UNITED STATES
SECURITIES AND EXCHANGE COMMISSION
Washington, D.C. 20549
FORM N-CSR
CERTIFIED SHAREHOLDER REPORT OF REGISTERED MANAGEMENT
INVESTMENT COMPANIES
Investment Company Act file number File No. 811-08520
TIAA SEPARATE ACCOUNT VA-1
(Exact name of Registrant as specified in charter)
730 Third Avenue, New York, New York 10017-3206
(Address of principal executive offices) (Zip code)
Terry H. Lin, Esq.
TIAA SEPARATE ACCOUNT VA-1
730 Third Avenue
New York, New York 10017-3206
(Name and address of agent for service)
Registrant’s telephone number, including area code: 212-490-9000
Date of fiscal year end: December 31
Date of reporting period: December 31, 2016
Item 1. Reports to Stockholders.
Annual Report
December 31, 2016
TIAA
GLOBAL ASSET MANAGEMENT
TIAA Separate Account VA-1
Audited financial statements
Stock Index Account
BUILT TO PERFORM.
CREATED TO SERVE.
Understanding this report
This annual report contains information about the TIAA Separate Account VA-1 and describes the account’s results for the twelve months ended December 31, 2016. The report contains three main sections:
| • | The account performance section compares the account’s investment returns with those of its benchmark index. |
| • | The summary portfolio of investments lists the industries and types of securities in which the account had investments as of December 31, 2016. |
| • | The financial statements provide detailed information about the operations and financial condition of the account. |
The views and opinions expressed in this report are through the end of the period, as stated on the cover of this report. They are subject to change at any time based on a variety of factors. As such, they are not guarantees of future performance or investment results and should not be taken as investment advice. To see the risks of investing in the TIAA Separate Account VA-1, please refer to the latest prospectus.
As always, you should carefully consider the investment objectives, risks, charges and expenses of any account before investing. For a prospectus that contains this and other important information, please visit our website at TIAA.org, or call 800-223-1200. We urge you to read the prospectus carefully before investing.
Information for contractowners
Portfolio holdings
The TIAA Separate Account VA-1’s summary portfolio of investments begins on page 7 of this report.
You can obtain a complete list of the portfolio holdings of the TIAA Separate Account VA-1 (Schedule of Investments) as of the most recently completed fiscal quarter in the following ways:
• By visiting our website at TIAA.org; or
• By calling us at 800-842-2252 to request a copy free of charge.
You can also obtain a complete list of the portfolio holdings of the account as of the most recently completed fiscal quarter, and for prior quarter-ends, from our Securities and Exchange Commission (SEC) Form N-CSR and Form N-Q filings. Form N-CSR filings are as of December 31 or June 30; Form N-Q filings are as of March 31 or September 30. Copies of these forms are available:
• Through the Electronic Data Gathering and Retrieval System (EDGAR) on the SEC’s website at www.sec.gov; or
• From the SEC’s Office of Investor Education and Advocacy.
(Call 202-551-8090 for more information.)
Proxy voting
The TIAA Separate Account VA-1’s ownership of stock gives it the right to vote on proxy issues of companies in which it invests. A description of our proxy voting policies and procedures can be found on our website at TIAA.org or on the SEC’s website at www.sec.gov. You may also call us at 800-223-1200 to request a free copy. A report of how the account voted during the most recently completed twelve-month period ended June 30 can be found on our website or on Form N-PX at www.sec.gov.
Contacting TIAA
There are three easy ways to contact us: by email, using the Contact Us link at the top of our home page; by mail at TIAA, 730 Third Avenue, New York, NY 10017-3206; or by phone at 800-223-1200.
Account management
The TIAA Separate Account VA-1 is managed by a portfolio management team of Teachers Advisors, LLC (formerly known as Teachers Advisors, Inc.). The members of this team are responsible for the day-to-day investment management of the account.
TIAA Separate Account VA-1 ∎ 2016 Annual Report 1
Important information about expenses
All contractowners in the TIAA Separate Account VA-1 incur ongoing costs, including management fees and other account expenses.
The TIAA Separate Account VA-1 is the underlying investment vehicle for Teachers Personal Annuity contracts issued by Teachers Insurance and Annuity Association of America. Premium taxes may apply to certain contracts. Because of this additional charge, the cost to investors may be higher than the figures shown in the expense example. Information about this additional charge can be found in the prospectus.
The expense example that appears in the table on page 3 is intended to help you understand your ongoing costs (in U.S. dollars) and does not reflect transactional costs incurred by the account for buying and selling securities. The example is designed to help you compare these ongoing costs with the ongoing costs of investing in other variable annuity accounts and mutual funds. Contractowners in the TIAA Separate Account VA-1 do not incur a sales charge for purchases or other distributions.
The example is based on an investment of $1,000 invested at the beginning of the six-month period and held for the entire period (July 1, 2016–December 31, 2016).
Actual expenses
The first line in the table uses the account’s actual expenses and its actual rate of return. You may use the information in this line, together with the amount you invested, to estimate the expenses that you paid over the six-month period.
Simply divide your account value by $1,000 (for example, an $8,600 account value divided by $1,000 = 8.6), then multiply the result by the number in the first line under the heading “Expenses paid during period” to estimate the expenses you paid during the six-month period.
Hypothetical example for comparison purposes
The second line in the table shows hypothetical account values and expenses based on the account’s actual expense ratio for the six-month period and an assumed 5% per year rate of return before expenses. This was not the account’s actual return.
This hypothetical example cannot be used to estimate the actual expenses you paid for the period but rather allows you to compare the ongoing costs of investing in the account with the costs of other accounts. To do so, compare our 5% hypothetical example with the 5% hypothetical examples that appear in the shareholder reports of other variable annuity accounts and mutual funds.
2 2016 Annual Report ∎ TIAA Separate Account VA-1
Important information about expenses
Expense example
Six months ended December 31, 2016
Stock Index Account
|
Beginning
|
Ending
|
Expenses paid
| |||||||||
Actual return | $1,000.00 | $1,083.79 | $3.93 | |||||||||
5% annual hypothetical return
|
| 1,000.00
|
|
| 1,021.37
|
|
| 3.81
|
| |||
| * | “Expenses paid during period” is based on the account’s actual expense ratio for the most recent fiscal half-year, multiplied by the average account value over the six-month period, multiplied by 184/366. There were 184 days in the six months ended December 31, 2016. The account’s annualized six-month expense ratio for that period was 0.75%. The total annual expense ratio reflects a voluntary agreement by the account’s investment adviser to waive a portion of its fee. Without such waiver, the account’s total annual expense ratio would have been 0.90%. Although TIAA reserves the right to increase the account’s mortality and expense risk charge to a maximum of 1.00% of average daily net assets per year, the total annual expense ratio will never exceed 1.50%. |
The account’s benchmark is the Russell 3000® Index, which measures the performance of the stocks of the 3,000 largest publicly traded U.S. companies, based on market capitalization. The index measures the performance of about 98% of the total market capitalization of the publicly traded U.S. equity market.
You cannot invest directly in any index. Index returns do not include a deduction for fees or expenses.
The Russell 3000 Index is a trademark/service mark of the Russell Investment Group. The Russell Investment Group is the owner of the copyrights relating to the Russell Indexes and is the source and owner of the data contained or reflected in the performance values relating to the Russell Indexes. The account is not promoted by, nor in any way affiliated with, the Russell Investment Group. The Russell Investment Group is not responsible for and has not reviewed the account nor any associated literature or publications and the Russell Investment Group makes no representation or warranty, express or implied, as to their accuracy, or completeness.
Russell reserves the right, at any time and without notice, to alter, amend, terminate or in any way change the Russell Indexes. Russell has no obligation to take the needs of any particular account or its participants or any other product or person into consideration in determining, composing or calculating any of the Russell Indexes.
Russell’s publication of the Russell Indexes in no way suggests or implies an opinion by Russell as to the attractiveness or appropriateness of investment in any or all securities upon which the Russell Indexes are based. RUSSELL MAKES NO REPRESENTATION, WARRANTY OR GUARANTEE REGARDING THE USE OR THE RESULTS OF USE OF THE RUSSELL INDEXES OR ANY DATA INCLUDED THEREIN, OR ANY SECURITIES (OR COMBINATION THEREOF) COMPRISING THE RUSSELL INDEXES. RUSSELL MAKES NO OTHER EXPRESS OR IMPLIED WARRANTY, AND EXPRESSLY DISCLAIMS ANY WARRANTY, OF ANY KIND, INCLUDING WITHOUT LIMITATION, ANY WARRANTY OF MERCHANT ABILITY OR FITNESS FOR A PARTICULAR PURPOSE WITH RESPECT TO THE RUSSELL INDEX(ES) OR ANY DATA OR ANY SECURITY (OR COMBINATION THEREOF) INCLUDED THEREIN.
TIAA Separate Account VA-1 ∎ 2016 Annual Report 3
Performance for the twelve months ended December 31, 2016
The Stock Index Account returned 11.98% for the year, compared with the 12.74% return of its benchmark, the Russell 3000® Index.
For the twelve-month period, the account’s return trailed that of its benchmark index, primarily because of the effect of expenses. The account’s return includes a deduction for expenses, while the benchmark’s does not. The account had a risk profile similar to that of its benchmark.
The U.S. economy continued to grow during 2016, prompting the Federal Reserve to raise its federal funds target rate to 0.50%–0.75% in mid-December. In the third quarter, the economy grew at an annualized rate of 3.5%, according to the government’s third estimate of gross domestic product (GDP), which measures the value of all goods and services produced in the nation. The jobless rate was 4.7% in December after remaining below 5.0% for most of the year.
Domestic equity markets gained ground during 2016. Early in the year, plunging oil prices caused concern among investors. Stocks were muted in June, after citizens of the United Kingdom voted to exit the European Union, but prices recovered in July. The run-up to the U.S. presidential election saw continued volatility, but domestic stocks proved resilient, surging in the remaining six weeks of the year. Small-cap stocks performed best, followed by mid caps and then large caps. Value stocks topped their growth counterparts in 2016. (Returns by investment style and capitalization size are based on the Russell Indexes.)
Ten of eleven sectors post positive returns
Ten of the eleven industry sectors in the account’s benchmark index delivered positive performance for the twelve months. Energy (up 26.9%) performed best as oil prices rebounded over the course of the year. Financials (up 22.7%) and information technology (up 13.8%) contributed the most to the index’s total return given their substantial weights. Together, these three sectors represented more than two-fifths of the total market capitalization of the index on December 31, 2016. Telecommunication services (up 23.9%) and materials (up 21.8%) also produced sizable gains, but they had minimal impact on the benchmark’s performance given their low weight. Health care (down 3.1%) was the sole decliner in the index amid an uncertain regulatory outlook for drug makers and service providers.
Four of the benchmark’s five largest stocks outperformed the benchmark for the twelve months—JPMorgan Chase, Exxon Mobil, Johnson & Johnson and Microsoft all generated substantial gains. In contrast, Apple, the benchmark’s largest stock, modestly underperformed the broad market, as measured by the index.
4 2016 Annual Report ∎ TIAA Separate Account VA-1
Stock Index Account
Performance as of December 31, 2016
| ||||||||||||||||
| Total return |
Average annual | |||||||||||||||
Inception date
|
1 year
|
5 years
|
10 years
| |||||||||||||
| ||||||||||||||||
Stock Index Account | 11/1/1994 | 11.98% | 13.85% | 6.38% | ||||||||||||
| ||||||||||||||||
Russell 3000 Index
| — | 12.74 | 14.67 | 7.07 | ||||||||||||
| ||||||||||||||||
The returns in this report show past performance, which is no guarantee of future results. Returns and the principal value of your investment will fluctuate. The account’s performance reflects a fee waiver, which is currently in place. Without such waiver, the expenses of the account would have been higher and its performance lower. Current performance may be higher or lower than that shown, and you may have a gain or a loss when you redeem your accumulation units. For current performance information, including performance to the most recent month-end, please visit TIAA.org.
You cannot invest directly in any index. Index returns do not include a deduction for fees or expenses.
$10,000 over 10 years
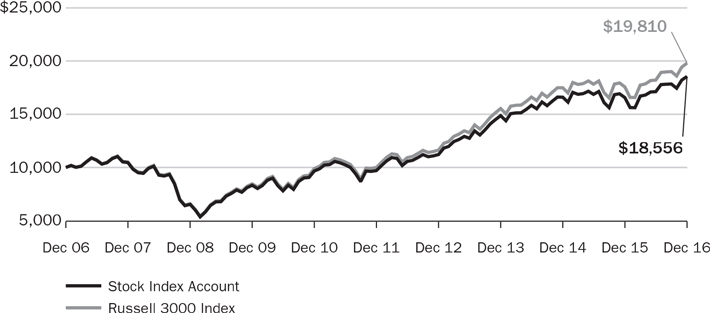
For the purpose of comparison, the graph also shows the change in the value of the account’s benchmark during the same period.
TIAA Separate Account VA-1 ∎ 2016 Annual Report 5
Stock Index Account
Portfolio composition
Sector
| % of net assets as of 12/31/2016 | |||
Information technology | 19.6 | |||
Financials | 15.9 | |||
Health care | 12.7 | |||
Consumer discretionary | 12.4 | |||
Industrials | 11.0 | |||
Consumer staples | 8.2 | |||
Energy | 6.9 | |||
Real estate | 4.0 | |||
Materials | 3.3 | |||
Utilities | 3.1 | |||
Telecommunication services | 2.4 | |||
Short-term investments, other assets & liabilities, net
|
| 0.5
|
| |
Total | 100.0 | |||
Holdings by company size
Market capitalization
| % of equity investments as of 12/31/2016 | |||
More than $50 billion | 52.1 | |||
More than $15 billion–$50 billion | 22.4 | |||
More than $2 billion–$15 billion | 21.1 | |||
$2 billion or less
|
| 4.4
|
| |
Total | 100.0 | |||
6 2016 Annual Report ∎ TIAA Separate Account VA-1
| Summary portfolio of investments |
Stock Index Account § December 31, 2016
| Shares | Company | Value (000) | % of net assets | |||||||||||||
| COMMON STOCKS | ||||||||||||||||
| AUTOMOBILES & COMPONENTS | $ | 8,743 | 0.9 | % | ||||||||||||
|
| |||||||||||||||
| BANKS | ||||||||||||||||
| 413,240 | Bank of America Corp | 9,133 | 1.0 | |||||||||||||
| 118,518 | Citigroup, Inc | 7,043 | 0.7 | |||||||||||||
| 146,319 | JPMorgan Chase & Co | 12,626 | 1.3 | |||||||||||||
| 183,778 | Wells Fargo & Co | 10,128 | 1.1 | |||||||||||||
| Other | 28,973 | 3.0 | ||||||||||||||
|
| |||||||||||||||
| 67,903 | 7.1 | |||||||||||||||
|
| |||||||||||||||
| CAPITAL GOODS | ||||||||||||||||
| 23,711 | 3M Co | 4,234 | 0.4 | |||||||||||||
| 24,026 | Boeing Co | 3,740 | 0.4 | |||||||||||||
| 369,942 | General Electric Co | 11,690 | 1.2 | |||||||||||||
| 30,622 | Honeywell International, Inc | 3,548 | 0.4 | |||||||||||||
| Other | 51,881 | 5.5 | ||||||||||||||
|
| |||||||||||||||
| 75,093 | 7.9 | |||||||||||||||
|
| |||||||||||||||
| COMMERCIAL & PROFESSIONAL SERVICES | 8,195 | 0.9 | ||||||||||||||
|
| |||||||||||||||
| CONSUMER DURABLES & APPAREL | 13,470 | 1.4 | ||||||||||||||
|
| |||||||||||||||
| CONSUMER SERVICES | ||||||||||||||||
| 33,561 | McDonald’s Corp | 4,085 | 0.4 | |||||||||||||
| Other | 16,298 | 1.7 | ||||||||||||||
|
| |||||||||||||||
| 20,383 | 2.1 | |||||||||||||||
|
| |||||||||||||||
| DIVERSIFIED FINANCIALS | ||||||||||||||||
| 15,524 | Goldman Sachs Group, Inc | 3,717 | 0.4 | |||||||||||||
| Other | 38,832 | 4.1 | ||||||||||||||
|
| |||||||||||||||
| 42,549 | 4.5 | |||||||||||||||
|
| |||||||||||||||
| ENERGY | ||||||||||||||||
| 75,704 | Chevron Corp | 8,910 | 0.9 | |||||||||||||
| 167,773 | d | Exxon Mobil Corp | 15,143 | 1.6 | ||||||||||||
| 56,028 | Schlumberger Ltd | 4,704 | 0.5 | |||||||||||||
| Other | 37,158 | 3.9 | ||||||||||||||
|
| |||||||||||||||
| 65,915 | 6.9 | |||||||||||||||
|
| |||||||||||||||
| FOOD & STAPLES RETAILING | ||||||||||||||||
| 61,014 | Wal-Mart Stores, Inc | 4,217 | 0.4 | |||||||||||||
| Other | 13,058 | 1.4 | ||||||||||||||
|
| |||||||||||||||
| 17,275 | 1.8 | |||||||||||||||
|
| |||||||||||||||
| FOOD, BEVERAGE & TOBACCO | ||||||||||||||||
| 78,791 | Altria Group, Inc | 5,328 | 0.5 | |||||||||||||
| 156,468 | Coca-Cola Co | 6,487 | 0.7 | |||||||||||||
| 58,026 | PepsiCo, Inc | 6,071 | 0.6 | |||||||||||||
| See notes to financial statements | TIAA Separate Account VA-1 § 2016 Annual Report | 7 |
| Summary portfolio of investments | continued |
Stock Index Account § December 31, 2016
| Shares | Company | Value (000) | % of net assets | |||||||||||||
| FOOD, BEVERAGE & TOBACCO—continued | ||||||||||||||||
| 62,448 | Philip Morris International, Inc | $ | 5,714 | 0.6 | % | |||||||||||
| Other | 21,576 | 2.3 | ||||||||||||||
|
| |||||||||||||||
| 45,176 | 4.7 | |||||||||||||||
|
| |||||||||||||||
| HEALTH CARE EQUIPMENT & SERVICES | ||||||||||||||||
| 56,502 | Medtronic plc | 4,025 | 0.4 | |||||||||||||
| 37,786 | UnitedHealth Group, Inc | 6,047 | 0.6 | |||||||||||||
| Other | 35,973 | 3.8 | ||||||||||||||
|
| |||||||||||||||
| 46,045 | 4.8 | |||||||||||||||
|
| |||||||||||||||
| HOUSEHOLD & PERSONAL PRODUCTS | ||||||||||||||||
| 102,979 | Procter & Gamble Co | 8,658 | 0.9 | |||||||||||||
| Other | 7,104 | 0.8 | ||||||||||||||
|
| |||||||||||||||
| 15,762 | 1.7 | |||||||||||||||
|
| |||||||||||||||
| INSURANCE | ||||||||||||||||
| 76,136 | * | Berkshire Hathaway, Inc (Class B) | 12,409 | 1.3 | ||||||||||||
| Other | 28,224 | 3.0 | ||||||||||||||
|
| |||||||||||||||
| 40,633 | 4.3 | |||||||||||||||
|
| |||||||||||||||
| MATERIALS | 31,632 | 3.3 | ||||||||||||||
|
| |||||||||||||||
| MEDIA | ||||||||||||||||
| 96,855 | Comcast Corp (Class A) | 6,688 | 0.7 | |||||||||||||
| 65,460 | Walt Disney Co | 6,822 | 0.7 | |||||||||||||
| Other | 15,263 | 1.6 | ||||||||||||||
|
| |||||||||||||||
| 28,773 | 3.0 | |||||||||||||||
|
| |||||||||||||||
| PHARMACEUTICALS, BIOTECHNOLOGY & LIFE SCIENCES | ||||||||||||||||
| 65,276 | AbbVie, Inc | 4,088 | 0.4 | |||||||||||||
| 30,292 | Amgen, Inc | 4,429 | 0.5 | |||||||||||||
| 67,274 | Bristol-Myers Squibb Co | 3,931 | 0.4 | |||||||||||||
| 30,897 | * | Celgene Corp | 3,576 | 0.4 | ||||||||||||
| 53,464 | Gilead Sciences, Inc | 3,829 | 0.4 | |||||||||||||
| 110,469 | Johnson & Johnson | 12,727 | 1.3 | |||||||||||||
| 111,637 | Merck & Co, Inc | 6,572 | 0.7 | |||||||||||||
| 242,075 | Pfizer, Inc | 7,863 | 0.8 | |||||||||||||
| Other | 27,485 | 2.9 | ||||||||||||||
|
| |||||||||||||||
| 74,500 | 7.8 | |||||||||||||||
|
| |||||||||||||||
| REAL ESTATE | 37,716 | 4.0 | ||||||||||||||
|
| |||||||||||||||
| RETAILING | ||||||||||||||||
| 15,638 | * | Amazon.com, Inc | 11,727 | 1.2 | ||||||||||||
| 50,098 | Home Depot, Inc | 6,717 | 0.7 | |||||||||||||
| Other | 28,195 | 3.0 | ||||||||||||||
|
| |||||||||||||||
| 46,639 | 4.9 | |||||||||||||||
|
| |||||||||||||||
| 8 | 2016 Annual Report § TIAA Separate Account VA-1 | See notes to financial statements |
| Summary portfolio of investments | continued |
Stock Index Account § December 31, 2016
| Shares | Company | Value (000) | % of net assets | |||||||||||||
| SEMICONDUCTORS & SEMICONDUCTOR EQUIPMENT | ||||||||||||||||
| 189,873 | Intel Corp | $ | 6,886 | 0.8 | % | |||||||||||
| 59,172 | Qualcomm, Inc | 3,858 | 0.4 | |||||||||||||
| Other | 19,264 | 2.0 | ||||||||||||||
|
| |||||||||||||||
| 30,008 | 3.2 | |||||||||||||||
|
| |||||||||||||||
| SOFTWARE & SERVICES | ||||||||||||||||
| 11,798 | * | Alphabet, Inc (Class A) | 9,349 | 1.0 | ||||||||||||
| 11,926 | * | Alphabet, Inc (Class C) | 9,205 | 1.0 | ||||||||||||
| 90,237 | * | Facebook, Inc | 10,382 | 1.1 | ||||||||||||
| 35,343 | International Business Machines Corp | 5,867 | 0.6 | |||||||||||||
| 38,817 | MasterCard, Inc (Class A) | 4,008 | 0.4 | |||||||||||||
| 304,576 | Microsoft Corp | 18,926 | 2.0 | |||||||||||||
| 118,806 | Oracle Corp | 4,568 | 0.5 | |||||||||||||
| 76,484 | Visa, Inc (Class A) | 5,967 | 0.6 | |||||||||||||
| Other | 41,992 | 4.4 | ||||||||||||||
|
| |||||||||||||||
| 110,264 | 11.6 | |||||||||||||||
|
| |||||||||||||||
| TECHNOLOGY HARDWARE & EQUIPMENT | ||||||||||||||||
| 220,413 | Apple, Inc | 25,528 | 2.7 | |||||||||||||
| 202,101 | Cisco Systems, Inc | 6,108 | 0.6 | |||||||||||||
| Other | 15,554 | 1.7 | ||||||||||||||
|
| |||||||||||||||
| 47,190 | 5.0 | |||||||||||||||
|
| |||||||||||||||
| TELECOMMUNICATION SERVICES | ||||||||||||||||
| 247,438 | AT&T, Inc | 10,523 | 1.1 | |||||||||||||
| 164,117 | Verizon Communications, Inc | 8,761 | 0.9 | |||||||||||||
| Other | 3,735 | 0.4 | ||||||||||||||
|
| |||||||||||||||
| 23,019 | 2.4 | |||||||||||||||
|
| |||||||||||||||
| TRANSPORTATION | ||||||||||||||||
| 33,920 | Union Pacific Corp | 3,517 | 0.4 | |||||||||||||
| Other | 17,504 | 1.8 | ||||||||||||||
|
| |||||||||||||||
| 21,021 | 2.2 | |||||||||||||||
|
| |||||||||||||||
| UTILITIES | 29,669 | 3.1 | ||||||||||||||
|
| |||||||||||||||
| TOTAL COMMON STOCKS | (Cost $448,809) | 947,573 | 99.5 | |||||||||||||
|
| |||||||||||||||
| RIGHTS / WARRANTS | ||||||||||||||||
| DIVERSIFIED FINANCIALS | 0 | ^ | 0.0 | |||||||||||||
|
| |||||||||||||||
| PHARMACEUTICALS, BIOTECHNOLOGY & LIFE SCIENCES | 1 | 0.0 | ||||||||||||||
|
| |||||||||||||||
| SOFTWARE & SERVICES | 0 | ^ | 0.0 | |||||||||||||
|
| |||||||||||||||
| TELECOMMUNICATION SERVICES | 6 | 0.0 | ||||||||||||||
|
| |||||||||||||||
| TOTAL RIGHTS / WARRANTS | (Cost $6) | 7 | 0.0 | |||||||||||||
|
| |||||||||||||||
| See notes to financial statements | TIAA Separate Account VA-1 § 2016 Annual Report | 9 |
| Summary portfolio of investments | concluded |
Stock Index Account § December 31, 2016
| Shares | Company | Value (000) | % of net assets | |||||||||||||
| SHORT-TERM INVESTMENTS | ||||||||||||||||
| GOVERNMENT AGENCY DEBT | $ | 2,900 | 0.3 | % | ||||||||||||
|
| |||||||||||||||
| INVESTMENTS IN REGISTERED INVESTMENT COMPANIES | ||||||||||||||||
| 11,329,456 | c | State Street Navigator Securities Lending Government Money Market Portfolio | 11,329 | 1.2 | ||||||||||||
|
| |||||||||||||||
| 11,329 | 1.2 | |||||||||||||||
|
| |||||||||||||||
| TOTAL SHORT-TERM INVESTMENTS | (Cost $14,229) | 14,229 | 1.5 | |||||||||||||
|
| |||||||||||||||
| TOTAL PORTFOLIO | (Cost $463,044) | 961,809 | 101.0 | |||||||||||||
| OTHER ASSETS & LIABILITIES, NET | (9,890 | ) | (1.0 | ) | ||||||||||||
|
| |||||||||||||||
| NET ASSETS | $ | 951,919 | 100.0 | % | ||||||||||||
|
| |||||||||||||||
| * | Non-income producing. |
| ^ | Amount represents less than $1,000. |
| c | Investments made with case collateral received from securities on loan. |
| d | All or a portion of these securities have been segregated by the custodian to cover margin or other requirements on open futures transactions. |
“Other” securities represent the aggregate value, by category, of securities that are not among the 50 largest holdings and, in total for any issuer, represent 1% or less of net assets.
At 12/31/16, the aggregate value of securities on loan is $10,943,000
Cost amounts are in thousands.
For ease of presentation, a number of classification categories have been grouped together in the Summary portfolio of investments. Note that the Account uses more specific categories in following its investment limitations on investment concentrations.
| 10 | 2016 Annual Report § TIAA Separate Account VA-1 | See notes to financial statements |
| Statement of assets and liabilities |
TIAA Separate Account VA-1 § December 31, 2016
| (amounts in thousands, except accumulation unit value) | Stock Index Account | |||
| ||||
ASSETS | ||||
Portfolio investments, at value*† | $ | 961,809 | ||
Cash | 92 | |||
Dividends and interest receivable | 1,261 | |||
Due from affiliates | 133 | |||
Other | 129 | |||
| ||||
Total assets | 963,424 | |||
| ||||
LIABILITIES | ||||
Investment management fees payable | 8 | |||
Service agreement fees payable | 11 | |||
Payable for collateral for securities loaned | 11,329 | |||
Payable for variation margin on futures contracts | 7 | |||
Payable for manager compensation | 129 | |||
Other | 21 | |||
| ||||
Total liabilities | 11,505 | |||
| ||||
NET ASSETS | ||||
| ||||
Accumulation Fund | $ | 951,919 | ||
| ||||
Accumulation units outstanding | 5,607 | |||
| ||||
Accumulation unit value | $ | 169.77 | ||
| ||||
* Portfolio investments, at cost | $ | 463,044 | ||
† Includes securities loaned of | $ | 10,943 | ||
| See notes to financial statements | TIAA Separate Account VA-1 § 2016 Annual Report | 11 |
| Statement of operations |
TIAA Separate Account VA-1 § For the year ended December 31, 2016
| (amounts in thousands) | Stock Index Account | |||
| ||||
INVESTMENT INCOME | ||||
Dividends* | $ | 19,387 | ||
Income from securities lending | 384 | |||
| ||||
Total income | 19,771 | |||
| ||||
EXPENSES | ||||
Administrative services | 1,826 | |||
Investment advisory | 2,738 | |||
Mortality and expense risk charges | 3,651 | |||
| ||||
Total expenses | 8,215 | |||
Less: Expense waiver by investment adviser | (1,369 | ) | ||
| ||||
Net expenses | 6,846 | |||
| ||||
Net investment income (loss) | 12,925 | |||
| ||||
NET REALIZED AND UNREALIZED GAIN (LOSS) ON TOTAL INVESTMENTS | ||||
Realized gain (loss): | ||||
Portfolio investments† | 44,623 | |||
Futures transactions | (58 | ) | ||
| ||||
Net realized gain (loss) on total investments | 44,565 | |||
| ||||
Change in unrealized appreciation (depreciation) on: | ||||
Portfolio investments | 46,585 | |||
Futures transactions | (3 | ) | ||
| ||||
Net change in unrealized appreciation (depreciation) on total investments | 46,582 | |||
| ||||
Net realized and unrealized gain (loss) on total investments | 91,147 | |||
| ||||
Net increase (decrease) in net assets from operations | $ | 104,072 | ||
| ||||
* Net of foreign withholding taxes | $ | 4 | ||
| † | Includes net gain (loss) from securities sold to affiliates of $649. |
| 12 | 2016 Annual Report § TIAA Separate Account VA-1 | See notes to financial statements |
| Statements of changes in net assets |
TIAA Separate Account VA-1 § For the year ended
| Stock Index Account | ||||||||
| (amounts in thousands) | December 31, 2016 | December 31, 2015 | ||||||
| ||||||||
OPERATIONS | ||||||||
Net investment income (loss) | $ | 12,925 | $ | 12,940 | ||||
Net realized gain (loss) on total investments | 44,565 | 46,021 | ||||||
Net change in unrealized appreciation (depreciation) on total investments | 46,582 | (60,690 | ) | |||||
| ||||||||
Net increase (decrease) in net assets from operations | 104,072 | (1,729 | ) | |||||
| ||||||||
FROM CONTRACTOWNER TRANSACTIONS | ||||||||
Premiums | 16,314 | 26,607 | ||||||
Withdrawals and death benefits | (93,529 | ) | (88,394 | ) | ||||
| ||||||||
Net increase (decrease) from contractowner transactions | (77,215 | ) | (61,787 | ) | ||||
| ||||||||
Net increase (decrease) in net assets | 26,857 | (63,516 | ) | |||||
NET ASSETS | ||||||||
Beginning of period | 925,062 | 988,578 | ||||||
| ||||||||
End of period | $ | 951,919 | $ | 925,062 | ||||
| ||||||||
ACCUMULATION UNITS | ||||||||
Units purchased | 104 | 173 | ||||||
Units sold / transferred | (599 | ) | (578 | ) | ||||
Outstanding | ||||||||
Beginning of period | 6,102 | 6,507 | ||||||
| ||||||||
End of period | 5,607 | 6,102 | ||||||
| ||||||||
| See notes to financial statements | TIAA Separate Account VA-1 § 2016 Annual Report | 13 |
| Financial highlights |
TIAA Separate Account VA-1
| Selected per accumulation unit data | ||||||||||||||||||||||||||||||||||||
| Gain (loss) from investment operations | ||||||||||||||||||||||||||||||||||||
| For the year ended | Investment incomea | Expensesa | Net investment income (loss)a | Net realized & unrealized gain (loss) on total investments | Net change in accumulation unit value | Accumulation unit value beginning of year | Accumulation unit value end of year | |||||||||||||||||||||||||||||
STOCK INDEX ACCOUNT |
| |||||||||||||||||||||||||||||||||||
| 12/31/16 | $ | 3.387 | $ | 1.173 | $ | 2.214 | $ | 15.947 | $ | 18.161 | $ | 151.608 | $ | 169.769 | ||||||||||||||||||||||
| 12/31/15 | 3.175 | 1.150 | 2.025 | (2.347 | ) | (0.322 | ) | 151.930 | 151.608 | |||||||||||||||||||||||||||
| 12/31/14 | 2.761 | 1.067 | 1.694 | 14.236 | 15.930 | 136.000 | 151.930 | |||||||||||||||||||||||||||||
| 12/31/13 | 2.402 | 0.896 | 1.506 | 31.870 | 33.376 | 102.624 | 136.000 | |||||||||||||||||||||||||||||
| 12/31/12 | 2.256 | 0.735 | 1.521 | 12.334 | 13.855 | 88.769 | 102.624 | |||||||||||||||||||||||||||||
| a | Based on average units outstanding. |
| b | Based on per accumulation unit data. |
| 14 | 2016 Annual Report § TIAA Separate Account VA-1 | See notes to financial statements |
| Ratios and supplemental data | ||||||||||||||||||||||||||||
| Ratios to average net assets | ||||||||||||||||||||||||||||
| Total returnb | Gross expenses | Net expenses | Net investment income (loss) | Portfolio turnover rate | Accumulation units outstanding end of year (in millions) | Net assets at the end of year (in millions) | ||||||||||||||||||||||
| 11.98 | % | 0.90 | % | 0.75 | % | 1.42 | % | 7 | % | 6 | $ | 952 | ||||||||||||||||
| (0.21 | ) | 0.90 | 0.75 | 1.32 | 7 | 6 | 925 | |||||||||||||||||||||
| 11.71 | 0.90 | 0.75 | 1.19 | 7 | 7 | 989 | ||||||||||||||||||||||
| 32.53 | 0.90 | 0.75 | 1.26 | 7 | 7 | 935 | ||||||||||||||||||||||
| 15.60 | 0.90 | 0.75 | 1.55 | 7 | 7 | 752 | ||||||||||||||||||||||
| See notes to financial statements | TIAA Separate Account VA-1 § 2016 Annual Report | 15 |
| Notes to financial statements |
TIAA Separate Account VA-1
Note 1—organization and significant accounting policies
TIAA Separate Account VA-1 (“VA-1”) is a segregated investment account of Teachers Insurance and Annuity Association of America (“TIAA”) and is organized under the insurance laws of the State of New York for the purpose of issuing and funding individual variable annuity contracts. The variable annuity contracts were issued by TIAA. VA-1 is registered with the Securities and Exchange Commission as an open-end management investment company under the Investment Company Act of 1940, as amended (“1940 Act”). VA-1 consists of a single investment portfolio, the Stock Index Account (“Account”).
The accompanying financial statements were prepared in accordance with accounting principles generally accepted in the United States of America (“U.S. GAAP”), which may require the use of estimates made by management and the evaluation of subsequent events. Actual results may differ from those estimates. The Account is an investment company and follows the accounting guidance in the Financial Accounting Standards Board (“FASB”) Accounting Standards Codification 946, Financial Services—Investment Companies. The Accumulation Unit Value (“AUV”) for financial reporting purposes may differ from the AUV for processing transactions. The AUV for financial reporting purposes includes security and contractowner transactions through the date of the report. Total return is computed based on the AUV used for processing transactions. The following is a summary of the significant accounting policies consistently followed by the Account.
Security valuation: The Account’s investments in securities are recorded at their estimated fair value as described in the valuation of investments note to the financial statements.
Investments and investment income: Securities transactions are accounted for as of the trade date for financial reporting purposes. Interest income is recorded as earned and includes accretion of discounts and amortization of premiums using the effective yield method. Dividend income is recorded on the ex-dividend date. Foreign dividend income is recorded on the ex-dividend date or as soon as possible after the Account determines the existence of a dividend declaration after exercising reasonable due diligence. Realized gains and losses on securities transactions are based upon the specific identification method. Distributions received on securities that represent a return of capital or capital gains are recorded as a reduction of cost of investments and/or as a realized gain. The Account estimates the components of distributions received that may be considered return of capital distributions or capital gain distributions.
Income taxes: VA-1 is a separate account of TIAA, which is taxed as a life insurance company under Subchapter L of the Internal Revenue Code. VA-1 should incur no federal income tax liability. Under the rules of taxation applicable to life insurance companies, VA-1’s Accumulation Account for contractowners will generally be treated as life insurance reserves; therefore, any increase in such reserves will be deductible. The Account files an income tax return in U.S. federal and applicable
| 16 | 2016 Annual Report § TIAA Separate Account VA-1 |
state and local jurisdictions. The Account’s federal income tax returns are generally subject to examination for a period of three fiscal years after being filed. State and local tax returns may be subject to examination for an additional period of time depending on the jurisdiction. Management has analyzed the Account’s tax positions taken for all open federal income tax years and has concluded that no provision for federal income tax is required in the Account’s financial statements.
Management committee compensation: The members of the Management Committee (“Committee”), all of whom are independent, receive certain remuneration for their services, plus travel and other expenses. Managers may elect to participate in a deferred compensation plan and defer all or a portion of their compensation. In addition, managers participate in a long-term compensation plan. Amounts deferred are retained by the Account until paid. Amounts payable to the managers for compensation are included in the accompanying Statement of Assets and Liabilities. Managers’ fees, including any deferred and long-term compensation incurred, are reflected in the Statement of Operations.
New rule issuances: In October 2016, the Commission issued Final Rule Release No. 33-10231, Investment Company Reporting Modernization. This final rule modernizes investment company reporting by requiring the filing of new forms N-PORT and N-CEN, and amends Regulation S-X disclosures related to derivatives and other disclosures in the financial statements and other filings. The requirements of this final rule in relation to forms N-PORT and N-CEN must be adopted by June 1, 2018, while the amended disclosures must be adopted by August 1, 2017. Management is currently assessing the impact of this rule to the Account’s financial statements and other filings.
In October 2016, the Commission issued Final Rule Release No. 33-10233, Investment Company Liquidity Risk Management Programs. This final rule requires accounts to establish a liquidity risk management program and enhances disclosures regarding accounts liquidity. The requirements of this final rule must be adopted by December 1, 2018. Management is currently assessing the impact of this rule to the Account’s financial statements and other filings.
In October 2016, the Commission issued Final Rule Release No. 33-10234, Investment Company Swing Pricing. This final rule permits certain accounts to use swing pricing during periods of heavy redemptions and requires certain disclosures regarding the use of swing pricing in forms filed with the Commission. Management may elect to adopt the provisions of this final rule by November 19, 2018. Management is currently assessing the impact of this rule to the Account’s financial statements and other filings.
| TIAA Separate Account VA-1 § 2016 Annual Report | 17 |
| Notes to financial statements |
Note 2—valuation of investments
Portfolio investments are valued at fair value utilizing various valuation methods approved by the Committee. U.S. GAAP establishes a hierarchy that prioritizes market inputs to valuation methods. The three levels of inputs are:
| • | Level 1 – quoted prices in active markets for identical securities |
| • | Level 2 – other significant observable inputs (including quoted prices for similar securities, interest rates, credit spreads, etc.) |
| • | Level 3 – significant unobservable inputs (including the Account’s own assumptions in determining the fair value of investments) |
The availability of observable inputs can vary from security to security and is affected by a wide variety of factors, including, for example, the type of security, whether the security is new and not yet established in the marketplace, the liquidity of markets, and other characteristics particular to the security. To the extent that valuation is based on models or inputs that are less observable or unobservable in the market, the determination of fair value requires more judgment. Accordingly, the degree of judgment exercised in determining fair value is greatest for instruments categorized in Level 3. The inputs or methodology used for valuing securities are not necessarily an indication of the risk associated with investing in those securities.
Certain portfolio investments that are measured at fair value using the net asset value per share practical expedient are not categorized within the fair value hierarchy. These investments will be disclosed at their fair value to allow reconciliation back to the Statement of Assets and Liabilities. As of December 31, 2016, no investments were valued utilizing the practical expedient.
A description of the valuation techniques applied to the Account’s major categories of assets and liabilities measured at fair value follows:
Exchange-traded equity securities, common and preferred stock: Equity securities listed or traded on a national market or exchange are valued based on their sale price at the official close of business of such market or exchange on the valuation date, or if there is no official close of business, the latest sale price, or at the mean of the latest available bid and asked prices if no sale is reported. To the extent these securities are actively traded and valuation adjustments are not applied, they are categorized in Level 1 of the fair value hierarchy. Foreign equity securities are valued at the last sale price or official closing price reported on the exchange where traded and converted to U.S. dollars at the prevailing rates of exchange on the date of valuation. For events affecting the value of foreign securities between the time when the exchange on which they are traded closes and the time when the Account’s net assets are calculated, such securities will be valued at fair value in accordance with procedures adopted by the Committee. Foreign securities are generally categorized in Level 2 of the fair value hierarchy.
Debt securities: Debt securities will generally be valued using prices provided by a pricing service that may employ various indications of value including but not limited
| 18 | 2016 Annual Report § TIAA Separate Account VA-1 |
| continued |
to broker-dealer quotations. Certain debt securities, other than money market instruments, are valued based on the most recent bid price or the equivalent quoted yield for such securities (or those of comparable maturity, quality and type). Debt securities are generally categorized in Level 2 of the fair value hierarchy; in instances where prices, yields or any other key inputs are unobservable, they are categorized in Level 3 of the hierarchy.
Investments in registered investment companies: These investments are valued at their net asset value on the valuation date. These investments are categorized in Level 1 of the fair value hierarchy.
Futures contracts: Stock and bond index futures contracts, which are traded on commodity exchanges, are valued at the last sale price as of the close of such commodity exchanges and are categorized in Level 1 of the fair value hierarchy.
Any portfolio security for which market quotations are not readily available or for which the above valuation procedures are deemed not to reflect fair value are valued at fair value, as determined in good faith using procedures approved by the Committee. To the extent the inputs are observable and timely, the values would be categorized in Level 2 of the fair value hierarchy; otherwise they would be categorized as Level 3.
Transfers between levels are recognized at the end of the reporting period. For the year ended December 31, 2016, there were no material transfers between levels by the Account.
The following table summarizes the market value of the Account’s investments as of December 31, 2016, based on the inputs used to value them (dollar amounts are in thousands):
| Level 1 | Level 2 | Level 3 | Total | |||||||||||||
| ||||||||||||||||
Equity Investments: | ||||||||||||||||
Health care | $ | 120,539 | $ | — | $ | 7 | $ | 120,546 | ||||||||
Industrials | 104,302 | — | 7 | 104,309 | ||||||||||||
Telecommunication services | 23,019 | — | 6 | 23,025 | ||||||||||||
All other equity investments* | 699,700 | — | — | 699,700 | ||||||||||||
Short-term investments | 11,329 | 2,900 | — | 14,229 | ||||||||||||
Futures** | (6 | ) | — | — | (6 | ) | ||||||||||
| ||||||||||||||||
Total | $ | 958,883 | $ | 2,900 | $ | 20 | $ | 961,803 | ||||||||
| ||||||||||||||||
| * | For detailed categories, see the accompanying Summary portfolio of investments. |
| ** | Derivative instruments are not reflected in the Summary portfolio of investments. |
Note 3—derivative instruments
As defined by U.S. GAAP, a derivative is a financial instrument whose value is derived from an underlying security price, foreign exchange rate, interest rate, index of prices or rates, or other variables. Derivatives require little or no initial investment and permit or require net settlement. The Account values derivatives at fair value.
| TIAA Separate Account VA-1 § 2016 Annual Report | 19 |
| Notes to financial statements |
At December 31, 2016, the Account has invested in derivative contracts which are reflected in the Statement of Assets and Liabilities as follows (dollar amounts are in thousands):
| Liabilities derivatives | ||||||||
| Derivative contracts | Location | Fair value amount | ||||||
| ||||||||
Equity contracts | Futures | * | $ | (6 | ) | |||
| ||||||||
| * | The fair value presented includes cumulative gain (loss) on open futures contracts; however, the value reflected on the accompanying Statement of Assets and Liabilities is only the payable for variation margin on open futures contracts. |
For the year ended December 31, 2016, the effect of derivative contracts on the Account’s Statement of Operations was as follows (dollar amounts are in thousands):
| Derivative contracts | Location | Realized gain (loss) | Change in unrealized appreciation (depreciation) | |||||||||
| ||||||||||||
Equity contracts | Futures transactions | $ | (58 | ) | $ | (3 | ) | |||||
| ||||||||||||
Futures contracts: The Account is subject to equity price risk in the normal course of pursuing its investment objectives. The Account uses futures contracts to manage exposure to the equity markets and for cash management purposes to remain highly invested in these markets while minimizing transaction costs. Buying futures contracts tends to increase exposure to the underlying instrument/index, while selling futures contracts tends to decrease exposure to the underlying instrument/index or hedge other investments. Initial margin deposits are made upon entering into a futures contract, and variation margin receipts or payments are settled daily reflecting changes in the value of the futures contracts. Daily changes in the value of such contracts are reflected in net unrealized gains and losses. Gains or losses are realized upon the expiration or closing of the futures contracts or if the counterparties do not perform in accordance with contractual provisions. With futures contracts, there is minimal counterparty credit risk to the Account since futures contracts are exchange-traded and the exchange’s clearinghouse, as counterparty to all exchange-traded funds, guarantees the futures contracts against default. During the year ended December 31, 2016, the Account had exposure to equity futures contracts, based on underlying notional values, generally between 0% and 1% of net assets.
At December 31, 2016, the Account held the following open futures contracts (dollar amounts are in thousands):
| Futures contracts | Number of contracts | Settlement value | Expiration date | Unrealized gain (loss) | ||||||||||
| ||||||||||||||
S&P 500 E Mini Index | 15 | $ | 1,677 | March 2017 | $ | (6 | ) | |||||||
| ||||||||||||||
| 20 | 2016 Annual Report § TIAA Separate Account VA-1 |
| continued |
Note 4—investment adviser and affiliates
Teachers Advisors, LLC (“Advisors”), a wholly owned subsidiary of TIAA and a registered investment adviser, provides investment advisory services for VA-1 pursuant to an Investment Management Agreement among TIAA, Advisors and VA-1. Prior to October 1, 2016, Teachers Advisors, LLC was named Teachers Advisors, Inc. TIAA provides all administrative services for VA-1 pursuant to an Administrative Services Agreement with VA-1. The contracts are distributed by TIAA-CREF Individual & Institutional Services, LLC (“Services”). Services is a wholly owned subsidiary of TIAA. The Investment Management Agreement sets the investment advisory charge at an annual rate of 0.30% of the average daily net assets of the Account. Advisors has agreed to voluntarily waive a portion of such fee, so that the daily deduction is equivalent to an annual charge of 0.15% of the average daily net assets of the Account.
The Administrative Services Agreement sets the administrative expense charge at an annual rate of 0.20% of the average daily net assets of the Account. TIAA also imposes a daily charge for bearing certain mortality and expense risks in connection with the contracts, equivalent to an annual rate of 0.40% of the average daily net assets of the Account. Although TIAA reserves the right to increase the Account’s mortality and expense risk charge to a maximum of 1.00% per year, the total expense ratio will never exceed 1.50% per year. TIAA pays death benefits to beneficiaries when an annuitant dies during the accumulation period, or during the annuity period while payments are still due for the remainder of a guaranteed period, if any.
The Account may purchase or sell investment securities in transactions with affiliated entities under procedures adopted by the Committee, pursuant to the 1940 Act. These transactions are effected at market rates without incurring broker commissions. For the year ended December 31, 2016, the Account engaged with affiliated entities in securities purchases of $7,159,000 and sales of $8,338,000, which resulted in net realized gains of $649,000.
Note 5—investments
Securities lending: The Account may lend its securities to qualified institutional borrowers to earn additional income. The Account receives collateral (in the form of cash, Treasury securities or other collateral permitted by applicable law) against the loaned securities and maintains collateral in an amount not less than 100% of the market value of loaned securities during the period of the loan; any additional collateral required due to changes in security values is delivered to the Account the next business day. Cash collateral received by the Account will generally be invested in high-quality short-term instruments or in one or more funds maintained by the securities lending agent (“Agent”) for the purpose of investing cash collateral. The value of the loaned securities and the liability to return the cash collateral received are reflected in the Statement of Assets and Liabilities. As of December 31, 2016, securities lending transactions are for equity securities, and the resulting loans are
| TIAA Separate Account VA-1 § 2016 Annual Report | 21 |
| Notes to financial statements |
continuous, can be recalled at any time, and have no set maturity. Securities lending income recognized by the Account consists of earnings on invested collateral and lending fees, net of any rebates to the borrower and compensation to the Agent. Such income is reflected separately in the Statement of Operations. In lending its securities, the Account bears the market risk with respect to the investment of collateral and the risk that the Agent may default on its contractual obligations to the Account. The Agent bears the risk that the borrower may default on its obligation to return the loaned securities as the Agent is contractually obligated to indemnify the Account if at the time of a default by a borrower some or all of the loan securities have not been returned.
Restricted securities: Restricted securities held by the Account, if any, may not be sold except in exempt transactions or in a public offering registered under the Securities Act of 1933. The risk of investing in such securities is generally greater than the risk of investing in securities that are widely held and publicly traded.
Net unrealized appreciation (depreciation): At December 31, 2016, net unrealized appreciation (depreciation) based on the aggregate cost of portfolio investments was $498,765,000, consisting of gross unrealized appreciation of $529,877,000 and gross unrealized depreciation of $(31,112,000).
Purchases and sales: Purchases and sales of portfolio securities (other than short-term instruments) for the year ended December 31, 2016 were $62,677,000 and $130,337,000, respectively.
Note 6—line of credit
The Account participates in a $1.5 billion unsecured revolving credit facility that can be used for temporary purposes, including, without limitation, the funding of contractowner withdrawals. The current facility was entered into on June 21, 2016 expiring on June 20, 2017, replacing the previous facility, which expired June 2016. Certain affiliated accounts and mutual funds, each of which is managed by Advisors, or an affiliate of Advisors, also participate in this facility. An annual commitment fee for the credit facility is borne by the participating accounts and mutual funds on a pro rata basis. Interest associated with any borrowing under the facility is charged to the borrowing accounts or mutual funds at a specified rate of interest. The Account is not liable for borrowings under the facility by other affiliated accounts or mutual funds. For the year ended December 31, 2016, there were no borrowings under this credit facility by the Account.
| 22 | 2016 Annual Report § TIAA Separate Account VA-1 |
| concluded |
Note 7—indemnification
In the normal course of business, the Account enters into contracts that contain a variety of representations and warranties and that provide general indemnities. The Account’s maximum exposure under these arrangements is unknown, as this would involve future claims against the Account that have not yet occurred. Also, under the Account’s organizational documents, the managers and officers of the Account are indemnified against certain liabilities that may arise out of their duties to the Account. However, based on experience, the Account expects the risk of loss due to these warranties and indemnities to be unlikely.
| TIAA Separate Account VA-1 § 2016 Annual Report | 23 |
| Report of independent registered public accounting firm |
To the Management Committee and Contract owners of the TIAA Separate Account VA-1:
In our opinion, the accompanying statement of assets and liabilities, including the summary portfolio of investments, and the related statements of operations and of changes in net assets and the financial highlights present fairly, in all material respects, the financial position of the Stock Index Account of TIAA Separate Account VA-1 (hereafter referred to as the “Account”) as of December 31, 2016, the results of its operations, the changes in its net assets and the financial highlights for each of the periods presented, in conformity with accounting principles generally accepted in the United States of America. These financial statements and financial highlights (hereafter referred to as “financial statements”) are the responsibility of the Account’s management. Our responsibility is to express an opinion on these financial statements based on our audits. We conducted our audits of these financial statements in accordance with the standards of the Public Company Accounting Oversight Board (United States). Those standards require that we plan and perform the audit to obtain reasonable assurance about whether the financial statements are free of material misstatement. An audit includes examining, on a test basis, evidence supporting the amounts and disclosures in the financial statements, assessing the accounting principles used and significant estimates made by management, and evaluating the overall financial statement presentation. We believe that our audits, which included confirmation of securities as of December 31, 2016 by correspondence with the custodian and brokers, provide a reasonable basis for our opinion.

PricewaterhouseCoopers LLP
Baltimore, Maryland
February 17, 2017
| 24 | 2016 Annual Report § TIAA Separate Account VA-1 |
| Management committee members and officers (unaudited) |
TIAA Separate Account VA-1 § December 31, 2016
Members
| Name, address and year of birth (“YOB”) | Position(s) held with account | Term of office and length of time served | Principal occupation(s) during past 5 years | Number of portfolios in fund complex overseen by member | Other directorship(s) held by member | |||||
Forrest Berkley c/o Corporate Secretary 730 Third Avenue New York, NY 10017-3206 YOB: 1954 | Member | Indefinite term. Member since 2006. | Retired Partner (since 2006), Partner (1990–2005) and Head of Global Product Management (2003–2005), GMO (formerly, Grantham, Mayo, Van Otterloo & Co.) (investment management); and member of asset allocation portfolio management team, GMO (2003–2005). | 88 | Director, the Maine Coast Heritage Trust; Investment Committee member, Maine Community Foundation and the Elmina B. Sewall Foundation; and Trustee of the Maine Chapter of the Nature Conservancy. | |||||
Nancy A. Eckl c/o Corporate Secretary 730 Third Avenue New York, NY 10017-3206 YOB: 1962 | Member | Indefinite term. Member since 2007. | Vice President (1990–2006), American Beacon Advisors, Inc., and Vice President of certain funds advised by American Beacon Advisors, Inc. | 88 | Independent Director, The Lazard Funds, Inc., Lazard Retirement Series, Inc., Lazard Global Total Return and Income Fund, Inc. and Lazard World Dividend & Income Fund, Inc. | |||||
Michael A. Forrester c/o Corporate Secretary 730 Third Avenue New York, NY 10017-3206 YOB: 1967 | Member | Indefinite term. Member since 2007. | Chief Executive Officer (since 2014) and Chief Operating Officer (2007–2014), Copper Rock Capital Partners, LLC; Chief Operating Officer, DDJ Capital Management (2003–2006). | 88 | Director of Copper Rock Capital Partners, LLC (investment adviser). |
| TIAA Separate Account VA-1 § 2016 Annual Report | 25 |
| Management committee members and officers (unaudited) | continued |
TIAA Separate Account VA-1 § December 31, 2016
Members—concluded
| Name, address and year of birth (“YOB”) | Position(s) held with account | Term of office and length of time served | Principal occupation(s) during past 5 years | Number of portfolios in fund complex overseen by member | Other directorship(s) held by member | |||||
Howell E. Jackson c/o Corporate Secretary 730 Third Avenue New York, NY 10017-3206 YOB: 1954 | Chairman of the Management Committee and Member | Indefinite term. Member since 2005; Chairman for term ending December 31, 2018. Chairman since 2013. | James S. Reid, Jr. Professor of Law (since 2004), Senior Advisor to the President and Provost (2010–2012), Acting Dean (2009), Vice Dean for Budget (2003–2006) and on the faculty (since 1989) of Harvard Law School. | 88 | Director, Commonwealth. | |||||
Thomas J. Kenny c/o Corporate Secretary 730 Third Avenue New York, NY 10017-3206 YOB: 1963 | Member | Indefinite term. Member since 2011. | Partner (2004–2010) and Managing Director (1999–2004), Goldman Sachs Asset Management. | 88 | Director, Aflac Insurance. Inc.; Director and Investment Committee member, Sansum Clinic; Investment Committee member, Cottage Health System; Member, University of California at Santa Barbara Arts and Lectures Advisory Council; Trustee and Chairman, Crane Country Day School. | |||||
Bridget A. Macaskill c/o Corporate Secretary 730 Third Avenue New York, NY 10017-3206 YOB: 1948 | Member | Indefinite term. Member since 2003. | Chairman, First Eagle Holdings (since 2016), Chief Executive Officer (2010–2016), President (2009–2016) and Chief Operating Officer (2009–2010), First Eagle Investment Management, LLC; Principal, BAM Consulting LLC (2003–2009); Independent Consultant for Merrill Lynch (2003–2009). | 88 | Director, First Eagle Holdings, LLC; Jones Lang LaSalle Incorporated; Close Brothers Group plc; Jupiter Fund Management plc; American Legacy Foundation (Investment Committee); University of Edinburgh (Campaign Board); the North Shore Land Alliance; and Prep for Prep. |
| 26 | 2016 Annual Report § TIAA Separate Account VA-1 |
James M. Poterba c/o Corporate Secretary 730 Third Avenue New York, NY 10017-3206 YOB: 1958 | Member | Indefinite term. Member since 2006. | President and Chief Executive Officer, National Bureau of Economic Research (“NBER”) (since 2008); Affiliated Faculty Member of the Finance Group at the Alfred P. Sloan School of Management, Massachusetts Institute of Technology (“MIT”) (since 2014); Mitsui Professor of Economics, MIT (since 1996); Head (2006–2008) and Associate Head (1994–2000 and 2001–2006), Economics Department of MIT; and Program Director, NBER (1990–2008). | 88 | Director, The Alfred P. Sloan Foundation and National Bureau of Economic Research; Member, Congressional Budget Office Panel of Economic Advisers. | |||||
Maceo K. Sloan c/o Corporate Secretary 730 Third Avenue New York, NY 10017-3206 YOB: 1949 | Member | Indefinite term. Member since 2001. | Chairman, President and Chief Executive Officer, Sloan Financial Group, Inc. (since 1991); Chairman and Chief Executive Officer (1991–2016) and Chief Investment Officer (1991–2013) and Chief Compliance Officer (2015–2016), NCM Capital Management Group, Inc.; Chairman and Chief Executive Officer (2003–2016) and Chief Investment Officer (2003–2013) and Chief Compliance Officer (2015–2016), NCM Capital Advisers Inc.; and Chairman, President and Principal Executive Officer, NCM Capital Investment Trust (2007–2012). | 88 | Director, SCANA Corporation (energy holding company). | |||||
Laura T. Starks c/o Corporate Secretary 730 Third Avenue New York, NY 10017-3206 YOB: 1950 | Member | Indefinite term. Member since 2006. | Associate Dean for Research (since 2011), McCombs School of Business, University of Texas at Austin (“McCombs”), and Director, AIM Investment Center at McCombs (since 2000). Charles E. and Sarah M. Seay Regents Chair in Finance (since 2002) and Professor, University of Texas at Austin (since 1987). Chairman, Department of Finance, University of Texas at Austin (2002–2011). | 88 | Member of the Board of Governors of the Investment Company Institute, the Governing Council of Independent Directors Council (an association for mutual fund directors); and Investment Advisory Committee, Employees Retirement System of Texas. |
| TIAA Separate Account VA-1 § 2016 Annual Report | 27 |
| Management committee members and officers (unaudited) | continued |
TIAA Separate Account VA-1 § December 31, 2016
Officers
| Name, address and year of birth (“YOB”) | Position(s) held with account | Term of office and length of time served | Principal occupation(s) during past 5 years | |||
Richard S. Biegen TIAA 730 Third Avenue New York, NY 10017-3206 YOB: 1962 | Chief Compliance Officer | One-year term. Chief Compliance Officer since 2008. | Managing Director, Senior Compliance Officer of Teachers Insurance and Annuity Association of America (“TIAA”). Chief Compliance Officer of the College Retirement Equities Fund (“CREF”), TIAA Separate Account VA-1, TIAA-CREF Funds, and TIAA-CREF Life Funds (collectively, the “TIAA-CREF Fund Complex”). | |||
Glenn Brightman TIAA 730 Third Avenue New York, NY 10017-3206 YOB: 1972 | Principal Financial Officer, Principal Accounting Officer and Treasurer since 2016 | One-year term. Principal Financial Officer, Principal Accounting Officer and Treasurer since 2016. | Senior Vice President, Chief Financial Officer of TIAA Global Asset Management. Treasurer of CREF; Principal Financial Officer, Principal Accounting Officer and Treasurer of TIAA Separate Account VA-1, the TIAA-CREF Funds and TIAA-CREF Life Funds. | |||
Roger W. Ferguson, Jr. TIAA 730 Third Avenue New York, NY 10017-3206 YOB: 1951 | President and Chief Executive Officer | One-year term. President and Chief Executive Officer since 2008. | President and Chief Executive Officer of TIAA, CREF and TIAA Separate Account VA-1. | |||
Stephen Gruppo TIAA 730 Third Avenue New York, NY 10017-3206 YOB: 1959 | Executive Vice President | One-year term. Executive Vice President since 2009. | Senior Executive Vice President, Chief Risk Officer of TIAA. Executive Vice President of the TIAA-CREF Fund Complex. |
| 28 | 2016 Annual Report § TIAA Separate Account VA-1 |
Robert G. Leary TIAA 730 Third Avenue New York, NY 10017-3206 YOB: 1961 | Executive Vice President | One-year term. Executive Vice President since 2013. | Senior Executive Vice President, Chief Executive Officer of TIAA Global Asset Management. Principal Executive Officer and Executive Vice President of CREF and VA-1. Principal Executive Officer and President of TIAA-CREF Funds and TIAA-CREF Life Funds. Prior to joining TIAA, Mr. Leary served as a Representative, Securities Research, Inc., President and Chief Operating Officer, U.S., ING Americas, Chief Executive Officer, ING Insurance US, and Chairman and Chief Executive Officer, ING Investment Management, Americas. | |||
J. Keith Morgan TIAA 730 Third Ave. New York, NY 10017-3206 YOB: 1951 | Executive Vice President | One-year term. Executive Vice President since 2015 | Senior Executive Vice President and Chief Legal Officer of TIAA and Executive Vice President of the TIAA-CREF Fund Complex. Prior to joining TIAA, Mr. Morgan served as Founder and Chief Executive Officer of Morris Lane Capital LLC (consultant), and as Senior Vice President and General Counsel of General Electric Capital Corporation. | |||
Ronald R. Pressman TIAA 730 Third Avenue New York, NY 10017-3206 YOB: 1958 | Executive Vice President | One-year term. Executive Vice President since 2012. | Senior Executive Vice President, Chief Executive Officer, Institutional Financial Services of TIAA, and Executive Vice President of the TIAA-CREF Fund Complex. Prior to joining TIAA, Mr. Pressman served as President and Chief Executive Officer of General Electric Capital Real Estate. | |||
Phillip T. Rollock TIAA 730 Third Avenue New York, NY 10017-3206 YOB: 1962 | Senior Managing Director and Corporate Secretary | One-year term. Senior Managing Director since 2013 and Corporate Secretary since 2012. | Senior Managing Director, Senior General Counsel and Corporate Secretary of TIAA and Senior Managing Director and Corporate Secretary of the TIAA-CREF Fund Complex. |
| TIAA Separate Account VA-1 § 2016 Annual Report | 29 |
| Management committee members and officers (unaudited) | concluded |
TIAA Separate Account VA-1 § December 31, 2016
Officers—concluded
| Name, address and year of birth (“YOB”) | Position(s) held with account | Term of office and length of time served | Principal occupation(s) during past 5 years | |||
Otha T. Spriggs, III TIAA 730 Third Avenue New York, NY 10017-3206 YOB: 1951 | Executive Vice President | One-year term. Executive Vice President since 2012. | Senior Executive Vice President and Chief Human Resources Officer of TIAA and Executive Vice President of the TIAA-CREF Fund Complex. Prior to joining TIAA, Mr. Spriggs served as Senior Vice President of Human Resources, Boston Scientific; President of Integrated People Solutions; Senior Vice President, Human Resources and various human resources leadership roles, CIGNA Corp. | |||
Constance K. Weaver TIAA 730 Third Avenue New York, NY 10017-3206 YOB: 1952 | Executive Vice President | One-year term. Executive Vice President since 2010. | Senior Executive Vice President, Chief Marketing Officer of TIAA and Executive Vice President of the TIAA-CREF Fund Complex. |
Please note that the Account’s Statement of Additional Information (SAI) includes additional information about the Account’s members and is available, without charge, through our website, tiaa.org, or by calling 800 223-1200.
| 30 | 2016 Annual Report § TIAA Separate Account VA-1 |
[This page intentionally left blank.]
[This page intentionally left blank.]
TIAA website
Account performance, personal account information and transactions, product descriptions, and information about investment choices and income options
TIAA.org
24 hours a day, 7 days a week
Automated telephone service
Check account performance and accumulation balances, change allocations, transfer funds and verify credited premiums
800-842-2252
24 hours a day, 7 days a week
National contact center
Retirement saving and planning, income options and payments, beneficiary services and tax reporting
800-842-2252
8 a.m. to 10 p.m. (ET), Monday–Friday
9 a.m. to 6 p.m. (ET), Saturday
Insurance planning center
After-tax annuities and life insurance
For an existing policy or contract
800-223-1200
To apply for a new policy or contract
877-825-0411
8 a.m. to 8 p.m. (ET), Monday–Friday
For the hearing- or speech-impaired
800-842-2755
8 a.m. to 10 p.m. (ET), Monday–Friday
9 a.m. to 6 p.m. (ET), Saturday
You should carefully consider the investment objectives, risks, charges and expenses of any account before investing. For a prospectus that contains this and other important information, please visit TIAA.org, or call 800-223-1200. Please read the prospectus carefully before investing. Investment, insurance and annuity products are not FDIC insured, are not bank guaranteed, are not bank deposits, are not insured by any federal government agency, are not a condition to any banking service or activity, and may lose value. TIAA Global Asset Management provides investment advice and portfolio management services through TIAA and over a dozen affiliated registered investment advisers. TIAA Brokerage Services is a division of TIAA-CREF Individual & Institutional Services, LLC. TIAA-CREF Individual & Institutional Services, LLC, Teachers Personal Investors Services, Inc., and Nuveen Securities, LLC, Members FINRA, distribute securities products. Annuity contracts and certificates are issued by Teachers Insurance and Annuity Association of America (TIAA) and College Retirement Equities Fund (CREF), New York, NY. After-tax annuities and life insurance are issued by TIAA-CREF Life Insurance Company, New York, NY. TIAA-CREF Trust Company, FSB provides trust services.
This material is not intended to be a recommendation or investment advice, does not constitute a solicitation to buy or sell securities, and is not provided in a fiduciary capacity. The information provided does not take into account the specific objectives or circumstances of any particular investor or suggest any specific course of action. Investment decisions should be made based on an investor’s objectives and circumstances and in consultation with his or her advisors.
©2017 Teachers Insurance and Annuity Association of America–College Retirement Equities Fund,
730 Third Avenue, New York, NY 10017-3206
 | 730 Third Avenue New York, NY 10017-3206 |

 | Printed on paper containing recycled fiber |
 |
We’re fond of paper…in its original form. Switch to eDelivery at TIAA.org/eDelivery |
| 97400 | A10845 (2/17) |
 | 730 Third Avenue New York, NY 10017-3206 |
| 97400 | A10845 (2/17) |
Item 2. Code of Ethics.
2(a) The Management Committee of TIAA Separate Account VA-1 (the “Registrant”) has adopted a code of ethics for senior financial officers, including the Registrant’s principal executive officer, principal financial officer, principal accounting officer, or controller, and persons performing similar functions, in conformity with rules promulgated under the Sarbanes-Oxley Act of 2002.
2(b) No response required.
2(c) During the reporting period, there were no amendments to the code of ethics.
2(d) During the reporting period, there were no implicit or explicit waivers granted by the Registrant from any provision of the code of ethics.
2(e) Not applicable.
2(f) A copy of the current code of ethics is filed as an exhibit to this Form N-CSR.
Item 3. Audit Committee Financial Expert.
3(a)(1) The Registrant’s Management Committee has determined that the Registrant has at least one audit committee financial expert serving on its Audit and Compliance Committee.
3(a)(2) Nancy A. Eckl is the Registrant’s audit committee financial expert and is “independent” for purposes of Item 3 of Form N-CSR.
Item 4. Principal Accountant Fees and Services.
PricewaterhouseCoopers LLP (“PwC”) performs independent audits of the Registrant’s financial statements. To maintain auditor independence and avoid the appearance of conflicts of interest, the Registrant, as a policy, does not engage PwC for management advisory or consulting services.
4(a) Audit Fees.
For the fiscal years ended December 31, 2016 and December 31, 2015, PwC’s aggregate fees for the audit of the Registrant’s annual financial statements were $53,250 and $51,900, respectively.
4(b) Audit Related Fees.
For the fiscal years ended December 31, 2016 and December 31, 2015, PwC’s aggregate fees for services related to the performance of the audit of the Registrant’s annual financial statements were $0 and $0, respectively.
For the fiscal years ended December 31, 2016 and December 31, 2015, the Audit-Related Fees billed by PwC to Teachers Advisors, LLC (“Advisors”) or to any entity controlling, controlled by or under common control with Advisors that provides ongoing services to the Registrant (collectively, “Fund Service Providers”) were $0 and $0, respectively.
4(c) Tax Fees.
For the fiscal years ended December 31, 2016 and December 31, 2015, PwC’s aggregate fees for tax services billed to the Registrant were $0 and $0, respectively.
For the fiscal years ended December 31, 2016 and December 31, 2015, PwC’s aggregate fees for tax services billed to the Fund Service Providers were $0 and $0, respectively.
4(d) All Other Fees.
For the fiscal years ended December 31, 2016 and December 31, 2015, PwC’s aggregate fees for all other services billed to the Registrant were $3,000 and $3,500, respectively.
For the fiscal years ended December 31, 2016 and December 31, 2015, PwC’s aggregate fees for all other services billed to the Fund Service Providers were $0 and $0, respectively.
4(e)(1) Preapproval Policy.
The Registrant’s audit and compliance committee (“Audit Committee”) has adopted a Preapproval Policy for External Audit Firm Services (the “Policy”). The Policy describes the types of services that may be provided by the independent auditor to the Registrant and certain of its affiliates without impairing the auditor’s independence. Under the Policy, the Audit Committee is required to preapprove all services to be performed by the Registrant’s
independent auditor in order to ensure that such services do not impair the auditor’s independence.
The Policy requires the Audit Committee to: (i) appoint the independent auditor to perform the financial statements audit for the Registrant and certain of its affiliates, including approving the terms of the engagement, and (ii) preapprove the audit, audit-related, tax and other services to be provided by the independent auditor to the Registrant and certain of its affiliates and the fees to be charged for provision of such services from year to year.
4(e)(2) Services provided pursuant to paragraph (c)(7)(i)(C) of Rule 2-01 of Regulation S-X (the “de minimis exception”):
Audit-Related Fees:
There were no amounts that were approved by the Audit Committee pursuant to the de minimis exception for the fiscal years ended December 31, 2016 and December 31, 2015 on behalf of the Registrant.
There were no amounts that were approved by the Audit Committee pursuant to the de minimis exception for the fiscal years ended December 31, 2016 and December 31, 2015 on behalf of the Fund Service Providers that relate directly to the operations and financial reporting of the Registrant.
Tax Fees:
There were no amounts that were approved by the Audit Committee pursuant to the de minimis exception for the fiscal years ended December 31, 2016 and December 31, 2015 on behalf of the Registrant.
There were no amounts that were approved by the Audit Committee pursuant to the de minimis exception for the fiscal years ended December 31, 2016 and December 31, 2015 on behalf of the Fund Service Providers that relate directly to the operations and financial reporting of the Registrant.
All Other Fees:
There were no amounts that were approved by the Audit Committee pursuant to the de minimis exception for the fiscal years ended December 31, 2016 and December 31, 2015 on behalf of the Registrant.
There were no amounts that were approved by the Audit Committee pursuant to the de minimis exception for the fiscal years ended December 31, 2016 and December 31, 2015 on behalf of the Fund Service Providers that relate directly to the operations and financial reporting of the Registrant.
4(f) The percentage of hours expended by PwC’s engagement to audit the Registrant’s financial statements for the most recent fiscal year attributable to work performed by persons other than PwC’s full-time, permanent employees was less than 50%.
4(g) Non-Audit Fees for Related Entities.
For the fiscal years ended December 31, 2016 and December 31, 2015, aggregate non-audit fees billed to the Registrant and to its Fund Service Providers by PwC were $305,800 and $399,000, respectively.
4(h) The Registrant’s Audit Committee has considered whether the non-audit services that were rendered by PwC to the Registrant’s Fund Service Providers that were not pre-approved pursuant to paragraph (c)(7)(ii) of Rule 2-01 of Regulation S-X are compatible with maintaining PwC’s independence.
Item 5. Audit Committee of Listed Registrants.
Not Applicable.
Item 6. Schedule of Investments.
TIAA SEPARATE ACCOUNT VA-1 - Stock Index Account
TIAA SEPARATE ACCOUNT VA-1
STOCK INDEX ACCOUNT
SCHEDULE OF INVESTMENTS
December 31, 2016
SHARES | COMPANY | VALUE (000) | ||||||
COMMON STOCKS - 99.5% | ||||||||
AUTOMOBILES & COMPONENTS - 0.9% | ||||||||
3,706 | * | Adient plc | $ | 217 | ||||
2,808 | * | American Axle & Manufacturing Holdings, Inc | 54 | |||||
8,860 | BorgWarner, Inc | 350 | ||||||
2,269 | Cooper Tire & Rubber Co | 88 | ||||||
605 | * | Cooper-Standard Holding, Inc | 63 | |||||
5,286 | Dana Holding Corp | 100 | ||||||
10,985 | Delphi Automotive plc | 740 | ||||||
1,044 | * | Dorman Products, Inc | 76 | |||||
1,256 | * | Federal Mogul Corp (Class A) | 13 | |||||
156,127 | Ford Motor Co | 1,894 | ||||||
744 | * | Fox Factory Holding Corp | 21 | |||||
56,291 | General Motors Co | 1,961 | ||||||
10,618 | Gentex Corp | 209 | ||||||
1,535 | * | Gentherm, Inc | 52 | |||||
10,982 | Goodyear Tire & Rubber Co | 339 | ||||||
7,420 | Harley-Davidson, Inc | 433 | ||||||
799 | * | Horizon Global Corp | 19 | |||||
3,018 | Lear Corp | 400 | ||||||
428 | Metaldyne Performance Group, Inc | 10 | ||||||
1,945 | * | Modine Manufacturing Co | 29 | |||||
670 | * | Motorcar Parts of America, Inc | 18 | |||||
1,379 | Spartan Motors, Inc | 13 | ||||||
909 | Standard Motor Products, Inc | 48 | ||||||
1,336 | * | Stoneridge, Inc | 24 | |||||
157 | Strattec Security Corp | 6 | ||||||
1,027 | Superior Industries International, Inc | 27 | ||||||
2,018 | * | Tenneco, Inc | 126 | |||||
5,007 | *,e | Tesla Motors, Inc | 1,070 | |||||
1,931 | Thor Industries, Inc | 193 | ||||||
897 | Tower International, Inc | 25 | ||||||
1,410 | Visteon Corp | 113 | ||||||
257 | Winnebago Industries, Inc | 8 | ||||||
526 | *,e | Workhorse Group, Inc | 4 | |||||
|
| |||||||
| TOTAL AUTOMOBILES & COMPONENTS | 8,743 | |||||||
|
| |||||||
BANKS - 7.1% | ||||||||
125 | 1st Source Corp | 6 | ||||||
295 | e | Access National Corp | 8 | |||||
255 | ACNB Corp | 8 | ||||||
444 | * | Allegiance Bancshares, Inc | 16 | |||||
374 | American National Bankshares, Inc | 13 | ||||||
1,390 | Ameris Bancorp | 61 | ||||||
387 | Ames National Corp | 13 | ||||||
21 | Arrow Financial Corp | 1 | ||||||
6,191 | Associated Banc-Corp | 153 | ||||||
3,765 | Astoria Financial Corp | 70 | ||||||
706 | * | Atlantic Capital Bancshares, Inc | 13 | |||||
1,598 | Banc of California, Inc | 28 | ||||||
333 | Bancfirst Corp | 31 | ||||||
1,284 | Banco Latinoamericano de Exportaciones S.A. (Class E) | 38 | ||||||
3,559 | Bancorpsouth, Inc | 111 | ||||||
2,688 | Bank Mutual Corp | 25 | ||||||
413,240 | Bank of America Corp | 9,133 | ||||||
1,630 | Bank of Hawaii Corp | 145 | ||||||
1
TIAA SEPARATE ACCOUNT VA-1 - Stock Index Account
SHARES | COMPANY | VALUE (000) | ||||||
288 | Bank of Marin Bancorp | $ | 20 | |||||
252 | Bank of NT Butterfield & Son Ltd | 8 | ||||||
3,616 | Bank of the Ozarks, Inc | 190 | ||||||
1,044 | BankFinancial Corp | 15 | ||||||
4,119 | BankUnited | 155 | ||||||
217 | Bankwell Financial Group, Inc | 7 | ||||||
1,166 | Banner Corp | 65 | ||||||
261 | Bar Harbor Bankshares | 12 | ||||||
32,696 | BB&T Corp | 1,537 | ||||||
573 | Bear State Financial, Inc | 6 | ||||||
2,895 | Beneficial Bancorp, Inc | 53 | ||||||
1,257 | Berkshire Hills Bancorp, Inc | 46 | ||||||
1,165 | Blue Hills Bancorp, Inc | 22 | ||||||
1,553 | BNC Bancorp | 50 | ||||||
2,584 | *,e | BofI Holding, Inc | 74 | |||||
1,068 | BOK Financial Corp | 89 | ||||||
3,543 | Boston Private Financial Holdings, Inc | 59 | ||||||
683 | Bridge Bancorp, Inc | 26 | ||||||
2,984 | Brookline Bancorp, Inc | 49 | ||||||
630 | Bryn Mawr Bank Corp | 27 | ||||||
334 | * | BSB Bancorp, Inc | 10 | |||||
131 | C&F Financial Corp | 7 | ||||||
613 | Camden National Corp | 27 | ||||||
950 | Capital Bank Financial Corp | 37 | ||||||
659 | Capital City Bank Group, Inc | 14 | ||||||
5,269 | Capitol Federal Financial | 87 | ||||||
1,503 | Cardinal Financial Corp | 49 | ||||||
421 | Carolina Financial Corp | 13 | ||||||
1,376 | * | Cascade Bancorp | 11 | |||||
3,051 | Cathay General Bancorp | 116 | ||||||
1,935 | Centerstate Banks of Florida, Inc | 49 | ||||||
987 | Central Pacific Financial Corp | 31 | ||||||
152 | Century Bancorp, Inc | 9 | ||||||
1,050 | Charter Financial Corp | 18 | ||||||
1,631 | Chemical Financial Corp | 88 | ||||||
122 | Chemung Financial Corp | 4 | ||||||
7,763 | CIT Group, Inc | 331 | ||||||
118,518 | Citigroup, Inc | 7,043 | ||||||
533 | Citizens & Northern Corp | 14 | ||||||
21,231 | Citizens Financial Group, Inc | 756 | ||||||
597 | City Holding Co | 40 | ||||||
856 | Clifton Bancorp, Inc | 14 | ||||||
498 | CNB Financial Corp | 13 | ||||||
1,740 | CoBiz, Inc | 29 | ||||||
326 | Codorus Valley Bancorp, Inc | 9 | ||||||
2,323 | Columbia Banking System, Inc | 104 | ||||||
7,230 | Comerica, Inc | 492 | ||||||
3,489 | Commerce Bancshares, Inc | 202 | ||||||
1,740 | Community Bank System, Inc | 108 | ||||||
651 | Community Trust Bancorp, Inc | 32 | ||||||
1,146 | ConnectOne Bancorp, Inc | 30 | ||||||
206 | County Bancorp, Inc | 6 | ||||||
673 | * | CU Bancorp | 24 | |||||
2,204 | Cullen/Frost Bankers, Inc | 194 | ||||||
1,005 | * | Customers Bancorp, Inc | 36 | |||||
4,428 | CVB Financial Corp | 102 | ||||||
1,325 | Dime Community Bancshares | 27 | ||||||
1,262 | * | Eagle Bancorp, Inc | 77 | |||||
5,936 | East West Bancorp, Inc | 302 | ||||||
314 | Enterprise Bancorp, Inc | 12 | ||||||
828 | Enterprise Financial Services Corp | 36 | ||||||
202 | * | Equity Bancshares, Inc | 7 | |||||
342 | ESSA Bancorp, Inc | 5 | ||||||
2
TIAA SEPARATE ACCOUNT VA-1 - Stock Index Account
SHARES | COMPANY | VALUE (000) | ||||||
3,087 | * | Essent Group Ltd | $ | 100 | ||||
3,701 | EverBank Financial Corp | 72 | ||||||
298 | Farmers Capital Bank Corp | 13 | ||||||
1,013 | Farmers National Banc Corp | 14 | ||||||
1,196 | * | FCB Financial Holdings, Inc | 57 | |||||
384 | Federal Agricultural Mortgage Corp (Class C) | 22 | ||||||
863 | Fidelity Southern Corp | 20 | ||||||
30,717 | Fifth Third Bancorp | 828 | ||||||
664 | Financial Institutions, Inc | 23 | ||||||
720 | First Bancorp (NC) | 20 | ||||||
4,520 | * | First Bancorp (Puerto Rico) | 30 | |||||
498 | First Bancorp, Inc | 16 | ||||||
1,277 | First Busey Corp | 39 | ||||||
360 | First Business Financial Services, Inc | 9 | ||||||
295 | First Citizens Bancshares, Inc (Class A) | 105 | ||||||
3,678 | First Commonwealth Financial Corp | 52 | ||||||
680 | First Community Bancshares, Inc | 21 | ||||||
758 | First Connecticut Bancorp | 17 | ||||||
53 | First Defiance Financial Corp | 3 | ||||||
2,653 | First Financial Bancorp | 75 | ||||||
2,781 | e | First Financial Bankshares, Inc | 126 | |||||
46 | First Financial Corp | 2 | ||||||
175 | First Financial Northwest, Inc | 3 | ||||||
549 | * | First Foundation, Inc | 16 | |||||
798 | First Hawaiian, Inc | 28 | ||||||
9,563 | First Horizon National Corp | 191 | ||||||
228 | e | First Internet Bancorp | 7 | |||||
747 | First Interstate Bancsystem, Inc | 32 | ||||||
1,580 | First Merchants Corp | 59 | ||||||
249 | First Mid-Illinois Bancshares, Inc | 8 | ||||||
3,289 | First Midwest Bancorp, Inc | 83 | ||||||
670 | *,e | First NBC Bank Holding Co | 5 | |||||
862 | First of Long Island Corp | 25 | ||||||
5,761 | First Republic Bank | 531 | ||||||
890 | * | Flagstar Bancorp, Inc | 24 | |||||
1,327 | Flushing Financial Corp | 39 | ||||||
8,646 | FNB Corp | 139 | ||||||
389 | * | Franklin Financial Network, Inc | 16 | |||||
7,161 | Fulton Financial Corp | 135 | ||||||
602 | German American Bancorp, Inc | 32 | ||||||
2,629 | Glacier Bancorp, Inc | 95 | ||||||
500 | Great Southern Bancorp, Inc | 27 | ||||||
1,739 | Great Western Bancorp, Inc | 76 | ||||||
688 | * | Green Bancorp, Inc | 10 | |||||
710 | Guaranty Bancorp | 17 | ||||||
3,286 | Hancock Holding Co | 142 | ||||||
1,297 | Hanmi Financial Corp | 45 | ||||||
406 | * | HarborOne Bancorp, Inc | 8 | |||||
879 | Heartland Financial USA, Inc | 42 | ||||||
1,007 | Heritage Commerce Corp | 15 | ||||||
1,277 | Heritage Financial Corp | 33 | ||||||
917 | Heritage Oaks Bancorp | 11 | ||||||
3,068 | Hilltop Holdings, Inc | 91 | ||||||
57 | Hingham Institution for Savings | 11 | ||||||
238 | Home Bancorp, Inc | 9 | ||||||
4,991 | Home Bancshares, Inc | 139 | ||||||
698 | * | HomeStreet, Inc | 22 | |||||
667 | * | HomeTrust Bancshares, Inc | 17 | |||||
5,560 | Hope Bancorp, Inc | 122 | ||||||
670 | Horizon Bancorp | 19 | ||||||
44,528 | Huntington Bancshares, Inc | 589 | ||||||
1,574 | IBERIABANK Corp | 132 | ||||||
350 | *,e | Impac Mortgage Holdings, Inc | 5 | |||||
1,031 | Independent Bank Corp (MA) | 73 | ||||||
3
TIAA SEPARATE ACCOUNT VA-1 - Stock Index Account
SHARES | COMPANY | VALUE (000) | ||||||
863 | Independent Bank Corp (MI) | $ | 19 | |||||
406 | Independent Bank Group, Inc | 25 | ||||||
2,385 | International Bancshares Corp | 97 | ||||||
12,271 | Investors Bancorp, Inc | 171 | ||||||
146,319 | JPMorgan Chase & Co | 12,626 | ||||||
3,956 | Kearny Financial Corp | 62 | ||||||
41,226 | Keycorp | 753 | ||||||
311 | Lake Sunapee Bank Group | 7 | ||||||
1,629 | Lakeland Bancorp, Inc | 32 | ||||||
976 | Lakeland Financial Corp | 46 | ||||||
378 | LCNB Corp | 9 | ||||||
1,826 | LegacyTexas Financial Group, Inc | 79 | ||||||
263 | *,e | LendingTree, Inc | 27 | |||||
833 | e | Live Oak Bancshares, Inc | 15 | |||||
5,920 | M&T Bank Corp | 926 | ||||||
1,072 | Macatawa Bank Corp | 11 | ||||||
946 | MainSource Financial Group, Inc | 33 | ||||||
2,934 | MB Financial, Inc | 139 | ||||||
540 | MBT Financial Corp | 6 | ||||||
724 | Mercantile Bank Corp | 27 | ||||||
273 | Merchants Bancshares, Inc | 15 | ||||||
1,997 | Meridian Bancorp, Inc | 38 | ||||||
241 | Meta Financial Group, Inc | 25 | ||||||
12,335 | * | MGIC Investment Corp | 126 | |||||
144 | Middleburg Financial Corp | 5 | ||||||
152 | Midland States Bancorp, Inc | 6 | ||||||
334 | MidWestOne Financial Group, Inc | 13 | ||||||
213 | MutualFirst Financial, Inc | 7 | ||||||
1,078 | National Bank Holdings Corp | 34 | ||||||
357 | e | National Bankshares, Inc | 16 | |||||
248 | * | National Commerce Corp | 9 | |||||
1,624 | * | Nationstar Mortgage Holdings, Inc | 29 | |||||
1,396 | NBT Bancorp, Inc | 58 | ||||||
18,627 | New York Community Bancorp, Inc | 296 | ||||||
301 | * | Nicolet Bankshares, Inc | 14 | |||||
2,265 | * | NMI Holdings, Inc | 24 | |||||
428 | Northfield Bancorp, Inc | 9 | ||||||
280 | Northrim BanCorp, Inc | 9 | ||||||
3,966 | Northwest Bancshares, Inc | 72 | ||||||
741 | OceanFirst Financial Corp | 22 | ||||||
1,902 | OFG Bancorp | 25 | ||||||
361 | Old Line Bancshares, Inc | 9 | ||||||
4,858 | Old National Bancorp | 88 | ||||||
1,237 | Old Second Bancorp, Inc | 14 | ||||||
441 | Opus Bank | 13 | ||||||
1,974 | Oritani Financial Corp | 37 | ||||||
297 | Orrstown Financial Services, Inc | 7 | ||||||
991 | Pacific Continental Corp | 22 | ||||||
589 | * | Pacific Mercantile Bancorp | 4 | |||||
1,114 | * | Pacific Premier Bancorp, Inc | 39 | |||||
4,871 | PacWest Bancorp | 265 | ||||||
529 | Park National Corp | 63 | ||||||
2,151 | Park Sterling Bank | 23 | ||||||
534 | Peapack Gladstone Financial Corp | 17 | ||||||
221 | Penns Woods Bancorp, Inc | 11 | ||||||
575 | * | PennyMac Financial Services, Inc | 10 | |||||
595 | Peoples Bancorp, Inc | 19 | ||||||
333 | Peoples Financial Services Corp | 16 | ||||||
11,107 | People’s United Financial, Inc | 215 | ||||||
521 | People’s Utah Bancorp | 14 | ||||||
2,087 | * | PHH Corp | 32 | |||||
1,758 | Pinnacle Financial Partners, Inc | 122 | ||||||
20,025 | PNC Financial Services Group, Inc | 2,342 | ||||||
3,587 | Popular, Inc | 157 | ||||||
4
TIAA SEPARATE ACCOUNT VA-1 - Stock Index Account
SHARES | COMPANY | VALUE (000) | ||||||
564 | Preferred Bank | $ | 30 | |||||
377 | Premier Financial Bancorp, Inc | 8 | ||||||
2,997 | PrivateBancorp, Inc | 162 | ||||||
2,744 | Prosperity Bancshares, Inc | 197 | ||||||
251 | Provident Financial Holdings, Inc | 5 | ||||||
2,502 | Provident Financial Services, Inc | 71 | ||||||
472 | QCR Holdings, Inc | 20 | ||||||
8,211 | Radian Group, Inc | 148 | ||||||
51,938 | Regions Financial Corp | 746 | ||||||
1,629 | Renasant Corp | 69 | ||||||
612 | Republic Bancorp, Inc (Class A) | 24 | ||||||
1,330 | *,e | Republic First Bancorp, Inc | 11 | |||||
1,466 | S&T Bancorp, Inc | 57 | ||||||
1,134 | Sandy Spring Bancorp, Inc | 45 | ||||||
1,194 | * | Seacoast Banking Corp of Florida | 26 | |||||
1,876 | e | ServisFirst Bancshares, Inc | 70 | |||||
497 | Shore Bancshares, Inc | 8 | ||||||
475 | SI Financial Group, Inc | 7 | ||||||
370 | Sierra Bancorp | 10 | ||||||
2,187 | * | Signature Bank | 328 | |||||
1,210 | Simmons First National Corp (Class A) | 75 | ||||||
1,021 | South State Corp | 89 | ||||||
228 | * | Southern First Bancshares, Inc | 8 | |||||
231 | Southern Missouri Bancorp, Inc | 8 | ||||||
454 | Southern National Bancorp of Virginia, Inc | 7 | ||||||
876 | Southside Bancshares, Inc | 33 | ||||||
740 | Southwest Bancorp, Inc | 21 | ||||||
1,614 | State Bank & Trust Co | 43 | ||||||
5,200 | Sterling Bancorp/DE | 122 | ||||||
922 | Stock Yards Bancorp, Inc | 43 | ||||||
443 | Stonegate Bank | 18 | ||||||
513 | Suffolk Bancorp | 22 | ||||||
244 | e | Summit Financial Group, Inc | 7 | |||||
385 | Sun Bancorp, Inc | 10 | ||||||
20,032 | SunTrust Banks, Inc | 1,099 | ||||||
2,164 | * | SVB Financial Group | 371 | |||||
5,140 | Synovus Financial Corp | 211 | ||||||
6,509 | TCF Financial Corp | 128 | ||||||
565 | Territorial Bancorp, Inc | 19 | ||||||
1,877 | * | Texas Capital Bancshares, Inc | 147 | |||||
2,387 | TFS Financial Corp | 45 | ||||||
1,514 | * | The Bancorp, Inc | 12 | |||||
664 | Tompkins Trustco, Inc | 63 | ||||||
2,594 | TowneBank | 86 | ||||||
968 | Trico Bancshares | 33 | ||||||
943 | * | Tristate Capital Holdings, Inc | 21 | |||||
657 | * | Triumph Bancorp, Inc | 17 | |||||
2,046 | Trustco Bank Corp NY | 18 | ||||||
2,849 | Trustmark Corp | 102 | ||||||
1,796 | UMB Financial Corp | 139 | ||||||
9,062 | Umpqua Holdings Corp | 170 | ||||||
1,777 | Union Bankshares Corp | 64 | ||||||
161 | e | Union Bankshares, Inc | 7 | |||||
2,794 | United Bankshares, Inc | 129 | ||||||
2,012 | United Community Banks, Inc | 60 | ||||||
1,829 | United Community Financial Corp | 16 | ||||||
2,065 | United Financial Bancorp, Inc (New) | 38 | ||||||
1,127 | Univest Corp of Pennsylvania | 35 | ||||||
65,388 | US Bancorp | 3,359 | ||||||
10,196 | Valley National Bancorp | 119 | ||||||
345 | * | Veritex Holdings, Inc | 9 | |||||
1,098 | * | Walker & Dunlop, Inc | 34 | |||||
821 | *,e | Walter Investment Management Corp | 4 | |||||
3,738 | Washington Federal, Inc | 128 | ||||||
718 | Washington Trust Bancorp, Inc | 40 | ||||||
5
TIAA SEPARATE ACCOUNT VA-1 - Stock Index Account
SHARES | COMPANY | VALUE (000) | ||||||
334 | WashingtonFirst Bankshares, Inc | $ | 10 | |||||
1,032 | Waterstone Financial, Inc | 19 | ||||||
3,763 | Webster Financial Corp | 204 | ||||||
183,778 | Wells Fargo & Co | 10,128 | ||||||
1,636 | WesBanco, Inc | 70 | ||||||
746 | West Bancorporation, Inc | 18 | ||||||
1,024 | e | Westamerica Bancorporation | 64 | |||||
3,836 | * | Western Alliance Bancorp | 187 | |||||
597 | Western New England Bancorp, Inc | 6 | ||||||
1,947 | Wintrust Financial Corp | 141 | ||||||
8,517 | * | WMIH Corp | 13 | |||||
1,176 | WSFS Financial Corp | 55 | ||||||
225 | * | Xenith Bankshares, Inc | 6 | |||||
1,817 | Yadkin Financial Corp | 62 | ||||||
8,430 | Zions Bancorporation | 363 | ||||||
|
| |||||||
TOTAL BANKS | 67,903 | |||||||
|
| |||||||
CAPITAL GOODS - 7.9% | ||||||||
23,711 | 3M Co | 4,234 | ||||||
5,848 | A.O. Smith Corp | 277 | ||||||
1,675 | Aaon, Inc | 55 | ||||||
1,501 | AAR Corp | 50 | ||||||
2,508 | Actuant Corp (Class A) | 65 | ||||||
1,732 | Acuity Brands, Inc | 400 | ||||||
1,431 | Advanced Drainage Systems, Inc | 29 | ||||||
5,513 | * | Aecom Technology Corp | 200 | |||||
1,460 | * | Aegion Corp | 35 | |||||
2,743 | * | Aerojet Rocketdyne Holdings, Inc | 49 | |||||
831 | * | Aerovironment, Inc | 22 | |||||
2,620 | AGCO Corp | 152 | ||||||
3,984 | Air Lease Corp | 137 | ||||||
1,949 | Aircastle Ltd | 41 | ||||||
374 | Alamo Group, Inc | 28 | ||||||
1,204 | Albany International Corp (Class A) | 56 | ||||||
3,696 | Allegion plc | 237 | ||||||
205 | Allied Motion Technologies, Inc | 4 | ||||||
5,851 | Allison Transmission Holdings, Inc | 197 | ||||||
1,234 | Altra Holdings, Inc | 46 | ||||||
909 | * | Ameresco, Inc | 5 | |||||
324 | e | American Railcar Industries, Inc | 15 | |||||
510 | *,e | American Superconductor Corp | 4 | |||||
568 | * | American Woodmark Corp | 43 | |||||
9,238 | Ametek, Inc | 449 | ||||||
1,174 | Apogee Enterprises, Inc | 63 | ||||||
1,503 | Applied Industrial Technologies, Inc | 89 | ||||||
17,975 | Arconic, Inc | 333 | ||||||
555 | Argan, Inc | 39 | ||||||
822 | * | Armstrong Flooring, Inc | 16 | |||||
1,923 | * | Armstrong World Industries, Inc | 80 | |||||
729 | Astec Industries, Inc | 49 | ||||||
810 | * | Astronics Corp | 27 | |||||
360 | * | Atkore International Group, Inc | 9 | |||||
1,059 | AZZ, Inc | 68 | ||||||
1,864 | * | Babcock & Wilcox Enterprises, Inc | 31 | |||||
2,064 | Barnes Group, Inc | 98 | ||||||
3,972 | BE Aerospace, Inc | 239 | ||||||
2,438 | * | Beacon Roofing Supply, Inc | 112 | |||||
1,428 | * | BMC Stock Holdings, Inc | 28 | |||||
24,026 | Boeing Co | 3,740 | ||||||
2,014 | Briggs & Stratton Corp | 45 | ||||||
3,043 | * | Builders FirstSource, Inc | 33 | |||||
3,729 | BWX Technologies, Inc | 148 | ||||||
988 | * | Caesarstone Sdot-Yam Ltd | 28 | |||||
6
TIAA SEPARATE ACCOUNT VA-1 - Stock Index Account
SHARES | COMPANY | VALUE (000) | ||||||
520 | * | CAI International, Inc | $ | 5 | ||||
2,591 | Carlisle Cos, Inc | 286 | ||||||
22,428 | Caterpillar, Inc | 2,080 | ||||||
1,264 | * | Chart Industries, Inc | 46 | |||||
4,310 | Chicago Bridge & Iron Co NV | 137 | ||||||
706 | CIRCOR International, Inc | 46 | ||||||
1,794 | Clarcor, Inc | 148 | ||||||
4,058 | * | Colfax Corp | 146 | |||||
840 | Columbus McKinnon Corp | 23 | ||||||
1,568 | Comfort Systems USA, Inc | 52 | ||||||
1,330 | * | Continental Building Products Inc | 31 | |||||
1,704 | Crane Co | 123 | ||||||
366 | * | CSW Industrials, Inc | 13 | |||||
1,041 | Cubic Corp | 50 | ||||||
6,385 | Cummins, Inc | 873 | ||||||
1,822 | Curtiss-Wright Corp | 179 | ||||||
24,291 | Danaher Corp | 1,891 | ||||||
12,652 | Deere & Co | 1,304 | ||||||
2,609 | * | DigitalGlobe, Inc | 75 | |||||
535 | DMC Global, Inc | 8 | ||||||
5,224 | Donaldson Co, Inc | 220 | ||||||
932 | Douglas Dynamics, Inc | 31 | ||||||
6,156 | Dover Corp | 461 | ||||||
485 | * | Ducommun, Inc | 12 | |||||
567 | * | DXP Enterprises, Inc | 20 | |||||
1,212 | * | Dycom Industries, Inc | 97 | |||||
18,376 | Eaton Corp | 1,233 | ||||||
2,145 | EMCOR Group, Inc | 152 | ||||||
25,584 | Emerson Electric Co | 1,426 | ||||||
840 | Encore Wire Corp | 36 | ||||||
648 | *,e | Energous Corp | 11 | |||||
979 | * | Energy Recovery, Inc | 10 | |||||
1,774 | EnerSys | 139 | ||||||
788 | * | Engility Holdings, Inc | 27 | |||||
882 | EnPro Industries, Inc | 59 | ||||||
4,763 | Equifax, Inc | 563 | ||||||
1,174 | ESCO Technologies, Inc | 66 | ||||||
1,198 | * | Esterline Technologies Corp | 107 | |||||
11,535 | Fastenal Co | 542 | ||||||
2,645 | Federal Signal Corp | 41 | ||||||
5,526 | Flowserve Corp | 266 | ||||||
5,770 | Fluor Corp | 303 | ||||||
11,983 | Fortive Corp | 643 | ||||||
6,328 | Fortune Brands Home & Security, Inc | 338 | ||||||
1,399 | Franklin Electric Co, Inc | 54 | ||||||
635 | Freightcar America, Inc | 9 | ||||||
633 | *,e | FuelCell Energy, Inc | 1 | |||||
1,317 | e | GATX Corp | 81 | |||||
277 | * | Gencor Industries, Inc | 4 | |||||
2,688 | * | Generac Holdings, Inc | 110 | |||||
2,068 | General Cable Corp | 39 | ||||||
9,775 | General Dynamics Corp | 1,688 | ||||||
369,942 | General Electric Co | 11,690 | ||||||
1,331 | * | Gibraltar Industries, Inc | 55 | |||||
870 | Global Brass & Copper Holdings, Inc | 30 | ||||||
288 | * | GMS, Inc | 8 | |||||
903 | Gorman-Rupp Co | 28 | ||||||
2,290 | Graco, Inc | 190 | ||||||
470 | Graham Corp | 10 | ||||||
1,667 | Granite Construction, Inc | 92 | ||||||
3,079 | * | Great Lakes Dredge & Dock Corp | 13 | |||||
1,206 | e | Greenbrier Cos, Inc | 50 | |||||
1,574 | Griffon Corp | 41 | ||||||
1,293 | H&E Equipment Services, Inc | 30 | ||||||
7
TIAA SEPARATE ACCOUNT VA-1 - Stock Index Account
SHARES | COMPANY | VALUE (000) | ||||||
3,556 | Harsco Corp | $ | 48 | |||||
797 | * | HC2 Holdings, Inc | 5 | |||||
7,822 | * | HD Supply Holdings, Inc | 333 | |||||
816 | HEICO Corp | 63 | ||||||
1,610 | HEICO Corp (Class A) | 109 | ||||||
981 | * | Herc Holdings, Inc | 39 | |||||
3,542 | Hexcel Corp | 182 | ||||||
2,415 | Hillenbrand, Inc | 93 | ||||||
30,622 | Honeywell International, Inc | 3,548 | ||||||
2,088 | Hubbell, Inc | 244 | ||||||
1,806 | Huntington Ingalls | 333 | ||||||
316 | Hurco Cos, Inc | 10 | ||||||
404 | Hyster-Yale Materials Handling, Inc | 26 | ||||||
3,071 | IDEX Corp | 277 | ||||||
298 | * | IES Holdings, Inc | 6 | |||||
11,816 | Illinois Tool Works, Inc | 1,447 | ||||||
10,173 | Ingersoll-Rand plc | 763 | ||||||
716 | Insteel Industries, Inc | 26 | ||||||
3,749 | ITT, Inc | 145 | ||||||
4,960 | * | Jacobs Engineering Group, Inc | 283 | |||||
1,200 | John Bean Technologies Corp | 103 | ||||||
36,727 | Johnson Controls International plc | 1,513 | ||||||
3,945 | Joy Global, Inc | 110 | ||||||
433 | Kadant, Inc | 26 | ||||||
1,238 | Kaman Corp | 61 | ||||||
6,104 | KBR, Inc | 102 | ||||||
3,241 | Kennametal, Inc | 101 | ||||||
1,479 | * | KEYW Holding Corp | 17 | |||||
2,122 | * | KLX, Inc | 96 | |||||
1,860 | * | Kratos Defense & Security Solutions, Inc | 14 | |||||
3,022 | L3 Technologies, Inc | 460 | ||||||
246 | * | Lawson Products, Inc | 6 | |||||
763 | *,e | Layne Christensen Co | 8 | |||||
1,542 | Lennox International, Inc | 236 | ||||||
2,461 | Lincoln Electric Holdings, Inc | 189 | ||||||
495 | e | Lindsay Corp | 37 | |||||
10,229 | Lockheed Martin Corp | 2,557 | ||||||
1,293 | LSI Industries, Inc | 13 | ||||||
674 | * | Lydall, Inc | 42 | |||||
5,733 | * | Manitowoc Co, Inc | 34 | |||||
5,214 | * | Manitowoc Foodservice, Inc | 101 | |||||
13,761 | Masco Corp | 435 | ||||||
1,317 | * | Masonite International Corp | 87 | |||||
2,813 | * | Mastec, Inc | 108 | |||||
1,540 | * | Mercury Systems, Inc | 47 | |||||
3,592 | * | Meritor, Inc | 45 | |||||
2,342 | * | Middleby Corp | 302 | |||||
623 | * | Milacron Holdings Corp | 12 | |||||
446 | Miller Industries, Inc | 12 | ||||||
1,285 | * | Moog, Inc (Class A) | 84 | |||||
4,196 | * | MRC Global, Inc | 85 | |||||
1,960 | MSC Industrial Direct Co (Class A) | 181 | ||||||
2,210 | Mueller Industries, Inc | 88 | ||||||
6,380 | Mueller Water Products, Inc (Class A) | 85 | ||||||
881 | * | MYR Group, Inc | 33 | |||||
206 | National Presto Industries, Inc | 22 | ||||||
2,058 | * | Navistar International Corp | 65 | |||||
1,244 | * | NCI Building Systems, Inc | 19 | |||||
210 | * | Neff Corp | 3 | |||||
822 | NN, Inc | 16 | ||||||
2,239 | Nordson Corp | 251 | ||||||
6,705 | Northrop Grumman Corp | 1,559 | ||||||
4,328 | * | NOW, Inc | 89 | |||||
291 | * | NV5 Holdings, Inc | 10 | |||||
8
TIAA SEPARATE ACCOUNT VA-1 - Stock Index Account
SHARES | COMPANY | VALUE (000) | ||||||
117 | Omega Flex, Inc | $ | 7 | |||||
2,156 | Orbital ATK, Inc | 189 | ||||||
1,499 | * | Orion Marine Group, Inc | 15 | |||||
2,888 | Oshkosh Truck Corp | 187 | ||||||
4,750 | Owens Corning, Inc | 245 | ||||||
13,860 | Paccar, Inc | 886 | ||||||
5,378 | Parker Hannifin Corp | 753 | ||||||
603 | * | Patrick Industries, Inc | 46 | |||||
6,885 | Pentair plc | 386 | ||||||
1,847 | * | PGT, Inc | 21 | |||||
7,340 | *,e | Plug Power, Inc | 9 | |||||
738 | * | Ply Gem Holdings, Inc | 12 | |||||
416 | Powell Industries, Inc | 16 | ||||||
193 | * | Power Solutions International, Inc | 1 | |||||
96 | Preformed Line Products Co | 6 | ||||||
1,452 | Primoris Services Corp | 33 | ||||||
1,003 | * | Proto Labs, Inc | 51 | |||||
1,522 | Quanex Building Products Corp | 31 | ||||||
5,705 | * | Quanta Services, Inc | 199 | |||||
1,477 | Raven Industries, Inc | 37 | ||||||
11,898 | Raytheon Co | 1,690 | ||||||
670 | * | RBC Bearings, Inc | 62 | |||||
1,842 | Regal-Beloit Corp | 128 | ||||||
3,742 | * | Rexnord Corp | 73 | |||||
5,215 | Rockwell Automation, Inc | 701 | ||||||
5,153 | Rockwell Collins, Inc | 478 | ||||||
3,945 | Roper Industries, Inc | 722 | ||||||
257 | * | Rush Enterprises, Inc | 8 | |||||
1,200 | * | Rush Enterprises, Inc (Class A) | 38 | |||||
1,291 | Simpson Manufacturing Co, Inc | 56 | ||||||
471 | * | SiteOne Landscape Supply, Inc | 16 | |||||
2,268 | Snap-On, Inc | 388 | ||||||
460 | * | Sparton Corp | 11 | |||||
5,435 | * | Spirit Aerosystems Holdings, Inc (Class A) | 317 | |||||
1,707 | * | SPX Corp | 40 | |||||
1,454 | * | SPX FLOW, Inc | 47 | |||||
537 | Standex International Corp | 47 | ||||||
5,914 | Stanley Works | 678 | ||||||
1,027 | Sun Hydraulics Corp | 41 | ||||||
2,625 | *,e | Sunrun, Inc | 14 | |||||
150 | Supreme Industries, Inc | 2 | ||||||
2,195 | * | Taser International, Inc | 53 | |||||
1,266 | * | Teledyne Technologies, Inc | 156 | |||||
421 | Tennant Co | 30 | ||||||
4,378 | Terex Corp | 138 | ||||||
967 | Textainer Group Holdings Ltd | 7 | ||||||
10,686 | Textron, Inc | 519 | ||||||
431 | *,e | The ExOne Company | 4 | |||||
1,423 | * | Thermon Group Holdings | 27 | |||||
2,921 | Timken Co | 116 | ||||||
1,841 | Titan International, Inc | 21 | ||||||
784 | * | Titan Machinery, Inc | 11 | |||||
4,000 | Toro Co | 224 | ||||||
2,012 | TransDigm Group, Inc | 501 | ||||||
1,211 | * | Trex Co, Inc | 78 | |||||
1,999 | * | Trimas Corp | 47 | |||||
6,168 | Trinity Industries, Inc | 171 | ||||||
1,507 | Triton International Ltd | 24 | ||||||
2,084 | Triumph Group, Inc | 55 | ||||||
1,399 | * | Tutor Perini Corp | 39 | |||||
3,677 | * | United Rentals, Inc | 388 | |||||
31,299 | United Technologies Corp | 3,431 | ||||||
1,705 | * | Univar, Inc | 48 | |||||
818 | Universal Forest Products, Inc | 84 | ||||||
9
TIAA SEPARATE ACCOUNT VA-1 - Stock Index Account
SHARES | COMPANY | VALUE (000) | ||||||
3,746 | * | USG Corp | $ | 108 | ||||
874 | Valmont Industries, Inc | 123 | ||||||
455 | * | Vectrus, Inc | 11 | |||||
365 | * | Veritiv Corp | 20 | |||||
1,023 | * | Vicor Corp | 15 | |||||
2,196 | W.W. Grainger, Inc | 510 | ||||||
2,666 | * | Wabash National Corp | 42 | |||||
2,016 | * | WABCO Holdings, Inc | 214 | |||||
1,001 | Watsco, Inc | 148 | ||||||
1,120 | Watts Water Technologies, Inc (Class A) | 73 | ||||||
1,764 | * | WESCO International, Inc | 117 | |||||
3,424 | Westinghouse Air Brake Technologies Corp | 284 | ||||||
67 | * | Willis Lease Finance Corp | 2 | |||||
1,858 | Woodward Governor Co | 128 | ||||||
7,022 | Xylem, Inc | 348 | ||||||
|
| |||||||
TOTAL CAPITAL GOODS | 75,093 | |||||||
|
| |||||||
COMMERCIAL & PROFESSIONAL SERVICES - 0.9% | ||||||||
2,371 | ABM Industries, Inc | 97 | ||||||
2,247 | * | Acacia Research (Acacia Technologies) | 15 | |||||
4,335 | * | ACCO Brands Corp | 57 | |||||
726 | * | Advanced Disposal Services, Inc | 16 | |||||
1,730 | * | Advisory Board Co | 58 | |||||
407 | *,e | Aqua Metals, Inc | 5 | |||||
2,166 | * | ARC Document Solutions, Inc | 11 | |||||
383 | Barrett Business Services, Inc | 25 | ||||||
1,868 | Brady Corp (Class A) | 70 | ||||||
1,853 | Brink’s Co | 76 | ||||||
1,375 | * | Casella Waste Systems, Inc (Class A) | 17 | |||||
2,160 | * | CBIZ, Inc | 30 | |||||
1,407 | CEB, Inc | 85 | ||||||
948 | Ceco Environmental Corp | 13 | ||||||
3,532 | Cintas Corp | 408 | ||||||
2,163 | * | Clean Harbors, Inc | 120 | |||||
586 | *,e | Cogint, Inc | 2 | |||||
4,068 | * | Copart, Inc | 225 | |||||
4,991 | Covanta Holding Corp | 78 | ||||||
364 | CRA International, Inc | 13 | ||||||
1,720 | Deluxe Corp | 123 | ||||||
1,372 | Dun & Bradstreet Corp | 167 | ||||||
6,139 | *,m | Dyax Corp | 7 | |||||
1,051 | Ennis, Inc | 18 | ||||||
1,364 | Essendant, Inc | 29 | ||||||
1,051 | Exponent, Inc | 63 | ||||||
419 | * | Franklin Covey Co | 8 | |||||
1,716 | * | FTI Consulting, Inc | 77 | |||||
841 | G & K Services, Inc (Class A) | 81 | ||||||
645 | * | GP Strategies Corp | 18 | |||||
2,955 | Healthcare Services Group | 116 | ||||||
858 | Heidrick & Struggles International, Inc | 21 | ||||||
555 | * | Heritage-Crystal Clean, Inc | 9 | |||||
1,891 | Herman Miller, Inc | 65 | ||||||
1,049 | * | Hill International, Inc | 5 | |||||
1,783 | HNI Corp | 100 | ||||||
896 | * | Huron Consulting Group, Inc | 45 | |||||
892 | * | ICF International, Inc | 49 | |||||
1,756 | * | Innerworkings, Inc | 17 | |||||
649 | Insperity, Inc | 46 | ||||||
2,666 | Interface, Inc | 50 | ||||||
5,704 | KAR Auction Services, Inc | 243 | ||||||
1,192 | Kelly Services, Inc (Class A) | 27 | ||||||
1,045 | Kforce, Inc | 24 | ||||||
139 | Kimball International, Inc (Class B) | 2 | ||||||
10
TIAA SEPARATE ACCOUNT VA-1 - Stock Index Account
SHARES | COMPANY | VALUE (000) | ||||||
1,970 | Knoll, Inc | $ | 55 | |||||
2,239 | Korn/Ferry International | 66 | ||||||
1,075 | LSC Communications, Inc | 32 | ||||||
2,932 | Manpower, Inc | 261 | ||||||
1,317 | Matthews International Corp (Class A) | 101 | ||||||
1,113 | McGrath RentCorp | 44 | ||||||
757 | * | Mistras Group, Inc | 19 | |||||
1,928 | Mobile Mini, Inc | 58 | ||||||
1,290 | MSA Safety, Inc | 89 | ||||||
514 | Multi-Color Corp | 40 | ||||||
1,969 | * | Navigant Consulting, Inc | 52 | |||||
14,557 | Nielsen NV | 611 | ||||||
563 | * | NL Industries, Inc | 5 | |||||
2,194 | * | On Assignment, Inc | 97 | |||||
7,788 | Pitney Bowes, Inc | 118 | ||||||
1,198 | Quad Graphics, Inc | 32 | ||||||
9,364 | Republic Services, Inc | 534 | ||||||
1,664 | Resources Connection, Inc | 32 | ||||||
4,841 | Robert Half International, Inc | 236 | ||||||
3,281 | Rollins, Inc | 111 | ||||||
2,316 | * | RPX Corp | 25 | |||||
2,868 | RR Donnelley & Sons Co | 47 | ||||||
672 | * | SP Plus Corp | 19 | |||||
2,666 | Steelcase, Inc (Class A) | 48 | ||||||
3,188 | * | Stericycle, Inc | 246 | |||||
1,231 | * | Team, Inc | 48 | |||||
2,022 | Tetra Tech, Inc | 87 | ||||||
2,191 | * | TransUnion | 68 | |||||
689 | * | TRC Cos, Inc | 7 | |||||
1,734 | * | TriNet Group, Inc | 44 | |||||
1,757 | * | TrueBlue, Inc | 43 | |||||
624 | Unifirst Corp | 90 | ||||||
928 | US Ecology, Inc | 46 | ||||||
6,094 | * | Verisk Analytics, Inc | 495 | |||||
871 | Viad Corp | 38 | ||||||
410 | VSE Corp | 16 | ||||||
1,558 | * | WageWorks, Inc | 113 | |||||
17,852 | Waste Management, Inc | 1,266 | ||||||
1,000 | West Corp | 25 | ||||||
|
| |||||||
TOTAL COMMERCIAL & PROFESSIONAL SERVICES | 8,195 | |||||||
|
| |||||||
CONSUMER DURABLES & APPAREL - 1.4% | ||||||||
821 | * | Acushnet Holdings Corp | 16 | |||||
2,238 | * | American Outdoor Brands Corp | 47 | |||||
653 | *,e | Arctic Cat, Inc | 10 | |||||
383 | Bassett Furniture Industries, Inc | 12 | ||||||
970 | * | Beazer Homes USA, Inc | 13 | |||||
3,502 | Brunswick Corp | 191 | ||||||
3,105 | CalAtlantic Group, Inc | 106 | ||||||
3,897 | Callaway Golf Co | 43 | ||||||
2,076 | Carter’s, Inc | 179 | ||||||
352 | * | Cavco Industries, Inc | 35 | |||||
649 | * | Century Communities, Inc | 14 | |||||
11,143 | Coach, Inc | 390 | ||||||
798 | Columbia Sportswear Co | 46 | ||||||
1,700 | * | CROCS, Inc | 12 | |||||
269 | CSS Industries, Inc | 7 | ||||||
447 | Culp, Inc | 17 | ||||||
1,333 | * | Deckers Outdoor Corp | 74 | |||||
13,218 | DR Horton, Inc | 361 | ||||||
458 | Escalade, Inc | 6 | ||||||
1,079 | Ethan Allen Interiors, Inc | 40 | ||||||
131 | Flexsteel Industries, Inc | 8 | ||||||
11
TIAA SEPARATE ACCOUNT VA-1 - Stock Index Account
SHARES | COMPANY | VALUE (000) | ||||||
1,713 | * | Fossil Group, Inc | $ | 44 | ||||
4,328 | Garmin Ltd | 210 | ||||||
1,666 | * | G-III Apparel Group Ltd | 49 | |||||
4,066 | *,e | GoPro, Inc | 35 | |||||
992 | * | Green Brick Partners, Inc | 10 | |||||
14,979 | Hanesbrands, Inc | 323 | ||||||
2,760 | Harman International Industries, Inc | 307 | ||||||
4,413 | Hasbro, Inc | 343 | ||||||
1,152 | * | Helen of Troy Ltd | 97 | |||||
359 | Hooker Furniture Corp | 14 | ||||||
4,761 | * | Hovnanian Enterprises, Inc (Class A) | 13 | |||||
2,023 | * | Iconix Brand Group, Inc | 19 | |||||
844 | * | Installed Building Products Inc | 35 | |||||
1,204 | * | iRobot Corp | 70 | |||||
816 | *,e | Jakks Pacific, Inc | 4 | |||||
232 | Johnson Outdoors, Inc | 9 | ||||||
5,284 | * | Kate Spade & Co | 99 | |||||
3,463 | KB Home | 55 | ||||||
2,017 | La-Z-Boy, Inc | 63 | ||||||
5,497 | Leggett & Platt, Inc | 269 | ||||||
420 | Lennar Corp (B Shares) | 14 | ||||||
7,356 | Lennar Corp (Class A) | 316 | ||||||
624 | *,e | LGI Homes, Inc | 18 | |||||
847 | Libbey, Inc | 16 | ||||||
362 | Lifetime Brands, Inc | 6 | ||||||
4,017 | * | Lululemon Athletica, Inc | 261 | |||||
862 | * | M/I Homes, Inc | 22 | |||||
776 | * | Malibu Boats Inc | 15 | |||||
441 | Marine Products Corp | 6 | ||||||
13,559 | Mattel, Inc | 374 | ||||||
302 | MCBC Holdings, Inc | 4 | ||||||
1,720 | MDC Holdings, Inc | 44 | ||||||
1,569 | * | Meritage Homes Corp | 55 | |||||
6,578 | * | Michael Kors Holdings Ltd | 283 | |||||
2,398 | * | Mohawk Industries, Inc | 479 | |||||
638 | Movado Group, Inc | 18 | ||||||
182 | Nacco Industries, Inc (Class A) | 16 | ||||||
1,389 | * | Nautilus, Inc | 26 | |||||
556 | * | New Home Co Inc | 6 | |||||
18,816 | Newell Rubbermaid, Inc | 840 | ||||||
53,182 | Nike, Inc (Class B) | 2,703 | ||||||
133 | * | NVR, Inc | 222 | |||||
621 | Oxford Industries, Inc | 37 | ||||||
546 | * | Perry Ellis International, Inc | 14 | |||||
3,160 | Phillips-Van Heusen Corp | 285 | ||||||
2,458 | e | Polaris Industries, Inc | 202 | |||||
1,632 | Pool Corp | 170 | ||||||
14,030 | Pulte Homes, Inc | 258 | ||||||
2,365 | Ralph Lauren Corp | 214 | ||||||
1,607 | *,e | Sequential Brands Group, Inc | 7 | |||||
5,202 | * | Skechers U.S.A., Inc (Class A) | 128 | |||||
– | *,e | Smith & Wesson Holding Corp | 0 | ^ | ||||
2,386 | * | Steven Madden Ltd | 85 | |||||
794 | e | Sturm Ruger & Co, Inc | 42 | |||||
295 | Superior Uniform Group, Inc | 6 | ||||||
1,381 | * | Taylor Morrison Home Corp | 27 | |||||
2,208 | *,e | Tempur-Pedic International, Inc | 151 | |||||
6,395 | * | Toll Brothers, Inc | 198 | |||||
1,636 | * | TopBuild Corp | 58 | |||||
6,138 | * | TRI Pointe Homes, Inc | 70 | |||||
1,991 | Tupperware Corp | 105 | ||||||
7,517 | * | Under Armour, Inc | 189 | |||||
7,579 | e | Under Armour, Inc (Class A) | 220 | |||||
700 | * | Unifi, Inc | 23 | |||||
12
TIAA SEPARATE ACCOUNT VA-1 - Stock Index Account
SHARES | COMPANY | VALUE (000) | ||||||
585 | * | Universal Electronics, Inc | $ | 38 | ||||
1,001 | * | Vera Bradley, Inc | 12 | |||||
13,663 | VF Corp | 729 | ||||||
649 | *,e | Vince Holding Corp | 3 | |||||
2,174 | * | Vista Outdoor, Inc | 80 | |||||
896 | * | WCI Communities, Inc | 21 | |||||
378 | Weyco Group, Inc | 12 | ||||||
2,964 | Whirlpool Corp | 539 | ||||||
638 | *,e | William Lyon Homes, Inc | 12 | |||||
3,989 | Wolverine World Wide, Inc | 88 | ||||||
1,093 | * | Zagg, Inc | 8 | |||||
|
| |||||||
TOTAL CONSUMER DURABLES & APPAREL | 13,470 | |||||||
|
| |||||||
CONSUMER SERVICES - 2.1% | ||||||||
675 | * | American Public Education, Inc | 17 | |||||
3,556 | * | Apollo Group, Inc (Class A) | 35 | |||||
8,896 | ARAMARK Holdings Corp | 318 | ||||||
650 | * | Ascent Media Corp (Series A) | 11 | |||||
2,607 | * | Belmond Ltd. | 35 | |||||
915 | * | BJ’s Restaurants, Inc | 36 | |||||
4,131 | Bloomin’ Brands, Inc | 74 | ||||||
538 | Bob Evans Farms, Inc | 29 | ||||||
353 | * | Bojangles’, Inc | 7 | |||||
3,388 | * | Boyd Gaming Corp | 68 | |||||
877 | * | Bridgepoint Education, Inc | 9 | |||||
1,504 | * | Bright Horizons Family Solutions | 105 | |||||
2,294 | Brinker International, Inc | 114 | ||||||
711 | * | Buffalo Wild Wings, Inc | 110 | |||||
2,101 | * | Caesars Acquisition Co | 28 | |||||
1,990 | *,e | Caesars Entertainment Corp | 17 | |||||
428 | Capella Education Co | 38 | ||||||
3,103 | * | Career Education Corp | 31 | |||||
16,343 | Carnival Corp | 851 | ||||||
741 | Carriage Services, Inc | 21 | ||||||
1,619 | * | Carrols Restaurant Group, Inc | 25 | |||||
1,867 | Cheesecake Factory | 112 | ||||||
3,194 | *,e | Chegg, Inc | 24 | |||||
1,147 | * | Chipotle Mexican Grill, Inc (Class A) | 433 | |||||
1,471 | Choice Hotels International, Inc | 82 | ||||||
595 | Churchill Downs, Inc | 89 | ||||||
751 | * | Chuy’s Holdings, Inc | 24 | |||||
2,643 | ClubCorp Holdings, Inc | 38 | ||||||
328 | Collectors Universe | 7 | ||||||
789 | e | Cracker Barrel Old Country Store, Inc | 132 | |||||
4,577 | Darden Restaurants, Inc | 333 | ||||||
1,563 | * | Dave & Buster’s Entertainment, Inc | 88 | |||||
1,033 | * | Del Frisco’s Restaurant Group, Inc | 18 | |||||
317 | * | Del Taco Restaurants, Inc | 4 | |||||
3,544 | * | Denny’s Corp | 45 | |||||
2,577 | e | DeVry Education Group, Inc | 80 | |||||
740 | DineEquity, Inc | 57 | ||||||
1,949 | Domino’s Pizza, Inc | 310 | ||||||
3,806 | Dunkin Brands Group, Inc | 200 | ||||||
809 | * | El Pollo Loco Holdings, Inc | 10 | |||||
1,192 | *,e | Eldorado Resorts, Inc | 20 | |||||
2,534 | Extended Stay America, Inc | 41 | ||||||
1,193 | * | Fiesta Restaurant Group, Inc | 36 | |||||
217 | * | Fogo De Chao, Inc | 3 | |||||
412 | Golden Entertainment, Inc | 5 | ||||||
179 | Graham Holdings Co | 92 | ||||||
1,857 | * | Grand Canyon Education, Inc | 108 | |||||
8,637 | H&R Block, Inc | 199 | ||||||
480 | *,e | Habit Restaurants, Inc | 8 | |||||
13
TIAA SEPARATE ACCOUNT VA-1 - Stock Index Account
SHARES | COMPANY | VALUE (000) | ||||||
21,071 | Hilton Worldwide Holdings, Inc | $ | 573 | |||||
5,091 | * | Houghton Mifflin Harcourt Co | 55 | |||||
900 | * | Hyatt Hotels Corp | 50 | |||||
4,720 | ILG, Inc | 86 | ||||||
3,625 | International Game Technology plc | 92 | ||||||
1,188 | International Speedway Corp (Class A) | 44 | ||||||
634 | * | Intrawest Resorts Holdings Inc | 11 | |||||
1,142 | * | Isle of Capri Casinos, Inc | 28 | |||||
596 | * | J Alexander’s Holdings, Inc | 6 | |||||
1,344 | Jack in the Box, Inc | 150 | ||||||
649 | *,e | Jamba, Inc | 7 | |||||
1,518 | * | K12, Inc | 26 | |||||
343 | *,e | Kona Grill, Inc | 4 | |||||
3,967 | * | La Quinta Holdings, Inc | 56 | |||||
14,568 | Las Vegas Sands Corp | 778 | ||||||
203 | Liberty Tax, Inc | 3 | ||||||
3,463 | * | LifeLock, Inc | 83 | |||||
608 | * | Lindblad Expeditions Holdings, Inc | 6 | |||||
754 | * | Luby’s, Inc | 3 | |||||
840 | Marcus Corp | 26 | ||||||
12,920 | Marriott International, Inc (Class A) | 1,068 | ||||||
924 | Marriott Vacations Worldwide Corp | 78 | ||||||
33,561 | McDonald’s Corp | 4,085 | ||||||
18,855 | * | MGM Resorts International | 544 | |||||
388 | * | Monarch Casino & Resort, Inc | 10 | |||||
133 | * | Nathan’s Famous, Inc | 9 | |||||
400 | * | Noodles & Co | 2 | |||||
6,600 | * | Norwegian Cruise Line Holdings Ltd | 281 | |||||
939 | * | Panera Bread Co (Class A) | 193 | |||||
1,121 | Papa John’s International, Inc | 96 | ||||||
3,355 | * | Penn National Gaming, Inc | 46 | |||||
2,455 | * | Pinnacle Entertainment, Inc | 36 | |||||
661 | Planet Fitness, Inc | 13 | ||||||
894 | * | Popeyes Louisiana Kitchen, Inc | 54 | |||||
946 | * | Potbelly Corp | 12 | |||||
638 | * | Red Lion Hotels Corp | 5 | |||||
600 | * | Red Robin Gourmet Burgers, Inc | 34 | |||||
618 | Red Rock Resorts, Inc | 14 | ||||||
282 | * | Regis Corp | 4 | |||||
6,692 | Royal Caribbean Cruises Ltd | 549 | ||||||
3,070 | * | Ruby Tuesday, Inc | 10 | |||||
1,588 | Ruth’s Chris Steak House, Inc | 29 | ||||||
1,968 | * | Scientific Games Corp (Class A) | 27 | |||||
2,991 | SeaWorld Entertainment, Inc | 57 | ||||||
7,755 | Service Corp International | 220 | ||||||
5,597 | * | ServiceMaster Global Holdings, Inc | 211 | |||||
645 | * | Shake Shack, Inc | 23 | |||||
2,963 | Six Flags Entertainment Corp | 178 | ||||||
1,512 | Sonic Corp | 40 | ||||||
2,146 | * | Sotheby’s (Class A) | 85 | |||||
581 | Speedway Motorsports, Inc | 13 | ||||||
57,525 | Starbucks Corp | 3,194 | ||||||
57 | * | Steak N Shake Co | 27 | |||||
491 | * | Strayer Education, Inc | 40 | |||||
3,813 | Summit Hotel Properties, Inc | 61 | ||||||
2,438 | Texas Roadhouse, Inc (Class A) | 118 | ||||||
1,428 | Vail Resorts, Inc | 230 | ||||||
1,142 | *,e | Weight Watchers International, Inc | 13 | |||||
8,703 | Wendy’s | 118 | ||||||
657 | e | Wingstop, Inc | 19 | |||||
4,383 | Wyndham Worldwide Corp | 335 | ||||||
3,163 | Wynn Resorts Ltd | 274 | ||||||
14,056 | * | Yum China Holdings, Inc | 367 | |||||
13,864 | Yum! Brands, Inc | 878 | ||||||
14
TIAA SEPARATE ACCOUNT VA-1 - Stock Index Account
SHARES | COMPANY | VALUE (000) | ||||||
805 | * | Zoe’s Kitchen, Inc | $ | 19 | ||||
|
| |||||||
TOTAL CONSUMER SERVICES | 20,383 | |||||||
|
| |||||||
DIVERSIFIED FINANCIALS - 4.5% | ||||||||
2,230 | * | Affiliated Managers Group, Inc | 324 | |||||
755 | AG Mortgage Investment Trust | 13 | ||||||
13,655 | AGNC Investment Corp | 248 | ||||||
17,373 | Ally Financial, Inc | 330 | ||||||
2,339 | Altisource Residential Corp | 26 | ||||||
32,077 | American Express Co | 2,376 | ||||||
6,314 | Ameriprise Financial, Inc | 700 | ||||||
41,157 | Annaly Capital Management, Inc | 410 | ||||||
4,519 | Anworth Mortgage Asset Corp | 23 | ||||||
2,842 | Apollo Commercial Real Estate Finance, Inc | 47 | ||||||
1,288 | Ares Commercial Real Estate Corp | 18 | ||||||
727 | e | Arlington Asset Investment Corp (Class A) | 11 | |||||
1,518 | e | ARMOUR Residential REIT, Inc | 33 | |||||
1,509 | Artisan Partners Asset Management, Inc | 45 | ||||||
269 | Associated Capital Group, Inc | 9 | ||||||
382 | B. Riley Financial, Inc | 7 | ||||||
42,096 | Bank of New York Mellon Corp | 1,995 | ||||||
6,642 | BGC Partners, Inc (Class A) | 68 | ||||||
5,020 | BlackRock, Inc | 1,910 | ||||||
953 | Calamos Asset Management, Inc (Class A) | 8 | ||||||
19,463 | Capital One Financial Corp | 1,698 | ||||||
1,519 | Capstead Mortgage Corp | 15 | ||||||
3,057 | CBOE Holdings, Inc | 226 | ||||||
46,895 | Charles Schwab Corp | 1,851 | ||||||
6,703 | Chimera Investment Corp | 114 | ||||||
13,629 | CME Group, Inc | 1,572 | ||||||
853 | Cohen & Steers, Inc | 29 | ||||||
4,557 | Colony Financial, Inc | 92 | ||||||
1,050 | *,e | Cowen Group, Inc | 16 | |||||
358 | *,e | Credit Acceptance Corp | 78 | |||||
6,273 | CYS Investments, Inc | 48 | ||||||
118 | Diamond Hill Investment Group, Inc | 25 | ||||||
16,457 | Discover Financial Services | 1,186 | ||||||
1,075 | * | Donnelley Financial Solutions, Inc | 25 | |||||
1,860 | Dynex Capital, Inc | 13 | ||||||
11,575 | * | E*TRADE Financial Corp | 401 | |||||
4,168 | Eaton Vance Corp | 175 | ||||||
978 | * | Encore Capital Group, Inc | 28 | |||||
1,226 | * | Enova International, Inc | 15 | |||||
1,452 | Evercore Partners, Inc (Class A) | 100 | ||||||
2,322 | * | Ezcorp, Inc (Class A) | 25 | |||||
1,535 | Factset Research Systems, Inc | 251 | ||||||
3,877 | Federated Investors, Inc (Class B) | 110 | ||||||
2,248 | Financial Engines, Inc | 83 | ||||||
1,945 | FirstCash, Inc | 91 | ||||||
3,451 | * | FNFV Group | 47 | |||||
14,449 | Franklin Resources, Inc | 572 | ||||||
1,532 | Gain Capital Holdings, Inc | 10 | ||||||
181 | GAMCO Investors, Inc (Class A) | 6 | ||||||
15,524 | Goldman Sachs Group, Inc | 3,717 | ||||||
416 | Great Ajax Corp | 6 | ||||||
1,775 | * | Green Dot Corp | 42 | |||||
1,124 | Greenhill & Co, Inc | 31 | ||||||
1,379 | Hannon Armstrong Sustainable Infrastructure Capital, Inc | 26 | ||||||
517 | Houlihan Lokey, Inc | 16 | ||||||
2,624 | Interactive Brokers Group, Inc (Class A) | 96 | ||||||
23,692 | IntercontinentalExchange Group, Inc | 1,337 | ||||||
675 | * | INTL FCStone, Inc | 27 | |||||
16,540 | Invesco Ltd | 502 | ||||||
4,617 | Invesco Mortgage Capital, Inc | 67 | ||||||
15
TIAA SEPARATE ACCOUNT VA-1 - Stock Index Account
SHARES | COMPANY | VALUE (000) | ||||||
1,434 | Investment Technology Group, Inc | $ | 28 | |||||
22,926 | e | iShares Russell 3000 Index Fund | 3,049 | |||||
2,991 | * | iStar Financial, Inc | 37 | |||||
6,087 | Janus Capital Group, Inc | 81 | ||||||
1,997 | * | KCG Holdings, Inc | 26 | |||||
1,570 | Ladder Capital Corp | 22 | ||||||
5,033 | * | Ladenburg Thalmann Financial Services, Inc | 12 | |||||
4,983 | Lazard Ltd (Class A) | 205 | ||||||
4,116 | Legg Mason, Inc | 123 | ||||||
13,480 | * | LendingClub Corp | 71 | |||||
13,604 | Leucadia National Corp | 316 | ||||||
3,491 | LPL Financial Holdings, Inc | 123 | ||||||
1,519 | MarketAxess Holdings, Inc | 223 | ||||||
418 | Marlin Business Services Corp | 9 | ||||||
15,586 | MFA Mortgage Investments, Inc | 119 | ||||||
731 | Moelis & Co | 25 | ||||||
6,708 | Moody’s Corp | 632 | ||||||
57,674 | Morgan Stanley | 2,437 | ||||||
562 | Morningstar, Inc | 41 | ||||||
3,587 | MSCI, Inc (Class A) | 283 | ||||||
1,755 | MTGE Investment Corp | 28 | ||||||
4,411 | NASDAQ OMX Group, Inc | 296 | ||||||
13,657 | Navient Corp | 224 | ||||||
686 | Nelnet, Inc (Class A) | 35 | ||||||
8,336 | New Residential Investment Corp | 131 | ||||||
4,058 | New York Mortgage Trust, Inc | 27 | ||||||
959 | * | NewStar Financial, Inc | 9 | |||||
8,220 | Northern Trust Corp | 732 | ||||||
6,989 | NorthStar Asset Management Group, Inc | 104 | ||||||
1,634 | OM Asset Management plc | 24 | ||||||
2,011 | * | On Deck Capital, Inc | 9 | |||||
2,198 | * | OneMain Holdings, Inc | 49 | |||||
448 | Oppenheimer Holdings, Inc | 8 | ||||||
387 | e | Orchid Island Capital, Inc | 4 | |||||
2,603 | PennyMac Mortgage Investment Trust | 43 | ||||||
1,198 | * | Pico Holdings, Inc | 18 | |||||
669 | * | Piper Jaffray Cos | 48 | |||||
727 | PJT Partners, Inc | 22 | ||||||
1,888 | * | PRA Group, Inc | 74 | |||||
527 | Pzena Investment Management, Inc (Class A) | 6 | ||||||
5,269 | Raymond James Financial, Inc | 365 | ||||||
3,160 | Redwood Trust, Inc | 48 | ||||||
231 | * | Regional Management Corp | 6 | |||||
1,443 | e | Resource Capital Corp | 12 | |||||
10,612 | S&P Global, Inc | 1,141 | ||||||
808 | * | Safeguard Scientifics, Inc | 11 | |||||
3,870 | * | Santander Consumer USA Holdings, Inc | 52 | |||||
5,102 | SEI Investments Co | 252 | ||||||
298 | Silvercrest Asset Management Group, Inc | 4 | ||||||
17,941 | * | SLM Corp | 198 | |||||
12,289 | SPDR Trust Series 1 | 2,747 | ||||||
9,612 | Starwood Property Trust, Inc | 211 | ||||||
15,874 | State Street Corp | 1,234 | ||||||
2,659 | * | Stifel Financial Corp | 133 | |||||
33,543 | Synchrony Financial | 1,217 | ||||||
9,759 | T Rowe Price Group, Inc | 734 | ||||||
9,980 | TD Ameritrade Holding Corp | 435 | ||||||
1,255 | Tiptree Financial, Inc | 8 | ||||||
8,777 | Two Harbors Investment Corp | 77 | ||||||
1,024 | Virtu Financial, Inc | 16 | ||||||
255 | Virtus Investment Partners, Inc | 30 | ||||||
8,295 | Voya Financial, Inc | 325 | ||||||
3,248 | Waddell & Reed Financial, Inc (Class A) | 63 | ||||||
1,871 | Western Asset Mortgage Capital Corp | 19 | ||||||
16
TIAA SEPARATE ACCOUNT VA-1 - Stock Index Account
SHARES | COMPANY | VALUE (000) | ||||||
322 | Westwood Holdings Group, Inc | $ | 19 | |||||
4,611 | e | WisdomTree Investments, Inc | 51 | |||||
276 | * | World Acceptance Corp | 18 | |||||
|
| |||||||
TOTAL DIVERSIFIED FINANCIALS | 42,549 | |||||||
|
| |||||||
ENERGY - 6.9% | ||||||||
4,200 | * | Abraxas Petroleum Corp | 11 | |||||
99 | Adams Resources & Energy, Inc | 4 | ||||||
1,327 | Alon USA Energy, Inc | 15 | ||||||
22,684 | Anadarko Petroleum Corp | 1,582 | ||||||
6,765 | * | Antero Resources Corp | 160 | |||||
15,738 | Apache Corp | 999 | ||||||
2,935 | Archrock, Inc | 39 | ||||||
624 | e | Ardmore Shipping Corp | 5 | |||||
2,529 | e | Atwood Oceanics, Inc | 33 | |||||
17,711 | Baker Hughes, Inc | 1,151 | ||||||
2,221 | * | Bill Barrett Corp | 16 | |||||
1,469 | Bristow Group, Inc | 30 | ||||||
18,400 | Cabot Oil & Gas Corp | 430 | ||||||
1,309 | * | California Resources Corp | 28 | |||||
4,954 | * | Callon Petroleum Co | 76 | |||||
905 | * | CARBO Ceramics, Inc | 9 | |||||
2,286 | * | Carrizo Oil & Gas, Inc | 85 | |||||
8,023 | * | Cheniere Energy, Inc | 332 | |||||
25,171 | * | Chesapeake Energy Corp | 177 | |||||
75,704 | Chevron Corp | 8,910 | ||||||
3,804 | Cimarex Energy Co | 517 | ||||||
251 | * | Clayton Williams Energy, Inc | 30 | |||||
3,211 | * | Clean Energy Fuels Corp | 9 | |||||
5,406 | * | Concho Resources, Inc | 717 | |||||
49,982 | ConocoPhillips | 2,506 | ||||||
9,664 | Consol Energy, Inc | 176 | ||||||
670 | * | Contango Oil & Gas Co | 6 | |||||
3,512 | * | Continental Resources, Inc | 181 | |||||
762 | e | CVR Energy, Inc | 19 | |||||
852 | * | Dawson Geophysical Co | 7 | |||||
2,390 | Delek US Holdings, Inc | 58 | ||||||
14,522 | * | Denbury Resources, Inc | 53 | |||||
21,672 | Devon Energy Corp | 990 | ||||||
3,880 | DHT Holdings, Inc | 16 | ||||||
2,618 | *,e | Diamond Offshore Drilling, Inc | 46 | |||||
2,958 | * | Diamondback Energy, Inc | 299 | |||||
1,027 | *,e | Dorian LPG Ltd | 8 | |||||
1,561 | * | Dril-Quip, Inc | 94 | |||||
4,022 | * | Energen Corp | 232 | |||||
11,576 | Ensco plc | 113 | ||||||
22,210 | EOG Resources, Inc | 2,245 | ||||||
1,448 | *,e | EP Energy Corp | 10 | |||||
7,136 | EQT Corp | 467 | ||||||
891 | * | Era Group, Inc | 15 | |||||
668 | Evolution Petroleum Corp | 7 | ||||||
1,467 | * | Exterran Corp | 35 | |||||
1,417 | * | Extraction Oil & Gas, Inc | 28 | |||||
167,773 | d | Exxon Mobil Corp | 15,143 | |||||
2,595 | * | Fairmount Santrol Holdings, Inc | 31 | |||||
9,000 | * | FMC Technologies, Inc | 320 | |||||
2,423 | * | Forum Energy Technologies, Inc | 53 | |||||
1,468 | e | Frank’s International NV | 18 | |||||
1,176 | e | Frontline Ltd | 8 | |||||
1,757 | GasLog Ltd | 28 | ||||||
877 | * | Gener8 Maritime, Inc | 4 | |||||
626 | * | Geospace Technologies Corp | 13 | |||||
3,789 | e | Golar LNG Ltd | 87 | |||||
17
TIAA SEPARATE ACCOUNT VA-1 - Stock Index Account
SHARES | COMPANY | VALUE (000) | ||||||
1,490 | Green Plains Renewable Energy, Inc | $ | 42 | |||||
5,190 | * | Gulfport Energy Corp | 112 | |||||
34,396 | Halliburton Co | 1,860 | ||||||
4,809 | * | Helix Energy Solutions Group, Inc | 42 | |||||
4,028 | Helmerich & Payne, Inc | 312 | ||||||
11,685 | Hess Corp | 728 | ||||||
6,919 | HollyFrontier Corp | 227 | ||||||
1,338 | *,e | Hornbeck Offshore Services, Inc | 10 | |||||
1,312 | * | Independence Contract Drilling, Inc | 9 | |||||
278 | * | International Seaways, Inc | 4 | |||||
61 | * | Isramco, Inc | 8 | |||||
1,048 | *,e | Jones Energy, Inc (Class A) | 5 | |||||
77,233 | Kinder Morgan, Inc | 1,600 | ||||||
6,492 | * | Kosmos Energy LLC | 46 | |||||
5,583 | * | Laredo Petroleum Holdings, Inc | 79 | |||||
35,161 | Marathon Oil Corp | 609 | ||||||
21,229 | Marathon Petroleum Corp | 1,069 | ||||||
3,403 | * | Matador Resources Co | 88 | |||||
1,193 | * | Matrix Service Co | 27 | |||||
9,887 | * | McDermott International, Inc | 73 | |||||
7,011 | Murphy Oil Corp | 218 | ||||||
11,421 | Nabors Industries Ltd | 187 | ||||||
15,151 | National Oilwell Varco, Inc | 567 | ||||||
561 | * | Natural Gas Services Group, Inc | 18 | |||||
3,582 | Navios Maritime Acq Corp | 6 | ||||||
8,207 | * | Newfield Exploration Co | 332 | |||||
3,910 | * | Newpark Resources, Inc | 29 | |||||
9,860 | Noble Corp plc | 58 | ||||||
17,585 | Noble Energy, Inc | 669 | ||||||
3,925 | e | Nordic American Tanker Shipping | 33 | |||||
3,091 | *,e Northern Oil And Gas, Inc | 9 | ||||||
9,279 | * | Oasis Petroleum, Inc | 140 | |||||
30,831 | * | Occidental Petroleum Corp | 2,196 | |||||
4,264 | Oceaneering International, Inc | 120 | ||||||
2,073 | * | Oil States International, Inc | 81 | |||||
8,715 | Oneok, Inc | 500 | ||||||
836 | Overseas Shipholding Group, Inc | 3 | ||||||
656 | * | Pacific Ethanol, Inc | 6 | |||||
648 | Panhandle Oil and Gas, Inc (Class A) | 15 | ||||||
1,291 | * | Par Pacific Holdings, Inc | 19 | |||||
5,410 | * | Parker Drilling Co | 14 | |||||
5,614 | * | Parsley Energy, Inc | 198 | |||||
5,358 | Patterson-UTI Energy, Inc | 144 | ||||||
4,046 | PBF Energy, Inc | 113 | ||||||
1,898 | * | PDC Energy, Inc | 138 | |||||
620 | * | PHI, Inc | 11 | |||||
18,159 | Phillips 66 | 1,569 | ||||||
2,681 | * | Pioneer Energy Services Corp | 18 | |||||
6,619 | Pioneer Natural Resources Co | 1,192 | ||||||
8,935 | * | Questar Market Resources, Inc | 165 | |||||
8,003 | Range Resources Corp | 275 | ||||||
1,773 | * | Renewable Energy Group, Inc | 17 | |||||
234 | * | Rex American Resources Corp | 23 | |||||
6,178 | * | Rice Energy, Inc | 132 | |||||
611 | * | RigNet, Inc | 14 | |||||
843 | * | Ring Energy, Inc | 11 | |||||
5,316 | * | Rowan Cos plc | 100 | |||||
2,428 | e | RPC, Inc | 48 | |||||
3,102 | * | RSP Permian, Inc | 138 | |||||
2,020 | *,e | Sanchez Energy Corp | 18 | |||||
56,028 | Schlumberger Ltd | 4,704 | ||||||
6,794 | Scorpio Tankers, Inc | 31 | ||||||
825 | * | SEACOR Holdings, Inc | 59 | |||||
15,354 | *,e | Seadrill Ltd | 52 | |||||
18
TIAA SEPARATE ACCOUNT VA-1 - Stock Index Account
SHARES | COMPANY | VALUE (000) | ||||||
1,826 | SemGroup Corp | $ | 76 | |||||
2,365 | e | Ship Finance International Ltd | 35 | |||||
3,872 | SM Energy Co | 134 | ||||||
412 | * | Smart Sand, Inc | 7 | |||||
20,086 | * | Southwestern Energy Co | 217 | |||||
28,111 | Spectra Energy Corp | 1,155 | ||||||
6,374 | Superior Energy Services | 108 | ||||||
7,633 | * | Synergy Resources Corp | 68 | |||||
6,143 | Targa Resources Investments, Inc | 344 | ||||||
2,010 | e | Teekay Corp | 16 | |||||
3,273 | Teekay Tankers Ltd (Class A) | 7 | ||||||
1,519 | * | Tesco Corp | 13 | |||||
4,846 | Tesoro Corp | 424 | ||||||
3,896 | * | Tetra Technologies, Inc | 20 | |||||
1,810 | *,e | Tidewater, Inc | 6 | |||||
12,872 | * | Transocean Ltd (NYSE) | 190 | |||||
2,246 | * | Unit Corp | 60 | |||||
2,430 | US Silica Holdings Inc | 138 | ||||||
18,891 | Valero Energy Corp | 1,291 | ||||||
1,693 | *,e | W&T Offshore, Inc | 5 | |||||
37,057 | * | Weatherford International Ltd | 185 | |||||
2,997 | Western Refining, Inc | 113 | ||||||
783 | * | Westmoreland Coal Co | 14 | |||||
8,077 | * | Whiting Petroleum Corp | 97 | |||||
1,880 | * | Willbros Group, Inc | 6 | |||||
27,853 | Williams Cos, Inc | 867 | ||||||
2,866 | World Fuel Services Corp | 132 | ||||||
11,391 | * | WPX Energy, Inc | 166 | |||||
|
| |||||||
TOTAL ENERGY | 65,915 | |||||||
|
| |||||||
FOOD & STAPLES RETAILING - 1.8% | ||||||||
1,108 | Andersons, Inc | 50 | ||||||
1,611 | Casey’s General Stores, Inc | 192 | ||||||
776 | * | Chefs’ Warehouse Holdings, Inc | 12 | |||||
17,576 | Costco Wholesale Corp | 2,814 | ||||||
43,216 | CVS Health Corp | 3,410 | ||||||
555 | Ingles Markets, Inc (Class A) | 27 | ||||||
38,321 | Kroger Co | 1,322 | ||||||
345 | * | Natural Grocers by Vitamin C | 4 | |||||
1,392 | * | Performance Food Group Co | 33 | |||||
821 | Pricesmart, Inc | 69 | ||||||
39,904 | * | Rite Aid Corp | 329 | |||||
1,024 | * | Smart & Final Stores, Inc | 14 | |||||
1,537 | Spartan Stores, Inc | 61 | ||||||
5,409 | * | Sprouts Farmers Market, Inc | 102 | |||||
10,836 | * | Supervalu, Inc | 51 | |||||
21,104 | Sysco Corp | 1,169 | ||||||
2,032 | * | United Natural Foods, Inc | 97 | |||||
1,110 | * | US Foods Holding Corp | 30 | |||||
292 | Village Super Market (Class A) | 9 | ||||||
34,649 | Walgreens Boots Alliance, Inc | 2,868 | ||||||
61,014 | Wal-Mart Stores, Inc | 4,217 | ||||||
145 | Weis Markets, Inc | 10 | ||||||
12,526 | Whole Foods Market, Inc | 385 | ||||||
|
| |||||||
TOTAL FOOD & STAPLES RETAILING | 17,275 | |||||||
|
| |||||||
FOOD, BEVERAGE & TOBACCO - 4.7% | ||||||||
827 | AdvancePierre Foods Holdings, Inc | 25 | ||||||
136 | Alico, Inc | 4 | ||||||
298 | * | Alliance One International, Inc | 6 | |||||
78,791 | Altria Group, Inc | 5,328 | ||||||
1,205 | *,e | Amplify Snack Brands, Inc | 11 | |||||
22,954 | Archer Daniels Midland Co | 1,048 | ||||||
19
TIAA SEPARATE ACCOUNT VA-1 - Stock Index Account
SHARES | COMPANY | VALUE (000) | ||||||
2,348 | B&G Foods, Inc (Class A) | $ | 103 | |||||
2,484 | * | Blue Buffalo Pet Products, Inc | 60 | |||||
269 | * | Boston Beer Co, Inc (Class A) | 46 | |||||
1,940 | Brown-Forman Corp | 90 | ||||||
7,882 | Brown-Forman Corp (Class B) | 354 | ||||||
5,491 | Bunge Ltd | 397 | ||||||
583 | Calavo Growers, Inc | 36 | ||||||
1,263 | e | Cal-Maine Foods, Inc | 56 | |||||
7,438 | Campbell Soup Co | 450 | ||||||
199 | Coca-Cola Bottling Co Consolidated | 36 | ||||||
156,468 | Coca-Cola Co | 6,487 | ||||||
17,373 | ConAgra Foods, Inc | 687 | ||||||
6,748 | Constellation Brands, Inc (Class A) | 1,035 | ||||||
418 | * | Craft Brewers Alliance, Inc | 7 | |||||
6,734 | * | Darling International, Inc | 87 | |||||
3,987 | Dean Foods Co | 87 | ||||||
7,474 | Dr Pepper Snapple Group, Inc | 678 | ||||||
288 | * | Farmer Bros Co | 11 | |||||
7,167 | Flowers Foods, Inc | 143 | ||||||
1,315 | Fresh Del Monte Produce, Inc | 80 | ||||||
901 | * | Freshpet, Inc | 9 | |||||
23,786 | General Mills, Inc | 1,469 | ||||||
3,864 | * | Hain Celestial Group, Inc | 151 | |||||
5,637 | Hershey Co | 583 | ||||||
10,672 | * | Hormel Foods Corp | 371 | |||||
2,973 | Ingredion, Inc | 371 | ||||||
649 | *,e | Inventure Foods, Inc | 6 | |||||
614 | J&J Snack Foods Corp | 82 | ||||||
4,566 | J.M. Smucker Co | 585 | ||||||
368 | John B. Sanfilippo & Son, Inc | 26 | ||||||
9,971 | Kellogg Co | 735 | ||||||
23,901 | Kraft Heinz Co | 2,087 | ||||||
5,927 | * | Lamb Weston Holdings, Inc | 224 | |||||
744 | Lancaster Colony Corp | 105 | ||||||
1,289 | * | Landec Corp | 18 | |||||
179 | * | Lifeway Foods, Inc | 2 | |||||
443 | Limoneira Co | 10 | ||||||
4,597 | McCormick & Co, Inc | 429 | ||||||
7,467 | Mead Johnson Nutrition Co | 528 | ||||||
476 | Mgp Ingredients, Inc | 24 | ||||||
6,880 | Molson Coors Brewing Co (Class B) | 669 | ||||||
60,257 | Mondelez International, Inc | 2,671 | ||||||
16,740 | * | Monster Beverage Corp | 742 | |||||
505 | *,e | National Beverage Corp | 26 | |||||
996 | * | Omega Protein Corp | 25 | |||||
58,026 | PepsiCo, Inc | 6,071 | ||||||
62,448 | Philip Morris International, Inc | 5,714 | ||||||
2,436 | Pilgrim’s Pride Corp | 46 | ||||||
4,776 | Pinnacle Foods, Inc | 255 | ||||||
2,482 | * | Post Holdings, Inc | 199 | |||||
845 | * | Primo Water Corp | 10 | |||||
33,235 | Reynolds American, Inc | 1,862 | ||||||
822 | e | Sanderson Farms, Inc | 77 | |||||
11 | * | Seaboard Corp | 43 | |||||
365 | * | Seneca Foods Corp | 15 | |||||
3,317 | Snyder’s-Lance, Inc | 127 | ||||||
889 | *,e | Synutra International, Inc | 5 | |||||
716 | e | Tootsie Roll Industries, Inc | 28 | |||||
2,265 | * | TreeHouse Foods, Inc | 163 | |||||
11,699 | Tyson Foods, Inc (Class A) | 722 | ||||||
821 | Universal Corp | 52 | ||||||
3,811 | e | Vector Group Ltd | 87 | |||||
7,197 | * | WhiteWave Foods Co (Class A) | 400 | |||||
|
| |||||||
TOTAL FOOD, BEVERAGE & TOBACCO | 45,176 | |||||||
|
| |||||||
20
TIAA SEPARATE ACCOUNT VA-1 - Stock Index Account
SHARES | COMPANY | VALUE (000) | ||||||
HEALTH CARE EQUIPMENT & SERVICES - 4.8% | ||||||||
338 | *,e | AAC Holdings, Inc | $ | 2 | ||||
1,018 | Abaxis, Inc | 54 | ||||||
59,134 | Abbott Laboratories | 2,271 | ||||||
1,560 | * | Abiomed, Inc | 176 | |||||
3,023 | * | Acadia Healthcare Co, Inc | 100 | |||||
3,073 | * | Accuray, Inc | 14 | |||||
1,212 | Aceto Corp | 27 | ||||||
255 | * | Addus HomeCare Corp | 9 | |||||
500 | *,e | Adeptus Health, Inc | 4 | |||||
13,594 | Aetna Inc | 1,686 | ||||||
1,468 | * | Air Methods Corp | 47 | |||||
3,570 | * | Alere, Inc | 139 | |||||
2,827 | * | Align Technology, Inc | 272 | |||||
7,667 | * | Allscripts Healthcare Solutions, Inc | 78 | |||||
380 | * | Almost Family, Inc | 17 | |||||
1,243 | * | Amedisys, Inc | 53 | |||||
368 | *,e | American Renal Associates Holdings, Inc | 8 | |||||
7,145 | AmerisourceBergen Corp | 559 | ||||||
2,008 | * | AMN Healthcare Services, Inc | 77 | |||||
558 | Analogic Corp | 46 | ||||||
1,310 | * | Angiodynamics, Inc | 22 | |||||
566 | * | Anika Therapeutics, Inc | 28 | |||||
10,618 | Anthem, Inc | 1,527 | ||||||
1,615 | * | athenahealth, Inc | 170 | |||||
1,229 | * | AtriCure, Inc | 24 | |||||
64 | Atrion Corp | 32 | ||||||
480 | *,e | Avinger, Inc | 2 | |||||
1,009 | * | AxoGen, Inc | 9 | |||||
2,955 | Bard (C.R.), Inc | 664 | ||||||
19,938 | Baxter International, Inc | 884 | ||||||
8,402 | Becton Dickinson & Co | 1,391 | ||||||
2,663 | *,e | BioScrip, Inc | 3 | |||||
1,148 | * | BioTelemetry, Inc | 26 | |||||
53,804 | * | Boston Scientific Corp | 1,164 | |||||
7,774 | * | Brookdale Senior Living, Inc | 97 | |||||
1,496 | Cantel Medical Corp | 118 | ||||||
1,396 | * | Capital Senior Living Corp | 22 | |||||
13,170 | Cardinal Health, Inc | 948 | ||||||
1,207 | * | Cardiovascular Systems, Inc | 29 | |||||
1,380 | * | Castlight Health, Inc | 7 | |||||
6,793 | * | Centene Corp | 384 | |||||
11,877 | * | Cerner Corp | 563 | |||||
4,212 | * | Cerus Corp | 18 | |||||
584 | Chemed Corp | 94 | ||||||
10,240 | Cigna Corp | 1,366 | ||||||
504 | * | Civitas Solutions, Inc | 10 | |||||
3,787 | * | Community Health Systems, Inc | 21 | |||||
481 | e | Computer Programs & Systems, Inc | 11 | |||||
1,529 | *,e | ConforMIS, Inc | 12 | |||||
1,202 | Conmed Corp | 53 | ||||||
1,970 | Cooper Cos, Inc | 345 | ||||||
514 | * | Corvel Corp | 19 | |||||
215 | * | Cotiviti Holdings, Inc | 7 | |||||
1,273 | * | Cross Country Healthcare, Inc | 20 | |||||
1,413 | * | CryoLife, Inc | 27 | |||||
593 | * | Cutera, Inc | 10 | |||||
943 | * | Cynosure, Inc (Class A) | 43 | |||||
6,941 | * | DaVita, Inc | 446 | |||||
9,201 | DENTSPLY SIRONA, Inc | 531 | ||||||
3,382 | * | DexCom, Inc | 202 | |||||
1,886 | * | Diplomat Pharmacy, Inc | 24 | |||||
8,431 | * | Edwards Lifesciences Corp | 790 | |||||
21
TIAA SEPARATE ACCOUNT VA-1 - Stock Index Account
SHARES | COMPANY | VALUE (000) | ||||||
3,300 | * | Endologix, Inc | $ | 19 | ||||
2,136 | Ensign Group, Inc | 47 | ||||||
221 | * | Entellus Medical, Inc | 4 | |||||
4,833 | * | Envision Healthcare Corp | 306 | |||||
560 | * | Evolent Health, Inc | 8 | |||||
408 | * | Exactech, Inc | 11 | |||||
25,461 | * | Express Scripts Holding Co | 1,751 | |||||
1,393 | * | Genesis Health Care, Inc | 6 | |||||
1,865 | * | GenMark Diagnostics, Inc | 23 | |||||
683 | * | Glaukos Corp | 23 | |||||
2,899 | * | Globus Medical, Inc | 72 | |||||
2,236 | * | Haemonetics Corp | 90 | |||||
2,049 | * | Halyard Health, Inc | 76 | |||||
12,362 | * | HCA Holdings, Inc | 915 | |||||
1,772 | * | HealthEquity, Inc | 72 | |||||
3,639 | Healthsouth Corp | 150 | ||||||
1,071 | * | HealthStream, Inc | 27 | |||||
1,449 | * | Healthways, Inc | 33 | |||||
3,257 | * | Henry Schein, Inc | 494 | |||||
2,407 | Hill-Rom Holdings, Inc | 135 | ||||||
2,713 | * | HMS Holdings Corp | 49 | |||||
11,048 | * | Hologic, Inc | 443 | |||||
5,959 | Humana, Inc | 1,216 | ||||||
604 | * | ICU Medical, Inc | 89 | |||||
3,501 | * | Idexx Laboratories, Inc | 411 | |||||
672 | * | Inogen Inc | 45 | |||||
2,425 | * | Inovalon Holdings, Inc | 25 | |||||
2,452 | * | Insulet Corp | 92 | |||||
1,266 | * | Integer Holding Corp | 37 | |||||
1,248 | * | Integra LifeSciences Holdings Corp | 107 | |||||
1,511 | * | Intuitive Surgical, Inc | 958 | |||||
1,548 | Invacare Corp | 20 | ||||||
1,103 | *,e | InVivo Therapeutics Holdings Corp | 5 | |||||
169 | *,e | iRadimed Corp | 2 | |||||
245 | *,e | iRhythm Technologies, Inc | 7 | |||||
312 | * | IRIDEX Corp | 4 | |||||
1,032 | * | K2M Group Holdings, Inc | 21 | |||||
3,505 | Kindred Healthcare, Inc | 27 | ||||||
4,098 | * | Laboratory Corp of America Holdings | 526 | |||||
498 | Landauer, Inc | 24 | ||||||
562 | LeMaitre Vascular, Inc | 14 | ||||||
593 | * | LHC Group, Inc | 27 | |||||
1,324 | * | LifePoint Hospitals, Inc | 75 | |||||
1,019 | * | Magellan Health Services, Inc | 77 | |||||
1,687 | * | Masimo Corp | 114 | |||||
9,018 | McKesson Corp | 1,267 | ||||||
1,990 | * | Medidata Solutions, Inc | 99 | |||||
3,789 | * | MEDNAX, Inc | 253 | |||||
56,502 | Medtronic plc | 4,025 | ||||||
1,883 | Meridian Bioscience, Inc | 33 | ||||||
1,836 | * | Merit Medical Systems, Inc | 49 | |||||
1,772 | * | Molina Healthcare, Inc | 96 | |||||
447 | National Healthcare Corp | 34 | ||||||
357 | National Research Corp | 7 | ||||||
1,466 | * | Natus Medical, Inc | 51 | |||||
1,566 | * | Neogen Corp | 103 | |||||
984 | * | Nevro Corp | 71 | |||||
1,348 | *,e | Nobilis Health Corp | 3 | |||||
2,085 | * | Novocure Ltd | 16 | |||||
2,136 | * | NuVasive, Inc | 144 | |||||
2,725 | * | NxStage Medical, Inc | 71 | |||||
1,030 | * | Omnicell, Inc | 35 | |||||
1,121 | * | OraSure Technologies, Inc | 10 | |||||
861 | * | Orthofix International NV | 31 | |||||
22
TIAA SEPARATE ACCOUNT VA-1 - Stock Index Account
SHARES | COMPANY | VALUE (000) | ||||||
2,252 | Owens & Minor, Inc | $ | 79 | |||||
919 | * | Oxford Immunotec Global plc | 14 | |||||
3,229 | Patterson Cos, Inc | 132 | ||||||
1,046 | * | Penumbra, Inc | 67 | |||||
1,217 | * | PharMerica Corp | 31 | |||||
1,297 | * | Premier, Inc | 39 | |||||
495 | * | Providence Service Corp | 19 | |||||
1,960 | Quality Systems, Inc | 26 | ||||||
5,631 | Quest Diagnostics, Inc | 517 | ||||||
1,220 | * | Quidel Corp | 26 | |||||
1,200 | * | Quorum Health Corp | 9 | |||||
1,510 | * | RadNet, Inc | 10 | |||||
5,454 | Resmed, Inc | 338 | ||||||
1,891 | *,e | Rockwell Medical, Inc | 12 | |||||
2,673 | * | RTI Biologics, Inc | 9 | |||||
569 | *,e | Second Sight Medical Products, Inc | 1 | |||||
4,065 | * | Select Medical Holdings Corp | 54 | |||||
1,177 | * | Senseonics Holdings, Inc | 3 | |||||
1,958 | * | Spectranetics Corp | 48 | |||||
11,159 | St. Jude Medical, Inc | 895 | ||||||
1,741 | *,e | Staar Surgical Co | 19 | |||||
13,489 | Stryker Corp | 1,616 | ||||||
643 | * | Surgery Partners, Inc | 10 | |||||
955 | * | Surgical Care Affiliates, Inc | 44 | |||||
723 | * | SurModics, Inc | 18 | |||||
480 | *,e | Tandem Diabetes Care, Inc | 1 | |||||
2,827 | * | Team Health Holdings, Inc | 123 | |||||
846 | * | Teladoc, Inc | 14 | |||||
1,809 | Teleflex, Inc | 291 | ||||||
3,638 | * | Tenet Healthcare Corp | 54 | |||||
1,189 | *,e | TransEnterix, Inc | 1 | |||||
948 | * | Triple-S Management Corp (Class B) | 20 | |||||
37,786 | UnitedHealth Group, Inc | 6,047 | ||||||
2,394 | * | Universal American Corp | 24 | |||||
3,547 | Universal Health Services, Inc (Class B) | 377 | ||||||
209 | US Physical Therapy, Inc | 15 | ||||||
149 | Utah Medical Products, Inc | 11 | ||||||
3,732 | * | Varian Medical Systems, Inc | 335 | |||||
441 | * | Vascular Solutions, Inc | 25 | |||||
3,169 | * | VCA Antech, Inc | 218 | |||||
3,977 | * | Veeva Systems, Inc | 162 | |||||
594 | * | Veracyte, Inc | 5 | |||||
960 | * | Vocera Communications, Inc | 18 | |||||
1,686 | * | WellCare Health Plans, Inc | 231 | |||||
2,759 | West Pharmaceutical Services, Inc | 234 | ||||||
4,246 | * | Wright Medical Group NV | 98 | |||||
1,444 | * | Zeltiq Aesthetics, Inc | 63 | |||||
7,412 | Zimmer Holdings, Inc | 765 | ||||||
|
| |||||||
TOTAL HEALTH CARE EQUIPMENT & SERVICES | 46,045 | |||||||
|
| |||||||
HOUSEHOLD & PERSONAL PRODUCTS - 1.7% | ||||||||
18,515 | * | Avon Products, Inc | 93 | |||||
237 | * | Central Garden & Pet Co | 8 | |||||
1,366 | * | Central Garden and Pet Co (Class A) | 42 | |||||
10,460 | Church & Dwight Co, Inc | 462 | ||||||
5,141 | Clorox Co | 617 | ||||||
34,978 | Colgate-Palmolive Co | 2,289 | ||||||
18,480 | Coty, Inc | 338 | ||||||
2,330 | * | Edgewell Personal Care Co | 170 | |||||
289 | * | elf Beauty, Inc | 8 | |||||
2,560 | Energizer Holdings, Inc | 114 | ||||||
8,638 | Estee Lauder Cos (Class A) | 661 | ||||||
3,010 | *,e | Herbalife Ltd | 145 | |||||
23
TIAA SEPARATE ACCOUNT VA-1 - Stock Index Account
SHARES | COMPANY | VALUE (000) | ||||||
4,123 | * | HRG Group, Inc | $ | 64 | ||||
735 | Inter Parfums, Inc | 24 | ||||||
14,482 | Kimberly-Clark Corp | 1,653 | ||||||
352 | * | Lifevantage Corp | 3 | |||||
571 | Medifast, Inc | 24 | ||||||
325 | Natural Health Trends Corp | 8 | ||||||
537 | Nature’s Sunshine Products, Inc | 8 | ||||||
2,285 | Nu Skin Enterprises, Inc (Class A) | 109 | ||||||
364 | * | Nutraceutical International Corp | 13 | |||||
255 | Oil-Dri Corp of America | 10 | ||||||
289 | e | Orchids Paper Products Co | 8 | |||||
102,979 | Procter & Gamble Co | 8,658 | ||||||
480 | * | Revlon, Inc (Class A) | 14 | |||||
1,021 | Spectrum Brands, Inc | 125 | ||||||
426 | * | USANA Health Sciences, Inc | 26 | |||||
577 | WD-40 Co | 68 | ||||||
|
| |||||||
TOTAL HOUSEHOLD & PERSONAL PRODUCTS | 15,762 | |||||||
|
| |||||||
INSURANCE - 4.3% | ||||||||
16,145 | Aflac, Inc | 1,124 | ||||||
599 | * | Alleghany Corp | 364 | |||||
3,629 | Allied World Assurance Co Holdings Ltd | 195 | ||||||
14,894 | Allstate Corp | 1,104 | ||||||
1,490 | * | AMBAC Financial Group, Inc | 33 | |||||
2,947 | American Equity Investment Life Holding Co | 66 | ||||||
2,826 | American Financial Group, Inc | 249 | ||||||
41,160 | American International Group, Inc | 2,688 | ||||||
284 | American National Insurance Co | 35 | ||||||
810 | Amerisafe, Inc | 50 | ||||||
3,256 | * | Amtrust Financial Services, Inc | 89 | |||||
10,555 | Aon plc | 1,177 | ||||||
4,579 | * | Arch Capital Group Ltd | 395 | |||||
1,301 | Argo Group International Holdings Ltd | 86 | ||||||
7,108 | Arthur J. Gallagher & Co | 369 | ||||||
2,585 | Aspen Insurance Holdings Ltd | 142 | ||||||
2,350 | Assurant, Inc | 218 | ||||||
5,264 | Assured Guaranty Ltd | 199 | ||||||
493 | * | Atlas Financial Holdings, Inc | 9 | |||||
3,814 | Axis Capital Holdings Ltd | 249 | ||||||
422 | Baldwin & Lyons, Inc (Class B) | 11 | ||||||
76,136 | * | Berkshire Hathaway, Inc (Class B) | 12,409 | |||||
265 | Blue Capital Reinsurance Holdings Ltd | 5 | ||||||
4,884 | Brown & Brown, Inc | 219 | ||||||
18,612 | Chubb Ltd | 2,459 | ||||||
5,924 | Cincinnati Financial Corp | 449 | ||||||
2,162 | *,e | Citizens, Inc (Class A) | 21 | |||||
1,136 | CNA Financial Corp | 47 | ||||||
7,386 | Conseco, Inc | 141 | ||||||
723 | e | Crawford & Co (Class B) | 9 | |||||
406 | Donegal Group, Inc (Class A) | 7 | ||||||
746 | * | eHealth, Inc | 8 | |||||
252 | EMC Insurance Group, Inc | 8 | ||||||
1,381 | Employers Holdings, Inc | 55 | ||||||
2,491 | Endurance Specialty Holdings Ltd | 230 | ||||||
469 | * | Enstar Group Ltd | 93 | |||||
983 | Erie Indemnity Co (Class A) | 111 | ||||||
1,629 | Everest Re Group Ltd | 352 | ||||||
125 | FBL Financial Group, Inc (Class A) | 10 | ||||||
485 | Federated National Holding Co | 9 | ||||||
471 | Fidelity & Guaranty Life | 11 | ||||||
4,423 | First American Financial Corp | 162 | ||||||
10,872 | FNF Group | 369 | ||||||
21,064 | * | Genworth Financial, Inc (Class A) | 80 | |||||
24
TIAA SEPARATE ACCOUNT VA-1 - Stock Index Account
SHARES | COMPANY | VALUE (000) | ||||||
417 | * | Global Indemnity Ltd | $ | 16 | ||||
1,299 | * | Greenlight Capital Re Ltd (Class A) | 30 | |||||
368 | * | Hallmark Financial Services | 4 | |||||
1,754 | Hanover Insurance Group, Inc | 160 | ||||||
15,739 | Hartford Financial Services Group, Inc | 750 | ||||||
290 | HCI Group, Inc | 11 | ||||||
1,074 | Heritage Insurance Holdings, Inc | 17 | ||||||
1,816 | Horace Mann Educators Corp | 78 | ||||||
392 | Independence Holding Co | 8 | ||||||
439 | Infinity Property & Casualty Corp | 39 | ||||||
62 | Investors Title Co | 10 | ||||||
597 | James River Group Holdings Ltd | 25 | ||||||
1,401 | Kemper Corp | 62 | ||||||
9,834 | Lincoln National Corp | 652 | ||||||
10,894 | Loews Corp | 510 | ||||||
2,294 | Maiden Holdings Ltd | 40 | ||||||
544 | * | Markel Corp | 492 | |||||
20,906 | Marsh & McLennan Cos, Inc | 1,413 | ||||||
3,498 | * | MBIA, Inc | 37 | |||||
1,146 | Mercury General Corp | 69 | ||||||
37,472 | Metlife, Inc | 2,019 | ||||||
1,991 | National General Holdings Corp | 50 | ||||||
92 | National Western Life Group, Inc | 29 | ||||||
460 | Navigators Group, Inc | 54 | ||||||
10,025 | Old Republic International Corp | 190 | ||||||
823 | OneBeacon Insurance Group Ltd (Class A) | 13 | ||||||
378 | *,e | Patriot National, Inc | 2 | |||||
1,934 | Primerica, Inc | 134 | ||||||
10,681 | Principal Financial Group | 618 | ||||||
1,787 | ProAssurance Corp | 100 | ||||||
23,091 | Progressive Corp | 820 | ||||||
17,676 | Prudential Financial, Inc | 1,839 | ||||||
2,540 | Reinsurance Group of America, Inc (Class A) | 320 | ||||||
1,702 | RenaissanceRe Holdings Ltd | 232 | ||||||
1,544 | RLI Corp | 97 | ||||||
591 | Safety Insurance Group, Inc | 44 | ||||||
2,545 | Selective Insurance Group, Inc | 110 | ||||||
630 | State Auto Financial Corp | 17 | ||||||
1,279 | State National Cos, Inc | 18 | ||||||
1,090 | Stewart Information Services Corp | 50 | ||||||
2,745 | * | Third Point Reinsurance Ltd | 32 | |||||
4,709 | Torchmark Corp | 347 | ||||||
11,710 | Travelers Cos, Inc | 1,433 | ||||||
703 | *,e | Trupanion, Inc | 11 | |||||
1,001 | United Fire & Casualty Co | 49 | ||||||
739 | United Insurance Holdings Corp | 11 | ||||||
1,340 | Universal Insurance Holdings, Inc | 38 | ||||||
9,851 | UnumProvident Corp | 433 | ||||||
3,104 | Validus Holdings Ltd | 171 | ||||||
3,784 | W.R. Berkley Corp | 252 | ||||||
177 | White Mountains Insurance Group Ltd | 148 | ||||||
11,073 | XL Group Ltd | 413 | ||||||
|
| |||||||
TOTAL INSURANCE | 40,633 | |||||||
|
| |||||||
MATERIALS - 3.3% | ||||||||
1,236 | A. Schulman, Inc | 41 | ||||||
1,237 | * | AdvanSix, Inc | 27 | |||||
185 | e | AEP Industries, Inc | 21 | |||||
7,861 | Air Products & Chemicals, Inc | 1,131 | ||||||
12,405 | * | AK Steel Holding Corp | 127 | |||||
4,468 | Albemarle Corp | 385 | ||||||
5,991 | Alcoa Corp | 168 | ||||||
4,614 | e | Allegheny Technologies, Inc | 73 | |||||
1,339 | American Vanguard Corp | 26 | ||||||
25
TIAA SEPARATE ACCOUNT VA-1 - Stock Index Account
SHARES | COMPANY | VALUE (000) | ||||||
2,561 | Aptargroup, Inc | $ | 188 | |||||
2,572 | Ashland Global Holdings, Inc | 281 | ||||||
3,690 | Avery Dennison Corp | 259 | ||||||
6,300 | * | Axalta Coating Systems Ltd | 171 | |||||
1,365 | Balchem Corp | 115 | ||||||
6,862 | Ball Corp | 515 | ||||||
3,500 | Bemis Co, Inc | 167 | ||||||
4,981 | * | Berry Plastics Group, Inc | 243 | |||||
1,581 | * | Boise Cascade Co | 36 | |||||
2,534 | Cabot Corp | 128 | ||||||
2,460 | Calgon Carbon Corp | 42 | ||||||
1,911 | Carpenter Technology Corp | 69 | ||||||
5,780 | Celanese Corp (Series A) | 455 | ||||||
2,103 | * | Century Aluminum Co | 18 | |||||
9,471 | CF Industries Holdings, Inc | 298 | ||||||
284 | Chase Corp | 24 | ||||||
7,294 | Chemours Co | 161 | ||||||
2,635 | * | Chemtura | 87 | |||||
724 | * | Clearwater Paper Corp | 47 | |||||
8,776 | *,e | Cliffs Natural Resources, Inc | 74 | |||||
1,314 | * | Codexis, Inc | 6 | |||||
5,932 | * | Coeur Mining, Inc | 54 | |||||
4,728 | Commercial Metals Co | 103 | ||||||
1,427 | Compass Minerals International, Inc | 112 | ||||||
5,210* | Crown Holdings, Inc | 274 | ||||||
439 | Deltic Timber Corp | 34 | ||||||
2,575 | Domtar Corp | 100 | ||||||
45,173 | Dow Chemical Co | 2,585 | ||||||
1,937 | Eagle Materials, Inc | 191 | ||||||
5,990 | Eastman Chemical Co | 451 | ||||||
10,468 | Ecolab, Inc | 1,227 | ||||||
35,215 | EI du Pont de Nemours & Co | 2,585 | ||||||
3,191 | * | Ferro Corp | 46 | |||||
2,943 | Ferroglobe plc | 32 | ||||||
2,943 | *,m | Ferroglobe plc + Warranty | 0 | ^ | ||||
1,776 | *,e | Flotek Industries, Inc | 17 | |||||
5,270 | FMC Corp | 298 | ||||||
596 | * | Forterra, Inc | 13 | |||||
53,242 | * | Freeport-McMoRan Copper & Gold, Inc (Class B) | 702 | |||||
954 | FutureFuel Corp | 13 | ||||||
3,109 | * | GCP Applied Technologies, Inc | 83 | |||||
2,189 | Gold Resource Corp | 10 | ||||||
13,219 | Graphic Packaging Holding Co | 165 | ||||||
203 | Greif, Inc | 14 | ||||||
1,060 | Greif, Inc (Class A) | 54 | ||||||
2,060 | H.B. Fuller Co | 100 | ||||||
137 | * | Handy & Harman Ltd | 3 | |||||
459 | Hawkins, Inc | 25 | ||||||
501 | Haynes International, Inc | 22 | ||||||
3,320 | * | Headwaters, Inc | 78 | |||||
14,849 | Hecla Mining Co | 78 | ||||||
8,201 | Huntsman Corp | 156 | ||||||
1,764 | * | Ingevity Corp | 97 | |||||
803 | Innophos Holdings, Inc | 42 | ||||||
974 | Innospec, Inc | 67 | ||||||
3,168 | International Flavors & Fragrances, Inc | 373 | ||||||
16,296 | International Paper Co | 865 | ||||||
722 | Kaiser Aluminum Corp | 56 | ||||||
3,552 | Kapstone Paper and Packaging Corp | 78 | ||||||
329 | KMG Chemicals, Inc | 13 | ||||||
850 | * | Koppers Holdings, Inc | 34 | |||||
1,207 | * | Kraton Polymers LLC | 34 | |||||
1,114 | Kronos Worldwide, Inc | 13 | ||||||
26
TIAA SEPARATE ACCOUNT VA-1 - Stock Index Account
SHARES | COMPANY | VALUE (000) | ||||||
5,138 | * | Louisiana-Pacific Corp | $ | 97 | ||||
901 | *,e | LSB Industries, Inc | 8 | |||||
13,899 | LyondellBasell Industries AF S.C.A | 1,192 | ||||||
2,614 | Martin Marietta Materials, Inc | 579 | ||||||
864 | Materion Corp | 34 | ||||||
1,470 | Minerals Technologies, Inc | 114 | ||||||
17,521 | Monsanto Co | 1,843 | ||||||
13,995 | Mosaic Co | 410 | ||||||
710 | * | Multi Packaging Solutions International Ltd | 10 | |||||
871 | Myers Industries, Inc | 12 | ||||||
685 | Neenah Paper, Inc | 58 | ||||||
302 | NewMarket Corp | 128 | ||||||
21,568 | Newmont Mining Corp | 735 | ||||||
13,088 | Nucor Corp | 779 | ||||||
6,869 | Olin Corp | 176 | ||||||
395 | Olympic Steel, Inc | 10 | ||||||
1,779 | * | Omnova Solutions, Inc | 18 | |||||
6,677 | * | Owens-Illinois, Inc | 116 | |||||
3,875 | Packaging Corp of America | 329 | ||||||
1,827 | PH Glatfelter Co | 44 | ||||||
5,829 | * | Platform Specialty Products Corp | 57 | |||||
3,457 | PolyOne Corp | 111 | ||||||
10,623 | PPG Industries, Inc | 1,007 | ||||||
11,429 | Praxair, Inc | 1,339 | ||||||
529 | Quaker Chemical Corp | 68 | ||||||
1,744 | Rayonier Advanced Materials, Inc | 27 | ||||||
1,041 | * | Real Industry, Inc | 6 | |||||
2,599 | Reliance Steel & Aluminum Co | 207 | ||||||
2,719 | Royal Gold, Inc | 172 | ||||||
5,399 | RPM International, Inc | 291 | ||||||
153 | * | Ryerson Holding Corp | 2 | |||||
1,183 | Schnitzer Steel Industries, Inc (Class A) | 30 | ||||||
1,285 | Schweitzer-Mauduit International, Inc | 59 | ||||||
1,899 | Scotts Miracle-Gro Co (Class A) | 181 | ||||||
7,868 | Sealed Air Corp | 357 | ||||||
1,682 | Sensient Technologies Corp | 132 | ||||||
3,235 | Sherwin-Williams Co | 869 | ||||||
1,724 | Silgan Holdings, Inc | 88 | ||||||
4,152 | Sonoco Products Co | 219 | ||||||
2,884 | Southern Copper Corp (NY) | 92 | ||||||
9,711 | Steel Dynamics, Inc | 346 | ||||||
834 | Stepan Co | 68 | ||||||
5,038 | * | Stillwater Mining Co | 81 | |||||
1,872 | * | Summit Materials, Inc | 45 | |||||
2,967 | * | SunCoke Energy, Inc | 34 | |||||
11,807 | Tahoe Resources, Inc | 111 | ||||||
1,733 | * | TimkenSteel Corp | 27 | |||||
970 | * | Trecora Resources | 13 | |||||
1,164 | Tredegar Corp | 28 | ||||||
819 | Trinseo S.A. | 49 | ||||||
2,723 | Tronox Ltd | 28 | ||||||
66 | United States Lime & Minerals, Inc | 5 | ||||||
5,639 | United States Steel Corp | 186 | ||||||
545 | *,e | US Concrete, Inc | 36 | |||||
3,064 | Valspar Corp | 317 | ||||||
1,212 | Valvoline, Inc | 26 | ||||||
5,309 | Vulcan Materials Co | 664 | ||||||
1,567 | Westlake Chemical Corp | 88 | ||||||
10,072 | WestRock Co | 511 | ||||||
1,910 | Worthington Industries, Inc | 91 | ||||||
2,838 | WR Grace & Co | 192 | ||||||
|
| |||||||
TOTAL MATERIALS | 31,632 | |||||||
|
| |||||||
27
TIAA SEPARATE ACCOUNT VA-1 - Stock Index Account
SHARES | COMPANY | VALUE (000) | ||||||
MEDIA - 3.0% | ||||||||
1,283 | e | AMC Entertainment Holdings, Inc | $ | 43 | ||||
2,276 | * | AMC Networks, Inc | 119 | |||||
165 | Cable One, Inc | 103 | ||||||
15,386 | CBS Corp (Class B) | 979 | ||||||
3,461 | *,e | Central European Media Enterprises Ltd (Class A) (NASDAQ) | 9 | |||||
8,080 | * | Charter Communications, Inc | 2,326 | |||||
4,394 | Cinemark Holdings, Inc | 169 | ||||||
1,723 | Clear Channel Outdoor Holdings, Inc (Class A) | 9 | ||||||
96,855 | Comcast Corp (Class A) | 6,688 | ||||||
46 | *,e | Daily Journal Corp | 11 | |||||
6,207 | * | Discovery Communications, Inc (Class A) | 170 | |||||
9,025 | * | Discovery Communications, Inc (Class C) | 242 | |||||
8,842 | * | DISH Network Corp (Class A) | 512 | |||||
1,252 | Entercom Communications Corp (Class A) | 19 | ||||||
2,637 | Entravision Communications Corp (Class A) | 18 | ||||||
798 | *,e | Eros International plc | 10 | |||||
2,606 | * | EW Scripps Co (Class A) | 50 | |||||
4,815 | Gannett Co, Inc | 47 | ||||||
1,656 | * | Global Eagle Entertainment, Inc | 11 | |||||
2,680 | * | Gray Television, Inc | 29 | |||||
408 | *,e | Hemisphere Media Group, Inc | 5 | |||||
2,551 | * | Imax Corp | 80 | |||||
15,824 | Interpublic Group of Cos, Inc | 370 | ||||||
1,843 | John Wiley & Sons, Inc (Class A) | 100 | ||||||
428 | * | Liberty Braves Group (Class A) | 9 | |||||
1,434 | * | Liberty Braves Group (Class C) | 29 | |||||
1,046 | * | Liberty Broadband Corp (Class A) | 76 | |||||
3,782 | * | Liberty Broadband Corp (Class C) | 280 | |||||
1,072 | * | Liberty Media Group (Class A) | 34 | |||||
2,092 | * | Liberty Media Group (Class C) | 66 | |||||
3,755 | * | Liberty SiriusXM Group (Class A) | 130 | |||||
7,166 | * | Liberty SiriusXM Group (Class C) | 243 | |||||
4,371 | *,e | Lions Gate Entertainment Corp | 107 | |||||
2,000 | *,e | Lions Gate Entertainment Corp | 54 | |||||
5,383 | * | Live Nation, Inc | 143 | |||||
546 | * | Loral Space & Communications, Inc | 22 | |||||
751 | * | Madison Square Garden Co | 129 | |||||
2,109 | MDC Partners, Inc | 14 | ||||||
4,469 | * | Media General, Inc | 84 | |||||
1,545 | Meredith Corp | 91 | ||||||
2,602 | * | MSG Networks, Inc | 56 | |||||
2,714 | National CineMedia, Inc | 40 | ||||||
1,709 | New Media Investment Group, Inc | 27 | ||||||
3,590 | New York Times Co (Class A) | 48 | ||||||
14,434 | News Corp | 165 | ||||||
4,202 | News Corp (Class B) | 50 | ||||||
1,218 | e | Nexstar Broadcasting Group, Inc (Class A) | 77 | |||||
9,450 | Omnicom Group, Inc | 804 | ||||||
888 | *,e | Radio One, Inc | 3 | |||||
787 | * | Reading International, Inc | 13 | |||||
3,573 | Regal Entertainment Group (Class A) | 74 | ||||||
175 | Saga Communications, Inc | 9 | ||||||
1,212 | Scholastic Corp | 58 | ||||||
3,406 | Scripps Networks Interactive (Class A) | 243 | ||||||
2,721 | Sinclair Broadcast Group, Inc (Class A) | 91 | ||||||
70,448 | e | Sirius XM Holdings, Inc | 313 | |||||
9,000 | TEGNA, Inc | 192 | ||||||
11,882 | Thomson Corp | 520 | ||||||
31,654 | Time Warner, Inc | 3,056 | ||||||
4,296 | Time, Inc | 77 | ||||||
322 | * | Townsquare Media, Inc | 3 | |||||
3,225 | Tribune Co | 113 | ||||||
28
TIAA SEPARATE ACCOUNT VA-1 - Stock Index Account
SHARES | COMPANY | VALUE (000) | ||||||
1,096 | tronc, Inc | $ | 15 | |||||
43,546 | Twenty-First Century Fox, Inc | 1,221 | ||||||
19,364 | Twenty-First Century Fox, Inc (Class B) | 528 | ||||||
411 | e | Viacom, Inc | 16 | |||||
13,700 | Viacom, Inc (Class B) | 481 | ||||||
65,460 | Walt Disney Co | 6,822 | ||||||
1,509 | World Wrestling Entertainment, Inc (Class A) | 28 | ||||||
|
| |||||||
TOTAL MEDIA | 28,773 | |||||||
|
| |||||||
PHARMACEUTICALS, BIOTECHNOLOGY & LIFE SCIENCES - 7.8% | ||||||||
65,276 | AbbVie, Inc | 4,088 | ||||||
3,739 | *,e | Acadia Pharmaceuticals, Inc | 108 | |||||
987 | *,e | Accelerate Diagnostics, Inc | 20 | |||||
1,131 | * | Acceleron Pharma, Inc | 29 | |||||
1,583 | * | AcelRx Pharmaceuticals, Inc | 4 | |||||
4,855 | * | Achillion Pharmaceuticals, Inc | 20 | |||||
357 | * | Aclaris Therapeutics, Inc | 10 | |||||
1,860 | * | Acorda Therapeutics, Inc | 35 | |||||
711 | * | Adamas Pharmaceuticals, Inc | 12 | |||||
1,933 | *,e | Aduro Biotech, Inc | 22 | |||||
1,291 | *,e | Advaxis, Inc | 9 | |||||
853 | * | Adverum Biotechnologies, Inc | 2 | |||||
1,350 | * | Aerie Pharmaceuticals, Inc | 51 | |||||
712 | * | Aevi Genomic Medicine, Inc | 4 | |||||
2,830 | *,e | Agenus, Inc | 12 | |||||
527 | * | Agile Therapeutics, Inc | 3 | |||||
13,032 | Agilent Technologies, Inc | 594 | ||||||
1,171 | *,e | Agios Pharmaceuticals, Inc | 49 | |||||
1,095 | * | Aimmune Therapeutics, Inc | 22 | |||||
1,027 | * | Akebia Therapeutics, Inc | 11 | |||||
3,444 | * | Akorn, Inc | 75 | |||||
1,060 | *,e | Albany Molecular Research, Inc | 20 | |||||
1,914 | * | Alder Biopharmaceuticals, Inc | 40 | |||||
8,726 | * | Alexion Pharmaceuticals, Inc | 1,068 | |||||
5,962 | * | Alkermes plc | 331 | |||||
13,484 | * | Allergan plc | 2,832 | |||||
3,137 | * | Alnylam Pharmaceuticals, Inc | 117 | |||||
1,423 | * | AMAG Pharmaceuticals, Inc | 49 | |||||
30,292 | Amgen, Inc | 4,429 | ||||||
5,205 | * | Amicus Therapeutics, Inc | 26 | |||||
1,331 | * | Amphastar Pharmaceuticals, Inc | 24 | |||||
1,910 | *,e | Ampio Pharmaceuticals, Inc | 2 | |||||
1,289 | *,e | Anavex Life Sciences Corp | 5 | |||||
292 | *,e | ANI Pharmaceuticals, Inc | 18 | |||||
1,485 | *,e | Anthera Pharmaceuticals, Inc | 1 | |||||
506 | * | Applied Genetic Technologies Corp | 5 | |||||
670 | * | Aptevo Therapeutics, Inc | 2 | |||||
1,104 | * | Aratana Therapeutics, Inc | 8 | |||||
894 | * | Ardelyx, Inc | 13 | |||||
9,609 | * | Arena Pharmaceuticals, Inc | 14 | |||||
7,383 | * | Ariad Pharmaceuticals, Inc | 92 | |||||
5,359 | * | Array Biopharma, Inc | 47 | |||||
2,299 | *,e | Arrowhead Research Corp | 4 | |||||
969 | * | Atara Biotherapeutics, Inc | 14 | |||||
2,944 | *,e | Athersys, Inc | 4 | |||||
189 | * | Avexis, Inc | 9 | |||||
1,017 | * | Axovant Sciences Ltd | 13 | |||||
408 | * | Axsome Therapeutics, Inc | 3 | |||||
873 | *,e | Bellicum Pharmaceuticals, Inc | 12 | |||||
3,132 | * | BioCryst Pharmaceuticals, Inc | 20 | |||||
8,796 | * | Biogen Idec, Inc | 2,494 | |||||
6,545 | * | BioMarin Pharmaceutical, Inc | 542 | |||||
3,334 | *,e | Bio-Path Holdings, Inc | 4 | |||||
29
TIAA SEPARATE ACCOUNT VA-1 - Stock Index Account
SHARES | COMPANY | VALUE (000) | ||||||
843 | * | Bio-Rad Laboratories, Inc (Class A) | $ | 154 | ||||
213 | * | Biospecifics Technologies Corp | 12 | |||||
1,525 | Bio-Techne Corp | 157 | ||||||
2,650 | *,e | BioTime, Inc | 10 | |||||
1,530 | *,e | Bluebird Bio, Inc | 94 | |||||
828 | * | Blueprint Medicines Corp | 23 | |||||
67,274 | Bristol-Myers Squibb Co | 3,931 | ||||||
4,348 | Bruker BioSciences Corp | 92 | ||||||
1,084 | * | Cambrex Corp | 58 | |||||
704 | *,e | Cara Therapeutics Inc | 7 | |||||
3,683 | * | Catalent, Inc | 99 | |||||
30,897 | * | Celgene Corp | 3,576 | |||||
4,172 | * | Celldex Therapeutics, Inc | 15 | |||||
412 | * | Cellular Biomedicine Group, Inc | 5 | |||||
1,716 | *,e | Cempra, Inc | 5 | |||||
1,993 | * | Charles River Laboratories International, Inc | 152 | |||||
1,103 | * | ChemoCentryx, Inc | 8 | |||||
1,747 | * | Chimerix, Inc | 8 | |||||
1,180 | *,e | ChromaDex Corp | 4 | |||||
448 | * | Cidara Therapeutics, Inc | 5 | |||||
1,310*,e | Clovis Oncology, Inc | 58 | ||||||
1,216 | * | Coherus Biosciences, Inc | 34 | |||||
551 | *,e | Collegium Pharmaceutical, Inc | 9 | |||||
642 | * | Concert Pharmaceuticals Inc | 7 | |||||
2,638 | * | Corcept Therapeutics, Inc | 19 | |||||
4,829 | * | Curis, Inc | 15 | |||||
1,140 | *,e | Cytokinetics, Inc | 14 | |||||
849 | * | CytomX Therapeutics, Inc | 9 | |||||
2,438 | *,e | CytRx Corp | 1 | |||||
2,577 | * | Depomed, Inc | 46 | |||||
851 | * | Dermira, Inc | 26 | |||||
476 | * | Dimension Therapeutics, Inc | 2 | |||||
4,800 | * | Durect Corp | 6 | |||||
1,590 | *,e | Dynavax Technologies Corp | 6 | |||||
364 | *,e | Eagle Pharmaceuticals, Inc | 29 | |||||
681 | *,e | Edge Therapeutics, Inc | 8 | |||||
296 | * | Editas Medicine, Inc | 5 | |||||
977 | *,e | Egalet Corp | 7 | |||||
135 | * | Eiger BioPharmaceuticals, Inc | 2 | |||||
39,252 | Eli Lilly & Co | 2,887 | ||||||
1,340 | * | Emergent Biosolutions, Inc | 44 | |||||
648 | * | Enanta Pharmaceuticals, Inc | 22 | |||||
8,355 | * | Endo International plc | 138 | |||||
1,449 | *,e | Endocyte, Inc | 4 | |||||
1,275 | * | Enzo Biochem, Inc | 9 | |||||
1,664 | * | Epizyme, Inc | 20 | |||||
554 | * | Esperion Thereapeutics, Inc | 7 | |||||
4,001 | *,e | Exact Sciences Corp | 53 | |||||
9,358 | * | Exelixis, Inc | 140 | |||||
2,028 | * | FibroGen, Inc | 43 | |||||
979 | * | Five Prime Therapeutics, Inc | 49 | |||||
405 | * | Flex Pharma, Inc | 2 | |||||
587 | * | Flexion Therapeutics Inc | 11 | |||||
1,247 | * | Fluidigm Corp | 9 | |||||
1,392 | *,e | Fortress Biotech, Inc | 4 | |||||
507 | *,e | Foundation Medicine, Inc | 9 | |||||
333 | *,e | Galena Biopharma, Inc | 1 | |||||
810 | * | Genomic Health, Inc | 24 | |||||
6,445 | *,e | Geron Corp | 13 | |||||
53,464 | Gilead Sciences, Inc | 3,829 | ||||||
561 | *,e | Global Blood Therapeutics, Inc | 8 | |||||
4,607 | *,e | Halozyme Therapeutics, Inc | 45 | |||||
1,306 | *,e | Heron Therapeutics, Inc | 17 | |||||
236 | * | Heska Corp | 17 | |||||
30
TIAA SEPARATE ACCOUNT VA-1 - Stock Index Account
SHARES | COMPANY | VALUE (000) | ||||||
6,621 | * | Horizon Pharma plc | $ | 107 | ||||
2,542 | *,e | Idera Pharmaceuticals, Inc | 4 | |||||
1,240 | * | Ignyta, Inc | 7 | |||||
5,842 | * | Illumina, Inc | 748 | |||||
484 | * | Immune Design Corp | 3 | |||||
3,866 | *,e | Immunogen, Inc | 8 | |||||
3,543 | *,e | Immunomedics, Inc | 13 | |||||
3,085 | * | Impax Laboratories, Inc | 41 | |||||
1,711 | * | INC Research Holdings, Inc | 90 | |||||
6,532 | * | Incyte Corp | 655 | |||||
2,197 | * | Infinity Pharmaceuticals, Inc | 3 | |||||
2,197 | *,e | Innoviva, Inc | 23 | |||||
767 | *,e | Inotek Pharmaceuticals Corp | 5 | |||||
2,690 | *,e | Inovio Pharmaceuticals, Inc | 19 | |||||
2,595 | * | Insmed, Inc | 34 | |||||
998 | *,e | Insys Therapeutics, Inc | 9 | |||||
276 | *,e | Intellia Therapeutics, Inc | 4 | |||||
673 | *,e | Intercept Pharmaceuticals, Inc | 73 | |||||
1,040 | * | Intersect ENT, Inc | 13 | |||||
1,415 | *,e | Intra-Cellular Therapies, Inc | 21 | |||||
2,310 | *,e | Intrexon Corp | 56 | |||||
889 | * | Invitae Corp | 7 | |||||
4,453 | * | Ionis Pharmaceuticals, Inc | 213 | |||||
5,284 | * | Ironwood Pharmaceuticals, Inc | 81 | |||||
110,469 | Johnson & Johnson | 12,727 | ||||||
2,598 | *,e | Juno Therapeutics, Inc | 49 | |||||
988 | * | Karyopharm Therapeutics, Inc | 9 | |||||
3,304 | *,e | Keryx Biopharmaceuticals, Inc | 19 | |||||
1,606 | *,e | Kite Pharma, Inc | 72 | |||||
486 | * | La Jolla Pharmaceutical Co | 8 | |||||
1,137 | *,e | Lannett Co, Inc | 25 | |||||
1,763 | *,e | Lexicon Pharmaceuticals, Inc | 24 | |||||
773 | *,e | Ligand Pharmaceuticals, Inc (Class B) | 79 | |||||
1,951 | *,e | Lion Biotechnologies, Inc | 14 | |||||
653 | *,e | Lipocine, Inc | 2 | |||||
550 | *,e | Loxo Oncology, Inc | 18 | |||||
1,733 | * | Luminex Corp | 35 | |||||
1,309 | * | MacroGenics, Inc | 27 | |||||
4,483 | * | Mallinckrodt plc | 223 | |||||
11,905 | *,e | MannKind Corp | 8 | |||||
2,880 | * | Medicines Co | 98 | |||||
1,230 | *,e | MediciNova, Inc | 7 | |||||
289 | * | Medpace Holdings, Inc | 10 | |||||
111,637 | Merck & Co, Inc | 6,572 | ||||||
4,612 | *,e | Merrimack Pharmaceuticals, Inc | 19 | |||||
1,054 | * | Mettler-Toledo International, Inc | 441 | |||||
4,566 | *,e | MiMedx Group, Inc | 40 | |||||
684 | *,e | Minerva Neurosciences, Inc | 8 | |||||
332 | * | Mirati Therapeutics, Inc | 2 | |||||
2,562 | * | Momenta Pharmaceuticals, Inc | 39 | |||||
18,027 | * | Mylan NV | 688 | |||||
480 | * | MyoKardia, Inc | 6 | |||||
2,876 | * | Myriad Genetics, Inc | 48 | |||||
460 | * | NanoString Technologies, Inc | 10 | |||||
280 | *,e | NantKwest, Inc | 2 | |||||
1,110 | * | Natera, Inc | 13 | |||||
5,532 | * | Nektar Therapeutics | 68 | |||||
2,201 | * | NeoGenomics, Inc | 19 | |||||
564 | *,e | Neos Therapeutics, Inc | 3 | |||||
3,617 | * | Neurocrine Biosciences, Inc | 140 | |||||
866 | * | NewLink Genetics Corp | 9 | |||||
11,296 | *,e | Novavax, Inc | 14 | |||||
543 | *,e | Ocular Therapeutix, Inc | 5 | |||||
1,496 | *,e | Omeros Corp | 15 | |||||
31
TIAA SEPARATE ACCOUNT VA-1 - Stock Index Account
SHARES | COMPANY | VALUE (000) | ||||||
542 | * | OncoMed Pharmaceuticals, Inc | $ | 4 | ||||
1,250 | * | Ophthotech Corp | 6 | |||||
13,300 | *,e | Opko Health, Inc | 124 | |||||
2,776 | *,e | Organovo Holdings, Inc | 9 | |||||
807 | *,e | Osiris Therapeutics, Inc | 4 | |||||
1,016 | * | Otonomy, Inc | 16 | |||||
1,035 | * | OvaScience, Inc | 2 | |||||
3,094 | *,e | Pacific Biosciences of California, Inc | 12 | |||||
1,106 | *,e | Pacira Pharmaceuticals, Inc | 36 | |||||
529 | * | Paratek Pharmaceuticals, Inc | 8 | |||||
1,994 | *,e | Parexel International Corp | 131 | |||||
1,295 | * | Patheon NV | 37 | |||||
7,108 | PDL BioPharma, Inc | 15 | ||||||
4,184 | PerkinElmer, Inc | 218 | ||||||
5,506 | Perrigo Co plc | 458 | ||||||
694 | * | Pfenex, Inc | 6 | |||||
242,075 | Pfizer, Inc | 7,863 | ||||||
2,423 | * | PharmAthene, Inc | 8 | |||||
638 | Phibro Animal Health Corp | 19 | ||||||
1,961 | * | Portola Pharmaceuticals, Inc | 44 | |||||
926 | * | PRA Health Sciences, Inc | 51 | |||||
2,249 | * | Prestige Brands Holdings, Inc | 117 | |||||
2,427 | * | Progenics Pharmaceuticals, Inc | 21 | |||||
282 | * | Protagonist Therapeutics, Inc | 6 | |||||
282 | * | Proteostasis Therapeutics, Inc | 3 | |||||
1,437 | *,e | Prothena Corp plc | 71 | |||||
1,436 | * | PTC Therapeutics, Inc | 16 | |||||
1,018 | * | Puma Biotechnology, Inc | 31 | |||||
8,922 | * | Qiagen NV (NASDAQ) | 250 | |||||
5,701 | * | Quintiles Transnational Holdings, Inc | 434 | |||||
1,230 | *,e | Radius Health, Inc | 47 | |||||
227 | *,e | Reata Pharmaceuticals, Inc | 5 | |||||
3,164 | * | Regeneron Pharmaceuticals, Inc | 1,161 | |||||
869 | * | REGENXBIO, Inc | 16 | |||||
1,210 | * | Regulus Therapeutics, Inc | 3 | |||||
1,493 | * | Repligen Corp | 46 | |||||
1,469 | * | Retrophin, Inc | 28 | |||||
670 | * | Revance Therapeutics, Inc | 14 | |||||
3,471 | * | Rigel Pharmaceuticals, Inc | 8 | |||||
1,100 | * | Sage Therapeutics, Inc | 56 | |||||
3,004 | * | Sangamo Biosciences, Inc | 9 | |||||
1,786 | * | Sarepta Therapeutics, Inc | 49 | |||||
2,282 | * | Sciclone Pharmaceuticals, Inc | 25 | |||||
4,085 | * | Seattle Genetics, Inc | 216 | |||||
745 | *,e | Seres Therapeutics, Inc | 7 | |||||
1,189 | *,e | Sorrento Therapeutics, Inc | 6 | |||||
702 | * | Spark Therapeutics, Inc | 35 | |||||
2,652 | * | Spectrum Pharmaceuticals, Inc | 12 | |||||
414 | * | Stemline Therapeutics, Inc | 4 | |||||
1,048 | * | Sucampo Pharmaceuticals, Inc (Class A) | 14 | |||||
1,932 | * | Supernus Pharmaceuticals, Inc | 49 | |||||
7,382 | * | Synergy Pharmaceuticals, Inc | 45 | |||||
3,062 | *,e | Synthetic Biologics, Inc | 2 | |||||
383 | *,e | T2 Biosystems, Inc | 2 | |||||
1,333 | * | Teligent, Inc | 9 | |||||
1,139 | * | TESARO, Inc | 153 | |||||
1,526 | * | Tetraphase Pharmaceuticals, Inc | 6 | |||||
1,516 | * | TG Therapeutics, Inc | 7 | |||||
5,906 | *,e | TherapeuticsMD, Inc | 34 | |||||
1,491 | *,e | Theravance Biopharma, Inc | 48 | |||||
15,751 | Thermo Fisher Scientific, Inc | 2,222 | ||||||
770 | *,e | Titan Pharmaceuticals, Inc | 3 | |||||
32
TIAA SEPARATE ACCOUNT VA-1 - Stock Index Account
SHARES | COMPANY | VALUE (000) | ||||||
390 | *,m | Tobira Therapeutics, Inc | $ | 5 | ||||
430 | *,e | Tokai Pharmaceuticals, Inc | 0 | ^ | ||||
1,790 | * | Trevena, Inc | 11 | |||||
1,190 | *,e | Trovagene, Inc | 2 | |||||
1,517 | * | Ultragenyx Pharmaceutical, Inc | 107 | |||||
1,741 | * | United Therapeutics Corp | 250 | |||||
1,501 | * | Vanda Pharmaceuticals, Inc | 24 | |||||
946 | * | Versartis, Inc | 14 | |||||
10,008 | * | Vertex Pharmaceuticals, Inc | 737 | |||||
702 | *,e | Vital Therapies, Inc | 3 | |||||
484 | *,e | Voyager Therapeutics, Inc | 6 | |||||
3,221 | * | VWR Corp | 81 | |||||
3,162 | * | Waters Corp | 425 | |||||
314 | *,e | WaVe Life Sciences Pte Ltd | 8 | |||||
663 | *,e | XBiotech, Inc | 7 | |||||
1,194 | * | Xencor Inc | 31 | |||||
704 | * | Zafgen, Inc | 2 | |||||
4,815 | *,e | ZIOPHARM Oncology, Inc | 26 | |||||
18,179 | Zoetis, Inc | 973 | ||||||
845 | * | Zogenix, Inc | 10 | |||||
|
| |||||||
TOTAL PHARMACEUTICALS, BIOTECHNOLOGY & LIFE SCIENCES | 74,500 | |||||||
|
| |||||||
REAL ESTATE - 4.0% | ||||||||
2,898 | Acadia Realty Trust | 95 | ||||||
943 | Agree Realty Corp | 43 | ||||||
1,613 | Alexander & Baldwin, Inc | 72 | ||||||
87 | Alexander’s, Inc | 37 | ||||||
3,080 | Alexandria Real Estate Equities, Inc | 342 | ||||||
466 | * | Altisource Portfolio Solutions S.A. | 12 | |||||
1,599 | American Assets Trust,Inc | 69 | ||||||
5,404 | American Campus Communities, Inc | 269 | ||||||
7,178 | American Homes 4 Rent | 151 | ||||||
16,968 | American Tower Corp | 1,793 | ||||||
6,168 | Apartment Investment & Management Co (Class A) | 280 | ||||||
7,320 | Apple Hospitality REIT, Inc | 146 | ||||||
1,267 | Armada Hoffler Properties, Inc | 18 | ||||||
1,249 | Ashford Hospitality Prime, Inc | 17 | ||||||
3,090 | Ashford Hospitality Trust, Inc | 24 | ||||||
454 | * | AV Homes, Inc | 7 | |||||
5,487 | AvalonBay Communities, Inc | 972 | ||||||
769 | Bluerock Residential Growth REIT, Inc | 11 | ||||||
6,073 | Boston Properties, Inc | 764 | ||||||
7,108 | Brandywine Realty Trust | 117 | ||||||
7,928 | Brixmor Property Group, Inc | 194 | ||||||
3,565 | Camden Property Trust | 300 | ||||||
3,493 | Care Capital Properties, Inc | 87 | ||||||
2,243 | CareTrust REIT, Inc | 34 | ||||||
1,667 | CatchMark Timber Trust Inc | 19 | ||||||
7,059 | CBL & Associates Properties, Inc | 81 | ||||||
11,909 | * | CBRE Group, Inc | 375 | |||||
3,595 | Cedar Realty Trust, Inc | 23 | ||||||
1,627 | Chatham Lodging Trust | 33 | ||||||
2,532 | Chesapeake Lodging Trust | 65 | ||||||
556 | City Office REIT, Inc | 7 | ||||||
2,678 | Colony Starwood Homes | 77 | ||||||
5,267 | Columbia Property Trust, Inc | 114 | ||||||
4,486 | Communications Sales & Leasing, Inc | 114 | ||||||
1,060 | Community Healthcare Trust, Inc | 24 | ||||||
267 | Consolidated-Tomoka Land Co | 14 | ||||||
4,821 | CoreCivic, Inc | 118 | ||||||
419 | CorEnergy Infrastructure Trust, Inc | 15 | ||||||
1,384 | Coresite Realty | 110 | ||||||
3,989 | Corporate Office Properties Trust | 125 | ||||||
33
TIAA SEPARATE ACCOUNT VA-1 - Stock Index Account
SHARES | COMPANY | VALUE (000) | ||||||
14,104 | Cousins Properties, Inc | $ | 120 | |||||
14,401 | Crown Castle International Corp | 1,250 | ||||||
7,343 | CubeSmart | 197 | ||||||
2,920 | CyrusOne, Inc | 131 | ||||||
3,638 | DCT Industrial Trust, Inc | 174 | ||||||
12,989 | DDR Corp | 198 | ||||||
8,448 | DiamondRock Hospitality Co | 97 | ||||||
6,088 | Digital Realty Trust, Inc | 598 | ||||||
5,417 | Douglas Emmett, Inc | 198 | ||||||
13,997 | Duke Realty Corp | 372 | ||||||
3,070 | DuPont Fabros Technology, Inc | 135 | ||||||
964 | Easterly Government Properties, Inc | 19 | ||||||
1,377 | EastGroup Properties, Inc | 102 | ||||||
2,519 | Education Realty Trust, Inc | 107 | ||||||
5,016 | Empire State Realty Trust, Inc | 101 | ||||||
2,617 | Entertainment Properties Trust | 188 | ||||||
2,770 | Equinix, Inc | 990 | ||||||
4,669 | * | Equity Commonwealth | 141 | |||||
3,010 | Equity Lifestyle Properties, Inc | 217 | ||||||
3,785 | Equity One, Inc | 116 | ||||||
14,232 | Equity Residential | 916 | ||||||
2,623 | Essex Property Trust, Inc | 610 | ||||||
4,978 | Extra Space Storage, Inc | 384 | ||||||
420 | e | Farmland Partners, Inc | 5 | |||||
2,807 | Federal Realty Investment Trust | 399 | ||||||
5,675 | FelCor Lodging Trust, Inc | 45 | ||||||
4,766 | First Industrial Realty Trust, Inc | 134 | ||||||
2,547 | First Potomac Realty Trust | 28 | ||||||
9,480 | Forest City Realty Trust, Inc | 198 | ||||||
1,413 | * | Forestar Group, Inc | 19 | |||||
2,420 | Four Corners Property Trust, Inc | 50 | ||||||
4,124 | Franklin Street Properties Corp | 53 | ||||||
309* | FRP Holdings, Inc | 12 | ||||||
7,673 | Gaming and Leisure Properties, Inc | 235 | ||||||
23,177 | General Growth Properties, Inc | 579 | ||||||
3,158 | Geo Group, Inc | 113 | ||||||
1,199 | Getty Realty Corp | 31 | ||||||
881 | Gladstone Commercial Corp | 18 | ||||||
5,364 | e | Global Net Lease, Inc | 42 | |||||
2,836 | Government Properties Income Trust | 54 | ||||||
17,334 | Gramercy Property Trust | 159 | ||||||
18,976 | HCP, Inc | 564 | ||||||
4,293 | Healthcare Realty Trust, Inc | 130 | ||||||
5,602 | Healthcare Trust of America, Inc | 163 | ||||||
1,884 | Hersha Hospitality Trust | 40 | ||||||
741 | HFF, Inc (Class A) | 22 | ||||||
3,988 | Highwoods Properties, Inc | 203 | ||||||
6,332 | Hospitality Properties Trust | 201 | ||||||
29,386 | Host Marriott Corp | 554 | ||||||
1,318 | * | Howard Hughes Corp | 150 | |||||
3,138 | Hudson Pacific Properties | 109 | ||||||
1,375 | Independence Realty Trust, Inc | 12 | ||||||
4,600 | Investors Real Estate Trust | 33 | ||||||
10,789 | Iron Mountain, Inc | 350 | ||||||
1,718 | Jones Lang LaSalle, Inc | 174 | ||||||
3,408 | Kennedy-Wilson Holdings, Inc | 70 | ||||||
3,723 | Kilroy Realty Corp | 273 | ||||||
16,000 | Kimco Realty Corp | 403 | ||||||
3,499 | Kite Realty Group Trust | 82 | ||||||
3,137 | Lamar Advertising Co | 211 | ||||||
3,864 | LaSalle Hotel Properties | 118 | ||||||
9,500 | Lexington Realty Trust | 103 | ||||||
6,172 | Liberty Property Trust | 244 | ||||||
1,889 | Life Storage, Inc | 161 | ||||||
34
TIAA SEPARATE ACCOUNT VA-1 - Stock Index Account
SHARES | COMPANY | VALUE (000) | ||||||
1,589 | LTC Properties, Inc | $ | 75 | |||||
5,673 | Macerich Co | 402 | ||||||
3,534 | Mack-Cali Realty Corp | 103 | ||||||
569 | * | Marcus & Millichap, Inc | 15 | |||||
627 | MedEquities Realty Trust, Inc | 7 | ||||||
8,614 | Medical Properties Trust, Inc | 106 | ||||||
4,337 | Mid-America Apartment Communities, Inc | 425 | ||||||
2,597 | Monmouth Real Estate Investment Corp (Class A) | 40 | ||||||
6,986 | Monogram Residential Trust, Inc | 76 | ||||||
1,549 | National Health Investors, Inc | 115 | ||||||
6,044 | National Retail Properties, Inc | 267 | ||||||
1,004 | National Storage Affiliates Trust | 22 | ||||||
2,762 | New Senior Investment Group, Inc | 27 | ||||||
6,777 | New York REIT, Inc | 69 | ||||||
822 | NexPoint Residential Trust, Inc | 18 | ||||||
2,437 | NorthStar Realty Europe Corp | 31 | ||||||
7,311 | NorthStar Realty Finance Corp | 111 | ||||||
7,718 | Omega Healthcare Investors, Inc | 241 | ||||||
567 | One Liberty Properties, Inc | 14 | ||||||
5,803 | Outfront Media, Inc | 144 | ||||||
7,444 | Paramount Group, Inc | 119 | ||||||
1,763 | * | Parkway, Inc | 39 | |||||
3,039 | Pebblebrook Hotel Trust | 90 | ||||||
3,002 | Pennsylvania REIT | 57 | ||||||
5,550 | Physicians Realty Trust | 105 | ||||||
5,978 | Piedmont Office Realty Trust, Inc | 125 | ||||||
1,205 | Potlatch Corp | 50 | ||||||
971 | Preferred Apartment Communities, Inc | 14 | ||||||
21,058 | Prologis, Inc | 1,112 | ||||||
636 | PS Business Parks, Inc | 74 | ||||||
5,950 | Public Storage, Inc | 1,330 | ||||||
1,928 | QTS Realty Trust, Inc | 96 | ||||||
3,795 | * | Quality Care Properties, Inc | 59 | |||||
3,606 | RAIT Investment Trust | 12 | ||||||
3,360 | Ramco-Gershenson Properties | 56 | ||||||
4,539 | Rayonier, Inc | 121 | ||||||
732 | Re/Max Holdings, Inc | 41 | ||||||
5,983 | Realogy Holdings Corp | 154 | ||||||
10,691 | Realty Income Corp | 615 | ||||||
3,786 | Regency Centers Corp | 261 | ||||||
3,984 | Retail Opportunities Investment Corp | 84 | ||||||
10,028 | Retail Properties of America, Inc | 154 | ||||||
2,685 | Rexford Industrial Realty, Inc | 62 | ||||||
5,071 | RLJ Lodging Trust | 124 | ||||||
283 | RMR Group, Inc | 11 | ||||||
1,467 | Ryman Hospitality Properties | 92 | ||||||
2,666 | Sabra Healthcare REIT, Inc | 65 | ||||||
392 | Saul Centers, Inc | 26 | ||||||
2,564 | Select Income REIT | 65 | ||||||
9,747 | Senior Housing Properties Trust | 184 | ||||||
990 | e | Seritage Growth Properties | 42 | |||||
1,385 | Silver Bay Realty Trust Corp | 24 | ||||||
12,408 | Simon Property Group, Inc | 2,205 | ||||||
3,923 | SL Green Realty Corp | 422 | ||||||
18,856 | Spirit Realty Capital, Inc | 205 | ||||||
2,290 | * | St. Joe Co | 43 | |||||
2,739 | STAG Industrial, Inc | 65 | ||||||
6,255 | STORE Capital Corp | 155 | ||||||
99 | * | Stratus Properties, Inc | 3 | |||||
2,587 | Sun Communities, Inc | 198 | ||||||
7,531 | Sunstone Hotel Investors, Inc | 115 | ||||||
3,910 | Tanger Factory Outlet Centers, Inc | 140 | ||||||
2,428 | Taubman Centers, Inc | 179 | ||||||
695 | * | Tejon Ranch Co | 18 | |||||
35
TIAA SEPARATE ACCOUNT VA-1 - Stock Index Account
SHARES | COMPANY | VALUE (000) | ||||||
1,821 | Terreno Realty Corp | $ | 52 | |||||
1,934 | Tier REIT, Inc | 34 | ||||||
761 | * | Trinity Place Holdings, Inc | 7 | |||||
10,915 | UDR, Inc | 398 | ||||||
994 | UMH Properties, Inc | 15 | ||||||
575 | Universal Health Realty Income Trust | 38 | ||||||
3,855 | Urban Edge Properties | 106 | ||||||
1,188 | Urstadt Biddle Properties, Inc (Class A) | 29 | ||||||
13,746 | Ventas, Inc | 859 | ||||||
37,616 | VEREIT, Inc | 318 | ||||||
6,868 | Vornado Realty Trust | 717 | ||||||
7,659 | Washington Prime Group, Inc | 80 | ||||||
3,060 | Washington REIT | 100 | ||||||
4,685 | Weingarten Realty Investors | 168 | ||||||
14,566 | Welltower, Inc | 975 | ||||||
29,618 | Weyerhaeuser Co | 891 | ||||||
976 | Whitestone REIT | 14 | ||||||
4,055 | WP Carey, Inc | 240 | ||||||
4,278 | Xenia Hotels & Resorts, Inc | 83 | ||||||
|
| |||||||
TOTAL REAL ESTATE | 37,716 | |||||||
|
| |||||||
RETAILING - 4.9% | ||||||||
1,264 | * | 1-800-FLOWERS.COM, Inc (Class A) | 13 | |||||
2,730 | Aaron’s, Inc | 87 | ||||||
2,820 | Abercrombie & Fitch Co (Class A) | 34 | ||||||
2,842 | Advance Auto Parts, Inc | 481 | ||||||
15,638 | * | Amazon.com, Inc | 11,727 | |||||
6,834 | American Eagle Outfitters, Inc | 104 | ||||||
367 | * | America’s Car-Mart, Inc | 16 | |||||
829 | * | Asbury Automotive Group, Inc | 51 | |||||
7,267 | * | Ascena Retail Group, Inc | 45 | |||||
2,694 | * | Autonation, Inc | 131 | |||||
1,195 | * | AutoZone, Inc | 944 | |||||
1,364 | * | Barnes & Noble Education, Inc | 16 | |||||
2,159 | Barnes & Noble, Inc | 24 | ||||||
5,730 | Bed Bath & Beyond, Inc | 233 | ||||||
11,024 | Best Buy Co, Inc | 470 | ||||||
824 | Big 5 Sporting Goods Corp | 14 | ||||||
1,715 | Big Lots, Inc | 86 | ||||||
272 | Blue Nile, Inc | 11 | ||||||
517 | * | Boot Barn Holdings, Inc | 6 | |||||
1,023 | e | Buckle, Inc | 23 | |||||
512 | * | Build-A-Bear Workshop, Inc | 7 | |||||
2,905 | * | Burlington Stores, Inc | 246 | |||||
2,077 | * | Cabela’s, Inc | 122 | |||||
1,284 | Caleres, Inc | 42 | ||||||
437 | Camping World Holdings, Inc | 14 | ||||||
7,934 | * | Carmax, Inc | 511 | |||||
966 | Cato Corp (Class A) | 29 | ||||||
4,716 | Chico’s FAS, Inc | 68 | ||||||
552 | Children’s Place Retail Stores, Inc | 56 | ||||||
619 | Citi Trends, Inc | 12 | ||||||
764 | *,e | Container Store Group, Inc | 5 | |||||
1,858 | Core-Mark Holding Co, Inc | 80 | ||||||
2,760 | CST Brands, Inc | 133 | ||||||
2,260 | * | Destination XL Group, Inc | 10 | |||||
3,623 | Dick’s Sporting Goods, Inc | 192 | ||||||
779 | e | Dillard’s, Inc (Class A) | 49 | |||||
11,444 | Dollar General Corp | 848 | ||||||
9,166 | * | Dollar Tree, Inc | 707 | |||||
2,767 | DSW, Inc (Class A) | 63 | ||||||
404 | *,e | Duluth Holdings, Inc | 10 | |||||
4,286 | * | Etsy, Inc | 50 | |||||
36
TIAA SEPARATE ACCOUNT VA-1 - Stock Index Account
SHARES | COMPANY | VALUE (000) | ||||||
4,730 | Expedia, Inc | $ | 536 | |||||
3,087 | * | Express Parent LLC | 33 | |||||
1,930 | Finish Line, Inc (Class A) | 36 | ||||||
2,292 | * | Five Below, Inc | 92 | |||||
5,534 | Foot Locker, Inc | 392 | ||||||
1,652 | * | Francesca’s Holdings Corp | 30 | |||||
1,409 | e | Fred’s, Inc (Class A) | 26 | |||||
724 | * | FTD Cos, Inc | 17 | |||||
4,219 | GameStop Corp (Class A) | 107 | ||||||
9,205 | Gap, Inc | 207 | ||||||
840 | * | Genesco, Inc | 52 | |||||
5,859 | Genuine Parts Co | 560 | ||||||
1,841 | GNC Holdings, Inc | 20 | ||||||
861 | Group 1 Automotive, Inc | 67 | ||||||
15,187 | * | Groupon, Inc | 50 | |||||
2,487 | Guess?, Inc | 30 | ||||||
983 | Haverty Furniture Cos, Inc | 23 | ||||||
948 | *,e | Hibbett Sports, Inc | 35 | |||||
50,098 | Home Depot, Inc | 6,717 | ||||||
1,388 | HSN, Inc | 48 | ||||||
12,859 | *,e | JC Penney Co, Inc | 107 | |||||
705 | * | Kirkland’s, Inc | 11 | |||||
7,447 | Kohl’s Corp | 368 | ||||||
9,734 | L Brands, Inc | 641 | ||||||
733 | *,e | Lands’ End, Inc | 11 | |||||
770 | * | LCI Industries, Inc | 83 | |||||
2,202 | * | Liberty Expedia Holdings, Inc | 87 | |||||
17,498 | * | Liberty Interactive Corp | 350 | |||||
3,006 | * | Liberty TripAdvisor Holdings, Inc | 45 | |||||
2,918 | * | Liberty Ventures | 108 | |||||
960 | Lithia Motors, Inc (Class A) | 93 | ||||||
12,079 | * | LKQ Corp | 370 | |||||
36,060 | Lowe’s Companies, Inc | 2,565 | ||||||
1,262 | *,e | Lumber Liquidators, Inc | 20 | |||||
12,456 | Macy’s, Inc | 446 | ||||||
1,129 | * | MarineMax, Inc | 22 | |||||
3,432 | * | Michaels Cos, Inc | 70 | |||||
1,098 | Monro Muffler, Inc | 63 | ||||||
1,529 | * | Murphy USA, Inc | 94 | |||||
16,385 | * | NetFlix, Inc | 2,028 | |||||
4,712 | Nordstrom, Inc | 226 | ||||||
1,216 | Nutri/System, Inc | 42 | ||||||
22,026 | Office Depot, Inc | 100 | ||||||
848 | * | Ollie’s Bargain Outlet Holdings, Inc | 24 | |||||
3,847 | * | O’Reilly Automotive, Inc | 1,071 | |||||
567 | * | Overstock.com, Inc | 10 | |||||
1,066 | *,e | Party City Holdco, Inc | 15 | |||||
1,600 | Penske Auto Group, Inc | 83 | ||||||
848 | PetMed Express, Inc | 20 | ||||||
3,298 | Pier 1 Imports, Inc | 28 | ||||||
1,996 | * | Priceline.com, Inc | 2,926 | |||||
2,196 | Rent-A-Center, Inc | 25 | ||||||
1,378 | * | Restoration Hardware Holdings, Inc | 42 | |||||
— | *,e | Restoration Hardware Holdings, Inc | 0 | ^ | ||||
15,704 | Ross Stores, Inc | 1,030 | ||||||
5,321 | * | Sally Beauty Holdings, Inc | 141 | |||||
691 | *,e | Sears Holdings Corp | 6 | |||||
1,357 | * | Select Comfort Corp | 31 | |||||
576 | Shoe Carnival, Inc | 16 | ||||||
1,427 | * | Shutterfly, Inc | 72 | |||||
3,063 | Signet Jewelers Ltd | 289 | ||||||
1,157 | Sonic Automotive, Inc (Class A) | 26 | ||||||
758 | * | Sportsman’s Warehouse Holdings, Inc | 7 | |||||
1,474 | e | Stage Stores, Inc | 6 | |||||
37
TIAA SEPARATE ACCOUNT VA-1 - Stock Index Account
SHARES | COMPANY | VALUE (000) | ||||||
24,736 | Staples, Inc | $ | 224 | |||||
1,440 | Stein Mart, Inc | 8 | ||||||
1,945 | Tailored Brands, Inc | 50 | ||||||
23,751 | Target Corp | 1,716 | ||||||
4,358 | Tiffany & Co | 337 | ||||||
884 | * | Tile Shop Holdings, Inc | 17 | |||||
432 | * | Tilly’s, Inc | 6 | |||||
26,680 | TJX Companies, Inc | 2,004 | ||||||
5,467 | Tractor Supply Co | 414 | ||||||
4,718 | * | TripAdvisor, Inc | 219 | |||||
1,789 | * | Tuesday Morning Corp | 10 | |||||
2,348 | * | Ulta Salon Cosmetics & Fragrance, Inc | 599 | |||||
3,362 | * | Urban Outfitters, Inc | 96 | |||||
990 | * | Vitamin Shoppe, Inc | 23 | |||||
1,299 | *,e | Wayfair, Inc | 45 | |||||
640 | * | West Marine, Inc | 7 | |||||
3,535 | Williams-Sonoma, Inc | 171 | ||||||
133 | Winmark Corp | 17 | ||||||
457 | * | Zumiez, Inc | 10 | |||||
|
| |||||||
TOTAL RETAILING | 46,639 | |||||||
|
| |||||||
SEMICONDUCTORS & SEMICONDUCTOR EQUIPMENT - 3.2% | ||||||||
210 | *,e | Acacia Communications, Inc | 13 | |||||
1,628 | * | Advanced Energy Industries, Inc | 89 | |||||
29,948 | * | Advanced Micro Devices, Inc | 340 | |||||
844 | * | Alpha & Omega Semiconductor Ltd | 18 | |||||
1,324 | *,e | Ambarella, Inc | 72 | |||||
3,751 | * | Amkor Technology, Inc | 40 | |||||
12,173 | Analog Devices, Inc | 884 | ||||||
43,802 | Applied Materials, Inc | 1,414 | ||||||
3,483 | * | Applied Micro Circuits Corp | 29 | |||||
1,339 | * | Axcelis Technologies, Inc | 19 | |||||
15,173 | Broadcom Ltd | 2,682 | ||||||
2,909 | Brooks Automation, Inc | 50 | ||||||
639 | Cabot Microelectronics Corp | 40 | ||||||
2,715 | * | Cavium, Inc | 170 | |||||
910 | * | Ceva, Inc | 31 | |||||
2,293 | * | Cirrus Logic, Inc | 130 | |||||
1,302 | Cohu, Inc | 18 | ||||||
4,110 | * | Cree, Inc | 108 | |||||
12,862 | Cypress Semiconductor Corp | 147 | ||||||
1,646 | * | Diodes, Inc | 42 | |||||
1,224 | * | DSP Group, Inc | 16 | |||||
5,882 | * | Entegris, Inc | 105 | |||||
1,921 | * | Exar Corp | 21 | |||||
2,662 | *,e | First Solar, Inc | 85 | |||||
2,989 | * | Formfactor, Inc | 33 | |||||
1,722 | * | GigOptix, Inc | 4 | |||||
229 | *,e | Impinj, Inc | 8 | |||||
1,603 | * | Inphi Corp | 72 | |||||
5,139 | * | Integrated Device Technology, Inc | 121 | |||||
189,873 | Intel Corp | 6,886 | ||||||
5,704 | Intersil Corp (Class A) | 127 | ||||||
1,231 | IXYS Corp | 15 | ||||||
6,195 | Kla-Tencor Corp | 487 | ||||||
3,559 | * | Kopin Corp | 10 | |||||
6,331 | Lam Research Corp | 669 | ||||||
5,097 | * | Lattice Semiconductor Corp | 38 | |||||
9,553 | Linear Technology Corp | 596 | ||||||
987 | * | MA-COM Technology Solutions | 46 | |||||
15,563 | Marvell Technology Group Ltd | 216 | ||||||
11,292 | Maxim Integrated Products, Inc | 436 | ||||||
2,280 | * | MaxLinear, Inc | 50 | |||||
38
TIAA SEPARATE ACCOUNT VA-1 - Stock Index Account
SHARES | COMPANY | VALUE (000) | ||||||
8,396 | Microchip Technology, Inc | $ | 539 | |||||
41,627 | * | Micron Technology, Inc | 912 | |||||
4,670 | * | Microsemi Corp | 252 | |||||
2,245 | MKS Instruments, Inc | 133 | ||||||
1,598 | Monolithic Power Systems, Inc | 131 | ||||||
1,014 | * | Nanometrics, Inc | 25 | |||||
1,216 | * | NeoPhotonics Corp Ltd | 13 | |||||
258 | NVE Corp | 18 | ||||||
20,467 | Nvidia Corp | 2,185 | ||||||
17,093 | * | ON Semiconductor Corp | 218 | |||||
1,181 | * | PDF Solutions, Inc | 27 | |||||
2,703 | * | Photronics, Inc | 31 | |||||
1,292 | Power Integrations, Inc | 88 | ||||||
5,230 | * | Qorvo, Inc | 276 | |||||
59,172 | Qualcomm, Inc | 3,858 | ||||||
4,954 | * | Rambus, Inc | 68 | |||||
1,464 | * | Rudolph Technologies, Inc | 34 | |||||
2,813 | * | Semtech Corp | 89 | |||||
1,460 | * | Sigma Designs, Inc | 9 | |||||
1,452 | * | Silicon Laboratories, Inc | 94 | |||||
7,550 | Skyworks Solutions, Inc | 564 | ||||||
2,299 | *,e | SunPower Corp | 15 | |||||
8,427 | Teradyne, Inc | 214 | ||||||
1,570 | Tessera Holding Corp | 69 | ||||||
40,375 | Texas Instruments, Inc | 2,946 | ||||||
928 | * | Ultra Clean Holdings | 9 | |||||
1,078 | * | Ultratech, Inc | 26 | |||||
1,796 | * | Veeco Instruments, Inc | 52 | |||||
3,930 | * | Versum Materials, Inc | 110 | |||||
2,408 | * | Xcerra Corp | 18 | |||||
10,076 | Xilinx, Inc | 608 | ||||||
|
| |||||||
TOTAL SEMICONDUCTORS & SEMICONDUCTOR EQUIPMENT | 30,008 | |||||||
|
| |||||||
SOFTWARE & SERVICES - 11.6% | ||||||||
1,524 | * | 2U, Inc | 46 | |||||
1,417 | * | A10 Networks, Inc | 12 | |||||
25,091 | Accenture plc | 2,939 | ||||||
4,872 | * | ACI Worldwide, Inc | 88 | |||||
22,233 | Activision Blizzard, Inc | 803 | ||||||
1,761 | * | Actua Corp | 25 | |||||
3,190 | * | Acxiom Corp | 86 | |||||
19,664 | * | Adobe Systems, Inc | 2,024 | |||||
6,783 | * | Akamai Technologies, Inc | 452 | |||||
351 | * | Alarm.com Holdings, Inc | 10 | |||||
780 | * | ALJ Regional Holdings, Inc | 3 | |||||
2,308 | Alliance Data Systems Corp | 527 | ||||||
11,798 | * | Alphabet, Inc (Class A) | 9,349 | |||||
11,926 | * | Alphabet, Inc (Class C) | 9,205 | |||||
384 | * | Amber Road, Inc | 4 | |||||
5,832 | Amdocs Ltd | 340 | ||||||
1,091 | American Software, Inc (Class A) | 11 | ||||||
1,936 | * | Angie’s List, Inc | 16 | |||||
3,431 | * | Ansys, Inc | 317 | |||||
244 | *,e | Appfolio, Inc | 6 | |||||
3,399 | * | Aspen Technology, Inc | 186 | |||||
1,048 | * | Atlassian Corp plc | 25 | |||||
389 | * | Autobytel, Inc | 5 | |||||
8,550 | * | Autodesk, Inc | 633 | |||||
18,331 | Automatic Data Processing, Inc | 1,884 | ||||||
1,988 | * | Bankrate, Inc | 22 | |||||
898 | * | Barracuda Networks, Inc | 19 | |||||
3,330 | * | Bazaarvoice, Inc | 16 | |||||
521 | *,e | Benefitfocus, Inc | 15 | |||||
39
TIAA SEPARATE ACCOUNT VA-1 - Stock Index Account
SHARES | COMPANY | VALUE (000) | ||||||
880 | * | Black Knight Financial Services, Inc | $ | 33 | ||||
1,736 | Blackbaud, Inc | 111 | ||||||
2,216 | * | Blackhawk Network Holdings, Inc | 84 | |||||
331 | * | Blackline, Inc | 9 | |||||
1,604 | * | Blucora, Inc | 24 | |||||
4,719 | Booz Allen Hamilton Holding Co | 170 | ||||||
1,713 | * | Bottomline Technologies, Inc | 43 | |||||
1,972 | * | Box, Inc | 27 | |||||
1,247 | * | Brightcove, Inc | 10 | |||||
4,636 | Broadridge Financial Solutions, Inc | 307 | ||||||
1,302 | * | BroadSoft, Inc | 54 | |||||
11,733 | CA, Inc | 373 | ||||||
1,033 | * | CACI International, Inc (Class A) | 128 | |||||
12,369 | * | Cadence Design Systems, Inc | 312 | |||||
2,264 | * | Callidus Software, Inc | 38 | |||||
540 | * | Carbonite, Inc | 9 | |||||
1,869 | * | Cardtronics plc | 102 | |||||
797 | * | Care.com, Inc | 7 | |||||
437 | Cass Information Systems, Inc | 32 | ||||||
6,061 | CDK Global, Inc | 362 | ||||||
921 | * | ChannelAdvisor Corp | 13 | |||||
1,034 | * | Cimpress NV | 95 | |||||
6,229 | * | Citrix Systems, Inc | 556 | |||||
24,134 | * | Cognizant Technology Solutions Corp (Class A) | 1,352 | |||||
1,101 | * | CommerceHub, Inc | 17 | |||||
550 | * | CommerceHub, Inc (Series A) | 8 | |||||
1,305 | * | Commvault Systems, Inc | 67 | |||||
5,517 | Computer Sciences Corp | 328 | ||||||
2,024 | * | comScore, Inc | 64 | |||||
3,726 | Convergys Corp | 92 | ||||||
2,077 | * | Cornerstone OnDemand, Inc | 88 | |||||
1,279 | * | CoStar Group, Inc | 241 | |||||
290 | * | Coupa Software, Inc | 7 | |||||
1,464 | CSG Systems International, Inc | 71 | ||||||
6,785 | CSRA, Inc | 216 | ||||||
708 | * | Datalink Corp | 8 | |||||
8,803 | * | Dell Technologies, Inc-VMware Inc | 484 | |||||
1,843 | * | DHI Group, Inc | 12 | |||||
335 | *,e | Digimarc Corp | 10 | |||||
1,357 | DST Systems, Inc | 145 | ||||||
4,694 | EarthLink Holdings Corp | 26 | ||||||
42,660 | * | eBay, Inc | 1,267 | |||||
797 | e | Ebix, Inc | 45 | |||||
11,617 | * | Electronic Arts, Inc | 915 | |||||
1,241 | * | Ellie Mae, Inc | 104 | |||||
2,483 | *,e | Endurance International Group Holdings, Inc | 23 | |||||
1,037 | * | EnerNOC, Inc | 6 | |||||
1,657 | * | Envestnet, Inc | 58 | |||||
1,840 | * | EPAM Systems, Inc | 118 | |||||
2,094 | * | Euronet Worldwide, Inc | 152 | |||||
292 | *,e | Everbridge, Inc | 5 | |||||
2,796 | EVERTEC, Inc | 50 | ||||||
544 | * | EXA Corp | 8 | |||||
1,092 | * | ExlService Holdings, Inc | 55 | |||||
90,237 | * | Facebook, Inc | 10,382 | |||||
1,150 | Fair Isaac Corp | 137 | ||||||
13,017 | Fidelity National Information Services, Inc | 985 | ||||||
6,281 | * | FireEye, Inc | 75 | |||||
3,306 | * | First American Corp | 122 | |||||
12,638 | * | First Data Corp | 179 | |||||
8,876 | * | Fiserv, Inc | 943 | |||||
1,340 | * | Five9, Inc | 19 | |||||
3,652 | * | FleetCor Technologies, Inc | 517 | |||||
514 | Forrester Research, Inc | 22 | ||||||
40
TIAA SEPARATE ACCOUNT VA-1 - Stock Index Account
SHARES | COMPANY | VALUE (000) | ||||||
6,035 | * | Fortinet, Inc | $ | 182 | ||||
3,206 | * | Gartner, Inc | 324 | |||||
6,383 | * | Genpact Ltd | 155 | |||||
1,325 | * | Gigamon, Inc | 60 | |||||
6,099 | Global Payments, Inc | 423 | ||||||
315 | * | Global Sources Ltd | 3 | |||||
1,240 | *,e | Globant S.A. | 41 | |||||
5,108 | *,e | Glu Mobile, Inc | 10 | |||||
1,933 | * | GoDaddy, Inc | 68 | |||||
2,479 | *,e | Gogo, Inc | 23 | |||||
3,325 | * | GrubHub, Inc | 125 | |||||
1,039 | * | GTT Communications, Inc | 30 | |||||
680 | * | Guidance Software, Inc | 5 | |||||
2,990 | * | Guidewire Software, Inc | 148 | |||||
1,077 | Hackett Group, Inc | 19 | ||||||
1,639 | * | Hortonworks, Inc | 14 | |||||
1,189 | * | HubSpot, Inc | 56 | |||||
2,910 | * | IAC/InterActiveCorp | 189 | |||||
1,120 | * | Imperva, Inc | 43 | |||||
1,377 | * | Information Services Group, Inc | 5 | |||||
445 | * | Instructure, Inc | 9 | |||||
35,343 | International Business Machines Corp | 5,867 | ||||||
1,633 | * | Intralinks Holdings, Inc | 22 | |||||
9,726 | Intuit, Inc | 1,115 | ||||||
1,737 | j2 Global, Inc | 142 | ||||||
3,038 | Jack Henry & Associates, Inc | 270 | ||||||
1,823 | * | Jive Software, Inc | 8 | |||||
5,355 | Leidos Holdings, Inc | 274 | ||||||
3,363 | * | Limelight Networks, Inc | 8 | |||||
3,304 | * | Lionbridge Technologies | 19 | |||||
1,143 | * | Liquidity Services, Inc | 11 | |||||
2,686 | * | Liveperson, Inc | 20 | |||||
1,024 | e | LogMeIn, Inc | 99 | |||||
2,780 | * | Manhattan Associates, Inc | 147 | |||||
1,025 | Mantech International Corp (Class A) | 43 | ||||||
1,311 | * | Marchex, Inc (Class B) | 3 | |||||
38,817 | MasterCard, Inc (Class A) | 4,008 | ||||||
1,373 | *,e | Match Group, Inc | 23 | |||||
2,445 | MAXIMUS, Inc | 136 | ||||||
1,521 | * | MeetMe, Inc | 8 | |||||
4,411 | Mentor Graphics Corp | 163 | ||||||
304,576 | Microsoft Corp | 18,926 | ||||||
391 | * | MicroStrategy, Inc (Class A) | 77 | |||||
613 | *,e | MINDBODY, Inc | 13 | |||||
1,253 | *,e | Mitek Systems, Inc | 8 | |||||
1,693 | * | MobileIron, Inc | 6 | |||||
844 | * | Model N, Inc | 7 | |||||
1,065 | * | MoneyGram International, Inc | 13 | |||||
1,800 | Monotype Imaging Holdings, Inc | 36 | ||||||
216 | NCI, Inc (Class A) | 3 | ||||||
2,229 | * | NeuStar, Inc (Class A) | 74 | |||||
909 | * | New Relic, Inc | 26 | |||||
2,596 | NIC, Inc | 62 | ||||||
9,231 | * | Nuance Communications, Inc | 138 | |||||
599 | * | Numerex Corp | 4 | |||||
556 | *,e | Nutanix, Inc | 15 | |||||
118,806 | Oracle Corp | 4,568 | ||||||
9,063 | *,e | Pandora Media, Inc | 118 | |||||
444 | * | Park City Group, Inc | 6 | |||||
12,790 | Paychex, Inc | 779 | ||||||
1,813 | * | Paycom Software, Inc | 82 | |||||
880 | * | Paylocity Holding Corp | 26 | |||||
45,415 | * | PayPal Holdings, Inc | 1,793 | |||||
1,584 | Pegasystems, Inc | 57 | ||||||
41
TIAA SEPARATE ACCOUNT VA-1 - Stock Index Account
SHARES | COMPANY | VALUE (000) | ||||||
1,536 | * | Perficient, Inc | $ | 27 | ||||
496 | * | PFSweb, Inc | 4 | |||||
1,710 | * | Planet Payment, Inc | 7 | |||||
2,115 | Progress Software Corp | 68 | ||||||
1,685 | * | Proofpoint, Inc | 119 | |||||
1,099 | * | PROS Holdings, Inc | 24 | |||||
4,427 | * | PTC, Inc | 205 | |||||
1,059 | * | Q2 Holdings, Inc | 31 | |||||
400 | QAD, Inc (Class A) | 12 | ||||||
1,041 | * | Qualys, Inc | 33 | |||||
1,192 | * | QuinStreet, Inc | 4 | |||||
2,538 | * | Quotient Technology, Inc | 27 | |||||
809 | * | Rapid7, Inc | 10 | |||||
1,085 | * | RealNetworks, Inc | 5 | |||||
2,115 | * | RealPage, Inc | 63 | |||||
7,233 | * | Red Hat, Inc | 504 | |||||
393 | Reis, Inc | 9 | ||||||
1,375 | * | RetailMeNot, Inc | 13 | |||||
390 | * | Rightside Group Ltd | 3 | |||||
2,430 | * | RingCentral, Inc | 50 | |||||
750 | * | Rosetta Stone, Inc | 7 | |||||
1,562 | * | Rubicon Project, Inc | 12 | |||||
8,252 | Sabre Corp | 206 | ||||||
25,723 | * | salesforce.com, Inc | 1,761 | |||||
594 | Sapiens International Corp NV | 9 | ||||||
1,738 | Science Applications International Corp | 147 | ||||||
257 | * | SecureWorks Corp | 3 | |||||
6,319 | * | ServiceNow, Inc | 470 | |||||
2,827 | * | ServiceSource International LLC | 16 | |||||
831 | * | Shutterstock, Inc | 40 | |||||
1,525 | * | Silver Spring Networks, Inc | 20 | |||||
5,430 | * | Splunk, Inc | 278 | |||||
690 | * | SPS Commerce, Inc | 48 | |||||
2,138 | * | Square, Inc | 29 | |||||
5,992 | SS&C Technologies Holdings, Inc | 171 | ||||||
661 | * | Stamps.com, Inc | 76 | |||||
1,663 | * | Sykes Enterprises, Inc | 48 | |||||
24,561 | Symantec Corp | 587 | ||||||
1,690 | * | Synchronoss Technologies, Inc | 65 | |||||
6,137 | * | Synopsys, Inc | 361 | |||||
1,329 | Syntel, Inc | 26 | ||||||
2,282 | * | Tableau Software, Inc | 96 | |||||
3,433 | * | Take-Two Interactive Software, Inc | 169 | |||||
1,464 | * | Tangoe, Inc | 12 | |||||
708 | * | TechTarget, Inc | 6 | |||||
834 | * | TeleNav, Inc | 6 | |||||
730 | TeleTech Holdings, Inc | 22 | ||||||
5,345 | * | Teradata Corp | 145 | |||||
4,964 | * | TiVo Corp | 104 | |||||
6,571 | Total System Services, Inc | 322 | ||||||
200 | *,e | Trade Desk, Inc | 6 | |||||
4,455 | Travelport Worldwide Ltd | 63 | ||||||
2,080 | *,e | TrueCar, Inc | 26 | |||||
1,137 | *,e | Twilio, Inc | 33 | |||||
25,252 | * | Twitter, Inc | 412 | |||||
1,273 | * | Tyler Technologies, Inc | 182 | |||||
1,115 | * | Ultimate Software Group, Inc | 203 | |||||
2,160 | *,e | Unisys Corp | 32 | |||||
6,404 | * | Vantiv, Inc | 382 | |||||
425 | * | Varonis Systems, Inc | 11 | |||||
1,227 | * | Vasco Data Security International | 17 | |||||
2,567 | * | Verint Systems, Inc | 91 | |||||
3,749 | *,e | VeriSign, Inc | 285 | |||||
2,063 | *,e | VirnetX Holding Corp | 5 | |||||
42
TIAA SEPARATE ACCOUNT VA-1 - Stock Index Account
SHARES | COMPANY | VALUE (000) | ||||||
1,253 | * | Virtusa Corp | $ | 31 | ||||
76,484 | Visa, Inc (Class A) | 5,967 | ||||||
3,182 | *,e | VMware, Inc (Class A) | 251 | |||||
1,457 | * | WebMD Health Corp (Class A) | 72 | |||||
1,869 | * | Website Pros, Inc | 40 | |||||
19,772 | Western Union Co | 429 | ||||||
1,599 | * | WEX, Inc | 178 | |||||
4,650 | * | Workday, Inc | 307 | |||||
912 | *,e | Workiva, Inc | 12 | |||||
929 | * | Xactly Corp | 10 | |||||
39,807 | Xerox Corp | 348 | ||||||
269 | * | XO Group, Inc | 5 | |||||
34,679 | * | Yahoo!, Inc | 1,341 | |||||
2,740 | * | Yelp, Inc | 104 | |||||
3,351 | * | Zendesk, Inc | 71 | |||||
2,077 | *,e | Zillow Group, Inc | 76 | |||||
4,246 | * | Zillow Group, Inc (Class C) | 155 | |||||
3,311 | * | Zix Corp | 16 | |||||
30,167 | * | Zynga, Inc | 78 | |||||
|
| |||||||
TOTAL SOFTWARE & SERVICES | 110,264 | |||||||
|
| |||||||
TECHNOLOGY HARDWARE & EQUIPMENT - 5.0% | ||||||||
4,409 | *,e | 3D Systems Corp | 59 | |||||
2,222 | Adtran, Inc | 50 | ||||||
932 | * | Aerohive Networks, Inc | 5 | |||||
1,059 | * | Agilysys, Inc | 11 | |||||
11,881 | Amphenol Corp (Class A) | 798 | ||||||
1,193 | * | Anixter International, Inc | 97 | |||||
220,413 | Apple, Inc | 25,528 | ||||||
654 | * | Applied Optoelectronics, Inc | 15 | |||||
1,614 | * | Arista Networks, Inc | 156 | |||||
7,489 | * | ARRIS International plc | 226 | |||||
3,591 | * | Arrow Electronics, Inc | 256 | |||||
1,363 | * | Avid Technology, Inc | 6 | |||||
5,010 | Avnet, Inc | 238 | ||||||
627 | AVX Corp | 10 | ||||||
1,306 | Badger Meter, Inc | 48 | ||||||
429 | Bel Fuse, Inc (Class B) | 13 | ||||||
1,728 | Belden CDT, Inc | 129 | ||||||
2,361 | * | Benchmark Electronics, Inc | 72 | |||||
755 | Black Box Corp | 11 | ||||||
16,191 | Brocade Communications Systems, Inc | 202 | ||||||
1,369 | * | CalAmp Corp | 20 | |||||
1,907 | * | Calix, Inc | 15 | |||||
6,215 | CDW Corp | 324 | ||||||
5,590 | * | Ciena Corp | 136 | |||||
202,101 | Cisco Systems, Inc | 6,108 | ||||||
522 | *,e | Clearfield, Inc | 11 | |||||
3,203 | Cognex Corp | 204 | ||||||
1,000 | * | Coherent, Inc | 137 | |||||
4,943 | * | CommScope Holding Co, Inc | 184 | |||||
784 | Comtech Telecommunications Corp | 9 | ||||||
490 | * | Control4 Corp | 5 | |||||
38,526 | Corning, Inc | 935 | ||||||
1,729 | * | Cray, Inc | 36 | |||||
1,425 | CTS Corp | 32 | ||||||
1,609 | Daktronics, Inc | 17 | ||||||
2,709 | Diebold, Inc | 68 | ||||||
1,490 | * | Digi International, Inc | 20 | |||||
2,076 | Dolby Laboratories, Inc (Class A) | 94 | ||||||
789 | * | Eastman Kodak Co | 12 | |||||
1,847 | * | EchoStar Corp (Class A) | 95 | |||||
1,199 | * | Electro Scientific Industries, Inc | 7 | |||||
43
TIAA SEPARATE ACCOUNT VA-1 - Stock Index Account
SHARES | COMPANY | VALUE (000) | ||||||
1,985 | * | Electronics for Imaging, Inc | $ | 87 | ||||
1,103 | EMCORE Corp | 10 | ||||||
259 | * | ePlus, Inc | 30 | |||||
4,537 | * | Extreme Networks, Inc | 23 | |||||
2,618 | * | F5 Networks, Inc | 379 | |||||
1,440 | * | Fabrinet | 58 | |||||
739 | * | FARO Technologies, Inc | 27 | |||||
4,415 | * | Finisar Corp | 134 | |||||
3,889 | *,e | Fitbit, Inc | 28 | |||||
5,222 | Flir Systems, Inc | 189 | ||||||
3,947 | * | Harmonic, Inc | 20 | |||||
4,886 | Harris Corp | 501 | ||||||
69,471 | Hewlett Packard Enterprise Co | 1,608 | ||||||
68,947 | HP, Inc | 1,023 | ||||||
2,439 | * | II-VI, Inc | 72 | |||||
1,305 | * | Immersion Corp | 14 | |||||
5,792 | * | Infinera Corp | 49 | |||||
1,504 | * | Insight Enterprises, Inc | 61 | |||||
1,431 | InterDigital, Inc | 131 | ||||||
3,133 | * | InvenSense, Inc | 40 | |||||
1,459 | * | IPG Photonics Corp | 144 | |||||
1,461 | * | Itron, Inc | 92 | |||||
2,593 | * | Ixia | 42 | |||||
7,308 | Jabil Circuit, Inc | 173 | ||||||
14,858 | Juniper Networks, Inc | 420 | ||||||
6,856 | * | Keysight Technologies, Inc | 251 | |||||
1,302 | * | Kimball Electronics, Inc | 24 | |||||
3,773 | * | Knowles Corp | 63 | |||||
758 | * | KVH Industries, Inc | 9 | |||||
911 | Littelfuse, Inc | 138 | ||||||
2,081 | * | Lumentum Holdings, Inc | 80 | |||||
1,366 | *,e | Maxwell Technologies, Inc | 7 | |||||
126 | Mesa Laboratories, Inc | 15 | ||||||
1,501 | Methode Electronics, Inc | 62 | ||||||
6,974 | Motorola, Inc | 578 | ||||||
632 | MTS Systems Corp | 36 | ||||||
4,015 | National Instruments Corp | 124 | ||||||
4,843 | * | NCR Corp | 196 | |||||
11,609 | NetApp, Inc | 409 | ||||||
1,274 | * | Netgear, Inc | 69 | |||||
3,375 | * | Netscout Systems, Inc | 106 | |||||
2,556 | * | Nimble Storage, Inc | 20 | |||||
1,328 | * | Novanta, Inc | 28 | |||||
4,246 | * | Oclaro, Inc | 38 | |||||
494 | * | OSI Systems, Inc | 38 | |||||
3,476 | * | Palo Alto Networks, Inc | 435 | |||||
929 | Park Electrochemical Corp | 17 | ||||||
430 | PC Connection, Inc | 12 | ||||||
1,367 | Plantronics, Inc | 75 | ||||||
1,413 | * | Plexus Corp | 76 | |||||
2,483 | * | Pure Storage, Inc | 28 | |||||
1,483 | * | Radisys Corp | 7 | |||||
790 | * | Rogers Corp | 61 | |||||
2,376 | * | Sanmina Corp | 87 | |||||
1,187 | * | Scansource, Inc | 48 | |||||
2,605 | * | ShoreTel, Inc | 19 | |||||
216 | Silicom Ltd | 9 | ||||||
2,205 | * | Sonus Networks, Inc | 14 | |||||
2,178 | * | Stratasys Ltd | 36 | |||||
1,554 | * | Super Micro Computer, Inc | 44 | |||||
1,279 | * | Synaptics, Inc | 69 | |||||
1,198 | SYNNEX Corp | 145 | ||||||
461 | Systemax, Inc | 4 | ||||||
1,442 | * | Tech Data Corp | 122 | |||||
44
TIAA SEPARATE ACCOUNT VA-1 - Stock Index Account
SHARES | COMPANY | VALUE (000) | ||||||
9,911 | * | Trimble Navigation Ltd | $ | 299 | ||||
2,698 | * | TTM Technologies, Inc | 37 | |||||
1,073 | * | Ubiquiti Networks, Inc | 62 | |||||
1,692 | * | Universal Display Corp | 95 | |||||
1,586 | *,e | USA Technologies, Inc | 7 | |||||
4,800 | * | VeriFone Systems, Inc | 85 | |||||
1,815 | * | Viasat, Inc | 120 | |||||
9,794 | * | Viavi Solutions, Inc | 80 | |||||
5,632 | Vishay Intertechnology, Inc | 91 | ||||||
654 | * | Vishay Precision Group, Inc | 12 | |||||
11,294 | Western Digital Corp | 767 | ||||||
2,122 | * | Zebra Technologies Corp (Class A) | 182 | |||||
|
| |||||||
TOTAL TECHNOLOGY HARDWARE & EQUIPMENT | 47,190 | |||||||
|
| |||||||
TELECOMMUNICATION SERVICES - 2.4% | ||||||||
3,853 | * | 8x8, Inc | 55 | |||||
247,438 | AT&T, Inc | 10,523 | ||||||
244 | ATN International, Inc | 20 | ||||||
1,565 | * | Boingo Wireless, Inc | 19 | |||||
21,624 | CenturyTel, Inc | 514 | ||||||
1,724 | * | Cincinnati Bell, Inc | 39 | |||||
1,955 | Cogent Communications Group, Inc | 81 | ||||||
2,274 | Consolidated Communications Holdings, Inc | 61 | ||||||
1,092 | * | Fairpoint Communications, Inc | 20 | |||||
48,411 | e | Frontier Communications Corp | 164 | |||||
1,464 | * | General Communication, Inc (Class A) | 29 | |||||
3,253 | *,e | Globalstar, Inc | 5 | |||||
460 | * | Hawaiian Telcom Holdco, Inc | 11 | |||||
609 | IDT Corp (Class B) | 11 | ||||||
1,405 | Inteliquent, Inc | 32 | ||||||
2,990 | *,e | Iridium Communications, Inc | 29 | |||||
11,694 | * | Level 3 Communications, Inc | 659 | |||||
757 | * | Lumos Networks Corp | 12 | |||||
1,262 | *,e | NII Holdings, Inc | 3 | |||||
2,552 | * | Orbcomm, Inc | 21 | |||||
410 | *,e | pdvWireless, Inc | 9 | |||||
5,006 | * | SBA Communications Corp (Class A) | 517 | |||||
1,910 | Shenandoah Telecom Co | 52 | ||||||
859 | Spok Holdings, Inc | 18 | ||||||
31,717 | * | Sprint Corp | 267 | |||||
384 | *,e | Straight Path Communications, Inc | 13 | |||||
3,834 | Telephone & Data Systems, Inc | 111 | ||||||
11,407 | * | T-Mobile US, Inc | 656 | |||||
580 | * | US Cellular Corp | 25 | |||||
164,117 | Verizon Communications, Inc | 8,761 | ||||||
7,849 | * | Vonage Holdings Corp | 54 | |||||
3,984 | e | Windstream Holdings, Inc | 29 | |||||
6,062 | * | Zayo Group Holdings, Inc | 199 | |||||
|
| |||||||
TOTAL TELECOMMUNICATION SERVICES | 23,019 | |||||||
|
| |||||||
TRANSPORTATION - 2.2% | ||||||||
2,138 | * | Air Transport Services Group, Inc | 34 | |||||
4,661 | Alaska Air Group, Inc | 414 | ||||||
391 | Allegiant Travel Co | 65 | ||||||
227 | Amerco, Inc | 84 | ||||||
21,610 | American Airlines Group, Inc | 1,009 | ||||||
1,131 | Arkansas Best Corp | 31 | ||||||
1,047 | * | Atlas Air Worldwide Holdings, Inc | 55 | |||||
3,471 | * | Avis Budget Group, Inc | 127 | |||||
988 | e | Celadon Group, Inc | 7 | |||||
5,697 | CH Robinson Worldwide, Inc | 417 | ||||||
1,178 | Copa Holdings S.A. (Class A) | 107 | ||||||
1,032 | Costamare, Inc | 6 | ||||||
45
TIAA SEPARATE ACCOUNT VA-1 - Stock Index Account
SHARES | COMPANY | VALUE (000) | ||||||
452 | * | Covenant Transportation Group, Inc | $ | 9 | ||||
38,511 | CSX Corp | 1,384 | ||||||
31,325 | Delta Air Lines, Inc | 1,541 | ||||||
1,254 | * | Echo Global Logistics, Inc | 31 | |||||
7,177 | Expeditors International of Washington, Inc | 380 | ||||||
10,037 | FedEx Corp | 1,869 | ||||||
944 | Forward Air Corp | 45 | ||||||
2,296 | * | Genesee & Wyoming, Inc (Class A) | 159 | |||||
1,777 | * | Hawaiian Holdings, Inc | 101 | |||||
2,244 | Heartland Express, Inc | 46 | ||||||
2,943 | * | Hertz Global Holdings, Inc | 63 | |||||
1,570 | * | Hub Group, Inc (Class A) | 69 | |||||
3,516 | J.B. Hunt Transport Services, Inc | 341 | ||||||
12,159 | * | JetBlue Airways Corp | 273 | |||||
4,468 | Kansas City Southern Industries, Inc | 379 | ||||||
2,204 | * | Kirby Corp | 147 | |||||
2,760 | Knight Transportation, Inc | 91 | ||||||
1,742 | Landstar System, Inc | 149 | ||||||
2,913 | Macquarie Infrastructure Co LLC | 238 | ||||||
110 | Marten Transport Ltd | 3 | ||||||
1,786 | Matson, Inc | 63 | ||||||
11,825 | Norfolk Southern Corp | 1,278 | ||||||
2,655 | * | Old Dominion Freight Line | 228 | |||||
99 | * | PAM Transportation Services, Inc | 3 | |||||
421 | Park-Ohio Holdings Corp | 18 | ||||||
759 | * | Radiant Logistics, Inc | 3 | |||||
1,220 | * | Roadrunner Transportation Services Holdings, Inc | 13 | |||||
2,221 | Ryder System, Inc | 165 | ||||||
1,140 | * | Saia, Inc | 50 | |||||
2,180 | * | Scorpio Bulkers, Inc | 11 | |||||
2,080 | Skywest, Inc | 76 | ||||||
26,013 | Southwest Airlines Co | 1,296 | ||||||
3,015 | * | Spirit Airlines, Inc | 174 | |||||
2,655 | *,e | Swift Transportation Co, Inc | 65 | |||||
33,920 | Union Pacific Corp | 3,517 | ||||||
12,814 | * | United Continental Holdings, Inc | 934 | |||||
27,802 | United Parcel Service, Inc (Class B) | 3,187 | ||||||
200 | Universal Truckload Services, Inc | 3 | ||||||
407 | * | USA Truck, Inc | 3 | |||||
1,875 | Werner Enterprises, Inc | 50 | ||||||
2,328 | * | Wesco Aircraft Holdings, Inc | 35 | |||||
3,629 | * | XPO Logistics, Inc | 157 | |||||
1,384 | * | YRC Worldwide, Inc | 18 | |||||
|
| |||||||
TOTAL TRANSPORTATION | 21,021 | |||||||
|
| |||||||
UTILITIES - 3.1% | ||||||||
27,308 | AES Corp | 317 | ||||||
2,057 | Allete, Inc | 132 | ||||||
9,155 | Alliant Energy Corp | 347 | ||||||
9,746 | Ameren Corp | 511 | ||||||
19,766 | American Electric Power Co, Inc | 1,244 | ||||||
1,493 | American States Water Co | 68 | ||||||
7,124 | American Water Works Co, Inc | 516 | ||||||
6,956 | Aqua America, Inc | 209 | ||||||
366 | Artesian Resources Corp | 12 | ||||||
5,498 | * | Atlantic Power Corp | 14 | |||||
2,435 | Atlantica Yield plc | 47 | ||||||
3,941 | Atmos Energy Corp | 292 | ||||||
2,315 | Avangrid, Inc | 88 | ||||||
2,597 | Avista Corp | 104 | ||||||
2,123 | Black Hills Corp | 130 | ||||||
2,026 | California Water Service Group | 69 | ||||||
14,721 | * | Calpine Corp | 168 | |||||
46
TIAA SEPARATE ACCOUNT VA-1 - Stock Index Account
SHARES | COMPANY | VALUE (000) | ||||||
18,179 | Centerpoint Energy, Inc | $ | 448 | |||||
670 | Chesapeake Utilities Corp | 45 | ||||||
11,263 | CMS Energy Corp | 469 | ||||||
518 | Connecticut Water Service, Inc | 29 | ||||||
12,284 | Consolidated Edison, Inc | 905 | ||||||
626 | Consolidated Water Co, Inc | 7 | ||||||
275 | Delta Natural Gas Co, Inc | 8 | ||||||
24,655 | Dominion Resources, Inc | 1,888 | ||||||
7,200 | DTE Energy Co | 709 | ||||||
27,710 | Duke Energy Corp | 2,151 | ||||||
5,091 | * | Dynegy, Inc | 43 | |||||
12,645 | Edison International | 910 | ||||||
1,646 | El Paso Electric Co | 77 | ||||||
1,914 | Empire District Electric Co | 65 | ||||||
7,172 | Entergy Corp | 527 | ||||||
12,788 | Eversource Energy | 706 | ||||||
35,732 | Exelon Corp | 1,268 | ||||||
17,014 | FirstEnergy Corp | 527 | ||||||
535 | Genie Energy Ltd | 3 | ||||||
8,417 | Great Plains Energy, Inc | 230 | ||||||
4,472 | Hawaiian Electric Industries, Inc | 148 | ||||||
1,914 | Idacorp, Inc | 154 | ||||||
8,034 | MDU Resources Group, Inc | 231 | ||||||
1,437 | MGE Energy, Inc | 94 | ||||||
644 | Middlesex Water Co | 28 | ||||||
3,042 | National Fuel Gas Co | 172 | ||||||
3,600 | New Jersey Resources Corp | 128 | ||||||
18,521 | NextEra Energy, Inc | 2,213 | ||||||
13,439 | NiSource, Inc | 298 | ||||||
1,124 | Northwest Natural Gas Co | 67 | ||||||
1,790 | NorthWestern Corp | 102 | ||||||
13,378 | NRG Energy, Inc | 164 | ||||||
1,290 | NRG Yield, Inc (Class A) | 20 | ||||||
2,626 | NRG Yield, Inc (Class C) | 42 | ||||||
8,254 | OGE Energy Corp | 276 | ||||||
2,141 | ONE Gas, Inc | 137 | ||||||
1,582 | Ormat Technologies, Inc | 85 | ||||||
1,620 | Otter Tail Corp | 66 | ||||||
2,385 | Pattern Energy Group, Inc | 45 | ||||||
19,976 | PG&E Corp | 1,214 | ||||||
4,420 | Pinnacle West Capital Corp | 345 | ||||||
3,355 | PNM Resources, Inc | 115 | ||||||
3,322 | Portland General Electric Co | 144 | ||||||
27,078 | PPL Corp | 922 | ||||||
20,355 | Public Service Enterprise Group, Inc | 893 | ||||||
5,186 | SCANA Corp | 380 | ||||||
10,000 | Sempra Energy | 1,006 | ||||||
678 | SJW Corp | 38 | ||||||
2,886 | South Jersey Industries, Inc | 97 | ||||||
37,798 | Southern Co | 1,859 | ||||||
1,975 | Southwest Gas Corp | 151 | ||||||
123 | e | Spark Energy, Inc | 4 | |||||
1,831 | Spire, Inc | 118 | ||||||
3,671 | TerraForm Global, Inc | 15 | ||||||
3,549 | * | TerraForm Power, Inc | 45 | |||||
7,127 | UGI Corp | 328 | ||||||
114 | Unitil Corp | 5 | ||||||
3,477 | Vectren Corp | 181 | ||||||
876 | *,e | Vivint Solar, Inc | 2 | |||||
12,603 | WEC Energy Group, Inc | 739 | ||||||
5,936 | Westar Energy, Inc | 335 | ||||||
2,078 | WGL Holdings, Inc | 159 | ||||||
20,150 | Xcel Energy, Inc | 820 | ||||||
47
TIAA SEPARATE ACCOUNT VA-1 - Stock Index Account
SHARES | COMPANY | VALUE (000) | ||||||
23 | York Water Co | $ | 1 | |||||
|
| |||||||
TOTAL UTILITIES | 29,669 | |||||||
|
| |||||||
TOTAL COMMON STOCKS | ||||||||
(Cost $448,809) | 947,573 | |||||||
|
| |||||||
RIGHTS / WARRANTS - 0.0% | ||||||||
DIVERSIFIED FINANCIALS - 0.0% | ||||||||
92 | m | Emergent Capital, Inc | 0 | ^ | ||||
|
| |||||||
TOTAL DIVERSIFIED FINANCIALS | 0 | ^ | ||||||
|
| |||||||
PHARMACEUTICALS, BIOTECHNOLOGY & LIFE SCIENCES - 0.0% | ||||||||
643 | m | Forest Laboratories, Inc CVR | 1 | |||||
244 | m | Omthera Pharmaceuticals, Inc | 0 | ^ | ||||
1,733 | m | Trius Therapeutics, Inc | 0 | ^ | ||||
|
| |||||||
TOTAL PHARMACEUTICALS, BIOTECHNOLOGY & LIFE SCIENCES | 1 | |||||||
|
| |||||||
SOFTWARE & SERVICES - 0.0% | ||||||||
1,221 | m | Gerber Scientific, Inc | 0 | ^ | ||||
|
| |||||||
TOTAL SOFTWARE & SERVICES | 0 | ^ | ||||||
|
| |||||||
TELECOMMUNICATION SERVICES - 0.0% | ||||||||
2,267 | m | Leap Wireless International, Inc | 6 | |||||
|
| |||||||
TOTAL TELECOMMUNICATION SERVICES | 6 | |||||||
|
| |||||||
TOTAL RIGHTS / WARRANTS | ||||||||
(Cost $6) | 7 | |||||||
|
| |||||||
PRINCIPAL | ISSUER | Rate | Maturity Date | |||||||||||||||
SHORT-TERM INVESTMENTS - 1.5% | ||||||||||||||||||
GOVERNMENT AGENCY DEBT - 0.3% | ||||||||||||||||||
| Federal Home Loan Bank (FHLB) | ||||||||||||||||||
$2,900,000 | FHLB | 0.350 | % | 01/04/13 | 2,900 | |||||||||||||
|
| |||||||||||||||||
| TOTAL GOVERNMENT AGENCY DEBT | 2,900 | |||||||||||||||||
|
| |||||||||||||||||
48
TIAA SEPARATE ACCOUNT VA-1 - Stock Index Account
SHARES | COMPANY | VALUE (000) | ||||||
INVESTMENTS IN REGISTERED INVESTMENT COMPANIES - 1.2% | ||||||||
11,329,456 | c | State Street Navigator Securities Lending Government Money Market Portfolio | $ | 11,329 | ||||
|
| |||||||
TOTAL INVESTMENTS IN REGISTERED INVESTMENT COMPANIES | 11,329 | |||||||
|
| |||||||
TOTAL SHORT-TERM INVESTMENTS | ||||||||
(Cost $14,229) | 14,229 | |||||||
|
| |||||||
TOTAL INVESTMENTS - 101.0% | ||||||||
(Cost $463,044) | 961,809 | |||||||
OTHER ASSETS & LIABILITIES, NET - (1.0)% | (9,890 | ) | ||||||
|
| |||||||
NET ASSETS - 100.0% | $ | 951,919 | ||||||
|
| |||||||
Abbreviation(s):
| ||
| REIT | Real Estate Investment Trust | |
| SPDR | Standard & Poor’s Depositary Receipts | |
| * | Non-income producing | |
| ^ | Amount represents less than $1,000. | |
| c | Investments made with cash collateral received from securities on loan. | |
| d | All or a portion of these securities have been segregated to cover margin requirements on open futures contracts. | |
| e | All or a portion of these securities are out on loan. The aggregate value of securities on loan is $10,943,000. | |
| m | Indicates a security that has been deemed illiquid. | |
| Cost amounts are in thousands. |
49
Report of Independent Registered Public Accounting Firm
To the Management Committee and Contract owners of the TIAA Separate Account VA-1:
In our opinion, the accompanying statement of assets and liabilities, including the summary portfolio of investments, and the related statements of operations and of changes in net assets and the financial highlights (included in Item 1 of this Form N-CSR) and the schedule of investments (included in Item 6 of this Form N-CSR) present fairly, in all material respects, the financial position of Stock Index Account of the TIAA Separate Account VA-1 (hereafter referred to as the “Account”) as of December 31, 2016, the results of its operations, the changes in its net assets and the financial highlights for each of the periods presented, in conformity with accounting principles generally accepted in the United States of America. These financial statements, financial highlights and schedule of investments (hereafter referred to as “financial statements”) are the responsibility of the Account’s management. Our responsibility is to express an opinion on these financial statements based on our audits. We conducted our audits of these financial statements in accordance with the standards of the Public Company Accounting Oversight Board (United States). Those standards require that we plan and perform the audit to obtain reasonable assurance about whether the financial statements are free of material misstatement. An audit includes examining, on a test basis, evidence supporting the amounts and disclosures in the financial statements, assessing the accounting principles used and significant estimates made by management, and evaluating the overall financial statement presentation. We believe that our audits, which included confirmation of securities as of December 31, 2016 by correspondence with the custodian and brokers, provide a reasonable basis for our opinion.
/s/ PricewaterhouseCoopers LLP
Baltimore, Maryland
February 17, 2017
50
Item 7. Disclosure of Proxy Voting Policies and Procedures for Closed-End Management Investment Companies.
Not Applicable.
Item 8. Portfolio Managers of Closed-End Management Investment Companies.
Not Applicable.
Item 9. Purchases of Equity Securities by Closed-End Management Investment Company and Affiliated Purchasers.
Not Applicable.
Item 10. Submission of Matters to a Vote of Security Holders.
There were no material changes to the procedures by which shareholders may recommend nominees to the Registrant’s Management Committee.
Item 11. Controls and Procedures.
(a) An evaluation was performed within 90 days of the filing date of the report under the supervision of the Registrant’s management, including the principal executive officer and principal financial officer, of the effectiveness of the design and operation of the Registrant’s disclosure controls and procedures. Based on that evaluation, the Registrant’s management, including the principal executive officer and principal financial officer, concluded that the Registrant’s disclosure controls and procedures were effective for this annual reporting period.
(b) There were no changes in the Registrant’s internal control over financial reporting that occurred during the Registrant’s annual period covered by this report that materially affected, or are reasonably likely to materially affect, the Registrant’s internal control over financial reporting.
Item 12. Exhibits.
12(a)(1) Copy of current SOX code of ethics for Senior Financial Officers
12(a)(2)(i) Section 302 certification of the principal executive officer
12(a)(2)(ii) Section 302 certification of the principal financial officer
12(b) Section 906 certification of principal executive officer and principal financial officer
SIGNATURES
Pursuant to the requirements of the Securities Exchange Act of 1934 and the Investment Company Act of 1940, the Registrant has duly caused this report to be signed on its behalf by the undersigned, thereunto duly authorized.
| TIAA SEPARATE ACCOUNT VA-1 | ||||||
| Dated: February 17, 2017 | By: | /s/ Robert G. Leary | ||||
| Robert G. Leary | ||||||
| Principal Executive Officer and Executive | ||||||
| Vice President | ||||||
Pursuant to the requirements of the Securities Exchange Act of 1934 and the Investment Company Act of 1940, this report has been signed below by the following persons on behalf of the Registrant and in the capacities and on the dates indicated.
| Dated: February 17, 2017 | By: | /s/ Robert G. Leary | ||||
| Robert G. Leary | ||||||
| Principal Executive Officer and Executive | ||||||
| Vice President | ||||||
| (principal executive officer) | ||||||
| Dated: February 17, 2017 | By: | /s/ Glenn E. Brightman | ||||
| Glenn E. Brightman | ||||||
| Chief Financial Officer, Principal Accounting | ||||||
| Officer and Treasurer | ||||||
| (principal financial officer) | ||||||
EXHIBIT INDEX
Item 12. Exhibits.
12(a)(1) Copy of current SOX code of ethics for Senior Financial Officers
12(a)(2)(i) Section 302 certification of the principal executive officer
12(a)(2)(ii) Section 302 certification of the principal financial officer
12(b) Section 906 certification of principal executive officer and principal financial officer