united states
securities and exchange commission
washington, d.c. 20549
form n-csr
certified shareholder report of registered management
investment companies
Investment Company Act file number 811-08542
The Saratoga Advantage Trust
(Exact name of registrant as specified in charter)
1616 N. Litchfield Rd., Suite 165, Goodyear, AZ 85395
(Address of principal executive offices) (Zip code)
Stuart M Strauss, Esq. Dechert LLP
1095 Avenue of the Americas, New York, NY 10036
(Name and address of agent for service)
Registrant's telephone number, including area code: 623-266-4567
Date of fiscal year end: 8/31
Date of reporting period: 2/28/23
Item 1. Reports to Stockholders.
| |
| |
 |
| |
| |
| Class I Shares |
| |
| |
| |
| |
| |
| |
| |
| |
| |
| | SEMI-ANNUAL REPORT | |
| | As Of February 28, 2023 | |
| |
| |
| |
| |
| |
| |
| |
| |
| |
| |
| |
| |
| |
| |
| |
| |
| |
| THIS REPORT IS AUTHORIZED FOR DISTRIBUTION ONLY TO SHAREHOLDERS |
| AND TO OTHERS WHO HAVE RECEIVED A COPY OF THE PROSPECTUS. |
| |
| |
| |
| |
TABLE OF CONTENTS
| Chairman’s Letter | Page 1 |
| Investment Review | Page 6 |
| Schedules of Investments | Page 39 |
| Statements of Assets and Liabilities | Page 79 |
| Statements of Operations | Page 83 |
| Statements of Changes in Net Assets | Page 87 |
| Notes to Financials | Page 93 |
| Financial Highlights | Page 114 |
| Supplemental Information | Page 123 |
| Privacy Notice | Page 127 |
| | |
TRUSTEES AND OFFICERS
| Bruce E. Ventimiglia | Trustee, Chairman, President & CEO |
| Patrick H. McCollough | Trustee |
| Udo W. Koopmann | Trustee |
| Floyd E. Seal | Trustee |
| Stephen H. Hamrick | Trustee |
| Stephen Ventimiglia | Vice President & Secretary |
| Jonathan W. Ventimiglia | Vice President, Assistant Secretary, |
| | Treasurer & Chief Financial Officer |
| Frederick C. Teufel, Jr | Chief Compliance Officer |
| Timothy J. Burdick | Assistant Secretary |
| Richard S. Gleason | Assistant Treasurer |
| | |
| Investment Manager | Distributor |
| Saratoga Capital Management, LLC | Northern Lights Distributors, LLC |
| 12725 W. Indian School Road, Suite E-101 | 4221 N 203rd Street, Suite 100 |
| Avondale, Arizona 85392 | Elkhorn, Nebraska 68022 |
| | |
| Transfer & Shareholder Servicing Agent | Custodian |
| Ultimus Fund Solutions, LLC | BNY Mellon Corp. |
| 4221 N 203rd Street, Suite 100 | 225 Liberty Street |
| Elkhorn, Nebraska 68022 | New York, New York 10286 |
| | |
| Administrator & Fund Accounting Agent | Custody Administrator |
| Ultimus Fund Solutions, LLC | Ultimus Fund Solutions, LLC |
| 4221 N 203rd Street, Suite 100 | 4221 N 203rd Street, Suite 100 |
| Elkhorn, Nebraska 68022 | Elkhorn, Nebraska 68022 |
THE SARATOGA ADVANTAGE TRUST
Semi-Annual Report to Shareholders
April 17, 2023
Dear Shareholder:
We are pleased to provide you with this semi-annual report on the investment strategies and performance of the portfolios in the Saratoga Advantage Trust (the “Trust”). This report covers the six months from September 1, 2022 through February 28, 2023.
We believe that successful investing requires discipline and patience. Try to stay focused on your long-term investment goals. Don’t let short-term stock and bond market fluctuations or investment manias change your long-term investment strategy. The Saratoga Advantage Trust’s portfolios are managed by some of the world’s leading institutional investment advisory firms. Combining the strength of the Trust’s performance with a well-designed asset allocation plan can help you to achieve your long-term investment goals.
ECONOMIC OVERVIEW
As measured by Real Gross Domestic Product (GDP), the value of the production of goods and services in the United States grew by 2.6% during the fourth quarter of 2022, down from 3.2% during the third quarter of 2022 (all GDP growth rates discussed are seasonally adjusted annualized rates unless otherwise noted). Within the main components of GDP during the quarter, consumer spending as measured by Personal Consumption Expenditures (PCE) advanced by 1.0%, while private sector investment as measured by Gross Private Domestic Investment (GPDI) rose 4.5%, reversing course after two steeply negative quarters. Government spending, which accounts for both consumption and gross investment rose 3.8%, though average government spending growth over the past year remains under 1.0%. The quarter’s GDP print once again benefited from net exports; though export growth was negative for the quarter, imports fell even further.
Consumer spending grew during the quarter, however spending on goods continues to deteriorate with PCE Goods down each quarter of 2022. The largest component of GDP, the Services portion of PCE, has now grown for ten straight quarters, though growth trends are falling. While spending on services is a positive signal from the nation’s consumers, the decimation of Residential spending, especially in the single family home market is just the opposite. Persistently high housing costs, falling real wages, and higher interest rates continue to roil the housing market; after falling 17.8% and 27.1% in the past two quarters, Residential contraction was 25.1% in the fourth quarter. Multi-family housing spending did post strong growth during the quarter, but the vast majority of the country’s roughly 129 million housing units are single-family, which continue to face chronic supply difficulties. While spending on residential structures currently accounts for around 4.0% of GDP, investment into the country’s non-residential structures is closer to 2.6%. This smaller portion of GDP rallied last quarter, led by investment into healthcare and
manufacturing structures. Though we’re always happy to see investment into the nation’s buildings, healthcare and manufacturing spending is often resilient in the face of recessionary tides.
As we wrote in last quarter’s MIVI, the depth of economic pain we see will likely correlate with how inflation persists and how the Federal Reserve (Fed) reacts to incoming inflation data. While many may focus on inflation falling back to the Fed’s 2.0% target, we believe inflation around 4.0% should allow the economy and earnings to recover and investors to see some relief. As inflation continues to fall towards 4.0%, and under that target on the producer side, many await the Fed’s reaction to see if policymakers consider their job well done and a more neutral stance being appropriate.
Monetary Policy: The Federal Reserve continues its tapering program. The Fed balance sheet topped out at roughly $8.96 trillion in April 2022, and has dropped to $8.71t at the end of March 2023. Notably, the Fed’s balance sheet grew by nearly $400 billion in March, as the collapse of SVB drove banks to take advantage of Fed liquidity programs. The Fed was quick to point out that such activity did not represent a change in their continued tapering operation, though it is a reminder of just how complex the job ahead of the Fed is as they try to shrink their massive balance sheet.
The Fed remains persistent in squeezing the country’s money supply. As of February, the monetary base fell 11.9% y-o-y, down from a cycle high of 57.7%. Within the monetary base, we see the Fed is manipulating policy considerably via currency in circulation (CiC). CiC hit a pandemic-high growth rate of 17% y-o-y in 2020; that figure has now dropped to 2.3% y-o-y, far below its modern historical y-o-y growth rate of roughly 7.0%. M2, one of the most widely used monetary figures for measuring liquidity in the economy, is also down massively from its cycle-high 22% y-o-y growth in February 2021 to -2.5% y-o-y currently, also well below its modern historical growth rate of 7.1% y-o-y; it is extremely unusual to see M2 negative over any significant period of time.
Tight monetary policy generally impacts the economy more quickly than loose monetary policy, and the Fed seems to be having success in pressuring the economy via their monetary policy tools.
Interest Rates: One-year treasuries rose rapidly in 2022, then stalled a bit during the winter months to close the year near 4.7%; after some volatile trading in February and March, they look range-bound near that same level. We generally see this treasury issue move up when inflation is high and the market is anticipating the Fed will move their target rates higher. The bond market seems to be signaling that it believes the Fed has done its job and may not need to continue raising rates in its fight against inflation. Out further on the yield curve, we generally find rates are less correlated to inflation and more representative of the bond market’s assumption of future growth. After posting strong gains in 2022, three-, five-, and ten-year treasury rates have fallen well off of their highs. This has resulted in the yield curve inverting towards the shorter end of the curve, after having done so at the long end in mid-2022.
Regarding long-term corporate bonds, the quality spread as measured by Moody’s-rated Baa bonds minus Aaa bonds continues moving up. The quality spread has historically been a good predictor of confidence in the corporate bond market and helps us establish a baseline expectation for corporate earnings. The quality spread approached a long-term low of 0.65 during June 2021, but has steadily moved up since, reaching 1.16 in December 2022. The spread has started to normalize, falling back to 1.03 in March. After a period of suggesting corporate earnings might begin to stall,
and seeing that dynamic play out in earnings revisions, a spread at current levels is closer to neutral as an indicator for future corporate earnings.
��
Equity Valuations: As of March 31, 2023, the S&P 500 index was at 4,109. Our proprietary valuation work suggests a fair value for the S&P 500 around 3,780. Earnings growth projections are facing adjustments downward. We believe PE levels are likely to stay suppressed below their modern historical (1990 to present) mean of roughly 24.9 as inflation and intermediate-to-long-term interest rates are presenting a headwind to valuations. Earnings are generally a leading indicator, peaking slightly before recessions. We wrote previously that earnings had potentially put in a near-term peak, and we’ve now seen three consecutive negative quarters along with continued downgrades in estimates.
To create a range of equity market outcomes, we use a valuation tool which we refer to as our Proper PE Valuation™ tool. Among other things, this analysis provides us with a set of ranges above and below which we consider the S&P 500 overvalued or undervalued, respectively. Our proprietary valuation work currently sets an appropriate S&P 500 PE from 20.5 to 22.5. This produces a fair value range of 3,824 to 4,197 over the next six months. Earnings growth is soft, however inflation and long-term rates dropping has once again slightly bumped up PE projections from our last report. The current levels and trends of the underlying data we analyze, including our technical work, indicates that we are likely to stay in or near fair-value range for the near-term; last quarter we wrote there is likely more risk to our PE target on the downside than the upside, however that evaluation is changing as inflation cools rapidly.
Inflation: Our past few inflation reports have focused on wages, which have historically played a large roll in our inflation research, and said wage data remains instructive to us. In particular, average weekly earnings of Production and Non Supervisory employees, specifically for Goods-producing workers (Goods Wages), has been a reliable leading indicator for inflation. It is useful to think about the growth of these types of wages in comparison to the growth of inflation; we generally view these wages and others as “pushing” inflation either up or down, and expect their movements to be correlated over time, if not immediately so. In December 2020, Goods Wages had risen 7.8% y-o-y, while CPI was at just 1.3%. We would view it as untenable for these wages to stay so elevated without eventually pushing inflation higher. Of course, we know now that inflation did, in fact, eventually follow high wage growth among other causal data.
That dynamic reversed a number of quarters ago. Over the past year, Goods Wages are up just 2.7% while CPI remains near 5%. Other wage component data we track lends confirmation: Total Private Average Weekly Earnings of Production and Non Supervisory Employees is a bit higher, at 4.4%, though also meaningfully negative on a real basis, off of a high at 8%. Manufacturing average weekly hours has also put in a sustained downtrend. Once again, we find it unlikely wages and inflation will remain dislocated; current wage trends should continue to pressure inflation downward.
The producer side of the story is saying the same, with a well-under-trend 2.7% reading in March.
COMPARING THE PORTFOLIOS’ PERFORMANCE TO BENCHMARKS
When reviewing the performance of the portfolios against their benchmarks, it is important to note that the Trust is designed to help investors to implement an asset allocation strategy to meet their individual needs as well as select individual investments within each asset category among the myriad of choices available. Each Saratoga portfolio was formed to represent an asset class, and each portfolio’s institutional money manager was selected based on their ability to manage money within that class.
Therefore, the Saratoga portfolios can help investors to properly implement their asset allocation decisions and keep their investments within the risk parameters that they establish with their investment consultants. Without the intended asset class consistency of the Saratoga portfolios, even the most carefully crafted allocation strategy could be negated. Furthermore, the benchmarks do not necessarily provide precise standards against which to measure the portfolios, in that the characteristics of the benchmarks can vary widely at different points in time from the Saratoga portfolios (e.g., characteristics such as: average market capitalizations, price-to-earnings and price-to-book ratios, bond quality ratings and maturities, etc.). In addition, the benchmarks can potentially have a survivor bias built into them (i.e., the performance of only funds that are still in existence may remain part of the benchmark’s performance while funds that do not exist anymore may be removed from the benchmark’s performance).
ELECTRONIC DELIVERY AVAILABLE
This report can be delivered to you electronically. Electronic delivery can help simplify your record keeping. With electronic delivery you’ll receive an email with a link to your Saratoga Advantage Trust quarterly statement, daily confirmations and/or semi-annual and annual reports each time one is available. You have the ability to choose which items you want delivered electronically. Choose one item or all items. It’s up to you. Please call our Customer Service Department toll-free at 1-888-672-4839 for instructions on how to establish electronic delivery.
AUTOMATED ACCOUNT UPDATES
I am pleased to inform you that you can get automated updates on your investments in the Saratoga Advantage Trust 24 hours a day, everyday, by calling toll-free 1-888-672-4839. For additional information about the Trust, please call your financial advisor, visit our website at www.saratogacap.com or call 1-800-807-FUND.
Finally, following you will find specific information on the investment strategy and performance of the Trust’s portfolios. Please speak with your financial advisor if you have any questions about your investment in the Saratoga Advantage Trust or your allocation of assets among the Trust’s portfolios.
We remain dedicated to serving your investment needs.
Thank you for investing with us.
Best wishes,

Bruce E. Ventimiglia
Chairman, President and
Chief Executive Officer
Investors should consider the investment objectives, risks, charges and expenses of the Saratoga Funds carefully. This and other information about the Saratoga Funds is contained in your prospectus, which should be read carefully. To obtain an additional copy of the prospectus, please call (800) 807-FUND. Past performance is not indicative of future results. Investments in stocks, bonds and mutual funds are not guaranteed and the principal value and investment return can fluctuate. Consequently, investors may receive back less than invested.
The S&P 500 is an unmanaged, capitalization-weighted index. It is not possible to invest directly in the S&P 500.
The security holdings discussed may not be representative of the Funds’ current or future investments. Portfolio holdings are subject to change and should not be considered to be investment advice. Any statements not of a factual nature constitute opinions which are subject to change without notice. Information contained herein was obtained from recognized statistical services and other sources believed to be reliable and we therefore cannot make any representation as to its completeness or accuracy. The Funds of the Saratoga Advantage Trust are distributed by Northern Lights Distributors, LLC, member FINRA/SIPC. 6190-NLD-04282023
LARGE CAPITALIZATION VALUE PORTFOLIO
Advised by: M.D. Sass Investor Services, Inc., New York, New York
Objective: The Portfolio seeks total return consisting of capital appreciation and dividend income.
| Total Aggregate Return for the Periods Ended February 28, 2023 |
| | | Class I |
| Inception: | 9/1/94 — 2/28/23* | 7.04% |
| Ten Year: | 3/1/13 — 2/28/23* | 10.27% |
| Five Year: | 3/1/18 — 2/28/23* | 10.94% |
| One Year: | 3/1/22 — 2/28/23 | 1.84% |
| Six Months: | 9/1/22 — 2/28/23 | 5.96% |
| | |
| * | Annualized performance for periods greater than one year. |
Performance data quoted above is historical. Past performance does not guarantee future results and current performance may be lower or higher than the performance data quoted. The investment return and principal value of an investment will fluctuate, so that shares when redeemed, may be worth more or less than their original cost. For more performance numbers current to the most recent month-end please call (800) 807-FUND. The returns shown do not reflect the deduction of taxes that a shareholder would pay on fund distributions or on the redemptions of fund shares. The total operating expense ratio as stated in the fee table to the Portfolio’s prospectus dated December 28, 2022, is 1.66%.
PORTFOLIO INVESTMENT STRATEGIES AND TECHNIQUES
In determining which securities to buy, hold or sell, the Portfolio’s Adviser focuses its investment selection on finding high quality companies with compelling valuations, measurable catalysts to unlock value and above-average long -term earnings growth potential. In general, the Adviser looks for companies that have value-added product lines to help preserve pricing power, a strong history of free cash flow generation, strong balance sheets, competent management with no record of misleading shareholders, and financially sound customers. Independent research is used to produce estimates for future earnings, which are inputs into the Adviser’s proprietary valuation model. The Adviser focuses its investments where it has a differentiated view and there exists, in its view, significant price appreciation potential to its estimate of the stocks’ intrinsic value.
PORTFOLIO ADVISER COMMENTARY
The Saratoga Large Cap Value Portfolio posted solid relative performance during the period. Performance was aided by investments in the Healthcare, Communication Services, and Industrial sectors. API Group (6.51%) was the portfolio’s top performing stock, up 51%. One of the leading companies in the highly fragmented Safety Service market has raised synergy guidance for its transformational acquisition of Chubb Fire and Safety, improved free cash flow conversion and has grown organically. The company affirmed margin expansion at Chubb and has plans to de-lever the balance sheet which could lead to further multiple expansion.
The main detractors from performance were First Republic (4.54%) and East West Bancorp (4.06%). Both of these stocks were negatively affected by rapid interest rate increases along with deposit flight at various regional banks. We exited both stocks during the March 2023 selloff.
We expect a slowing economy with wide divergence in performance amongst different stocks and sectors which we believe may favor the portfolio’s value-oriented, relatively concentrated approach to stock selection.
Within the discussion above, the percentages shown next to specific securities are the percentages of the Portfolio represented by the security on 2/28/23. The securities held in the Portfolio are subject to change and any discussion of those securities should not be considered investment advice.
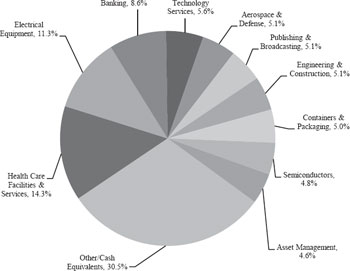
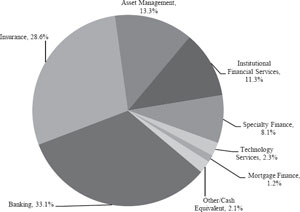
LARGE CAPITALIZATION VALUE PORTFOLIO
SIGNIFICANT AREAS OF INVESTMENT
AS A PERCENTAGE OF NET ASSETS
| Top 10 Portfolio Holdings* |
| | % of |
| Company | Net Assets |
| API Group Corporation | 6.5% |
| CACI International, Inc., Class A | 5.6% |
| Raytheon Technologies Corporation | 5.1% |
| Liberty Media Corp-Liberty Formula One - Series C | 5.1% |
| MasTec, Inc. | 5.1% |
| AmerisourceBergen Corporation | 5.0% |
| Crown Holdings, Inc. | 5.0% |
| Chemed Corporation | 4.9% |
| ON Semiconductor Corporation | 4.8% |
| Rockwell Automation, Inc. | 4.8% |
| | |
| * | Based on total net assets as of February 28, 2023. |
Excludes short-term investments.
Portfolio Composition*
LARGE CAPITALIZATION GROWTH PORTFOLIO
Advised by: Smith Group Asset Management, Dallas, Texas
Objective: The Portfolio seeks capital appreciation.
| Total Aggregate Return for the Periods Ended February 28, 2023 |
| | | Class I |
| Inception: | 9/1/94 – 2/28/23* | 8.55% |
| Ten Year: | 3/1/13 – 2/28/23* | 12.90% |
| Five Year: | 3/1/18 – 2/28/23* | 9.83% |
| One Year: | 3/1/22 – 2/28/23 | (11.31)% |
| Six Months: | 9/1/22 – 2/28/23 | (2.12)% |
| | | |
| * | Annualized performance for periods greater than one year. |
Performance data quoted above is historical. Past performance does not guarantee future results and current performance may be lower or higher than the performance data quoted. The investment return and principal value of an investment will fluctuate, so that shares when redeemed, may be worth more or less than their original cost. For more performance numbers current to the most recent month-end please call (800) 807-FUND. The returns shown do not reflect the deduction of taxes that a shareholder would pay on fund distributions or on the redemptions of fund shares. The total operating expense ratio as stated in the fee table to the Portfolio’s prospectus dated December 28, 2022, is 1.67%.
PORTFOLIO INVESTMENT STRATEGIES AND TECHNIQUES
The Portfolio’s Adviser employs quantitative and qualitative analysis that seeks to identify high quality companies that it believes have the ability to accelerate earnings growth and exceed investor expectations. The Adviser’s selection process consists of three steps. First, the Adviser reviews a series of screens utilizing the Adviser’s investment models, which are based on fundamental characteristics, designed to eliminate companies that the Adviser’s research shows have a high probability of underperformance. Factors considered when reviewing the screens include a multi-factor valuation framework, earnings quality, capital structure and financial quality. Next, securities that pass the initial screens are then evaluated to try to identify stocks with the highest probability of producing an earnings growth rate that exceeds investor expectations. This process incorporates changes in earnings expectations and earnings quality analysis. Finally, these steps produce a list of eligible companies which are subjected to analysis by the Adviser to further understand each company’s business prospects and earnings potential. The Adviser uses the results of this analysis to construct the Portfolio’s security positions.
PORTFOLIO ADVISOR COMMENTARY
The six-month period ending February 28, 2023 was an interesting period for US equities as, unlike recent history, the average stock performed significantly better than the largest names in the broad market. This was even more evident within the growth universe where the equal-weighted indexes generally trounced their cap-weighted brethren. The large cap growth sector trailed large cap value during the period; a shift likely triggered by the Federal Reserve’s all-out assault against the highest inflation experienced in the US since the early 1980’s.
The Fed raised short-term interest rates from near zero to 5% and remains committed to further rate increases to squelch inflation down from its 9.1% peak last summer to their 2.0% target range. The Fed’s actions represent the most dramatic tightening cycle since the 1980s and it appears to already be impacting the most interest rate sensitive sectors of the economy, including financials. The Fed has made it clear they will not risk a start and stop approach to fighting inflation, which means they seem fully prepared to tip the economy into recession, if that is required to quell wage and price increases. We believe market themes for 2023 are likely to remain similar to 2022 as stubbornly high inflation and sharply higher interest rates continue to compress valuations, incite fears of recession and pressure corporate profits. If the stock market is going to reverse the losses of 2022, a prompt end to the Fed’s rate hiking campaign and improvement in financial conditions is likely a key component. Every major inflationary peak since WWII has experienced a downturn in corporate profits over the 12-months following the peak. If history holds, then 2023 earnings for the S&P 500 would be expected to be at least 8% below 2022 earnings. Whether this potential earnings downturn is already priced into market valuations, or whether the downturn even comes to pass, is still very much up in the air.
For the six-month period ending February 28, 2023, the Saratoga Large Cap Growth Portfolio posted slightly positive relative performance. The best performing sectors were Financials and Information Technology while Health Care was a drag on performance. Two insurance companies, Arch Capital Group (2.14%) and Everest Re Group (2.47%) were significant contributors as was software company Splunk (2.56%) which reported successive quarters of earnings significantly better than expected and guidance that continued to portend its strength in IT operations management. Negative sentiment towards managed care companies in general hurt shares of Molina Healthcare (1.65%) while a lower growth outlook from Veeva Systems (0.00%) weighed on investors.
Within the discussion above, the percentages shown next to specific securities are the percentages of the Portfolio represented by the security on 2/28/23. The securities held in the Portfolio are subject to change and any discussion of those securities should not be considered investment advice.
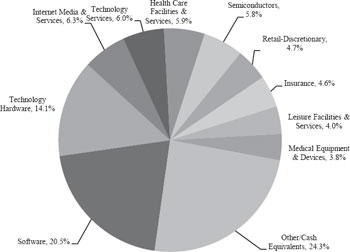
LARGE CAPITALIZATION GROWTH PORTFOLIO
SIGNIFICANT AREAS OF INVESTMENT
AS A PERCENTAGE OF NET ASSETS
| Top 10 Portfolio Holdings* |
| | % of |
| Company | Net Assets |
| Apple, Inc. | 10.5% |
| Microsoft Corporation | 8.2% |
| Tesla, Inc. | 3.3% |
| Airbnb, Inc., Class A | 2.9% |
| United Rentals, Inc. | 2.8% |
| NVIDIA Corporation | 2.8% |
| Amazon.com, Inc. | 2.6% |
| Splunk, Inc. | 2.6% |
| Synopsys, Inc. | 2.5% |
| Everest Re Group Ltd. | 2.5% |
| | |
| * | Based on total net assets as of February 28, 2023. |
Excludes short-term investments.
Portfolio Composition*
MID CAPITALIZATION PORTFOLIO
Advised by: Vaughn Nelson Investment Management, L.P., Houston, Texas
Objective: The Portfolio seeks long-term capital appreciation.
| Total Aggregate Return for the Periods Ended February 28, 2023 |
| | | Class I |
| Inception: | 1/7/03 – 2/28/23* | 8.79% |
| Ten Year: | 3/1/13 – 2/28/23* | 8.13% |
| Five Year: | 3/1/18 – 2/28/23* | 6.09% |
| One Year: | 3/1/22 – 2/28/23 | (5.26)% |
| Six Months: | 9/1/22 – 2/28/23 | 3.61% |
| | |
| * | Annualized performance for periods greater than one year. |
Performance data quoted above is historical. Past performance does not guarantee future results and current performance may be lower or higher than the performance data quoted. The investment return and principal value of an investment will fluctuate, so that shares when redeemed, may be worth more or less than their original cost. For more performance numbers current to the most recent month-end please call (800) 807-FUND. The returns shown do not reflect the deduction of taxes that a shareholder would pay on fund distributions or on the redemptions of fund shares. The total operating expense ratio as stated in the fee table to the Portfolio’s prospectus dated December 28, 2022, is 2.01%.
PORTFOLIO INVESTMENT STRATEGIES AND TECHNIQUES
The Portfolio invests in securities of companies that are believed by the Adviser to be undervalued, thereby offering above-average potential for capital appreciation. The Portfolio may also invest in equity securities of foreign companies. The Adviser invests in medium capitalization companies with a focus on total return using a bottom-up value oriented investment process. The Adviser seeks companies with the following characteristics, although not all of the companies it selects will have these attributes: (i) companies earning a positive economic margin with stable-to -improving returns; (ii) companies valued at a discount to their asset value; and (iii) companies with an attractive dividend yield and minimal basis risk. In selecting investments, the Adviser generally employs the following strategy: (i) value-driven investment philosophy that selects stocks selling at attractive values based upon business fundamentals, economic margin analysis, discounted cash flow models and historical valuation multiples. The Adviser reviews companies that it believes are out-of-favor or misunderstood; (ii) use of value-driven screens to create a research universe of companies with market capitalizations of at least $1 billion; and (iii) use of fundamental and risk analysis to construct a portfolio of securities that the Adviser believes has an attractive return potential.
PORTFOLIO ADVISOR COMMENTARY
US equity markets staged a modest rally in the fourth quarter of 2022. International equity markets generally outperformed US equity markets. The recovery in equity markets was largely driven by peaking inflationary conditions and the rapid increase in non -US interest rates relative to US interest rates, which triggered a broad-based decline in the US dollar. The 2022 bear market in equities reflects the impact of higher interest rates increasing the cost of capital, and thereby decreasing equity valuations. The next challenge for markets will be digesting declining earnings expectations for 2023. We believe the largest reduction in earnings expectations should occur during the first two quarters of 2023. A second half recovery will be contingent on the interplay between a deceleration in inflation and whether the higher interest rates lead to excessive economic and market weakness.
With sequential growth looking like it is set to slow in both Q1 and Q2 of 2023, the US earnings recession that began in Q4 2022 could potentially become a broader economic recession in the short term. Typically, banking stress develops once we are well into a recession as the ability for borrowers to service debt becomes impaired. Given the rapid increase in interest rates, regional banks are already under tremendous pressure despite credit costs remaining well below historical norms. While we believe the Federal Reserve’s interest rate hiking cycle is mainly in the rear-view mirror, we suspect we are still in the early stages of experiencing rising credit losses. The developing strains in the banking system will only enhance the lagged effects of rising interest rates, which were set to materially impair economic activity and availability of liquidity during 2023.
As a result of buys and sells and market action, the Saratoga Advantage Trust Mid Cap Portfolio is overweight Industrials, Financials, Utilities, and Materials while underweight Consumer Discretionary, Real Estate, Information Technology, Energy, Health Care, Consumer Staples, and Communication Services. During the period, the portfolio experienced positive absolute and negative relative performance. Positive relative performance came from Industrials, Information Technology, Real Estate, Consumer Staples, Materials, and Communication services while offset by underperformance in Utilities, Health Care, Energy, Consumer Discretionary, and Financials.
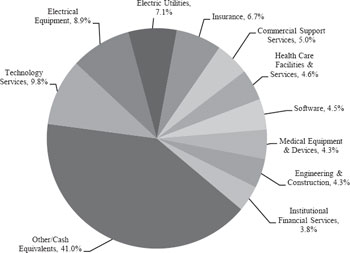
MID CAPITALIZATION PORTFOLIO
SIGNIFICANT AREAS OF INVESTMENT
AS A PERCENTAGE OF NET ASSETS
| Top 10 Portfolio Holdings* |
| | % of |
| Company | Net Assets |
| WillScot Mobile Mini Holdings Corporation | 4.3% |
| Republic Services Inc. | 3.6% |
| Nexstar Media Group Inc. | 3.2% |
| Motorola Solutions Inc. | 3.2% |
| FactSet Research Systems Inc. | 2.9% |
| Allstate Corporation (The) | 2.9% |
| MAXIMUS Inc. | 2.6% |
| AmerisourceBergen Corporation | 2.6% |
| SS&C Technologies Holdings Inc. | 2.5% |
| Nasdaq Inc. | 2.3% |
| | |
| * | Based on total net assets as of February 28, 2023. |
Excludes short-term investments.
Portfolio Composition*
SMALL CAPITALIZATION PORTFOLIO
Advised by: Zacks Investment Management, Inc., Chicago, Illinois
Objective: The Portfolio seeks maximum capital appreciation.
| Total Aggregate Return for the Periods Ended February 28, 2023 |
| | | Class I |
| Inception: | 9/1/94 – 2/28/23* | 8.45% |
| Ten Year: | 3/1/13 – 2/28/23* | 7.65% |
| Five Year: | 3/1/18 – 2/28/23* | 7.03% |
| One Year: | 3/1/22 – 2/28/23 | (8.28)% |
| Six Months: | 9/1/22 – 2/28/23 | (0.09)% |
| | | |
| * | Annualized performance for periods greater than one year. |
Performance data quoted above is historical. Past performance does not guarantee future results and current performance may be lower or higher than the performance data quoted. The investment return and principal value of an investment will fluctuate, so that shares when redeemed, may be worth more or less than their original cost. For more performance numbers current to the most recent month-end please call (800) 807-FUND. The returns shown do not reflect the deduction of taxes that a shareholder would pay on fund distributions or on the redemptions of fund shares. The total operating expense ratio as stated in the fee table to the Portfolio’s prospectus dated December 28, 2022, is 2.06%.
PORTFOLIO INVESTMENT STRATEGIES AND TECHNIQUES
In selecting securities for the Portfolio, the Adviser begins with a screening process that seeks to identify growing companies whose stocks sell at discounted price-to-earnings and price-to-cash flow multiples. The Adviser also attempts to discern situations where intrinsic asset values are not widely recognized. The Adviser favors such higher-quality companies that generate strong cash flow, provide above-average free cash flow yields and maintain sound balance sheets. Rigorous fundamental analysis, from both a quantitative and qualitative standpoint, is applied to all investment candidates. While the Adviser employs a disciplined “bottom -up” approach that attempts to identify undervalued stocks, it nonetheless is sensitive to emerging secular trends. The Adviser does not, however, rely on macroeconomic forecasts in its stock selection efforts and prefers to remain fully invested.
PORTFOLIO ADVISOR COMMENTARY
During Q4 2022, small-cap stocks as an asset class underperformed mid-cap and large-cap stocks. During the quarter, US employment and economic growth remained strong. Towards the end of the quarter, China started relaxing its strict covid lockdown. Energy prices also began moving lower. Inflation remained uncomfortably high. In order to bring down inflation, the Federal Reserve maintained the tightening of financial conditions by raising interest rates at a fast pace while also winding down its balance sheet. Markets started weighing the pros of a still-strong economy with employment growth versus the cons of an economy with tighter financial conditions, which may lead to a future economic slowdown and a potential recession. Due to this environment, smaller stocks underperformed their larger counterparts.
As we entered Q1 2023, small-cap stocks continued their relative underperformance. US economic and employment growth stayed strong, and inflation started lowering. The pace of the Federal Reserve’s interest rate increases slowed moderately. During the early part of the quarter, there was optimism that the economy may avoid a recession, which helped smaller stocks to perform well. This was offset towards the end of the quarter by the failure of two regional banks and the emergence of contagion fears in other banks. Additionally, tighter lending by the banks and the subsequent slowdown in economic growth added to an increased potential of a recession. In this volatile environment, investor preference leaned toward larger stocks as opposed to their smaller counterparts. These smaller stocks are more exposed to risks stemming from a lack of economic growth and bank lending.
In the small-cap space, technology, consumer discretionary, materials, industrials, and consumer staples sectors outperformed. The financials, energy, and health care sectors underperformed. The portfolio’s overweight to the technology and consumer discretionary sectors helped the relative performance. An underweight to consumer staples sector hurt the relative performance.
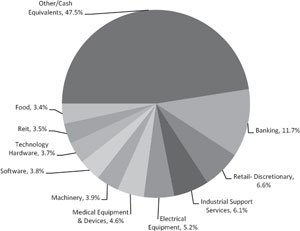
SMALL CAPITALIZATION PORTFOLIO
SIGNIFICANT AREAS OF INVESTMENT
AS A PERCENTAGE OF NET ASSETS
| Top 10 Portfolio Holdings* |
| | % of |
| Company | Net Assets |
| WESCO International Inc. | 2.4% |
| Applied Industrial Technologies Inc. | 2.2% |
| Encore Wire Corporation | 2.2% |
| EMCOR Group Inc. | 1.9% |
| Builders FirstSource Inc. | 1.8% |
| Academy Sports & Outdoors Inc. | 1.7% |
| Hillenbrand Inc. | 1.7% |
| Quaker Houghton | 1.7% |
| GATX Corporation | 1.5% |
| Lindsay Corporation | 1.5% |
| | |
| * | Based on total net assets as of February 28, 2023. |
Excludes short-term investments.
Portfolio Composition*
INTERNATIONAL EQUITY PORTFOLIO
Advised by: Smith Group Asset Management, Dallas, Texas
Objective: The Portfolio seeks long-term capital appreciation.
| Total Aggregate Return for the Periods Ended February 28, 2023 |
| | | Class I |
| Inception: | 9/1/94 – 2/28/23* | 1,22% |
| Ten Year: | 3/1/13 – 2/28/23* | 0.64% |
| Five Year: | 3/1/18 – 2/28/23* | (0.59)% |
| One Year: | 3/1/22 – 2/28/23 | (12.42)% |
| Six Months: | 9/1/22 – 2/28/23 | 11.91% |
| | | |
| * | Annualized performance for periods greater than one year. |
Performance data quoted above is historical. Past performance does not guarantee future results and current performance may be lower or higher than the performance data quoted. The investment return and principal value of an investment will fluctuate, so that shares when redeemed, may be worth more or less than their original cost. For more performance numbers current to the most recent month-end please call (800) 807-FUND. The returns shown do not reflect the deduction of taxes that a shareholder would pay on fund distributions or on the redemptions of fund shares. The total operating expense ratio as stated in the fee table to the Portfolio’s prospectus dated December 28, 2022, is 3.23%.
PORTFOLIO INVESTMENT STRATEGIES AND TECHNIQUES
The Adviser seeks to purchase reasonably valued stocks it believes have the ability to accelerate earnings growth and exceed investor expectations. The Adviser utilizes a three step process in stock selection. First, the Adviser reviews a series of screens utilizing the Adviser’s investment models, which are based on fundamental characteristics, designed to eliminate companies that the Adviser’s research shows have a high probability of underperformance. Factors considered when reviewing the screens include a multi-factor valuation framework, earnings quality, capital structure and financial quality. Next, securities that pass the initial screens are then evaluated to try to identify stocks with the highest probability of producing an earnings growth rate that exceeds investor expectations. This process incorporates changes in earnings expectations and earnings quality analysis. Finally, these steps produce a list of eligible companies which are subjected to analysis by the Adviser to further understand each company’s business prospects and earnings potential. A stock is sold when it no longer meets the Adviser’s criteria.
PORTFOLIO ADVISOR COMMENTARY
The Saratoga International Equity Portfolio posted strong relative performance during the period. During these six months, non -US markets generally outpaced US equities. Markets outside the US were aided by a steep sell-off in the greenback in November and December.
Market themes for 2023 are likely to remain similar to 2022 as stubbornly high inflation and sharply higher interest rates continue to compress valuations, incite fears of recession and pressure corporate profits. Given the resolute commitment of central banks to combat inflation, we believe inflation has likely peaked and will further recede in 2023. Just one week into 2023 the World Bank cut estimates for 2023 growth to 1.7% from 3.5% due to weaker growth expectations for the US, Europe and China. The downgrade was due to a myriad of reasons including persistently high inflation, rising interest rates, Russia’s continued war on Ukraine, and lingering effects of lockdowns in China. The first half of 2023 is likely to be a challenging period for corporate profits. On the bright side, the prospect of a strong earnings recovery could provide a favorable base for global equity markets into late 2023 and beyond.
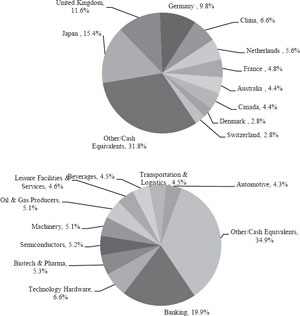
Developed Europe was the standout region over the six months in both the benchmark and the portfolio, as the severe energy crisis that was so feared last summer did not become a reality. Both portfolio stock selection within, and an overweight to, the region aided excess return. The UK was the lead contributor, with the Netherlands, Spain, and Switzerland also significantly outperforming. Emerging Asia was the second largest contributor, with the largest driver of outperformance being an underweight to India.
From a sector view, Financials holdings were the largest contributor to excess return, led by two European banks, Banco Santander (2.73%) and ABN AMRO (3.05%), which were the top two individual performers in the portfolio during the period. Consumer Staples was the second largest outperformer, with all four holdings making positive contributions. The Energy sector came in third place in terms of relative return. The Consumer Discretionary sector was the only detractor of note. Allocation effect was minimal.
INTERNATIONAL EQUITY PORTFOLIO
SIGNIFICANT AREAS OF INVESTMENT
AS A PERCENTAGE OF NET ASSETS
| Top 10 Portfolio Holdings* |
| | % of |
| Company | Net Assets |
| ABN AMRO Bank N.V. | 3.0% |
| BP plc | 2.8% |
| Novo Nordisk A/S | 2.8% |
| UBS Group A.G. | 2.8% |
| Banco Santander S.A. | 2.7% |
| Sumitomo Mitsui Financial Group Inc. | 2.7% |
| WPP plc | 2.7% |
| GEA Group A.G. | 2.6% |
| STMicroelectronics N.V. | 2.6% |
| Taiwan Semiconductor Manufacturing Company | 2.6% |
| | |
| * | Based on total net assets as of February 28, 2023. |
Excludes short-term investments.
Portfolio Composition*
HEALTH & BIOTECHNOLOGY PORTFOLIO
Advised by: Oak Associates, Ltd., Akron, Ohio
Objective: The Portfolio seeks long-term capital growth.
| Total Aggregate Return for the Periods Ended February 28, 2023 |
| | | Class I |
| Inception: | 1/28/03 – 2/28/23* | 8.32% |
| Ten Year: | 3/1/13 – 2/28/23* | 8.87% |
| Five Year: | 3/1/18 – 2/28/23* | 5.44% |
| One Year: | 9/1/22 – 2/28/23 | 1.84% |
| Six Months: | 9/1/22 – 2/28/23 | 3.33% |
| | | |
| * | Annualized performance for periods greater than one year. |
Performance data quoted above is historical. Past performance does not guarantee future results and current performance may be lower or higher than the performance data quoted. The investment return and principal value of an investment will fluctuate, so that shares when redeemed, may be worth more or less than their original cost. For more performance numbers current to the most recent month-end please call (800) 807-FUND. The returns shown do not reflect the deduction of taxes that a shareholder would pay on fund distributions or on the redemptions of fund shares. The total operating expense ratio as stated in the fee table to the Portfolio’s prospectus dated December 28, 2022, is 2.50%.
PORTFOLIO INVESTMENT STRATEGIES AND TECHNIQUES
The Adviser utilizes a top-down investment approach focused on long-term economic trends. The Adviser begins with the overall outlook for the economy, then seeks to identify specific industries with attractive characteristics and long-term growth potential. Ultimately, the Adviser seeks to identify high-quality companies within the selected industries and to acquire them at attractive prices. The Adviser’s stock selection process is based on an analysis of individual companies’ fundamental values, such as earnings growth potential and the quality of corporate management.
PORTFOLIO ADVISOR COMMENTARY
During the semi-annual period ended February 28th, 2023, US markets were relatively flat as volatility and uncertainty resulted from mixed economic data as the Federal Reserve rate hikes began to sink in. Inflation has also shown signs of peaking as economic data continues to decelerate. However, the labor market and excess savings remained strong which allowed economic activity and earnings to remain healthier as companies were able to pass on pricing costs to consumers.
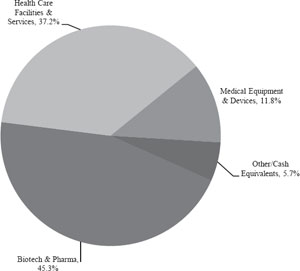
The Healthcare sector slightly outperformed the overall market over the six-month period. Patients have slowly begun to return to the doctor’s office as well as move forward with elective procedures. This resulted in Biotechnology outperforming during the period through increased prescriptions along with Healthcare Equipment companies that benefit from discretionary procedures. Managed Healthcare underperformed as investors shifted to a more risk-on allocation which included beaten up Technology stocks.
The Federal Reserve is adamant on remaining data driven and the recent failure of several banks suggests we are getting close to a pause in this tightening cycle. This would be a welcome event for the US equity market in our opinion. That said, we anticipate continued market volatility until investors are certain the Fed has beaten inflation. The defensive characteristics of the group keep it potentially attractive as a result. Further, we believe Healthcare stocks continue to present an attractive blend of valuation, demographic trends and a still unfolding return to normal operating environment.
HEALTH & BIOTECHNOLOGY PORTFOLIO
SIGNIFICANT AREAS OF INVESTMENT
AS A PERCENTAGE OF NET ASSETS
| Top 10 Portfolio Holdings* |
| | % of |
| Company | Net Assets |
| Amgen Inc. | 5.2% |
| Regeneron Pharmaceuticals Inc. | 4.6% |
| Merck & Company Inc. | 3.9% |
| AbbVie Inc. | 3.8% |
| United Therapeutics Corporation | 3.7% |
| Bio-Rad Laboratories Inc. | 3.6% |
| AmerisourceBergen Corporation | 3.5% |
| McKesson Corporation | 3.4% |
| Vertex Pharmaceuticals Inc. | 3.4% |
| Laboratory Corp of America Holdings | 3.3% |
| | |
| * | Based on total net assets as of February 28, 2023. |
Excludes short-term investments.
Portfolio Composition*
TECHNOLOGY & COMMUNICATIONS PORTFOLIO
Advised by: Oak Associates, Ltd., Akron, Ohio
Objective: The Portfolio seeks long-term growth of capital.
| Total Aggregate Return for the Periods Ended February 28, 2023 |
| | | Class I |
| Inception: | 1/7/03 – 2/28/23* | 11.57% |
| Ten Year: | 3/1/13 – 2/28/23* | 12.53% |
| Five Year: | 3/1/18 – 2/28/23* | 6.18% |
| One Year: | 3/1/22 – 2/28/23 | (16.89)% |
| Six Months: | 9/1/22 – 2/28/23 | (2.80)% |
| | | |
| * | Annualized performance for periods greater than one year. |
Performance data quoted above is historical. Past performance does not guarantee future results and current performance may be lower or higher than the performance data quoted. The investment return and principal value of an investment will fluctuate, so that shares when redeemed, may be worth more or less than their original cost. For more performance numbers current to the most recent month-end please call (800) 807-FUND. The returns shown do not reflect the deduction of taxes that a shareholder would pay on fund distributions or on the redemptions of fund shares. The total operating expense ratio as stated in the fee table to the Portfolio’s prospectus dated December 28, 2022, is 2.15%.
PORTFOLIO INVESTMENT STRATEGIES AND TECHNIQUES
In buying and selling securities for the Portfolio, the Adviser relies on fundamental analysis of each issuer and its potential for success in light of its current financial condition, its industry position and economic and market conditions. Factors considered include growth potential, earnings, valuation, competitive advantages and management.
PORTFOLIO ADVISOR COMMENTARY
US equity markets traded relatively flat during the semi-annual period ended February 28th, 2023. While inflation has slowed and the Federal Reserve has reduced the pace of rate hikes, uncertainty remains. Economic data has been decelerating creating a headwind for inflation, but prices do remain elevated in certain areas largely related to service industries. Excess savings and a strong labor market have kept consumer spending higher for longer than most anticipated when the Fed began to raise rates a year ago. That said, we expect the cumulative effect of this tightening cycle to slow economic growth further in the second half of the year.
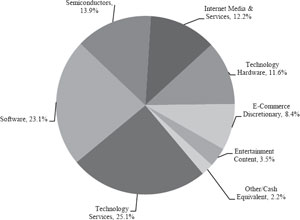
The Technology sector performed relatively in line with the broader market during the period albeit not in a straight line. Early in the period Technology stocks, particularly those exposed to the consumer, underperformed as investors feared the Fed’s actions would weigh heavily on spending. However, the consumer has remained resilient. This combined with perceived attractive valuations pushed the sector higher in the final three months of the period. Further, large capitalization technology companies have begun right sizing for the slower growth environment ahead which has been welcomed by investors.
We remain constructive on the broader Technology industry and believe secular trends could continue to make it one of the most profitable and fastest growing sectors within the market. We think that profitability and efficiency have the potential for expansion as the risk profile that tolerated deferred profitability in return for rapid near-term growth shifts due to an increased cost of capital. Likewise, we believe the portfolio’s preference for what we deem high-quality growth and respect for shareholder capital will be sought-after characteristics moving forward.
TECHNOLOGY & COMMUNICATIONS PORTFOLIO
SIGNIFICANT AREAS OF INVESTMENT
AS A PERCENTAGE OF NET ASSETS
| Top 10 Portfolio Holdings* |
| | % of |
| Company | Net Assets |
| Alphabet Inc. | 6.4% |
| Cisco Systems Inc. | 6.4% |
| Visa Inc. | 5.8% |
| Amazon.com Inc. | 5.7% |
| Microsoft Corporation | 5.6% |
| QUALCOMM Inc. | 5.3% |
| Apple Inc. | 5.2% |
| Oracle Corporation | 5.1% |
| Amdocs Ltd. | 4.8% |
| KLA Corporation | 4.7% |
| | |
| * | Based on total net assets as of February 28, 2023. |
Excludes short-term investments.
Portfolio Composition*
ENERGY & BASIC MATERIALS PORTFOLIO
Advised by: Smith Group Asset Management, Dallas, Texas
Objective: The Portfolio seeks long-term growth of capital.
| Total Aggregate Return for the Periods Ended February 28, 2023 |
| | | Class I |
| Inception: | 1/7/03 – 2/28/23* | 4.69% |
| Ten Year: | 3/1/13 – 2/28/23* | (0.73)% |
| Five Year: | 3/1/18 – 2/28/23* | 0.66% |
| One Year: | 3/1/22 – 2/28/23 | 6.90% |
| Six Months: | 9/1/22 – 2/28/23 | 8.53% |
| | | |
| * | Annualized performance for periods greater than one year. |
Performance data quoted above is historical. Past performance does not guarantee future results and current performance may be lower or higher than the performance data quoted. The investment return and principal value of an investment will fluctuate, so that shares when redeemed, may be worth more or less than their original cost. For more performance numbers current to the most recent month-end please call (800) 807-FUND. The returns shown do not reflect the deduction of taxes that a shareholder would pay on fund distributions or on the redemptions of fund shares. The total operating expense ratio as stated in the fee table to the Portfolio’s prospectus dated December 28, 2022 is 3.22%.
PORTFOLIO INVESTMENT STRATEGIES AND TECHNIQUES
The Adviser employs quantitative and qualitative analysis that seeks to identify reasonably valued, high quality companies within the energy and basic materials sectors. The Adviser’s selection process incorporates a multi-factor valuation framework, capital structure, and financial quality analysis. The valuation framework includes, but is not limited to, analysis of price to earnings, price to sales, price to book, and price to operating cash flow. Valuation methodology is industry-specific within the energy and basic materials sectors. This process produces a list of eligible companies which are then subjected to analysis by the Adviser to further understand each company’s business prospects and earnings potential. The Adviser uses the results of this analysis to construct the Portfolio’s security positions.
PORTFOLIO ADVISOR COMMENTARY
Both the Energy and Materials sectors significantly outpaced the broad market during the period. Over these six months the price of Natural Gas plummeted from $8.93/MMBtu to $2.50/MMBtu (Henry Hub). Crude oil prices also fell but not as dramatically, down 14.7% to $76.88/bbl (West Texas Intermediate).
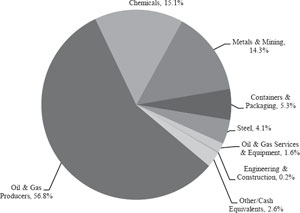
The Saratoga Energy & Basic Materials Portfolio’s Energy holdings (59% of portfolio weight during the period, on average) saw outperformance in both Refining & Marketing and Integrated Oil & Gas holdings, more than offsetting a drag from Storage & Transportation holdings. An underweight to the Equipment & Services was a detractor, while an underweight to Storage & Transportation was a positive.
The portfolio’s Basic Materials holdings (39% of portfolio weight during the period, on average) posted strong relative returns for the period. Chemical holdings were the standout performers, particularly the portfolio’s Specialty Chemical names. This positive effect was partially mitigated by poor stock selection in Metals & Mining. An underweight to Industrial Gases was a negative while an overweight to Steel contributed positively.
ENERGY & BASIC MATERIALS PORTFOLIO
SIGNIFICANT AREAS OF INVESTMENT
AS A PERCENTAGE OF NET ASSETS
| Top 10 Portfolio Holdings* |
| | % of |
| Company | Net Assets |
| Exxon Mobil Corporation | 7.5% |
| Chevron Corporation | 6.8% |
| Shell plc | 4.0% |
| ConocoPhillips | 3.3% |
| TotalEnergies S.E. | 3.3% |
| Eni SpA | 3.2% |
| Suncor Energy Inc. | 3.1% |
| Rio Tinto plc | 2.5% |
| PBF Energy Inc. | 2.5% |
| | |
| * | Based on total net assets as of February 28, 2023. |
Excludes short-term investments.
Portfolio Composition*
FINANCIAL SERVICES PORTFOLIO
Advised by: Smith Group Asset Management, Dallas, Texas
Objective: The Portfolio seeks long-term growth of capital.
| Total Aggregate Return for the Periods Ended February 28, 2023 |
| | | Class I |
| Inception: | 1/7/03 – 2/28/23* | 3.54% |
| Ten Year: | 3/1/13 – 2/28/23* | 6.80% |
| Five Year: | 3/1/18 – 2/28/23* | 2.01% |
| One Year: | 3/1/22 – 2/28/23 | (8.82) |
| Six Months: | 9/1/22 – 2/28/23 | 7.01% |
| | | |
| * | Annualized performance for periods greater than one year. |
Performance data quoted above is historical. Past performance does not guarantee future results and current performance may be lower or higher than the performance data quoted. The investment return and principal value of an investment will fluctuate, so that shares when redeemed, may be worth more or less than their original cost. For more performance numbers current to the most recent month-end please call (800) 807-FUND. The returns shown do not reflect the deduction of taxes that a shareholder would pay on fund distributions or on the redemptions of fund shares. The total operating expense ratio as stated in the fee table to the Portfolio’s prospectus dated December 28, 2022 is 3.30%.
PORTFOLIO INVESTMENT STRATEGIES AND TECHNIQUES
The Adviser employs quantitative and qualitative analysis that seeks to identify reasonably valued, high quality financial services companies that it believes have the ability to accelerate earnings growth and exceed investor expectations. The Adviser’s selection process consists of three steps. First, the Adviser reviews a series of screens utilizing the Adviser’s investment models, which are based on fundamental characteristics designed to eliminate companies that the Adviser’s research shows have a high probability of underperformance. Factors considered when reviewing the screens include a multi-factor valuation framework, earnings quality, and capital structure. The valuation framework includes, but is not limited to, analysis of price to earnings, price to sales, price to book, cash held to price and various cash flow ratios. Valuation methodology is industry-specific within the financial services sector. Next, securities that pass the initial screens are then evaluated to try to identify stocks with the highest probability of producing an earnings growth rate that exceeds investor expectations. This process incorporates changes in earnings expectations and earnings quality analysis. Finally, these steps produce a list of eligible companies which are subjected to analysis by the Adviser to further understand each company’s business prospects and earnings potential. The Adviser uses the results of this analysis to construct the Portfolio’s security positions.
PORTFOLIO ADVISOR COMMENTARY
The Financial Services sector significantly outpaced the broad market during the period. The top performing holdings in the Saratoga Advantage Trust Financial Services Portfolio were wealth and asset manager Ameriprise Financial (1.25%), diversified bank JPMorgan Chase (4.66%) and retirement and investments firm Voya Financial (1.43%). The portfolio’s underweight to the weak performing group of Insurance Brokers aided performance. Key detractors to performance were Utah based regional bank Zions Bancorp (0.99%), Puerto Rico based regional bank Popular (2.47%) and financial data firm S&P Global (1.66%). The portfolio’s overweight to the underperforming Regional Banking group was a hindrance on performance.
The Fed raised short-term interest rates from near zero to 5% and remains committed to further rate increases to squelch inflation down from its 9.1% peak last summer to their 2.0% target range. The Fed’s actions represent the most dramatic tightening cycle since the 1980s and it appears to already be impacting the most interest rate sensitive sectors of the economy, including financials. The Fed has made it clear they will not risk a start and stop approach to fighting inflation, which means they seem fully prepared to tip the economy into recession, if that is required to quell wage and price increases. We believe market themes for 2023 are likely to remain similar to 2022 as stubbornly high inflation and sharply higher interest rates continue to compress valuations, incite fears of recession and pressure corporate profits. If the stock market is going to reverse the losses of 2022, a prompt end to the Fed’s rate hiking campaign and improvement in financial conditions is likely a key component. Every major inflationary peak since WWII has experienced a downturn in corporate profits over the 12-months following the peak. If history holds, then 2023 earnings for the S&P 500 would be expected to be at least 8% below 2022 earnings. Whether this potential earnings downturn is already priced into market valuations, or whether the downturn even comes to pass, is still very much up in the air.
FINANCIAL SERVICES PORTFOLIO
SIGNIFICANT AREAS OF INVESTMENT
AS A PERCENTAGE OF NET ASSETS
| Top 10 Portfolio Holdings* |
| | % of |
| Company | Net Assets |
| Berkshire Hathaway Inc. | 8.5% |
| JPMorgan Chase & Company | 4.7% |
| Chubb Ltd. | 4.2% |
| Morgan Stanley | 4.2% |
| Citigroup Inc. | 4.0% |
| Bank of America Corporation | 3.9% |
| US Bancorp | 3.5% |
| MetLife Inc. | 3.4% |
| Raymond James Financial Inc. | 3.3% |
| CME Group Inc. | 3.3% |
| | |
| * | Based on total net assets as of February 28, 2023. |
Excludes short-term investments.
Portfolio Composition*
INVESTMENT QUALITY BOND PORTFOLIO
Advised by: Saratoga Capital Management, LLC, Avondale, Arizona
Objective: The Portfolio seeks current income and reasonable stability of principal.
| Total Aggregate Return for the Periods Ended February 28, 2023 |
| | | Class I |
| Inception: | 9/1/94 – 2/28/23* | 3.16% |
| Ten Year: | 3/1/13 – 2/28/23* | 0.45% |
| Five Year: | 3/1/18 – 2/28/23* | 0.68% |
| One Year: | 3/1/22 – 2/28/23 | (1.21)% |
| Six Months: | 9/1/22 – 2/28/23 | 0.39% |
| | | |
| * | Annualized performance for periods greater than one year. |
Performance data quoted above is historical. Past performance does not guarantee future results and current performance may be lower or higher than the performance data quoted. The investment return and principal value of an investment will fluctuate, so that shares when redeemed, may be worth more or less than their original cost. For more performance numbers current to the most recent month-end please call (800) 807-FUND. The returns shown do not reflect the deduction of taxes that a shareholder would pay on fund distributions or on the redemptions of fund shares. The total operating expense ratio as stated in the fee table to the Portfolio’s prospectus dated December 28, 2022, is 2.01%.
PORTFOLIO INVESTMENT STRATEGIES AND TECHNIQUES
The Portfolio is a “fund of funds.” The Portfolio’s main investment strategy is to invest in unaffiliated registered investment companies and exchange-traded funds (“ETFs”) (the “Underlying Funds”). The Portfolio will normally invest at least 80% of its total assets in Underlying Funds which invest in investment grade fixed-income securities or mortgage pass-through securities rated within the four highest grades by Moody’s Investors Service, Inc. (“Moody’s”), Standard & Poor’s Corporation (“S&P”) or Fitch Inc. (“Fitch”) or, if not rated, securities considered by an Underlying Fund’s adviser to be of comparable quality. In deciding which Underlying Funds to buy, hold or sell in pursuing the Portfolio’s investment objective, the Manager considers economic developments, interest rate trends, and performance history of an Underlying Fund’s management team, among other factors. The average maturity of the securities held by an Underlying Fund will generally range from three to ten years. In addition, the Portfolio may invest up to 5% of its net assets in Underlying Funds that invest in fixed-income securities of any grade, including those that are rated lower than investment grade at the time of purchase, commonly known as “junk bonds.”
PORTFOLIO ADVISOR COMMENTARY
One-year treasuries rose rapidly in 2022, then stalled a bit during the winter months to close the year near 4.7%; after some volatile trading in February and March, they look range-bound near that same level. We generally see this treasury issue move up when inflation is high and the market is anticipating the Fed will move their target rates higher. The bond market seems to be signaling that it believes the Fed has done its job and may not need to continue raising rates in its fight against inflation. Out further on the yield curve, we generally find rates are less correlated to inflation and more representative of the bond market’s assumption of future growth. After posting strong gains in 2022, three-, five-, and ten-year treasury rates have fallen well off of their highs. This has resulted in the yield curve inverting towards the shorter end of the curve, after having done so at the long end in mid-2022.
Regarding long-term corporate bonds, the quality spread as measured by Moody’s-rated Baa bonds minus Aaa bonds continues moving up. The quality spread has historically been a good predictor of confidence in the corporate bond market and helps us establish a baseline expectation for corporate earnings. The quality spread approached a long-term low of 0.65 during June 2021, but has steadily moved up since, reaching 1.16 in December 2022. The spread has started to normalize, falling back to 1.03 in March. After a period of suggesting corporate earnings might begin to stall, and seeing that dynamic play out in earnings revisions, a spread at current levels is closer to neutral as an indicator for future corporate earnings.
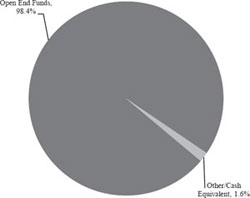
INVESTMENT QUALITY BOND PORTFOLIO
SIGNIFICANT AREAS OF INVESTMENT
AS A PERCENTAGE OF NET ASSETS
| Top 10 Portfolio Holdings* |
| | % of |
| Company | Net Assets |
| Vanguard Ultra-Short-Term Bond Fund, Admiral Class | 90.8% |
| Vanguard Short-Term Bond Index Fund, Admiral Class | 7.6% |
| | |
| * | Based on total net assets as of February 28, 2023. |
Excludes short-term investments.
Portfolio Composition*
MUNICIPAL BOND PORTFOLIO
Advised by: Saratoga Capital Management, LLC, Avondale, Arizona
Objective: The Portfolio seeks a high level of interest income that is excluded from federal income taxation
to the extent consistent with prudent investment management and the preservation of capital.
| Total Aggregate Return for the Year Ended February 28, 2023 |
| | | Class I |
| Inception: | 9/1/94 – 2/28/23* | 2.28% |
| Ten Year: | 3/1/13 – 2/28/23* | (0.33)% |
| Five Year: | 3/1/18 – 2/28/23* | (0.44)% |
| One Year: | 3/1/22 – 2/28/23 | (1.58)% |
| Six Months: | 9/1/22 – 2/28/23 | (0.11)% |
| | | |
| * | Annualized performance for periods greater than one year. |
Performance data quoted above is historical. Past performance does not guarantee future results and current performance may be lower or higher than the performance data quoted. The investment return and principal value of an investment will fluctuate, so that shares when redeemed, may be worth more or less than their original cost. For more performance numbers current to the most recent month-end please call (800) 807-FUND. The returns shown do not reflect the deduction of taxes that a shareholder would pay on fund distributions or on the redemptions of fund shares. The total operating expense ratio as stated in the fee table to the Portfolio’s prospectus dated December 28, 2022, is 3.09%.
PORTFOLIO INVESTMENT STRATEGIES AND TECHNIQUES
The Portfolio is a “fund of funds.” The Portfolio’s main investment strategy is to invest in unaffiliated registered investment companies and exchange-traded funds (“ETFs”) (the “Underlying Funds”). As a matter of fundamental policy, the Portfolio will normally invest at least 80% of its total assets in securities that pay interest exempt from federal income taxes. The Manager generally invests the Portfolio’s assets in Underlying Funds that invest in municipal obligations. There are no maturity limitations on the securities held by the Underlying Funds. Municipal obligations are bonds, notes or short-term commercial paper issued by state governments, local governments, and their respective agencies. In pursuing the Portfolio’s investment objective, the Manager has considerable leeway in deciding which Underlying Funds it buys, holds or sells on a day-to-day basis. The Underlying Fund’s adviser will invest primarily in municipal bonds rated within the four highest grades by Moody’s Investors Service, Inc. (“Moody’s”), Standard & Poor’s Corporation (“S&P”) or Fitch Inc. (“Fitch”) or, if not rated, of comparable quality in the opinion of an Underlying Fund’s adviser. An Underlying Fund may invest without limit in municipal obligations such as private activity bonds that pay interest income subject to the “alternative minimum tax,” although the Portfolio does not currently expect to invest more than 20% of its total assets in such instruments.
PORTFOLIO ADVISOR COMMENTARY
The Federal Reserve continues its tapering program. The Fed balance sheet topped out at roughly $8.96 trillion in April 2022, and has dropped to $8.71t at the end of March 2023. Notably, the Fed’s balance sheet grew by nearly $400 billion in March, as the collapse of SVB drove banks to take advantage of Fed liquidity programs. The Fed was quick to point out that such activity did not represent a change in their continued tapering operation, though it is a reminder of just how complex the job ahead of the Fed is as they try to shrink their massive balance sheet.
One-year treasuries rose rapidly in 2022, then stalled a bit during the winter months to close the year near 4.7%; after some volatile trading in February and March, they look range-bound near that same level. We generally see this treasury issue move up when inflation is high and the market is anticipating the Fed will move their target rates higher. The bond market seems to be signaling that it believes the Fed has done its job and may not need to continue raising rates in its fight against inflation. Out further on the yield curve, we generally find rates are less correlated to inflation and more representative of the bond market’s assumption of future growth. After posting strong gains in 2022, three-, five-, and ten-year treasury rates have fallen well off of their highs. This has resulted in the yield curve inverting towards the shorter end of the curve, after having done so at the long end in mid-2022.
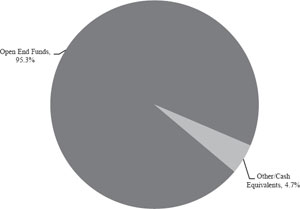
MUNICIPAL BOND PORTFOLIO
SIGNIFICANT AREAS OF INVESTMENT
AS A PERCENTAGE OF NET ASSETS
| Top 10 Portfolio Holdings* |
| | % of |
| Company | Net Assets |
| JPMorgan Ultra-Short Municipal Fund, Class I | 87.9% |
| Vanguard Short-Term Tax-Exempt Fund, Admiral Class | 7.4% |
| | |
| * | Based on total net assets as of February 28, 2023. |
Excludes short-term investments.
Portfolio Composition*
U.S. GOVERNMENT MONEY MARKET PORTFOLIO
Advised by: Saratoga Capital Management, LLC, Avondale, Arizona
Objective: The U.S. Government Money Market Portfolio seeks to provide maximum current income to the extent
consistent with the maintenance of liquidity and the preservation of capital.
| 7-Day Compounded Yield¹ | U.S. Government Money Market Portfolio (Class I) |
| 2/28/23 | 3.59% |
| Total Aggregate Return for the Periods Ended February 28, 2023 |
| | | Class I |
| Inception: | 9/1/94 — 2/28/23* | 1.66% |
| Ten Year: | 3/1/13 — 2/28/23* | 0.29% |
| Five Year: | 3/1/18 — 2/28/23* | 0.56% |
| One Year: | 3/1/22 — 2/28/23 | 1.27% |
| Six Months: | 9/1/22 — 2/28/23 | 1.27% |
| | | |
| 1 | The current 7-day yield more closely reflects the current earnings of the Portfolio than the total return quotation. |
| * | Annualized performance for periods greater than one year. |
Performance data quoted above is historical. Past performance does not guarantee future results and current performance may be lower or higher than the performance data quoted. The investment return and principal value of an investment will fluctuate, so that shares when redeemed, may be worth more or less than their original cost. For more performance numbers current to the most recent month-end please call (800) 807-FUND. The returns shown do not reflect the deduction of taxes that a shareholder would pay on fund distributions or on the redemptions of fund shares. The total operating expense ratio as stated in the fee table to the Portfolio’s prospectus dated December 28, 2022, is 1.11%.
An investment in the U.S. Government Money Market Portfolio is not insured or guaranteed by the Federal Deposit Insurance Corporation or any other government agency. Although the U.S. Government Money Market Portfolio seeks to preserve the value of your investment at $1.00 per share, it is possible to lose money by investing in the Portfolio.
AGGRESSIVE BALANCED ALLOCATION PORTFOLIO
Advised by: Saratoga Capital Management, LLC, Avondale, Arizona
Objective: The Portfolio seeks total return consisting of capital appreciation and income.
| Total Aggregate Return for the Periods Ended February 28, 2023 |
| | | Class I |
| Inception: | 1/4/18 — 2/28/23*+ | 4.75% |
| Five Year: | 3/1/18 — 2/28/23* | 5.23% |
| One Year: | 3/1/22 — 2/28/23 | (3.70)% |
| Six Months: | 9/1/22 — 2/28/23 | 2.97% |
| | | |
| * | Annualized performance for periods greater than one year. |
| + | Commencement of offering is December 29, 2017. Start of performance is January 4, 2018. |
Performance data quoted above is historical. Past performance does not guarantee future results and current performance may be lower or higher than the performance data quoted. The investment return and principal value of an investment will fluctuate, so that shares when redeemed, may be worth more or less than their original cost. For more performance numbers current to the most recent month-end please call (800) 807-FUND. The returns shown do not reflect the deduction of taxes that a shareholder would pay on fund distributions or on the redemptions of fund shares. The total operating expense ratio as stated in the fee table to the Portfolio’s prospectus dated December 28, 2022 is 3.16%.
PORTFOLIO INVESTMENT STRATEGIES AND TECHNIQUES
The Portfolio is a “fund of funds.” The Portfolio’s main investment strategy is to invest in other Saratoga Advantage Trust mutual funds (the “Saratoga Funds”) and/or unaffiliated registered investment companies and exchange-traded funds (“ETFs”) (together with the Saratoga Funds, the “Underlying Funds”) . The Portfolio’s Manager allocates the Portfolio’s investments in Underlying Funds based on a propriety asset allocation model developed by the Manager (the “SaratogaSHARP® model”). Consistent with the SaratogaSHARP® model, the Manager allocates the Portfolio’s investments based on an analysis of capital markets that includes an examination of current economic conditions, historical asset class behavior and current market assumptions. In constructing the Portfolio, the Manager typically allocates assets among asset classes in the following investment categories: core equity, sector equity, fixed income, money market and alternative investments. The target allocations are: approximately 35%-95% of the Portfolio’s assets to core equity investments; 7.5%-30% to sector equity investments; 2%-55% to fixed income investments; 2%-55% to money market investments; and 4%-40% to alternative investments. The Portfolio will invest in equity, fixed income and alternative instruments through its investments in the Underlying Funds. The Manager regularly evaluates how individual economic sectors and statistics are effecting the general economy and markets in order to develop the asset allocation parameters. Accordingly, asset allocation parameters may vary widely over time in response to changing market and/or economic conditions. The sectors in which the Portfolio typically invests include: health and biotechnology, technology and communications, financial services, energy and basic materials and global real estate.
PORTFOLIO ADVISOR COMMENTARY
The period was defined by an historically aggressive Fed, falling inflation, and reduced expectations for economic growth. We rely on over fifty macro-economic indicators when assembling our allocation strategy for the Saratoga Asset Allocation Portfolios. These indicators generally fall into four categories: monetary policy, interest rates, valuations, and inflation. As of the six -month period ending February 2023, we believe: monetary policy is slightly negative for equities, neutral for shorter term bonds, and negative for longer term bonds; interest rates are negative for equities, neutral for shorter term bonds, and slightly negative for longer term bonds; and, inflation is negative for equities, neutral for shorter term bonds, and slightly negative for longer term bonds.
During the period, the allocation portfolios benefited from an overweight to shorter term bonds versus longer term bonds. Within equities, an overweight to domestic large cap equities versus small cap and mid cap equities helped relative performance, though an underweight to foreign equities was a drag on performance. An overweight to large cap value versus large cap growth also benefited performance.
Within the discussion above, the percentages shown next to specific securities are the percentages of the Portfolio represented by the security on 2/28/23. The securities held in the Portfolio are subject to change and any discussion of those securities should not be considered investment advice.
AGGRESSIVE BALANCED ALLOCATION PORTFOLIO
SIGNIFICANT AREAS OF INVESTMENT
AS A PERCENTAGE OF NET ASSETS
| Top 10 Portfolio Holdings* |
| | % of |
| Company | Net Assets |
| Saratoga Large Capitalization Value Portfolio, Class I | 18.5% |
| Saratoga Large Capitalization Growth Portfolio, Class I | 12.4% |
| Vanguard Ultra-Short-Term Bond Fund, Admiral Class | 11.9% |
| Saratoga Mid Capitalization Portfolio, Class I | 10.9% |
| Eaton Vance Global Macro Absolute Return Fund, Class I | 9.9% |
| Vanguard Small-Cap Index Fund, Admiral Class | 8.5% |
| Vanguard Total International Stock Index Fund, Admiral Class | 6.6% |
| Saratoga Health & Biotechnology Portfolio, Class I | 4.0% |
| Saratoga Energy & Basic Materials Portfolio, Class I | 3.3% |
| Vanguard Financials Index Fund, Admiral Class | 3.2% |
| | |
| * | Based on total net assets as of February 28, 2023. |
Excludes short-term investments.
Portfolio Composition*
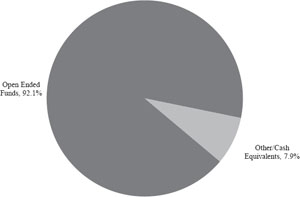
CONSERVATIVE BALANCED ALLOCATION PORTFOLIO
Advised by: Saratoga Capital Management, LLC, Avondale, Arizona
Objective: The Portfolio seeks total return consisting of capital appreciation and income.
| Total Aggregate Return for the Periods Ended February 28, 2023 |
| | | Class I |
| Inception: | 1/4/18 — 2/28/23*+ | 3.73% |
| Five Year: | 3/1/18 — 2/28/23* | 4.09% |
| One Year: | 3/1/22 — 2/28/23 | (3.10)% |
| Six Months: | 9/1/22 — 2/28/23 | 1.64% |
| | | |
| * | Annualized performance for periods greater than one year. |
| + | Commencement of offering is December 29, 2017. Start of performance is January 4, 2018. |
Performance data quoted above is historical. Past performance does not guarantee future results and current performance may be lower or higher than the performance data quoted. The investment return and principal value of an investment will fluctuate, so that shares when redeemed, may be worth more or less than their original cost. For more performance numbers current to the most recent month-end please call (800) 807-FUND. The returns shown do not reflect the deduction of taxes that a shareholder would pay on fund distributions or on the redemptions of fund shares. The total operating expense ratio as stated in the fee table to the Portfolio’s prospectus dated December 28, 2022 is 2.69%.
PORTFOLIO INVESTMENT STRATEGIES AND TECHNIQUES
The Portfolio is a “fund of funds.” The Portfolio’s main investment strategy is to invest in other Saratoga Advantage Trust mutual funds (the “Saratoga Funds”) and/or unaffiliated registered investment companies and exchange-traded funds (“ETFs”) (together with the Saratoga Funds, the “Underlying Funds”) . The Portfolio’s Manager allocates the Portfolio’s investments in Underlying Funds based on a propriety asset allocation model developed by the Manager (the “SaratogaSHARP® model”). Consistent with the SaratogaSHARP® model, the Manager allocates the Portfolio’s investments based on an analysis of capital markets that includes an examination of current economic conditions, historical asset class behavior and current market assumptions. In constructing the Portfolio, the Manager typically allocates assets among asset classes in the following investment categories: core equity, fixed income, money market and alternative investments. The target allocations are: approximately 5%-65% of the Portfolio’s assets to core equity investments; 8%-75% to fixed income investments; 10%-75% to money market investments; and 2%-30% to alternative investments. The Manager does not currently intend to allocate any of the Portfolio’s assets to sector equity investments; however, it may do so in the future. The Portfolio will invest in equity, fixed income and alternative instruments through its investments in the Underlying Funds. The Manager regularly evaluates how individual economic sectors and statistics are affecting the general economy and markets in order to develop the asset allocation parameters. Accordingly, asset allocation parameters may vary widely over time in response to changing market and/or economic conditions.
PORTFOLIO ADVISOR COMMENTARY
The period was defined by an historically aggressive Fed, falling inflation, and reduced expectations for economic growth. We rely on over fifty macro-economic indicators when assembling our allocation strategy for the Saratoga Asset Allocation Portfolios. These indicators generally fall into four categories: monetary policy, interest rates, valuations, and inflation. As of the six -month period ending February 2023, we believe: monetary policy is slightly negative for equities, neutral for shorter term bonds, and negative for longer term bonds; interest rates are negative for equities, neutral for shorter term bonds, and slightly negative for longer term bonds; and, inflation is negative for equities, neutral for shorter term bonds, and slightly negative for longer term bonds.
During the period, the allocation portfolios benefited from an overweight to shorter term bonds versus longer term bonds. Within equities, an overweight to domestic large cap equities versus small cap and mid cap equities helped relative performance, though an underweight to foreign equities was a drag on performance. An overweight to large cap value versus large cap growth also benefited performance.
CONSERVATIVE BALANCED ALLOCATION PORTFOLIO
SIGNIFICANT AREAS OF INVESTMENT
AS A PERCENTAGE OF NET ASSETS
| Top 10 Portfolio Holdings* |
| | % of |
| Company | Net Assets |
| Vanguard Ultra-Short-Term Bond Fund, Admiral Class | 31.1% |
| Saratoga Large Capitalization Value Portfolio, Class I | 13.5% |
| Saratoga Large Capitalization Growth Portfolio, Class I | 8.9% |
| Saratoga Mid Capitalization Portfolio, Class I | 7.8% |
| Eaton Vance Global Macro Absolute Return Fund, Class I | 7.5% |
| Vanguard Small-Cap Index Fund, Admiral Class | 1.8% |
| Vanguard Total International Stock Index Fund, Admiral Class | 1.0% |
| | |
| * | Based on total net assets as of February 28, 2023. |
Excludes short-term investments.
Portfolio Composition*
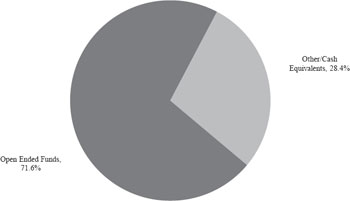
MODERATE BALANCED ALLOCATION PORTFOLIO
Advised by: Saratoga Capital Management, LLC, Avondale, Arizona
Objective: The Portfolio seeks total return consisting of capital appreciation and income.
| Total Aggregate Return for the Periods Ended February 28, 2023 |
| | | Class I |
| Inception: | 1/4/18 — 2/28/23*+ | 4.79% |
| Five Year: | 3/1/18 — 2/28/23* | 5.23% |
| One Year: | 3/1/22 — 2/28/23 | (3.58)% |
| Six Months: | 9/1/22 — 2/28/23 | 1.89% |
| | | |
| * | Annualized performance for periods greater than one year. |
| + | Commencement of offering is December 29, 2017. Start of performance is January 4, 2018. |
Performance data quoted above is historical. Past performance does not guarantee future results and current performance may be lower or higher than the performance data quoted. The investment return and principal value of an investment will fluctuate, so that shares when redeemed, may be worth more or less than their original cost. For more performance numbers current to the most recent month-end please call (800) 807-FUND. The returns shown do not reflect the deduction of taxes that a shareholder would pay on fund distributions or on the redemptions of fund shares. The total operating expense ratio as stated in the fee table to the Portfolio’s prospectus dated December 28, 2022 is 2.97%.
PORTFOLIO INVESTMENT STRATEGIES AND TECHNIQUES
The Portfolio is a “fund of funds.” The Portfolio’s main investment strategy is to invest in other Saratoga Advantage Trust mutual funds (the “Saratoga Funds”) and/or unaffiliated registered investment companies and exchange-traded funds (“ETFs”) (together with the Saratoga Funds, the “Underlying Funds”) . The Portfolio’s Manager allocates the Portfolio’s investments in Underlying Funds based on a propriety asset allocation model developed by the Manager (the “SaratogaSHARP® model”). Consistent with the SaratogaSHARP® model, the Manager allocates the Portfolio’s investments based on an analysis of capital markets that includes an examination of current economic conditions, historical asset class behavior and current market assumptions. In constructing the Portfolio, the Manager typically allocates assets among asset classes in the following investment categories: core equity, sector equity, fixed income, money market and alternative investments. The target allocations are: approximately 20%-82.5% of the Portfolio’s assets to core equity investments; 2.5%-25% to sector equity investments; 6%-65% to fixed income investments; 7%-65% to money market investments; and 3%-35% to alternative investments. The Portfolio will invest in equity, fixed income and alternative instruments through its investments in the Underlying Funds. The Manager regularly evaluates how individual economic sectors and statistics are effecting the general economy and markets in order to develop the asset allocation parameters. Accordingly, asset allocation parameters may vary widely over time in response to changing market and/or economic conditions. The sectors in which the Portfolio typically invests include: health and biotechnology, technology and communications, financial services, energy and basic materials and global real estate.
PORTFOLIO ADVISOR COMMENTARY
The period was defined by an historically aggressive Fed, falling inflation, and reduced expectations for economic growth. We rely on over fifty macro-economic indicators when assembling our allocation strategy for the Saratoga Asset Allocation Portfolios. These indicators generally fall into four categories: monetary policy, interest rates, valuations, and inflation. As of the six-month period ending February 2023, we believe: monetary policy is slightly negative for equities, neutral for shorter term bonds, and negative for longer term bonds; interest rates are negative for equities, neutral for shorter term bonds, and slightly negative for longer term bonds; and, inflation is negative for equities, neutral for shorter term bonds, and slightly negative for longer term bonds.
During the period, the allocation portfolios benefited from an overweight to shorter term bonds versus longer term bonds. Within equities, an overweight to domestic large cap equities versus small cap and mid cap equities helped relative performance, though an underweight to foreign equities was a drag on performance. An overweight to large cap value versus large cap growth also benefited performance.
MODERATE BALANCED ALLOCATION PORTFOLIO
SIGNIFICANT AREAS OF INVESTMENT
AS A PERCENTAGE OF NET ASSETS
| Top 10 Portfolio Holdings* |
| | % of |
| Company | Net Assets |
| Vanguard Ultra-Short-Term Bond Fund, Admiral Class | 22.3% |
| Saratoga Large Capitalization Value Portfolio, Class I | 18.7% |
| Saratoga Large Capitalization Growth Portfolio, Class I | 12.2% |
| Saratoga Mid Capitalization Portfolio, Class I | 10.9% |
| Eaton Vance Global Macro Absolute Return Fund, Class I | 7.7% |
| Vanguard Small-Cap Index Fund, Admiral Class | 3.7% |
| Vanguard Total International Stock Index Fund, Admiral Class | 2.4% |
| Saratoga Health & Biotechnology Portfolio, Class I | 2.1% |
| Saratoga Technology & Communications Portfolio, Class I | 1.8% |
| Saratoga Energy & Basic Materials Portfolio, Class I | 1.8% |
| | |
| * | Based on total net assets as of February 28, 2023. |
Excludes short-term investments.
Portfolio Composition*
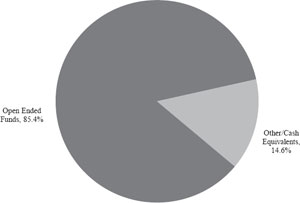
MODERATELY AGGRESSIVE BALANCED ALLOCATION
PORTFOLIO
Advised by: Saratoga Capital Management, LLC, Avondale, Arizona
Objective: The Portfolio seeks total return consisting of capital appreciation and income.
| Total Aggregate Return for the Periods Ended February 28, 2023 |
| | | Class I |
| Inception: | 1/4/18 — 2/28/23*+ | 4.49% |
| Five Year: | 3/1/18 — 2/28/23* | 5.07% |
| One Year: | 3/1/22 — 2/28/23 | (3.51)% |
| Six Months: | 9/1/22 — 2/28/23 | 2.33% |
| | | |
| * | Annualized performance for periods greater than one year. |
| + | Commencement of offering is December 29, 2017. Start of performance is January 4, 2018. |
Performance data quoted above is historical. Past performance does not guarantee future results and current performance may be lower or higher than the performance data quoted. The investment return and principal value of an investment will fluctuate, so that shares when redeemed, may be worth more or less than their original cost. For more performance numbers current to the most recent month-end please call (800) 807-FUND. The returns shown do not reflect the deduction of taxes that a shareholder would pay on fund distributions or on the redemptions of fund shares. The total operating expense ratio as stated in the fee table to the Portfolio’s prospectus dated December 28, 2023 is 3.14%.
PORTFOLIO INVESTMENT STRATEGIES AND TECHNIQUES
The Portfolio is a “fund of funds.” The Portfolio’s main investment strategy is to invest in other Saratoga Advantage Trust mutual funds (the “Saratoga Funds”) and/or unaffiliated registered investment companies and exchange-traded funds (“ETFs”) (together with the Saratoga Funds, the “Underlying Funds”) . The Portfolio’s Manager allocates the Portfolio’s investments in Underlying Funds based on a propriety asset allocation model developed by the Manager (the “SaratogaSHARP® model”). Consistent with the SaratogaSHARP® model, the Manager allocates the Portfolio’s investments based on an analysis of capital markets that includes an examination of current economic conditions, historical asset class behavior and current market assumptions. In constructing the Portfolio, the Manager typically allocates assets among asset classes in the following investment categories: core equity, sector equity, fixed income, money market and alternative investments. The target allocations are: approximately 30%-90% of the Portfolio’s assets to core equity investments; 5%-27.5% to sector equity investments; 3%-60% to fixed income investments; 5%-60% to money market investments; and 3.5%-37.5% to alternative investments. The Portfolio will invest in equity, fixed income and alternative instruments through its investments in the Underlying Funds. The Manager regularly evaluates how individual economic sectors and statistics are effecting the general economy and markets in order to develop the asset allocation parameters. Accordingly, asset allocation parameters may vary widely over time in response to changing market and/or economic conditions. The sectors in which the Portfolio typically invests include: health and biotechnology, technology and communications, financial services, energy and basic materials and global real estate.
PORTFOLIO ADVISOR COMMENTARY
The period was defined by an historically aggressive Fed, falling inflation, and reduced expectations for economic growth. We rely on over fifty macro-economic indicators when assembling our allocation strategy for the Saratoga Asset Allocation Portfolios. These indicators generally fall into four categories: monetary policy, interest rates, valuations, and inflation. As of the six -month period ending February 2023, we believe: monetary policy is slightly negative for equities, neutral for shorter term bonds, and negative for longer term bonds; interest rates are negative for equities, neutral for shorter term bonds, and slightly negative for longer term bonds; and, inflation is negative for equities, neutral for shorter term bonds, and slightly negative for longer term bonds.
During the period, the allocation portfolios benefited from an overweight to shorter term bonds versus longer term bonds. Within equities, an overweight to domestic large cap equities versus small cap and mid cap equities helped relative performance, though an underweight to foreign equities was a drag on performance. An overweight to large cap value versus large cap growth also benefited performance.
MODERATELY AGGRESSIVE BALANCED ALLOCATION PORTFOLIO
SIGNIFICANT AREAS OF INVESTMENT
AS A PERCENTAGE OF NET ASSETS
| Top 10 Portfolio Holdings* |
| | % of |
| Company | Net Assets |
| Vanguard Ultra-Short-Term Bond Fund, Admiral Class | 18.2% |
| Saratoga Large Capitalization Value Portfolio, Class I | 17.3% |
| Saratoga Large Capitalization Growth Portfolio, Class I | 11.4% |
| Saratoga Mid Capitalization Portfolio, Class I | 10.9% |
| Eaton Vance Global Macro Absolute Return Fund, Class I | 8.5% |
| Vanguard Small-Cap Index Fund, Admiral Class | 5.9% |
| Vanguard Total International Stock Index Fund, Admiral Class | 3.9% |
| Saratoga Health & Biotechnology Portfolio, Class I | 2.7% |
| Saratoga Energy & Basic Materials Portfolio, Class I | 2.6% |
| Saratoga Technology & Communications Portfolio, Class I | 2.1% |
| | |
| * | Based on total net assets as of February 28, 2023. |
Excludes short-term investments.
Portfolio Composition*
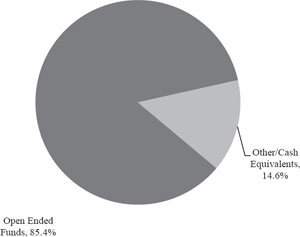
MODERATELY CONSERVATIVE BALANCED ALLOCATION PORTFOLIO
Advised by: Saratoga Capital Management, LLC, Avondale, Arizona
Objective: The Portfolio seeks total return consisting of capital appreciation and income.
| Total Aggregate Return for the Periods Ended February 28, 2023 |
| | | Class I |
| Inception: | 1/10/18 — 2/28/23*+ | 4.14% |
| Five Year: | 3/1/18 — 2/28/23* | 4.72% |
| One Year: | 3/1/22 — 2/28/23 | (2.80)% |
| Six Months: | 9/1/22 — 2/28/23 | 2.38% |
| | | |
| * | Annualized performance for periods greater than one year. |
| + | Commencement of offering is December 29, 2017. Start of performance is January 10, 2018. |
Performance data quoted above is historical. Past performance does not guarantee future results and current performance may be lower or higher than the performance data quoted. The investment return and principal value of an investment will fluctuate, so that shares when redeemed, may be worth more or less than their original cost. For more performance numbers current to the most recent month-end please call (800) 807-FUND. The returns shown do not reflect the deduction of taxes that a shareholder would pay on fund distributions or on the redemptions of fund shares. The total operating expense ratio as stated in the fee table to the Portfolio’s prospectus dated December 28, 2022 is 3.21%.
PORTFOLIO INVESTMENT STRATEGIES AND TECHNIQUES
The Portfolio is a “fund of funds.” The Portfolio’s main investment strategy is to invest in other Saratoga Advantage Trust mutual funds (the “Saratoga Funds”) and/or unaffiliated registered investment companies and exchange-traded funds (“ETFs”) (together with the Saratoga Funds, the “Underlying Funds”) . The Portfolio’s Manager allocates the Portfolio’s investments in Underlying Funds based on a propriety asset allocation model developed by the Manager (the “SaratogaSHARP® model”). Consistent with the SaratogaSHARP® model, the Manager allocates the Portfolio’s investments based on an analysis of capital markets that includes an examination of current economic conditions, historical asset class behavior and current market assumptions. In constructing the Portfolio, the Manager typically allocates assets among asset classes in the following investment categories: core equity, fixed income, money market and alternative investments. The target allocations are: approximately 10%-75% of the Portfolio’s assets to core equity investments; 7%-70% to fixed income investments; 8.5%-70% to money market investments; and 2.5%-32.5% to alternative investments. The Manager does not currently intend to allocate any of the Portfolio’s assets to sector equity investments; however, it may do so in the future. The Portfolio will invest in equity, fixed income and alternative instruments through its investments in the Underlying Funds. The Manager regularly evaluates how individual economic sectors and statistics are effecting the general economy and markets in order to develop the asset allocation parameters. Accordingly, asset allocation parameters may vary widely over time in response to changing market and/or economic conditions.
PORTFOLIO ADVISOR COMMENTARY
The period was defined by an historically aggressive Fed, falling inflation, and reduced expectations for economic growth. We rely on over fifty macro-economic indicators when assembling our allocation strategy for the Saratoga Asset Allocation Portfolios. These indicators generally fall into four categories: monetary policy, interest rates, valuations, and inflation. As of the six -month period ending February 2023, we believe: monetary policy is slightly negative for equities, neutral for shorter term bonds, and negative for longer term bonds; interest rates are negative for equities, neutral for shorter term bonds, and slightly negative for longer term bonds; and, inflation is negative for equities, neutral for shorter term bonds, and slightly negative for longer term bonds.
During the period, the allocation portfolios benefited from an overweight to shorter term bonds versus longer term bonds. Within equities, an overweight to domestic large cap equities versus small cap and mid cap equities helped relative performance, though an underweight to foreign equities was a drag on performance. An overweight to large cap value versus large cap growth also benefited performance.
MODERATELY CONSERVATIVE BALANCED ALLOCATION PORTFOLIO
SIGNIFICANT AREAS OF INVESTMENT
AS A PERCENTAGE OF NET ASSETS
| Top 10 Portfolio Holdings* |
| | % of |
| Company | Net Assets |
| Vanguard Ultra-Short-Term Bond Fund, Admiral Class | 26.8% |
| Saratoga Large Capitalization Value Portfolio, Class I | 18.7% |
| Saratoga Large Capitalization Growth Portfolio, Class I | 12.4% |
| Saratoga Mid Capitalization Portfolio, Class I | 11.6% |
| Eaton Vance Global Macro Absolute Return Fund, Class I | 7.8% |
| Vanguard Small-Cap Index Fund, Admiral Class | 5.6% |
| Vanguard Total International Stock Index Fund, Admiral Class | 3.6% |
| | |
| * | Based on total net assets as of February 28, 2023. |
Excludes short-term investments.
Portfolio Composition*
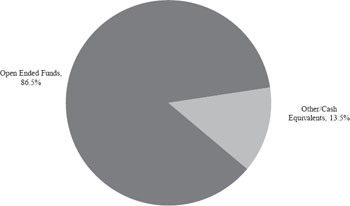
| SARATOGA LARGE CAPITALIZATION VALUE PORTFOLIO |
| SCHEDULE OF INVESTMENTS (Unaudited) |
| February 28, 2023 |
| Shares | | | | | Fair Value | |
| | | | | COMMON STOCKS — 89.6% | | | | |
| | | | | AEROSPACE & DEFENSE - 5.1% | | | | |
| | 11,499 | | | Raytheon Technologies Corporation | | $ | 1,127,937 | |
| | | | | | | | | |
| | | | | ASSET MANAGEMENT - 4.6% | | | | |
| | 81,034 | | | Blue Owl Capital, Inc. | | | 999,960 | |
| | | | | | | | | |
| | | | | BANKING - 8.6% | | | | |
| | 11,709 | | | East West Bancorp, Inc. | | | 892,343 | |
| | 8,112 | | | First Republic Bank | | | 997,857 | |
| | | | | | | | 1,890,200 | |
| | | | | CHEMICALS - 4.5% | | | | |
| | 15,897 | | | Corteva, Inc. | | | 990,224 | |
| | | | | | | | | |
| | | | | CONTAINERS & PACKAGING - 5.0% | | | | |
| | 12,795 | | | Crown Holdings, Inc. | | | 1,106,896 | |
| | | | | | | | | |
| | | | | ELECTRICAL EQUIPMENT - 11.3% | | | | |
| | 60,974 | | | API Group Corporation(a) | | | 1,432,279 | |
| | 3,549 | | | Rockwell Automation, Inc. | | | 1,046,707 | |
| | | | | | | | 2,478,986 | |
| | | | | ENGINEERING & CONSTRUCTION - 5.1% | | | | |
| | 11,427 | | | MasTec, Inc.(a)(b) | | | 1,116,646 | |
| | | | | | | | | |
| | | | | HEALTH CARE FACILITIES & SERVICES - 14.3% | | | | |
| | 7,118 | | | AmerisourceBergen Corporation | | | 1,107,276 | |
| | 4,388 | | | Charles River Laboratories International, Inc.(a) | | | 962,464 | |
| | 2,070 | | | Chemed Corporation | | | 1,079,671 | |
| | | | | | | | 3,149,411 | |
| | | | | INTERNET MEDIA & SERVICES - 4.4% | | | | |
| | 10,659 | | | Alphabet, Inc., Class A(a) | | | 959,950 | |
| | | | | | | | | |
| | | | | MEDICAL EQUIPMENT & DEVICES - 3.6% | | | | |
| | 32,666 | | | Avantor, Inc.(a) | | | 796,070 | |
| | | | | | | | | |
See accompanying notes to financial statements.
| SARATOGA LARGE CAPITALIZATION VALUE PORTFOLIO |
| SCHEDULE OF INVESTMENTS (Unaudited) (Continued) |
| February 28, 2023 |
| Shares | | | | | Fair Value | |
| | | | | COMMON STOCKS — 89.6% (Continued) | | | | |
| | | | | PUBLISHING & BROADCASTING - 5.1% | | | | |
| | 16,619 | | | Liberty Media Corp-Liberty Formula One - Series C(a) | | $ | 1,127,931 | |
| | | | | | | | | |
| | | | | SEMICONDUCTORS - 4.8% | | | | |
| | 13,661 | | | ON Semiconductor Corporation(a) | | | 1,057,498 | |
| | | | | | | | | |
| | | | | SPECIALTY FINANCE - 4.5% | | | | |
| | 11,393 | | | Walker & Dunlop, Inc. | | | 993,811 | |
| | | | | | | | | |
| | | | | TECHNOLOGY SERVICES - 5.6% | | | | |
| | 4,179 | | | CACI International, Inc., Class A(a) | | | 1,224,447 | |
| | | | | | | | | |
| | | | | WHOLESALE - DISCRETIONARY - 3.1% | | | | |
| | 9,754 | | | Copart, Inc.(a) | | | 687,267 | |
| | | | | | | | | |
| | | | | TOTAL COMMON STOCKS (Cost $18,538,824) | | �� | 19,707,234 | |
| | | | | | | | | |
| Principal | | | | | | | |
| Amount ($) | | | | | | | |
| | | | | COLLATERAL FOR SECURITIES LOANED — 0.0%(c) | | | | |
| | | | | REPURCHASE AGREEMENTS - 0.0%(c) | | | | |
| | 417 | | | Citigroup Global Markets, Inc., dated 2/28/2023, due 3/1/2023, 4.550%, total to be received $417 (Collateralized by various US Government agency obligations, due 12/26/2024-1/15/2058, 0.000%- 7.500% totaling $425)(d) | | | | |
| | | | | | | | | |
| | | | | TOTAL COLLATERAL FOR SECURITIES LOANED (Cost $417) | | | 417 | |
See accompanying notes to financial statements.
| SARATOGA LARGE CAPITALIZATION VALUE PORTFOLIO |
| SCHEDULE OF INVESTMENTS (Unaudited) (Continued) |
| February 28, 2023 |
| Shares | | | | | Fair Value | |
| | | | | SHORT-TERM INVESTMENT — 10.6% | | | | |
| | | | | MONEY MARKET FUND - 10.6% | | | | |
| | 2,337,690 | | | Dreyfus Institutional Preferred Government Money Market Fund, Institutional Class, 4.54% (Cost $2,337,690)(e) | | $ | 2,337,690 | |
| | | | | | | | | |
| | | | | TOTAL INVESTMENTS - 100.2% (Cost $20,876,931) | | $ | 22,045,341 | |
| | | | | LIABILITIES IN EXCESS OF OTHER ASSETS - (0.2)% | | | (54,320 | ) |
| | | | | NET ASSETS - 100.0% | | $ | 21,991,021 | |
| (a) | Non-income producing security. |
| (b) | All or a portion of the security is on loan. The total fair Value of the securities on loan as of February 28, 2023 was $1,002,661. |
| (d) | Security was purchased with cash received as collateral for securities on loan at February 28, 2023. Total collateral had a value of $417 at February 28, 2023. Additional collateral received from the borrower not disclosed in the Schedule of Investments had a value of $1,022,895 on February 28, 2023. |
| (e) | Rate disclosed is the seven day effective yield as of February 28, 2023. |
See accompanying notes to financial statements.
| SARATOGA LARGE CAPITALIZATION GROWTH PORTFOLIO |
| SCHEDULE OF INVESTMENTS (Unaudited) |
| February 28, 2023 |
| Shares | | | | | Fair Value | |
| | | | | COMMON STOCKS — 99.5% | | | | |
| | | | | AUTOMOTIVE - 3.3% | | | | |
| | 3,480 | | | Tesla, Inc.(a) | | $ | 715,871 | |
| | | | | | | | | |
| | | | | BEVERAGES - 2.1% | | | | |
| | 2,680 | | | PepsiCo, Inc. | | | 465,060 | |
| | | | | | | | | |
| | | | | BIOTECHNOLOGY & PHARMACEUTICALS - 2.6% | | | | |
| | 4,550 | | | Ionis Pharmaceuticals, Inc.(a) | | | 163,345 | |
| | 950 | | | Merck & Company, Inc. | | | 100,928 | |
| | 3,030 | | | Neurocrine Biosciences, Inc.(a) | | | 312,393 | |
| | | | | | | | 576,666 | |
| | | | | COMMERCIAL SUPPORT SERVICES - 2.0% | | | | |
| | 2,950 | | | Waste Management, Inc. | | | 441,792 | |
| | | | | | | | | |
| | | | | E-COMMERCE DISCRETIONARY - 2.6% | | | | |
| | 6,070 | | | Amazon.com, Inc.(a) | | | 571,976 | |
| | | | | | | | | |
| | | | | HEALTH CARE FACILITIES & SERVICES - 5.9% | | | | |
| | 1,170 | | | McKesson Corporation | | | 409,278 | |
| | 1,320 | | | Molina Healthcare, Inc.(a) | | | 363,436 | |
| | 1,120 | | | UnitedHealth Group, Inc. | | | 533,052 | |
| | | | | | | | 1,305,766 | |
| | | | | INDUSTRIAL SUPPORT SERVICES - 2.8% | | | | |
| | 1,300 | | | United Rentals, Inc. (a) | | | 609,089 | |
| | | | | | | | | |
| | | | | INFRASTRUCTURE REIT - 0.9% | | | | |
| | 980 | | | American Tower Corporation | | | 194,049 | |
| | | | | | | | | |
| | | | | INSURANCE - 4.6% | | | | |
| | 6,720 | | | Arch Capital Group Ltd.(a) | | | 470,400 | |
| | 1,415 | | | Everest Re Group Ltd. | | | 543,318 | |
| | | | | | | | 1,013,718 | |
| | | | | INTERNET MEDIA & SERVICES - 6.3% | | | | |
| | 5,190 | | | Airbnb, Inc., Class A(a) | | | 639,823 | |
| | 3,540 | | | Alphabet, Inc., Class A(a) | | | 318,812 | |
See accompanying notes to financial statements.
| SARATOGA LARGE CAPITALIZATION GROWTH PORTFOLIO |
| SCHEDULE OF INVESTMENTS (Unaudited) (Continued) |
| February 28, 2023 |
| Shares | | | | | Fair Value | |
| | | | | COMMON STOCKS — 99.5% (Continued) | | | | |
| | | | | INTERNET MEDIA & SERVICES - 6.3% (Continued) | | | | |
| | 3,560 | | | Alphabet, Inc., Class C(a) | | $ | 321,468 | |
| | 4,590 | | | Pinterest, Inc., Class A(a) | | | 115,255 | |
| | | | | | | | 1,395,358 | |
| | | | | LEISURE FACILITIES & SERVICES - 4.0% | | | | |
| | 233 | | | Chipotle Mexican Grill, Inc.(a) | | | 347,421 | |
| | 1,030 | | | Choice Hotels International, Inc. | | | 121,911 | |
| | 2,540 | | | Live Nation Entertainment, Inc.(a) | | | 183,032 | |
| | 1,390 | | | Marriott International, Inc., Class A | | | 235,244 | |
| | | | | | | | 887,608 | |
| | | | | MACHINERY - 1.5% | | | | |
| | 430 | | | Caterpillar, Inc. | | | 103,007 | |
| | 990 | | | IDEX Corporation | | | 222,730 | |
| | | | | | | | 325,737 | |
| | | | | MEDICAL EQUIPMENT & DEVICES - 3.8% | | | | |
| | 3,100 | | | Agilent Technologies, Inc. | | | 440,107 | |
| | 270 | | | Mettler-Toledo International, Inc.(a) | | | 387,102 | |
| | | | | | | | 827,209 | |
| | | | | OIL & GAS PRODUCERS - 0.4% | | | | |
| | 790 | | | EOG Resources, Inc. | | | 89,286 | |
| | | | | | | | | |
| | | | | PUBLISHING & BROADCASTING - 1.9% | | | | |
| | 6,070 | | | Liberty Media Corp-Liberty Formula One - Series C(a) | | | 411,971 | |
| | | | | | | | | |
| | | | | RETAIL - CONSUMER STAPLES - 0.8% | | | | |
| | 355 | | | Costco Wholesale Corporation | | | 171,884 | |
| | | | | | | | | |
| | | | | RETAIL - DISCRETIONARY - 4.7% | | | | |
| | 207 | | | AutoZone, Inc.(a) | | | 514,714 | |
| | 1,010 | | | Ulta Beauty, Inc.(a) | | | 523,988 | |
| | | | | | | | 1,038,702 | |
| | | | | SELF-STORAGE REIT - 0.7% | | | | |
| | 550 | | | Public Storage | | | 164,423 | |
See accompanying notes to financial statements.
| SARATOGA LARGE CAPITALIZATION GROWTH PORTFOLIO |
| SCHEDULE OF INVESTMENTS (Unaudited) (Continued) |
| February 28, 2023 |
| Shares | | | | | Fair Value | |
| | | | | COMMON STOCKS — 99.5% (Continued) | | | | |
| | | | | SEMICONDUCTORS - 5.8% | | | | |
| | 1,420 | | | Advanced Micro Devices, Inc.(a) | | $ | 111,584 | |
| | 1,280 | | | Applied Materials, Inc. | | | 148,672 | |
| | 220 | | | Broadcom, Inc. | | | 130,744 | |
| | 2,620 | | | NVIDIA Corporation | | | 608,259 | |
| | 2,140 | | | QUALCOMM, Inc. | | | 264,354 | |
| | | | | | | | 1,263,613 | |
| | | | | SOFTWARE - 20.5% | | | | |
| | 2,685 | | | Crowdstrike Holdings, Inc., Class A(a) | | | 324,053 | |
| | 8,450 | | | Fortinet, Inc.(a) | | | 502,268 | |
| | 7,243 | | | Microsoft Corporation | | | 1,806,549 | |
| | 2,250 | | | Palo Alto Networks, Inc.(a) | | | 423,833 | |
| | 1,100 | | | Paycom Software, Inc.(a) | | | 317,966 | |
| | 5,480 | | | Splunk, Inc.(a) | | | 561,700 | |
| | 1,540 | | | Synopsys, Inc.(a) | | | 560,190 | |
| | | | | | | | 4,496,559 | |
| | | | | TECHNOLOGY HARDWARE - 14.1% | | | | |
| | 15,600 | | | Apple, Inc. | | | 2,299,596 | |
| | 3,870 | | | Arista Networks, Inc.(a) | | | 536,769 | |
| | 8,860 | | | Pure Storage, Inc., Class A(a) | | | 252,864 | |
| | | | | | | | 3,089,229 | |
| | | | | TECHNOLOGY SERVICES - 6.0% | | | | |
| | 1,090 | | | Automatic Data Processing, Inc. | | | 239,604 | |
| | 1,350 | | | Gartner, Inc.(a) | | | 442,544 | |
| | 4,040 | | | Paychex, Inc. | | | 446,015 | |
| | 850 | | | Visa, Inc., Class A(b) | | | 186,949 | |
| | | | | | | | 1,315,112 | |
| | | | | TRANSPORTATION & LOGISTICS - 0.9% | | | | |
| | 1,880 | | | Expeditors International of Washington, Inc. | | | 196,573 | |
See accompanying notes to financial statements.
| SARATOGA LARGE CAPITALIZATION GROWTH PORTFOLIO |
| SCHEDULE OF INVESTMENTS (Unaudited) (Continued) |
| February 28, 2023 |
| | | | | | Fair Value | |
| | | | COMMON STOCKS — 99.5% (Continued) | | | |
| | | | WHOLESALE - CONSUMER STAPLES - 1.3% | | | |
| | 5,230 | | | Performance Food Group Company(a) | | $ | 295,966 | |
| | | | | | | | | |
| | | | | TOTAL COMMON STOCKS (Cost $19,003,740) | | | 21,863,217 | |
| | | | | | | | | |
| | | | | TOTAL INVESTMENTS - 99.5% (Cost $19,003,740) | | $ | 21,863,217 | |
| | | | | OTHER ASSETS IN EXCESS OF LIABILITIES - 0.5% | | | 119,716 | |
| | | | | NET ASSETS - 100.0% | | $ | 21,982,933 | |
| Ltd. | - Limited Company |
| | |
| REIT | - Real Estate Investment Trust |
| (a) | Non-income producing security. |
| (b) | All or a portion of the security is on loan. The total fair Value of the securities on loan as of February 28, 2023 was $185,314. |
See accompanying notes to financial statements.
| SARATOGA MID CAPITALIZATION PORTFOLIO |
| SCHEDULE OF INVESTMENTS (Unaudited) |
| February 28, 2023 |
| Shares | | | | | Fair Value | |
| | | | | COMMON STOCKS — 92.9% | | | | |
| | | | | APPAREL & TEXTILE PRODUCTS - 0.5% | | | | |
| | 1,155 | | | Skechers USA, Inc., Class A(a) | | $ | 51,409 | |
| | | | | | | | | |
| | | | | ASSET MANAGEMENT - 3.3% | | | | |
| | 843 | | | Apollo Global Management, Inc. | | | 59,769 | |
| | 685 | | | Ares Management Corporation, Class A | | | 55,232 | |
| | 7,118 | | | Brightsphere Investment Group, Inc. | | | 178,447 | |
| | 615 | | | Raymond James Financial, Inc. | | | 66,703 | |
| | | | | | | | 360,151 | |
| | | | | BANKING - 3.5% | | | | |
| | 2,660 | | | Bank of NT Butterfield & Son Ltd. (The) | | | 96,159 | |
| | 1,695 | | | First Republic Bank | | | 208,501 | |
| | 3,005 | | | Huntington Bancshares, Inc. | | | 46,037 | |
| | 1,445 | | | PacWest Bancorp | | | 40,099 | |
| | | | | | | | 390,796 | |
| | | | | BIOTECH & PHARMA - 0.4% | | | | |
| | 3,860 | | | Elanco Animal Health, Inc.(a) | | | 44,274 | |
| | | | | | | | | |
| | | | | CHEMICALS - 3.6% | | | | |
| | 295 | | | Avery Dennison Corporation | | | 53,746 | |
| | 1,945 | | | Axalta Coating Systems Ltd.(a) | | | 57,961 | |
| | 1,755 | | | FMC Corporation | | | 226,658 | |
| | 595 | | | LyondellBasell Industries N.V., Class A | | | 57,114 | |
| | | | | | | | 395,479 | |
| | | | | COMMERCIAL SUPPORT SERVICES - 5.0% | | | | |
| | 4,300 | | | Aramark | | | 158,240 | |
| | 3,075 | | | Republic Services, Inc. | | | 396,460 | |
| | | | | | | | 554,700 | |
| | | | | CONSTRUCTION MATERIALS - 1.5% | | | | |
| | 935 | | | Vulcan Materials Company | | | 169,151 | |
| | | | | | | | | |
| | | | | CONSUMER SERVICES - 0.8% | | | | |
| | 745 | | | Grand Canyon Education, Inc.(a) | | | 84,401 | |
See accompanying notes to financial statements.
| SARATOGA MID CAPITALIZATION PORTFOLIO |
| SCHEDULE OF INVESTMENTS (Unaudited) (Continued) |
| February 28, 2023 |
| Shares | | | | | Fair Value | |
| | | | | COMMON STOCKS — 92.9% (Continued) | | | | |
| | | | | CONTAINERS & PACKAGING - 1.2% | | | | |
| | 1,540 | | | Crown Holdings, Inc. | | $ | 133,225 | |
| | | | | | | | | |
| | | | | ELECTRIC UTILITIES - 7.1% | | | | |
| | 2,695 | | | Alliant Energy Corporation | | | 138,173 | |
| | 1,730 | | | Ameren Corporation | | | 143,088 | |
| | 2,475 | | | CMS Energy Corporation | | | 145,951 | |
| | 2,320 | | | Evergy, Inc. | | | 136,439 | |
| | 9,985 | | | Vistra Corporation | | | 219,570 | |
| | | | | | | | 783,221 | |
| | | | | ELECTRICAL EQUIPMENT - 8.9% | | | | |
| | 990 | | | Allegion plc | | | 111,583 | |
| | 1,750 | | | AMETEK, Inc. | | | 247,730 | |
| | 330 | | | Hubbell, Inc. | | | 83,008 | |
| | 615 | | | Keysight Technologies, Inc.(a) | | | 98,375 | |
| | 5,255 | | | nVent Electric PLC | | | 240,889 | |
| | 2,350 | | | Otis Worldwide Corporation | | | 198,857 | |
| | | | | | | | 980,442 | |
| | | | | ENGINEERING & CONSTRUCTION - 4.3% | | | | |
| | 9,280 | | | WillScot Mobile Mini Holdings Corporation(a) | | | 476,992 | |
| | | | | | | | | |
| | | | | HEALTH CARE FACILITIES & SERVICES - 4.6% | | | | |
| | 1,810 | | | AmerisourceBergen Corporation | | | 281,564 | |
| | 1,055 | | | IQVIA Holdings, Inc.(a) | | | 219,936 | |
| | | | | | | | 501,500 | |
| | | | | HOME CONSTRUCTION - 0.5% | | | | |
| | 2,190 | | | AZEK Company, Inc. (The)(a) | | | 52,757 | |
| | | | | | | | | |
| | | | | HOUSEHOLD PRODUCTS - 1.5% | | | | |
| | 2,045 | | | Church & Dwight Company, Inc. | | | 171,331 | |
| | | | | | | | | |
| | | | | INSTITUTIONAL FINANCIAL SERVICES - 3.8% | | | | |
| | 1,300 | | | Cboe Global Markets, Inc. | | | 164,021 | |
| | 4,465 | | | Nasdaq, Inc. | | | 250,308 | |
| | | | | | | | 414,329 | |
See accompanying notes to financial statements.
| SARATOGA MID CAPITALIZATION PORTFOLIO |
| SCHEDULE OF INVESTMENTS (Unaudited) (Continued) |
| February 28, 2023 |
| Shares | | | | | Fair Value | |
| | | | | COMMON STOCKS — 92.9% (Continued) | | | | |
| | | | | INSURANCE - 6.7% | | | | |
| | 2,445 | | | Allstate Corporation (The) | | $ | 314,866 | |
| | 1,240 | | | Arthur J Gallagher & Company | | | 232,314 | |
| | 1,365 | | | Reinsurance Group of America, Inc. | | | 197,202 | |
| | | | | | | | 744,382 | |
| | | | | LEISURE PRODUCTS - 1.5% | | | | |
| | 865 | | | Axon Enterprise, Inc.(a) | | | 173,268 | |
| | | | | | | | | |
| | | | | MACHINERY - 2.1% | | | | |
| | 1,935 | | | Crane Holdings Company | | | 231,774 | |
| | | | | | | | | |
| | | | | MEDICAL EQUIPMENT & DEVICES - 4.3% | | | | |
| | 665 | | | Agilent Technologies, Inc. | | | 94,410 | |
| | 4,055 | | | Avantor, Inc.(a) | | | 98,820 | |
| | 430 | | | Cooper Companies, Inc. (The) | | | 140,597 | |
| | 1,835 | | | Hologic, Inc.(a) | | | 146,140 | |
| | | | | | | | 479,967 | |
| | | | | METALS & MINING - 0.5% | | | | |
| | 3,425 | | | Constellium S.E.(a) | | | 54,766 | |
| | | | | | | | | |
| | | | | OIL & GAS PRODUCERS - 2.9% | | | | |
| | 1,005 | | | Diamondback Energy, Inc. | | | 141,283 | |
| | 530 | | | Pioneer Natural Resources Company | | | 106,217 | |
| | 14,695 | | | Southwestern Energy Company(a) | | | 77,884 | |
| | | | | | | | 325,384 | |
| | | | | PUBLISHING & BROADCASTING - 3.2% | | | | |
| | 1,880 | | | Nexstar Media Group, Inc. | | | 349,492 | |
| | | | | | | | | |
| | | | | SEMICONDUCTORS - 1.0% | | | | |
| | 295 | | | Analog Devices, Inc. | | | 54,124 | |
| | 670 | | | Entegris, Inc. | | | 57,104 | |
| | | | | | | | 111,228 | |
| | | | | SOFTWARE - 4.5% | | | | |
| | 4,680 | | | SS&C Technologies Holdings, Inc. | | | 274,716 | |
See accompanying notes to financial statements.
| SARATOGA MID CAPITALIZATION PORTFOLIO |
| SCHEDULE OF INVESTMENTS (Unaudited) (Continued) |
| February 28, 2023 |
| Shares | | | | | Fair Value | |
| | | | | COMMON STOCKS — 92.9% (Continued) | | | | |
| | | | | SOFTWARE - 4.5% (Continued) | | | | |
| | 675 | | | Tyler Technologies, Inc.(a) | | $ | 216,844 | |
| | | | | | | | 491,560 | |
| | | | | SPECIALTY FINANCE - 1.7% | | | | |
| | 20,175 | | | New Residential Investment Corporation | | | 183,593 | |
| | | | | | | | | |
| | | | | TECHNOLOGY HARDWARE - 3.2% | | | | |
| | 1,325 | | | Motorola Solutions, Inc. | | | 348,223 | |
| | | | | | | | | |
| | | | | TECHNOLOGY SERVICES - 9.8% | | | | |
| | 845 | | | CACI International, Inc., Class A(a) | | | 247,585 | |
| | 755 | | | CDW Corporation | | | 152,827 | |
| | 430 | | | Equifax, Inc. | | | 87,088 | |
| | 760 | | | FactSet Research Systems, Inc. | | | 315,058 | |
| | 3,500 | | | MAXIMUS, Inc. | | | 287,280 | |
| | | | | | | | 1,089,838 | |
| | | | | WHOLESALE - CONSUMER STAPLES - 1.0% | | | | |
| | 1,860 | | | Performance Food Group Company(a) | | | 105,258 | |
| | | | | | | | | |
| | | | | TOTAL COMMON STOCKS (Cost $7,536,564) | | | 10,252,891 | |
| | | | | | | | | |
| | | | | SHORT-TERM INVESTMENT — 7.7% | | | | |
| | | | | MONEY MARKET FUND - 7.7% | | | | |
| | 855,134 | | | Dreyfus Institutional Preferred Government Money Market Fund Institutional Class, Institutional Class, 4.54% (Cost $855,134)(b) | | | 855,134 | |
| | | | | | | | | |
| | | | | TOTAL INVESTMENTS - 100.6% (Cost $8,391,698) | | $ | 11,108,025 | |
| | | | | LIABILITIES IN EXCESS OF OTHER ASSETS - (0.6)% | | | (69,141 | ) |
| | | | | NET ASSETS - 100.0% | | $ | 11,038,884 | |
| LTD | - Limited Company |
| | |
| PLC | - Public Limited Company |
| (a) | Non-income producing security. |
| (b) | Rate disclosed is the seven day effective yield as of February 28, 2023. |
See accompanying notes to financial statements.
| SARATOGA SMALL CAPITALIZATION PORTFOLIO |
| SCHEDULE OF INVESTMENTS (Unaudited) |
| February 28, 2023 |
| Shares | | | | | Fair Value | |
| | | | | COMMON STOCKS — 95.7% | | | | |
| | | | | AEROSPACE & DEFENSE - 0.5% | | | | |
| | 16,428 | | | AMMO, Inc.(a),(b) | | $ | 32,035 | |
| | | | | | | | | |
| | | | | APPAREL & TEXTILE PRODUCTS - 1.0% | | | | |
| | 483 | | | Crocs, Inc.(a) | | | 58,786 | |
| | | | | | | | | |
| | | | | ASSET MANAGEMENT - 0.9% | | | | |
| | 1,704 | | | Artisan Partners Asset Management, Inc., Class A | | | 56,181 | |
| | | | | | | | | |
| | | | | BANKING - 11.7% | | | | |
| | 915 | | | 1st Source Corporation | | | 45,585 | |
| | 1,424 | | | Amalgamated Financial Corporation | | | 33,535 | |
| | 1,297 | | | Bank of NT Butterfield & Son Ltd. (The) | | | 46,887 | |
| | 814 | | | Banner Corporation | | | 51,266 | |
| | 661 | | | City Holding Company | | | 64,910 | |
| | 3,052 | | | Eastern Bankshares, Inc. | | | 47,855 | |
| | 992 | | | First Bancorp | | | 41,158 | |
| | 3,586 | | | Fulton Financial Corporation | | | 61,679 | |
| | 2,950 | | | Home BancShares, Inc. | | | 71,095 | |
| | 865 | | | Nicolet Bankshares, Inc.(a) | | | 64,408 | |
| | 763 | | | Preferred Bank | | | 53,715 | |
| | 2,518 | | | United Community Banks, Inc. | | | 83,371 | |
| | 941 | | | Westamerica BanCorporation | | | 51,868 | |
| | | | | | | | 717,332 | |
| | | | | BIOTECH & PHARMA - 1.4% | | | | |
| | 2,365 | | | Alkermes plc(a) | | | 63,240 | |
| | 458 | | | Intra-Cellular Therapies, Inc.(a) | | | 22,456 | |
| | | | | | | | 85,696 | |
| | | | | CHEMICALS - 2.7% | | | | |
| | 483 | | | Balchem Corporation | | | 62,790 | |
| | 534 | | | Quaker Houghton(b) | | | 104,546 | |
| | | | | | | | 167,336 | |
| | | | | COMMERCIAL SUPPORT SERVICES - 2.0% | | | | |
| | 407 | | | AMN Healthcare Services, Inc.(a) | | | 36,634 | |
| | 712 | | | Korn Ferry | | | 39,794 | |
See accompanying notes to financial statements.
| SARATOGA SMALL CAPITALIZATION PORTFOLIO |
| SCHEDULE OF INVESTMENTS (Unaudited) (Continued) |
| February 28, 2023 |
| Shares | | | | | Fair Value | |
| | | | | COMMON STOCKS — 95.7% (Continued) | | | | |
| | | | | COMMERCIAL SUPPORT SERVICES - 2.0% (Continued) | | | | |
| | 2,518 | | | Resources Connection, Inc. | | $ | 45,475 | |
| | | | | | | | 121,903 | |
| | | | | CONSTRUCTION MATERIALS - 0.8% | | | | |
| | 432 | | | Simpson Manufacturing Company, Inc. | | | 46,596 | |
| | | | | | | | | |
| | | | | CONSUMER SERVICES - 2.0% | | | | |
| | 2,009 | | | Chegg, Inc.(a) | | | 31,923 | |
| | 2,390 | | | Coursera, Inc.(a) | | | 26,935 | |
| | 1,475 | | | Stride, Inc.(a) | | | 62,644 | |
| | | | | | | | 121,502 | |
| | | | | ELECTRICAL EQUIPMENT - 5.2% | | | | |
| | 966 | | | AAON, Inc. | | | 87,868 | |
| | 585 | | | Badger Meter, Inc. | | | 71,148 | |
| | 509 | | | Novanta, Inc.(a) | | | 79,867 | |
| | 432 | | | Watts Water Technologies, Inc., Class A | | | 75,699 | |
| | | | | | | | 314,582 | |
| | | | | ENGINEERING & CONSTRUCTION - 2.7% | | | | |
| | 687 | | | EMCOR Group, Inc. | | | 114,880 | |
| | 1,246 | | | Sterling Infrastructure, Inc.(a) | | | 47,921 | |
| | | | | | | | 162,801 | |
| | | | | FOOD - 3.4% | | | | |
| | 2,670 | | | BellRing Brands, Inc.(a) | | | 82,450 | |
| | 1,297 | | | Cal-Maine Foods, Inc. | | | 73,670 | |
| | 3,026 | | | Utz Brands, Inc.(b) | | | 49,626 | |
| | | | | | | | 205,746 | |
| | | | | FORESTRY, PAPER & WOOD PRODUCTS - 0.7% | | | | |
| | 610 | | | Boise Cascade Company | | | 42,157 | |
| | | | | | | | | |
| | | | | HEALTH CARE FACILITIES & SERVICES - 3.2% | | | | |
| | 254 | | | Medpace Holdings, Inc.(a) | | | 49,246 | |
| | 305 | | | Molina Healthcare, Inc.(a) | | | 83,975 | |
| | 1,551 | | | Progyny, Inc.(a) | | | 58,256 | |
| | | | | | | | 191,477 | |
See accompanying notes to financial statements.
| SARATOGA SMALL CAPITALIZATION PORTFOLIO |
| SCHEDULE OF INVESTMENTS (Unaudited) (Continued) |
| February 28, 2023 |
| Shares | | | | | Fair Value | |
| | | | | COMMON STOCKS — 95.7% (Continued) | | | | |
| | | | | HOME CONSTRUCTION - 0.5% | | | | |
| | 1,958 | | | Forestar Group, Inc.(a) | | $ | 27,941 | |
| | | | | | | | | |
| | | | | HOTEL REIT - 1.0% | | | | |
| | 4,221 | | | Pebblebrook Hotel Trust(b) | | | 60,234 | |
| | | | | | | | | |
| | | | | INDUSTRIAL INTERMEDIATE PROD - 1.8% | | | | |
| | 6,561 | | | Janus International Group, Inc.(a) | | | 68,169 | |
| | 178 | | | RBC Bearings, Inc.(a) | | | 40,906 | |
| | | | | | | | 109,075 | |
| | | | | INDUSTRIAL SUPPORT SERVICES - 6.1% | | | | |
| | 915 | | | Applied Industrial Technologies, Inc. | | | 130,717 | |
| | 432 | | | Herc Holdings, Inc. | | | 62,031 | |
| | 381 | | | Transcat, Inc.(a) | | | 34,286 | |
| | 890 | | | WESCO International, Inc.(a) | | | 147,367 | |
| | | | | | | | 374,401 | |
| | | | | INSURANCE - 0.7% | | | | |
| | 2,518 | | | Lemonade, Inc.(a),(b) | | | 41,043 | |
| | | | | | | | | |
| | | | | INTERNET MEDIA & SERVICES - 0.7% | | | | |
| | 1,704 | | | HealthStream, Inc.(a) | | | 43,708 | |
| | | | | | | | | |
| | | | | LEISURE FACILITIES & SERVICES - 1.6% | | | | |
| | 1,831 | | | International Game Technology plc | | | 48,631 | |
| | 280 | | | Wingstop, Inc. | | | 47,698 | |
| | | | | | | | 96,329 | |
| | | | | LEISURE PRODUCTS - 1.1% | | | | |
| | 585 | | | Fox Factory Holding Corporation(a) | | | 68,738 | |
| | | | | | | | | |
| | | | | MACHINERY - 3.9% | | | | |
| | 1,068 | | | Cactus, Inc., Class A | | | 49,075 | |
| | 2,136 | | | Hillenbrand, Inc. | | | 100,690 | |
| | 585 | | | Lindsay Corporation | | | 88,037 | |
| | | | | | | | 237,802 | |
See accompanying notes to financial statements.
| SARATOGA SMALL CAPITALIZATION PORTFOLIO |
| SCHEDULE OF INVESTMENTS (Unaudited) (Continued) |
| February 28, 2023 |
| Shares | | | | | Fair Value | |
| | | | | COMMON STOCKS — 95.7% (Continued) | | | | |
| | | | | MEDICAL EQUIPMENT & DEVICES - 4.6% | | | | |
| | 4,272 | | | Adaptive Biotechnologies Corporation(a) | | $ | 36,526 | |
| | 2,823 | | | Castle Biosciences, Inc.(a) | | | 71,083 | |
| | 254 | | | Inspire Medical Systems, Inc.(a) | | | 66,022 | |
| | 356 | | | Shockwave Medical, Inc.(a) | | | 67,725 | |
| | 687 | | | STAAR Surgical Company(a),(b) | | | 38,053 | |
| | 1 | | | Zynex, Inc.(a) | | | 13 | |
| | | | | | | | 279,422 | |
| | | | | METALS & MINING - 2.2% | | | | |
| | 687 | | | Encore Wire Corporation(b) | | | 132,598 | |
| | | | | | | | | |
| | | | | MORTGAGE FINANCE - 1.8% | | | | |
| | 2,289 | | | Blackstone Mortgage Trust, Inc., Class A(b) | | | 48,458 | |
| | 5,239 | | | Ladder Capital Corporation | | | 59,201 | |
| | | | | | | | 107,659 | |
| | | | | OFFICE REIT - 1.0% | | | | |
| | 3,077 | | | Equity Commonwealth | | | 65,324 | |
| | | | | | | | | |
| | | | | OIL & GAS PRODUCERS - 2.3% | | | | |
| | 1,424 | | | Matador Resources Company | | | 76,596 | |
| | 254 | | | Murphy USA, Inc. | | | 64,793 | |
| | | | | | | | 141,389 | |
| | | | | OIL & GAS SERVICES & EQUIPMENT - 1.9% | | | | |
| | 1,297 | | | Helmerich & Payne, Inc. | | | 54,578 | |
| | 2,187 | | | Patterson-UTI Energy, Inc. | | | 29,962 | |
| | 3,179 | | | ProPetro Holding Corporation(a) | | | 28,007 | |
| | | | | | | | 112,547 | |
| | | | | REAL ESTATE INVESTMENT TRUSTS - 0.8% | | | | |
| | 5,213 | | | GEO Group, Inc. (The)(a),(b) | | | 45,666 | |
| | | | | | | | | |
| | | | | REAL ESTATE OWNERS & DEVELOPERS - 0.8% | | | | |
| | 458 | | | McGrath RentCorporation | | | 47,101 | |
See accompanying notes to financial statements.
| SARATOGA SMALL CAPITALIZATION PORTFOLIO |
| SCHEDULE OF INVESTMENTS (Unaudited) (Continued) |
| February 28, 2023 |
| Shares | | | | | Fair Value | |
| | | | | COMMON STOCKS — 95.7% (Continued) | | | | |
| | | | | RETAIL - CONSUMER STAPLES - 1.3% | | | | |
| | 1,093 | | | BJ’s Wholesale Club Holdings, Inc.(a) | | $ | 78,477 | |
| | | | | | | | | |
| | | | | RETAIL - DISCRETIONARY - 6.6% | | | | |
| | 1,780 | | | Academy Sports & Outdoors, Inc. | | | 105,287 | |
| | 127 | | | Avis Budget Group, Inc.(a) | | | 27,897 | |
| | 1,322 | | | Buckle, Inc. (The) | | | 53,924 | |
| | 1,273 | | | Builders FirstSource, Inc.(a) | | | 107,924 | |
| | 2,492 | | | Macy’s, Inc. | | | 50,986 | |
| | 788 | | | Signet Jewelers Ltd.(b) | | | 56,437 | |
| | | | | | | | 402,455 | |
| | | | | SEMICONDUCTORS - 1.0% | | | | |
| | 636 | | | Diodes, Inc.(a) | | | 58,315 | |
| | | | | | | | | |
| | | | | SOFTWARE - 3.8% | | | | |
| | 788 | | | Blackline, Inc.(a) | | | 53,868 | |
| | 1,628 | | | Digi International, Inc.(a) | | | 54,325 | |
| | 1,297 | | | Phreesia, Inc.(a) | | | 47,730 | |
| | 356 | | | Qualys, Inc.(a) | | | 42,061 | |
| | 229 | | | SPS Commerce, Inc.(a) | | | 34,497 | |
| | | | | | | | 232,481 | |
| | | | | SPECIALTY FINANCE - 1.5% | | | | |
| | 814 | | | GATX Corporation | | | 88,800 | |
| | 31 | | | PROG Holdings, Inc.(a) | | | 766 | |
| | | | | | | | 89,566 | |
| | | | | SPECIALTY REIT - 0.7% | | | | |
| | 1,272 | | | Hannon Armstrong Sustainable Infrastructure | | | 39,954 | |
| | | | | | | | | |
| | | | | STEEL - 0.6% | | | | |
| | 661 | | | Commercial Metals Company | | | 34,207 | |
| | | | | | | | | |
| | | | | TECHNOLOGY HARDWARE - 3.7% | | | | |
| | 1,831 | | | NetScout Systems, Inc.(a) | | | 52,074 | |
| | 2,289 | | | PagerDuty, Inc.(a) | | | 68,349 | |
| | 483 | | | Super Micro Computer, Inc.(a) | | | 47,320 | |
See accompanying notes to financial statements.
| SARATOGA SMALL CAPITALIZATION PORTFOLIO |
| SCHEDULE OF INVESTMENTS (Unaudited) (Continued) |
| February 28, 2023 |
| Shares | | | | | Fair Value | |
| | | | | COMMON STOCKS — 95.7% (Continued) | | | | |
| | | | | TECHNOLOGY HARDWARE - 3.7% (Continued) | | | | |
| | 4,450 | | | TTM Technologies, Inc.(a) | | $ | 59,140 | |
| | | | | | | | 226,883 | |
| | | | | TECHNOLOGY SERVICES - 0.6% | | | | |
| | 1,450 | | | I3 Verticals, Inc., Class A(a) | | | 35,685 | |
| | | | | | | | | |
| | | | | TELECOMMUNICATIONS - 1.3% | | | | |
| | 1,221 | | | Iridium Communications, Inc.(a) | | | 74,932 | |
| | | | | | | | | |
| | | | | TRANSPORTATION & LOGISTICS - 2.0% | | | | |
| | 3,052 | | | Heartland Express, Inc. | | | 49,229 | |
| | 661 | | | Matson, Inc. | | | 43,963 | |
| | 992 | | | Universal Logistics Holdings, Inc. | | | 29,462 | |
| | | | | | | | 122,654 | |
| | | | | WHOLESALE - CONSUMER STAPLES - 1.6% | | | | |
| | 1,602 | | | Chefs’ Warehouse, Inc. (The)(a) | | | 52,145 | |
| | 814 | | | Performance Food Group Company(a) | | | 46,064 | |
| | | | | | | | 98,209 | |
| | | | | | | | | |
| | | | | TOTAL COMMON STOCKS (Cost $5,266,352) | | | 5,808,925 | |
| | | | | | | | | |
| Principal | | | | | | |
| Amount ($) | | | | | | |
| | | | | COLLATERAL FOR SECURITIES LOANED – 2.0% | | | | |
| | | | | | | | | |
| | | | | REPURCHASE AGREEMENT — 2.0% | | | | |
| | 120,017 | | | BNP Paribas SA, dated 02/28/2023, due 3/1/2023, 4.550%, total to be received $122,417 (Collateralized by various US Government agency obligations, due 12/26/2024-01/15/2058, 0.000%-7.500% totaling $122,125)(c) | | | | |
| | | | | | | | | |
| | | | | TOTAL REPURCHASE AGREEMENTS (Cost $120,017) | | | 120,017 | |
See accompanying notes to financial statements.
| SARATOGA SMALL CAPITALIZATION PORTFOLIO |
| SCHEDULE OF INVESTMENTS (Unaudited) (Continued) |
| February 28, 2023 |
| Shares | | | | | Fair Value | |
| | | | | SHORT-TERM INVESTMENT — 4.7% | | | | |
| | | | | MONEY MARKET FUND - 4.7% | | | | |
| | 282,836 | | | Dreyfus Institutional Preferred Government Money Market Fund Institutional Class, Institutional Class, 4.54% (Cost $282,836)(d) | | $ | 282,836 | |
| | | | | | | | | |
| | | | | TOTAL INVESTMENTS - 102.4% (Cost $5,669,205) | | $ | 6,211,778 | |
| | | | | LIABILITIES IN EXCESS OF OTHER ASSETS - (2.4)% | | | (145,424 | ) |
| | | | | NET ASSETS - 100.0% | | $ | 6,066,354 | |
| LTD | - Limited Company |
| | |
| PLC | - Public Limited Company |
| | |
| REIT | - Real Estate Investment Trust |
| (a) | Non-income producing security. |
| (b) | All or a portion of the security is on loan. The total fair value of the securities on loan as of February 28, 2023 was $558,252. |
| (c) | Security was purchased with cash received as collateral for securities on loan at February 28, 2023. Total collateral had a value of $120,017 at February 28, 2023. Additional collateral received from the borrower not disclosed in the Schedule of investments had a value of $459,342 on February 28, 2023. |
| (d) | Rate disclosed is the seven day effective yield as of February 28, 2023. |
See accompanying notes to financial statements.
| SARATOGA INTERNATIONAL EQUITY PORTFOLIO |
| SCHEDULE OF INVESTMENTS (Unaudited) |
| February 28, 2023 |
| Shares | | | | | Fair Value | |
| | | | | COMMON STOCKS — 97.9% | | | | |
| | | | | Australia - 4.4% | | | | |
| | 640 | | | Macquarie Group Ltd. | | $ | 81,242 | |
| | 27,500 | | | Stockland Corp. Ltd. | | | 70,815 | |
| | | | | | | | 152,057 | |
| | | | | Canada - 4.4% | | | | |
| | 790 | | | Bank of Montreal | | | 74,869 | |
| | 1,170 | | | Restaurant Brands International, Inc. | | | 75,453 | |
| | | | | | | | 150,322 | |
| | | | | Cayman Islands - 1.9% | | | | |
| | 2,900 | | | JD.com, Inc. | | | 64,465 | |
| | | | | | | | | |
| | | | | China - 6.6% | | | | |
| | 2,500 | | | BYD Company Ltd., H Shares | | | 67,209 | |
| | 14,700 | | | China Merchants Bank Company Ltd., H Shares | | | 79,767 | |
| | 8,000 | | | Tsingtao Brewery Company, Ltd. | | | 78,956 | |
| | | | | | | | 225,932 | |
| | | | | Denmark - 2.8% | | | | |
| | 690 | | | Novo Nordisk A/S, Class B(a) | | | 97,462 | |
| | | | | | | | | |
| | | | | Finland - 2.3% | | | | |
| | 16,900 | | | Nokia Corporation | | | 78,209 | |
| | | | | | | | | |
| | | | | France - 4.8% | | | | |
| | 810 | | | Arkema S.A. | | | 82,139 | |
| | 1,410 | | | Compagnie de Saint-Gobain | | | 83,808 | |
| | | | | | | | 165,947 | |
| | | | | Germany - 9.8% | | | | |
| | 343 | | | Allianz SE(a) | | | 80,562 | |
| | 7,850 | | | Deutsche Lufthansa AG(b) | | | 81,353 | |
| | 2,070 | | | GEA Group AG | | | 91,022 | |
| | 450 | | | Merck KGaA | | | 85,294 | |
| | | | | | | | 338,231 | |
| | | | | Indonesia - 2.3% | | | | |
| | 257,300 | | | Bank Rakyat Indonesia Persero Tbk PT | | | 78,797 | |
See accompanying notes to financial statements.
| SARATOGA INTERNATIONAL EQUITY PORTFOLIO |
| SCHEDULE OF INVESTMENTS (Unaudited) (Continued) |
| February 28, 2023 |
| Shares | | | | | Fair Value | |
| | | | | COMMON STOCKS — 97.9% (Continued) | | | | |
| | | | | Italy - 2.3% | | | | |
| | 5,500 | | | Eni SpA | | $ | 77,703 | |
| | | | | | | | | |
| | | | | Japan - 15.4% | | | | |
| | 500 | | | HIROSE ELECTRIC CO LTD | | | 61,140 | |
| | 2,353 | | | Hoshizaki Corporation | | | 83,426 | |
| | 2,800 | | | Nippon Yusen KK | | | 72,789 | |
| | 1,000 | | | Sony Corporation(a) | | | 83,626 | |
| | 2,100 | | | Sumitomo Mitsui Financial Group, Inc. | | | 91,726 | |
| | 3,600 | | | Tokyo Gas Company Ltd. | | | 69,444 | |
| | 1,800 | | | Toyota Tsusho Corp. | | | 73,420 | |
| | | | | | | | 535,571 | |
| | | | | Jersey - 2.7% | | | | |
| | 7,510 | | | WPP plc(a) | | | 92,362 | |
| | | | | | | | | |
| | | | | Korea (Republic of) - 2.4% | | | | |
| | 1,430 | | | Kia Motors Corporation(a) | | | 81,426 | |
| | | | | | | | | |
| | | | | Korea (Republic Of) - 2.3% | | | | |
| | 840 | | | Orion Corporation of Republic of Korea | | | 79,555 | |
| | | | | | | | | |
| | | | | Mexico - 2.2% | | | | |
| | 18,980 | | | Wal-Mart de Mexico S.A.B de C.V. | | | 74,786 | |
| | | | | | | | | |
| | | | | Netherlands - 5.6% | | | | |
| | 5,950 | | | ABN AMRO Bank N.V. - ADR | | | 105,022 | |
| | 1,900 | | | STMicroelectronics N.V. | | | 91,037 | |
| | | | | | | | 196,059 | |
| | | | | South Africa - 1.7% | | | | |
| | 6,970 | | | Mr. Price Group Ltd. | | | 57,802 | |
| | | | | | | | | |
| | | | | Spain - 2.7% | | | | |
| | 23,880 | | | Banco Santander S.A. | | | 94,050 | |
See accompanying notes to financial statements.
| SARATOGA INTERNATIONAL EQUITY PORTFOLIO |
| SCHEDULE OF INVESTMENTS (Unaudited) (Continued) |
| February 28, 2023 |
| Shares | | | | | Fair Value | |
| | | | | COMMON STOCKS — 97.9% (Continued) | | | | |
| | | | | Switzerland - 2.8% | | | | |
| | 4,430 | | | UBS Group AG(a) | | $ | 96,291 | |
| | | | | | | | | |
| | | | | Taiwan - 1.9% | | | | |
| | 7,000 | | | Delta Electronics, Inc. | | | 65,249 | |
| | | | | | | | | |
| | | | | Taiwan Province of China - 2.6% | | | | |
| | 1,010 | | | Taiwan Semiconductor Manufacturing Company Ltd. - ADR | | | 87,941 | |
| | | | | | | | | |
| | | | | Thailand - 2.4% | | | | |
| | 13,700 | | | Bumrungrad Hospital PCL | | | 82,051 | |
| | | | | | | | | |
| | | | | United Kingdom - 11.6% | | | | |
| | 1,880 | | | Anglo American plc | | | 64,960 | |
| | 38,360 | | | Barclays plc | | | 80,498 | |
| | 2,430 | | | BP plc - ADR | | | 96,227 | |
| | 1,400 | | | Coca-Cola European Partners plc | | | 77,000 | |
| | 1,210 | | | InterContinental Hotels Group plc | | | 81,564 | |
| | | | | | | | 400,249 | |
| | | | | | | | | |
| | | | | TOTAL COMMON STOCKS (Cost $3,029,302) | | | 3,372,517 | |
| | | | | | | | | |
| | | | | SHORT-TERM INVESTMENTS — 2.0% | | | | |
| | | | | MONEY MARKET FUNDS - 2.0% | | | | |
| | 69,875 | | | Dreyfus Institutional Preferred Government Money, Institutional Class, 4.54% (Cost $69,875)(c) | | | 69,875 | |
| | | | | | | | | |
| | | | | TOTAL INVESTMENTS - 99.9% (Cost $3,099,177) | | $ | 3,442,392 | |
| | | | | OTHER ASSETS IN EXCESS OF LIABILITIES- 0.1% | | | 2,558 | |
| | | | | NET ASSETS - 100.0% | | $ | 3,444,950 | |
| ADR | - American Depositary Receipt |
| | |
| A/S | - Anonim Sirketi |
| | |
| LTD | - Limited Company |
| | |
| PLC | - Public Limited Company |
| | |
| S/A | - Société Anonyme |
See accompanying notes to financial statements.
| SARATOGA INTERNATIONAL EQUITY PORTFOLIO |
| SCHEDULE OF INVESTMENTS (Unaudited) |
| February 28, 2023 (Unaudited) |
| | | | | | | | | | | | | Unrealized | |
| | | | | | | | | | | | | Appreciation/ | |
| Foreign Currency | | Settlement Date | | Counterparty | | Local Currency | | | U.S. Dollar Value | | | (Depreciation) | |
| To Sell: | | | | | | | | | | | | | | | | |
| Canadian Dollar | | 03/01/2023 | | Bank of NY | | | 1,072 | | | $ | 786 | | | $ | 2 | |
| Australian Dollar | | 03/02/2023 | | Bank of NY | | | 2,712 | | | | 1,824 | | | | (1 | ) |
| | | | | | | | | | | $ | 2,610 | | | $ | 1 | |
| | | | | | | | | | | | | | | | | |
| Total | | | | | | | | | | | | | | $ | 1 | |
| (a) | The value of this security has been determined in good faith under policies of the Board of Trustees. |
| (b) | Non-income producing security. |
| (c) | Rate disclosed is the seven day effective yield as of February 28, 2023. |
See accompanying notes to financial statements.
| SARATOGA HEALTH & BIOTECHNOLOGY FUND |
| SCHEDULE OF INVESTMENTS (Unaudited) |
| February 28, 2023 |
| Shares | | | | | Fair Value | |
| | | | | COMMON STOCKS — 94.3% | | | | |
| | | | | BIOTECH & PHARMA - 45.3% | | | | |
| | 2,965 | | | AbbVie, Inc. | | $ | 456,314 | |
| | 2,685 | | | Amgen, Inc. | | | 622,008 | |
| | 1,184 | | | Biogen, Inc.(a) | | | 319,514 | |
| | 19,368 | | | Exelixis, Inc.(a) | | | 330,805 | |
| | 3,068 | | | Gilead Sciences, Inc. | | | 247,066 | |
| | 26,340 | | | Ironwood Pharmaceuticals, Inc.(a),(b) | | | 296,852 | |
| | 2,320 | | | Johnson & Johnson | | | 355,563 | |
| | 4,350 | | | Merck & Company, Inc. | | | 462,144 | |
| | 2,366 | | | Moderna, Inc.(a) | | | 328,424 | |
| | 3,591 | | | Novartis A.G. - ADR | | | 302,075 | |
| | 7,668 | | | Pfizer, Inc. | | | 311,091 | |
| | 720 | | | Regeneron Pharmaceuticals, Inc.(a) | | | 547,502 | |
| | 1,782 | | | United Therapeutics Corporation(a) | | | 438,443 | |
| | 1,390 | | | Vertex Pharmaceuticals, Inc.(a) | | | 403,503 | |
| | | | | | | | 5,421,304 | |
| | | | | HEALTH CARE FACILITIES & SERVICES - 37.2% | | | | |
| | 2,665 | | | AmerisourceBergen Corporation | | | 414,566 | |
| | 4,969 | | | Cardinal Health, Inc. | | | 376,203 | |
| | 4,900 | | | Centene Corporation(a) | | | 335,160 | |
| | 1,136 | | | Cigna Group (The) | | | 331,826 | |
| | 764 | | | Elevance Health, Inc. | | | 358,828 | |
| | 4,099 | | | Ensign Group, Inc. (The) | | | 366,779 | |
| | 630 | | | Humana, Inc. | | | 311,863 | |
| | 1,665 | | | Laboratory Corp of America Holdings | | | 398,534 | |
| | 1,150 | | | McKesson Corporation | | | 402,281 | |
| | 842 | | | Molina Healthcare, Inc.(a) | | | 231,828 | |
| | 2,110 | | | Quest Diagnostics, Inc. | | | 291,940 | |
| | 4,221 | | | Tenet Healthcare Corporation(a) | | | 247,055 | |
| | 800 | | | UnitedHealth Group, Inc. | | | 380,752 | |
| | | | | | | | 4,447,615 | |
| | | | | MEDICAL EQUIPMENT & DEVICES - 11.8% | | | | |
| | 896 | | | Bio-Rad Laboratories, Inc., Class A(a) | | | 428,144 | |
| | 1,422 | | | Intuitive Surgical, Inc.(a) | | | 326,193 | |
| | 4,811 | | | Medtronic plc | | | 398,351 | |
See accompanying notes to financial statements.
| SARATOGA HEALTH & BIOTECHNOLOGY FUND |
| SCHEDULE OF INVESTMENTS (Unaudited) (Continued) |
| February 28, 2023 |
| Shares | | | | | Fair Value | |
| | | | | COMMON STOCKS — 94.3% (Continued) | | | | |
| | | | | MEDICAL EQUIPMENT & DEVICES - 11.8% (Continued) | | | | |
| | 1,003 | | | Stryker Corporation | | $ | 263,669 | |
| | | | | | | | 1,416,357 | |
| | | | | | | | | |
| | | | | TOTAL COMMON STOCKS (Cost $8,826,214) | | | 11,285,276 | |
| | | | | | | | | |
| | | | | SHORT-TERM INVESTMENT — 5.1% | | | | |
| | | | | MONEY MARKET FUND - 5.1% | | | | |
| | 604,270 | | | Dreyfus Institutional Preferred Government Money Market Fund Institutional Class, Institutional Class, 4.54% (Cost $604,270)(c) | | | 604,270 | |
| | | | | | | | | |
| | | | | TOTAL INVESTMENTS - 99.4% (Cost $9,430,484) | | $ | 11,889,546 | |
| | | | | OTHER ASSETS IN EXCESS OF LIABILITIES- 0.6% | | | 67,376 | |
| | | | | NET ASSETS - 100.0% | | $ | 11,956,922 | |
| ADR | - American Depositary Receipt |
| | |
| PLC | - Public Limited Company |
| (a) | Non-income producing security. |
| (b) | Security was purchased with cash received as collateral for securities on loan at February 28, 2023. Total collateral had a value of $137,199 at February 28, 2023. |
| (c) | Rate disclosed is the seven day effective yield as of February 28, 2023. |
See accompanying notes to financial statements.
| SARATOGA TECHNOLOGY & COMMUNICATION PORTFOLIO |
| SCHEDULE OF INVESTMENTS (Unaudited) |
| February 28, 2023 |
| Shares | | | | | Fair Value | |
| | | | | COMMON STOCKS — 97.8% | | | | |
| | | | | E-COMMERCE DISCRETIONARY - 8.4% | | | | |
| | 20,660 | | | Amazon.com, Inc.(a) | | $ | 1,946,792 | |
| | 19,638 | | | eBay, Inc. | | | 901,384 | |
| | | | | | | | 2,848,176 | |
| | | | | ENTERTAINMENT CONTENT - 3.5% | | | | |
| | 15,455 | | | Activision Blizzard, Inc. | | | 1,178,444 | |
| | | | | | | | | |
| | | | | INTERNET MEDIA & SERVICES - 12.2% | | | | |
| | 6,000 | | | Alphabet, Inc., Class A(a) | | | 540,360 | |
| | 24,170 | | | Alphabet, Inc., Class C(a) | | | 2,182,551 | |
| | 8,073 | | | Meta Platforms, Inc., Class A(a) | | | 1,412,291 | |
| | | | | | | | 4,135,202 | |
| | | | | SEMICONDUCTORS - 13.9% | | | | |
| | 24,038 | | | Intel Corporation | | | 599,267 | |
| | 4,170 | | | KLA Corporation | | | 1,582,015 | |
| | 3,291 | | | NVIDIA Corporation | | | 764,039 | |
| | 14,420 | | | QUALCOMM, Inc. | | | 1,781,302 | |
| | | | | | | | 4,726,623 | |
| | | | | SOFTWARE - 23.1% | | | | |
| | 12,790 | | | Akamai Technologies, Inc.(a) | | | 928,554 | |
| | 7,542 | | | Microsoft Corporation | | | 1,881,127 | |
| | 19,926 | | | Oracle Corporation | | | 1,741,532 | |
| | 6,620 | | | Salesforce, Inc.(a) | | | 1,083,098 | |
| | 3,500 | | | Synopsys, Inc.(a) | | | 1,273,160 | |
| | 8,310 | | | VMware, Inc., Class A(a) | | | 915,180 | |
| | | | | | | | 7,822,651 | |
| | | | | TECHNOLOGY HARDWARE - 11.6% | | | | |
| | 12,004 | | | Apple, Inc. | | | 1,769,510 | |
| | 44,577 | | | Cisco Systems, Inc. | | | 2,158,418 | |
| | | | | | | | 3,927,928 | |
| | | | | TECHNOLOGY SERVICES - 25.1% | | | | |
| | 17,805 | | | Amdocs Ltd. | | | 1,631,116 | |
| | 11,963 | | | Cognizant Technology Solutions Corporation, Class A | | | 749,243 | |
| | 10,473 | | | Global Payments, Inc. | | | 1,175,071 | |
| | 5,795 | | | Jack Henry & Associates, Inc. | | | 951,771 | |
See accompanying notes to financial statements.
| SARATOGA TECHNOLOGY & COMMUNICATION PORTFOLIO |
| SCHEDULE OF INVESTMENTS (Unaudited) (Continued) |
| February 28, 2023 |
| Shares | | | | | Fair Value | |
| | | | | COMMON STOCKS — 97.8% (Continued) | | | | |
| | | | | TECHNOLOGY SERVICES - 25.1% (Continued) | | | | |
| | 3,236 | | | Mastercard, Inc., Class A | | $ | 1,149,718 | |
| | 12,062 | | | PayPal Holdings, Inc.(a) | | | 887,763 | |
| | 8,961 | | | Visa, Inc., Class A(b) | | | 1,970,881 | |
| | | | | | | | 8,515,563 | |
| | | | | TOTAL COMMON STOCKS (Cost $13,455,778) | | | 33,154,587 | |
| | | | | | | | | |
| | | | | SHORT-TERM INVESTMENT — 2.7% | | | | |
| | | | | MONEY MARKET FUND - 2.7% | | | | |
| | 915,582 | | | Dreyfus Institutional Preferred Government Money Market Fund Institutional Class, Institutional Class, 4.54% (Cost $915,582)(c) | | | 915,582 | |
| | | | | | | | | |
| | | | | TOTAL INVESTMENTS - 100.5% (Cost $14,371,360) | | $ | 34,070,169 | |
| | | | | LIABILITIES IN EXCESS OF OTHER ASSETS - (0.5)% | | | (183,217 | ) |
| | | | | NET ASSETS - 100.0% | | $ | 33,886,952 | |
| (a) | Non-income producing security. |
| (b) | All or a portion of the security is on loan. The total fair value of the securities on loan as of February 28, 2023 was $1,954,725. |
| (c) | Rate disclosed is the seven day effective yield as of February 28, 2023. |
See accompanying notes to financial statements.
| SARATOGA ENERGY & BASIC MATERIALS PORTFOLIO |
| SCHEDULE OF INVESTMENTS (Unaudited) |
| February 28, 2023 |
| Shares | | | | | Fair Value | |
| | | | | COMMON STOCKS — 97.4% | | | | |
| | | | | CHEMICALS - 15.1% | | | | |
| | 3,233 | | | BASF S.E. - ADR | | $ | 41,286 | |
| | 930 | | | Covestro A.G. - ADR | | | 20,441 | |
| | 682 | | | Dow, Inc. | | | 39,011 | |
| | 642 | | | Huntsman Corporation | | | 18,836 | |
| | 127 | | | Linde plc | | | 44,244 | |
| | 378 | | | LyondellBasell Industries N.V., Class A | | | 36,284 | |
| | 649 | | | Mosaic Company (The) | | | 34,520 | |
| | 104 | | | PPG Industries, Inc. | | | 13,734 | |
| | 151 | | | Westlake Corporation | | | 17,990 | |
| | | | | | | | 266,346 | |
| | | | | CONTAINERS & PACKAGING - 5.3% | | | | |
| | 690 | | | Berry Global Group, Inc. | | | 42,849 | |
| | 627 | | | International Paper Company | | | 22,817 | |
| | 871 | | | Westrock Company | | | 27,349 | |
| | | | | | | | 93,015 | |
| | | | | ENGINEERING & CONSTRUCTION - 0.2% | | | | |
| | 172 | | | Technip Energies N.V. - ADR | | | 3,323 | |
| | | | | | | | | |
| | | | | METALS & MINING - 14.3% | | | | |
| | 2,089 | | | Anglo American plc - ADR | | | 36,098 | |
| | 9,646 | | | B2Gold Corporation | | | 32,700 | |
| | 276 | | | BHP Group Ltd. - ADR | | | 16,828 | |
| | 522 | | | Freeport-McMoRan, Inc. | | | 21,386 | |
| | 2,945 | | | Glencore plc - ADR | | | 34,957 | |
| | 637 | | | Rio Tinto plc - ADR | | | 44,417 | |
| | 3,412 | | | Sibanye Stillwater Ltd. - ADR | | | 27,637 | |
| | 2,382 | | | Vale S.A. - ADR | | | 38,922 | |
| | | | | | | | 252,945 | |
| | | | | OIL & GAS PRODUCERS - 56.8% | | | | |
| | 1,408 | | | BP plc - ADR | | | 55,757 | |
| | 759 | | | Canadian Natural Resources Ltd. | | | 42,891 | |
| | 312 | | | Chesapeake Energy Corporation | | | 25,213 | |
| | 745 | | | Chevron Corporation | | | 119,774 | |
| | 399 | | | Civitas Resources, Inc. | | | 27,998 | |
See accompanying notes to financial statements.
| SARATOGA ENERGY & BASIC MATERIALS PORTFOLIO |
| SCHEDULE OF INVESTMENTS (Unaudited) (Continued) |
| February 28, 2023 |
| Shares | | | | | Fair Value | |
| | | | | COMMON STOCKS — 97.4% (Continued) | | | | |
| | | | | OIL & GAS PRODUCERS - 56.8% (Continued) | | | | |
| | 560 | | | ConocoPhillips | | $ | 57,876 | |
| | 271 | | | Diamondback Energy, Inc. | | | 38,097 | |
| | 1,972 | | | Eni SpA - ADR | | | 55,926 | |
| | 3,083 | | | EnLink Midstream, LLC | | | 34,715 | |
| | 372 | | | EOG Resources, Inc. | | | 42,043 | |
| | 582 | | | Equinor ASA - ADR | | | 17,757 | |
| | 4,867 | | | Equitrans Midstream Corporation | | | 29,348 | |
| | 1,210 | | | Exxon Mobil Corporation | | | 132,991 | |
| | 1,773 | | | Kinder Morgan, Inc. | | | 30,247 | |
| | 279 | | | Marathon Petroleum Corporation | | | 34,484 | |
| | 619 | | | Ovintiv, Inc. | | | 26,475 | |
| | 1,015 | | | PBF Energy, Inc., Class A | | | 44,366 | |
| | 1,149 | | | Shell plc - ADR | | | 69,825 | |
| | 1,625 | | | Suncor Energy, Inc. | | | 54,600 | |
| | 932 | | | TotalEnergies S.E. - ADR | | | 57,700 | |
| | 161 | | | Woodside Energy Group Ltd. - ADR | | | 3,917 | |
| | | | | | | | 1,002,000 | |
| | | | | OIL & GAS SERVICES & EQUIPMENT - 1.6% | | | | |
| | 528 | | | Schlumberger Ltd | | | 28,095 | |
| | | | | | | | | |
| | | | | STEEL - 4.1% | | | | |
| | 184 | | | Nucor Corporation | | | 30,809 | |
| | 692 | | | POSCO - ADR | | | 42,205 | |
| | | | | | | | 73,014 | |
| | | | | | | | | |
| | | | | TOTAL COMMON STOCKS (Cost $1,348,724) | | | 1,718,738 | |
See accompanying notes to financial statements.
| SARATOGA ENERGY & BASIC MATERIALS PORTFOLIO |
| SCHEDULE OF INVESTMENTS (Unaudited) (Continued) |
| February 28, 2023 |
| Shares | | | | | Fair Value | |
| | | | | SHORT-TERM INVESTMENT — 2.6% | | | | |
| | | | | MONEY MARKET FUND - 2.6% | | | | |
| | 46,336 | | | Dreyfus Institutional Preferred Government Money Market Fund Institutional Class, Institutional Class, 4.54% (Cost $46,336)(a) | | $ | 46,336 | |
| | | | | | | | | |
| | | | | TOTAL INVESTMENTS - 100.0% (Cost $1,395,060) | | $ | 1,765,074 | |
| | | | | OTHER ASSETS IN EXCESS OF LIABILITIES - 0.0% | | | 183 | |
| | | | | NET ASSETS - 100.0% | | $ | 1,765,257 | |
| ADR | - American Depositary Receipt |
| | |
| LLC | - Limited Liability Company |
| | |
| LTD | - Limited Company |
| | |
| PLC | - Public Limited Company |
| | |
| S/A | - Société Anonyme |
| (a) | Rate disclosed is the seven day effective yield as of February 28, 2023. |
See accompanying notes to financial statements.
| SARATOGA FINANCIAL SERVICES PORTFOLIO |
| SCHEDULE OF INVESTMENTS (Unaudited) |
| February 28, 2023 |
| Shares | | | | | Fair Value | |
| | | | | COMMON STOCKS — 97.9% | | | | |
| | | | | ASSET MANAGEMENT - 13.3% | | | | |
| | 51 | | | Ameriprise Financial, Inc. | | $ | 17,486 | |
| | 28 | | | BlackRock, Inc. | | | 19,304 | |
| | 483 | | | Blackstone, Inc. | | | 43,856 | |
| | 240 | | | Charles Schwab Corporation (The) | | | 18,701 | |
| | 32 | | | F&G Annuities & Life, Inc. | | | 652 | |
| | 423 | | | Raymond James Financial, Inc. | | | 45,879 | |
| | 590 | | | Stifel Financial Corporation | | | 39,430 | |
| | | | | | | | 185,308 | |
| | | | | BANKING - 33.1% | | | | |
| | 1,599 | | | Bank of America Corporation | | | 54,846 | |
| | 184 | | | Bank OZK | | | 8,470 | |
| | 1,111 | | | Citigroup, Inc. | | | 56,317 | |
| | 435 | | | East West Bancorp, Inc. | | | 33,151 | |
| | 348 | | | Fifth Third Bancorp | | | 12,632 | |
| | 454 | | | JPMorgan Chase & Company | | | 65,082 | |
| | 59 | | | PNC Financial Services Group, Inc. (The) | | | 9,317 | |
| | 483 | | | Popular, Inc. | | | 34,486 | |
| | 1,737 | | | Regions Financial Corporation | | | 40,507 | |
| | 717 | | | Synovus Financial Corporation | | | 29,978 | |
| | 220 | | | Truist Financial Corporation | | | 10,329 | |
| | 1,015 | | | US Bancorp | | | 48,446 | |
| | 920 | | | Wells Fargo & Company | | | 43,028 | |
| | 272 | | | Zions Bancorp NA | | | 13,769 | |
| | | | | | | | 460,358 | |
| | | | | INSTITUTIONAL FINANCIAL SERVICES - 11.3% | | | | |
| | 200 | | | Cboe Global Markets, Inc. | | | 25,234 | |
| | 247 | | | CME Group, Inc. | | | 45,784 | |
| | 60 | | | Goldman Sachs Group, Inc. (The) | | | 21,099 | |
| | 72 | | | Intercontinental Exchange, Inc. | | | 7,330 | |
| | 607 | | | Morgan Stanley | | | 58,575 | |
| | | | | | | | 158,022 | |
| | | | | INSURANCE - 28.6% | | | | |
| | 617 | | | Aflac, Inc. | | | 42,049 | |
| | 244 | | | American Financial Group, Inc. | | | 32,723 | |
See accompanying notes to financial statements.
| SARATOGA FINANCIAL SERVICES PORTFOLIO |
| SCHEDULE OF INVESTMENTS (Unaudited) (Continued) |
| February 28, 2023 |
| Shares | | | | | Fair Value | |
| | | | | COMMON STOCKS — 97.9% (Continued) | | | | |
| | | | | INSURANCE - 28.6% (Continued) | | | | |
| | 32 | | | Aon PLC, CLASS A | | $ | 9,730 | |
| | 61 | | | Arthur J Gallagher & Company | | | 11,428 | |
| | 137 | | | Axis Capital Holdings Ltd. | | | 8,319 | |
| | 390 | | | Berkshire Hathaway, Inc., Class B(a) | | | 119,019 | |
| | 279 | | | Chubb Ltd. | | | 58,874 | |
| | 147 | | | Marsh & McLennan Companies, Inc. | | | 23,835 | |
| | 662 | | | MetLife, Inc. | | | 47,485 | |
| | 84 | | | Progressive Corporation (The) | | | 12,056 | |
| | 267 | | | Voya Financial, Inc. | | | 19,889 | |
| | 210 | | | W R Berkley Corporation | | | 13,900 | |
| | | | | | | | 399,307 | |
| | | | | MORTGAGE FINANCE - 1.2% | | | | |
| | 1,604 | | | AGNC Investment Corporation | | | 17,435 | |
| | | | | | | | | |
| | | | | SPECIALTY FINANCE - 8.1% | | | | |
| | 116 | | | American Express Company | | | 20,183 | |
| | 246 | | | Capital One Financial Corporation | | | 26,834 | |
| | 180 | | | Discover Financial Services | | | 20,160 | |
| | 511 | | | Fidelity National Financial, Inc. | | | 20,368 | |
| | 726 | | | Synchrony Financial | | | 25,925 | |
| | | | | | | | 113,470 | |
| | | | | TECHNOLOGY SERVICES - 2.3% | | | | |
| | 16 | | | MSCI, Inc. | | | 8,354 | |
| | 68 | | | S&P Global, Inc. | | | 23,201 | |
| | | | | | | | 31,555 | |
| | | | | | | | | |
| | | | | TOTAL COMMON STOCKS (Cost $909,168) | | | 1,365,455 | |
See accompanying notes to financial statements.
| SARATOGA FINANCIAL SERVICES PORTFOLIO |
| SCHEDULE OF INVESTMENTS (Unaudited) (Continued) |
| February 28, 2023 |
| Shares | | | | | Fair Value | |
| | | | | SHORT-TERM INVESTMENT — 2.8% | | | | |
| | | | | MONEY MARKET FUND - 2.8% | | | | |
| | 39,049 | | | Dreyfus Institutional Preferred Government Money Market Fund Institutional Class, Institutional Class, 4.54% (Cost $39,049)(b) | | $ | 39,049 | |
| | | | | | | | | |
| | | | | TOTAL INVESTMENTS - 100.7% (Cost $948,217) | | $ | 1,404,504 | |
| | | | | LIABILITIES IN EXCESS OF OTHER ASSETS - (0.7)% | | | (9,071 | ) |
| | | | | NET ASSETS - 100.0% | | $ | 1,395,433 | |
| LTD | - Limited Company |
| | |
| MSCI | - Morgan Stanley Capital International |
| | |
| PLC | - Public Limited Company |
| (a) | Non-income producing security. |
| (b) | Rate disclosed is the seven day effective yield as of February 28, 2023. |
See accompanying notes to financial statements.
| SARATOGA INVESTMENT QUALITY BOND PORTFOLIO |
| SCHEDULE OF INVESTMENTS (Unaudited) |
| February 28, 2023 |
| Shares | | | | | Fair Value | |
| | | | | OPEN END FUNDS — 98.4% | | | | |
| | | | | FIXED INCOME - 98.4% | | | | |
| | 87,459 | | | Vanguard Short-Term Bond Index Fund, Admiral Class | | $ | 860,597 | |
| | 521,786 | | | Vanguard Ultra-Short-Term Bond Fund Admiral Class | | | 10,289,616 | |
| | | | | | | | 11,150,213 | |
| | | | | | | | | |
| | | | | TOTAL OPEN END FUNDS (Cost $11,456,607) | | | 11,150,213 | |
| | | | | | | | | |
| | | | | SHORT-TERM INVESTMENT — 2.2% | | | | |
| | | | | MONEY MARKET FUND - 2.2% | | | | |
| | 249,848 | | | Dreyfus Institutional Preferred Government Money Market Fund Institutional Class, 4.54% (Cost $249,848)(a) | | | 249,848 | |
| | | | | | | | | |
| | | | | TOTAL INVESTMENTS - 100.6% (Cost $11,706,455) | | $ | 11,400,061 | |
| | | | | LIABILITIES IN EXCESS OF OTHER ASSETS - (0.6)% | | | (68,768 | ) |
| | | | | NET ASSETS - 100.0% | | $ | 11,331,293 | |
| (a) | Rate disclosed is the seven day effective yield as of February 28, 2023. |
See accompanying notes to financial statements.
| SARATOGA MUNICIPAL BOND PORTFOLIO |
| SCHEDULE OF INVESTMENTS (Unaudited) |
| February 28, 2023 |
| Shares | | | | | Fair Value | |
| | | | | OPEN END FUNDS — 95.3% | | | | |
| | | | | FIXED INCOME - 95.3% | | | | |
| | 56,265 | | | JPMorgan Ultra-Short Municipal Fund, Class I | | $ | 556,461 | |
| | 3,014 | | | Vanguard Short-Term Tax-Exempt Fund, Admiral Class | | | 46,868 | |
| | | | | | | | 603,329 | |
| | | | | | | | | |
| | | | | TOTAL OPEN END FUNDS (Cost $614,531) | | | 603,329 | |
| | | | | | | | | |
| | | | | SHORT-TERM INVESTMENT — 4.5% | | | | |
| | | | | MONEY MARKET FUND - 4.5% | | | | |
| | 28,528 | | | Dreyfus AMT-Free Tax Exempt Cash Management, Institutional Class, 3.51% (Cost $28,526)(a) | | | 28,526 | |
| | | | | | | | | |
| | | | | TOTAL INVESTMENTS - 99.8% (Cost $643,057) | | $ | 631,855 | |
| | | | | OTHER ASSETS IN EXCESS OF LIABILITIES - 0.2% | | | 1,085 | |
| | | | | NET ASSETS - 100.0% | | $ | 632,940 | |
| (a) | Rate disclosed is the seven day effective yield as of February 28, 2023. |
See accompanying notes to financial statements.
| SARATOGA U.S. GOVERNMENT MONEY MARKET PORTFOLIO |
SCHEDULE OF INVESTMENTS (Unaudited) February 28, 2023 |
| Shares | | | | | Fair Value | |
| | | | | SHORT-TERM INVESTMENTS — 99.0% | | | | |
| | | | | MONEY MARKET FUNDS - 99.0% | | | | |
| | 1,229,494 | | | BlackRock Liquidity FedFund, Institutional Class, 4.42%(a) | | $ | 1,229,494 | |
| | 1,229,495 | | | Dreyfus Government Cash Management, Class I, 4.47%(a) | | | 1,229,495 | |
| | 1,229,495 | | | Federated Hermes Government Obligations Fund, Institutional Class, 4.40%(a) | | | 1,229,495 | |
| | 1,229,494 | | | JPMorgan US Government Money Market Fund, Capital Class, 4.38%(a) | | | 1,229,494 | |
| | | | | TOTAL MONEY MARKET FUNDS (Cost $4,917,978) | | | 4,917,978 | |
| | | | | | | | | |
| | | | | TOTAL SHORT-TERM INVESTMENTS (Cost $4,917,978) | | | 4,917,978 | |
| | | | | | | | | |
| | | | | TOTAL INVESTMENTS - 99.0% (Cost $4,917,978) | | $ | 4,917,978 | |
| | | | | OTHER ASSETS IN EXCESS OF LIABILITIES - 1.0% | | | 51,535 | |
| | | | | NET ASSETS - 100.0% | | $ | 4,969,513 | |
| (a) | Rate disclosed is the seven day effective yield as of February 28, 2023. |
See accompanying notes to financial statements.
| SARATOGA AGGRESSIVE BALANCED ALLOCATION PORTFOLIO |
| SCHEDULE OF INVESTMENTS (Unaudited) |
| February 28, 2023 |
| Shares | | | | | Fair Value | |
| | | | | OPEN END FUNDS — 92.1% | | | | |
| | | | | ALTERNATIVE - 9.9% | | | | |
| | 13,030 | | | Eaton Vance Global Macro Absolute Return Fund, Class I | | $ | 107,236 | |
| | | | | | | | | |
| | | | | EQUITY - 70.3% | | | | |
| | 2,726 | | | Saratoga Energy & Basic Materials Portfolio, Class I(a) | | | 35,767 | |
| | 1,934 | | | Saratoga Health & Biotechnology Portfolio, Class I(a) | | | 42,886 | |
| | 6,287 | | | Saratoga Large Capitalization Growth Portfolio, Class I(a) | | | 133,537 | |
| | 7,901 | | | Saratoga Large Capitalization Value Portfolio, Class I(a) | | | 199,889 | |
| | 9,794 | | | Saratoga Mid Capitalization Portfolio, Class I(a) | | | 117,139 | |
| | 1,752 | | | Saratoga Technology & Communications Portfolio, Class I(a) | | | 33,060 | |
| | 785 | | | Vanguard Financials Index Fund, Admiral Class | | | 34,393 | |
| | 966 | | | Vanguard Small-Cap Index Fund, Admiral Class | | | 91,393 | |
| | 2,447 | | | Vanguard Total International Stock Index Fund, Admiral Class | | | 70,878 | |
| | | | | | | | 758,942 | |
| | | | | FIXED INCOME - 11.9% | | | | |
| | 6,509 | | | Vanguard Ultra-Short-Term Bond Fund, Admiral Class | | | 128,352 | |
| | | | | | | | | |
| | | | | TOTAL OPEN END FUNDS (Cost $1,029,750) | | | 994,530 | |
| | | | | | | | | |
| | | | | SHORT-TERM INVESTMENT — 7.6% | | | | |
| | | | | MONEY MARKET FUND - 7.6% | | | | |
| | 82,005 | | | Dreyfus Institutional Preferred Government Money Market Fund, Institutional Class, 4.54% (Cost $82,005)(b) | | | 82,005 | |
| | | | | | | | | |
| | | | | TOTAL INVESTMENTS - 99.7% (Cost $1,111,755) | | $ | 1,076,535 | |
| | | | | OTHER ASSETS IN EXCESS OF LIABILITIES - 0.3% | | | 2,956 | |
| | | | | NET ASSETS - 100.0% | | $ | 1,079,491 | |
| (a) | Investment in affiliate. |
| (b) | Rate disclosed is the seven day effective yield as of February 28, 2023. |
See accompanying notes to financial statements.
| SARATOGA CONSERVATIVE BALANCED ALLOCATION PORTFOLIO |
SCHEDULE OF INVESTMENTS (Unaudited) February 28, 2023 |
| Shares | | | | | Fair Value | |
| | | | | OPEN END FUNDS — 71.6% | | | | |
| | | | | ALTERNATIVE - 7.5% | | | | |
| | 24,556 | | | Eaton Vance Global Macro Absolute Return Fund, Class I | | $ | 202,093 | |
| | | | | | | | | |
| | | | | EQUITY - 33.0% | | | | |
| | 11,371 | | | Saratoga Large Capitalization Growth Portfolio, Class I(a) | | | 241,530 | |
| | 14,437 | | | Saratoga Large Capitalization Value Portfolio, Class I(a) | | | 365,247 | |
| | 17,793 | | | Saratoga Mid Capitalization Portfolio, Class I(a) | | | 212,798 | |
| | 514 | | | Vanguard Small-Cap Index Fund, Admiral Class | | | 48,621 | |
| | 942 | | | Vanguard Total International Stock Index Fund, Admiral Class | | | 27,275 | |
| | | | | | | | 895,471 | |
| | | | | FIXED INCOME - 31.1% | | | | |
| | 42,822 | | | Vanguard Ultra-Short-Term Bond Fund, Admiral Class | | | 844,455 | |
| | | | | | | | | |
| | | | | TOTAL OPEN END FUNDS (Cost $2,047,664) | | | 1,942,019 | |
| | | | | | | | | |
| | | | | SHORT-TERM INVESTMENT — 28.5% | | | | |
| | | | | MONEY MARKET FUND - 28.5% | | | | |
| | 774,809 | | | Dreyfus Institutional Preferred Government Money Market Fund, Institutional Class, 4.54% (Cost $774,809)(b) | | | 774,809 | |
| | | | | | | | | |
| | | | | TOTAL INVESTMENTS - 100.1% (Cost $2,822,473) | | $ | 2,716,828 | |
| | | | | LIABILITIES IN EXCESS OF OTHER ASSETS - (0.1)% | | | (2,457 | ) |
| | | | | NET ASSETS - 100.0% | | $ | 2,714,371 | |
| (a) | Investment in affiliate. |
| (b) | Rate disclosed is the seven day effective yield as of February 28, 2023. |
See accompanying notes to financial statements.
| SARATOGA MODERATE BALANCED ALLOCATION PORTFOLIO |
| SCHEDULE OF INVESTMENTS (Unaudited) |
| February 28, 2023 |
| Shares | | | | | Fair Value | |
| | | | | OPEN END FUNDS — 85.4% | | | | |
| | | | | ALTERNATIVE - 7.7% | | | | |
| | 14,925 | | | Eaton Vance Global Macro Absolute Return Fund, Class I | | $ | 122,836 | |
| | | | | | | | | |
| | | | | EQUITY - 55.4% | | | | |
| | 2,168 | | | Saratoga Energy & Basic Materials Portfolio, Class I(a) | | | 28,446 | |
| | 1,526 | | | Saratoga Health & Biotechnology Portfolio, Class I(a) | | | 33,835 | |
| | 9,130 | | | Saratoga Large Capitalization Growth Portfolio, Class I(a) | | | 193,914 | |
| | 11,780 | | | Saratoga Large Capitalization Value Portfolio, Class I(a) | | | 298,026 | |
| | 14,535 | | | Saratoga Mid Capitalization Value Portfolio, Class I(a) | | | 173,843 | |
| | 1,557 | | | Saratoga Technology & Communications Portfolio, Class I(a) | | | 29,381 | |
| | 629 | | | Vanguard Financials Index Fund, Admiral Class | | | 27,523 | |
| | 625 | | | Vanguard Small-Cap Index Fund, Admiral Class | | | 59,111 | |
| | 1,299 | | | Vanguard Total International Stock Index Fund, Admiral Class | | | 37,606 | |
| | | | | | | | 881,685 | |
| | | | | FIXED INCOME - 22.3% | | | | |
| | 17,969 | | | Vanguard Ultra-Short-Term Bond Fund, Admiral Class | | | 354,345 | |
| | | | | | | | | |
| | | | | TOTAL OPEN END FUNDS (Cost $1,395,862) | | | 1,358,866 | |
| | | | | | | | | |
| | | | | SHORT-TERM INVESTMENT — 14.6% | | | | |
| | | | | MONEY MARKET FUND - 14.6% | | | | |
| | 231,737 | | | Dreyfus Institutional Preferred Government Money Market Fund, Institutional Class, 4.54% (Cost $231,737)(b) | | | 231,737 | |
| | | | | | | | | |
| | | | | TOTAL INVESTMENTS - 100.0% (Cost $1,627,599) | | $ | 1,590,603 | |
| | | | | OTHER ASSETS IN EXCESS OF LIABILITIES - 0.0%(c) | | | 226 | |
| | | | | NET ASSETS - 100.0% | | $ | 1,590,829 | |
| (a) | Investment in affiliate. |
| (b) | Rate disclosed is the seven day effective yield as of February 28, 2023. |
See accompanying notes to financial statements.
| SARATOGA MODERATELY AGGRESSIVE BALANCED ALLOCATION PORTFOLIO |
SCHEDULE OF INVESTMENTS (Unaudited) February 28, 2023 |
| Shares | | | | | Fair Value | |
| | | | | OPEN END FUNDS — 85.4% | | | | |
| | | | | ALTERNATIVE - 8.5% | | | | |
| | 9,752 | | | Eaton Vance Global Macro Absolute Return Fund, Class I | | $ | 80,262 | |
| | | | | | | | | |
| | | | | EQUITY - 58.7% | | | | |
| | 1,884 | | | Saratoga Energy & Basic Materials Portfolio, Class I(a) | | | 24,712 | |
| | 1,136 | | | Saratoga Health & Biotechnology Portfolio, Class I(a) | | | 25,186 | |
| | 5,046 | | | Saratoga Large Capitalization Growth Portfolio, Class I(a) | | | 107,176 | |
| | 6,405 | | | Saratoga Large Capitalization Value Portfolio, Class I(a) | | | 162,042 | |
| | 8,599 | | | Saratoga Mid Capitalization Portfolio, Class I(a) | | | 102,844 | |
| | 1,027 | | | Saratoga Technology & Communications Portfolio, Class I(a) | | | 19,371 | |
| | 407 | | | Vanguard Financials Index Fund, Admiral Class | | | 17,813 | |
| | 582 | | | Vanguard Small-Cap Index Fund, Admiral Class | | | 55,090 | |
| | 1,270 | | | Vanguard Total International Stock Index Fund, Admiral Class | | | 36,784 | |
| | | | | | | | 551,018 | |
| | | | | FIXED INCOME - 18.2% | | | | |
| | 8,672 | | | Vanguard Ultra-Short-Term Bond Fund, Admiral Class | | | 171,005 | |
| | | | | | | | | |
| | | | | TOTAL OPEN END FUNDS (Cost $825,266) | | | 802,285 | |
| | | | | | | | | |
| | | | | SHORT-TERM INVESTMENT — 14.5% | | | | |
| | | | | MONEY MARKET FUND - 14.5% | | | | |
| | 136,466 | | | Dreyfus Institutional Preferred Government Money Market Fund, Institutional Class, 4.54% (Cost $136,466)(b) | | | 136,466 | |
| | | | | | | | | |
| | | | | TOTAL INVESTMENTS - 99.9% (Cost $961,732) | | $ | 938,751 | |
| | | | | OTHER ASSETS IN EXCESS OF LIABILITIES - 0.1% | | | 596 | |
| | | | | NET ASSETS - 100.0% | | $ | 939,347 | |
| (a) | Investment in affiliate. |
| (b) | Rate disclosed is the seven day effective yield as of February 28, 2023. |
See accompanying notes to financial statements.
| SARATOGA MODERATELY CONSERVATIVE BALANCED ALLOCATION PORTFOLIO |
SCHEDULE OF INVESTMENTS (Unaudited) February 28, 2023 |
| Shares | | | | | Fair Value | |
| | | | | OPEN END FUNDS — 86.5% | | | | |
| | | | | ALTERNATIVE - 7.8% | | | | |
| | 5,383 | | | Eaton Vance Global Macro Absolute Return Fund, Class I | | $ | 44,300 | |
| | | | | | | | | |
| | | | | EQUITY - 51.9% | | | | |
| | 3,327 | | | Saratoga Large Capitalization Growth Portfolio, Class I(a) | | | 70,659 | |
| | 4,202 | | | Saratoga Large Capitalization Value Portfolio, Class I(a) | | | 106,322 | |
| | 5,487 | | | Saratoga Mid Capitalization Portfolio, Class I(a) | | | 65,621 | |
| | 338 | | | Vanguard Small-Cap Index Fund, Admiral Class | | | 31,996 | |
| | 699 | | | Vanguard Total International Stock Index Fund, Admiral Class | | | 20,254 | |
| | | | | | | | 294,852 | |
| | | | | FIXED INCOME - 26.8% | | | | |
| | 7,733 | | | Vanguard Ultra-Short-Term Bond Fund, Admiral Class | | | 152,502 | |
| | | | | | | | | |
| | | | | TOTAL OPEN END FUNDS (Cost $512,735) | | | 491,654 | |
| | | | | | | | | |
| | | | | SHORT-TERM INVESTMENT — 13.4% | | | | |
| | | | | MONEY MARKET FUND - 13.4% | | | | |
| | 75,938 | | | Dreyfus Institutional Preferred Government Money Market Fund, Institutional Class, 4.54% (Cost $75,938)(b) | | | 75,938 | |
| | | | | | | | | |
| | | | | TOTAL INVESTMENTS - 99.9% (Cost $588,673) | | $ | 567,592 | |
| | | | | OTHER ASSETS IN EXCESS OF LIABILITIES - 0.1% | | | 715 | |
| | | | | NET ASSETS - 100.0% | | $ | 568,307 | |
| (a) | Investment in affiliate. |
| (b) | Rate disclosed is the seven day effective yield as of February 28, 2023. |
See accompanying notes to financial statements.
| STATEMENTS OF ASSETS AND LIABILITIES |
| February 28, 2023 (Unaudited) |
| | | Large | | | Large | | | | | | | | | | |
| | | Capitalization | | | Capitalization | | | Mid | | | Small | | | International | |
| | | Value | | | Growth | | | Capitalization | | | Capitalization | | | Equity | |
| | | Portfolio | | | Portfolio | | | Portfolio | | | Portfolio | | | Portfolio | |
| Assets: | | | | | | | | | | | | | | | | | | | | |
| Investments, at cost (including collateral on loaned securities Note 4) | | $ | 20,876,931 | | | $ | 19,003,740 | | | $ | 8,391,698 | | | $ | 5,669,205 | | | $ | 3,099,177 | |
| Investments in securities, at value (including collateral on loaned securities Note 4) | | $ | 22,045,341 | | | $ | 21,863,217 | | | $ | 11,108,025 | | | $ | 6,211,778 | | | $ | 3,442,392 | |
| Foreign Cash (Cost $0, $0, $0, $0, $2,011) | | | — | | | | — | | | | — | | | | — | | | | 2,011 | |
| Unrealized appreciation on forward currency exchange contracts | | | — | | | | — | | | | — | | | | — | | | | 1 | |
| Receivable for securities sold | | | — | | | | 1,451,506 | | | | — | | | | — | | | | — | |
| Receivable for fund shares sold | | | 46 | | | | 484 | | | | 176 | | | | 23 | | | | 46 | |
| Interest and dividends receivable | | | 37,276 | | | | 24,839 | | | | 14,537 | | | | 16,977 | | | | 20,617 | |
| Prepaid expenses and other assets | | | 11,466 | | | | 24,968 | | | | 6,016 | | | | 8,232 | | | | 16,551 | |
| Total Assets | | | 22,094,129 | | | | 23,365,014 | | | | 11,128,754 | | | | 6,237,010 | | | | 3,481,618 | |
| | | | | | | | | | | | | | | | | | | | | |
| Liabilities: | | | | | | | | | | | | | | | | | | | | |
| Securities lending collateral (a) (See Note 2) | | | 417 | | | | — | | | | — | | | | 120,017 | | | | — | |
| Due to Custodian | | | — | | | | 1,232,425 | | | | — | | | | — | | | | — | |
| Payable for fund shares redeemed | | | 103 | | | | — | | | | 21 | | | | — | | | | — | |
| Payable to manager | | | 24,232 | | | | 24,049 | | | | 13,489 | | | | 6,071 | | | | — | |
| Administration fees payable | | | 45,402 | | | | 74,602 | | | | 32,111 | | | | 18,269 | | | | 14,745 | |
| Custody fees payable | | | 2,349 | | | | 3,833 | | | | 9,746 | | | | 6,791 | | | | 8,915 | |
| Trustee fees payable | | | — | | | | — | | | | 1,621 | | | | 833 | | | | 1,219 | |
| Compliance officer fees payable | | | 2,107 | | | | — | | | | 3,215 | | | | 1,125 | | | | 1,147 | |
| Payable for distribution (12b-1) fees | | | 440 | | | | 3,249 | | | | 1,070 | | | | 46 | | | | 74 | |
| Dividend Payable | | | — | | | | — | | | | — | | | | — | | | | 12 | |
| Accrued expenses and other liabilities | | | 28,058 | | | | 43,923 | | | | 28,597 | | | | 17,504 | | | | 10,556 | |
| Total Liabilities | | | 103,108 | | | | 1,382,081 | | | | 89,870 | | | | 170,656 | | | | 36,668 | |
| | | | | | | | | | | | | | | | | | | | | |
| Net Assets | | $ | 21,991,021 | | | $ | 21,982,933 | | | $ | 11,038,884 | | | $ | 6,066,354 | | | $ | 3,444,950 | |
| | | | | | | | | | | | | | | | | | | | | |
| Net Assets: | | | | | | | | | | | | | | | | | | | | |
| Par value of shares of beneficial interest | | $ | 8,726 | | | $ | 11,630 | | | $ | 9,479 | | | $ | 9,690 | | | $ | 3,405 | |
| Paid in capital | | | 20,475,861 | | | | 20,697,341 | | | | 8,915,123 | | | | 5,630,472 | | | | 5,737,715 | |
| Accumulated earnings (loss) | | | 1,506,434 | | | | 1,273,962 | | | | 2,114,282 | | | | 426,192 | | | | (2,296,170 | ) |
| Net Assets | | $ | 21,991,021 | | | $ | 21,982,933 | | | $ | 11,038,884 | | | $ | 6,066,354 | | | $ | 3,444,950 | |
| | | | | | | | | | | | | | | | | | | | | |
| Net Asset Value Per Share | | | | | | | | | | | | | | | | | | | | |
| Class I | | | | | | | | | | | | | | | | | | | | |
| Net Assets | | $ | 21,505,961 | | | $ | 19,289,902 | | | $ | 9,606,405 | | | $ | 6,004,899 | | | $ | 3,394,036 | |
| Shares of beneficial interest outstanding | | | 850,014 | | | | 908,194 | | | | 803,446 | | | | 951,816 | | | | 335,412 | |
| Net asset value, redemption price and offering price per share | | $ | 25.30 | | | $ | 21.24 | | | $ | 11.96 | | | $ | 6.31 | | | $ | 10.12 | |
| | | | | | | | | | | | | | | | | | | | | |
| Class A | | | | | | | | | | | | | | | | | | | | |
| Net Assets | | $ | 352,876 | | | $ | 1,104,236 | | | $ | 1,304,211 | | | $ | 54,959 | | | $ | 40,481 | |
| Shares of beneficial interest outstanding | | | 15,085 | | | | 61,737 | | | | 127,487 | | | | 10,117 | | | | 3,980 | |
| Net asset value, redemption price per share | | $ | 23.39 | | | $ | 17.89 | | | $ | 10.23 | | | $ | 5.43 | | | $ | 10.17 | |
| Offering price per share (maximum sales charge of 5.75%) | | $ | 24.82 | | | $ | 18.98 | | | $ | 10.85 | | | $ | 5.76 | | | $ | 10.79 | |
| | | | | | | | | | | | | | | | | | | | | |
| Class C | | | | | | | | | | | | | | | | | | | | |
| Net Assets | | $ | 132,184 | | | $ | 1,588,795 | | | $ | 128,268 | | | $ | 6,496 | | | $ | 10,433 | |
| Shares of beneficial interest outstanding | | | 7,511 | | | | 193,105 | | | | 17,001 | | | | 7,090 | | | | 1,149 | |
| Net asset value, offering price per share (b) | | $ | 17.60 | | | $ | 8.23 | | | $ | 7.54 | | | $ | 0.92 | | | $ | 9.08 | |
| | | $ | 1,002,661 | | | $ | 185,314 | | | $ | — | | | $ | 558,252 | | | $ | — | |
| (a) | Includes securities loaned of: |
| (b) | Redemption price per C share varies based on length of time shares are held. |
| STATEMENTS OF ASSETS AND LIABILITIES |
| February 28, 2023 (Unaudited) |
| | | | | | | | | | | | | | | Investment | |
| | | Health & | | | Technology & | | | Energy & Basic | | | Financial | | | Quality | |
| | | Biotechnology | | | Communications | | | Materials | | | Services | | | Bond | |
| | | Portfolio | | | Portfolio | | | Portfolio | | | Portfolio | | | Portfolio | |
| Assets: | | | | | | | | | | | | | | | | | | | | |
| Investments in securities, at cost (including collateral on loaned securities Note 4) | | $ | 9,430,484 | | | $ | 14,371,360 | | | $ | 1,395,060 | | | $ | 948,217 | | | $ | 11,706,455 | |
| Investments in securities, at value (including collateral on loaned securities Note 4) | | $ | 11,889,546 | | | $ | 34,070,169 | | | $ | 1,765,074 | | | $ | 1,404,504 | | | $ | 11,400,061 | |
| Receivable for securities sold | | | 139,323 | | | | — | | | | — | | | | — | | | | — | |
| Receivable for fund shares sold | | | 5 | | | | 332 | | | | 4 | | | | 21 | | | | — | |
| Interest and dividends receivable | | | 25,673 | | | | 69,393 | | | | 7,516 | | | | 1,848 | | | | 32,717 | |
| Prepaid expenses and other assets | | | 10,053 | | | | 24,781 | | | | 4,643 | | | | 2,607 | | | | 10,994 | |
| Total Assets | | | 12,064,600 | | | | 34,164,675 | | | | 1,777,237 | | | | 1,408,980 | | | | 11,443,772 | |
| | | | | | | | | | | | | | | | | | | | | |
| Liabilities: | | | | | | | | | | | | | | | | | | | | |
| Payable for fund shares redeemed | | | 20 | | | | 365 | | | | 45 | | | | — | | | | — | |
| Payable to manager | | | 25,553 | | | | 68,336 | | | | — | | | | 2,347 | | | | 12,145 | |
| Administration fees payable | | | 39,001 | | | | 108,008 | | | | 5,251 | | | | 2,927 | | | | 33,076 | |
| Custody fees payable | | | 1,019 | | | | 3,590 | | | | 2,580 | | | | 1,911 | | | | 1,440 | |
| Trustee fees payable | | | 1,627 | | | | 2,029 | | | | 45 | | | | 208 | | | | 3,695 | |
| Compliance officer fees payable | | | 1,414 | | | | 1,208 | | | | 1,058 | | | | 298 | | | | 6,712 | |
| Payable for distribution (12b-1) fees | | | 6,673 | | | | 14,287 | | | | 172 | | | | 67 | | | | 8,053 | |
| Dividend Payable | | | — | | | | — | | | | 7 | | | | — | | | | — | |
| Accrued expenses and other liabilities | | | 32,371 | | | | 79,900 | | | | 2,822 | | | | 5,789 | | | | 47,358 | |
| Total Liabilities | | | 107,678 | | | | 277,723 | | | | 11,980 | | | | 13,547 | | | | 112,479 | |
| | | | | | | | | | | | | | | | | | | | | |
| Net Assets | | $ | 11,956,922 | | | $ | 33,886,952 | | | $ | 1,765,257 | | | $ | 1,395,433 | | | $ | 11,331,293 | |
| | | | | | | | | | | | | | | | | | | | | |
| Net Assets: | | | | | | | | | | | | | | | | | | | | |
| Par value of shares of beneficial interest | | $ | 5,974 | | | $ | 20,582 | | | $ | 1,365 | | | $ | 1,445 | | | $ | 12,284 | |
| Paid in capital | | | 8,978,202 | | | | 13,003,571 | | | | 2,480,556 | | | | 990,138 | | | | 11,688,804 | |
| Accumulated earnings (loss) | | | 2,972,746 | | | | 20,862,799 | | | | (716,664 | ) | | | 403,850 | | | | (369,795 | ) |
| Net Assets | | $ | 11,956,922 | | | $ | 33,886,952 | | | $ | 1,765,257 | | | $ | 1,395,433 | | | $ | 11,331,293 | |
| | | | | | | | | | | | | | | | | | | | | |
| Net Asset Value Per Share | | | | | | | | | | | | | | | | | | | | |
| Class I | | | | | | | | | | | | | | | | | | | | |
| Net Assets | | $ | 6,577,958 | | | $ | 18,767,582 | | | $ | 1,518,860 | | | $ | 1,302,807 | | | $ | 11,174,072 | |
| Shares of beneficial interest outstanding | | | 296,743 | | | | 994,442 | | | | 115,741 | | | | 133,764 | | | | 1,211,165 | |
| Net asset value, redemption price and offering price per share | | $ | 22.17 | | | $ | 18.87 | | | $ | 13.12 | | | $ | 9.74 | | | $ | 9.23 | |
| | | | | | | | | | | | | | | | | | | | | |
| Class A | | | | | | | | | | | | | | | | | | | | |
| Net Assets | | $ | 4,761,190 | | | $ | 12,368,255 | | | $ | 246,150 | | | $ | 92,610 | | | $ | 151,356 | |
| Shares of beneficial interest outstanding | | | 253,653 | | | | 791,087 | | | | 20,686 | | | | 10,695 | | | | 16,572 | |
| Net asset value, redemption price per share | | $ | 18.77 | | | $ | 15.63 | | | $ | 11.90 | | | $ | 8.66 | | | $ | 9.13 | |
| Offering price per share (maximum sales charge of 5.75%) | | $ | 19.92 | | | $ | 16.58 | | | $ | 12.63 | | | $ | 9.19 | | | $ | 9.69 | |
| | | | | | | | | | | | | | | | | | | | | |
| Class C | | | | | | | | | | | | | | | | | | | | |
| Net Assets | | $ | 617,774 | | | $ | 2,751,115 | | | $ | 247 | | | $ | 16 | | | $ | 5,865 | |
| Shares of beneficial interest outstanding | | | 46,987 | | | | 272,651 | | | | 25 | | | | 2 | | | | 653 | |
| Net asset value, offering price per share (a) | | $ | 13.15 | | | $ | 10.09 | | | $ | 9.70 | (b) | | $ | 7.49 | (b) | | $ | 8.99 | (b) |
| (a) | Redemption price per C share varies based on length of time shares are held. |
| (b) | Does not calculate due to rounding |
| STATEMENTS OF ASSETS AND LIABILITIES |
| February 28, 2023 (Unaudited) |
| | | | | | | | | Aggressive | | | Conservative | | | Moderate | |
| | | Municipal | | | U.S. Government | | | Balanced | | | Balanced | | | Balanced | |
| | | Bond | | | Money Market | | | Allocation | | | Allocation | | | Allocation | |
| | | Portfolio | | | Portfolio | | | Portfolio | | | Portfolio | | | Portfolio | |
| Assets: | | | | | | | | | | | | | | | | | | | | |
| Investments in Affiliates, at cost | | $ | — | | | $ | — | | | $ | 600,487 | | | $ | 892,250 | | | $ | 788,699 | |
| Investments in securities, at cost | | | 643,057 | | | | 4,917,978 | | | | 511,268 | | | | 1,930,223 | | | | 838,900 | |
| Total Investments, at cost | | $ | 643,057 | | | $ | 4,917,978 | | | $ | 1,111,755 | | | $ | 2,822,473 | | | $ | 1,627,599 | |
| | | | | | | | | | | | | | | | | | | | | |
| Investments Affiliates, at value | | $ | — | | | $ | — | | | $ | 562,278 | | | $ | 819,575 | | | $ | 757,445 | |
| Investments in securities, at value | | | 631,855 | | | | 4,917,978 | | | | 514,257 | | | | 1,897,253 | | | | 833,158 | |
| Total Investments, at value | | $ | 631,855 | | | $ | 4,917,978 | | | $ | 1,076,535 | | | $ | 2,716,828 | | | $ | 1,590,603 | |
| Cash | | | 6 | | | | — | | | | — | | | | — | | | | — | |
| Receivable for fund shares sold | | | — | | | | 1,759 | | | | 2,120 | | | | 4,000 | | | | 2,725 | |
| Interest and dividends receivable | | | 1,354 | | | | 28,200 | | | | 306 | | | | 2,742 | | | | 1,199 | |
| Receivable from manager | | | 4,264 | | | | — | | | | 2,131 | | | | 1,573 | | | | 1,822 | |
| Prepaid expenses and other assets | | | 7,592 | | | | 35,749 | | | | 1,334 | | | | 535 | | | | 1,204 | |
| Total Assets | | | 645,071 | | | | 4,983,686 | | | | 1,082,426 | | | | 2,725,678 | | | | 1,597,553 | |
| | | | | | | | | | | | | | | | | | | | | |
| Liabilities: | | | | | | | | | | | | | | | | | | | | |
| Payable for fund shares redeemed | | | 127 | | | | — | | | | — | | | | — | | | | — | |
| Payable to manager | | | — | | | | 1,806 | | | | — | | | | — | | | | — | |
| Administration fees payable | | | 1,551 | | | | 2,694 | | | | 1,540 | | | | 6,723 | | | | 3,770 | |
| Custody fees payable | | | 1,227 | | | | 708 | | | | 332 | | | | 479 | | | | 378 | |
| Compliance officer fees payable | | | — | | | | 141 | | | | 76 | | | | 31 | | | | 31 | |
| Payable for distribution (12b-1) fees | | | 8,002 | | | | 664 | | | | 257 | | | | 1,059 | | | | 853 | |
| Distributions payable | | | — | | | | 63 | | | | — | | | | — | | | | — | |
| Accrued expenses and other liabilities | | | 1,224 | | | | 8,097 | | | | 730 | | | | 3,015 | | | | 1,692 | |
| Total Liabilities | | | 12,131 | | | | 14,173 | | | | 2,935 | | | | 11,307 | | | | 6,724 | |
| | | | | | | | | | | | | | | | | | | | | |
| Net Assets | | $ | 632,940 | | | $ | 4,969,513 | | | $ | 1,079,491 | | | $ | 2,714,371 | | | $ | 1,590,829 | |
| | | | | | | | | | | | | | | | | | | | | |
| Net Assets: | | | | | | | | | | | | | | | | | | | | |
| Par value of shares of beneficial interest | | $ | 727 | | | $ | 49,810 | | | $ | 1,081 | | | $ | 2,699 | | | $ | 1,545 | |
| Paid in capital | | | 668,165 | | | | 4,919,019 | | | | 1,086,828 | | | | 2,775,313 | | | | 1,604,340 | |
| Accumulated earnings (loss) | | | (35,952 | ) | | | 684 | | | | (8,418 | ) | | | (63,641 | ) | | | (15,056 | ) |
| Net Assets | | $ | 632,940 | | | $ | 4,969,513 | | | $ | 1,079,491 | | | $ | 2,714,371 | | | $ | 1,590,829 | |
| | | | | | | | | | | | | | | | | | | | | |
| Net Asset Value Per Share | | | | | | | | | | | | | | | | | | | | |
| Class I | | | | | | | | | | | | | | | | | | | | |
| Net Assets | | $ | 598,518 | | | $ | 4,770,210 | | | $ | 800,899 | | | $ | 2,034,812 | | | $ | 1,044,275 | |
| Shares of beneficial interest outstanding | | | 68,676 | | | | 4,781,893 | | | | 80,074 | | | | 201,634 | | | | 100,873 | |
| Net asset value, redemption price and offering price per share | | $ | 8.72 | | | $ | 1.00 | | | $ | 10.00 | | | $ | 10.09 | | | $ | 10.35 | |
| | | | | | | | | | | | | | | | | | | | | |
| Class A | | | | | | | | | | | | | | | | | | | | |
| Net Assets | | $ | 12,353 | | | $ | 140,177 | | | $ | 119,303 | | | $ | 34,648 | | | $ | 17,334 | |
| Shares of beneficial interest outstanding | | | 1,443 | | | | 139,928 | | | | 11,987 | | | | 3,435 | | | | 1,680 | |
| Net asset value, redemption price per share | | $ | 8.56 | | | $ | 1.00 | | | $ | 9.95 | (b) | | $ | 10.09 | | | $ | 10.32 | |
| Offering price per share (maximum sales charge of 5.75%) | | $ | 9.08 | | | $ | 1.06 | | | $ | 10.56 | | | $ | 10.71 | | | $ | 10.95 | |
| | | | | | | | | | | | | | | | | | | | | |
| Class C | | | | | | | | | | | | | | | | | | | | |
| Net Assets | | $ | 22,069 | | | $ | 59,126 | | | $ | 159,289 | | | $ | 644,911 | | | $ | 529,220 | |
| Shares of beneficial interest outstanding | | | 2,583 | | | | 59,174 | | | | 16,031 | | | | 64,881 | | | | 51,978 | |
| Net asset value, offering price per share (a) | | $ | 8.54 | | | $ | 1.00 | | | $ | 9.94 | | | $ | 9.94 | | | $ | 10.18 | |
| (a) | Redemption price per C share varies based on length of time shares are held. |
| (b) | Does not calculate due to rounding. |
| STATEMENTS OF ASSETS AND LIABILITIES |
| February 28, 2023 (Unaudited) |
| | | Moderately | | | Moderately | |
| | | Aggressive Balanced | | | Conservative | |
| | | Allocation | | | Balanced Allocation | |
| | | Portfolio | | | Portfolio | |
| Assets: | | | | | | | | |
| Investments in Affiliates, at cost | | $ | 463,475 | | | $ | 256,819 | |
| Investments in Unaffilated securities, at cost | | | 498,257 | | | | 331,854 | |
| Total Investments, at cost | | $ | 961,732 | | | $ | 588,673 | |
| | | | | | | | | |
| Investments Affiliates, at value | | $ | 441,331 | | | $ | 242,602 | |
| Investments in Unaffiated securities, at value | | | 497,420 | | | | 324,990 | |
| Total Investments, at value | | $ | 938,751 | | | $ | 567,592 | |
| Receivable for fund shares sold | | | 125 | | | | — | |
| Interest and dividends receivable | | | 486 | | | | 349 | |
| Receivable from manager | | | 1,404 | | | | 1,565 | |
| Prepaid expenses and other assets | | | 790 | | | | 12 | |
| Total Assets | | | 941,556 | | | | 569,518 | |
| | | | | | | | | |
| Liabilities: | | | | | | | | |
| Administration fees payable | | | 1,325 | | | | 577 | |
| Custody fees payable | | | 198 | | | | 266 | |
| Compliance officer fees payable | | | 31 | | | | 31 | |
| Payable for distribution (12b-1) fees | | | 347 | | | | 269 | |
| Accrued expenses and other liabilities | | | 308 | | | | 68 | |
| Total Liabilities | | | 2,209 | | | | 1,211 | |
| | | | | | | | | |
| Net Assets | | $ | 939,347 | | | $ | 568,307 | |
| | | | | | | | | |
| Net Assets: | | | | | | | | |
| Par value of shares of beneficial interest | | $ | 921 | | | $ | 605 | |
| Paid in capital | | | 941,346 | | | | 579,770 | |
| Accumulated earnings | | | (2,920 | ) | | | (12,068 | ) |
| Net Assets | | $ | 939,347 | | | $ | 568,307 | |
| | | | | | | | | |
| Net Asset Value Per Share | | | | | | | | |
| Class I | | | | | | | | |
| Net Assets | | $ | 675,323 | | | $ | 400,894 | |
| Shares of beneficial interest outstanding | | | 65,972 | | | | 42,390 | |
| Net asset value, redemption price and offering price per share | | $ | 10.24 | | | $ | 9.46 | |
| | | | | | | | | |
| Class A | | | | | | | | |
| Net Assets | | $ | 65,094 | | | $ | 12 | |
| Shares of beneficial interest outstanding | | | 6,394 | | | | 1 | |
| Net asset value, redemption price per share | | $ | 10.18 | | | $ | 9.46 | (b) |
| Offering price per share (maximum sales charge of 5.75%) | | $ | 10.80 | | | $ | 10.04 | |
| | | | | | | | | |
| Class C | | | | | | | | |
| Net Assets | | $ | 198,930 | | | $ | 167,401 | |
| Shares of beneficial interest outstanding | | | 19,739 | | | | 18,146 | |
| Net asset value, offering price per share (a) | | $ | 10.08 | | | $ | 9.23 | |
| (a) | Redemption price per C share varies based on length of time shares are held. |
| (b) | Does not calculate due to rounding |
| STATEMENTS OF OPERATIONS |
| For the Period Ended February 28, 2023 (Unaudited) |
| | | Large | | | Large | | | | | | | | | | |
| | | Capitalization | | | Capitalization | | | Mid | | | Small | | | International | |
| | | Value | | | Growth | | | Capitalization | | | Capitalization | | | Equity | |
| | | Portfolio | | | Portfolio | | | Portfolio | | | Portfolio | | | Portfolio | |
| Investment Income: | | | | | | | | | | | | | | | | | | | | |
| Dividend income | | $ | 76,397 | | | $ | 77,385 | | | $ | 90,644 | | | $ | 59,667 | | | $ | 39,557 | |
| Interest income | | | 45,635 | | | | 4,640 | | | | 9,202 | | | | 4,856 | | | | 1,102 | |
| Securities lending income - net | | | 1,015 | | | | 136 | | | | 44 | | | | 492 | | | | 216 | |
| Less: Foreign withholding taxes | | | — | | | | — | | | | — | | | | — | | | | (5,132 | ) |
| Total Investment Income | | | 123,047 | | | | 82,161 | | | | 99,890 | | | | 65,015 | | | | 35,743 | |
| | | | | | | | | | | | | | | | | | | | | |
| Operating Expenses: | | | | | | | | | | | | | | | | | | | | |
| Management fees | | | 64,908 | | | | 71,715 | | | | 40,257 | | | | 19,063 | | | | 11,353 | |
| Distribution (12b-1) fees | | | | | | | | | | | | | | | | | | | | |
| Class A Shares | | | 657 | | | | 2,095 | | | | 2,614 | | | | 108 | | | | 75 | |
| Class C Shares | | | 604 | | | | 8,450 | | | | 610 | | | | 24 | | | | 43 | |
| Administration fees | | | 62,593 | | | | 66,455 | | | | 39,837 | | | | 22,349 | | | | 19,350 | |
| Professional fees | | | 14,460 | | | | 20,571 | | | | 8,989 | | | | 3,329 | | | | 1,253 | |
| Printing and postage expense | | | 3,277 | | | | 5,726 | | | | 1,611 | | | | 2,071 | | | | 748 | |
| Custodian fees | | | 2,457 | | | | 1,825 | | | | 1,947 | | | | 4,612 | | | | 3,616 | |
| Trustees’ fees | | | 1,723 | | | | 2,667 | | | | 370 | | | | 307 | | | | 133 | |
| Shareholder servicing fees | | | 1,323 | | | | 2,606 | | | | 645 | | | | 1,787 | | | | 39 | |
| Registration fees | | | 996 | | | | 3,284 | | | | 1,492 | | | | 1,021 | | | | 2,033 | |
| Insurance expense | | | 956 | | | | 1,268 | | | | 409 | | | | 178 | | | | 116 | |
| Compliance officer fees | | | — | | | | 4,240 | | | | 1,107 | | | | 743 | | | | 229 | |
| Miscellaneous expenses | | | 1,859 | | | | 2,518 | | | | 1,706 | | | | 1,442 | | | | 393 | |
| Net Operating Expenses | | | 155,813 | | | | 193,420 | | | | 101,594 | | | | 57,034 | | | | 39,381 | |
| | | | | | | | | | | | | | | | | | | | | |
| Net Investment Income (Loss) | | | (32,766 | ) | | | (111,259 | ) | | | (1,704 | ) | | | 7,981 | | | | (3,638 | ) |
| | | | | | | | | | | | | | | | | | | | | |
| Realized and Unrealized Gain (Loss) on Investments: | | | | | | | | | | | | | | | | | | | | |
| Net realized gain (loss) from: | | | | | | | | | | | | | | | | | | | | |
| Investments and Foreign currency transactions | | | 461,176 | | | | 329,962 | | | | (539,129 | ) | | | (82,388 | ) | | | 19,307 | |
| Net Realized Gain (Loss) | | | 461,176 | | | | 329,962 | | | | (539,129 | ) | | | (82,388 | ) | | | 19,307 | |
| | | | | | | | | | | | | | | | | | | | | |
| Net change in unrealized appreciation (depreciation) on Investments and Foreign currency translations | | | 709,909 | | | | (761,033 | ) | | | 911,564 | | | | 67,070 | | | | 339,998 | |
| Net Realized and Unrealized Gain (Loss) on investments | | | 1,171,085 | | | | (431,071 | ) | | | 372,435 | | | | (15,318 | ) | | | 359,305 | |
| | | | | | | | | | | | | | | | | | | | | |
| Net Increase (Decrease) in Net Assets Resulting From Operations | | $ | 1,138,319 | | | $ | (542,330 | ) | | $ | 370,731 | | | $ | (7,337 | ) | | $ | 355,667 | |
| STATEMENTS OF OPERATIONS |
| For the Period Ended February 28, 2023 (Unaudited) |
| | | | | | | | | | | | | | | Investment | |
| | | Health & | | | Technology & | | | Energy & Basic | | | Financial | | | Quality | |
| | | Biotechnology | | | Communications | | | Materials | | | Services | | | Bond | |
| | | Portfolio | | | Portfolio | | | Portfolio | | | Portfolio | | | Portfolio | |
| Investment Income: | | | | | | | | | | | | | | | | | | | | |
| Dividend income | | $ | 82,810 | | | $ | 173,508 | | | $ | 38,456 | | | $ | 17,938 | | | $ | 140,980 | |
| Interest income | | | 5,363 | | | | 5,743 | | | | 590 | | | | 649 | | | | 7,023 | |
| Securities lending income - net | | | 19 | | | | 470 | | | | — | | | | — | | | | — | |
| Less: Foreign withholding taxes | | | — | | | | — | | | | (1,880 | ) | | | 35 | | | | — | |
| Total Investment Income | | | 88,192 | | | | 179,721 | | | | 37,166 | | | | 18,622 | | | | 148,003 | |
| | | | | | | | | | | | | | | | | | | | | |
| Operating Expenses: | | | | | | | | | | | | | | | | | | | | |
| Management fees | | | 78,068 | | | | 220,362 | | | | 10,965 | | | | 7,559 | | | | 31,117 | |
| Distribution (12b-1) fees | | | | | | | | | | | | | | | | | | | | |
| Class A Shares | | | 9,944 | | | | 24,981 | | | | 493 | | | | 217 | | | | 300 | |
| Class C Shares | | | 3,245 | | | | 16,030 | | | | 22 | | | | — | | | | 72 | |
| Administration fees | | | 50,513 | | | | 137,753 | | | | 8,290 | | | | 5,841 | | | | 39,595 | |
| Professional fees | | | 8,642 | | | | 37,669 | | | | 4,224 | | | | 524 | | | | 4,642 | |
| Shareholder servicing fees | | | 3,419 | | | | 7,339 | | | | 286 | | | | 134 | | | | 513 | |
| Registration fees | | | 2,626 | | | | 4,400 | | | | 1,529 | | | | 789 | | | | 3,874 | |
| Printing and postage expense | | | 2,586 | | | | 11,935 | | | | 1,049 | | | | 658 | | | | 1,359 | |
| Custodian fees | | | 1,963 | | | | 5,882 | | | | 1,950 | | | | 1,417 | | | | 1,365 | |
| Compliance officer fees | | | 909 | | | | 6,659 | | | | 163 | | | | 247 | | | | 1,081 | |
| Insurance expense | | | 467 | | | | 998 | | | | 82 | | | | 38 | | | | 495 | |
| Trustees’ fees | | | 388 | | | | 2,162 | | | | 352 | | | | 296 | | | | 591 | |
| Miscellaneous expenses | | | 1,635 | | | | 5,533 | | | | 1,019 | | | | 1,221 | | | | 1,419 | |
| Total Operating Expenses | | | 164,405 | | | | 481,703 | | | | 30,424 | | | | 18,941 | | | | 86,423 | |
| Less: Expenses waived | | | — | | | | — | | | | (3,591 | ) | | | (571 | ) | | | — | |
| Net Operating Expenses | | | 164,405 | | | | 481,703 | | | | 26,833 | | | | 18,370 | | | | 86,423 | |
| | | | | | | | | | | | | | | | | | | | | |
| Net Investment Income (Loss) | | | (76,213 | ) | | | (301,982 | ) | | | 10,333 | | | | 252 | | | | 61,580 | |
| | | | | | | | | | | | | | | | | | | | | |
| Realized and Unrealized Gain (Loss) on Investments: | | | | | | | | | | | | | | | | | | | | |
| Net realized gain (loss) from: | | | | | | | | | | | | | | | | | | | | |
| Investments and Foreign currency transactions | | | 692,450 | | | | 1,872,385 | | | | 92,319 | | | | 17,686 | | | | — | |
| Net realized gain | | | 692,450 | | | | 1,872,385 | | | | 92,319 | | | | 17,686 | | | | — | |
| | | | | | | | | | | | | | | | | | | | | |
| Net change in unrealized appreciation (depreciation) on Investments and Foreign currency transactions | | | (213,715 | ) | | | (2,927,448 | ) | | | 43,296 | | | | 39,698 | | | | (29,278 | ) |
| Net Realized and Unrealized Gain (Loss) on Investments | | | 478,735 | | | | (1,055,063 | ) | | | 135,615 | | | | 57,384 | | | | (29,278 | ) |
| | | | | | | | | | | | | | | | | | | | | |
| Net Increase (Decrease) in Net Assets Resulting From Operations | | $ | 402,522 | | | $ | (1,357,045 | ) | | $ | 145,948 | | | $ | 57,636 | | | $ | 32,302 | |
| STATEMENTS OF OPERATIONS |
| For the Period Ended February 28, 2023 (Unaudited) |
| | | | | | | | | Aggressive | | | Conservative | | | Moderate | |
| | | Municipal | | | U.S. Government | | | Balanced | | | Balanced | | | Balanced | |
| | | Bond | | | Money Market | | | Allocation | | | Allocation | | | Allocation | |
| | | Portfolio | | | Portfolio | | | Portfolio | | | Portfolio | | | Portfolio | |
| | | | | | | | | | | | | | | | |
| Investment Income: | | | | | | | | | | | | | | | | | | | | |
| Dividend income | | $ | 5,262 | | | $ | — | | | $ | 6,328 | | | $ | 17,524 | | | $ | 10,058 | |
| Interest income | | | 338 | | | | 94,524 | | | | 1,226 | | | | 13,416 | | | | 3,993 | |
| Dividend income from Affiliates | | | — | | | | — | | | | 3,506 | | | | 5,279 | | | | 5,406 | |
| Total Investment Income | | | 5,600 | | | | 94,524 | | | | 11,060 | | | | 36,219 | | | | 19,457 | |
| | | | | | | | | | | | | | | | | | | | | |
| Operating Expenses: | | | | | | | | | | | | | | | | | | | | |
| Management fees | | | 1,788 | | | | 13,037 | | | | 4,005 | | | | 11,738 | | | | 7,205 | |
| Distribution (12b-1) fees | | | | | | | | | | | | | | | | | | | | |
| Class A Shares | | | 56 | | | | 278 | | | | 1 | | | | 43 | | | | 21 | |
| Class C Shares | | | 109 | | | | 319 | | | | 756 | | | | 3,107 | | | | 2,487 | |
| Administration fees | | | 3,320 | | | | 3,440 | | | | 3,750 | | | | 10,069 | | | | 6,324 | |
| Registration fees | | | 1,528 | | | | 756 | | | | 745 | | | | 239 | | | | 613 | |
| Compliance officer fees | | | 332 | | | | 1,317 | | | | 211 | | | | 397 | | | | 241 | |
| Trustees’ fees | | | 312 | | | | 308 | | | | 417 | | | | 529 | | | | 453 | |
| Professional fees | | | 287 | | | | 2,486 | | | | 823 | | | | 2,157 | | | | 1,375 | |
| Custodian fees | | | 117 | | | | 665 | | | | 353 | | | | 485 | | | | 342 | |
| Printing and postage expense | | | 68 | | | | 1,021 | | | | 185 | | | | 467 | | | | 249 | |
| Insurance expense | | | 26 | | | | 268 | | | | 51 | | | | 144 | | | | 91 | |
| Shareholder servicing fees | | | 21 | | | | 35 | | | | 14 | | | | 27 | | | | 29 | |
| Miscellaneous expenses | | | 386 | | | | 1,314 | | | | 1,165 | | | | 1,259 | | | | 1,208 | |
| Total Operating Expenses | | | 8,350 | | | | 25,244 | | | | 12,476 | | | | 30,661 | | | | 20,638 | |
| Less: Expenses waived and/or reimbursed | | | (2,014 | ) | | | — | | | | (7,165 | ) | | | (14,596 | ) | | | (10,206 | ) |
| Net Operating Expenses | | | 6,336 | | | | 25,244 | | | | 5,311 | | | | 16,065 | | | | 10,432 | |
| | | | | | | | | | | | | | | | | | | | | |
| Net Investment Income (Loss) | | | (736 | ) | | | 69,280 | | | | 5,749 | | | | 20,154 | | | | 9,025 | |
| | | | | | | | | | | | | | | | | | | | | |
| Realized and Unrealized Gain (Loss) on Investments: | | | | | | | | | | | | | | | | | | | | |
| Net realized gain (loss) from: | | | | | | | | | | | | | | | | | | | | |
| Investments | | | (2,084 | ) | | | — | | | | 132 | | | | 69 | | | | (202 | ) |
| Affiliated Investments | | | — | | | | — | | | | (585 | ) | | | (3,481 | ) | | | (16,570 | ) |
| Distribution of realized gains by underlying | | | | | | | | | | | | | | | | | | | | |
| Affiliated Investment Companies | | | — | | | | — | | | | 27,120 | | | | 41,743 | | | | 42,976 | |
| Net realized gain (loss) | | | (2,084 | ) | | | — | | | | 26,667 | | | | 38,331 | | | | 26,204 | |
| | | | | | | | | | | | | | | | | | | | | |
| Net change in unrealized appreciation (depreciation) on: | | | | | | | | | | | | | | | | | | | | |
| Affiliated Investments | | | — | | | | — | | | | (16,205 | ) | | | (24,898 | ) | | | (17,783 | ) |
| Investments | | | 1,525 | | | | — | | | | 10,937 | | | | 7,436 | | | | 8,737 | |
| | | | | | | | | | | | | | | | | | | | | |
| Net change in unrealized appreciation (depreciation) | | | 1,525 | | | | — | | | | (5,268 | ) | | | (17,462 | ) | | | (9,046 | ) |
| Net Realized and Unrealized Gain (loss) on Investments | | | (559 | ) | | | — | | | | 21,399 | | | | 20,869 | | | | 17,158 | |
| | | | | | | | | | | | | | | | | | | | | |
| Net Increase (Decrease) in Net Assets Resulting From Operations | | $ | (1,295 | ) | | $ | 69,280 | | | $ | 27,148 | | | $ | 41,023 | | | $ | 26,183 | |
| STATEMENTS OF OPERATIONS |
| For the Period Ended February 28, 2023 (Unaudited) |
| | | Moderately | | | Moderately | |
| | | Aggressive Balanced | | | Conservative | |
| | | Allocation | | | Balanced Allocation | |
| | | Portfolio | | | Portfolio | |
| | | | | | | |
| Investment Income: | | | | | | | | |
| Dividend income | | $ | 5,807 | | | $ | 3,988 | |
| Interest income | | | 2,290 | | | | 1,312 | |
| Dividend income from Affiliates | | | 3,007 | | | | 1,546 | |
| Total Investment Income | | | 11,104 | | | | 6,846 | |
| | | | | | | | | |
| Operating Expenses: | | | | | | | | |
| Management fees | | | 4,055 | | | | 2,565 | |
| Distribution (12b-1) fees | | | | | | | | |
| Class A Shares | | | 78 | | | | — | |
| Class C Shares | | | 941 | | | | 776 | |
| Administration fees | | | 3,597 | | | | 2,501 | |
| Professional fees | | | 729 | | | | 555 | |
| Trustees’ fees | | | 338 | | | | 367 | |
| Custodian fees | | | 240 | | | | 269 | |
| Registration fees | | | 191 | | | | 139 | |
| Compliance officer fees | | | 147 | | | | 103 | |
| Printing and postage expense | | | 103 | | | | 122 | |
| Shareholder servicing fees | | | 5 | | | | 42 | |
| Insurance expense | | | 52 | | | | 35 | |
| Miscellaneous expenses | | | 1,163 | | | | 1,155 | |
| Total Operating Expenses | | | 11,639 | | | | 8,629 | |
| Less: Expenses waived and/or reimbursed | | | (6,159 | ) | | | (5,029 | ) |
| Net Operating Expenses | | | 5,480 | | | | 3,600 | |
| | | | | | | | | |
| Net Investment Income | | | 5,624 | | | | 3,246 | |
| | | | | | | | | |
| Realized and Unrealized Gain on Investments: | | | | | | | | |
| Net realized gain/(loss) from: | | | | | | | | |
| Investments | | | 286 | | | | (1,464 | ) |
| Affiliated Investments | | | (3,841 | ) | | | (4,963 | ) |
| Distribution of realized gains by underlying: | | | | | | | | |
| Investment Companies | | | — | | | | — | |
| Affiliated Investment Companies | | | 22,902 | | | | 12,316 | |
| Net realized gain | | | 19,347 | | | | 5,889 | |
| | | | | | | | | |
| | | | | | | | | |
| Net change in unrealized appreciation on: | | | | | | | | |
| Investments | | | 6,561 | | | | 3,786 | |
| Affiliated Investments | | | (11,790 | ) | | | (5,069 | ) |
| Net change in unrealized appreciation | | | (5,229 | ) | | | (1,283 | ) |
| | | | | | | | | |
| Net Realized and Unrealized Gain on Investments | | | 14,118 | | | | 4,606 | |
| | | | | | | | | |
| Net Increase in Net Assets Resulting From Operations | | $ | 19,742 | | | $ | 7,852 | |
| STATEMENTS OF CHANGES IN NET ASSETS |
| | | Large Capitalization Value | | | Large Capitalization Growth | | | Mid Capitalization | |
| | | Portfolio | | | Portfolio | | | Portfolio | |
| | | | | | | | | | | | | | | | | | | |
| | | Period Ended | | | Year Ended | | | Period Ended | | | Year Ended | | | Period Ended | | | Year Ended | |
| | | February 28, 2023 | | | August 31, 2022 | | | February 28, 2023 | | | August 31, 2022 | | | February 28, 2023 | | | August 31, 2022 | |
| | | (Unaudited) | | | | | | (Unaudited) | | | | | | (Unaudited) | | | | |
| Operations: | | | | | | | | | | | | | | | | | | | | | | | | |
| Net investment loss | | $ | (32,766 | ) | | $ | (175,597 | ) | | $ | (111,259 | ) | | $ | (300,436 | ) | | $ | (1,704 | ) | | $ | (45,857 | ) |
| Net realized gain (loss) on investments | | | 461,176 | | | | 2,271,820 | | | | 329,962 | | | | 2,414,678 | | | | (539,129 | ) | | | 654,914 | |
| Net change in unrealized appreciation (depreciation) on investments | | | 709,909 | | | | (2,240,901 | ) | | | (761,033 | ) | | | (7,058,931 | ) | | | 911,564 | | | | (1,862,137 | ) |
| Net increase (decrease) in net assets resulting from operations | | | 1,138,319 | | | | (144,678 | ) | | | (542,330 | ) | | | (4,944,689 | ) | | | 370,731 | | | | (1,253,080 | ) |
| | | | | | | | | | | | | | | | | | | | | | | | | |
| Distributions to Shareholders: | | | | | | | | | | | | | | | | | | | | | | | | |
| Total Distributions Paid: | | | | | | | | | | | | | | | | | | | | | | | | |
| Class I | | | (1,570,868 | ) | | | (3,674,554 | ) | | | (1,293,480 | ) | | | (4,975,376 | ) | | | (165,609 | ) | | | (1,378,401 | ) |
| Class A | | | (28,911 | ) | | | (80,177 | ) | | | (83,895 | ) | | | (281,806 | ) | | | (27,100 | ) | | | (240,355 | ) |
| Class C | | | (13,335 | ) | | | (29,151 | ) | | | (269,819 | ) | | | (953,439 | ) | | | (3,389 | ) | | | (30,769 | ) |
| Return of Capital | | | | | | | | | | | | | | | | | | | | | | | | |
| Class I | | | — | | | | — | | | | — | | | | (347,446 | ) | | | — | | | | — | |
| Class A | | | — | | | | — | | | | — | | | | (19,679 | ) | | | — | | | | — | |
| Class C | | | — | | | | — | | | | — | | | | (66,582 | ) | | | — | | | | — | |
| Total Dividends and Distributions to Shareholders | | | (1,613,114 | ) | | | (3,783,882 | ) | | | (1,647,194 | ) | | | (6,644,328 | ) | | | (196,098 | ) | | | (1,649,525 | ) |
| | | | | | | | | | | | | | | | | | | | | | | | | |
| Share Transactions of Beneficial Interest (Note 5): | | | | | | | | | | | | | | | | | | | | | | | | |
| Net proceeds from shares sold | | | | | | | | | | | | | | | | | | | | | | | | |
| Class I | | | 1,890,364 | | | | 3,257,933 | | | | 1,816,211 | | | | 1,881,802 | | | | 104,827 | | | | 406,493 | |
| Class A | | | 22,271 | | | | 82,321 | | | | 62,689 | | | | 200,477 | | | | 5,194 | | | | 59,384 | |
| Class C | | | 5,248 | | | | 5,405 | | | | 4,233 | | | | 4,655 | | | | 3,671 | | | | 3,782 | |
| Reinvestment of dividends and distributions | | | | | | | | | | | | | | | | | | | | | | | | |
| Class I | | | 1,483,589 | | | | 3,441,478 | | | | 1,183,010 | | | | 4,849,242 | | | | 153,714 | | | | 1,286,038 | |
| Class A | | | 27,647 | | | | 76,371 | | | | 78,915 | | | | 294,392 | | | | 26,490 | | | | 234,887 | |
| Class C | | | 13,316 | | | | 29,094 | | | | 268,505 | | | | 1,001,805 | | | | 1,820 | | | | 13,713 | |
| Cost of shares redeemed | | | | | | | | | | | | | | | | | | | | | | | | |
| Class I | | | (1,162,198 | ) | | | (2,164,716 | ) | | | (2,792,070 | ) | | | (3,305,158 | ) | | | (298,150 | ) | | | (673,918 | ) |
| Class A | | | (2,453 | ) | | | (158,894 | ) | | | (17,457 | ) | | | (287,870 | ) | | | (96,761 | ) | | | (244,493 | ) |
| Class C | | | — | | | | (8,057 | ) | | | (262,809 | ) | | | (510,815 | ) | | | — | | | | (27,460 | ) |
| Net increase (decrease) in net assets from share transactions of beneficial interest | | | 2,277,784 | | | | 4,560,935 | | | | 341,227 | | | | 4,128,530 | | | | (99,195 | ) | | | 1,058,426 | |
| | | | | | | | | | | | | | | | | | | | | | | | | |
| Total Increase (Decrease) in Net Assets | | | 1,802,989 | | | | 632,375 | | | | (1,848,297 | ) | | | (7,460,487 | ) | | | 75,438 | | | | (1,844,179 | ) |
| | | | | | | | | | | | | | | | | | | | | | | | | |
| Net Assets: | | | | | | | | | | | | | | | | | | | | | | | | |
| Beginning of year/period | | | 20,188,032 | | | | 19,555,657 | | | | 23,831,230 | | | | 31,291,717 | | | | 10,963,446 | | | | 12,807,625 | |
| End of year/period | | $ | 21,991,021 | | | $ | 20,188,032 | | | $ | 21,982,933 | | | $ | 23,831,230 | | | $ | 11,038,884 | | | $ | 10,963,446 | |
| STATEMENTS OF CHANGES IN NET ASSETS |
| | | Small Capitalization | | | International Equity | | | Health & Biotechnology | |
| | | Portfolio | | | Portfolio | | | Portfolio | |
| | | | | | | | | | | | | | | | | | | |
| | | Period Ended | | | Year Ended | | | Period Ended | | | Year Ended | | | Period Ended | | | Year Ended | |
| | | February 28, 2023 | | | August 31, 2022 | | | February 28, 2023 | | | August 31, 2022 | | | February 28, 2023 | | | August 31, 2022 | |
| | | (Unaudited) | | | | | | (Unaudited) | | | | | | (Unaudited) | | | | |
| Operations: | | | | | | | | | | | | | | | | | | | | | | | | |
| Net investment income (loss) | | $ | 7,981 | | | $ | (41,130 | ) | | $ | (3,638 | ) | | $ | 17,810 | | | $ | (76,213 | ) | | $ | (162,612 | ) |
| Net realized gain (loss) on investments and foreign currency transactions | | | (82,388 | ) | | | 586,336 | | | | 19,307 | | | | (34,722 | ) | | | 692,450 | | | | 780,400 | |
| Net change in unrealized appreciation (depreciation) on investments and foreign currency transactions | | | 67,070 | | | | (1,080,060 | ) | | | 339,998 | | | | (927,795 | ) | | | (213,715 | ) | | | (1,595,366 | ) |
| Net increase (decrease) in net assets resulting from operations | | | (7,337 | ) | | | (534,854 | ) | | | 355,667 | | | | (944,707 | ) | | | 402,522 | | | | (977,578 | ) |
| | | | | | | | | | | | | | | | | | | | | | | | | |
| Distributions to Shareholders: | | | | | | | | | | | | | | | | | | | | | | | | |
| Total Distributions Paid: | | | | | | | | | | | | | | | | | | | | | | | | |
| Class I | | | (530,776 | ) | | | (1,399,513 | ) | | | (9,348 | ) | | | (17,024 | ) | | | (370,044 | ) | | | (225,964 | ) |
| Class A | | | (5,618 | ) | | | (16,646 | ) | | | — | | | | — | | | | (314,023 | ) | | | (194,237 | ) |
| Class C | | | (1,751 | ) | | | (1,601 | ) | | | — | | | | (28 | ) | | | (57,632 | ) | | | (34,723 | ) |
| Total Dividends and Distributions to Shareholders | | | (538,145 | ) | | | (1,417,760 | ) | | | (9,348 | ) | | | (17,052 | ) | | | (741,699 | ) | | | (454,924 | ) |
| | | | | | | | | | | | | | | | | | | | | | | | | |
| Share Transactions of Beneficial Interest (Note 5): | | | | | | | | | | | | | | | | | | | | | | | | |
| Net proceeds from shares sold | | | | | | | | | | | | | | | | | | | | | | | | |
| Class I | | | 407,350 | | | | 781,646 | | | | 428,683 | | | | 349,181 | | | | 294,857 | | | | 572,190 | |
| Class A | | | 1,541 | | | | — | | | | 674 | | | | 342 | | | | 3,975 | | | | 106,461 | |
| Class C | | | 2,063 | | | | 2,125 | | | | 1,394 | | | | 1,436 | | | | 3,400 | | | | 3,600 | |
| Reinvestment of dividends and distributions | | | | | | | | | | | | | | | | | | | | | | | | |
| Class I | | | 496,766 | | | | 1,287,014 | | | | 8,558 | | | | 15,533 | | | | 351,251 | | | | 213,457 | |
| Class A | | | 5,512 | | | | 16,303 | | | | — | | | | — | | | | 295,067 | | | | 183,321 | |
| Class C | | | 1,740 | | | | 1,564 | | | | — | | | | 28 | | | | 55,432 | | | | 33,363 | |
| Cost of shares redeemed | | | | | | | | | | | | | | | | | | | | | | | | |
| Class I | | | (254,650 | ) | | | (878,995 | ) | | | (192,948 | ) | | | (1,033,188 | ) | | | (714,352 | ) | | | (794,718 | ) |
| Class A | | | (1,144 | ) | | | (10,911 | ) | | | (878 | ) | | | (54,731 | ) | | | (204,609 | ) | | | (356,886 | ) |
| Class C | | | — | | | | (5 | ) | | | — | | | | — | | | | (35,112 | ) | | | (37,330 | ) |
| Net increase (decrease) in net assets from share transactions of beneficial interest | | | 659,178 | | | | 1,198,741 | | | | 245,483 | | | | (721,399 | ) | | | 49,909 | | | | (76,542 | ) |
| | | | | | | | | | | | | | | | | | | | | | | | | |
| Total Increase (Decrease) in Net Assets | | | 113,696 | | | | (753,873 | ) | | | 591,802 | | | | (1,683,158 | ) | | | (289,268 | ) | | | (1,509,044 | ) |
| | | | | | | | | | | | | | | | | | | | | | | | | |
| Net Assets: | | | | | | | | | | | | | | | | | | | | | | | | |
| Beginning of year/period | | | 5,952,658 | | | | 6,706,531 | | | | 2,853,148 | | | | 4,536,306 | | | | 12,246,190 | | | | 13,755,234 | |
| End of year/period | | $ | 6,066,354 | | | $ | 5,952,658 | | | $ | 3,444,950 | | | $ | 2,853,148 | | | $ | 11,956,922 | | | $ | 12,246,190 | |
| STATEMENTS OF CHANGES IN NET ASSETS |
| | | Technology & Communications | | | Energy & Basic Materials | | | Financial Services | |
| | | Portfolio | | | Portfolio | | | Portfolio | |
| | | | | | | | | | | | | | | | | | | |
| | | Period Ended | | | Year Ended | | | Period Ended | | | Year Ended | | | Period Ended | | | Year Ended | |
| | | February 28, 2023 | | | August 31, 2022 | | | February 28, 2023 | | | August 31, 2022 | | | February 28, 2023 | | | August 31, 2022 | |
| | | (Unaudited) | | | | | | (Unaudited) | | | | | | (Unaudited) | | | | |
| Operations: | | | | | | | | | | | | | | | | | | | | | | | | |
| Net investment income (loss) | | $ | (301,982 | ) | | $ | (693,943 | ) | | $ | 10,333 | | | $ | 46,391 | | | $ | 252 | | | $ | (7,601 | ) |
| Net realized gain on investments and foreign currency transactions | | | 1,872,385 | | | | 6,914,320 | | | | 92,319 | | | | 39,051 | | | | 17,686 | | | | 50,524 | |
| Net change in unrealized appreciation (depreciation) on investments and foreign currency transactions | | | (2,927,448 | ) | | | (22,277,865 | ) | | | 43,296 | | | | 123,493 | | | | 39,698 | | | | (284,403 | ) |
| Net increase (decrease) in net assets resulting from operations | | | (1,357,045 | ) | | | (16,057,488 | ) | | | 145,948 | | | | 208,935 | | | | 57,636 | | | | (241,480 | ) |
| | | | | | | | | | | | | | | | | | | | | | | | | |
| Distributions to Shareholders: | | | | | | | | | | | | | | | | | | | | | | | | |
| Total Distributions Paid: | | | | | | | | | | | | | | | | | | | | | | | | |
| Class I | | | (3,016,636 | ) | | | (3,661,327 | ) | | | (38,637 | ) | | | (14,413 | ) | | | (58,439 | ) | | | (64,974 | ) |
| Class A | | | (2,282,629 | ) | | | (2,390,759 | ) | | | (6,724 | ) | | | (764 | ) | | | (4,799 | ) | | | (12,021 | ) |
| Class C | | | (817,904 | ) | | | (1,434,203 | ) | | | (206 | ) | | | (32 | ) | | | (1 | ) | | | (1 | ) |
| Total Dividends and Distributions to Shareholders | | | (6,117,169 | ) | | | (7,486,289 | ) | | | (45,567 | ) | | | (15,209 | ) | | | (63,239 | ) | | | (76,996 | ) |
| | | | | | | | | | | | | | | | | | | | | | | | | |
| Share Transactions of Beneficial Interest (Note 5): | | | | | | | | | | | | | | | | | | | | | | | | |
| Net proceeds from shares sold | | | | | | | | | | | | | | | | | | | | | | | | |
| Class I | | | 609,509 | | | | 1,442,127 | | | | 159,453 | | | | 672,606 | | | | 379,206 | | | | 329,190 | |
| Class A | | | 37,911 | | | | 1,119,873 | | | | 1,005 | | | | 138,576 | | | | 475 | | | | — | |
| Class C | | | 4,000 | | | | 27,640 | | | | — | | | | 1,275 | | | | 0 | | | | — | |
| Reinvestment of dividends and distributions | | | | | | | | | | | | | | | | | | | | | | | | |
| Class I | | | 2,772,936 | | | | 3,351,958 | | | | 38,292 | | | | 14,282 | | | | 57,598 | | | | 64,059 | |
| Class A | | | 2,133,091 | | | | 2,262,107 | | | | 6,601 | | | | 735 | | | | 3,769 | | | | 10,901 | |
| Class C | | | 783,803 | | | | 1,405,624 | | | | 206 | | | | 32 | | | | 1 | | | | 1 | |
| Cost of shares redeemed | | | | | | | | | | | | | | | | | | | | | | | | |
| Class I | | | (3,382,482 | ) | | | (5,550,304 | ) | | | (288,709 | ) | | | (451,944 | ) | | | (174,448 | ) | | | (445,231 | ) |
| Class A | | | (860,129 | ) | | | (2,248,929 | ) | | | (11,865 | ) | | | (11,520 | ) | | | (114,018 | ) | | | (9,225 | ) |
| Class C | | | (946,531 | ) | | | (3,619,617 | ) | | | (7,202 | ) | | | (1,245 | ) | | | — | | | | — | |
| Net increase (decrease) in net assets from share transactions of beneficial interest | | | 1,152,108 | | | | (1,809,521 | ) | | | (102,219 | ) | | | 362,797 | | | | 152,583 | | | | (50,305 | ) |
| | | | | | | | | | | | | | | | | | | | | | | | | |
| Total Increase (Decrease) in Net Assets | | | (6,322,106 | ) | | | (25,353,298 | ) | | | (1,838 | ) | | | 556,523 | | | | 146,980 | | | | (368,781 | ) |
| | | | | | | | | | | | | | | | | | | | | | | | | |
| Net Assets: | | | | | | | | | | | | | | | | | | | | | | | | |
| Beginning of year/period | | | 40,209,058 | | | | 65,562,356 | | | | 1,767,095 | | | | 1,210,572 | | | | 1,248,453 | | | | 1,617,234 | |
| End of year/period | | $ | 33,886,952 | | | $ | 40,209,058 | | | $ | 1,765,257 | | | $ | 1,767,095 | | | $ | 1,395,433 | | | $ | 1,248,453 | |
| STATEMENTS OF CHANGES IN NET ASSETS |
| | | Investment Quality Bond | | | Municipal Bond | | | U.S. Government Money Market | |
| | | Portfolio | | | Portfolio | | | Portfolio | |
| | | | | | | | | | | | | | | | | | | |
| | | Period Ended | | | Year Ended | | | Period Ended | | | Year Ended | | | Period Ended | | | Year Ended | |
| | | February 28, 2023 | | | August 31, 2022 | | | February 28, 2023 | | | August 31, 2022 | | | February 28, 2023 | | | August 31, 2022 | |
| | | (Unaudited) | | | | | | (Unaudited) | | | | | | (Unaudited) | | | | |
| Operations: | | | | | | | | | | | | | | | | | | | | | | | | |
| Net investment income (loss) | | $ | 61,580 | | | $ | (132,510 | ) | | $ | (736 | ) | | $ | (12,448 | ) | | $ | 69,280 | | | $ | 906 | |
| Net realized loss on investments | | | — | | | | (6,949 | ) | | | (2,084 | ) | | | (2,141 | ) | | | — | | | | — | |
| Distribution of realized gains by underlying investment companies | | | — | | | | 3,267 | | | | — | | | | — | | | | — | | | | — | |
| Net change in unrealized appreciation (depreciation) on investments | | | (29,278 | ) | | | (265,599 | ) | | | 1,525 | | | | (12,686 | ) | | | — | | | | — | |
| Net increase (decrease) in net assets resulting from operations | | | 32,302 | | | | (401,791 | ) | | | (1,295 | ) | | | (27,275 | ) | | | 69,280 | | | | 906 | |
| | | | | | | | | | | | | | | | | | | | | | | | | |
| Distributions to Shareholders: | | | | | | | | | | | | | | | | | | | | | | | | |
| Total Distributions Paid: | | | | | | | | | | | | | | | | | | | | | | | | |
| Class I | | | (43,869 | ) | | | (152,472 | ) | | | — | | | | — | | | | (67,015 | ) | | | (535 | ) |
| Class A | | | (378 | ) | | | (2,014 | ) | | | — | | | | — | | | | (1,514 | ) | | | (20 | ) |
| Class C | | | (6 | ) | | | (483 | ) | | | — | | | | — | | | | (415 | ) | | | (8 | ) |
| Total Dividends and Distributions to Shareholders | | | (44,253 | ) | | | (154,969 | ) | | | — | | | | — | | | | (68,944 | ) | | | (563 | ) |
| | | | | | | | | | | | | | | | | | | | | | | | | |
| Share Transactions of Beneficial Interest (Note 5): | | | | | | | | | | | | | | | | | | | | | | | | |
| Net proceeds from shares sold | | | | | | | | | | | | | | | | | | | | | | | | |
| Class I | | | 125,954 | | | | 777,268 | | | | 893 | | | | 35,854 | | | | 1,305,260 | | | | 1,604,222 | |
| Class A | | | 985 | | | | 5,854 | | | | — | | | | — | | | | 1,719 | | | | 841 | |
| Class C | | | — | | | | — | | | | 680 | | | | 1,359 | | | | 47,871 | | | | 17,054 | |
| Reinvestment of dividends and distributions | | | | | | | | | | | | | | | | | | | | | | | | |
| Class I | | | 43,549 | | | | 150,968 | | | | — | | | | — | | | | 45,020 | | | | 531 | |
| Class A | | | 374 | | | | 1,993 | | | | — | | | | — | | | | 1,512 | | | | 19 | |
| Class C | | | 6 | | | | 475 | | | | — | | | | — | | | | 415 | | | | 8 | |
| Cost of shares redeemed | | | | | | | | | | | | | | | | | | | | | | | | |
| Class I | | | (420,450 | ) | | | (964,856 | ) | | | (16,369 | ) | | | (167,328 | ) | | | (1,688,411 | ) | | | (1,983,776 | ) |
| Class A | | | (1,170 | ) | | | (20,132 | ) | | | (52,298 | ) | | | (9,853 | ) | | | (1,793 | ) | | | (271,534 | ) |
| Class C | | | (29,217 | ) | | | — | | | | — | | | | (13,603 | ) | | | (82,831 | ) | | | (28,529 | ) |
| Net decrease in net assets from share transactions of beneficial interest | | | (279,969 | ) | | | (48,430 | ) | | | (67,094 | ) | | | (153,571 | ) | | | (371,238 | ) | | | (661,164 | ) |
| | | | | | | | | | | | | | | | | | | | | | | | | |
| Total Decrease in Net Assets | | | (291,920 | ) | | | (605,190 | ) | | | (68,389 | ) | | | (180,846 | ) | | | (370,902 | ) | | | (660,821 | ) |
| | | | | | | | | | | | | | | | | | | | | | | | | |
| Net Assets: | | | | | | | | | | | | | | | | | | | | | | | | |
| Beginning of year/period | | | 11,623,213 | | | | 12,228,403 | | | | 701,329 | | | | 882,175 | | | | 5,340,415 | | | | 6,001,236 | |
| End of year/period | | $ | 11,331,293 | | | $ | 11,623,213 | | | $ | 632,940 | | | $ | 701,329 | | | $ | 4,969,513 | | | $ | 5,340,415 | |
| STATEMENTS OF CHANGES IN NET ASSETS |
| | | Aggressive Balanced | | | Conservative Balanced | | | Moderate Balanced | |
| | | Allocation Portfolio | | | Allocation Portfolio | | | Allocation Portfolio | |
| | | | | | | | | | | | | | | | | | | |
| | | Period Ended | | | Year Ended | | | Period Ended | | | Year Ended | | | Period Ended | | | Year Ended | |
| | | February 28, 2023 | | | August 31, 2022 | | | February 28, 2023 | | | August 31, 2022 | | | February 28, 2023 | | | August 31, 2022 | |
| | | (Unaudited) | | | | | | (Unaudited) | | | | | | (Unaudited) | | | | |
| Operations: | | | | | | | | | | | | | | | | | | | | | | | | |
| Net investment income | | $ | 5,749 | | | $ | 26,923 | | | $ | 20,154 | | | $ | 66,525 | | | $ | 9,025 | | | $ | 44,890 | |
| Net realized gain (loss) on investments | | | (453 | ) | | | 2,072 | | | | (3,412 | ) | | | (13,531 | ) | | | (16,772 | ) | | | (386 | ) |
| Distribution of realized gains by underlying affiliated investment companies | | | 27,120 | | | | 54,869 | | | | 41,742 | | | | 137,622 | | | | 42,976 | | | | 99,398 | |
| Net change in unrealized depreciation on investments | | | (5,268 | ) | | | (177,431 | ) | | | (17,462 | ) | | | (374,948 | ) | | | (9,046 | ) | | | (280,680 | ) |
| Net increase (decrease) in net assets resulting from operations | | | 27,148 | | | | (93,567 | ) | | | 41,022 | | | | (184,332 | ) | | | 26,183 | | | | (136,778 | ) |
| | | | | | | | | | | | | | | | | | | | | | | | | |
| Distributions to Shareholders: | | | | | | | | | | | | | | | | | | | | | | | | |
| Total Distributions Paid: | | | | | | | | | | | | | | | | | | | | | | | | |
| Class I | | | (50,959 | ) | | | (74,884 | ) | | | (91,659 | ) | | | (151,581 | ) | | | (63,033 | ) | | | (90,465 | ) |
| Class A | | | (1 | ) | | | (1 | ) | | | (1,565 | ) | | | (2,719 | ) | | | (926 | ) | | | (3,886 | ) |
| Class C | | | (9,053 | ) | | | (14,576 | ) | | | (27,203 | ) | | | (43,805 | ) | | | (28,070 | ) | | | (36,027 | ) |
| Total Dividends and Distributions to Shareholders | | | (60,013 | ) | | | (89,461 | ) | | | (120,427 | ) | | | (198,105 | ) | | | (92,029 | ) | | | (130,378 | ) |
| | | | | | | | | | | | | | | | | | | | | | | | | |
| Share Transactions of Beneficial Interest (Note 5): | | | | | | | | | | | | | | | | | | | | | | | | |
| Net proceeds from shares sold | | | | | | | | | | | | | | | | | | | | | | | | |
| Class I | | | 12,138 | | | | 34,584 | | | | 55,869 | | | | 68,411 | | | | 15,155 | | | | 44,402 | |
| Class A | | | 119,378 | | | | — | | | | — | | | | — | | | | 861 | | | | 1,131 | |
| Class C | | | 5,155 | | | | 5,162 | | | | 13,921 | | | | 14,462 | | | | 35,795 | | | | 43,323 | |
| Reinvestment of dividends and distributions | | | | | | | | | | | | | | | | | | | | | | | | |
| Class I | | | 50,959 | | | | 74,884 | | | | 90,714 | | | | 149,854 | | | | 63,033 | | | | 90,466 | |
| Class A | | | 1 | | | | 1 | | | | 1,564 | | | | 2,720 | | | | 926 | | | | 3,886 | |
| Class C | | | 9,053 | | | | 14,576 | | | | 27,203 | | | | 43,805 | | | | 28,070 | | | | 36,027 | |
| Cost of shares redeemed | | | | | | | | | | | | | | | | | | | | | | | | |
| Class I | | | (7,141 | ) | | | (28,382 | ) | | | (13,577 | ) | | | (24,149 | ) | | | (122,842 | ) | | | (8,550 | ) |
| Class A | | | — | | | | (5,322 | ) | | | (1,400 | ) | | | (50 | ) | | | — | | | | (33,771 | ) |
| Class C | | | (1,516 | ) | | | (17,369 | ) | | | (2,282 | ) | | | (13,852 | ) | | | (11,393 | ) | | | (35,578 | ) |
| Net increase in net assets from share transactions of beneficial interest | | | 188,027 | | | | 78,134 | | | | 172,012 | | | | 241,201 | | | | 9,605 | | | | 141,336 | |
| | | | | | | | | | | | | | | | | | | | | | | | | |
| Total Increase (Decrease) in Net Assets | | | 155,162 | | | | (104,894 | ) | | | 92,607 | | | | (141,236 | ) | | | (56,241 | ) | | | (125,820 | ) |
| | | | | | | | | | | | | | | | | | | | | | | | | |
| Net Assets: | | | | | | | | | | | | | | | | | | | | | | | | |
| Beginning of year/period | | | 924,329 | | | | 1,029,223 | | | | 2,621,764 | | | | 2,763,000 | | | | 1,647,070 | | | | 1,772,890 | |
| End of year/period | | $ | 1,079,491 | | | $ | 924,329 | | | $ | 2,714,371 | | | $ | 2,621,764 | | | $ | 1,590,829 | | | $ | 1,647,070 | |
| STATEMENTS OF CHANGES IN NET ASSETS |
| | | Moderately Aggressive Balanced | | | Moderately Conservative Balanced | |
| | | Allocation Portfolio | | | Allocation Portfolio | |
| | | | | | | | | | | | | |
| | | Period Ended | | | Year Ended | | | Period Ended | | | Year Ended | |
| | | February 28, 2023 | | | August 31, 2022 | | | February 28, 2023 | | | August 31, 2022 | |
| | | (Unaudited) | | | | | | (Unaudited) | | | | |
| Operations: | | | | | | | | | | | | | | | | |
| Net investment income | | $ | 5,624 | | | $ | 24,437 | | | $ | 3,246 | | | $ | 19,319 | |
| Net realized gain (loss) on investments | | | (3,555 | ) | | | — | | | | (6,427 | ) | | | 4,972 | |
| Distribution of realized gains by underlying affiliated and non affiliated investment companies | | | 22,902 | | | | 51,945 | | | | 12,316 | | | | 38,881 | |
| Net change in unrealized depreciation on investments | | | (5,229 | ) | | | (156,147 | ) | | | (1,283 | ) | | | (115,496 | ) |
| Net increase (decrease) in net assets resulting from operations | | | 19,742 | | | | (79,765 | ) | | | 7,852 | | | | (52,324 | ) |
| | | | | | | | | | | | | | | | | |
| Distributions to Shareholders: | | | | | | | | | | | | | | | | |
| Total Distributions Paid: | | | | | | | | | | | | | | | | |
| Class I | | | (35,841 | ) | | | (53,434 | ) | | | (28,286 | ) | | | (63,427 | ) |
| Class A | | | (3,457 | ) | | | (5,239 | ) | | | (1 | ) | | | (1 | ) |
| Class C | | | (10,721 | ) | | | (13,273 | ) | | | (11,267 | ) | | | (16,396 | ) |
| Total Dividends and Distributions to Shareholders | | | (50,019 | ) | | | (71,946 | ) | | | (39,554 | ) | | | (79,824 | ) |
| | | | | | | | | | | | | | | | | |
| Share Transactions of Beneficial Interest (Note 5): | | | | | | | | | | | | | | | | |
| Net proceeds from shares sold | | | | | | | | | | | | | | | | |
| Class I | | | 4,200 | | | | 21,324 | | | | 259 | | | | 525 | |
| Class A | | | 516 | | | | 69,017 | | | | — | | | | — | |
| Class C | | | 8,126 | | | | 8,955 | | | | 9,800 | | | | 6,500 | |
| Reinvestment of dividends and distributions | | | | | | | | | | | | | | | | |
| Class I | | | 35,841 | | | | 53,434 | | | | 28,286 | | | | 56,212 | |
| Class A | | | 3,457 | | | | 5,239 | | | | 1 | | | | 1 | |
| Class C | | | 10,721 | | | | 13,273 | | | | 11,267 | | | | 16,396 | |
| Cost of shares redeemed | | | | | | | | | | | | | | | | |
| Class I | | | (24 | ) | | | (2,626 | ) | | | (99,291 | ) | | | (77,504 | ) |
| Class A | | | (12 | ) | | | (12 | ) | | | — | | | | — | |
| Class C | | | — | | | | (5,726 | ) | | | — | | | | (6,500 | ) |
| | | | | | | | | | | | | | | | | |
| Net increase (decrease) in net assets from share transactions of beneficial interest | | | 62,825 | | | | 162,878 | | | | (49,678 | ) | | | (4,370 | ) |
| | | | | | | | | | | | | | | | | |
| Total Increase (Decrease) in Net Assets | | | 32,548 | | | | 11,167 | | | | (81,380 | ) | | | (136,518 | ) |
| | | | | | | | | | | | | | | | | |
| Net Assets: | | | | | | | | | | | | | | | | |
| Beginning of year/period | | | 906,799 | | | | 895,632 | | | | 649,687 | | | | 786,205 | |
| End of year/period | | $ | 939,347 | | | $ | 906,799 | | | $ | 568,307 | | | $ | 649,687 | |
| NOTES TO FINANCIAL STATEMENTS |
| Six Months Ended February 28, 2023 (Unaudited) |
| 1. | ORGANIZATION AND SIGNIFICANT ACCOUNTING POLICIES |
The Saratoga Advantage Trust (the “Trust”) was organized on April 8, 1994, as a Delaware Statutory Trust and is registered under the Investment Company Act of 1940, as amended, as an open-end management investment company. The Trust commenced investment operations on September 2, 1994. The Trust currently consists of seventeen series. These financial statements include the following seventeen series: the Large Capitalization Value Portfolio; the Large Capitalization Growth Portfolio; the Mid Capitalization Portfolio; the Small Capitalization Portfolio; the International Equity Portfolio; the Health & Biotechnology Portfolio; the Technology & Communications Portfolio; the Energy & Basic Materials Portfolio; the Financial Services Portfolio; the Investment Quality Bond Portfolio; the Municipal Bond Portfolio; the U.S. Government Money Market Portfolio, Aggressive Balanced Allocation Portfolio, Conservative Balanced Allocation Portfolio, Moderate Balanced Allocation Portfolio, Moderately Aggressive Balanced Allocation Portfolio, and Moderately Conservative Balanced Allocation Portfolio, (collectively, the “Portfolios”). Saratoga Capital Management, LLC (the “Manager”) serves as the Trust’s Manager.
The following serve as advisers (the “Advisers”) to their respective Portfolio(s): M.D. Sass Investors Services, Inc. serves as Adviser to Large Capitalization Value; Smith Group Asset Management serves as Adviser to Large Capitalization Growth, Energy & Basic Materials, Financial Services and International Equity; Vaughan Nelson Investment Management, L.P. serves as Adviser to Mid Capitalization; Zacks Investment Management, Inc. serves as Adviser to Small Capitalization; Oak Associates, Ltd. serves as Adviser to Health & Biotechnology and Technology & Communications; Saratoga Capital Management, LLC serves as Adviser to U.S. Government Money Market, Investment Quality Bond, Municipal Bond, Aggressive Balanced Allocation, Conservative Balanced Allocation, Moderate Balanced Allocation, Moderately Aggressive Balanced Allocation and Moderately Conservative Balanced Allocation. Ultimus Fund Solutions, LLC (the “Administrator”), serves the Trust as administrator, custody administrator, transfer agent and fund accounting agent. Northern Lights Distributors, LLC (“NLD” or the “Distributor”) is the Trust’s Distributor.
The Large Capitalization Value Portfolio, the Large Capitalization Growth Portfolio, the Mid Capitalization Portfolio, the Small Capitalization Portfolio, the International Equity Portfolio, the Health & Biotechnology Portfolio, the Technology & Communications Portfolio, the Energy & Basic Materials Portfolio, the Financial Services Portfolio, the Investment Quality Bond Portfolio, the Municipal Bond Portfolio, the U.S. Government Money Market Portfolio, Aggressive Balanced Allocation, Conservative Balanced Allocation, Moderately Conservative Balanced Allocation, Moderate Balanced Allocation, and Moderately Aggressive Balanced Allocation are diversified portfolios.
| Portfolio | Primary Objective |
| Large Capitalization Value | Total return consisting of capital appreciation and dividend income |
| Large Capitalization Growth | Capital appreciation |
| Mid Capitalization | Long-term capital appreciation |
| Small Capitalization | Maximum capital appreciation |
| International Equity | Long-term capital appreciation |
| Health & Biotechnology | Long-term capital growth |
| Technology & Communications | Long-term capital growth |
| Energy & Basic Materials | Long-term capital growth |
| Financial Services | Long-term capital growth |
| Investment Quality Bond | Current income and reasonable stability of principal |
| Municipal Bond | High level of interest income that is excluded from federal income taxation to the extent consistent with prudent investment management and the preservation of capital |
| U.S. Government Money Market | Maximum current income to the extent consistent with the maintenance of liquidity and the preservation of capital |
| Aggressive Balanced Allocation | Total return consisting of capital appreciation and income |
| Conservative Balanced Allocation | Total return consisting of capital appreciation and income |
| Moderate Balanced Allocation | Total return consisting of capital appreciation and income |
| Moderately Aggressive Balanced Allocation | Total return consisting of capital appreciation and income |
| Moderately Conservative Balanced | Total return consisting of capital appreciation and income |
| Allocation | |
Currently, all Portfolios offer Class A, Class C and Class I shares. Each class represents an interest in the same assets of the applicable Portfolio, and the classes are identical except for differences in their sales charge structures and ongoing service and distribution charges. All classes of shares have equal voting privileges except that each class has exclusive voting rights with respect to its service and/or distribution plans.
| NOTES TO FINANCIAL STATEMENTS |
| Six Months Ended February 28, 2023 (Unaudited)(Continued) |
The following is a summary of significant accounting policies followed by the Portfolios in preparation of its financial statements. These policies are in conformity with accounting principles generally accepted in the United States of America (“GAAP”). The preparation of financial statements in conformity with GAAP requires management to make estimates and assumptions that affect the reported amounts of assets and liabilities and disclosure of contingent assets and liabilities at the date of the financial statements and the reported amounts of increases and decreases in net assets from operations during the reporting period. Actual results could differ from those estimates. Each Portfolio is an investment company and accordingly follows the investment company accounting and reporting guidance of the Financial Accounting Standards Board (FASB) Accounting Standard Codification Topic 946 “Financial Services – Investment Companies” including FASB Accounting Standard Update ASU 2013-08.
(a) Valuation of Investments
Investment securities listed on a national securities exchange are valued at the last reported sale price on the valuation date. NASDAQ traded securities are valued at the NASDAQ Official Closing Price (NOCP). If there are no such reported sales, the securities are valued at the mean between current bid and ask. Debt securities (other than short-term obligations) are valued each day by an independent pricing service approved by the Board of Trustees using methods which include current market quotations from a major market maker in the securities and trader-reviewed “matrix” prices. Short-term debt securities having a remaining maturity of sixty days or less may be valued at amortized cost or amortized value, which approximates market value. U.S. Government Money Market values all of its securities on the basis of amortized cost, which approximates market value. Options listed on a securities exchange or board of trade for which market quotations are readily available shall be valued at the last quoted sales price or, in the absence of a sale, at the mean between the last bid and ask price. Options not listed on a securities exchange or board of trade for which over -the-counter market quotations are readily available shall be valued at the mean of the current bid and asked prices. Futures are valued based on their daily settlement value. Swap transactions are valued through an independent pricing service or at fair value based on daily price reporting from the swap counterparty issuing the swap. Total return swaps on securities listed on an exchange shall be valued at the last quoted sales price or, in the absence of a sale, at the mean between the current bid and ask prices. Any securities or other assets for which market quotations are not readily available are valued at their fair value as determined in good faith under procedures established by the Board of Trustees. There is no single standard for determining the fair value of such securities. Rather, in determining the fair value of a security, the board appointed Saratoga Capital Management, LLC as the valuation designee. The Valuation designee shall take into account the relevant factors and surrounding circumstances, a few of which may include: (i) the nature and pricing history (if any) of the security; (ii) whether any dealer quotations for the security are available; and (iii) possible valuation methodologies that could be used to determine the fair value of a security. The International Equity Portfolio uses fair value prices as provided by an independent pricing vendor on a daily basis for those securities traded on a foreign exchange. Foreign currency and Forward currency exchange contracts are valued daily at the London close each day. The ability of issuers of debt securities held by the portfolios to meet their obligations may be affected by economic or political developments in a specific state, industry or region. Investments in foreign countries may involve certain considerations and risks not typically associated with domestic investments, including, but not limited to, the possibility of future political and economic developments and the level of government supervision and regulation of foreign securities markets.
Valuation of Fund of Funds – The Funds may invest in portfolios of open -end or closed-end investment companies (the “Underlying Funds”). The Underlying Funds value securities in their portfolios for which market quotations are readily available at their market values (generally the last reported sale price) and all other securities and assets at their fair value based upon the methods established by the board of directors of the Underlying Funds. The shares of many closed-end investment companies, after their initial public offering, frequently trade at a price per share, which is different than the net asset value per share. The difference represents a market premium or market discount of such shares. There can be no assurances that the market discount or market premium on shares of any closed-end investment company purchased by a Fund will not change.
The Portfolios utilize various methods to measure the fair value of most of its investments on a recurring basis. GAAP establishes a hierarchy that prioritizes inputs to valuation methods. The three levels of input are:
Level 1 – Unadjusted quoted prices in active markets for identical assets and liabilities that the Portfolios have the ability to access.
Level 2 – Observable inputs other than quoted prices included in level 1 that are observable for the asset or liability, either directly or indirectly. These inputs may include quoted prices for the identical instrument on an inactive market, prices for similar instruments, interest rates, prepayment speeds, credit risk, yield curves, default rates and similar data.
Level 3 – Unobservable inputs for the asset or liability, to the extent relevant observable inputs are not available, representing the Portfolios’ own assumptions about the assumptions a market participant would use in valuing the asset or liability, and would be based on the best information available.
| NOTES TO FINANCIAL STATEMENTS |
| Six Months Ended February 28, 2023 (Unaudited)(Continued) |
The availability of observable inputs can vary from security to security and is affected by a wide variety of factors, including, for example, the type of security, whether the security is new and not yet established in the marketplace, the liquidity of markets, and other characteristics particular to the security. To the extent that valuation is based on models or inputs that are less observable or unobservable in the market, the determination of fair value requires more judgment. Accordingly, the degree of judgment exercised in determining fair value is greatest for instruments categorized in Level 3.
The inputs used to measure fair value may fall into different levels of the fair value hierarchy. In such cases, for disclosure purposes, the level in the fair value hierarchy within which the fair value measurement falls in its entirety, is determined based on the lowest level input that is significant to the fair value measurement in its entirety.
The inputs or methodology used for valuing securities are not necessarily an indication of the risk associated with investing in those securities. The following tables summarize the inputs used as of February 28, 2023, for the Portfolios’ assets and liabilities measured at fair value:
| Large Capitalization Value | |
| | | | | | | | | | | | | |
| Assets* | | Level 1 | | | Level 2 | | | Level 3 | | | Total | |
| Common Stock | | $ | 19,707,234 | | | $ | — | | | $ | — | | | $ | 19,707,234 | |
| Collateral for Securities Loaned | | | — | | | | 417 | | | | — | | | | 417 | |
| Short-Term Investment | | | 2,337,690 | | | | — | | | | — | | | | 2,337,690 | |
| Total | | $ | 22,044,924 | | | $ | 417 | | | $ | — | | | $ | 22,045,341 | |
| | | | | | | | | | | | | | | | | |
| Large Capitalization Growth | |
| | | | | | | | | | | | | |
| Assets* | | Level 1 | | | Level 2 | | | Level 3 | | | Total | |
| Common Stock | | $ | 21,863,217 | | | $ | — | | | $ | — | | | $ | 21,863,217 | |
| Total | | $ | 21,863,217 | | | $ | — | | | $ | — | | | $ | 21,863,217 | |
| | | | | | | | | | | | | | | | | |
| Mid Capitalization | |
| | |
| Assets* | | Level 1 | | | Level 2 | | | Level 3 | | | Total | |
| Common Stocks | | $ | 10,252,891 | | | $ | — | | | $ | — | | | $ | 10,252,891 | |
| Short-Term Investment | | | 855,134 | | | | — | | | | — | | | | 855,134 | �� |
| Total | | $ | 11,108,025 | | | $ | — | | | $ | — | | | $ | 11,108,025 | |
| | | | | | | | | | | | | | | | | |
| Small Capitalization | |
| | | | | | | | | | | | | |
| Assets* | | Level 1 | | | Level 2 | | | Level 3 | | | Total | |
| Common Stocks | | $ | 5,808,925 | | | $ | — | | | $ | — | | | $ | 5,808,925 | |
| Collateral for Securities Loaned | | | — | | | | 120,017 | | | | — | | | | 120,017 | |
| Short-Term Investment | | | 282,836 | | | | — | | | | — | | | | 282,836 | |
| Total | | $ | 6,091,761 | | | $ | 120,017 | | | $ | — | | | $ | 6,211,778 | |
| NOTES TO FINANCIAL STATEMENTS |
| Six Months Ended February 28, 2023 (Unaudited)(Continued) |
| International Equity | |
| | | | | | | | | | | | | |
| Assets | | Level 1 | | | Level 2 | | | Level 3 | | | Total | |
| Common Stocks | | | | | | | | | | | | | | | | |
| Australia | | $ | — | | | $ | 152,057 | | | $ | — | | | $ | 152,057 | |
| Canada | | | 150,322 | | | | — | | | | — | | | | 150,322 | |
| Cayman Islands | | | 64,465 | | | | — | | | | — | | | | 64,465 | |
| China | | | — | | | | 225,932 | | | | — | | | | 225,932 | |
| Denmark | | | — | | | | 97,462 | | | | — | | | | 97,462 | |
| Finland | | | — | | | | 78,209 | | | | — | | | | 78,209 | |
| France | | | — | | | | 165,947 | | | | — | | | | 165,947 | |
| Germany | | | — | | | | 338,231 | | | | — | | | | 338,231 | |
| Indonesia | | | — | | | | 78,797 | | | | — | | | | 78,797 | |
| Italy | | | — | | | | 77,703 | | | | — | | | | 77,703 | |
| Japan | | | — | | | | 535,571 | | | | — | | | | 535,571 | |
| Jersey | | | — | | | | 92,362 | | | | — | | | | 92,362 | |
| Korea (Republic of) | | | — | | | | 160,981 | | | | — | | | | 160,981 | |
| Mexico | | | 74,786 | | | | — | | | | — | | | | 74,786 | |
| Netherlands | | | — | | | | 196,059 | | | | — | | | | 196,059 | |
| South Africa | | | — | | | | 57,802 | | | | — | | | | 57,802 | |
| Spain | | | — | | | | 94,050 | | | | — | | | | 94,050 | |
| Swizterland | | | — | | | | 96,291 | | | | — | | | | 96,291 | |
| Taiwan | | | — | | | | 65,249 | | | | — | | | | 65,249 | |
| Taiwan Province of China | | | — | | | | 87,941 | | | | — | | | | 87,941 | |
| Thailand | | | — | | | | 82,051 | | | | — | | | | 82,051 | |
| United Kingdom | | | — | | | | 400,249 | | | | — | | | | 400,249 | |
| Short -Term Investment | | | 69,875 | | | | — | | | | — | | | | 69,875 | |
| Total | | $ | 359,448 | | | $ | 3,082,944 | | | $ | — | | | $ | 3,442,392 | |
| | | | | | | | | �� | | | | | | | | |
| Health & Biotechnology | |
| | | | | | | | | | | | | |
| Assets* | | Level 1 | | | Level 2 | | | Level 3 | | | Total | |
| Common Stocks | | $ | 11,285,276 | | | $ | — | | | $ | — | | | $ | 11,285,276 | |
| Short-Term Investment | | | 604,270 | | | | — | | | | — | | | | 604,270 | |
| Total | | $ | 11,889,546 | | | $ | — | | | $ | — | | | $ | 11,889,546 | |
| | | | | | | | | | | | | | | | | |
| Technology & Communications | |
| | | | | | | | | | | | | |
| Assets* | | Level 1 | | | Level 2 | | | Level 3 | | | Total | |
| Common Stocks | | $ | 33,154,587 | | | $ | — | | | $ | — | | | $ | 33,154,587 | |
| Short-Term Investment | | | 915,582 | | | | — | | | | — | | | | 915,582 | |
| Total | | $ | 34,070,169 | | | $ | — | | | $ | — | | | $ | 34,070,169 | |
| | | | | | | | | | | | | | | | | |
| Energy & Basic Materials | |
| | | | | | | | | | | | | |
| Assets* | | Level 1 | | | Level 2 | | | Level 3 | | | Total | |
| Common Stocks | | $ | 1,718,738 | | | $ | — | | | $ | — | | | $ | 1,718,738 | |
| Short-Term Investment | | | 46,336 | | | | — | | | | — | | | | 46,336 | |
| Total | | $ | 1,765,074 | | | $ | — | | | $ | — | | | $ | 1,765,074 | |
| | | | | | | | | | | | | | | | | |
| Financial Services | |
| | | | | | | | | | | | | |
| Assets* | | Level 1 | | | Level 2 | | | Level 3 | | | Total | |
| Common Stocks | | $ | 1,365,455 | | | $ | — | | | $ | — | | | $ | 1,365,455 | |
| Short-Term Investment | | | 39,049 | | | | — | | | | — | | | | 39,049 | |
| Total | | $ | 1,404,504 | | | $ | — | | | $ | — | | | $ | 1,404,504 | |
| | | | | | | | | | | | | | | | | |
| Investment Quality Bond | |
| | | | | | | | | | | | | |
| Assets* | | Level 1 | | | Level 2 | | | Level 3 | | | Total | |
| Open End Funds | | $ | 11,150,213 | | | $ | — | | | $ | — | | | $ | 11,150,213 | |
| Short-Term Investment | | | 249,848 | | | | — | | | | — | | | | 249,848 | |
| Total | | $ | 11,400,061 | | | $ | — | | | $ | — | | | $ | 11,400,061 | |
| NOTES TO FINANCIAL STATEMENTS |
| Six Months Ended February 28, 2023 (Unaudited)(Continued) |
| Municipal Bond | |
| | | | | | | | | | | | | |
| Assets* | | Level 1 | | | Level 2 | | | Level 3 | | | Total | |
| Open End Funds | | $ | 603,329 | | | $ | — | | | $ | — | | | $ | 603,329 | |
| Short-Term Investment | | | 28,526 | | | | — | | | | — | | | | 28,526 | |
| Total | | $ | 631,855 | | | $ | — | | | $ | — | | | $ | 631,855 | |
| | | | | | | | | | | | | | | | | |
| U.S. Government Money Market | |
| | | | | | | | | | | | | |
| Assets* | | Level 1 | | | Level 2 | | | Level 3 | | | Total | |
| Short-Term Investments | | $ | 4,917,978 | | | $ | — | | | $ | — | | | $ | 4,917,978 | |
| Total | | $ | 4,917,978 | | | $ | — | | | $ | — | | | $ | 4,917,978 | |
| | | | | | | | | | | | | | | | | |
| Aggressive Balanced Allocation | |
| | | | | | | | | | | | | |
| Assets* | | Level 1 | | | Level 2 | | | Level 3 | | | Total | |
| Open Ended Funds | | $ | 994,530 | | | $ | — | | | $ | — | | | $ | 994,530 | |
| Short-Term Investment | | | 82,005 | | | | — | | | | — | | | | 82,005 | |
| Total | | $ | 1,076,535 | | | $ | — | | | $ | — | | | $ | 1,076,535 | |
| | | | | | | | | | | | | | | | | |
| Conservative Balanced Allocation | |
| | | | | | | | | | | | | |
| Assets* | | Level 1 | | | Level 2 | | | Level 3 | | | Total | |
| Open Ended Funds | | $ | 1,942,019 | | | $ | — | | | $ | — | | | $ | 1,942,019 | |
| Short-Term Investment | | | 774,809 | | | | — | | | | — | | | | 774,809 | |
| Total | | $ | 2,716,828 | | | $ | — | | | $ | — | | | $ | 2,716,828 | |
| | | | | | | | | | | | | | | | | |
| Moderate Balanced Allocation | |
| | | | | | | | | | | | | |
| Assets* | | Level 1 | | | Level 2 | | | Level 3 | | | Total | |
| Open Ended Funds | | $ | 1,358,866 | | | $ | — | | | $ | — | | | $ | 1,358,866 | |
| Short-Term Investment | | | 231,737 | | | | — | | | | — | | | | 231,737 | |
| Total | | $ | 1,590,603 | | | $ | — | | | $ | — | | | $ | 1,590,603 | |
| | | | | | | | | | | | | | | | | |
| Moderately Aggressive Balanced Allocation | |
| | | | | | | | | | | | | |
| Assets* | | Level 1 | | | Level 2 | | | Level 3 | | | Total | |
| Open Ended Funds | | $ | 802,285 | | | $ | — | | | $ | — | | | $ | 802,285 | |
| Short-Term Investment | | | 136,466 | | | | — | | | | — | | | | 136,466 | |
| Total | | $ | 938,751 | | | $ | — | | | $ | — | | | $ | 938,751 | |
| | | | | | | | | | | | | | | | | |
| Moderately Conservative Balanced Allocation | |
| | | | | | | | | | | | | |
| Assets* | | Level 1 | | | Level 2 | | | Level 3 | | | Total | |
| Open Ended Funds | | $ | 491,654 | | | $ | — | | | $ | — | | | $ | 491,654 | |
| Short-Term Investment | | | 75,938 | | | | — | | | | — | | | | 75,938 | |
| Total | | $ | 567,592 | | | $ | — | | | $ | — | | | $ | 567,592 | |
The Funds did not hold any Level 3 securities during the period.
(b) Federal Income Tax
It is each Portfolio’s policy to continue to qualify as a regulated investment company by complying with the provisions of the Internal Revenue Code that are applicable to regulated investment companies and to distribute substantially all of its taxable income and net realized gains to shareholders. Therefore, no federal income tax provision is required.
| NOTES TO FINANCIAL STATEMENTS |
| Six Months Ended February 28, 2023 (Unaudited)(Continued) |
Capital loss carry forwards, as of each Portfolio’s most recent tax year-ended August 31, 2022, available to offset future capital gains, and utilized capital gains, if any, are as follows:
| | | Non-Expiring | | | Non-Expiring | | | | | | | |
| | | Short-Term | | | Long-Term | | | CLCF Utilized | | | Total | |
| Large Capitalization Value | | $ | — | | | $ | — | | | $ | — | | | $ | — | |
| Large Capitalization Growth | | | — | | | | — | | | | — | | | | — | |
| Mid Capitalization | | | — | | | | — | | | | — | | | | — | |
| Small Capitalization | | | — | | | | — | | | | — | | | | — | |
| International Equity | | | 2,321,286 | | | | 221,586 | | | | 76,112 | | | | 2,542,872 | |
| Health & Biotechnology | | | — | | | | — | | | | — | | | | — | |
| Technology & Communications | | | — | | | | — | | | | — | | | | — | |
| Energy & Basic Materials | | | 842,460 | | | | 279,768 | | | | 60,095 | | | | 1,122,228 | |
| Financial Services | | | — | | | | — | | | | — | | | | — | |
| Investment Quality Bond | | | 746 | | | | — | | | | — | | | | 746 | |
| Municipal Bond | | | 8,328 | | | | 4,062 | | | | — | | | | 12,390 | |
| U.S. Government Money Market | | | — | | | | — | | | | — | | | | — | |
| Aggressive Balanced Allocation | | | — | | | | — | | | | — | | | | — | |
| Conservative Balanced Allocation | | | — | | | | — | | | | — | | | | — | |
| Moderate Balanced Allocation | | | — | | | | — | | | | — | | | | — | |
| Moderately Aggressive Balanced Allocation | | | — | | | | — | | | | — | | | | — | |
| Moderately Conservative Balanced Allocation | | | — | | | | — | | | | — | | | | — | |
The Portfolios recognize the tax benefits of uncertain tax positions only when the position is “more likely than not” to be sustained assuming examination by tax authorities. Management has reviewed the tax positions taken on its 2019-2021 returns and expected to be taken in the Portfolios’ 2022 returns and concluded that no liability for unrecognized tax benefits should be recorded related to uncertain tax positions. The Portfolios identify its major tax jurisdictions as U.S. Federal, Arizona and foreign jurisdictions where the Portfolios make significant investments. The Portfolios recognize interest and penalties, if any, related to unrecognized tax benefits as income tax expense in the Statements of Operations. During the period ended February 28, 2023, the Portfolios did not incur any interest or penalties.
(c) Security Transactions and Other Income
Security transactions are reflected for financial reporting purposes as of the trade date. Dividend income is recognized on the ex-dividend date, and interest income is recognized on an accrual basis including premium amortized and discount accreted. All paydown gains and losses are classified as interest income in the accompanying Statements of Operations in accordance with U.S. GAAP. Discounts and premiums on securities purchased are accreted and amortized, over the lives of the respective securities with a corresponding increase/decrease in the cost basis of that security using the yield to maturity method, or where applicable, the first call date of the security. Realized gains or losses from sales of securities are determined by comparing the identified cost of the security lot sold with the net sales proceeds. Withholding taxes on foreign dividends have been provided for in accordance with the Trust’s understanding of the applicable country’s tax rules and rates.
(d) Dividends and Distributions
The following table summarizes each Portfolio’s intended dividend and capital gain declaration policy:
| | | | | Capital |
| Portfolio | | Income Dividends | | Gains |
| Large Capitalization Value | | Annually | | Annually |
| Large Capitalization Growth | | Annually | | Annually |
| Mid Capitalization | | Annually | | Annually |
| Small Capitalization | | Annually | | Annually |
| International Equity | | Annually | | Annually |
| Health & Biotechnology | | Annually | | Annually |
| Technology & Communication | | Annually | | Annually |
| Energy & Basic Materials | | Annually | | Annually |
| Financial Services | | Annually | | Annually |
| Investment Quality Bond | | Monthly | | Annually |
| Municipal Bond | | Monthly | | Annually |
| U.S. Government Money Market | | Daily - paid monthly | | Annually |
| Aggressive Balanced Allocation | | Annually | | Annually |
| Conservative Balanced Allocation | | Annually | | Annually |
| NOTES TO FINANCIAL STATEMENTS |
| Six Months Ended February 28, 2023 (Unaudited)(Continued) |
| | | | | Capital |
| Portfolio | | Income Dividends | | Gains |
| Moderate Balanced Allocation | | Annually | | Annually |
| Moderately Aggressive Balanced Allocation | | Annually | | Annually |
| Moderately Conservative Balanced Allocation | | Annually | | Annually |
Each Portfolio records dividends and distributions to its shareholders on the ex-dividend date. The amount of dividends and distributions from net investment income and net realized gains are determined in accordance with federal income tax regulations, which may differ from GAAP. These “book-tax” differences are either permanent or temporary in nature. To the extent these differences are permanent in nature, such amounts are reclassified within the net asset accounts based on their federal tax-basis treatment; temporary differences do not require reclassification. To the extent dividends and distributions exceed current and accumulated earnings and profits for federal income tax purposes, they are reported as distributions of paid-in- surplus or tax return of capital. These reclassifications have no effect on net assets, results from operations or net asset value per share of each Portfolio.
(e) Allocation of Expenses
Expenses specifically attributable to a particular Portfolio are borne by that Portfolio. Other expenses are allocated to each Portfolio based on its net assets in relation to the total net assets of all the applicable Portfolios of the Trust or another reasonable basis. Each Fund’s income, expenses (other than the class specific distribution fees) and realized and unrealized gains and losses are allocated proportionally each day between the classes based upon the relative net assets of each class.
(f) Repurchase Agreements
In connection with transactions in repurchase agreements, it is the Trust’s policy that its custodian take possession of the underlying collateral securities, the fair value of which exceeds the principal amount of the repurchase transaction, including accrued interest, at all times. If the seller defaults, and the fair value of the collateral declines, realization of the collateral by the Trust may be delayed or limited.
(g) Indemnification
The Trust indemnifies its Officers and Trustees for certain liabilities that may arise from the performance of their duties to the Trust. Additionally, in the normal course of business, the Portfolios enter into contracts that contain a variety of representations and warranties and which provide general indemnities. The Portfolios’ maximum exposure under these arrangements is unknown, as this would involve future claims that may be made against the Portfolios that have not yet occurred. However, based on experience, the risk of loss due to these warranties and indemnities appears to be remote.
(h) Other
The preparation of the financial statements in accordance with accounting principles generally accepted in the United States of America requires management to make estimates and assumptions that affect the reported amounts and disclosures in the financial statements. Actual results could differ from those estimates.
Foreign currency. Investment securities and other assets and liabilities denominated in foreign currencies are translated into U.S. dollar amounts at the date of valuation. Purchases and sales of investment securities and income and expense items denominated in foreign currencies are translated into U.S. dollar amounts on the respective dates of such transactions.
The Trust does not isolate that portion of the results of operations resulting from changes in foreign exchange rates on investments from the fluctuations arising from changes in market prices of securities held. Such fluctuations are included with the net realized and unrealized gain or loss from investments.
Reported net realized foreign exchange gains or losses arise from sales of foreign currencies, currency gains or losses realized between the trade and settlement dates on securities transactions, and the difference between the amounts of dividends, interest, and foreign withholding taxes recorded on the company’s books and the U.S. dollar equivalent of the amounts actually received or paid. Net unrealized foreign exchange gains and losses arise from changes in the fair values of assets and liabilities, other than investments in securities at fiscal period end, resulting from changes in exchange rates.
Market Disruptions Risk. The Portfolio is subject to investment and operational risks associated with financial, economic and other global market developments and disruptions, including the recent spread of an infectious respiratory illness caused by a novel strain of coronavirus (known as COVID-19), which can negatively impact the securities markets and cause the Portfolio to lose value.
| NOTES TO FINANCIAL STATEMENTS |
| Six Months Ended February 28, 2023 (Unaudited)(Continued) |
The spread of COVID -19 has caused volatility, severe market dislocations and liquidity constraints in many markets, including markets for the securities the Portfolios hold, and may adversely affect the Portfolios’ investments and operations. The transmission of COVID-19 and efforts to contain its spread have resulted in travel restrictions and disruptions, closed international borders, enhanced health screenings at ports of entry and elsewhere, disruption of and delays in healthcare service preparation and delivery, quarantines, event and service cancellations or interruptions, disruptions to business operations and supply chains, and a reduction in consumer and business spending, as well as general concern and uncertainty that has negatively affected the economy. These disruptions have led to instability in the marketplace and the jobs market. The impact of COVID-19 could adversely affect the economies of many nations or the entire global economy, the financial well-being and performance of individual issuers, borrowers and sectors and the health of the markets generally in potentially significant and unforeseen ways.
The foregoing could lead to a significant economic downturn or recession, increased market volatility, a greater number of market closures, higher default rates and adverse effects on the values and liquidity of the Portfolios’ securities or other assets. Such impacts may adversely affect the performance of the Portfolios.
Under an agreement with the BNY Mellon Corp. (“BNY Mellon”), the Portfolios can lend their portfolio securities to brokers, dealers and other financial institutions approved by the Board of Trustees to earn additional income. Loans are collateralized by cash, in an amount at least equal to the market value of the securities loaned plus accrued interest, which is invested in highly liquid, short-term instruments such as repurchase agreements collateralized by U.S. Government securities and money market funds in accordance with the Portfolios’ security lending procedures. A portion of the income generated by the investment in the collateral, net of any rebates paid by BNY Mellon to the borrowers, is remitted to BNY Mellon as lending agent, and the remainder is paid to the Portfolios. The Portfolios continue to receive interest or dividends on the securities loaned. The Portfolios have the right under the Master Securities Lending Agreement to recover the securities from the borrower on demand; if the borrower fails to deliver the securities on a timely basis, the Portfolios could experience delays or losses on recovery. Additionally, the Portfolios are subject to the risk of loss from investments made with the cash received as collateral. The Portfolios manage credit exposure arising from these lending transactions by, in appropriate circumstances, entering into master netting agreements and collateral agreements with third party borrowers that provide in the event of default (such as bankruptcy or a borrower’s failure to pay or perform), the right to net a third party borrower’s rights and obligations under such agreement and liquidate and set off collateral against the net amount owed by the counterparty.
At February 28, 2023, the following portfolios loaned securities and received U.S. Government securities and cash collateral for the loan. This cash was invested in repurchase agreements as shown in the Schedules of Investments. The aggregate market value of the collateral shown below includes non-cash U.S Treasury securities and is calculated based on prior day’s prices.
| | | Market Value of | | | Market Value | | | Value of | |
| Portfolio | | Loaned Securities | | | of Collateral | | | Non-cash Collateral | |
| Large Capitalization Value | | $ | 1,002,661 | | | $ | 1,023,312 | | | $ | 1,022,895 | |
| Large Capitalization Growth | | | 185,314 | | | | 189,054 | | | | 189,054 | |
| Small Capitalization | | | 558,252 | | | | 579,359 | | | | 120,017 | |
At February 28, 2023, the percentage of total investment income the Portfolios received from the investment of cash collateral retained by the lending agent, BNY Mellon, was as follows:
| | | Percentage of Total |
| Portfolio | | Investment Income |
| Large Capitalization Value | | 0.82% |
| Large Capitalization Growth | | 0.17% |
| Mid Capitalization | | 0.04% |
| Small Capitalization | | 0.77% |
| International Equity | | 0.60% |
| Health & Biotechnology | | 0.02% |
| Technology & Communications | | 0.26% |
| NOTES TO FINANCIAL STATEMENTS |
| Six Months Ended February 28, 2023 (Unaudited)(Continued) |
The following table presents the Portfolios’ assets and liabilities available for offset under a master netting arrangement net of collateral pledged as of February 28, 2023.
| | | | | | Gross Amounts not offset in the | | | | |
| | | | | | Statements of Assets and Liabilities | | | | |
| | | Gross Amounts Recognized | | | Financial | | | | | | | |
| | | in Statements of Assets and | | | Instruments | | | Cash Collateral | | | Net Amount | |
| | | Liabilities | | | Pledged | | | Pledged | | | of Assets | |
| Large Capitalization Value | | | | | | | | | | | | | | | | |
| Description of Liability | | | | | | | | | | | | | | | | |
| Securities Loaned | | $ | 417 | | | $ | 417 | | | $ | — | | | $ | — | |
| | | | | | | | | | | | | | | | | |
| Small Capitalization | | | | | | | | | | | | | | | | |
| Description of Liability | | | | | | | | | | | | | | | | |
| Securities Loaned | | $ | 120,017 | | | $ | 120,017 | | | $ | — | | | $ | — | |
| 3. | MANAGEMENT FEE, ADMINISTRATION FEE AND OTHER TRANSACTIONS WITH AFFILIATES |
(a) The management fees are payable to the Manager monthly by each Portfolio and are computed daily at the following annual rates of each Portfolio’s average daily net assets: 1.25% for Health & Biotechnology, Technology & Communications, Energy & Basic Materials and Financial Services; 0.75% for Mid Capitalization and International Equity; 0.65% for Large Capitalization Value, Large Capitalization Growth and Small Capitalization; 0.55% for Investment Quality Bond and Municipal Bond; 0.475% for U.S. Government Money Market; 0.90% for Conservative Balanced Allocation, Moderately Conservative Balanced Allocation, Moderate Balanced Allocation, Moderately Aggressive Balanced Allocation, and Aggressive Balanced Allocation. The manager pays the fees charged by the Portfolios’ sub-advisers. The Portfolios do not pay the sub-advisers directly.
For the six months ended February 28, 2023, the Manager waived $3,591 for Energy & Basic Materials, $571 for Financial Services, $2,014 for Municipal Bond, $7,165 for Aggressive Balanced Allocation, $14,596 for Conservative Balanced Allocation, $10,206 for Moderate Balanced Allocation, $6,159 for Moderately Aggressive Balanced Allocation, and $5,029 for Moderately Conservative Balanced Allocation. The U.S Government Money Market Fund is subject to additional voluntary waivers by the Manager to ensure the portfolio maintains a NAV of $1.00.
(b) Ultimus Fund Solutions, LLC (“UFS”), an affiliate of Northern Lights Distributors, LLC (the “Distributor”) provides administrative, fund accounting and transfer agency services to the Portfolios pursuant to agreements with the Trust, for which it receives from each Portfolio: (i) a minimum annual fee or basis points in decreasing amounts as assets reach certain breakpoints; and (ii) any related out-of-pocket expenses.
Pursuant to the terms of the Trust’s Custody Administration Agreement with UFS (the “Custody Administration Agreement”), the Trust pays an asset-based fee in decreasing amounts as Trust assets reach certain breakpoints. The Trust also pays certain transaction fees and out-of-pocket expenses pursuant to the Custody Administration Agreement.
In addition, certain affiliates of the Distributor provide services to the Trust as follows:
Blu Giant, LLC (“Blu Giant”) – Blu Giant, an affiliate of UFS and the Distributor, provides EDGAR conversion and filing services as well as print management services for the Trust on an ad-hoc basis. For the provision of these services, Blu Giant receives customary fees from the Portfolios.
Certain employees of UFS are also officers of the Trust, and are not paid any fees directly by the Trust for serving in such capacity.
| NOTES TO FINANCIAL STATEMENTS |
| Six Months Ended February 28, 2023 (Unaudited)(Continued) |
(c) The Portfolios have adopted a Plan of Distribution pursuant to Rule 12b-1 under the 1940 Act (the “Plan”) with respect to the sale and distribution of Class A and C shares of the Portfolios. The Plan provides that each Portfolio will pay the Distributor or other entities, including the Manager, a fee, which is accrued daily and paid monthly, at the annual rate of 0.40% of the average daily net assets of Class A shares (0.25% of the average daily net assets of Aggressive Balanced Allocation, Conservative Balanced Allocation, Moderate Balanced Allocation, Moderately Aggressive Balanced Allocation and Moderately Conservative Balanced Allocation Class A shares) and 1.00% of the average daily net assets of the Portfolios’ Class C shares. A portion of the fee payable pursuant to the Plan, equal to 0.25% of the average daily net assets, is currently characterized as a service fee and it may be paid directly to the Manager, or other entities for providing support services. A service fee is a payment made for personal service and/or the maintenance of shareholder accounts. The aggregate of such service fee payments will not exceed 0.25% of average daily net assets. For the six months ended February 28, 2023 the Distributor waived $0 in fees for the U.S. Government Money Market Portfolio.
Class A shares are offered at net asset value plus a maximum sales load of 5.75%. Class C shares are offered subject to a CDSC of 1.00%. Class I shares are offered at net asset value.
For the six months ended February 28, 2023, the Distributor received sales charges on sales of the Portfolios’ Class A shares. In addition, CDSCs were paid to the Manager for Class C shares. The Distributor and the Manager have advised the Portfolios that the approximate amounts are as follows:
| Portfolio | | Distributor Sales Charges | | | CDSC’s | |
| | | Class A | | | Class C | |
| Large Capitalization Value | | $ | 1,273 | | | $ | 52 | |
| Large Capitalization Growth | | | 3,627 | | | | 42 | |
| Mid Capitalization | | | 236 | | | | 37 | |
| Small Capitalization | | | 56 | | | | 21 | |
| International Equity | | | 24 | | | | 14 | |
| Health & Biotechnology | | | 57 | | | | 67 | |
| Technology & Communications | | | 727 | | | | 99 | |
| Energy & Basic Materials | | | 17 | | | | 3 | |
| Financial Services | | | 17 | | | | — | |
| Investment Quality Bond | | | 36 | | | | — | |
| Municipal Bond | | | — | | | | — | |
| U.S Government Money Market | | | — | | | | 626 | |
| Aggressive Balanced Allocation | | | 4,315 | | | | 52 | |
| Conservative Balanced Allocation | | | — | | | | 139 | |
| Moderate Balanced Allocation | | | 52 | | | | 358 | |
| Moderately Aggressive Balanced Allocation | | | 31 | | | | 11 | |
| Moderately Conservative Balanced Allocation | | | — | | | | 98 | |
(d) The Trust and the Manager have entered into Excess Expense Agreements (the “Expense Agreements”). In connection with the Expense Agreements, the Manager is currently voluntarily waiving, all or a portion of its management fees and/or assuming certain other operating expenses (excluding front-end and contingent deferred sales loads, interest and tax expenses, leverage, dividends and interest on short positions, brokerage commissions, expenses incurred in connection with any merger, reorganization or liquidation, extraordinary or non-routine expenses and Acquired Fund Fees and Expenses) of certain Portfolios in order to maintain the expense ratios of each class of the Portfolios at or below predetermined levels (each an “Expense Cap”). The annual expense caps in effect at February 28, 2023, for each portfolio were: 3.00%, 3.60% and 2.60% for Class A, C and I shares, respectively, of Large Capitalization Value, Large Capitalization Growth, Mid Capitalization, and Small Capitalization; 3.30%, 3.90% and 2.90% for Class A, C and I shares, respectively, of International Equity; 2.30%, 2.90% and 1.90%, for Class A, C and I shares, respectively, of Investment Quality Bond and Municipal Bond; 2.15%, 2.75% and 1.75% for Class A, C and I shares, respectively, of U.S. Government Money Market; 3.40%, 4.00% and 3.00% for Class A, C and I shares, respectively, of Health & Biotechnology, Technology & Communications, Energy & Basic Materials and Financial Services. For the Aggressive Balanced Allocation, Conservative Balanced Allocation, Moderate Balanced Allocation, Moderately Aggressive Balanced Allocation and Moderately Conservative Balanced Allocation the Manager is waiving all or a portion of its management fees and/or assuming certain operating expenses (excluding front end and contingent deferred sales loads, interest and tax expenses, leverage, dividends and interest on short positions, brokerage commissions, expenses incurred in connection with any merger, reorganization or liquidation, extraordinary or non-routine expenses and Acquired Fund Fees and Expenses) the expense caps are 1.24%, 0.99% and 1.99% for Classes A, I and C shares respectively. Under the terms of the Expense Agreements, the Manager is permitted to seek reimbursement from the Portfolios, subject to limitations, for fees they waived and Portfolio expenses they paid within three (3) years of the end of the fiscal year in which such fees were waived or expenses paid, as long as the reimbursement does not cause the Portfolio’s operating expenses to exceed (i) the
| NOTES TO FINANCIAL STATEMENTS |
| Six Months Ended February 28, 2023 (Unaudited)(Continued) |
expense cap in place at the time the advisory fees were waived or the expenses were incurred; or (ii) the current expense cap, whichever is less.
The Expense Agreement with the Manager may be terminated by either party, without penalty, upon receipt of 60 days prior notice, except for the Aggressive Balanced Allocation, Conservative Balanced Allocation, Moderate Balanced Allocation, Moderately Aggressive Balanced Allocation and Moderately Conservative Balanced Allocation which shall continue through December 31, 2023.
In addition, the U.S. Government Money Market Portfolio’s distributor has agreed to waive Distribution Fees and/or Service (12b-1) Fees for the Portfolio’s Class A and C shares through December 31, 2023. The Agreement may only be terminated during its term by or with the consent of the Trust’s Board of Trustees.
The following table shows the available waived expenses and expiration date for each Portfolio subject to potential recovery.
| Portfolio | | 8/31/2023 | | | 8/31/2024 | | | 8/31/2025 | |
| International Equity | | $ | 30,421 | | | $ | 7,065 | | | $ | 12,272 | |
| Energy & Basic Materials | | | 7,300 | | | | 12,004 | | | | 3,323 | |
| Financial Services | | | 6,123 | | | | 5,710 | | | | 4,609 | |
| Investment Quality Bond | | | — | | | | — | | | | 843 | |
| Municipal Bond | | | 9,326 | | | | 9,915 | | | | 5,596 | |
| Aggressive Balanced Allocation | | | 9,335 | | | | 13,846 | | | | 12,260 | |
| Conservative Balanced Allocation | | | 19,169 | | | | 25,699 | | | | 27,543 | |
| Moderate Balanced Allocation | | | 12,115 | | | | 19,205 | | | | 19,364 | |
| Moderately Aggressive Balanced Allocation | | | 8,273 | | | | 12,873 | | | | 11,730 | |
| Moderately Conservative Balanced Allocation | | | 10,326 | | | | 11,586 | | | | 10,829 | |
(e) The following Portfolios in the Trust had portfolio trades executed with a certain broker pursuant to a commission recapture agreement. For the six months ended February 28, 2023, the amount received by the participating Portfolios under this arrangement was as follows: Large Cap Value, $3,984; Health & Biotechnology, $1,008; and Technology & Communications, $2,247. These amounts are included with the realized gain/loss for each Portfolio in the Statement of Operations.
| NOTES TO FINANCIAL STATEMENTS |
| Six Months Ended February 28, 2023 (Unaudited)(Continued) |
(f) Affiliated Investments — Companies which are affiliates of the Portfolios at February 28, 2023, are noted in the Portfolio’s Schedule of Investments. A summary of the investments in the affiliated investments are detailed below:
| Affiliated Holding | | Value at
8/31/2022 | | | Purchases | | | Sale Proceeds | | | Realized Gain
(Loss) | | | Change in
Unrealized
Appreciation
(Depreciation) | | | Value at
2/28/2023 | | | Shares at
2/28/2023 | | | Income | | | Long Term
Capital Gain
Distribution | |
| Aggressive Balanced Allocation | | | | | | | | | | | | | | | | | | | | | | | | | | | | | | | | | | | | |
| Saratoga Energy & Basic Materials Portfolio, CL I | | $ | 30,400 | | | $ | 3,979 | | | $ | 294 | | | $ | (24 | ) | | $ | 1,706 | | | $ | 35,767 | | | | 2,726 | | | $ | 2,621 | | | $ | — | |
| Saratoga Health & Biotechnology Portfolio, CL I | | | 37,663 | | | | 6,520 | | | | 418 | | | | (35 | ) | | | (844 | ) | | | 42,886 | | | | 1,934 | | | | — | | | | 2,117 | |
| Saratoga Large Capitalization Growth Portfolio, CL I | | | 122,256 | | | | 23,200 | | | | 1,459 | | | | (243 | ) | | | (10,217 | ) | | | 133,537 | | | | 6,287 | | | | — | | | | 7,730 | |
| Saratoga Large Capitalization Value Portfolio, CL I | | | 171,886 | | | | 33,628 | | | | 1,918 | | | | (93 | ) | | | (3,614 | ) | | | 199,889 | | | | 7,901 | | | | 885 | | | | 11,134 | |
| Saratoga Mid Capitalization Portfolio, CL I | | | 101,696 | | | | 14,887 | | | | 1,243 | | | | (145 | ) | | | 1,944 | | | | 117,139 | | | | 9,794 | | | | — | | | | 1,796 | |
| Saratoga Technology & Communications Portfolio, CL I | | | 30,388 | | | | 8,270 | | | | 373 | | | | (45 | ) | | | (5,180 | ) | | | 33,060 | | | | 1,752 | | | | — | | | | 4,343 | |
| Total | | | 494,289 | | | | | | | | | | | | (585 | ) | | | (16,205 | ) | | | 562,278 | | | | | | | | 3,506 | | | | 27,120 | |
| | | | | | | | | | | | | | | | | | | | | | | | | | | | | | | | | | | | | |
| Conservative Balanced Allocation | | | | | | | | | | | | | | | | | | | | | | | | | | | | | | | | | | | | |
| Saratoga Large Capitalization Growth Portfolio | | | 264,245 | | | | 15,677 | | | | 16,000 | | | | (1,355 | ) | | | (21,037 | ) | | | 241,530 | | | | 11,371 | | | | — | | | | 15,677 | |
| Saratoga Large Capitalization Value Portfolio, CL I | | | 367,534 | | | | 27,699 | | | | 21,300 | | | | (1,126 | ) | | | (7,560 | ) | | | 365,247 | | | | 14,437 | | | | 5,279 | | | | 22,420 | |
| Saratoga Mid Capitalization Portfolio, CL I | | | 220,453 | | | | 3,645 | | | | 14,000 | | | | (1,000 | ) | | | 3,700 | | | | 212,798 | | | | 17,793 | | | | — | | | | 3,646 | |
| Total | | | 852,232 | | | | | | | | | | | | (3,481 | ) | | | (24,897 | ) | | | 819,575 | | | | | | | | 5,279 | | | | 41,743 | |
| | | | | | | | | | | | | | | | | | | | | | | | | | | | | | | | | | | | | |
| Moderate Balanced Allocation | | | | | | | | | | | | | | | | | | | | | | | | | | | | | | | | | | | | |
| Saratoga Energy & Basic Materials Portfolio, CL I | | | 28,381 | | | | 1,177 | | | | 2,552 | | | | (483 | ) | | | 1,923 | | | | 28,446 | | | | 2,168 | | | | 772 | | | | — | |
| Saratoga Health & Biotechnology Portfolio, CL I | | | 35,761 | | | | 2,437 | | | | 3,650 | | | | (671 | ) | | | (42 | ) | | | 33,835 | | | | 1,526 | | | | — | | | | 1,878 | |
| Saratoga Large Capitalization Growth Portfolio, CL I | | | 232,635 | | | | 17,707 | | | | 34,792 | | | | (7,379 | ) | | | (14,257 | ) | | | 193,914 | | | | 9,130 | | | | — | | | | 13,759 | |
| Saratoga Large Capitalization Value Portfolio, CL I | | | 325,123 | | | | 29,413 | | | | 46,935 | | | | (3,254 | ) | | | (6,321 | ) | | | 298,026 | | | | 11,780 | | | | 4,634 | | | | 19,683 | |
| Saratoga Mid Capitalization Portfolio, CL I | | | 195,317 | | | | 6,583 | | | | 29,800 | | | | (4,404 | ) | | | 6,147 | | | | 173,843 | | | | 14,535 | | | | — | | | | 3,223 | |
| Saratoga Technology & Communications Portfolio, CL I | | | 33,105 | | | | 4,952 | | | | 3,064 | | | | (379 | ) | | | (5,233 | ) | | | 29,381 | | | | 1,557 | | | | — | | | | 4,433 | |
| Total | | | 850,322 | | | | | | | | | | | | (16,570 | ) | | | (17,783 | ) | | | 757,445 | | | | | | | | 5,406 | | | | 42,976 | |
| | | | | | | | | | | | | | | | | | | | | | | | | | | | | | | | | | | | | |
| Moderately Aggressive Balanced Allocation | | | | | | | | | | | | | | | | | | | | | | | | | | | | | | | | | | | | |
| Saratoga Energy & Basic Materials Portfolio, CL I | | | 22,769 | | | | 665 | | | | — | | | | — | | | | 1,278 | | | | 24,712 | | | | 1,884 | | | | 665 | | | | — | |
| Saratoga Health & Biotechnology Portfolio, CL I | | | 24,375 | | | | 1,375 | | | | — | | | | — | | | | (564 | ) | | | 25,186 | | | | 1,136 | | | | — | | | | 1,375 | |
| Saratoga Large Capitalization Growth Portfolio, CL I | | | 118,895 | | | | 6,957 | | | | 8,600 | | | | (1,359 | ) | | | (8,717 | ) | | | 107,176 | | | | 5,046 | | | | — | | | | 6,957 | |
| Saratoga Large Capitalization Value Portfolio, CL I | | | 166,113 | | | | 12,288 | | | | 12,300 | | | | (650 | ) | | | (3,409 | ) | | | 162,042 | | | | 6,405 | | | | 2,342 | | | | 9,947 | |
| Saratoga Mid Capitalization Portfolio, CL I | | | 107,872 | | | | 1,761 | | | | 8,000 | | | | (1,832 | ) | | | 3,043 | | | | 102,844 | | | | 8,599 | | | | — | | | | 1,761 | |
| Saratoga Technology & Communications Portfolio, CL I | | | 19,930 | | | | 2,862 | | | | — | | | | — | | | | (3,421 | ) | | | 19,371 | | | | 1,027 | | | | — | | | | 2,862 | |
| Total | | | 459,954 | | | | | | | | | | | | (3,841 | ) | | | (11,790 | ) | | | 441,331 | | | | | | | | 3,007 | | | | 22,902 | |
| | | | | | | | | | | | | | | | | | | | | | | | | | | | | | | | | | | | | |
| Moderately Conservative Balanced Allocation | | | | | | | | | | | | | | | | | | | | | | | | | | | | | | | | | | | | |
| Saratoga Large Capitalization Growth Portfolio, CL I | | | 87,806 | | | | 4,619 | | | | 14,468 | | | | (2,309 | ) | | | (4,989 | ) | | | 70,659 | | | | 3,327 | | | | — | | | | 4,619 | |
| Saratoga Large Capitalization Value Portfolio, CL I | | | 119,865 | | | | 8,111 | | | | 18,490 | | | | (734 | ) | | | (2,430 | ) | | | 106,322 | | | | 4,202 | | | | 1,546 | | | | 6,566 | |
| Saratoga Mid Capitalization Portfolio, CL I | | | 76,978 | | | | 1,131 | | | | 12,918 | | | | (1,920 | ) | | | 2,350 | | | | 65,621 | | | | 5,487 | | | | — | | | | 1,131 | |
| Total | | | 284,649 | | | | | | | | | | | | (4,963 | ) | | | (5,069 | ) | | | 242,602 | | | | | | | | 1,546 | | | | 12,316 | |
| NOTES TO FINANCIAL STATEMENTS |
| Six Months Ended February 28, 2023 (Unaudited)(Continued) |
| 4. | INVESTMENT TRANSACTIONS |
| (a) | For the six months ended February 28, 2023, the cost of purchases and proceeds from sales of investment securities, other than short-term securities, for the Portfolios were as follows: |
| Portfolio | | Purchases | | | Sales | |
| Large Capitalization Value | | $ | 5,923,299 | | | $ | 5,924,754 | |
| Large Capitalization Growth | | | 6,616,725 | | | | 7,992,699 | |
| Mid Capitalization | | | 3,277,876 | | | | 3,606,850 | |
| Small Capitalization | | | 2,913,999 | | | | 2,741,503 | |
| International Equity | | | 1,000,835 | | | | 831,017 | |
| Health & Biotechnology | | | 3,629,980 | | | | 4,579,159 | |
| Technology & Communications | | | 1,988,452 | | | | 7,709,130 | |
| Energy & Basic Materials | | | 602,555 | | | | 754,466 | |
| Financial Services | | | 313,402 | | | | 247,429 | |
| Investment Quality Bond | | | 126,869 | | | | — | |
| Municipal Bond | | | 5,004 | | | | 87,500 | |
| Aggressive Balanced Allocation | | | 147,029 | | | | 10,517 | |
| Conservative Balanced Allocation | | | 64,545 | | | | 56,600 | |
| Moderate Balanced Allocation | | | 83,710 | | | | 186,018 | |
| Moderately Aggressive Balanced Allocation | | | 31,716 | | | | 35,800 | |
| Moderately Conservative Balanced Allocation | | | 17,851 | | | | 99,553 | |
(b) Certain Portfolios may enter into foreign currency exchange contracts. Because various Portfolios may invest in securities denominated in foreign currencies, they may seek to hedge foreign currency risks by engaging in foreign currency exchange transactions. These may include buying or selling foreign currencies on a spot basis, entering into foreign currency forward contracts, and buying and selling foreign currency options, foreign currency futures, and options on foreign currency futures. Currency exchange rates may fluctuate significantly over short periods and can be subject to unpredictable change based on such factors as political developments and currency controls by foreign governments.
(c) Other Investment Companies or Exchange Traded Funds – Certain Portfolios may invest up to 100% of their net assets in shares of affiliated and unaffiliated investment companies, including money market mutual funds, other mutual funds or exchange-traded funds (“ETFs”). An ETF generally is an open-end investment company, unit investment trust or a portfolio of securities deposited with a depository in exchange for depository receipts. ETFs provide investors the opportunity to buy or sell throughout the day an entire portfolio of securities in a single security. Although index mutual funds are similar to index-based ETFs, they are generally sold and redeemed only once per day at market close. The ETFs in which a Portfolio invests may be subject to liquidity risk. Liquidity risk exists when particular investments are difficult to purchase or sell, possibly preventing the sale of the security at an advantageous time or price. To the extent that the ETFs in which a Portfolio invests hold securities of companies with smaller market capitalizations or securities with substantial market risk, they will have a greater exposure to liquidity risk. In addition, ETFs are subject to the following risks that do not apply to conventional mutual funds that can be found in “Exchange-Traded Funds” below: (1) the market price of the ETF’s shares may trade at a discount to their net asset value; (2) an active trading market for an ETF’s shares may not develop or be maintained; or (3) trading of an ETF’s shares may be halted if the listing exchange deem such action appropriate, the shares are de-listed from the exchange, or the activation of market-wide “circuit breakers” (which are tied to large decreases in stock prices) halts stock trading generally. Additionally, ETFs have management fees, which increase their cost. In addition to the advisory and operational fees a Portfolio bears directly in connection with its own operation, the Portfolio also bears its pro rata portion of the advisory and operational expenses incurred indirectly through investments in other investment companies.
The derivative instruments outstanding, as of February 28, 2023, as disclosed in the Portfolio of Investments and Statement of Assets and Liabilities, and the amounts of realized and changes in unrealized gains and losses on derivative instruments during the period, as disclosed in the Statement of Operations, serve as indicators of the volume of derivative activity for the Fund. The derivatives are not accounted for as hedging instruments under GAAP.
| NOTES TO FINANCIAL STATEMENTS |
| Six Months Ended February 28, 2023 (Unaudited)(Continued) |
The effect of derivative instruments on the Statements of Assets and Liabilities for the period ended February 28, 2023, were as follows:
| | | | | | | Location of derivatives on Statements of | | Fair value of asset | |
| Fund | | Derivative | | Risk Type | | Assets and Liabilities | | derivatives | |
| International Equity | | | | | | | | |
| | | Forward Exchange Contracts | | Foreign Exchange | | Unrealized appreciation on forward currency exchange contracts | | $ | 1 | |
The effect of derivative instruments on the Statements of Operations for the period ended February 28, 2023, were as follows:
| | | | | | | | | Realized and unrealized | |
| Fund | | Derivative | | Location of loss on derivatives | | Risk Type | | loss on derivatives | |
| International Equity | | | | | | |
| | | Forward Exchange Contracts | | Net realized loss from investments and foreign currency transactions | | Foreign Exchange | | $ | (4,153 | ) |
| | | Forward Exchange Contracts | | Net change in unrealized appreciation on investments and foreign currency translations | | Foreign Exchange | | | 926 | |
| | | | | | | Total | | $ | (3,227 | ) |
| NOTES TO FINANCIAL STATEMENTS |
| Six Months Ended February 28, 2023 (Unaudited)(Continued) |
| 5. | AUTHORIZED SHARES OF BENEFICIAL INTEREST AND PAR VALUE PER SHARE |
Each Portfolio has unlimited shares of beneficial interest authorized at $0.01 par value per share. For the periods indicated, transactions were as follows:
| | | Class I Shares | | | Class A Shares | | | Class C Shares | |
| | | Six Months Ended | | | Year Ended | | | Six Months Ended | | | Year Ended | | | Six Months Ended | | | Year Ended | |
| | | February 28, 2023 | | | August 31, 2022 | | | February 28, 2023 | | | August 31, 2022 | | | February 28, 2023 | | | August 31, 2022 | |
| Large Capitalization Value | | | | | | | | | | | | | | | | | | |
| Issued | | | 74,155 | | | | 119,488 | | | | 944 | | | | 2,665 | | | | 318 | | | | 266 | |
| Redeemed | | | (47,071 | ) | | | (79,642 | ) | | | (103 | ) | | | (5,786 | ) | | | — | | | | (321 | ) |
| Reinvested from Dividends | | | 62,336 | | | | 128,702 | | | | 1,256 | | | | 3,054 | | | | 803 | | | | 1,492 | |
| Net Increase (Decrease) in Shares | | | 89,420 | | | | 168,548 | | | | 2,097 | | | | (67 | ) | | | 1,121 | | | | 1,437 | |
| Large Capitalization Growth | | | | | | | | | | | | | | | | | | | | | | | | |
| Issued | | | 86,811 | | | | 64,915 | | | | 3,425 | | | | 9,588 | | | | 559 | | | | 369 | |
| Redeemed | | | (131,624 | ) | | | (122,844 | ) | | | (954 | ) | | | (12,608 | ) | | | (32,752 | ) | | | (41,035 | ) |
| Reinvested from Dividends | | | 57,567 | | | | 165,503 | | | | 4,556 | | | | 11,729 | | | | 33,647 | | | | 78,882 | |
| Net Increase (Decrease) in Shares | | | 12,754 | | | | 107,574 | | | | 7,027 | | | | 8,709 | | | | 1,454 | | | | 38,216 | |
| Mid Capitalization | | | | | | | | | | | | | | | | | | | | | | | | |
| Issued | | | 9,006 | | | | 30,666 | | | | 525 | | | | 4,629 | | | | 498 | | | | 440 | |
| Redeemed | | | (25,725 | ) | | | (51,919 | ) | | | (9,783 | ) | | | (21,583 | ) | | | — | | | | (3,102 | ) |
| Reinvested from Dividends | | | 13,183 | | | | 98,547 | | | | 2,652 | | | | 20,879 | | | | 247 | | | | 1,629 | |
| Net Increase (Decrease) in Shares | | | (3,536 | ) | | | 77,294 | | | | (6,606 | ) | | | 3,925 | | | | 745 | | | | (1,033 | ) |
| Small Capitalization | | | | | | | | | | | | | | | | | | | | | | | | |
| Issued | | | 62,282 | | | | 100,977 | | | | 255 | | | | — | | | | 2,344 | | | | 1,157 | |
| Redeemed | | | (39,379 | ) | | | (115,004 | ) | | | (194 | ) | | | (1,661 | ) | | | — | | | | (1 | ) |
| Reinvested from Dividends | | | 79,483 | | | | 161,280 | | | | 1,024 | | | | 2,329 | | | | 1,912 | | | | 874 | |
| Net Increase in Shares | | | 102,386 | | | | 147,253 | | | | 1,085 | | | | 668 | | | | 4,256 | | | | 2,030 | |
| International Equity | | | | | | | | | | | | | | | | | | | | | | | | |
| Issued | | | 45,341 | | | | 30,699 | | | | 78 | | | | 32 | | | | 160 | | | | 130 | |
| Redeemed | | | (20,540 | ) | | | (87,524 | ) | | | (101 | ) | | | (4,720 | ) | | | — | | | | — | |
| Reinvested from Dividends | | | 895 | | | | 1,301 | | | | — | | | | — | | | | — | | | | 3 | |
| Net Increase (Decrease) in Shares | | | 25,696 | | | | (55,524 | ) | | | (23 | ) | | | (4,688 | ) | | | 160 | | | | 133 | |
| Health & Biotechnology | | | | | | | | | | | | | | | | | | | | | | | | |
| Issued | | | 12,305 | | | | 23,658 | | | | 196 | | | | 5,157 | | | | 248 | | | | 246 | |
| Redeemed | | | (30,865 | ) | | | (33,351 | ) | | | (10,240 | ) | | | (17,461 | ) | | | (2,478 | ) | | | (2,538 | ) |
| Reinvested from Dividends | | | 14,684 | | | | 9,146 | | | | 14,557 | | | | 9,148 | | | | 3,898 | | | | 2,301 | |
| Net Increase (Decrease) in Shares | | | (3,876 | ) | | | (547 | ) | | | 4,513 | | | | (3,156 | ) | | | 1,668 | | | | 9 | |
| Technology & Communications | | | | | | | | | | | | | | | | | | | | | | | | |
| Issued | | | 30,183 | | | | 48,178 | | | | 2,340 | | | | 43,127 | | | | 354 | | | | 1,605 | |
| Redeemed | | | (170,931 | ) | | | (203,520 | ) | | | (55,038 | ) | | | (91,469 | ) | | | (86,707 | ) | | | (224,527 | ) |
| Reinvested from Dividends | | | 153,201 | | | | 109,720 | | | | 142,111 | | | | 86,176 | | | | 80,804 | | | | 75,047 | |
| Net Increase (Decrease) in Shares | | | 12,453 | | | | (45,622 | ) | | | 89,413 | | | | 37,834 | | | | (5,549 | ) | | | (147,875 | ) |
| Energy & Basic Materials | | | | | | | | | | | | | | | | | | | | | | | | |
| Issued | | | 11,592 | | | | 55,483 | | | | 84 | | | | 11,812 | | | | — | | | | 141 | |
| Redeemed | | | (21,305 | ) | | | (37,157 | ) | | | (963 | ) | | | (974 | ) | | | (754 | ) | | | (134 | ) |
| Reinvested from Dividends | | | 2,982 | | | | 1,281 | | | | 567 | | | | 72 | | | | 22 | | | | 4 | |
| Net Increase (Decrease) in Shares | | | (6,731 | ) | | | 19,607 | | | | (312 | ) | | | 10,910 | | | | (732 | ) | | | 11 | |
| Financial Services | | | | | | | | | | | | | | | | | | | | | | | | |
| Issued | | | 37,657 | | | | 28,403 | | | | 55 | | | | — | | | | — | | | | — | |
| Redeemed | | | (19,230 | ) | | | (41,508 | ) | | | (13,661 | ) | | | (965 | ) | | | — | | | | — | |
| Reinvested from Dividends | | | 6,187 | | | | 5,684 | | | | 455 | | | | 1,076 | | | | — | | | | — | |
| Net Increase (Decrease) in Shares | | | 24,614 | | | | (7,421 | ) | | | (13,151 | ) | | | 111 | | | | — | | | | — | |
| Investment Quality Bond | | | | | | | | | | | | | | | | | | | | | | | | |
| Issued | | | 13,684 | | | | 82,426 | | | | 108 | | | | 639 | | | | — | | | | — | |
| Redeemed | | | (45,704 | ) | | | (102,013 | ) | | | (128 | ) | | | (2,110 | ) | | | (3,268 | ) | | | — | |
| Reinvested from Dividends | | | 4,725 | | | | 15,942 | | | | 41 | | | | 212 | | | | 1 | | | | 51 | |
| Net Increase (Decrease) in Shares | | | (27,295 | ) | | | (3,645 | ) | | | 21 | | | | (1,259 | ) | | | (3,267 | ) | | | 51 | |
| NOTES TO FINANCIAL STATEMENTS |
| Six Months Ended February 28, 2023 (Unaudited)(Continued) |
| | | Class I Shares | | | Class A Shares | | | Class C Shares | |
| | | Six Months Ended | | | Year Ended | | | Six Months Ended | | | Year Ended | | | Six Months Ended | | | Year Ended | |
| | | February 28, 2023 | | | August 31, 2022 | | | February 28, 2023 | | | August 31, 2022 | | | February 28, 2023 | | | August 31, 2022 | |
| Municipal Bond | | | | | | | | | | | | | | | | | | | | | | | | |
| Issued | | | 102 | | | | 4,038 | | | | — | | | | — | | | | 179 | | | | 154 | |
| Redeemed | | | (1,878 | ) | | | (19,023 | ) | | | (6,124 | ) | | | (1,135 | ) | | | — | | | | (1,565 | ) |
| Reinvested from Dividends | | | — | | | | — | | | | — | | | | — | | | | — | | | | — | |
| Net Increase (Decrease) in Shares | | | (1,776 | ) | | | (14,985 | ) | | | (6,124 | ) | | | (1,135 | ) | | | 179 | | | | (1,411 | ) |
| U.S. Government Money Market | | | | | | | | | | | | | | | | | | | | | | | | |
| Issued | | | 1,305,260 | | | | 1,604,223 | | | | 1,719 | | | | 841 | | | | 47,871 | | | | 17,054 | |
| Redeemed | | | (1,688,411 | ) | | | (1,983,775 | ) | | | (1,794 | ) | | | (271,534 | ) | | | (82,831 | ) | | | (28,529 | ) |
| Reinvested from Dividends | | | 45,020 | | | | 531 | | | | 1,512 | | | | 19 | | | | 415 | | | | 8 | |
| Net Increase (Decrease) in Shares | | | (338,131 | ) | | | (379,021 | ) | | | 1,437 | | | | (270,674 | ) | | | (34,545 | ) | | | (11,467 | ) |
| Aggressive Balanced Allocation | | | | | | | | | | | | | | | | | | | | | | | | |
| Issued | | | 1,210 | | | | 3,041 | | | | 11,986 | | | | — | | | | 529 | | | | 469 | |
| Redeemed | | | (691 | ) | | | (2,390 | ) | | | — | | | | (418 | ) | | | (160 | ) | | | (1,665 | ) |
| Reinvested from Dividends | | | 5,189 | | | | 6,552 | | | | — | ** | | | — | ** | | | 926 | | | | 1,276 | |
| Net Increase (Decrease) in Shares | | | 5,708 | | | | 7,203 | | | | 11,986 | | | | (418 | ) | | | 1,295 | | | | 80 | |
| Conservative Balanced Allocation | | | | | | | | | | | | | | | | | | | | | | | | |
| Issued | | | 5,494 | | | | 6,155 | | | | — | | | | — | | | | 1,413 | | | | 1,334 | |
| Redeemed | | | (1,340 | ) | | | (2,091 | ) | | | (142 | ) | | | (5 | ) | | | (236 | ) | | | (1,288 | ) |
| Reinvested from Dividends | | | 9,126 | | | | 13,416 | | | | 157 | | | | 243 | | | | 2,773 | | | | 3,947 | |
| Net Increase (Decrease) in Shares | | | 13,280 | | | | 17,480 | | | | 15 | | | | 238 | | | | 3,950 | | | | 3,993 | |
| Moderate Balanced Allocation | | | | | | | | | | | | | | | | | | | | | | | | |
| Issued | | | 1,458 | | | | 3,847 | | | | 82 | | | | 100 | | | | 3,564 | | | | 3,856 | |
| Redeemed | | | (12,223 | ) | | | (685 | ) | | | — | | | | (3,115 | ) | | | (1,164 | ) | | | (3,121 | ) |
| Reinvested from Dividends | | | 6,192 | | | | 7,759 | | | | 91 | | | | 333 | | | | 2,799 | | | | 3,101 | |
| Net Increase (Decrease) in Shares | | | (4,573 | ) | | | 10,921 | | | | 173 | | | | (2,682 | ) | | | 5,199 | | | | 3,836 | |
| Moderately Aggressive Balanced Allocation | | | | | | | | | | | | | | | | | | | | | | | | |
| Issued | | | 410 | | | | 1,877 | | | | 50 | | | | 5,513 | | | | 775 | | | | 780 | |
| Redeemed | | | (2 | ) | | | (211 | ) | | | (1 | ) | | | (1 | ) | | | — | | | | (461 | ) |
| Reinvested from Dividends | | | 3,563 | | | | 4,638 | | | | 345 | | | | 455 | | | | 1,080 | | | | 1,155 | |
| Net Increase (Decrease) in Shares | | | 3,971 | | | | 6,304 | | | | 394 | | | | 5,967 | | | | 1,855 | | | | 1,474 | |
| Moderately Conservative Balanced Allocation | | | | | | | | | | | | | | | | | | | | | | | | |
| Issued | | | 27 | | | | 50 | | | | — | | | | — | | | | 1,095 | | | | 604 | |
| Redeemed | | | (10,423 | ) | | | (7,125 | ) | | | — | | | | — | | | | — | | | | (604 | ) |
| Reinvested from Dividends | | | 3,048 | | | | 5,224 | | | | — | ** | | | — | ** | | | 1,243 | | | | 1,541 | |
| Net Increase (Decrease) in Shares | | | (7,348 | ) | | | (1,851 | ) | | | — | ** | | | — | ** | | | 2,338 | | | | 1,541 | |
| ** | Amount represents less than 0.5 shares. |
| NOTES TO FINANCIAL STATEMENTS |
| Six Months Ended February 28, 2023 (Unaudited)(Continued) |
| 6. | AGGREGATE UNREALIZED APPRECIATION AND DEPRECIATION – TAX BASIS |
The identified cost of investments in securities owned by each Fund for federal income tax purposes, and its respective gross unrealized appreciation and depreciation February 28, 2023, were as follows:
| | | | | | Gross | | | Gross | | | Net Unrealized | |
| | | Tax | | | Unrealized | | | Unrealized | | | Appreciation/ | |
| | | Cost | | | Appreciation | | | Depreciation | | | (Depreciation) | |
| Large Capitalization Value | | $ | 20,876,931 | | | $ | 1,826,948 | | | $ | (658,538 | ) | | $ | 1,168,410 | |
| Large Capitalization Growth | | | 19,003,740 | | | | 3,819,102 | | | | (959,625 | ) | | | 2,859,477 | |
| Mid Capitalization | | | 8,432,187 | | | | 2,890,080 | | | | (214,242 | ) | | | 2,675,838 | |
| Small Capitalization | | | 5,690,242 | | | | 899,568 | | | | (378,032 | ) | | | 521,536 | |
| International Equity | | | 3,102,154 | | | | 484,683 | | | | (144,445 | ) | | | 340,238 | |
| Health & Biotechnology | | | 9,430,484 | | | | 2,752,743 | | | | (293,681 | ) | | | 2,459,062 | |
| Technology & Communications | | | 14,395,769 | | | | 20,755,460 | | | | (1,081,060 | ) | | | 19,674,400 | |
| Energy & Basic Materials | | | 1,462,090 | | | | 411,602 | | | | (108,618 | ) | | | 302,984 | |
| Financial Services | | | 950,216 | | | | 478,860 | | | | (24,572 | ) | | | 454,288 | |
| Investment Quality Bond | | | 11,706,455 | | | | — | | | | (307,351 | ) | | | (307,351 | ) |
| Municipal Bond | | | 643,084 | | | | — | | | | (11,229 | ) | | | (11,229 | ) |
| U.S. Government Money Market | | | 4,917,978 | | | | — | | | | — | | | | — | |
| Aggressive Balanced Allocation | | | 1,111,901 | | | | 17,733 | | | | (53,099 | ) | | | (35,366 | ) |
| Conservative Balanced Allocation | | | 2,831,407 | | | | 719 | | | | (115,298 | ) | | | (114,579 | ) |
| Moderate Balanced Allocation | | | 1,640,479 | | | | 20,059 | | | | (69,935 | ) | | | (49,876 | ) |
| Moderately Aggressive Balanced Allocation | | | 965,341 | | | | 16,521 | | | | (43,111 | ) | | | (26,590 | ) |
| Moderately Conservative Balanced Allocation | | | 588,745 | | | | 554 | | | | (21,707 | ) | | | (21,153 | ) |
| 7. | DISTRIBUTIONS TO SHAREHOLDERS AND TAX COMPONENTS OF CAPITAL |
The tax character of dividends utilized during the period ended August 31, 2022 was as follows:
| For fiscal year ended | | Ordinary | | | Long-Term | | | Exempt | | | Return of | | | | |
| 8/31/2022 | | Income | | | Capital Gains | | | Income | | | Capital | | | Total | |
| Large Capitalization Value | | $ | 2,000,493 | | | $ | 1,783,389 | | | $ | — | | | $ | — | | | $ | 3,783,882 | |
| Large Capitalization Growth | | | 1,648,261 | | | | 4,562,360 | | | | — | | | | 433,707 | | | | 6,644,328 | |
| Mid Capitalization | | | 352,691 | | | | 1,296,834 | | | | — | | | | — | | | | 1,649,525 | |
| Small Capitalization | | | 202,520 | | | | 1,215,240 | | | | — | | | | — | | | | 1,417,760 | |
| International Equity | | | 17,052 | | | | — | | | | — | | | | — | | | | 17,052 | |
| Health & Biotechnology | | | 53,205 | | | | 401,719 | | | | — | | | | — | | | | 454,924 | |
| Technology & Communications | | | — | | | | 7,486,289 | | | | — | | | | — | | | | 7,486,289 | |
| Energy & Basic Materials | | | 15,209 | | | | — | | | | — | | | | — | | | | 15,209 | |
| Financial Services | | | 31,650 | | | | 45,346 | | | | — | | | | — | | | | 76,996 | |
| Investment Quality Bond | | | — | | | | 154,969 | | | | — | | | | — | | | | 154,969 | |
| Municipal Bond | | | — | | | | — | | | | — | | | | — | | | | — | |
| U.S. Government Money Market | | | 615 | | | | — | | | | — | | | | — | | | | 615 | |
| Aggressive Balanced Allocation | | | 27,299 | | | | 62,162 | | | | — | | | | — | | | | 89,461 | |
| Conservative Balanced Allocation | | | 53,920 | | | | 144,185 | | | | — | | | | — | | | | 198,105 | |
| Moderate Balanced Allocation | | | 44,890 | | | | 85,488 | | | | — | | | | — | | | | 130,378 | |
| Moderately Aggressive Balanced Allocation | | | 24,553 | | | | 47,393 | | | | — | | | | — | | | | 71,946 | |
| Moderately Conservative Balanced Allocation | | | 19,978 | | | | 59,846 | | | | — | | | | — | | | | 79,824 | |
| NOTES TO FINANCIAL STATEMENTS |
| Six Months Ended February 28, 2023 (Unaudited)(Continued) |
The tax character of dividends utilized during the period ended August 31, 2021 was as follows:
| For fiscal year ended | | Ordinary | | | Long-Term | | | Exempt | | | Return of | | | | |
| 8/31/2021 | | Income | | | Capital Gains | | | Income | | | Capital | | | Total | |
| Large Capitalization Value | | $ | — | | | $ | — | | | $ | — | | | $ | — | | | $ | — | |
| Large Capitalization Growth | | | — | | | | 2,825,180 | | | | — | | | | — | | | | 2,825,180 | |
| Mid Capitalization | | | 111,672 | | | | 790,855 | | | | — | | | | — | | | | 902,527 | |
| Small Capitalization | | | — | | | | — | | | | — | | | | — | | | | — | |
| International Equity | | | 91,767 | | | | — | | | | — | | | | — | | | | 91,767 | |
| Health & Biotechnology | | | 24,182 | | | | 1,457,402 | | | | — | | | | — | | | | 1,481,584 | |
| Technology & Communications | | | — | | | | 7,561,392 | | | | — | | | | — | | | | 7,561,392 | |
| Energy & Basic Materials | | | 16,483 | | | | — | | | | — | | | | — | | | | 16,483 | |
| Financial Services | | | — | | | | 46,047 | | | | — | | | | — | | | | 46,047 | |
| Investment Quality Bond | | | 8,659 | | | | 4,027 | | | | — | | | | — | | | | 12,686 | |
| Municipal Bond | | | — | | | | — | | | | — | | | | 514 | | | | 514 | |
| U.S. Government Money Market | | | 1,175 | | | | — | | | | — | | | | — | | | | 1,175 | |
| Aggressive Balanced Allocation | | | 8,359 | | | | 6,565 | | | | — | | | | — | | | | 14,924 | |
| Conservative Balanced Allocation | | | 5,711 | | | | 2,609 | | | | — | | | | — | | | | 8,320 | |
| Moderate Balanced Allocation | | | 2,713 | | | | 14,800 | | | | — | | | | — | | | | 17,513 | |
| Moderately Aggressive Balanced Allocation | | | 4,569 | | | | 7,208 | | | | — | | | | — | | | | 11,777 | |
| Moderately Conservative Balanced Allocation | | | 284 | | | | 10,498 | | | | — | | | | — | | | | 10,782 | |
During the fiscal year ended August 31, 2022, the Funds utilized tax equalization which is the use of earnings and profits distributions to shareholders on redemption of shares as part of the dividends paid deduction for income tax purposes. Permanent book and tax differences, primarily attributable to the book/tax basis treatment of distributions in excess, net operating losses and short-term capital gains, tax adjustments for prior year tax returns, reclassification of Fund distributions, adjustments for nondeductible payments and foreign tax credit pass-through, and the use of tax equalization credits, resulted in reclassification for the tax year ended August 31, 2022 as follows:
| | | Paid | | | Distributable | |
| | | In | | | or Accumulated | |
| | | Capital | | | Earnings (Loss) | |
| Large Capitalization Value | | $ | 174,405 | | | $ | (174,405 | ) |
| Large Capitalization Growth | | | (310,779 | ) | | | 310,779 | |
| Mid Capitalization | | | (8,647 | ) | | | 8,647 | |
| Small Capitalization | | | 47,442 | | | | (47,442 | ) |
| International Equity | | | — | | | | — | |
| Health & Biotechnology | | | (21,397 | ) | | | 21,397 | |
| Technology & Communications | | | (198,942 | ) | | | 198,942 | |
| Energy & Basic Materials | | | — | | | | — | |
| Financial Services | | | (3,454 | ) | | | 3,454 | |
| Investment Quality Bond | | | (55,687 | ) | | | 55,687 | |
| Municipal Bond | | | (12,122 | ) | | | 12,122 | |
| U.S. Government Money Market | | | — | | | | — | |
| Aggressive Balanced Allocation | | | — | | | | — | |
| Conservative Balanced Allocation | | | — | | | | — | |
| Moderate Balanced Allocation | | | — | | | | — | |
| Moderately Aggressive Balanced Allocation | | | — | | | | — | |
| Moderately Conservative Balanced Allocation | | | — | | | | — | |
Net assets were unaffected by the above reclassifications.
| NOTES TO FINANCIAL STATEMENTS |
| Six Months Ended February 28, 2023 (Unaudited)(Continued) |
As of each of the Portfolio’s tax year-ended August 31, 2022, the components of distributable earnings on a tax basis were as follows:
| | | Undistributed | | | Undistributed | | | Post October Loss | | | Capital Loss | | | Other | | | Unrealized | | | Total | |
| | | Ordinary | | | Long-Term | | | and | | | Carry | | | Book/Tax | | | Appreciation/ | | | Accumulated | |
| | | Income | | | Capital Gains | | | Late Year Loss | | | Forwards | | | Differences | | | (Depreciation) | | | Earnings/(Deficits) | |
| Large Capitalization Value | | $ | 307,361 | | | $ | 1,305,588 | | | $ | (90,221 | ) | | $ | — | | | $ | — | | | $ | 458,501 | | | $ | 1,981,229 | |
| Large Capitalization Growth | | | — | | | | — | | | | (157,024 | ) | | | — | | | | — | | | | 3,620,510 | | | | 3,463,486 | |
| Mid Capitalization | | | — | | | | 196,082 | | | | (20,707 | ) | | | — | | | | — | | | | 1,764,274 | | | | 1,939,649 | |
| Small Capitalization | | | — | | | | 538,104 | | | | (20,896 | ) | | | — | | | | — | | | | 454,466 | | | | 971,674 | |
| International Equity | | | 9,278 | | | | — | | | | (108,504 | ) | | | (2,542,872 | ) | | | — | | | | (391 | ) | | | (2,642,489 | ) |
| Health & Biotechnology | | | — | | | | 741,628 | | | | (102,482 | ) | | | — | | | | — | | | | 2,672,777 | | | | 3,311,923 | |
| Technology & Communications | | | — | | | | 6,117,007 | | | | (381,842 | ) | | | — | | | | — | | | | 22,601,848 | | | | 28,337,013 | |
| Energy & Basic Materials | | | 45,515 | | | | — | | | | — | | | | (1,122,228 | ) | | | — | | | | 259,668 | | | | (817,045 | ) |
| Financial Services | | | — | | | | 2,266 | | | | (7,403 | ) | | | — | | | | — | | | | 414,590 | | | | 409,453 | |
| Investment Quality Bond | | | — | | | | — | | | | (79,025 | ) | | | (746 | ) | | | — | | | | (278,073 | ) | | | (357,844 | ) |
| Municipal Bond | | | — | | | | — | | | | (9,513 | ) | | | (12,390 | ) | | | — | | | | (12,754 | ) | | | (34,657 | ) |
| U.S. Government Money Market | | | 348 | | | | — | | | | — | | | | — | | | | — | | | | — | | | | 348 | |
| Aggressive Balanced Allocation | | | — | | | | 54,545 | | | | — | | | | — | | | | — | | | | (30,098 | ) | | | 24,447 | |
| Conservative Balanced Allocation | | | — | | | | 112,880 | | | | — | | | | — | | | | — | | | | (97,117 | ) | | | 15,763 | |
| Moderate Balanced Allocation | | | — | | | | 91,620 | | | | — | | | | — | | | | — | | | | (40,830 | ) | | | 50,790 | |
| Moderately Aggressive Balanced Allocation | | | — | | | | 48,718 | | | | — | | | | — | | | | — | | | | (21,361 | ) | | | 27,357 | |
| Moderately Conservative Balanced Allocation | | | — | | | | 39,504 | | | | — | | | | — | | | | — | | | | (19,870 | ) | | | 19,634 | |
The difference between book basis and tax basis unrealized appreciation (depreciation), undistributed net investment income (loss) and accumulated net realized gain (loss) from security transactions are primarily attributable to the tax deferral of losses on wash sales, adjustments for real estate investment trusts and C-Corporations adjustments. The unrealized appreciation in the table above includes unrealized foreign currency gain/(loss) of $(1,557) for the International Equity Portfolio and $(20) for the Energy & Basic Materials Portfolio.
Late year losses incurred after December 31 within the fiscal year are deemed to arise on the first business day of the following fiscal year for tax purposes. The Portfolios below incurred and elected to defer such late year losses as follows:
| | | Late Year | |
| | | Losses | |
| Large Capitalization Value | | $ | 90,221 | |
| Large Capitalization Growth | | | 157,024 | |
| Mid Capitalization | | | 20,707 | |
| Small Capitalization | | | 20,896 | |
| International Equity | | | — | |
| Health & Biotechnology | | | 102,482 | |
| Technology & Communications | | | 381,842 | |
| Energy & Basic Materials | | | — | |
| Financial Services | | | 7,403 | |
| Investment Quality Bond | | | 76,843 | |
| Municipal Bond | | | 7,459 | |
| U.S. Government Money Market | | | — | |
| Aggressive Balanced Allocation | | | — | |
| Conservative Balanced Allocation | | | — | |
| Moderate Balanced Allocation | | | — | |
| Moderately Aggressive Balanced Allocation | | | — | |
| Moderately Conservative Balanced Allocation | | | — | |
| NOTES TO FINANCIAL STATEMENTS |
| Six Months Ended February 28, 2023 (Unaudited)(Continued) |
Capital losses incurred after October 31 within the fiscal year are deemed to arise on the first business day of the following fiscal year for tax purposes. The Portfolios below incurred and elected to defer such late year losses as follows:
| | | Post October | |
| | | Losses | |
| Large Capitalization Value | | $ | — | |
| Large Capitalization Growth | | | — | |
| Mid Capitalization | | | — | |
| Small Capitalization | | | — | |
| International Equity | | | 108,504 | |
| Health & Biotechnology | | | — | |
| Technology & Communications | | | — | |
| Energy & Basic Materials | | | — | |
| Financial Services | | | — | |
| Investment Quality Bond | | | 2,182 | |
| Municipal Bond | | | 2,054 | |
| U.S. Government Money Market | | | — | |
| Aggressive Balanced Allocation | | | — | |
| Conservative Balanced Allocation | | | — | |
| Moderate Balanced Allocation | | | — | |
| Moderately Aggressive Balanced Allocation | | | — | |
| Moderately Conservative Balanced Allocation | | | — | |
| 8. | UNDERLYING INVESTMENTS IN OTHER INVESTMENT COMPANIES |
Each underlying fund, including each exchange-traded fund (“ETF”), is subject to specific risks, depending on the nature of the underlying fund. These risks could include liquidity risk, sector risk, foreign and related currency risk, as well as risks associated with real estate investments and commodities. Investors in the Fund will indirectly bear fees and expenses charged by the underlying investment companies in which the Fund invests in addition to the Fund’s direct fees and expenses.
The performance of the Investment Quality Bond Portfolio will be directly affected by the performance of the Vanguard Ultra-Short-Term Bond Fund – Admiral Shares. The financial statements of the Vanguard Ultra-Short-Term Bond Fund – Admiral Shares, including the portfolio of investments, can be found on the Securities and Exchange Commission’s (“SEC”) website www.sec.gov and should be read in conjunction with the Portfolio’s financial statements. As of February 28, 2023, the percentage of net assets invested in the Vanguard Ultra-Short-Term Bond Fund – Admiral Class was 90.8%.
The performance of the Municipal Bond Portfolio will be directly affected by the performance of the JPMorgan Ultra-Short Municipal Fund - Class I. The financial statements of the JPMorgan Ultra-Short Municipal Fund - Class I, including the portfolio of investments, can be found on the Securities and Exchange Commission’s (“SEC”) website www.sec.gov and should be read in conjunction with the Portfolio’s financial statements. As of February 28, 2023, the percentage of net assets invested in the JPMorgan Ultra-Short Municipal Fund - Class I was 87.9%.
The performance of the Conservative Balanced Allocation Portfolio will be directly affected by the performance of the Vanguard Ultra-Short-Term Bond Fund – Admiral Class and Dreyfus Institutional Preferred Government Money Market Fund, Institutional Class. The financial statements of the Vanguard Ultra-Short-Term Bond Fund and Dreyfus Institutional Preferred Government Money Market Fund, including the portfolio of investments, can be found on the Securities and Exchange Commission’s (“SEC”) website www.sec.gov and should be read in conjunction with the Portfolio’s financial statements. As of February 28, 2023, the percentage of net assets invested in the Vanguard Ultra-Short-Term Bond Fund and Dreyfus Institutional Preferred Government Money Market Fund was 31.1% and 28.5%, respectively.
The performance of the Moderately Conservative Balanced Allocation Portfolio will be directly affected by the performance of the Vanguard Ultra-Short- Term Bond Fund – Admiral Class. The financial statements of the Vanguard Ultra-Short-Term Bond Fund, including the portfolio of investments, can be found on the Securities and Exchange Commission’s (“SEC”) website www.sec.gov and should be read in conjunction with the Portfolio’s financial statements. As of February 28, 2023, the percentage of net assets invested in the Vanguard Ultra-Short-Term Bond Fund was 26.8%.
| NOTES TO FINANCIAL STATEMENTS |
| Six Months Ended February 28, 2023 (Unaudited)(Continued) |
The beneficial ownership, either directly or indirectly, of more than 25% of the voting securities of a Portfolio creates a presumption of control of the Portfolio under Section 2(a)(9) of the 1940 Act. As of February 28, 2023, the below entities held more than 25% of the voting securities for each of the Funds listed.
| | | Pershing, | | First National | | Mid Atlantic Trust |
| | | LLC * | | Bank * | | Company FBO * |
| Large Cap Value | | — | | 38.60% | | — |
| Large Cap Growth | | — | | 29.40% | | — |
| Mid Cap | | — | | 43.85% | | — |
| Small Cap | | — | | 50.83% | | — |
| International Equity | | — | | 55.68% | | — |
| Energy & Basic Materials | | — | | 50.61% | | — |
| Financial Services | | — | | 60.68% | | — |
| Investment Quality Bond | | — | | 63.04% | | — |
| U.S. Government Money Market | | — | | 56.67% | | — |
| Aggressive Balanced Allocation | | — | | 66.33% | | 31.63% |
| Conservative Balanced Allocation | | 26.27% | | 43.18% | | 28.43% |
| Moderate Balanced Allocation Portfolio | | — | | 42.21% | | 26.92% |
| Moderately Aggressive Balanced Allocation | | — | | 58.68% | | 39.78% |
| Moderately Conservative Balanced Allocation | | — | | 70.37% | | — |
* Comprised of multiple investors and accounts
| 10. | RECENT ACCOUNTING PRONOUNCEMENTS |
In March 2020, FASB issued ASU 2020-04, Reference Rate Reform (Topic 848): Facilitation of the Effects of Reference Rate Reform on Financial Reporting (’‘ASU 2020-04’’). The amendments in ASU 2020-04 provide optional temporary financial reporting relief from the effect of certain types of contract modifications due to the planned discontinuation of LIBOR and other interbank-offered based reference rates as of the end of 2021. ASU 2020-04 is effective for certain reference rate-related contract modifications that occur during the period March 12, 2020 through December 31, 2022. Management is currently evaluating the impact, if any of applying this ASU.
Subsequent events after the date of the Statements of Assets and Liabilities have been evaluated through the date the financial statements were issued. Management has determined that no events or transactions occurred requiring adjustment or disclosure in the financial statements.
| FINANCIAL HIGHLIGHTS (For a share outstanding throughout each year/period) |
| | | Large Capitalization Value Portfolio - Class I Shares | |
| | | | | | | | | | | | | | | | | | | |
| | | Six Months Ended | | | | | | | | | | | | | | | | |
| | | February 28, | | | Year Ended | | | Year Ended | | | Year Ended | | | Year Ended | | | Year Ended | |
| | | 2023 | | | August 31, | | | August 31, | | | August 31, | | | August 31, | | | August 31, | |
| | | (Unaudited) | | | 2022 | | | 2021 | | | 2020 | | | 2019 | | | 2018 | |
| Net Asset Value, Beginning of Year/Period | | $ | 25.97 | | | $ | 32.15 | | | $ | 22.32 | | | $ | 21.17 | | | $ | 22.78 | | | $ | 23.77 | |
| Income (Loss) from Investment Operations: | | | | | | | | | | | | | | | | | | | | | | | | |
| Net investment income (loss) (1) | | | (0.04 | ) | | | (0.25 | ) | | | (0.17 | ) | | | (0.03 | ) | | | (0.01 | ) | | | 0.10 | |
| Net realized and unrealized gain (loss) | | | 1.46 | | | | 0.36 | | | | 10.00 | | | | 1.18 | | | | (0.21 | ) | | | 0.71 | |
| Total from investment operations | | | 1.42 | | | | 0.11 | | | | 9.83 | | | | 1.15 | | | | (0.22 | ) | | | 0.81 | |
| Dividends and Distributions: | | | | | | | | | | | | | | | | | | | | | | | | |
| Dividends from net investment income | | | — | | | | — | | | | — | | | | — | | | | (0.07 | ) | | | — | |
| Distributions from realized gains | | | (2.09 | ) | | | (6.29 | ) | | | — | | | | — | | | | (1.32 | ) | | | (0.78 | ) |
| Distributions from return of capital | | | — | | | | — | | | | — | | | | — | | | | — | | | | (1.02 | ) |
| Total dividends and distributions | | | (2.09 | ) | | | (6.29 | ) | | | — | | | | — | | | | (1.39 | ) | | | (1.80 | ) |
| Redemption Fees | | | — | | | | — | | | | — | | | | — | | | | — | | | | — | |
| Net Asset Value, End of Year/Period | | $ | 25.30 | | | $ | 25.97 | | | $ | 32.15 | | | $ | 22.32 | | | $ | 21.17 | | | $ | 22.78 | |
| Total Return* | | | 5.96 | % | | | (0.22 | )% | | | 44.04 | % | | | 5.43 | % | | | (0.14 | )% | | | 3.58 | % |
| Ratios and Supplemental Data: | | | | | | | | | | | | | | | | | | | | | | | | |
| Net assets, end of year/period (000s) | | $ | 21,506 | | | $ | 19,753 | | | $ | 19,033 | | | $ | 12,317 | | | $ | 13,358 | | | $ | 14,930 | |
| Ratio of gross operating expenses to average net assets (2) | | | 1.55 | % (4) | | | 1.65 | % | | | 1.33 | % | | | 1.17 | % | | | 1.14 | % | | | 1.22 | % |
| Ratio of net investment income (loss) after expense reimbursement/recoupment to average net assets | | | (0.32 | )% (4) | | | (0.90 | )% | | | (0.61 | )% | | | (0.15 | )% | | | (0.04 | )% | | | 0.45 | % |
| Portfolio Turnover Rate | | | 33 | % (5) | | | 117 | % | | | 108 | % | | | 82 | % | | | 87 | % | | | 100 | % |
| | | | | | | | | | | | | | | | | | | | | | | | | |
| | | Large Capitalization Growth Portfolio - Class I Shares | |
| | | | |
| | | Six Months Ended | | | | | | | | | | | | | | | | |
| | | February 28, | | | Year Ended | | | Year Ended | | | Year Ended | | | Year Ended | | | Year Ended | |
| | | 2023 | | | August 31, | | | August 31, | | | August 31, | | | August 31, | | | August 31, | |
| | | (Unaudited) | | | 2022 | | | 2021 | | | 2020 | | | 2019 | | | 2018 | |
| Net Asset Value, Beginning of Year/Period | | $ | 23.26 | | | $ | 34.32 | | | $ | 28.60 | | | $ | 24.45 | | | $ | 31.61 | | | $ | 25.48 | |
| Income (Loss) from Investment Operations: | | | | | | | | | | | | | | | | | | | | | | | | |
| Net investment income (loss) (1) | | | (0.10 | ) | | | (0.27 | ) | | | (0.16 | ) | | | (0.03 | ) | | | — | | | | — | |
| Net realized and unrealized gain (loss) | | | (0.44 | ) | | | (3.97 | ) | | | 8.32 | | | | 7.85 | | | | (1.76 | ) | | | 7.68 | |
| Total from investment operations | | | (0.54 | ) | | | (4.24 | ) | | | 8.16 | | | | 7.82 | | | | (1.76 | ) | | | 7.68 | |
| Dividends and Distributions: | | | | | | | | | | | | | | | | | | | | | | | | |
| Distributions from realized gains | | | (1.48 | ) | | | (6.37 | ) | | | (2.44 | ) | | | (3.67 | ) | | | (5.40 | ) | | | (1.55 | ) |
| Distributions from return of capital | | | — | | | | (0.45 | ) | | | — | | | | — | | | | — | | | | — | |
| Total dividends and distributions | | | (1.48 | ) | | | (6.82 | ) | | | (2.44 | ) | | | (3.67 | ) | | | (5.40 | ) | | | (1.55 | ) |
| Redemption Fees | | | — | | | | — | | | | — | | | | — | | | | — | | | | — | |
| Net Asset Value, End of Year/Period | | $ | 21.24 | | | $ | 23.26 | | | $ | 34.32 | | | $ | 28.60 | | | $ | 24.45 | | | $ | 31.61 | |
| Total Return* | | | (2.12 | )% | | | (16.45 | )% | | | 31.15 | % | | | 35.93 | % | | | -4.37 | % | | | 31.33 | % |
| Ratios and Supplemental Data: | | | | | | | | | | | | | | | | | | | | | | | | |
| Net assets, end of year/period (000s) | | $ | 19,290 | | | $ | 20,826 | | | $ | 27,040 | | | $ | 28,236 | | | $ | 24,398 | | | $ | 29,936 | |
| Ratio of gross operating expenses to average net assets (3) | | | 1.66 | % (4) | | | 1.67 | % | | | 1.34 | % | | | 1.12 | % | | | 1.06 | % | | | 1.14 | % |
| Ratio of net investment income (loss) after expense reimbursement/recoupment to average net assets | | | (0.91 | )% (4) | | | (0.98 | )% | | | (0.54 | )% | | | (0.11 | )% | | | 0.01 | % | | | 0.00 | % |
| Portfolio Turnover Rate | | | 30 | % (5) | | | 60 | % | | | 65 | % | | | 74 | % | | | 90 | % | | | 74 | % |
| | | | | | | | | | | | | | | | | | | | | | | | | |
| (1) | Per share amounts calculated using the average shares method, which more appropriately presents the per share data for the Year/Period. |
| (2) | Ratio of net operating expenses to average net assets (after waiver and/or reimbursement or reduction by commissions recaptured) for the Large Cap Value Portfolio: |
| | | | 1.55 | % (4) | | | 1.65 | % | | | 1.33 | % | | | 1.17 | % | | | 1.14 | % | | | 1.22 | % |
| (3) | Ratio of net operating expenses to average net assets (after waiver and/or reimbursement or reduction by commissions recaptured) for the Large Cap Growth Portfolio: |
| | | | 1.66 | % (4) | | | 1.67 | % | | | 1.34 | % | | | 1.12 | % | | | 1.06 | % | | | 1.14 | % |
| (4) | Annualized for periods less than one year. |
| * | Assumes reinvestment of all dividends and distributions. Aggregate (not annualized) total return is shown for any period shorter than one year. Total return does not reflect the deduction of taxes that a shareholder would pay on distributions or on the redemption of shares. |
| FINANCIAL HIGHLIGHTS (For a share outstanding throughout each year/period) |
| | | Mid Capitalization Portfolio - Class I Shares | |
| | | | |
| | | Six Months Ended | | | | | | | | | | | | | | | | |
| | | February 28, | | | Year Ended | | | Year Ended | | | Year Ended | | | Year Ended | | | Year Ended | |
| | | 2023 | | | August 31, | | | August 31, | | | August 31, | | | August 31, | | | August 31, | |
| | | (Unaudited) | | | 2022 | | | 2021 | | | 2020 | | | 2019 | | | 2018 | |
| Net Asset Value, Beginning of Year/Period | | $ | 11.75 | | | $ | 14.96 | | | $ | 11.60 | | | $ | 11.69 | | | $ | 13.48 | | | $ | 12.87 | |
| Income (Loss) from Investment Operations: | | | | | | | | | | | | | | | | | | | | | | | | |
| Net investment income (loss) (1) | | | 0.00 | | | | (0.04 | ) | | | (0.03 | ) | | | 0.03 | | | | 0.08 | | | | 0.05 | |
| Net realized and unrealized gain (loss) | | | 0.42 | | | | (1.26 | ) | | | 4.50 | | | | (0.07 | ) | | | (0.65 | ) | | | 1.57 | |
| Total from investment operations | | | 0.42 | | | | (1.30 | ) | | | 4.47 | | | | (0.04 | ) | | | (0.57 | ) | | | 1.62 | |
| Dividends and Distributions: | | | | | | | | | | | | | | | | | | | | | | | | |
| Dividends from net investment income | | | — | | | | (0.04 | ) | | | (0.04 | ) | | | (0.05 | ) | | | (0.07 | ) | | | (0.06 | ) |
| Distributions from realized gains | | | (0.21 | ) | | | (1.87 | ) | | | (1.07 | ) | | | — | | | | (1.15 | ) | | | (0.95 | ) |
| Total dividends and distributions | | | (0.21 | ) | | | (1.91 | ) | | | (1.11 | ) | | | (0.05 | ) | | | (1.22 | ) | | | (1.01 | ) |
| Redemption Fees | | | — | | | | — | | | | — | | | | — | | | | — | | | | — | |
| Net Asset Value, End of Year/Period | | $ | 11.96 | | | $ | 11.75 | | | $ | 14.96 | | | $ | 11.60 | | | $ | 11.69 | | | $ | 13.48 | |
| Total Return* | | | 3.61 | % | | | (9.97 | )% | | | 40.57 | % | | | (0.38 | )% | | | (3.13 | )% | | | 13.17 | % |
| Ratios and Supplemental Data: | | | | | | | | | | | | | | | | | | | | | | | | |
| Net assets, end of year/period (000s) | | $ | 9,606 | | | $ | 9,486 | | | $ | 10,919 | | | $ | 8,126 | | | $ | 8,859 | | | $ | 10,224 | |
| Ratio of gross operating expenses to average net assets (2) | | | 1.83 | % (4) | | | 2.01 | % | | | 1.64 | % | | | 1.46 | % | | | 1.29 | % | | | 1.45 | % |
| Ratio of net investment income (loss) after expense reimbursement/recoupment to average net assets | | | 0.03 | % (4) | | | (0.32 | )% | | | (0.19 | )% | | | 0.28 | % | | | 0.66 | % | | | 0.40 | % |
| Portfolio Turnover Rate | | | 32 | % (5) | | | 43 | % | | | 55 | % | | | 53 | % | | | 49 | % | | | 39 | % |
| | | | | | | | | | | | | | | | | | | | | | | | | |
| | | Small Capitalization Portfolio - Class I Shares | |
| | | | | | | | | | | | | | | | | | | |
| | | Six Months Ended | | | | | | | | | | | | | | | | |
| | | February 28, | | | Year Ended | | | Year Ended | | | Year Ended | | | Year Ended | | | Year Ended | |
| | | 2023 | | | August 31, | | | August 31, | | | August 31, | | | August 31, | | | August 31, | |
| | | (Unaudited) | | | 2022 | | | 2021 | | | 2020 | | | 2019 | | | 2018 | |
| Net Asset Value, Beginning of Year/Period | | $ | 6.94 | | | $ | 9.45 | | | $ | 6.43 | | | $ | 5.89 | | | $ | 8.10 | | | $ | 6.66 | |
| Income (Loss) from Investment Operations: | | | | | | | | | | | | | | | | | | | | | | | | |
| Net investment income (loss) (1) | | | 0.01 | | | | (0.05 | ) | | | (0.05 | ) | | | (0.03 | ) | | | — | | | | (0.01 | ) |
| Net realized and unrealized gain (loss) | | | (0.02 | ) | | | (0.47 | ) | | | 3.07 | | | | 0.57 | | | | (1.30 | ) | | | 1.45 | |
| Total from investment operations | | | (0.01 | ) | | | (0.52 | ) | | | 3.02 | | | | 0.54 | | | | (1.30 | ) | | | 1.44 | |
| Dividends and Distributions: | | | | | | | | | | | | | | | | | | | | | | | | |
| Distributions from realized gains | | | (0.62 | ) | | | (1.99 | ) | | | — | | | | — | | | | (0.91 | ) | | | — | |
| Total dividends and distributions | | | (0.62 | ) | | | (1.99 | ) | | | — | | | | — | | | | (0.91 | ) | | | — | |
| Redemption Fees | | | — | | | | — | | | | — | | | | — | | | | — | | | | — | |
| Net Asset Value, End of Year/Period | | $ | 6.31 | | | $ | 6.94 | | | $ | 9.45 | | | $ | 6.43 | | | $ | 5.89 | | | $ | 8.10 | |
| Total Return* | | | (0.09 | )% | | | (8.22 | )% | | | 46.97 | % | | | 9.19 | % | | | (15.41 | )% | | | 21.62 | % |
| Ratios and Supplemental Data: | | | | | | | | | | | | | | | | | | | | | | | | |
| Net assets, end of year/period (000s) | | $ | 6,005 | | | $ | 5,893 | | | $ | 6,632 | | | $ | 5,362 | | | $ | 5,357 | | | $ | 7,331 | |
| Ratio of gross operating expenses to average net assets (3) | | | 1.94 | % (4) | | | 2.06 | % | | | 1.70 | % | | | 1.68 | % | | | 1.44 | % | | | 1.55 | % |
| Ratio of net investment income (loss) after expense reimbursement/recoupment to average net assets | | | 0.30 | % (4) | | | (0.63 | )% | | | (0.61 | )% | | | (0.44 | )% | | | (0.04 | )% | | | (0.20 | )% |
| Portfolio Turnover Rate | | | 48 | % (5) | | | 104 | % | | | 103 | % | | | 101 | % | | | 90 | % | | | 115 | % |
| | | | | | | | | | | | | | | | | | | | | | | | | |
| (1) | Per share amounts calculated using the average shares method, which more appropriately presents the per share data for the Year/Period. |
| (2) | Ratio of net operating expenses to average net assets (after waiver and/or reimbursement or reduction by commissions recaptured) for the Mid Capitalization Portfolio: |
| | | | | 1.83 | % (4) | | 2.01 | % | | | 1.64 | % | | | 1.46 | % | | | 1.29 | % | | | 1.45 | % |
| (3) | Ratio of net operating expenses to average net assets (after waiver and/or reimbursement or reduction by commissions recaptured) for the Small Cap Portfolio: |
| | | | | 1.94 | % (4) | | 2.06 | % | | | 1.70 | % | | | 1.68 | % | | | 1.44 | % | | | 1.55 | % |
| (4) | Annualized for periods less than one year. |
| * | Assumes reinvestment of all dividends and distributions. Aggregate (not annualized) total return is shown for any period shorter than one year. Total return does not reflect the deduction of taxes that a shareholder would pay on distributions or on the redemption of shares. |
| ** | Per share amount represents less than $0.01 per share. |
| FINANCIAL HIGHLIGHTS (For a share outstanding throughout each year/period) |
| | | International Equity Portfolio - Class I Shares | |
| | | | | | | | | | | | | | | | | | | |
| | | Six Months Ended | | | | | | | | | | | | | | | | |
| | | February 28, | | | Year Ended | | | Year Ended | | | Year Ended | | | Year Ended | | | Year Ended | |
| | | 2023 | | | August 31, | | | August 31, | | | August 31, | | | August 31, | | | August 31, | |
| | | (Unaudited) | | | 2022 | | | 2021 | | | 2020 | | | 2019 | | | 2018 | |
| Net Asset Value, Beginning of Year/Period | | $ | 9.07 | | | $ | 12.11 | | | $ | 8.94 | | | $ | 8.95 | | | $ | 10.23 | | | $ | 10.51 | |
| Income (Loss) from Investment Operations: | | | | | | | | | | | | | | | | | | | | | | | | |
| Net investment income (loss) (1) | | | (0.01 | ) | | | 0.06 | | | | 0.07 | | | | 0.10 | | | | 0.19 | | | | 0.11 | |
| Net realized and unrealized gain (loss) | | | 1.09 | | | | (3.05 | ) | | | 3.28 | | | | 0.08 | | | | (1.42 | ) | | | (0.39 | ) |
| Total from investment operations | | | 1.08 | | | | (2.99 | ) | | | 3.35 | | | | 0.18 | | | | (1.23 | ) | | | (0.28 | ) |
| Dividends and Distributions: | | | | | | | | | | | | | | | | | | | | | | | | |
| Dividends from net investment income | | | (0.03 | ) | | | (0.05 | ) | | | (0.18 | ) | | | (0.19 | ) | | | (0.05 | ) | | | — | ** |
| Total dividends and distributions | | | (0.03 | ) | | | (0.05 | ) | | | (0.18 | ) | | | (0.19 | ) | | | (0.05 | ) | | | — | |
| Redemption Fees | | | — | | | | — | | | | — | | | | — | | | | — | | | | — | |
| Net Asset Value, End of Year/Period | | $ | 10.12 | | | $ | 9.07 | | | $ | 12.11 | | | $ | 8.94 | | | $ | 8.95 | | | $ | 10.23 | |
| Total Return* | | | 11.91 | % | | | (24.79 | )% | | | 37.96 | % | | | 1.80 | % # | | | (12.02 | )% # | | | (2.63 | )% |
| Ratios and Supplemental Data: | | | | | | | | | | | | | | | | | | | | | | | | |
| Net assets, end of year/period (000s) | | $ | 3,394 | | | $ | 2,809 | | | $ | 4,421 | | | $ | 6,277 | | | $ | 8,320 | | | $ | 11,024 | |
| Ratio of gross operating expenses to average net assets (2) | | | 2.59 | % (4) | | | 3.23 | % | | | 2.47 | % | | | 1.64 | % | | | 1.61 | % | | | 2.30 | % |
| Ratio of net investment income (loss) after expense reimbursement/recoupment to average net assets | | | (0.23 | )% (4) | | | 0.50 | % | | | 0.63 | % | | | 1.09 | % | | | 2.00 | % | | | 0.99 | % |
| Portfolio Turnover Rate | | | 28 | % (5) | | | 47 | % | | | 59 | % | | | 52 | % | | | 95 | % | | | 130 | % |
| | | | | | | | | | | | | | | | | | | | | | | | | |
| | | Health & Biotechnology Portfolio - Class I Shares | |
| | | | | | | | | | | | | | | | | | | |
| | | Six Months Ended | | | | | | | | | | | | | | | | |
| | | February 28, | | | Year Ended | | | Year Ended | | | Year Ended | | | Year Ended | | | Year Ended | |
| | | 2023 | | | August 31, | | | August 31, | | | August 31, | | | August 31, | | | August 31, | |
| | | (Unaudited) | | | 2022 | | | 2021 | | | 2020 | | | 2019 | | | 2018 | |
| Net Asset Value, Beginning of Year/Period | | $ | 22.60 | | | $ | 25.10 | | | $ | 23.02 | | | $ | 21.14 | | | $ | 27.51 | | | $ | 29.45 | |
| Income (Loss) from Investment Operations: | | | | | | | | | | | | | | | | | | | | | | | | |
| Net investment income (loss) (1) | | | (0.12 | ) | | | (0.25 | ) | | | (0.16 | ) | | | 0.01 | | | | (0.01 | ) | | | (0.05 | ) |
| Net realized and unrealized gain (loss) | | | 0.96 | | | | (1.46 | ) | | | 4.82 | | | | 2.78 | | | | (2.30 | ) | | | 2.34 | |
| Total from investment operations | | | 0.84 | | | | (1.71 | ) | | | 4.66 | | | | 2.79 | | | | (2.31 | ) | | | 2.29 | |
| Dividends and Distributions: | | | | | | | | | | | | | | | | | | | | | | | | |
| Distributions from realized gains | | | (1.27 | ) | | | (0.79 | ) | | | (2.58 | ) | | | (0.91 | ) | | | (4.06 | ) | | | (4.23 | ) |
| Total dividends and distributions | | | (1.27 | ) | | | (0.79 | ) | | | (2.58 | ) | | | (0.91 | ) | | | (4.06 | ) | | | (4.23 | ) |
| Redemption Fees | | | — | | | | — | | | | — | | | | — | | | | — | | | | — | |
| Net Asset Value, End of Year/Period | | $ | 22.17 | �� | | $ | 22.60 | | | $ | 25.10 | | | $ | 23.02 | | | $ | 21.14 | | | $ | 27.51 | |
| Total Return* | | | 3.33 | % | | | (6.92 | )% | | | 22.43 | % | | | 13.22 | % | | | (9.16 | )% | | | 8.88 | % |
| Ratios and Supplemental Data: | | | | | | | | | | | | | | | | | | | | | | | | |
| Net assets, end of year/period (000s) | | $ | 6,578 | | | $ | 6,794 | | | $ | 7,560 | | | $ | 6,741 | | | $ | 6,927 | | | $ | 9,436 | |
| Ratio of gross operating expenses to average net assets (3) | | | 2.42 | % (4) | | | 2.50 | % | | | 2.14 | % | | | 1.91 | % | | | 1.82 | % | | | 1.90 | % |
| Ratio of net investment income (loss) after expense reimbursement/recoupment to average net assets | | | (1.01 | )% (4) | | | (1.05 | )% | | | (0.69 | )% | | | 0.05 | % | | | (0.02 | )% | | | (0.20 | )% |
| Portfolio Turnover Rate | | | 30 | % (5) | | | 23 | % | | | 19 | % | | | 21 | % | | | 32 | % | | | 13 | % |
| | | | | | | | | | | | | | | | | | | | | | | | | |
| (1) | Per share amounts calculated using the average shares method, which more appropriately presents the per share data for the Year/Period. |
| (2) | Ratio of net operating expenses to average net assets (after waiver and/or reimbursement or reduction by commissions recaptured) for the International Equity Portfolio: |
| | | | | 2.59 | % (4) | | 2.90 | % | | | 2.32 | % | | | 1.25 | % | | | 1.25 | % | | | 1.92 | % |
| (3) | Ratio of net operating expenses to average net assets (after waiver and/or reimbursement or reduction by commissions recaptured) for the Health & Biotechnology Portfolio: |
| | | | | 2.42 | % (4) | | 2.50 | % | | | 2.14 | % | | | 1.91 | % | | | 1.82 | % | | | 1.90 | % |
| (4) | Annualized for periods less than one year. |
| # | Includes adjustments in accordance with accounting principles generally accepted in the United States and, consequently, the net asset value for financial reporting purposes and the returns based upon those net asset values may differ from the net asset values and returns for shareholder transactions. |
| * | Assumes reinvestment of all dividends and distributions. Aggregate (not annualized) total return is shown for any period shorter than one year. Total return does not reflect the deduction of taxes that a shareholder would pay on distributions or on the redemption of shares. |
| ** | Per share amount represents less than $0.01 per share. |
| FINANCIAL HIGHLIGHTS (For a share outstanding throughout each year/period) |
| | | Technology & Communications Portfolio - Class I Shares | |
| | | | | | | | | | | | | | | | | | | |
| | | Six Months Ended | | | | | | | | | | | | | | | | |
| | | February 28, | | | Year Ended | | | Year Ended | | | Year Ended | | | Year Ended | | | Year Ended | |
| | | 2023 | | | August 31, | | | August 31, | | | August 31, | | | August 31, | | | August 31, | |
| | | (Unaudited) | | | 2022 | | | 2021 | | | 2020 | | | 2019 | | | 2018 | |
| Net Asset Value, Beginning of Year/Period | | $ | 22.95 | | | $ | 34.72 | | | $ | 31.63 | | | $ | 24.28 | | | $ | 24.86 | | | $ | 20.67 | |
| Income (Loss) from Investment Operations: | | | | | | | | | | | | | | | | | | | | | | | | |
| Net investment income (loss) (1) | | | (0.15 | ) | | | (0.29 | ) | | | (0.37 | ) | | | (0.11 | ) | | | 0.03 | | | | (0.11 | ) |
| Net realized and unrealized gain (loss) | | | (0.63 | ) | | | (7.84 | ) | | | 7.10 | | | | 8.43 | | | | 0.27 | | | | 5.89 | |
| Total from investment operations | | | (0.78 | ) | | | (8.13 | ) | | | 6.73 | | | | 8.32 | | | | 0.30 | | | | 5.78 | |
| Dividends and Distributions: | | | | | | | | | | | | | | | | | | | | | | | | |
| Distributions from realized gains | | | (3.30 | ) | | | (3.64 | ) | | | (3.64 | ) | | | (0.97 | ) | | | (0.88 | ) | | | (1.59 | ) |
| Total dividends and distributions | | | (3.30 | ) | | | (3.64 | ) | | | (3.64 | ) | | | (0.97 | ) | | | (0.88 | ) | | | (1.59 | ) |
| Redemption Fees | | | — | | | | — | | | | — | | | | — | | | | — | | | | — | |
| Net Asset Value, End of Year/Period | | $ | 18.87 | | | $ | 22.95 | | | $ | 34.72 | | | $ | 31.63 | | | $ | 24.28 | | | $ | 24.86 | |
| Total Return* | | | (2.80 | )% | | | -26.02 | % | | | 23.89 | % | | | 35.28 | % | | | 1.70 | % | | | 29.38 | % |
| Ratios and Supplemental Data: | | | | | | | | | | | | | | | | | | | | | | | | |
| Net assets, end of year/period (000s) | | $ | 18,768 | | | $ | 22,533 | | | $ | 35,680 | | | $ | 32,790 | | | $ | 28,695 | | | $ | 29,894 | |
| Ratio of gross operating expenses to average net assets (2) | | | 2.49 | % (4) | | | 2.15 | % | | | 1.99 | % | | | 1.68 | % | | | 1.68 | % | | | 1.75 | % |
| Ratio of net investment income (loss) after expense reimbursement/recoupment to average net assets | | | (1.48 | )% (4) | | | (1.06 | )% | | | (1.20 | )% | | | (0.42 | )% | | | 0.11 | % | | | (0.50 | )% |
| Portfolio Turnover Rate | | | 6 | % (5) | | | 3 | % | | | 10 | % | | | 10 | % | | | 2 | % | | | 1 | % |
| | | | | | | | | | | | | | | | | | | | | | | | | |
| | | Energy & Basic Materials Portfolio - Class I Shares | |
| | | | | | | | | | | | | | | | | | | |
| | | Six Months Ended | | | | | | | | | | | | | | | | |
| | | February 28, | | | Year Ended | | | Year Ended | | | Year Ended | | | Year Ended | | | Year Ended | |
| | | 2023 | | | August 31, | | | August 31, | | | August 31, | | | August 31, | | | August 31, | |
| | | (Unaudited) | | | 2022 | | | 2021 | | | 2020 | | | 2019 | | | 2018 | |
| Net Asset Value, Beginning of Year/Period | | $ | 12.43 | | | $ | 10.75 | | | $ | 8.24 | | | $ | 10.11 | | | $ | 14.44 | | | $ | 12.15 | |
| Income (Loss) from Investment Operations: | | | | | | | | | | | | | | | | | | | | | | | | |
| Net investment income (loss) (1) | | | 0.08 | | | | 0.34 | | | | 0.14 | | | | 0.14 | | | | 0.04 | | | | (0.07 | ) |
| Net realized and unrealized gain (loss) | | | 0.97 | | | | 1.46 | | | | 2.54 | | | | (2.01 | ) | | | (4.37 | ) | | | 2.36 | |
| Total from investment operations | | | 1.05 | | | | 1.80 | | | | 2.68 | | | | (1.87 | ) | | | (4.33 | ) | | | 2.29 | |
| Dividends and Distributions: | | | | | | | | | | | | | | | | | | | | | | | | |
| Dividends from net investment income | | | (0.36 | ) | | | (0.12 | ) | | | (0.17 | ) | | | — | | | | — | | | | — | |
| Total dividends and distributions | | | (0.36 | ) | | | (0.12 | ) | | | (0.17 | ) | | | — | | | | — | | | | — | |
| Redemption Fees | | | — | | | | — | | | | — | | | | — | | | | — | | | | — | |
| Net Asset Value, End of Year/Period | | $ | 13.12 | | | $ | 12.43 | | | $ | 10.75 | | | $ | 8.24 | | | $ | 10.11 | | | $ | 14.44 | |
| Total Return* | | | 8.53 | % | | | 16.84 | % | | | 32.86 | % | | | (18.50 | )% | | | (29.99 | )% | | | 18.85 | % |
| Ratios and Supplemental Data: | | | | | | | | | | | | | | | | | | | | | | | | |
| Net assets, end of year/period (000s) | | $ | 1,519 | | | $ | 1,523 | | | $ | 1,107 | | | $ | 942 | | | $ | 976 | | | $ | 1,783 | |
| Ratio of gross operating expenses to average net assets (3) | | | 3.41 | % (4) | | | 3.22 | % | | | 4.07 | % | | | 3.65 | % | | | 3.07 | % | | | 3.51 | % |
| Ratio of net investment income (loss) after expense reimbursement/recoupment to average net assets | | | 1.24 | % (4) | | | 2.75 | % | | | 1.37 | % | | | 1.57 | % | | | 0.35 | % | | | (0.53 | )% |
| Portfolio Turnover Rate | | | 35 | % (5) | | | 43 | % | | | 81 | % | | | 63 | % | | | 45 | % | | | 61 | % |
| | | | | | | | | | | | | | | | | | | | | | | | | |
| (1) | Per share amounts calculated using the average shares method, which more appropriately presents the per share data for the Year/Period. |
| (2) | Ratio of net operating expenses to average net assets (after waiver and/or reimbursement or reduction by commissions recaptured) for the Technology & Communications Portfolio: |
| | | | 2.49 | % (4) | | | 2.15 | % | | | 1.99 | % | | | 1.68 | % | | | 1.68 | % | | | 1.75 | % |
| (3) | Ratio of net operating expenses to average net assets (after waiver and/or reimbursement or reduction by commissions recaptured) for the Energy & Basic Materials Portfolio: |
| | | | 3.00 | % (4) | | | 3.00 | % | | | 3.00 | % | | | 3.00 | % | | | 3.00 | % | | | 3.00 | % |
| (4) | Annualized for periods less than one year. |
| * | Assumes reinvestment of all dividends and distributions. Aggregate (not annualized) total return is shown for any period shorter than one year. Total return does not reflect the deduction of taxes that a shareholder would pay on distributions or on the redemption of shares. |
| FINANCIAL HIGHLIGHTS (For a share outstanding throughout each year/period) |
| | | Financial Services Portfolio - Class I Shares | |
| | | | | | | | | | | | | | | | | | | |
| | | Six Months Ended | | | | | | | | | | | | | | | | |
| | | February 28, | | | Year Ended | | | Year Ended | | | Year Ended | | | Year Ended | | | Year Ended | |
| | | 2023 | | | August 31, | | | August 31, | | | August 31, | | | August 31, | | | August 31, | |
| | | (Unaudited) | | | 2022 | | | 2021 | | | 2020 | | | 2019 | | | 2018 | |
| Net Asset Value, Beginning of Year/Period | | $ | 9.56 | | | $ | 11.72 | | | $ | 7.89 | | | $ | 8.92 | | | $ | 12.02 | | | $ | 10.56 | |
| Income (Loss) from Investment Operations: | | | | | | | | | | | | | | | | | | | | | | | | |
| Net investment loss (1) | | | — | | | | (0.05 | ) | | | (0.03 | ) | | | (0.06 | ) | | | (0.07 | ) | | | (0.15 | ) |
| Net realized and unrealized gain (loss) | | | 0.65 | | | | (1.60 | ) | | | 4.20 | | | | (0.76 | ) | | | (1.35 | ) | | | 1.61 | |
| Total from investment operations | | | 0.65 | | | | (1.65 | ) | | | 4.17 | | | | (0.82 | ) | | | (1.42 | ) | | | 1.46 | |
| Dividends and Distributions: | | | | | | | | | | | | | | | | | | | | | | | | |
| Distributions from realized gains | | | (0.47 | ) | | | (0.51 | ) | | | (0.34 | ) | | | (0.21 | ) | | | (1.68 | ) | | | — | |
| Total dividends and distributions | | | (0.47 | ) | | | (0.51 | ) | | | (0.34 | ) | | | (0.21 | ) | | | (1.68 | ) | | | — | |
| Redemption Fees | | | — | | | | — | | | | — | | | | — | | | | — | | | | — | |
| Net Asset Value, End of Year/Period | | $ | 9.74 | | | $ | 9.56 | | | $ | 11.72 | | | $ | 7.89 | | | $ | 8.92 | | | $ | 12.02 | |
| Total Return* | | | 7.01 | % | | | (14.74 | )% | | | 54.37 | % | | | (9.60 | )% | | | (10.93 | )% | | | 13.83 | % |
| Ratios and Supplemental Data: | | | | | | | | | | | | | | | | | | | | | | | | |
| Net assets, end of year/period (000s) | | $ | 1,303 | | | $ | 1,044 | | | $ | 1,366 | | | $ | 944 | | | $ | 1,136 | | | $ | 1,411 | |
| Ratio of gross operating expenses to average net assets (2) | | | 2.92 | % (5) | | | 3.30 | % | | | 3.41 | % | | | 3.51 | % | | | 3.41 | % | | | 3.42 | % |
| Ratio of net investment income (loss) after expense reimbursement/recoupment to average net assets | | | 0.08 | % (5) | | | (0.43 | )% | | | (0.34 | )% | | | (0.66 | )% | | | (0.73 | )% | | | (1.29 | )% |
| Portfolio Turnover Rate | | | 20 | % (6) | | | 39 | % | | | 59 | % | | | 71 | % | | | 67 | % | | | 52 | % |
| | | | | | | | | | | | | | | | | | | | | | | | | |
| | | Investment Quality Bond Portfolio - Class I Shares | |
| | | | | | | | | | | | | | | | | | | |
| | | Six Months Ended | | | | | | | | | | | | | | | | |
| | | February 28, | | | Year Ended | | | Year Ended | | | Year Ended | | | Year Ended | | | Year Ended | |
| | | 2023 | | | August 31, | | | August 31, | | | August 31, | | | August 31, | | | August 31, | |
| | | (Unaudited) | | | 2022 | | | 2021 | | | 2020 | | | 2019 | | | 2018 | |
| Net Asset Value, Beginning of Year/Period | | $ | 9.23 | | | $ | 9.68 | | | $ | 9.79 | | | $ | 9.56 | | | $ | 9.31 | | | $ | 9.57 | |
| Income (Loss) from Investment Operations: | | | | | | | | | | | | | | | | | | | | | | | | |
| Net investment income (loss) (1) | | | 0.05 | | | | (0.10 | ) | | | (0.06 | ) | | | 0.07 | | | | 0.11 | | | | 0.08 | |
| Net realized and unrealized gain (loss) | | | (0.01 | ) | | | (0.23 | ) | | | (0.03 | ) | | | 0.24 | | | | 0.27 | | | | (0.21 | ) |
| Total from investment operations | | | 0.04 | | | | (0.33 | ) | | | (0.09 | ) | | | 0.31 | | | | 0.38 | | | | (0.13 | ) |
| Dividends and Distributions: | | | | | | | | | | | | | | | | | | | | | | | | |
| Dividends from net investment income | | | (0.04 | ) | | | — | | | | (0.02 | ) | | | (0.08 | ) | | | (0.13 | ) | | | (0.06 | ) |
| Distributions from realized gains | | | — | | | | (0.12 | ) | | | — | | | | — | | | | — | | | | (0.07 | ) |
| Total dividends and distributions | | | (0.04 | ) | | | (0.12 | ) | | | (0.02 | ) | | | (0.08 | ) | | | (0.13 | ) | | | (0.13 | ) |
| Redemption Fees | | | — | | | | — | | | | — | | | | — | | | | — | | | | — | |
| Net Asset Value, End of Year/Period | | $ | 9.23 | | | $ | 9.23 | | | $ | 9.68 | | | $ | 9.79 | | | $ | 9.56 | | | $ | 9.31 | |
| Total Return* | | | 0.39 | % | | | (3.39 | )% | | | (0.87 | )% | | | 3.24 | % | | | 4.14 | % | | | (1.34 | )% |
| Ratios and Supplemental Data: | | | | | | | | | | | | | | | | | | | | | | | | |
| Net assets, end of year/period (000s) | | $ | 11,174 | | | $ | 11,436 | | | $ | 12,020 | | | $ | 4,345 | | | $ | 4,243 | | | $ | 4,935 | |
| Ratio of gross operating expenses to average net assets (3),(4) | | | 1.52 | % (5) | | | 1.91 | % | | | 1.45 | % | | | 1.37 | % | | | 1.27 | % | | | 1.54 | % |
| Ratio of net investment income (loss) after expense reimbursement/recoupment to average net assets (4) | | | 1.10 | % (5) | | | (1.11 | )% | | | -0.61 | % | | | 0.71 | % | | | 1.18 | % | | | 0.87 | % |
| Portfolio Turnover Rate | | | 1 | % (6) | | | 1 | % | | | 62 | % | | | 23 | % | | | 11 | % | | | 112 | % |
| | | | | | | | | | | | | | | | | | | | | | | | | |
| (1) | Per share amounts calculated using the average shares method, which more appropriately presents the per share data for the Year/Period. |
| (2) | Ratio of net operating expenses to average net assets (after waiver and/or reimbursement or reduction by commissions recaptured) for the Financial Services Portfolio: |
| | | | 2.92 | % (5) | | | 3.00 | % | | | 3.01 | % | | | 3.00 | % | | | 3.00 | % | | | 3.00 | % |
| (3) | Ratio of net operating expenses to average net assets (after waiver and/or reimbursement or reduction by commissions recaptured) for the Investment Quality Bond Portfolio: |
| | | | 1.52 | % (5) | | | 1.90 | % | | | 1.45 | % | | | 1.37 | % | | | 1.27 | % | | | 1.23 | % |
| (4) | Does not include the expenses of funds in which the Fund invests. |
| (5) | Annualized for periods less than one year. |
| * | Assumes reinvestment of all dividends and distributions. Aggregate (not annualized) total return is shown for any period shorter than one year. Total return does not reflect the deduction of taxes that a shareholder would pay on distributions or on the redemption of shares. |
| FINANCIAL HIGHLIGHTS (For a share outstanding throughout each year/period) |
| | | Municipal Bond Portfolio - Class I Shares | |
| | | | | | | | | | | | | | | | | | | |
| | | Six Months Ended | | | | | | | | | | | | | | | | |
| | | February 28, | | | Year Ended | | | Year Ended | | | Year Ended | | | Year Ended | | | Year Ended | |
| | | 2023 | | | August 31, | | | August 31, | | | August 31, | | | August 31, | | | August 31, | |
| | | (Unaudited) | | | 2022 | | | 2021 | | | 2020 | | | 2019 | | | 2018 | |
| Net Asset Value, Beginning of Year/Period | | $ | 8.73 | | | $ | 9.01 | | | $ | 9.08 | | | $ | 9.02 | | | $ | 8.95 | | | $ | 9.24 | |
| Income (Loss) from Investment Operations: | | | | | | | | | | | | | | | | | | | | | | | | |
| Net investment income (loss) (1) | | | (0.01 | ) | | | (0.13 | ) | | | (0.09 | ) | | | — | | | | 0.01 | | | | 0.05 | |
| Net realized and unrealized gain (loss) | | | 0.00 | | | | (0.15 | ) | | | 0.03 | | | | 0.07 | | | | 0.07 | | | | (0.29 | ) |
| Total from investment operations | | | (0.01 | ) | | | (0.28 | ) | | | (0.06 | ) | | | 0.07 | | | | 0.08 | | | | (0.24 | ) |
| Dividends and Distributions: | | | | | | | | | | | | | | | | | | | | | | | | |
| Dividends from net investment income | | | — | | | | — | | | | — | | | | (0.01 | ) | | | (0.01 | ) | | | (0.05 | ) |
| Return of Capital | | | — | | | | — | | | | (0.01 | ) | | | — | | | | — | | | | — | |
| Total dividends and distributions | | | — | | | | — | | | | (0.01 | ) | | | (0.01 | ) | | | (0.01 | ) | | | (0.05 | ) |
| Net Asset Value, End of Year/Period | | $ | 8.72 | | | $ | 8.73 | | | $ | 9.01 | | | $ | 9.08 | | | $ | 9.02 | | | $ | 8.95 | |
| Total Return* | | | (0.11 | )% | | | (3.11 | )% # | | | (0.70 | )% # | | | 0.77 | % # | | | 0.88 | % # | | | (2.66 | )% |
| Ratios and Supplemental Data: | | | | | | | | | | | | | | | | | | | | | | | | |
| Net assets, end of year/period (000s) | | $ | 599 | | | $ | 615 | | | $ | 770 | | | $ | 507 | | | $ | 557 | | | $ | 589 | |
| Ratio of gross operating expenses to average net assets (2),(4) | | | 1.35 | % (5) | | | 2.58 | % | | | 2.78 | % | | | 2.35 | % | | | 2.91 | % | | | 3.79 | % |
| Ratio of net investment income (loss) after expense reimbursement/recoupment to average net assets (4) | | | (0.15 | )% (5) | | | (1.43 | )% | | | -0.96 | % | | | 0.04 | % | | | 0.11 | % | | | 0.46 | % |
| Portfolio Turnover Rate | | | 1 | % (6) | | | 0 | % | | | 82 | % | | | 22 | % | | | 2 | % | | | 104 | % |
| | | | | | | | | | | | | | | | | | | |
| | | U.S. Government Money Market Portfolio - Class I Shares | |
| | | | | | | | | | | | | | | | | | | |
| | | Six Months Ended | | | | | | | | | | | | | | | | |
| | | February 28, | | | Year Ended | | | Year Ended | | | Year Ended | | | Year Ended | | | Year Ended | |
| | | 2023 | | | August 31, | | | August 31, | | | August 31, | | | August 31, | | | August 31, | |
| | | (Unaudited) | | | 2022 | | | 2021 | | | 2020 | | | 2019 | | | 2018 | |
| Net Asset Value, Beginning of Year/Period | | $ | 1.00 | | | $ | 1.00 | | | $ | 1.00 | | | $ | 1.00 | | | $ | 1.00 | | | $ | 1.00 | |
| Income (Loss) from Investment Operations: | | | | | | | | | | | | | | | | | | | | | | | | |
| Net investment income (1) | | | 0.01 | ** | | | 0.00 | ** | | | 0.00 | ** | | | 0.00 | ** | | | 0.01 | | | | 0.00 | ** |
| Net realized and unrealized gain (loss) | | | 0.00 | | | | — | | | | — | | | | — | | | | — | | | | — | |
| Total from investment operations | | | 0.01 | ** | | | 0.00 | ** | | | 0.00 | ** | | | 0.00 | ** | | | 0.01 | | | | 0.00 | ** |
| Dividends and Distributions: | | | | | | | | | | | | | | | | | | | | | | | | |
| Dividends from net investment income | | | (0.01 | ) ** | | | (0.00 | ) ** | | | (0.00 | ) ** | | | (0.00 | ) ** | | | (0.01 | ) | | | (0.00 | ) ** |
| Distributions from realized gains | | | — | | | | — | | | | — | | | | — | | | | — | | | | — | |
| Total dividends and distributions | | | (0.01 | ) ** | | | (0.00 | ) ** | | | (0.00 | ) ** | | | (0.00 | ) ** | | | (0.01 | ) | | | (0.00 | ) ** |
| Net Asset Value, End of Year/Period | | $ | 1.00 | | | $ | 1.00 | | | $ | 1.00 | | | $ | 1.00 | | | $ | 1.00 | | | $ | 1.00 | |
| Total Return* | | | 1.27 | % | | | 0.01 | % | | | 0.02 | % | | | 0.00 | % | | | 1.09 | % | | | 0.29 | % |
| Ratios and Supplemental Data: | | | | | | | | | | | | | | | | | | | | | | | | |
| Net assets, end of year/period (000s) | | $ | 4,770 | | | $ | 5,108 | | | $ | 5,488 | | | $ | 5,213 | | | $ | 5,992 | | | $ | 7,656 | |
| Ratio of gross operating expenses to average net assets (3),(4) | | | 0.90 | % (5) | | | 0.93 | % | | | 1.07 | % | | | 1.18 | % | | | 1.24 | % | | | 1.17 | % |
| Ratio of net investment income after expense reimbursement/recoupment to average net assets (4) | | | 2.55 | % (5) | | | 0.02 | % | | | 0.01 | % | | | 0.28 | % | | | 1.09 | % | | | 0.29 | % |
| Portfolio Turnover Rate | | | N/A | (6) | | | N/A | | | | N/A | | | | N/A | | | | N/A | | | | N/A | |
| | | | | | | | | | | | | | | | | | | | | | | | | |
| (1) | Per share amounts calculated using the average shares method, which more appropriately presents the per share data for the Year/Period. |
| (2) | Ratio of net operating expenses to average net assets (after waiver and/or reimbursement or reduction by commissions recaptured) for the Municipal Bond Portfolio: |
| | | | | 1.35 | % (5) | | 1.90 | % | | | 1.52 | % | | | 1.64 | % | | | 1.41 | % | | | 1.27 | % |
| (3) | Ratio of net operating expenses to average net assets (after waiver and/or reimbursement or reduction by commissions recaptured) for the U.S. Government Money Market Portfolio: |
| | | | | 0.90 | % (5) | | 0.46 | % | | | 0.02 | % | | | 0.68 | % | | | 1.24 | % | | | 1.16 | % |
| (4) | Does not include the expenses of funds in which the Fund invests. |
| (5) | Annualized for periods less than one year. |
| # | Includes adjustments in accordance with accounting principles generally accepted in the United States and, consequently, the net asset value for financial reporting purposes and the returns based upon those net asset values may differ from the net asset values and returns for shareholder transactions. |
| * | Assumes reinvestment of all dividends and distributions. Aggregate (not annualized) total return is shown for any period shorter than one year. Total return does not reflect the deduction of taxes that a shareholder would pay on distributions or on the redemption of shares. |
| ** | Per share amount represents less than $0.01 per share. |
| FINANCIAL HIGHLIGHTS (For a share outstanding throughout each year/period) |
| | | Aggressive Balanced Allocation Portfolio - Class I Shares | |
| | | | | | | | | | | | | | | | | | | |
| | | | | | | | | | | | | | | | | | For the Period | |
| | | Six Months Ended | | | | | | | | | | | | | | | December 29, | |
| | | February 28, | | | Year Ended | | | Year Ended | | | Year Ended | | | Year Ended | | | 2017 (1) to | |
| | | 2023 | | | August 31, | | | August 31, | | | August 31, | | | August 31, | | | August 31, | |
| | | (Unaudited) | | | 2022 | | | 2021 | | | 2020 | | | 2019 | | | 2018 | |
| Net Asset Value, Beginning of Year/Period | | $ | 10.39 | | | $ | 12.53 | | | $ | 10.42 | | | $ | 9.94 | | | $ | 10.43 | | | $ | 10.00 | |
| Income (Loss) from Investment Operations: | | | | | | | | | | | | | | | | | | | | | | | | |
| Net investment income (2) | | | 0.07 | | | | 0.33 | | | | 0.40 | | | | 0.25 | | | | 0.24 | | | | 0.04 | |
| Net realized and unrealized gain (loss) | | | 0.22 | | | | (1.35 | ) | | | 1.91 | | | | 0.62 | | | | (0.45 | ) | | | 0.39 | |
| Total from investment operations | | | 0.29 | | | | (1.02 | ) | | | 2.31 | | | | 0.87 | | | | (0.21 | ) | | | 0.43 | |
| Dividends and Distributions: | | | | | | | | | | | | | | | | | | | | | | | | |
| Dividends from net investment income | | | (0.07 | ) | | | (0.37 | ) | | | (0.12 | ) | | | (0.28 | ) | | | (0.27 | ) | | | — | |
| Distributions from realized gains | | | (0.61 | ) | | | (0.75 | ) | | | (0.08 | ) | | | (0.11 | ) | | | (0.01 | ) | | | — | |
| Total dividends and distributions | | | (0.68 | ) | | | (1.12 | ) | | | (0.20 | ) | | | (0.39 | ) | | | (0.28 | ) | | | — | |
| Net Asset Value, End of Year/Period | | $ | 10.00 | | | $ | 10.39 | | | $ | 12.53 | | | $ | 10.42 | | | $ | 9.94 | | | $ | 10.43 | |
| Total Return* | | | 2.97 | % | | | (8.96 | )% | | | 22.46 | % | | | 8.76 | % | | | (1.81 | )% | | | 4.30 | % |
| Ratios and Supplemental Data: | | | | | | | | | | | | | | | | | | | | | | | | |
| Net assets, end of year/period (000s) | | $ | 801 | | | $ | 773 | | | $ | 842 | | | $ | 666 | | | $ | 595 | | | $ | 607 | |
| Ratio of gross operating expenses to average net assets (4) | | | 2.55 | % (3) | | | 2.23 | % | | | 2.39 | % | | | 2.01 | % | | | 3.01 | % | | | 3.07 | % (3) |
| Ratio of net operating expenses to average net assets (4) | | | 0.99 | % (3) | | | 0.99 | % | | | 0.93 | % | | | 0.79 | % | | | 0.60 | % | | | 0.35 | % (3) |
| Ratio of net investment income after expense reimbursement/recoupment to average net assets (4) | | | 1.40 | % (3) | | | 2.90 | % | | | 3.44 | % | | | 2.53 | % | | | 2.47 | % | | | 0.64 | % (3) |
| Portfolio Turnover Rate | | | 1 | % (5) | | | 2 | % | | | 54 | % | | | 3 | % | | | 56 | % | | | 8 | % (5) |
| | | | | | | | | | | | | | | | | | | |
| | | Conservative Balanced Allocation Portfolio - Class I Shares | |
| | | | | | | | | | | | | | | | | | | |
| | | | | | | | | | | | | | | | | | For the Period | |
| | | Six Months Ended | | | | | | | | | | | | | | | December 29, | |
| | | February 28, | | | Year Ended | | | Year Ended | | | Year Ended | | | Year Ended | | | 2017 (1) to | |
| | | 2023 | | | August 31, | | | August 31, | | | August 31, | | | August 31, | | | August 31, | |
| | | (Unaudited) | | | 2022 | | | 2021 | | | 2020 | | | 2019 | | | 2018 | |
| Net Asset Value, Beginning of Year/Period | | $ | 10.41 | | | $ | 12.00 | | | $ | 10.58 | | | $ | 10.20 | | | $ | 10.33 | | | $ | 10.00 | |
| Income (Loss) from Investment Operations: | | | | | | | | | | | | | | | | | | | | | | | | |
| Net investment income (loss) (2) | | | 0.09 | | | | 0.30 | | | | (0.02 | ) | | | 0.23 | | | | 0.23 | | | | 0.06 | |
| Net realized and unrealized gain (loss) | | | 0.07 | | | | (1.01 | ) | | | 1.49 | | | | 0.52 | | | | (0.16 | ) | | | 0.27 | |
| Total from investment operations | | | 0.16 | | | | (0.71 | ) | | | 1.47 | | | | 0.75 | | | | 0.07 | | | | 0.33 | |
| Dividends and Distributions: | | | | | | | | | | | | | | | | | | | | | | | | |
| Dividends from net investment income | | | (0.04 | ) | | | (0.29 | ) | | | (0.05 | ) | | | (0.24 | ) | | | (0.20 | ) | | | — | |
| Distributions from realized gains | | | (0.44 | ) | | | (0.59 | ) | | | — | | | | (0.10 | ) | | | — | ** | | | — | |
| Distributions from return of capital | | | — | | | | — | | | | — | | | | (0.03 | ) | | | — | | | | — | |
| Total dividends and distributions | | | (0.48 | ) | | | (0.88 | ) | | | (0.05 | ) | | | (0.37 | ) | | | (0.20 | ) | | | — | |
| Net Asset Value, End of Year/Period | | $ | 10.09 | | | $ | 10.41 | | | $ | 12.00 | | | $ | 10.58 | | | $ | 10.20 | | | $ | 10.33 | |
| Total Return* | | | 1.64 | % | | | (6.39 | )% | | | 13.94 | % | | | 7.45 | % | | | 0.84 | % | | | 3.30 | % |
| Ratios and Supplemental Data: | | | | | | | | | | | | | | | | | | | | | | | | |
| Net assets, end of year/period (000s) | | $ | 2,035 | | | $ | 1,960 | | | $ | 2,050 | | | $ | 1,656 | | | $ | 1,602 | | | $ | 937 | |
| Ratio of gross operating expenses to average net assets (4) | | | 2.11 | % (3) | | | 2.01 | % | | | 1.95 | % | | | 1.60 | % | | | 1.77 | % | | | 2.59 | % (3) |
| Ratio of net operating expenses to average net assets (4) | | | 0.99 | % (3) | | | 0.99 | % | | | 0.93 | % | | | 0.79 | % | | | 0.70 | % | | | 0.49 | % (3) |
| Ratio of net investment income (loss) after expense reimbursement/recoupment to average net assets (4) | | | 1.79 | % (3) | | | 2.70 | % | | | (0.22 | )% | | | 2.28 | % | | | 2.32 | % | | | 0.83 | % (3) |
| Portfolio Turnover Rate | | | 3 | % (5) | | | 11 | % | | | 71 | % | | | 12 | % | | | 31 | % | | | 4 | % (5) |
| | | | | | | | | | | | | | | | | | | | | | | | | |
| (1) | Commencement of offering. |
| (2) | Per share amounts calculated using the average shares method, which more appropriately presents the per share data for the year/period. |
| (3) | Annualized for periods less than one year. |
| (4) | Does not include the expenses of funds in which the Fund invests. |
| * | Assumes reinvestment of all dividends and distributions. Aggregate (not annualized) total return is shown for any period shorter than one year. Total return does not reflect the deduction of taxes that a shareholder would pay on distributions or on the redemption of shares. |
| ** | Per share amount represents less than $0.01 per share. |
| FINANCIAL HIGHLIGHTS (For a share outstanding throughout each year/period) |
| | | Moderate Balanced Allocation Portfolio - Class I Shares | |
| | | | | | | | | | | | | | | | | | | |
| | | | | | | | | | | | | | | | | | For the Period | |
| | | Six Months Ended | | | | | | | | | | | | | | | December 29, | |
| | | February 28, | | | Year Ended | | | Year Ended | | | Year Ended | | | Year Ended | | | 2017 (1) to | |
| | | 2023 | | | August 31, | | | August 31, | | | August 31, | | | August 31, | | | August 31, | |
| | | (Unaudited) | | | 2022 | | | 2021 | | | 2020 | | | 2019 | | | 2018 | |
| Net Asset Value, Beginning of Year/Period | | $ | 10.75 | | | $ | 12.55 | | | $ | 10.69 | | | $ | 10.15 | | | $ | 10.43 | | | $ | 10.00 | |
| Income (Loss) from Investment Operations: | | | | | | | | | | | | | | | | | | | | | | | | |
| Net investment income (loss) (2) | | | 0.07 | | | | 0.33 | | | | (0.01 | ) | | | 0.22 | | | | 0.28 | | | | 0.05 | |
| Net realized and unrealized gain (loss) | | | 0.12 | | | | (1.18 | ) | | | 2.02 | | | | 0.67 | | | | (0.28 | ) | | | 0.38 | |
| Total from investment operations | | | 0.19 | | | | (0.85 | ) | | �� | 2.01 | | | | 0.89 | | | | (0.00 | ) | | | 0.43 | |
| Dividends and Distributions: | | | | | | | | | | | | | | | | | | | | | | | | |
| Dividends from net investment income | | | — | | | | (0.34 | ) | | | (0.08 | ) | | | (0.24 | ) | | | (0.28 | ) | | | — | |
| Distributions from realized gains | | | (0.59 | ) | | | (0.61 | ) | | | (0.07 | ) | | | (0.11 | ) | | | — | ** | | | — | |
| Total dividends and distributions | | | (0.59 | ) | | | (0.95 | ) | | | (0.15 | ) | | | (0.35 | ) | | | (0.28 | ) | | | — | |
| Net Asset Value, End of Year/Period | | $ | 10.35 | | | $ | 10.75 | | | $ | 12.55 | | | $ | 10.69 | | | $ | 10.15 | | | $ | 10.43 | |
| Total Return* | | | 1.89 | % | | | (7.36 | )% | | | 19.01 | % | | | 8.93 | % | | | 0.31 | % | | | 4.30 | % |
| Ratios and Supplemental Data: | | | | | | | | | | | | | | | | | | | | | | | | |
| Net assets, end of year/period (000s) | | $ | 1,044 | | | $ | 1,134 | | | $ | 1,187 | | | $ | 967 | | | $ | 743 | | | $ | 588 | |
| Ratio of gross operating expenses to average net assets (4) | | | 2.27 | % (3) | | | 2.11 | % | | | 2.11 | % | | | 1.70 | % | | | 2.12 | % | | | 2.87 | % (3) |
| Ratio of net operating expenses to average net assets (4) | | | 0.99 | % (3) | | | 0.99 | % | | | 0.93 | % | | | 0.79 | % | | | 0.63 | % | | | 0.36 | % (3) |
| Ratio of net investment income (loss) after expense reimbursement/recoupment to average net assets (4) | | | 1.45 | % (3) | | | 2.88 | % | | | (0.09 | )% | | | 2.19 | % | | | 2.79 | % | | | 0.73 | % (3) |
| Portfolio Turnover Rate | | | 6 | % (5) | | | 2 | % | | | 52 | % | | | 8 | % | | | 35 | % | | | 7 | % (5) |
| | | | | | | | | | | | | | | | | | | |
| | | Moderately Aggressive Balanced Allocation Portfolio - Class I Shares | |
| | | | | | | | | | | | | | | | | | | |
| | | | | | | | | | | | | | | | | | For the Period | |
| | | Six Months Ended | | | | | | | | | | | | | | | December 29, | |
| | | February 28, | | | Year Ended | | | Year Ended | | | Year Ended | | | Year Ended | | | 2017 (1) to | |
| | | 2023 | | | August 31, | | | August 31, | | | August 31, | | | August 31, | | | August 31, | |
| | | (Unaudited) | | | 2022 | | | 2021 | | | 2020 | | | 2019 | | | 2018 | |
| Net Asset Value, Beginning of Year/Period | | $ | 10.58 | | | $ | 12.44 | | | $ | 10.48 | | | $ | 9.93 | | | $ | 10.35 | | | $ | 10.00 | |
| Income (Loss) from Investment Operations: | | | | | | | | | | | | | | | | | | | | | | | | |
| Net investment income (loss) (2) | | | 0.08 | | | | 0.32 | | | | (0.00 | ) | | | 0.22 | | | | 0.28 | | | | 0.03 | |
| Net realized and unrealized gain (loss) | | | 0.16 | | | | (1.23 | ) | | | 2.14 | | | | 0.59 | | | | (0.43 | ) | | | 0.32 | |
| Total from investment operations | | | 0.24 | | | | (0.91 | ) | | | 2.14 | | | | 0.81 | | | | (0.15 | ) | | | 0.35 | |
| Dividends and Distributions: | | | | | | | | | | | | | | | | | | | | | | | | |
| Dividends from net investment income | | | — | | | | (0.36 | ) | | | (0.08 | ) | | | (0.25 | ) | | | (0.27 | ) | | | — | |
| Distributions from realized gains | | | (0.58 | ) | | | (0.59 | ) | | | (0.10 | ) | | | (0.01 | ) | | | — | | | | — | |
| Total dividends and distributions | | | (0.58 | ) | | | (0.95 | ) | | | (0.18 | ) | | | (0.26 | ) | | | (0.27 | ) | | | — | |
| Net Asset Value, End of Year/Period | | $ | 10.24 | | | $ | 10.58 | | | $ | 12.44 | | | $ | 10.48 | | | $ | 9.93 | | | $ | 10.35 | |
| Total Return* | | | 2.33 | % | | | (7.93 | )% | | | 20.70 | % | | | 8.14 | % | | | (1.18 | )% | | | 3.50 | % |
| Ratios and Supplemental Data: | | | | | | | | | | | | | | | | | | | | | | | | |
| Net assets, end of year/period (000s) | | $ | 675 | | | $ | 656 | | | $ | 693 | | | $ | 568 | | | $ | 380 | | | $ | 397 | |
| Ratio of gross operating expenses to average net assets (4) | | | 2.36 | % (3) | | | 2.26 | % | | | 2.50 | % | | | 2.08 | % | | | 2.62 | % | | | 3.12 | % (3) |
| Ratio of net operating expenses to average net assets (4) | | | 0.99 | % (3) | | | 0.99 | % | | | 0.93 | % | | | 0.79 | % | | | 0.65 | % | | | 0.32 | % (3) |
| Ratio of net investment income after expenses reimbursement/recoupment to average net assets (4) | | | 1.47 | % (3) | | | 2.84 | % | | | 0.03 | % | | | 2.20 | % | | | 2.84 | % | | | 0.51 | % (3) |
| Portfolio Turnover Rate | | | 4 | % (5) | | | 0 | % | | | 48 | % | | | 8 | % | | | 69 | % | | | 0 | % (5) |
| | | | | | | | | | | | | | | | | | | | | | | | | |
| (1) | Commencement of offering. |
| (2) | Per share amounts calculated using the average shares method, which more appropriately presents the per share data for the year/period. |
| (3) | Annualized for periods less than one year. |
| (4) | Does not include the expenses of funds in which the Fund invests. |
| * | Assumes reinvestment of all dividends and distributions. Aggregate (not annualized) total return is shown for any period shorter than one year. Total return does not reflect the deduction of taxes that a shareholder would pay on distributions or on the redemption of shares. |
| FINANCIAL HIGHLIGHTS (For a share outstanding throughout each year/period) |
| | | Moderately Conservative Balanced Allocation Portfolio - Class I Shares | |
| | | | | | | | | | | | | | | | | | | |
| | | | | | | | | | | | | | | | | | For the Period | |
| | | Six Months Ended | | | | | | | | | | | | | | | December 29, | |
| | | February 28, | | | Year Ended | | | Year Ended | | | Year Ended | | | Year Ended | | | 2017 (1) to | |
| | | 2023 | | | August 31, | | | August 31, | | | August 31, | | | August 31, | | | August 31, | |
| | | (Unaudited) | | | 2022 | | | 2021 | | | 2020 | | | 2019 | | | 2018 | |
| Net Asset Value, Beginning of Year/Period | | $ | 9.95 | | | $ | 11.98 | | | $ | 10.36 | | | $ | 9.94 | | | $ | 10.25 | | | $ | 10.00 | |
| Income (Loss) from Investment Operations: | | | | | | | | | | | | | | | | | | | | | | | | |
| Net investment income (loss) (2) | | | 0.07 | | | | 0.32 | | | | (0.01 | ) | | | 0.24 | | | | 0.26 | | | | 0.04 | |
| Net realized and unrealized gain (loss) | | | 0.15 | | | | (1.09 | ) | | | 1.78 | | | | 0.53 | | | | (0.31 | ) | | | 0.21 | |
| Total from investment operations | | | 0.22 | | | | (0.77 | ) | | | 1.77 | | | | 0.77 | | | | (0.05 | ) | | | 0.25 | |
| Dividends and Distributions: | | | | | | | | | | | | | | | | | | | | | | | | |
| Dividends from net investment income | | | — | | | | (0.32 | ) | | | (0.01 | ) | | | (0.26 | ) | | | (0.26 | ) | | | — | |
| Distributions from realized gains | | | (0.71 | ) | | | (0.94 | ) | | | (0.14 | ) | | | (0.09 | ) | | | — | | | | — | |
| Total dividends and distributions | | | (0.71 | ) | | | (1.26 | ) | | | (0.15 | ) | | | (0.35 | ) | | | (0.26 | ) | | | — | |
| Net asset, end of year/period | | $ | 9.46 | | | $ | 9.95 | | | $ | 11.98 | | | $ | 10.36 | | | $ | 9.94 | | | $ | 10.25 | |
| Total Return * | | | 2.38 | % | | | (7.19 | )% | | | 17.26 | % | | | 7.84 | % | | | (0.19 | )% | | | 2.50 | % |
| Ratios and Supplemental Data: | | | | | | | | | | | | | | | | | | | | | | | | |
| Net assets, end of year/period (000s) | | $ | 401 | | | $ | 495 | | | $ | 618 | | | $ | 836 | | | $ | 741 | | | $ | 743 | |
| Ratio of gross operating expenses to average net assets (4) | | | 2.76 | % (3) | | | 2.50 | % | | | 2.34 | % | | | 1.85 | % | | | 2.30 | % | | | 2.37 | % (3) |
| Ratio of net operating expenses to average net assets (4) | | | 0.99 | % (3) | | | 0.99 | % | | | 0.92 | % | | | 0.79 | % | | | 0.67 | % | | | 0.41 | % (3) |
| Ratio of net investment income (loss) after expense reimbursement/recoupment to average net assets (4) | | | 1.40 | % (3) | | | 2.95 | % | | | (0.07 | )% | | | 2.46 | % | | | 2.67 | % | | | 0.58 | % (3) |
| Portfolio Turnover Rate | | | 4 | % (5) | | | 10 | % | | | 74 | % | | | 11 | % | | | 57 | % | | | 0 | % (5) |
| | | | | | | | | | | | | | | | | | | | | | | | | |
| (1) | Commencement of offering. |
| (2) | Per share amounts calculated using the average shares method, which more appropriately presents the per share data for the year/period. |
| (3) | Annualized for periods less than one year. |
| (4) | Does not include the expenses of funds in which the Fund invests. |
| * | Assumes reinvestment of all dividends and distributions. Aggregate (not annualized) total return is shown for any period shorter than one year. Total return does not reflect the deduction of taxes that a shareholder would pay on distributions or on the redemption of shares. |
| SUPPLEMENTAL INFORMATION (Unaudited) |
Shareholders of funds will pay ongoing expenses, such as advisory fees, distribution and services fees (12b-1 fees), and other fund expenses. The following examples are intended to help the shareholder understand the ongoing cost (in dollars) of investing in a fund and to compare these costs with the ongoing costs of investing in other mutual funds. Please note, the expenses shown in the tables are meant to highlight ongoing costs only and do not reflect any transactional costs, such as sales charges (loads), or contingent deferred sales charges (CDSCs) on redemptions.
This example is based on an investment of $1,000 invested at the beginning of the period and held for the six-month period from September 1, 2022, through February 28, 2023.
Actual Expenses: The first table provides information about actual account values and actual expenses. The shareholder may use the information in this line, together with the amount invested, to estimate the expenses that would be paid over the period. Simply divide account value by $1,000 (for example, an $8,600 account value divided by $1,000 = 8.6), then multiply the result by the number under the heading entitled “Expenses Paid” to estimate the expenses paid on the account during the period.
| | | Beginning Account | | Ending Account | | Expense Paid | | Expense Ratio |
| | | Value - 9/1/2022 | | Value - 2/28/2023 | | 9/1/2022 - 2/28/2023* | | [Annualized] |
| Actual Expenses - Table 2: | | | | | | | | |
| Large Capitalization Value – Class I | | $1,000.00 | | $1,059.60 | | $7.70 | | 1.51% |
| Large Capitalization Value – Class A | | 1,000.00 | | 1,057.30 | | 9.75 | | 1.91% |
| Large Capitalization Value – Class C | | 1,000.00 | | 1,054.50 | | 12.78 | | 2.51% |
| Large Capitalization Growth – Class I | | 1,000.00 | | 978.80 | | 8.14 | | 1.66% |
| Large Capitalization Growth – Class A | | 1,000.00 | | 977.20 | | 10.11 | | 2.06% |
| Large Capitalization Growth – Class C | | 1,000.00 | | 974.40 | | 13.00 | | 2.65% |
| Mid Capitalization – Class I | | 1,000.00 | | 1,036.10 | | 9.25 | | 1.83% |
| Mid Capitalization – Class A | | 1,000.00 | | 1,033.00 | | 11.26 | | 2.23% |
| Mid Capitalization – Class C | | 1,000.00 | | 1,029.60 | | 14.25 | | 2.83% |
| Small Capitalization – Class I | | 1,000.00 | | 999.10 | | 9.62 | | 1.94% |
| Small Capitalization – Class A | | 1,000.00 | | 997.30 | | 11.60 | | 2.34% |
| Small Capitalization – Class C | | 1,000.00 | | 996.60 | | 14.54 | | 2.94% |
| International Equity – Class I | | 1,000.00 | | 1,119.10 | | 13.61 | | 2.59% |
| International Equity – Class A | | 1,000.00 | | 1,116.40 | | 15.81 | | 3.01% |
| International Equity – Class C | | 1,000.00 | | 1,114.10 | | 18.77 | | 3.58% |
| Health & Biotechnology – Class I | | 1,000.00 | | 1,033.30 | | 12.22 | | 2.42% |
| Health & Biotechnology – Class A | | 1,000.00 | | 1,031.00 | | 14.20 | | 2.82% |
| Health & Biotechnology – Class C | | 1,000.00 | | 1,027.90 | | 17.20 | | 3.42% |
| Technology & Communications – Class I | | 1,000.00 | | 972.00 | | 12.17 | | 2.49% |
| Technology & Communications – Class A | | 1,000.00 | | 970.10 | | 14.14 | | 2.89% |
| Technology & Communications – Class C | | 1,000.00 | | 967.70 | | 17.03 | | 3.49% |
| Energy & Basic Materials – Class I | | 1,000.00 | | 1,085.30 | | 15.51 | | 3.00% |
| Energy & Basic Materials – Class A | | 1,000.00 | | 1,082.80 | | 17.56 | | 3.40% |
| Energy & Basic Materials – Class C | | 1,000.00 | | 1,079.90 | | 20.63 | | 4.00% |
| Financial Services – Class I | | 1,000.00 | | 1,070.10 | | 15.40 | | 3.00% |
| Financial Services – Class A | | 1,000.00 | | 1,067.70 | | 17.43 | | 3.40% |
| Financial Services – Class C | | 1,000.00 | | 1,077.40 | | 20.60 | | 4.00% |
| Investment Quality Bond – Class I | | 1,000.00 | | 1,003.90 | | 7.56 | | 1.52% |
| Investment Quality Bond – Class A | | 1,000.00 | | 1,000.30 | | 9.52 | | 1.92% |
| Investment Quality Bond – Class C | | 1,000.00 | | 997.70 | | 13.13 | | 2.65% |
| Municipal Bond – Class I | | 1,000.00 | | 998.90 | | 9.42 | | 1.90% |
| Municipal Bond – Class A | | 1,000.00 | | 996.50 | | 11.39 | | 2.30% |
| Municipal Bond – Class C | | 1,000.00 | | 993.00 | | 14.33 | | 2.90% |
| U.S. Government Money Market – Class I | | 1,000.00 | | 1,012.70 | | 4.48 | | 0.90% |
| U.S. Government Money Market – Class A | | 1,000.00 | | 1,010.80 | | 8.52 | | 1.71% |
| U.S. Government Money Market – Class C | | 1,000.00 | | 1,010.90 | | 11.04 | | 2.21% |
| SUPPLEMENTAL INFORMATION (Unaudited) (Continued) |
| | | Beginning Account | | Ending Account | | Expense Paid | | Expense Ratio |
| | | Value -9/1/2022 | | Value - 2/28/2023 | | 9/1/2022 - 2/28/2023* | | [Annualized] |
| Actual Expenses - Table 2: (Continued) | | | | | | | | |
| Aggressive Balanced Allocation - Class I | | $1,000.00 | | $1,029.70 | | $4.98 | | 0.99% |
| Aggressive Balanced Allocation - Class A | | 1,000.00 | | 1,029.90 | | 6.24 | | 1.24% |
| Aggressive Balanced Allocation - Class C | | 1,000.00 | | 1,025.60 | | 9.99 | | 1.99% |
| Conservative Balanced Allocation - Class I | | 1,000.00 | | 1,016.40 | | 4.95 | | 0.99% |
| Conservative Balanced Allocation - Class A | | 1,000.00 | | 1,015.80 | | 6.19 | | 1.24% |
| Conservative Balanced Allocation - Class C | | 1,000.00 | | 1,011.70 | | 9.93 | | 1.99% |
| Moderate Aggressive Balanced Allocation - Class I | | 1,000.00 | | 1,023.30 | | 4.97 | | 0.99% |
| Moderate Aggressive Balanced Allocation - Class A | | 1,000.00 | | 1,021.40 | | 6.21 | | 1.24% |
| Moderate Aggressive Balanced Allocation - Class C | | 1,000.00 | | 1,017.60 | | 9.96 | | 1.99% |
| Moderate Balanced Allocation - Class I | | 1,000.00 | | 1,018.90 | | 4.96 | | 0.99% |
| Moderate Balanced Allocation - Class A | | 1,000.00 | | 1,018.00 | | 6.19 | | 1.24% |
| Moderate Balanced Allocation - Class C | | 1,000.00 | | 1,014.30 | | 9.94 | | 1.99% |
| Moderate Conservative Balanced Allocation - Class I | | 1,000.00 | | 1,023.80 | | 4.98 | | 0.99% |
| Moderate Conservative Balanced Allocation - Class A | | 1,000.00 | | 1,023.80 | | 6.22 | | 1.24% |
| Moderate Conservative Balanced Allocation - Class C | | 1,000.00 | | 1,017.90 | | 9.96 | | 1.99% |
| SUPPLEMENTAL INFORMATION (Unaudited) (Continued) |
Hypothetical Examples for Comparison Purposes: The second table below provides information about hypothetical account values and hypothetical expenses based on the fund’s actual expense ratio and an assumed rate of return of 5% per year before expenses, which is not the fund’s actual return. The hypothetical account values and expenses may not be used to estimate the actual ending account balance or expenses paid for the period. This information may be used to compare the ongoing costs of investing in the fund and other mutual funds. To do so, a shareholder would compare this 5% hypothetical example with the 5% hypothetical examples that appear in the shareholder reports of the other mutual funds.
| | | Beginning Account | | Ending Account | | Expense Paid | | Expense Ratio |
| Hypothetical | | Value - 9/1/2022 | | Value - 2/28/2023 | | 9/1/2022 - 2/28/2023* | | [Annualized] |
| [5% Return Before Expenses] - Table 2: | | | | | | | | |
| Large Capitalization Value – Class I | | $1,000.00 | | $1,017.32 | | $7.54 | | 1.51% |
| Large Capitalization Value – Class A | | 1,000.00 | | 1,015.32 | | 9.55 | | 1.91% |
| Large Capitalization Value – Class C | | 1,000.00 | | 1,012.35 | | 12.52 | | 2.51% |
| Large Capitalization Growth – Class I | | 1,000.00 | | 1,016.57 | | 8.29 | | 1.66% |
| Large Capitalization Growth – Class A | | 1,000.00 | | 1,014.56 | | 10.30 | | 2.06% |
| Large Capitalization Growth – Class C | | 1,000.00 | | 1,011.63 | | 13.24 | | 2.65% |
| Mid Capitalization – Class I | | 1,000.00 | | 1,015.71 | | 9.16 | | 1.83% |
| Mid Capitalization – Class A | | 1,000.00 | | 1,013.71 | | 11.16 | | 2.23% |
| Mid Capitalization – Class C | | 1,000.00 | | 1,010.76 | | 14.11 | | 2.83% |
| Small Capitalization – Class I | | 1,000.00 | | 1,015.17 | | 9.69 | | 1.94% |
| Small Capitalization – Class A | | 1,000.00 | | 1,013.18 | | 11.69 | | 2.34% |
| Small Capitalization – Class C | | 1,000.00 | | 1,010.23 | | 14.64 | | 2.94% |
| International Equity – Class I | | 1,000.00 | | 1,011.95 | | 12.92 | | 2.59% |
| International Equity – Class A | | 1,000.00 | | 1,009.86 | | 15.01 | | 3.01% |
| International Equity – Class C | | 1,000.00 | | 1,007.04 | | 17.82 | | 3.58% |
| Health & Biotechnology – Class I | | 1,000.00 | | 1,012.78 | | 12.09 | | 2.42% |
| Health & Biotechnology – Class A | | 1,000.00 | | 1,010.81 | | 14.06 | | 2.82% |
| Health & Biotechnology – Class C | | 1,000.00 | | 1,007.83 | | 17.03 | | 3.42% |
| Technology & Communications – Class I | | 1,000.00 | | 1,012.46 | | 12.41 | | 2.49% |
| Technology & Communications – Class A | | 1,000.00 | | 1,010.44 | | 14.43 | | 2.89% |
| Technology & Communications – Class C | | 1,000.00 | | 1,007.49 | | 17.37 | | 3.49% |
| Energy & Basic Materials – Class I | | 1,000.00 | | 1,009.92 | | 14.95 | | 3.00% |
| Energy & Basic Materials – Class A | | 1,000.00 | | 1,007.94 | | 16.93 | | 3.40% |
| Energy & Basic Materials – Class C | | 1,000.00 | | 1,004.96 | | 19.88 | | 4.00% |
| Financial Services – Class I | | 1,000.00 | | 1,009.92 | | 14.95 | | 3.00% |
| Financial Services – Class A | | 1,000.00 | | 1,007.94 | | 16.93 | | 3.40% |
| Financial Services – Class C | | 1,000.00 | | 1,004.96 | | 19.88 | | 4.00% |
| Investment Quality Bond – Class I | | 1,000.00 | | 1,017.25 | | 7.61 | | 1.52% |
| Investment Quality Bond – Class A | | 1,000.00 | | 1,015.28 | | 9.59 | | 1.92% |
| Investment Quality Bond – Class C | | 1,000.00 | | 1,011.65 | | 13.22 | | 2.65% |
| Municipal Bond – Class I | | 1,000.00 | | 1,015.37 | | 9.49 | | 1.90% |
| Municipal Bond – Class A | | 1,000.00 | | 1,013.39 | | 11.48 | | 2.30% |
| Municipal Bond – Class C | | 1,000.00 | | 1,010.41 | | 14.46 | | 2.90% |
| U.S. Government Money Market – Class I | | 1,000.00 | | 1,020.34 | | 4.50 | | 0.90% |
| U.S. Government Money Market – Class A | | 1,000.00 | | 1,016.32 | | 8.54 | | 1.71% |
| U.S. Government Money Market – Class C | | 1,000.00 | | 1,013.81 | | 11.06 | | 2.21% |
| SUPPLEMENTAL INFORMATION (Unaudited) (Continued) |
| | | Beginning Account | | Ending Account | | Expense Paid | | Expense Ratio |
| Hypothetical | | Value - 9/1/2022 | | Value - 2/28/2023 | | 9/1/2022 - 2/28/2023* | | [Annualized] |
| [5% Return Before Expenses] - Table 2: | | | | | | | | |
| Aggressive Balanced Allocation - Class I | | $1,000.00 | | $1,019.89 | | $4.96 | | 0.99% |
| Aggressive Balanced Allocation - Class A | | 1,000.00 | | 1,018.65 | | 6.21 | | 1.24% |
| Aggressive Balanced Allocation - Class C | | 1,000.00 | | 1,014.93 | | 9.94 | | 1.99% |
| Conservative Balanced Allocation - Class I | | 1,000.00 | | 1,019.89 | | 4.96 | | 0.99% |
| Conservative Balanced Allocation - Class A | | 1,000.00 | | 1,018.65 | | 6.20 | | 1.24% |
| Conservative Balanced Allocation - Class C | | 1,000.00 | | 1,014.93 | | 9.94 | | 1.99% |
| Moderate Aggressive Balanced Allocation - Class I | | 1,000.00 | | 1,019.88 | | 4.96 | | 0.99% |
| Moderate Aggressive Balanced Allocation - Class A | | 1,000.00 | | 1,018.65 | | 6.20 | | 1.24% |
| Moderate Aggressive Balanced Allocation - Class C | | 1,000.00 | | 1,014.93 | | 9.94 | | 1.99% |
| Moderate Balanced Allocation - Class I | | 1,000.00 | | 1,019.88 | | 4.96 | | 0.99% |
| Moderate Balanced Allocation - Class A | | 1,000.00 | | 1,018.66 | | 6.19 | | 1.24% |
| Moderate Balanced Allocation - Class C | | 1,000.00 | | 1,014.93 | | 9.94 | | 1.99% |
| Moderate Conservative Balanced Allocation - Class I | | 1,000.00 | | 1,019.88 | | 4.97 | | 0.99% |
| Moderate Conservative Balanced Allocation - Class A | | 1,000.00 | | 1,018.65 | | 6.21 | | 1.24% |
| Moderate Conservative Balanced Allocation - Class C | | 1,000.00 | | 1,014.92 | | 9.95 | | 1.99% |
| * | Expenses are equal to the Portfolio’s annualized expense ratio, multiplied by the average account value over the period, multiplied by 181/365 (to reflect the days in the reporting period). |
Rev July 2011
| FACTS | | WHAT DOES THE SARATOGA ADVANTAGE TRUST DO WITH YOUR PERSONAL INFORMATION? |
| | | | |
| Why? | | Financial companies choose how they share your personal information. Federal law gives consumers the right to limit some but not all sharing. Federal law also requires us to tell you how we collect, share, and protect your personal information. Please read this notice carefully to understand what we do. |
| | | | |
| What? | | The types of personal information we collect and share depend on the product or service you have with us. This information can include: |
| | | |
| | | ● | Social Security number and wire transfer instructions |
| | | | |
| | | ● | account transactions and transaction history |
| | | | |
| | | ● | investment experience and purchase history |
| | | | |
| | | When you are no longer our customer, we continue to share your information as described in this notice. |
| | | | |
| How? | | All financial companies need to share customers’ personal information to run their everyday business. In the section below, we list the reasons financial companies can share their customers’ personal information; the reasons The Saratoga Advantage Trust (“The Trust”) choose to share; and whether you can limit this sharing. |
| Reasons we can share your personal information | Do The Funds share? | Can you limit this
sharing? |
| For our everyday business purposes — such as to process your transactions, maintain your account(s), respond to court orders and legal investigations, or report to credit bureaus | Yes | No |
| For our marketing purposes — to offer our products and services to you | Yes | No |
| For joint marketing with other financial companies | No | We don’t share |
| For our affiliates’ everyday business purposes — information about your transactions and experiences | Yes | No |
| For our affiliates’ everyday business purposes — information about your creditworthiness | No | We don’t share |
| For our affiliates to market to you | No | We don’t share |
| For nonaffiliates to market to you | No | We don’t share |
| Questions? | Call 1-800-807-FUND | |
| Who we are |
Who is providing this notice? | The Saratoga Advantage Trust |
| What we do |
| How does The Trust protect my personal information? | To protect your personal information from unauthorized access and use, we use security measures that comply with federal law. These measures include computer safeguards and secured files and buildings. We restrict access to nonpublic personal information about you to those employees who need to know that information to provide products or services to you. |
| How does The Trust collect my personal information? | We collect your personal information, for example, when you ● open an account or deposit money ● direct us to buy securities or direct us to sell your securities ● seek information about your investments We also collect your personal information from others, such as credit bureaus, affiliates, or other companies. |
| Why can’t I limit all sharing? | Federal law gives you the right to limit only ● sharing for affiliates’ everyday business purposes—information about your creditworthiness ● affiliates from using your information to market to you ● sharing for non-affiliates to market to you ● State laws and individual companies may give you additional rights to limit sharing. |
| Definitions |
| Affiliates | Companies related by common ownership or control. They can be financial and nonfinancial companies. ● Our affiliates include financial companies such as Saratoga Capital Management. |
| Nonaffiliates | Companies not related by common ownership or control. They can be financial and nonfinancial companies. ● The Trust does not share your personal information with nonaffiliates so they can market you. |
| Joint marketing | A formal agreement between nonaffiliated financial companies that together market financial products or services to you. ● The Trust does not jointly market. |
How to Obtain Proxy Voting Information
Information regarding how the Portfolios voted proxies relating to portfolio securities during the most recent twelve month period ended June 30 as well as a description of the policies and procedures that the Portfolios use to determine how to vote proxies is available without charge, upon request, by calling 1-888-672-4839 or by referring to the Securities and Exchange Commission’s (“SEC”) website at http://www.sec.gov.
How to Obtain 1st and 3rd Fiscal Quarter Portfolio Holdings
Funds file a complete schedule of portfolio holdings with the Securities and Exchange Commission (the “SEC”) for the first and third quarters of each fiscal year as an exhibit to its reports on Form N-PORT, within sixty days after the end of the period. Form N-PORT reports are available at the SEC’s website at www.sec.gov.
Saratoga-SA23
Item 2. Code of Ethics. Not applicable for semi-annual reports.
Item 3. Audit Committee Financial Expert. Not applicable for semi-annual reports.
Item 4. Principal Accountant Fees and Services. Not applicable for semi-annual reports.
Item 5. Audit Committee of Listed Companies. Not applicable to open-end investment companies.
Item 6. Schedule of Investments. See Item 1.
Item 7. Disclosure of Proxy Voting Policies and Procedures for Closed-End Funds. Not applicable to
open-end investment companies.
Item 8. Portfolio Managers of Closed-End Management Investment Companies. Not applicable to open-end investment companies.
Item 9. Purchases of Equity Securities by Closed-End Management Investment Company and Affiliated Purchasers. Not applicable to open-end investment companies.
Item 10. Submission of Matters to a Vote of Security Holders. None.
Item 11. Controls and Procedures.
(a) Based on an evaluation of the registrant’s disclosure controls and procedures as of February 28, 2022, the disclosure controls and procedures are reasonably designed to ensure that the information required in filings on Forms N-CSR is recorded, processed, summarized, and reported on a timely basis.
(b) There were no significant changes in the registrant’s internal control over financial reporting that occurred during the registrant’s last fiscal half-year that have materially affected, or are reasonably likely to materially affect, the registrant’s internal control over financial reporting.
Item 12. Disclosure of Securities Lending Activities for Closed-End Management Investment Companies. Not applicable.
Item 13. Exhibits.
(a)(1) Not applicable.
(a)(2) Certification(s) required by Section 302 of the Sarbanes-Oxley Act of 2002 (and Item 11(a)(2) of Form N-CSR) are filed herewith.
(a)(3) Not applicable.
(b) Certification(s) required by Section 906 of the Sarbanes-Oxley Act of 2002 (and Item 11(b) of Form N-CSR) are filed herewith.
SIGNATURES
Pursuant to the requirements of the Securities Exchange Act of 1934 and the Investment Company Act of 1940, the registrant has duly caused this report to be signed on its behalf by the undersigned, thereunto duly authorized.
(Registrant) The Saratoga Advantage Trust
By (Signature and Title)
* /s/ Bruce E. Ventimiglia
Bruce E. Ventimiglia, President and Chief Executive Officer
Date 5/9/23
Pursuant to the requirements of the Securities Exchange Act of 1934 and the Investment Company Act of 1940, this report has been signed below by the following persons on behalf of the registrant and in the capacities and on the dates indicated.
By (Signature and Title)
* /s/ Jonathan W. Ventimiglia
Jonathan W. Ventimiglia, Vice President, Assistant Secretary, Treasurer and Chief Financial Officer
Date 5/9/23
By (Signature and Title)
* /s/ Bruce E. Ventimiglia
Bruce E. Ventimiglia, President and Chief Executive Officer
Date 5/9/23
* Print the name and title of each signing officer under his or her signature.