SECURITIES AND EXCHANGE COMMISSION
WASHINGTON, D.C. 20549
FORM 10-K
| x | Annual report pursuant to Section 13 or 15(d) of the Securities Exchange Act of 1934 for the fiscal year ended December 31, 2006 |
COMMISSION FILE NUMBER: 0-24484
MPS GROUP, INC.
(Exact name of registrant as specified in its charter)
| | |
| Florida | | 59-3116655 |
| (State or other jurisdiction of incorporation or organization) | | (I.R.S. Employer Identification No.) |
| 1 Independent Drive, Jacksonville, FL | | 32202 |
| (Address of principal executive offices) | | (Zip Code) |
(Registrant’s telephone number including area code): (904) 360-2000
Securities registered pursuant to Section 12(b) of the Act:
| | |
| Common Stock, Par Value $0.01 Per Share | | New York Stock Exchange |
| (Title of each class) | | (Name of each exchange on which registered) |
Indicate by a check mark if the registrant is a well-known seasoned issuer, as defined in Rule 405 of the Securities Act.
Yes x No ¨
Indicate by check mark whether the registrant (1) has filed all reports required to be filed by Section 13 or 15(d) of the Securities Exchange Act of 1934 during the preceding 12 months (or for such shorter period that the registrant was required to file such reports), and (2) has been subject to such filing requirements for the past 90 days.
Yes x No ¨
Indicate by check mark if disclosure of delinquent filers pursuant to Item 405 of Regulation S-K is not contained herein, and will not be contained, to the best of registrant’s knowledge, in definitive proxy or information statements incorporated by reference in Part III of this Form 10-K or any amendment to this Form 10-K. x
Indicate by a check mark whether the registrant is a large accelerated filer, an accelerated filer, or a non-accelerated filer. See definition of “accelerated filer and large accelerated filer” in Rule 12b-2 of the Exchange Act.
| | | | |
Large accelerated filer x | | Accelerated filer ¨ | | Non-accelerated filer ¨ |
Indicate by check mark whether the registrant is a shell company (as defined in Rule 12b-2 of the Exchange Act.): Yes ¨ No x
The aggregate market value of the voting stock held by non-affiliates of the Registrant, based upon the closing sale price of common stock on, June 30, 2006, the last business day of the registrant’s most recently completed second fiscal quarter, as reported by the New York Stock Exchange, was approximately $1,559,549,128.
As of February 15, 2007 the number of shares outstanding of the Registrant’s common stock was 102,483,844.
DOCUMENTS INCORPORATED BY REFERENCE.
Portions of the Registrant’s Proxy Statement for its 2007 Annual Meeting of shareholders are incorporated by reference in Part III.
This Annual Report on Form 10-K contains forward-looking statements that are subject to certain risks, uncertainties or assumptions and may be affected by certain factors, including but not limited to the specific factors discussed in Part I, Item 1A under ‘Risk Factors,’ in Part II, Item 5 under ‘Market for Registrant’s Common Equity, Related Stockholder Matters and Issuer Purchases of Equity Securities’, and Part II, Item 7 under ‘Management’s Discussion and Analysis of Financial Condition and Results of Operations—Liquidity and Capital Resources.’ In some cases, you can identify forward-looking statements by terminology such as ‘may,’ ‘should,’ ‘could,’ ‘expects,’ ‘plans,’ ‘indicates,’ ‘projects,’ ‘anticipates,’ ‘believes,’ ‘estimates,’ ‘appears,’ ‘predicts,’ ‘potential,’ ‘continues,’ ‘can,’ ‘hopes,’ ‘perhaps,’ ‘would,’ or ‘become,’ or the negative of these terms or other comparable terminology. In addition, except for historical facts, all information provided in Part II, Item 7A, under ‘Quantitative and Qualitative Disclosures About Market Risk’ should be considered forward-looking statements. Should one or more of these risks, uncertainties or other factors materialize, or should underlying assumptions prove incorrect, actual results, performance or achievements of the Company may vary materially from any future results, performance or achievements expressed or implied by such forward-looking statements.
Forward-looking statements are based on beliefs and assumptions of the Company’s management and on information currently available to such management. Forward looking statements speak only as of the date they are made, and the Company undertakes no obligation to publicly update any of them in light of new information or future events. Undue reliance should not be placed on such forward-looking statements, which are based on current expectations. Forward-looking statements are not guarantees of performance.
2
TABLE OF CONTENTS
PART III
Information required by Part III (Items 10-14) is to be included in the Registrant’s Definitive Proxy Statement to be filed pursuant to Regulation 14A not later than 120 days after the end of the fiscal year covered by this report, and is hereby incorporated herein by reference.
PART IV
3
PART I
References to “we”, “our”, “us”, “MPS” or the “Company” in this Annual Report on Form 10-K refer to MPS Group, Inc. and its consolidated subsidiaries, unless the context requires otherwise.
Overall
MPS Group, Inc. is a leading provider of business services with over 200 offices throughout the United States, Canada, the United Kingdom, and continental Europe. We deliver specialty staffing, consulting and business solutions to virtually all industries in the following disciplines, through the following primary brands:
| | |
Discipline | | Brand(s) |
Information Technology (IT) Services | | Modis® |
Accounting and Finance | | Badenoch & Clark®, Accounting Principals® |
Engineering | | Entegee® |
Legal | | Special Counsel® |
IT Solutions | | Idea Integration® |
Healthcare | | Soliant Health® |
Work Force Automation | | Beeline® |
Our strategy is to focus on increasing revenue and profits, through a combination of internal growth and acquisitions, primarily within our core disciplines and, to a lesser extent, expansion into new specialties. Specifically, we aim to maintain a leadership position in our IT-related disciplines, while growing our professional-related disciplines both organically and through acquisitions, which should result in the Professional Services division providing a larger overall percentage contribution to our total revenue in the future. The key elements to our internal growth strategy include:
| | • | | increasing penetration of existing markets and customer segments, |
| | • | | expanding current specialties into new and contiguous geographic markets, |
| | • | | concentrating on skill areas that value high levels of service, and |
| | • | | identifying and adding new practice areas. |
We feel we are able to execute and profit from our internal growth and acquisition strategies due to our strong management team, our integrated and scalable back office support services, and to the continued development of our strategic management information systems. While we look to strengthen relationships with our clients, we are not dependent upon a single customer or a limited number of customers.
We target potential acquisitions that will either increase the geographic presence of our businesses or offer complementary service offerings. Our target acquisitions have generally ranged from $5 million to $25 million in annual revenue. Accordingly, we acquired six businesses in 2006 that contributed $65 million to our 2006 revenue. In 2005, we acquired three businesses that contributed $52 million to our 2005 revenue. In 2004, we acquired seven businesses that contributed $61 million to our 2004 revenue.
In all of our markets and disciplines, we encounter aggressive and capable competition, with a number of firms offering services similar to ours on a national, regional or local basis. Our ability to compete successfully depends on our reputation, pricing and quality of service provided, our understanding of clients’ specific job requirements, and our ability to provide qualified personnel in a timely manner.
4
The Company was incorporated under the laws of the State of Florida in 1992 under the name Accustaff Incorporated, and changed its name to MPS Group, Inc. in 2002. Our headquarters are located in Jacksonville, Florida. Strategically, our operations are coordinated primarily from facilities in Jacksonville, Florida, and London, England, and to a lesser extent, Burlington, Massachusetts. Both our Jacksonville and London facilities provide support and centralized services to our offices in the administrative, marketing, public relations, accounting, training and legal areas. Regional and local office managers are responsible for most activities of their offices, including sales, local and regional marketing and recruitment.
Segments
We present the financial results of our operations under our four reporting segments: North American Professional Services, European Professional Services, North American IT Services and European IT Services. In addition, we have both a Professional Services and an IT Services division. The Professional Services division is comprised of the North American Professional Services segment and the European Professional Services segment. The IT services division is comprised of the North American IT Services segment and the European IT Services segment. The table below highlights the percentage contribution of revenue and gross profit from our four segments for 2006 and 2005:
| | | | | | | | | | | | |
| | | 2006 Revenue | | | 2005 Revenue | | | 2006 Gross Profit | | | 2005 Gross Profit | |
North American Professional Services | | 32.9 | % | | 31.9 | % | | 36.6 | % | | 36.3 | % |
European Professional Services | | 23.0 | % | | 21.6 | % | | 23.8 | % | | 23.5 | % |
| | | | | | | | | | | | |
Professional Services Division | | 55.9 | % | | 53.5 | % | | 60.4 | % | | 59.8 | % |
| | | | |
North American IT Services | | 29.9 | % | | 30.3 | % | | 31.3 | % | | 32.1 | % |
European IT Services | | 14.2 | % | | 16.2 | % | | 8.3 | % | | 8.1 | % |
| | | | | | | | | | | | |
IT Services Division | | 44.1 | % | | 46.5 | % | | 39.6 | % | | 40.2 | % |
| | | | |
North American Segments | | 62.8 | % | | 62.2 | % | | 67.9 | % | | 68.4 | % |
European Segments | | 37.2 | % | | 37.8 | % | | 32.1 | % | | 31.6 | % |
Additional financial information relating to our segments can be found in Footnote 15 to the Consolidated Financial Statements.
Professional Services Division
Our Professional Services division provides specialized staffing and recruiting in the disciplines of accounting, finance, law, engineering and healthcare for varying periods of time to companies or other organizations (including government agencies) that have a need for such personnel, but are unable to, or choose not to, engage certain personnel as their own employees. Businesses increasingly view the use of temporary employees as a means of controlling personnel costs and converting the nature of such costs from fixed to variable. Examples of client needs for staffing solutions include the need for specialized or highly-skilled personnel for the completion of a specific project or subproject, substitution for regular employees during vacation or sick leave, and staffing of high turnover positions or during seasonal peaks.
We operate this division under a variable cost business model whereby revenue and cost of revenue are primarily recognized and incurred on a time-and-materials basis. The vast majority of our billable consultants are compensated on an hourly basis only for the hours which are billed to our clients.
Clients also hire our skilled consultants on a permanent basis, whether it is from a conversion of a temporary assignment to, or a direct placement of, a full-time position. We earn a one-time fee for these services. These fees represent approximately 7% of this division’s revenue.
5
The principal national and international competitors of our Professional Services division include Robert Half International Inc., Resources Connection, Inc., Spherion Corporation, Kelly Law Registry, Adecco SA, Michael Page International, Robert Walters PLC, Hays PLC, Cross Country Healthcare, Inc., On Assignment Inc., Kforce Inc., Aerotek (a division of Allegis Group), Hudson Highland Group Inc., and CDI Corporation.
North American Professional Services Segment
Our North American Professional Services segment goes to market under the primary brands and operating unitsEntegee,Special Counsel,Accounting Principals, andSoliant Health. The demands of our clients, including the need for confidentiality, accuracy, reliability, cost-effectiveness, and frequent peak workload periods, are similar among the businesses within this segment.
Entegee
Entegee provides technical and engineering strategic workforce solutions. From on-site management consulting and in-house project services to temporary and direct placement,Entegee combines industry knowledge and experience to fill highly skilled technical and engineering positions. These positions include, but are not limited to, engineers, designers, drafters, inspectors and assemblers.Entegee operates through a domestic network of national practice branches with offices in 18 markets, and employs approximately 2,700 billable consultants at the end of 2006.Entegee also provides engineering and drafting design services through two company-owned centers that utilize state-of-the-art computer technology. Its primary clients include government and defense contractors, manufacturing and engineering companies.
Special Counsel
Special Counsel staffs temporary and full-time employees in attorney, paralegal, legal administrative and legal secretarial positions for workload management, litigation support, business transaction support, pre-litigation and document management support, as well as e-discovery, medical document review, deposition digesting, court reporting and other trial-related services.Special Counsel has a network of 37 offices across the United States, and employs approximately 1,400 billable consultants at the end of 2006. Its primary clients are Fortune 1000 companies and law firms.
Accounting Principals
Accounting Principals specializes in placing temporary and full-time employees in accounting and finance positions.Accounting Principals has a network of 40 offices across the United States, and employs approximately 1,600 billable consultants at the end of 2006.
In February 2006, we expandedAccounting Principals’ geographic footprint with the acquisition of Garelli Wong and Associates. Garelli Wong provides high-end accounting candidates to clients primarily located in the Chicago, Illinois area.
Soliant Health
Soliant Health specializes primarily in placing traveling healthcare professionals, in the areas of nursing, physical and occupational therapy, speech and language therapy, along with imaging technicians.Soliant Health employs approximately 1,100 consultants at the end of 2006, and its clients include hospitals and healthcare providers across the United States.
In April 2006, we expanded Soliant Health’s service line with the acquisition of the Pharmacy Staffing Services Unit of Cardinal Health, which provides staffing solutions to clients nationwide through its 4 locations in Boston, Massachusetts, West Palm Beach, Florida, Houston, Texas, and Irvine, California.
6
European Professional Services Segment
Since 1980, our European Professional Services business,Badenoch & Clark, has specialized in placing temporary, permanent, and contract employees in accounting and finance, financial services, legal, human resources, and marketing positions.Badenoch & Clark has 19 offices across the United Kingdom along with offices in Belgium, Germany, Hungary, and the Netherlands.Badenoch & Clark employs approximately 4,300 billable consultants.
In April 2006, we expandedBadenoch & Clark’s geographic footprint in mainland Europe with the acquisitions of the Corinthe Companies and Chronos. Corinthe provides temporary and permanent placement of professionals in finance and accounting, human resources and marketing positions in the Netherlands. Chronos provides permanent placement of professionals in Belgium, Germany, and Hungary.
IT Services Division
Our IT Services division provides specialty staffing, consulting and business solutions under the brands/operating unitsModis,Modis International,Idea Integration andBeeline. We utilize the brandModis in both our North American and European segments; however, the overall business culture distinguishes the operation of these two segments.
We operate this division primarily under a variable cost business model whereby revenue and cost of revenue are primarily recognized and incurred on a time-and-materials basis. The vast majority of the billable consultants are compensated on an hourly basis only for the hours which are billed to our clients. Approximately 2% of this division’s revenue is generated from fees for clients hiring our skilled consultants on a permanent basis, whether it is from a conversion of a temporary assignment to, or a direct placement of, a full-time position.
The principal national and international competitors of our IT Services division include Keane, Inc., Computer Horizons Corp., Comsys IT Partners, Inc., CIBER, Inc., Adecco Information Technology (a division of Adecco SA), Hays PLC, Elan, and TEKsystems (a division of Allegis Group). In addition, we may compete against the internal management information services and IT departments of our clients and potential clients.
North American IT Services Segment
Modis
Modis specializes in the placement of IT contract consultants for IT project support and staffing, recruitment of full-time positions, project-based solutions, supplier management solutions, and on-site recruiting support for application development, systems integration, and enterprise application integration.Modis has a network of 49 offices across the United States and Canada, and employs approximately 3,900 billable consultants. Its primary clients are Fortune 1000 companies.
Idea Integration
Idea Integration specializes in Web design and development, application development, digital data management, business intelligence, infrastructure and security, and interactive marketing.Ideautilizes both salaried and hourly consultants to deliver solutions primarily under time-and-materials contracts and to a lesser extent under fixed-fee contracts. Its clients include Fortune 1000 companies, government and middle-market companies.
Beeline
Beeline provides software-based workforce solutions that manage recruitment, development and retention. Beeline streamlines the recruitment and management of full-time, contract and project-based labor.Beeline operates primarily in the United States and its’ clients include leading global companies, healthcare organizations, and government entities.
7
Beeline maintains a full-time staff to support its operations and seeks to collect a service charge based upon the usage of this service. Subsequent to the initial start up costs and time, minimal cost and resources are required by the client for the usage ofBeeline’s services.
In October 2006, we expandedBeeline’sproduct offerings with the acquisition of Integrated Performance Systems (“IPS”). IPS leverages technology to automate and integrate many aspects of human capital performance including learning management, performance management, talent management, and organizational development.
European IT Services segment
Our European IT Services segment is comprised ofModis International.Modis International, headquartered in the United Kingdom, specializes in providing IT contract consultants throughout the United Kingdom and certain continental European markets. Modis International, and its predecessors, has been in operation for over 30 years. It has 18 offices across the United Kingdom, and an office each in Belgium, Germany, and the Netherlands. It employs approximately 2,100 billable consultants.
In August 2006, we expandedModis International’sservice offerings with the acquisition of Netlogic. Netlogic provides IT infrastructure and network solutions to clients in the United Kingdom.
Employees
MPS employs approximately 17,300 consultants and approximately 2,800 full-time staff employees. Approximately 270 of the employees work at corporate headquarters.
As described below, in most jurisdictions, we, as the employer of the consultants or as otherwise required by applicable law, are responsible for employment administration. This administration includes collection of withholding taxes, employer contributions for social security or its equivalent outside the United States, unemployment tax, maintaining workers’ compensation and fiduciary and liability insurance, and other governmental requirements imposed on employers. Full-time employees are covered by life and disability insurance and receive health insurance and other benefits.
Government Regulations
Outside of the United States and Canada, the staffing services industry is closely regulated. These regulations differ among countries but generally may regulate: (i) the relationship between us and our temporary employees; (ii) registration, licensing, record keeping, and reporting requirements; and (iii) types of operations permitted. Regulation within the United States and Canada has not materially impacted our operations.
In many countries, including the United States and the United Kingdom, staffing services firms are considered the legal employers of the temporary consultants while the consultant is on assignment with a company client. Therefore, laws regulating the employer/employee relationship, such as tax withholding or reporting, social security or retirement, anti-discrimination, and workers’ compensation, govern us. In other countries, staffing services firms, while not the direct legal employer of the consultant, are still responsible for collecting taxes and social security deductions and transmitting such amounts to the taxing authorities.
8
Intellectual Property
We seek to protect our intellectual property through copyright, trade secret and trademark law and through contractual non-disclosure restrictions. Our services often involve the development of work and materials for specific client engagements, the ownership of which is frequently assigned to the client. We do at times, and when appropriate, negotiate to retain the ownership or continued use of development tools or know how created or generated by us for a client in the delivery of our services, which we may then license or use in the delivery of our services to other clients.
Seasonality
Our quarterly operating results are affected by the number of billing days in a quarter and the seasonality of our customers’ businesses. Demand for our services has historically been lower during the calendar year-end, as a result of holidays, through February of the following year. Extreme weather conditions may also affect demand in the early part of the year as certain of our clients’ facilities are located in geographic areas subject to closure or reduced hours due to inclement weather. In addition, we experience an increase in our cost of sales and a corresponding decrease in gross profit and gross margin in the first fiscal quarter of each year, as a result of certain U.S. state and federal employment tax resets.
Access to Company Information
Our common stock is listed on the New York Stock Exchange (‘NYSE’) under the ticker symbol ‘MPS’. Our Internet address is www.mpsgroup.com. We make available through our Internet website our annual reports on Form 10-K, quarterly reports on Form 10-Q, and current reports on Form 8-K, as soon as reasonably practicable after filing such material with, or furnishing it to, the Securities and Exchange Commission. The information contained on our website, or on other websites linked to our website, is not part of this document.
Our results of operations and financial condition can be adversely affected by numerous risks and uncertainties. The risks and uncertainties that we currently believe are most important are described below. You should carefully consider the risk factors detailed below in conjunction with the other information contained in this document. Should any of these risks actually materialize, our business, financial condition, and future prospects could be negatively impacted.
Demand for our services is affected by the economic climate in the industries and markets we serve.The demand for our services, in particular our staffing services, is highly dependent upon the state of the economy and upon the staffing needs of our clients. Any negative variation in the economic condition of the United States, United Kingdom or of any of the other foreign countries in which we do business, may severely reduce the demand for our services and thereby significantly decrease our revenues and profits.
Our market is highly competitive with low barriers to entry.Our industry is intensely competitive and highly fragmented, and the barriers to entry are quite low. There are many competitors, and new ones are entering the market constantly. In addition, some of these competitors have greater resources than us. Competition arises locally, regionally, nationally, internationally and in certain cases from remote locations, particularly from offshore locations such as India and China.
Certain of our contracts are awarded on the basis of competitive proposals, which can be periodically re-bid by the client. There can be no assurance that existing contracts will be renewed on satisfactory terms or that additional or replacement contracts will be awarded to us. In addition, long-term contracts form a negligible
9
portion of our revenue. There can be no assurance we will be able to retain clients or market share in the future. Nor can there be any assurance that we will, in light of competitive pressures, be able to remain profitable or, if profitable, maintain our current profit margins.
Our business requires a qualified candidate pool, which we may not be able to recruit or maintain. Our staffing services consist of the placement of individuals seeking employment in specialized IT and professional positions. Some of these sectors are characterized by a shortage of qualified candidates. There can be no assurance that suitable candidates for employment will continue to be available or will continue to seek employment through us. Candidates generally seek temporary or regular positions through multiple sources, including us and our competitors. Any shortage of qualified candidates could materially adversely affect us.
Our business depends on key personnel, including executive officers, local managers and field personnel.We are engaged in a services business. As such, our success or failure is highly dependent upon the performance of our management personnel and employees, rather than upon technology or upon tangible assets (of which we have few). There can be no assurance that we will be able to attract and retain the personnel that are essential to our success.
We have to comply with existing government regulation and are exposed to increasing regulation of the workplace.Our business is subject to regulation or licensing in many states and in certain foreign countries. There can be no assurance we will be able to continue to obtain all necessary licenses or approvals or that the cost of compliance will not prove to be material in the future. Any inability to comply with government regulation or licensing requirements, or increase in the cost of compliance, could materially adversely affect us. Additionally, our staffing services entail employing individuals on a temporary basis and placing such individuals in clients’ workplaces. Increased government regulation of the workplace or of the employer-employee relationship could materially adversely affect us.
We are exposed to claims and costs, liabilities and litigation arising from the delivery of our services. Our recruiting services involve our referring candidates to clients for potential employment, and our staffing services entail employing or retaining individuals on a temporary basis and placing such individuals in clients’ workplaces. Our recruiting services entail a risk of liability to our clients and others, contractually and otherwise, arising from allegations of inadequate background checks, inadequate credentialing of our nursing and healthcare workers, and negligent referral of candidates to our clients. Our staffing services entail a risk of liability to our clients and others, contractually and otherwise, arising from various workplace events, often beyond our control, including allegations of errors and omissions, injury to property or persons, or misappropriation or theft of property or proprietary information allegedly caused or contributed to by our temporary workers. Our staffing services also entail a risk of employment and co-employment liability, to either or both our clients and our temporary workers, arising from allegations by our temporary workers of discrimination, harassment, inadequate workplace conditions, or entitlement to employee benefits or pay from clients to which they are assigned. We maintain insurance for many of the aforementioned claims, but there can be no assurance that we will continue to be able to obtain insurance at a cost that does not have a material adverse effect upon us or that such claims (whether by reason of not having insurance or by reason of such claims being outside the scope of the insurance) will not have a material adverse effect upon us.
We have acquired, and may continue to acquire, companies, and these acquisitions could disrupt our business or adversely affect our earnings. We have acquired several companies and may continue to acquire companies in the future. Entering into an acquisition entails many risks, any of which could harm our business, including failure to successfully integrate the acquired company with our existing business, alienation or impairment of relationships with substantial customers or key employees of the acquired business or our existing business, and assumption of liabilities of the acquired business. Any acquisition that we consummate also may have an adverse affect on our liquidity or earnings and may be dilutive to our earnings. Adverse business conditions or developments suffered by or associated with any business we acquire additionally could result in impairment to the goodwill or intangible assets associated with the acquired business and a related write down of the value of these assets, adversely affecting our earnings.
10
The price of our common stock may fluctuate significantly.The market price for our common stock can fluctuate as a result of a variety of factors, including the factors listed above, many of which are beyond our control. These factors include: actual or anticipated variations in quarterly operating results; announcements of new services by our competitors or us; announcements relating to strategic relationships or acquisitions; changes in financial estimates or other statements by securities analysts; and other changes in general economic conditions. Because of this, we may fail to meet or exceed the expectations of our shareholders or of our securities analysts and the market price for our common stock could fluctuate as a result.
| ITEM 1B. | UNRESOLVED STAFF COMMENTS |
There are no unresolved comments from the Staff of the Securities and Exchange Commission concerning our periodic or current reports under the Securities Exchange Act of 1934.
Our corporate headquarters, located in Jacksonville, Florida, is on lease through 2012. Our business services are conducted through more than 200 offices located in the United States, Canada, the United Kingdom, and continental Europe. Almost all of our offices are on lease, with the terms of an average office lease being from three to six years.
We believe our facilities are generally adequate for our needs and do not anticipate difficulty replacing such facilities or locating additional facilities, if needed. Additional information on lease commitments can be found in Footnote 6 to the Consolidated Financial Statements.
We are a party to a number of lawsuits and claims arising out of the ordinary conduct of our business. In the opinion of management, based on the advice of in-house and external legal counsel, the lawsuits and claims pending are not likely to have a material adverse effect on us, our financial position, our results of operations, or our cash flows.
| ITEM 4. | SUBMISSION OF MATTERS TO A VOTE OF SECURITY HOLDERS |
No matters were submitted to a vote of security holders during the fourth quarter of 2006.
11
PART II
| ITEM 5. | MARKET FOR REGISTRANT’S COMMON EQUITY, RELATED STOCKHOLDER MATTERS AND ISSUER PURCHASES OF EQUITY SECURITIES |
Market Price and Related Matters
The following table sets forth the high and low sale prices of our common stock, as reported by the NYSE, during the two years ended December 31, 2006:
| | | | | | | | | | | | |
| | | 2006 | | 2005 |
| | | High | | Low | | High | | Low |
Period: | | | | | | | | | | | | |
First Quarter | | $ | 16.27 | | $ | 12.66 | | $ | 12.45 | | $ | 9.93 |
Second Quarter | | $ | 17.80 | | $ | 13.80 | | $ | 10.77 | | $ | 7.15 |
Third Quarter | | $ | 15.98 | | $ | 11.58 | | $ | 12.38 | | $ | 9.38 |
Fourth Quarter | | $ | 16.48 | | $ | 14.11 | | $ | 14.45 | | $ | 10.00 |
See the factors set forth above in ‘Risk Factors,’ for factors that may impact the price of our common stock. As of February 15, 2007, there were approximately 966 holders of record of our common stock.
We have never paid, nor do we currently intend to pay, a cash dividend or other cash distribution with respect to our common stock.
Issuer Repurchases of Equity Securities
Our Board of Directors has authorized certain repurchases of our common stock. For 2006, we repurchased 3.2 million shares at a cost of $45.0 million. The following table sets forth information about our common stock repurchases for the three months ended December 31, 2006. As of February 15, 2007, we have repurchased a total of 12.0 million shares at a cost of $122.2 million under this plan. We anticipate that we will continue to purchase shares under this authorization in the future as we have approximately $45 million remaining under this authorization as of February 15, 2007. There is no expiration date for this authorization.
| | | | | | | | | | |
Period (1) | | Total Number
of Shares
Repurchased | | Average Price
Paid per Share | | Total Number of
Shares Purchased
As Part of Publicly
Announced Plans or Programs | | Maximum Number (or
Approximate Dollar
Value) of Shares That
May Yet be Purchased
Under the Plans or Programs |
October 1, 2006 to October 31, 2006 | | — | | | — | | — | | $ | 49,216,625 |
November 1, 2006 to November 30, 2006 | | — | | | — | | — | | | 49,216,625 |
December 1, 2006 to December 31, 2006 | | 269,764 | | $ | 14.83 | | 269,764 | | | 45,216,628 |
| | | | | | | | | | |
Total | | 269,764 | | $ | 14.83 | | 269,764 | | $ | 45,216,628 |
| (1) | Based on trade date, not settlement date. |
12
Performance Graph
The following Performance Graph and related information shall not be deemed “soliciting material” or to be “filed” with the Securities and Exchange Commission, nor shall such information be incorporated by reference into any future filing under the Securities Act of 1933 or Securities Exchange Act of 1934, each as amended, except to the extent that the Company specifically incorporates it by reference into such filing.
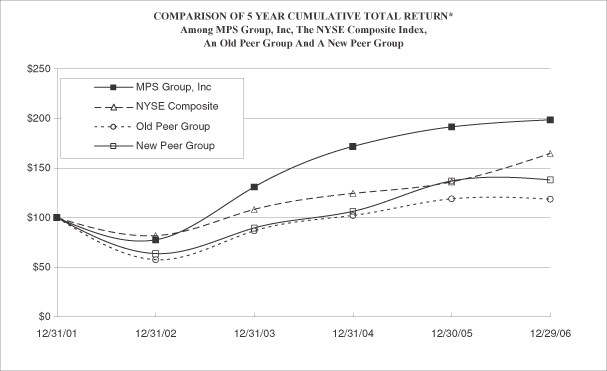
The following graph and table compare the cumulative total return of our common stock, the NYSE composite market index (U.S. companies), and an index of selected publicly traded employment services and consulting companies (the “Self-Determined Peer Group”), as described below, for the period beginning December 31, 2001 and ending December 29, 2006 (the last trading dates in our 2001 and 2006 fiscal years), assuming an initial investment of $100 and the reinvestment of any dividends. We obtained the information reflected in the graph and table from independent sources we believe to be reliable, but we have not independently verified the information.
We revised our Self-Determined Peer Group from prior year to take into consideration acquisitions of companies within our peer group and the evolving strategic direction of MPS. Consequently, the following graph and table comparison includes both our previous and new Self-Determined Peer Group.
| | | | | | | | | | | | |
| Total Returns Index for: | | 12/31/01 | | 12/31/02 | | 12/31/03 | | 12/31/04 | | 12/31/05 | | 12/31/06 |
| | | | | | |
MPS Group, Inc | | 100.00 | | 77.59 | | 130.95 | | 171.71 | | 191.46 | | 198.60 |
NYSE Composite | | 100.00 | | 81.83 | | 108.16 | | 124.38 | | 136.03 | | 164.60 |
Old Self-Determined Peer Group | | 100.00 | | 57.55 | | 86.67 | | 102.25 | | 118.91 | | 118.62 |
New Self-Determined Peer Group | | 100.00 | | 63.64 | | 89.46 | | 106.28 | | 136.92 | | 138.11 |
Companies in the New Self-Determined Peer Group | | | | | | | | | | |
CDI Corp | | Kforce Inc | | | | |
Comsys It Partners Inc | | On Assignment Inc | | | | |
Hudson Highland Group Inc | | Robert Half International | | | | |
13
| ITEM 6. | SELECTED FINANCIAL DATA |
| | | | | | | | | | | | | | | | | | |
| | | Years Ended | |
(amounts in thousands except per common share
amounts) | | Dec. 31, 2006 | | Dec. 31, 2005 | | Dec. 31, 2004 | | | Dec. 31, 2003 | | | Dec. 31, 2002 | |
Consolidated Statements of Operations data: | | | | | | | | | | | | | | | | | | |
Revenue | | $ | 1,876,622 | | $ | 1,684,699 | | $ | 1,426,842 | | | $ | 1,096,030 | | | $ | 1,119,156 | |
Cost of revenue | | | 1,359,580 | | | 1,242,331 | | | 1,066,055 | | | | 808,890 | | | | 834,318 | |
| | | | | | | | | | | | | | | | | | |
Gross profit | | | 517,042 | | | 442,368 | | | 360,787 | | | | 287,140 | | | | 284,838 | |
Operating expenses | | | 402,498 | | | 355,382 | | | 309,551 | | | | 251,623 | | | | 255,929 | |
Impairment of investment | | | — | | | — | | | — | | | | — | | | | 16,165 | |
Exit costs (recapture) | | | — | | | — | | | (897 | ) | | | (284 | ) | | | 8,967 | |
| | | | | | | | | | | | | | | | | | |
Operating income | | | 114,544 | | | 86,986 | | | 52,133 | | | | 35,801 | | | | 3,777 | |
Other income (expense), net | | | 5,991 | | | 3,799 | | | 1,437 | | | | 553 | | | | (3,947 | ) |
| | | | | | | | | | | | | | | | | | |
Income (loss) from continuing operations before income taxes and cumulative effect of accounting change | | | 120,535 | | | 90,785 | | | 53,570 | | | | 36,354 | | | | (170 | ) |
Provision for income taxes | | | 45,321 | | | 31,188 | | | 18,150 | | | | 14,519 | | | | 13,832 | |
| | | | | | | | | | | | | | | | | | |
Income (loss) from continuing operations before cumulative effect of accounting change | | | 75,214 | | | 59,597 | | | 35,420 | | | | 21,835 | | | | (14,002 | ) |
Discontinued operations: (2) | | | | | | | | | | | | | | | | | | |
Income (loss) from discontinued operations, net of tax | | | — | | | — | | | — | | | | (2,395 | ) | | | 1,410 | |
Loss on sale of discontinued operations, net of tax | | | — | | | — | | | — | | | | (20,675 | ) | | | — | |
| | | | | | | | | | | | | | | | | | |
Income (loss) before cumulative effect of accounting change | | | 75,214 | | | 59,597 | | | 35,420 | | | | (1,235 | ) | | | (12,592 | ) |
Cumulative effect of accounting change, net of tax (1) | | | — | | | — | | | — | | | | — | | | | (553,712 | ) |
| | | | | | | | | | | | | | | | | | |
Net income (loss) | | $ | 75,214 | | $ | 59,597 | | $ | 35,420 | | | $ | (1,235 | ) | | $ | (566,304 | ) |
| | | | | | | | | | | | | | | | | | |
Basic income (loss) per common share: | | | | | | | | | | | | | | | | | | |
From continuing operations | | $ | 0.74 | | $ | 0.59 | | $ | 0.34 | | | $ | 0.21 | | | $ | (0.14 | ) |
| | | | | | | | | | | | | | | | | | |
From discontinued operations | | $ | — | | $ | — | | $ | — | | | $ | (0.02 | ) | | $ | 0.01 | |
| | | | | | | | | | | | | | | | | | |
From sale of discontinued operations | | $ | — | | $ | — | | $ | — | | | $ | (0.20 | ) | | $ | — | |
| | | | | | | | | | | | | | | | | | |
From accounting change | | $ | — | | $ | — | | $ | — | | | $ | — | | | $ | (5.49 | ) |
| | | | | | | | | | | | | | | | | | |
Basic income (loss) per common share | | $ | 0.74 | | $ | 0.59 | | $ | 0.34 | | | $ | (0.01 | ) | | $ | (5.62 | ) |
| | | | | | | | | | | | | | | | | | |
Diluted income (loss) per common share: | | | | | | | | | | | | | | | | | | |
From continuing operations | | $ | 0.72 | | $ | 0.56 | | $ | 0.33 | | | $ | 0.21 | | | $ | (0.14 | ) |
| | | | | | | | | | | | | | | | | | |
From discontinued operations | | $ | — | | $ | — | | $ | — | | | $ | (0.02 | ) | | $ | 0.01 | |
| | | | | | | | | | | | | | | | | | |
From sale of discontinued operations | | $ | — | | $ | — | | $ | — | | | $ | (0.20 | ) | | $ | — | |
| | | | | | | | | | | | | | | | | | |
From accounting change | | $ | — | | $ | — | | $ | — | | | $ | — | | | $ | (5.49 | ) |
| | | | | | | | | | | | | | | | | | |
Diluted income (loss) per common share | | $ | 0.72 | | $ | 0.56 | | $ | 0.33 | | | $ | (0.01 | ) | | $ | (5.62 | ) |
| | | | | | | | | | | | | | | | | | |
Basic average common shares outstanding | | | 101,340 | | | 101,719 | | | 102,804 | | | | 101,680 | | | | 100,833 | |
| | | | | | | | | | | | | | | | | | |
Diluted average common shares outstanding | | | 104,090 | | | 105,832 | | | 106,842 | | | | 104,518 | | | | 100,833 | |
| | | | | | | | | | | | | | | | | | |
14
| | | | | | | | | | | | | | | |
| | | December 31, |
(amounts in thousands) | | 2006 | | 2005 | | 2004 | | 2003 | | 2002 |
Consolidated Balance Sheet data: | | | | | | | | | | | | | | | |
Working capital | | $ | 318,879 | | $ | 279,859 | | $ | 232,133 | | $ | 216,879 | | $ | 171,154 |
Total assets | | | 1,142,279 | | | 1,028,006 | | | 954,604 | | | 893,151 | | | 892,974 |
Long term debt | | | — | | | — | | | — | | | — | | | — |
Stockholders’ equity (1) | | | 963,298 | | | 876,040 | | | 835,663 | | | 793,462 | | | 781,559 |
| (1) | The Company recognized an impairment loss associated with its adoption of Statement of Financial Accounting Standards (‘SFAS’) No. 142 ‘Goodwill and Other Intangible Assets,’ effective January 1, 2002. This loss was recorded as a Cumulative Effect of Accounting Change, and reduced Stockholders’ Equity. In addition, SFAS No. 142 discontinued the periodic amortization of goodwill. |
| (2) | The income (loss) from discontinued operations for the periods presented above and the 2003 loss on sale related to the discontinued outplacement unit, sold in December 2003. |
| ITEM 7. | MANAGEMENT’S DISCUSSION AND ANALYSIS OF FINANCIAL CONDITION AND RESULTS OF OPERATIONS |
MPS Group, Inc. is a leading provider of business services with over 200 offices throughout the United States, Canada, the United Kingdom, and continental Europe. The Company delivers specialty staffing, consulting and business solutions to virtually all industries in the following disciplines and through the following primary brands:
| | |
Discipline | | Brand(s) |
Information Technology (IT) Services | | Modis® |
Accounting and Finance | | Badenoch & Clark®,Accounting Principals® |
Engineering | | Entegee® |
Legal | | Special Counsel® |
IT Solutions | | Idea Integration® |
Healthcare | | Soliant Health® |
Work Force Automation | | Beeline® |
We present the financial results of the above brands under our four reporting segments: North American Professional Services, European Professional Services, North American IT Services and European IT Services.
Non-GAAP Financial Measures
From time to time we may measure certain financial information on a ‘constant currency’ basis. Such constant currency financial data is not a U.S. generally accepted accounting principles (‘GAAP’) financial measure. Constant currency removes from financial data the impact of changes in exchange rates between the U.S. dollar and the functional currencies of our foreign subsidiaries, by translating the current period financial data into U.S. dollars using the same foreign currency exchange rates that were used to translate the financial data for the previous period. We believe presenting certain results on a constant currency basis is useful to investors because it allows a more meaningful comparison of the performance of our foreign operations from period to period. Additionally, certain internal reporting and compensation targets are based on constant currency financial data for our various foreign subsidiaries. However, constant currency measures should not be considered in isolation or as an alternative to financial measures that reflect current period exchange rates, or to other financial measures calculated and presented in accordance with GAAP.
From time to time we may measure certain financial information excluding the effect of acquisitions. Such financial data that excludes the effect of businesses we acquire is not a GAAP financial measure. We believe presenting some results excluding the effects of businesses we acquire is helpful to investors because it permits a
15
comparison of the performance of our core internal operations from period to period. Additionally, certain internal reporting and compensation targets are based on the performance of core internal operations. The effect of a business we acquire is generally excluded for only the first 12 months following the acquisition date. Subsequent to this, a business is considered to be integrated for reporting purposes. Again however, such measures should be considered only in conjunction with the correlative measures that include the results from acquisitions, as calculated and presented in accordance with GAAP.
We may use EBITDA to measure results of operations. EBITDA is a non-GAAP financial measure that is defined as earnings before interest, taxes, depreciation and amortization. We believe EBITDA is a meaningful measure of operating performance as it gives management a consistent measurement tool for evaluating the operating activities of the business as a whole, as well as, the various operating units, before the effect of investing activities, interest and taxes. In addition, we believe EBITDA provides useful information to investors, analysts, lenders, and other interested parties because it excludes transactions that management considers unrelated to core business operations, thereby helping interested parties to more meaningfully evaluate, trend and analyze the operating performance of our business. We also use EBITDA for certain internal reporting purposes, and certain compensation targets may be based on EBITDA. Finally, certain covenants in our debt facility are based on EBITDA performance measures. EBITDA, as with all non-GAAP financial measures, should be considered only in conjunction with the comparable measures, as calculated and presented in accordance with GAAP, including net income.
Critical Accounting Policies
We prepare our financial statements in conformity with GAAP. We believe the following are our most critical accounting policies in that they are the most important to the portrayal of our financial condition and results of operations and require management’s most difficult, subjective or complex judgments.
Revenue Recognition
We recognize substantially all revenue at the time services are provided, and on a time and materials basis. In most cases, the consultant is our employee and all costs of employing the worker are our responsibility and are included in cost of revenue. Revenues generated when we permanently place an individual with a client are recorded on the date the individual begins employment with the client.
In addition and to a lesser extent, we are involved in fixed price or lump-sum engagements. The services we render under the relevant contracts generally require performance spanning more than one accounting period. We recognize revenue for these engagements under the proportional performance accounting model.
Allowance for Doubtful Accounts
We regularly monitor and assess our risk of not collecting amounts we are owed by our customers. This evaluation is based upon a variety of factors including, an analysis of amounts current and past due along with relevant history and facts particular to the customer. Based upon the results of this analysis, we record an allowance for uncollectible accounts for this risk. Our allowance for doubtful accounts, as a percentage of gross accounts receivable was 5.0%, 4.6% and 4.5% as of December 31, 2006, 2005 and 2004 respectively. As of December 31, 2006, a five-percentage point deviation in our allowance for doubtful accounts would have resulted in an increase or decrease to the allowance of $740,000. This analysis requires us to make significant estimates, and changes in facts and circumstances could result in material changes in the allowance for doubtful accounts.
Income Taxes
The provision for income taxes is based on income before taxes as reported in the Consolidated Statements of Operations. Deferred tax assets and liabilities are recognized for the expected future tax consequences of
16
events that have been included in the financial statements or tax returns. Under this method, deferred tax assets and liabilities are determined based on the differences between the financial statement carrying amounts and the tax basis of assets and liabilities using enacted tax rates in effect for the year in which the differences are expected to reverse. An assessment is made as to whether or not a valuation allowance is required to offset deferred tax assets. This assessment includes anticipating future income.
Significant management judgment is required in determining the provision for income taxes, deferred tax assets and liabilities and any valuation allowance recorded against our deferred tax assets. Management evaluates all available evidence to determine whether it is more likely than not that some portion or all of the deferred income tax assets will not be realized. The establishment and amount of a valuation allowance requires significant estimates and judgment and can materially affect our results of operations. Our effective tax rate may vary from period to period based, for example, on changes in estimated taxable income or loss, changes to the valuation allowance, changes to federal, state or foreign tax laws, completion of federal, state or foreign audits, deductibility of certain costs and expenses by jurisdiction, and as a result of acquisitions.
Our tax basis in tax-deductible goodwill is deducted in our income tax returns. Accordingly, we expect future tax deductions of $308.1 million associated with tax-deductible goodwill. While these deductions are expected to span the next fifteen years, approximately 75% are anticipated to be generated over the next five years. In addition, we have a net deferred tax asset as of December 31, 2006 and 2005. The components of our net deferred tax assets as well as other information on income taxes can be found in Footnote 7 to the Consolidated Financial Statements.
Impairment of Tangible and Intangible Assets
For acquisitions, we allocate the excess of the cost of the acquisition over the fair market value of the net tangible assets acquired first to identifiable intangible assets, if any, and then to goodwill. In connection with SFAS No. 142,Goodwill and Other Intangible Assets, we are required to perform goodwill impairment reviews, at least annually, utilizing a fair-value approach.
We performed valuation testing during the fourth quarters of 2004, 2005 and 2006 (our designated timing of the annual impairment test under SFAS No. 142) and did not incur any impairment. We plan to perform our next annual impairment review during the fourth quarter of 2007. An impairment review prior to our next scheduled annual review may be required if certain events occur, including lower than forecasted earnings levels for various reporting units. In addition, changes to other assumptions could significantly impact our estimate of the fair value of our reporting units. Such a change may result in a goodwill impairment charge, which could have a significant impact on the reportable segments that include the related reporting units and the Consolidated Financial Statements.
We used an equally blended value of a discounted cash flow analysis and market comparables analysis to arrive at fair value for SFAS No. 142. For the discounted cash flow analysis, significant assumptions included expected future revenue growth rates, reporting unit profit margins, working capital levels and a discount rate. The revenue growth rates and reporting unit profit margins are based, in part, on its expectation of a stable economic environment. Market comparables included a comparison of the market ratios and performance fundamentals from comparable companies. The use of these measurement criteria is consistent with the underlying concepts used in determining the fair value of a company or reportable unit under the market approach. The market ratios we used refer to the multiples of revenue and earnings of comparable companies and the performance fundamentals refer to the consideration of the effects of the differences in the operating metrics, i.e., growth rates, operating margins, gross margins, etc. on our value versus the comparable companies. Additional information on Goodwill can be found in Footnote 5 to the Consolidated Financial Statements.
We amortize the cost of identifiable intangible assets (either through acquisition or as part of intellectual property) over their estimated useful lives unless such lives are deemed indefinite. We review our long-lived
17
assets and identifiable intangibles for impairment whenever events or changes in circumstances indicate that the carrying amount of the asset may not be recoverable. In performing the review for recoverability, we estimate the future cash flows expected to result from the use of the asset and its eventual disposition. If the sum of the expected future cash flows (undiscounted and without interest charges) is less than the carrying amount of the asset, an impairment loss is recognized. Otherwise, an impairment loss is not recognized. Measurement of an impairment loss for long-lived assets and identifiable intangibles would be based on the fair value of the asset.
Share-Based Compensation
Under our employee and director share-based compensation plans, participants have received or may receive grants of stock options, stock appreciation rights, restricted stock, restricted stock units, and performance shares. For 2006, we have solely utilized restricted stock for our share-based awards. Historically, we have utilized both restricted stock and stock options.
Effective January 1, 2006, we adopted the provisions of SFAS 123R,Share-Based Payment, using the modified prospective transition method to all past awards outstanding and unvested as of the effective date of January 1, 2006; accordingly, prior periods have not been restated. SFAS 123R requires the recognition of expense only for awards that are expected to vest, rather than recording forfeitures when they occur as previously permitted. Our forfeiture rates are based mainly upon historical share-based compensation cancellations. However, if the actual number of forfeitures differs from those estimated by management, additional adjustments to compensation expense may be required in future periods. A one-percentage point deviation in the estimated forfeiture rates would have resulted in a $100,000 increase or decrease in compensation expense related to restricted stock units for the year ended December 31, 2006. Additional information on share-based compensation can be found in Footnote 9 to the Consolidated Financial Statements.
18
EXECUTIVE SUMMARY
In 2006, our consolidated revenue increased 11% and our consolidated operating income increased 32% compared to 2005. Revenue from our Professional Services businesses and businesses within our North American IT Services segment increased 16% and 10%, respectively, compared to 2005. We believe this growth was attributable to the performance of our sales and recruiting staff, acquisitions, and favorable macroeconomic conditions in both the United States and abroad. Revenue in our European IT Services segment was negatively impacted from our scaling back relationships with certain low-margin, high volume clients in the United Kingdom in order to focus on higher-margin clients in both the United Kingdom and continental Europe. This effort, which we started in 2005 and completed in 2006, resulted in a 300 basis point gross margin increase in our European IT Services segment compared to 2005. We believe revenue growth in our European IT Services segment will resume in 2007.
We target potential acquisitions that will either increase the geographic presence of our businesses or offer complementary service offerings. Our target acquisitions have generally ranged from $5 million to $25 million in annual revenue. From 2004 to 2006, we acquired the following businesses herein defined as the North American Professional Acquisitions, the North American IT Acquisitions, the European Professional Acquisitions, and the European IT Acquisition:
| | | | | | |
Name/Description | | Segment | | Business | | Year |
Garelli Wong | | North American Professional | | Accounting and Finance Staffing | | 2006 |
Pacioli Companies | | North American Professional | | Accounting and Finance Staffing | | 2005 |
Lillian Kloock | | North American Professional | | Accounting and Finance Staffing | | 2004 |
Accounting Alternatives | | North American Professional | | Accounting and Finance Staffing | | 2004 |
Accounting Solutions | | North American Professional | | Accounting and Finance Staffing | | 2004 |
Pharmacy Staffing Unit of Cardinal Health | | North American Professional | | Pharmacy Staffing | | 2006 |
Bilingual Therapies | | North American Professional | | Healthcare Staffing | | 2005 |
Management Search | | North American Professional | | Healthcare Staffing | | 2004 |
Sunbelt Staffing | | North American Professional | | Healthcare Staffing | | 2004 |
Legal Networks | | North American Professional | | Legal Staffing | | 2004 |
Alderson Court Reporting | | North American Professional | | Legal Staffing | | 2004 |
| | | |
Integrated Performance Systems | | North American IT | | Workforce Solutions | | 2006 |
Encore Development | | North American IT | | IT Solutions | | 2005 |
Pacioli Companies | | North American IT | | IT Solutions | | 2005 |
| | | |
Chronos International | | European Professional | | European Permanent Placement | | 2006 |
Corinthe Holding BV | | European Professional | | European Staffing | | 2006 |
| | | |
Netlogic | | European IT | | European IT Staffing | | 2006 |
We continue to believe that long-term opportunities for growth in the professional services market may be more robust than in the IT services market, and as a result, we continue to diversify our revenue base. Revenue from our Professional Services division represented 56% of consolidated revenue in 2006, compared to 54% in 2005 and 50% in 2004.
We continue to look for opportunities to increase gross margin along with increasing operating leverage within each segment. We were able to increase our staffing services gross margin 80 basis points to 24.0% in 2006 from 23.2% in 2005. Specifically within the European IT Services segment, our lowest gross margin segment, we are realizing the positive gross margin impact from scaling back relationships with certain low-margin, high-volume clients previously discussed. As we review gross margin trends for 2006, gross margin
19
has been aided by the percentage of revenue attributable to direct hire fees within each segment. Direct hire fees now represent 4.7% of revenue, up from 4.0% in 2005. In addition, the staffing services gross margins have been increasing in our North American Professional Services segment, our North American IT Services segment, and our European IT Services segment, while decreasing in our European Professional Services segment.
The following detailed analysis of operations should be read in conjunction with the 2006 Consolidated Financial Statements and related footnotes included elsewhere in this Form 10-K.
Results of Operations for the Three Years Ended December 31, 2006—Consolidated
Consolidated revenue was $1,876.6 million, $1,684.7 million, and $1,426.8 million in 2006, 2005 and 2004, respectively, increasing by 11.4% and 18.1% in 2006 and 2005, respectively.
Consolidated gross profit was $517.0 million, $442.4 million, and $360.8 million in 2006, 2005 and 2004, respectively, increasing by 16.9% and by 22.6% in 2006 and 2005, respectively. The consolidated gross margin was 27.5%, 26.3% and 25.3% in 2006, 2005 and 2004, respectively.
Consolidated operating expenses were $402.5 million, $355.4 million, and $308.7 million, in 2006, 2005 and 2004, respectively, increasing by 13.3% and 15.1% in 2006 and 2005, respectively. General and administrative (G&A) expenses, which are included in operating expenses, were $386.6 million, $340.1 million, and $293.8 million, in 2006, 2005 and 2004, respectively, increasing by 13.7% and 15.8% in 2006 and 2005, respectively.
Included in consolidated operating expenses for 2004 was an $897,000 recapture for exit costs incurred in 2002. This exit costs recapture related to the settlement of certain abandoned office space earlier than what we originally anticipated.
Unallocated corporate expenses, included in consolidated operating expenses, pertain to certain functions, such as executive management, accounting, administration, tax, and treasury that are not attributable to our operating units. Unallocated corporate expenses were $28.1 million, $25.4 million and $23.3 million, in 2006, 2005 and 2004, respectively, increasing 10.6% and 9.0% in 2006 and 2005, respectively. As a percentage of revenue, unallocated corporate expenses were 1.5% for 2006 and 2005, and 1.6% for 2004. The increase in unallocated corporate expense in both 2006 and 2005 was due primarily to a combination of higher compensation and benefits costs, and an increase in non-cash compensation expense from our use of restricted stock.
Consolidated operating income was $114.5 million, $87.0 million, and $52.1 million in 2006, 2005 and 2004, respectively, increasing by 31.6% and 67.0% in 2006 and 2005, respectively. Operating income as a percentage of revenue was 6.1%, 5.2% and 3.7% in 2006, 2005 and 2004, respectively.
Consolidated other income, net, was $6.0 million, $3.8 million, and $1.4 million in 2006, 2005 and 2004, respectively. Other income, net, primarily includes interest income related to our investments and cash on hand, net of interest expense related to notes issued in connection with acquisitions and fees and interest on our credit facility.
The consolidated income tax provision was $45.3 million, $31.2 million, and $18.2 million in 2006, 2005 and 2004, respectively. The effective tax rate was 37.6%, 34.4%, and 33.9%, for 2006, 2005 and 2004, respectively. Included in the 2006, 2005 and 2004 tax provisions were $1.1 million, $3.3 million and $1.3 million, respectively, of tax benefits due primarily to valuation allowance reductions associated with state net operating loss and foreign tax credit carryforwards, and favorable settlements of certain state income tax audits.
Consolidated net income was $75.2 million, $59.6 million and $35.4 million, in 2006, 2005, and 2004, respectively.
20
Results of Operations for the Three Years Ended December 31, 2006 – By Business Segment
Professional Services division
North American Professional Services segment
Revenue in our North American Professional Services segment was $617.2 million, $537.3 million, and $429.6 million, for 2006, 2005 and 2004, respectively, increasing by 14.9% and by 25.1% in 2006 and 2005, respectively. North American Professional Acquisitions contributed $33.2 million, $47.5 million, and $60.6 million in revenue in 2006, 2005 and 2004, respectively. The increase in revenue for both 2006 and 2005 was due primarily to revenue from acquisitions and internal growth, most notably in the segment’s Soliant Health and Entegee business units.
Revenue contribution from the North American Professional Services businesses for 2006, 2005 and 2004 were as follows:
| | | | | | | | | |
| | | 2006 | | | 2005 | | | 2004 | |
Entegee | | 44.9 | % | | 45.7 | % | | 49.6 | % |
Special Counsel | | 22.2 | | | 24.1 | | | 24.5 | |
Accounting Principals | | 16.9 | | | 17.6 | | | 13.3 | |
Soliant Health | | 16.0 | | | 12.6 | | | 11.7 | |
Other | | — | | | — | | | 0.9 | |
Gross profit in our North American Professional Services segment was $189.1 million, $160.4 million, and $123.8 million, for 2006, 2005 and 2004, respectively, increasing by 17.9% and by 29.6% in 2006 and 2005, respectively. North American Professional Acquisitions contributed $10.7 million, $17.0 million, and $19.7 million in gross profit in 2006, 2005 and 2004, respectively. Gross margin in our North American Professional services segment was 30.6%, 29.9% and 28.8% in 2006, 2005 and 2004, respectively. While direct hire fees and gross margins from the segment’s staffing services increased in both 2006 and 2005, the 2006 increase in gross margin was due primarily to the improved staffing services gross margins. Conversely, the 2005 increase was due primarily to an increase in direct hire fees. Direct hire fees, which generate higher margin, increased to 5.9% of the segment’s revenue in 2006, from 5.6% and 4.5% in 2005 and 2004, respectively.
G&A expenses in our North American Professional Services segment were $125.1 million, $110.8 million, and $88.4 million, in 2006, 2005 and 2004, respectively, increasing by 12.9% and by 25.3% in 2006 and 2005, respectively. As a percentage of revenue, G&A expenses were 20.3% for 2006, and 20.6% for 2005 and 2004. The increase in G&A expenses for both 2006 and 2005 was due primarily to the increase in compensation expense related to the increases in the segment’s revenue and additional G&A from North American Professional Acquisitions.
Operating income was $59.2 million, $44.5 million, and $30.9 million in 2006, 2005 and 2004, respectively, increasing by 33.0% and by 44.0% in 2006 and 2005, respectively. Operating income as a percentage of revenue was 9.6%, 8.3% and 7.2% in 2006, 2005 and 2004, respectively.
European Professional Services segment
Revenue in our European Professional Services segment was $431.4 million, $364.8 million, and $289.1 million, for 2006, 2005 and 2004, respectively, increasing by 18.3% and by 26.2% in 2006 and 2005, respectively. Changes in foreign currency exchange rates increased revenue by $5.3 million from 2005 to 2006 and reduced revenue by $2.7 million from 2004 to 2005. European Professional Acquisitions contributed $22.8 million in revenue in 2006. The increase in revenue for both 2006 and 2005 was due primarily to the increased demand for our services and the execution of our acquisition strategy.
21
Gross profit in our European Professional Services segment was $123.1 million, $104.3 million, and $80.4 million, in 2006, 2005 and 2004, respectively, increasing by 18.0% and by 29.7% in 2006 and 2005, respectively. Changes in foreign currency exchange rates increased gross profit by $1.5 million from 2005 to 2006 and reduced gross profit by $770,000 from 2004 to 2005. European Professional Acquisitions contributed $10.9 million in gross profit in 2006. Gross margin in our European Professional Services segment was 28.5%, 28.6%, and 27.8% in 2006, 2005 and 2004, respectively. The decrease in gross margin in 2006 and the increase in gross margin in 2005 was due primarily to the mix of staffing services provided by this segment and our ability to manage the bill and pay rate spread for these services. We were better able to manage the bill and pay rate spread in 2005 thus resulting in improved gross margins. The 2006 reduction in gross margins from the segment’s staffing services was mostly offset by direct hire fees, as direct hire fees increased to 8.5% of the segment’s revenue in 2006, from 7.6% and 7.3% in 2005 and 2004, respectively.
G&A expenses in our European Professional Services segment were $88.1 million, $76.3 million, and $65.6 million, in 2006, 2005 and 2004, respectively, increasing by 15.5% and by 16.3% in 2006 and 2005, respectively. As a percentage of revenue, G&A expenses were 20.4%, 20.9%, and 22.7%, for 2006, 2005 and 2004, respectively. The increase in G&A expenses for both 2006 and 2005 was due primarily to the increase in compensation expense related to the increases in the segment’s revenue and additional G&A expenses from the European Professional Acquisitions.
Operating income was $31.9 million, $26.1 million, and $13.2 million in 2006, 2005 and 2004, respectively, increasing by 22.2% and by 97.7% in 2006 and 2005, respectively. Operating income as a percentage of revenue was 7.4%, 7.2% and 4.6% in 2006, 2005 and 2004, respectively.
IT Services division
North American IT Services segment
Revenue in our North American IT Services segment was $561.0 million, $510.5 million, and $459.5 million, for 2006, 2005 and 2004, respectively, increasing by 9.9% and 11.1% in 2006 and 2005, respectively. North American IT Acquisitions contributed $6.6 million and $4.8 million in revenue in 2006 and 2005, respectively. The increase in revenue in both 2006 and 2005 was due primarily to increased spending on IT initiatives by our clients and our investment in additional sales and recruiting personnel.
Revenue within the North American IT Services segment is generated primarily fromModis, as it generated 84.2%, 85.4% and 82.8% of the segment’s revenue for 2006, 2005 and 2004, respectively.Idea Integration andBeeline are responsible for the remainder of this segment’s revenue.
Gross profit in our North American IT Services segment was $162.0 million, $142.2 million, and $123.8 million, in 2006, 2005 and 2004, respectively, increasing by 13.9% and 14.9% in 2006 and 2005, respectively. North American IT Acquisitions contributed $2.8 million and $1.4 million in gross profit in 2006 and 2005, respectively. Gross margin in our North American IT Services segment was 28.9%, 27.9% and 26.9% in 2006, 2005 and 2004, respectively. We were better able to manage the bill and pay rate spread and decrease our reliance on clients with national vendor lists in both 2006 and 2005, resulting in improved gross margins fromModis’staffing services. Revenue from middle market clients tend to generate higher gross margin as middle market clients do not generally have the same level of buying power as clients with national vendor lists. In addition, direct hire fees and fees generated from ourBeeline unit, which both generate higher margin, increased in both 2006 and 2005.
G&A expenses in our North American IT Services segment were $110.8 million, $98.1 million, and $87.2 million, in 2006, 2005 and 2004, respectively, increasing by 12.9% and 12.5% in 2006 and 2005, respectively. As a percentage of revenue, G&A expenses were 19.8%, 19.2%, and 19.0%, for 2006, 2005 and 2004,
22
respectively. The increase in G&A expenses for both 2006 and 2005 was due primarily to the increase in compensation expense related to this segment’s increases in revenue and our investment in additional sales and recruiting personnel.
Operating income was $45.1 million, $37.3 million, and $28.0 million in 2006, 2005 and 2004, respectively, increasing by 20.9% and by 33.2% in 2006 and 2005, respectively. Operating income as a percentage of revenue was 8.0%, 7.3% and 6.1% in 2006, 2005 and 2004, respectively.
European IT Services segment
Revenue in our European IT Services segment was $267.1 million, $272.2 million, and $248.8 million, for 2006, 2005 and 2004, respectively, decreasing by 1.9% in 2006 and increasing by 9.4% in 2005. Changes in foreign currency exchange rates increased revenue by $3.3 million from 2005 to 2006 and reduced revenue by $2.0 million from 2004 to 2005. The European IT Acquisition contributed $2.7 million in revenue in 2006. The decrease in revenue in 2006 was due primarily to the scaling back of relationships with certain low-margin, high-volume clients which we began in 2005 and completed in 2006. The increase in revenue in 2005 was due to increased spending on IT initiatives by our UK market clients.
Gross profit in our European IT Services segment was $42.8 million, $35.5 million, $32.8 million, in 2006, 2005 and 2004, respectively, increasing by 20.6% and 8.2% in 2006 and 2005, respectively. Changes in foreign currency exchange rates increased gross profit by $523,000 from 2005 to 2006, and reduced gross profit by $262,000 from 2004 to 2005. The IT European Acquisition contributed $788,000 in gross profit in 2006. Gross margin in our European IT Services segment was 16.0%, 13.0%, and 13.2% in 2006, 2005 and 2004, respectively. The increase in gross margin in 2006 was due primarily to the positive margin impact from the scaling back of relationships with certain low-margin, high-volume clients in the United Kingdom in order to focus on higher-margin clients in both the United Kingdom and continental Europe. The decrease in gross margin in 2005 was due primarily to a higher proportion of the segment’s growth being in the UK market, where margins are generally lower than those in the continental European market.
G&A expenses in our European IT Services segment were $34.4 million, $29.5 million, and $29.2 million, in 2006, 2005 and 2004, respectively, increasing by 16.6% and 1.0% in 2006 and 2005, respectively. As a percentage of revenue, G&A expenses were 12.9%, 10.8%, and 11.7%, for 2006, 2005 and 2004, respectively. The increase in G&A expenses in 2006 and 2005 was due primarily to the increase in compensation expense related to the increases in the segment’s gross profit.
Operating income was $6.5 million, $4.5 million, and $2.4 million in 2006, 2005 and 2004, respectively, increasing by 44.4% and by 87.5% in 2006 and 2005, respectively. Operating income as a percentage of revenue was 2.4%, 1.7% and 1.0% in 2006, 2005 and 2004, respectively.
LIQUIDITY AND CAPITAL RESOURCES
Overview
We intend to generate stockholder value through strategic investments in our existing businesses, acquisitions, and stock repurchases, as appropriate. Changes to our liquidity have historically been due primarily to the net effect of: (i) funds generated by operations and stock option exercises; and (ii) funds used for operations, acquisitions, repurchases of common stock and capital expenditures. While there can be no assurances in this regard, we believe that funds provided by operations and our current cash balances will be sufficient to meet our presently anticipated needs for working capital, capital expenditures, repurchases of common stock and acquisitions for at least the next 12 months.
23
In 2006, cash of $113.3 million provided from operating activities and the effect of changes in foreign currency exchange rates, exceeded the $83.6 million used in investing and financing activities. Our net increase of cash in 2006 was due primarily to a higher level of cash provided by operations and the positive translation impact from changes in foreign currency exchange rates. In 2005, cash of $91.9 million provided from operating activities, exceeded the $55.4 million used in investing activities, financing activities, and the effect of changes in foreign currency exchange rates. Our net increase of cash in 2005 was due primarily to a higher level of cash provided by operations and less cash spent on acquisitions. In 2004, cash of $71.3 million used in both investing and financing activities exceeded the $53.0 million of cash provided from operating activities and the effect of changes in foreign currency exchange rates. The below table highlights working capital and cash and cash equivalents as of December 31, 2006 and 2005, respectively:
| | | | | | |
(amounts in millions) | | 2006 | | 2005 |
Working capital | | $ | 318.9 | | $ | 279.9 |
Cash and cash equivalents | | | 172.7 | | | 143.0 |
Operating Cash Flows
For 2006, 2005, and 2004, we generated $106.6 million, $91.9 million, and $50.7 million of cash flow from operations, respectively. The increase in cash flow from operations in 2006 and 2005 was due primarily to our increased level of income, given that we were able to maintain our leverage of working capital during this growth. Cash flow from operations in 2006 included a $12.9 million outflow from excess tax benefits on share-based awards. SFAS 123R requires tax benefits resulting from share-based awards in excess of compensation cost recognized to be classified as financing cash flows in the Consolidated Statement of Cash Flows. Prior to our adoption of SFAS 123R on January 1, 2006, tax benefits resulting from share-based awards were classified as operating cash flows. See Footnote 9 to the Consolidated Financial Statements for a further discussion of SFAS 123R.
Investing Cash Flows
For 2006, we used $57.7 million of cash for investing activities, including $44.2 million for acquisitions, net of cash acquired, and $13.6 million for capital expenditures.
For 2005, we used $25.5 million of cash for investing activities, including $17.7 million for acquisitions, net of cash acquired, and $11.5 million for capital expenditures, net of $3.7 million generated from the sale of certain assets within our North American IT Services segment.
For 2004, we used $57.3 million of cash for investing activities, including $50.2 million for acquisitions, net of cash acquired, and $9.6 million for capital expenditures, net of $2.4 million generated from the sale of certain assets of our then executive search brand.
We anticipate that capital expenditures for furniture and equipment, including improvements to our management information and operating systems, during the next twelve months, will be approximately $10 to $15 million.
Financing Cash Flows
For 2006, we used $25.9 million of cash for financing activities, consisting primarily of $45.0 million for the repurchase of common stock and $7.6 million for the settlement of equity related grants, net of $14.8 million generated from stock option exercises and $12.9 million from excess tax benefits from share-based awards.
For 2005, we used $25.7 million of cash for financing activities, primarily $37.3 million used for the repurchase of common stock and $2.5 million used for repayments on indebtedness, net of $14.7 million generated from stock option exercises.
24
For 2004, we used $14.0 million of cash for financing activities, consisting primarily of $30.9 million for the repurchase of common stock, net of $18.3 million generated from stock option exercises.
Our Board of Directors has authorized certain repurchases of our common stock. For 2006, we repurchased 3.2 million shares at a cost of $45.0 million. As of February 15, 2007, we have repurchased a total of 12.0 million shares at a cost of $122.2 million under this plan. We anticipate that we will continue to purchase shares under this authorization in the future as we have approximately $45 million remaining under this authorization as of February 15, 2007. There is no expiration date for this authorization.
Indebtedness, Contractual Obligations, and Commercial Commitments of the Company
The following are contractual cash obligations and other commercial commitments at December 31, 2006:
| | | | | | | | | | | | | | | |
| | | Payments Due by Period |
(amounts in thousands) | | Total | | Less than
1 Year | | 1-3
Years | | 4-5
Years | | After 5
Years |
Contractual cash obligations | | | | | | | | | | | | | | | |
Operating leases | | $ | 78,438 | | $ | 18,541 | | $ | 40,185 | | $ | 12,497 | | $ | 7,215 |
Other | | | 4,483 | | | 4,483 | | | — | | | — | | | — |
| | | | | | | | | | | | | | | |
Total contractual cash obligations | | $ | 82,921 | | $ | 23,024 | | $ | 40,185 | | $ | 12,497 | | $ | 7,215 |
| | | | | | | | | | | | | | | |
| |
| | | Amount of Commitment Expiration per Period |
| | | Total | | Less than
1 Year | | 1-3
Years | | 4-5
Years | | After 5
Years |
Standby letters of credit | | $ | 11,063 | | $ | 11,063 | | $ | — | | $ | — | | $ | — |
| | | | | | | | | | | | | | | |
Total commercial commitments | | $ | 11,063 | | $ | 11,063 | | $ | — | | $ | — | | $ | — |
| | | | | | | | | | | | | | | |
In the fourth quarter of 2006, we closed on a $250 million revolving credit facility which replaced an expiring $150 million facility. Our credit facility is syndicated to a group of leading financial institutions and contains certain financial and non-financial covenants relating to our operations, including maintaining certain financial ratios. Repayment of the credit facility is guaranteed by substantially all of our subsidiaries. The facility expires in November 2011. To date, there have been no borrowings outstanding under this facility, other than $7.6 million of standby letters of credit for certain operational matters.
New Accounting Pronouncements
In July 2006, the FASB issued FASB Interpretation No. (“FIN”) 48Accounting for Uncertainty in Income Taxes—an interpretation of FASB Statement No. 109 (“SFAS 109”). FIN 48 clarifies the accounting for uncertainty in income taxes recognized in accordance with SFAS 109. This interpretation prescribes a recognition threshold and measurement attribute for the financial statement recognition and measurement of a tax position taken or expected to be taken in a tax return. Additionally, FIN 48 provides guidance on recognition, classification, and disclosure of tax positions. The provisions of FIN 48 are effective for fiscal years beginning after December 15, 2006, with the cumulative effect of initially adopting this interpretation being recorded as an adjustment to the opening balance of retained earnings. While we are in the process of finalizing the impact FIN 48 will have on our consolidated financial statements, we do not expect its adoption to have a material effect on them.
In September 2006, the FASB issued SFAS No. 157,Fair Value Measurements (“SFAS 157”), which defines fair value, establishes a framework for measuring fair value in generally accepted accounting principals, and expands disclosures about fair value measurements. SFAS 157 does not require any new fair value measurements, but rather clarifies the application of other accounting pronouncements that require or permit fair
25
value measurements. The provisions of SFAS 157 are effective for financial statements issued for fiscal years beginning after November 15, 2007, and interim periods within those years. Earlier application is encouraged, provided the reporting entity has not yet issued financial statements for that fiscal year. We are currently evaluating the impact of SFAS 157, but management does not expect the adoption of SFAS 157 to have a material effect on our consolidated financial statements.
In September 2006, the Securities and Exchange Commission issued Staff Accounting Bulletin No. 108,Considering the Effects of Prior Year Misstatement when Quantifying Misstatements in Current Year Financial Statements(“SAB 108”). SAB 108 provides guidance which is meant to eliminate the diversity of practice in quantifying identified misstatements by putting forward a single quantification framework to be used by all public companies. The Company adopted the provisions of SAB 108 in the fourth quarter of 2006 as its provisions were effective for fiscal years ending on or after November 15, 2006. The adoption of SAB 108 did not have a material impact on our consolidated financial statements.
| ITEM 7A. QUANTITATIVE | AND QUALITATIVE DISCLOSURES ABOUT MARKET RISK |
The following assessment of our market risks does not include uncertainties that are either nonfinancial or nonquantifiable, such as political, economic, tax and credit risks.
Our exposure to market risk for changes in interest rates relates primarily to debt obligations under the credit facility, if any, and to our investments. We have an investment portfolio consisting of cash and cash equivalents including deposits in banks, money market funds, and short-term investments with maturities of 90 days or less. We are adverse to principal loss and seek to preserve our invested funds by placing these funds with high credit quality issuers. We evaluate our invested funds to respond appropriately to a reduction in the credit rating of any investment issuer or guarantor.
We are exposed to the impact of foreign currency fluctuations. Changes in foreign currency exchange rates impact translations of foreign denominated assets and liabilities into U.S. dollars and future earnings and cash flows from transactions denominated in different currencies. Our international operations generated approximately 39% of 2006 consolidated revenue, approximately 84% of which was from the United Kingdom. As of December 31, 2006, we have not entered into any foreign currency derivative instruments.
Our international operations transact business in their functional currency. As a result, fluctuations in the value of foreign currencies against the U.S. dollar have an impact on reported results. Revenues and expenses denominated in foreign currencies are translated into U.S dollars at monthly average exchange rates prevailing during the period. Consequently, as the value of the U.S. dollar changes relative to the currencies of our non-U.S. markets, our reported results vary.
Fluctuations in exchange rates impact the U.S. dollar amount of stockholders’ equity. The assets and liabilities of our non-U.S. subsidiaries are translated into U.S. dollars at the exchange rate in effect at the end of a reporting period. The resulting translation adjustments are recorded in Stockholders’ equity, as a component of Accumulated other comprehensive income, in our Consolidated Balance Sheets.
We are exposed to minimal price fluctuations on equity mutual funds that are contained within our company-owned life insurance. The cash surrender value of the company-owned life insurance was $12.2 million at December 31, 2006, and is included in Other assets, net in the consolidated Balance Sheets. Changes to the cash surrender value are recognized in Other income, net on our Consolidated Statements of Operations. This company-owned life insurance is intended to be used to settle our obligations of deferred compensation. Therefore, a corresponding employee liability is included in ‘Other’ in the Liabilities section of the Consolidated Balance Sheets.
26
| ITEM 8. | FINANCIAL STATEMENTS AND SUPPLEMENTARY DATA |
(a) Consolidated Financial Statements: The following consolidated financial statements are included in this Annual Report on Form 10-K:
| | |
| | | Page |
| |
Report of Independent Registered Certified Public Accounting Firm | | 28 |
| |
Management’s Report on Internal Control Over Financial Reporting | | 30 |
| |
Consolidated Balance Sheets at December 31, 2006 and 2005 | | 31 |
| |
Consolidated Statements of Operations for the years ended December 31, 2006, 2005, and 2004 | | 32 |
| |
Consolidated Statements of Stockholders’ Equity for the years ended December 31, 2006, 2005, and 2004 | | 33 |
| |
Consolidated Statements of Cash Flows for the years ended December 31, 2006, 2005, and 2004 | | 34 |
| |
Notes to Consolidated Financial Statements | | 36 |
| |
Schedule II—Valuation & Qualifying Accounts | | 53 |
27
Report of Independent Registered Certified Public Accounting Firm
To the Board of Directors and Stockholders’ of MPS Group, Inc.:
We have completed integrated audits of MPS Group, Inc’s consolidated financial statements and of its internal control over financial reporting as of December 31, 2006, in accordance with the standards of the Public Company Accounting Oversight Board (United States). Our opinions, based on our audits, are presented below.
Consolidated financial statements and financial statement schedule
In our opinion, the consolidated financial statements listed in the accompanying index present fairly, in all material respects, the financial position of MPS Group, Inc and its subsidiaries at December 31, 2006 and 2005, and the results of their operations and their cash flows for each of the three years in the period ended December 31, 2006 in conformity with accounting principles generally accepted in the United States of America. In addition, in our opinion, the financial statement schedule listed in the accompanying index presents fairly, in all material respects, the information set forth therein when read in conjunction with the related consolidated financial statements. These financial statements and financial statement schedule are the responsibility of the Company’s management. Our responsibility is to express an opinion on these financial statements and financial statement schedule based on our audits. We conducted our audits of these statements in accordance with the standards of the Public Company Accounting Oversight Board (United States). Those standards require that we plan and perform the audit to obtain reasonable assurance about whether the financial statements are free of material misstatement. An audit of financial statements includes examining, on a test basis, evidence supporting the amounts and disclosures in the financial statements, assessing the accounting principles used and significant estimates made by management, and evaluating the overall financial statement presentation. We believe that our audits provide a reasonable basis for our opinion.
Internal control over financial reporting
Also, in our opinion, management’s assessment, included in Management’s Report on Internal Control over Financial Reporting appearing under Item 8, that the Company maintained effective internal control over financial reporting as of December 31, 2006 based on criteria established inInternal Control—Integrated Framework issued by the Committee of Sponsoring Organizations of the Treadway Commission (COSO), is fairly stated, in all material respects, based on those criteria. Furthermore, in our opinion, the Company maintained, in all material respects, effective internal control over financial reporting as of December 31, 2006, based on criteria established inInternal Control—Integrated Framework issued by the COSO. The Company’s management is responsible for maintaining effective internal control over financial reporting and for its assessment of the effectiveness of internal control over financial reporting. Our responsibility is to express opinions on management’s assessment and on the effectiveness of the Company’s internal control over financial reporting based on our audit. We conducted our audit of internal control over financial reporting in accordance with the standards of the Public Company Accounting Oversight Board (United States). Those standards require that we plan and perform the audit to obtain reasonable assurance about whether effective internal control over financial reporting was maintained in all material respects. An audit of internal control over financial reporting includes obtaining an understanding of internal control over financial reporting, evaluating management’s assessment, testing and evaluating the design and operating effectiveness of internal control, and performing such other procedures as we consider necessary in the circumstances. We believe that our audit provides a reasonable basis for our opinions.
A company’s internal control over financial reporting is a process designed to provide reasonable assurance regarding the reliability of financial reporting and the preparation of financial statements for external purposes in accordance with generally accepted accounting principles. A company’s internal control over financial reporting includes those policies and procedures that (i) pertain to the maintenance of records that, in reasonable detail,
28
accurately and fairly reflect the transactions and dispositions of the assets of the company; (ii) provide reasonable assurance that transactions are recorded as necessary to permit preparation of financial statements in accordance with generally accepted accounting principles, and that receipts and expenditures of the company are being made only in accordance with authorizations of management and directors of the company; and (iii) provide reasonable assurance regarding prevention or timely detection of unauthorized acquisition, use, or disposition of the company’s assets that could have a material effect on the financial statements.
Because of its inherent limitations, internal control over financial reporting may not prevent or detect misstatements. Also, projections of any evaluation of effectiveness to future periods are subject to the risk that controls may become inadequate because of changes in conditions, or that the degree of compliance with the policies or procedures may deteriorate.
PricewaterhouseCoopers LLP
Jacksonville, Florida
February 28, 2007
29
Management’s Report on Internal Control over Financial Reporting
Management of MPS Group, Inc. is responsible for establishing and maintaining adequate internal control over financial reporting, as such term is defined in Rules 13a-15(f) and 15d-15(f) under the Securities Exchange Act of 1934.
Because of its inherent limitations, internal control over financial reporting may not prevent or detect misstatements. Also, projections of any evaluation of effectiveness to future periods are subject to the risk that controls may become inadequate because of changes in conditions, or that the degree of compliance with the policies or procedures may deteriorate.
Management assessed the effectiveness of the Company’s internal control over financial reporting as of December 31, 2006. In making this assessment, management used the criteria set forth inInternal Control–Integrated Framework issued by the Committee of Sponsoring Organizations of the Treadway Commission.
Based on that assessment, management concluded that the Company’s internal control over financial reporting was effective as of December 31, 2006.
Management’s assessment of the effectiveness of the Company’s internal control over financial reporting has been audited by PricewaterhouseCoopers LLP, an independent registered certified public accounting firm, as stated in their report which is included herein.
30
MPS Group, Inc. and Subsidiaries
Consolidated Balance Sheets
| | | | | | | | |
(amounts in thousands) | | December 31, 2006 | | | December 31, 2005 | |
| ASSETS | | | | | | | | |
Current assets: | | | | | | | | |
Cash and cash equivalents | | $ | 172,692 | | | $ | 142,951 | |
Accounts receivable, net of allowance of $14,766 and $11,872 | | | 278,438 | | | | 244,506 | |
Prepaid expenses | | | 7,997 | | | | 7,131 | |
Deferred income taxes | | | 2,997 | | | | 5,749 | |
Other | | | 17,798 | | | | 16,091 | |
| | | | | | | | |
Total current assets | | | 479,922 | | | | 416,428 | |
Furniture, equipment, and leasehold improvements, net | | | 28,472 | | | | 24,542 | |
Goodwill, net | | | 602,112 | | | | 545,363 | |
Deferred income taxes | | | 11,165 | | | | 27,277 | |
Other assets, net | | | 20,608 | | | | 14,396 | |
| | | | | | | | |
Total assets | | $ | 1,142,279 | | | $ | 1,028,006 | |
| | | | | | | | |
| | |
| LIABILITIES AND STOCKHOLDERS’ EQUITY | | | | | | | | |
Current liabilities: | | | | | | | | |
Accounts payable and accrued expenses | | $ | 81,069 | | | $ | 65,869 | |
Accrued payroll and related taxes | | | 67,186 | | | | 58,711 | |
Income taxes payable | | | 12,788 | | | | 11,989 | |
| | | | | | | | |
Total current liabilities | | | 161,043 | | | | 136,569 | |
Other | | | 17,938 | | | | 15,397 | |
| | | | | | | | |
Total liabilities | | | 178,981 | | | | 151,966 | |
| | | | | | | | |
Commitments and contingencies (Note 6 and 7) | | | | | | | | |
Stockholders’ equity: | | | | | | | | |
Preferred stock, $.01 par value; 10,000,000 shares authorized; no shares issued | | | — | | | | — | |
Common stock, $.01 par value; 400,000,000 shares authorized; 114,902,247 and 111,169,227 shares issued, respectively | | | 1,149 | | | | 1,112 | |
Additional contributed capital | | | 716,980 | | | | 687,661 | |
Retained earnings | | | 332,777 | | | | 257,563 | |
Accumulated other comprehensive income | | | 42,196 | | | | 11,560 | |
Deferred stock compensation | | | — | | | | (4,630 | ) |
Treasury stock, at cost (12,466,236 and 8,834,114 shares, respectively) | | | (129,804 | ) | | | (77,226 | ) |
| | | | | | | | |
Total stockholders’ equity | | | 963,298 | | | | 876,040 | |
| | | | | | | | |
Total liabilities and stockholders’ equity | | $ | 1,142,279 | | | $ | 1,028,006 | |
| | | | | | | | |
See accompanying notes to consolidated financial statements.
31
MPS Group, Inc. and Subsidiaries
Consolidated Statements of Operations
| | | | | | | | | | |
| | | Years Ended December 31, | |
(amounts in thousands except per common share amounts) | | 2006 | | 2005 | | 2004 | |
Revenue | | $ | 1,876,622 | | $ | 1,684,699 | | $ | 1,426,842 | |
Cost of revenue | | | 1,359,580 | | | 1,242,331 | | | 1,066,055 | |
| | | | | | | | | | |
Gross profit | | | 517,042 | | | 442,368 | | | 360,787 | |
| | | | | | | | | | |
Operating expenses: | | | | | | | | | | |
General and administrative | | | 386,629 | | | 340,065 | | | 293,776 | |
Depreciation and intangibles amortization | | | 15,869 | | | 15,317 | | | 15,775 | |
Exit recapture | | | — | | | — | | | (897 | ) |
| | | | | | | | | | |
Total operating expenses | | | 402,498 | | | 355,382 | | | 308,654 | |
| | | | | | | | | | |
Operating income | | | 114,544 | | | 86,986 | | | 52,133 | |
Other income, net | | | 5,991 | | | 3,799 | | | 1,437 | |
| | | | | | | | | | |
Income before provision for income taxes | | | 120,535 | | | 90,785 | | | 53,570 | |
Provision for income taxes | | | 45,321 | | | 31,188 | | | 18,150 | |
| | | | | | | | | | |
Net income | | $ | 75,214 | | $ | 59,597 | | $ | 35,420 | |
| | | | | | | | | | |
Basic net income per common share | | $ | 0.74 | | $ | 0.59 | | $ | 0.34 | |
| | | | | | | | | | |
Average common shares outstanding, basic | | | 101,340 | | | 101,719 | | | 102,804 | |
| | | | | | | | | | |
Diluted net income per common share | | $ | 0.72 | | $ | 0.56 | | $ | 0.33 | |
| | | | | | | | | | |
Average common shares outstanding, diluted | | | 104,090 | | | 105,832 | | | 106,842 | |
| | | | | | | | | | |
See accompanying notes to consolidated financial statements.
32
MPS Group, Inc. and Subsidiaries
Consolidated Statements of Stockholders’ Equity
| | | | | | | | | | | | | | | | | | | | | | | | | | | | | | |
| | | Common Stock | | | Additional
Contributed
Capital | | | Retained
Earnings | | Accumulated
Other
Comprehensive
Income (Loss) | | | Deferred
Stock
Compensation | | | Treasury
Stock | | | Total | |
(amounts in thousands except common share amounts) | | Shares | | | Amount | | | | | | | |
Balance, December 31, 2003 | | 104,576,204 | | | $ | 1,046 | | | $ | 634,492 | | | $ | 162,546 | | $ | 6,933 | | | $ | (2,495 | ) | | $ | (9,060 | ) | | $ | 793,462 | |
Comprehensive Income: | | | | | | | | | | | | | | | | | | | | | | | | | | | | | | |
Net income | | — | | | | — | | | | — | | | | 35,420 | | | — | | | | — | | | | — | | | | | |
Foreign currency translation | | — | | | | — | | | | — | | | | — | | | 11,564 | | | | — | | | | — | | | | | |
Total comprehensive income | | — | | | | — | | | | — | | | | — | | | — | | | | — | | | | — | | | | 46,984 | |
Exercise of stock options and related tax benefit | | 3,283,337 | | | | 33 | | | | 23,454 | | | | — | | | — | | | | — | | | | — | | | | 23,487 | |
Purchase of treasury stock | | — | | | | — | | | | — | | | | — | | | — | | | | — | | | | (30,882 | ) | | | (30,882 | ) |
Issuance of restricted stock | | 575,000 | | | | 6 | | | | 6,494 | | | | — | | | — | | | | (6,500 | ) | | | — | | | | — | |
Share-based plans expense | | — | | | | — | | | | — | | | | — | | | — | | | | 2,612 | | | | — | | | | 2,612 | |
| | | | | | | | | | | | | | | | | | | | | | | | | | | | | | |
Balance, December 31, 2004 | | 108,434,541 | | | | 1,085 | | | | 664,440 | | | | 197,966 | | | 18,497 | | | | (6,383 | ) | | | (39,942 | ) | | | 835,663 | |
Comprehensive Income: | | | | | | | | | | | | | | | | | | | | | | | | | | | | | | |
Net income | | — | | | | — | | | | — | | | | 59,597 | | | — | | | | — | | | | — | | | | | |
Foreign currency translation | | — | | | | — | | | | — | | | | — | | | (6,937 | ) | | | — | | | | — | | | | | |
Total comprehensive income | | — | | | | — | | | | — | | | | — | | | — | | | | — | | | | — | | | | 52,660 | |
Exercise of stock options and related tax benefit | | 2,584,186 | | | | 26 | | | | 21,592 | | | | — | | | — | | | | — | | | | — | | | | 21,618 | |
Purchase of treasury stock | | — | | | | — | | | | — | | | | — | | | — | | | | — | | | | (37,284 | ) | | | (37,284 | ) |
Issuance of restricted stock | | 221,000 | | | | 2 | | | | 2,412 | | | | — | | | — | | | | (2,414 | ) | | | — | | | | — | |
Cancellation of restricted stock | | (70,500 | ) | | | (1 | ) | | | (783 | ) | | | — | | | — | | | | 459 | | | | — | | | | (325 | ) |
Share-based plans expense | | — | | | | — | | | | — | | | | — | | | — | | | | 3,708 | | | | — | | | | 3,708 | |
| | | | | | | | | | | | | | | | | | | | | | | | | | | | | | |
Balance, December 31, 2005 | | 111,169,227 | | | | 1,112 | | | | 687,661 | | | | 257,563 | | | 11,560 | | | | (4,630 | ) | | | (77,226 | ) | | | 876,040 | |
Comprehensive Income: | | | | | | | | | | | | | | | | | | | | | | | | | | | | | | |
Net income | | — | | | | — | | | | — | | | | 75,214 | | | — | | | | — | | | | — | | | | | |
Foreign currency translation | | — | | | | — | | | | — | | | | — | | | 30,636 | | | | — | | | | — | | | | | |
Total comprehensive income | | — | | | | — | | | | — | | | | — | | | — | | | | — | | | | — | | | | 105,850 | |
Reclassification of deferred stock compensation upon adoption of SFAS 123R | | — | | | | — | | | | (4,630 | ) | | | — | | | — | | | | 4,630 | | | | — | | | | — | |
Exercise of stock options | | 2,507,688 | | | | 25 | | | | 14,803 | | | | — | | | — | | | | — | | | | — | | | | 14,828 | |
Excess tax benefit from share-based awards | | — | | | | — | | | | 12,678 | | | | — | | | — | | | | — | | | | — | | | | 12,678 | |
Purchase of treasury stock | | — | | | | — | | | | — | | | | — | | | — | | | | — | | | | (45,019 | ) | | | (45,019 | ) |
Settlement of share-based awards | | — | | | | — | | | | — | | | | — | | | — | | | | — | | | | (7,559 | ) | | | (7,559 | ) |
Issuance of restricted stock | | 1,309,828 | | | | 13 | | | | (13 | ) | | | — | | | — | | | | — | | | | — | | | | — | |
Cancellation of restricted stock | | (84,496 | ) | | | (1 | ) | | | 1 | | | | — | | | — | | | | — | | | | — | | | | — | |
Share-based plans expense | | — | | | | — | | | | 6,480 | | | | — | | | — | | | | — | | | | — | | | | 6,480 | |
| | | | | | | | | | | | | | | | | | | | | | | | | | | | | | |
Balance, December 31, 2006 | | 114,902,247 | | | $ | 1,149 | | | $ | 716,980 | | | $ | 332,777 | | $ | 42,196 | | | $ | — | | | $ | (129,804 | ) | | $ | 963,298 | |
| | | | | | | | | | | | | | | | | | | | | | | | | | | | | | |
See accompanying notes to consolidated financial statements.
33
MPS Group, Inc. and Subsidiaries
Consolidated Statements of Cash Flows
| | | | | | | | | | | | |
| | | Years Ended December 31, | |
(amounts in thousands) | | 2006 | | | 2005 | | | 2004 | |
Cash flows from operating activities: | | | | | | | | | | | | |
Net income | | $ | 75,214 | | | $ | 59,597 | | | $ | 35,420 | |
Adjustments to reconcile net income to net cash provided by operating activities: | | | | | | | | | | | | |
Discontinued operations | | | — | | | | — | | | | 437 | |
Exit recapture | | | — | | | | — | | | | (897 | ) |
Deferred income taxes | | | 17,931 | | | | 22,697 | | | | 19,256 | |
Share-based plans expense | | | 6,480 | | | | 3,383 | | | | 2,612 | |
Excess tax benefit from share-based awards | | | (12,895 | ) | | | — | | | | — | |
Depreciation and intangibles amortization | | | 15,869 | | | | 15,317 | | | | 15,755 | |
Changes in certain assets and liabilities, net of acquisitions: | | | | | | | | | | | | |
Accounts receivable | | | (9,575 | ) | | | (42,615 | ) | | | (43,757 | ) |
Prepaid expenses and other assets | | | 133 | | | | (676 | ) | | | 480 | |
Accounts payable and accrued expenses | | | 6,016 | | | | 21,586 | | | | 20,461 | |
Accrued payroll and related taxes | | | 9,414 | | | | 14,775 | | | | 5,148 | |
Other, net | | | (1,986 | ) | | | (2,166 | ) | | | (4,253 | ) |
| | | | | | | | | | | | |
Net cash provided by operating activities | | | 106,601 | | | | 91,898 | | | | 50,662 | |
| | | | | | | | | | | | |
Cash flows from investing activities: | | | | | | | | | | | | |
Sale of assets | | | — | | | | 3,674 | | | | 2,442 | |
Purchase of furniture, equipment, and leasehold improvements, net of disposals | | | (13,571 | ) | | | (11,480 | ) | | | (9,565 | ) |
Purchase of businesses, including additional consideration on acquisitions, net of cash acquired | | | (44,155 | ) | | | (17,714 | ) | | | (50,223 | ) |
| | | | | | | | | | | | |
Net cash used in investing activities | | | (57,726 | ) | | | (25,520 | ) | | | (57,346 | ) |
| | | | | | | | | | | | |
Cash flows from financing activities: | | | | | | | | | | | | |
Repurchases of common stock | | | (45,019 | ) | | | (37,284 | ) | | | (30,882 | ) |
Discount realized on employee stock purchase plan | | | (5 | ) | | | (572 | ) | | | (433 | ) |
Settlement of share-based awards | | | (7,559 | ) | | | — | | | | — | |
Excess tax benefit from share-based awards | | | 12,895 | | | | — | | | | — | |
Proceeds from stock options exercised | | | 14,833 | | | | 14,687 | | | | 18,251 | |
Repayments on indebtedness | | | (1,003 | ) | | | (2,553 | ) | | | (893 | ) |
| | | | | | | | | | | | |
Net cash used in financing activities | | | (25,858 | ) | | | (25,722 | ) | | | (13,957 | ) |
| | | | | | | | | | | | |
Effect of exchange rate changes on cash and cash equivalents | | | 6,724 | | | | (4,202 | ) | | | 2,308 | |
| | | | | | | | | | | | |
Net increase (decrease) in cash and cash equivalents | | | 29,741 | | | | 36,454 | | | | (18,333 | ) |
Cash and cash equivalents, beginning of year | | | 142,951 | | | | 106,497 | | | | 124,830 | |
| | | | | | | | | | | | |
Cash and cash equivalents, end of year | | $ | 172,692 | | | $ | 142,951 | | | $ | 106,497 | |
| | | | | | | | | | | | |
See accompanying notes to consolidated financial statements.
34
| | | | | | | | | |
| | | Years Ended December 31, |
(amounts in thousands) | | 2006 | | 2005 | | 2004 |
SUPPLEMENTAL CASH FLOW INFORMATION | | | | | | | | | |
Interest paid | | $ | 627 | | $ | 600 | | $ | 598 |
Income taxes paid | | | 14,154 | | | 4,861 | | | 5,106 |
NON-CASH INVESTING AND FINANCING ACTIVITIES
The Company completed six acquisitions in 2006, three acquisitions in 2005, and seven acquisitions in 2004. In connection with the acquisitions, liabilities were assumed as follows:
| | | | | | | | | | | | |
| | | Years Ended December 31, | |
| | | 2006 | | | 2005 | | | 2004 | |
Fair value of assets acquired | | $ | 55,849 | | | $ | 18,003 | | | $ | 59,816 | |
Cash paid | | | (44,283 | ) | | | (15,250 | ) | | | (48,201 | ) |
| | | | | | | | | | | | |
Liabilities assumed | | $ | 11,566 | | | $ | 2,753 | | | $ | 11,615 | |
| | | | | | | | | | | | |
35
MPS GROUP, INC.
NOTES TO CONSOLIDATED FINANCIAL STATEMENTS
1. DESCRIPTION OF BUSINESS
MPS Group, Inc. (‘MPS’ or the ‘Company’) (New York Stock Exchange symbol: MPS) is a leading provider of business services with over 200 offices throughout the United States, Canada, the United Kingdom, and continental Europe. The Company delivers specialty staffing, consulting and business solutions to virtually all industries in the following disciplines and through the following primary brands:
| | |
Discipline | | Brand(s) |
Information Technology (IT) Services | | Modis® |
Accounting and Finance | | Badenoch & Clark® , Accounting Principals® |
Engineering | | Entegee® |
Legal | | Special Counsel® |
IT Solutions | | Idea Integration® |
Healthcare | | Soliant Health® |
Work Force Automation | | Beeline® |
The Company presents the financial results of the above brands under its four reporting segments: North American Professional Services, European Professional Services, North American IT Services and European IT Services.
2. SUMMARY OF SIGNIFICANT ACCOUNTING POLICIES
Basis of Presentation and Consolidation
The consolidated financial statements include the accounts of the Company and its wholly owned subsidiaries. All material intercompany transactions have been eliminated in the accompanying consolidated financial statements.
Cash and Cash Equivalents
Cash and cash equivalents include deposits in banks, money market funds, and short-term investments with original maturities of 90 days or less, when purchased.
Furniture, Equipment, and Leasehold Improvements
Furniture, equipment, and leasehold improvements are recorded at cost less accumulated depreciation and amortization. Depreciation of furniture and equipment is computed using the straight-line method over the estimated useful lives of the related assets. The Company has developed a proprietary software package, which allows the Company to implement imaging, time capture, and data-warehouse reporting. The costs associated with the development of this proprietary software package have been capitalized, and are being amortized over a five-year period. See Footnote 13.
In accordance with Statements of Financial Accounting Standards (‘SFAS’) No. 144,Accounting for the Impairment or Disposal of Long-Lived Assets, the Company evaluates the recoverability of its carrying value of property and equipment whenever events or changes in circumstances indicate that the carrying amount may not be recoverable. Carrying value write-downs and gains and losses on disposition of property and equipment are reflected in the Consolidated Statements of Operations.
Goodwill and Other Identifiable Intangible Assets
For acquisitions, the Company allocates the excess of cost over the fair market value of the net tangible assets first to identifiable intangible assets, if any, and then to goodwill. In connection with SFAS No. 142,
36
MPS GROUP, INC.
NOTES TO CONSOLIDATED FINANCIAL STATEMENTS—(Continued)
Goodwill and Other Intangible Assets, the Company is required to perform goodwill impairment reviews, at least annually, utilizing a fair-value approach.
The Company performed valuation testing during the fourth quarters of 2004, 2005 and 2006 (its designated timing of the annual impairment test under SFAS No. 142) and did not incur any impairment. The Company plans to perform its next annual impairment review during the fourth quarter of 2007. An impairment review prior to its next scheduled annual review may be required if certain events occur, including lower than forecasted earnings levels for various reporting units. In addition, changes to other assumptions could significantly impact the Company’s estimate of the fair value of its reporting units. Such a change may result in a goodwill impairment charge, which could have a significant impact on the reportable segments that include the related reporting units and the Consolidated Financial Statements.
The Company used an equally blended value of a discounted cash flow analysis and market comparables analysis to arrive at fair value for SFAS No. 142. For the discounted cash flow analysis, significant assumptions included expected future revenue growth rates, reporting unit profit margins, working capital levels and a discount rate. The revenue growth rates and reporting unit profit margins are based, in part, on its expectation of a stable economic environment. Market comparables included a comparison of the market ratios and performance fundamentals from comparable companies. The use of these measurement criteria is consistent with the underlying concepts used in determining the fair value of a company or reportable unit under the market approach. The market ratios the Company used refer to the multiples of revenue and earnings of comparable companies and the performance fundamentals refer to the consideration of the effects of the differences in the operating metrics, i.e. growth rates, operating margins, gross margins, etc. on its value versus the comparable companies.
From 2004 to 2006, we acquired a total of 16 businesses for our four reporting segments. These acquisitions were recorded in accordance with the provisions of SFAS No. 141Business Combinations. See Footnote 3 (Business Combinations) and Footnote 5 (Goodwill And Other Identifiable Intangible Assets).
Revenue Recognition
The Company recognizes substantially all revenue at the time services are provided and is recorded on a time and materials basis. In most cases, the consultant is the Company’s employee and all costs of employing the worker are the responsibility of the Company and are included in cost of revenue. Revenues generated when the Company permanently places an individual with a client are recorded at the time of start.
In addition and to a lesser extent, the Company is involved in fixed price or lump-sum engagements. The services rendered by the Company under the relevant contracts generally require performance spanning more than one accounting period. The Company recognizes revenue for these engagements under the proportional performance accounting model.
Foreign Operations
The financial position and operating results of foreign operations are consolidated using the local currency as the functional currency. These operating results are considered to be permanently invested in foreign operations. Local currency assets and liabilities are translated at the rate of exchange to the U.S. dollar on the balance sheet date, and the local currency revenues and expenses are translated at average rates of exchange to the U.S. dollar during the period.
37
MPS GROUP, INC.
NOTES TO CONSOLIDATED FINANCIAL STATEMENTS—(Continued)
Income Taxes
The provision for income taxes is based on income before taxes as reported in the accompanying Consolidated Statements of Operations. Deferred tax assets and liabilities are recognized for the expected future tax consequences of events that have been included in the financial statements or tax returns. Under this method, deferred tax assets and liabilities are determined based on the differences between the financial statement carrying amounts and the tax basis of assets and liabilities using enacted tax rates in effect for the year in which the differences are expected to reverse. An assessment is made as to whether or not a valuation allowance is required to offset deferred tax assets. This assessment includes anticipating future taxable income.
The Company is subject to periodic review by federal, foreign, state and local taxing authorities in the ordinary course of business. As a result, tax contingencies have been recorded for such items, including amounts related to current audits. These contingencies are adjusted as expected results differ from what was recorded. See Footnote 7.
Net Income per Common Share
The consolidated financial statements include ‘basic’ and ‘diluted’ per share information. Basic net income per common share information is calculated by dividing net income by the weighted average number of common shares outstanding. Diluted net income per common share information is calculated by also considering the impact of potential common stock equivalents on both net income and the weighted average number of common shares outstanding. The weighted average number of common shares used in the basic net income per common share computations was 101.3 million, 101.7 million and 102.8 million in 2006, 2005 and 2004, respectively. The only difference in the computation of basic and diluted net income per common share is the inclusion of 2.8 million, 4.1 million and 4.0 million incremental common shares from the assumed exercise of stock options and restricted stock awards in 2006, 2005 and 2004, respectively. See Footnote 10.
Pervasiveness of Estimates
The preparation of financial statements in conformity with generally accepted accounting principles requires management to make estimates and assumptions that affect the reported amount of assets and liabilities and disclosure of contingent assets and liabilities at the date of the financial statements and the reported amounts of revenue and expenses during the reporting period. Although management believes these estimates and assumptions are adequate, actual results may differ from the estimates and assumptions used.
New Accounting Pronouncements
In July 2006, the FASB issued FASB Interpretation No. (“FIN”) 48Accounting for Uncertainty in Income Taxes—an interpretation of FASB Statement No. 109 (“SFAS 109”). FIN 48 clarifies the accounting for uncertainty in income taxes recognized in accordance with SFAS 109. This interpretation prescribes a recognition threshold and measurement attribute for the financial statement recognition and measurement of a tax position taken or expected to be taken in a tax return. Additionally, FIN 48 provides guidance on recognition, classification, and disclosure of tax positions. The provisions of FIN 48 are effective for fiscal years beginning after December 15, 2006, with the cumulative effect of initially adopting this interpretation being recorded as an adjustment to the opening balance of retained earnings. While we are in the process of finalizing the impact FIN 48 will have on our consolidated financial statements, we do not expect its adoption to have a material effect on them.
In September 2006, the FASB issued SFAS No. 157,Fair Value Measurements (“SFAS 157”), which defines fair value, establishes a framework for measuring fair value in generally accepted accounting principals,
38
MPS GROUP, INC.
NOTES TO CONSOLIDATED FINANCIAL STATEMENTS—(Continued)
and expands disclosures about fair value measurements. SFAS 157 does not require any new fair value measurements, but rather clarifies the application of other accounting pronouncements that require or permit fair value measurements. The provisions of SFAS 157 are effective for financial statements issued for fiscal years beginning after November 15, 2007, and interim periods within those years. Earlier application is encouraged, provided the reporting entity has not yet issued financial statements for that fiscal year. We are currently evaluating the impact of SFAS 157, but management does not expect the adoption of SFAS 157 to have a material effect on our consolidated financial statements.
In September 2006, the Securities and Exchange Commission issued Staff Accounting Bulletin No. 108,Considering the Effects of Prior Year Misstatement when Quantifying Misstatements in Current Year Financial Statements(“SAB 108”). SAB 108 provides guidance which is meant to eliminate the diversity of practice in quantifying identified misstatements by putting forward a single quantification framework to be used by all public companies. The Company adopted the provisions of SAB 108 in the fourth quarter of 2006 as its provisions were effective for fiscal years ending on or after November 15, 2006. The adoption of SAB 108 did not have a material impact on our consolidated financial statements.
3. BUSINESS COMBINATIONS
In 2006, the Company acquired the following businesses for which purchase consideration totaled $49.6 million in cash, of which $44.5 million was paid at closing:
| | |
Name/Description | | Business |
| |
Garelli Wong | | Accounting and Finance Staffing |
| |
Chronos International | | European Recruitment |
| |
Corinthe Holding BV | | European Staffing & Recruitment |
| |
Pharmacy Staffing Unit of Cardinal Health | | Pharmacy Staffing |
| |
Netlogic | | European IT Staffing |
| |
Integrated Performance Systems | | Workforce Solutions |
In 2005, the Company acquired the following businesses for which purchase consideration totaled $17.3 million in cash, of which $16.1 million was paid at closing:
| | |
Name/Description | | Business |
| |
Encore Development | | IT Solutions |
| |
Bilingual Therapies | | Healthcare Staffing |
| |
Pacioli Companies | | Accounting & Finance Staffing/IT Solutions |
39
MPS GROUP, INC.
NOTES TO CONSOLIDATED FINANCIAL STATEMENTS—(Continued)
In 2004, the Company acquired the following businesses for which purchase consideration totaled $49.2 million in cash, of which $46.8 million was paid at closing:
| | |
Name/Description | | Business |
| |
Management Search | | Healthcare Staffing |
| |
Sunbelt Staffing | | Healthcare Staffing |
| |
Lillian Kloock | | Accounting and Finance Staffing |
| |
Accounting Alternatives | | Accounting and Finance Staffing |
| |
Accounting Solutions | | Accounting and Finance Staffing |
| |
Legal Networks | | Legal Staffing |
| |
Alderson Court Reporting | | Legal Staffing |
4. INDEBTEDNESS
Indebtedness at December 31, 2006 and 2005 consisted of the following:
| | | | | | |
(amounts in thousands) | | 2006 | | 2005 |
Notes payable to former stockholders of acquired companies (interest ranging from 1.7% to 5.3%) | | $ | 4,483 | | $ | 1,250 |
| | | | | | |
| | | 4,483 | | | 1,250 |
Current portion of notes payable | | | 4,483 | | | 1,250 |
| | | | | | |
Long-term portion of notes payable | | $ | — | | $ | — |
| | | | | | |
The notes payable are included in the line item ‘Accounts payable and accrued expenses’ on the Consolidated Balance Sheets.
In the fourth quarter of 2006, the Company closed on a $250 million revolving credit facility which replaced an expiring $150 million facility. The credit facility is syndicated to a group of leading financial institutions and contains certain financial and non-financial covenants relating to its operations, including maintaining certain financial ratios. Repayment of the credit facility is guaranteed by substantially all of the subsidiaries of the Company. The facility expires in November 2011. The Company incurred certain costs directly related to obtaining the credit facility in the amount of approximately $440,000. These costs have been capitalized and are being amortized over the life of the credit facility, and are included in the line item ‘Other assets, net’ on the Consolidated Balance Sheet. As of December 31, 2006, there were no borrowings outstanding under this facility, other than $7.6 million of standby letters of credit for certain operational matters.
40
MPS GROUP, INC.
NOTES TO CONSOLIDATED FINANCIAL STATEMENTS—(Continued)
5. GOODWILL AND OTHER IDENTIFIABLE INTANGIBLE ASSETS
The changes in the carrying amount of goodwill for 2006 and 2005 are as follows:
| | | | | | | | | | | | | | | | | |
| | | Professional Services | | IT Services | | Total | |
(dollar amounts in thousands) | | North
America | | Europe | | North
America | | | Europe | |
Balance as of December 31, 2004 | | $ | 152,806 | | $ | 102,173 | | $ | 244,758 | | | $ | 29,555 | | $ | 529,292 | |
2005 acquisitions | | | 10,843 | | | — | | | 4,252 | | | | — | | | 15,095 | |
Effect of foreign currency exchange rates | | | — | | | 2,374 | | | — | | | | 698 | | | 3,072 | |
Reduction of goodwill as a result of the disposition of certain assets in the IT solutions unit | | | — | | | — | | | (2,096 | ) | | | — | | | (2,096 | ) |
| | | | | | | | | | | | | | | | | |
Balance as of December 31, 2005 | | | 163,649 | | | 104,547 | | | 246,914 | | | | 30,253 | | | 545,363 | |
2006 acquisitions | | | 12,043 | | | 17,201 | | | 5,106 | | | | 3,026 | | | 37,376 | |
Effect of foreign currency exchange rates | | | — | | | 16,238 | | | 136 | | | | 2,999 | | | 19,373 | |
| | | | | | | | | | | | | | | | | |
Balance as of December 31, 2006 | | $ | 175,692 | | $ | 137,986 | | $ | 252,156 | | | $ | 36,278 | | $ | 602,112 | |
| | | | | | | | | | | | | | | | | |
The Company allocated the purchase price of acquisitions in accordance with SFAS 141Business Combinations. At December 31, 2006 and 2005, there were $6.0 million, and $2.6 million, respectively, of identifiable intangible assets on the Company’s Consolidated Balance Sheets relating to the Company’s acquisitions in 2006 and 2005. Identifiable intangible assets relate primarily to the value of the acquired business’ customer relationships and trade names at the acquisition date.
6. COMMITMENTS AND CONTINGENCIES
Rent expense, primarily for office premises, was $26.0 million, $24.0 million, and $19.8 million, for 2006, 2005 and 2004, respectively. The Company leases office space under various noncancelable operating leases. The following is a schedule of future minimum lease payments with terms in excess of one year (amounts in thousands):
| | | |
Year | | |
2007 | | $ | 18,541 |
2008 | | | 15,580 |
2009 | | | 13,435 |
2010 | | | 11,170 |
2011 | | | 7,334 |
Thereafter | | | 12,379 |
| | | |
| | $ | 78,439 |
| | | |
In addition, as of December 31, 2006, the Company had future purchase commitments of approximately $6.3 million over the next three years, related primarily to telecom service agreements, software licenses and subscriptions, and computer hardware and software maintenance agreements.
The Company is a party to a number of lawsuits and claims arising out of the ordinary conduct of its business. In the opinion of management, based on the advice of in-house and external legal counsel, the lawsuits and claims pending are not likely to have a material adverse effect on the Company, its financial position, its results of operations, or its cash flows.
41
MPS GROUP, INC.
NOTES TO CONSOLIDATED FINANCIAL STATEMENTS—(Continued)
7. INCOME TAXES
A comparative analysis of the provision for income taxes from continuing operations is as follows:
| | | | | | | | | | | | |
(amounts in thousands) | | 2006 | | | 2005 | | | 2004 | |
Current: | | | | | | | | | | | | |
Federal | | $ | 13,767 | | | $ | 214 | | | $ | (2,914 | ) |
State | | | 1,490 | | | | 834 | | | | (858 | ) |
International | | | 12,133 | | | | 7,443 | | | | 2,666 | |
| | | | | | | | | | | | |
| | | 27,390 | | | | 8,491 | | | | (1,106 | ) |
| | | | | | | | | | | | |
Deferred: | | | | | | | | | | | | |
Federal | | | 20,592 | | | | 25,433 | | | | 18,618 | |
State | | | 763 | | | | (2,335 | ) | | | 93 | |
International | | | (3,424 | ) | | | (401 | ) | | | 545 | |
| | | | | | | | | | | | |
| | | 17,931 | | | | 22,697 | | | | 19,256 | |
| | | | | | | | | | | | |
| | $ | 45,321 | | | $ | 31,188 | | | $ | 18,150 | |
| | | | | | | | | | | | |
The difference between the actual income tax provision and the tax provision computed by applying the statutory federal income tax rate to income before provision for income taxes is attributable to the following:
| | | | | | | | | | | | | | | | | | | | | |
| | | 2006 | | | 2005 | | | 2004 | |
(amounts in thousands) | | Amount | | | Percentage | | | Amount | | | Percentage | | | Amount | | | Percentage | |
Tax computed using the federal statutory rate | | $ | 42,187 | | | 35.0 | % | | $ | 31,775 | | | 35.0 | % | | $ | 18,750 | | | 35.0 | % |
State income taxes, net of federal income tax effect | | | 2,253 | | | 1.9 | % | | | (1,501 | ) | | (1.7 | )% | | | (765 | ) | | (1.4 | )% |
Non-deductible meals | | | 3,330 | | | 2.8 | % | | | 2,434 | | | 2.7 | % | | | 1,865 | | | 3.5 | % |
Foreign tax rate differential | | | (2,129 | ) | | (1.8 | )% | | | (1,112 | ) | | (1.2 | )% | | | (142 | ) | | (0.3 | )% |
Other permanent differences | | | (320 | ) | | (0.3 | )% | | | (408 | ) | | (0.4 | )% | | | (1,558 | ) | | (2.9 | )% |
| | | | | | | | | | | | | | | | | | | | | |
| | $ | 45,321 | | | 37.6 | % | | $ | 31,188 | | | 34.4 | % | | $ | 18,150 | | | 33.9 | % |
| | | | | | | | | | | | | | | | | | | | | |
42
MPS GROUP, INC.
NOTES TO CONSOLIDATED FINANCIAL STATEMENTS—(Continued)
The components of the deferred tax assets and liabilities recorded in the accompanying Consolidated Balance Sheets are as follows:
| | | | | | | | |
(amounts in thousands) | | 2006 | | | 2005 | |
Gross deferred tax assets: | | | | | | | | |
Allowance for doubtful accounts | | $ | 4,680 | | | $ | 2,488 | |
Foreign tax credit carryforward | | | 21,203 | | | | 20,687 | |
Net operating loss carryforward | | | 9,409 | | | | 17,953 | |
Capital loss carryforward | | | 3,661 | | | | 3,661 | |
Deferred compensation | | | 4,131 | | | | 3,197 | |
Equity based compensation | | | 3,431 | | | | 2,842 | |
Amortization of goodwill | | | — | | | | 6,223 | |
Other employee benefits | | | 2,369 | | | | 1,815 | |
Other | | | 4,088 | | | | 4,537 | |
| | | | | | | | |
Total gross deferred tax assets | | $ | 52,972 | | | $ | 63,403 | |
| | | | | | | | |
Valuation allowance | | | (26,041 | ) | | | (27,765 | ) |
| | | | | | | | |
Total gross deferred tax assets, net of valuation allowance | | $ | 26,931 | | | $ | 35,638 | |
| | | | | | | | |
Gross deferred tax liabilities: | | | | | | | | |
Amortization of goodwill | | | (10,575 | ) | | | — | |
Other | | | (2,194 | ) | | | (2,612 | ) |
| | | | | | | | |
Total gross deferred tax liabilities | | | (12,769 | ) | | | (2,612 | ) |
| | | | | | | | |
Net deferred tax asset | | $ | 14,162 | | | $ | 33,026 | |
| | | | | | | | |
Recognition of deferred tax assets is based on management’s belief that it is more likely than not that the tax benefit associated with temporary differences, operating loss carryforwards and tax credits will be utilized. A valuation allowance is recorded for those deferred tax assets for which it is more likely than not that realization will not occur.
The Company utilized a significant portion of its Federal net operating loss in 2006, reducing the related deferred tax asset to approximately $700,000 from $7.9 million in 2005. The Company expects to utilize the remaining Federal net operating loss carryforward in 2007.
The Company’s valuation allowance at December 31, 2006, consisted of $15.0 million in foreign tax credit carryforwards, $6.8 million in state net operating loss carryforwards, $3.7 million for a capital loss carryforward, and approximately $500,000 in foreign net operating loss carryforwards. The valuation allowance at December 31, 2005, consisted of $15.5 million in foreign tax credit carryforwards, $8.6 million in state net operating loss carryforwards, and $3.7 million for a capital loss carryforward.
In addition to deferred tax expense, the Company’s deferred tax asset changed in 2006 by approximately $900,000 of deferred taxes related to acquisitions.
Federal income taxes were not provided for on income from foreign subsidiaries (except for Canada), since they are considered to be permanently invested. If these earnings were remitted, foreign tax credits would substantially offset any resulting federal income tax.
The Company is subject to periodic review by federal, foreign, state and local taxing authorities in the ordinary course of business. As of December 31, 2006, the Company has no outstanding income tax audits with the Internal Revenue Service. The Company’s federal income tax returns have been audited or surveyed by the
43
MPS GROUP, INC.
NOTES TO CONSOLIDATED FINANCIAL STATEMENTS—(Continued)
Internal Revenue Service through 2002. Many of the Company’s UK subsidiaries have been audited through 2003. The Company has several state income tax audits throughout the year since the Company operates in a multi-state environment. Tax contingencies have been recorded for uncertain tax positions, including uncertain tax positions related to current audits. These contingencies are adjusted as expected results differ from what was recorded.
8. EMPLOYEE BENEFITS
Profit Sharing Plans
The Company has a qualified contributory 401(k) profit sharing plan which covers all full-time employees over age twenty-one with over 90 days of employment and 375 hours of service. The Company made matching contributions of approximately $3.2 million, $2.6 million and $500,000, net of forfeitures, to the profit sharing plan for 2006, 2005 and 2004, respectively. Under the terms of the profit sharing plan, the Company will match at least 25% of employee contributions up to the first 5% of total eligible compensation, as defined in the various profit sharing plans. For 2006 and 2005, the Company matched 50% of employee contributions up to the aforementioned limit.
The Company has assumed many 401(k) plans of acquired subsidiaries. From time to time, the Company merges these plans into the Company’s plan. Company contributions relating to these merged plans are included in the aforementioned total.
Deferred Compensation Plan
The Company also has a non-qualified deferred compensation plan for its highly compensated employees. While the deferred compensation plan provides for matching contributions, the Company did not match employee deferrals for 2006, 2005 or 2004. The Company looks to invest the assets of the deferred compensation plan based on a portfolio designed to achieve the most desirable balance between investment return and asset protection by investing in equities of high quality companies and in high quality fixed income securities. As of December 31, 2006 and 2005, the liability to the employees for amounts deferred, which is included in ‘Other’ in the Liabilities section of the Consolidated Balance Sheets, was $12.7 million and $9.2 million, respectively.
In the beginning of 2002, the Company purchased insurance on the lives of its highly compensated employees. This company-owned life insurance is intended to be used to settle the Company’s obligations of deferred compensation. The cash surrender value of the company-owned life insurance is included in ‘Other assets, net’ in the Consolidated Balance Sheets.
Management Savings Plan
In 2004, the Company established the Management Savings Plan (the “MSP”), as a non-qualified defined contribution plan. Each year participants selected by the compensation committee are qualified to receive annual contributions from the Company on terms and in amounts established by the committee, subject to a minimum annual contribution to each such participant of five percent of annual cash compensation (salary plus bonus). In addition, several participants are eligible to receive change of control benefits in accordance with the terms of the MSP. The aggregate contribution by the Company to the MSP was approximately $600,000, $600,000 and $250,000, for 2006, 2005 and 2004, respectively.
9. STOCKHOLDERS’ EQUITY
Stock Repurchase Plan
The Company’s Board of Directors has authorized certain repurchases of our common stock. For 2006, the Company repurchased 3.2 million shares at a cost of $45.0 million, which brought the total amount repurchased under this plan to 12.0 million shares at a cost of $122.2 million as of December 31, 2006.
44
MPS GROUP, INC.
NOTES TO CONSOLIDATED FINANCIAL STATEMENTS—(Continued)
MPS has the following share-based compensation plans for employees and directors:
Incentive Employee Stock Plan
Under the Company’s 2004 Equity Incentive Plan (“Employee Plan”), which replaced the Amended and Restated 1995 Stock Option Plan (“1995 Plan”), participants may be granted stock options (incentive and nonqualified), stock appreciation rights, restricted stock, restricted stock units, and performance shares. The total number of shares available for award under the Employee Plan as of December 31, 2006 was 2.7 million, which includes lapsed or cancelled awards or options from grants outstanding under the 1995 Plan at the time of shareholder approval of the Employee Plan. The Employee Plan, among other things, requires the exercise price of nonqualified stock options to not be less than 100% of the fair market value of the stock on the date the option is granted, and defines a director in accordance with Rule 16b-3 of the Securities Exchange Act of 1934, as amended, and with Section 162(m) of the Internal Revenue Code of 1986, as amended. The Employee Plan prohibits the Company from reducing the exercise price of outstanding options (repricing) without first receiving shareholder approval.
Non-Employee Director Stock Plan
Under the Company’s 2004 Non-Employee Director Equity Incentive Plan (“Director Plan”), which replaced the Amended and Restated Non-Employee Director Stock Option Plan (“Prior Director Plan”), non-employee directors may be granted stock options, stock appreciation rights, restricted stock, and restricted stock units. The total number of shares that may be awarded under the Director Plan as of December 31, 2006 was 170,000. The Director Plan awards each non-employee director an option to purchase 60,000 shares at an exercise price equal to the fair market value at the date of the grant upon election to the Board, which becomes exercisable ratably over a five-year period. In addition, the Director Plan provides for an annual issuance of non-qualified options to purchase 20,000 shares to each director, upon reelection, at an exercise price equal to the fair market value at the date of grant, which become exercisable ratably over a three-year period. The Director Plan provides that such formulaic awards cease upon the director accruing 100,000 options. Options expire ten years from the date of the grant. The Director Plan also allows for the grant of additional options to non-employee directors from time to time as the Board determines in its discretion as well as the substitution of one option with one-half of a share of restricted stock.
For 2006, the Company utilized restricted stock for its share-based compensation awards. Historically, the majority of the Company’s share-based compensation awards were granted in restricted stock, non-qualified stock options, and incentive stock options. For 2006, the Company recognized an expense of $0.04 per basic and diluted common share related to share-based compensation, comprised of $6.8 million of compensation expense, primarily from restricted stock, net of a $2.5 million income tax benefit. This compensation expense is included in the general and administrative expense line item on its Consolidated Statements of Operations.
Prior to January 1, 2006, the Company accounted for its share-based awards in accordance with the recognition and measurement principles of Accounting Principles Board Opinion No. 25,Accounting for Stock Issued to Employees, and related implementation guidance. No compensation cost was reflected in our Consolidated Statements of Operations for stock options as all stock options granted had an exercise price equal to the fair market value of our underlying common stock on the date of grant. Effective January 1, 2006, we adopted the provisions of SFAS 123R,Share-Based Payment. Management elected to apply the modified prospective transition method to all past awards outstanding and unvested as of the effective date of January 1, 2006. Under this transition method, compensation cost recognized in 2006 includes the applicable amounts of: (a) compensation cost for all share-based payments granted prior to, but not yet vested as of, January 1, 2006 (based on the grant-date fair value estimated in accordance with the original provisions of SFAS 123,Accountingfor Stock-Based Compensation and previously presented in pro forma footnote disclosures), and
45
MPS GROUP, INC.
NOTES TO CONSOLIDATED FINANCIAL STATEMENTS—(Continued)
(b) compensation cost for all share-based payments granted subsequent to January 1, 2006 (based on the grant-date fair value estimated in accordance with the new provisions of SFAS 123R). At January 1, 2006, the unvested portion of stock options granted prior to January 1, 2006 was $486,000 and will be expensed through 2007. In addition, the Company is required to comply with the following provisions of SFAS 123R:
| | • | | Forfeiture rate—SFAS 123R requires the recognition of expense only for awards that will eventually vest. The provision requires pre-vesting forfeitures to be estimated at the time of grant and modified, if necessary, if actual forfeitures differ from estimated forfeitures. The Company’s forfeiture rates were based mainly upon its historical share-based compensation cancellations. The estimated forfeiture rates resulted in an immaterial adjustment to current unvested awards as of January 1, 2006. |
| | • | | Tax benefits—SFAS 123R requires tax benefits resulting from share-based awards in excess of compensation cost recognized to be classified as financing cash flows in the Consolidated Statements of Cash Flows. Prior to the adoption of SFAS 123R, tax benefits resulting from share-based awards were classified as operating cash flows. |
| | • | | Tax windfall pool—SFAS 123R requires companies to calculate a cumulative pool of tax windfalls, offset by tax shortfalls using historical data from the original implementation date of SFAS 123. Management utilized the short form method to calculate the transitional cumulative tax pool. In addition, management has calculated a tax windfall pool as of December 31, 2006; therefore, any future tax shortfalls related to share-based awards will be charged against additional paid-in capital up to the amount of the Company’s windfall pool. |
Stock Options
MPS stock options generally vest over three to five years with a graded vesting schedule. The Company recognizes expense for its stock options using the graded-vesting method over the requisite service period. Its options generally expire ten years after the grant date. The total value of compensation expense for stock options is equal to the fair value of the award on the grant date. Historically, management has calculated the fair value of stock options utilizing the Black-Scholes option-pricing model.
Compensation expense recognized in the Consolidated Statements of Operations for stock options was $393,000 for 2006. A summary of the Company’s stock options as of December 31, 2006 is presented below:
| | | | | | | | | | | |
| | | Shares (000s) | | | Weighted
Average
Exercise Price | | Weighted
Average
Remaining
Contractual
Term | | Total Intrinsic
Value (000s) |
Outstanding at December 31, 2003 | | 11,800 | | | $ | 6.10 | | | | | |
Granted | | 165 | | | $ | 11.73 | | | | | |
Forfeited | | (3,283 | ) | | $ | 5.73 | | | | | |
Exercised | | (768 | ) | | $ | 6.16 | | | | | |
| | | | | | | | | | | |
Outstanding at December 31, 2004 | | 7,914 | | | $ | 6.26 | | 6.70 | | $ | 49,014 |
Granted | | 2,895 | | | $ | 9.10 | | | | | |
Forfeited | | (2,584 | ) | | $ | 5.67 | | | | | |
Exercised | | (151 | ) | | $ | 8.27 | | | | | |
| | | | | | | | | | | |
Outstanding at December 31, 2005 | | 8,074 | | | $ | 7.43 | | 6.97 | | $ | 50,893 |
Granted | | — | | | $ | — | | | | | |
Forfeited | | (216 | ) | | $ | 9.48 | | | | | |
Exercised | | (2,508 | ) | | $ | 5.92 | | | | $ | 24,382 |
| | | | | | | | | | | |
Outstanding at December 31, 2006 | | 5,350 | | | $ | 8.08 | | 6.32 | | $ | 33,365 |
| | | | |
Options exercisable at December 31, 2006 | | 5,273 | | | $ | 8.07 | | 6.31 | | $ | 32,939 |
46
MPS GROUP, INC.
NOTES TO CONSOLIDATED FINANCIAL STATEMENTS—(Continued)
As of December 31, 2006, there was $133,000 of unrecognized compensation cost related to unvested stock options, which is expected to be recognized over a weighted-average period of approximately ten months. For 2006, cash received and the total tax benefit from the exercise of stock options was $14.9 million and $8.8 million, respectively. In addition during 2006, $2.0 million of cash was used for minimum statutory withholding requirements upon net settlement of employee stock option exercises.
Restricted Stock
Historically, MPS restricted stock vests over three to five years. The Company recognizes expense for its restricted stock using the straight-line method over the requisite service period. The total value of compensation expense for restricted stock is equal to the closing price of MPS common stock on the date of grant.
Compensation expense recognized in the Consolidated Statements of Operations for restricted stock was $6.1 million, $3.4 million and $2.6 million in 2006, 2005 and 2004 respectively. A summary of the Company’s restricted stock as of December 31, 2006 is presented below:
| | | | | | | | | |
| | | Shares (000s) | | | Weighted Average
Fair Value at Grant | | Fair Value (000s) |
Unvested at December 31, 2005 | | 1,746 | | | $ | 7.28 | | | |
Granted | | 1,310 | | | $ | 16.28 | | | |
Forfeited | | (85 | ) | | $ | 13.60 | | | |
Vested | | (1020 | ) | | $ | 4.50 | | $ | 15,984 |
| | | | | | | | | |
Unvested at December 31, 2006 | | 1,951 | | | $ | 14.50 | | | |
As of December 31, 2006, there was $17.5 million of unrecognized compensation cost related to unvested restricted stock, which is expected to be recognized over a weighted-average period of approximately 3 years. For 2006, the total tax benefit generated from vested restricted stock was $5.9 million. In addition, $5.5 million of cash was used for minimum statutory withholding requirements upon net settlement of employee restricted stock exercises.
Prior Period Pro Forma Presentations
Under the modified prospective transition method, the Company’s results for prior periods have not been restated to reflect the effects of implementing SFAS 123R. The following pro forma information, as required by SFAS 148,Accounting for Stock-Based Compensation—Transition and Disclosure, an amendment of FASB Statement 123, is presented for comparative purposes and illustrates the pro forma effect on net income and earnings per common share for each period presented as if we had applied the fair value recognition provisions of SFAS 123 to share-based awards prior to January 1, 2006:
| | | | | | | | |
(amounts in thousands except per common share amounts) | | 2005 | | | 2004 | |
Net income | | | | | | | | |
As reported | | $ | 59,597 | | | $ | 35,420 | |
Total stock-based employee compensation expense determined under fair value based method for all awards, net of related tax effects | | | (9,794 | ) | | | (2,705 | ) |
| | | | | | | | |
Pro forma | | $ | 49,803 | | | $ | 32,715 | |
| | | | | | | | |
Basic net income per common share | | | | | | | | |
As reported | | $ | 0.59 | | | $ | 0.34 | |
Pro forma | | $ | 0.49 | | | $ | 0.32 | |
Diluted net income per common share | | | | | | | | |
As reported | | $ | 0.56 | | | $ | 0.33 | |
Pro forma | | $ | 0.47 | | | $ | 0.31 | |
47
MPS GROUP, INC.
NOTES TO CONSOLIDATED FINANCIAL STATEMENTS—(Continued)
The fair value of each option grant is estimated on the date of grant using the Black Scholes option-pricing model with the following assumptions used for grants in both 2005 and 2004: risk-free interest rate of 3.8%; expected volatility of 70%; and expected lives of 5 years. The weighted average fair values of options granted during 2005 and 2004 were $5.48 and $7.48 per share, respectively.
In 2001, the Company implemented an employee stock purchase plan (“ESPP”), which provided that eligible employees may contribute up to 10% of their base earnings toward the quarterly purchase of the Company’s common stock. The employee’s purchase price was 85% of the lesser of the fair market value of the stock on the first business day or the last business day of the quarterly offering period. Effective in the third quarter of 2006, the Company revised the ESPP, changing the employee’s purchase price to 95% of the fair value of the stock on the last business day of the monthly offering period. Compensation expense of $356,000 was recorded in the first half of 2006 for the amount of the discount under the original plan in accordance with SFAS 123R. No compensation expense was recorded in connection with the ESPP in 2005 and 2004. During 2006, 2005 and 2004, the Company issued the following stock under the ESPP:
| | | | | | | | |
| | | Number
of Shares | | Purchase Price |
Year | | | High | | Low |
2006 | | 112,549 | | $ | 16.04 | | $ | 14.06 |
2005 | | 153,251 | | $ | 12.76 | | $ | 8.80 |
2004 | | 189,667 | | $ | 11.14 | | $ | 8.34 |
Since inception of the ESPP, 1,012,489 shares have been purchased, leaving 487,511 shares available for future issuances.
10. NET INCOME PER COMMON SHARE
The calculation of basic net income per common share and diluted net income per common share is presented below:
| | | | | | | | | |
(amounts in thousands except per common share amounts) | | 2006 | | 2005 | | 2004 |
Income per common share computation: | | | | | | | | | |
Net income | | $ | 75,214 | | $ | 59,597 | | $ | 35,420 |
| | | | | | | | | |
Basic average common shares outstanding | | | 101,340 | | | 101,719 | | | 102,804 |
Incremental shares from assumed exercise of stock options and restricted stock awards | | | 2,750 | | | 4,113 | | | 4,038 |
| | | | | | | | | |
Diluted average common shares outstanding | | | 104,090 | | | 105,832 | | | 106,842 |
| | | | | | | | | |
Basic income per common share: | | | | | | | | | |
Basic net income per common share | | $ | 0.74 | | $ | 0.59 | | $ | 0.34 |
| | | | | | | | | |
Diluted income per common share: | | | | | | | | | |
Diluted net income per common share | | $ | 0.72 | | $ | 0.56 | | $ | 0.33 |
| | | | | | | | | |
Options to purchase approximately 116,000, 318,000, 700,000 shares of common stock that were outstanding during 2006, 2005, and 2004 respectively, were not included in the computation of diluted earnings per common share as the exercise prices of these options were greater than the average market price of the common shares.
48
MPS GROUP, INC.
NOTES TO CONSOLIDATED FINANCIAL STATEMENTS—(Continued)
11. CONCENTRATION OF CREDIT RISK
The Company’s financial instruments that are exposed to concentrations of credit risk consist primarily of cash and accounts receivable. The Company places its cash and cash equivalents with what management believes to be high credit quality institutions. At times such investments may be in excess of the FDIC insurance limit. The Company routinely assesses the financial strength of its customers and, as a consequence, believes that its accounts receivable credit risk exposure is limited.
12. FAIR VALUE OF FINANCIAL INSTRUMENTS
The carrying amounts of cash and cash equivalents, accounts receivable, other assets, accounts payable and accrued expenses, and notes payable approximate fair value due to the short-term maturities of these assets and liabilities. Borrowings, if any, under the revolving credit facility have variable rates that reflect currently available terms and conditions for similar debt. The carrying amount of this debt is considered by management to be a reasonable estimate of its fair value.
13. FURNITURE, EQUIPMENT, AND LEASEHOLD IMPROVEMENTS
A summary of furniture, equipment, and leasehold improvements at December 31, 2006 and 2005 is as follows:
| | | | | | | | |
(amounts in thousands) | | Estimated Useful
Life in Years | | 2006 | | 2005 |
Furniture, equipment, and leasehold improvements | | 5 -15 /lease term | | $ | 97,343 | | $ | 81,333 |
Software | | 3 | | | 5,960 | | | 4,373 |
Software development | | 5 | | | 13,232 | | | 12,428 |
| | | | | | | | |
| | | | | 116,535 | | | 98,134 |
Accumulated depreciation and amortization | | | | | 88,063 | | | 73,592 |
| | | | | | | | |
Total furniture, equipment, and leasehold improvements, net | | | | $ | 28,472 | | $ | 24,542 |
| | | | | | | | |
Total depreciation and amortization expense on furniture, equipment, and leasehold improvements was $12.3 million, $12.7 million, and $13.6 million for 2006, 2005, and 2004, respectively.
14. QUARTERLY FINANCIAL DATA (UNAUDITED)
| | | | | | | | | | | | | | | |
| | | For the Three Months Ended | | For the Year Ended Dec. 31, 2006 |
(amounts in thousands except per common share amounts) | | Mar. 31, 2006 | | June 30, 2006 | | Sept. 30, 2006 | | Dec. 31, 2006 | |
Revenue | | $ | 439,309 | | $ | 468,425 | | $ | 483,085 | | $ | 485,803 | | $ | 1,876,622 |
Gross profit | | $ | 117,116 | | $ | 130,980 | | $ | 134,526 | | $ | 134,420 | | $ | 517,042 |
Net income | | $ | 16,010 | | $ | 19,008 | | $ | 19,676 | | $ | 20,520 | | $ | 75,214 |
Basic net income per common share | | $ | 0.16 | | $ | 0.19 | | $ | 0.19 | | $ | 0.20 | | $ | 0.74 |
Diluted net income per common share | | $ | 0.15 | | $ | 0.18 | | $ | 0.19 | | $ | 0.20 | | $ | 0.72 |
49
MPS GROUP, INC.
NOTES TO CONSOLIDATED FINANCIAL STATEMENTS—(Continued)
| | | | | | | | | | | | | | | |
| | | For the Three Months Ended | | For the Year Ended Dec. 31, 2005 |
(amounts in thousands except per common share amounts) | | Mar. 31, 2005 | | June. 30, 2005 | | Sept. 30, 2005 | | Dec. 31, 2005 | |
Revenue | | $ | 407,709 | | $ | 424,836 | | $ | 426,961 | | $ | 425,193 | | $ | 1,684,699 |
Gross profit | | $ | 101,934 | | $ | 110,919 | | $ | 113,945 | | $ | 115,570 | | $ | 442,368 |
Net income | | $ | 9,349 | | $ | 13,111 | | $ | 17,121 | | $ | 20,016 | | $ | 59,597 |
Basic net income per common share | | $ | 0.09 | | $ | 0.13 | | $ | 0.17 | | $ | 0.20 | | $ | 0.59 |
Diluted net income per common share | | $ | 0.09 | | $ | 0.12 | | $ | 0.16 | | $ | 0.19 | | $ | 0.56 |
15. SEGMENT REPORTING
The Company discloses segment information in accordance with SFAS 131,Disclosure About Segments of an Enterprise and Related Information, which requires companies to report selected segment information on a quarterly basis and to report certain entity-wide disclosures about products and services, major customers, and the material countries in which the entity holds assets and reports revenues.
The Company has four reportable segments: North American Professional Services, European Professional Services, North American IT Services, and European IT Services. The Company’s reportable segments offer different services, have different client bases, experience differing economic characteristics, and are managed separately as each requires different resources and marketing strategies. The North American Professional services segment provides specialized staffing and recruiting in the disciplines of accounting, finance, law, engineering and healthcare in North America. The European Professional services segment provides specialized staffing and recruiting for accounting and finance, legal, human resources, and marketing positions in Europe, principally in the United Kingdom. The North American IT services segment offers value-added solutions such as IT project support and staffing, recruitment of full-time positions, project-based solutions, workforce solutions, on-site recruiting support, IT strategy consulting, design and branding, application development, and integration in North America. The European IT services segment provides value-added solutions such as IT project support and staffing, and recruitment of full-time positions, specialized staffing and solutions in Europe, principally in the United Kingdom.
The Company’s segment results include the results from acquisitions named in Footnote 3. The Company evaluates segment performance based on revenues, gross profit, and income from continuing operations before provision for income taxes. The Company does not allocate income taxes, interest or unusual items to the segments. In addition, the Company does not report total assets by segment.
The accounting policies of the segments are consistent with those described in the summary of significant accounting policies in Footnote 2 and all intersegment sales and transfers are eliminated.
No one customer represents more than 5% of the Company’s overall revenue. Therefore, the Company does not believe it has a material reliance on any one customer as the Company is able to provide services to numerous Fortune 1000 and other leading businesses.
50
MPS GROUP, INC.
NOTES TO CONSOLIDATED FINANCIAL STATEMENTS—(Continued)
The following tables summarize performance, accounts receivable, net, and long-lived assets by segment, and revenue by geographic location:
| | | | | | | | | | | | |
(amounts in thousands) | | 2006 | | | 2005 | | | 2004 | |
Revenue | | | | | | | | | | | | |
North American Professional Services | | $ | 617,166 | | | $ | 537,257 | | | $ | 429,560 | |
European Professional Services | | | 431,402 | | | | 364,793 | | | | 289,058 | |
North American IT Services | | | 560,987 | | | | 510,499 | | | | 459,470 | |
European IT Services | | | 267,067 | | | | 272,150 | | | | 248,754 | |
| | | | | | | | | | | | |
Total revenue | | $ | 1,876,622 | | | $ | 1,684,699 | | | $ | 1,426,842 | |
| | | | | | | | | | | | |
Gross profit | | | | | | | | | | | | |
North American Professional Services | | $ | 189,147 | | | $ | 160,400 | | | $ | 123,783 | |
European Professional Services | | | 123,064 | | | | 104,320 | | | | 80,402 | |
North American IT Services | | | 162,047 | | | | 142,192 | | | | 123,757 | |
European IT Services | | | 42,784 | | | | 35,456 | | | | 32,845 | |
| | | | | | | | | | | | |
Total gross profit | | $ | 517,042 | | | $ | 442,368 | | | $ | 360,787 | |
| | | | | | | | | | | | |
Income before provision for income taxes | | | | | | | | | | | | |
North American Professional Services | | $ | 59,241 | | | $ | 44,469 | | | $ | 30,937 | |
European Professional Services | | | 31,870 | | | | 26,120 | | | | 13,192 | |
North American IT Services | | | 45,059 | | | | 37,324 | | | | 28,022 | |
European IT Services | | | 6,515 | | | | 4,485 | | | | 2,401 | |
| | | | | | | | | | | | |
| | | 142,685 | | | | 112,398 | | | | 74,552 | |
Corporate expenses (1) | | | (28,141 | ) | | | (25,412 | ) | | | (23,316 | ) |
Recapture (2) | | | — | | | | — | | | | 897 | |
Other income, net | | | 5,991 | | | | 3,799 | | | | 1,437 | |
| | | | | | | | | | | | |
Total income before provision for income taxes | | $ | 120,535 | | | $ | 90,785 | | | $ | 53,570 | |
| | | | | | | | | | | | |
Geographic Areas | | | | | | | | | | | | |
Revenue | | | | | | | | | | | | |
North America | | $ | 1,178,153 | | | $ | 1,047,756 | | | $ | 889,030 | |
Europe | | | 698,469 | | | | 636,943 | | | | 537,812 | |
| | | | | | | | | | | | |
Total revenue | | $ | 1,876,622 | | | $ | 1,684,699 | | | $ | 1,426,842 | |
| | | | | | | | | | | | |
51
MPS GROUP, INC.
NOTES TO CONSOLIDATED FINANCIAL STATEMENTS—(Continued)
| | | | | | |
| | | December 31, |
(amounts in thousands) | | 2006 | | 2005 |
Accounts receivable, net | | | | | | |
North American Professional Services | | $ | 85,477 | | $ | 75,783 |
European Professional Services | | | 47,084 | | | 42,237 |
North American IT Services | | | 98,041 | | | 89,155 |
European IT Services | | | 47,836 | | | 37,331 |
| | | | | | |
Total accounts receivable, net | | $ | 278,438 | | $ | 244,506 |
| | | | | | |
Long-lived assets | | | | | | |
North American Professional Services | | $ | 178,922 | | $ | 166,319 |
European Professional Services | | | 143,640 | | | 108,210 |
North American IT Services | | | 261,652 | | | 255,506 |
European IT Services | | | 41,887 | | | 35,421 |
| | | | | | |
| | | 626,101 | | | 565,456 |
Corporate | | | 4,483 | | | 4,449 |
| | | | | | |
Total long-lived assets | | $ | 630,584 | | $ | 569,905 |
| | | | | | |
| (1) | Corporate expenses include unallocated expenses not directly related to the segments’ operations. |
| (2) | 2004 includes an $897,000 recapture relating to the settlement of abandoned real estate associated with exit costs incurred in 2002. |
52
MPS GROUP, INC.
Schedule II—Valuation and Qualifying Accounts
(amounts in thousands)
| | | | | | | | | | | | | | | | | | |
| | | Balance at
Beginning of
Period | | Charged to
Expenses | | | Write-offs | | | Deductions | | | Translation
Adjustments | | | Balance at
End of Period |
Year Ended December 31, 2004 | | | | | | | | | | | | | | | | | | |
Allowance for doubtful accounts receivable | | $ | 12,899 | | 3,271 | | | (6,715 | ) | | — | | | 381 | | | $ | 9,836 |
Deferred tax valuation allowance | | $ | 27,171 | | 3,716 | | | — | | | — | | | — | | | $ | 30,887 |
Year Ended December 31, 2005 | | | | | | | | | | | | | | | | | | |
Allowance for doubtful accounts receivable | | $ | 9,836 | | 4,178 | | | (1,498 | ) | | — | | | (644 | ) | | $ | 11,872 |
Deferred tax valuation allowance | | $ | 30,887 | | (1,181 | ) | | — | | | (1,941 | ) | | — | | | $ | 27,765 |
Year Ended December 31, 2006 | | | | | | | | | | | | | | | | | | |
Allowance for doubtful accounts receivable | | $ | 11,872 | | 4,443 | | | (2,409 | ) | | — | | | 860 | | | $ | 14,766 |
Deferred tax valuation allowance | | $ | 27,765 | | (374 | ) | | (1,350 | ) | | — | | | — | | | $ | 26,041 |
| ITEM 9. | CHANGES IN AND DISAGREEMENTS WITH ACCOUNTANTS ON ACCOUNTING AND FINANCIAL DISCLOSURE |
None.
| ITEM 9A. | CONTROLS AND PROCEDURES |
Disclosure Control and Procedures
MPS management, with the participation of our chief executive officer and chief financial officer, evaluated our disclosure controls and procedures, as defined in Rules 13a-15(e) and 15d-15(e) promulgated under the Securities Exchange Act of 1934, as amended, as of the end of the period covered by this Annual Report on Form 10-K.
No system of controls, no matter how well designed and operated, can provide absolute assurance that the objectives of the system of controls are met, and no evaluation of controls can provide absolute assurance that the system of controls has operated effectively in all cases. Our disclosure controls and procedures, however, are designed to provide reasonable assurance that the objectives of disclosure controls and procedures are met.
Based on the evaluation discussed above, our chief executive and chief financial officers have concluded that our disclosure controls and procedures were effective as of December 31, 2006, to provide reasonable assurance that the objectives of disclosure controls and procedures are met.
Internal Control Over Financial Reporting
Our management’s report on the Company’s internal control over financial reporting as of December 31, 2006 is included in Part II, Item 8, of this Annual Report on Form 10-K. Management’s assessment of internal control over financial reporting in that report has been audited by PricewaterhouseCoopers LLP, our independent registered certified public accounting firm, as stated in their report which is also included in Part II, Item 8.
53
MPS GROUP, INC.
There were no changes in the Company’s internal control over financial reporting identified in connection with the evaluation required by Rule 13a-15 of the Securities Exchange Act of 1934 that occurred during the Company’s fourth fiscal quarter of 2006 that have materially affected, or are reasonably likely to materially affect, the Company’s internal control over financial reporting.
| ITEM 9B. | OTHER INFORMATION |
None.
PART III
Information required by Part III with respect to Directors and Executive Officers of the Registrant (Item 10), Executive Compensation (Item 11), Security Ownership of Certain Beneficial Owners and Management and Related Stockholder Matters (Item 12), Certain Relationships and Related Transactions (Item 13), Principal Accountant Fees and Services (Item 14), and the Audit Committee Charter is to be included in the Registrant’s Definitive Proxy Statement to be filed pursuant to Regulation 14A (the ‘Proxy Statement’) not later than 120 days after the end of the fiscal year covered by this report. Such Proxy Statement, when filed, is incorporated herein by reference.
PART IV
| ITEM 15. | EXHIBITS AND FINANCIAL STATEMENT SCHEDULE |
| (a) | 1. Financial Statements. |
The following consolidated financial statements of the Company and its subsidiaries are included in Item 8 of this report:
Report of Independent Registered Certified Public Accounting Firm;
Management’s Report on Internal Control Over Financial Reporting;
Consolidated Balance Sheets at December 31, 2006 and 2005;
Consolidated Statements of Operations for the years ended December 31, 2006, 2005, and 2004;
Consolidated Statements of Stockholders’ Equity for the years ended December 31, 2006, 2005, and 2004;
Consolidated Statements of Cash Flows for the years ended December 31, 2006, 2005 and 2004; and
Notes to Consolidated Financial Statements.
| (a) | 2. Financial Statement Schedules. |
For the three years ended December 31, 2006
Schedule II—Valuation & Qualifying Accounts
All other schedules are omitted because they are not applicable or the required information is shown in the financial statements or notes thereto.
54
MPS GROUP, INC.
All documents referenced below were filed pursuant to the Securities Exchange Act of 1934 by MPS Group, Inc., file no. 0-24484, unless otherwise indicated.
| | 3.1 | Amended and Restated Articles of Incorporation of the Company, incorporated by reference to the Company’s Quarterly Report on Form 10-Q filed May 14, 2002. |
| | 3.2 | Amended and Restated Bylaws of the Company, incorporated by reference to the Company’s Quarterly Report on Form 10-Q filed May 15, 2003. |
| | 4. | Form of stock certificate for the Company’s Common Stock, $.01 par value, incorporated by reference to the Company’s Registration Statement on Form S-3 (No. 333-106855) filed July 7, 2003. |
| | 10.1 | MPS Group, Inc. 2001 Amended and Restated 2001 Employee Stock Purchase Plan, incorporated by reference to the Company’s Quarterly Report on Form 10-Q filed August 8, 2006. ^ |
| | 10.2 | MPS Group, Inc. (formerly AccuStaff Incorporated) Amended and Restated Non-Employee Director Stock Plan, incorporated by reference to the Company’s Annual Report on Form 10-K filed March 16, 2005.^ |
| | 10.3 | AccuStaff Incorporated (now MPS Group, Inc.) Amended and Restated Non-Employee Director Stock Plan—Form of Non-Employee Director Stock Option Award Agreement, as amended, incorporated by reference to the Company’s Annual Report on Form 10-K filed March 30, 2000. ^ |
| | 10.4 | Profit Sharing Plan, incorporated by reference to the Company’s Registration on Form S-1 (No. 333-78906).^ |
| | 10.5 | Revolving Credit Agreement By and Between the Company and the Material Subsidiaries of the Company and JPMorgan Chase, N.A., as Administrative Agent and Certain Lenders Party named therein, dated November 10, 2006. |
| | 10.6 | Modis Professional Services, Inc. (now MPS Group, Inc.) Amended and Restated 1995 Stock Option Plan, incorporated by reference to the Company’s Quarterly Report on Form 10-Q filed August 8, 2001.^ |
| | 10.7 | Modis Professional Services, Inc. (now MPS Group, Inc.) Amended and Restated 1995 Stock Option Plan—Form of Stock Option Agreement, incorporated by reference to the Company’s Quarterly Report on Form 10-Q filed August 8, 2001. ^ |
| | 10.8 | Modis Professional Services, Inc. (now MPS Group, Inc.) Amended and Restated 1995 Stock Option Plan—Form of Restricted Stock Agreement, incorporated by reference to the Company’s Quarterly Report on Form 10-Q filed August 9, 2004. ^ |
| | 10.9 | Chairman Employment Agreement, incorporated by reference to the Company’s Quarterly Report on Form 10-Q/A filed May 18, 2001. ^ |
| | 10.10 | Amendment and Renewal of Chairman Employment Agreement with Derek E. Dewan, incorporated by reference to the Company’s Quarterly Report on Form 10-Q filed November 9, 2005. ^ |
| | 10.11 | Restricted Stock Agreement with Derek E. Dewan, incorporated by reference to the Company’s Quarterly Report on Form 10-Q filed May 16, 2001. ^ |
| | 10.12 | Amended and Restated Executive Employment Agreement with Timothy D. Payne, incorporated by reference to the Company’s Quarterly Report on Form 10-Q filed May 16, 2001. ^ |
| | 10.13 | Restricted Stock Agreement with Timothy D. Payne, incorporated by reference to the Company’s Quarterly Report on Form 10-Q filed November 14, 2002. ^ |
55
MPS GROUP, INC.
| | 10.14 | Amended and Restated Executive Employment Agreement with Robert P. Crouch, incorporated by reference to the Company’s Quarterly Report on Form 10-Q filed May 16, 2001. ^ |
| | 10.15 | Restricted Stock Agreement with Robert P. Crouch, incorporated by reference to the Company’s Quarterly Report on Form 10-Q filed November 14, 2002. ^ |
| | 10.16 | Modis Professional Services, Inc. (now MPS Group, Inc.) Executive Option Plan, incorporated by reference to the Company’s Registration on Form S-8 (No. 333-88329). ^ |
| | 10.17 | Form of Director’s Indemnification Agreement, incorporated by reference to the Company’s Annual Report on Form 10-K filed March 30, 2000. |
| | 10.18 | Form of Officer’s Indemnification Agreement, incorporated by reference to the Company’s Annual Report on Form 10-K filed March 30, 2000 . |
| | 10.19 | Amended and Restated Executive Deferred Compensation Plan, incorporated by reference to the Company’s Quarterly Report on Form 10-Q filed May 15, 2003. ^ |
| | 10.20 | Form of Executive Employment Agreement with each of Gregory D. Holland, Tyra H. Tutor, and Richard L. White, incorporated by reference to the Company’s Quarterly Report on Form 10-Q filed May 15, 2003. ^ |
| | 10.21 | Form of Supplement to Restricted Stock Agreement with Richard L. White, Gregory D. Holland and Tyra H. Tutor, incorporated by reference to the Company’s Annual Report on Form 10-K filed March 16, 2005. ^ |
| | 10.22 | 2004 Equity Incentive Plan, incorporated by reference to the Company’s Quarterly Report on Form 10-Q filed August 9, 2004. ^ |
| | 10.23 | 2004 Equity Incentive Plan – Form of Stock Option Agreement, incorporated by reference to the Company’s Annual Report on Form 10-K filed March 16, 2005. ^ |
| | 10.24 | 2004 Equity Incentive Plan – Form of Restricted Stock Agreement, incorporated by reference to the Company’s Annual Report on Form 10-K filed March 16, 2005. ^ |
| | 10.25 | 2004 Non-Employee Director Equity Incentive Plan, incorporated by reference to the Company’s Quarterly Report on Form 10-Q filed August 9, 2004. ^ |
| | 10.26 | 2004 Non-Employee Director Equity Incentive Plan – Form of Stock Option Agreement, incorporated by reference to the Company’s Annual Report on Form 10-K filed March 16, 2005. ^ |
| | 10.27 | Executive Annual Incentive Plan, incorporated by reference to the Company’s Quarterly Report on Form 10-Q filed August 9, 2004. ^ |
| | 10.28 | Management Savings Plan, incorporated by reference to the Company’s Quarterly Report on Form 10-Q filed August 9, 2004. ^ |
| | 21 | Subsidiaries of the Registrant. |
| | 23 | Consent of PricewaterhouseCoopers LLP. |
| | 31.1 | Certification of Timothy D. Payne pursuant to Rule 13a-14a. |
| | 31.2 | Certification of Robert P. Crouch pursuant to Rule 13a-14a. |
| | 32.1 | Certification of Timothy D. Payne pursuant to 18 U.S.C. Section 1350. |
| | 32.2 | Certification of Robert P. Crouch pursuant to 18 U.S.C. Section 1350. |
| ^ | This Exhibit is a management contract or compensatory plan or arrangement. |
56
MPS GROUP, INC.
EXHIBIT INDEX
| | |
Exhibit
No. | | Description |
| 10.5 | | Revolving Credit Agreement By and Between the Company and the Material Subsidiaries of the Company and JPMorgan Chase, N.A., as Administrative Agent and Certain Lenders Party named therein, dated November 10, 2006. |
| |
| 21 | | Subsidiaries of the Registrant. |
| |
| 23 | | Consent of PricewaterhouseCoopers LLP. |
| |
| 31.1 | | Certification of Timothy D. Payne pursuant to Rule 13a-14. |
| |
| 31.2 | | Certification of Robert P. Crouch pursuant to Rule 13a-14. |
| |
| 32.1 | | Certification of Timothy D. Payne pursuant to 18 U.S.C. Section 1350. |
| |
| 32.2 | | Certification of Robert P. Crouch pursuant to 18 U.S.C. Section 1350. |
57
MPS GROUP, INC.
SIGNATURES
Pursuant to the requirements of Section 13 or 15(d) of the Securities Exchange Act of 1934, the registrant has duly caused this report to be signed on its behalf by the undersigned, thereunto duly authorized.
| | |
MPS GROUP, INC. |
| |
| By: | | /S/ TIMOTHY D. PAYNE |
| | Timothy D. Payne President and Chief Executive Officer |
Date: February 27, 2007
Pursuant to the requirements of Securities Exchange Act of 1934, this report has been signed below by the following persons on behalf of the registrant and in the capacities and on the dates indicated.
| | | | |
Signatures | | Title | | Date |
| | |
/S/ TIMOTHY D. PAYNE Timothy D. Payne | | President, Chief Executive Officer and Director | | February 27, 2007 |
| | |
/S/ ROBERT P. CROUCH Robert P. Crouch | | Senior Vice President, Chief Financial Officer, Treasurer, and Chief Accounting Officer | | February 26, 2007 |
| | |
/S/ DEREK E. DEWAN Derek E. Dewan | | Chairman of the Board | | February 26, 2007 |
| | |
/S/ MICHAEL D. ABNEY Michael D. Abney | | Director | | February 26, 2007 |
| | |
/S/ T. WAYNE DAVIS T. Wayne Davis | | Director | | February 26, 2007 |
| | |
/S/ ARTHUR B. LAFFER Arthur B. Laffer | | Director | | February 26, 2007 |
| | |
/S/ WILLIAM M. ISAAC William M. Isaac | | Director | | February 27, 2007 |
| | |
/S/ JOHN R. KENNEDY John R. Kennedy | | Director | | February 26, 2007 |
| | |
/S/ DARLA D. MOORE Darla D. Moore | | Director | | February 26, 2007 |
| | |
/S/ PETER J. TANOUS Peter J. Tanous | | Director | | February 26, 2007 |
58