UNITED STATES
SECURITIES AND EXCHANGE COMMISSION
Washington, D.C. 20549
FORM N-CSR
CERTIFIED SHAREHOLDER REPORT OF REGISTERED
MANAGEMENT INVESTMENT COMPANIES
Investment Company Act file number | 811-8544 | |||||||
| ||||||||
FPA FUNDS TRUST’S FPA CRESCENT FUND AND FPA INTERNATIONAL VALUE FUND | ||||||||
(Exact name of registrant as specified in charter) | ||||||||
| ||||||||
11400 WEST OLYMPIC BLVD., SUITE 1200, LOS ANGELES, CALIFORNIA |
| 90064 | ||||||
(Address of principal executive offices) |
| (Zip code) | ||||||
| ||||||||
J. RICHARD ATWOOD, | ||||||||
(Name and address of agent for service) | ||||||||
| ||||||||
Registrant’s telephone number, including area code: | 310-473-0225 |
| ||||||
| ||||||||
Date of fiscal year end: | DECEMBER 31 |
| ||||||
| ||||||||
Date of reporting period: | JUNE 30, 2012 |
| ||||||
Item 1. Report to Stockholders.
Semi-Annual Report

Distributor:
FPA FUND DISTRIBUTORS, INC.
11400 West Olympic Boulevard, Suite 1200
Los Angeles, California 90064
FPA Crescent Fund
June 30, 2012
FPA CRESCENT FUND
LETTER TO SHAREHOLDERS
Dear Shareholders:
Overview
FPA Crescent declined 2.9% in the second quarter amidst global market weakness, but increased 3.5% for the first half. We continue to maintain our conservative posture given our cautious outlook that we lay out in the commentary below. Please turn to page 16 for additional information about Fund performance and statistics.
The top individual contributors and detractors from our quarterly performance are as follows:
| Winners | Losers | ||||||
| Wal-Mart | Cisco Systems | ||||||
| Petsmart | Canadian Natural Resources | ||||||
| Anheuser-Busch INB | Western Digital | ||||||
Our top losers marginally offset the gains of our top winners. The three companies in the winner circle have been contributing to profitability for some time. The losers are a bit different. Cisco is just below our cost. Western Digital is still in the money, having given up much of our gains in the second quarter and, Canadian Natural Resources (CNQ) continues to perform poorly. In Q1, it was operating issues that plagued CNQ, during Q2, it was more general weakness in energy stocks that placed CNQ in the top 3 losers for two quarters running. As we stated in our Q1 commentary, we believe that CNQ will prove a profitable investment over time.
We confess to a lack of conviction over the short term, but that's nothing new. We have a lot of fear about the economy longer-term, so we continue to maintain liquidity with the expectation that we will be able to commit that capital in the future. As of quarter-end, your portfolio had 69.0% exposure to risk assets, with the following composition:
| Risk Asset | Exposure | ||||||
| Common stock, long | 66.3 | % | |||||
| Common stock, short | 3.4 | % | |||||
| Corporate debt, long | 3.5 | % | |||||
| Mortgages (whole loans) | 1.6 | % | |||||
| Other | 1.0 | % | |||||
We argue (or is it "beg?") for more value before committing additional capital. We carry with us our fear- of inflation and wonder where we will be in three years. We continue to preach caution. We find stocks neither particularly cheap, nor unusually expensive, so we sit in purgatory — waiting.
Economy
As bottoms-up value investors — but not to the point of being blind to the 30,000-foot view — we believe one ignores the macro at great peril. Therefore, in this letter we will share some of the big-picture considerations that are integral to our investment process. We're left with the view that the world will continue to see bouts of high volatility and that the level of economic growth in developed economies will probably be less than most expect. We do not believe the markets have priced such expectations adequately.
We have a tendency to be appropriately fearful, when we have cause, but usually too early. We wrote of the whimsical valuations of Internet stocks in 1998-99, the perilous use of credit default swaps in 2002, irresponsible sub-prime lending in 2005, and the opacity and risk of the investment banks in 2006. We were early
1
in each instance, and as a result, we had to accept some underperformance for a time. Presently, we're concerned about a disastrous ending to this grand experiment of money printing and government debt proliferation. That is combined with aggressive government spending in some countries, and forced austerity in others — as if anyone ever saved his way to prosperity. We believe the reasons for our unease are sound, but we're fairly confident that our timing will be off once again.
Our comments are more of a collection of observations that, when taken together, form a picture for us — like a mosaic. Seen up close, it's just a bunch of colored tiles, but when we stand back, the image is clear — and it's disconcerting.
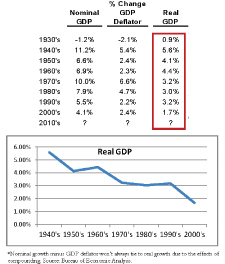
Slowing growth in this country is not new. Real U.S. economic growth has, in fact, been decelerating for decades. Growth was 5.6% in the 1940s, then it fell to 4% and change in the '50s and '60s, then to the low 3% range in the '70s, '80s and '90s. The most recent decade came in at less than 2%.
Slowing Trajectory of U.S. Economic Growth
We continue to believe future growth will be slower than in the past. We don't see another path. The United States is a bigger ship now than it was 50 years ago, and it just won't move as fast — especially since consumers have maxed out their balance sheets and governments are in the process of maxing out theirs. We've already had the secular benefit of households shifting from one to two incomes. Interest rates have already declined to generational lows. And the regulatory environment has become even more stifling.
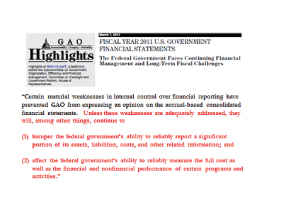
We have to offer a disclaimer, though: It's hard to have conviction in analyzing the data when the government information we're given is flawed. To make matters even more challenging, our elected and appointed
2
officials presumably use government statistics and projections for policy-making that is, sadly, already dangerously skewed toward the short-term view. The federal Government Accountability Office, ostensibly the auditor of our nation's financial statements, recognizes the problem and has published qualified statements of our government's financials for many years. The GAO wrote in 2010, "The federal government did not maintain adequate systems or have sufficient, reliable evidence to support certain material information reported in the U.S. government's... financial statements." The recently released 2011 GAO statement offered more severe language (as shown below). We depend on government data for GDP, CPI and a host of other metrics, so one should not take government statistics at face value.

Source: http://www.circadee.com
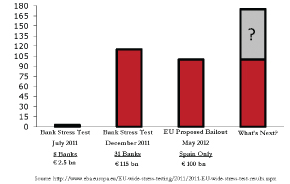
The European Union isn't much better, having seriously misjudged the depth of its financial crisis. In July 2011, the results of bank stress tests showed that eight banks required €2.5 billion. By December, it had grown to 31 banks needing €115 billion, and in May, the EU proposed a €100 billion bailout of Spain just to shore up that country's banks. Citigroup projects that the European banking system needs another €350 billion to be solvent.
3
European Banks: Capital Inadequacy
And then there's China, which is, by some accounts, a kleptocracy. Who knows what the real numbers are there? One can't have confidence in the integrity of the data. The China Daily opined, "Public skepticism has been directed chiefly at the statistical arm of the government, which has been ridiculed for releasing data contradicting basic commonsense assumptions. Local officials too have been castigated for concocting statistics that win approbation from superiors bent upon boosting GDP numbers."1
So we don't trust the numbers — numbers that are more important now that we have morphed from laissez faire capitalism to more of a government managed capitalism. But governments can't cure every ill. We would be better off if assets were to drop in value to the point where a sensible buyer could come in at a natural clearing price. Money can't be spent or printed just to move markets or to keep people shopping in stores. And we can't just keep borrowing money and spending it foolishly.
Debt has been going up faster than the returns on that debt. If you consider not just the U.S. government, but also U.S. corporate and household debt, our return on investment has steadily declined for decades. For the years since 1956, we've compared the change in GDP to the change in debt. You can see from the chart below that we are getting a lower return for each incremental dollar borrowed.
1 http://www.chinadaily.com.cn/opinion/2010-06/04/content_9933090.htm.
4
Diminishing Productivity of Debt
This is not to say we shouldn't borrow. But it certainly means that, if we do, we "sure as hell" better spend the money wisely. People shouldn't be buying cars and homes they can't afford. Companies shouldn't allocate capital just because they have the cash or borrow because they can. They should do so because they can achieve a respectable return on investment. We'd all be better off if the government spent more on things that can pay dividends in the future, like education, infrastructure, and scientific research. Instead, we get pandering earmarks. We spend as if the well has no bottom, and given our penchant for printing money, perhaps that is technically true. But the well narrows as you go more deeply, further limiting our already decreasing fiscal flexibility.
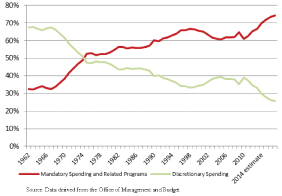
Mandatory vs. Discretionary Spending (% of Total Spending)
5
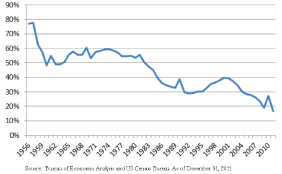
Mandatory spending, the part of the federal budget that has been legally mandated outside of the budget process, has increased to an all-time high of 64%. This includes Social Security, Medicare, a plethora of other government programs, and of course, interest expense.
As these expenses have grown, our discretionary spending has declined commensurately. Government agencies bear the brunt of the squeeze, with many suffering budget cuts of 10% to 30%.
The risk to the global growth scenario is ill-considered spending. Here are a few examples:
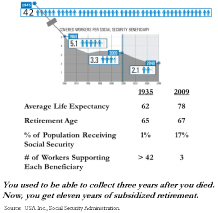
At its birth in 1935, Social Security had close to 50 workers supporting every beneficiary. Citizens could collect benefits at age 65, but the average life expectancy then was just 62. Brilliant, really — people couldn't collect until three years after they died. Since then, the number of beneficiaries has increased 17-fold, and now there are just three workers supporting each recipient. Retirees can now collect at age 67, and (thankfully for most) they can expect to live to 78. Those eleven years of subsidized retirement are uneconomic. We believe this underutilized human capital could be deployed more wisely, thus enhancing productivity.
Social Security Dilemma
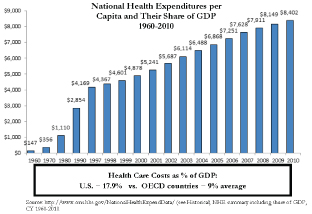
At double the OECD average, our nation's health care costs are another example of unrestrained spending.2 What's more, our care isn't notably better, and is even worse in some cases. The Affordable Care Act, Obamacare, won't be bringing costs down, since it focuses more on the broad delivery of healthcare than it does on reducing the fat in the system.
2 Organisation for Economic Co-operation and Development.
6
U.S. Health Care Costs
The White House's federal budget takes into account all the spending, projecting a $6.7 trillion cumulative deficit over the next decade. At this point, I'd have to take the over on that, but let's just use their numbers. If that comes to pass, debt held by the public will increase by $8 trillion. The Administration projects that this will cause interest expense to rise from $223 billion to $915 billion — and that conveniently ignores the existing $5 trillion in intragovernmental debt and its associated interest cost.3 About 6% of government spending is dedicated to interest expense — thanks to a larger federal budget and a lower cost of debt, that's less than the 1970 number of 7% — but the future won't be as kind. The White House estimates that our nation's financing costs as a percent of outlays will rise to 12.6% in five years, and to 15.7% in 10 years.
2012 Budget as Prepared by the OMB
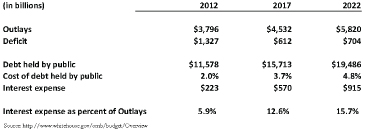
3�� According to the Office of Management and Budget, the White House anticipates that the cost of money will increase from 2% in 2012 to almost 5% in 2022.
7
We highly doubt that interest rates can be sustained at such a low level forever (despite the help with LIBOR thanks to Barclays et al.). If federal interest expense quadruples as the White House anticipates, then certain government spending is going to be crowded out. To put the almost $700 billion increase in perspective, that's about equal to what we spend on defense today. What programs will we see cut? What will the economic cost be? What about the social cost? Will the deficit be larger than the Office of Management and Budget estimates? Will the outstanding debt be greater than expected? Will the cost of debt be higher? These are just a few of the questions that keep us awake at night.

Certain government spending will get cut. It's already happening. Here in Los Angeles, we have a smaller police force per capita, fire stations have closed, some state workers receive unpaid furloughs certain days of the month, and various state agencies have shortened their hours
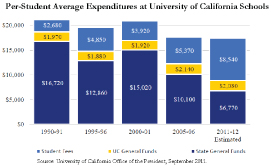
With more spending elsewhere, there's less for education. The University of California system receives $10,000 less per student from the State General Fund than it did two decades ago. Fees have tripled for students, making that public education more like semi-private. As a result, the UC system is now taking more full-pay foreign and out-of-state students. There's only so much money, even with control of the printing press, so something has to give. Education is one of those things, not just here in California, but across the country.
Education Gets Crowded Out
Of the money that is there, more is being handed out to households. The government's $2.5 trillion in benefits now provides support to 49% of U.S. households, up from 30% in the early 1980s.
8
Government Largesse
Household spending didn't change much as a result of the most recent recession. Households spent $11 trillion in 2007 and spent the same amount in 2010. Not bad, considering the job market shed 7.6 million jobs, causing unemployment to rise from 5% to 9.4%. To help ease the pain, U.S. government payments to households increased by $800 billion. Giving people so much and getting so little in return will not inure to the benefit of this country's long-term economic health.
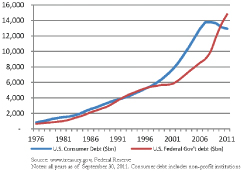
When the consumer stumbled in 2008, the government became the growth engine — borrowing and spending in its stead. Ironically, what we couldn't afford to do individually, we somehow think, can be done collectively as a nation — and without repercussions. This argues for a Keynesian end point when governments can no longer engage in deficit spending alone to spur the economy. We can decide on our own, or the markets will decide for us — through rising rates, a buyers' strike on U.S. Treasuries, or a currency crisis. The issue for us, as investors, is what does an imminent Keynesian end point mean in the context of both risk and opportunity?
U.S. Consumer and Government Debt
9
We acknowledge that it is much more difficult to know Europe as well as the United States. But the problems in Europe — particularly in Southern Europe, where policy has also run amok — look similar to what is happening here at the federal, state, and local levels. They've reached their Keynesian end point and are now dependent on the kindness of their neighbors. The United States is just at an earlier stage.

Source: The Economist.
We fear that the EU is worse than it looks, and there isn't a clear path to resolution. It never made sense to us to have independent fiscal fiefdoms that could act without regard to the policies of a central monetary authority. We don't know what will happen, but everyone appears to be counting on Germany. It reminds me of a Jewish curse my Rabbi once spoke of: May you be successful and the rest of your family poor. Germany is in the awkward position of having to choose whether to continue funding its irresponsible cousins, force them out of the EU, or leave the EU itself. A German exit would probably be as costly as reintegrating East and West Germany after the fall of the Berlin Wall. The new Deutschemark would certainly trade far richer than the Euro, hurting Germany's exports and possibly creating social unrest.
Imagine a young German and a young Frenchman of the same age committing to share an apartment. They agree to split the rent and the utilities. That works fine for years, until one day the Frenchman tells the German, "I want to retire now that I'm 60. I understand that you want to work for seven more years, and you've saved a lot more than me because I've worked just 35 hours a week to your 40, and I've taken more vacation time. Since you have more money, why don't you shoulder a larger share of the rent?" If you're the German, you'd have to seriously consider living on your own. Germany's choice is not an easy one, and given the complexity of the circumstances and my uneducated view, we don't pretend to have the answer. But we raise the question nonetheless because it will affect many companies that we either own or may consider owning.
China has its share of challenges as well, including their own housing bubble and unsustainable infrastructure spending. Yet the picture that gets painted by the United States, Europe, and China is an optimistic one. They believe their economies will get over their respective hurdles and all will be fine. But that seems to contradict the unprecedented policy initiatives that have left us hoping that this Grand Experiment doesn't blow up the lab. Slower growth is causing this crazy behavior, which we believe just increases socio-economic risk.
The Fed's balance sheet has ballooned in an unprecedented fashion, taking risk assets along with it. The goal of these programs was, in part, to take markets higher, instilling confidence that would hopefully translate to the economy. They were successful in boosting the markets, but economic growth has barely budged. The Fed's been pushing hard on a string, only to end up with weak economic growth and the most anemic recovery most of us have ever seen. No one sees that with more clarity than our nation's elderly, who are now forced to live with less thanks to low interest rates.
10
Fed Asset Expansion Has Moved with Risk Assets
Securities markets have become dependent on continued Fed action. The market has moved higher with each of the Fed's moves: QE, QE2, Operation Twist, and LTRO4 in Europe. There was a point at which Quantitative Easing had to be explained to us. What was an emergency measure has become the base case. Now, it seems most people are praying for QE3. At some point, even hit movies stop having sequels. It's Red Bull economics. Drink it and get jacked up only to come down hard later.
Narrowly defined, however, these programs have been successful. Operation Twist, the Fed's most recent effort, has successfully moved Treasury maturities further out. In December, 41% of U.S. Treasury Debt matured inside of two years. Now, six months later, just 32% matures inside two years. We have recommended that our companies follow the government's lead and term out their debt at a fixed rate at the longest possible maturity.
QE Impact on Stock Market: Wash, Rinse, Repeat
Doing the twist has the benefit of minimizing financing costs. With interest rates managed with such a heavy hand, the bond vigilantes are kept at bay and spending in Washington can continue unabated. This keeps
4 LTRO = longer-term refinancing operations.
11
us from recognizing the real problem. It's not debt. Debt is the manifestation. We have a spending problem. The fiscal cliff gets lots of press, as it should, but it's the symptom, not the problem.

Copyright Kipper Williams/Guardian News & Media.
Given all of these different risks, questionable accounting, and inappropriate policy measures, many of which are conflicting, we have struggled with whether we will have inflation or deflation. It's an important debate, because optimal portfolio positioning in each case is diametrically opposed.
We certainly see the inflation tinder:
• In the extraordinary growth in our money supply.
• In the fact that certain industries below norm today will contribute to both growth and inflation when they eventually rebound.
• Construction is one such industry running below norm, but that won't be forever. U.S. construction spending has averaged 15.2% of GDP for the past 20 years.5 It is currently running just 12.4%.6 Three quarters of that difference is residential home construction. Although we aren't likely to return to constructing two million new homes annually, we're not going to stay at 700,000 homes forever, either. We think 1.25 million to 1.4 million housing starts is a more normal range.7
• Recovering U.S. auto sales are another potential inflation engine. We think the right range is 15.5 million to 17.0 million new cars sold annually, or 10% to 20% more than the current volume. A bump in auto sales may not be that far off, since the average age of our fleet is at 11 years — its oldest ever.
Inflation Tinder
5 At its peak in the last decade, construction represented 17.3% of GDP.
6 Bureau of Economic Analysis.
7 We have worked through a couple thousand sub-prime whole loans. We are seeing a bottom. Said another way, the loans we bought in 2011 have been better than those purchased in 2009 and 2010, and that's not just because we've gotten better on price.
12
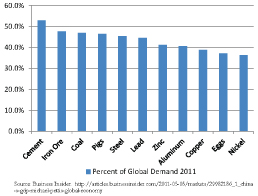
• In China's infrastructure spending, which is multiples higher than what is required for a developed society. The country accounts for only 9.4% of the global economy and 19% of the world's population, yet it consumes close to 50% of the world's cement, iron ore, coal, and steel, as well as prodigious amounts of many other commodities — all of which helps drive inflation higher.8
China Commodity Consumption
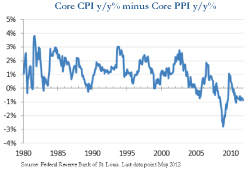
At present, we are witnessing deflation in certain parts of the U.S. economy — and it shows up on the slide below depicting CPI, net of PPI.9 In addition, housing remains weak. We have more computing power for less money. And we now have a proven abundance of natural gas that lowers input costs for many products and gives us a modicum of energy independence. And while China has been an engine of inflation, it could push commodity prices the other direction if there's a slowdown in consumption triggered by an economic downturn, or by the country's realization that it can afford to moderate its infrastructure build.
8 http://articles.businessinsider.com/2011-05-05/markets/29982186_1_china-s-gdp-michael-pettis-global-economy.
9 CPI = Consumer Price Index; PPI = Producer Price Index.
13
Deflationary Pressures
The inflation/deflation debate is set against the backdrop of a U.S. stock market that is priced above average, and a European market that's priced below average. Valuation, though, is partially dependent on sustaining all-time high operating margins. After-tax margins have benefited from a number of inputs that have been in decline, and it begs the question: What happens to these variables prospectively?
Corporate Margins at an All-Time High
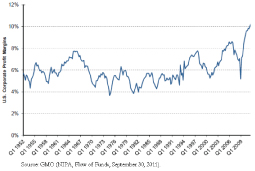
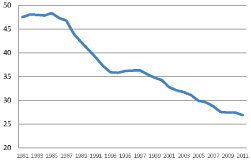
Corporate tax rates, for example, have helped push margins higher, having declined from 47.5% in 1981 to just 26.9% today. We guess one can always bet they'll decline further.
14
Average Corporate Tax Rates Worldwide
Labor costs and interest rates have also been key drivers in helping margins hit new highs. We think it's safe to say that we can't count on the similar declines in these variables in the future — and there's a good chance they'll be higher instead. Without some significant improvement in demand, the "E" part of the Price/Earnings equation may be overstated.
Investments
CareFusion
We recently made an investment in CareFusion (CFN), a leading medical technology company serving hospitals in the United States and abroad. In this country, it has dominant market positions in a majority of its businesses. CFN's products and services are particularly attractive because they help lower hospitals' operating costs. With new, highly motivated and experienced management at the helm, we believe CFN could improve its R&D productivity and grow international sales at a faster rate. This should translate into better long-term EPS growth. Management's actions to date should increase the company's operating margin to a level more commensurate with its strong share position and in line with similarly positioned medical device companies. The company is trading at ~10x cash earnings and it has minimal net debt leverage, so we find CFN to be an attractive investment.
High Yield /Distressed
We have been building an investment in a senior note issued by a domestic energy company that is currently under financial duress. The investment is a classic yield-to-workout story, where there is uncertainty surrounding the issuer's liquidity, but given the asset coverage of our claims, there appears to be low risk and reasonable upside in a restructuring. A reorganization would be welcome, because the company could then improve its asset value by using its cash to develop the asset base instead of paying interest on its debt. The Portfolio will either earn a yield-to-improved-credit when the company solves some of its current liquidity challenges, or it will hold the position through a restructuring. In both cases, the risk/reward and the presence of a contractual timetable make this an attractive investment.
15
Closing
As you would suspect given our fears, we remain conservatively postured, with not quite 70% in risk assets, and the balance in cash. If one had a strong view of inflation, he would construct a portfolio quite differently than the person who expects deflation. We have positioned our portfolio to be relatively robust in either scenario. In a world of deflation, not much besides our cash will do well. In a world of inflation, which is where we believe the Central Bankers and their respective administrations are leading us in the long term, we believe our stocks should at least perform nominally well. We continue to let price be our guide. If a business or asset is good and cheap — absolutely, not relatively — we'll buy it.
People don't change because they see the light. They change because they feel the heat. We expect some more heat, and then some change. Meanwhile, we prefer to prepare for the worst and hope for the best.
We added two people to our team during the quarter. Brandon Stranzl joins us after a number of years managing his own fund, and working at ESL and Third Avenue. Since Brian Selmo and Brandon have been good friends since their days at Third Avenue, we understood the high quality of his work and knew he would be a good fit philosophically. Greg Crouch recently joined us after spending 19 years in Europe as a journalist. Greg's success has been recognized internationally and includes a Pulitzer Prize nomination. The skills of an investigative journalist are integral to our investment process, and Greg takes our capabilities to a whole new level. The majority of our team was known to us prior to joining FPA. Greg is no exception, since he lived a few doors down from me in our freshman dorm at Northwestern. Both Brandon and Greg have already had an impact. Rik Ekstrand will no longer be contributing directly to the Contrarian Strategy; instead, he will be focusing solely on driving the performance of FPA's SMAV product, which he has co-managed since 2010. We thank Rik for his contributions and look forward to interacting with him on an ad-hoc basis in the future.
Respectfully submitted,

Steven Romick
President
July 18, 2012
16
The discussion of Fund investments represents the views of the Fund's managers at the time of this report and is subject to change without notice. References to individual securities are for informational purposes only and should not be construed as recommendations to purchase or sell individual securities.
FORWARD LOOKING STATEMENT DISCLOSURE
As mutual fund managers, one of our responsibilities is to communicate with shareholders in an open and direct manner. Insofar as some of our opinions and comments in our letters to shareholders are based on current management expectations, they are considered "forward-looking statements" which may or may not be accurate over the long term. While we believe we have a reasonable basis for our comments and we have confidence in our opinions, actual results may differ materially from those we anticipate. You can identify forward-looking statements by words such as "believe," "expect," "may," "anticipate," and other similar expressions when discussing prospects for particular portfolio holdings and/or the markets, generally. We cannot, however, assure future results and disclaim any obligation to update or alter any forward-looking statements, whether as a result of new information, future events, or otherwise. Further, information provided in this report should not be construed as a recommendation to purchase or sell any particular security.
17
PORTFOLIO CHARACTERISTICS AND PERFORMANCE
June 30, 2012
Portfolio Characteristics
| FPA Crescent | S&P 500 | Barclays Capital Gov't/Credit | |||||||||||||
| Stocks | |||||||||||||||
| Price/Earnings TTM | 13.7 | x | 15.3 | x | |||||||||||
| Price/Earnings 2011 est. | 10.9 | x | 13.0 | x | |||||||||||
| Price/Book | 1.4 | x | 2.2 | x | |||||||||||
| Dividend Yield | 1.7 | % | 2.2 | % | |||||||||||
| Average Weighted Market Cap (billion) | $ | 60.8 | $ | 110.5 | |||||||||||
| Median Market Cap (billion) | $ | 20.4 | $ | 12.0 | |||||||||||
| Bonds | |||||||||||||||
| Duration (years) | 0.6 | 5.9 | |||||||||||||
| Maturity (years) | 0.7 | 8.2 | |||||||||||||
| Yield-to-Worst | 2.1 | % | 1.8 | % | |||||||||||
| Yield-to-Worst (corporate only) | 11.3 | % | |||||||||||||
Portfolio Analysis
10 Largest Holdings
| CVS Caremark | 3.9 | % | |||||
| Aon | 3.4 | % | |||||
| Covidien | 2.8 | % | |||||
| Microsoft | 2.8 | % | |||||
| Anheuser-Busch* | 2.2 | % | |||||
| Wal-Mart Stores | 2.2 | % | |||||
| Cisco | 2.1 | % | |||||
| Omnicare | 2.0 | % | |||||
| Occidental | 1.9 | % | |||||
| Ensco plc | 1.9 | % | |||||
| Total | 25.2 | % | |||||
* Various issues
Excludes U.S. Gov't Securities
Portfolio Composition
| Asset Class | |||||||
| Common Stocks, Long | 66.3 | % | |||||
| Common Stocks, Short | -3.4 | % | |||||
| Other | 0.9 | % | |||||
| Corporate Fixed Income | 3.3 | % | |||||
| Corporate Fixed Income, Short | -0.1 | % | |||||
| Mortgage Backed | 1.8 | % | |||||
| US Govt Bonds and Agencies | 0.4 | % | |||||
| Liquidity** | 24.3 | % | |||||
| Geographic | |||||||
| U.S. | 46.0 | % | |||||
| Europe | 21.3 | % | |||||
| Other | 1.8 | % | |||||
** Liquidity defined as cash and high quality, liquid, limited term securities - net of shorts and collateral
Performance Statistics
| FPA Crescent | S&P 500 | 60% R2500/ 40% BCGC | |||||||||||||
| Statistics | |||||||||||||||
| Gain in Up Months - Cumulative | 383.8 | % | 492.9 | % | 387.0 | % | |||||||||
| Upside Participation | 77.9 | % | 99.2 | % | |||||||||||
| Loss in Down Months - Cumulative | -179.5 | % | -321.7 | % | -214.1 | % | |||||||||
| Downside Participation | 55.8 | % | 83.8 | % | |||||||||||
| Up Month - Average | 2.6 | % | 3.4 | % | 2.6 | % | |||||||||
| Down Month - Average | -2.2 | % | -3.8 | % | -2.7 | % | |||||||||
| Delta between Up/Down months | 4.8 | % | 7.2 | % | 5.3 | % | |||||||||
| Worst Month | -13.9 | % | -16.8 | % | -13.9 | % | |||||||||
| Best Month | 12.6 | % | 10.9 | % | 9.3 | % | |||||||||
| Standard Deviation | 10.69 | % | 15.43 | % | 11.27 | % | |||||||||
| Sharpe Ratio (using 5% risk-free rate) | 0.53 | 0.19 | 0.33 | ||||||||||||
| Performance | |||||||||||||||
| Quarter | -2.9 | % | -2.8 | % | -1.4 | % | |||||||||
| Calendar YTD | 3.6 | % | 9.5 | % | 6.2 | % | |||||||||
| 1 Year - Trailing | 1.6 | % | 5.5 | % | 2.8 | % | |||||||||
| 3 Years - Trailing | 11.0 | % | 16.4 | % | 14.9 | % | |||||||||
| 5 Years - Trailing | 3.8 | % | 0.2 | % | 4.2 | % | |||||||||
| 10 Years - Trailing | 8.3 | % | 5.3 | % | 7.7 | % | |||||||||
| 15 Years - Trailing | 8.6 | % | 4.8 | % | 7.7 | % | |||||||||
| From Inceptiona | 10.6 | % | 8.0 | % | 8.7 | % | |||||||||
18
PORTFOLIO CHARACTERISTICS AND PERFORMANCE
June 30, 2012
HISTORICAL PERFORMANCE
| Calendar Year-End | FPA Crescent | 60% R2500/ 40% BCGC | Russell 2500 | S&P 500 | |||||||||||||||
| 2012 | Q2 | -2.9 | % | -1.4 | % | -4.1 | % | -2.8 | % | ||||||||||
| 2011 | 3.0 | % | 2.5 | % | -2.5 | % | 2.1 | % | |||||||||||
| 2010 | 12.0 | % | 19.1 | % | 26.7 | % | 15.1 | % | |||||||||||
| 2009 | 28.4 | % | 22.5 | % | 34.4 | % | 26.5 | % | |||||||||||
| 2008 | -20.6 | % | -21.4 | % | -36.8 | % | -37.0 | % | |||||||||||
| 2007 | 6.8 | % | 3.9 | % | 1.4 | % | 5.5 | % | |||||||||||
| 2006 | 12.4 | % | 11.2 | % | 16.2 | % | 15.8 | % | |||||||||||
| 2005 | 10.8 | % | 6.0 | % | 8.1 | % | 4.9 | % | |||||||||||
| 2004 | 10.2 | % | 12.7 | % | 18.3 | % | 10.9 | % | |||||||||||
| 2003 | 26.2 | % | 28.1 | % | 45.5 | % | 28.7 | % | |||||||||||
| 2002 | 3.7 | % | -6.6 | % | -17.8 | % | -22.1 | % | |||||||||||
| 2001 | 36.1 | % | 4.8 | % | 1.2 | % | -11.9 | % | |||||||||||
| 2000 | 3.6 | % | 7.9 | % | 4.3 | % | -9.1 | % | |||||||||||
| 1999 | -6.3 | % | 13.3 | % | 24.2 | % | 21.0 | % | |||||||||||
| 1998 | 2.8 | % | 4.9 | % | 0.4 | % | 28.6 | % | |||||||||||
| 1997 | 22.0 | % | 18.5 | % | 24.4 | % | 33.4 | % | |||||||||||
| 1996 | 22.9 | % | 12.6 | % | 19.0 | % | 23.0 | % | |||||||||||
| 1995 | 26.0 | % | 26.7 | % | 31.7 | % | 37.6 | % | |||||||||||
| 1994 | 4.3 | % | -2.0 | % | -1.1 | % | 1.3 | % | |||||||||||
| 1993 | a | 9.6 | % | 8.2 | % | 10.1 | % | 4.4 | % | ||||||||||
Objective, Strategy and Rankings
Objective
The Fund's investment objective is to provide a total return consistent with reasonable investment risk through a combination of income and capital appreciation. We employ a strategy of selectively investing across a company's capital structure (i.e., a combination of equity and debt securities) that we believe have the potential to increase in market value, in order to achieve rates of return with less risk than the broad U.S. equity indices.
Strategy
To invest across a company's capital structure to meet our objective. This includes investing in Common and Preferred Stocks, Convertible Bonds, High-Yield Bonds, and Bank Debt. There is an occasional use of Government Bonds.
Downside Protection
FPA Crescent's ratio of positive to negative monthly performance is, on average from inception,a 10% better than the equity indexes. FPA Crescent has, on average from inception, captured 71% of the upside monthly performance but just 51% of the downside when compared to the equity indexes.
Volatility
FPA Crescent has exhibited much less volatility as measured by its Standard Deviation from inception.a On average, the Fund's Standard Deviation is 38% lower than the equity indexes. FPA Crescent has a much lower delta in its average monthly performance, i.e., the difference between the average positive and negative month when compared to the equity indexes.
FPA Crescent has had only two years of negative performance since inception,a the worst a loss of 21%. FPA Crescent's maximum drawdown is 36% better than its benchmarks.
| Crescent | 60% R2500/40% BCGC | R2500 | S&P 500 | ||||||||||||||||
| Number loss years since inceptiona | 2 | 3 | 4 | 4 | |||||||||||||||
| Maximum Drawdownb | -29 | % | -33 | % | -53 | % | -51 | % | |||||||||||
Performance
FPA Crescent has beaten the stock indexes for the inception-to-date time period.a
Conclusion
FPA Crescent has met its objective since inception, having achieved higher absolute rates of return than the indexes and a dramatically higher Sharpe Ratio.a
NOTES
a Inception date is June 2, 1993. Returns from inception are annualized. The annualized performance of the Russell 2500 and Barclays Capital Government/Credit Indexes begins 6/1/93.
b Maximum Drawdown is the largest percentage peak to trough decline in value that has occurred since inception.
Past performance is not necessarily indicative of future results. All returns assume the reinvestment of dividends and distributions. There are no assurances that the Fund will meet its stated objectives. The Fund's holdings and allocations are subject to change because it is actively managed and should not be considered recommendations to buy individual securities. Distributed by FPA Fund Distributors, Inc., a subsidiary of First Pacific Advisors, LLC.
Balanced Benchmark is a hypothetical combination of unmanaged indices comprised of 60% Russell 2500 Index and 40% Barclays Capital Government/Credit Index, reflecting the Fund's neutral mix of 60% stocks and 40% bonds.
Russell 2500 Index is an unmanaged index comprised of 2,500 stocks of U.S. companies with small market capitalizations.
Barclays Capital Government/Credit Index is an unmanaged index of investment grade bonds, including U.S. Government Treasury bonds, corporate bonds, and yankee bonds.
S&P 500 Index includes a representative sample of 500 leading companies in leading industries of the U.S. economy. The index focuses on the large-cap segment of the market, with over 80% coverage of U.S. equities, but is also considered a proxy for the total market.
19
FPA CRESCENT FUND
MAJOR PORTFOLIO CHANGES
For the Six Months Ended June 30, 2012
(Unaudited)
| Shares or Principal Amount | |||||||
| NET PURCHASES | |||||||
| Common Stocks | |||||||
| Alleghany Corporation (1) | 282,000 shs. | ||||||
| Cisco Systems, Inc. | 3,300,000 shs. | ||||||
| Google Inc. | 162,000 shs. | ||||||
| Oracle Corporation (1) | 4,460,000 shs. | ||||||
| Renault SA (1) | 1,950,000 shs. | ||||||
| Tesco plc | 10,436,050 shs. | ||||||
| Thales S.A. | 1,078,400 shs. | ||||||
| WellPoint, Inc. | 1,040,000 shs. | ||||||
| Western Digital Corporation | 1,360,000 shs. | ||||||
| Xerox Corporation | 5,595,000 shs. | ||||||
| Non-Convertible Bonds & Debentures | |||||||
| ATP Oil & Gas Corporation — 11.875% 2015 (1) | $ | 59,986,000 | |||||
| Florida Mortgage Resolution Trust Series 2012-4A — 6.31% 2050 (1) | $ | 26,708,510 | |||||
| William Lyon Homes Inc. — 10.25% 2015 (Floating) (1) | $ | 24,594,500 | |||||
| NET SALES | |||||||
| Common Stocks | |||||||
| Kraft Foods Inc. (2) | 1,230,000 shs. | ||||||
| Roche Holding AG — Genusschein (2) | 305,000 shs. | ||||||
| SECOM Co. Ltd. (2) | 805,600 shs. | ||||||
| Transatlantic Holdings Inc. (2) | 1,501,400 shs. | ||||||
| Wal-Mart Stores, Inc. | 1,880,000 shs. | ||||||
| Non-Convertible Bonds & Debentures | |||||||
| CIT Group Inc. | |||||||
| — 7% 2015 (2) | $ | 12,900,711 | |||||
| — 7% 2016 (2) | $ | 21,501,189 | |||||
| — 7% 2017 (2) | $ | 30,101,668 | |||||
| International Lease Finance Corporation | |||||||
| — 5.3% 2012 (2) | $ | 7,675,000 | |||||
| — 5.35% 2012 (2) | $ | 14,816,000 | |||||
| — 7.125% 2012 (2) | $ | 5,817,000 | |||||
(1) Indicates new commitment to portfolio
(2) Indicates elimination from portfolio
20
FPA CRESCENT FUND
PORTFOLIO OF INVESTMENTS
June 30, 2012
(Unaudited)
| COMMON STOCKS — LONG | Shares | Value | |||||||||
| RETAILING — 12.2% | |||||||||||
| CVS Caremark Corporation | 7,495,000 | $ | 350,241,350 | ||||||||
| Kao Corporation | 2,130,300 | 58,460,119 | |||||||||
| Lowe's Companies, Inc. | 4,925,000 | 140,067,000 | |||||||||
| PetSmart, Inc. | 2,076,900 | 141,603,042 | |||||||||
| Tesco plc | 31,096,050 | 151,011,747 | |||||||||
| Walgreen Co. | 2,175,000 | 64,336,500 | |||||||||
| Wal-Mart Stores, Inc. | 2,775,000 | 193,473,000 | |||||||||
| $ | 1,099,192,758 | ||||||||||
| TECHNOLOGY — 11.4% | |||||||||||
| Arris Group, Inc.* | 3,447,200 | $ | 47,950,552 | ||||||||
| Cisco Systems, Inc. | 10,815,000 | 185,693,550 | |||||||||
| Google Inc.* | 260,000 | 150,818,200 | |||||||||
| Hewlett-Packard Company | 2,991,800 | 60,165,098 | |||||||||
| Microsoft Corporation | 8,299,800 | 253,890,882 | |||||||||
| Oracle Corporation | 4,460,000 | 132,462,000 | |||||||||
| Western Digital Corporation* | 3,175,000 | 96,774,000 | |||||||||
| Xerox Corporation | 11,995,000 | 94,400,650 | |||||||||
| $ | 1,022,154,932 | ||||||||||
| HEALTH CARE — 10.8% | |||||||||||
| CareFusion Corp | 3,545,200 | $ | 91,040,736 | ||||||||
| Covidien plc | 4,780,000 | 255,730,000 | |||||||||
| Johnson & Johnson | 1,870,000 | 126,337,200 | |||||||||
| Omnicare, Inc. | 5,760,000 | 179,884,800 | |||||||||
| Thermo Fisher Scientific Inc.* | 3,190,000 | 165,592,900 | |||||||||
| WellPoint, Inc. | 2,395,000 | 152,777,050 | |||||||||
| $ | 971,362,686 | ||||||||||
| FINANCIAL SERVICES — 9.9% | |||||||||||
| Alleghany Corporation | 282,000 | $ | 95,809,500 | ||||||||
| American International Group, Inc.* | 3,640,000 | 116,807,600 | |||||||||
| Aon Corporation | 6,590,000 | 308,280,200 | |||||||||
| Bank of America Corporation | 3,745,000 | 30,634,100 | |||||||||
| The Bank Of New York Mellon Corporation | 4,425,000 | 97,128,750 | |||||||||
| CIT Group Inc.* | 2,705,000 | 96,406,200 | |||||||||
| Citigroup Inc. | 1,755,000 | 48,104,550 | |||||||||
| The Travelers Companies, Inc. | 1,555,000 | 99,271,200 | |||||||||
| $ | 892,442,100 | ||||||||||
21
FPA CRESCENT FUND
PORTFOLIO OF INVESTMENTS (Continued)
June 30, 2012
(Unaudited)
| COMMON STOCKS — LONG — Continued | Shares | Value | |||||||||
| ENERGY — 7.7% | |||||||||||
| Apache Corporation | 830,000 | $ | 72,948,700 | ||||||||
| Canadian Natural Resouces Limited | 5,100,000 | 136,935,000 | |||||||||
| Ensco plc (ADR) | 3,590,000 | 168,622,300 | |||||||||
| Groupe Bruxelles Lambert S.A. (ADR) | 1,485,000 | 100,477,328 | |||||||||
| Occidental Petroleum Corporation | 1,990,000 | 170,682,300 | |||||||||
| Rowan Companies, Inc. | 1,425,000 | 46,070,250 | |||||||||
| $ | 695,735,878 | ||||||||||
| CONSUMER NON-DURABLE GOODS — 3.5% | |||||||||||
| Anheuser-Busch InBev SA/NV (ADR) | 2,413,800 | $ | 192,259,170 | ||||||||
| Anheuser-Busch InBev SA/NV | 90,000 | 6,977,349 | |||||||||
| Unilever N.V. — NY shares | 334,632 | 11,159,977 | |||||||||
| Unilever N.V. | 3,094,147 | 103,248,901 | |||||||||
| $ | 313,645,397 | ||||||||||
| INDUSTRIAL PRODUCTS — 3.3% | |||||||||||
| AGCO Corporation* | 945,000 | $ | 43,214,850 | ||||||||
| Henkel AG &Co. KGaA | 920,000 | 50,830,828 | |||||||||
| Owens-Illinois, Inc.* | 5,624,300 | 107,817,831 | |||||||||
| Thales S.A. | 2,990,000 | 98,393,425 | |||||||||
| $ | 300,256,934 | ||||||||||
| ADVERTISING — 1.8% | |||||||||||
| The Interpublic Group of Companies | 4,421,800 | $ | 47,976,530 | ||||||||
| WPP plc | 9,574,408 | 115,922,145 | |||||||||
| $ | 163,898,675 | ||||||||||
| AUTOMOTIVE — 1.1% | |||||||||||
| Group 1 Automotive, Inc. | 426,800 | $ | 19,466,348 | ||||||||
| Renault S.A. | 1,950,000 | 77,536,290 | |||||||||
| $ | 97,002,638 | ||||||||||
| TELECOMMUNICATIONS — 1.0% | |||||||||||
| Vodafone Group plc (ADR) | 2,990,000 | $ | 84,258,200 | ||||||||
| REAL ESTATE — 0.8% | |||||||||||
| Countrywide Holdings, Ltd.— A*,** | 3,171,611 | $ | 12,916,069 | ||||||||
| Countrywide Holdings, Ltd.— B*,** | 3,171,611 | — | |||||||||
| Genting Malaysia Berhad | 53,251,200 | 60,818,195 | |||||||||
| $ | 73,734,264 | ||||||||||
22
FPA CRESCENT FUND
PORTFOLIO OF INVESTMENTS (Continued)
June 30, 2012
(Unaudited)
| COMMON STOCKS — LONG — Continued | Shares or Principal Amount | Value | |||||||||
| OTHER COMMON STOCKS — 2.8% | $ | 250,724,435 | |||||||||
| TOTAL COMMON STOCKS — LONG — 66.3% (Cost $5,427,800,626) | $ | 5,964,408,897 | |||||||||
| LIMITED PARTNERSHIPS — 0.7% (Cost $64,361,793) | |||||||||||
| Endeavour Financial Restoration Fund, L.P.*,**,†† | $ | 32,000,000 | $ | 34,260,384 | |||||||
| U.S. Farming Realty Trust, L.P.*,**,†† | 32,361,793 | 32,057,074 | |||||||||
| $ | 66,317,458 | ||||||||||
| CURRENCY DERIVATIVES/FUTURES — 0.2% (Cost $15,567,359) | |||||||||||
| Currency JPY Swaption 02/27/14* | 51,459,597,000 | $ | 135,166 | ||||||||
| Euro @ € 1.26487 — 07/19/12* | 15,000,000 | 2,550 | |||||||||
| British Pounds @ £1.58194 — 07/23/12* | 60,000,000 | 938,400 | |||||||||
| Euro @ € 1.29669— 08/14/12* | 103,300,000 | 3,304,567 | |||||||||
| Yen @ ¥ 78.964 — 08/22/12* | 4,400,000,000 | 687,198 | |||||||||
| JPY Put @0.07525 — 03/24/22* | 194,350,000 | 11,120,707 | |||||||||
| $ | 16,188,588 | ||||||||||
| BONDS & DEBENTURES CONVERTIBLE BONDS & DEBENTURES | |||||||||||
| HEALTH CARE — 0.1% | |||||||||||
| Omnicare Inc. — 3.75% 2025 | $ | 6,959,000 | $ | 9,124,989 | |||||||
| FINANCIAL SERVICES — 0.1% | |||||||||||
| iStar Financial Inc.— 0.74575% 2012 (Floating) | $ | 8,911,000 | $ | 8,821,890 | |||||||
| TOTAL CONVERTIBLE BONDS & DEBENTURES — 0.2% (Cost $15,055,269) | $ | 17,946,879 | |||||||||
23
FPA CRESCENT FUND
PORTFOLIO OF INVESTMENTS (Continued)
June 30, 2012
(Unaudited)
| NON-CONVERTIBLE BONDS & DEBENTURES | Principal Amount | Value | |||||||||
| CORPORATE BONDS & DEBENTURES | |||||||||||
| REAL ESTATE — 2.3% | |||||||||||
| Countrywide Holdings, Ltd. — 10% 2018 Reg S** | $ | 3,539,051 | $ | 5,543,215 | |||||||
| Countrywide Holdings, Ltd. — 10% 2018** | 8,348,952 | 13,076,963 | |||||||||
| MOB Participation — 9.75% 2014**,†† | 17,253,609 | 17,253,609 | |||||||||
| Stanwich Mortgage Loan Trust Series | |||||||||||
| 2009-2 — 3.16% 2049**,†† | 11,898,506 | 5,321,012 | |||||||||
| 2010-1A — 3.11% 2047**,†† | 8,459,149 | 4,278,638 | |||||||||
| 2010-2A — 2.67% 2057**,†† | 39,650,779 | 19,991,923 | |||||||||
| 2010-3A — 9.16% 2038**,†† | 20,500,540 | 10,256,420 | |||||||||
| 2010-4A — 5.71% 2049**,†† | 30,560,611 | 14,280,974 | |||||||||
| 2011-1A — 5.03% 2049**,†† | 60,620,652 | 31,973,090 | |||||||||
| 2011-2A — 5.11% 2049**,†† | 39,071,776 | 20,911,371 | |||||||||
| 2012-2A — 0.02% 2047**,†† | 21,786,264 | 8,388,561 | |||||||||
| 2012-4A — 1.29% 2051**,†† | 41,689,357 | 18,512,994 | |||||||||
| Florida Mortgage Resolution Trust Series 2012-4A — 6.31% 2050**,†† | 25,686,600 | 9,450,026 | |||||||||
| William Lyon Homes Inc. — 10.25% 2015 (Floating)**,†† | 24,594,500 | 24,594,500 | |||||||||
| $ | 203,833,296 | ||||||||||
| FINANCIAL SERVICES — 1.8% | |||||||||||
| American Capital, Ltd. — 8.96% 2013 | $ | 46,724,000 | $ | 46,957,620 | |||||||
| International Lease Finance Corporation | |||||||||||
| —5.875% 2013 | 6,976,000 | 7,115,520 | |||||||||
| —5.65% 2014 | 5,515,000 | 5,669,420 | |||||||||
| —6.625% 2013 | 1,612,000 | 1,664,390 | |||||||||
| iStar Financial Inc. | |||||||||||
| —5.7% 2014 | 20,649,000 | 19,410,060 | |||||||||
| —5.85% 2017 | 4,950,000 | 4,356,000 | |||||||||
| —5.875% 2016 | 18,785,000 | 16,906,500 | |||||||||
| —6.05% 2015 | 6,912,000 | 6,429,888 | |||||||||
| Springleaf Financial Services | |||||||||||
| —4.875% 2012 | 8,141,000 | 8,119,019 | |||||||||
| —5.375% 2012 | 18,011,000 | 17,834,492 | |||||||||
| —5.75% 2016 | 5,100,000 | 4,040,730 | |||||||||
| —5.85% 2013 | 3,486,000 | 3,346,560 | |||||||||
| —5.9% 2012 | 357,000 | 354,394 | |||||||||
| —6.5% 2017 | 8,980,000 | 7,002,604 | |||||||||
| —6.9% 2017 | 15,366,000 | 12,298,332 | |||||||||
| $ | 161,505,529 | ||||||||||
24
FPA CRESCENT FUND
PORTFOLIO OF INVESTMENTS (Continued)
June 30, 2012
(Unaudited)
| NON-CONVERTIBLE BONDS & DEBENTURES — Continued | Principal Amount | Value | |||||||||
| ENERGY — 0.3% | |||||||||||
| ATP Oil & Gas Corporation — 11.875% 2015 | $ | 59,986,000 | $ | 27,593,560 | |||||||
| INDUSTRIAL PRODUCTS — 0.3% | |||||||||||
| Kion Group | |||||||||||
| —2.4709% 2014 Term Loan B (Floating)** | $ | 12,697,117 | $ | 11,378,902 | |||||||
| —2.7209% 2015 Term Loan C (Floating** | 12,696,398 | 11,448,596 | |||||||||
| $ | 22,827,498 | ||||||||||
| UTILITIES — 0.2% | |||||||||||
| GenOn Energy, Inc. — 7.625% 2014 | $ | 15,230,000 | $ | 15,502,617 | |||||||
| BUSINESS SERVICES — 0.0% | |||||||||||
| First Data Corporation — 2.9846% 2014 (Floating)** | $ | 4,372,879 | $ | 4,212,526 | |||||||
| TOTAL CORPORATE BONDS & DEBENTURES — 4.9% | $ | 435,475,026 | |||||||||
| U.S. GOVERNMENT & AGENCIES — 24.2% | |||||||||||
| Federal National Mortgage Association | |||||||||||
| —0.28% 2012 (Floating) | $ | 35,570,000 | $ | 35,595,966 | |||||||
| —7.5% 2028 | 38,429 | 44,647 | |||||||||
| U.S. Treasury Notes | |||||||||||
| —0.375% 2012 | 160,000,000 | 160,068,800 | |||||||||
| —0.375% 2012† | 950,000,000 | 950,703,000 | |||||||||
| —0.625% 2012 | 25,000,000 | 24,999,000 | |||||||||
| —0.625% 2012 | 50,000,000 | 50,019,500 | |||||||||
| —0.625% 2013† | 345,000,000 | 345,875,955 | |||||||||
| —1.375% 2013 | 455,000,000 | 457,898,805 | |||||||||
| —3.875% 2013 | 120,000,000 | 122,737,080 | |||||||||
| —4.875% 2012 | 35,000,000 | 35,002,800 | |||||||||
| TOTAL U.S. GOVERNMENT & AGENCIES | $ | 2,182,945,553 | |||||||||
| TOTAL NON-CONVERTIBLE BONDS & DEBENTURES — 29.1% (Cost $2,553,499,233) | $ | 2,618,420,579 | |||||||||
| TOTAL INVESTMENT SECURITIES — 96.5% (Cost $8,076,284,280) | $ | 8,683,282,401 | |||||||||
25
FPA CRESCENT FUND
PORTFOLIO OF INVESTMENTS (Continued)
June 30, 2012
(Unaudited)
| SHORT-TERM INVESTMENTS — 4.6% | Shares or Principal Amount | Value | |||||||||
| Short-term Corporate Notes: | |||||||||||
| Exxon Mobil Corporation | |||||||||||
| —0.04% 07/11/12 | $ | 50,000,000 | $ | 49,999,444 | |||||||
| —0.06% 07/18/12 | 55,380,000 | 55,378,431 | |||||||||
| Federal Home Loan Bank | |||||||||||
| —0.07% 08/02/12 | 55,000,000 | 54,996,578 | |||||||||
| —0.07% 08/02/12 | 74,900,000 | 74,895,340 | |||||||||
| —0.075% 07/24/12 | 76,000,000 | 75,996,358 | |||||||||
| —0.08% 08/20/12 | 40,000,000 | 39,995,556 | |||||||||
| Federal National Mortgage Association — 0.06% 07/09/12 | 50,000,000 | 49,999,333 | |||||||||
| State Street Bank Repurchase Agreement — 0.01% 07/02/12 (Collateralized by $14,355,000 Face Amount U.S. Treasury Note — 3.125% 2041, market value $15,481,997) | 15,177,000 | 15,177,000 | |||||||||
| TOTAL SHORT-TERM INVESTMENTS (Cost $416,438,040) | $ | 416,438,040 | |||||||||
| TOTAL INVESTMENTS — 101.1% (Cost $8,492,722,320) | $ | 9,099,720,441 | |||||||||
| SECURITIES SOLD SHORT | |||||||||||
| COMMON STOCKS SOLD SHORT | |||||||||||
| American Greetings Corporation (Class A) | (419,800 | ) | $ | (6,137,476 | ) | ||||||
| Avalonbay Communities, Inc. | (100,400 | ) | (14,204,592 | ) | |||||||
| Banco Bilbao Vizcaya Argentaria, S.A. (ADR) | (200,657 | ) | (1,418,645 | ) | |||||||
| Banco Popular Espanol, S.A. | (287,457 | ) | (648,216 | ) | |||||||
| Douglas Emmett | (417,600 | ) | (9,646,560 | ) | |||||||
| Essex Propertry Trust, Inc. | (88,200 | ) | (13,575,744 | ) | |||||||
| Express Scripts, Inc.* | (385,427 | ) | (21,518,389 | ) | |||||||
| Federal Realty Investment Trust | (107,300 | ) | (11,168,857 | ) | |||||||
| HCP, Inc. | (226,700 | ) | (10,008,805 | ) | |||||||
| Hospitality Properties Trust | (182,300 | ) | (4,515,571 | ) | |||||||
| Intuitive Surgical, Inc.* | (9,900 | ) | (5,482,521 | ) | |||||||
| Jarden Corporation | (102,900 | ) | (4,323,858 | ) | |||||||
| Nissan Motor Co., Ltd. | (12,148,800 | ) | (113,661,743 | ) | |||||||
| PharMerica Corporation* | (320,700 | ) | (3,502,044 | ) | |||||||
| Pool Corporation | (143,000 | ) | (5,785,780 | ) | |||||||
| Texas Roadhouse, Inc. (Class A) | (297,000 | ) | (5,473,710 | ) | |||||||
| Ventas Inc. | (61,800 | ) | (3,900,816 | ) | |||||||
26
FPA CRESCENT FUND
PORTFOLIO OF INVESTMENTS (Continued)
June 30, 2012
(Unaudited)
| SECURITIES SOLD SHORT — Continued | Shares or Principal Amount | Value | |||||||||
| Verizon Communications Inc. | (1,044,500 | ) | $ | (46,417,580 | ) | ||||||
| Volvo AB | (914,886 | ) | (10,406,005 | ) | |||||||
| $ | (291,796,912 | ) | |||||||||
| OTHER COMMON STOCKS SOLD SHORT | $ | (16,382,096 | ) | ||||||||
| TOTAL COMMON STOCKS SOLD SHORT | $ | (308,179,008 | ) | ||||||||
| NON-CONVERTIBLE BONDS & DEBENTURES SOLD SHORT | |||||||||||
| Safeway Inc. — 3.95% 2020 | $ | (6,810,000 | ) | $ | (6,530,177 | ) | |||||
| TOTAL SECURITIES SOLD SHORT — (3.5)% (Proceeds $280,725,613) | $ | (314,709,185 | ) | ||||||||
| Other assets less liabilities, net — 2.4% | $ | 217,859,790 | |||||||||
| TOTAL NET ASSETS — 100.0% — NOTE 2 | $ | 9,002,871,046 | |||||||||
* Non-income producing security.
** Restricted securities. These restricted securities constituted 3.4% of total net assets at June 30, 2012.
† Security segregated as collateral for securities sold short.
†† These securities have been valued in good faith under policies adopted by authority of the Board of Trustees in accordance with the Fund's fair value procedures. These securities constituted 2.8% of total net assets at June 30, 2012.
See notes to financial statements.
27
FPA CRESCENT FUND
STATEMENT OF ASSETS AND LIABILITIES
June 30, 2012
(Unaudited)
| ASSETS | |||||||||||
| Investments at value: | |||||||||||
| Investment securities — at market value (identified cost $8,076,284,280) | $ | 8,683,282,401 | |||||||||
| Short-term investments — at amortized cost (maturities 60 days or less) | 416,438,040 | $ | 9,099,720,441 | ||||||||
| Cash | 483 | ||||||||||
| Deposits for securities sold short | 200,399,492 | ||||||||||
| Receivable for: | |||||||||||
| Dividends and accrued interest | 25,887,861 | ||||||||||
| Investment securities sold | 23,355,868 | ||||||||||
| Capital stock sold | 22,444,985 | ||||||||||
| Other assets | 485,317 | ||||||||||
| $ | 9,372,294,447 | ||||||||||
| LIABILITIES | |||||||||||
| Payable for: | |||||||||||
| Securities sold short, at market value (proceeds $280,725,613) | $ | 314,709,185 | |||||||||
| Investment securities purchased | 33,554,778 | ||||||||||
| Capital stock repurchased | 10,482,604 | ||||||||||
| Advisory fees and financial services | 8,040,008 | ||||||||||
| Accrued expenses | 1,685,313 | ||||||||||
| Dividends and accrued interest expense on securities sold short | 628,689 | ||||||||||
| Other liabilities | 322,824 | 369,423,401 | |||||||||
| NET ASSETS | $ | 9,002,871,046 | |||||||||
| SUMMARY OF SHAREHOLDERS' EQUITY | |||||||||||
| Capital Stock — no par value; unlimited authorized shares; 324,718,710 outstanding shares | $ | 8,210,161,755 | |||||||||
| Undistributed net realized gain on investments | 186,359,096 | ||||||||||
| Undistributed net investment income | 33,335,646 | ||||||||||
| Unrealized appreciation of investments | 573,014,549 | ||||||||||
| NET ASSETS | $ | 9,002,871,046 | |||||||||
| NET ASSET VALUE | |||||||||||
| Offering and redemption price per share | $ | 27.73 | |||||||||
See notes to financial statements.
28
FPA CRESCENT FUND
STATEMENT OF OPERATIONS
For the Six Months Ended June 30, 2012
(Unaudited)
| INVESTMENT INCOME | |||||||||||
| Interest | $ | 28,060,241 | |||||||||
| Dividends | 63,482,800 | ||||||||||
| $ | 91,543,041 | ||||||||||
| EXPENSES: | |||||||||||
| Advisory fees | $ | 42,447,900 | |||||||||
| Short sale dividend & interest expense | 4,439,551 | ||||||||||
| Financial services | 4,244,790 | ||||||||||
| Transfer agent fees and expenses | 2,276,576 | ||||||||||
| Custodian fees and expenses | 297,655 | ||||||||||
| Registration fees | 119,735 | ||||||||||
| Reports to shareholders | 103,970 | ||||||||||
| Trustees' fees and expenses | 62,737 | ||||||||||
| Audit and tax service fees | 33,606 | ||||||||||
| Legal fees | 18,460 | ||||||||||
| Other expenses | 279,457 | 54,324,437 | |||||||||
| Net investment income | $ | 37,218,604 | |||||||||
| NET REALIZED AND UNREALIZED GAIN (LOSS) ON INVESTMENTS | |||||||||||
| Net realized gain on investments: | |||||||||||
| Net realized gain on sale of investment securities | $ | 154,115,181 | |||||||||
| Net realized gain on expiration of foreign currency contracts | 888,629 | ||||||||||
| Net realized loss on sale of investment securities sold short | (5,849,754 | ) | |||||||||
| Net realized gain on investments | $ | 149,154,056 | |||||||||
| Change in unrealized appreciation of investments: | |||||||||||
| Investment securities | $ | 68,772,707 | |||||||||
| Investment securities sold short | (2,556,792 | ) | |||||||||
| Foreign currency contracts | 1,054,191 | ||||||||||
| Change in unrealized appreciation of investments | 67,270,106 | ||||||||||
| Net realized and unrealized gain on investments | $ | 216,424,162 | |||||||||
| CHANGE IN NET ASSETS RESULTING FROM OPERATIONS | $ | 253,642,766 | |||||||||
See notes to financial statements.
29
FPA CRESCENT FUND
STATEMENT OF CHANGES IN NET ASSETS
| Six Months Ended June 30, 2012 (Unaudited) | Nine Months Ended December 31, 2011 | ||||||||||||||||||
| CHANGES IN NET ASSETS | |||||||||||||||||||
| Operations: | |||||||||||||||||||
| Net investment income | $ | 37,218,604 | $ | 46,151,463 | |||||||||||||||
| Net realized gain on investments | 149,154,056 | 166,047,744 | |||||||||||||||||
| Change in unrealized appreciation of investments | 67,270,106 | (291,055,272 | ) | ||||||||||||||||
| Change in net assets resulting from operations | $ | 253,642,766 | $ | (78,856,065 | ) | ||||||||||||||
| Distributions to shareholders from: | |||||||||||||||||||
| Net investment income | — | $ | (77,120,318 | ) | |||||||||||||||
| Net realized capital gains | — | — | (136,279,779 | ) | (213,400,097 | ) | |||||||||||||
| Capital Stock transactions: | |||||||||||||||||||
| Proceeds from Capital Stock sold | $ | 2,003,743,557 | $ | 2,575,270,988 | |||||||||||||||
| Proceeds from shares issued to shareholders upon reinvestment of dividends and distributions | — | 176,792,294 | |||||||||||||||||
| Cost of Capital Stock repurchased* | (733,045,996 | ) | 1,270,697,561 | (1,014,042,761 | ) | 1,738,020,521 | |||||||||||||
| Total change in net assets | $ | 1,524,340,327 | $ | 1,445,764,359 | |||||||||||||||
| NET ASSETS | |||||||||||||||||||
| Beginning of period | 7,478,530,719 | 6,032,766,360 | |||||||||||||||||
| End of period | $ | 9,002,871,046 | $ | 7,478,530,719 | |||||||||||||||
| CHANGE IN CAPITAL STOCK OUTSTANDING | |||||||||||||||||||
| Shares of Capital Stock sold | 71,887,466 | 94,763,506 | |||||||||||||||||
| Shares issued to shareholders upon reinvestment of dividends and distributions | — | 6,557,702 | |||||||||||||||||
| Shares of Capital Stock repurchased | (26,394,380 | ) | (37,742,571 | ) | |||||||||||||||
| Increase (decrease) in Capital Stock outstanding | 45,493,086 | 63,578,637 | |||||||||||||||||
* Net of redemption fees of $443,404 and $812,783 for the periods ended June 30, 2012 and December 31, 2011, respectively.
See notes to financial statements.
30
FPA CRESCENT FUND
FINANCIAL HIGHLIGHTS
Selected Data for Each Share of Capital Stock Outstanding Throughout Each Period
| Six Months Ended June 30, | Nine Months Ended December | Year Ended March 31, | |||||||||||||||||||||||||
| 2012 (Unaudited) | 31, 2011 | 2011 | 2010 | 2009 | 2008 | ||||||||||||||||||||||
| Per share operating performance: | |||||||||||||||||||||||||||
| Net asset value at beginning of period | $ | 26.78 | $ | 27.98 | $ | 25.88 | $ | 19.11 | $ | 24.99 | $ | 26.98 | |||||||||||||||
| Income from investment operations: | |||||||||||||||||||||||||||
| Net investment income | $ | 0.12 | $ | 0.20 | $ | 0.31 | $ | 0.31 | $ | 0.35 | $ | 0.59 | |||||||||||||||
| Net realized and unrealized gain (loss) on investment securities | 0.83 | (0.58 | ) | 2.75 | 6.77 | (5.63 | ) | 0.33 | |||||||||||||||||||
| Total from investment operations | $ | 0.95 | $ | (0.38 | ) | $ | 3.06 | $ | 7.08 | $ | (5.28 | ) | $ | 0.92 | |||||||||||||
| Less distributions: | |||||||||||||||||||||||||||
| Dividends from net investment income | — | $ | (0.31 | ) | $ | (0.32 | ) | $ | (0.31 | ) | $ | (0.37 | ) | $ | (0.75 | ) | |||||||||||
| Distributions from net realized capital gains | — | (0.51 | ) | (0.64 | ) | — | (0.23 | ) | (2.16 | ) | |||||||||||||||||
| Total distributions | — | $ | (0.82 | ) | $ | (0.96 | ) | $ | (0.31 | ) | $ | (0.60 | ) | $ | (2.91 | ) | |||||||||||
| Redemption fees | — | * | — | * | — | * | — | * | — | * | — | * | |||||||||||||||
| Net asset value at end of period | $ | 27.73 | $ | 26.78 | $ | 27.98 | $ | 25.88 | $ | 19.11 | $ | 24.99 | |||||||||||||||
| Total investment return** | 3.55 | % | (1.36 | )% | 12.22 | % | 37.22 | % | (21.57 | )% | 3.30 | % | |||||||||||||||
| Ratios/supplemental data: | |||||||||||||||||||||||||||
| Net assets at end of year (in $000's) | $ | 9,002,871 | $ | 7,478,531 | $ | 6,032,766 | $ | 3,291,711 | $ | 1,263,061 | $ | 1,246,165 | |||||||||||||||
| Ratio of expenses to average net assets | 1.26 | %†‡ | 1.25 | %†‡ | 1.28 | %‡ | 1.34 | %‡ | 1.50 | %‡ | 1.34 | %‡ | |||||||||||||||
| Ratio of net investment income to average net assets | 0.86 | %† | 0.89 | %† | 0.87 | % | 1.32 | % | 1.65 | % | 2.06 | % | |||||||||||||||
| Portfolio turnover rate | 22 | %† | 32 | %† | 20 | % | 32 | % | 32 | % | 29 | % | |||||||||||||||
* Rounds to less than $0.01 per share.
** Return is based on net asset value per share, adjusted for reinvestment of distributions. The return for the six months ended June 30, 2012 and the nine months ended December 31, 2011 is not annualized.
† Annualized
‡ For the periods ended June 30, 2012, December 31, 2011, March 31, 2011, March 31, 2010, March 31, 2009, and March 31, 2008, the expense ratio includes short sale dividend expense equal to 0.10%, 0.07%, 0.12%, 0.17%, 0.27%, and 0.12% of average net assets, respectively.
See notes to financial statements.
31
FPA CRESCENT FUND
NOTES TO FINANCIAL STATEMENTS
June 30, 2012
(Unaudited)
NOTE 1 — Significant Accounting Policies
FPA Crescent Fund (the "Fund"), a series of the FPA Funds Trust, is registered under the Investment Company Act of 1940 as an open-end, diversified, management investment company. The Fund's investment objective is to provide a total return consistent with reasonable risk through a combination of income and capital appreciation by investing in a combination of equity securities and fixed income obligations. The following is a summary of significant accounting policies consistently followed by the Fund in the preparation of its financial statements.
A. Security Valuation
The Fund's investments are reported at fair value as defined by accounting principles generally accepted in the United States of America. The Fund generally determines its net asset value as of approximately 4:00 p.m. New York time each day the New York Stock Exchange is open. Further discussion of valuation methods, inputs and classifications can be found under Note 9.
B. Securities Transactions and Related Investment Income
Securities transactions are accounted for on the date the securities are purchased or sold. Dividend income and distributions to shareholders are recorded on the ex-dividend date. Interest income and expenses are recorded on an accrual basis.
C. Use of Estimates
The preparation of the financial statements in conformity with accounting principles generally accepted in the United States of America requires management to make estimates and assumptions that affect the amounts reported. Actual results could differ from those estimates.
NOTE 2 — Risk Considerations
Investing in the Fund may involve certain risks including, but not limited to, those described below.
Market Risk: Because the values of the Fund's investments will fluctuate with market conditions, so will the value of your investment in the Fund. You could lose money on your investment in the Fund or the Fund could underperform other investments.
Common Stocks and Other Securities (Long): The prices of common stocks and other securities held by the Fund may decline in response to certain events taking place around the world, including those directly involving companies whose securities are owned by the Fund; conditions affecting the general economy; overall market changes; local, regional or global political, social or economic instability; and currency, interest rate and commodity price fluctuations.
Common Stocks and Other Securities (Short): The prices of common stocks and other securities sold short rise between the date of the short sale and the date on which the Fund replaces the borrowed security. In addition, the Fund repays the person that lent it the security for any interest or dividends that may have accrued.
Interest Rate Risk: The values of, and the income generated by, most debt securities held by the Fund may be affected by changing interest rates and by changes in the effective maturities and credit rating of these securities. For example, the value of debt securities in the Fund's portfolio generally will decline when interest rates rise and increase when interest rates fall. In addition, falling interest rates may cause an issuer to redeem, call or refinance a security before its stated maturity, which may result in the Fund having to reinvest the proceeds in lower yielding securities.
Credit Risk: The values of any of the Fund's investments may also decline in response to events affecting the issuer or its credit rating. The lower rated debt securities in which the Fund may invest are considered speculative and are generally subject to greater volatility and risk of loss than investment grade securities, particularly in deteriorating
32
FPA CRESCENT FUND
NOTES TO FINANCIAL STATEMENTS (Continued)
June 30, 2012
(Unaudited)
economic conditions. The Fund invests a significant portion of its assets in securities of issuers that hold mortgage- and asset-backed securities and direct investments in securities backed by commercial and residential mortgage loans and other financial assets. The value and related income of these securities is sensitive to changes in economic conditions, including delinquencies and/or defaults. Though the Fund has not been adversely impacted, continuing shifts in the market's perception of credit quality on securities backed by commercial and residential mortgage loans and other financial assets may result in increased volatility of market price and periods of illiquidity that can negatively impact the valuation of certain securities held by the Fund.
NOTE 3 — Purchases and Sales of Investment Securities
Cost of purchases of investment securities (excluding securities sold short and short-term investments with maturities of 60 days or less at the time of purchase) aggregated $3,534,836,719 for the six month period ended June 30, 2012. The proceeds and cost of securities sold resulting in net realized gains of $149,154,056 aggregated $2,516,520,651 and $2,367,366,595, respectively, for the six month period ended June 30, 2012. Realized gains or losses are based on the specific identification method.
NOTE 4 — Federal Income Tax
No provision for federal income tax is required because the Fund has elected to be taxed as a "regulated investment company" under the Internal Revenue Code and intends to maintain this qualification and to distribute each year to its shareholders, in accordance with the distribution requirements of the Code, all of its taxable net investment income and taxable net realized gains on investments.
The cost of investment securities (excluding securities sold short) held at June 30, 2012, for federal income tax purposes was $8,082,292,201. Gross unrealized appreciation and depreciation for all investment securities at June 30, 2012, for federal income tax purposes was $894,981,966 and $293,991,766 respectively resulting in net unrealized appreciation of $600,990,200. As of and during the six month period ended June 30, 2012, the Fund did not have any liability for unrecognized tax benefits. The Fund recognizes interest and penalties, if any, related to unrecognized tax benefits as income tax expense in the Statement of Operations. During the six month period, the Fund did not incur any interest or penalties. The Fund is not subject to examination by U.S. federal tax authorities for years ended on or before December 31, 2008 or by state tax authorities for years ended on or before December 31, 2007.
NOTE 5 — Advisory Fees and Other Affiliated Transactions
Pursuant to an Investment Advisory Agreement, advisory fees were paid by the Fund to First Pacific Advisors, LLC (the "Adviser"). Under the terms of this Agreement, the Fund pays the Adviser a monthly fee calculated at the annual rate of 1.00% of the Fund's average daily net assets. In addition, the Fund pays the Adviser an amount equal to 0.10% of the average daily net assets for each fiscal year for the provision of financial services to the Fund. The Adviser has agreed to voluntarily reduce its fees for any annual expenses (exclusive of short sale dividends, interest, taxes, the cost of any supplemental statistical and research information, and extraordinary expenses such as litigation) in excess of 1.85% of the average net assets of the Fund for the year. The Adviser is not obligated to continue this fee reduction policy indefinitely. No fees were waived during the period.
For the six month period ended June 30, 2012, the Fund paid aggregate fees of $62,000 to all Trustees who are not interested persons of the Adviser. Certain officers of the Fund are also officers of the Adviser and FPA Fund Distributors. Inc.
33
FPA CRESCENT FUND
NOTES TO FINANCIAL STATEMENTS (Continued)
June 30, 2012
(Unaudited)
NOTE 6 — Securities Sold Short
The Fund maintains cash deposits and segregates marketable securities in amounts equal to the current market value of the securities sold short or the market value of the securities at the time they were sold short, whichever is greater. Possible losses from short sales may be unlimited, whereas losses from purchases cannot exceed the total amount invested. The dividends on securities sold short are reflected as short sale dividend expense.
NOTE 7 — Redemption Fees
A redemption fee of 2% applies to redemptions within 90 days of purchase. For the six month period ended June 30, 2012, the Fund collected $443,404 in redemption fees, which amounts to less than $0.01 per share.
NOTE 8 — Distributor
FPA Fund Distributors, Inc. ("Distributor"), a wholly owned subsidiary of the Adviser, received no fees for distribution services during the year. The distributor pays its own overhead and general administrative expenses, the cost of supplemental sales literature, promotion and advertising.
NOTE 9 — Disclosure of Fair Value Measurements
The Fund uses the following methods and inputs to establish the fair value of its assets and liabilities. Use of particular methods and inputs may vary over time based on availability and relevance as market and economic conditions evolve.
Equity securities are generally valued at the official closing price of, or the last reported sale price on, the exchange or market on which such securities are traded, as of the close of business on the day the securities are being valued or, lacking any sales, at the last available bid price. Prices for each security are taken from the principal exchange or market in which the security trades. Securities that are unlisted and fixed-income and convertible securities listed on a national securities exchange for which the over-the-counter market more accurately reflects the securities' value in the judgment of the Fund's officers, are valued at the most recent bid price. However, most fixed income securities are generally valued at prices obtained from pricing vendors. Vendors value such securities based on one or more of the following inputs: transactions, bids, offers quotations from dealers and trading systems, spreads and other relationships observed in the markets among comparable securities, benchmarks, underlying equity of the issuer, and proprietary pricing models such as cash flows, financial or collateral performance and other reference data (includes prepayments, defaults, collateral, credit enhancements, and interest rate volatility). Short-term corporate notes with maturities of 60 days or less are valued at amortized cost, which approximates market value.
Securities for which representative market quotations are not readily available or are considered unreliable by the Adviser are valued as determined in good faith under guidelines adopted by authority of the Fund's Board of Trustees. Various inputs may be reviewed in order to make a good faith determination of a security's value. These inputs include, but are not limited to, the type and cost of the security; contractual or legal restrictions on resale of the security; relevant financial or business developments of the issuer; actively traded similar or related securities; conversion or exchange rights on the security; related corporate actions; significant events occurring after the close of trading in the security; and changes in overall market conditions. Fair valuations and valuations of investments that are not actively trading involve judgment and may differ materially from valuations of investments that would have been used had greater market activity occurred.
The Fund classifies its assets based on three valuation methodologies. Level 1 values are based on quoted market prices in active markets for identical assets. Level 2 values are based on significant observable market inputs, such as quoted prices for similar assets and quoted prices in inactive markets or other market observable inputs as noted above including spreads, cash flows, financial performance, prepayments, defaults, collateral, credit
34
FPA CRESCENT FUND
NOTES TO FINANCIAL STATEMENTS (Continued)
June 30, 2012
(Unaudited)
enhancements, and interest rate volatility. Level 3 values are based on significant unobservable inputs that reflect the Fund's determination of assumptions that market participants might reasonably use in valuing the assets. These assumptions consider inputs such as proprietary pricing models, cash flows, prepayments, defaults, and collateral. The valuation levels are not necessarily an indication of the risk associated with investing in those securities. The following table presents the valuation levels of the Fund's investments as of June 30, 2012:
| Investments | Level 1 | Level 2 | Level 3 | Total | |||||||||||||||
| Common Stocks — Long | $ | 5,951,492,828 | — | $ | 12,916,069 | $ | 5,964,408,897 | ||||||||||||
| Limited Partnerships | — | — | 66,317,458 | 66,317,458 | |||||||||||||||
| Convertible Bonds & Debentures | — | $ | 17,946,879 | — | 17,946,879 | ||||||||||||||
| Non-Convertible Bonds & Debentures | — | 231,641,730 | 203,833,296 | 435,475,026 | |||||||||||||||
| U.S. Government & Agencies | — | 2,182,945,553 | — | 2,182,945,553 | |||||||||||||||
| Short-Term Investments | — | 416,438,040 | — | 416,438,040 | |||||||||||||||
| $ | 5,951,492,828 | $ | 2,846,972,202 | $ | 283,066,823 | $ | 9,083,531,853 | ||||||||||||
| Currency Derivatives/Futures | $ | — | $ | 16,188,588 | $ | — | $ | 16,188,588 | |||||||||||
| Securities Sold Short | |||||||||||||||||||
| Common Stocks Sold Short | $ | (308,179,008 | ) | — | — | $ | (308,179,008 | ) | |||||||||||
| Non-Convertible Bonds & Debentures Sold Short | — | $ | (6,530,177 | ) | — | (6,530,177 | ) | ||||||||||||
| $ | (308,179,008 | ) | $ | (6,530,177 | ) | — | $ | (314,709,185 | ) | ||||||||||
The following table summarizes the Fund's Level 3 investment securities and related transactions during the six month period ended June 30, 2012:
| Investment | Beginning Value at December 31, 2011 | Net Realized and Unrealized Gains (Losses)* | Purchases | (Sales) | Net Transfers In (Out) | Ending Value at June 30, 2012 | |||||||||||||||||||||
| Common Stocks — Long | $ | 13,152,168 | $ | 835,403 | — | $ | (1,071,502 | ) | — | $ | 12,916,069 | ||||||||||||||||
| Limited Partnership | 56,049,186 | 3,930,285 | $ | 6,337,987 | — | — | 66,317,458 | ||||||||||||||||||||
| Non-Convertible Bonds & Debentures | 161,697,920 | 28,628,951 | 66,461,420 | (52,954,995 | ) | — | 203,833,286 | ||||||||||||||||||||
| $ | 230,899,274 | $ | 33,394,639 | $ | 72,799,407 | $ | (54,026,497 | ) | — | $ | 283,066,823 | ||||||||||||||||
* Net realized and unrealized gains (losses) are included in the related amounts in the statement of operations.
Transfers of investments between different levels of the fair value hierarchy are recorded at market value as of the end of the reporting period.
Note 10 — Commitments
At June 30, 2012, the Fund was liable for unfunded commitments of $2,638,207 for the U.S. Farming Realty Trust, and $11,246,391 for the MOB Participation.
35
FPA CRESCENT FUND
SHAREHOLDER EXPENSE EXAMPLE
June 30, 2012
(Unaudited)
Fund Expenses
Mutual fund shareholders generally incur two types of costs: (1) transaction costs, and (2) ongoing costs, including advisory and administrative fees; shareholder service fees; and other Fund expenses. The Example is intended to help you understand your ongoing costs (in dollars) of investing in the Fund and to compare these costs with the ongoing costs of investing in other mutual funds. The Example is based on an investment of $1,000 invested at the beginning of the year and held for the entire year.
Actual Expenses
The information in the table under the heading "Actual Performance" provides information about actual account values and actual expenses. You may use the information in this column, together with the amount you invested, to estimate the expenses that you paid over the period. Simply divide your account value by $1,000 (for example, an $8,600 account value divided by $1,000= 8.6), then multiply the result by the number in the first column in the row entitled "Expenses Paid During Period" to estimate the expenses you paid on your account during this period.
Hypothetical Example for Comparison Purposes
The information in the table under the heading "Hypothetical Performance (5% return before expenses)" provides information about hypothetical account values and hypothetical expenses based on the Fund's actual expense ratio and an assumed rate of return of 5% per year before expenses, which is not the Fund's actual return. The hypothetical account values and expenses may not be used to estimate the actual ending account balance or expenses you paid for the period. You may use this information to compare the ongoing costs of investing in the Fund and other funds. To do so, compare this 5% hypothetical example with the 5% hypothetical examples that appear in the shareholder reports of other funds.
Please note that the expenses shown in the table are meant to highlight your ongoing costs only and do not reflect any transactional costs. Therefore, the information under the heading "Hypothetical Performance (5% return before expenses)" is useful in comparing ongoing costs only, and will not help you determine the relative total costs of owning different funds. In addition, if these transactional costs were included, your costs would have been higher. Even though FPA Crescent Fund does not charge transaction fees, if you purchase shares through a broker, the broker may charge you a fee. You should evaluate other mutual funds' transaction fees and any applicable broker fees to assess the total cost of ownership for comparison purposes.
| Actual Performance | Hypothetical Performance (5% return before expenses) | ||||||||||
| Beginning Account Value December 31, 2011 | $ | 1,000.00 | $ | 1,000.00 | |||||||
| Ending Account Value June 30, 2012 | $ | 1,035.50 | $ | 1,018.66 | |||||||
| Expenses Paid During Period* | $ | 6.38 | $ | 6.34 | |||||||
* Expenses are equal to the Fund's annualized expense ratio of 1.26%, multiplied by the average account value over the period and prorated for the six-months ended June 30, 2012 (182/366 days).
36
FPA CRESCENT FUND
TRUSTEE AND OFFICER INFORMATION
| Name, Age & Address | Position(s) With Trust/ Years Served | Principal Occupation(s) During the Past 5 Years | Portfolios in Fund Complex Overseen | Other Directorships | |||||||||||||||
| Willard H. Altman, Jr. – (76)* | Trustee & Chairman† Years Served: 9 | Retired. Formerly, until 1995, Partner of Ernst & Young LLP, a public accounting firm. | 7 | ||||||||||||||||
| Thomas P. Merrick – (75)* | Trustee† Years Served: 2 | Private Consultant. President of Strategic Planning Consultants for more than the past five years. Former Executive Committee Member and Vice President of Fluor Corporation, responsible for strategic planning, from 1993 to 1998. | 7 | ||||||||||||||||
| Alfred E. Osborne, Jr. – (67)* | Trustee† Years Served: 9 | Senior Associate Dean of the John E. Anderson School of Management at UCLA. | 4 | Wedbush, Inc., Heckmann Corporation and Kaiser Aluminum, Inc. | |||||||||||||||
| Patrick B. Purcell – (69)* | Trustee† Years Served: 5 | Retired. Formerly Executive Vice President, Chief Financial and Administrative Officer of Paramount Pictures from 1983 to 1998. | 7 | The Motion Picture and Television Fund | |||||||||||||||
| Allan M. Rudnick – (71)* | Trustee† Years Served: 1 | Private Investor. Formerly, Co-Founder, Chief Executive Officer, Chairman and Chief Investment Officer of Kayne Anderson Rudnick Investment Management from 1989 to 2007 | 7 | ||||||||||||||||
| Steven Romick – (49) | Trustee,† President & Chief Investment Officer Years Served: 18 | Partner of the Adviser since 2006. Formerly, Senior Vice President of First Pacific Advisors, Inc. from 1996 to 2006. | 2 | Arden Group, Inc. | |||||||||||||||
| Eric S. Ende – (67) | Vice President Years Served: 9 | Partner of the Adviser since 2006. Formerly, Senior Vice President of First Pacific Advisors, Inc. from 1984 to 2006. | 3 | ||||||||||||||||
| J. Richard Atwood – (52) | Treasurer Years Served: 9 | Chief Operating Officer of the Adviser. President and Chief Executive Officer of FPA Fund Distributors, Inc. | FPA Fund Distributors, Inc. | ||||||||||||||||
| Christopher H. Thomas – (55) | Chief Compliance Officer Years Served: 9 | Vice President and Chief Compliance Officer of the Adviser and Vice President of FPA Fund Distributors, Inc. | FPA Fund Distributors, Inc. | ||||||||||||||||
| Sherry Sasaki – (57) | Secretary Years Served: 9 | Assistant Vice President and Secretary of the Adviser and Secretary of FPA Fund Distributors, Inc. | |||||||||||||||||
| E. Lake Setzler – (45) | Assistant Treasurer Years Served: 5 | Vice President and Controller of the Adviser since 2005. | |||||||||||||||||
| Michael P. Gomez – (27) | Assistant Vice President Years Served: <1 | Assistant Vice President of the Adviser since 2010. Formerly In-Charge Associate of PricewaterhouseCoopers from 2007-2010 | |||||||||||||||||
† Trustees serve until their resignation, removal or retirement.
* Audit Committee member
Additional information on the Trustees is available in the Statement of Additional Information. Each of the above listed individuals can be contacted at 11400 W. Olympic Blvd., Suite 1200, Los Angeles, CA 90064.
37
FPA CRESCENT FUND
INVESTMENT ADVISER
First Pacific Advisors, LLC
11400 West Olympic Boulevard, Suite 1200
Los Angeles, CA 90064
TRANSFER & SHAREHOLDER SERVICE AGENT
UMB Fund Services, Inc.
P.O. Box 2175
Milwaukee, WI 53201-2175
or
803 W. Michigan St. Ste A
Milwaukee, WI, 53233-2301
(800) 638-3060
CUSTODIAN
State Street Bank and Trust Company
Boston, Massachusetts
TICKER SYMBOL: FPACX
CUSIP: 30254T759
DISTRIBUTOR
FPA Fund Distributors, Inc.
11400 West Olympic Boulevard, Suite 1200
Los Angeles, California 90064
COUNSEL
K&L Gates LLP
San Francisco, California
INDEPENDENT REGISTERED PUBLIC ACCOUNTING FIRM
Deloitte & Touche LLP
Los Angeles, California
This report has been prepared for the information of shareholders of FPA Crescent Fund, and is not authorized for distribution to prospective investors unless preceded or accompanied by an effective prospectus.
The Fund's complete proxy voting record for the 12 months ended June 30, 2012 is available without charge, upon request, by calling (800) 982-4372 and on the SEC's website at www.sec.gov.
The Fund's schedule of portfolio holdings, filed the second and fourth quarter on Form N-Q with the SEC, is available on the SEC's website at www.sec.gov. Form N-Q is available at the SEC's Public Reference Room in Washington, D.C., and information on the operations of the Public Reference Room may be obtained by calling 1-202-942-8090. To obtain information on Form N-Q from the Fund, shareholders can call 1-800-982-4372.
Additional information about the Fund is available online at www.fpafunds.com. This information includes, among other things, holdings, top sectors and performance, and is updated on or about the 15th business day after the end of the quarter.
FPA International Value Fund
Semi-Annual Report
June 30, 2012

Distributor:
FPA FUND DISTRIBUTORS, INC.
11400 West Olympic Boulevard, Suite 1200
Los Angeles, California 90064
FPA INTERNATIONAL VALUE FUND
LETTER TO SHAREHOLDERS
Dear Fellow Shareholders,
During the second quarter of 2012, the Fund returned a negative 5.24%, which compares favorably to the MSCI All Country World Index (ex-U.S.) (Net) (the "Index") loss of 7.61%. Since inception on December 1, 2011, our Fund has returned 8.40% vs. 1.62% for the Index.
Capturing value over time
We do not consider short-term returns versus an index to be particularly meaningful. Because we concentrate solely on finding companies offering the best value, index comparisons offer limited relevance to our strategy. We encourage shareholders to consider the Fund's returns over the medium to long-term, and focus on the underlying quality of the businesses we own today, along with the margins of safety we believe they offer. While we are not satisfied with absolute negative returns, we note that the decline in market prices against relatively stable business values has made our holdings more attractive prospectively. At the end of the quarter, our portfolio of investments offered a 36% discount (vs. 31% at March 31, 2012) to our underlying intrinsic value estimates on a weighted average basis.
Key performers
Our best performing holding in the quarter was Diageo (up 7.2% in US currency). Based in the UK, Diageo is the global leading producer and distributor of premium spirits. The group's portfolio is mostly geared towards Scotch (Johnnie Walker) and Vodka (Smirnoff), but also includes about a third of the world's 100 leading spirit and beer brands. The business hasn't experienced a down year in a decade and has grown at an organic compound annual growth rate (CAGR) of 5% over the period. 40% of revenues are generated in emerging markets where Diageo now stands to reap the rewards of years of investments. Operating profits margins are typically in excess of 30% in established markets. The group generates returns on capital in excess of 20% and high, sustainable free cash flows. Management has proven operationally strong, value-creation focused, and shareholder-oriented. CEO Paul Walsh has led the firm for over a decade. Walsh repositioned the portfolio away from food, made financially sound spirit acquisitions, and pulled out of overpriced auctions. In his tenure, he has returned £ 9 billion in dividends and £ 8 billion through buybacks to shareholders, or 40% of the current market capitalization. The balance sheet has a reasonable amount of leverage in light of the strong cash generation at 2x net debt/EBITDA. Diageo is a good example of high business quality consistently underappreciated by capital markets. We have followed the company for many years and we remain interested in owning the stock so long as it trades at a material discount to our fair value estimate.
Our worst performing stock was Daimler (down 22.4%). Daimler was our best performer in the previous period (when it was up 34.0%). This is similar to the last quarter's situation with Philips, which was one of our best performing holdings again this period (up 2.3%), as the company reported results that were better than analysts had feared a few months ago. In the case of Daimler, the stock traded down on Chinese growth concerns, and the implications for earning expectations in the coming quarters. We never shared the Street's hopes for wild uninterrupted growth in China, and don't claim to know precisely what Daimler's next year sales will be in that region. However, we do expect that in the long run, China will remain one of the group's largest individual markets.
1
Concept of intrinsic value
More importantly, our valuation of Philips, Daimler, or any other business for that matter is not based on short-term results. We strive to understand the competitive dynamics of a business, using that to estimate its long-term economics and associated free cash flows. This free cash flow generation out into perpetuity is the basis for our estimate of intrinsic value. Relative to that, what happens to profits in any given quarter isn't significant, providing it doesn't reflect a change in the fundamentals of the business. Little of the value of any given business is created in one year, let alone one quarter. In many cases, however, fears over upcoming quarterly results will drive stock price volatility and offer long-term investors like ourselves the opportunity to invest in high-quality businesses at substantial discounts to fair value. One of our goals as managers of FPA International Value Fund is to take advantage of these opportunities.
Investors face realities
The Fund's general profile did not change much in the second quarter. In a reversal of the prior period, however, we witnessed a change of heart in capital markets that led us to make several portfolio decisions. Whereas in the first quarter investors seemed to turn a blind eye to the many challenges facing the world economy, in the second, they engaged more directly with the dysfunctional political environments in many developed countries: high levels of government and consumer debt, troubled financial institutions, and the prospect of tax increases together with further austerity measures. These issues returned to the forefront with more banks' missteps, hectic elections in Greece, a new socialist government in France, a precipitated bailout of the Spanish financial system, and further deterioration in economic data, particularly in the European periphery. The same way we didn't believe that business values had improved significantly in the first quarter, we don't think that they declined materially this quarter and thus, took several initiatives in line with our bottom-up approach to investing.
Portfolio decisions
At the end of the quarter, our Fund was 79% invested (up from 66% at March 31, 2012). This increase arose from a combination of the decline in prices and acting on specific research outcomes. We took advantage of depressed valuations to increase our exposure to some existing positions and re-purchased stakes in Michael Page and Alten. We had sold out of these holdings last quarter after they had returned 31.3% and 37.6%, respectively. Following the sales and prior to our renewed investments, their stocks had retreated -19.0% and -19.4%, respectively. We continue to monitor high quality names with hopes of becoming shareholders and, consistent with our valuation discipline, invest any time their stocks offer at least 50% upside. Michael Page and Alten are good examples of irrational market behaviors (disconnects that arise in the short-term between fluctuations in stock prices and business values) and how we take advantage of these anomalies when we invest. We also initiated a position in Travis Perkins, the UK's largest builders' merchant. The group earns industry leading margins and returns on capital, has a strong balance sheet, and is managed by a long-serving, value-minded management team. While Travis' current trading outlook is challenged, we are able to purchase the business at attractive multiples of current profits and free cash flows. In difficult times, we expect the company will continue to widen its competitive moat thus allowing for increased value creation and ultimately benefitting long-term shareholders.
We note that following these decisions, our portfolio remains geared towards companies domiciled in Europe. This is only a reflection of where we find the most compelling opportunities, as our investment approach is agnostic to geographic or sector exposure. In addition, many of the businesses we invest in operate globally and thus, generate a large portion of both their current and future cash flows outside Europe. That means the risk to our estimate of fair value is less coming from Europe than corporations' domiciles otherwise suggest. Where business value is created is what is important to us as investors.
2
Long-term value investment opportunities
As we mentioned in prior commentaries, this is far from an easy time to be managing money. We remain mindful of the many difficulties ahead when analyzing businesses, gauging their financial strength, and assessing intrinsic values. At the same time, valuations are compressing again for some securities, increasing the scope of investment opportunities and enhancing the prospect of superior returns for long-term value investors. While the economic environment remains bleak, in particular in Europe, and while some companies will suffer further pressure, competitively advantaged businesses with strong balance sheets run by capable management teams should eventually build stronger competitive positions. We travelled extensively in the last period and are actively researching companies that appear so positioned. Our portfolio is comprised of many such businesses and while near-term trading conditions may prove difficult, we are enthused about the long-term prospects of the companies in which we invest, the significant discounts to intrinsic values at which they trade, and the opportunity to be able to buy their stocks.
As always, we thank you for your confidence and look forward to continue serving your interests as shareholders of the FPA International Value Fund.
Respectfully submitted,

Pierre O. Py
Portfolio Manager
July 27, 2012
Team Update
On a different front, I am saddened to report that my friend and colleague of nearly a decade Eric Bokota stepped down as Co-Portfolio Manager of the FPA International Value Fund. Eric could no longer dedicate the energy and attention that the business requires and had to come to the difficult decision of resigning from FPA, effective July 23, 2012. In a press release published the same day, he expressed his firm belief in the strategy and announced his intention to maintain a significant investment in the Fund.
I will continue as Portfolio Manager of FPA International Value Fund and will act as sole Manager of the Strategy going forward. While these are difficult, unforeseen circumstances, it does not impact the portfolio as we invest in a small number of companies with a long-term view and expect limited turnover.
We are fortunate in that we were in the process of adding analytical resources to the team. I am very excited by some of the candidates we came across and confident that we will find strong investment talent to contribute to our international research effort. In the interim, FPA's management and investment professionals have offered their full support in managing the transition. FPA remains strongly committed to the Strategy.
I would like to thank Eric for his contributions to FPA. While I will miss him, I support his decision. I wish him well and I hope to have the opportunity to work with him again at some point in the future. I also take this opportunity to thank my associates at FPA who have proven to be remarkable partners throughout this challenging time.
3
Past performance is not indicative of future performance. The MSCI ACWI ex-USA Index is a float-adjusted market capitalization index that is designed to measure the combined equity market performance of developed and emerging market countries excluding the United States. These indices do not reflect any commissions or fees which would be incurred by an investor purchasing the stocks they represent. The performance of the Fund and of the Averages is computed on a total return basis which includes reinvestment of all distributions.
The discussion of Fund investments represents the views of the Fund's managers at the time of this report and is subject to change without notice. References to individual securities are for informational purposes only and should not be construed as recommendations to purchase or sell individual securities.
FORWARD LOOKING STATEMENT DISCLOSURE
As mutual fund managers, one of our responsibilities is to communicate with shareholders in an open and direct manner. Insofar as some of our opinions and comments in our letters to shareholders are based on current management expectations, they are considered "forward-looking statements" which may or may not be accurate over the long term. While we believe we have a reasonable basis for our comments and we have confidence in our opinions, actual results may differ materially from those we anticipate. You can identify forward-looking statements by words such as "believe," "expect," "may," "anticipate," and other similar expressions when discussing prospects for particular portfolio holdings and/or the markets, generally. We cannot, however, assure future results and disclaim any obligation to update or alter any forward-looking statements, whether as a result of new information, future events, or otherwise. Further, information provided in this report should not be construed as a recommendation to purchase or sell any particular security.
4
FPA INTERNATIONAL VALUE FUND
PORTFOLIO SUMMARY
June 30, 2012
(Unaudited)
| Common Stocks | 78.1 | % | |||||||||
| Business Services | 21.5 | % | |||||||||
| Industrial Products | 13.4 | % | |||||||||
| Technology | 8.3 | % | |||||||||
| Consumer Non-Durables | 8.1 | % | |||||||||
| Human Resources | 7.5 | % | |||||||||
| Basic Materials | 6.9 | % | |||||||||
| Trading & Distribution | 6.3 | % | |||||||||
| Consumer Durables | 6.1 | % | |||||||||
| Currency Forwards | 0.2 | % | |||||||||
| Short-Term Investments | 21.8 | % | |||||||||
| Other Assets and Liabilities, net | (0.1 | )% | |||||||||
| Total Net Assets | 100.0 | % | |||||||||
MAJOR PORTFOLIO CHANGES
For the Six Months Ended June 30, 2012
(Unaudited)
| Shares | |||||||
| NET PURCHASES | |||||||
| Common Stocks | |||||||
| Brambles Ltd (1) | 42,870 | ||||||
| G4S plc (1) | 29,081 | ||||||
| Legrand S.A. (1) | 9,223 | ||||||
| Sodexo (1) | 1,696 | ||||||
| Travis Perkins plc (1) | 17,600 | ||||||
| NET SALES | |||||||
| Common Stocks | |||||||
| Rexel S.A. (2) | 2,971 | ||||||
(1) Indicates new commitment to portfolio
(2) Indicates elimination from portfolio
5
FPA INTERNATIONAL VALUE FUND
PORTFOLIO OF INVESTMENTS
June 30, 2012
(Unaudited)
| COMMON STOCKS | Shares | Value | |||||||||
| BUSINESS SERVICES — 21.5% | |||||||||||
| BBA Aviation plc | 84,477 | $ | 269,929 | ||||||||
| Brambles Ltd | 42,870 | 270,364 | |||||||||
| G4S plc | 29,081 | 127,128 | |||||||||
| LSL Property Services plc | 180,943 | 661,057 | |||||||||
| Publicis Groupe | 6,116 | 278,843 | |||||||||
| Sodexo | 1,696 | 131,699 | |||||||||
| $ | 1,739,020 | ||||||||||
| INDUSTRIAL PRODUCTS — 13.4% | |||||||||||
| ASSA ABLOY AB | 11,479 | $ | 319,322 | ||||||||
| GEA Group Aktiengesellschaft | 9,993 | 265,148 | |||||||||
| Koninklijke Philips Electronics N.V. | 9,533 | 187,718 | |||||||||
| Legrand S.A. | 9,223 | 312,079 | |||||||||
| $ | 1,084,267 | ||||||||||
| TECHNOLOGY — 8.3% | |||||||||||
| ALTEN S.A. | 12,200 | $ | 337,517 | ||||||||
| SAP AG | 5,682 | 336,450 | |||||||||
| $ | 673,967 | ||||||||||
| CONSUMER NON-DURABLES — 8.1% | |||||||||||
| Britvic plc | 75,822 | $ | 391,787 | ||||||||
| Diageo plc | 10,351 | 266,213 | |||||||||
| $ | 658,000 | ||||||||||
| HUMAN RESOURCES — 7.5% | |||||||||||
| Adecco S.A. | 8,209 | $ | 363,039 | ||||||||
| Michael Page International plc | 42,250 | 247,433 | |||||||||
| $ | 610,472 | ||||||||||
| BASIC MATERIALS — 6.9% | |||||||||||
| Incitec Pivot Limited | 99,324 | $ | 289,807 | ||||||||
| Travis Perkins plc | 17,600 | 267,536 | |||||||||
| $ | 557,343 | ||||||||||
| TRADING & DISTRIBUTION — 6.3% | |||||||||||
| Atea ASA | 52,600 | $ | 461,444 | ||||||||
| Wolseley plc | 1,394 | 51,900 | |||||||||
| $ | 513,344 | ||||||||||
| CONSUMER DURABLES — 6.1% | |||||||||||
| Daimler AG | 10,191 | $ | 455,546 | ||||||||
| The Swatch Group Ltd | 107 | 42,081 | |||||||||
| $ | 497,627 | ||||||||||
| TOTAL COMMON STOCKS — 78.1% (Cost $6,412,497) | $ | 6,334,040 | |||||||||
6
FPA INTERNATIONAL VALUE FUND
PORTFOLIO OF INVESTMENTS (Continued)
June 30, 2012
(Unaudited)
| Value | |||||||||||
| CURRENCY FORWARDS — 0.2% | |||||||||||
| Euro @ €1.292 — 01/9/14* | $ | 3,803 | |||||||||
| Euro @ €1.33068 — 01/9/14* | 4,463 | ||||||||||
| Euro @ €1.31835 — 01/9/14* | 692 | ||||||||||
| Euro @ €1.3149 — 01/9/14* | 1,909 | ||||||||||
| British Pounds @ £1.5365 — 01/9/14* | (1,551 | ) | |||||||||
| British Pounds @ £1.55627 — 01/9/14* | (387 | ) | |||||||||
| British Pounds @ £1.56091 — 01/9/14 * | (104 | ) | |||||||||
| British Pounds @ £1.56997 — 01/9/14* | 187 | ||||||||||
| British Pounds @ £1.58715 — 01/9/14* | 526 | ||||||||||
| British Pounds @ £1.59647 — 04/24/14* | 567 | ||||||||||
| British Pounds @ £1.6113 — 04/24/14* | 1,396 | ||||||||||
| Euro @ €1.32673 — 05/7/14* | 1,496 | ||||||||||
| Euro @ €1.3188 — 05/7/14* | 3,692 | ||||||||||
| British Pounds @ £1.60445 — 05/07/14* | 1,355 | ||||||||||
| Euro @ €1.30633 — 05/12/14* | 797 | ||||||||||
| Euro @ €1.2901 — 05/12/14* | 394 | ||||||||||
| British Pounds @ £1.5986 — 05/12/14* | 505 | ||||||||||
| British Pounds @ £1.5856 — 05/12/14* | 183 | ||||||||||
| British Pounds @ £1.57272 — 05/22/14* | 980 | ||||||||||
| British Pounds @ £1.5673 — 05/29/14* | 64 | ||||||||||
| British Pounds @ £1.5612 — 05/30/14* | (134 | ) | |||||||||
| Euro @ €1.26565 — 06/06/14* | 131 | ||||||||||
| British Pounds @ £1.5389 — 06/09/14* | (890 | ) | |||||||||
| British Pounds @ £1.5382 — 06/09/14* | (457 | ) | |||||||||
| British Pounds @ £1.5334 — 06/09/14* | (1,073 | ) | |||||||||
| Euro @ €1.26517 — 06/12/14* | 15 | ||||||||||
| Euro @ €1.26844 — 06/16/14* | 442 | ||||||||||
| Euro @ €1.26226 — 06/27/14* | (97 | ) | |||||||||
| $ | 18,904 | ||||||||||
| TOTAL INVESTMENT SECURITIES — 78.3% (Cost $6,412,497) | $ | 6,352,944 | |||||||||
7
FPA INTERNATIONAL VALUE FUND
PORTFOLIO OF INVESTMENTS (Continued)
June 30, 2012
(Unaudited)
| Principal Amount | Value | ||||||||||
| SHORT-TERM INVESTMENTS — 21.8% (Cost $1,765,001) | |||||||||||
| State Street Bank Repurchase Agreement — 0.01% 07/02/12 (Collateralized by $1,670,000 Principal Amount U.S. Treasury Note — 3.125% 2041, market value $1,801,110) | $ | 1,765,000 | $ | 1,765,001 | |||||||
| TOTAL INVESTMENTS — 100.1% (Cost $8,177,498) | $ | 8,117,945 | |||||||||
| Other assets and liabilities, net — (0.1)% | (12,233 | ) | |||||||||
| TOTAL NET ASSETS — 100% | $ | 8,105,712 | |||||||||
* Non-income producing securities
See notes to financial statements.
8
FPA INTERNATIONAL VALUE FUND
STATEMENT OF ASSETS AND LIABILITIES
June 30, 2012
(Unaudited)
| ASSETS | |||||||||||
| Investments at value: | |||||||||||
| Investment securities — at market value (identified cost $6,412,497) | $ | 6,352,944 | |||||||||
| Short-term investments — at amortized cost (maturities 60 days or less) | 1,765,001 | $ | 8,117,945 | ||||||||
| Cash | 971 | ||||||||||
| Receivable for: | |||||||||||
| Capital stock sold | $ | 69,200 | |||||||||
| Dividends | 9,996 | 79,196 | |||||||||
| $ | 8,198,112 | ||||||||||
| LIABILITIES | |||||||||||
| Payable for: | |||||||||||
| Investment securities purchased | $ | 68,893 | |||||||||
| Advisory fees | 23,507 | 92,400 | |||||||||
| NET ASSETS | $ | 8,105,712 | |||||||||
| SUMMARY OF SHAREHOLDERS' EQUITY | |||||||||||
| Capital stock — no par value; unlimited authorized shares; 747,555 outstanding shares | $ | 8,063,804 | |||||||||
| Undistributed net realized gain on investments | 42,832 | ||||||||||
| Undistributed net investment income | 58,629 | ||||||||||
| Unrealized depreciation of investments | (59,553 | ) | |||||||||
| NET ASSETS | $ | 8,105,712 | |||||||||
| NET ASSET VALUE, REDEMPTION PRICE AND MAXIMUM OFFERING PRICE PER SHARE | |||||||||||
| Net asset value and redemption price per share (net assets divided by shares outstanding) | $ | 10.84 | |||||||||
See notes to financial statements.
9
FPA INTERNATIONAL VALUE FUND
STATEMENT OF OPERATIONS
For the Six Months Ended June 30, 2012
(Unaudited)
| INVESTMENT INCOME | |||||||||||
| Dividends | $ | 89,530 | |||||||||
| Interest | 80 | ||||||||||
| $ | 89,610 | ||||||||||
| EXPENSES: | |||||||||||
| Directors fees and expenses | $ | 42,618 | |||||||||
| Reports to shareholders | 31,765 | ||||||||||
| Registration fees | 30,425 | ||||||||||
| Audit and tax service fees | 25,000 | ||||||||||
| Advisory fees | 22,964 | ||||||||||
| Transfer agent fees and expenses | 12,521 | ||||||||||
| Custodian fees and expenses | 10,743 | ||||||||||
| Legal fees | 7,106 | ||||||||||
| Insurance | 5,014 | ||||||||||
| Financial services | 2,323 | ||||||||||
| Other fees and expenses | 5,029 | ||||||||||
| Total expenses | $ | 195,508 | |||||||||
| Expenses reimbursed by Adviser | (164,527 | ) | 30,981 | ||||||||
| Net investment income | $ | 58,629 | |||||||||
| NET REALIZED AND UNREALIZED GAIN (LOSS) ON INVESTMENTS | |||||||||||
| Net realized gain on investments: | |||||||||||
| Proceeds from sales of investment securities | $ | 386,703 | |||||||||
| Cost of investment securities sold | 343,871 | ||||||||||
| Net realized gain on investments | $ | 42,832 | |||||||||
| Change in unrealized appreciation of investments: | |||||||||||
| Unrealized appreciation at beginning of period | $ | 17,448 | |||||||||
| Unrealized depreciation at end of period | (59,553 | ) | |||||||||
| Change in unrealized depreciation of investments | (77,001 | ) | |||||||||
| Net realized and unrealized loss on investments | $ | (34,169 | ) | ||||||||
| NET CHANGE IN NET ASSETS RESULTING FROM OPERATIONS | $ | 24,460 | |||||||||
See notes to financial statements.
10
FPA INTERNATIONAL VALUE FUND
STATEMENT OF CHANGES IN NET ASSETS
| Six Months Ended June 30, 2012 (Unaudited) | For the Period December 1, 2011 to December 31, 2011 | ||||||||||||||||||
| CHANGE IN NET ASSETS | |||||||||||||||||||
| Operations: | |||||||||||||||||||
| Net investment income (loss) | $ | 58,629 | $ | (700 | ) | ||||||||||||||
| Net realized gain on investments | 42,832 | — | |||||||||||||||||
| Change in unrealized appreciation (depreciation) of investments | (77,001 | ) | 17,448 | ||||||||||||||||
| Change in net assets resulting from operations | $ | 24,460 | $ | 16,748 | |||||||||||||||
| Capital Stock transactions: | |||||||||||||||||||
| Proceeds from Capital Stock sold | $ | 7,163,302 | $ | 102,000 | |||||||||||||||
| Cost of Capital Stock repurchased* | (500,798 | ) | 6,662,504 | — | 102,000 | ||||||||||||||
| Total change in net assets | $ | 6,686,964 | $ | 118,748 | |||||||||||||||
| NET ASSETS | |||||||||||||||||||
| Beginning of period | 1,418,748 | 1,300,000 | |||||||||||||||||
| End of period | $ | 8,105,712 | $ | 1,418,748 | |||||||||||||||
| CHANGE IN CAPITAL STOCK OUTSTANDING | |||||||||||||||||||
| Shares of Capital Stock sold | 653,893 | 10,381 | |||||||||||||||||
| Shares of Capital Stock repurchased | (46,719 | ) | — | ||||||||||||||||
| Change in Capital Stock outstanding | 607,174 | 10,381 | |||||||||||||||||
* Net of redemption fees of $12,467 and $0 collected for the periods ended June 30, 2012, and December 31, 2011, respectively.
See notes to financial statements.
11
FPA INTERNATIONAL VALUE FUND
FINANCIAL HIGHLIGHTS
Selected Data for Each Share of Capital Stock Outstanding Throughout the Period
| For the Six Months Ended June 30, 2012 (Unaudited) | For the Period December 1, 2011 to December 31, 2011 | ||||||||||
| Per share operating performance: | |||||||||||
| Net asset value at beginning of period | $ | 10.11 | $ | 10.00 | |||||||
| Income from investment operations: | |||||||||||
| Net investment income | $ | 0.08 | — | * | |||||||
| Net realized and unrealized gain (loss) on investment securities | 0.63 | $ | 0.11 | ||||||||
| Total from investment operations | $ | 0.71 | $ | 0.11 | |||||||
| Redemption fees | $ | 0.02 | — | ||||||||
| Net asset value at end of period | $ | 10.84 | $ | 10.11 | |||||||
| Total investment return** | 7.22 | % | 1.10 | % | |||||||
| Ratios/supplemental data: | |||||||||||
| Net assets at end of period | $ | 8,105,712 | $ | 1,418,748 | |||||||
| Ratio of expenses to average net assets: | |||||||||||
| Before reimbursement from Adviser | 7.53 | %† | 16.64 | %† | |||||||
| After reimbursement from Adviser | 1.35 | %† | 1.35 | %† | |||||||
| Ratio of net investment income (loss) to average assets: | |||||||||||
| Before reimbursement from Adviser | (4.08 | )%† | (15.9 | )%† | |||||||
| After reimbursement from Adviser | 2.26 | %† | (0.61 | )%† | |||||||
| Portfolio turnover rate | 24 | %† | 0 | % | |||||||
* Rounds to less than $0.01 per share.
** Return is based on net asset value per share and is not annualized
† Annualized
See notes to financial statements.
12
FPA INTERNATIONAL VALUE FUND
NOTES TO FINANCIAL STATEMENTS
June 30, 2012
(Unaudited)
NOTE 1 — Significant Accounting Policies
FPA International Value Fund (the "Fund"), a series of the FPA Funds Trust, is registered under the Investment Company Act of 1940, as a diversified, open-end management investment company. The Fund commenced operations on December 1, 2011. The Fund's primary investment objective is to seek above average capital appreciation over the long term while attempting to minimize the risk of capital loss. The following is a summary of significant accounting policies consistently followed by the Fund in the preparation of its financial statements.
A. Security Valuation
The Fund's investments are reported at fair value as defined by accounting principles generally accepted in the United States of America. The Fund generally determines its net asset value as of approximately 4:00 p.m. New York time each day the New York Stock Exchange is open. Further discussion of valuation methods, inputs and classifications can be found under Note 8.
B. Securities Transactions and Related Investment Income
Securities transactions are accounted for on the date the securities are purchased or sold. Dividend income and distributions to shareholders are recorded on the ex-dividend date. Interest income and expenses are recorded on an accrual basis.
C. Use of Estimates
The preparation of the financial statements in accordance with accounting principles generally accepted in the United States of America requires management to make estimates and assumptions that affect the amounts reported. Actual results could differ from those estimates.
NOTE 2 — Risk Considerations
Investing in the Fund may involve certain risks including, but not limited to, those described below.
Market Risk: Because the values of the Fund's investments will fluctuate with market conditions, so will the value of your investment in the Fund. You could lose money on your investment in the Fund or the Fund could underperform other investments.
Common Stocks and Other Securities: The prices of common stocks and other securities held by the Fund may decline in response to certain events taking place around the world, including those directly involving companies whose securities are owned by the Fund; conditions affecting the general economy; overall market changes; local, regional or global political, social or economic instability; and currency, interest rate and commodity price fluctuations. Since the Fund principally invests in foreign securities, it will be subject to risks not typically associated with domestic securities. Foreign investments, especially those of companies in emerging markets, can be riskier less liquid, harder to value, and more volatile than investments in the United States. Adverse political and economic developments or changes in the value of foreign currency can make it more difficult for the Fund to value the securities. Differences in tax and accounting standards, difficulties in obtaining information about foreign companies, restrictions on receiving investment proceeds from a foreign country, confiscatory foreign tax laws, and potential difficulties in enforcing contractual obligations, can all add to the risk and volatility of foreign investments. The financial problems in global economies over the past several years, including the European sovereign debt crisis, may continue to cause high volatility in global financial markets.
NOTE 3 — Purchases of Investment Securities
Cost of purchases of investment securities (excluding short-term investments with maturities of 60 days or less at the time of purchase) aggregated $5,791,047 for the period ended June 30, 2012. Realized gains or losses are based on the specific identification method.
NOTE 4 — Federal Income Tax
No provision for federal income tax is required because the Fund has elected to be taxed as a "regulated investment company" under the Internal Revenue Code and intends to maintain this qualification and to distribute each year to its shareholders, in accordance with the minimum distribution requirements of the Code, its taxable net investment income and taxable net realized gains on investments.
13
FPA INTERNATIONAL VALUE FUND
NOTES TO FINANCIAL STATEMENTS (Continued)
(Unaudited)
The cost of investment securities held at June 30, 2012, was $6,412,497 for federal income tax purposes. Gross unrealized appreciation and depreciation for all investments at June 30, 2012, for federal income tax purposes was $160,827 and $220,380, respectively resulting in net unrealized depreciation of $59,553. As of and during the period ended June 30, 2012, the Fund did not have any liability for unrecognized tax benefits. The Fund recognizes interest and penalties, if any, related to unrecognized tax benefits as income tax expense in the Statement of Operations. During the year, the Fund did not incur any interest or penalties.
NOTE 5 — Advisory Fees and Other Affiliated Transactions
Pursuant to an Investment Advisory Agreement, advisory fees were paid by the Fund to First Pacific Advisors, LLC (the "Adviser"). Under the terms of this Agreement, the Fund pays the Adviser a monthly fee calculated at the annual rate of 1% of the Fund's average daily net assets. In addition, the Fund pays the Adviser an amount equal to 0.10% of the average daily net assets for each fiscal year in reimbursement for the provision of financial services to the Fund. The Agreement obligates the Adviser to reduce its fee to the extent necessary to reimburse the Fund for any annual expenses (exclusive of interest, taxes, the cost of brokerage and research services, and extraordinary expenses such as litigation) in excess of 1.85% of the average net assets of the Fund for the year. In addition, the Adviser has contractually agreed to reimburse expenses in excess of 1.35% of the average net assets of the Fund (exclusive of interest, taxes, the cost of brokerage and research services, and extraordinary expenses such as litigation) through April 30, 2013.
For the period ended June 30, 2012, the Fund paid aggregate fees of $41,833 to all Directors who are not affiliated persons of the Adviser. Certain officers of the Fund are also officers of the Adviser and FPA Fund Distributors, Inc.
NOTE 6 — Redemption Fees
A redemption fee of 2% applies to redemptions within 90 days of purchase for certain purchases made by persons eligible to purchase shares without an initial sales charge. For the period ended June 30, 2012, the Fund collected $12,467 in redemption fees. The impact of these fees is $0.02 per share.
NOTE 7 — Distributor
FPA Fund Distributors, Inc. ("Distributor"), a wholly owned subsidiary of the Adviser, received no fees for distribution services during the period. The Distributor pays its own overhead and general administrative expenses, the cost of supplemental sales literature, promotion and advertising.
NOTE 8 — Disclosure of Fair Value Measurements
The Fund uses the following methods and inputs to establish the fair value of its assets and liabilities. Use of particular methods and inputs may vary over time based on availability and relevance as market and economic conditions evolve.
Equity securities are generally valued at the official closing price of, or the last reported sale price on, the exchange or market on which such securities are traded, as of the close of business on the day the securities are being valued or, lacking any sales, at the last available bid price. Prices for each security are taken from the principal exchange or market in which the security trades. Securities that are unlisted and fixed-income and convertible securities listed on a national securities exchange for which the over-the-counter market more accurately reflects the securities' value in the judgment of the Fund's officers, are valued at the most recent bid price. Short-term corporate notes with maturities of 60 days or less are valued at amortized cost, which approximates market value.
Securities for which representative market quotations are not readily available or are considered unreliable by the Adviser are valued as determined in good faith under guidelines adopted by authority of the Fund's Board of Directors. Various inputs may be reviewed in order to make a good faith determination of a security's value. These inputs include, but are not limited to, the type and cost of the security; contractual or legal restrictions on resale of the security; relevant financial or business developments of the issuer; actively traded similar or related securities; conversion or exchange rights on the security; related corporate actions; significant events occurring
14
FPA INTERNATIONAL VALUE FUND
NOTES TO FINANCIAL STATEMENTS (Continued)
(Unaudited)
after the close of trading in the security; and changes in overall market conditions. Fair valuations and valuations of investments that are not actively trading involve judgment and may differ materially from valuations of investments that would have been used had greater market activity occurred.
The Fund classifies its assets based on three valuation methodologies. Level 1 values are based on quoted market prices in active markets for identical assets. Level 2 values are based on significant observable market inputs, such as quoted prices for similar assets and quoted prices in inactive markets or other market observable inputs. Level 3 values are based on significant unobservable inputs that reflect the Fund's determination of assumptions that market participants might reasonably use in valuing the assets. The valuation levels are not necessarily an indication of the risk associated with investing in those securities. The following table presents the valuation levels of the Fund's investments as of June 30, 2012:
| Investments | Level 1 | Level 2 | Level 3 | Total | |||||||||||||||
| Common Stocks | $ | 6,334,040 | — | — | $ | 6,334,040 | |||||||||||||
| Currency Forwards | — | $ | 18,904 | — | 18,904 | ||||||||||||||
| Short-Term Investments | — | 1,765,001 | — | 1,765,001 | |||||||||||||||
| $ | 6,334,040 | $ | 1,783,905 | — | $ | 8,117,945 | |||||||||||||
Transfers of investments between different levels of the hierarchy are recorded at market value as of the end of the reporting period. There were no significant transfers between Levels 1, 2, or 3 during the period ending June 30, 2012.
15
FPA INTERNATIONAL VALUE FUND
SHAREHOLDER EXPENSE EXAMPLE
June 30, 2012
(Unaudited)
Fund Expenses
As a shareholder of the Fund, you incur two types of costs: (1) transaction costs, and (2) ongoing costs, including advisory and administrative fees; shareholder service fees; and other Fund expenses. The Example is intended to help you understand your ongoing costs (in dollars) of investing in the Fund and to compare these costs with the ongoing costs of investing in other mutual funds. The Example is based on an investment of $1,000 invested at the beginning of the year and held for the entire year.
Actual Expenses
The information in the table under the heading "Actual Performance" provides information about actual account values and actual expenses. You may use the information in this column, together with the amount you invested, to estimate the expenses that you paid over the period. Simply divide your account value by $1,000 (for example, an $8,600 account value divided by $1,000= 8.6), then multiply the result by the number in the first column in the row entitled "Expenses Paid During Period" to estimate the expenses you paid on your account during this period.
Hypothetical Example for Comparison Purposes
The information in the table under the heading "Hypothetical Performance (5% return before expenses)" provides information about hypothetical account values and hypothetical expenses based on the Fund's actual expense ratio and an assumed rate of return of 5% per year before expenses, which is not the Fund's actual return. The hypothetical account values and expenses may not be used to estimate the actual ending account balance or expenses you paid for the period. You may use this information to compare the ongoing costs of investing in the Fund and other funds. To do so, compare this 5% hypothetical example with the 5% hypothetical examples that appear in the shareholder reports of other funds.
Please note that the expenses shown in the table are meant to highlight your ongoing costs only and do not reflect any transactional costs. Therefore, the information under the heading "Hypothetical Performance (5% return before expenses)" is useful in comparing ongoing costs only, and will not help you determine the relative total costs of owning different funds. In addition, if these transactional costs were included, your costs would have been higher.
| Actual Performance | Hypothetical Performance (5% return before expenses) | ||||||||||
| Beginning Account Value December 31, 2011 | $ | 1,000.00 | $ | 1,000.00 | |||||||
| Ending Account Value June 30, 2012 | $ | 1,072.20 | $ | 1,018.20 | |||||||
| Expenses Paid During Period* | $ | 6.96 | $ | 6.80 | |||||||
* Expenses are equal to the Fund's annualized expense ratio of 1.35%, multiplied by the average account value over the period and prorated for the six-months ended June 30, 2012 (182/366 days).
16
FPA INTERNATIONAL VALUE FUND
DIRECTOR AND OFFICER INFORMATION
| Name & Address | Position(s) With Fund Years Served | Principal Occupation(s) During the Past 5 Years | Portfolios in Fund Complex Overseen | Other Directorships | |||||||||||||||
| Willard H. Altman, Jr. – (76)* | Trustee & Chairman† Years Served: <1 | Retired. Formerly, until 1995, Partner of Ernst & Young LLP, a public accounting firm. | 7 | ||||||||||||||||
| Thomas P. Merrick – (75)* | Trustee† Years Served: <1 | Private Consultant. President of Strategic Planning Consultants for more than the past five years. Former Executive Committee Member and Vice President of Fluor Corporation, responsible for strategic planning, from 1993 to 1998. | 7 | ||||||||||||||||
| Alfred E. Osborne, Jr. – (67)* | Trustee† Years Served: <1 | Senior Associate Dean of the John E. Anderson School of Management at UCLA. | 4 | Wedbush, Inc., Heckmann Corporation and Kaiser Aluminum, Inc. | |||||||||||||||
| Patrick B. Purcell – (69)* | Trustee† Years Served: <1 | Retired. Formerly Executive Vice President, Chief Financial and Administrative Officer of Paramount Pictures from 1983 to March 1998. | 7 | The Motion Picture and Television Fund | |||||||||||||||
| Allan M. Rudnick – (71)* | Trustee† Years Served: <1 | Private Investor. Formerly, Co-Founder, Chief Executive Officer, Chairman and Chief Investment Officer of Kayne Anderson Rudnick Investment Management from 1989 to 2007 | 7 | ||||||||||||||||
| Steven Romick – (49) | Trustee,† President & Chief Investment Officer Years Served: <1 | Partner of the Adviser since 2006. Formerly, Senior Vice President of First Pacific Advisors, Inc. from 1996 to 2006. | 2 | Arden Group, Inc. | |||||||||||||||
| Pierre O. Py – (35) | Portfolio Manager Years Served: <1 | Vice President of the Adviser since 2011. Formerly an international research analyst at Harris Associates LP from 2005 to 2010. | |||||||||||||||||
| Eric S. Ende – (67) | Vice President Years Served: <1 | Partner of the Adviser since 2006. Formerly, Senior Vice President of First Pacific Advisors, Inc. from 1984 to 2006. | 3 | ||||||||||||||||
| J. Richard Atwood – (52) | Treasurer Years Served: <1 | Chief Operating Officer of the Adviser. President and Chief Executive Officer of FPA Fund Distributors, Inc. | FPA Fund Distributors, Inc. | ||||||||||||||||
| Christopher H. Thomas – (55) | Chief Compliance Officer Years Served: <1 | Vice President and Chief Compliance Officer of the Adviser and Vice President of FPA Fund Distributors, Inc. | FPA Fund Distributors, Inc. | ||||||||||||||||
| Sherry Sasaki – (57) | Secretary Years Served: <1 | Assistant Vice President and Secretary of the Adviser and Secretary of FPA Fund Distributors, Inc. | |||||||||||||||||
| E. Lake Setzler – (45) | Assistant Treasurer Years Served: <1 | Vice President and Controller of the Adviser since 2005. | |||||||||||||||||
| Michael P. Gomez – (27) | Assistant Vice President Years Served: <1 | Assistant Vice President of the Adviser since 2010. Formerly In-Charge Associate of PricewaterhouseCoopers from 2007-2010. | |||||||||||||||||
† Trustees serve until their resignation, removal or retirement.
* Audit Committee member
Additional information on the Trustees is available in the Statement of Additional Information. Each of the above listed individuals can be contacted at 11400 W. Olympic Blvd., Suite 1200, Los Angeles, CA 90064.
17
FPA INTERNATIONAL VALUE FUND
INVESTMENT ADVISER
First Pacific Advisors, LLC
11400 West Olympic Boulevard, Suite 1200
Los Angeles, CA 90064
TRANSFER & SHAREHOLDER
SERVICE AGENT
UMB Fund Services, Inc.
P.O. Box 2175
Milwaukee, WI 53201-2175
or
803 W. Michigan St., Suite A
Milwaukee, WI 53233-2301
(800) 638-3060
CUSTODIAN
State Street Bank and Trust Company
Boston, Massachusetts
TICKER SYMBOL: FPIVX
CUSIP: 30254T726
DISTRIBUTOR
FPA Fund Distributors, Inc.
11400 West Olympic Boulevard, Suite 1200
Los Angeles, California 90064
LEGAL COUNSEL
K&L Gates LLP
San Francisco, California
INDEPENDENT REGISTERED PUBLIC
ACCOUNTING FIRM
Deloitte & Touche LLP
Los Angeles, California
This report has been prepared for the information of shareholders of FPA International Value Fund, and is not authorized for distribution to prospective investors unless preceded or accompanied by an effective prospectus.
The Fund's schedule of portfolio holdings, filed the first and third quarter on Form N-Q with the SEC, is available on the SEC's website at www.sec.gov. Form N-Q is available at the SEC's Public Reference Room in Washington, D.C., and information on the operations of the Public Reference Room may be obtained by calling 1-202-942-8090. To obtain information on Form N-Q from the Fund, shareholders can call 1-800-982-4372.
Additional information about the Fund is available online at www.fpafunds.com. This information includes, among other things, holdings, top sectors and performance, and is updated on or about the 15th business day after the end of the quarter.
Item 2. | Code of Ethics. Not Applicable to this semi-annual report. | |
|
| |
Item 3. | Audit Committee Financial Expert. Not Applicable to this semi-annual report. | |
|
| |
Item 4. | Principal Accountant Fees and Services. Not Applicable to this semi-annual report. | |
|
| |
Item 5. | Audit Committee of Listed Registrants. Not Applicable. | |
|
| |
Item 6. | Schedule of Investments. The schedule of investments is included as part of the report to stockholders filed under Item 1 of this Form. | |
|
| |
Item 7. | Disclosure of Proxy Voting Policies and Procedures for Closed-End Management Investment Companies. Not Applicable. | |
|
| |
Item 8. | Portfolio Managers of Closed-End Management Investment Companies. Not Applicable. | |
|
| |
Item 9. | Purchases of Equity Securities by Closed-End Management Investment Company and Affiliated Purchasers. Not Applicable. | |
|
| |
Item 10. | Submission of Matters to a Vote of Security Holders. There has been no material change to the procedures by which shareholders may recommend nominees to the registrant’s board of trustees. | |
|
| |
Item 11. | Controls and Procedures. | |
|
| |
| (a) | The principal executive officer and principal financial officer of the registrant have concluded that the registrant’s disclosure controls and procedures (as defined in Rule 30a-3(c) under the Investment Company Act of 1940) are effective based on their evaluation of the disclosure controls and procedures as of a date within 90 days of the filing date of this report. |
|
|
|
| (b) | There have been no significant changes in the registrant’s internal controls over financial reporting (as defined in Rule 30a-3(d) under the Investment Company Act of 1940) that occurred during the second fiscal quarter of the period covered by this report that have materially affected, or is reasonably likely to materially affect, the registrant’s internal controls over financial reporting. |
Item 12. | Exhibits. | |
|
| |
| (a)(1) | Code of ethics as applies to the registrant’s officers and trustees, as required to be disclosed under Item 2 of Form N-CSR. Not Applicable to this semi-annual report. |
|
|
|
| (a)(2) | Separate certification for the registrant’s principal executive officer and principal financial officer, as required by Rule 30a-2(a) under the Investment Company Act of 1940. Attached hereto. |
|
|
|
| (a)(3) | Not Applicable |
|
|
|
| (b) | Separate certification for the registrant’s principal executive officer and principal financial officer, as required by Rule 30a-2(b) under the Investment Company Act of 1940. Attached hereto. |
SIGNATURES
Pursuant to the requirements of the Securities Exchange Act of 1934 and the Investment Company Act of 1940, the registrant has duly caused this report to be signed on its behalf by the undersigned, thereunto duly authorized.
FPA FUNDS TRUST’S FPA CRESCENT FUND AND FPA INTERNATIONAL VALUE FUND
By: | /s/ STEVEN T. ROMICK |
|
Steven T. Romick, President | ||
(Principal Executive Officer) | ||
Date: August 17, 2012
Pursuant to the requirements of the Securities Exchange Act of 1934 and the Investment Company Act of 1940, this report has been signed below by the following persons on behalf of the registrant and in the capacities and on the dates indicated.
FPA FUNDS TRUST’S FPA CRESCENT FUND AND FPA INTERNATIONAL VALUE FUND
By: | /s/ STEVEN T. ROMICK |
|
Steven T. Romick, President | ||
(Principal Executive Officer) | ||
Date: August 17, 2012
By: | /s/ J. RICHARD ATWOOD |
|
J. Richard Atwood, Treasurer | ||
(Principal Financial Officer) | ||
Date: August 17, 2012