UNITED STATES
SECURITIES AND EXCHANGE COMMISSION
Washington, D.C. 20549
FORM N-CSR
CERTIFIED SHAREHOLDER REPORT OF REGISTERED
MANAGEMENT INVESTMENT COMPANIES
Investment Company Act file number: 811-08544
fpa FUNDS TRUST
(Exact name of registrant as specified in charter)
11601 WILSHIRE BLVD., STE. 1200
LOS ANGELES, CALIFORNIA 90025
(Address of principal executive offices)(Zip code)
| (Name and Address of Agent for Service) | Copy to: |
J. RICHARD ATWOOD, PRESIDENT FPA FUNDS TRUST 11601 WILSHIRE BLVD., STE. 1200 LOS ANGELES, CALIFORNIA 90025 | MARK D. PERLOW, ESQ. DECHERT LLP ONE BUSH STREET, STE. 1600 SAN FRANCISCO, CA 94104 |
Registrant’s telephone number, including area code: (310) 473-0225
Date of fiscal year end: December 31
Date of reporting period: December 31, 2020
Item 1: Report to Shareholders.
| (a) | The Reports to Shareholders are attached herewith. |

Distributor:
UMB DISTRIBUTION SERVICES, LLC
235 West Galena Street
Milwaukee, Wisconsin 53212
Beginning on January 1, 2021, as permitted by regulations adopted by the Securities and Exchange Commission, we intend to no longer mail paper copies of the Fund's shareholder reports, unless you specifically request paper copies of the reports from the Fund or from your financial intermediary, such as a broker-dealer or bank. Instead, the reports will be made available on the FPA Funds website (fpa.com/funds), and you will be notified by mail each time a report is posted and provided with a website link to access the report. If you already elected to receive shareholder reports electronically, you will not be affected by this change and you need not take any action. If you prefer to receive shareholder reports and other communications electronically, you may update your mailing preferences with your financial intermediary, or enroll in e-delivery at fpa.com (for accounts held directly with the Fund).
You may elect to continue to receive paper copies of all future reports free of charge. If you invest through a financial intermediary, you may contact your financial intermediary to request that you continue to receive paper copies of your shareholder reports. If you invest directly with the Fund, you may inform the Fund that you wish to continue receiving paper copies of your shareholder reports by contacting us at (800) 638-3060. Your election to receive reports in paper will apply to all funds held with the FPA Funds or through your financial intermediary.
FPA CRESCENT FUND
LETTER TO SHAREHOLDERS
Dear Shareholders:
Overview
The FPA Crescent Fund — Institutional Class ("Fund" or "Crescent") gained 18.15% for the fourth quarter and 12.11% for the full year 2020.1
The Fund's performance and that of its underlying equity exposure can be considered in the context of the following illustrative indices.
Exhibit A: Performance versus Illustrative Indices2
| | | Q4 2020 | | 2020 | |
Crescent | | | 18.2 | % | | | 12.1 | % | |
Crescent — Long Equity | | | 23.8 | % | | | 12.6 | % | |
S&P 500 | | | 12.2 | % | | | 18.4 | % | |
MSCI ACWI | | | 14.7 | % | | | 16.3 | % | |
Including some minor risk assets and cash held, the Fund generated 135.3% of the average of the S&P 500 and MSCI ACWI return in the fourth quarter. The Fund outperformed its own risk exposure of 79.0%, on average, during the quarter.3
The Fund's strategy may have appeared out of step in the first quarter, and as we argued at the time in the Fund's Q1 2020 commentary: "Businesses owned by the Fund may have seen their stock value move 25% day-to-day, or even intra-day, but in our assessment their business value did not similarly change."
Stock prices generally appreciated over the last three months; and in many cases increased by quite a lot. While the Fund showed an outsized improvement in the fourth quarter, which was generally a function of the many positions we pointed out as being inexpensive in our Q3 2020 commentary. And still, in our assessment, not a lot has changed in the underlying fundamentals of the companies held in the portfolio.
1 Effective September 4, 2020, the current single class of shares of the Fund was renamed the Institutional Class shares. Unless otherwise noted, all data herein is representative of the Institutional Share Class.
2 Comparison to the indices is for illustrative purposes only. The Fund does not include outperformance of any index or benchmark in its investment objectives. An investor cannot invest directly in an index. The long equity segment of the Fund is presented gross of investment management fees, transactions costs, and Fund operating expenses, which if included, would reduce the returns presented. Long equity holdings only includes equity securities excluding paired trades, short-sales, and preferred securities. The long equity performance information shown herein is for illustrative purposes only and may not reflect the impact of material economic or market factors. No representation is being made that any account, product or strategy will or is likely to achieve profits, losses, or results similar to those shown. Long equity performance does not represent the return an investor in the Fund can or should expect to receive. Fund shareholders may only invest or redeem their shares at net asset value.
3 Risk assets are any assets that are not risk free and generally refers to any financial security or instrument, such as equities, commodities, high-yield bonds, and other financial products that are likely to fluctuate in price. Risk exposure refers to the Fund's exposure to risk assets as a percent of total assets. The Fund's net risk exposure as of December 31, 2020 was 78.5%.
Past performance is no guarantee, nor is it indicative, of future results.
1
FPA CRESCENT FUND
LETTER TO SHAREHOLDERS
(Continued)
Portfolio discussion
It's been a year of extreme, nerve-wracking volatility. Our longer-term mindset is our anchor in choppy seas, guiding us to seek out what is currently out of favor while avoiding the inflated valuations of what is in vogue. However, these portfolio decisions can cause us to appear out of touch with the crowd — hopefully a temporary phenomenon, and incumbent on us to prove to you over time.
In our Q2 2020 commentary earlier this year, we shared what we believed would be temporary impacts on certain businesses: that people would get on planes and stay in hotels again, and what that might mean for the travel and aerospace industries, for example.
We owned and subsequently purchased many stocks that experienced dramatic price declines in the first quarter. The shares of these companies were priced at such low valuations, suggesting that their businesses would never recover.
As a result, the Fund saw more changes in its portfolio last year than it has had in many years. We took the opportunity to increase equity exposure earlier in 2020 as investors were running for the exits. We reset the portfolio by reducing or eliminating certain holdings that in our view offered less attractive long-term potential, while increasing existing and new positions in those businesses that we believed were temporarily harmed by the global pandemic but whose stock prices were disproportionately decimated.
The contributors to and detractors from the Fund's trailing 12-month returns are listed below and reflect the realities of 2020: technology and other growth stocks performed well, while more cyclical "value" stocks did not.
Exhibit B: Trailing Twelve Month Contributors and Detractors as of December 31, 20204
Contributors | | Perf.
Cont. | | Avg. %
of Port. | | Detractors | | Perf.
Cont. | | Avg. %
of Port. | |
Alphabet | | | 2.02 | % | | | 5.3 | % | | Howmet Aerospace | | | -1.25 | % | | | 1.9 | % | |
Broadcom | | | 1.64 | % | | | 2.8 | % | | McDermott (multiple issues) | | | -1.09 | % | | | 0.8 | % | |
Naspers & Prosus | | | 1.35 | % | | | 3.0 | % | | Wells Fargo | | | -0.99 | % | | | 1.6 | % | |
Baidu | | | 1.22 | % | | | 1.6 | % | | Ally Financial | | | -0.94 | % | | | 0.2 | % | |
Facebook | | | 1.17 | % | | | 2.5 | % | | Raytheon & Otis | | | -0.80 | % | | | 0.7 | % | |
| | | | 7.41 | % | | | 15.1 | % | | | | | -5.07 | % | | | 5.2 | % | |
4 Reflects the top five contributors and detractors to the Fund's performance based on contribution to return for the trailing twelve months ("TTM"). Contribution is presented gross of investment management fees, transactions costs, and Fund operating expenses, which if included, would reduce the returns presented. The information provided does not reflect all positions purchased, sold or recommended by FPA during the quarter. A copy of the methodology used and a list of every holding's contribution to the overall Fund's performance during the TTM is available by contacting FPA Client Service at crm@fpa.com. It should not be assumed that recommendations made in the future will be profitable or will equal the performance of the securities listed. Positions in Naspers and Prosus are look-through investments to gain exposure to Tencent. Raytheon and Otis were results of a Merger between Raytheon and United Technologies. As such, the contribution to return and weight of these separate companies has been combined for purposes of this analysis.
Past performance is no guarantee, nor is it indicative, of future results.
2
FPA CRESCENT FUND
LETTER TO SHAREHOLDERS
(Continued)
Technology: It's no great surprise that the top five contributors to performance over the last year were our technology investments that floated upwards on the rising tide. Despite taking some profits, we retained many of these positions. These companies share the common characteristic that they operate successful business models and trade at valuations that, although not as inexpensive as they once were, we believe will still provide a reasonable return in the years to come.
Financials: The financials in our portfolio underperformed as investors sold shares in a panic, fearing that the economic downturn would cause such damage to loan and investment portfolios and that there would be, in general, less demand for their products and services. The market was correct that their businesses would be harmed, but not to the degree that was ultimately priced into their stocks. There has been some recent recognition of this as financials were strong performers in Q4 and in the early days of 2021. Given strong balance sheets, a post-COVID economy within sight, stimulus packages, and the Fed's security purchase support, combined with inexpensive valuations, we suspect that there is still gas left in their collective tank.
Aerospace: We own two aerospace suppliers, Howmet and Meggitt, which saw their stock prices decline by around two-thirds from their Q1 2020 highs.5 Howmet's price increased about three times from its low and ended the year at its all-time high. Meggitt's stock price doubled from its bottom but is still significantly below its peak. The value of their necessary and large market share businesses did not fluctuate as much as their stock prices.
When things look bleakest, the prospects for returns are typically brightest. As much as that might have been the case earlier this year, in our assessment the opposite is true today. Now that the stock market has run to new highs, we would suggest that we have borrowed from future returns.6 In general, the more you pay for an asset, the lower you can expect for its future return. We therefore retain approximately 25% in cash and conservative fixed income as available to be redirected for future opportunities.
Markets and Economy
It's always good to take stock at the end of a calendar year, and no better time than now with 2020 delivering more than the usual share of surprises.
At the end of 2019, no one predicted that the unemployment rate would hit its highest level since the Great Depression and most Americans would struggle financially; US national debt would cross $27 trillion, an increase of almost $5 trillion; GDP would shrink 3.5%; average wages would decline but household incomes would increase, thanks to government stimulus checks (Exhibit C); yet the stock market would hit new highs, delivering a double-digit rate of return.
5 As of December 31, 2020. The TTM average portfolio weight of and contribution by Meggitt were 0.8% and -0.43%, respectively. The TTM average portfolio weight of and contribution by Howmet were 1.9% and -1.25%, respectively.
6 Unless otherwise noted, any references to "market" in this Commentary refers to the S&P 500 Index.
Past performance is no guarantee, nor is it indicative, of future results.
3
FPA CRESCENT FUND
LETTER TO SHAREHOLDERS
(Continued)
Exhibit C: Personal Income Increased in 2020 Despite a Decline in Wages in the U.S.7
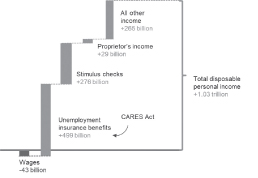
The economy and, by extension, the securities markets have been supported by the friendliest financial conditions in U.S. history including: a negative real rate of interest, liberal fiscal policy, business subsidies, stimulus checks for most individuals, and a ballooning Fed balance sheet used to buy treasuries, agencies, and now corporate bonds.
People were fearful of what might be. As is usually the case, however, more things could happen than will happen. We certainly did not predict that 2020 would unfold as it did, but the three meta-points we communicated in our Q1 2020 commentary, when fear was near its peak, reflect our steady bearing.
We said then that;
1) "...the world isn't coming to an end. The impact on the Fund is largely a mark-to-market exercise in the midst of the most unsettling series of events that many of us have ever experienced."
2) "We put almost 30 percent of the Fund's cash to work during the quarter, with its cash position shrinking to 26% of the portfolio from 36%. We added more than a dozen new holdings and are genuinely happy with what we own...."
3) "We believe Crescent's portfolio of securities at the end of this tumultuous quarter is attractive...."
Investors typically anchor to the average annual market return, while disregarding that the actual annual returns vacillate tremendously around that average.
7 Source: Bureau of Economic Analysis. Data is from March 2020 through November 2020 and compared to the same time period in 2019.
Past performance is no guarantee, nor is it indicative, of future results.
4
FPA CRESCENT FUND
LETTER TO SHAREHOLDERS
(Continued)
Ironically, people will one day look back at 2020 and see a year that delivered a market return of approximately 2x the long-term average. There will be less attention paid to the market having declined approximately 34%, only to then rebound approximately 67%.8 That's comforting in a way as it suggests that this unusual year was not really so abnormal.
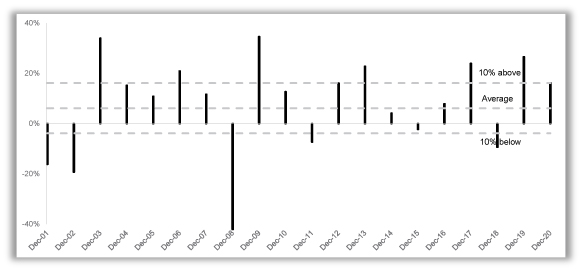
Investors focus on average annual stock market returns without often appreciating that the stock market never returns the average. Long-term equity returns are achieved with significant variability around the mean. The MSCI ACWI Net Return Index has returned an average of 6.12% over the past 20 years, but in only three instances were the returns even within 2% of the average. In 65% of the cases, the returns were more than 10 percentage points higher or lower than the average, with a 77% spread between the best and worst years (34.6% in 2009; -42.2% in 2008). Therefore, notwithstanding the tremendous volatility during the year, as it relates to the global stock market returns for the full calendar year 2020, it was truly an exceptionally unexceptional year (Exhibit D).
Exhibit D: MSCI ACWI Returns 2001 to 20209
The pendulum swung hard to the downside in March and now has swung even harder to the upside since those market lows. We also wrote in our Q1 2020 commentary that "As emotion is wrung from the stock market, it tends to look forward to what the economy looks like on the other side of a virulent downturn." That happened sooner than we expected. Far be it from us to say this rebound was overdone, but there's little question that the markets are pricing in a COVID-free world (Exhibit E).
8 Source: Bloomberg. As of December 31, 2020. The 'market' statistics noted refer to the S&P 500 Index.
9 Source: Bloomberg. As of December 31, 2020. MSCI ACWI Net Return Index.
Past performance is no guarantee, nor is it indicative, of future results.
5
FPA CRESCENT FUND
LETTER TO SHAREHOLDERS
(Continued)
Exhibit E: Global Valuations10

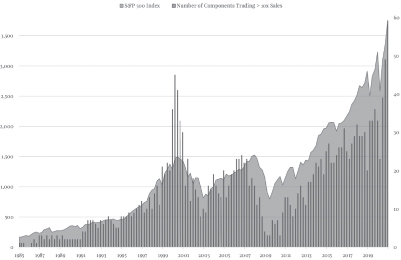
In comparison to trailing indicators, large-cap US stocks (S&P 500) trade at 22.3x forward earnings at year-end, 45% higher than the 20-year average. 11 Larger market cap companies based outside the U.S. (ACWI ex-U.S.) trade less expensively at 16.7x, although still 25% higher than its 20-year average. These higher valuations can, in part, be supported by lower interest rates and the higher growth rates of many businesses. However, ~12% of the S&P 500 now trades at more than 10x sales — its largest percentage and more than during the dotcom bubble (Exhibit F). Only time will tell if it is truly different this time, but it has always been dangerous to utter those words during previous periods of market exuberance.
10 Source: Factset. As of December 31, 2020. Data is represented by the respective indices in the charts.
11 Source: J.P. Morgan Asset Management, Guide to the Markets. Slide 55. As of December 31, 2020.
Past performance is no guarantee, nor is it indicative, of future results.
6
FPA CRESCENT FUND
LETTER TO SHAREHOLDERS
(Continued)
Exhibit F: Valuation Extreme12
International stocks continue to trade more inexpensively (relatively) when compared to U.S. stocks even with many operating globally (Exhibit G). A lower valuation on its own, though, does not warrant a place for a stock in our portfolio. Those slots are reserved for growing businesses. We have been fortunate to find many such companies in the last couple of years, which explains our 40.7% exposure (as a percent of net equity investments) to foreign-domiciled companies; including global companies like Lafargeholcim, Groupe Bruxelles Lambert, Glencore, and Richemont.13
12 Source: What were you thinking? Part Tres. Jesse Felder, The Felder Report. Data as of December 31, 2020. The 'number of components' refers to individual stocks.
13 Portfolio composition will change due to ongoing management of the Fund.
Past performance is no guarantee, nor is it indicative, of future results.
7
FPA CRESCENT FUND
LETTER TO SHAREHOLDERS
(Continued)
Exhibit G: Relative Forward P/E Ratio of S&P 500 vs. MSCI ACWI ex-U.S.14

Generally high valuations create a friendly market for raising capital. This past year was no different. Initial public offering volume hit a record $175 billion; while SPACS, the special purpose acquisition companies that have a "blank check" to invest, have raised more than $60 billion.15
According to Bloomberg, "a record $120 trillion of stock changed hands on U.S. stock exchanges last year, up 50% year-over year. The average Russell 3000 stock saw average daily share volume surge 46% to 1.9 million shares."16 The stocks that performed best were those with better projected prospects than current earnings and companies that were either less impacted by or benefited from the pandemic. Needless to say, we did not own many of these companies. The momentum-driven buying of many individuals, including those utilizing commission-less platforms like Robinhood, have helped drive stock prices higher. Many of these "investors" operate with the core tenet that past performance is indicative of future performance, and have piled into stocks with the aid of record amounts of borrowed money and the use of derivatives (Exhibits H & I).
14 Source: Factset. As of December 31, 2020.
15 Source: A Speculative Frenzy is Sweeping Wall Street and World Markets. Bloomberg News. As of December 19, 2020.
16 Source: Day Traders Put Stamp on Market with Unprecedented Stock Frenzy. Bloomberg Quint. As of January 1, 2021.
Past performance is no guarantee, nor is it indicative, of future results.
8
FPA CRESCENT FUND
LETTER TO SHAREHOLDERS
(Continued)
Exhibit H: Margin Debt17
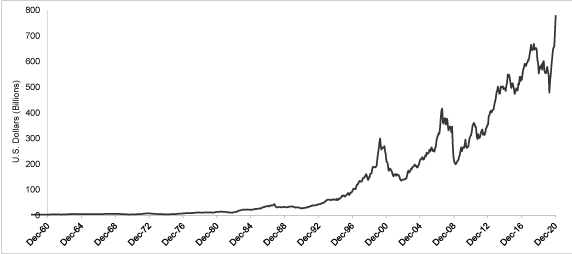
Exhibit I: Call Options Traded 20-Day Moving Average18

17 Source: Yardeni Research, Inc. As of December 31, 2020. Debit balances in margin accounts at broker/dealers. Beginning in 1997, data reflects debit Balances in customers' securities margin accounts.
18 Source: Bloomberg. U.S. Total Option Call Volumes. As of December 31, 2020.
Past performance is no guarantee, nor is it indicative, of future results.
9
FPA CRESCENT FUND
LETTER TO SHAREHOLDERS
(Continued)
It's interesting to see how people find solace in different industries in which they have little grasp of the economics, let alone what might be the right price to pay. Momentum, more than understanding, drove the Nifty 50 in the 70s; Oil stocks in the 80s; Tech stocks in the 90s; Diversified industrial stocks and certain financials — like General Electric and Bank of America in the 00s; and now back to technology and healthcare stocks today. 19
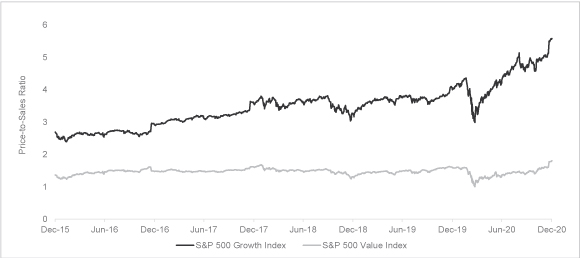
This has led to a clear bifurcation in the market with a widening gulf between the haves and have-nots — as pronounced as we've ever seen it (Exhibit J). The valuations of many "haves" are too rich for our blood and are less likely to deliver reasonable returns over time, despite many high quality businesses in the mix. The lower valuations of the "have-nots" can often be appropriately justified by the secular challenges these businesses face. As price conscious investors, we focus on the cohort in between. Much of the oxygen in the room has gotten sucked up by those stocks that have been "working", leaving the share prices of many good businesses gasping for air.
Exhibit J: Price/Sales: S&P 500 Growth Index vs S&P 500 Value Index20
Grounded in the philosophy of not paying more for an asset than we believe it is worth, our true north remains bottom-up security selection. We evaluate the risk/reward of each of our investments over a three to five-year period, and innately believe that anything less is speculation. As risky as investing in stocks appeared at the March lows, particularly with regard to the financial, travel, and aerospace sectors, we'd argue that higher stock prices today, all else equal, translates to greater risk.
19 Nifty 50 was an informal designation for fifty popular large-cap stocks on the New York Stock Exchange in the 1960s and 1970s that were widely regarded as solid buy and hold growth stocks, or "Blue-chip" stocks.
20 Source: Bloomberg. As of December 31, 2020.
Past performance is no guarantee, nor is it indicative, of future results.
10
FPA CRESCENT FUND
LETTER TO SHAREHOLDERS
(Continued)
We therefore expend the bulk of our energy and capital on those businesses that we believe offer secular growth, good returns on capital, have operators who are either owners or function with an owner mentality and, finally, trade at prices that should allow for an acceptable rate of return over time.
Investors today are paying more for certainty — or for the illusion of certainty. However, there are numerous companies (many with unproven business models) whose valuations can only be justified by high earnings growth well into the future. Further, achieving those growth rates does not assure good stock price performance. Take Microsoft for example. It posted 19.5% earnings growth through the first decade of the millennium, but its stock price declined 48% in that time.21 Price may not matter over the short-term, but it certainly does over the long-term. The Crescent portfolio will hopefully continue to prove that point.
High Yield and Distressed Debt
Our inability to find attractive high yield and distressed debt opportunities has been disappointing. Higher yielding corporate debt had always been an integral part of our portfolio, yet we have been sidelined for much of the last decade. We watched the yields of lower tier corporate credits decline over the last decade, and then decline some more.
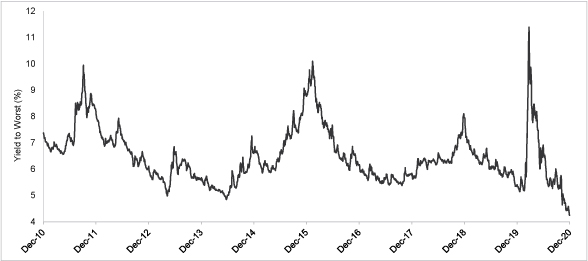
In a quest for return, investors have bid up the price of high yield bonds so that this yield is now at an all-time low of 4.2%, and that's a gross yield before some measure of defaults (Exhibit K).
Exhibit K: BofA US High Yield Index Yield to Worst22
21 Source: Bloomberg, for the period 12/31/1999 to 12/31/2009. Microsoft's stock price on the respective dates was $58.38 and $30.48.
22 Source: Bloomberg. As of December 31, 2020. High yield bonds market data represented by ICE BofA US High Yield Index. Yield to worst is a measure of the lowest possible yield that a bond can receive operating within the terms of its contract without defaulting.
Past performance is no guarantee, nor is it indicative, of future results.
11
FPA CRESCENT FUND
LETTER TO SHAREHOLDERS
(Continued)
Adding to the risk factors, corporate debt generally has the worst lender protection in its history; i.e., fewer and weaker covenants and more covenant relief than we've ever seen (Exhibits L & M).
Exhibit L: Covenant-lite Share of Outstanding US Leverage Loans23
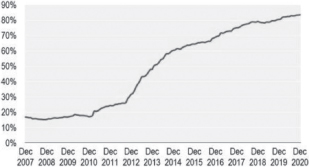
23 Source: LCD, S&P Global Market Intelligence. As of December 31, 2020.
Past performance is no guarantee, nor is it indicative, of future results.
12
FPA CRESCENT FUND
LETTER TO SHAREHOLDERS
(Continued)
Exhibit M: Covenant Relief Count24

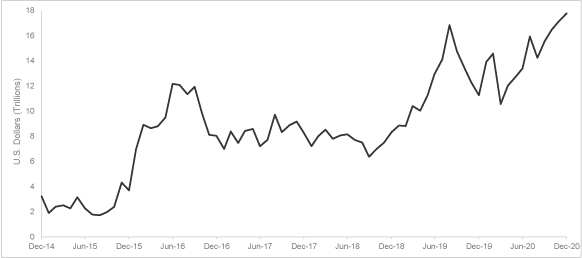
Should we once again see opportunities in high yield (higher yields with the necessary lender protection), then you will likely see more fund exposure to the asset class. There is, unfortunately, no guarantee that this will materialize, particularly in a world where lenders are now paying borrowers. Almost $18 trillion of global debt now has a negative yield (Exhibit N).
24 Source: Markets betting on the Fed's dovish policy shift on inflation, Credit. The Daily Shot, as of August 27, 2020. Data for 2020 is through July 31. Data for 2020 is through July 31, 2020 and is sourced from LCD, an offering of S&P Global Market Intelligence.
Past performance is no guarantee, nor is it indicative, of future results.
13
FPA CRESCENT FUND
LETTER TO SHAREHOLDERS
(Continued)
Exhibit N: Negative Yielding Global Debt25
Closing
What was a bad year in March turned into an average year by December, emphasizing how noisy short-term performance can be for long duration assets. From a valuation perspective, we believe we are well-positioned for future performance, although more relatively than absolutely: our portfolio is less expensive than the market but certainly not as cheap as it was in March.26 And we have available liquidity that will allow us to capitalize on future opportunities.
Although we do not like losing money, we can't forget about making money. This balance between capital preservation and appreciation must always consider the macro environment: the sovereign desire to inflate, the continued low interest rates, and the negative real return on cash. Given that setup, if we can continue to be successful with our long equity security selection, then we should run Crescent more invested even if that may involve greater volatility.27
25 Source: Bloomberg. Bloomberg Barclays Global Aggregate Negative Yielding Debt Index Market Value. As of December 31, 2020.
26 The forward P/E of the Fund's long equity and the S&P 500 Index as of 03/31/2020 and 12/31/2020 were 11.8x and 16.1x; 26.9x and 29.8x, respectively.
27 For illustrative purposes only. The long equity segment of the Fund is presented gross of investment management fees, transactions costs, and Fund operating expenses, which if included, would reduce the returns presented. Long equity holdings only includes equity securities excluding paired trades, short-sales, and preferred securities. The long equity performance information shown herein is for illustrative purposes only and may not reflect the impact of material economic or market factors. No representation is being made that any account, product or strategy will or is likely to achieve profits, losses, or results similar to those shown. Long equity performance does not represent the return an investor in the Fund can or should expect to receive. Fund shareholders may only invest or redeem their shares at net asset value.
Past performance is no guarantee, nor is it indicative, of future results.
14
FPA CRESCENT FUND
LETTER TO SHAREHOLDERS
(Continued)
We will continue to pay closer attention to how things might unfold over time, rather than to emphasize any moment in time.
Respectfully submitted,

Steven Romick
Co-Portfolio Manager
January 29, 2021
15
FPA CRESCENT FUND
LETTER TO SHAREHOLDERS
(Continued)
The discussions of Fund investments represent the views of the Fund's managers at the time of this report and are subject to change without notice. These views may not be relied upon as investment advice or as an indication of trading intent on behalf of any First Pacific Advisors portfolio. Security examples featured are samples for presentation purposes and are intended to illustrate our investment philosophy and its application. It should not be assumed that most recommendations made in the future will be profitable or will equal the performance of the securities. This information and data has been prepared from sources believed reliable. The accuracy and completeness of the information cannot be guaranteed and is not a complete summary or statement of all available data.
FORWARD LOOKING STATEMENT DISCLOSURE
As mutual fund managers, one of our responsibilities is to communicate with shareholders in an open and direct manner. Insofar as some of our opinions and comments in our letters to shareholders are based on our current expectations, they are considered "forward-looking statements" which may or may not prove to be accurate over the long term. While we believe we have a reasonable basis for our comments and we have confidence in our opinions, actual results may differ materially from those we anticipate. You can identify forward-looking statements by words such as "believe," "expect," "may," "anticipate," and other similar expressions when discussing prospects for particular portfolio holdings and/or the markets, generally. We cannot, however, assure future results and disclaim any obligation to update or alter any forward-looking statements, whether as a result of new information, future events, or otherwise. Further, information provided in this report should not be construed as a recommendation to purchase or sell any particular security.
16
FPA CRESCENT FUND
HISTORICAL PERFORMANCE
(Unaudited)
Change in Value of a $10,000 Investment in FPA Crescent Fund Institutional Class vs. S&P 500, MSCI All Country World Index, 60%/40% S&P 500 Index/Bloomberg Barclays US Aggregate Bond Index and Consumer Price Index for the Ten Years Ended December 31, 2020
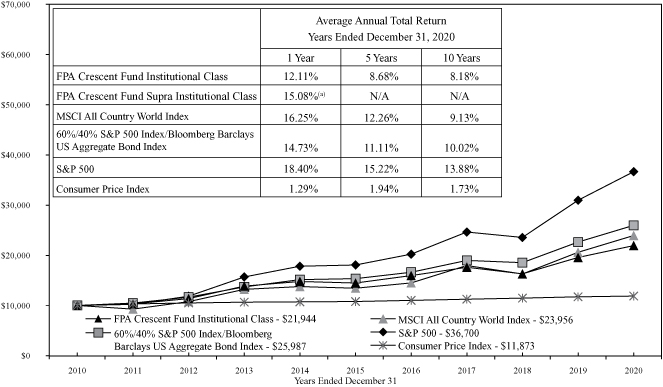
(a) Period from September 4, 2020, date operations commenced, through December 31, 2020.
The Standard & Poor's 500 Stock Index (S&P 500) is a capitalization-weighted index which covers industrial, utility, transportation and financial service companies, and represents approximately 75% of the New York Stock Exchange (NYSE) capitalization and 30% of NYSE issuers and is considered a measure of large capitalization stock performance. The MSCI All Country World Index is a float-adjusted market capitalization index that is designed to measure the combined equity market performance of developed and emerging market countries. The 60%/40% S&P 500 Index/Bloomberg Barclays U.S. Aggregate Bond Index is a composite blend of 60% of the S&P 500 Index and 40% of the Bloomberg Barclays U.S. Aggregate Bond Index. The Consumer Price Index (CPI) is an unmanaged index representing the rate of inflation of U.S. consumer prices as determined by the U.S. Bureau of Labor Statistics. The S&P 500, MSCI All Country World and 60%/40% S&P 500/Bloomberg Barclays U.S. Aggregate Bond indexes are included as broad-based comparisons to the capitalization characteristics of the Fund's portfolio. The CPI is included as comparison of the Fund's results to inflation.
Past performance is no guarantee of future results and current performance may be higher or lower than the performance shown. This data represents past performance and investors should understand that investment returns and principal values fluctuate, so that when you redeem your investment may be worth more or less than its original cost. Current month-end performance data can be obtained by visiting the website at www.fpa.com or by calling toll-free, 1-800-982-4372. Information regarding the Fund's expense ratio and redemption fees can be found on pages 38, 39 and 44. The Prospectus details the Fund's objective and policies, sales charges, and other matters of interest to prospective investors. Please read the Prospectus carefully before investing. The Prospectus may be obtained by visiting the website at www.fpa.com, by email at crm@fpa.com, toll-free by calling 1-800-982-4372 or by contacting the Fund in writing.
17
FPA CRESCENT FUND
PORTFOLIO SUMMARY
December 31, 2020
Common Stocks | | | | | 74.6 | % | |
Internet Media | | | 12.4 | % | | | |
Semiconductor Devices | | | 6.6 | % | | | |
Cable & Satellite | | | 6.1 | % | | | |
Cement & Aggregates | | | 3.9 | % | | | |
Industrial Distribution & Rental | | | 3.6 | % | | | |
Banks | | | 3.4 | % | | | |
P&C Insurance | | | 2.9 | % | | | |
Institutional Brokerage | | | 2.8 | % | | | |
Diversified Banks | | | 2.7 | % | | | |
Electrical Components | | | 2.7 | % | | | |
Investment Companies | | | 2.7 | % | | | |
Base Metals | | | 2.1 | % | | | |
Insurance Brokers | | | 2.1 | % | | | |
Internet Based Services | | | 1.9 | % | | | |
Railroad Rolling Stock | | | 1.6 | % | | | |
Computer Hardware & Storage | | | 1.5 | % | | | |
Application Software | | | 1.4 | % | | | |
Midstream — Oil & Gas | | | 1.2 | % | | | |
Hotels, Restaurants & Leisure | | | 1.2 | % | | | |
Telecom Carriers | | | 1.2 | % | | | |
E-Commerce Discretionary | | | 1.2 | % | | | |
Apparel, Footwear & Accessory Design | | | 1.1 | % | | | |
Commercial & Residential Building
Equipment & Systems | | | 1.1 | % | | | |
Specialty Chemicals | | | 1.0 | % | | | |
Aircraft & Parts | | | 1.0 | % | | | |
Wealth Management | | | 1.0 | % | | | |
Other Common Stocks | | | 0.9 | % | | | |
Infrastructure Software | | | 0.9 | % | | | |
Medical Equipment | | | 0.8 | % | | | |
Real Estate Owners & Developers | | | 0.6 | % | | | |
Integrated Utilities | | | 0.4 | % | | | |
Oil & Gas Services & Equipment | | | 0.3 | % | | | |
Marine Shipping | | | 0.3 | % | | | |
Closed End Fund | | | | | 0.7 | % | |
Limited Partnerships | | | | | 1.4 | % | |
Preferred Stocks | | | | | 1.1 | % | |
Automobiles | | | 1.0 | % | | | |
Engineering Services | | | 0.1 | % | | | |
Energy | | | 0.0 | % | | | |
Warrants | | | | | 0.0 | % | |
18
FPA CRESCENT FUND
PORTFOLIO SUMMARY (Continued)
December 31, 2020
Bonds & Debentures | | | | | 10.4 | % | |
U.S. Treasuries | | | 6.0 | % | | | |
Corporate Bonds & Notes | | | 2.1 | % | | | |
Municipals | | | 1.2 | % | | | |
Corporate Bank Debt | | | 1.1 | % | | | |
Asset-Backed Securities | | | 0.0 | % | | | |
Short-term Investments | | | | | 12.0 | % | |
Securities Sold Short | | | | | (3.8 | )% | |
Other Assets And Liabilities, Net | | | | | 3.6 | % | |
Net Assets | | | | | 100.0 | % | |
19
FPA CRESCENT FUND
PORTFOLIO OF INVESTMENTS
December 31, 2020
COMMON STOCKS | | Shares | | Fair Value | |
INTERNET MEDIA — 12.4% | |
Alphabet, Inc. (Class A)(a) | | | 155,782 | | | $ | 273,029,769 | | |
Alphabet, Inc. (Class C)(a) | | | 149,898 | | | | 262,603,308 | | |
Baidu, Inc. (ADR) (China)(a) | | | 692,881 | | | | 149,828,587 | | |
Facebook, Inc. (Class A)(a) | | | 901,184 | | | | 246,167,422 | | |
Naspers, Ltd. (N Shares) (South Africa) | | | 999,707 | | | | 204,714,599 | | |
Prosus NV (Netherlands)(a) | | | 1,071,980 | | | | 115,750,985 | | |
| | | $ | 1,252,094,670 | | |
SEMICONDUCTOR DEVICES — 6.6% | |
Analog Devices, Inc. | | | 1,929,660 | | | $ | 285,068,672 | | |
Broadcom, Inc. | | | 680,788 | | | | 298,083,026 | | |
NXP Semiconductors NV (Netherlands) | | | 495,130 | | | | 78,730,621 | | |
| | | $ | 661,882,319 | | |
CABLE & SATELLITE — 6.1% | |
Charter Communications, Inc. (Class A)(a)(b) | | | 407,280 | | | $ | 269,436,084 | | |
Comcast Corp. (Class A)(b) | | | 6,679,349 | | | | 349,997,888 | | |
| | | $ | 619,433,972 | | |
CEMENT & AGGREGATES — 3.9% | |
HeidelbergCement AG (Germany) | | | 1,246,654 | | | $ | 92,820,225 | | |
LafargeHolcim Ltd. (Switzerland)(a) | | | 5,386,620 | | | | 295,659,543 | | |
| | | $ | 388,479,768 | | |
INDUSTRIAL DISTRIBUTION & RENTAL — 3.6% | |
GEA Group AG (Germany) | | | 1,017,395 | | | $ | 36,389,365 | | |
Howmet Aerospace, Inc. | | | 6,464,080 | | | | 184,484,843 | | |
LG Corp. (South Korea) | | | 1,772,486 | | | | 143,026,918 | | |
| | | $ | 363,901,126 | | |
BANKS — 3.4% | |
CIT Group, Inc. | | | 1,109,274 | | | $ | 39,822,937 | | |
Signature Bank | | | 826,280 | | | | 111,787,421 | | |
Wells Fargo & Co. | | | 6,360,024 | | | | 191,945,524 | | |
| | | $ | 343,555,882 | | |
P&C INSURANCE — 2.9% | |
American International Group, Inc.(b) | | | 7,752,935 | | | $ | 293,526,119 | | |
INSTITUTIONAL BROKERAGE — 2.8% | |
Jefferies Financial Group, Inc.(b) | | | 11,415,011 | | | $ | 280,809,271 | | |
20
FPA CRESCENT FUND
PORTFOLIO OF INVESTMENTS (Continued)
December 31, 2020
COMMON STOCKS — Continued | | Shares | | Fair Value | |
DIVERSIFIED BANKS — 2.7% | |
Bank of America Corp. | | | 1,322,205 | | | $ | 40,076,034 | | |
Citigroup, Inc. | | | 3,820,250 | | | | 235,556,615 | | |
| | | $ | 275,632,649 | | |
ELECTRICAL COMPONENTS — 2.7% | |
TE Connectivity, Ltd. (Switzerland) | | | 2,263,442 | | | $ | 274,034,923 | | |
INVESTMENT COMPANIES — 2.7% | |
Groupe Bruxelles Lambert SA (Belgium) | | | 2,698,000 | | | $ | 271,942,296 | | |
BASE METALS — 2.1% | |
Glencore plc (Switzerland)(a) | | | 67,586,309 | | | $ | 214,640,167 | | |
INSURANCE BROKERS — 2.1% | |
Aon plc (Class A) (Britain) | | | 983,127 | | | $ | 207,705,241 | | |
INTERNET BASED SERVICES — 1.9% | |
Booking Holdings, Inc.(a) | | | 87,262 | | | $ | 194,356,035 | | |
RAILROAD ROLLING STOCK — 1.6% | |
Westinghouse Air Brake Technologies Corp. | | | 2,162,605 | | | $ | 158,302,686 | | |
COMPUTER HARDWARE & STORAGE — 1.5% | |
Dell Technologies (C Shares)(a) | | | 2,102,833 | | | $ | 154,116,631 | | |
APPLICATION SOFTWARE — 1.4% | |
Epic Games, Inc.(d)(e) | | | 33,130 | | | $ | 19,049,750 | | |
Nexon Co. Ltd. (Japan) | | | 3,964,090 | | | | 122,311,541 | | |
| | | $ | 141,361,291 | | |
MIDSTREAM — OIL & GAS — 1.2% | |
Kinder Morgan, Inc.(b) | | | 8,905,679 | | | $ | 121,740,632 | | |
HOTELS, RESTAURANTS & LEISURE — 1.2% | |
Marriott International, Inc. (Class A) | | | 921,818 | | | $ | 121,606,231 | | |
TELECOM CARRIERS — 1.2% | |
SoftBank Group Corp. (Japan) | | | 1,522,000 | | | $ | 118,160,488 | | |
21
FPA CRESCENT FUND
PORTFOLIO OF INVESTMENTS (Continued)
December 31, 2020
COMMON STOCKS — Continued | | Shares | | Fair Value | |
E-COMMERCE DISCRETIONARY — 1.2% | |
Alibaba Group Holding Ltd. (ADR) (China)(a) | | | 500,827 | | | $ | 116,557,468 | | |
APPAREL, FOOTWEAR & ACCESSORY DESIGN — 1.1% | |
Cie Financiere Richemont SA (Switzerland) | | | 1,260,768 | | | $ | 113,900,255 | | |
COMMERCIAL & RESIDENTIAL BUILDING EQUIPMENT &
SYSTEMS — 1.1% | |
Samsung C&T Corp. (South Korea) | | | 859,404 | | | $ | 109,397,064 | | |
SPECIALTY CHEMICALS — 1.0% | |
Univar Solutions, Inc.(a) | | | 5,500,735 | | | $ | 104,568,972 | | |
AIRCRAFT & PARTS — 1.0% | |
Meggitt plc (Britain)(a) | | | 16,338,300 | | | $ | 103,897,155 | | |
WEALTH MANAGEMENT — 1.0% | |
LPL Financial Holdings, Inc. | | | 968,110 | | | $ | 100,896,424 | | |
INFRASTRUCTURE SOFTWARE — 0.9% | |
FirstEnergy Corp. | | | 2,789,666 | | | $ | 85,391,676 | | |
MEDICAL EQUIPMENT — 0.8% | |
Olympus Corp. (Japan) | | | 3,471,210 | | | $ | 75,998,310 | | |
REAL ESTATE OWNERS & DEVELOPERS — 0.6% | |
Swire Pacific Ltd. (Class A) (Hong Kong) | | | 10,152,602 | | | $ | 55,924,656 | | |
INTEGRATED UTILITIES — 0.4% | |
PG&E Corp.(a) | | | 3,597,611 | | | $ | 44,826,233 | | |
OIL & GAS SERVICES & EQUIPMENT — 0.3% | |
Mcdermott International Ltd.(a)(c) | | | 39,633,209 | | | $ | 32,102,899 | | |
MARINE SHIPPING — 0.3% | |
Sound Holding FP (Luxembourg)(c)(d)(e)(f) | | | 1,146,250 | | | $ | 31,923,993 | | |
22
FPA CRESCENT FUND
PORTFOLIO OF INVESTMENTS (Continued)
December 31, 2020
COMMON STOCKS — Continued | | Shares or
Principal
Amount | | Fair Value | |
| OTHER COMMON STOCKS — 0.9%(k) | | | | $ | 90,914,317 | | |
| | | $ | 90,914,317 | | |
| TOTAL COMMON STOCKS — 74.6% (Cost $4,967,890,227) | | $ | 7,523,581,819 | | |
CLOSED END FUND — 0.7% | |
Altaba Escrow(a)(d)(e)(Cost $0) | | | 4,756,180 | | | $ | 67,513,975 | | |
LIMITED PARTNERSHIPS | |
U.S. Farming Realty Trust, L.P. (Real Estate)(c)(d)(e) | | | 350,000 | | | $ | 17,906,498 | | |
U.S. Farming Realty Trust II, L.P. (Real Estate)(c)(d)(e) | | | 120,000 | | | | 8,544,132 | | |
GACP II LP (Credit)(d)(e) | | | 958,312 | | | | 37,883,328 | | |
FPS LLC (Marine Shipping)(c)(d)(e)(f) | | | 1,076,253 | | | | 65,661,790 | | |
FPS Shelby Holding I LLC (Marine Shipping)(c)(d)(e)(f) | | | 107,799 | | | | 9,464,470 | | |
| TOTAL LIMITED PARTNERSHIPS — 1.4% (Cost $163,209,900) | | $ | 139,460,218 | | |
PREFERRED STOCKS | |
AUTOMOBILES — 1.0% | |
Porsche Automobil Holding SE (Germany) | | | 1,539,070 | | | $ | 106,314,078 | | |
ENGINEERING SERVICES — 0.1% | |
McDermott International, Inc.(d)(e) | | | 225,906 | | | $ | 7,906,722 | | |
| TOTAL PREFERRED STOCKS — 1.1% (Cost $88,712,586) | | $ | 114,220,800 | | |
WARRANT — 0.0% | |
ENERGY — 0.0% | |
Cie Financiere Richemont SA 11/22/2023(a) (Cost $0) | | | 2,521,536 | | | $ | 655,092 | | |
BONDS & DEBENTURES | |
ASSET-BACKED SECURITY — 0.0% | |
MARINE SHIPPING — 0.0% | |
Kamsarmax Shipping — 7.000% 11/4/2021(d)(e) (Cost $6,064,516) | | $ | 6,064,516 | | | $ | 4,410,116 | | |
CORPORATE BONDS & NOTES | |
COMMUNICATIONS — 0.1% | |
Uber Technologies, Inc. — 8.000% 11/1/2026(g) | | $ | 7,066,000 | | | $ | 7,711,620 | | |
23
FPA CRESCENT FUND
PORTFOLIO OF INVESTMENTS (Continued)
December 31, 2020
BONDS & DEBENTURES — Continued | | Principal
Amount | | Fair Value | |
CONSUMER, CYCLICAL — 1.0% | |
Carnival Corp. — 11.500% 4/1/2023(g) | | $ | 30,383,000 | | | $ | 35,132,471 | | |
Royal Caribbean Cruises Ltd. — 11.500% 6/1/2025(g) | | | 61,108,000 | | | | 71,285,537 | | |
| | | $ | 106,418,008 | | |
ENERGY — 0.3% | |
Gulfport Energy Corp. — 6.000% 10/15/2024 | | $ | 18,209,000 | | | $ | 12,131,746 | | |
Gulfport Energy Corp. — 6.375% 5/15/2025 | | | 8,822,000 | | | | 5,844,575 | | |
Gulfport Energy Corp. — 6.375% 1/15/2026 | | | 9,128,000 | | | | 6,070,120 | | |
Gulfport Energy Corp. — 6.625% 5/1/2023 | | | 9,417,000 | | | | 6,344,704 | | |
| | | $ | 30,391,145 | | |
INDUSTRIAL — 0.7% | |
Bombardier, Inc. — 7.450% 5/1/2034(g) | | $ | 5,800,000 | | | $ | 5,017,000 | | |
Bombardier, Inc. — 7.500% 3/15/2025(g) | | | 66,677,000 | | | | 62,342,995 | | |
| | | $ | 67,359,995 | | |
TOTAL CORPORATE BONDS & NOTES — 2.1%
(Cost $167,068,217) | | $ | 211,880,768 | | |
CORPORATE BANK DEBT | |
Dell International LLC Term Loan B, 1M USD LIBOR + 2.000% — 2.750%
9/19/2025(d)(h) | | $ | 16,351,119 | | | $ | 16,361,420 | | |
Gray Television, Inc. Term Loan, 1M USD LIBOR + 2.250% — 2.394%
2/7/2024(d)(h) | | | 21,837,000 | | | | 21,659,684 | | |
| McDermott Intl Senior Exit LC — 0.000% 6/30/2024(d)(e)(l) | | | 12,520,193 | | | | (1,252,019 | ) | |
| McDermott LC — 1.000% 12/31/2021(d)(e)(l) | | | 22,648,178 | | | | 28,053,885 | | |
McDermott Super Senior Exit LC, 1M USD LIBOR + 0.500%
6/30/2024(d)(e)(l) | | | 49,113,301 | | | | (4,665,764 | ) | |
McDermott Technology Americas, Inc., 6/30/2024(d) | | | 1,074,102 | | | | 859,281 | | |
McDermott Technology Americas, Inc., 1M USD LIBOR + 1.000% —
1.146% 6/30/2025(d)(h) | | | 32,176,109 | | | | 20,270,949 | | |
Steenbok LUX Financial 2 SARL, PIK — 10.750% 12/31/2021(d) | | | 1,112,278 | | | | 903,611 | | |
Western Digital Corp. Term Loan B 4, 1M USD LIBOR + 1.750% — 1.896%
4/29/2023(d)(h) | | | 27,421,120 | | | | 27,369,842 | | |
| TOTAL CORPORATE BANK DEBT — 1.1% (Cost $179,360,394) | | $ | 109,560,889 | | |
MUNICIPALS | |
Commonwealth of Puerto Rico GO,
Series 2014 A, (SER A), — 8.000% 7/1/2035 | | $ | 111,230,000 | | | $ | 76,192,550 | | |
Puerto Rico Public Buildings Authority Rev., Series 2012 U,
(REF-GOVT FACS-SER U), — 5.250% 7/1/2042 | | | 54,920,000 | | | | 42,837,600 | | |
| TOTAL MUNICIPALS — 1.2% (Cost $47,159,988) | | $ | 119,030,150 | | |
24
FPA CRESCENT FUND
PORTFOLIO OF INVESTMENTS (Continued)
December 31, 2020
BONDS & DEBENTURES — Continued | | Principal
Amount | | Fair Value | |
U.S. TREASURIES | |
U.S. Treasury Bills — 0.028% 1/12/2021(i) | | $ | 36,800,000 | | | $ | 36,799,293 | | |
U.S. Treasury Bills — 0.044% 1/14/2021(i) | | | 60,000,000 | | | | 59,999,034 | | |
U.S. Treasury Bills — 0.045% 1/26/2021(i) | | | 55,000,000 | | | | 54,998,070 | | |
U.S. Treasury Bills — 0.056% 1/28/2021(i) | | | 35,000,000 | | | | 34,998,023 | | |
U.S. Treasury Bills — 0.062% 2/18/2021(i) | | | 30,000,000 | | | | 29,996,895 | | |
U.S. Treasury Bills — 0.067% 2/4/2021(i) | | | 65,000,000 | | | | 64,995,365 | | |
U.S. Treasury Bills — 0.068% 2/2/2021(i) | | | 65,000,000 | | | | 64,995,294 | | |
U.S. Treasury Bills — 0.069% 2/25/2021(i) | | | 35,000,000 | | | | 34,995,205 | | |
U.S. Treasury Bills — 0.071% 1/21/2021(i) | | | 40,000,000 | | | | 39,998,680 | | |
U.S. Treasury Bills — 0.071% 2/11/2021(i) | | | 40,000,000 | | | | 39,996,056 | | |
U.S. Treasury Bills — 0.072% 2/23/2021(i) | | | 48,000,000 | | | | 47,995,594 | | |
U.S. Treasury Bills — 0.073% 2/9/2021(i) | | | 70,000,000 | | | | 69,995,618 | | |
U.S. Treasury Bills — 0.086% 3/2/2021(i) | | | 27,000,000 | | | | 26,996,679 | | |
| TOTAL U.S. TREASURIES — 6.0% (Cost $606,762,499) | | $ | 606,759,806 | | |
| TOTAL BONDS & DEBENTURES — 10.4% (Cost $1,006,415,614) | | $ | 1,051,641,729 | | |
| TOTAL INVESTMENT SECURITIES — 88.2% (Cost $6,226,228,327) | | $ | 8,897,073,633 | | |
SHORT-TERM INVESTMENTS | |
Apple, Inc. | |
| — 0.091% 1/7/2021 | | $ | 115,000,000 | | | $ | 114,998,275 | | |
| — 0.101% 2/1/2021 | | | 40,000,000 | | | | 39,996,556 | | |
| — 0.101% 2/2/2021 | | | 25,000,000 | | | | 24,997,778 | | |
| — 0.101% 2/3/2021 | | | 25,000,000 | | | | 24,997,708 | | |
| — 0.101% 2/5/2021 | | | 50,000,000 | | | | 49,995,139 | | |
| — 0.101% 2/8/2021 | | | 20,000,000 | | | | 19,997,889 | | |
| — 0.101% 2/12/2021 | | | 35,000,000 | | | | 34,995,917 | | |
Chevron Corp. | |
| — 0.091% 2/3/2021 | | | 89,400,000 | | | | 89,392,624 | | |
| — 0.091% 2/5/2021 | | | 50,000,000 | | | | 49,995,625 | | |
| — 0.101% 1/5/2021 | | | 15,000,000 | | | | 14,999,833 | | |
| — 0.101% 1/28/2021 | | | 15,000,000 | | | | 14,998,875 | | |
| — 0.101% 2/12/2021 | | | 18,000,000 | | | | 17,997,900 | | |
| — 0.112% 1/6/2021 | | | 57,000,000 | | | | 56,999,129 | | |
| — 0.112% 1/8/2021 | | | 45,000,000 | | | | 44,999,038 | | |
| — 0.112% 2/10/2021 | | | 28,000,000 | | | | 27,996,578 | | |
25
FPA CRESCENT FUND
PORTFOLIO OF INVESTMENTS (Continued)
December 31, 2020
SHORT-TERM INVESTMENTS — Continued | | Shares or
Principal
Amount | | Fair Value | |
Exxon Mobil Corp. | |
| — 0.091% 1/29/2021 | | $ | 70,000,000 | | | $ | 69,995,100 | | |
| — 0.101% 1/22/2021 | | | 20,000,000 | | | | 19,998,833 | | |
| — 0.101% 2/22/2021 | | | 48,000,000 | | | | 47,993,067 | | |
| — 0.101% 2/23/2021 | | | 75,000,000 | | | | 74,988,958 | | |
| — 0.101% 2/24/2021 | | | 80,000,000 | | | | 79,988,000 | | |
Nestle Cap Corp. | |
| — 0.091% 2/4/2021 | | | 43,000,000 | | | | 42,996,345 | | |
| — 0.091% 2/5/2021 | | | 75,000,000 | | | | 74,993,438 | | |
Nestle Finance International Ltd. — 0.112% 1/5/2021 | | | 19,600,000 | | | | 19,599,760 | | |
Roche Holding, Inc. | |
| — 0.071% 1/15/2021 | | | 30,000,000 | | | | 29,999,183 | | |
| — 0.081% 1/20/2021 | | | 34,000,000 | | | | 33,998,564 | | |
| — 0.091% 1/11/2021 | | | 44,000,000 | | | | 43,998,900 | | |
| — 0.091% 1/13/2021 | | | 40,000,000 | | | | 39,998,800 | | |
State Street Bank Repurchase Agreement — 0.00% 1/4/2021
(Dated 12/31/2020, repurchase price of $796,000, collateralized by
$684,500 principal amount U.S. Treasury Notes — 0.375% 2023,
fair value $811,940)(j) | | | 796,000 | | | | 796,000 | | |
TOTAL SHORT-TERM INVESTMENTS — 12.0%
(Cost $1,206,703,812) | | $ | 1,206,703,812 | | |
| TOTAL INVESTMENTS — 100.2% (Cost $7,432,932,139) | | $ | 10,103,777,445 | | |
SECURITIES SOLD SHORT — (3.8)% | |
COMMON STOCKS SOLD SHORT — (3.3)% | |
Softbank Corp. (Japan) | | | (1,005,890 | ) | | $ | (12,625,918 | ) | |
Volkswagen AG (Preference Shares) (Germany) | | | (408,519 | ) | | | (76,345,557 | ) | |
| | | $ | (88,971,475 | ) | |
| OTHER COMMON STOCKS SOLD SHORT(k) | | $ | (245,584,519 | ) | |
| TOTAL COMMON STOCKS SOLD SHORT (Proceeds $304,928,608) | | $ | (334,555,994 | ) | |
CORPORATE BONDS & NOTES SOLD SHORT — (0.5)% | |
Dell International LLC / EMC Corp. — 7.125% 6/15/2024(g) | | $ | (16,693,000 | ) | | $ | (17,312,727 | ) | |
Western Digital Corp. — 4.750% 2/15/2026 | | | (27,578,000 | ) | | | (30,600,847 | ) | |
TOTAL CORPORATE BONDS & NOTES SOLD SHORT
(Proceeds $44,594,096) | | $ | (47,913,574 | ) | |
26
FPA CRESCENT FUND
PORTFOLIO OF INVESTMENTS (Continued)
December 31, 2020
SECURITIES SOLD SHORT — Continued | | Shares | | Fair Value | |
| TOTAL SECURITIES SOLD SHORT (Proceeds $349,522,704) | | $ | (382,469,568 | ) | |
| Other assets and liabilities, net — 3.6% | | | 361,327,679 | | |
NET ASSETS — 100.0% | | $ | 10,082,635,556 | | |
(a) Non-income producing security.
(b) As of December 31, 2020, investments with a value of $1,114,987,500 were fully or partially segregated with the broker(s)/custodian as collateral for open short contracts.
(c) Affiliated Security.
(d) Restricted securities. These restricted securities constituted 3.90% of total net assets at December 31, 2020, most of which are considered liquid by the Adviser. These securities are not registered and may not be sold to the public. There are legal and/or contractual restrictions on resale. The Fund does not have the right to demand that such securities be registered. The values of these securities are determined by valuations provided by pricing services, brokers, dealers, market makers, or in good faith under policies adopted by authority of the Fund's Board of Trustees.
(e) Investments categorized as a significant unobservable input (Level 3) (See Note 8 of the Notes to Financial Statements).
(f) Controlled company.
(g) Security exempt from registration under Rule 144A of the Securities Act of 1933. These securities may be resold in transactions exempt from registration, typically only to qualified institutional buyers. Unless otherwise indicated, these securities are not considered to be illiquid.
(h) Variable/Floating Rate Security — The rate shown is based on the latest available information as of December 31, 2020. For Corporate Bank Debt, the rate shown may represent a weighted average interest rate. Certain variable rate securities are not based on a published rate and spread but are determined by the issuer or agent and are based on current market conditions. These securities do not indicate a reference rate and spread in their description.
(i) Zero coupon bond. Coupon amount represents effective yield to maturity.
(j) Security pledged as collateral (See Note 10 of the Notes to Financial Statements).
(k) As permitted by U.S. Securities and Exchange Commission regulations, "Other" Common Stocks include holdings in their first year of acquisition that have not previously been publicly disclosed.
(l) All or a portion of this holding is subject to unfunded loan commitments. The stated interest rate reflects the weighted average of the reference rate and spread for the funded portion, if any, and the commitment fees on the portion of the loan that is unfunded. See Note 11.
27
FPA CRESCENT FUND
PORTFOLIO OF INVESTMENTS (Continued)
December 31, 2020
Purchased Options
Description | | Pay/
Receive
Floating
Rate | | Floating
Rate
Index | | Exercise
Rate | | Expiration
Date | | Counter-
party | | Notional
Amount | | Premium | | Fair Value | |
Call —
CMS Cap
Swap(d)(e) | | Receive | | Maximum of
[0, 30-Year —
3-Year —
USD-ISDA
Swap Rate —
0.04] | | | 0.04 | % | | 2/15/2023 | | Barclays
Bank
PLC | | $ | 4,776,000,000 | | | $ | 1,265,640 | | | $ | 955,200 | | |
Call —
CMS Cap
Swap(d)(e) | | Receive | | Maximum of
[0, 30-Year —
3-Year —
USD-ISDA
Swap Rate —
0.04] | | | 0.04 | % | | 2/22/2023 | | Barclays
Bank
PLC | | | 4,776,000,000 | | | | 1,265,640 | | | | 1,002,960 | | |
Call —
CMS Cap
Swap(d)(e) | | Receive | | Maximum of
[0, 30-Year —
3-Year —
USD-ISDA
Swap Rate —
0.04] | | | 0.04 | % | | 3/01/2023 | | Barclays
Bank
PLC | | | 4,776,000,000 | | | | 1,265,640 | | | | 1,002,960 | | |
Call —
CMS Cap
Swap(d)(e) | | Receive | | Maximum of
[0, 30-Year —
3-Year —
USD-ISDA
Swap Rate —
0.04] | | | 0.04 | % | | 3/08/2023 | | Barclays
Bank
PLC | | | 4,776,000,000 | | | | 1,265,640 | | | | 1,002,960 | | |
Call —
CMS Cap
Swap(d)(e) | | Receive | | Maximum of
[0, 30-Year —
3-Year —
USD-ISDA
Swap Rate —
0.04] | | | 0.04 | % | | 2/15/2023 | | Goldman
Sachs
Inter-
national | | | 9,204,500,000 | | | | 2,531,237 | | | | 2,393,170 | | |
Call —
CMS Cap
Swap(d)(e) | | Receive | | Maximum of
[0, 30-Year —
3-Year —
USD-ISDA
Swap Rate —
0.04] | | | 0.04 | % | | 2/22/2023 | | Goldman
Sachs
Inter-
national | | | 9,204,500,000 | | | | 2,531,238 | | | | 2,393,170 | | |
28
FPA CRESCENT FUND
PORTFOLIO OF INVESTMENTS (Continued)
December 31, 2020
Description | | Pay/
Receive
Floating
Rate | | Floating
Rate
Index | | Exercise
Rate | | Expiration
Date | | Counter-
party | | Notional
Amount | | Premium | | Fair Value | |
Call —
CMS Cap
Swap(d)(e) | | Receive | | Maximum of
[0, 30-Year —
3-Year —
USD-ISDA
Swap Rate —
0.04] | | | 0.04 | % | | 3/01/2023 | | Goldman
Sachs
Inter-
national | | $ | 9,204,500,000 | | | $ | 2,531,237 | | | $ | 2,485,215 | | |
Call —
CMS Cap
Swap(d)(e) | |
Receive | | Maximum of
[0, 30-Year —
3-Year —
USD-ISDA
Swap Rate —
0.04] | | | 0.04 | % | | 3/08/2023 | | Goldman
Sachs
Inter-
national | | | 9,204,500,000 | | | | 2,531,238 | | | | 2,485,215 | | |
Call —
CMS Cap
Swap(d)(e) | | Receive | | Maximum of
[0, 30-Year —
3-Year —
USD-ISDA
Swap Rate —
0.04] | | | 0.04 | % | | 2/15/2023 | | Morgan
Stanley | | | 5,062,500,000 | | | | 1,265,625 | | | | 405,000 | | |
Call —
CMS Cap
Swap(d)(e) | | Receive | | Maximum of
[0, 30-Year —
3-Year —
USD-ISDA
Swap Rate —
0.04] | | | 0.04 | % | | 2/22/2023 | | Morgan
Stanley | | | 5,062,500,000 | | | | 1,265,625 | | | | 405,000 | | |
Call —
CMS Cap
Swap(d)(e) | | Receive | | Maximum of
[0, 30-Year —
3-Year —
USD-ISDA
Swap Rate —
0.04] | | | 0.04 | % | | 3/01/2023 | | Morgan
Stanley | | | 5,062,500,000 | | | | 1,265,625 | | | | 405,000 | | |
Call —
CMS Cap
Swap(d)(e) | | Receive | | Maximum of
[0, 30-Year —
3-Year —
USD-ISDA
Swap Rate —
0.04] | | | 0.04 | % | | 3/08/2023 | | Morgan
Stanley | | | 5,062,500,000 | | | | 1,265,625 | | | | 455,625 | | |
Call —
OIS Cap
Swap(d)(e) | | Receive | | 3-Month
USD-LIBOR | | | 0.68 | % | | 1/11/2029 | | Morgan
Stanley | | | 260,061,813 | | | | 7,038,227 | | | | 8,454,610 | | |
| | | $ | 27,288,237 | | | $ | 23,846,085 | | |
29
FPA CRESCENT FUND
PORTFOLIO OF INVESTMENTS (Continued)
December 31, 2020
Written Options
Description | | Pay/
Receive
Floating
Rate | | Floating
Rate
Index | | Exercise
Rate | | Expiration
Date | | Counter-
party | | Notional
Amount | | Premium | | Fair Value | |
Put — OIS
Floor
Swap(d)(e) | |
Pay | |
3-Month
USD-LIBOR | |
0.35% | |
1/11/2029 | |
Morgan
Stanley | | $ | (260,061,813 | ) | | $ | (7,038,227 | ) | | $ | (6,353,310 | ) | |
Swap Agreements outstanding as of December 31, 2020 were as follows:
Credit Default Swaps on Asset-Backed Securities — Buy Protection (1)
Description | |
Payment
Frequency | |
Fixed Deal
Pay Rate | |
Expiration
Date | |
Counterparty | |
Notional
Amount (2) | |
Value (3) | | Upfront
Payments
Paid
(Received) | |
Unrealized
Appreciation
(Depreciation) | |
Dell Inc. 7.1% Bonds
due 4/15/2028(d)(e) | | | Q | | | | 1.00 | % | | 6/20/2024 | | Barclays
Bank PLC | | $ | 7,682,605 | | | $ | 1,898 | | | $ | 202,178 | | | $ | (200,280 | ) | |
Dell Inc. 7.1% Bonds
due 4/15/2028(d)(e) | | | Q | | | | 1.00 | % | | 6/20/2024 | | Goldman Sachs
International | | | 29,846,904 | | | | (76,085 | ) | | | 784,532 | | | | (860,617 | ) | |
Dell Inc. 7.1% Bonds
due 4/15/2028(d)(e) | | | Q | | | | 1.00 | % | | 12/20/2024 | | Goldman Sachs
International | | | 4,801,628 | | | | 7,845 | | | | 121,216 | | | | (113,371 | ) | |
Dell Inc. 7.1% Bonds
due 4/15/2028(d)(e) | | | Q | | | | 1.00 | % | | 6/20/2024 | | Morgan
Stanley | | | 17,362,671 | | | | 6,954 | | | | 424,310 | | | | (417,356 | ) | |
| | | | | | | | | | | | | $ | (59,388 | ) | | $ | 1,532,236 | | | $ | (1,591,624 | ) | |
(1) If the Fund is a buyer of protection and a credit event occurs, as defined under the terms of that particular swap agreement, the Fund will either (i) receive from the seller of protection an amount equal to the notional amount of the swap and deliver the referenced obligation or underlying investments comprising the referenced index or (ii) receive a net settlement amount in the form of cash or investments equal to the notional amount of the swap less the recovery value of the referenced obligation or underlying investments comprising the referenced index.
(2) The maximum potential amount the Fund could be required to pay as a seller of credit protection or receive as a buyer of credit protection if a credit event occurs as defined under the terms of that particular swap agreement.
(3) The quoted market prices and resulting values for credit default swap agreements on Asset-Backed Securities serve as an indicator of the current status of the payment/performance risk and represent the expected amount paid or received for the credit derivative had the notional amount of the swap agreement been closed/sold as of year-end. Increasing values (buy protection) or decreasing values (sell protection), when compared to the notional amount of the swap, represent a deterioration of the referenced entity's credit soundness and a greater likelihood of risk of default or other credit event occurring as defined under the terms of the agreement.
30
FPA CRESCENT FUND
PORTFOLIO OF INVESTMENTS — RESTRICTED SECURITIES
December 31, 2020
Issuer | | Acquisition
Date(s) | | Cost | | Fair Value | | Fair
Value as a %
of Net Assets | |
Altaba Escrow
| | 09/26/2014, 09/29/2014,
09/30/2014, 10/03/2014,
10/06/2014, 10/07/2014,
08/28/2015, 11/01/2016,
11/02/2016, 11/03/2016 | | $ | — | | | $ | 67,513,975 | | | | 0.67 | % | |
CMS CAP SWAPTION 4.000
FEB23 4.000 CALL Barclays
Bank PLC 4.000% 02/15/2023 | | 02/26/2020 | | | 1,265,640 | | | | 955,200 | | | | 0.01 | % | |
CMS CAP SWAPTION 4.000
FEB23 4.000 CALL Barclays
Bank PLC 4.000% 02/22/2023 | | 02/26/2020 | | | 1,265,640 | | | | 1,002,960 | | | | 0.01 | % | |
CMS CAP SWAPTION 4.000
MAR23 4.000 CALL Barclays
Bank PLC 4.000% 03/01/2023 | | 02/26/2020 | | | 1,265,640 | | | | 1,002,960 | | | | 0.01 | % | |
CMS CAP SWAPTION 4.000
MAR23 4.000 CALL Barclays
Bank PLC 4.000% 03/08/2023 | | 02/26/2020 | | | 1,265,640 | | | | 1,002,960 | | | | 0.01 | % | |
CMS CAP SWAPTION 4.000
FEB23 4.000 CALL Goldman
Sachs International 4.000%
02/15/2023 | | 02/26/2020 | | | 2,531,237 | | | | 2,393,170 | | | | 0.02 | % | |
CMS CAP SWAPTION 4.000
FEB23 4.000 CALL Goldman
Sachs International 4.000%
02/22/2023 | | 02/26/2020 | | | 2,531,238 | | | | 2,393,170 | | | | 0.02 | % | |
CMS CAP SWAPTION 4.000
MAR23 4.000 CALL Goldman
Sachs International 4.000%
03/01/2023 | | 02/26/2020 | | | 2,531,237 | | | | 2,485,215 | | | | 0.02 | % | |
CMS CAP SWAPTION 4.000
MAR23 4.000 CALL Goldman
Sachs International 4.000%
03/08/2023 | | 02/26/2020 | | | 2,531,238 | | | | 2,485,215 | | | | 0.02 | % | |
CMS CAP SWAPTION 4.000
FEB23 4.000 CALL Morgan
Stanley 4.000% 02/15/2023 | | 02/26/2020 | | | 1,265,625 | | | | 405,000 | | | | 0.00 | % | |
CMS CAP SWAPTION 4.000
FEB23 4.000 CALL Morgan
Stanley 4.000% 02/22/2023 | | 02/26/2020 | | | 1,265,625 | | | | 405,000 | | | | 0.00 | % | |
CMS CAP SWAPTION 4.000
MAR23 4.000 CALL Morgan
Stanley 4.000% 3/01/2023 | | 02/26/2020 | | | 1,265,625 | | | | 405,000 | | | | 0.00 | % | |
31
FPA CRESCENT FUND
PORTFOLIO OF INVESTMENTS — RESTRICTED SECURITIES (Continued)
December 31, 2020
Issuer | | Acquisition
Date(s) | | Cost | | Fair Value | | Fair
Value as a %
of Net Assets | |
CMS CAP SWAPTION 4.000
MAR23 4.000 CALL Morgan
Stanley 4.000% 03/08/2023 | | 02/26/2020 | | $ | 1,265,625 | | | $ | 455,625 | | | | 0.00 | % | |
Dell, Inc. 7.1% Bonds due
4/15/2028 | | 09/12/2019, 10/10/2019 | | | 202,178 | | �� | | 1,898 | | | | 0.00 | % | |
Dell, Inc. 7.1% Bonds due
4/15/2028 | | 11/10/2020 | | | 784,532 | | | | (76,085 | ) | | | 0.00 | % | |
Dell, Inc. 7.1% Bonds due
4/15/2028 | | 11/01/2019 | | | 121,216 | | | | 7,845 | | | | 0.00 | % | |
Dell, Inc. 7.1% Bonds due
4/15/2028
| | 09/05/2019, 10/15/2019,
10/17/2019 | | |
424,310 | | | |
6,954 | | | |
0.00% | | |
Dell International LLC Term
Loan B — 2.750% 09/19/2025
| | 01/31/2020, 04/30/2020,
06/09/2020, 11/10/2020,
12/15/2020 | | |
16,419,408 | | | |
16,361,420 | | | |
0.16% | | |
Epic Games, Inc. | | 06/25/2020 | | | 19,049,750 | | | | 19,049,750 | | | | 0.19 | % | |
FPS LLC (Marine Shipping)
| | 02/03/2020, 03/02/2020,
03/09/2020, 04/09/2020,
05/29/2020, 07/20/2020 | | | 97,594,052 | | | | 65,661,790 | | | | 0.65% | | |
FPS Shelby Holding I LLC
| | 02/04/2020, 03/26/2020,
04/29/2020, 07/24/2020 | | | 10,779,935 | | | | 9,464,470 | | | | 0.09 | % | |
GACP II LP (Credit) | | 01/17/2020 | | | 31,187,670 | | | | 37,883,328 | | | | 0.38 | % | |
Gray Television, Inc. Term
Loan — 2.394% 02/07/2024
| | 06/13/2019, 06/14/2019,
06/18/2019, 06/21/2019,
07/19/2019 | | |
21,837,691 | | | |
21,659,684 | | | |
0.21% | | |
Kamsarmax Shipping — 7.000%
11/4/2021 | | 11/04/2020, 11/06/2020 | | | 6,064,516 | | | | 4,410,116 | | | | 0.04 | % | |
McDermott International, Inc. | | 12/31/2020 | | | — | | | | 7,906,722 | | | | 0.08 | % | |
McDermott LC — 1.000%
12/31/2021 | | 12/31/2020 | | | 36,413,228 | | | | 28,053,885 | | | | 0.28 | % | |
McDermott Intl Senior Exit LC
06/30/2024 | | 07/01/2020 | | | 2,343,241 | | | | (1,252,019 | ) | | | (0.01 | )% | |
McDermott Super Senior
Exit LC. — 0.500% 06/30/2024 | | 02/28/2020, 12/14/2020 | | | (372,878 | ) | | | (4,665,764 | ) | | | (0.05 | )% | |
McDermott Technology Americas,
Inc. — 1.146% 06/30/2025
| | 07/20/2020, 07/29/2020,
08/03/2020, 09/01/2020,
11/02/2020, 11/30/2020,
12/31/2020, 01/05/2021 | | |
78,128,758 | | | |
20,270,949 | | | |
0.20% | | |
32
FPA CRESCENT FUND
PORTFOLIO OF INVESTMENTS — RESTRICTED SECURITIES (Continued)
December 31, 2020
Issuer | | Acquisition
Date(s) | | Cost | | Fair Value | | Fair
Value as a %
of Net Assets | |
McDermott Technology Americas,
Inc. 06/30/2024 | | 07/01/2020 | | $ | 1,074,102 | | | $ | 859,281 | | | | 0.01 | % | |
OIS CAP SWAPTION 0.680
JAN29 0.680 CALL Morgan
Stanley 0.680% 01/11/2029 | | 10/19/2020 | | | 7,038,227 | | | | 8,454,610 | | | | 0.08 | % | |
OIS FLOOR SWAPTION 0.350
JAN29 0.350 PUT Morgan
Stanley 0.350% 01/11/2029 | | 10/19/2020 | | | (7,038,227 | ) | | | (6,353,310 | ) | | | (0.06 | )% | |
Sound Holding FP | | 10/07/2013 | | | 68,546,025 | | | | 31,923,993 | | | | 0.32 | % | |
Steenbok LUX Financial 2
SARL — 10.750% 12/31/2021 | | 03/04/2020, 06/30/2020
12/31/2020 | | | 1,026,823 | | | | 903,611 | | | | 0.01 | % | |
U.S. Farming Realty Trust II, L.P.
(Real Estate)
| | 12/24/2012, 04/29/2013,
06/17/2013, 10/28/2013,
01/14/2014, 04/22/2014,
06/25/2014, 09/09/2014,
10/08/2014, 12/18/2014,
06/18/2015, 07/29/2015 | | | 9,498,194 | | | | 8,544,132 | | | | 0.08 | % | |
U.S. Farming Realty Trust, L.P.
(Real Estate)
| | 11/26/2010, 01/31/2011,
03/09/2011, 04/15/2011,
05/10/2011, 06/27/2011,
08/15/2011, 10/17/2011,
10/28/2011, 11/28/2011,
01/03/2012, 01/26/2012,
04/05/2012, 07/13/2012,
12/07/2012, 08/01/2013 | | | 14,150,049 | | | | 17,906,498 | | | | 0.18 | % | |
Western Digital Corp. Term
Loan B 4 — 1.896% 04/29/2023 | | 01/27/2020, 02/27/2020 | | | 27,176,503 | | | | 27,369,842 | | | | 0.27 | % | |
TOTAL RESTRICTED
SECURITIES | | | | $ | 462,699,313 | | | $ | 397,259,050 | | | | 3.90 | % | |
See accompanying Notes to Financial Statements.
33
FPA CRESCENT FUND
STATEMENT OF ASSETS AND LIABILITIES
December 31, 2020
ASSETS | |
Investment securities — at fair value (identified cost $5,976,186,496) | | $ | 8,731,469,850 | | |
| Investments in affiliates — at fair value (identified cost $250,041,831) | | | 165,603,783 | | |
Short-term investments — at amortized cost (maturities 60 days or less) | | | 1,206,703,812 | | |
Purchased options, at value (premiums paid $27,288,237) | | | 23,846,085 | | |
Deposits for securities sold short | | | 365,645,523 | | |
Cash | | | 3,091,981 | | |
Receivable for: | |
Investment securities sold | | | 46,129,459 | | |
Dividends and interest | | | 15,313,927 | | |
Capital Stock sold | | | 2,574,134 | | |
| Total assets | | | 10,560,378,554 | | |
LIABILITIES | |
| Securities sold short, at fair value (proceeds $349,522,704) | | | 382,469,568 | | |
Swaps, at fair value (net upfront payments paid $1,532,236) | | | 59,388 | | |
Written options, at value (premiums received $7,038,227) | | | 6,353,310 | | |
Payable for: | |
| Investment securities purchased | | | 10,340,478 | | |
Due to broker — OTC derivatives collateral | | | 13,324,124 | | |
Capital Stock repurchased | | | 10,430,976 | | |
Advisory fees | | | 8,354,572 | | |
Due to custodian | | | 2,332 | | |
Accrued expenses and other liabilities | | | 46,408,250 | | |
| Total liabilities | | | 477,742,998 | | |
NET ASSETS | | $ | 10,082,635,556 | | |
SUMMARY OF SHAREHOLDERS' EQUITY | |
Capital Stock — no par value; unlimited authorized shares;
280,272,255 outstanding shares | | $ | 7,330,812,709 | | |
| Distributable earnings | | | 2,751,822,847 | | |
NET ASSETS | | $ | 10,082,635,556 | | |
Institutional Class | |
Net Assets | | $ | 8,903,455,242 | | |
Shares outstanding, no par value; unlimited authorized shares | | | 247,499,188 | | |
Offering and redemption price per share | | $ | 35.97 | | |
Supra Institutional Class: | |
Net Assets | | $ | 1,179,180,314 | | |
Shares outstanding, no par value; unlimited authorized shares | | | 32,773,067 | | |
Offering and redemption price per share | | $ | 35.98 | | |
See accompanying Notes to Financial Statements.
34
FPA CRESCENT FUND
STATEMENT OF OPERATIONS
For the Year Ended December 31, 2020
INVESTMENT INCOME | |
Dividends (net of foreign taxes withheld of $2,989,879) | | $ | 133,372,135 | | |
Interest | | | 47,073,560 | | |
| Income from affiliates | | | 450,388 | | |
| Total investment income | | | 180,896,083 | | |
EXPENSES | |
Advisory fees | | | 105,040,186 | | |
Short sale dividend expense | | | 7,956,438 | | |
Transfer agent fees and expenses | | | 4,014,642 | | |
Administrative services fees — Institutional Class | | | 2,587,719 | | |
Legal fees | | | 1,154,895 | | |
Reports to shareholders | | | 655,682 | | |
Custodian fees | | | 586,535 | | |
Other professional fees | | | 523,820 | | |
Trustee fees and expenses | | | 361,488 | | |
Audit and tax services fees | | | 87,956 | | |
Filing fees | | | 78,474 | | |
Administrative services fees — Supra Institutional Class(a) | | | 12,155 | | |
Other | | | 168,914 | | |
Total expenses | | | 123,228,904 | | |
Reimbursement from Adviser | | | (2,325,297 | ) | |
Net expenses | | | 120,903,607 | | |
Net investment income | | | 59,992,476 | | |
NET REALIZED AND UNREALIZED APPRECIATION (DEPRECIATION) | |
Net realized gain (loss) on: | |
| Investments | | | 783,158,012 | | |
| Investments in affiliates | | | (148,782,471 | ) | |
In-kind redemptions | | | 176,855,075 | | |
Written options | | | 7,420,352 | | |
Purchased options | | | 678,439 | | |
Swap contracts | | | (1,937,868 | ) | |
Investments in foreign currency transactions | | | (739,922 | ) | |
Net change in unrealized appreciation (depreciation) of: | |
| Investments | | | (204,482,377 | ) | |
| Investments in affiliates | | | (132,349,306 | ) | |
| Investment securities sold short | | | 35,981,560 | | |
Written options | | | 1,629,507 | | |
Purchased options | | | 2,430,365 | | |
Swap contracts | | | (312,900 | ) | |
Translation of foreign currency denominated amounts | | | 731,149 | | |
Net realized and unrealized gain | | | 520,279,615 | | |
NET INCREASE IN NET ASSETS RESULTING FROM OPERATIONS | | $ | 580,272,091 | | |
(a) Period from September 4, 2020, date operations commenced, through December 31, 2020.
See accompanying Notes to Financial Statements.
35
FPA CRESCENT FUND
STATEMENTS OF CHANGES IN NET ASSETS
| | | Year Ended
December 31, 2020 | | Year Ended
December 31, 2019 | |
INCREASE (DECREASE) IN NET ASSETS | |
Operations: | |
Net investment income | | $ | 59,992,476 | | | $ | 271,832,039 | | |
| Net realized gain | | | 816,651,617 | | | | 413,989,963 | | |
| Net change in unrealized appreciation (depreciation) | | | (296,372,002 | ) | | | 1,912,005,408 | | |
Net increase in net assets resulting from operations | | | 580,272,091 | | | | 2,597,827,410 | | |
Distributions to shareholders — Institutional Class | | | (510,592,905 | ) | | | (654,441,642 | ) | |
Distributions to shareholders — Supra Institutional Class(a) | | | (12,461,447 | ) | | | N/A | | |
Total Distributions to shareholders | | | (523,054,352 | ) | | | (654,441,642 | ) | |
Capital Stock transactions:(b) | |
Proceeds from Capital Stock sold | | | 2,408,393,979 | | | | 1,538,225,165 | | |
Proceeds from shares issued to shareholders upon reinvestment of
dividends and distributions | | | 458,862,950 | | | | 565,800,499 | | |
Cost of Capital Stock repurchased(c) | | | (6,850,927,376 | ) | | | (3,745,562,801 | ) | |
Net decrease from Capital Stock transactions | | | (3,983,670,447 | ) | | | (1,641,537,137 | ) | |
Total change in net assets | | | (3,926,452,708 | ) | | | 301,848,631 | | |
NET ASSETS | |
Beginning of Year | | | 14,009,088,264 | | | | 13,707,239,633 | | |
End of Year | | $ | 10,082,635,556 | | | $ | 14,009,088,264 | | |
(a) Period from September 4, 2020, date operations commenced, through December 31, 2020.
(b) See Note 9, Capital Stock, in the Notes to Financial Statements.
(c) Net of redemption fees of $444,210 and $481,210 for the year ended December 31, 2020 and year ended December 31, 2019, respectively, see Note 7.
See accompanying Notes to Financial Statements.
36
FPA CRESCENT FUND
FINANCIAL HIGHLIGHTS
| | | Year Ended December 31, | |
Institutional Class | | 2020 | | 2019 | | 2018 | | 2017 | | 2016 | |
Per share operating performance: | |
Net asset value at beginning of year | | $ | 33.83 | | | $ | 29.53 | | | $ | 34.69 | | | $ | 32.61 | | | $ | 31.06 | | |
Income from investment operations: | |
Net investment income* | | | 0.18 | | | | 0.62 | | | | 0.24 | | | | 0.23 | | | | 0.24 | | |
Net realized and unrealized gain (loss)
on investment securities | | | 3.69 | | | | 5.25 | | | | (2.78 | ) | | | 3.14 | | | | 2.93 | | |
Total from investment operations | | | 3.87 | | | | 5.87 | | | | (2.54 | ) | | | 3.37 | | | | 3.17 | | |
Less distributions: | |
Dividends from net investment income | | | (0.11 | ) | | | (0.80 | ) | | | (0.21 | ) | | | (0.34 | ) | | | (0.29 | ) | |
Distributions from net realized
capital gains | | | (1.62 | ) | | | (0.77 | ) | | | (2.41 | ) | | | (0.95 | ) | | | (1.34 | ) | |
Total distributions | | | (1.73 | ) | | | (1.57 | ) | | | (2.62 | ) | | | (1.29 | ) | | | (1.63 | ) | |
Redemption fees | | | — | ** | | | — | ** | | | — | ** | | | — | ** | | | 0.01 | | |
Net asset value at end of year | | $ | 35.97 | | | $ | 33.83 | | | $ | 29.53 | | | $ | 34.69 | | | $ | 32.61 | | |
Total investment return | | | 12.11 | % | | | 20.02 | % | | | (7.43 | )% | | | 10.39 | % | | | 10.25 | % | |
Ratios/supplemental data: | |
Net assets, end of year (in $000's) | | $ | 8,903,455 | | | $ | 14,009,883 | | | $ | 13,707,240 | | | $ | 17,484,747 | | | $ | 16,555,035 | | |
Ratio of expenses to average net assets: | |
Before reimbursement from Adviser | | | 1.15 | %‡ | | | 1.23 | %‡ | | | 1.18 | %‡ | | | 1.10 | %‡ | | | 1.09 | %‡ | |
After reimbursement from Adviser | | | 1.13 | %‡ | | | 1.23 | %‡ | | | 1.18 | %‡ | | | 1.10 | %‡ | | | 1.09 | %‡ | |
Net investment income: | |
Before reimbursement from Adviser | | | 0.54 | % | | | 1.90 | % | | | 0.70 | % | | | 0.66 | % | | | 0.77 | % | |
After reimbursement from Adviser | | | 0.56 | % | | | 1.90 | % | | | 0.70 | % | | | 0.66 | % | | | 0.77 | % | |
Portfolio turnover rate | | | 29 | % | | | 23 | % | | | 64 | % | | | 18 | % | | | 35 | % | |
* Per share amount is based on average shares outstanding.
** Rounds to less than $0.01 per share.
‡ For the periods ended December 31, 2020, December 31, 2019, December 31, 2018, December 31, 2017 and December 31, 2016, the expense ratio includes short sale dividend expense equal to 0.07%, 0.16%, 0.11%, 0.03% and 0.02% of average net assets, respectively.
See accompanying Notes to Financial Statements.
37
FPA CRESCENT FUND
FINANCIAL HIGHLIGHTS
Supra Institutional Class | | Period from
September 4,
through
December 31,
2020 | |
Per share operating performance: | |
Net asset value at beginning of period | | $ | 31.96 | | |
Income from investment operations: | |
Net investment income* | | | 0.01 | | |
Net realized and unrealized gain on investment securities | | | 4.81 | | |
Total from investment operations | | | 4.82 | | |
Less distributions: | |
Distributions from net realized capital gains | | | (0.80 | ) | |
Total distributions | | | (0.80 | ) | |
Redemption fees | | | — | ** | |
Net asset value at end of period | | $ | 35.98 | | |
Total investment return | | | 15.08 | % | |
Ratios/supplemental data: | |
Net assets, end of period (in $000's) | | $ | 1,179,180 | | |
Ratio of expenses to average net assets: | |
| Before reimbursement from Adviser | | | 1.14 | %†‡ | |
| After reimbursement from Adviser | | | 1.11 | %†‡ | |
Net investment income: | |
Before reimbursement from Adviser | | | 0.07 | %† | |
| After reimbursement from Adviser | | | 0.10 | %† | |
Portfolio turnover rate | | | 29 | % | |
* Per share amount is based on average shares outstanding.
** Rounds to less than $0.01 per share.
† Annualized.
‡ For the period ended December 31, 2020, the expense ratio includes short sale dividend expense equal to 0.13% of average net assets.
See accompanying Notes to Financial Statements.
38
FPA CRESCENT FUND
NOTES TO FINANCIAL STATEMENTS
December 31, 2020
NOTE 1 — Significant Accounting Policies
FPA Crescent Fund (the "Fund"), a series of the FPA Funds Trust, is registered under the Investment Company Act of 1940 as an open-end, diversified, management investment company. The Fund's investment objective is to seek to generate equity-like returns over the long-term, take less risk than the market and avoid permanent impairment of capital. The Fund qualifies as an investment company pursuant to Financial Accounting Standard Board (FASB) Accounting Standards Codification (ASC) No. 946, Financial Services — Investment Companies.
Effective September 4, 2020, the Supra Institutional class commenced operations and was funded by the Institutional class.
The following is a summary of significant accounting policies consistently followed by the Fund in the preparation of its financial statements.
A. Security Valuation
The Fund's investments are reported at fair value as defined by accounting principles generally accepted in the United States of America, ("U.S. GAAP"). The Fund generally determines its net asset value as of approximately 4:00 p.m. New York time each day the New York Stock Exchange is open. Further discussion of valuation methods, inputs and classifications can be found under Disclosure of Fair Value Measurements.
B. Securities Transactions and Related Investment Income
Securities transactions are accounted for on the date the securities are purchased or sold. Dividend income and distributions to shareholders are recorded on the ex-dividend date. Interest income and expenses are recorded on an accrual basis. Market discounts and premiums on fixed income securities are amortized over the expected life of the securities. Realized gains or losses are based on the specific identification method. The books and records of the Fund are maintained in U.S. dollars as follows: (1) the foreign currency fair value of investment securities, and other assets and liabilities stated in foreign currencies, are translated using the daily spot rate; and (2) purchases, sales, income and expenses are translated at the rate of exchange prevailing on the respective dates of such transactions. The resultant exchange gains and losses are included in net realized or net unrealized gain (loss) in the statement of operations.
C. Use of Estimates
The preparation of the financial statements in accordance with U.S. GAAP requires management to make estimates and assumptions that affect the amounts reported. Actual results could differ from those estimates. Actual results could differ from those estimates.
D. Recent Accounting Pronouncements
In August 2018, the Financial Accounting Standards Board (FASB) issued Accounting Standards Update (ASU) No. 2018-13, Fair Value Measurement (Topic 820) — Disclosure Framework — Changes to the Disclosure Requirements for Fair Value Measurement. The amendments eliminate certain disclosure requirements for fair value measurements for all entities, requires public entities to disclose certain new information and modifies some disclosure requirements. The new guidance is effective for all entities for fiscal years beginning after December 15, 2019 and for interim periods within those fiscal years. The Fund has adopted the standard for the current fiscal year and the changes are incorporated into the financial statements.
In March 2020, the FASB issued ASU 2020-04, Reference Rate Reform (Topic 848) Facilitation of the Effects of Reference Rate Reform on Financial Reporting, which provides optional expedients and exceptions for applying GAAP to contracts, hedging relationships, and other transaction to ease the potential burden in accounting for (or recognizing the effects of) reference rate reform on financial reporting if certain criteria
39
FPA CRESCENT FUND
NOTES TO FINANCIAL STATEMENTS (Continued)
are met. The guidance is effective from March 12, 2020 through December 31, 2022. As of December 31, 2020, the guidance did not have a material impact on the Financial Statements.
NOTE 2 — Risk Considerations
Investing in the Fund may involve certain risks including, but not limited to, those described below.
Market Risk: Because the values of the Fund's investments will fluctuate with market conditions, so will the value of your investment in the Fund. You could lose money on your investment in the Fund or the Fund could underperform other investments.
Common Stocks and Other Securities (Long): The prices of common stocks and other securities held by the Fund may decline in response to certain events taking place around the world, including; those directly involving companies whose securities are owned by the Fund; conditions affecting the general economy; overall market changes; local, regional or global political, social or economic instability; and currency, interest rate and commodity price fluctuations.
Common Stocks and Other Securities (Short): The prices of common stocks and other securities sold short rise between the date of the short sale and the date on which the Fund replaces the borrowed security. In addition, the Fund repays the person that lent it the security for any interest or dividends that may have accrued.
Interest Rate and Credit Risk: The values of, and the income generated by, most debt securities held by the Fund may be affected by changing interest rates and by changes in the effective maturities and credit rating of these securities. For example, the value of debt securities in the Fund's portfolio generally will decline when interest rates rise and increase when interest rates fall. In addition, falling interest rates may cause an issuer to redeem, call or refinance a security before its stated maturity, which may result in the Fund having to reinvest the proceeds in lower yielding securities. Debt securities are subject to credit risk, meaning that the issuer of the debt security may default or fail to make timely payments of principal or interest. The values of any of the Fund's investments may also decline in response to events affecting the issuer or its credit rating. The lower rated debt securities in which the Fund may invest are considered speculative and are generally subject to greater volatility and risk of loss than investment grade securities, particularly in deteriorating economic conditions.
Repurchase Agreements: Repurchase agreements permit the Fund to maintain liquidity and earn income over periods of time as short as overnight. Repurchase agreements held by the Fund are fully collateralized by U.S. Government securities, or securities issued by U.S. Government agencies, or securities that are within the three highest credit categories assigned by established rating agencies (Aaa, Aa, or A by Moody's or AAA, AA or A by Standard & Poor's) or, if not rated by Moody's or Standard & Poor's, are of equivalent investment quality as determined by the Adviser. Such collateral is in the possession of the Fund's custodian. The collateral is evaluated daily to ensure its fair value equals or exceeds the current fair value of the repurchase agreements including accrued interest. In the event of default on the obligation to repurchase, the Fund has the right to liquidate the collateral and apply the proceeds in satisfaction of the obligation.
The Fund may enter into repurchase agreements, under the terms of a Master Repurchase Agreement ("MRA"). The MRA permits the Fund, under certain circumstances including an event of default (such as bankruptcy or insolvency), to offset payables and/or receivables under the MRA with collateral held and/or posted to the counterparty and create one single net payment due to or from the Fund. However, bankruptcy or insolvency laws of a particular jurisdiction may impose restrictions on or prohibitions against such a right of offset in the event of a MRA counterparty's bankruptcy or insolvency. Pursuant to the terms of the MRA, the Fund receives securities as collateral with a fair value in excess of the repurchase price to be received by the Fund upon the maturity of the repurchase transaction. Upon a bankruptcy or insolvency of the MRA counterparty, the Fund recognizes a liability with respect to such excess collateral to reflect the Fund's obligation under bankruptcy law
40
FPA CRESCENT FUND
NOTES TO FINANCIAL STATEMENTS (Continued)
to return the excess to the counterparty. Repurchase agreements outstanding at the end of the period are listed in the Fund's Portfolio of Investments.
Many countries have experienced outbreaks of infectious illnesses in recent decades, including swine flu, avian influenza, SARS and, more recently, COVID-19. The global outbreak of COVID-19 in early 2020 has resulted in various disruptions, including travel and border restrictions, quarantines, supply chain disruptions, lower consumer demand and general market uncertainty. The effects of COVID-19 have and may continue to adversely affect the global economy, financial markets and the economies of certain nations and individual issuers, any of which may negatively impact the Fund and its holdings. Similar consequences could arise as a result of the spread of other infectious diseases.
NOTE 3 — Purchases and Sales of Investment Securities
Cost of purchases of investment securities (excluding short-term investments) aggregated $2,639,578,786 for the year ended December 31, 2020. The proceeds and cost of securities sold resulting in net realized gains of $813,199,578 aggregated $5,807,827,278 and $4,994,627,700, respectively, for the year ended December 31, 2020.
NOTE 4 — Federal Income Tax
No provision for federal income tax is required because the Fund has elected to be taxed as a "regulated investment company" under the Internal Revenue Code (the "Code") and intends to maintain this qualification and to distribute each year to its shareholders, in accordance with the minimum distribution requirements of the Code, its taxable net investment income and taxable net realized gains on investments.
Distributions paid to shareholders are based on net investment income and net realized gains determined on a tax reporting basis, which may differ from financial reporting.
For federal income tax purposes, the Fund had the following components of distributable earnings at December 31, 2020:
Unrealized appreciation | | $ | 2,477,139,005 | | |
Undistributed capital gains | | | 190,606,839 | | |
Undistributed ordinary income | | | 84,446,750 | | |
The tax status of distributions paid during the fiscal years ended December 31, 2020 and 2019 were as follows:
| | | 2020 | | 2019 | |
Dividends from ordinary income | | $ | 110,604,770 | | | $ | 328,363,999 | | |
Distributions from long-term capital gains | | | 412,449,582 | | | | 326,077,643 | | |
The Fund utilizes the provisions of federal income tax laws that provide for the carryforward of capital losses for prior years, offsetting such losses against any future realized capital gains. The Fund did not generate or utilize capital losses during the current tax year.
The cost of investment securities held at December 31, 2020 was $7,617,722,175 for federal income tax purposes. Gross unrealized appreciation and depreciation for all investment at December 31, 2020, for federal income tax purposes was $2,614,714,910 and $137,575,905, respectively resulting in net unrealized appreciation of $2,477,139,005. As of and during the year ended December 31, 2020, the Fund did not have any liability for unrecognized tax benefits. The Fund recognizes interest and penalties, if any, related to unrecognized tax benefits
41
FPA CRESCENT FUND
NOTES TO FINANCIAL STATEMENTS (Continued)
as income tax expense in the Statement of Operations. During the year, the Fund did not incur any interest or penalties. The statute of limitations remains open for the last 3 years, once a return is filed. No examinations are in progress at this time.
During the year ended December 31, 2020, the Fund reclassified ($407,549,664) to Paid in Capital from Distributable Earnings to align financial reporting to tax reporting. These permanent differences are primarily due to distributions made in connection with redemption of fund shares, prior period adjustments and redemptions in-kind adjustments. Net assets were not affected by these reclassifications.
NOTE 5 — Advisory Fees and Other Affiliated Transactions
Pursuant to an Investment Advisory Agreement (the "Agreement"), advisory fees were paid by the Fund to First Pacific Advisors, LP (the "Adviser").
The total management fee rate paid by the Fund, as a percentage of average daily net assets, for the previous fiscal year was 1.00%. In addition, as of April 1, 2020, the Adviser has contractually agreed to reimburse expenses in excess of 1.05% of the average daily net assets of the Fund, excluding short sale dividend expenses and interest expenses on cash deposits relating to short sales, brokerage fees and commissions, interest, taxes, fees and expenses of other funds in which the Fund invests, and extraordinary expenses, including litigation expenses not incurred in the Fund's ordinary course of business, through April 30, 2021.
Effective September 4, 2020, the Board approved the reduction in the annual advisory fee rate paid by the Fund to 0.93%. The current management fee rate paid by Institutional Class shares is 1.00% and Supra Institutional Class shares is 0.94%, which includes both the advisory fee of 0.93% and a class-specific administrative service fee of 0.07% for Institutional Class and 0.01% for Supra Institutional Class. In addition, effective September 4, 2020, the Adviser has contractually agreed to reimburse operating expenses in excess of 0.05% of the average daily net assets of the Fund, excluding management fees, administrative service fees, short sale dividend expenses and interest expenses on cash deposits relating to short sales, brokerage fees and commissions, interest, taxes, fees and expenses of other funds in which the Fund invests, and extraordinary expenses, including litigation expenses not incurred in the Fund's ordinary course of business, through September 4, 2021. This agreement may only be terminated earlier by the Fund's Board of Trustees (the "Board") or upon termination of the Advisory Agreement. The reductions and reimbursements are in amounts that maintain total operating expenses at or below certain limits. The limit is expressed as a percentage of average daily net assets attributable to the Fund on an annualized basis during the reporting period. The expenses borne by the Adviser are subject to reimbursement by the Fund through the fiscal year end, provided no reimbursement will be made it would result in the Fund exceeding the total operating expense limits. Any amounts outstanding at the end of the period are shown as an expense reimbursement from Adviser or expense reimbursement to Adviser on the Statement of Assets and Liabilities.
For the year ended December 31, 2020, the Fund paid aggregate fees and expenses of $361,488 to all Trustees who are not affiliated persons of the Adviser. Certain officers of the Fund are also officers of the Adviser.
NOTE 6 — Securities Sold Short
The Fund maintains cash deposits and segregates marketable securities in amounts equal to the current fair value of the securities sold short or the fair value of the securities at the time they were sold short, whichever is greater. The Fund considers cash deposits held in connection with securities sold short to be restricted cash. The restriction will lapse when the related short positions are terminated. Possible losses from short sales may be unlimited, whereas losses from purchases cannot exceed the total amount invested. The dividends on securities sold short are reflected as short sale dividend expense.
42
FPA CRESCENT FUND
NOTES TO FINANCIAL STATEMENTS (Continued)
NOTE 7 — Redemption Fees
A redemption fee of 2% applies to redemptions within 90 days of purchase. For the year ended December 31, 2020, the Fund collected $444,210 in redemption fees. The impact of these fees is less than $0.01 per share.
NOTE 8 — Disclosure of Fair Value Measurements
The Fund uses the following methods and inputs to establish the fair value of its assets and liabilities. Use of particular methods and inputs may vary over time based on availability and relevance as market and economic conditions evolve.
Equity securities are generally valued each day at the official closing price of, or the last reported sale price on, the exchange or market on which such securities principally are traded, as of the close of business on that day. If there have been no sales that day, equity securities are generally valued at the last available bid price. Securities that are unlisted and fixed-income and convertible securities listed on a national securities exchange for which the over-the-counter ("OTC") market more accurately reflects the securities' value in the judgment of the Fund's officers, are valued at the most recent bid price. Events occurring after the close of trading on non-U.S. exchanges may result in adjustments to the valuation of foreign securities to reflect their fair value as of the close of regular trading on the NYSE. The Fund may utilize an independent fair valuation service in adjusting the valuations of foreign securities. However, most fixed income securities are generally valued at prices obtained from pricing vendors and brokers. Vendors value such securities based on one or more of the following inputs: transactions, bids, offers quotations from dealers and trading systems, spreads and other relationships observed in the markets among comparable securities, benchmarks, underlying equity of the issuer, and proprietary pricing models such as cash flows, financial or collateral performance and other reference data (includes prepayments, defaults, collateral, credit enhancements, and interest rate volatility). Currency forwards are valued at the closing currency exchange rate which is not materially different from the forward rate. Short-term corporate notes with maturities of 60 days or less at the time of purchase are valued at amortized cost.
Securities for which representative market quotations are not readily available or are considered unreliable by the Adviser are valued as determined in good faith under procedures adopted by the authority of the Fund's Board of Trustees. Various inputs may be reviewed in order to make a good faith determination of a security's value. These inputs include, but are not limited to, the type and cost of the security; contractual or legal restrictions on resale of the security; relevant financial or business developments of the issuer; actively traded similar or related securities; conversion or exchange rights on the security; related corporate actions; significant events occurring after the close of trading in the security; and changes in overall market conditions. Investments in limited partnerships are valued, as a practical expedient, utilizing the net asset valuations provided by the underlying limited partnerships in a manner consistent with U.S. GAAP for investment companies. The Fund applies the practical expedient to its investments in limited partnerships on an investment-by-investment basis, and consistently with the Fund's entire position in a particular investment, unless it is probable that the Fund will sell a portion of an investment at an amount different from the net asset valuation. Investments in limited partnerships are included in Level 3 of the fair value hierarchy based on the limited rights of withdrawal by the Fund as specified in the respective agreements. Fair valuations and valuations of investments that are not actively trading involve judgment and may differ materially from valuations of investments that would have been used had greater market activity occurred.
Investments in open-end investment companies are valued at their net asset value each business day and are categorized as Level 1. The investments in limited partnerships represent investments in private funds which are valued at their net asset value as a practical expedient. The net asset value of the limited partnerships has been estimated primarily based upon the pro-rata ownership of the fair value of the limited partnerships as reported by
43
FPA CRESCENT FUND
NOTES TO FINANCIAL STATEMENTS (Continued)
the Management of the limited partnerships. Investments in private funds can never be redeemed. Instead, the nature of the investments in this category is that distributions are received through the liquidation of the underlying assets of the limited partnerships.
The Fund classifies its assets based on three valuation methodologies. Level 1 values are based on quoted market prices in active markets for identical assets. Level 2 values are based on significant observable market inputs, such as quoted prices for similar assets and quoted prices in inactive markets or other market observable inputs as noted above including spreads, cash flows, financial performance, prepayments, defaults, collateral, credit enhancements, and interest rate volatility. Level 3 values are based on significant unobservable inputs that reflect the Fund's determination of assumptions that market participants might reasonably use in valuing the assets. The valuation levels are not necessarily an indication of the risk associated with investing in those securities. The following table presents the valuation levels of the Fund's investments as of December 31, 2020: (see Portfolio of Investments for industry categories):
Investments | | Level 1 | | Level 2 | | Level 3 | | Total | |
Common Stocks | |
Internet Media | | $ | 931,629,086 | | | $ | 320,465,584 | | | | — | | | $ | 1,252,094,670 | | |
Semiconductor Devices | | | 661,882,319 | | | | — | | | | — | | | | 661,882,319 | | |
Cable & Satellite | | | 619,433,972 | | | | — | | | | — | | | | 619,433,972 | | |
Cement & Aggregates | | | — | | | | 388,479,768 | | | | — | | | | 388,479,768 | | |
Industrial Distribution & Rental | | | 184,484,843 | | | | 179,416,283 | | | | — | | | | 363,901,126 | | |
Banks | | | 343,555,882 | | | | — | | | | — | | | | 343,555,882 | | |
P&C Insurance | | | 293,526,119 | | | | — | | | | — | | | | 293,526,119 | | |
Institutional Brokerage | | | 280,809,271 | | | | — | | | | — | | | | 280,809,271 | | |
Diversified Banks | | | 275,632,649 | | | | — | | | | — | | | | 275,632,649 | | |
Electrical Components | | | 274,034,923 | | | | — | | | | — | | | | 274,034,923 | | |
Investment Companies | | | — | | | | 271,942,296 | | | | — | | | | 271,942,296 | | |
Base Metals | | | — | | | | 214,640,167 | | | | — | | | | 214,640,167 | | |
Insurance Brokers | | | 207,705,241 | | | | — | | | | — | | | | 207,705,241 | | |
Internet Based Services | | | 194,356,035 | | | | — | | | | — | | | | 194,356,035 | | |
Railroad Rolling Stock | | | 158,302,686 | | | | — | | | | — | | | | 158,302,686 | | |
Computer Hardware & Storage | | | 154,116,631 | | | | — | | | | — | | | | 154,116,631 | | |
Application Software | | | — | | | | 122,311,541 | | | $ | 19,049,750 | | | | 141,361,291 | | |
Midstream — Oil & Gas | | | 121,740,632 | | | | — | | | | — | | | | 121,740,632 | | |
Hotels, Restaurants & Leisure | | | 121,606,231 | | | | — | | | | — | | | | 121,606,231 | | |
Telecom Carriers | | | — | | | | 118,160,488 | | | | — | | | | 118,160,488 | | |
E-Commerce Discretionary | | | 116,557,468 | | | | — | | | | — | | | | 116,557,468 | | |
Apparel, Footwear & Accessory
Design | | | — | | | | 113,900,255 | | | | — | | | | 113,900,255 | | |
Commercial & Residential
Building Equipment & Systems | | | — | | | | 109,397,064 | | | | — | | | | 109,397,064 | | |
44
FPA CRESCENT FUND
NOTES TO FINANCIAL STATEMENTS (Continued)
Investments | | Level 1 | | Level 2 | | Level 3 | | Total | |
Specialty Chemicals | | $ | 104,568,972 | | | | — | | | | — | | | $ | 104,568,972 | | |
Aircraft & Parts | | | — | | | $ | 103,897,155 | | | | — | | | | 103,897,155 | | |
Wealth Management | | | 100,896,424 | | | | — | | | | — | | | | 100,896,424 | | |
Infrastructure Software | | | 85,391,676 | | | | — | | | | — | | | | 85,391,676 | | |
Medical Equipment | | | — | | | | 75,998,310 | | | | — | | | | 75,998,310 | | |
Real Estate Owners & Developers | | | — | | | | 55,924,656 | | | | — | | | | 55,924,656 | | |
Integrated Utilities | | | 44,826,233 | | | | — | | | | — | | | | 44,826,233 | | |
Oil & Gas Services & Equipment | | | 32,102,899 | | | | — | | | | — | | | | 32,102,899 | | |
Marine Shipping | | | — | | | | — | | | $ | 31,923,993 | | | | 31,923,993 | | |
Other Common Stocks | | | 90,914,317 | | | | — | | | | — | | | | 90,914,317 | | |
Closed End Fund | | | — | | | | — | | | | 67,513,975 | | | | 67,513,975 | | |
Limited Partnerships | | | — | | | | — | | | | 139,460,218 | | | | 139,460,218 | | |
Preferred Stocks | |
Automobiles | | | — | | | | 106,314,078 | | | | — | | | | 106,314,078 | | |
Engineering Services | | | — | | | | — | | | | 7,906,722 | | | | 7,906,722 | | |
Warrant | |
Energy | | | 655,092 | | | | — | | | | — | | | | 655,092 | | |
Asset-Backed Security | |
Marine Shipping | | | — | | | | — | | | | 4,410,116 | | | | 4,410,116 | | |
Corporate Bonds & Notes | | | — | | | | 211,880,768 | | | | — | | | | 211,880,768 | | |
Corporate Bank Debt | | | — | | | | 87,424,787 | | | | 22,136,102 | | | | 109,560,889 | | |
Municipals | | | — | | | | 119,030,150 | | | | — | | | | 119,030,150 | | |
U.S. Treasuries | | | — | | | | 606,759,806 | | | | — | | | | 606,759,806 | | |
Short-Term Investments | | | — | | | | 1,206,703,812 | | | | — | | | | 1,206,703,812 | | |
| | $ | 5,398,729,601 | | | $ | 4,412,646,968 | | | $ | 292,400,876 | | | $ | 10,103,777,445 | | |
Purchased Options (interest rate risk) | | | — | | | | — | | | $ | 23,846,085 | | | $ | 23,846,085 | | |
Written Options (interest rate risk) | | | — | | | | — | | | | (6,353,310 | ) | | | (6,353,310 | ) | |
Credit Default Swaps (credit risk) | | | — | | | | — | | | | (59,388 | ) | | | (59,388 | ) | |
| | | | — | | | | — | | | $ | 17,433,387 | | | $ | 17,433,387 | | |
Common Stock Sold Short | | $ | (245,584,519 | ) | | $ | (88,971,475 | ) | | | — | | | $ | (334,555,994 | ) | |
Corporate Bonds & Notes Sold Short | | | — | | | | (47,913,574 | ) | | | — | | | | (47,913,574 | ) | |
| | $ | (245,584,519 | ) | | $ | (136,885,049 | ) | | | — | | | $ | (382,469,568 | ) | |
45
FPA CRESCENT FUND
NOTES TO FINANCIAL STATEMENTS (Continued)
The following table summarizes the Fund's Level 3 investment securities and related transactions during the year ended December 31, 2020:
| Investments | | Beginning
Value at
December 31,
2019 | | Net Realized and
Unrealized Gains
(Losses)* | | Purchases | | (Sales) | | Gross
Transfers
In/(Out) | | Ending
Value at
December 31,
2020 | | Net Change
in Unrealized
Appreciation
(Depreciation)
related to
Investments held
at December 31,
2020 | |
Common Stocks | | $ | 41,511,807 | | | $ | (9,587,814 | ) | | $ | 19,049,750 | | | | — | | | | — | | | $ | 50,973,743 | | | $ | (9,587,814 | ) | |
Closed End Fund | | | 96,027,274 | | | | 11,105,680 | | | | — | | | $ | (39,618,979 | ) | | | — | | | | 67,513,975 | | | | (28,513,299 | ) | |
Limited Partnerships | | | 182,177,764 | | | | (42,247,575 | ) | | | 31,575,831 | | | | (32,045,802 | ) | | | — | | | | 139,460,218 | | | | (42,247,576 | ) | |
Preferred Stock | | | — | | | | 7,906,722 | | | | — | | | | — | | | | — | | | | 7,906,722 | | | | 7,906,722 | | |
Residential Mortgage-Backed
Securities Non-Agency
Collateralized Mortgage
Obligation | | | 19,185 | | | | (18,244 | ) | | | — | | | | (941 | ) | | | — | | | | — | | | | (1,804 | ) | |
Asset-Backed Securities
Marine Shipping | | | 6,847,315 | | | | (1,654,400 | ) | | | — | | | | (782,799 | ) | | | — | | | | 4,410,116 | | | | (1,654,400 | ) | |
Corporate Bank Debt | | | 33,952,030 | | | | (12,773,803 | ) | | | 40,840,746 | | | | (39,882,871 | ) | | | — | | | | 22,136,102 | | | | (12,849,737 | ) | |
Purchased Options (interest
rate risk) | | | 109,616,351 | | | | (986,948 | ) | | | 27,288,237 | | | | (112,071,555 | ) | | | — | | | | 23,846,085 | | | | (8,091 | ) | |
Currency Options (currency risk) | | | 19,335,104 | | | | 6,578,010 | | | | — | | | | (25,913,114 | ) | | | — | | | | — | | | | (4,710,266 | ) | |
Written Options (interest rate risk) | | | (6,423,266 | ) | | | (4,664,180 | ) | | | 11,772,363 | | | | (7,038,227 | ) | | | — | | | | (6,353,310 | ) | | | 3,544,934 | | |
Equity Options (equity risk) | | | (4,321,815 | ) | | | 6,505,415 | | | | 4,917,296 | | | | (7,100,896 | ) | | | — | | | | — | | | | 5,233,295 | | |
Credit Default Swaps (credit risk) | | | 692,055 | | | | (751,443 | ) | | | — | | | | — | | | | — | | | | (59,388 | ) | | | (312,900 | ) | |
| | $ | 479,433,804 | | | $ | (40,588,580 | ) | | $ | 135,444,223 | | | $ | (264,455,184 | ) | | | — | | | $ | 309,834,263 | | | $ | (83,200,936 | ) | |
Level 3 Valuation Process: Investments classified within Level 3 of the fair value hierarchy are valued by the Adviser in good faith under procedures adopted by authority of the Fund's Board of Trustees. The Adviser employs various methods to determine fair valuations including regular review of key inputs and assumptions, and review of related market activity, if any. However, there are generally no observable trade activities in these securities. The Adviser reports to the Board of Trustees at their regularly scheduled quarterly meetings, or more often if warranted. The report includes a summary of the results of the process, the key inputs and assumptions noted, and any changes to the inputs and assumptions used. When appropriate, the Adviser will recommend changes to the procedures and process employed. The value determined for an investment using the fair value procedures may differ significantly from the value realized upon the sale of such investment. Transfers of investments between different levels of the fair value hierarchy are recorded at fair value as of the end of the reporting period. There were no transfers into or out of Level 3 during the year ended December 31, 2020.
46
FPA CRESCENT FUND
NOTES TO FINANCIAL STATEMENTS (Continued)
The following table summarizes the quantitative inputs and assumptions used for items categorized as items categorized as Level 3 of the fair value hierarchy as of December 31, 2020:
| Financial Assets | | Fair Value at
December 31, 2020 | | Valuation Technique(s) | | Unobservable
Inputs | | Price/Range | | Weighted
Average Price/
Discount (%) | |
Asset-Backed Securities — Marine Most Recent
Shipping | | $ | 4,410,116 | | | Capitlization (Funding) (a) | | Cost | | $72.72 | | $72.72 | |
| | | | | | | | | | Market Discount | | 12% | | 12% | |
Corporate Bank Debt | | $ | 22,136,102 | | | Pricing Model (b) | | Quotes/Prices | | $77.00-$90.00 | | $74.55 | |
Preferred Stock | | $ | 7,906,722 | | | Pricing Model (c) | | Capital Structure | | $35.00 | | $35.00 | |
Purchased Options (interest rate risk) | | $ | 23,846,085 | | | Third-Party Broker Quote (d) | | Quotes/Prices | | $0.00-$0.03 | | $0.01 | |
Written Options (interest rate risk) | | $ | (6,353,310 | ) | | Third-Party Broker Quote (d) | | Quotes/Prices | | $0.02 | | $0.02 | |
Credit Default Swaps (credit risk) | | $ | (59,388 | ) | | Third-Party Broker Quote (d) | | Quotes/Prices | | ($0.22)-$0.20 | | ($0.32) | |
Common Stocks — Long | | $ | 31,923,993 | | | NAV adjusted to Fair Value (e) | | N/A | | $27.85 | | $27.85 | |
| | | 19,049,750 | | | Restricted Security (g) | | Quotes/Prices | | $575.00 | | $575.00 | |
Closed-End Funds | | $ | 67,513,975 | | | Restricted Security (f) | | Quotes/Prices | | $14.20 | | $14.20 | |
Limited Partnerships | | $ | 75,126,260 | | | NAV adjusted to Fair Value (e) | | N/A | | $61.01-$87.80 | | $64.38 | |
| | | 37,883,328 | | | Discounted NAV (i) | | N/A | | 15.00% | | 20.73% | |
| | | 17,906,498 | | | Discounted NAV (i) | | Market Discount | | 28.94% | | | |
| | | 8,544,132 | | | Discounted NAV (i) | | Market Discount | | 28.94% | | | |
(a) The significant unobservable inputs used in the fair value measurement of the Fund's term loan are based on its most recent funding, discounted for potential exit strategies. If the financial condition of the underlying assets were to deteriorate, or if the market comparables were to fall, the value of this investment could be lower.
(b) The Pricing Model technique for Level 3 securities involves recently quoted funding prices of the security.
(c) The Pricing Model technique for Level 3 securities involves valuation of the security's position within the capital structure of the firm.
(d) The Third Party Broker Quote technique involves obtaining an independent third-party broker quote for the security.
(e) The NAV provided by the administrator of the LLC is reported at depreciated cost. To adjust to fair value, the Fund obtains independent appraisals of the underlying fixed assets and adjusts the NAV based on the difference between the two values.
(f) The fair value of the investment is based on the most recently available last executed trade.
(g) The fair value of the investment is based on the initial purchase price. If the financial condition of the underlying assets were to deteriorate, or if the market comparables were to fall, the valuve of the investment could be lower.
(h) No adjustments were made to the NAV provided by the administrator of the Limited Partnerships. Adjustments to the NAV would be considered if the practical expedient NAV was not as of Fund's measurement date; it was probable that the Limited Partnerships would be sold at a value materially different than the reported expedient NAV; or it was determined in accordance with the Fund's valuation procedures that the Limited Partnerships are not being reported at fair value.
(i) The NAV provided by the general partner has been discounted for the possible impact from various long-term exit strategies under consideration by the general partner.
Options Contracts: An option contract is a commitment that gives the purchaser of the contract the right, but not the obligation, to buy or sell an underlying asset at a specific price on or before a specified future date. On the other hand, the writer of an option contract is obligated, upon the exercise of the option, to buy or sell an underlying asset at a specific price on or before a specified future date. A swaption is an option contract granting the owner the right to enter into an underlying swap. Inflation-capped options are options on U.S. inflation rates at a stated strike price. The seller of an inflation-capped option receives an upfront premium and in return the
47
FPA CRESCENT FUND
NOTES TO FINANCIAL STATEMENTS (Continued)
buyer receives the right to receive a payment at the expiration of the option if the cumulative annualized inflation rate over the life of the option is above (for caps) or below (for floors) the stated strike price. The purpose of inflation-capped options is to protect the buyer from inflation erosion above a certain rate on a given notional exposure. A floor can be used to give downside protection to investments in inflation-linked products below a certain rate on a given notional exposure. Writing put options or purchasing call options tends to increase a Fund's exposure to the underlying instrument. Writing call options or purchasing put options tends to decrease a Fund's exposure to the underlying instrument. When a Fund writes or purchases a call, put, or inflation-capped option, an amount equal to the premium received or paid by the Fund is recorded as a liability or an investment, respectively, and subsequently adjusted to the current market value, based on the quoted daily settlement price of the option written or purchased. Certain options may be written or purchased with premiums to be determined on a future date. The premiums for these options are based upon implied volatility parameters at specified terms. Premiums received or paid from writing or purchasing options, which expire unexercised, are treated by a Fund on the expiration date as realized gains or losses. The difference between the premium and the amount paid or received on a closing purchase or sale transaction, including brokerage commissions, is also treated as a realized gain or loss. If an option is exercised, the premium paid or realized is added to the cost of the purchase or proceeds from the sale in determining whether the Fund has realized a gain or loss on investment transactions. A Fund, as a writer of an option, may have no control over whether the underlying instrument may be sold (call) or purchased (put) and as a result bears the market risk of an unfavorable change in the price of the underlying written option. In addition, an illiquid market may make it difficult for a Fund to close out an option contract. The maximum risk of loss associated with writing put options is limited to the exercised fair value of the option contract. The maximum risk of loss associated with writing call options is potentially unlimited. Listed option contracts present minimal counterparty credit risk since they are exchange traded and the exchange's clearinghouse, as counterparty to all exchange-traded options, guarantees the options against default. A Fund's maximum risk of loss from counterparty credit risk related to OTC option contracts is limited to the premiums paid.
Forward foreign currency contracts: Forward foreign currency contracts are agreements to exchange one currency for another at a future date and at a specified price. The Funds' transactions in forward foreign currency contracts are limited to transaction and portfolio hedging. The contractual amounts of forward foreign currency contracts do not necessarily represent the amounts potentially subject to risk. The measurement of the risks associated with these instruments is meaningful only when all related and offsetting transactions are considered and could exceed the net unrealized value shown in the tables below. Risks arise from the possible inability of counterparties to meet the terms of their contracts and from movements in currency values. Forward foreign currency contracts are valued daily at the foreign exchange rates as of the close of the New York Stock Exchange. Unrealized appreciation or depreciation on the contracts as measured by the difference between the forward foreign exchange rates at the dates of entry into the contracts and the foreign exchange rates at the end of the period is included in the Statement of Assets and Liabilities under the caption "Forward Foreign Currency Contracts." Realized gains and losses and the net change in unrealized appreciation (depreciation) on forward foreign currency contracts for the year are included in the Statement of Operations under the caption "Forward Foreign Currency Contracts."
Credit Default Swaps: The Fund enters into credit default swap contracts for investment purposes and to manage its credit risk. Credit default swap agreements involve one party making a stream of payments (referred to as the buyer of protection) to another party (the seller of protection) in exchange for the right to receive a specified return in the event of a default or other credit event for the referenced entity, obligation or index. The
48
FPA CRESCENT FUND
NOTES TO FINANCIAL STATEMENTS (Continued)
Fund may purchase or sell protection. A seller of protection generally receives an upfront payment or periodic payments throughout the term of the swap provided there is no credit event. Such periodic payments received are accrued daily and accounted for as realized gains. If a credit event occurs, as defined under the terms of the swap agreement, the Fund will either (i) pay to the buyer of protection an amount equal to the notional amount of the swap and take delivery of the referenced obligation or underlying securities comprising the referenced index or (ii) pay a net settlement amount in the form of cash or securities equal to the notional amount of the swap less the recovery value of the referenced obligation or underlying securities comprising the referenced index. The buyer of protection generally pays an upfront premium or periodic payments throughout the term of the swap provided there is no credit event. Such periodic payments paid are accrued daily and accounted for as realized losses.
Entering into credit default swaps involves, to varying degrees, elements of credit, market and documentation risk in excess of the related amounts recognized in the Consolidated Statement of Assets and Liabilities. Such risks involve the possibility that there will be no liquid market for these agreements, that the counterparty to the agreements may default on its obligations to perform or disagree as to the meaning of the contractual terms in the agreements, and that there will be unfavorable changes in net interest rates.
| | | Asset Derivatives | | Liability Derivatives | |
Derivative Type | | Statement of Assets
and Liabilities
Location | | Fair Value | | Statement of Assets
and Liabilities
Location | | Fair Value | |
Credit contracts | | | | | — | | | Swaps, at fair value | | $ | (59,388 | ) | |
Interest rate
contracts | | Purchased options,
at value | | $ | 23,846,085 | | | Written options,
at value | | | (6,353,310 | ) | |
Total | | | | $ | 23,846,085 | | | | | $ | (6,412,698 | ) | |
Derivative Type | | Location of Gain or
(Loss) on Derivatives
Within Statement of
Operations | | Realized Gain or
(Loss) on
Derivatives | | Change in Unrealized
Appreciation or (Depreciation) | |
Foreign currency
contracts | | Purchased options | | $ | 11,288,277 | | | $ | (4,710,266 | ) | |
Equity
contracts | | Written options,
Purchased options | | | 5,998,485 | | | | 2,430,365 | | |
Credit contracts | | Swap contracts | | | (1,937,868 | ) | | | (312,900 | ) | |
Interest rate
contracts | | Written options,
Purchased options | | | (9,187,971 | ) | | | 1,629,507 | | |
Total | | | | $ | 6,160,923 | | | $ | (963,294 | ) | |
49
FPA CRESCENT FUND
NOTES TO FINANCIAL STATEMENTS (Continued)
The following table represents the average monthly volume of the Fund's derivative transactions during the year ended December 31, 2020:
Purchased Options | |
Average notional amount | |
Calls | | $ | 58,317,527 | | |
Puts | | | 72,118,846,433 | | |
Written Options | |
Average notional amount | |
Calls | | $ | (9,403 | ) | |
Puts | | | (396,025,774 | ) | |
Swaps | |
Average notional amount | | $ | 59,693,808 | | |
NOTE 9 — Capital Stock
| | | Year Ended
12/31/2020 | | Year Ended
12/31/2019 | |
| | | Shares | | Amount | | Shares | | Amount | |
Capital Stock sold | |
Institutional Class | | | 32,818,768 | | | $ | 1,033,674,881 | | | | 47,013,051 | | | $ | 1,538,225,165 | | |
Supra Institutional Class(a) | | | 39,911,145 | | | | 1,374,719,098 | | | | N/A | | | | N/A | | |
Issued to shareholders upon
reinvestment of dividends and
distributions | |
Institutional Class | | | 14,134,128 | | | | 450,582,121 | | | | 16,952,654 | | | | 565,800,499 | | |
Supra Institutional Class(a) | | | 233,585 | | | | 8,280,829 | | | | N/A | | | | N/A | | |
Capital Stock repurchased | |
Institutional Class | | | (213,605,986 | ) | | | (6,622,737,320 | ) | | | (113,959,735 | ) | | | (3,745,562,801 | ) | |
Supra Institutional Class(a) | | | (7,371,663 | ) | | | (228,190,056 | ) | | | N/A | | | | N/A | | |
Change in Capital Stock outstanding | | | (133,880,023 | ) | | $ | (3,983,670,447 | ) | | | (49,994,030 | ) | | $ | (1,641,537,137 | ) | |
(a) Period from September 4, 2020, date operations commenced, through December 31, 2020.
NOTE 10 — Collateral Requirements
For derivatives traded under an ISDA Master Agreement, the collateral requirements are typically calculated by netting the mark to market amount for each transaction under such agreement and comparing that amount to the value of any collateral currently pledged by a Fund and the counterparty. Cash collateral that has been pledged to cover obligations of a Fund and cash collateral received from the counterparty, if any, is reported separately on the Statement of Assets and Liabilities as cash pledged as collateral and cash received as collateral, respectively. Non-cash collateral pledged by a Fund, if any, is noted in the Portfolio of Investments. Generally, the amount of
50
FPA CRESCENT FUND
NOTES TO FINANCIAL STATEMENTS (Continued)
collateral due from or to a party is delivered to/pledged by the Fund on the next business day. Typically, the Fund and counterparties are not permitted to sell, repledge or use the collateral they receive. To the extent amounts due to the Fund from its counterparties are not fully collateralized, contractually or otherwise, the Fund bears the risk of loss from counterparty non-performance. The Fund attempts to mitigate counterparty risk by entering into agreements only with counterparties that it believes have the financial resources to honor their obligations and by monitoring the financial stability of those counterparties.
For financial reporting purposes, the Fund does not offset derivative assets and derivative liabilities that are subject to netting arrangements in the Statement of Assets and Liabilities.
FASB Accounting Standards Update No. 2011-11, Disclosures about Offsetting Assets and Liabilities, requires disclosures to make financial statements that are prepared under U.S. GAAP more comparable to those prepared under International Financial Reporting Standards. Under this guidance the Fund discloses both gross and net information about instruments and transactions eligible for offset such as instruments and transactions subject to an agreement similar to a master netting arrangement. The following table presents the Fund's OTC derivative assets, liabilities and master repurchase agreements by counterparty net of amounts available for the offset under an ISDA Master agreement or similar agreements and net of the related collateral received or pledged by the Fund as of December 31, 2020:
Counterparty | | Product | | Gross Assets
(Liabilities) in
the Statement
of Assets and
Liabilities | | Cash
Collateral
(Received)
Pledged | | Financial
Instruments
(Received)
Pledged | | Assets
(Liabilities)
Available for
Offset | | Net Amount
of Asset and
(Liabilities)* | |
State Street Bank
and Trust
Company: | |
| | | Repurchase Agreement | | $ | 796,000 | | | | — | | | $ | (796,000 | )** | | | — | | | | — | | |
Barclays Bank PLC: | |
| | | Purchased Options | | $ | 3,964,080 | | | | — | | | $ | 1,158,657 | | | | — | | | $ | 5,122,737 | | |
| | | Swap Agreements | | $ | 1,898 | | | | — | | | | — | | | | — | | | $ | 1,898 | | |
Goldman Sachs
International: | |
| | | Purchased Options | | $ | 9,756,770 | | | $ | (9,688,530 | )*** | | | — | | | | (68,240 | ) | | | — | | |
| | | Swap Agreements | | $ | (68,240 | ) | | | — | | | | — | | | | 68,240 | | | | — | | |
Morgan Stanley: | |
| | | Purchased Options | | $ | 10,125,235 | | | $ | (3,559,000 | ) | | | — | | | $ | (6,353,310 | ) | | $ | 212,925 | | |
| | | Written Options | | $ | (6,353,310 | ) | | | — | | | | — | | | $ | 6,353,310 | | | | — | | |
| | | Swap Agreements | | $ | 6,954 | | | | — | | | | — | | | | — | | | $ | 6,954 | | |
* Represents the net amount receivable (payable) from the counterparty in the event of default.
** Collateral with a value of $811,940 has been received in connection with a master repurchase agreement. Excess of collateral received from the individual master repurchase agreement is not shown for financial reporting purposes.
*** Collateral with a value of $9,765,124 has been received in connection with a master repurchase agreement. Excess of collateral received from the individual master repurchase agreement is not shown for financial reporting purposes.
51
FPA CRESCENT FUND
NOTES TO FINANCIAL STATEMENTS (Continued)
NOTE 11 — Commitments
As of December 31, 2020 the Fund was liable for the following unfunded commitments:
| Asset Class | | Unfunded
Commitment | |
Corporate Bank Debt | | $ | 77,741,786 | | |
NOTE 12 — Affiliated Investments
A company is considered an affiliate of a fund under the Investment Company Act of 1940 if the Fund's holdings in that company represent 5% or more of the outstanding voting shares of that company. Further details on such holdings and related transactions during the year ended December 31, 2020, appear below:
| Investments | | Shares
Held as of
December 31,
2019 | | Beginning
Value as of
December 31,
2019 | | Purchases
at Cost | | Proceeds
from Sales | | Net
Realized
Gain/(Loss)
on sales of
Affiliated
Investments | | Change in
Unrealized
Appreciation/
Depreciation | | Transfers In
(Out) | | Ending
Value as of
December 31,
2020 | | Shares
as of
December 31,
2020 | | Dividend
Income
from
Affiliated
Investments | |
Common
Stocks — 0.64% | |
Containers &
Packaging — 0.00% | |
O-I Glass, Inc.(a) | | | 9,007,760 | | | $ | 107,462,577 | | | | — | | | $ | (57,563,749 | ) | | $ | (148,782,471 | ) | | $ | 98,883,643 | | | | — | | | | — | | | | — | | | $ | 450,388 | | |
Oil & Gas
Services &
Equipment — 0.32% | |
McDermott
International
Ltd.(a) | | | — | | | | — | | | $ | 62,309,394 | | | | (12,835,818 | ) | | | — | | | | (17,370,677 | ) | | | — | | | $ | 32,102,899 | | | | 39,633,209 | | | | — | | |
Marine Shipping — 0.32% | |
Sound Holding FP
(Luxembourg)(b)(c)(d) | | | 1,146,250 | | | | 41,511,807 | | | | — | | | | — | | | | — | | | | (9,587,814 | ) | | | — | | | | 31,923,993 | | | | 1,146,250 | | | | — | | |
Limted
Partnerships — 1.00% | |
FPS LLC
(Marine Shipping)(b)(c)(d) | | | 937,450 | | | | 89,291,870 | | | | 13,880,242 | | | | — | | | | — | | | | (37,510,322 | ) | | | — | | | | 65,661,790 | | | | 1,076,253 | | | | — | | |
FPS Shelby Holding I
LLC(b)(c)(d) | | | — | | | | — | | | | 10,793,719 | | | | (13,784 | ) | | | — | | | | (1,315,465 | ) | | | — | | | | 9,464,470 | | | | 107,799 | | | | — | | |
U.S. Farming Realty
Trust, L.P.(b)(c)(d) | | | — | | | | 32,266,611 | | | | — | | | | (13,028,203 | ) | | | — | | | | (1,331,910 | ) | | | — | | | | 17,906,498 | | | | 350,000 | | | | — | | |
U.S. Farming Realty
Trust II, L.P.(b)(c)(d) | | | — | | | | 9,810,483 | | | | — | | | | (423,589 | ) | | | — | | | | (842,762 | ) | | | — | | | | 8,544,132 | | | | 120,000 | | | | — | | |
| | | | | 131,368,964 | | | | 24,673,961 | | | | (13,465,576 | ) | | | — | | | | (41,000,459 | ) | | | — | | | | 101,576,890 | | | | | | | | — | | |
Total Affiliate
Investments — 1.64% | | | | $ | 280,343,348 | | | $ | 86,983,356 | | | $ | (83,865,143 | ) | | $ | (148,782,471 | ) | | $ | 30,924,693 | | | | — | | | $ | 165,603,783 | | | | | | | $ | 450,388 | | |
(a) Non-income producing security.
52
FPA CRESCENT FUND
NOTES TO FINANCIAL STATEMENTS (Continued)
(b) Restricted securities. These securities are considered liquid by the Adviser. Most of these securities are not registered and may not be sold to the public. There are legal and/or contractual restrictions on resale. The Fund does not have the right to demand that such securities be registered. The values of these securities are determined by valuations provided by pricing services, brokers, dealers, market makers, or in good faith under policies adopted by authority of the Fund's Board of Trustees.
(c) These securities have been valued in good faith under policies adopted by authority of the Board of Trustee in accordance with the Fund's fair value procedures.
(d) Investments categorized as a significant unobservable input (Level 3) (See Note 8 of the Notes to Financial Statements).
53
FPA CRESCENT FUND
REPORT OF INDEPENDENT REGISTERED
PUBLIC ACCOUNTING FIRM
TO THE SHAREHOLDERS AND
BOARD OF TRUSTEES OF FPA CRESCENT FUND
Opinion on the Financial Statements
We have audited the accompanying statement of assets and liabilities of FPA Crescent Fund (the "Fund") (one of the funds constituting the FPA Funds Trust (the "Trust")), including the portfolio of investments, as of December 31, 2020, the related statement of operations for the year then ended, the statement of changes in net assets for each of the two years in the period then ended, and the financial highlights for each of the three years in the period then ended and the related notes (collectively referred to as the "financial statements"). The financial highlights for the years ended December 31, 2016 and December 31, 2017 were audited by another independent registered public accounting firm whose report, dated February 20, 2018, expressed an unqualified opinion on those financial highlights. In our opinion, the financial statements present fairly, in all material respects, the financial position of the Fund (one of the funds constituting the FPA Funds Trust) at December 31, 2020, the results of its operations for the year then ended, the changes in its net for each of the two years in the period then ended, and its financial highlights for each of the three years in the period then ended, in conformity with U.S. generally accepted accounting principles.
Basis for Opinion
These financial statements are the responsibility of the Fund's management. Our responsibility is to express an opinion on the Fund's financial statements based on our audits. We are a public accounting firm registered with the Public Company Accounting Oversight Board (United States) ("PCAOB") and are required to be independent with respect to the Fund in accordance with the U.S. federal securities laws and the applicable rules and regulations of the Securities and Exchange Commission and the PCAOB.
We conducted our audits in accordance with the standards of the PCAOB. Those standards require that we plan and perform the audit to obtain reasonable assurance about whether the financial statements are free of material misstatement, whether due to error or fraud. The Fund is not required to have, nor were we engaged to perform, an audit of the Fund's internal control over financial reporting. As part of our audits, we are required to obtain an understanding of internal control over financial reporting, but not for the purpose of expressing an opinion on the effectiveness of the Fund's internal control over financial reporting. Accordingly, we express no such opinion.
Our audits included performing procedures to assess the risks of material misstatement of the financial statements, whether due to error or fraud, and performing procedures that respond to those risks. Such procedures included examining, on a test basis, evidence regarding the amounts and disclosures in the financial statements. Our procedures included confirmation of securities owned as of December 31, 2020, by correspondence with the custodian and brokers or by other appropriate auditing procedures where replies from brokers were not received. Our audits also included evaluating the accounting principles used and significant estimates made by management, as well as evaluating the overall presentation of the financial statements. We believe that our audits provide a reasonable basis for our opinion.

We have served as the auditor of one or more FPA investment companies since 2018.
Los Angeles, CA
February 26, 2021
54
FPA CRESCENT FUND
APPROVAL OF INVESTMENT ADVISORY AGREEMENT
(Unaudited)
Approval of the Advisory Agreement. At a meeting of the Board of Directors held on August 10, 2020, the Directors approved the continuation of the advisory agreement between the Fund and the Adviser (the "Advisory Agreement") for an additional one-year period through September 30, 2021, on the recommendation of the Independent Directors, who met in executive session on August 10, 2020 prior to the Board meeting to review and discuss the proposed continuation of the Advisory Agreement. The Board had also met on July 13, 2020, with the Independent Directors meeting separately prior to the Meeting in executive session with the management of the Adviser and then separately with independent counsel to evaluate the renewal of the Advisory Agreement. Prior to their July 13 meeting, the Independent Directors, through their independent counsel, had requested and received extensive materials prepared in connection with the review of the Advisory Agreements. The materials provided a broad range of information regarding the Fund, including a description of, among other matters, the terms of the Advisory Agreement; the services provided by the Adviser; the experience of the relevant investment personnel; the Fund's performance in absolute terms and as compared to the performance of peers and appropriate benchmark(s); the fees and expenses of the Fund in absolute terms and as compared to peers; and the profitability of the Adviser from serving as adviser to the Fund. Following their review at the July 13 meeting, the Independent Directors requested (through their independent counsel) and received supplemental information and responses to a number of questions relating to the materials provided by the Adviser.
In addition, the Board met regularly throughout the year and received information on a variety of topics that were relevant to its annual consideration of the renewal of the Advisory Agreement including, among other matters, Fund investment performance, compliance, risk management, liquidity, valuation, trade execution and other matters relating to Fund operations. The Independent Directors also had met with management of the Adviser (including key investment personnel) at their quarterly meetings as well as with management at other times between the quarterly meetings throughout the year. The materials specifically provided in connection with the annual review of the Advisory Agreement supplement the information received throughout the year.
At their regular Board meetings and executive sessions, the Independent Directors were also assisted by independent legal counsel. In addition to the materials provided by the Adviser, the Independent Directors received a legal memorandum from independent counsel that outlined, among other matters: the duties of the Independent Directors and relevant requirements under the 1940 Act; the general principles under state law relevant to considering the approval of advisory contracts; an adviser's fiduciary duty with respect to advisory agreements and compensation; the standards used by courts in determining whether investment advisers and investment company boards of trustees have fulfilled their duties; and factors to be considered by the Independent Directors when voting on advisory agreements. During executive session, independent legal counsel reviewed with the Independent Directors these duties, standards and factors summarized in the legal memorandum described above. The following paragraphs summarize the material information and factors considered by the Board and the Independent Directors, as well as the Directors' conclusions relative to such factors.
Nature, Extent and Quality of Services. The Board and the Independent Trustees considered information provided by the Adviser in response to their requests, as well as information provided throughout the year regarding: the Adviser and its staffing in connection with the Fund, including the Fund's portfolio managers and the number and quality of analysts the Adviser has hired who are under the direct supervision of the Fund's portfolio managers; the scope of services supervised and provided by the Adviser; and the absence of any significant service problems reported to the Board. The Independent Trustees especially noted the experience, length of service and the outstanding reputation of the Fund's portfolio managers: Steven Romick, who has managed the Fund since its inception in 1993, Mark Landecker, who joined the Adviser in 2009 and has served
55
FPA CRESCENT FUND
APPROVAL OF INVESTMENT ADVISORY AGREEMENT (Continued)
(Unaudited)
as portfolio manager since 2013 and Brian A. Selmo, who joined the Adviser in 2008 and has served as portfolio manager since 2013. The Board and the Independent Trustees concluded that the nature, extent and quality of services provided by the Adviser have benefitted and should continue to benefit the Fund and its shareholders.
Investment Performance. The Board and the Independent Trustees reviewed the overall investment performance of the Fund. They also received information from an independent consultant, Broadridge, regarding the Fund's performance relative to a peer group of flexible (domestic and international) funds selected by Broadridge (the "Peer Group"). The Board and the Independent Trustees considered the Adviser's representation that the Fund's investment strategy is significantly different from other funds in the Peer Group in that the Fund has a much broader universe of investment possibilities, which requires a greater degree of portfolio management effort on the part of the Adviser. The Board and the Independent Trustees also considered the Adviser's representation that no other Broadridge category or peer grouping adequately represents the breadth and style of investing performed by the Fund's portfolio managers on behalf of the Fund (as a report previously prepared for the Board by an independent consultant had concluded). The Board and the Independent Trustees also considered FPA's representation that the Fund's size did not impede its ability to manage the Fund. The Board and the Independent Trustees noted the Fund's strong long-term investment performance and low volatility of returns when compared to the Peer Group and concluded that the Fund's investment performance has been strong. The Board and the Independent Trustees noted the Fund matched its Peer Group median for the 10-year period ending March 31, 2020, but underperformed its Peer Group median for the one-, three-, and five-year periods ending March 31, 2020. The Board and the Independent Trustees further noted the Fund underperformed the comparative S&P 500 Index for the one-, three-, five- and 10-year periods ending March 31, 2020. They also noted that Morningstar continues to give the Fund a "Gold" Analyst Rating.] In addition, they considered a comparison of the Fund's performance to that of hedge funds managed by the Adviser in a similar style. The Board and the Independent Trustees concluded that the Adviser's continued management of the Fund's investments should benefit the Fund and its shareholders.
Advisory Fees and Fund Expenses; Comparison with Peer Group and Institutional Fees. The Board and the Independent Trustees considered information provided by the Adviser regarding the Fund's advisory fees and total expense levels. The Board and the Independent Trustees reviewed comparative information regarding fees and expenses for the mutual fund industry generally and for the Peer Group. The Board and the Independent Trustees noted that the Fund's current management fee rate and total expense ratio each ranked towards the higher end of those of the Peer Group. They considered the Adviser's representation that the Fund's broader investment strategy makes comparisons to the advisory fees of the funds in the Peer Group less relevant, noting the Adviser's representation that most of the funds in the Peer Group are traditional balanced funds with different investment objectives and strategies, generally encompassing bond components that traditionally have lower advisory fees. The Board and the Independent Trustees considered the fees charged by the Adviser for advising institutional accounts and hedge funds and for sub-advising other mutual funds and the Adviser's discussion of the differences between the services provided by the Adviser to the Fund and those provided by the Adviser to the sub-advised funds, institutional accounts, and hedge funds. The Board and the Independent Trustees concluded that the continued payment of advisory fees and expenses by the Fund to the Adviser was fair and reasonable and should continue to benefit the Fund and its shareholders.
Adviser Profitability and Costs. The Board and the Independent Trustees considered information provided by the Adviser regarding the Adviser's costs in providing services to the Fund, the profitability of the Adviser and the benefits to the Adviser from its relationship to the Fund. They reviewed and considered the Adviser's
56
FPA CRESCENT FUND
APPROVAL OF INVESTMENT ADVISORY AGREEMENT (Continued)
(Unaudited)
representations regarding its assumptions and methods of allocating certain costs, such as personnel costs, which constitute the Adviser's largest operating cost, overhead and trading costs with respect to the provision of investment advisory services. The Independent Trustees discussed with the Adviser the general process through which individuals' compensation is determined and then reviewed by the management committee of the Adviser, as well as the Adviser's methods for determining that its compensation levels are set at appropriate levels to attract and retain the personnel necessary to provide high quality professional investment advice. In evaluating the Adviser's profitability, they excluded certain distribution and marketing-related expenses. The Board and the Independent Trustees recognized that the Adviser is entitled under the law to earn a reasonable level of profits for the services that it provides to the Fund. The Board and the Independent Trustees concluded that the Adviser's level of profitability from its relationship with the Fund did not indicate that the Adviser's compensation was unreasonable or excessive.
Economies of Scale and Sharing of Economies of Scale. The Board and the Independent Trustees considered, and discussed at length with the Adviser, whether there have been economies of scale with respect to the management of the Fund, whether the Fund has appropriately benefited from any economies of scale, and whether the fee rate is reasonable in relation to the Fund's asset levels and any economies of scale that may exist. While the Independent Trustees noted that the Fund experienced significant increases in its net assets several years ago, in recent years asset levels have declined. They also considered the Adviser's representation that its internal costs of providing investment management services to the Fund have also significantly increased in recent years as a result of a number of factors, including the ongoing and growing complexity of the Fund's investments, as well as the Adviser's substantial investment in additional professional resources and staffing. The Board and the Independent Trustees considered both quantitative and qualitative information regarding the Adviser's representation that it has also made significant investments in: (1) maintaining a portfolio management team of three and a team of analysts, traders and other investment personnel who assist with the management of the Fund; (2) new compliance, operations, and administrative personnel; (3) information technology, portfolio accounting and trading systems; and (4) office space, each of which enhances the quality of services provided to the Fund. The Board and Independent Trustees also considered the Adviser's representation that it would continue making such investments to maintain and increase the level and quality of services that it provides to the Fund. The Board and the Independent Trustees also considered that the Adviser had agreed to forgo the compensation for providing certain financial services that it had previously received from the Fund. The Board and the Independent Trustees also considered the Adviser's willingness to close funds to new investors when it believed that the Fund had limited capacity to grow or that it otherwise would benefit fund shareholders. The Board also noted that even though the Fund has experienced net outflows during the recent period, the Adviser has continued to make investments in the services it provides to the Fund. The Board noted that the Fund does not charge sales loads.
The Board and the Independent Trustees recognized that the advisory fee schedule for the Fund does not have breakpoints. They considered that many mutual funds have breakpoints in the advisory fee structure as a means by which to share in the benefits of potential economies of scale as a fund's assets grow. They also considered that not all funds have breakpoints in their fee structures and that breakpoints are not the exclusive means of sharing potential economies of scale. The Board and the Independent Trustees considered the Adviser's statement that it believes that breakpoints currently remain inappropriate for the Fund given the ongoing additional investments the Adviser is making in its business for the benefit of the Fund, uncertainties regarding the direction of the economy, and uncertainties regarding future growth or contraction in the Fund's assets, all of which could negatively impact the profitability of the Adviser. The Board and the Independent Trustees concluded that the
57
FPA CRESCENT FUND
APPROVAL OF INVESTMENT ADVISORY AGREEMENT (Continued)
(Unaudited)
Fund is benefitting from the ongoing investments made by the Adviser in its team of personnel serving the Fund and in the Adviser's service infrastructure, and that in light of these investments, the addition of breakpoints to the Fund's advisory fee structure was not warranted at current asset levels.
Ancillary Benefits. The Board and the Independent Trustees considered other actual and potential benefits to the Adviser from managing the Fund, including the acquisition and use of research services with commissions generated by the Fund, in concluding that the contractual advisory and other fees are fair and reasonable for the Funds. They noted that the Adviser does not have any affiliates that benefit from the Adviser's relationship to the Fund.
Conclusions. The Board and the Independent Trustees determined that the Fund continues to benefit from the services of the Adviser's highly experienced portfolio managers and portfolio management team, which has produced outstanding long-term returns with low relative volatility. In addition, the Board and the Independent Trustees agreed that the Fund continues to receive high quality services from the Adviser. The Board and the Independent Trustees concluded that the current advisory fee rate is reasonable and fair to the Fund and its shareholders in light of the nature and quality of the services provided by the Adviser and the Adviser's profitability and costs. In reaching their conclusions, the Independent Trustees also noted their intention to continue monitoring the factors relevant to the Adviser's compensation, such as changes in the Fund's asset levels, changes in portfolio management personnel and the cost and quality of the services provided by the Adviser to the Fund. On the basis of the foregoing, and without assigning particular weight to any single factor, none of which was dispositive, the Board and the Independent Trustees concluded that it would be in the best interests of the Fund to continue to be advised and managed by the Adviser and determined to approve the continuation of the current Advisory Agreement for another one-year period through September 30, 2021.
58
FPA CRESCENT FUND
SHAREHOLDER EXPENSE EXAMPLE
December 31, 2020 (Unaudited)
Fund Expenses
Mutual fund shareholders generally incur two types of costs: (1) transaction costs, and (2) ongoing costs, including advisory and administrative fees; shareholder service fees; and other Fund expenses. The Example is intended to help you understand your ongoing costs (in dollars) of investing in the Fund and to compare these costs with the ongoing costs of investing in other mutual funds. The Example is based on an investment of $1,000 invested at the beginning of the year and held for the entire year.
Actual Expenses
The information in the table under the heading "Actual Performance" provides information about actual account values and actual expenses. You may use the information in this column, together with the amount you invested, to estimate the expenses that you paid over the period. Simply divide your account value by $1,000 (for example, an $8,600 account value divided by $1,000 = 8.6), then multiply the result by the number in the first column in the row entitled "Expenses Paid During Period" to estimate the expenses you paid on your account during this period.
Hypothetical Example for Comparison Purposes
The information in the table under the heading "Hypothetical Performance (5% return before expenses)" provides information about hypothetical account values and hypothetical expenses based on the Fund's actual expense ratio and an assumed rate of return of 5% per year before expenses, which is not the Fund's actual return. The hypothetical account values and expenses may not be used to estimate the actual ending account balance or expenses you paid for the period. You may use this information to compare the ongoing costs of investing in the Fund and other funds. To do so, compare this 5% hypothetical example with the 5% hypothetical examples that appear in the shareholder reports of other funds.
Please note that the expenses shown in the table are meant to highlight your ongoing costs only and do not reflect any transactional costs. Therefore, the information under the heading "Hypothetical Performance (5% return before expenses)" is useful in comparing ongoing costs only, and will not help you determine the relative total costs of owning different funds. In addition, if these transactional costs were included, your costs would have been higher. Even though the Fund does not charge transaction fees, if you purchase shares through a broker, the broker may charge you a fee. You should evaluate other mutual funds' transaction fees and any applicable broker fees to assess the total cost of ownership for comparison purposes.
| | | Actual Performance | | Hypothetical Performance
(5% return before expenses) | |
Institutional Class | |
Beginning Account Value June 30, 2020 | | $ | 1,000.00 | | | $ | 1,000.00 | | |
Ending Account Value December 31, 2020 | | $ | 1,226.40 | | | $ | 1,019.46 | | |
Expenses Paid During Period(a) | | $ | 6.32 | | | $ | 5.74 | | |
Supra Institutional Class | |
Beginning Account Value June 30, 2020(b) | | $ | 1,000.00 | | | $ | 1,000.00 | | |
Ending Account Value December 31, 2020 | | $ | 1,151.95 | | | $ | 1,013.02 | | |
Expenses Paid During Period(c) | | $ | 3.69 | | | $ | 3.45 | | |
(a) Expenses are equal to the class's annualized expense ratio of 1.13%, multiplied by the average account value over the period and prorated for the six-months ended December 31, 2020 (184/366 days).
(b) Period from September 4, 2020, date operations commenced, through December 31, 2020.
(c) Expenses are equal to the class's annualized expense ratio of 1.11%, multiplied by the average account value over the period and prorated for the six-months ended December 31, 2020 (113/366 days).
59
FPA CRESCENT FUND
PRIVACY POLICY
(Unaudited)
The following is the privacy notice of the mutual funds managed by First Pacific Advisors, LP ("FPA", and the mutual funds, the "FPA Funds" ). A complete list of funds is provided below.
The FPA Funds take privacy seriously and consider privacy to be a fundamental aspect of its relationships with its former, prospective and current investors. The FPA Funds are committed to maintaining the confidentiality, integrity and security of its former, current, and prospective investors' non-public personal information and other personal information. This privacy policy describes our privacy practices surrounding the collection and sharing of non-public personal information and other personal information of current, former and prospective investors and visitors to websites maintained by the FPA Funds.
Obtaining Personal Data.
While providing investors and/or prospective investors (collectively, "investors") with products and services, the FPA Funds, and certain service providers, such as the FPA Fund's Transfer Agents and/or Administrators, may obtain personal data about such investors, which may come directly from the investor or their intermediaries from sources such as: (i) account applications, subscription agreements and other forms, (ii) written, electronic or verbal correspondence, (iii) investor transactions, (iv) an investor's brokerage or financial advisory firm, financial advisor or consultant, and/or (v) from information captured on applicable websites, including information you may voluntarily provide when you subscribe to receive FPA's quarterly updates or request us to mail you information about the FPA Funds. In addition, the FPA Funds may collect additional personal data from different sources, such as affiliates or their service providers; public websites or other publicly available sources such as government records; or from credit reporting agencies, sanctions screening databases, or from sources designed to detect and prevent fraud.
The personal data collected about an investor may include: (i) identifiers and similar information such as the investor's name, address, tax identification number, birth date, driver's license number, and potentially email address and phone number (if provided); (ii) certain information protected under other federal or state law, like an investor's signature or bank account information; (iii) characteristics of protected classifications under federal or state law, like gender or marital status; (iv) commercial information like an investment selection, beneficiary information, or transaction and account history with the FPA Funds; (v) internet or other electronic network activity like interactions with the FPA website; (vi) professional or employment-related information like an investor's occupation and job title; and (vii) inferences drawn from the other categories to build a profile on an investor to, for example, gauge an investor's potential interest in investing in new funds or products.
Respecting Your Privacy.
The FPA Funds do not disclose any personal data provided by investors or gathered by the FPA Funds to third parties, except as required or permitted by law or as necessary for such third parties to perform their agreements with respect to the FPA Funds. Non-affiliated companies may from time to time be used to provide certain services, such as maintaining investor accounts, preparing and mailing prospectuses, reports, account statements and other information, and gathering shareholder proxies. The FPA Funds may also provide an investor's personal data and account information to the investor's respective custodian, brokerage or financial advisory firm and/or financial advisor or consultant.
Sharing Information with Third Parties.
The FPA Funds reserve the right to report or disclose personal data or account information to third parties in circumstances where the FPA Funds believe in good faith that disclosure is required or permitted under law, to cooperate with regulators or law enforcement authorities, to protect their rights or property, or upon reasonable
60
FPA CRESCENT FUND
PRIVACY POLICY (Continued)
(Unaudited)
request by the FPA Funds in which an investor has invested. In addition, the FPA Funds may disclose information about an investor or an investor's accounts to a third party at the investor's request or direction or with the consent of the investor.
Procedures to Safeguard Private Information.
The FPA Funds will take reasonable steps and use security measures appropriate to the nature of the information and that comply with applicable laws to protect investors' personal data against unauthorized access and exfiltration, acquisition, theft, or disclosure. In addition to this policy, the FPA Funds have implemented internal procedures that are designed to help guard investors' personal data. Given the nature of information security, there is no guarantee that such safeguards will always be successful.
Information Collected Automatically from Websites.
When you visit a website maintained by the FPA Funds, those sites may collect certain information about that visit through automated tools, including cookies. Cookies are bits of data that a website sends to a web browser on a visitor's computer. Websites maintained by the FPA Funds use cookies and other tools to operate the websites and collect analytics information about your visit to our websites, including the number of visitors to a website and the webpages visited. These tools may be provided by third party analytics providers. The analytics information collected does not identify a particular individual visitor or user. You can change your cookie preferences by changing the setting on your web browser to delete or reject cookies. If you delete or reject cookies, some website pages may not function properly. The FPA Funds website does not respond to "do not track" signals.
Links to Other Websites.
This privacy policy only addresses the use and disclosure of personal data in conjunction with your use of websites maintained by the FPA Funds. These websites may contain links to other websites. If we create such a link, we will let you know when you are leaving the FPA website. These third-party websites may collect information, including personal data, from you. Please be aware that we are not responsible for the privacy practices or the content of third-party websites. We disclaim liability for any information, materials, products or services offered at any of the third-party sites linked to websites maintained by the FPA Funds. The availability of a link to another party's website is provided as a convenience, but it does not constitute an endorsement or sponsorship of any third party or their products, and does not create an affiliation or partnership between FPA and any third party. You should also be aware that third parties have different privacy policies than FPA and may have different information security practices. We encourage you to read the privacy statements provided by other websites before you provide personal data to them.
Changes to the Privacy Policy.
From time to time, the FPA Funds may update or revise this privacy policy. If there are changes to the terms of this privacy policy, documents containing the revised policy on the relevant website will be updated.
FPA Funds.
FPA Crescent Fund, FPA New Income, Inc., FPA Flexible Fixed Income Fund, FPA U.S. Core Equity Fund, Inc., FPA Queens Road Value Fund, FPA Queens Road Small Cap Value Fund, and Source Capital, Inc.
Revised: February 2021
61
FPA CRESCENT FUND
TRUSTEE AND OFFICER INFORMATION
(Unaudited)
Sandra Brown, Mark L. Lipson, Alfred E. Osborne, Jr., A. Robert Pisano, and Patrick B. Purcell are all Trustees of the Fund who are not "interested persons" of the Fund, as that term is defined in the 1940 Act (collectively, the "Independent Trustees"). Trustees serve until their resignation, removal or retirement. The Statement of Additional Information includes additional information about the Trustees and is available, without charge, upon request by calling (800) 982-4372.
Name, Address(1)
and Year of Birth | | Position(s)
Held with
the Fund | | Year First
Elected as
Trustee of
the Fund | | Principal Occupation(s)
During the
Past Five Years | | Number of
FPA Funds
Overseen
by Trustee | | Other
Directorships
Held by Trustee
During the Past
Five Years | |
Independent Trustees | |
Sandra Brown,
1955 | | Trustee | | | 2016 | | | Consultant (since 2009). Formerly, CEO and President of Transamerica Financial Advisers, Inc. (1999-2009); President, Transamerica Securities Sales Corp. (1998-2009); Vice President, Bank of America Mutual Fund Administration (1990-1998). Director/Trustee of FPA Funds Trust, FPA New Income, Inc., FPA U.S. Core Equity Fund, and Source Capital (since 2016), and Director of Bragg Capital Trust (since 2020). | | | 7 | | | None | |
Mark L. Lipson,
1949 | | Trustee & Chairman | | | 2015 | | | Registered Investment Adviser, ML2 Advisors, LLC (since 2014). Formerly Managing Director, Bessemer Trust (2007-2014) and US Trust (2003-2006); Chairman and CEO of the Northstar Mutual Funds (1993-2001); and President and CEO of the National Mutual Funds (1988-1993). Director/Trustee of FPA Funds Trust, FPA New Income, Inc., FPA U.S. Core Equity Fund, and Source Capital (since 2015), and Director of Bragg Capital Trust (since 2020). | | | 7 | | | None | |
Alfred E. Osborne, Jr.,
1944 | | Trustee | | | 2002 | | | Senior Associate Dean, (2003-Present), Interim Dean (2018-June 2019), Professor and Faculty Director (since 2003) Price Center for Entrepreneurship and Innovation at the John E. Anderson School of Management at UCLA. Dr. Osborne has been at UCLA since 1972. Director/Trustee of FPA Funds Trust, FPA New Income, Inc., FPA U.S. Core Equity Fund, and Source Capital (since 2013), and Director of Bragg Capital Trust (since 2020). | | | 7 | | | Kaiser Aluminum and Wedbush Capital | |
62
FPA CRESCENT FUND
TRUSTEE AND OFFICER INFORMATION (Continued)
(Unaudited)
Name, Address(1)
and Year of Birth | | Position(s)
Held with
the Fund | | Year First
Elected as
Trustee of
the Fund | | Principal Occupation(s)
During the
Past Five Years | | Number of
FPA Funds
Overseen
by Trustee | | Other
Directorships
Held by Trustee
During the Past
Five Years | |
A. Robert Pisano,
1943 | | Trustee | | | 2013 | | | Consultant (since 2012). Formerly, President and Chief Operating Officer of The Motion Picture Association of America, Inc. (2005-2011). Formerly, National Executive Director and Chief Executive Officer of The Screen Actors Guild (2001-2005). Director/Trustee of FPA Funds Trust, FPA New Income, Inc., FPA U.S. Core Equity Fund, and Source Capital (since 2013), and Director of Bragg Capital Trust (since 2020). | | | 7 | | | Resources Global Professionals | |
Patrick B. Purcell,
1943 | | Trustee | | | 2006 | | | Retired (since 2000). Formerly, Consultant to Paramount Pictures 1998-2000; Executive Vice President, Chief Financial and Administrative Officer of Paramount Pictures (1983-1998). Director/Trustee of FPA Funds Trust, FPA New Income, Inc., FPA U.S. Core Equity Fund, and Source Capital (since 2012), and Director of Bragg Capital Trust (since 2020). | | | 7 | | | None | |
"Interested" Trustees(2) | |
Steven Romick,
1963 | | Trustee | | | 2002 | | | Director and President of FPA GP, Inc., the General Partner of the Adviser (since 2018). Vice President (since 2015) and Portfolio Manager of FPA Crescent Fund (since 1993) and of Source Capital, Inc. (since 2015). Formerly, Managing Partner of FPA (2010-2018). Formerly, President of the Trust (2002-2015). | | | 2 | | | None | |
J. Richard Atwood,
1960 | | Trustee | | | 2016 | | | Director and President of FPA GP, Inc., the General Partner of the Adviser (since 2018). Director/Trustee (since 2016, except the Bragg Capital Trust since 2020) and President (since 2015, except the Bragg Capital Trust since 2020) of each FPA Fund. Formerly, Managing Partner of FPA (2006-2018). Formerly, until 2015, Treasurer of each FPA Fund for more than the past five years. | | | 7 | | | None | |
(1) The address of each Trustee is 11601 Wilshire Boulevard, Suite 1200, Los Angeles, California 90025.
(2) "Interested person" within the meaning of the 1940 Act by virtue of their affiliation with the Fund's Adviser.
63
FPA CRESCENT FUND
TRUSTEE AND OFFICER INFORMATION (Continued)
(Unaudited)
Officers of the Fund. Officers of the Fund are elected annually by the Board.
Name, Address(1)
and Year of Birth | | Position
with Fund | | Year First
Elected as
Officer of the
Fund | | Principal Occupation(s)
During the Past Five Years | |
J. Richard Atwood,
1960 | | President | | | 1997 | | | Director and President of FPA GP, Inc., the General Partner of FPA (since 2018). Director/Trustee (since 2016, except Bragg Capital Trust since 2020) and President for more than the past five years (except Bragg Capital Trust since 2020) of each FPA Fund. Formerly, Managing Partner of FPA (2006-2018). | |
Steven Romick,
1963 | | Vice President and Portfolio Manager | | | 2002 | | | Director and President of FPA GP, Inc., the General Partner of the Adviser (since 2018). Vice President (since 2015) and Portfolio Manager of FPA Crescent Fund (since 1993) and of Source Capital, Inc. (since 2015). Formerly, Managing Partner of FPA (2010-2018). Formerly, President of the Trust (2002-2015). | |
Mark Landecker,
1975 | | Vice President and Portfolio Manager | | | 2013 | | | Partner of FPA (since 2013). Formerly, Managing Director (January 2013-December 2013). Vice President and Portfolio Manager of Source Capital, Inc. (since 2015). | |
Brian Selmo,
1977 | | Vice President and Portfolio Manager | | | 2013 | | | Partner of FPA (since 2013). Formerly, Managing Director (January 2013-December 2013). Vice President and Portfolio Manager of Source Capital, Inc. (since 2015). | |
Karen E. Richards,
1969 | | Chief Compliance Officer | | | 2019 | | | Chief Compliance Officer of FPA (since 2018); and Chief Compliance Officer of each FPA Fund (since 2019, except Bragg Capital Trust since 2020). Formerly, Deputy Chief Compliance Officer of First Republic Investment Management, LLC (from 2016 to 2018), and Vice President, Senior Compliance Officer of Pacific Investment Management Company (from 2010 to 2016). | |
E. Lake Setzler III,
1967 | | Treasurer | | | 2006 | | | Senior Vice President (since 2013) and Controller of FPA; and Treasurer of each FPA Fund for more than the past five years (except Bragg Capital Trust since 2020). | |
Rebecca D. Gilding,
1979 | | Secretary | | | 2019 | | | Vice President and Counsel, State Street Bank and Trust Company (since 2016); and Secretary of each FPA Fund (since 2019, except Bragg Capital Trust since 2020). Formerly, Assistant Vice President and Associate Counsel, Brown Brothers Harriman & Co. (2013 to 2016). | |
(1) The address for each Officer (except Ms. Gilding) is 11601 Wilshire Boulevard, Suite 1200, Los Angeles, California 90025. Ms. Gilding's address is State Street Bank and Trust Company, One Lincoln Street, Boston, Massachusetts 02111.
64
FPA CRESCENT FUND
(Unaudited)
INVESTMENT ADVISER
First Pacific Advisors, LP
11601 Wilshire Boulevard, Suite 1200
Los Angeles, CA 90025
TRANSFER & SHAREHOLDER SERVICE AGENT
UMB Fund Services, Inc.
P.O. Box 2175
Milwaukee, WI 53201-2175
or
235 West Galena Street
Milwaukee, WI 53212-3948
(800) 638-3060
CUSTODIAN AND ADMINISTRATOR
State Street Bank and Trust Company
One Lincoln Street
Boston, Massachusetts 02111
Institutional Class:
TICKER SYMBOL: FPACX
CUSIP: 30254T759
Supra Institutional Class:
TICKER SYMBOL: FPCSX
CUSIP: 30254T676
DISTRIBUTOR
UMB Distribution Services, LLC
235 West Galena Street
Milwaukee, Wisconsin 53212-3948
LEGAL COUNSEL
Dechert LLP
One Bush Street, Suite 1600
San Francisco, California 94104
INDEPENDENT REGISTERED PUBLIC ACCOUNTING FIRM
Ernst & Young LLP
725 South Figueroa Street
Los Angeles, California 90017
This report has been prepared for the information of shareholders of FPA CRESCENT FUND, and is not authorized for distribution to prospective investors unless preceded or accompanied by an effective prospectus.
A description of the policies and procedures that the Adviser uses to vote proxies related to the Fund's portfolio securities is set forth in the Fund's Statement of Additional Information which is available without charge, upon request, on the Fund's website at www.fpa.com or by calling (800) 982-4372 and on the Securities and Exchange Commission's website at www.sec.gov.
The Fund's complete proxy voting record for the 12 months ended June 30, 2020 is available without charge, upon request by calling (800) 982-4372 and on the SEC's website at www.sec.gov.
The Fund's schedule of portfolio holdings, filed the first and third quarter of the Fund's fiscal year on Form N-PORT with the SEC, is available on the SEC's website at www.sec.gov.
Additional information about the Fund is available online at www.fpa.com. This information includes, among other things, holdings, top sectors, and performance, and is updated on or about the 15th business day after the end of each quarter.

Distributor:
UMB DISTRIBUTION SERVICES, LLC
235 West Galena Street
Milwaukee, Wisconsin 53212
Annual Report
December 31, 2020
Beginning on January 1, 2021, as permitted by regulations adopted by the Securities and Exchange Commission, we intend to no longer mail paper copies of the Fund's shareholder reports, unless you specifically request paper copies of the reports from the Fund or from your financial intermediary, such as a broker-dealer or bank. Instead, the reports will be made available on the FPA Funds website (fpa.com/funds), and you will be notified by mail each time a report is posted and provided with a website link to access the report. If you already elected to receive shareholder reports electronically, you will not be affected by this change and you need not take any action. If you prefer to receive shareholder reports and other communications electronically, you may update your mailing preferences with your financial intermediary, or enroll in e-delivery at fpa.com (for accounts held directly with the Fund).
You may elect to continue to receive paper copies of all future reports free of charge. If you invest through a financial intermediary, you may contact your financial intermediary to request that you continue to receive paper copies of your shareholder reports. If you invest directly with the Fund, you may inform the Fund that you wish to continue receiving paper copies of your shareholder reports by contacting us at (800) 638-3060. Your election to receive reports in paper will apply to all funds held with the FPA Funds or through your financial intermediary.
FPA Flexible Fixed Income Fund
FPA FLEXIBLE FIXED INCOME FUND
LETTER TO SHAREHOLDERS
INTRODUCTION
Dear Fellow Shareholders,
FPA Flexible Fixed Income Fund (the "Fund") returned 1.34% in the fourth quarter of 2020 and 4.70% for the year ended December 31, 2020.
As of December 31, 2020, the portfolio had a yield-to-worst1 of 1.85% and an effective duration of 1.09 years. The Treasury yield curve steepened during the quarter, with decreasing yields for Treasuries maturing within two years and increasing yields for Treasuries maturing beyond two years. In addition, spreads across both investment grade and high-yield debt markets compressed further during the quarter, continuing a recovery (and then some) since the pandemic-related increase in spreads that occurred during the first quarter of 2020.2 Lower spreads have combined with lower Treasury yields since the start of the year to produce historically low yields in investment grade and high-yield debt, both in corporates and structured products. While we are excited for society that the rollout of vaccines offers the prospect of a return to normalcy, the markets seem to assume that the return to normalcy will happen in a linear fashion with no disruptions. A market-wide clamor for yield has driven down yields, leaving fixed income markets historically expensive and significantly lowering potential future returns. As always, we look for credit investments (rated BBB or lower) that adequately compensate for the risk of non-payment. Today, our opportunities are limited. In the absence of attractive credit investments, we will deploy capital into high-quality investments (rated single-A or higher). The Fund's credit exposure was essentially unchanged from 20.5% as of September 30, 2020 to 20.6% as of December 31, 2020. Cash and equivalents increased from 1.9% of the portfolio as of September 30 to 12.8% at December 31.
Portfolio Attribution3
Fourth Quarter 2020
The largest contributor to performance during the quarter were corporates, which includes corporate bonds and bank debt, with both higher prices and coupons contributing to performance. In general, prices rose due to a combination of the rebound in credit spreads and improved underlying operational performance at the company level. The second largest contributor to performance were collateralized loan obligations (CLOs), driven
1 Yield to Worst ("YTW") is presented gross of fees and reflects the lowest possible yield on a callable bond without the issuer defaulting. It does not represent the yield an investor should expect to receive. As of December 31, 2020, the Fund's subsidized/unsubsidized 30-day SEC standardized yield ("SEC Yield") was 2.25%/1.92% respectively. The SEC Yield calculation is an annualized measure of the Fund's dividend and interest payments for the last 30 days, less the Fund expenses. Subsidized yield reflects fee waivers and/or expense reimbursements during the period. Without waivers and/or reimbursements, yields would be reduced. Unsubsidized yield does not adjust for any fee waivers and/or expense reimbursements in effect. The SEC Yield calculation shows investors what they would earn in yield over the course of a 12-month period if the fund continued earning the same rate for the rest of the year.
2 Securities rated BBB or above are considered investment grade. Credit ratings BB and below are lower-rated securities (junk bonds). High-yielding, non-investment grade bonds (junk bonds) involve higher risks than investment grade bonds. Bonds with credit ratings of CCC or below have a high default risk.
3 This information is not a recommendation for a specific security or sector and these securities/sectors may not be in the Fund at the time you receive this report. The information provided does not reflect all positions or sectors purchased, sold or recommended by FPA during the quarter. The portfolio holdings as of the most recent quarter-end may be obtained at www.fpa.com.
Past performance is no guarantee, nor is it indicative, of future results.
1
FPA FLEXIBLE FIXED INCOME FUND
LETTER TO SHAREHOLDERS
(Continued)
by a combination of coupon payments and higher prices as a result of lower spreads. The third largest contributor to performance were asset-backed securities (ABS) backed by equipment with most of the return due to coupon payments.
At the sector level, there were no meaningful detractors from performance though there were individual bonds in some sectors that detracted from performance.
Calendar Year 2020
For the year ended December 31, 2020, the largest contributor to performance were corporates, which includes corporate bonds and bank debt. These investments benefited from coupon payments and price appreciation. The second largest contributor to performance were CLOs with the return driven by coupon payments and price appreciation. For both the corporate and CLO investments, price appreciation was particularly beneficial for investments that were made after prices declined in March as a result of market-wide COVID-19 concerns. The third largest contributor to performance were ABS backed by auto loans or leases. Those bonds benefited from coupon payments in addition to lower yields driving up bond prices over the course of the year.
At the sector level, there were no meaningful detractors from performance though there were individual bonds in some sectors that detracted from performance.
Portfolio Activity
The table below shows the portfolio's exposures as of December 31, 2020 compared to September 30, 2020 and December 31, 2019:
| Sector | | % Portfolio
12/31/2020 | | % Portfolio
9/30/2020 | | % Portfolio
12/31/2019 | |
ABS | | | 62.0 | % | | | 69.1 | % | | | 33.5 | % | |
Mortgage Backed (CMO)4 | | | 6.5 | % | | | 7.4 | % | | | 6.3 | % | |
Stripped Mortgage-backed | | | 0.7 | % | | | 1.0 | % | | | 0.5 | % | |
Corporate | | | 8.3 | % | | | 8.8 | % | | | 9.2 | % | |
CMBS4 | | | 9.6 | % | | | 11.7 | % | | | 12.6 | % | |
Mortgage Pass-through | | | 0.1 | % | | | 0.1 | % | | | 18.5 | % | |
U.S. Treasury | | | 0.0 | % | | | 0.0 | % | | | 6.9 | % | |
Cash and equivalents | | | 12.8 | % | | | 1.9 | % | | | 12.5 | % | |
Total | | | 100.0 | % | | | 100.0 | % | | | 100.0 | % | |
Yield-to-worst5 | | | 1.85 | % | | | 2.13 | % | | | 2.80 | % | |
Effective Duration (years) | | | 1.09 | | | | 1.38 | | | | 1.74 | | |
Average Life (years) | | | 1.47 | | | | 2.31 | | | | 2.23 | | |
4 Collateralized mortgage obligations ("CMO") are mortgage-backed bonds that separate mortgage pools into different maturity classes. Commercial mortgage-backed securities ("CMBS") are securities backed by commercial mortgages rather than residential mortgages.
5 Please see Footnote 1 for definition of yield-to-worst and for the Fund's subsidized and unsubsidized SEC Yield as of December 31, 2020.
Past performance is no guarantee, nor is it indicative, of future results.
2
FPA FLEXIBLE FIXED INCOME FUND
LETTER TO SHAREHOLDERS
(Continued)
FPA launched the Flexible Fixed Income strategy and associated FPA Flexible Fixed Income fund at the end of 2018 with the goal of providing fixed income investors with attractive long-term returns and limited short-term mark-to-market risk. A key component of the strategy is to invest in an absolute value manner with the flexibility to invest across sectors and ratings within fixed income. We expected that the deployment of the strategy's full capability would not occur until we saw a meaningful dislocation in credit markets, which ended up happening in 2020.
Indeed, the past year will leave an indelible mark on us. COVID-19 and the fear of disease transmission may forever impact our behavior and how we interact with each other. For investors, the ongoing COVID-19 pandemic will join the Great Financial Crisis, the early 2000 tech bubble, the telecom bubble, the 2015 energy upheaval and other similar market events as yet another reminder that the unexpected can happen. The market is not necessarily the best predictor of whether and when adverse events can occur and it's incumbent on investors themselves to make that assessment and determine whether the returns justify the risk.
We try to be thoughtful about risk versus reward. Over the past 36 years, expensive markets have led us to actively manage our portfolios in advance of some of these unexpected events. In the case of COVID-19, we did the same. As we described in detail in our March 2020 shareholder letter, heading into 2020 we had positioned the Fund for capital preservation, not knowing that a pandemic would occur, but knowing that markets were expensive and not adequately compensating us for risk. To summarize that letter, in the quarters prior to 2020 we:
• Shortened the portfolio's duration, thereby reducing exposure to rising spreads
• Upgraded the quality of our holdings, gravitating toward AAA and AA-rated bonds and increasing our holdings of Treasuries
• Reduced the portfolio's credit exposure (including in February 2020, prior to the market meltdown in March, reducing exposure to some investments that we expected to be negatively impacted by COVID-19)
• Mostly avoided esoteric investments, where yields did not compensate for a combination of unfavorable structure and/or lack of clarity on credit quality
These decisions allowed us to mitigate the impact of price declines in the portfolio during the first quarter due to limited exposure to the parts of the market that sold off the most, particularly credit. Further, our downside protection-oriented underwriting gave us confidence that our portfolio would preserve capital for our investors, despite the fact that prices fell precipitously across fixed income markets in March 2020. Our active management did not leave every bond in our portfolio unscathed, but we did better than our peer group.6 At the depths of the market in March 2020, FPA Flexible Fixed Income had a drawdown of 3.32% compared to a drawdown of 10.10% for the Morningstar Nontraditional Bond category (in which FPA Flexible Fixed Income resides), 5.39% for the Bloomberg Barclays Aggregate Bond Index, 6.52% for the Bloomberg Barclays Universal Index and 19.09% for the Bloomberg Barclays High Yield Index.
In the midst of the market turmoil, we sprang into action. Once spreads increased in March, we actively deployed a significant portion of the Fund's capital into credit. Demonstrating the breadth and flexibility of our approach, we made 73 different investments in both corporate debt and securitized products, investing on average approximately a third of the portfolio in credit and, in the process, more than doubling the credit exposure from 9.6% of the portfolio at the end of 2019 to 20.6% at the end of 2020.
6 The Fund's peer group is the Morningstar Non-traditional Bond Fund Category. Please see end of this Commentary for important disclosures and definitions.
3
FPA FLEXIBLE FIXED INCOME FUND
LETTER TO SHAREHOLDERS
(Continued)
Yet, those credit investments do not fully capture the scope of our opportunistic investments in the past year. We also made investments in 43 different highly rated structured products bonds (mostly CLOs) at either significant discounts or historically cheap spreads. These high-quality investments represented approximately 20% of the portfolio, on average.
This opportunistic approach led both the corporate credit and structured product credit positions to meaningfully contribute to the Fund's performance. For the full year, credit contributed 175 basis points (bps) or 35% of the Fund's total return, with 63% of that credit contribution coming from corporate credit and 37% coming from structured product credit. In addition, the aforementioned high-quality structured product bond investments contributed 49 bps or 10% of the full year return.
After March 2020, markets recovered with a huge assist from the Federal Reserve and Treasury via lower interest rates, lending programs, and quantitative easing that expanded beyond Treasuries and mortgages to corporate debt. In light of this support, some may ask why we did not invest more in credit. First, we are not ones to count on the whims of the government to support our investments, so we built the Fund's portfolio to perform well absent market support from the government. Second, we wanted to have conviction on the value of our investments rather than speculate on a flood of money pushing up asset prices. The capital we deployed understates the work we did poring over opportunities, trying to identify businesses and assets that we expected to retain value in a post-COVID-19 world, with little knowledge of what that world would look like. We are not virologists or epidemiologists. We do not pretend that we have any edge on how or for how long COVID-19's impact will be felt. As such, we researched but ultimately passed on potential investments where we could not develop a view on value or determine whether there was sufficient liquidity to survive to the other side of the pandemic.
Yet, the government support did in fact come and, with prices rising indiscriminately across fixed income markets as a result, it ended up being a boon to those who were not as prudent in their security selection as we were. We encourage investors to ask themselves how their other investments would have performed without the benefit of the government backstop.
Nevertheless, we are happy to say that we delivered a return versus drawdown profile that is better than our peers, despite the occurrence of a (hopefully) once-in-a-generation event (as pictured below).
4
FPA FLEXIBLE FIXED INCOME FUND
LETTER TO SHAREHOLDERS
(Continued)
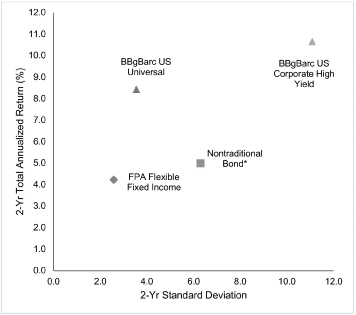
Source (Chart Data): Morningstar Direct as of December 31, 2020. Fund performance is shown net of all fees and expenses and includes reinvestment of distributions. Comparison to indices is for illustrative purposes only. The Fund does not include outperformance of any index or benchmark in its investment objectives. See Cover Page for performance since inception. Past performance is no guarantee, nor is it indicative, of future results
* Reflects peer group bond fund categories as defined by Morningstar.
Nine months later, we have come full circle in some respects. While COVID-19 has put the world in a more precarious position than it was in before March, the markets suggest otherwise. The chart below shows that, over the past 12 months, Treasury yields have declined by approximately 145 basis points (bps) for bonds maturing within three years and approximately 120-130 bps for bonds maturing in five to seven years.
5
FPA FLEXIBLE FIXED INCOME FUND
LETTER TO SHAREHOLDERS
(Continued)
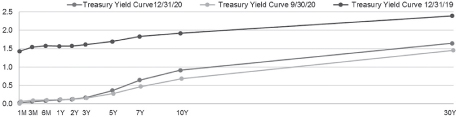
Chart data as of the dates shown. Source: Bloomberg.
The following chart shows that spreads on various types of structured product bonds, similar to much of what constitutes the Fund, have retraced from their March highs to levels that are below where they started 2020.
Structured Product Spreads
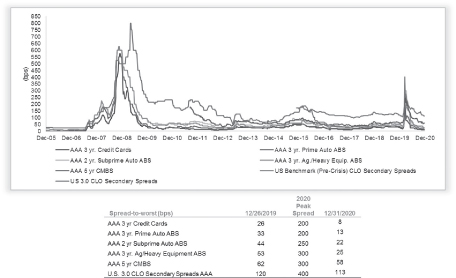
Source: JP Morgan. Chart data from December 31, 2005 through December 31, 2020. ABS is asset-backed security. Spread to worst is the spread implied by the yield-to-worst.
6
FPA FLEXIBLE FIXED INCOME FUND
LETTER TO SHAREHOLDERS
(Continued)
In combination with lower Treasury yields, these lower spreads have resulted in historically low yields on investment grade bonds, as evidenced by the yields on the Bloomberg Barclays U.S. Aggregate 1-3 year Bond Index and Bloomberg Barclays U.S. Aggregate Bond Index (as shown below).
Bloomberg Barclays U.S. Aggregate 1-3 Year Bond Index

Source: Bloomberg Barclays. Chart data from January 29, 1993 through December 31, 2020. YTW is Yield to Worst.
7
FPA FLEXIBLE FIXED INCOME FUND
LETTER TO SHAREHOLDERS
(Continued)
Bloomberg Barclays U.S. Aggregate Bond Index
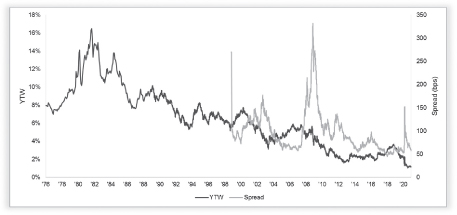
Source: Bloomberg Barclays. Chart data from January 30, 1976 through December 31, 2020. Source: Bloomberg Barclays. Spread data for the Bloomberg Barclays U.S. Aggregate Bond Index ("Index") is not available prior to November 25, 1998. YTW is Yield to Worst. The Index is a broad-based index that measure the investment grade, US dollar denominated, fixed rate taxable bond market.
As the chart below shows, these conditions have also led to historically high duration in the investment grade bond market. From a duration perspective, unless one has a view that negative yields are in our future, the future potential returns from further price appreciation are unattractive in comparison to the downside risk to prices, especially for those who, like us, do not like to speculate on future changes in prices (i.e., bet on changes in yields and spreads). To illustrate that point, and as highlighted by the ratio of yield-to-worst to duration in the chart below, the Bloomberg Barclays U.S. Aggregate Bond Index could withstand a less than 20 bps increase in yield before it produces a negative return over the course of a year.
8
FPA FLEXIBLE FIXED INCOME FUND
LETTER TO SHAREHOLDERS
(Continued)
Bloomberg Barclays U.S. Aggregate Bond Index
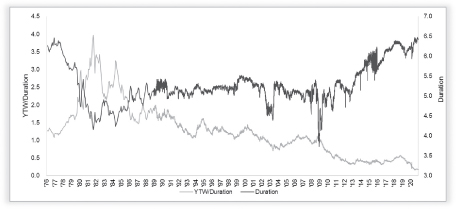
Source: Bloomberg Barclays. Chart data from January 30, 1976 through December 31, 2020.
In high-yield bonds and leveraged loans, investors have fallen into the trap of buying spreads that are not obviously expensive, ignoring the fact that historically low risk-free rates are leading to overall absolute compensation — as measured by yield — that is not only historically low but, given the underlying credit risk, may also be inadequate to provide investors with a return on their capital.
9
FPA FLEXIBLE FIXED INCOME FUND
LETTER TO SHAREHOLDERS
(Continued)
Bloomberg Barclays U.S. High Yield Bond Index
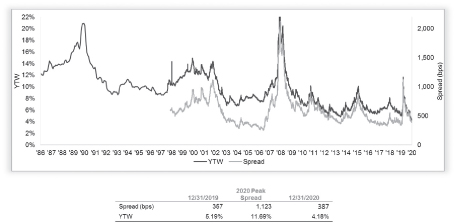
Source: Bloomberg Barclays. Chart data from December 31, 1986 through December 31, 2020. High yield bonds are bonds that pay higher interest rates because they have lower credit ratings than investment grade bonds.
10
FPA FLEXIBLE FIXED INCOME FUND
LETTER TO SHAREHOLDERS
(Continued)
Credit Suisse Leveraged Loan Index
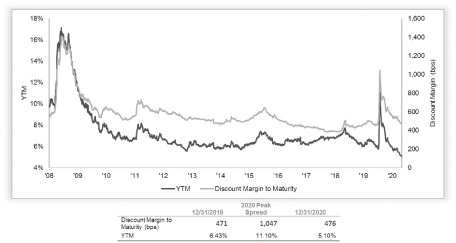
Chart data from June 30, 2008 through January 19, 2021. Source: Credit Suisse. YTM is yield to maturity. Discount Margin to Maturity is the average expected return of a floating rate security that's earned in addition to the index underlying, or reference rate of, the security. The size of the discount margin depends on the price of the floating or variable rate security.
We've commented many times in the past about why it's important to invest based on yield rather than spread. Dollars of return is what ultimately drives performance. Moreover, dollars of return offset default-related losses. Expected future dollars are measured by yield, not spread. A research note we read recently is a good example of why yield matters: "It is noteworthy that at an index level, CCCs have gone from a 10% YTW a year ago to 6.5% today, implying substantial performance. Unfortunately, actual total returns have been a meager 3% over the period, with default losses eating away at the bulk of that yield."7 Spread-based buyers who ignore yield are exposed to the mismatch between their relative-value investment approach and absolute losses.
From a credit perspective, the market is behaving as if the world's recovery from COVID-19 will be a linear path. However, we have already seen signs that this may not be the case. Lockdown fatigue and, perhaps, misguided government policy has led to increased infection rates and deaths as more people socialize. The pace of inoculations has been slower than expected. New, more stringent lockdowns have been instituted. New, more contagious (and, possibly, more virulent) strains of the virus have appeared. The current crop of vaccines may offer less protection against some of these new strains, and these new strains may increase the percentage of the population that needs to be vaccinated to contain the spread of the virus. We hope for a fast recovery, but we're
7 Hamid, Sherif, Jefferies research, 1/25/21
11
FPA FLEXIBLE FIXED INCOME FUND
LETTER TO SHAREHOLDERS
(Continued)
aware that these emerging challenges could cause the recovery to slow or flounder. The Federal Reserve can Band-Aid over a lot of financial problems but it can't manufacture revenue at businesses that are now secularly challenged in a post-COVID-19 world. What happens to those businesses that do not generate sufficient cash to survive but instead have been relying on lenient capital markets to provide financing that keeps them alive? What happens to consumers who are not earning sufficient income and have been relying on a generous government to support them?
We prefer not to bet on largesse from the central bank, the government or financial markets to support our investments. With yields near historically low levels, we prefer to invest with confidence that our capital will be returned, even under dire economic and market circumstances. This approach leads us toward short duration bonds which can protect capital in a rising interest rate and/or rising spread environment and maximize the option value on higher yielding investments in the future — similar to our approach at the start of 2020 (which served us well). In doing so, we will focus on areas where we still see attractive prices. We will also opportunistically invest in credit to the extent that we feel the potential returns adequately compensate us for the risk of permanent impairment of capital. To that end, this past quarter, our investment activity was directed toward high-quality CLOs, corporate bank debt, newly issued bonds backed by non-performing residential mortgages and various types of high-quality, short maturity ABS and non-agency commercial mortgage-backed securities (CMBS).
For 36 years, FPA's fixed income team has been managing fixed income portfolios with the same absolute return and preservation of capital mindset. During this time, we have seen both wildly overvalued and undervalued fixed income markets and we strive for equanimity through both. The Fund's downside protection versus peers, low volatility of returns and solid risk-adjusted returns speak to this temperament. The goal, as always, is to produce attractive long-term returns anchored by limited short-term volatility.
Now is the hard part. In comparison to today, investing was much easier when COVID-19 led to a calamity in the market. Despite the greater uncertainty at that time, low prices provided a cure. We are more fearful of the markets now than when we were in the depths of the pandemic-driven sell-off because debt now trades at exorbitant prices, unbefitting the significant economic uncertainty that exists.
Financial markets appear to be drunk off the stimulus of quantitative easing and unending support provided by central banks and governments. This reminds us of a piece of unintended investment advice we received, as recounted by a friend who was out late at a bar, trying to convince his companions to stay for another drink. The advice he received: Don't chase a good time. Extraordinary gains have been made by investors thanks to the relentless rise in bond prices. Given the significant duration risk in the market and low absolute yields, investors should now ask themselves what further gains they are chasing. We suggest they should not chase a good time.
Macroeconomic Commentary
With the rollout of COVID-19 vaccines, the oft-used phrase "light at the end of the tunnel" reemerged in the news and in most economic forecast reports. Our focus is on two questions: what did the country do to get through the scary dark tunnel and where does the tunnel lead us after we exit to the light of day on the other side?
When society entered the dark tunnel of stay-at-home orders, it put millions of people out of work temporarily and severely reduced revenue at businesses of all sizes. The Federal Reserve and Congress responded with a series of policies and programs designed to bridge these revenue and income gaps, dampen the recession, and provide some dim light as everyone worked their way through the tunnel of recession. These policies and programs fell into four areas: monetary easing; special lending programs to backstop the financial markets; supplemental income payments to households; and grants and low interest loans to small- and mid-sized businesses.
12
FPA FLEXIBLE FIXED INCOME FUND
LETTER TO SHAREHOLDERS
(Continued)
The chart below shows the changes in Federal Reserve policy that occurred in 2020.
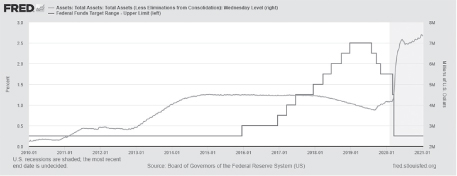
Source: Board of Governors of the Federal Reserve System (U.S.) U.S. recessions are shaded. The most recent end date is undecided.
The overnight lending rate declined to a range of 0.00% to .25% and the Federal Reserve purchased over $3 trillion in Treasury and agency mortgage securities. Combined with a pledge to continue purchasing $80 billion per month of Treasury securities and $40 billion of mortgage securities for the foreseeable future, the Federal Reserve's balance sheet more than doubled.
13
FPA FLEXIBLE FIXED INCOME FUND
LETTER TO SHAREHOLDERS
(Continued)
The table below lists the Treasury and Federal Reserve lending programs instituted in 2020.

* Outstanding balance of purchases or loans as of November 30, 2020. Source: BCA Research. Data source: Federal Reserve.
What is evident from this table is that the total amount outstanding in each program is far less than the stated maximum capacity. In other words, these programs effectively served as a backstop with the capital markets, not the Treasury or Federal Reserve, ultimately creating the needed lending power to satisfy much of the corporate borrowing needs. Consequently, the gross issuance of both investment grade and non-investment grade debt was at historic high levels.
The graphic below shows the fiscal policy programs that targeted households and small businesses with the needed liquidity to weather the stay-at-home orders and pandemic restrictions. Note that this chart does not factor in the year-end $900 billion-plus stimulus bill that includes direct checks to households and Paycheck Protection Plan Loans and grants.
14
FPA FLEXIBLE FIXED INCOME FUND
LETTER TO SHAREHOLDERS
(Continued)
Emergency Relief Package categories, in billions
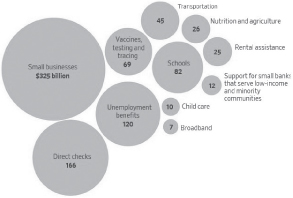
Source: Bianco Research. Data source: Congressional aides.
This leads to the question, 'what is on the other side of the tunnel?' The first thing that is coming into focus is that all the liquidity provided to the economy was created with borrowed money or printed money. While effective in providing the needed immediate liquidity for the economy and controlling the near-term solvency issue, those moves have consequences. We look around and see mountains of debt at the corporate and government level. Fortunately, we only see a foothill of debt at the household level.
Corporate debt specifically has increased meaningfully. Leverage at investment grade companies has been increasing since 2015 and has been consistently higher than it has been since the recession of 2001-03. Investment grade corporate borrower leverage has risen due to increased borrowing by BBB-rated borrowers. In the high yield universe, leverage at the median high yield borrower is approximately a turn of leverage higher than the leverage of the median borrower in 2006.
How will businesses and government manage the mountains of debt? In general, higher levels of debt can be dealt with better in an environment of faster nominal GDP growth. Coming out of the Great Financial Crisis, attempts to spur nominal GDP growth had limited success. The general idea executed back then by central banks and policy makers was to stimulate real economic growth and inflation (together, nominal growth). Central bankers maintained an accommodative monetary policy via negative interest or zero-interest rates (NIRP, ZIRP) and quantitative easing (QE). Unfortunately, this was combined with fiscal austerity to varying degrees, which resulted in slow and substandard economic growth.
In 2020, the monetary policy response to the economic downturn was larger and implemented much faster. The same can be said for the fiscal policy response compared to the Great Financial Crisis. Policy makers today seem to be focused less on austerity (at least in the near term), with additional stimulus ideas being contemplated. Having said that, tax increases to assist in payment of these stimulus ideas along with tempering
15
FPA FLEXIBLE FIXED INCOME FUND
LETTER TO SHAREHOLDERS
(Continued)
the amount of stimulus are, in fact, subtle forms of austerity. Expect to see this austerity debate emerge during the short to intermediate period of this business expansion.
Without higher economic growth, the other options for debt management become more difficult for borrowers and lenders. For corporations, while the volume of bankruptcies has been controlled to date, if debt levels stay high, there's a greater possibility of a longer period of elevated bankruptcies and reorganizations. There's also potential for more 'zombie' companies, and that can be detrimental to economic growth.
Payment default is a far more difficult option for the federal government, so the better solution for that institution is inflation since cheaper dollars can then be used to pay interest. That said, refinancing government debt could become expensive if higher inflation leads to rising interest rates. Modern Monetary Theory (MMT) is the concept of using non-austerity solutions to address the fiscal funding problem and government debt that, allegedly, does not have inflation implications. Whether MMT gains traction among policymakers is yet to be determined.
In summary, whenever we exit the tunnel, we will exit with significantly more debt than when we entered. At this point, it's unclear whether real or nominal output growth will be sufficient to service that debt. With yields at such low levels, we don't see sufficient compensation for default or inflation risk. Nevertheless, as we enter the light, we're going to invest with our eyes wide open unlike other investors who seem to have theirs shaded with rose-colored glasses.
Thank you for your continued trust and support.
Respectfully submitted,

Thomas H. Atteberry
Portfolio Manager

Abhijeet Patwardhan
Portfolio Manager
January 2021
16
FPA FLEXIBLE FIXED INCOME FUND
LETTER TO SHAREHOLDERS
(Continued)
Important Disclosures
This Commentary is for informational and discussion purposes only and does not constitute, and should not be construed as, an offer or solicitation for the purchase or sale of any securities, products or services discussed, and neither does it provide investment advice. Any such offer or solicitation shall only be made pursuant to the Fund's Prospectus which supersedes the information contained herein in its entirety.
The views expressed herein, and any forward-looking statements, are as of the date of the publication and are those of the portfolio management team and are subject to change without notice. Future events or results may vary significantly from those expressed and are subject to change at any time in response to changing circumstances and industry developments. This information and data has been prepared from sources believed reliable, but the accuracy and completeness of the information cannot be guaranteed and is not a complete summary or statement of all available data. You should not construe the contents of this document as legal, tax, accounting, investment or other advice or recommendations.
Portfolio composition will change due to ongoing management of the Fund. References to individual securities or sectors are for informational purposes only and should not be construed as recommendations by the Fund, the portfolio managers, the Adviser, or the distributor. It should not be assumed that future investments will be profitable or will equal the performance of the security or sector examples discussed. The portfolio holdings as of the most recent quarter-end may be obtained at www.fpa.com.
The statements made herein may be forward-looking and/or based on current expectations, projections, and/or information currently available. Actual results may differ from those anticipated. The portfolio managers and/or FPA cannot assure future results and disclaims any obligation to update or alter any statistical data and/or references thereto, as well as any forward-looking statements, whether as a result of new information, future events, or otherwise. Such statements may or may not be accurate over the long-term.
Investments, including investments in mutual funds, carry risks and investors may lose principal value. Capital markets are volatile and can decline significantly in response to adverse issuer, political, regulatory, market, or economic developments. The Fund may purchase foreign securities, including American Depository Receipts (ADRs) and other depository receipts, which are subject to interest rate, currency exchange rate, economic and political risks; this may be enhanced when investing in emerging markets. Foreign investments, especially those of companies in emerging markets, can be riskier, less liquid, harder to value, and more volatile than investments in the United States. The securities of smaller, less well-known companies can be more volatile than those of larger companies.
The return of principal in a bond fund is not guaranteed. Bond funds have the same issuer, interest rate, inflation and credit risks that are associated with underlying bonds owned by the Fund. Lower rated bonds, convertible securities and other types of debt obligations involve greater risks than higher rated bonds.
Interest rate risk is the risk that when interest rates go up, the value of fixed income securities, such as bonds, typically go down and investors may lose principal value. Credit risk is the risk of loss of principal due to the issuer's failure to repay a loan. Generally, the lower the quality rating of a security, the greater the risk that the issuer will fail to pay interest fully and return principal in a timely manner. If an issuer defaults the security may lose some or all of its value.
Mortgage securities and collateralized mortgage obligations (CMOs) are subject to prepayment risk and the risk of default on the underlying mortgages or other assets; such derivatives may increase volatility. Convertible
17
FPA FLEXIBLE FIXED INCOME FUND
LETTER TO SHAREHOLDERS
(Continued)
securities are generally not investment grade and are subject to greater credit risk than higher-rated investments. High yield securities can be volatile and subject to much higher instances of default.
Collateralized debt obligations ("CDOs"), which include collateralized loan obligations ("CLOs"), collateralized bond obligations ("CBOs"), and other similarly structured securities, carry additional risks in addition to interest rate risk and default risk. This includes, but is not limited to: (i) distributions from the underlying collateral may not be adequate to make interest or other payments; (ii) the quality of the collateral may decline in value or default; and (iii) the complex structure of the security may not be fully understood at the time of investment and may produce disputes with the issuer or unexpected investment results. Investments in CDOs are also more difficult to value than other investments.
Value style investing presents the risk that the holdings or securities may never reach their full market value because the market fails to recognize what the portfolio management team considers the true business value or because the portfolio management team has misjudged those values. In addition, value style investing may fall out of favor and underperform growth or other styles of investing during given periods.
The ratings agencies that provide ratings are Standard and Poor's, Moody's, and Fitch. Credit ratings range from AAA (highest) to D (lowest). Bonds rated BBB or above are considered investment grade. Credit ratings of BB and below are lower-rated securities (junk bonds). High-yielding, non-investment grade bonds (junk bonds) involve higher risks than investment grade bonds. Bonds with credit ratings of CCC or below have high default risk.
Please refer to the Fund's Prospectus for a complete overview of the primary risks associated with the Fund.
Not authorized for distribution unless preceded or accompanied by a current prospectus. The prospectus can be accessed at: https://fpa.com/request-funds-literature.
Index/Category Definitions
Comparison to any index is for illustrative purposes only and should not be relied upon as a fully accurate measure of comparison. The Fund will be less diversified than the indices noted herein, and may hold non-index securities or securities that are not comparable to those contained in an index. Indices will hold positions that are not within the Fund's investment strategy. Indices are unmanaged, do not reflect any commissions, fees or expenses which would be incurred by an investor purchasing the underlying securities. The Fund does not include outperformance of any index or benchmark in its investment objectives. An investor cannot invest directly in an index.
Bloomberg Barclays US Aggregate Bond Index provides a measure of the performance of the U.S. investment grade bonds market, which includes investment grade U.S. Government bonds, investment grade corporate bonds, mortgage pass-through securities and asset-backed securities that are publicly offered for sale in the United States. The securities in the Index must have at least 1 year remaining in maturity. In addition, the securities must be denominated in U.S. dollars and must be fixed rate, nonconvertible, and taxable.
Bloomberg Barclays US Aggregate 1-3 Year Bond Index provides a measure of the performance of the U.S. investment grade bonds market, which includes investment grade U.S. Government bonds, investment grade corporate bonds, mortgage pass-through securities and asset-backed securities that are publicly offered for sale in the United States. The securities in the Index must have a remaining maturity of 1 to 3 years. In addition, the securities must be denominated in U.S. dollars and must be fixed rate, nonconvertible, and taxable.
18
FPA FLEXIBLE FIXED INCOME FUND
LETTER TO SHAREHOLDERS
(Continued)
Bloomberg Barclays U.S. Universal Bond Index represents the union of the following Bloomberg Barclay's indices: U.S. Aggregate Index, the U.S. Corporate High-Yield Index, the 144A Index, the Eurodollar Index, the Emerging Markets Index, and the non-ERISA portion of the CMBS Index. Municipal debt, private placements, and non-dollar-denominated issues are excluded from the Universal Index. The only constituent of the index that includes floating-rate debt is the Emerging Markets Index.
Bloomberg Barclays U.S. High Yield Index measures the market of USD-denominated, non-investment grade, fixed-rate, taxable corporate bonds.
Credit Suisse Leveraged Loan Index is designed to mirror the investable universe of U.S. dollar institutional leveraged loans, including U.S. and international borrowers.
The Consumer Price Index (CPI) is an unmanaged index representing the rate of the inflation of U.S. consumer prices as determined by the U.S. Department of Labor Statistics. There can be no guarantee that the CPI will reflect the exact level of inflation at any given time. This index reflects non-seasonally adjusted returns.
The CPI + 200 bps is created by adding 2% to the annual percentage change in the CPI. This index reflects non-seasonally adjusted returns.
Morningstar Nontraditional Bond Category contains funds that pursue strategies divergent in one or more ways from conventional practice in the broader bond fund universe. Many funds in this group describe themselves as "absolute return" portfolios, which seek to avoid losses and produce returns uncorrelated with the overall bond market; they employ a variety of methods to achieve those aims. Another large subset are self described "unconstrained" portfolios that have more flexibility to invest tactically across a wide swath of individual sectors, including high yield and foreign debt, and typically with very large allocations. Funds in the latter group typically have broad freedom to manage interest rate sensitivity, but attempt to tactically manage those exposures in order to minimize volatility. The category is also home to a subset of portfolios that attempt to minimize volatility by maintaining short or ultra short duration portfolios, but explicitly court significant credit and foreign bond market risk in order to generate high returns. Funds within this category often will use credit default swaps and other fixed income derivatives to a significant level within their portfolios. There were 323 funds in the category at 12/31/2020.
Other Definitions
Basis Point (bps) is equal to one hundredth of one percent, or 0.01%. 100 basis points = 1%.
Corporate holdings include bank debt, corporate bonds and common stock.
Downside Protection is a technique used to prevent a decrease in the value of the investment.
A discount margin to maturity is the average expected return of a floating-rate security (typically a bond) that's earned in addition to the index underlying, or reference rate of, the security. The size of the discount margin depends on the price of the floating- or variable-rate security.
Effective Duration (years) is the duration calculation for bonds with embedded options. Effective duration takes into account that expected cash flows will fluctuate as interest rates change.
Repo (Repurchase Agreement) is a form of short-term borrowing for dealers in government securities.
Weighted Average Life (years) is the average length of time that each dollar of unpaid principal on a loan, a mortgage or an amortizing bond remains outstanding.
19
FPA FLEXIBLE FIXED INCOME FUND
LETTER TO SHAREHOLDERS
(Continued)
Yield to Maturity is the rate of return anticipated on a bond if held until the end of its lifetime. YTM is considered a long-term bond yield expressed as an annual rate. The YTM calculation takes into account the bond's current market price, par value, coupon interest rate and time to maturity. It is also assumed that all coupon payments are reinvested at the same rate as the bond's current yield.
Zombie companies are companies that earn just enough money to continue operating and service debt but are unable to pay off their debt.
©2021 Morningstar, Inc. All Rights Reserved. The information contained herein: (1) is proprietary to Morningstar and/or its content providers; (2) may not be copied or distributed; and (3) is not warranted by Morningstar to be accurate, complete or timely. Neither Morningstar nor its content providers are responsible for any damages or losses arising from any use of this information. Past performance is no guarantee of future results.
The FPA Funds are distributed by UMB Distribution Services, LLC, 235 W. Galena Street, Milwaukee, WI, 53212.
20
FPA FLEXIBLE FIXED INCOME FUND
LETTER TO SHAREHOLDERS
(Continued)
The discussions of Fund investments represent the views of the Fund's managers at the time of this report and are subject to change without notice. References to individual securities are for informational purposes only and should not be construed as recommendations to purchase or sell individual securities.
FUND RISKS
Investments in mutual funds carry risks and investors may lose principal value. Stock markets are volatile and can decline significantly in response to adverse issuer, political, regulatory, market, or economic developments. The funds may purchase foreign securities which are subject to interest rate, currency exchange rate, economic and political risks: this may be enhanced when investing in emerging markets. The securities of smaller, less well-known companies can be more volatile than those of larger companies. The return of principal in a bond fund is not guaranteed. Bond funds have the same issuer, interest rate, inflation and credit risks that are associated with underlying bonds owned by the fund. Lower rated bonds, convertible securities and other types of debt obligations involve greater risks than higher rated bonds. Mortgage securities and collateralized mortgage obligations (CMOs) are subject to prepayment risk and the risk of default on the underlying mortgages or other assets; derivatives may increase volatility. High yield securities can be volatile and subject to much higher instances of default.
FORWARD LOOKING STATEMENT DISCLOSURE
As mutual fund managers, one of our responsibilities is to communicate with shareholders in an open and direct manner. Insofar as some of our opinions and comments in our letters to shareholders are based on our current expectations, they are considered "forward-looking statements" which may or may not prove to be accurate over the long term. While we believe we have a reasonable basis for our comments and we have confidence in our opinions, actual results may differ materially from those we anticipate. You can identify forward-looking statements by words such as "believe," "expect," "may," "anticipate," and other similar expressions when discussing prospects for particular portfolio holdings and/or the markets, generally. We cannot, however, assure future results and disclaim any obligation to update or alter any forward-looking statements, whether as a result of new information, future events, or otherwise. Further, information provided in this report should not be construed as a recommendation to purchase or sell any particular security.
21
FPA FLEXIBLE FIXED INCOME FUND
HISTORICAL PERFORMANCE
(Unaudited)
Change in Value of a $10,000 Investment in FPA Flexible Fixed Income Fund vs Bloomberg Barclays U.S. Universal Bond Index and Consumer Price Index + 200 Basis Points from December 31, 2018 to December 31, 2020

Past performance is not indicative of future performance. The Bloomberg Barclays U.S. Universal Bond Index represents the union of the following Bloomberg Barclays' indices: U.S. Aggregate Index, U.S. High-Yield Corporate Index,144A Index, Eurodollar Index, Emerging Markets Index and non-ERISA portion of the CMBS Index. Municipal debt, private placements, and non-dollar-denominated issues are excluded from the Universal Index. The only constituent of the index that includes floating-rate debt is the Emerging Markets Index. The CPI + 200 Basis Points index is created by adding 2% to the annual percentage change in the Consumer Price Index ("CPI"). The Consumer Price Index is an unmanaged index representing the rate of inflation of U.S. consumer prices as determined by the U.S. Department of Labor Statistics. There can be no guarantee that the CPI or other indexes will reflect the exact level of inflation at any given time. An investor cannot invest directly in an index. The performance of the Fund and of the Averages is computed on a total return basis, which includes reinvestment of all distributions.
Past performance is no guarantee of future results, and current performance may be higher or lower than the performance shown. This data represents past performance, and investors should understand that investment returns and principal values fluctuate, so that when you redeem your investment it may be worth more or less than its original cost. Current month-end performance data can be obtained by visiting the website at www.fpa.com or by calling toll-free, 1-800-982-4372. Information regarding the Fund's expense ratio and redemption fees can be found on page 46.
The Prospectus details the Fund's objective and policies, charges, and other matters of interest to prospective investors. Please read the prospectus carefully before investing. The Prospectus may be obtained by visiting the website at www.fpa.com, by email at crm@fpa.com, toll-free by calling 1-800-982-4372 or by contacting the Fund in writing.
22
FPA FLEXIBLE FIXED INCOME FUND
PORTFOLIO SUMMARY
December 31, 2020
Common Stocks | | | | | 0.2 | % | |
Energy | | | 0.2 | % | | | |
Retailing | | | 0.0 | % | | | |
Rights | | | | | 0.0 | % | |
Bonds & Debentures | | | | | 99.6 | % | |
Asset-Backed Securities | | | 62.8 | % | | | |
U.S. Treasuries | | | 12.8 | % | | | |
Commercial Mortgage-Backed Securities | | | 10.1 | % | | | |
Residential Mortgage-Backed Securities | | | 6.1 | % | | | |
Corporate Bank Debt | | | 4.7 | % | | | |
Corporate Bonds & Notes | | | 3.1 | % | | | |
Short-term Investments | | | | | 1.1 | % | |
Other Assets And Liabilities, Net | | | | | (0.9 | )% | |
Net Assets | | | | | 100.0 | % | |
23
FPA FLEXIBLE FIXED INCOME FUND
PORTFOLIO OF INVESTMENTS
December 31, 2020
COMMON STOCKS | | Shares or
Principal
Amount | | Fair Value | |
ENERGY — 0.2% | |
PHI Group, Inc.(a)(b) | | | 23,814 | | | $ | 214,326 | | |
PHI Group, Inc., Restricted(a)(b) | | | 51,478 | | | | 463,302 | | |
| | | $ | 677,628 | | |
RETAILING — 0.0% | |
Copper Earn Out Trust(a)(b)(c) | | | 7,803 | | | $ | 46,818 | | |
| TOTAL COMMON STOCKS — 0.2% (Cost $615,785) | | $ | 724,446 | | |
RIGHTS — 0.0% | |
MIDSTREAM — OIL & GAS — 0.0% | |
Windstream Rights Offering(a)(b)(c) (Cost $372,781) | | | 11,258 | | | $ | 123,838 | | |
BONDS & DEBENTURES | |
COMMERCIAL MORTGAGE-BACKED SECURITIES — 10.1% | |
AGENCY — 0.8% | |
Federal Home Loan Mortgage Corp. K042 A1 — 2.267% 6/25/2024 | | $ | 196,888 | | | $ | 203,282 | | |
Federal Home Loan Mortgage Corp. K024 A2 — 2.573% 9/25/2022 | | | 93,000 | | | | 95,698 | | |
Government National Mortgage Association 2014-169 A —
2.600% 11/16/2042 | | | 589,921 | | | | 596,912 | | |
Government National Mortgage Association 2015-21 A —
2.600% 11/16/2042 | | | 166,233 | | | | 166,901 | | |
Government National Mortgage Association 2014-148 A —
2.650% 11/16/2043 | | | 666,712 | | | | 674,499 | | |
Government National Mortgage Association 2014-138 A —
2.700% 1/16/2044 | | | 7,578 | | | | 7,587 | | |
Government National Mortgage Association 2019-39 A —
3.100% 5/16/2059 | | | 961,520 | | | | 987,891 | | |
| | | $ | 2,732,770 | | |
AGENCY STRIPPED — 0.6% | |
Government National Mortgage Association 2015-19 IO, VRN —
0.604% 1/16/2057(d) | | $ | 2,833,133 | | | $ | 98,039 | | |
Government National Mortgage Association 2015-7 IO, VRN —
0.666% 1/16/2057(d) | | | 3,271,572 | | | | 118,266 | | |
Government National Mortgage Association 2020-42 IO, VRN —
1.057% 3/16/2062(d) | | | 5,717,395 | | | | 496,566 | | |
Government National Mortgage Association 2020-75, VRN —
1.116% 2/16/2062(d) | | | 8,132,682 | | | | 700,942 | | |
24
FPA FLEXIBLE FIXED INCOME FUND
PORTFOLIO OF INVESTMENTS (Continued)
December 31, 2020
BONDS & DEBENTURES — Continued | | Principal
Amount | | Fair Value | |
Government National Mortgage Association 2020-71, VRN — 1.206%
1/16/2062(d) | | $ | 4,610,791 | | | $ | 409,941 | | |
Government National Mortgage Association 2020-43, VRN — 1.274%
11/16/2061(d) | | | 3,163,843 | | | | 276,513 | | |
| | | $ | 2,100,267 | | |
NON-AGENCY — 8.7% | |
A10 Bridge Asset Financing LLC 2020-C A — 2.021% 8/15/2040(e) | | $ | 846,455 | | | $ | 846,398 | | |
Citigroup Commercial Mortgage Trust 2012-GC8 AAB — 2.608%
9/10/2045 | | | 395,294 | | | | 400,108 | | |
Citigroup Commercial Mortgage Trust 2013-GC11 AAB — 2.690%
4/10/2046 | | | 50,371 | | | | 51,399 | | |
Citigroup Commercial Mortgage Trust 2013-GC11 A3 — 2.815%
4/10/2046 | | | 744,604 | | | | 770,494 | | |
Citigroup Commercial Mortgage Trust 2012-GC8 A4 — 3.024%
9/10/2045 | | | 290,149 | | | | 296,512 | | |
Citigroup Commercial Mortgage Trust 2013-GC11 A4 — 3.093%
4/10/2046 | | | 90,000 | | | | 94,242 | | |
Citigroup Commercial Mortgage Trust 2013-GC11 AS — 3.422%
4/10/2046 | | | 800,000 | | | | 840,996 | | |
COMM 2013-CCRE7 Mortgage Trust 2013-CR7 A4 — 3.213%
3/10/2046 | | | 1,153,226 | | | | 1,213,874 | | |
COMM Mortgage Trust 2012-CR5 A3 — 2.540% 12/10/2045 | | | 874,342 | | | | 895,832 | | |
COMM Mortgage Trust 2013-LC6 A4 — 2.941% 1/10/2046 | | | 1,359,220 | | | | 1,410,692 | | |
COMM Mortgage Trust 2012-CR2 A4 — 3.147% 8/15/2045 | | | 297,000 | | | | 305,979 | | |
COMM Mortgage Trust 2015-CR22 A3 — 3.207% 3/10/2048 | | | 179,000 | | | | 182,193 | | |
CoreVest American Finance Trust 2018-1 A — 3.804% 6/15/2051(e) | | | 562,041 | | | | 586,495 | | |
DBUBS Mortgage Trust 2011-LC3A AM, VRN —
5.335% 8/10/2044(d)(e) | | | 500,000 | | | | 504,011 | | |
GS Mortgage Securities Corp. II 2015-GC30 AAB — 3.120% 5/10/2050 | | | 438,395 | | | | 458,075 | | |
GS Mortgage Securities Corp. Trust 2012-ALOH A —
3.551% 4/10/2034(e) | | | 988,000 | | | | 992,187 | | |
Hawaii Hotel Trust I 2019-MAUI C, 1M USD LIBOR + 1.650%,
FRN — 1.809% 5/15/2038(d)(e) | | | 1,384,000 | | | | 1,326,939 | | |
JP Morgan Chase Commercial Mortgage Securities Trust 2016-WIKI A —
2.798% 10/5/2031(e) | | | 602,000 | | | | 598,891 | | |
JP Morgan Chase Commercial Mortgage Securities Trust 2012-C8 A3 —
2.829% 10/15/2045 | | | 468,258 | | | | 480,938 | | |
JP Morgan Chase Commercial Mortgage Securities Trust 2012-C8 AS —
3.424% 10/15/2045(e) | | | 687,000 | | | | 706,072 | | |
25
FPA FLEXIBLE FIXED INCOME FUND
PORTFOLIO OF INVESTMENTS (Continued)
December 31, 2020
BONDS & DEBENTURES — Continued | | Principal
Amount | | Fair Value | |
JP Morgan Chase Commercial Mortgage Securities Trust C
2012-HSBC A — 3.093% 7/5/2032(e) | | $ | 917,190 | | | $ | 937,332 | | |
JPMBB Commercial Mortgage Securities Trust 2015-C30 ASB —
3.559% 7/15/2048 | | | 857,930 | | | | 905,350 | | |
Morgan Stanley Bank of America Merrill Lynch Trust 2012-C6 A4 —
2.858% 11/15/2045 | | | 224,501 | | | | 230,759 | | |
RETL P 2019-RVP B, 1M USD LIBOR + 1.55%, FRN —
1.709% 3/15/2036(d)(e) | | | 3,649 | | | | 3,577 | | |
UBS Commercial Mortgage Trust 2012-C1 AAB — 3.002% 5/10/2045 | | | 44,633 | | | | 44,970 | | |
UBS Commercial Mortgage Trust 2012-C1 A3 — 3.400% 5/10/2045 | | | 2,093,948 | | | | 2,131,298 | | |
UBS-Barclays Commercial Mortgage Trust 2012-C4 A5 — 2.850%
12/10/2045 | | | 1,697,000 | | | | 1,756,213 | | |
UBS-Barclays Commercial Mortgage Trust 2012-C3 A4 — 3.091%
8/10/2049 | | | 1,357,900 | | | | 1,402,331 | | |
VCC Trust 2020-MC1 A, VRN — 4.500% 6/25/2045(d)(e) | | | 718,272 | | | | 708,897 | | |
VNDO E Mortgage Trust 2012-6AVE A — 2.996% 11/15/2030(e) | | | 109,000 | | | | 112,200 | | |
VNDO E Mortgage Trust 2012-6AVE B — 3.298% 11/15/2030(e) | | | 1,250,000 | | | | 1,291,612 | | |
Wells Fargo Commercial Mortgage Trust 2012-LC5 A3 — 2.918%
10/15/2045 | | | 1,179,532 | | | | 1,215,073 | | |
Wells Fargo Commercial Mortgage Trust 2014-LC18 ASB — 3.244%
12/15/2047 | | | 800,570 | | | | 840,354 | | |
WFRBS Commercial Mortgage Trust 2012-C8 AFL,
1M USD LIBOR + 1.000%, FRN — 1.153% 8/15/2045(d)(e) | | | 824,426 | | | | 826,633 | | |
WFRBS Commercial Mortgage Trust 2013-C11 A3 — 2.695%
3/15/2045 | | | 163,402 | | | | 167,469 | | |
WFRBS Commercial Mortgage Trust 2012-C9 A3 — 2.870% 11/15/2045 | | | 1,345,775 | | | | 1,381,667 | | |
WFRBS Commercial Mortgage Trust 2012-C8 A3 — 3.001% 8/15/2045 | | | 1,254,000 | | | | 1,286,621 | | |
WFRBS Commercial Mortgage Trust 2013-C11 A4 — 3.037% 3/15/2045 | | | 300,000 | | | | 310,829 | | |
WFRBS Commercial Mortgage Trust 2013-C11 A5 — 3.071% 3/15/2045 | | | 246,000 | | | | 255,939 | | |
| | | $ | 28,771,451 | | |
TOTAL COMMERICAL MORTGAGE-BACKED SECURITIES
(Cost $33,293,789) | | $ | 33,604,488 | | |
RESIDENTIAL MORTGAGE-BACKED SECURITIES — 6.1% | |
AGENCY COLLATERALIZED MORTGAGE OBLIGATION — 1.1% | |
Federal Home Loan Mortgage Corp. 4336 WV — 3.000% 10/15/2025 | | $ | 568,476 | | | $ | 581,274 | | |
Federal Home Loan Mortgage Corp. 4235 QE — 3.000% 8/15/2031 | | | 150,077 | | | | 154,194 | | |
Federal Home Loan Mortgage Corp. 4162 P — 3.000% 2/15/2033 | | | 551,937 | | | | 582,893 | | |
26
FPA FLEXIBLE FIXED INCOME FUND
PORTFOLIO OF INVESTMENTS (Continued)
December 31, 2020
BONDS & DEBENTURES — Continued | | Principal
Amount | | Fair Value | |
Federal National Mortgage Association 2012-47 HA — 1.500%
5/25/2027 | | $ | 212,080 | | | $ | 214,537 | | |
Federal National Mortgage Association 2013-35 QB — 1.750%
2/25/2043 | | | 943,826 | | | | 959,643 | | |
Federal National Mortgage Association 4220 EH — 2.500% 6/15/2028 | | | 174,055 | | | | 179,001 | | |
Federal National Mortgage Association 4387 VA — 3.000% 2/15/2026 | | | 752,632 | | | | 775,417 | | |
Federal National Mortgage Association 2012-144 PD — 3.500%
4/25/2042 | | | 143,465 | | | | 153,461 | | |
| | | $ | 3,600,420 | | |
AGENCY POOL FIXED RATE — 0.1% | |
Federal National Mortgage Association AL1576 — 4.000% 3/1/2027 | | $ | 214,864 | | | $ | 228,671 | | |
Federal National Mortgage Association FM1102 — 4.000% 3/1/2031 | | | 91,850 | | | | 97,494 | | |
| | | $ | 326,165 | | |
AGENCY STRIPPED — 0.1% | |
Federal National Mortgage Association 284 1 — 0.000% 7/25/2027(f) | | $ | 237,247 | | | $ | 227,045 | | |
NON-AGENCY — 0.5% | |
PRPM 2020-3 LLC — 2.857% 9/25/2025(e)(g) | | $ | 1,614,273 | | | $ | 1,622,732 | | |
NON-AGENCY COLLATERALIZED MORTGAGE OBLIGATION — 4.3% | |
Bravo Residential Funding Trust 2019-1 A1C — 3.500% 3/25/2058(e) | | $ | 669,194 | | | $ | 690,480 | | |
CFMT LLC 2020-HB4 A, VRN — 0.946% 12/26/2030(c)(d)(e) | | | 626,000 | | | | 625,374 | | |
CIM Trust 2017-7 A, VRN — 3.000% 4/25/2057(d)(e) | | | 95,645 | | | | 97,664 | | |
CIM Trust 2018-R3 A1, VRN — 5.000% 12/25/2057(d)(e) | | | 615,371 | | | | 653,219 | | |
Finance of America HECM Buyout 2020-HB2 A, VRN — 1.710%
7/25/2030(d)(e) | | | 1,442,136 | | | | 1,451,855 | | |
Finance of America HECM Buyout 2020-HB1 M1, VRN — 2.105%
2/25/2030(d)(e) | | | 198,000 | | | | 198,717 | | |
Nationstar HECM Loan Trust 2020-1A A1, VRN — 1.269%
9/25/2030(d)(e) | | | 2,265,008 | | | | 2,267,295 | | |
Nationstar HECM Loan Trust 2020-1A M1, VRN — 1.472%
9/25/2030(d)(e) | | | 673,000 | | | | 673,951 | | |
Nationstar HECM Loan Trust 2020-1A M2, VRN — 1.972%
9/25/2030(d)(e) | | | 602,000 | | | | 602,793 | | |
Nationstar HECM Loan Trust 2019-2A M1, VRN — 2.359%
11/25/2029(c)(d)(e) | | | 130,000 | | | | 130,949 | | |
Nationstar HECM Loan Trust 2019-1A M1, VRN — 2.664%
6/25/2029(d)(e) | | | 1,008,000 | | | | 1,011,788 | | |
PRPM LLC 2020-5 A1 — 3.104% 11/25/2025(e)(g) | | | 1,645,338 | | | | 1,655,195 | | |
27
FPA FLEXIBLE FIXED INCOME FUND
PORTFOLIO OF INVESTMENTS (Continued)
December 31, 2020
BONDS & DEBENTURES — Continued | | Principal
Amount | | Fair Value | |
RCO V Mortgage LLC 2020-1 A1 — 3.105% 9/25/2025(e)(g) | | $ | 1,458,631 | | | $ | 1,455,245 | | |
Towd Point Mortgage Trust 2017-2 A1, VRN — 2.750% 4/25/2057(d)(e) | | | 1,069,481 | | | | 1,093,597 | | |
Towd Point Mortgage Trust 2018-1 A1, VRN — 3.000% 1/25/2058(d)(e) | | | 54,708 | | | | 56,659 | | |
Towd Point Mortgage Trust 2018-2 A1, VRN — 3.250% 3/25/2058(d)(e) | | | 1,011,242 | | | | 1,057,471 | | |
Towd Point Mortgage Trust 2018-5 A1A, VRN — 3.250%
7/25/2058(d)(e) | | | 122,758 | | | | 128,501 | | |
VCAT LLC 2020-NPL1 A1 — 3.671% 8/25/2050(e)(g) | | | 639,155 | | | | 639,147 | | |
| | | $ | 14,489,900 | | |
TOTAL RESIDENTIAL MORTGAGE-BACKED SECURITIES
(Cost $20,024,455) | | $ | 20,266,262 | | |
ASSET-BACKED SECURITIES — 62.8% | |
AUTO — 15.6% | |
Ally Auto Receivables Trust 2019-1 A4 — 3.020% 4/15/2024 | | $ | 252,000 | | | $ | 262,155 | | |
American Credit Acceptance Receivables Trust 2020-4 B — 0.850%
12/13/2024(e) | | | 760,000 | | | | 759,366 | | |
American Credit Acceptance Receivables Trust 2020-4 C — 1.310%
12/14/2026(e) | | | 1,246,000 | | | | 1,250,451 | | |
American Credit Acceptance Receivables Trust 2020-3 C — 1.850%
6/15/2026(e) | | | 1,033,000 | | | | 1,047,647 | | |
American Credit Acceptance Receivables Trust 2020-2 B — 2.480%
9/13/2024(e) | | | 340,000 | | | | 347,905 | | |
CarMax Auto Owner Trust 2019-3 A3 — 2.180% 8/15/2024 | | | 919,000 | | | | 941,630 | | |
CarMax Auto Owner Trust 2017-3 C — 2.720% 5/15/2023 | | | 240,000 | | | | 243,623 | | |
CarMax Auto Owner Trust 2019-1 A4 — 3.260% 8/15/2024 | | | 200,000 | | | | 210,504 | | |
CarMax Auto Owner Trust 2018-3 A4 — 3.270% 3/15/2024 | | | 600,000 | | | | 627,111 | | |
CarMax Auto Owner Trust 2019-1 B — 3.450% 11/15/2024 | | | 107,000 | | | | 112,219 | | |
CarMax Auto Owner Trust 2018-4 B — 3.670% 5/15/2024 | | | 95,000 | | | | 100,509 | | |
DT Auto Owner Trust 2020-3A B — 0.910% 12/16/2024(e) | | | 395,000 | | | | 396,849 | | |
DT Auto Owner Trust 2020-3A C — 1.470% 6/15/2026(e) | | | 2,884,000 | | | | 2,895,802 | | |
DT Auto Owner Trust 2020-2A B — 2.080% 3/16/2026(e) | | | 361,000 | | | | 367,818 | | |
Exeter Automobile Receivables Trust 2020-3A B — 0.790% 9/16/2024 | | | 565,000 | | | | 566,301 | | |
Exeter Automobile Receivables Trust 2020-3A C — 1.320% 7/15/2025 | | | 2,884,000 | | | | 2,893,786 | | |
Exeter Automobile Receivables Trust 2020-2A B — 2.080% 7/15/2024(e) | | | 590,000 | | | | 601,799 | | |
Ford Credit Auto Lease Trust 2020-B C — 1.700% 2/15/2025 | | | 348,000 | | | | 349,859 | | |
Ford Credit Auto Lease Trust 2020-A A4 — 1.880% 5/15/2023 | | | 320,000 | | | | 326,460 | | |
Ford Credit Auto Lease Trust 2020-A B — 2.050% 6/15/2023 | | | 1,500,000 | | | | 1,525,405 | | |
Ford Credit Auto Lease Trust 2019-B B — 2.360% 1/15/2023 | | | 494,000 | | | | 501,685 | | |
28
FPA FLEXIBLE FIXED INCOME FUND
PORTFOLIO OF INVESTMENTS (Continued)
December 31, 2020
BONDS & DEBENTURES — Continued | | Principal
Amount | | Fair Value | |
Ford Credit Auto Owner Trust 2019-A A4 — 2.850% 8/15/2024 | | $ | 676,000 | | | $ | 705,569 | | |
GM Financial Automobile Leasing Trust 2020-3 C — 1.110% 10/21/2024 | | | 1,000,000 | | | | 999,697 | | |
GM Financial Automobile Leasing Trust 2020-1 B — 1.840% 12/20/2023 | | | 255,000 | | | | 258,548 | | |
GM Financial Automobile Leasing Trust 2019-2 B — 2.890% 3/20/2023 | | | 1,000,000 | | | | 1,016,729 | | |
Honda Auto Receivables Owner Trust 2020-2 A2 — 0.740% 11/15/2022 | | | 220,823 | | | | 221,320 | | |
Honda Auto Receivables Owner Trust 2020-1 A3 — 1.610% 4/22/2024 | | | 1,007,000 | | | | 1,027,794 | | |
Honda Auto Receivables Owner Trust 2019-3 A3 — 1.780% 8/15/2023 | | | 523,000 | | | | 531,486 | | |
Honda Auto Receivables Owner Trust 2019-2 A4 — 2.540% 3/21/2025 | | | 1,000,000 | | | | 1,038,079 | | |
Honda Auto Receivables Owner Trust 2019-1 A4 — 2.900% 6/18/2024 | | | 355,000 | | | | 368,575 | | |
Honda Auto Receivables Owner Trust 2018-4 A4 — 3.300% 7/15/2025 | | | 155,000 | | | | 160,661 | | |
Hyundai Auto Lease Securitization Trust 2020-A A4 —
2.000% 12/15/2023(e) | | | 778,000 | | | | 795,971 | | |
Hyundai Auto Lease Securitization Trust 2020-A B —
2.120% 5/15/2024(e) | | | 2,556,000 | | | | 2,619,023 | | |
Hyundai Auto Lease Securitization Trust 2019-A B —
3.250% 10/16/2023(e) | | | 334,000 | | | | 336,460 | | |
Hyundai Auto Receivables Trust 2019-A A4 — 2.710% 5/15/2025 | | | 1,000,000 | | | | 1,038,908 | | |
Legal Fee Funding — 8.000% 7/20/2036(e) | | | 246,731 | | | | 254,485 | | |
Mercedes-Benz Auto Lease Trust 2020-A A4 — 1.880% 9/15/2025 | | | 1,438,000 | | | | 1,470,597 | | |
Nissan Auto Lease Trust 2020-A A4 — 1.880% 4/15/2025 | | | 1,442,000 | | | | 1,471,083 | | |
Nissan Auto Receivables Owner Trust 2019-C A3 — 1.930% 7/15/2024 | | | 575,000 | | | | 586,975 | | |
Nissan Auto Receivables Owner Trust 2019-A A4 — 3.000% 9/15/2025 | | | 252,000 | | | | 264,014 | | |
Nissan Auto Receivables Owner Trust 2018-B A4 — 3.160% 12/16/2024 | | | 435,000 | | | | 451,687 | | |
Prestige Auto Receivables Trust 2020-1A B — 0.770% 10/15/2024(e) | | | 476,000 | | | | 475,693 | | |
Prestige Auto Receivables Trust 2019-1A B — 2.530% 1/16/2024(e) | | | 263,000 | | | | 266,103 | | |
Santander Consumer Auto Receivables Trust 2020-AA B —
2.260% 12/15/2025(e) | | | 688,000 | | | | 710,995 | | |
Santander Drive Auto Receivables Trust 2020-2 B — 0.960% 11/15/2024 | | | 2,770,000 | | | | 2,786,916 | | |
Santander Drive Auto Receivables Trust 2020-3 C — 1.120% 1/15/2026 | | | 1,240,000 | | | | 1,249,114 | | |
Toyota Auto Receivables Owner Trust 2020-A A3 — 1.660% 5/15/2024 | | | 1,063,000 | | | | 1,083,799 | | |
Toyota Auto Receivables Owner Trust 2019-C A3 — 1.910% 9/15/2023 | | | 238,000 | | | | 241,819 | | |
Toyota Auto Receivables Owner Trust 2019-A A4 — 3.000% 5/15/2024 | | | 252,000 | | | | 263,891 | | |
Volkswagen Auto Lease Trust 2019-A A4 — 2.020% 8/20/2024 | | | 259,000 | | | | 264,202 | | |
Volkswagen Auto Loan Enhanced Trust 2020-1 A2A — 0.930%
12/20/2022 | | | 1,345,452 | | | | 1,349,374 | | |
Westlake Automobile Receivables Trust 2020-3A B — 0.780%
11/17/2025(e) | | | 934,000 | | | | 933,797 | | |
Westlake Automobile Receivables Trust 2020-3A C — 1.240%
11/17/2025(e) | | | 438,000 | | | | 440,056 | | |
29
FPA FLEXIBLE FIXED INCOME FUND
PORTFOLIO OF INVESTMENTS (Continued)
December 31, 2020
BONDS & DEBENTURES — Continued | | Principal
Amount | | Fair Value | |
Westlake Automobile Receivables Trust 2020-2A B — 1.320%
7/15/2025(e) | | $ | 1,674,000 | | | $ | 1,693,586 | | |
Westlake Automobile Receivables Trust 2020-2A C — 2.010%
7/15/2025(e) | | | 530,000 | | | | 539,437 | | |
Westlake Automobile Receivables Trust 2020-1A C — 2.520%
4/15/2025(e) | | | 1,543,000 | | | | 1,584,160 | | |
World Omni Auto Receivables Trust 2019-C A3 — 1.960% 12/16/2024 | | | 650,000 | | | | 662,737 | | |
World Omni Auto Receivables Trust 2017-B B — 2.370% 5/15/2024 | | | 350,000 | | | | 351,122 | | |
World Omni Auto Receivables Trust 2018-A B — 2.890% 4/15/2025 | | | 1,022,000 | | | | 1,030,019 | | |
World Omni Auto Receivables Trust 2018-B A4 — 3.030% 6/17/2024 | | | 1,013,000 | | | | 1,043,686 | | |
World Omni Auto Receivables Trust 2019-A A3 — 3.040% 5/15/2024 | | | 774,427 | | | | 789,552 | | |
World Omni Auto Receivables Trust 2019-A B — 3.340% 6/16/2025 | | | 252,000 | | | | 264,147 | | |
World Omni Automobile Lease Securitization Trust 2020-A A3 —
1.700% 1/17/2023 | | | 792,000 | | | | 805,738 | | |
World Omni Automobile Lease Securitization Trust 2019-B A4 —
2.070% 2/18/2025 | | | 338,000 | | | | 344,403 | | |
World Omni Automobile Lease Securitization Trust 2019-B B —
2.130% 2/18/2025 | | | 190,000 | | | | 193,379 | | |
World Omni Automobile Lease Securitization Trust 2019-A B —
3.240% 7/15/2024 | | | 529,000 | | | | 540,673 | | |
| | | $ | 51,854,943 | | |
COLLATERALIZED LOAN OBLIGATION — 21.8% | |
AGL CLO 6 Ltd. 2020-6A E, 3M USD LIBOR + 7.480%, FRN —
7.731% 7/20/2031(d)(e) | | $ | 500,000 | | | $ | 501,413 | | |
AGL CLO 7 Ltd. 2020-7A A1, 3M USD LIBOR + 1.800%, FRN —
2.050% 7/15/2031(d)(e) | | | 2,030,000 | | | | 2,037,028 | | |
AGL CLO 7 Ltd. 2020-7A E, 3M USD LIBOR + 7.480%, FRN —
7.730% 7/15/2031(d)(e) | | | 1,715,000 | | | | 1,719,781 | | |
Battalion CLO 18 Ltd. 2020-18A A1, 3M USD LIBOR + 1.800%, FRN —
2.035% 10/15/2032(d)(e) | | | 1,052,000 | | | | 1,056,842 | | |
Carlyle Global Market Strategies CLO Ltd. 2015-2A A1R, 3M USD
LIBOR + 0.780%, FRN — 0.997% 4/27/2027(d)(e) | | | 405,607 | | | | 403,923 | | |
Cayuga Park CLO Ltd. 2020 1A E, 3M USD LIBOR + 7.330%, FRN —
7.562% 7/17/2031(d)(e) | | | 1,066,000 | | | | 1,071,664 | | |
Cerberus Corporate Credit Solutions Fund, FRN — 1.767%
10/15/2030(d)(e) | | | 1,247,000 | | | | 1,225,165 | | |
Cerberus Loan Funding XXI LP 2017-4A A, 3M USD LIBOR + 1.45%,
FRN — 1.687% 10/15/2027(d)(e) | | | 695,623 | | | | 695,386 | | |
Cerberus Loan Funding XXIII L.P. 2018-2A A, 3M USD LIBOR + 1.00%,
FRN — 1.237% 4/15/2028(d)(e) | | | 526,974 | | | | 524,901 | | |
30
FPA FLEXIBLE FIXED INCOME FUND
PORTFOLIO OF INVESTMENTS (Continued)
December 31, 2020
BONDS & DEBENTURES — Continued | | Principal
Amount | | Fair Value | |
Cerberus Loan Funding XXIX L.P. 2020-2A A, 3M USD LIBOR + 1.900%,
FRN — 2.133% 10/15/2032(d)(e) | | $ | 2,733,000 | | | $ | 2,737,255 | | |
Cerberus Loan Funding XXVIII L.P. 2020-1A A, 3M USD LIBOR +
1.850%, FRN — 2.060% 10/15/2031(d)(e) | | | 2,412,000 | | | | 2,414,858 | | |
Cerberus Loan Funding XXVIII L.P. 2020-1A D, 3M USD LIBOR +
5.300%, FRN — 5.510% 10/15/2031(d)(e) | | | 2,236,000 | | | | 2,239,428 | | |
CIFC Funding Ltd. 2020-2A E, 3M USD LIBOR + 7.635%, FRN —
7.918% 8/24/2032(d)(e) | | | 1,595,000 | | | | 1,610,956 | | |
Elm Trust 2020-4A A2 — 2.286% 10/20/2029(e) | | | 330,000 | | | | 330,970 | | |
Elm Trust 2020-3A A2 — 2.954% 8/20/2029(e) | | | 362,000 | | | | 365,417 | | |
Elm Trust 2020-4A B — 3.866% 10/20/2029(e) | | | 985,000 | | | | 987,754 | | |
Elm Trust 2020-3A B — 4.481% 8/20/2029(e) | | | 897,000 | | | | 903,294 | | |
Fortress Credit Opportunities, 3M USD LIBOR + 2.25%, FRN —
2.487% 7/15/2028(d)(e) | | | 1,564,722 | | | | 1,570,350 | | |
Fortress Credit Opportunities FCO 2020 13A C 144A, 3M USD LIBOR +
4.00%, FRN — 4.237% 7/15/2028(d)(e) | | | 711,000 | | | | 713,472 | | |
Fortress Credit Opportunities FCO 2020 13A D 144A, 3M USD LIBOR +
4.05%, FRN — 4.287% 7/15/2028(d)(e) | | | 1,422,000 | | | | 1,383,656 | | |
Fortress Credit Opportunities IX CLO Ltd. 2017-9A A1T, 3M USD
LIBOR + 1.55%, FRN — 1.771% 11/15/2029(d)(e) | | | 2,193,000 | | | | 2,190,816 | | |
Fortress Credit Opportunities IX CLO Ltd. 2017-9A AFR2 — 2.530%
11/15/2029(e) | | | 1,069,000 | | | | 1,073,009 | | |
Fortress Credit Opportunities VII CLO Ltd. 2016-7A BR, 3M USD
LIBOR + 2.45%, FRN — 2.667% 12/15/2028(d)(e) | | | 329,000 | | | | 324,781 | | |
Fortress Credit Opportunities VII CLO Ltd. 2016-7I E,
3M USD LIBOR + 7.49%, FRN — 7.707% 12/15/2028(d) | | | 246,000 | | | | 227,455 | | |
Golub Capital BDC CLO 4 LLC 2020-1A A1, 3M USD LIBOR + 2.350%,
FRN — 2.554% 11/5/2032(d)(e) | | | 2,002,000 | | | | 2,013,019 | | |
Golub Capital Partners ABS Funding Ltd. 2020-1A A2 — 3.208%
1/22/2029(e) | | | 2,267,000 | | | | 2,268,063 | | |
Golub Capital Partners ABS Funding Ltd. 2020-1A B — 4.496%
1/22/2029(e) | | | 1,404,000 | | | | 1,404,658 | | |
Golub Capital Partners CLO Ltd. 2020-49A A1, 3M USD LIBOR + 2.50%,
FRN — 2.779% 7/20/2032(d)(e) | | | 777,000 | | | | 780,434 | | |
Golub Capital Partners TALF LLC 2020-2A A, 3M USD LIBOR + 1.850%,
FRN — 2.021% 2/5/2030(d)(e) | | | 1,234,000 | | | | 1,234,784 | | |
Hercules Capital Funding Trust 2018-1A A — 4.605% 11/22/2027(e) | | | 1,075,069 | | | | 1,084,706 | | |
Hercules Capital Funding Trust 2019-1A A — 4.703% 2/20/2028(e) | | | 1,171,000 | | | | 1,181,639 | | |
Ivy Hill Middle Market Credit Fund IX Ltd. 9A CR, FRN — 2.568%
1/18/2030(d)(e) | | | 2,092,000 | | | | 1,978,001 | | |
31
FPA FLEXIBLE FIXED INCOME FUND
PORTFOLIO OF INVESTMENTS (Continued)
December 31, 2020
BONDS & DEBENTURES — Continued | | Principal
Amount | | Fair Value | |
Ivy Hill Middle Market Credit Fund X Ltd. 10A A1AR,
3M USD LIBOR + 1.25%, FRN — 1.468% 7/18/2030(d)(e) | | $ | 227,000 | | | $ | 225,075 | | |
Jamestown CLO VII Ltd. 2015-7A A1R, 3M USD LIBOR + 0.83%,
FRN — 1.045% 7/25/2027(d)(e) | | | 261,966 | | | | 261,343 | | |
Kayne CLO 8 Ltd. 2020-8A E, 3M USD LIBOR + 7.150%,
FRN — 7.395% 7/15/2031(d)(e) | | | 2,091,000 | | | | 2,104,081 | | |
KKR CLO 17 Ltd. 17 A, 3M USD LIBOR + 1.340%, FRN —
1.577% 4/15/2029(d)(e) | | | 750,000 | | | | 750,089 | | |
KKR CLO 18 Ltd. 18 A, 3M USD LIBOR + 1.270%, FRN —
1.488% 7/18/2030(d)(e) | | | 800,000 | | | | 800,002 | | |
Madison Park Funding XIII Ltd. 2014-13A AR2,
3M USD LIBOR + 0.950%, FRN — 1.168% 4/19/2030(d)(e) | | | 550,000 | | | | 547,572 | | |
Ocean Trails CLO IX 2020-9A A1, 3M USD LIBOR + 1.870%,
FRN — 2.153% 10/15/2029(d)(e) | | | 250,000 | | | | 250,883 | | |
Ocean Trails CLO X 2020-10A A1, 3M USD LIBOR + 1.550%,
FRN — 1.744% 10/15/2031(d)(e) | | | 1,857,000 | | | | 1,860,216 | | |
Octagon Investment Partners 46 Ltd. 2020-2A E,
3M USD LIBOR + 7.860%, FRN — 8.109% 7/15/2033(d)(e) | | | 2,097,000 | | | | 2,106,900 | | |
Octagon Investment Partners 48 Ltd. 2020-3A E,
3M USD LIBOR + 7.660%, FRN — 7.892% 10/20/2031(d)(e) | | | 300,000 | | | | 301,562 | | |
Owl Rock CLO III Ltd. 2020-3A A1L, 3M USD LIBOR + 1.800%,
FRN — 2.018% 4/20/2032(d)(e) | | | 800,000 | | | | 799,996 | | |
Owl Rock Technology Financing LLC 2020-1A A,
3M USD LIBOR + 2.950%, FRN — 0.000% 1/15/2031(d)(e) | | | 2,408,000 | | | | 2,403,391 | | |
Palmer Square CLO Ltd. 2019-1A A1, 3M USD LIBOR + 1.05%,
FRN — 1.268% 4/20/2027(d)(e) | | | 331,589 | | | | 331,603 | | |
Silvermore CLO Ltd. 2014-1A A1R, 3M USD LIBOR + 1.170%
FRN — 1.391% 5/15/2026(d)(e) | | | 114,729 | | | | 114,558 | | |
Sound Point CLO XII Ltd. 2016-2A AR, 3M USD LIBOR + 1.29%,
FRN — 1.508% 10/20/2028(d)(e) | | | 514,000 | | | | 514,042 | | |
Sound Point CLO XVII Ltd. 2017-3A A1A, 3M USD LIBOR + 1.220%,
FRN — 1.438% 10/20/2030(d)(e) | | | 533,000 | | | | 532,644 | | |
Sound Point CLO XVII Ltd. 2017-3A A1B, 3M USD LIBOR + 1.220%,
FRN — 1.438% 10/20/2030(d)(e) | | | 533,000 | | | | 532,644 | | |
Stratus CLO Ltd. 2020-2A D, 3M USD LIBOR + 3.650%,
FRN — 3.918% 10/15/2028(d)(e) | | | 1,182,000 | | | | 1,185,922 | | |
Symphony CLO XII Ltd. 2013-12A AR, 3M USD LIBOR + 1.030%,
FRN — 1.267% 10/15/2025(d)(e) | | | 489,791 | | | | 489,806 | | |
Symphony CLO XIX Ltd. 2018-19A A, 3M USD LIBOR + 0.960%,
FRN — 1.190% 4/16/2031(d)(e) | | | 800,000 | | | | 796,162 | | |
32
FPA FLEXIBLE FIXED INCOME FUND
PORTFOLIO OF INVESTMENTS (Continued)
December 31, 2020
BONDS & DEBENTURES — Continued | | Principal
Amount | | Fair Value | |
Telos CLO Ltd. 2014-5A A1R, 3M USD LIBOR + 0.95%,
FRN — 1.168% 4/17/2028(d)(e) | | $ | 188,700 | | | $ | 187,691 | | |
Telos CLO Ltd. 2013-3A AR, 3M USD LIBOR + 1.300% FRN —
1.518% 7/17/2026(d)(e) | | | 262,082 | | | | 261,978 | | |
Trinitas CLO V Ltd. 2016-5A AR, 3M USD LIBOR + 1.39%,
FRN — 1.605% 10/25/2028(d)(e) | | | 626,969 | | | | 626,224 | | |
VCO CLO LLC 2018-1A A, 3M USD LIBOR + 1.50%,
FRN — 1.718% 7/20/2030(d)(e) | | | 223,125 | | | | 223,124 | | |
Venture 35 CLO Ltd. 2018-35A AS, 3M USD LIBOR + 1.65%,
FRN — 1.366% 10/22/2031(d)(e) | | | 155,000 | | | | 155,039 | | |
Venture CDO Ltd., 3M USD LIBOR + 0.88%, FRN —
1.117% 4/15/2027(d)(e) | | | 1,055,024 | | | | 1,050,775 | | |
Venture XXIX CLO Ltd. 2017-29A A, 3M USD LIBOR + 1.280%,
FRN — 1.501% 9/7/2030(d)(e) | | | 676,000 | | | | 676,032 | | |
Venture Xxv Clo Ltd. 2016-25A ARR, 3M USD LIBOR + 1.020%,
FRN — 1.000% 4/20/2029(d)(e) | | | 577,000 | | | | 577,000 | | |
Venture XXV CLO Ltd. 2016-25A AR, 3M USD LIBOR + 1.230%,
FRN — 2.365% 4/20/2029(d)(e) | | | 577,000 | | | | 577,002 | | |
Vericrest Opportunity Loan Transferee LLC 2014-NPL4 A1 —
3.967% 4/25/2050(e)(g) | | | 459,843 | | | | 464,216 | | |
Voya CLO Ltd. 2020-2A E, 3M USD LIBOR + 7.850%, FRN —
8.035% 7/19/2031(d)(e) | | | 2,304,000 | | | | 2,314,833 | | |
Wellfleet CLO Ltd. 2016-1A AR, 3M USD LIBOR + 0.910%
FRN — 1.128% 4/20/2028(d)(e) | | | 313,417 | | | | 312,259 | | |
Whitebox CLO II Ltd. 2020-2A A1, 3M USD LIBOR + 1.750%,
FRN — 1.992% 10/24/2031(d)(e) | | | 2,586,000 | | | | 2,599,111 | | |
Woodmont Trust, 3M USD LIBOR + 2.00%, FRN —
2.218% 10/18/2032(d)(e) | | | 2,799,000 | | | | 2,806,336 | | |
Zais CLO 14 Ltd. 2020-14A A1A, 3M USD LIBOR + 1.400%,
FRN — 1.637% 4/15/2032(d)(e) | | | 1,394,000 | | | | 1,394,117 | | |
Zais CLO 5 Ltd. 2016-2A A1, 3M USD LIBOR + 1.530%,
FRN — 1.767% 10/15/2028(d)(e) | | | 488,192 | | | | 488,197 | | |
Zais CLO 7 LLC 2017-2A A, 3M USD LIBOR + 1.290%,
FRN — 1.527% 4/15/2030(d)(e) | | | 620,583 | | | | 618,596 | | |
| | | $ | 72,495,899 | | |
CREDIT CARD — 1.9% | |
American Express Credit Account Master Trust 2019-2 A —
2.670% 11/15/2024 | | $ | 268,000 | | | $ | 276,290 | | |
American Express Credit Account Master Trust 2019-2 B —
2.860% 11/15/2024 | | | 1,160,000 | | | | 1,195,306 | | |
33
FPA FLEXIBLE FIXED INCOME FUND
PORTFOLIO OF INVESTMENTS (Continued)
December 31, 2020
BONDS & DEBENTURES — Continued | | Principal
Amount | | Fair Value | |
American Express Credit Account Master Trust 2019-1 A —
2.870% 10/15/2024 | | $ | 1,545,000 | | | $ | 1,593,616 | | |
Barclays Dryrock Issuance Trust 2019-1 A — 1.960% 5/15/2025 | | | 869,000 | | | | 891,527 | | |
Capital One Multi-Asset Execution Trust 2019-A2 A2 —
1.720% 8/15/2024 | | | 49,000 | | | | 50,149 | | |
Discover Card Execution Note Trust 2019-A1 A1 — 3.040% 7/15/2024 | | | 174,000 | | | | 178,483 | | |
Synchrony Card Funding LLC 2019-A2 A — 2.340% 6/15/2025 | | | 1,144,000 | | | | 1,174,718 | | |
Synchrony Card Funding LLC 2019-A1 A — 2.950% 3/15/2025 | | | 989,000 | | | | 1,020,784 | | |
| | | $ | 6,380,873 | | |
EQUIPMENT — 13.3% | |
ARI Fleet Lease Trust 2018-B A3 — 3.430% 8/16/2027(e) | | $ | 380,000 | | | $ | 391,405 | | |
Avis Budget Rental Car Funding AESOP LLC 2017-2A A —
2.970% 3/20/2024(e) | | | 268,000 | | | | 276,770 | | |
Avis Budget Rental Car Funding AESOP LLC 2017-1A A —
3.070% 9/20/2023(e) | | | 2,192,000 | | | | 2,262,019 | | |
Avis Budget Rental Car Funding AESOP LLC 2019-1A A —
3.450% 3/20/2023(e) | | | 254,000 | | | | 260,638 | | |
Chesapeake Funding II LLC 2017-2A A1 — 1.990% 5/15/2029(e) | | | 38,686 | | | | 38,640 | | |
Chesapeake Funding II LLC 2020-1A C — 2.140% 8/16/2032(e) | | | 368,000 | | | | 369,191 | | |
Chesapeake Funding II LLC 2017-4A C — 2.760% 11/15/2029(e) | | | 286,000 | | | | 287,988 | | |
Chesapeake Funding II LLC 2018-1A A1 — 3.040% 4/15/2030(e) | | | 1,019,452 | | | | 1,029,804 | | |
Chesapeake Funding II LLC — 3.110% 4/15/2031(e) | | | 676,000 | | | | 691,548 | | |
Chesapeake Funding II LLC 2018-2A A1 — 3.230% 8/15/2030(e) | | | 1,173,016 | | | | 1,187,877 | | |
CNH Equipment Trust 2020-A A2 — 1.080% 7/17/2023 | | | 636,441 | | | | 637,946 | | |
Coinstar Funding LLC Series 2017-1A A2 — 5.216% 4/25/2047(e) | | | 2,569,795 | | | | 2,490,540 | | |
Daimler Trucks Retail Trust 2020-1 A2 — 1.140% 4/15/2022 | | | 130,717 | | | | 130,945 | | |
Daimler Trucks Retail Trust 2019-1 A4 — 2.790% 5/15/2025(e) | | | 1,000,000 | | | | 1,027,750 | | |
Dell Equipment Finance Trust 2019-2 A3 — 1.910% 10/22/2024(e) | | | 1,470,000 | | | | 1,494,475 | | |
Dell Equipment Finance Trust 2020-2 D — 1.920% 3/23/2026(e) | | | 745,000 | | | | 744,634 | | |
Dell Equipment Finance Trust 2019-2 B — 2.060% 10/22/2024(e) | | | 1,073,000 | | | | 1,093,460 | | |
Dell Equipment Finance Trust 2019-1 A2 — 2.780% 8/23/2021(e) | | | 29,626 | | | | 29,656 | | |
Dell Equipment Finance Trust 2019-1 B — 2.940% 3/22/2024(e) | | | 1,294,000 | | | | 1,321,769 | | |
Dell Equipment Finance Trust 2018-2 A3 — 3.370% 10/22/2023(e) | | | 332,360 | | | | 334,364 | | |
Dell Equipment Finance Trust 2018-2 C — 3.720% 10/22/2023(e) | | | 1,777,000 | | | | 1,811,941 | | |
Dell Equipment Finance Trust 2020-1 C — 4.260% 6/22/2023(e) | | | 664,000 | | | | 700,841 | | |
Enterprise Fleet Financing LLC 2020-1 A2 — 1.780% 12/22/2025(e) | | | 522,777 | | | | 531,110 | | |
Enterprise Fleet Financing LLC 2019-2 A2 — 2.290% 2/20/2025(e) | | | 584,756 | | | | 594,107 | | |
Enterprise Fleet Financing LLC 2019-1 A2 — 2.980% 10/20/2024(e) | | | 814,440 | | | | 825,377 | | |
Enterprise Fleet Financing LLC 2018-1 A3 — 3.100% 10/20/2023(e) | | | 2,195,000 | | | | 2,222,976 | | |
Enterprise Fleet Financing LLC 2018-2 A2 — 3.140% 2/20/2024(e) | | | 529,785 | | | | 533,133 | | |
34
FPA FLEXIBLE FIXED INCOME FUND
PORTFOLIO OF INVESTMENTS (Continued)
December 31, 2020
BONDS & DEBENTURES — Continued | | Principal
Amount | | Fair Value | |
Enterprise Fleet Financing LLC 2018-3 A2 — 3.380% 5/20/2024(e) | | $ | 217,796 | | | $ | 220,319 | | |
Great American Auto Leasing, Inc. 2019-1 B — 3.370% 2/18/2025(e) | | | 252,000 | | | | 258,097 | | |
GreatAmerica Leasing Receivables Funding LLC 2019-1 A4 —
3.210% 2/18/2025(e) | | | 250,000 | | | | 260,971 | | |
GreatAmerica Leasing Receivables Funding LLC Series 2020-1 A3 —
1.760% 8/15/2023(e) | | | 369,000 | | | | 375,460 | | |
GreatAmerica Leasing Receivables Funding LLC Series 2018-1 B —
2.990% 6/17/2024(e) | | | 255,000 | | | | 259,815 | | |
HPEFS Equipment Trust 2020-1A A2 — 1.730% 2/20/2030(e) | | | 102,324 | | | | 102,908 | | |
HPEFS Equipment Trust 2020-1A B — 1.890% 2/20/2030(e) | | | 175,000 | | | | 177,615 | | |
HPEFS Equipment Trust 2020-2A C — 2.000% 7/22/2030(e) | | | 711,000 | | | | 718,798 | | |
HPEFS Equipment Trust 2020-1A C — 2.030% 2/20/2030(e) | | | 815,000 | | | | 829,711 | | |
HPEFS Equipment Trust 2019-1A B — 2.320% 9/20/2029(e) | | | 100,000 | | | | 101,275 | | |
John Deere Owner Trust 2019 A A4 — 3.000% 1/15/2026 | | | 532,000 | | | | 553,136 | | |
Kubota Credit Owner Trust 2020-1A A2 — 1.920% 12/15/2022(e) | | | 580,176 | | | | 584,913 | | |
Kubota Credit Owner Trust 2018-1A A4 — 3.210% 1/15/2025(e) | | | 730,000 | | | | 749,806 | | |
Navistar Financial Dealer Note Master Trust 2020-1 A,
1M USD LIBOR + 0.950%, FRN — 1.098% 7/25/2025(d)(e) | | | 1,572,000 | | | | 1,571,183 | | |
Navistar Financial Dealer Note Master Trust 2020-1 C,
1M USD LIBOR + 2.150%, FRN — 2.298% 7/25/2025(d)(e) | | | 1,063,000 | | | | 1,065,733 | | |
NextGear Floorplan Master Owner Trust 2019-2A A2 —
2.070% 10/15/2024(e) | | | 971,000 | | | | 997,506 | | |
NextGear Floorplan Master Owner Trust 2019-1A A2 —
3.210% 2/15/2024(e) | | | 934,000 | | | | 963,085 | | |
NextGear Floorplan Master Owner Trust 2018-2A A2 —
3.690% 10/15/2023(e) | | | 412,000 | | | | 422,788 | | |
Verizon Owner Trust 2019 A A1A — 2.930% 9/20/2023 | | | 847,000 | | | | 863,529 | | |
Verizon Owner Trust 2019 A B — 3.020% 9/20/2023 | | | 532,000 | | | | 549,669 | | |
Verizon Owner Trust 2019-C A1A — 1.940% 4/22/2024 | | | 1,532,000 | | | | 1,564,443 | | |
Verizon Owner Trust 2019-C B — 2.060% 4/22/2024 | | | 925,000 | | | | 949,401 | | |
Verizon Owner Trust 2019-B A1A — 2.330% 12/20/2023 | | | 141,000 | | | | 143,810 | | |
Verizon Owner Trust 2019-B B — 2.400% 12/20/2023 | | | 1,006,000 | | | | 1,034,960 | | |
Verizon Owner Trust 2018-1A C — 3.200% 9/20/2022(e) | | | 1,400,000 | | | | 1,421,303 | | |
Verizon Owner Trust 2018-A B — 3.380% 4/20/2023 | | | 556,000 | | | | 571,166 | | |
Volvo Financial Equipment LLC Series 2019-2A A2 —
2.020% 8/15/2022(e) | | | 1,037,343 | | | | 1,042,616 | | |
Volvo Financial Equipment LLC Series 2019-1A A3 —
3.000% 3/15/2023(e) | | | 1,206,000 | | | | 1,223,987 | | |
Volvo Financial Equipment LLC Series 2019-1A A4 —
3.130% 11/15/2023(e) | | | 250,000 | | | | 258,287 | | |
35
FPA FLEXIBLE FIXED INCOME FUND
PORTFOLIO OF INVESTMENTS (Continued)
December 31, 2020
BONDS & DEBENTURES — Continued | | Principal
Amount | | Fair Value | |
Wheels SPV 2 LLC 2019-1A A3 — 2.350% 5/22/2028(e) | | $ | 1,033,000 | | | $ | 1,058,427 | | |
| | | $ | 44,215,621 | | |
OTHER — 10.2% | |
ABPCI Direct Lending Fund ABS I Ltd. 2020-1A A — 3.199%
12/20/2030(e) | | $ | 1,284,000 | | | $ | 1,284,000 | | |
ABPCI Direct Lending Fund ABS I Ltd. 2020-1A B — 4.935%
12/20/2030(e) | | | 3,273,000 | | | | 3,292,160 | | |
ABPCI Direct Lending Fund CLO X L.P. 2020-10A A1A, 3M USD
LIBOR + 1.950%, FRN — 2.197% 1/20/2032(d)(e) | | | 678,000 | | | | 678,338 | | |
ABPCI Direct Lending Fund IX LLC 2020-9A A1, 3M USD LIBOR +
1.950%, FRN — 2.190% 11/18/2031(d)(e) | | | 881,000 | | | | 880,984 | | |
CARS-DB4 L.P. 2020-1A A1 — 2.690% 2/15/2050(e) | | | 304,511 | | | | 313,052 | | |
Conn's Receivables Funding LLC 2020-A B — 4.270% 6/16/2025(e) | | | 883,000 | | | | 882,655 | | |
InSite Issuer LLC 2020-1A C — 4.213% 9/15/2050(e) | | | 298,000 | | | | 305,855 | | |
InSite Issuer LLC 2016-1A C — 6.414% 11/15/2046(e) | | | 1,000,000 | | | | 1,074,941 | | |
LCM XIII L.P. 13A ARR, 3M USD LIBOR + 1.140%, FRN — 1.358%
7/19/2027(d)(e) | | | 800,000 | | | | 798,550 | | |
Magnetite XVI Ltd. 2015-16A AR, 3M USD LIBOR + 0.800%,
FRN — 1.018% 1/18/2028(d)(e) | | | 301,908 | | | | 300,776 | | |
MelTel Land Funding LLC 2019-1A C — 6.070% 4/15/2049(e) | | | 312,000 | | | | 325,736 | | |
MF1 Ltd. 2020-FL4 A, 1M USD LIBOR + 1.700%, FRN — 1.859%
11/15/2035(d)(e) | | | 585,000 | | | | 585,501 | | |
New Residential Advance Receivables Trust Advance Receivables
Backed Notes 2020-APT1 AT1 — 1.035% 12/16/2052(e) | | | 734,000 | | | | 733,965 | | |
New Residential Mortgage LLC 2018-FNT1 A — 3.610% 5/25/2023(e) | | | 611,108 | | | | 611,234 | | |
NRZ Advance Receivables Trust 2015-ON1 2020-T3 AT3 — 1.317%
10/15/2052(e) | | | 847,000 | | | | 847,034 | | |
NRZ Advance Receivables Trust 2015-ON1 2020-T2 AT2 — 1.475%
9/15/2053(e) | | | 2,720,000 | | | | 2,725,989 | | |
Ocwen Master Advance Receivables Trust 2020-T1 AT1 — 1.278%
8/15/2052(e) | | | 2,793,000 | | | | 2,792,846 | | |
OHA Credit Funding 6 Ltd. 2020-6A E, 3M USD LIBOR + 7.330%,
FRN — 7.582% 7/20/2031(d)(e) | | | 1,418,000 | | | | 1,425,471 | | |
Palmer Square Loan Funding Ltd. 2018-4A A1, 3M USD LIBOR +
0.900%, FRN — 1.121% 11/15/2026(d)(e) | | | 133,998 | | | | 133,942 | | |
Parliament Funding II Ltd. 2020-1A A, 3M USD LIBOR + 2.450%,
FRN — 2.764% 8/12/2030(d)(e) | | | 986,000 | | | | 991,947 | | |
PFS Financing Corp. 2020-F A — 0.930% 8/15/2024(e) | | | 2,089,000 | | | | 2,099,200 | | |
PFS Financing Corp. 2020-F B — 1.420% 8/15/2024(e) | | | 130,000 | | | | 129,975 | | |
PFS Financing Corp. 2020-E B — 1.570% 10/15/2025(e) | | | 1,151,000 | | | | 1,156,008 | | |
36
FPA FLEXIBLE FIXED INCOME FUND
PORTFOLIO OF INVESTMENTS (Continued)
December 31, 2020
BONDS & DEBENTURES — Continued | | Principal
Amount | | Fair Value | |
PFS Financing Corp. 2020-A B — 1.770% 6/15/2025(e) | | $ | 2,119,000 | | | $ | 2,132,629 | | |
PFS Financing Corp. 2019-A A2 — 2.860% 4/15/2024(e) | | | 1,676,000 | | | | 1,711,709 | | |
PFS Financing Corp. 2019-A B — 3.130% 4/15/2024(e) | | | 1,000,000 | | | | 1,018,050 | | |
PFS Financing Corp. 2018-F A — 3.520% 10/15/2023(e) | | | 486,000 | | | | 498,035 | | |
SpringCastle America Funding LLC 2020-AA A — 1.970% 9/25/2037(e) | | | 1,908,263 | | | | 1,919,877 | | |
TVEST 2020A LLC 2020-A A — 4.500% 7/15/2032(e) | | | 636,003 | | | | 636,920 | | |
VOLT XCI LLC 2020-NPL7 A1 — 3.105% 11/25/2050(e)(g) | | | 1,414,591 | | | | 1,418,139 | | |
| | | $ | 33,705,518 | | |
| TOTAL ASSET-BACKED SECURITIES (Cost $205,812,641) | | $ | 208,652,854 | | |
CORPORATE BONDS & NOTES — 3.1% | |
COMMUNICATIONS — 0.4% | |
Consolidated Communications, Inc. — 6.500% 10/1/2028(e) | | $ | 1,119,000 | | | $ | 1,200,989 | | |
CONSUMER, CYCLICAL — 1.4% | |
Air Canada 2020-1 Class C Pass Through Trust — 10.500% 7/15/2026(e) | | $ | 1,030,000 | | | $ | 1,086,956 | | |
American Airlines 2016-1 Class A Pass Through Trust —
4.100% 1/15/2028 | | | 844,166 | | | | 781,999 | | |
American Airlines 2016-2 Class A Pass Through Trust —
3.650% 6/15/2028 | | | 1,019,161 | | | | 943,197 | | |
Aramark Services, Inc. — 6.375% 5/1/2025(e) | | | 316,000 | | | | 336,935 | | |
Carnival Corp. — 11.500% 4/1/2023(e) | | | 512,000 | | | | 592,036 | | |
CD&R Smokey Buyer, Inc. — 6.750% 7/15/2025(e) | | | 177,000 | | | | 189,169 | | |
Royal Caribbean Cruises Ltd. — 11.500% 6/1/2025(e) | | | 594,000 | | | | 692,931 | | |
| | | $ | 4,623,223 | | |
CONSUMER, NON-CYCLICAL — 0.6% | |
Cimpress plc — 7.000% 6/15/2026(e) | | $ | 335,000 | | | $ | 352,169 | | |
StoneMor Partners L.P. / Cornerstone Family Services of West Virginia
Subsidiary PIK — 11.500% 6/30/2024 | | | 1,739,811 | | | | 1,726,762 | | |
| | | $ | 2,078,931 | | |
ENERGY — 0.2% | |
Natural Resource Partners LP / NRP Finance Corp. — 9.125% 6/30/2025(e) | | $ | 831,000 | | | $ | 760,365 | | |
FINANCIAL — 0.5% | |
Golub Capital BDC, Inc. — 3.375% 4/15/2024 | | $ | 1,487,000 | | | $ | 1,510,749 | | |
| TOTAL CORPORATE BONDS & NOTES (Cost $9,329,689) | | $ | 10,174,257 | | |
37
FPA FLEXIBLE FIXED INCOME FUND
PORTFOLIO OF INVESTMENTS (Continued)
December 31, 2020
BONDS & DEBENTURES — Continued | | Principal
Amount | | Fair Value | |
CORPORATE BANK DEBT — 4.7% | |
ABG Intermediate Holding 2 LLC, 3M USD LIBOR + 5.250 —
6.250% 9/27/2024(a)(d) | | $ | 584,000 | | | $ | 584,000 | | |
ABG Intermediate Holding 2 LLC First Lien,
3M USD LIBOR + 3.500% — 4.500% 9/27/2024(a)(d) | | | 960,820 | | | | 953,210 | | |
Asurion LLC Second Lien, 1M USD LIBOR + 6.5000% —
6.647% 8/4/2025(a)(d) | | | 1,007,000 | | | | 1,013,717 | | |
BJ Services, Inc., 7.000% — 8.500% 1/3/2023(a)(c) | | | 133,400 | | | | 126,730 | | |
Capstone Acquisition Holdings, Inc. 2020 Delayed Draw Term Loan,
1M USD LIBOR + 4.750% 11/12/2027(a)(i) | | | 240,160 | | | | 1,802 | | |
Capstone Acquisition Holdings, Inc. 2020 Term Loan,
1M USD LIBOR + 4.750% — 5.750% 11/12/2027(a)(d) | | | 1,339,840 | | | | 1,349,889 | | |
Cincinnati Bell, Inc., 1M USD LIBOR + 3.250% — 4.250% 10/2/2024(a)(d) | | | 1,124,496 | | | | 1,123,293 | | |
Delta Air Lines, Inc. 2020 Term Loan B, 3M USD LIBOR + 4.750% —
4.964% 4/29/2023(a)(d) | | | 332,330 | | | | 337,039 | | |
Frontier Communications Corp., 1M USD LIBOR + 0.000% —
5.875% 10/15/2027(a)(d)(e) | | | 398,000 | | | | 430,835 | | |
Frontier Communications Corp. 2020 Dip Exit Term Loan,
1M USD LIBOR + 2.750% — 5.750% 10/8/2021(a)(d) | | | 1,127,000 | | | | 1,124,182 | | |
Hanjin International Corp., 1M USD LIBOR + 5.000% —
2.768% 12/23/2022(a)(c)(d) | | | 1,559,000 | | | | 1,551,205 | | |
JC Penney Corp., Inc., 3M USD LIBOR + 4.250% —
5.250% 6/23/2023(a)(d) | | | 480,181 | | | | 32,412 | | |
JC Penney Corp., Inc., 1M USD LIBOR + 9.5000% —
9.500% 4/1/2021(a)(d) | | | 749,709 | | | | 824,680 | | |
Logix Holding Co. LLC, 1M USD LIBOR + 5.750% —
6.750% 12/22/2024(a)(d) | | | 331,620 | | | | 301,775 | | |
Mediaco Holding, Inc. Class A 6.40000% — 8.400% 11/25/2024(a)(c) | | | 1,214,502 | | | | 1,129,487 | | |
McDermott Super Senior Exit LC — 6/30/2024(a)(c)(i) | | | 640,000 | | | | (60,800 | ) | |
Packers Holdings LLC 2020 Incremental Term Loan —
4.750% 12/4/2024(a) | | | 292,000 | | | | 291,635 | | |
Packers Holdings, LLC First Lien, 1M USD LIBOR + 3.000% —
4.000% 12/4/2024(a)(d) | | | 1,087,000 | | | | 1,081,565 | | |
Polyconcept North America Holdings, Inc., 3M USD LIBOR + 4.500% —
5.500% 8/16/2023(a)(d) | | | 749,122 | | | | 704,174 | | |
Solera Holdings, Inc. USD Term Loan B, 1M USD LIBOR + 2.750% —
2.897% 3/3/2023(a)(d) | | | 1,043,775 | | | | 1,035,080 | | |
38
FPA FLEXIBLE FIXED INCOME FUND
PORTFOLIO OF INVESTMENTS (Continued)
December 31, 2020
BONDS & DEBENTURES — Continued | | Principal
Amount | | Fair Value | |
Tech Data Corp. ABL Term Loan, 1M USD LIBOR + 3.500% —
3.645% 6/30/2025(a)(d) | | $ | 749,123 | | | $ | 753,100 | | |
Windstream Services LLC, 1M USD LIBOR + 6.250% —
7.250% 9/21/2027(a)(d) | | | 845,744 | | | | 825,658 | | |
| TOTAL CORPORATE BANK DEBT (Cost $15,528,349) | | $ | 15,514,668 | | |
U.S. TREASURIES — 12.8% | |
U.S. Treasury Bills — 0.015% 1/5/2021(f) | | $ | 1,173,000 | | | $ | 1,172,996 | | |
U.S. Treasury Bills — 0.016% 1/12/2021(f) | | | 9,553,000 | | | | 9,552,817 | | |
U.S. Treasury Bills — 0.020% 1/26/2021(f) | | | 9,685,000 | | | | 9,684,660 | | |
U.S. Treasury Bills — 0.118% 2/2/2021(f) | | | 9,676,000 | | | | 9,675,299 | | |
U.S. Treasury Bills — 0.022% 2/9/2021(f) | | | 9,802,000 | | | | 9,801,386 | | |
U.S. Treasury Bills — 0.022% 2/23/2021(f) | | | 2,716,000 | | | | 2,715,751 | | |
| TOTAL U.S. TREASURIES (Cost $42,602,751) | | $ | 42,602,909 | | |
| TOTAL BONDS & DEBENTURES — 99.6% (Cost $326,591,674) | | $ | 330,815,438 | | |
| TOTAL INVESTMENT SECURITIES — 99.8% (Cost $327,580,240) | | $ | 331,663,722 | | |
SHORT-TERM INVESTMENTS — 1.1% | |
State Street Bank Repurchase Agreement — 0.00% 1/4/2021
(Dated 12/31/2020, repurchase price of $3,603,000, collateralized by
$3,676,400 principal amount U.S. Treasury Bill — 0.00% 2021,
fair value $3,675,128)(h) | | $ | 3,603,000 | | | $ | 3,603,000 | | |
| TOTAL SHORT-TERM INVESTMENTS (Cost $3,603,000) | | $ | 3,603,000 | | |
| TOTAL INVESTMENTS — 100.9% (Cost $331,183,240) | | $ | 335,266,722 | | |
| Other assets and liabilities, net — (0.9)% | | | (2,890,112 | ) | |
NET ASSETS — 100.0% | | $ | 332,376,610 | | |
(a) Restricted securities. These restricted securities constituted 4.92% of total net assets at December 31, 2020, most of which are considered liquid by the Adviser. These securities are not registered and may not be sold to the public. There are legal and/or contractual restrictions on resale. The Fund does not have the right to
39
FPA FLEXIBLE FIXED INCOME FUND
PORTFOLIO OF INVESTMENTS (Continued)
December 31, 2020
demand that such securities be registered. The values of these securities are determined by valuations provided by pricing services, brokers, dealers, market makers, or in good faith under policies adopted by authority of the Fund's Board of Trustees.
(b) Non-income producing security.
(c) Investments categorized as a significant unobservable input (Level 3) (See Note 6 of the Notes to Financial Statements).
(d) Variable/Floating Rate Security — The rate shown is based on the latest available information as of December 31, 2020. For Corporate Bank Debt, the rate shown may represent a weighted average interest rate. Certain variable rate securities are not based on a published rate and spread but are determined by the issuer or agent and are based on current market conditions. These securities do not indicate a reference rate and spread in their description.
(e) Security exempt from registration under Rule 144A of the Securities Act of 1933. These securities may be resold in transactions exempt from registration, typically only to qualified institutional buyers. Unless otherwise indicated, these securities are not considered to be illiquid.
(f) Zero coupon bond. Coupon amount represents effective yield to maturity.
(g) Step Coupon — Coupon rate increases in increments to maturity. Rate disclosed is as of December 31, 2020.
(h) Security pledged as collateral (See Note 7 of the Notes to Financial Statements).
(i) All or a portion of this holding is subject to unfunded loan commitments. The stated interest rate reflects the weighted average of the reference rate and spread for the funded portion, if any, and the commitment fees on the portion of the loan that is unfunded. See Note 8.
40
FPA FLEXIBLE FIXED INCOME FUND
PORTFOLIO OF INVESTMENTS — RESTRICTED SECURITIES
December 31, 2020
Issuer | | Acquisition
Date(s) | | Cost | | Fair Value | | Fair
Value as a %
of Net Assets | |
ABG Intermediate Holding 2 LLC,
3M USD LIBOR + 5.250 —
6.250% 9/27/2024 | | 07/15/2020 | | $ | 570,949 | | | $ | 584,000 | | | | 0.18 | % | |
ABG Intermediate Holding 2 LLC
First Lien, 3M USD LIBOR +
3.500% — 4.500% 9/27/2024
| | 03/06/2020, 03/12/2020,
03/20/2020 | | | 871,680 | | | | 953,210 | | | | 0.29 | % | |
Asurion LLC Second Lien,
1M USD LIBOR + 6.5000% —
6.647% 8/4/2025 | | 09/25/2020, 11/02/2020 | | | 1,008,869 | | | | 1,013,717 | | | | 0.30 | % | |
BJ Services, Inc., 7.000% —
8.500% 1/3/2023 | | 12/31/2019 | | | 132,549 | | | | 126,730 | | | | 0.04% | | |
Capstone Acquisition Holdings,
Inc. 2020 Delayed Draw Term
Loan, 1M USD LIBOR +
4.750% 11/12/2027 | | 11/12/2020 | | | (1,181 | ) | | | 1,802 | | | | 0.00 | % | |
Capstone Acquisition Holdings,
Inc. 2020 Term Loan,
1M USD LIBOR + 4.750% —
5.750% 11/12/2027 | | 11/12/2020 | | | 1,326,662 | | | | 1,349,889 | | | | 0.40 | % | |
Cincinnati Bell, Inc.,
1M USD LIBOR + 3.250% —
4.250% 10/2/2024 | | 03/24/2020, 03/16/2020 | | | 1,063,769 | | | | 1,123,293 | | | | 0.34 | % | |
Copper Earn Out Trust | | 12/07/2020 | | | — | | | | 46,818 | | | | 0.01 | % | |
Delta Air Lines, Inc.
2020 Term Loan B,
3M USD LIBOR + 4.750% —
4.964% 4/29/2023 | | 04/27/2020 | | | 324,301 | | | | 337,039 | | | | 0.10 | % | |
Frontier Communications Corp.,
1M USD LIBOR + 0.000% —
5.875% 10/15/2027 | | 10/01/2020 | | | 398,000 | | | | 430,835 | | | | 0.13 | % | |
Frontier Communications Corp.
2020 Dip Exit Term Loan,
1M USD LIBOR + 2.750% —
5.750% 10/8/2021 | | 10/01/2020, 11/19/2020 | | | 1,116,959 | | | | 1,124,182 | | | | 0.34 | % | |
Hanjin International Corp.,
1M USD LIBOR + 5.000% —
2.768% 12/23/2022 | | 12/23/2020 | | | 1,551,205 | | | | 1,551,205 | | | | 0.47 | % | |
JC Penney Corp., Inc.,
3M USD LIBOR + 4.250% —
5.250% 6/23/2023
| | 02/08/2019, 03/11/2019,
01/17/2019 | | | 372,057 | | | | 32,412 | | | | 0.01 | % | |
41
FPA FLEXIBLE FIXED INCOME FUND
PORTFOLIO OF INVESTMENTS — RESTRICTED SECURITIES (Continued)
December 31, 2020
Issuer | | Acquisition
Date(s) | | Cost | | Fair Value | | Fair
Value as a %
of Net Assets | |
JC Penney Corp., Inc.,
1M USD LIBOR + 9.5000% —
9.500% 4/1/2021 | | 06/08/2020, 07/10/2020 | | $ | 567,793 | | | $ | 824,680 | | | | 0.25 | % | |
Logix Holding Co. LLC,
1M USD LIBOR + 5.750% —
6.750% 12/22/2024 | | 01/09/2019, 06/18/2019 | | | 331,547 | | | | 301,775 | | | | 0.09 | % | |
McDermott Super Senior
Exit LC — 6/30/2024 | | 02/28/2020 | | | (5,271 | ) | | | (60,800 | ) | | | (0.02 | )% | |
Mediaco Holding, Inc.
Class A 6.40000% — 8.400%
11/25/2024
| | 06/18/2019, 06/19/2019,
03/27/2020, 08/27/2020 | | | 1,204,601 | | | | 1,129,487 | | | | 0.34 | % | |
PHI Group, Inc. | | 08/19/2019 | | | 188,003 | | | | 214,326 | | | | 0.06 | % | |
PHI Group, Inc., Restricted | | 08/19/2019 | | | 427,782 | | | | 463,302 | | | | 0.14 | % | |
Packers Holdings LLC 2020
Incremental Term Loan —
4.750% 12/4/2024 | | 11/24/2020 | | | 290,562 | | | | 291,635 | | | | 0.09 | % | |
Packers Holdings, LLC First Lien,
1M USD LIBOR + 3.000% —
4.000% 12/4/2024 | | 10/30/2020, 11/19/2020 | | | 1,072,805 | | | | 1,081,565 | | | | 0.32 | % | |
Polyconcept North America
Holdings, Inc., 3M USD
LIBOR + 4.500% —
5.500% 8/16/2023 | | 11/18/2019 | | | 743,682 | | | | 704,174 | | | | 0.21 | % | |
Solera Holdings, Inc.
USD Term Loan B,
1M USD LIBOR + 2.750% —
2.897% 3/3/2023
| | 11/12/2020, 11/13/2020,
11/19/2020, 11/20/2020 | | | 1,030,894 | | | | 1,035,080 | | | | 0.31 | % | |
Tech Data Corp. ABL Term Loan,
1M USD LIBOR + 3.500% —
3.645% 6/30/2025 | | 06/26/2020, 10/30/2020 | | | 742,741 | | | | 753,100 | | | | 0.23 | % | |
Windstream Rights Offering | | 11/16/2020 | | | 372,781 | | | | 123,838 | | | | 0.04 | % | |
Windstream Services LLC,
1M USD LIBOR + 6.250% —
7.250% 9/21/2027 | | 08/11/2020 | | | 813,175 | | | | 825,658 | | | | 0.25 | % | |
TOTAL RESTRICTED
SECURITIES | | | | $ | 16,516,914 | | | $ | 16,362,952 | | | | 4.92 | % | |
See accompanying Notes to Financial Statements.
42
FPA FLEXIBLE FIXED INCOME FUND
STATEMENT OF ASSETS AND LIABILITIES
December 31, 2020
ASSETS | |
Investment securities — at fair value (identified cost $327,580,240) | | $ | 331,663,722 | | |
Short-term investments — repurchase agreements | | | 3,603,000 | | |
Cash | | | 129,710 | | |
Receivable for: | |
Dividends and interest | | | 1,110,999 | | |
Investment securities sold | | | 351,978 | | |
Capital Stock sold | | | 136,577 | | |
Prepaid expenses and other assets | | | 12,515 | | |
| Total assets | | | 337,008,501 | | |
LIABILITIES | |
Payable for: | |
| Investment securities purchased | | | 4,319,510 | | |
Capital Stock repurchased | | | 153,575 | | |
Advisory fees | | | 43,705 | | |
Accrued expenses and other liabilities | | | 115,101 | | |
| Total liabilities | | | 4,631,891 | | |
NET ASSETS | | $ | 332,376,610 | | |
SUMMARY OF SHAREHOLDERS' EQUITY | |
Capital Stock — no par value; unlimited authorized shares;
32,313,993 outstanding shares | | $ | 32,313,993 | | |
Additional Paid-in Capital | | | 295,486,885 | | |
Distributable earnings | | | 4,575,732 | | |
NET ASSETS | | $ | 332,376,610 | | |
NET ASSET VALUE | |
Offering and redemption price per share | | $ | 10.29 | | |
See accompanying Notes to Financial Statements.
43
FPA FLEXIBLE FIXED INCOME FUND
STATEMENT OF OPERATIONS
For the Year Ended December 31, 2020
INVESTMENT INCOME | |
Interest | | $ | 6,622,593 | | |
EXPENSES | |
Advisory fees | | | 1,093,780 | | |
Transfer agent fees and expenses | | | 160,415 | | |
Filing fees | | | 83,971 | | |
Custodian fees | | | 79,101 | | |
Trustee fees and expenses | | | 73,622 | | |
Legal fees | | | 68,115 | | |
Reports to shareholders | | | 62,332 | | |
Audit and tax services fees | | | 20,000 | | |
Other professional fees | | | 16,224 | | |
Administrative services fees | | | 11,261 | | |
Other | | | 9,395 | | |
Total expenses | | | 1,678,216 | | |
Reimbursement from Adviser | | | (825,067 | ) | |
Net expenses | | | 853,149 | | |
Net investment income | | | 5,769,444 | | |
NET REALIZED AND UNREALIZED GAIN (LOSS) | |
Net realized gain (loss) on: | |
| Investments | | | 1,895,677 | | |
Net change in unrealized appreciation (depreciation) of: | |
| Investments | | | 3,305,098 | | |
Net realized and unrealized gain | | | 5,200,775 | | |
NET INCREASE IN NET ASSETS RESULTING FROM OPERATIONS | | $ | 10,970,219 | | |
See accompanying Notes to Financial Statements.
44
FPA FLEXIBLE FIXED INCOME FUND
STATEMENTS OF CHANGES IN NET ASSETS
| | | Year Ended
December 31, 2020 | | Year Ended
December 31, 2019(1) | |
INCREASE (DECREASE) IN NET ASSETS | |
Operations: | |
Net investment income | | $ | 5,769,444 | | | $ | 2,440,532 | | |
| Net realized gain (loss) | | | 1,895,677 | | | | (67,175 | ) | |
| Net change in unrealized appreciation | | | 3,305,098 | | | | 778,384 | | |
Net increase in net assets resulting from operations | | | 10,970,219 | | | | 3,151,741 | | |
Distributions to shareholders | | | (7,145,741 | ) | | | (2,400,488 | ) | |
Capital Stock transactions: | |
Proceeds from Capital Stock sold | | | 244,623,377 | | | | 143,104,215 | | |
Proceeds from shares issued to shareholders upon reinvestment
of dividends and distributions | | | 5,929,562 | | | | 1,963,802 | | |
Cost of Capital Stock repurchased | | | (62,090,169 | ) | | | (9,080,908 | ) | |
Net increase from Capital Stock transactions | | | 188,462,770 | | | | 135,987,109 | | |
Total change in net assets | | | 192,287,248 | | | | 136,738,362 | | |
NET ASSETS | |
Beginning of Year | | | 140,089,362 | | | | 3,351,000 | | |
End of Year | | $ | 332,376,610 | | | $ | 140,089,362 | | |
CHANGE IN CAPITAL STOCK OUTSTANDING | |
Shares of Capital Stock sold | | | 23,989,390 | | | | 14,199,869 | | |
Shares issued to shareholders upon reinvestment of
dividends and distributions | | | 580,866 | | | | 193,874 | | |
Shares of Capital Stock repurchased | | | (6,090,039 | ) | | | (895,067 | ) | |
Change in Capital Stock outstanding | | | 18,480,217 | | | | 13,498,676 | | |
(1) Operations of the Fund commenced on December 31, 2018, upon which the Fund sold 335,100 shares ofcapital stock worth $3,351,000.
See accompanying Notes to Financial Statements.
45
FPA FLEXIBLE FIXED INCOME FUND
FINANCIAL HIGHLIGHTS
Selected Data for Each Share of Capital Stock Outstanding Throughout Each Year
| | | Year Ended December 31 | |
| | | 2020 | | 2019 | |
Per share operating performance: | |
Net asset value at beginning of year | | $ | 10.13 | | | $ | 10.00 | | |
Income from investment operations: | |
Net investment income(1) | | | 0.27 | | | | 0.28 | | |
Net realized and unrealized gain on investment securities | | | 0.20 | | | | 0.10 | | |
Total from investment operations | | | 0.47 | | | | 0.38 | | |
Less distributions: | |
Dividends from net investment income | | | (0.27 | ) | | | (0.25 | ) | |
Distributions from net realized capital gains | | | (0.04 | ) | | | — | | |
Total distributions | | | (0.31 | ) | | | (0.25 | ) | |
Net asset value at end of year | | $ | 10.29 | | | $ | 10.13 | | |
Total investment return(2) | | | 4.70 | % | | | 3.78 | % | |
Ratios/supplemental data: | |
Net assets, end of year (in $000's) | | $ | 332,377 | | | $ | 140,089 | | |
Ratio of expenses to average net assets | |
Before reimbursement from Adviser | | | 0.77 | % | | | 1.01 | % | |
After reimbursement from Adviser | | | 0.39 | % | | | 0.39 | % | |
Ratio of net investment income to average net assets | |
Before reimbursement from Adviser | | | 2.25 | % | | | 2.11 | % | |
After reimbursement from Adviser | | | 2.63 | % | | | 2.74 | % | |
| Portfolio turnover rate | | | 39 | % | | | 30 | % | |
(1) Per share amount is based on average shares outstanding.
(2) Return is based on net asset value per share, adjusted for reinvestment of distributions, and does not reflect deduction of the sales charge.
See accompanying Notes to Financial Statements.
46
FPA FLEXIBLE FIXED INCOME FUND
NOTES TO FINANCIAL STATEMENTS
December 31, 2020
NOTE 1 — Significant Accounting Policies
FPA Flexible Fixed Income Fund (the "Fund") is registered under the Investment Company Act of 1940, as a diversified, open-end, management investment company. The Fund's primary investment objective is to seek current income and long-term total return. Capital preservation is also a consideration. The Fund qualifies as an investment company pursuant to Financial Accounting Standard Board (FASB) Accounting Standards Codification (ASC) No. 946, Financial Services — Investment Companies. The following is a summary of significant accounting policies consistently followed by the Fund in the preparation of its financial statements.
A. Security Valuation
The Fund's investments are reported at fair value as defined by accounting principles generally accepted in the United States of America, ("U.S. GAAP"). The Fund generally determines its net asset value as of approximately 4:00 p.m. New York time each day the New York Stock Exchange is open. The Fund generally determines its net asset value as of approximately 4:00 p.m. New York time each day the New York Stock Exchange is open. Further discussion of valuation methods, inputs and classifications can be found under Disclosure of Fair Value Measurements.
B. Securities Transactions and Related Investment Income
Securities transactions are accounted for on the date the securities are purchased or sold. Dividend income and distributions to shareholders are recorded on the ex-dividend date. Interest income and expenses are recorded on an accrual basis. Market discounts and premiums on fixed income securities are amortized over the expected life of the securities. Realized gains or losses are based on the specific identification method.
C. Use of Estimates
The preparation of the financial statements in accordance with U.S. GAAP requires management to make estimates and assumptions that affect the amounts reported. Actual results could differ from those estimates. Actual results could differ from those estimates.
D. Recent Accounting Pronouncements
In August 2018, the Financial Accounting Standards Board (FASB) issued Accounting Standards Update (ASU) No. 2018-13, Fair Value Measurement (Topic 820) — Disclosure Framework — Changes to the Disclosure Requirements for Fair Value Measurement. The amendments eliminate certain disclosure requirements for fair value measurements for all entities, requires public entities to disclose certain new information and modifies some disclosure requirements. The new guidance is effective for all entities for fiscal years beginning after December 15, 2019 and for interim periods within those fiscal years. The Fund has adopted the standard for the current fiscal year and the changes are incorporated into the financial statements.
In March 2020, the FASB issued ASU 2020-04, Reference Rate Reform (Topic 848) Facilitation of the Effects of Reference Rate Reform on Financial Reporting, which provides optional expedients and exceptions for applying GAAP to contracts, hedging relationships, and other transaction to ease the potential burden in accounting for (or recognizing the effects of) reference rate reform on financial reporting if certain criteria are met. The guidance is effective from March 12, 2020 through December 31, 2022. As of December 31, 2020, the guidance did not have a material impact on the Financial Statements.
47
FPA FLEXIBLE FIXED INCOME FUND
NOTES TO FINANCIAL STATEMENTS (Continued)
December 31, 2020
NOTE 2 — Risk Considerations
Investing in the Fund may involve certain risks including, but not limited to, those described below.
Market Risk: Because the values of the Fund's investments will fluctuate with market conditions, so will the value of your investment in the Fund. You could lose money on your investment in the Fund or the Fund could underperform other investments.
Interest Rate and Credit Risk: The values of, and the income generated by, most debt securities held by the Fund may be affected by changing interest rates and by changes in the effective maturities and credit rating of these securities. For example, the value of debt securities in the Fund's portfolio generally will decline when interest rates rise and increase when interest rates fall. In addition, falling interest rates may cause an issuer to redeem, call or refinance a security before its stated maturity, which may result in the Fund having to reinvest the proceeds in lower yielding securities.
Mortgage-Backed and Other Asset-Backed Securities Risk: The values of some mortgage-backed and other asset-backed securities may expose the Fund to a lower rate of return upon reinvestment of principal. When interest rates rise, the value of mortgage-related securities generally will decline; however, when interest rates are declining, the value of mortgage related-securities with prepayment features may not increase as much as other fixed income securities. The rate of prepayments on underlying mortgages will affect the price and volatility of a mortgage-related security, and may shorten or extend the effective maturity of the security beyond what was anticipated at the time of purchase. If an unanticipated rate of prepayment on underlying mortgages increases the effective maturity of a mortgage-related security, the volatility of the security can be expected to increase. The value of these securities may also fluctuate in response to the market's perception of the creditworthiness of the issuers. Additionally, although mortgages and mortgage-related securities are generally supported by some form of government or private guarantee and/or insurance, there is no assurance that private guarantors or insurers will meet their obligations.
Stripped Mortgage-Backed Interest Only ("I/O") and Principal Only ("P/O") Securities: Stripped mortgage backed securities are usually structured with two classes that receive different proportions of the interest and principal distributions on a pool of mortgage assets. In certain cases, one class will receive all of the interest payments on the underlying mortgages (the I/O class), while the other class will receive all of the principal payments (the P/O class). The Fund currently has investments in I/O securities. The yield to maturity on I/Os is sensitive to the rate of principal repayments (including prepayments) on the related underlying mortgage assets, and principal payments may have a material effect on yield-to-maturity. If the underlying mortgage assets experience greater than anticipated prepayments of principal, a Fund may not fully recoup its initial investment in I/Os.
Credit Risk: Debt securities are subject to credit risk, meaning that the issuer of the debt security may default or fail to make timely payments of principal or interest. The values of any of the Fund's investments may also decline in response to events affecting the issuer or its credit rating. The lower rated debt securities in which the Fund may invest are considered speculative and are generally subject to greater volatility and risk of loss than investment grade securities, particularly in deteriorating economic conditions. The Fund invests a significant portion of its assets in securities of issuers that hold mortgage-and asset-backed securities and direct investments in securities backed by commercial and residential mortgage loans and other financial assets. The value and related income of these securities is sensitive to changes in economic conditions, including delinquencies and/or defaults. Continuing shifts in the market's perception of credit quality on securities backed by commercial and residential mortgage loans and other financial assets may result in increased volatility of market price and periods of illiquidity that can negatively impact the valuation of certain securities held by the Fund.
48
FPA FLEXIBLE FIXED INCOME FUND
NOTES TO FINANCIAL STATEMENTS (Continued)
December 31, 2020
Repurchase Agreements: Repurchase agreements permit the Fund to maintain liquidity and earn income over periods of time as short as overnight. Repurchase agreements held by the Fund are fully collateralized by U.S. Government securities, or securities issued by U.S. Government agencies, or securities that are within the three highest credit categories assigned by established rating agencies (Aaa, Aa, or A by Moody's or AAA, AA or A by Standard & Poor's) or, if not rated by Moody's or Standard & Poor's, are of equivalent investment quality as determined by the Adviser. Such collateral is in the possession of the Fund's custodian. The collateral is evaluated daily to ensure its fair value equals or exceeds the current fair value of the repurchase agreements including accrued interest. In the event of default on the obligation to repurchase, the Fund has the right to liquidate the collateral and apply the proceeds in satisfaction of the obligation.
The Fund may enter into repurchase agreements, under the terms of a Master Repurchase Agreement ("MRA"). The MRA permits the Fund, under certain circumstances including an event of default (such as bankruptcy or insolvency), to offset payables and/or receivables under the MRA with collateral held and/or posted to the counterparty and create one single net payment due to or from the Fund. However, bankruptcy or insolvency laws of a particular jurisdiction may impose restrictions on or prohibitions against such a right of offset in the event of a MRA counterparty's bankruptcy or insolvency. Pursuant to the terms of the MRA, the Fund receives securities as collateral with a fair value in excess of the repurchase price to be received by the Fund upon the maturity of the repurchase transaction. Upon a bankruptcy or insolvency of the MRA counterparty, the Fund recognizes a liability with respect to such excess collateral to reflect the Fund's obligation under bankruptcy law to return the excess to the counterparty. Repurchase agreements outstanding at the end of the period are listed in the Fund's Portfolio of Investments.
Many countries have experienced outbreaks of infectious illnesses in recent decades, including swine flu, avian influenza, SARS and, more recently, COVID-19. The global outbreak of COVID-19 in early 2020 has resulted in various disruptions, including travel and border restrictions, quarantines, supply chain disruptions, lower consumer demand and general market uncertainty. The effects of COVID-19 have and may continue to adversely affect the global economy, financial markets and the economies of certain nations and individual issuers, any of which may negatively impact the Fund and its holdings. Similar consequences could arise as a result of the spread of other infectious diseases.
NOTE 3 — Purchases and Sales of Investment Securities
Cost of purchases of investment securities (excluding short-term investments) aggregated $269,847,989 for the year ended December 31, 2020. The proceeds and cost of securities sold resulting in net realized gains of $1,843,131 aggregated $75,482,055 and $73,638,924, respectively, for the year ended December 31, 2020.
NOTE 4 — Advisory Fees and Other Affiliated Transactions
Pursuant to an Investment Advisory Agreement (the "Agreement"), advisory fees were paid by the Fund to First Pacific Advisors, LP (the "Adviser"). Under the terms of this Agreement, the Fund pays the Adviser a monthly fee calculated at the annual rate of 0.50% of the Fund's average daily net assets. In addition, the Fund's investment Adviser has contractually agreed to reimburse the Fund for Total Annual Fund Operating Expenses (excluding interest, taxes, brokerage fees and commissions payable by the Fund in connection with the purchase or sale of portfolio securities, and extraordinary expenses, including litigation expenses not incurred in the Fund's ordinary course of business) in excess of 0.39% of the average net assets of the Fund through December 31, 2019, in excess of 0.39% of net assets of the Fund for the year ended December 31, 2020, in excess of 0.49% of net assets of the Fund for the year ended December 31, 2021, and in excess of 0.59% of net assets of the Fund for the year ended December 31, 2022. During the term of the current expense limit agreement, beginning
49
FPA FLEXIBLE FIXED INCOME FUND
NOTES TO FINANCIAL STATEMENTS (Continued)
December 31, 2020
January 1, 2020 and ending December 31, 2022, any expenses reimbursed to the Fund by FPA during any of the previous 36 months may be recouped by FPA, provided the Fund's Total Annual Fund Operating Expenses do not exceed the then-applicable expense limit. Beginning January 1, 2023, any expenses reimbursed to the Fund by FPA during any of the previous 36 months may be recouped by FPA, provided the Fund's Total Annual Fund Operating Expenses do not exceed 0.64% of average net assets of the Fund for any subsequent calendar year, regardless of whether there is a then-effective higher expense limit. This agreement may only be terminated earlier by the Fund's Board of Trustees (the "Board") or upon termination of the Advisory Agreement. As of December 31, 2020, the Adviser may seek recoupment of expense reimbursements in the amount of $825,067 no later than December 31, 2023.
For the year ended December 31, 2020, the Fund paid aggregate fees and expenses of $73,622 to all Trustees who are not affiliated persons of the Adviser. Certain officers of the Fund are also officers of the Adviser.
NOTE 5 — Federal Income Tax
No provision for federal income tax is required because the Fund has elected to be taxed as a "regulated investment company" under the Internal Revenue Code (the "Code") and intends to maintain this qualification and to distribute each year to its shareholders, in accordance with the minimum distribution requirements of the Code, its taxable net investment income and taxable net realized gains on investments.
Distributions paid to shareholders are based on net investment income and net realized gains determined on a tax reporting basis, which may differ from financial reporting. For federal income tax purposes, the Fund had the following components of distributable earnings at December 31, 2020:
Unrealized appreciation | | $ | 4,083,480 | | |
Undistributed ordinary income | | | 498,228 | | |
Capital loss deferrals | | | (5,977 | ) | |
The tax status of distributions paid during the fiscal years ended December 31, 2020 and 2019 were as follows:
| | | 2020 | | 2019 | |
Dividends from ordinary income | | $ | 6,890,731 | | | $ | 2,400,488 | | |
| Distributions from long-term capital gains | | | 255,010 | | | | — | | |
The Fund utilizes the provisions of federal income tax laws that provide for the carryforward of capital losses for prior years, offsetting such losses against any future realized capital gains. The Fund utilized $55,795 of short-term capital losses during the current tax year.
The cost of investment securities held at December 31, 2020 was $331,183,242 for federal income tax purposes. Gross unrealized appreciation and depreciation for all investment at December 31, 2020, for federal income tax purposes was $5,144,465 and $1,060,985, respectively resulting in net unrealized appreciation of $4,083,480. As of and during the year ended December 31, 2020, the Fund did not have any liability for unrecognized tax benefits. The Fund recognizes interest and penalties, if any, related to unrecognized tax benefits
50
FPA FLEXIBLE FIXED INCOME FUND
NOTES TO FINANCIAL STATEMENTS (Continued)
December 31, 2020
as income tax expense in the Statement of Operations. During the year, the Fund did not incur any interest or penalties. The statute of limitations remains open for the last 3 years, once a return is filed. No examinations are in progress at this time.
NOTE 6 — Disclosure of Fair Value Measurements
The Fund uses the following methods and inputs to establish the fair value of its assets and liabilities. Use of particular methods and inputs may vary over time based on availability and relevance as market and economic conditions evolve.
Equity securities are generally valued each day at the official closing price of, or the last reported sale price on, the exchange or market on which such securities principally are traded, as of the close of business on that day.
If there have been no sales that day, equity securities are generally valued at the last available bid price. Securities that are unlisted and fixed-income and convertible securities listed on a national securities exchange for which the over-the-counter ("OTC") market more accurately reflects the securities' value in the judgment of the Fund's officers, are valued at the most recent bid price. However, most fixed income securities are generally valued at prices obtained from pricing vendors and brokers. Vendors value such securities based on one or more of the following inputs: transactions, bids, offers quotations from dealers and trading systems, spreads and other relationships observed in the markets among comparable securities, benchmarks, underlying equity of the issuer, and proprietary pricing models such as cash flows, financial or collateral performance and other reference data (includes prepayments, defaults, collateral, credit enhancements, and interest rate volatility). Short-term corporate notes with maturities of 60 days or less at the time of purchase are valued at amortized cost.
Securities for which representative market quotations are not readily available or are considered unreliable by the Adviser are valued as determined in good faith under procedures adopted by the authority of the Fund's Board of Trustees. Various inputs may be reviewed in order to make a good faith determination of a security's value. These inputs include, but are not limited to, the type and cost of the security; contractual or legal restrictions on resale of the security; relevant financial or business developments of the issuer; actively traded similar or related securities; conversion or exchange rights on the security; related corporate actions; significant events occurring after the close of trading in the security; and changes in overall market conditions. Fair valuations and valuations of investments that are not actively trading involve judgment and may differ materially from valuations of investments that would have been used had greater market activity occurred.
The Fund classifies its assets based on three valuation methodologies. Level 1 values are based on quoted market prices in active markets for identical assets. Level 2 values are based on significant observable market inputs, such as quoted prices for similar assets and quoted prices in inactive markets or other market observable inputs as noted above including spreads, cash flows, financial performance, prepayments, defaults, collateral, credit enhancements, and interest rate volatility. Level 3 values are based on significant unobservable inputs that reflect the Fund's determination of assumptions that market participants might reasonably use in valuing the
51
FPA FLEXIBLE FIXED INCOME FUND
NOTES TO FINANCIAL STATEMENTS (Continued)
December 31, 2020
assets. The valuation levels are not necessarily an indication of the risk associated with investing in those securities. The following table presents the valuation levels of the Fund's investments as of December 31, 2020:
Investments | | Level 1 | | Level 2 | | Level 3 | | Total | |
Common Stocks | |
Energy | | $ | 677,628 | | | | — | | | | — | | | $ | 677,628 | | |
Retailing | | | — | | | | — | | | $ | 46,818 | | | | 46,818 | | |
Rights | |
Midstream — Oil & Gas | | | — | | | | — | | | | 123,838 | | | | 123,838 | | |
Commercial Mortgage-Backed Securities | |
Agency | | | — | | | $ | 2,732,770 | | | | — | | | | 2,732,770 | | |
Agency Stripped | | | — | | | | 2,100,267 | | | | — | | | | 2,100,267 | | |
Non-Agency | | | — | | | | 28,771,451 | | | | — | | | | 28,771,451 | | |
Residential Mortgage-Backed Securities | |
Agency Collateralized Mortgage Obligation | | | — | | | | 3,600,420 | | | | — | | | | 3,600,420 | | |
Agency Pool Fixed Rate | | | — | | | | 326,165 | | | | — | | | | 326,165 | | |
Agency Stripped | | | — | | | | 227,045 | | | | — | | | | 227,045 | | |
Non-Agency | | | — | | | | 1,622,732 | | | | — | | | | 1,622,732 | | |
Non-Agency Collateralized Mortgage Obligation | | | — | | | | 13,733,577 | | | | 756,323 | | | | 14,489,900 | | |
Asset-Backed Securities | |
Auto | | | — | | | | 51,854,943 | | | | — | | | | 51,854,943 | | |
Collateralized Loan Obligation | | | — | | | | 72,495,899 | | | | — | | | | 72,495,899 | | |
Credit Card | | | — | | | | 6,380,873 | | | | — | | | | 6,380,873 | | |
Equipment | | | — | | | | 44,215,621 | | | | — | | | | 44,215,621 | | |
Other | | | — | | | | 33,705,518 | | | | — | | | | 33,705,518 | | |
Corporate Bonds & Notes | | | — | | | | 10,174,257 | | | | — | | | | 10,174,257 | | |
Corporate Bank Debt | | | — | | | | 12,768,046 | | | | 2,746,622 | | | | 15,514,668 | | |
U.S. Treasuries | | | — | | | | 42,602,909 | | | | — | | | | 42,602,909 | | |
Short-Term Investment | | | — | | | | 3,603,000 | | | | — | | | | 3,603,000 | | |
| | | $ | 677,628 | | | $ | 330,915,493 | | | $ | 3,673,601 | | | $ | 335,266,722 | | |
52
FPA FLEXIBLE FIXED INCOME FUND
NOTES TO FINANCIAL STATEMENTS (Continued)
December 31, 2020
The following table summarizes the Fund's Level 3 investment securities and related transactions during the year ended December 31, 2020:
Investments | | Beginning
Value at
December 31,
2019 | | Net
Realized
and
Unrealized
Gains
(Losses)* | | Purchases | | (Sales) | | Gross
Transfers
In/(Out) | | Ending
Value at
December 31,
2020 | | Net Change
in Unrealized
Appreciation
(Depreciation)
related to
Investments
held at
December 31,
2020 | |
Common Stocks | | $ | 489,398 | | | $ | 235,048 | | | | — | | | | — | | | $ | (677,628 | ) | | $ | 46,818 | | | $ | 235,048 | | |
Rights | | | — | | | | (248,943 | ) | | $ | 372,781 | | | | — | | | | — | | | | 123,838 | | | | (248,943 | ) | |
Residential Mortgage-Backed
Securities Non-Agency
Collateralized Mortgage
Obligation | | | 1,204,188 | | | | (813 | ) | | | 1,302,378 | | | $ | (1,880,379 | ) | | | 130,949 | | | | 756,323 | | | | (813 | ) | |
Corporate Bank Debt | | | 2,554,734 | | | | (132,767 | ) | | | 1,550,301 | | | | (1,225,646 | ) | | | — | | | | 2,746,622 | | | | (201,717 | ) | |
| | | $ | 4,248,320 | | | $ | (147,475 | ) | | $ | 3,225,460 | | | $ | (3,106,025 | ) | | $ | (546,679 | ) | | $ | 3,673,601 | | | $ | (216,425 | ) | |
* Net realized and unrealized gains (losses) are included in the related amounts in the statement of operations.
Level 3 Valuation Process: Investments classified within Level 3 of the fair value hierarchy are valued by the Adviser in good faith under procedures adopted by authority of the Fund's Board of Trustees. The Adviser employs various methods to determine fair valuations including regular review of key inputs and assumptions, and review of related market activity, if any. However, there are generally no observable trade activities in these securities. The Adviser reports to the Board of Trustees at their regularly scheduled quarterly meetings, or more often if warranted. The report includes a summary of the results of the process, the key inputs and assumptions noted, and any changes to the inputs and assumptions used. When appropriate, the Adviser will recommend changes to the procedures and process employed. The value determined for an investment using the fair value procedures may differ significantly from the value realized upon the sale of such investment. There were transfers of $677,628 out of Level 3 into Level 2 and $130,949 out of Level 2 into Level 3 during the year ended December 31, 2020. Transfers out of Level 3 were due to change in valuation technique from recent trade activity to vendor priced. Transfers into Level 3 were due to change in valuation technique from vendor priced to third party broker quoted.
The following table summarizes the quantitative inputs and assumptions used for items categorized as items categorized as Level 3 of the fair value hierarchy as of December 31, 2020:
| Financial Assets | | Fair Value at
December 31, 2020 | | Valuation Technique(s) | | Unobservable
Inputs | | Price/Range | | Weighted
Average Price | |
Common Stocks | | $ | 46,818 | | | Pricing Model (a) | | Quotes/Prices | | $6.00 | | $ | 6.00 | | |
Rights | | $ | 123,838 | | | Pricing Model (a) | | Quotes/Prices | | $11.00 | | $ | 11.00 | | |
Residential Mortgage-Backed Securities
Non-Agency Collateralized Mortgage
Obligation | | $ | 756,323 | | | Third-Party Broker Quote (b) | | Quotes/Prices | | $99.90.-$100.73 | | $ | 100.04 | | |
Corporate Bank Debt | | $ | 1,256,217 | | | Pricing Model (c) | | Amortized Cost | | $93.00-$95.00 | | $ | 93.20 | | |
| | | $ | 1,490,405 | | | Pricing Model (a) | | Quotes/Prices | | $90.50-$99.50 | | $ | 99.50 | | |
(a) The Pricing Model technique for Level 3 securities involves recently quoted funding prices of the security.
53
FPA FLEXIBLE FIXED INCOME FUND
NOTES TO FINANCIAL STATEMENTS (Continued)
December 31, 2020
(b) The Third Party Broker Quote technique involves obtaining an independent third-party broker quote for the security.
(c) The Pricing Model technique for Level 3 securities involves external valuation by an independent third party.
NOTE 7 — Collateral Requirements
FASB Accounting Standards Update No. 2011-11, Disclosures about Offsetting Assets and Liabilities, requires disclosures to make financial statements that are prepared under U.S. GAAP more comparable to those prepared under International Financial Reporting Standards. Under this guidance the Fund discloses both gross and net information about instruments and transactions eligible for offset such as instruments and transactions subject to an agreement similar to a master netting arrangement. In addition, the Fund discloses collateral received and posted in connection with master netting agreements or similar arrangements.
The following table presents the Fund's OTC derivative assets, liabilities and master repurchase agreements by counterparty net of amounts available for offset under an ISDA Master agreement or similar agreements and net of the related collateral received or pledged by the Fund as of December 31, 2020:
| | | | | Gross Amounts Not Offset in the
Statement of Assets and Liabilities | | | |
Counterparty | | Gross Assets
(Liabilities)
in the Statement of
Assets and Liabilities | | Security
Collateral
(Received)
Pledged | | Assets (Liabilities)
Available for Offset | | Net Amount
of Assets
(Liabilities)* | |
State Street Bank and
Trust Company: | |
Repurchase Agreement | | $ | 3,603,000 | | | $ | (3,603,000 | )** | | | — | | | | — | | |
* Represents the net amount receivable from the counterparty in the event of default.
** Collateral with a value of $3,675,128 has been received in connection with a master repurchase agreement. Excess of collateral received from the individual master repurchase agreement is not shown for financial reporting purposes.
NOTE 8 — Commitments
As of December 31, 2020 the Fund was liable for the following unfunded commitments:
Asset Class | | Unfunded
Commitment | |
Corporate Bank Debt | | $ | 880,160 | | |
54
FPA FLEXIBLE FIXED INCOME FUND
REPORT OF INDEPENDENT REGISTERED
PUBLIC ACCOUNTING FIRM
TO THE SHAREHOLDERS AND
BOARD OF TRUSTEES OF FPA FLEXIBLE FIXED INCOME FUND
Opinion on the Financial Statements
We have audited the accompanying statement of assets and liabilities of FPA Flexible Fixed Income Fund (the "Fund") (one of the funds constituting the FPA Funds Trust (the "Trust")), including the portfolio of investments, as of December 31, 2020, and the related statement of operations for the year then ended, statement of changes in net assets and financial highlights for each of the two years in the period then ended, and the related notes (collectively referred to as the "financial statements"). In our opinion, the financial statements present fairly, in all material respects, the financial position of the Fund (one of the funds constituting the FPA Funds Trust) at December 31, 2020 and the results of its operations for the year then ended, and the changes in its net assets and financial highlights for each of the two years in the period then ended, in conformity with U.S. generally accepted accounting principles.
Basis for Opinion
These financial statements are the responsibility of the Fund's management. Our responsibility is to express an opinion on the Fund's financial statements based on our audit. We are a public accounting firm registered with the Public Company Accounting Oversight Board (United States) ("PCAOB") and are required to be independent with respect to the Fund in accordance with the U.S. federal securities laws and the applicable rules and regulations of the Securities and Exchange Commission and the PCAOB.
We conducted our audit in accordance with the standards of the PCAOB. Those standards require that we plan and perform the audit to obtain reasonable assurance about whether the financial statements are free of material misstatement, whether due to error or fraud. The Fund is not required to have, nor were we engaged to perform, an audit of the Fund's internal control over financial reporting. As part of our audit, we are required to obtain an understanding of internal control over financial reporting, but not for the purpose of expressing an opinion on the effectiveness of the Fund's internal control over financial reporting. Accordingly, we express no such opinion.
Our audit included performing procedures to assess the risks of material misstatement of the financial statements, whether due to error or fraud, and performing procedures that respond to those risks. Such procedures included examining, on a test basis, evidence regarding the amounts and disclosures in the financial statements. Our procedures included confirmation of securities owned as of December 31, 2020, by correspondence with the custodian and brokers or by other appropriate auditing procedures where replies from brokers were not received. Our audit also included evaluating the accounting principles used and significant estimates made by management, as well as evaluating the overall presentation of the financial statements. We believe that our audit provides a reasonable basis for our opinion.

We have served as the auditor of one or more FPA investment companies since 2018.
Los Angeles, CA
February 26, 2021
55
FPA FLEXIBLE FIXED INCOME FUND
APPROVAL OF THE ADVISORY AGREEMENT
(Unaudited)
Approval of the Advisory Agreement. At a meeting of the Board of Directors held on August 10, 2020, the Directors approved the continuation of the advisory agreement between the Fund and the Adviser (the "Advisory Agreement") for an additional one-year period through September 30, 2021, on the recommendation of the Independent Directors, who met in executive session on August 10, 2020 prior to the Board meeting to review and discuss the proposed continuation of the Advisory Agreement. The Board had also met on July 13, 2020, with the Independent Directors meeting separately prior to the Meeting in executive session with the management of the Adviser and then separately with independent counsel to evaluate the renewal of the Advisory Agreement. Prior to their July 13 meeting, the Independent Directors, through their independent counsel, had requested and received extensive materials prepared in connection with the review of the Advisory Agreements. The materials provided a broad range of information regarding the Fund, including a description of, among other matters, the terms of the Advisory Agreement; the services provided by the Adviser; the experience of the relevant investment personnel; the Fund's performance in absolute terms and as compared to the performance of peers and appropriate benchmark(s); the fees and expenses of the Fund in absolute terms and as compared to peers; and the profitability of the Adviser from serving as adviser to the Fund. Following their review at the July 13 meeting, the Independent Directors requested (through their independent counsel) and received supplemental information and responses to a number of questions relating to the materials provided by the Adviser.
In addition, the Board met regularly throughout the year and received information on a variety of topics that were relevant to its annual consideration of the renewal of the Advisory Agreement including, among other matters, Fund investment performance, compliance, risk management, liquidity, valuation, trade execution and other matters relating to Fund operations. The Independent Directors also had met with management of the Adviser (including key investment personnel) at their quarterly meetings as well as with management at other times between the quarterly meetings throughout the year. The materials specifically provided in connection with the annual review of the Advisory Agreement supplement the information received throughout the year.
At their regular Board meetings and executive sessions, the Independent Directors were also assisted by independent legal counsel. In addition to the materials provided by the Adviser, the Independent Directors received a legal memorandum from independent counsel that outlined, among other matters: the duties of the Independent Directors and relevant requirements under the 1940 Act; the general principles under state law relevant to considering the approval of advisory contracts; an adviser's fiduciary duty with respect to advisory agreements and compensation; the standards used by courts in determining whether investment advisers and investment company boards of trustees have fulfilled their duties; and factors to be considered by the Independent Directors when voting on advisory agreements. During executive session, independent legal counsel reviewed with the Independent Directors these duties, standards and factors summarized in the legal memorandum described above. The following paragraphs summarize the material information and factors considered by the Board and the Independent Directors, as well as the Directors' conclusions relative to such factors.
Nature, Extent and Quality of Services. The Board and the Independent Directors considered information provided by the Adviser in response to their requests, as well as information provided throughout the year regarding: the Adviser and its staffing in connection with the Fund, including the Fund's portfolio managers and the senior analysts supporting them; the scope of services supervised and provided by the Adviser; and the absence of any significant service problems reported to the Board. The Board and the Independent Directors noted the experience, length of service and the outstanding reputation of the Fund's portfolio managers: Tom Atteberry, who has been with the Adviser since 1997 and has served as portfolio manager since 2018 and Abhijeet
56
FPA FLEXIBLE FIXED INCOME FUND
APPROVAL OF THE ADVISORY AGREEMENT (Continued)
(Unaudited)
V. Patwardhan, who joined the Adviser in 2010 and has served as portfolio manager since 2018. After discussion, the Board and the Independent Directors concluded that the nature, extent and quality of services provided by the Adviser have benefited and should continue to benefit the Fund and its shareholders.
Investment Performance. The Board and the Independent Directors reviewed the overall investment performance of the Fund. The Directors also received information from an independent consultant, Broadridge, regarding the Fund's performance relative to a peer group of alternative credit focus funds selected by Broadridge (the "Peer Group"). . The Board and the Independent Directors noted the Fund outperformed its Peer Group median for the one-year period ending March 31, 2020, and underperformed the comparative Bloomberg Barclays U.S. Universal Bond Index, for the one-year period ending March 31, 2020. After discussion, the Board and the Independent Directors determined that the Fund's investment results were reasonable in light of the Fund's objectives and concluded that the Adviser's continued management of the Fund should benefit the Fund and its shareholders.
Advisory Fees and Fund Expenses; Comparison with Peer Group and Institutional Fees. The Board and the Independent Directors considered information provided by the Adviser regarding the Fund's advisory fees and total expense levels. The Board and the Independent Directors reviewed comparative information regarding fees and expenses for the Peer Group. The Board and the Independent Directors noted that the Fund's advisory fee was below the Peer Group median and its overall net expense ratio was also below the Peer Group median. In addition, the Directors noted that the fee rate charged to the Fund is higher than institutional accounts managed in a similar style by the portfolio managers but considered the Adviser's discussion of the differences between the services provided by the Adviser to the Fund and those provided by the Adviser to the institutional accounts. The Board and the Independent Directors concluded that the continued payment of advisory fees and expenses by the Fund to the Adviser was fair and reasonable and should continue to benefit the Fund and its shareholders.
Adviser Profitability and Costs. The Board and the Independent Directors considered information provided by the Adviser regarding the Adviser's costs in providing services to the Fund, the profitability of the Adviser and the benefits to the Adviser from its relationship to the Fund. They reviewed and considered the Adviser's representations regarding its assumptions and methods of allocating certain costs, such as personnel costs, which constitute the Adviser's largest operating cost, overhead and trading costs with respect to the provision of investment advisory services. The Independent Directors discussed with the Adviser the general process through which individuals' compensation is determined and then reviewed by the management committee of the Adviser, as well as the Adviser's methods for determining that its compensation levels are set at appropriate levels to attract and retain the personnel necessary to provide high quality professional investment advice. In evaluating the Adviser's profitability, they excluded certain distribution and marketing-related expenses. The Board and the Independent Directors recognized that the Adviser is entitled under the law to earn a reasonable level of profits for the services that it provides to the Fund. The Board and the Independent Directors concluded that the Adviser's level of profitability from its relationship with the Fund did not indicate that the Adviser's compensation was unreasonable or excessive.
Economies of Scale and Sharing of Economies of Scale. The Board and the Independent Directors considered whether there have been economies of scale with respect to the management of the Fund, whether the Fund has appropriately benefited from any economies of scale, and whether the fee rate is reasonable in relation to the Fund's asset levels and any economies of scale that may exist. The Board and the Independent Directors considered the Adviser's representation that its internal costs of providing investment management services to
57
FPA FLEXIBLE FIXED INCOME FUND
APPROVAL OF THE ADVISORY AGREEMENT (Continued)
(Unaudited)
the Fund have significantly increased in recent years as a result of a number of factors, including the Adviser's substantial investment in additional professional resources and staffing. The Board and the Independent Directors considered both quantitative and qualitative information regarding the Adviser's representation that it has also made significant investments in: (1) the two portfolio managers, five analysts, traders and other investment personnel who assist with the management of the Fund; (2) new compliance, operations, and administrative personnel; (3) information technology, portfolio accounting and trading systems; and (4) office space, each of which enhances the quality of services provided to the Fund. The Board and the Independent Directors also considered the Adviser's willingness to close funds to new investors when it believed that a fund may have limited capacity to grow or that it otherwise would benefit fund shareholders. The Board noted that the Fund does not charge sales loads.
The Board and the Independent Directors recognized that the advisory fee rate schedule for the Fund does not have breakpoints. They considered that many mutual funds have breakpoints in the advisory fee structure as a means by which to share in the benefits of potential economies of scale as a fund's assets grow. They also considered that not all funds have breakpoints in their fee structures and that breakpoints are not the exclusive means of sharing potential economies of scale. The Board and the Independent Directors considered the Adviser's statement that it believes that breakpoints currently remain inappropriate for the Fund given the ongoing investments the Adviser is making in its business for the benefit of the Fund, uncertainties regarding the direction of the economy, rising inflation, increasing costs for personnel and systems, and growth or contraction in the Fund's assets, all of which could negatively impact the profitability of the Adviser. The Board and the Independent Directors also noted that the Adviser has contractually agreed to reimburse the Fund for Total Annual Fund Operating Expenses (excluding interest, taxes, brokerage fees and commissions payable by the Fund in connection with the purchase or sale of portfolio securities, and extraordinary expenses, including litigation expenses not incurred in the Fund's ordinary course of business) in excess of 0.39% of the average net assets of the Fund for the year ending December 31, 2020, in excess of 0.49% of the average net assets of the Fund for the year ending December 31, 2021, and in excess of 0.59% of the average net assets of the Fund for the year ending December 31, 2022. The Board and the Independent Directors concluded that the Fund is benefitting from the ongoing investments made by the Adviser in its team of personnel serving the Fund and in the Adviser's service infrastructure, and that in light of these investments, the addition of breakpoints in the Fund's advisory fee structure was not warranted at current asset levels.
Ancillary Benefits. The Board and the Independent Directors considered other actual and potential benefits to the Adviser from managing the Fund, including the acquisition and use of research services with commissions generated by the Fund, in concluding that the contractual advisory and other fees are fair and reasonable for the Fund. They noted that the Adviser does not have any affiliates that benefit from the Adviser's relationship to the Fund.
Conclusions. The Board and the Independent Directors determined that the Fund continues to benefit from the services of the Adviser's highly experienced portfolio management team. In addition, the Board and the Independent Directors agreed that the Fund continues to receive high quality services from the Adviser. The Board and the Independent Directors concluded that the current advisory fee rate is reasonable and fair to the Fund and its shareholders in light of the nature and quality of the services provided by the Adviser and the Adviser's profitability and costs. The Board and the Independent Directors also noted their intention to continue monitoring the factors relevant to the Adviser's compensation, such as changes in the Fund's asset levels, changes in portfolio management personnel and the cost and quality of the services provided by the Adviser to the Fund.
58
FPA FLEXIBLE FIXED INCOME FUND
APPROVAL OF THE ADVISORY AGREEMENT (Continued)
(Unaudited)
On the basis of the foregoing, and without assigning particular weight to any single factor, none of which was dispositive, the Board and the Independent Directors concluded that it would be in the best interests of the Fund to continue to be advised and managed by the Adviser and determined to approve the continuation of the current Advisory Agreement for another one-year period through September 30, 2021.
59
FPA FLEXIBLE FIXED INCOME FUND
SHAREHOLDER EXPENSE EXAMPLE
December 31, 2020 (Unaudited)
Fund Expenses
Mutual fund shareholders generally incur two types of costs: (1) transaction costs, and (2) ongoing costs, including advisory and administrative fees; shareholder service fees; and other Fund expenses. The Example is intended to help you understand your ongoing costs (in dollars) of investing in the Fund and to compare these costs with the ongoing costs of investing in other mutual funds. The Example is based on an investment of $1,000 invested at the beginning of the year and held for the entire year.
Actual Expenses
The information in the table under the heading "Actual Performance" provides information about actual account values and actual expenses. You may use the information in this column, together with the amount you invested, to estimate the expenses that you paid over the period. Simply divide your account value by $1,000 (for example, an $8,600 account value divided by $1,000 = 8.6), then multiply the result by the number in the first column in the row entitled "Expenses Paid During Period" to estimate the expenses you paid on your account during this period.
Hypothetical Example for Comparison Purposes
The information in the table under the heading "Hypothetical Performance (5% return before expenses)" provides information about hypothetical account values and hypothetical expenses based on the Fund's actual expense ratio and an assumed rate of return of 5% per year before expenses, which is not the Fund's actual return. The hypothetical account values and expenses may not be used to estimate the actual ending account balance or expenses you paid for the period. You may use this information to compare the ongoing costs of investing in the Fund and other funds. To do so, compare this 5% hypothetical example with the 5% hypothetical examples that appear in the shareholder reports of other funds.
Please note that the expenses shown in the table are meant to highlight your ongoing costs only and do not reflect any transactional costs. Therefore, the information under the heading "Hypothetical Performance (5% return before expenses)" is useful in comparing ongoing costs only, and will not help you determine the relative total costs of owning different funds. In addition, if these transactional costs were included, your costs would have been higher. Even though the Fund does not charge transaction fees, if you purchase shares through a broker, the broker may charge you a fee. You should evaluate other mutual funds' transaction fees and any applicable broker fees to assess the total cost of ownership for comparison purposes.
| | | Actual
Performance | | Hypothetical Performance
(5% return before expenses) | |
Beginning Account Value June 30, 2020 | | $ | 1,000.00 | | | $ | 1,000.00 | | |
Ending Account Value December 31, 2020 | | $ | 1,027.80 | | | $ | 1,023.18 | | |
Expenses Paid During Period* | | $ | 1.98 | | | $ | 1.98 | | |
* Expenses are equal to the Fund's annualized expense ratio of 0.39%, multiplied by the average account value over the period and prorated for the six-months ended December 31, 2020 (184/366 days).
60
FPA FLEXIBLE FIXED INCOME FUND
PRIVACY POLICY
(Unaudited)
The following is the privacy notice of the mutual funds managed by First Pacific Advisors, LP ("FPA", and the mutual funds, the "FPA Funds" ). A complete list of funds is provided below.
The FPA Funds take privacy seriously and consider privacy to be a fundamental aspect of its relationships with its former, prospective and current investors. The FPA Funds are committed to maintaining the confidentiality, integrity and security of its former, current, and prospective investors' non-public personal information and other personal information. This privacy policy describes our privacy practices surrounding the collection and sharing of non-public personal information and other personal information of current, former and prospective investors and visitors to websites maintained by the FPA Funds.
Obtaining Personal Data
While providing investors and/or prospective investors (collectively, "investors") with products and services, the FPA Funds, and certain service providers, such as the FPA Fund's Transfer Agents and/or Administrators, may obtain personal data about such investors, which may come directly from the investor or their intermediaries from sources such as: (i) account applications, subscription agreements and other forms, (ii) written, electronic or verbal correspondence, (iii) investor transactions, (iv) an investor's brokerage or financial advisory firm, financial advisor or consultant, and/or (v) from information captured on applicable websites, including information you may voluntarily provide when you subscribe to receive FPA's quarterly updates or request us to mail you information about the FPA Funds. In addition, the FPA Funds may collect additional personal data from different sources, such as affiliates or their service providers; public websites or other publicly available sources such as government records; or from credit reporting agencies, sanctions screening databases, or from sources designed to detect and prevent fraud.
The personal data collected about an investor may include: (i) identifiers and similar information such as the investor's name, address, tax identification number, birth date, driver's license number, and potentially email address and phone number (if provided); (ii) certain information protected under other federal or state law, like an investor's signature or bank account information; (iii) characteristics of protected classifications under federal or state law, like gender or marital status; (iv) commercial information like an investment selection, beneficiary information, or transaction and account history with the FPA Funds; (v) internet or other electronic network activity like interactions with the FPA website; (vi) professional or employment-related information like an investor's occupation and job title; and (vii) inferences drawn from the other categories to build a profile on an investor to, for example, gauge an investor's potential interest in investing in new funds or products.
Respecting Your Privacy
The FPA Funds do not disclose any personal data provided by investors or gathered by the FPA Funds to third parties, except as required or permitted by law or as necessary for such third parties to perform their agreements with respect to the FPA Funds. Non-affiliated companies may from time to time be used to provide certain services, such as maintaining investor accounts, preparing and mailing prospectuses, reports, account statements and other information, and gathering shareholder proxies. The FPA Funds may also provide an investor's personal data and account information to the investor's respective custodian, brokerage or financial advisory firm and/or financial advisor or consultant.
Sharing Information with Third Parties
The FPA Funds reserve the right to report or disclose personal data or account information to third parties in circumstances where the FPA Funds believe in good faith that disclosure is required or permitted under law, to cooperate with regulators or law enforcement authorities, to protect their rights or property, or upon reasonable
61
FPA FLEXIBLE FIXED INCOME FUND
PRIVACY POLICY (Continued)
(Unaudited)
request by the FPA Funds in which an investor has invested. In addition, the FPA Funds may disclose information about an investor or an investor's accounts to a third party at the investor's request or direction or with the consent of the investor.
Procedures to Safeguard Private Information
The FPA Funds will take reasonable steps and use security measures appropriate to the nature of the information and that comply with applicable laws to protect investors' personal data against unauthorized access and exfiltration, acquisition, theft, or disclosure. In addition to this policy, the FPA Funds have implemented internal procedures that are designed to help guard investors' personal data. Given the nature of information security, there is no guarantee that such safeguards will always be successful.
Information Collected Automatically from Websites
When you visit a website maintained by the FPA Funds, those sites may collect certain information about that visit through automated tools, including cookies. Cookies are bits of data that a website sends to a web browser on a visitor's computer. Websites maintained by the FPA Funds use cookies and other tools to operate the websites and collect analytics information about your visit to our websites, including the number of visitors to a website and the webpages visited. These tools may be provided by third party analytics providers. The analytics information collected does not identify a particular individual visitor or user. You can change your cookie preferences by changing the setting on your web browser to delete or reject cookies. If you delete or reject cookies, some website pages may not function properly. The FPA Funds website does not respond to "do not track" signals.
Links to Other Websites
This privacy policy only addresses the use and disclosure of personal data in conjunction with your use of websites maintained by the FPA Funds. These websites may contain links to other websites. If we create such a link, we will let you know when you are leaving the FPA website. These third-party websites may collect information, including personal data, from you. Please be aware that we are not responsible for the privacy practices or the content of third-party websites. We disclaim liability for any information, materials, products or services offered at any of the third-party sites linked to websites maintained by the FPA Funds. The availability of a link to another party's website is provided as a convenience, but it does not constitute an endorsement or sponsorship of any third party or their products, and does not create an affiliation or partnership between FPA and any third party. You should also be aware that third parties have different privacy policies than FPA and may have different information security practices. We encourage you to read the privacy statements provided by other websites before you provide personal data to them.
Changes to the Privacy Policy
From time to time, the FPA Funds may update or revise this privacy policy. If there are changes to the terms of this privacy policy, documents containing the revised policy on the relevant website will be updated.
FPA Funds
FPA Crescent Fund, FPA New Income, Inc., FPA Flexible Fixed Income Fund, FPA U.S. Core Equity Fund, Inc., FPA Queens Road Value Fund, FPA Queens Road Small Cap Value Fund, and Source Capital, Inc.
Revised: February 2021
62
FPA FLEXIBLE FIXED INCOME FUND
TRUSTEE AND OFFICER INFORMATION
(Unaudited)
Sandra Brown, Mark L. Lipson, Alfred E. Osborne, Jr., A. Robert Pisano, and Patrick B. Purcell are all Trustees of the Fund who are not "interested persons" of the Fund, as that term is defined in the 1940 Act (collectively, the "Independent Trustees"). Trustees serve until their resignation, removal or retirement. The Statement of Additional Information includes additional information about the Trustees and is available, without charge, upon request by calling (800) 982-4372.
Name, Address(1)
and Year of Birth | | Position(s)
Held with
the Fund | | Year First
Elected as
Trustee of
the Fund | | Principal Occupation(s)
During the
Past Five Years | | Number of
FPA Funds
Overseen
by Trustee | | Other
Directorships
Held by Trustee
During the Past
Five Years | |
Independent Trustees | |
Sandra Brown,
1955 | | Trustee | | | 2016 | | | Consultant (since 2009). Formerly, CEO and President of Transamerica Financial Advisers, Inc. (1999-2009); President, Transamerica Securities Sales Corp. (1998-2009); Vice President, Bank of America Mutual Fund Administration (1990-1998). Director/Trustee of FPA Funds Trust, FPA New Income, Inc., FPA U.S. Core Equity Fund, and Source Capital (since 2016), and Director of Bragg Capital Trust (since 2020). | | | 7 | | | None | |
Mark L. Lipson,
1949 | | Trustee & Chairman | | | 2015 | | | Registered Investment Adviser, ML2 Advisors, LLC (since 2014). Formerly Managing Director, Bessemer Trust (2007-2014) and US Trust (2003-2006); Chairman and CEO of the Northstar Mutual Funds (1993-2001); and President and CEO of the National Mutual Funds (1988-1993). Director/Trustee of FPA Funds Trust, FPA New Income, Inc., FPA U.S. Core Equity Fund, and Source Capital (since 2015), and Director of Bragg Capital Trust (since 2020). | | | 7 | | | None | |
Alfred E. Osborne, Jr.,
1944 | | Trustee | | | 2002 | | | Senior Associate Dean, (2003-Present), Interim Dean (2018-June 2019), Professor and Faculty Director (since 2003) Price Center for Entrepreneurship and Innovation at the John E. Anderson School of Management at UCLA. Dr. Osborne has been at UCLA since 1972. Director/Trustee of FPA Funds Trust, FPA New Income, Inc., FPA U.S. Core Equity Fund, and Source Capital (since 2013), and Director of Bragg Capital Trust (since 2020). | | | 7 | | | Kaiser Aluminum and Wedbush Capital | |
63
FPA FLEXIBLE FIXED INCOME FUND
TRUSTEE AND OFFICER INFORMATION (Continued)
(Unaudited)
Name, Address(1)
and Year of Birth | | Position(s)
Held with
the Fund | | Year First
Elected as
Trustee of
the Fund | | Principal Occupation(s)
During the
Past Five Years | | Number of
FPA Funds
Overseen
by Trustee | | Other
Directorships
Held by Trustee
During the Past
Five Years | |
A. Robert Pisano,
1943 | | Trustee | | | 2013 | | | Consultant (since 2012). Formerly, President and Chief Operating Officer of The Motion Picture Association of America, Inc. (2005-2011). Formerly, National Executive Director and Chief Executive Officer of The Screen Actors Guild (2001- 2005). Director/Trustee of FPA Funds Trust, FPA New Income, Inc., FPA U.S. Core Equity Fund, and Source Capital (since 2013), and Director of Bragg Capital Trust (since 2020). | | | 7 | | | Resources Global Professionals | |
Patrick B. Purcell,
1943 | | Trustee | | | 2006 | | | Retired (since 2000). Formerly, Consultant to Paramount Pictures 1998-2000; Executive Vice President, Chief Financial and Administrative Officer of Paramount Pictures (1983-1998). Director/Trustee of FPA Funds Trust, FPA New Income, Inc., FPA U.S. Core Equity Fund, and Source Capital (since 2012), and Director of Bragg Capital Trust (since 2020). | | | 7 | | | None | |
"Interested" Trustee(2) | |
Steven Romick,
1963 | | Trustee | | | 2002 | | | Director and President of FPA GP, Inc., the General Partner of the Adviser (since 2018). Vice President (since 2015) and Portfolio Manager of FPA Crescent Fund (since 1993) and of Source Capital, Inc. (since 2015). Formerly, Managing Partner of FPA (2010-2018). Formerly, President of the Trust (2002-2015). | | | 2 | | | None | |
J. Richard Atwood,
1960 | | Trustee | | | 2016 | | | Director and President of FPA GP, Inc., the General Partner of the Adviser (since 2018). Director/Trustee (since 2016, except the Bragg Capital Trust since 2020) and President (since 2015, except the Bragg Capital Trust since 2020) of each FPA Fund. Formerly, Managing Partner of FPA (2006-2018). Formerly, until 2015, Treasurer of each FPA Fund for more than the past five years. | | | 7 | | | None | |
(1) The address of each Trustee is 11601 Wilshire Boulevard, Suite 1200, Los Angeles, California 90025.
(2) "Interested person" within the meaning of the 1940 Act by virtue of their affiliation with the Fund's Adviser.
64
FPA FLEXIBLE FIXED INCOME FUND
TRUSTEE AND OFFICER INFORMATION (Continued)
(Unaudited)
Officers of the Fund. Officers of the Fund are elected annually by the Board.
Name, Address(1)
and Year of Birth | | Position
with Fund | | Year First
Elected as
Officer of the
Fund | | Principal Occupation(s)
During the Past Five Years | |
J. Richard Atwood,
1960 | | President | | | 2002 | | | Director and President of FPA GP, Inc., the General Partner of FPA (since 2018). Director/Trustee (since 2016, except Bragg Capital Trust since 2020) and President for more than the past five years (except Bragg Capital Trust since 2020) of each FPA Fund. Formerly, Managing Partner of FPA (2006-2018). | |
Thomas. H. Atteberry,
1953 | | Vice President and Portfolio Manager | | | 2018 | | | Partner of FPA. Formerly Chief Executive Officer of the Fund (until 2015). Vice President and Portfolio Manager of FPA Flexible Fixed Income Fund (since 2018). | |
Abhijeet Patwardhan,
1979 | | Vice President and Portfolio Manager | | | 2018 | | | Partner (since 2017) and a Director of Research (since 2015) of FPA; Managing Director of FPA from 2015 to 2017, Senior Vice President of FPA from 2014 to 2015; Analyst and Vice President of FPA from 2010 to 2013. Vice President and Portfolio Manager of FPA Flexible Fixed Income Fund (since 2018). | |
Karen E. Richards,
1969 | | Chief Compliance Officer | | | 2019 | | | Chief Compliance Officer of FPA (since 2018); and Chief Compliance Officer of each FPA Fund (since 2019, except Bragg Capital Trust since 2020). Formerly, Deputy Chief Compliance Officer of First Republic Investment Management, LLC (from 2016 to 2018), and Vice President, Senior Compliance Officer of Pacific Investment Management Company (from 2010 to 2016). | |
E. Lake Setzler III,
1967 | | Treasurer | | | 2006 | | | Senior Vice President (since 2013) and Controller of FPA; and Treasurer of each FPA Fund for more than the past five years (except Bragg Capital Trust since 2020). | |
Rebecca D. Gilding,
1979 | | Secretary | | | 2019 | | | Vice President and Counsel, State Street Bank and Trust Company (since 2016); and Secretary of each FPA Fund (since 2019, except Bragg Capital Trust since 2020). Formerly, Assistant Vice President and Associate Counsel, Brown Brothers Harriman & Co. (2013 to 2016). | |
(1) The address for each Officer (except Ms. Gilding) is 11601 Wilshire Boulevard, Suite 1200, Los Angeles, California 90025. Ms. Gilding's address is State Street Bank and Trust Company, One Lincoln Street, Boston, Massachusetts 02111.
65
FPA FLEXIBLE FIXED INCOME FUND
(Unaudited)
INVESTMENT ADVISER
First Pacific Advisors, LP
11601 Wilshire Boulevard, Suite 1200
Los Angeles, CA 90025
TRANSFER & SHAREHOLDER
SERVICE AGENT
UMB Fund Services, Inc.
P.O. Box 2175
Milwaukee, WI 53201-2175
or
235 West Galena Street
Milwaukee, WI 53212-3948
(800) 638-3060
CUSTODIAN AND ADMINISTRATOR
State Street Bank and Trust Company
One Lincoln Street
Boston, Massachusetts 02111
TICKER SYMBOL: FPFIX
CUSIP: 30254T718
DISTRIBUTOR
UMB Distribution Services, LLC
235 West Galena Street
Milwaukee, Wisconsin 53212-3948
LEGAL COUNSEL
Dechert LLP
One Bush Street, Suite 1600
San Francisco, California 94104
INDEPENDENT REGISTERED PUBLIC ACCOUNTING FIRM
Ernst & Young LLP
725 South Figueroa Street
Los Angeles, California 90017
This report has been prepared for the information of shareholders of FPA FLEXIBLE FIXED INCOME FUND, and is not authorized for distribution to prospective investors unless preceded or accompanied by an effective prospectus.
A description of the policies and procedures that the Adviser uses to vote proxies related to the Fund's portfolio securities is set forth in the Fund's Statement of Additional Information which is available without charge, upon request, on the Fund's website at www.fpa.com or by calling (800) 982-4372 and on the Securities and Exchange Commission's website at www.sec.gov.
The Fund's complete proxy voting record for the 12 months ended June 30, 2020 is available without charge, upon request by calling (800) 982-4372 and on the SEC's website at www.sec.gov.
The Fund's schedule of portfolio holdings, filed the first and third quarter of the Fund's fiscal year on Form N-PORT with the SEC, is available on the SEC's website at www.sec.gov.
Additional information about the Fund is available online at www.fpa.com. This information includes, among other things, holdings, top sectors, and performance, and is updated on or about the 15th business day after the end of each quarter.
Item 2. Code of Ethics.
| (a) | The registrant has adopted a code of ethics that applies to the registrant’s principal executive and financial officers. |
| (c) | During the period covered by this report, there were no amendments to the provisions of the code of ethics adopted in 2(a) above. |
| (d) | During the period covered by this report, there were not any implicit or explicit waivers to the provisions of the code of ethics adopted in 2(a). |
| (f) | A copy of the registrant’s code of ethics is filed as an exhibit to this Form N-CSR. |
Item 3. Audit Committee Financial Expert.
The registrant’s board of directors has determined that Patrick B. Purcell, who is a member of the registrant’s audit committee and board of directors, is an “audit committee financial expert” and is “independent,” as those terms are defined in this Item. This designation will not increase the designee’s duties, obligations or liability as compared to his duties, obligations or liability as a member of the audit committee and of the board of directors. This designation does not affect the duties, obligations or liability of any other member of the audit committee or the board of directors.
Item 4. Principal Accountant Fees and Services.
| FPA Crescent Fund | | 2019 | | | 2020 | |
| (a) Audit Fees | | $ | 55,000 | | | $ | 56,000 | |
| (b) Audit Related Fees | | $ | -0- | | | $ | -0- | |
| (c) Tax Fees (1) | | $ | 11,700 | | | $ | 11,900 | |
| (d) All Other Fees (2) | | $ | 833 | | | $ | 1,667 | |
(1) Tax fees are for the preparation of the Fund’s tax return(s).
2) Other fees are for the identification of any PFIC holdings in the Fund.
| FPA Flexible Fixed Income Fund | | 2019 | | | 2020 | |
| (a) Audit Fees | | $ | 16,000 | | | $ | 26,000 | |
| (b) Audit Related Fees | | $ | -0- | | | $ | -0- | |
| (c) Tax Fees (1) | | $ | 4,000 | | | $ | 6,500 | |
| (d) All Other Fees | | $ | -0- | | | $ | -0- | |
(1) Tax fees are for the preparation of the Fund’s tax return(s).
(e)(1) The audit committee shall pre-approve all audit and permissible non-audit services that the committee considers compatible with maintaining the independent auditors’ independence. The pre-approval requirement will extend to all non-audit services provided to the registrant, the adviser, and any entity controlling, controlled by, or under common control with the adviser that provides ongoing services to the registrant, if the engagement relates directly to the operations and financial reporting of the registrant; provided, however, that an engagement of the registrant’s independent auditors to perform attest services for the registrant, the adviser or its affiliates required by generally accepted auditing standards to complete the examination of the registrant’s financial statements (such as an examination conducted in accordance with Statement on Standards for Attestation Engagements Number 16, or a Successor Statement, issued by the American Institute of Certified Public Accountants), will be deem pre-approved if:
| | (i) | the registrant’s independent auditors inform the audit committee of the engagement, |
| | | |
| | (ii) | the registrant’s independent auditors advise the audit committee at least annually that the performance of this engagement will not impair the independent auditor’s independence with respect to the registrant, and |
| | | |
| | (iii) | the audit committee receives a copy of the independent auditor’s report prepared in connection with such services. The committee may delegate to one or more committee members the authority to review and pre-approve audit and permissible non-audit services. Actions taken under any such delegation will be reported to the full committee at its next meeting. |
(e)(2) 0% of the services provided to the registrant described in paragraphs b-d of this Item were approved by the Audit Committee pursuant to paragraph (c)(7)(i)(C) of Rule 2-01 of Regulation S-X. There were no services provided to the investment adviser or any entity controlling, controlled by or under common control with the adviser described in paragraphs (b) — (d) of this Item that were required to be pre-approved by the audit committee.
(f) For the fiscal year ended December 31, 2020, if greater than 50%, specify the percentage of hours spent on the audit of the registrant's financial statements for the most recent fiscal year that were attributed to work performed by persons who are not full-time, permanent employees of the principal accountant Ernst & Young LLP (“EY”). According to EY, such amount was below 50%; therefore disclosure item not applicable to this filing.
(g) For the fiscal years ended December 31, 2020 and December 31, 2019, the aggregate non-audit fees billed by EY for services rendered to the investment advisor were $43,500 and $41,250, respectively.
(h) The registrant's Audit Committee has considered whether the provision of non-audit services that were rendered to the registrant's investment advisor, which were not pre-approved (not requiring pre-approval), is compatible with maintaining EY's independence.
Item 5. Audit Committee of Listed Registrants.
Not applicable.
Item 6. Investments.
| (a) | Schedule of Investments is included as a part of the report to shareholders filed under Item 1 of this Form N-CSR. |
Item 7. Disclosure of Proxy Voting Policies and Procedures for Closed-End Management Investment Companies.
Not applicable.
Item 8. Portfolio Managers of Closed-End Management Investment Companies.
Not applicable.
Item 9. Purchases of Equity Securities by Closed-End Management Investment Company and Affiliated Purchasers.
Not applicable.
Item 10. Submission of Matters to a Vote of Security Holders.
There have been no material changes to the procedures by which the shareholders may recommend nominees to the registrant’s board of directors.
Item 11. Controls and Procedures.
| (a) | The principal executive officer and principal financial officer of the registrant have concluded that the registrant’s disclosure controls and procedures (as defined in Rule 30a-3(c) under the Investment Company Act of 1940) are effective based on their evaluation of the disclosure controls and procedures as of a date within 90 days of the filing date of this report. |
| (b) | There have been no significant changes in the registrant’s internal controls over financial reporting (as defined in Rule 30a-3(d) under the Investment Company Act of 1940) that occurred during the registrant’s second fiscal quarter of the period covered by this report that have materially affected, or is reasonably likely to materially affect, the registrant’s internal controls over financial reporting. |
Item 12. Disclosure of Securities Lending Activities for Closed-End Management Investment Companies
Not applicable.
Item 13. Exhibits.
SIGNATURES
Pursuant to the requirements of the Securities Exchange Act of 1934 and the Investment Company Act of 1940, the registrant has duly caused this report to be signed on its behalf by the undersigned, thereunto duly authorized.
FPA FUNDS TRUST
| By: | /s/ J. Richard Atwood | |
| | J. Richard Atwood | |
| | President (principal executive officer) | |
Pursuant to the requirements of the Securities Exchange Act of 1934 and the Investment Company Act of 1940, this report has been signed below by the following persons on behalf of the registrant and in the capacities and on the dates indicated.
| By: | /s/ J. Richard Atwood | |
| | J. Richard Atwood | |
| | President (principal executive officer) | |
| By: | /s/ E. Lake Setzler III | |
| | E. Lake Setzler III | |
| | Treasurer (principal financial officer) | |