UNITED STATES
SECURITIES AND EXCHANGE COMMISSION
Washington, D.C. 20549
FORM N-CSR
CERTIFIED SHAREHOLDER REPORT OF REGISTERED
MANAGEMENT INVESTMENT COMPANIES
Investment Company Act file number: 811-08544
fpa FUNDS TRUST
(Exact name of registrant as specified in charter)
11601 WILSHIRE BLVD., STE. 1200
LOS ANGELES, CALIFORNIA 90025
(Address of principal executive offices)(Zip code)
| (Name and Address of Agent for Service) | Copy to: |
J. RICHARD ATWOOD, PRESIDENT FPA FUNDS TRUST 11601 WILSHIRE BLVD., STE. 1200 LOS ANGELES, CALIFORNIA 90025 | MARK D. PERLOW, ESQ. DECHERT LLP ONE BUSH STREET, STE. 1600 SAN FRANCISCO, CA 94104 |
Registrant’s telephone number, including area code: (310) 473-0225
Date of fiscal year end: December 31
Date of reporting period: December 31, 2021
Item 1: Report to Shareholders.
| (a) | The Reports to Shareholders are attached herewith. |

Distributor:
UMB DISTRIBUTION SERVICES, LLC
235 West Galena Street
Milwaukee, Wisconsin 53212
FPA CRESCENT FUND
LETTER TO SHAREHOLDERS
Dear Shareholder:
Overview
The FPA Crescent Fund — Institutional Class ("Fund" or "Crescent") gained 1.87% in 2021's fourth quarter and increased 15.17% for the calendar year.1 The Fund generated 64.2% of the average of the S&P 500 and MSCI ACWI NR USD's ("MSCI ACWI") return in 2021, underperforming its own 75.8% average net risk exposure.2
Crescent's performance and that of its underlying equity exposure are captured in the following table:
Exhibit A: Performance versus Illustrative Indices3
| | Q4 2021 | | 2021 | |
Crescent | | | 1.87 | % | | | 15.17 | % | |
Crescent — Long Equity | | | 3.68 | % | | | 23.18 | % | |
MSCI ACWI NR USD | | | 6.68 | % | | | 18.54 | % | |
S&P 500 | | | 11.03 | % | | | 28.71 | % | |
60% MSCI ACWI NR USD/ 40% BBg US Agg | | | 4.02 | % | | | 10.20 | % | |
60% S&P 500 / 40% BBg US Agg | | | 6.57 | % | | | 15.86 | % | |
1 Effective September 4, 2020, the current single class of shares of the Fund was renamed the Institutional Class shares. Unless otherwise noted, all data herein is representative of the Institutional Share Class.
2 Risk assets are any assets that are not risk free and generally refers to any financial security or instrument, such as equities, commodities, high-yield bonds, and other financial products that are likely to fluctuate in price. Risk exposure refers to the Fund's exposure to risk assets as a percent of total assets. The Fund's net risk exposure as of December 31, 2021 was 74.8%.
3 Comparison to the indices is for illustrative purposes only. The Fund does not include outperformance of any index or benchmark in its investment objectives. An investor cannot invest directly in an index. The long equity segment of the Fund is presented gross of investment management fees, transactions costs, and Fund operating expenses, which if included, would reduce the returns presented. Long equity holdings only includes equity securities excluding paired trades, short-sales, and preferred securities. The long equity performance information shown herein is for illustrative purposes only and may not reflect the impact of material economic or market factors. No representation is being made that any account, product or strategy will or is likely to achieve profits, losses, or results similar to those shown. Long equity performance does not represent the return an investor in the Fund can or should expect to receive. Fund shareholders may only invest or redeem their shares at net asset value.
Past performance is no guarantee, nor is it indicative, of future results.
1
FPA CRESCENT FUND
LETTER TO SHAREHOLDERS
(Continued)
Portfolio discussion
The top contributors to and detractors from the Fund's trailing 12-month returns are listed below.
Exhibit B: Trailing Twelve-Month Contributors and Detractors as of December 31, 20214
| Contributors | | Perf.
Cont. | | Avg. %
of Port. | | Detractors | | Perf.
Cont. | | Avg. %
of Port. | |
Alphabet | | | 3.01 | % | | | 5.7 | % | | Alibaba | | | -0.69 | % | | | 1.2 | % | |
American International Group | | | 1.41 | % | | | 2.9 | % | | SPDR S&P 500 ETF (short) | | | -0.53 | % | | | -2.0 | % | |
Broadcom | | | 1.39 | % | | | 2.9 | % | | Softbank ADR/Softbank | | | -0.52 | % | | | 1.0 | % | |
Jefferies Financial Group | | | 1.22 | % | | | 2.0 | % | | Nexon | | | -0.41 | % | | | 0.9 | % | |
Glencore | | | 1.20 | % | | | 2.2 | % | | Naspers & Prosus | | | -0.39 | % | | | 2.8 | % | |
| | | 8.23 | % | | | 15.7 | % | | | | | -2.55 | % | | | 3.8 | % | |
Economic recovery and persistent easy money continued to underpin the financial markets, allowing 2020's global stock market rally to continue in 2021 and benefiting certain positions held in the Fund (as much as global stock volatility temporarily hurt their stock prices in Q1 2020). Crescent's top five contributors added 8.2% to the Fund's return in 2021, about 3.2x the sum of the top five detractors. Importantly, there was a lack of significant news that impacted the individual investments in the above table.
Exposure to each of the top five contributors was reduced in 2021, as their respective valuations reached levels high enough to warrant a reduction in holding size, but not their complete elimination from the portfolio. We did sell out of nine stocks completely in 2021, however. We similarly moved on from these positions largely as a result of valuation, which also drove other changes. Along with the reduction in position size of six financial service companies, we also eliminated positions in Bank of America and CIT Group. The Fund's exposure to travel-related companies was also reduced as a function of selling some of our Marriott International and all of Booking Holdings stakes.
We believe that the portfolio changes in the last year resulted in the exchange of less appealing risk-reward opportunities for more attractive ones. Ten new equities were added in 2021, including new positions in video game stocks Ubisoft Entertainment and Activision Blizzard, which joined Nexon and Epic Corp to comprise our current sector exposure of 3.1%.
Unsurprisingly due to low yields, there were no new high yield positions and just one new private credit investment.
Crescent ended 2021 with net risk exposure of 74.8%, lower year over year by approximately five percentage points.
4 Reflects the top five contributors and detractors to the Fund's performance based on contribution to return for the trailing twelve months ("TTM"). Contribution is presented gross of investment management fees, transactions costs, and Fund operating expenses, which if included, would reduce the returns presented. The information provided does not reflect all positions purchased, sold or recommended by FPA during the quarter. A copy of the methodology used and a list of every holding's contribution to the overall Fund's performance during the TTM is available by contacting FPA Client Service at crm@fpa.com. It should not be assumed that recommendations made in the future will be profitable or will equal the performance of the securities listed.
Past performance is no guarantee, nor is it indicative, of future results.
2
FPA CRESCENT FUND
LETTER TO SHAREHOLDERS
(Continued)
While the global stock markets remain at more elevated valuation levels, the potential for continued financial repression and its inflationary consequences is the reason why Crescent has a larger position in equities than has been typical (and less in corporate bonds). We believe that more "balanced" portfolios of stocks and bonds (e.g., the 60/40 equity/fixed income portfolios) are likely to generate weaker long-term returns, dragged down by the low yielding bonds — both investment grade and high yield, when compared to a more equity-centric portfolio. The poor performance of fixed income instruments last year, as shown in Exhibit C, and in stark contrast to the equity returns shown in Exhibit A, might just be a harbinger of things to come.
Exhibit C: Bond Returns5
| | 2021 | |
| 10-Year Government Bonds | |
United States | | | -5.7 | % | |
Germany | | | -10.2 | % | |
Japan | | | -10.5 | % | |
| US Corporate Bonds | |
Investment Grade | | | -1.0 | % | |
High Yield | | | 3.3 | % | |
Wrestling with how much to own of stocks versus bonds doesn't seem like much of a contest. The low starting yields of bonds in general, and corporate bonds more specifically with their additional burden of potential default, offered a negative real yield at quarter end and into the beginning of 2022. With such an anemic starting point, it appears that the earnings growth potential of stocks affords the better opportunity for those with a longer-term view despite higher-than-average equity valuations (Exhibit D).
5 Source: Bloomberg. As of December 31, 2021.
Past performance is no guarantee, nor is it indicative, of future results.
3
FPA CRESCENT FUND
LETTER TO SHAREHOLDERS
(Continued)
Exhibit D: S&P 500 Forward Earnings Yield & Nominal 10-Year Treasury Bond Yield6
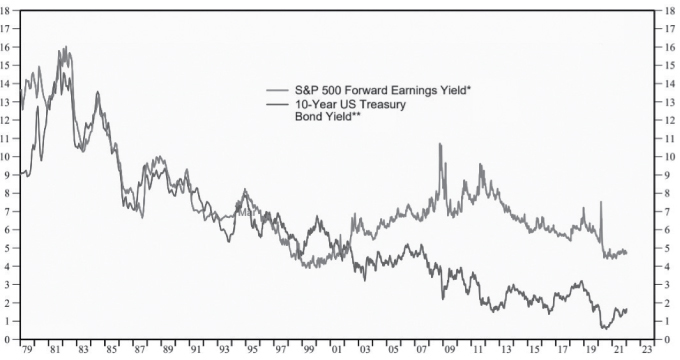
The S&P 500's estimated 2022 P/E is 21.5x, which in its inverse translates to an estimated earnings yield of 4.7%. Given lower stock valuations outside the U.S., the estimated 2022 earnings yield for the global MSCI ACWI is a higher 5.6%. Contrast this with a 1.5% 10-year U.S. Treasury yield or worse, the 0.07% and -0.09% yields for Japanese and German government bonds.7
Assuming positive economic growth over the next decade, we believe the total return potential of stocks should exceed that of bonds, albeit with greater volatility. While volatility satisfies the institutional definition of equity risk, we have a different view. More precisely, risk is losing money, or a permanent impairment of capital, and should not factor in episodic, yet temporary price declines. Crescent's oft-stated goal is to deliver an equity-like rate of return while avoiding a permanent impairment of capital. The potential discomfort that comes with the ups and downs of the market must be borne if one is to achieve equity-like rates of return.
6 Source: Yardeni.com, I/B/E/S data by Refinitiv, FRED. Chart data covers the period December 31,1978 through January 7, 2022.
* Year-ahead forward consensus expected earnings divided by S&P 500 stock price index. Monthly through March 1994, then weekly.
** Monthly through March 1994, then weekly.
7 Source: Bloomberg, FRED. US, Japanese and German 10-year government bond yields as of December 31, 2021.
Past performance is no guarantee, nor is it indicative, of future results.
4
FPA CRESCENT FUND
LETTER TO SHAREHOLDERS
(Continued)
It is not a truism that more invested = more risk. There are different kinds of risk. We believe, for example, that being less invested in risk assets invites the greater risk of inflation eroding the value of your cash or "conservative" fixed income instruments.
The easy money environment since the great financial crisis set the stage for higher inflation. The pandemic has made things worse, impacting both size and availability of the labor pool and causing supply chain disruptions. While one can reasonably argue that domestic inflation in the future will be lower than 2021's 7%, we believe that inflation will likely average higher in this next decade than the preceding one — something that is not currently expected just as last year's rise was not anticipated (Exhibits E and F).8
Exhibit E: CPI 1965 to 20219
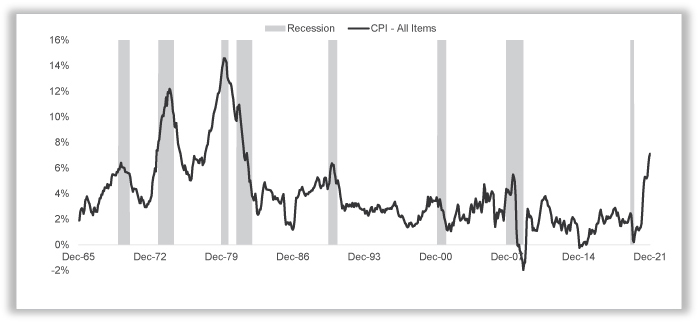
8 Average inflation over the past 10 years (2011-2020) was approximately 1.9%.
9 Source: FRED. Chart data covers the period December 31, 1965 through December 31, 2021. CPI stands for Consumer Price Index.
Past performance is no guarantee, nor is it indicative, of future results.
5
FPA CRESCENT FUND
LETTER TO SHAREHOLDERS
(Continued)
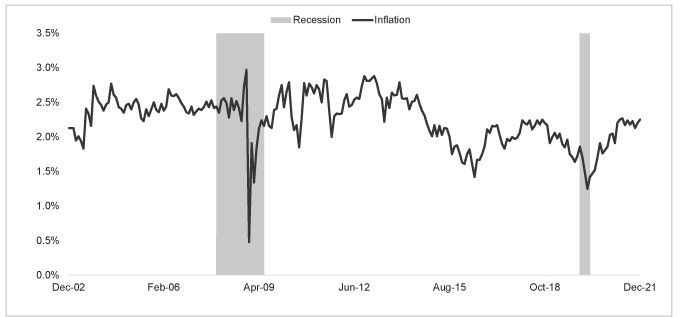
Exhibit F: 5-Year Forward US Inflation Expectation Rate10
We manage your capital to seek to provide an acceptable real rate of return over time — both in the absolute and factoring in the risk assumed to achieve it. This requires us to seek to protect our/your portfolio from the diminution of real return that inflation can cause. To accomplish this, we:
◼ Own more stocks than the historical average (Exhibit G), including the Fund's holdings of lower priced overseas-based businesses that we believe offer better potential for risk-adjusted returns than their US counterparts.
◼ Hold good to great quality businesses at good prices. Owning shares in businesses that are both less expensive and growing faster than the stock market should help to achieve our goal (Exhibit H).
◼ Have avoided low-yielding bonds, particularly those with unappreciated credit risk (Exhibit G).
10 Source: FRED. Chart data covers the period December 31, 2002 through December 31, 2021.
Past performance is no guarantee, nor is it indicative, of future results.
6
FPA CRESCENT FUND
LETTER TO SHAREHOLDERS
(Continued)
Exhibit G: FPA Crescent Historic Asset Class Composition11
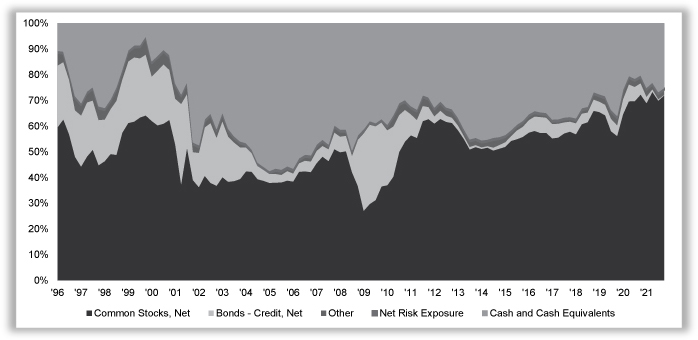
11 Source: FPA. Chart data covers the period March 31, 1996 through December 31, 2021.
Past performance is no guarantee, nor is it indicative, of future results.
7
FPA CRESCENT FUND
LETTER TO SHAREHOLDERS
(Continued)
Exhibit H: FPA Crescent Long Equity Holding Valuation and Earnings Growth vs Stock Market12
| | Price/Earnings
1 Year Forward | | Price/Book | | 3-Year Trailing
EPS Growth | | 3-Year Forward
Estimated
EPS Growth | |
| | 12/31/2020 | | 12/31/2021 | | 12/31/2020 | | 12/31/2021 | | 12/31/2020 | | 12/31/2021 | | 12/31/2020 | | 12/31/2021 | |
FPA Crescent —
Long Equity
Portfolio | | | 18.9 | x | | | 15.6 | x | | | 1.6 | x | | | 1.8 | x | | | -30 | % | | | 22 | % | | | 40 | % | | | 21 | % | |
vs. MSCI
ACWI NR | | | -10 | % | | | -13 | % | | | -43 | % | | | -42 | % | | | | | | | | | | | 79 | % | | | 150 | % | |
vs. S&P 500 | | | -21 | % | | | -25 | % | | | -62 | % | | | -62 | % | | | | | | | | | | | 84 | % | | | 121 | % | |
MSCI ACWI NR | | | 21.1 | x | | | 18.0 | x | | | 2.8 | x | | | 3.1 | x | | | -4 | % | | | 5 | % | | | 22 | % | | | 9 | % | |
S&P 500 | | | 23.9 | x | | | 20.9 | x | | | 4.2 | x | | | 4.8 | x | | | 1 | % | | | 9 | % | | | 22 | % | | | 10 | % | |
Hopefully, the Fund's long equity exposure will continue to outperform global indices as it has done historically. Long equities held by Crescent outperformed the S&P 500 by 0.70% since 2007 and beaten the MSCI ACWI by 4.22% since 2011 when the Fund began to tilt more international (Exhibit I).
12 Source: CapIQ, Factset, Bloomberg, FPA calculations. 3-Year Forward Estimated EPS Growth is based on FPA calculations using consensus data from CapIQ, Factset and Bloomberg. Forward looking statistics are estimates and subject to change. Comparison to the S&P 500 and MSCI ACWI Indices is being used as a representation of the "market" and is for illustrative purposes only. The Fund does not include outperformance of any index or benchmark in its investment objectives. Please refer to footnote 3 for the definition of the long equity holdings and other important information and refer to Page 1 for net returns of the Fund. The long equity holdings average weight in the Fund was 74.4% and 75.1% for Q4 2021 and TTM through 12/31/21, respectively. The long equity holdings average weight in the Fund was 75.2% and 71.6% for Q4 2020 and TTM through 12/31/20, respectively. The long equity statistics shown herein are for illustrative purposes only and may not reflect the impact of material economic or market factors. No representation is being made that any account, product or strategy will or is likely to achieve results similar to those shown. Long equity statistics noted herein do not represent the results that the Fund or an investor can or should expect to receive. Fund shareholders can only purchase and redeem shares at net asset value.
Past performance is no guarantee, nor is it indicative, of future results.
8
FPA CRESCENT FUND
LETTER TO SHAREHOLDERS
(Continued)
Exhibit I: Long Equity Carve-Out Gross Performance vs. Indices13
| | CAGR
1/1/07 to
12/31/21 | | CAGR
1/1/11 to
12/31/21 | | 2021 | | 2020 | | 2019 | | 2018 | | 2017 | | 2016 | | 2015 | | 2014 | | 2013 | | 2012 | | 2011 | | 2010 | | 2009 | | 2008 | | 2007 | |
FPACX Long
Equity | | | 11.36 | % | | | 14.17 | % | | | 23.18 | % | | | 12.55 | % | | | 31.53 | % | | | -12.33 | % | | | 21.07 | % | | | 15.57 | % | | | -0.64 | % | | | 13.64 | % | | | 38.12 | % | | | 17.77 | % | | | 4.58 | % | | | 22.48 | % | | | 38.66 | % | | | -38.27 | % | | | 11.47 | % | |
MSCI
ACWI NR* | | | | | 9.95 | % | | | 18.54 | % | | | 16.25 | % | | | 26.60 | % | | | -9.42 | % | | | 23.97 | % | | | 7.86 | % | | | -2.36 | % | | | 4.16 | % | | | 22.80 | % | | | 16.13 | % | | | -7.35 | % | | | — | | | | — | | | | — | | | | — | | |
Excess Return
vs. MSCI
ACWI NR | | | | | 4.22 | % | | | 4.64 | % | | | -3.71 | % | | | 4.93 | % | | | -2.91 | % | | | -2.90 | % | | | 7.71 | % | | | 1.72 | % | | | 9.48 | % | | | 15.32 | % | | | 1.64 | % | | | 11.93 | % | | | — | | | | — | | | | — | | | | — | | |
S&P 500 | | | 10.66 | % | | | 15.16 | % | | | 28.71 | % | | | 18.40 | % | | | 31.49 | % | | | -4.38 | % | | | 21.83 | % | | | 11.96 | % | | | 1.38 | % | | | 13.69 | % | | | 32.39 | % | | | 16.00 | % | | | 2.11 | % | | | 15.06 | % | | | 26.46 | % | | | -37.00 | % | | | 5.49 | % | |
Excess Return
vs. S&P 500 | | | 0.70 | % | | | -0.99 | % | | | -5.53 | % | | | -5.85 | % | | | 0.04 | % | | | -7.95 | % | | | -0.76 | % | | | 3.61 | % | | | -2.02 | % | | | -0.05 | % | | | 5.73 | % | | | 1.77 | % | | | 2.47 | % | | | 7.42 | % | | | 12.20 | % | | | -1.27 | % | | | 5.98 | % | |
Closing
We wish we could tell you the Crescent portfolio is as cheap as it has ever been, but given the market and the Fund's strong performance since Q1 2020's market bottom, you know that cannot be true. We have repositioned the portfolio as a function of old opportunities that have come to fruition and new opportunities that we believe offer reasonable prospects for attractive risk-adjusted future returns. The portfolio is also built to withstand multiple potential outcomes: e.g., inflation, stagflation, and recession.14
We just watched Peter Jackson's The Beatles: Get Back. Although a music documentary, we couldn't help but appreciate how those four young men from Liverpool managed to focus on what they do best and what they wanted to accomplish, despite pressure from others to do some things differently. Your portfolio managers
13 As of December 31, 2021, which represents latest data available. Data shown from January 1, 2007 as that is when FPA began capturing this data. CAGR shown for period 1/1/2007 through 12/31/2021 for the S&P 500 and for the period 1/1/2011 through 12/31/2021 for the MSCI ACWI.
* The MSCI ACWI NR was not considered a relevant illustrative index prior to 2011 because the Fund was not classified as a global mandate until this point in time.
Source: FPA and Morningstar Direct. FPACX or Fund refers to FPA Crescent Fund — Institutional Class. The table shows the performance of the long equity segment of the Fund only and is presented gross of investment management fees, transactions costs, and Fund operating expenses, which if included, would reduce the returns presented. Please refer to page 1 for overall net performance of the Fund since inception. Long equity holdings only includes equity securities excluding paired trades, short-sales, and preferred securities. The long equity performance information shown herein is for illustrative purposes only and may not reflect the impact of material economic or market factors. No representation is being made that any account, product or strategy will or is likely to achieve profits, losses, or results similar to those shown. Long equity performance does not represent the return an investor in the Fund can or should expect to receive. Fund shareholders may only invest or redeem their shares at net asset value. Comparison to the S&P 500 and the MSCI ACWI NR indices is for illustrative purposes only. The Fund does not include outperformance of any index or benchmark in its investment objectives. An investor cannot invest directly in an index. Active stock selection refers to the fact that the Fund can make investments outside of the index or in different weights than the index and thus Fund performance may differ, sometimes materially, for any given period as compared to a given index.
14 The performance of the Fund, the S&P 500 and the MSCI ACWI NR for the period since the Q1 2020 bottom, 03/24/2020, to 12/31/2021 was 77.77%, 119.03,% and 102.12%, respectively. Fund performance is net of fees and expenses and includes reinvestment of distributions.
Past performance is no guarantee, nor is it indicative, of future results.
9
FPA CRESCENT FUND
LETTER TO SHAREHOLDERS
(Continued)
similarly come together to concentrate on the long-term, which means shutting our ears to the many cacophonous voices that whisper to us in the short-term.
Best wishes in the New Year and may you and your families be in good health.
Respectfully submitted,
FPA Crescent Portfolio Managers
January 31, 2022
Important Disclosures
This Commentary is for informational and discussion purposes only and does not constitute, and should not be construed as, an offer or solicitation for the purchase or sale with respect to any securities, products or services discussed, and neither does it provide investment advice. Any such offer or solicitation shall only be made pursuant to the Fund's Prospectus, which supersedes the information contained herein in its entirety. This presentation does not constitute an investment management agreement or offering circular.
The views expressed herein and any forward-looking statements are as of the date of the publication and are those of the portfolio management team and are subject to change without notice. Future events or results may vary significantly from those expressed and are subject to change at any time in response to changing circumstances and industry developments. This information and data have been prepared from sources believed reliable, but the accuracy and completeness of the information cannot be guaranteed and is not a complete summary or statement of all available data.
Portfolio composition will change due to ongoing management of the Fund. References to individual securities or sectors are for informational purposes only and should not be construed as recommendations by the Fund, the portfolio managers, the Adviser, or the distributor. It should not be assumed that future investments will be profitable or will equal the performance of the security or sector examples discussed. The portfolio holdings as of the most recent quarter-end may be obtained at www.fpa.com.
Investments, including investments in mutual funds, carry risks and investors may lose principal value. Capital markets are volatile and can decline significantly in response to adverse issuer, political, regulatory, market, or economic developments. The Fund may purchase foreign securities, including American Depository Receipts (ADRs) and other depository receipts, which are subject to interest rate, currency exchange rate, economic and political risks; these risks may be heightened when investing in emerging markets. Foreign investments, especially those of companies in emerging markets, can be riskier, less liquid, harder to value, and more volatile than investments in the United States. Adverse political and economic developments or changes in the value of foreign currency can make it more difficult for the Fund to value the securities. Differences in tax and accounting standards, difficulties in obtaining information about foreign companies, restrictions on receiving investment proceeds from a foreign country, confiscatory foreign tax laws, and potential difficulties in enforcing contractual obligations, can all add to the risk and volatility of foreign investments.
Small and mid-cap stocks involve greater risks and may fluctuate in price more than larger company stocks. Short-selling involves increased risks and transaction costs. You risk paying more for a security than you received from its sale.
The return of principal in a bond investment is not guaranteed. Bonds have issuer, interest rate, inflation and credit risks. Interest rate risk is the risk that when interest rates go up, the value of fixed income securities,
10
FPA CRESCENT FUND
LETTER TO SHAREHOLDERS
(Continued)
such as bonds, typically go down and investors may lose principal value. Credit risk is the risk of loss of principal due to the issuer's failure to repay a loan. Generally, the lower the quality rating of a security, the greater the risk that the issuer will fail to pay interest fully and return principal in a timely manner. If an issuer defaults the security may lose some or all of its value. Lower rated bonds, callable bonds and other types of debt obligations involve greater risks. Mortgage-backed securities and asset-backed securities are subject to prepayment risk and the risk of default on the underlying mortgages or other assets. High yield securities can be volatile and subject to much higher instances of default. Derivatives may increase volatility.
The ratings agencies that provide ratings are Standard and Poor's, Moody's, and Fitch. Credit ratings range from AAA (highest) to D (lowest). Bonds rated BBB or above are considered investment grade. Credit ratings BB and below are lower-rated securities (junk bonds). High-yielding, non-investment grade bonds (junk bonds) involve higher risks than investment grade bonds. Bonds with credit ratings of CCC or below have high default risk.
Value securities, including those selected by the Fund's portfolio managers, are subject to the risk that their intrinsic value may never be realized by the market because the market fails to recognize what the portfolio managers consider to be their true business value or because the portfolio managers have misjudged those values. In addition, value style investing may fall out of favor and underperform growth or other styles of investing during given periods.
Investing in Special Purpose Acquisition Companies ("SPACS") involves risks. Because SPACs and similar entities have no operating history or ongoing business other than seeking acquisitions, the value of their securities is particularly dependent on the ability of the entity's management to identify and complete a profitable acquisition. SPACs are not required to provide the depth of disclosures or undergo the rigorous due diligence of a traditional initial public offering (IPO). Investors in SPACs may become exposed to speculative investments, foreign or domestic, in higher risk sectors/industries. SPAC investors generally pay certain fees and give the sponsor certain incentives (e.g., discounted ownership stakes) not found in traditional IPOs. Due to this, an investment in a SPAC may include potential conflicts and the potential for misalignment of incentives in the structure of the SPAC. For more information relating to the risks of investing in SPACs please refer to the Fund's Prospectus.
While transactions in derivatives may reduce certain risks, they entail certain other risks. Derivatives may magnify the Fund's gains or losses, causing it to make or lose substantially more than it invested. Derivatives have a risk of default by the counterparty to a contract. When used for hedging purposes, increases in the value of the securities the Fund holds or intends to acquire should offset any losses incurred with a derivative.
Investments in private securities and limited partnerships present risks. These investments are not registered under the federal securities laws, and are generally eligible for sale only to certain eligible investors. They may be illiquid, and thus more difficult to sell, because there may be relatively few potential purchasers for such investments, and the sale of such investments may also be restricted under securities laws.
Please refer to the Fund's Prospectus for a complete overview of the primary risks associated with the Fund.
In making any investment decision, you must rely on your own examination of the Fund, including the risks involved in an investment. Investments mentioned herein may not be suitable for all recipients and in each case, potential investors are advised not to make any investment decision unless they have taken independent advice from an appropriately authorized advisor. An investment in any security mentioned herein does not
11
FPA CRESCENT FUND
LETTER TO SHAREHOLDERS
(Continued)
guarantee a positive return as securities are subject to market risks, including the potential loss of principal. You should not construe the contents of this document as legal, tax, investment or other advice or recommendations.
Index Definitions
Comparison to any index is for illustrative purposes only and should not be relied upon as a fully accurate measure of comparison. The Fund may be less diversified than the indices noted herein, and may hold non-index securities or securities that are not comparable to those contained in an index. Indices will hold positions that are not within the Fund's investment strategy. Indices are unmanaged and do not reflect any commissions, transaction costs, or fees and expenses which would be incurred by an investor purchasing the underlying securities and which would reduce the performance in an actual account. You cannot invest directly in an index. The Fund does not include outperformance of any index in its investment objectives.
S&P 500 Index includes a representative sample of 500 hundred companies in leading industries of the U.S. economy. The Index focuses on the large-cap segment of the market, with over 80% coverage of U.S. equities, but is also considered a proxy for the total market.
MSCI ACWI NR USD Index is a free float-adjusted market capitalization weighted index that is designed to represent performance of the full opportunity set of large- and mid-cap stocks across 23 developed and 26 emerging markets.
CAGR is the compound annual growth rate is the rate of return (RoR) that would be required for an investment to grow from its beginning balance to its ending balance, assuming the profits were reinvested at the end of each period of the investment's life span.
Consumer Price Index (CPI) is an unmanaged index representing the rate of the inflation of U.S. consumer prices as determined by the U.S. Department of Labor Statistics. The CPI is presented to illustrate the Fund's purchasing power against changes in the prices of goods as opposed to a benchmark, which is used to compare the Fund's performance. There can be no guarantee that the CPI will reflect the exact level of inflation at any given time.
Bloomberg (BBg) US Aggregate Bond Index provides a measure of the performance of the US investment grade bonds market, which includes investment grade US Government bonds, investment grade corporate bonds, mortgage pass-through securities and asset-backed securities that are publicly offered for sale in the United States. The securities in the Index must have at least 1-year remaining in maturity. In addition, the securities must be denominated in US dollars and must be fixed rate, nonconvertible, and taxable.
60% S&P500/ 40% Bloomberg US Aggregate Bond Index is a hypothetical combination of unmanaged indices and comprises 60% S&P 500 Index and 40% Bloomberg US Aggregate Bond Index.
60% MSCI ACWI NR USD/ 40% Bloomberg US Aggregate Bond Index is a hypothetical combination of unmanaged indices and comprises 60% MSCI ACWI Index and 40% Bloomberg US Aggregate Bond Index.
Other Definitions
Corporate bond is a type of debt security that is issued by a firm and sold to investors. The company gets the capital it needs and in return the investor is paid a pre-established number of interest payments at either a fixed or variable interest rate.
Earnings Per Share (EPS) is calculated as a company's profit divided by the outstanding shares of its common stock. The resulting number serves as an indicator of a company's profitability.
12
FPA CRESCENT FUND
LETTER TO SHAREHOLDERS
(Continued)
Earnings Per Share Growth is defined as the percentage change in normalized earnings per share over the previous 12-month period to the latest year end.
Earnings yield refers to the earnings per share for the most recent 12-month period divided by the current market price per share. The earnings yield (the inverse of the P/E ratio) shows the percentage of a company's earnings per share.
Government bond is a debt security issued by a government to support government spending and obligations. Government bonds can pay periodic interest payments called coupon payments.
High-yield bonds (also called junk bonds) are bonds that pay higher interest rates because they have lower credit ratings than investment-grade bonds. High-yield bonds are more likely to default, so they must pay a higher yield than investment-grade bonds to compensate investors.
Inflation is the decline of purchasing power of a given currency over time. A quantitative estimate of the rate at which the decline in purchasing power occurs can be reflected in the increase of an average price level of a basket of selected goods and services in an economy over some period of time.
Investment grade is a rating that signifies that a municipal or corporate bond presents a relatively low risk of default.
Long Equity Performance represents the performance of stocks that the Fund owned over the given time periods and excludes the long equity portion of a pair trade, short-sales, limited partnerships, derivatives/futures, corporate bonds, mortgage backed securities, and cash and cash equivalents.
Market Capitalization refers to the total dollar market value of a company's outstanding shares of stock. Commonly referred to as "market cap," it is calculated by multiplying the total number of a company's outstanding shares by the current market price of one share.
Market Cycles, also known as stock market cycles, is a wide term referring to trends or patterns that emerge during different markets or business environments.
Net Equity Exposure includes long equity securities minus short-sales and preferred securities.
Net Risk Exposure is a measure of the extent to which a fund's trading book is exposed to market fluctuations. In regards to the Fund, it is the percent of the portfolio exposed to Risk Assets.
Price to Book is used to compare a firm's market capitalization to its book value. It's calculated by dividing the company's stock price per share by its book value per share (BVPS). An asset's book value is equal to its carrying value on the balance sheet, and companies calculate it netting the asset against its accumulated depreciation.
Price to Earnings is the ratio for valuing a company that measures its current share price relative to its EPS. The price-to-earnings ratio is also sometimes known as the price multiple or the earnings multiple.
Trailing Price to Earnings is a relative valuation multiple that is based on the last 12 months of actual earnings.
Forward Price to Earnings is a version of the ratio of price-to-earnings (P/E) that uses forecasted earnings for the P/E calculation.
Risk Assets is any asset that carries a degree of risk. Risk asset generally refers to assets that have a significant degree of price volatility, such as equities, commodities, high-yield bonds, real estate and currencies, but does not include cash and cash equivalents.
Standard Deviation is a measure of the dispersion of a set of data from its mean.
13
FPA CRESCENT FUND
LETTER TO SHAREHOLDERS
(Continued)
Treasury bonds (T-bonds) are government debt securities issued by the U.S. Federal government that have maturities greater than 20 years. T-bonds earn periodic interest until maturity, at which point the owner is also paid a par amount equal to the principal.
Volatility is a statistical measure of the dispersion of returns for a given security or market index. In most cases, the higher the volatility, the riskier the security. Volatility is often measured as either the standard deviation or variance between returns from that same security or market index.
Yield refers to the earnings generated and realized on an investment over a particular period of time. It's expressed as a percentage based on the invested amount, current market value, or face value of the security.
©2021 Morningstar, Inc. All Rights Reserved. The information contained herein: (1) is proprietary to Morningstar and/or its content providers; (2) may not be copied or distributed; and (3) is not warranted by Morningstar to be accurate, complete or timely. Neither Morningstar nor its content providers are responsible for any damages or losses arising from any use of this information. Past performance is no guarantee of future results.
The FPA Funds are distributed by UMB Distribution Services, LLC, 235 W. Galena Street, Milwaukee, WI, 53212.
14
FPA CRESCENT FUND
LETTER TO SHAREHOLDERS
(Continued)
The discussions of Fund investments represent the views of the Fund's managers at the time of this report and are subject to change without notice. These views may not be relied upon as investment advice or as an indication of trading intent on behalf of any First Pacific Advisors portfolio. Security examples featured are samples for presentation purposes and are intended to illustrate our investment philosophy and its application. It should not be assumed that most recommendations made in the future will be profitable or will equal the performance of the securities. This information and data has been prepared from sources believed reliable. The accuracy and completeness of the information cannot be guaranteed and is not a complete summary or statement of all available data.
FORWARD LOOKING STATEMENT DISCLOSURE
As mutual fund managers, one of our responsibilities is to communicate with shareholders in an open and direct manner. Insofar as some of our opinions and comments in our letters to shareholders are based on our current expectations, they are considered "forward-looking statements" which may or may not prove to be accurate over the long term. While we believe we have a reasonable basis for our comments and we have confidence in our opinions, actual results may differ materially from those we anticipate. You can identify forward-looking statements by words such as "believe," "expect," "may," "anticipate," and other similar expressions when discussing prospects for particular portfolio holdings and/or the markets, generally. We cannot, however, assure future results and disclaim any obligation to update or alter any forward-looking statements, whether as a result of new information, future events, or otherwise. Further, information provided in this report should not be construed as a recommendation to purchase or sell any particular security.
15
FPA CRESCENT FUND
HISTORICAL PERFORMANCE
(Unaudited)
Change in Value of a $10,000 Investment in FPA Crescent Fund Institutional Class vs. S&P 500, MSCI All Country World Index, 60%/40% S&P 500 Index/Bloomberg Barclays US Aggregate Bond Index and Consumer Price Index for the Ten Years Ended December 31, 2021
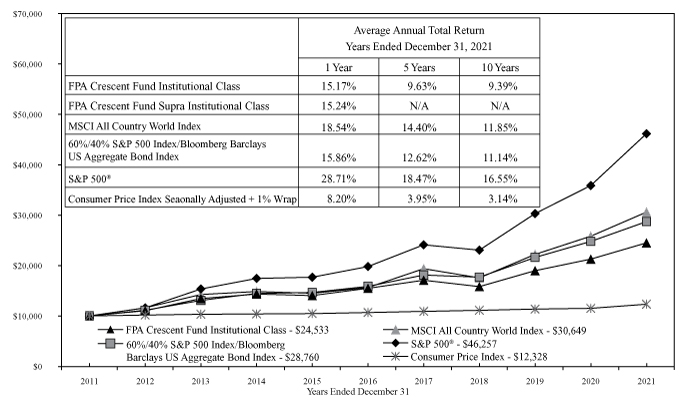
The Standard & Poor's 500 Stock Index (S&P 500) is a capitalization-weighted index which covers industrial, utility, transportation and financial service companies, and represents approximately 75% of the New York Stock Exchange (NYSE) capitalization and 30% of NYSE issuers and is considered a measure of large capitalization stock performance. The MSCI All Country World Index is a float-adjusted market capitalization index that is designed to measure the combined equity market performance of developed and emerging market countries. The 60%/40% S&P 500 Index/Bloomberg Barclays U.S. Aggregate Bond Index is a composite blend of 60% of the S&P 500 Index and 40% of the Bloomberg Barclays U.S. Aggregate Bond Index. The Consumer Price Index (CPI) is an unmanaged index representing the rate of inflation of U.S. consumer prices as determined by the U.S. Bureau of Labor Statistics. The S&P 500, MSCI All Country World and 60%/40% S&P 500/Bloomberg Barclays U.S. Aggregate Bond indexes are included as broad-based comparisons to the capitalization characteristics of the Fund's portfolio. The CPI is included as comparison of the Fund's results to inflation.
Past performance is no guarantee of future results and current performance may be higher or lower than the performance shown. This data represents past performance and investors should understand that investment returns and principal values fluctuate, so that when you redeem your investment may be worth more or less than its original cost. Current month-end performance data can be obtained by visiting the website at www.fpa.com or by calling toll-free, 1-800-982-4372. Information regarding the Fund's expense ratio and redemption fees can be found on pages 36, 37, 42 and 43. The Prospectus details the Fund's objective and policies, sales charges, and other matters of interest to prospective investors. Please read the Prospectus carefully before investing. The Prospectus may be obtained by visiting the website at www.fpa.com, by email at crm@fpa.com, toll-free by calling 1-800-982-4372 or by contacting the Fund in writing.
16
FPA CRESCENT FUND
PORTFOLIO SUMMARY
December 31, 2021
Common Stocks | | | | | 71.8 | % | |
Internet Media | | | 12.1 | % | | | | | |
Semiconductor Devices | | | 7.3 | % | | | | | |
Cable & Satellite | | | 5.9 | % | | | | | |
Application Software | | | 4.5 | % | | | | | |
Cement & Aggregates | | | 3.4 | % | | | | | |
Electrical Components | | | 3.1 | % | | | | | |
Diversified Banks | | | 3.0 | % | | | | | |
P&C Insurance | | | 2.9 | % | | | | | |
Banks | | | 2.5 | % | | | | | |
Industrial Distribution & Rental | | | 2.5 | % | | | | | |
Insurance Brokers | | | 2.3 | % | | | | | |
Base Metals | | | 2.3 | % | | | | | |
Investment Companies | | | 2.2 | % | | | | | |
Institutional Brokerage | | | 1.8 | % | | | | | |
Food Services | | | 1.7 | % | | | | | |
E-Commerce Discretionary | | | 1.3 | % | | | | | |
Chemicals | | | 1.3 | % | | | | | |
Infrastructure Software | | | 1.1 | % | | | | | |
Hotels, Restaurants & Leisure | | | 1.1 | % | | | | | |
Railroad Rolling Stock | | | 1.0 | % | | | | | |
Apparel, Footwear & Accessory Design | | | 1.0 | % | | | | | |
Specialty Chemicals | | | 1.0 | % | | | | | |
Wealth Management | | | 0.9 | % | | | | | |
Telecom Carriers | | | 0.9 | % | | | | | |
Midstream — Oil & Gas | | | 0.8 | % | | | | | |
Commercial & Residential Building
Equipment & Systems | | | 0.8 | % | | | | | |
Computer Hardware & Storage | | | 0.7 | % | | | | | |
Real Estate Owners & Developers | | | 0.6 | % | | | | | |
Marine Shipping | | | 0.5 | % | | | | | |
Industrials | | | 0.5 | % | | | | | |
Integrated Utilities | | | 0.4 | % | | | | | |
Entertainment Content | | | 0.2 | % | | | | | |
Oil & Gas Services & Equipment | | | 0.2 | % | | | | | |
Closed End Fund | | | | | 0.3 | % | |
Limited Partnerships | | | | | 1.5 | % | |
Preferred Stocks | | | | | 0.1 | % | |
Warrant | | | | | 0.0 | % | |
Special Purpose Acquisition Companies | | | | | 3.2 | % | |
Bonds & Debentures | | | | | 18.5 | % | |
U.S. Treasuries | | | 18.3 | % | | | | | |
Corporate Bank Debt | | | 0.2 | % | | | | | |
Corporate Bonds & Notes | | | 0.0 | % | | | | | |
Short-term Investments | | | | | 5.7 | % | |
Securities Sold Short | | | | | (2.5 | )% | |
Other Assets And Liabilities, Net | | | | | 1.4 | % | |
Net Assets | | | | | 100.0 | % | |
17
FPA CRESCENT FUND
PORTFOLIO OF INVESTMENTS
December 31, 2021
COMMON STOCKS | | Shares | | Fair Value | |
INTERNET MEDIA — 12.1% | |
Alphabet, Inc. Class A(a) | | | 120,086 | | | $ | 347,893,946 | | |
Alphabet, Inc. Class C(a) | | | 92,424 | | | | 267,437,162 | | |
Baidu, Inc. ADR (China)(a) | | | 3,912,174 | | | | 72,548,475 | | |
Meta Platforms, Inc. Class A(a) | | | 895,761 | | | | 301,289,212 | | |
Naspers, Ltd. N Shares (South Africa) | | | 345,972 | | | | 53,670,711 | | |
Prosus NV (Netherlands) | | | 2,430,289 | | | | 203,448,914 | | |
| | | $ | 1,246,288,420 | | |
SEMICONDUCTOR DEVICES — 7.3% | |
Analog Devices, Inc. | | | 1,683,454 | | | $ | 295,900,710 | | |
Broadcom, Inc. | | | 536,804 | | | | 357,194,750 | | |
NXP Semiconductors NV (Netherlands) | | | 429,743 | | | | 97,886,860 | | |
| | | $ | 750,982,320 | | |
CABLE & SATELLITE — 5.9% | |
Charter Communications, Inc. Class A(a)(b) | | | 390,978 | | | $ | 254,905,927 | | |
Comcast Corp. Class A(b) | | | 6,979,258 | | | | 351,266,055 | | |
| | | $ | 606,171,982 | | |
APPLICATION SOFTWARE — 4.5% | |
Activision Blizzard, Inc. | | | 2,313,470 | | | $ | 153,915,159 | | |
Entain PLC (Isle of Man)(a) | | | 3,205,123 | | | | 73,013,490 | | |
Epic Games, Inc.(a)(c)(d)(e) | | | 33,130 | | | | 29,320,050 | | |
Nexon Co. Ltd. (Japan) | | | 4,096,691 | | | | 79,205,779 | | |
Open Text Corp. (Canada) | | | 1,515,451 | | | | 71,953,613 | | |
Ubisoft Entertainment SA (France)(a) | | | 1,111,750 | | | | 54,514,860 | | |
| | | $ | 461,922,951 | | |
CEMENT & AGGREGATES — 3.4% | |
HeidelbergCement AG (Germany) | | | 1,012,913 | | | $ | 68,638,527 | | |
LafargeHolcim Ltd. (Switzerland) | | | 5,535,770 | | | | 282,559,990 | | |
| | | $ | 351,198,517 | | |
ELECTRICAL COMPONENTS — 3.1% | |
TE Connectivity Ltd. (Switzerland) | | | 1,944,520 | | | $ | 313,728,857 | | |
DIVERSIFIED BANKS — 3.0% | |
Citigroup, Inc. | | | 3,571,897 | | | $ | 215,706,860 | | |
Flutter Entertainment PLC (Ireland)(a) | | | 369,704 | | | | 58,848,549 | | |
Gulfport Energy Corp.(a) | | | 503,402 | | | | 36,260,046 | | |
| | | $ | 310,815,455 | | |
18
FPA CRESCENT FUND
PORTFOLIO OF INVESTMENTS (Continued)
December 31, 2021
COMMON STOCKS — Continued | | Shares | | Fair Value | |
P&C INSURANCE — 2.9% | |
American International Group, Inc.(b) | | | 5,195,127 | | | $ | 295,394,921 | | |
BANKS — 2.5% | |
Signature Bank | | | 86,091 | | | $ | 27,847,856 | | |
Wells Fargo & Co. | | | 4,809,287 | | | | 230,749,590 | | |
| | | $ | 258,597,446 | | |
INDUSTRIAL DISTRIBUTION & RENTAL — 2.5% | |
Howmet Aerospace, Inc. | | | 4,577,152 | | | $ | 145,690,748 | | |
LG Corp. (South Korea) | | | 1,610,540 | | | | 109,604,783 | | |
| | | $ | 255,295,531 | | |
INSURANCE BROKERS — 2.3% | |
Aon PLC Class A (Britain) | | | 790,294 | | | $ | 237,530,765 | | |
BASE METALS — 2.3% | |
Glencore PLC (Switzerland) | | | 46,063,352 | | | $ | 233,777,756 | | |
INVESTMENT COMPANIES — 2.2% | |
Groupe Bruxelles Lambert SA (Belgium) | | | 2,039,158 | | | $ | 227,886,352 | | |
INSTITUTIONAL BROKERAGE — 1.8% | |
Jefferies Financial Group, Inc.(b) | | | 4,697,583 | | | $ | 182,266,220 | | |
FOOD SERVICES — 1.7% | |
JDE Peet's NV (Netherlands) | | | 4,041,690 | | | $ | 124,699,634 | | |
Just Eat Takeaway.com NV (Netherlands)(a)(f) | | | 965,437 | | | | 53,275,784 | | |
| | | $ | 177,975,418 | | |
E-COMMERCE DISCRETIONARY — 1.3% | |
Alibaba Group Holding Ltd. ADR(China)(a) | | | 5,586,312 | | | $ | 85,182,204 | | |
Amazon.com, Inc.(a) | | | 15,136 | | | | 50,468,570 | | |
| | | $ | 135,650,774 | | |
CHEMICALS — 1.3% | |
International Flavors & Fragrances, Inc. | | | 867,290 | | | $ | 130,657,238 | | |
INFRASTRUCTURE SOFTWARE — 1.1% | |
FirstEnergy Corp. | | | 2,789,666 | | | $ | 116,022,209 | | |
HOTELS, RESTAURANTS & LEISURE — 1.1% | |
Marriott International, Inc. Class A(a) | | | 693,390 | | | $ | 114,575,764 | | |
19
FPA CRESCENT FUND
PORTFOLIO OF INVESTMENTS (Continued)
December 31, 2021
COMMON STOCKS — Continued | | Shares | | Fair Value | |
RAILROAD ROLLING STOCK — 1.0% | |
Westinghouse Air Brake Technologies Corp. | | | 1,123,039 | | | $ | 103,443,122 | | |
APPAREL, FOOTWEAR & ACCESSORY DESIGN — 1.0% | |
Cie Financiere Richemont SA (Switzerland) | | | 676,970 | | | $ | 101,746,095 | | |
SPECIALTY CHEMICALS — 1.0% | |
Univar Solutions, Inc.(a) | | | 3,486,932 | | | $ | 98,854,522 | | |
WEALTH MANAGEMENT — 0.9% | |
LPL Financial Holdings, Inc. | | | 606,686 | | | $ | 97,124,362 | | |
TELECOM CARRIERS — 0.9% | |
SoftBank Group Corp. (Japan) | | | 1,963,022 | | | $ | 92,732,866 | | |
MIDSTREAM — OIL & GAS — 0.8% | |
Kinder Morgan, Inc.(b) | | | 5,262,897 | | | $ | 83,469,546 | | |
COMMERCIAL & RESIDENTIAL BUILDING EQUIPMENT &
SYSTEMS — 0.8% | |
Samsung C&T Corp. (South Korea) | | | 801,618 | | | $ | 80,246,092 | | |
COMPUTER HARDWARE & STORAGE — 0.7% | |
Dell Technologies, Inc. C Shares(a) | | | 1,192,689 | | | $ | 66,993,341 | | |
REAL ESTATE OWNERS & DEVELOPERS — 0.6% | |
Swire Pacific Ltd. Class A (Hong Kong) | | | 10,113,170 | | | $ | 57,520,515 | | |
MARINE SHIPPING — 0.5% | |
Sound Holding FP (Luxembourg)(c)(d)(e)(g)(h) | | | 1,146,250 | | | $ | 55,564,380 | | |
INDUSTRIALS — 0.5% | |
Uber Technologies, Inc.(a) | | | 1,183,677 | | | $ | 49,631,577 | | |
INTEGRATED UTILITIES — 0.4% | |
PG&E Corp.(a) | | | 3,597,611 | | | $ | 43,674,998 | | |
20
FPA CRESCENT FUND
PORTFOLIO OF INVESTMENTS (Continued)
December 31, 2021
COMMON STOCKS — Continued | | Shares | | Fair Value | |
ENTERTAINMENT CONTENT — 0.2% | |
Netflix, Inc.(a) | | | 42,588 | | | $ | 25,656,715 | | |
OIL & GAS SERVICES & EQUIPMENT — 0.2% | |
McDermott International Ltd.(a)(g) | | | 46,782,420 | | | $ | 19,180,792 | | |
| TOTAL COMMON STOCKS — 71.8% (Cost $4,545,733,988) | | $ | 7,382,577,819 | | |
CLOSED END FUND — 0.3% | |
Altaba Escrow(c)(Cost $0) | | | 4,756,180 | | | $ | 28,204,147 | | |
LIMITED PARTNERSHIPS | |
FPS LLC (Marine Shipping)(c)(d)(e)(g)(h) | | | 1,185,446 | | | $ | 83,704,351 | | |
FPS Shelby Holding I LLC (Marine Shipping)(c)(d)(e)(g)(h) | | | 107,799 | | | | 8,876,468 | | |
Footpath Ventures SpV IV LP (Private Credit)(c)(d)(e) | | | 150,000 | | | | 15,108,448 | | |
GACP II LP (Private Credit)(c)(d)(e) | | | 958,312 | | | | 29,634,927 | | |
U.S. Farming Realty Trust LP (Real Estate)(c)(d)(e)(g) | | | 350,000 | | | | 5,966,001 | | |
U.S. Farming Realty Trust II LP (Real Estate)(c)(d)(e)(g) | | | 120,000 | | | | 8,343,236 | | |
| TOTAL LIMITED PARTNERSHIPS — 1.5% (Cost $152,581,792) | | $ | 151,633,431 | | |
PREFERRED STOCKS | |
ENGINEERING SERVICES — 0.1% | |
McDermott International, Inc.(c)(d)(e)(g) | | | 22,591 | | | $ | 13,554,380 | | |
ENERGY — 0.0% | |
Gulfport Energy Corp.(d)(e) | | | 1,345 | | | $ | 727,363 | | |
| TOTAL PREFERRED STOCKS — 0.1% (Cost $1,272,525) | | $ | 14,281,743 | | |
WARRANT — 0.0% | |
ENERGY — 0.0% | |
Cie Financiere Richemont SA 11/22/2023(a) (Cost $0) | | | 2,521,536 | | | $ | 2,767,270 | | |
21
FPA CRESCENT FUND
PORTFOLIO OF INVESTMENTS (Continued)
December 31, 2021
SPECIAL PURPOSE ACQUISITION COMPANIES(a) — 3.2% | | Shares | | Fair Value | |
Accelerate Acquisition Corp. | | | 1,824 | | | $ | 18,185 | | |
African Gold Acquisition Corp. | | | 175,509 | | | | 1,769,131 | | |
Agile Growth Corp. | | | 972,411 | | | | 9,539,352 | | |
Alpha Partners Technology Merger Corp. | | | 40,319 | | | | 397,142 | | |
Angel Pond Holdings Corp. | | | 948,163 | | | | 9,367,850 | | |
Apollo Strategic Growth Capital II | | | 206,968 | | | | 2,061,401 | | |
Ares Acquisition Corp. | | | 494,451 | | | | 4,909,898 | | |
Artisan Acquisition Corp. Class A | | | 42,770 | | | | 325,484 | | |
Atlantic Coastal Acquisition Corp. | | | 1,651,462 | | | | 12,344,725 | | |
Babylon Holdings Ltd.(a) | | | 12,409 | | | | 8,438 | | |
BigBear.ai Holdings, Inc. | | | 266,952 | | | | 216,231 | | |
Broadscale Acquisition Corp. | | | 1,046,401 | | | | 8,517,706 | | |
BurTech Acquisition Corp. | | | 438,637 | | | | 4,390,756 | | |
Churchill Capital Corp. VII | | | 616,422 | | | | 6,177,165 | | |
Colonnade Acquisition Corp. II | | | 1,032,132 | | | | 10,197,464 | | |
COVA Acquisition Corp. | | | 334,885 | | | | 3,348,850 | | |
DHC Acquisition Corp. | | | 520,584 | | | | 5,091,312 | | |
Digital Transformation Opportunities Corp. | | | 72,255 | | | | 716,047 | | |
Disruptive Acquisition Corp. I | | | 1,032,135 | | | | 10,125,244 | | |
ESM Acquisition Corp. | | | 157 | | | | 1,559 | | |
Flame Acquisition Corp. | | | 1,032,145 | | | | 10,300,807 | | |
Forest Road Acquisition Corp. II | | | 1,242,983 | | | | 12,319,205 | | |
Fortress Value Acquisition Corp. IV | | | 493,906 | | | | 4,850,157 | | |
FTAC Hera Acquisition Corp. | | | 124,395 | | | | 1,238,974 | | |
Fusion Acquisition Corp. II | | | 173,927 | | | | 1,721,008 | | |
Glenfarne Merger Corp. | | | 1,033,214 | | | | 10,249,483 | | |
Global Partner Acquisition Corp. II | | | 387,688 | | | | 3,818,727 | | |
Golden Arrow Merger Corp. | | | 1,032,132 | | | | 10,114,894 | | |
Gores Holdings VII, Inc. | | | 4,846 | | | | 48,412 | | |
Gores Holdings VIII, Inc. | | | 264,895 | | | | 2,461,460 | | |
Gores Technology Partners II, Inc. | | | 6,490 | | | | 65,419 | | |
GX Acquisition Corp. II | | | 864,261 | | | | 6,402,015 | | |
Haymaker Acquisition Corp. III | | | 9,171 | | | | 73,443 | | |
Heliogen, Inc. | | | 98,835 | | | | 168,019 | | |
Hudson Executive Investment Corp. III | | | 1,243,215 | | | | 12,195,939 | | |
InterPrivate IV InfraTech Partners, Inc. | | | 866,479 | | | | 8,534,818 | | |
Kismet Acquisition Three Corp. | | | 1,032,132 | | | | 10,114,894 | | |
Landcadia Holdings IV, Inc. | | | 1,243,001 | | | | 12,430,010 | | |
Lazard Growth Acquisition Corp. I | | | 37,457 | | | | 370,450 | | |
Lead Edge Growth Opportunities Ltd. | | | 111,893 | | | | 1,121,168 | | |
22
FPA CRESCENT FUND
PORTFOLIO OF INVESTMENTS (Continued)
December 31, 2021
SPECIAL PURPOSE ACQUISITION COMPANIES — Continued | | Shares or
Principal
Amount | | Fair Value | |
Macondray Capital Acquisition Corp. I | | | 1,030,833 | | | $ | 10,277,405 | | |
Mason Industrial Technology, Inc. | | | 760,239 | | | | 7,541,571 | | |
Metals Acquisition Corp. | | | 539,903 | | | | 5,318,045 | | |
Mission Advancement Corp. | | | 613,285 | | | | 6,071,521 | | |
Monument Circle Acquisition Corp. | | | 69,903 | | | | 692,739 | | |
Northern Star Investment Corp. III | | | 550,747 | | | | 5,466,164 | | |
Northern Star Investment Corp. IV | | | 425,470 | | | | 4,216,408 | | |
Orion Acquisition Corp. | | | 252,217 | | | | 2,484,337 | | |
Peridot Acquisition Corp. II | | | 582,407 | | | | 5,783,302 | | |
Pershing Square Tontine Holdings Ltd. Class A | | | 457,176 | | | | 9,015,511 | | |
Pine Technology Acquisition Corp. | | | 1,290,095 | | | | 9,704,737 | | |
Plum Acquisition Corp. I | | | 969,880 | | | | 9,436,932 | | |
Queen's Gambit Growth Capital | | | 109,868 | | | | 833,354 | | |
Ross Acquisition Corp. II | | | 231,224 | | | | 2,316,864 | | |
RXR Acquisition Corp. | | | 9,883 | | | | 97,842 | | |
Silver Spike Acquisition Corp. II | | | 130,768 | | | | 1,301,142 | | |
Slam Corp. | | | 714,327 | | | | 7,057,551 | | |
Stratim Cloud Acquisition Corp. | | | 671,649 | | | | 6,582,160 | | |
TCW Special Purpose Acquisition Corp. | | | 118,726 | | | | 1,175,387 | | |
Tio Tech A (Germany) | | | 297,050 | | | | 2,946,736 | | |
TLG Acquisition One Corp. | | | 1,242,983 | | | | 12,305,532 | | |
Twelve Seas Investment Co. II | | | 990,015 | | | | 9,830,849 | | |
Viking Acquisition (Norway)(c)(d)(e) | | | 9,562,500 | | | | 7,238,931 | | |
Virgin Orbit Holdings, Inc. | | | 94,559 | | | | 132,383 | | |
TOTAL SPECIAL PURPOSE ACQUISITION COMPANIES — 3.2%
(Cost $328,301,389) | | $ | 325,950,645 | | |
BONDS & DEBENTURES | |
CORPORATE BONDS & NOTES | |
ENERGY — 0.0% | |
Gulfport Energy Corp. — 6.000% 10/15/2024(d)(e) | | $ | 18,209,000 | | | $ | — | | |
Gulfport Energy Corp. — 6.375% 5/15/2025(d)(e) | | | 8,822,000 | | | | — | | |
Gulfport Energy Corp. — 6.375% 1/15/2026(d)(e) | | | 9,128,000 | | | | — | | |
Gulfport Energy Corp. — 6.625% 5/1/2023(d)(e) | | | 9,417,000 | | | | — | | |
| | | $ | — | | |
| TOTAL CORPORATE BONDS & NOTES — 0.0% (Cost $0) | | $ | — | | |
23
FPA CRESCENT FUND
PORTFOLIO OF INVESTMENTS (Continued)
December 31, 2021
BONDS & DEBENTURES — Continued | | Principal
Amount | | Fair Value | |
CORPORATE BANK DEBT | |
McDermott LC,
1M USD LIBOR + 4.000% — 4.131% 12/31/2025(c)(d)(e)(g)(i)(j) | | $ | 28,718,370 | | | $ | 17,142,040 | | |
McDermott Senior Exit LC — 3.000% 6/30/2024(e)(g)(i) | | | 19,843,000 | | | | (9,326,210 | ) | |
McDermott Technology Americas, Inc.,
1M USD LIBOR + 1.000% — 1.087% 6/30/2025(c)(g)(j) | | | 33,083,090 | | | | 14,225,729 | | |
McDermott Technology Americas, Inc.,
1M USD LIBOR + 3.000% — 3.090% 6/30/2024(c)(g)(j) | | | 1,074,102 | | | | 612,238 | | |
Steenbok LUX Financial 2 SARL, PIK — 10.750% 12/31/2022(c) | | | 741,988 | | | | 763,446 | | |
| TOTAL CORPORATE BANK DEBT — 0.2% (Cost $97,809,620) | | $ | 23,417,243 | | |
U.S. TREASURIES | |
U.S. Treasury Bills — 0.020% 2/24/2022(k) | | $ | 70,000,000 | | | $ | 69,994,911 | | |
U.S. Treasury Bills — 0.030% 1/13/2022(k) | | | 100,000,000 | | | | 99,999,440 | | |
U.S. Treasury Bills — 0.030% 1/18/2022(k) | | | 100,000,000 | | | | 99,998,360 | | |
U.S. Treasury Bills — 0.030% 1/27/2022(k) | | | 85,000,000 | | | | 84,997,458 | | |
U.S. Treasury Bills — 0.030% 3/1/2022(k) | | | 121,000,000 | | | | 120,989,134 | | |
U.S. Treasury Bills — 0.033% 2/22/2022(k) | | | 118,000,000 | | | | 117,994,348 | | |
U.S. Treasury Bills — 0.035% 3/31/2022(k) | | | 120,000,000 | | | | 119,986,644 | | |
U.S. Treasury Bills — 0.037% 3/3/2022(k) | | | 40,000,000 | | | | 39,996,684 | | |
U.S. Treasury Bills — 0.038% 1/25/2022(k) | | | 127,000,000 | | | | 126,999,047 | | |
U.S. Treasury Bills — 0.041% 1/4/2022(k) | | | 125,000,000 | | | | 124,999,912 | | |
U.S. Treasury Bills — 0.041% 1/11/2022(k) | | | 77,000,000 | | | | 76,999,361 | | |
U.S. Treasury Bills — 0.041% 2/1/2022(k) | | | 90,000,000 | | | | 89,994,492 | | |
U.S. Treasury Bills — 0.043% 2/8/2022(k) | | | 50,000,000 | | | | 49,998,890 | | |
U.S. Treasury Bills — 0.043% 2/17/2022(k) | | | 100,000,000 | | | | 99,995,980 | | |
U.S. Treasury Bills — 0.046% 1/6/2022(k) | | | 75,000,000 | | | | 74,999,813 | | |
U.S. Treasury Bills — 0.047% 3/10/2022(k) | | | 110,000,000 | | | | 109,985,810 | | |
U.S. Treasury Bills — 0.047% 5/5/2022(k) | | | 200,000,000 | | | | 199,937,900 | | |
U.S. Treasury Bills — 0.048% 1/20/2022(k) | | | 75,000,000 | | | | 74,999,423 | | |
U.S. Treasury Cash Management Bills — 0.025% 2/15/2022(k) | | | 100,000,000 | | | | 99,996,470 | | |
| TOTAL U.S. TREASURIES — 18.3% (Cost $1,882,908,376) | | $ | 1,882,864,077 | | |
| TOTAL BONDS & DEBENTURES — 18.5% (Cost $1,980,717,996) | | $ | 1,906,281,320 | | |
TOTAL INVESTMENT SECURITIES — 95.4%
(Cost $7,008,607,690) | | $ | 9,811,696,375 | | |
24
FPA CRESCENT FUND
PORTFOLIO OF INVESTMENTS (Continued)
December 31, 2021
SHORT-TERM INVESTMENTS | | Shares or
Principal
Amount | | Fair Value | |
Amazon.com, Inc. | |
| — 0.061% 2/11/2022 | | $ | 17,000,000 | | | $ | 16,998,838 | | |
| — 0.061% 2/14/2022 | | | 43,000,000 | | | | 42,996,847 | | |
Apple, Inc. — 0.051% 1/11/2022 | | | 25,000,000 | | | | 24,999,653 | | |
Cisco Systems, Inc. | |
| — 0.081% 2/2/2022 | | | 60,000,000 | | | | 59,995,733 | | |
| — 0.081% 2/3/2022 | | | 20,000,000 | | | | 19,998,533 | | |
Johnson & Johnson — 0.061% 2/15/2022 | | | 40,000,000 | | | | 39,997,000 | | |
Nestle Capital Corp. — 0.071% 1/12/2022 | | | 125,000,000 | | | | 124,997,326 | | |
National Finance International Ltd. — 0.071% 1/11/2022 | | | 45,200,000 | | | | 45,199,121 | | |
Roche Holdings, Inc | |
| — 0.041% 1/19/2022 | | | 25,000,000 | | | | 24,999,500 | | |
| — 0.041% 1/21/2022 | | | 25,000,000 | | | | 24,999,445 | | |
Roche Holdings, Inc. — 0.051% 1/10/2022 | | | 60,000,000 | | | | 59,999,250 | | |
State Street Bank Repurchase Agreement — 0.00% 1/3/2022
(Dated 12/31/2021, repurchase price of $104,822,000, collateralized by
$105,499,400 principal amount U.S. Treasury Notes 0.625% —
1.75% 2027 — 2028, fair value $106,918,513)(l) | | | 104,822,000 | | | | 104,822,000 | | |
TOTAL SHORT-TERM INVESTMENTS — 5.7%
(Cost $590,003,246) | | $ | 590,003,246 | | |
| TOTAL INVESTMENTS — 101.1% (Cost $7,598,610,936) | | $ | 10,401,699,621 | | |
SECURITIES SOLD SHORT — (2.5)% | |
COMMON STOCKS SOLD SHORT — (2.5)% | |
SoftBank Corp. (Japan) | | | (1,426,732 | ) | | | (18,040,352 | ) | |
SPDR S&P 500 ETF Trust | | | (505,929 | ) | | | (240,296,038 | ) | |
TOTAL COMMON STOCKS SOLD SHORT
(Proceeds $188,622,673) | | $ | (258,336,390 | ) | |
| TOTAL SECURITIES SOLD SHORT(Proceeds $188,622,673) | | $ | (258,336,390 | ) | |
Other assets and liabilities, net — 1.4% | | | 141,592,762 | | |
NET ASSETS — 100.0% | | $ | 10,284,955,993 | | |
25
FPA CRESCENT FUND
PORTFOLIO OF INVESTMENTS (Continued)
December 31, 2021
(a) Non-income producing security.
(b) As of December 31, 2021, investments with a value of $947,582,500 were fully or partially segregated with the broker(s)/custodian as collateral for short option contracts.
(c) Restricted securities. These restricted securities constituted 3.29% of total net assets at December 31, 2021, most of which are considered liquid by the Adviser. These securities are not registered and may not be sold to the public. There are legal and/or contractual restrictions on resale. The Fund does not have the right to demand that such securities be registered. The values of these securities are determined by valuations provided by pricing services, brokers, dealers, market makers, or in good faith under policies adopted by authority of the Fund's Board of Trustees.
(d) These securities have been valued in good faith under policies adopted by authority of the Board of Trustees in accordance with the Fund's fair value procedures. These securities constituted 2.68% of total net assets at December 31, 2021.
(e) Investments categorized as a significant unobservable input (Level 3) (See Note 8 of the Notes to Financial Statements).
(f) Security exempt from registration under Rule 144A of the Securities Act of 1933. These securities may be resold in transactions exempt from registration, typically only to qualified institutional buyers. Unless otherwise indicated, these securities are not considered to be illiquid.
(g) Affiliated Security.
(h) Controlled company.
(i) All or a portion of this holding is subject to unfunded loan commitments. The stated interest rate reflects the weighted average of the reference rate and spread for the funded portion, if any, and the commitment fees on the portion of the loan that is unfunded.
(j) Variable/Floating Rate Security — The rate shown is based on the latest available information as of December 31, 2021. For Corporate Bank Debt, the rate shown may represent a weighted average interest rate. Certain variable rate securities are not based on a published rate and spread but are determined by the issuer or agent and are based on current market conditions. These securities do not indicate a reference rate and spread in their description.
(k) Zero coupon bond. Coupon amount represents effective yield to maturity.
(l) Security pledged as collateral (See Note 10 of the Notes to Financial Statements)
26
FPA CRESCENT FUND
PORTFOLIO OF INVESTMENTS (Continued)
December 31, 2021
Purchased Options
Description | | Pay/
Receive
Floating
Rate | | Floating
Rate
Index | | Exercise
Rate | | Expiration
Date | | Counter-
party | | Notional
Amount | | Premium | | Fair Value | |
Call —
CMS Cap
Swap(c)(e) | | Receive | | Maximum of
[0, 30-Year —
3-Year —
USD-ISDA
Swap Rate —
0.04] | | | 0.04 | % | | 2/15/2023 | | Barclays
Bank
PLC | | $ | 4,776,000,000 | | | $ | 1,265,640 | | | $ | 682,968 | | |
Call —
CMS Cap
Swap(c)(e) | | Receive | | Maximum of
[0, 30-Year —
3-Year —
USD-ISDA
Swap Rate —
0.04] | | | 0.04 | % | | 2/22/2023 | | Barclays
Bank
PLC | | | 4,776,000,000 | | | | 1,265,640 | | | | 702,072 | | |
Call —
CMS Cap
Swap(c)(e) | | Receive | | Maximum of
[0, 30-Year —
3-Year —
USD-ISDA
Swap Rate —
0.04] | | | 0.04 | % | | 3/01/2023 | | Barclays
Bank
PLC | | | 4,776,000,000 | | | | 1,265,640 | | | | 740,280 | | |
Call —
CMS Cap
Swap(c)(e) | | Receive | | Maximum of
[0, 30-Year —
3-Year —
USD-ISDA
Swap Rate —
0.04] | | | 0.04 | % | | 3/08/2023 | | Barclays
Bank
PLC | | | 4,776,000,000 | | | | 1,265,640 | | | | 764,160 | | |
Call —
CMS Cap
Swap(c)(e) | | Receive | | Maximum of
[0, 30-Year —
3-Year —
USD-ISDA
Swap Rate —
0.04] | | | 0.04 | % | | 2/15/2023 | | Goldman
Sachs
Inter-
national | | | 9,204,500,000 | | | | 2,531,237 | | | | 902,041 | | |
Call —
CMS Cap
Swap(c)(e) | | Receive | | Maximum of
[0, 30-Year —
3-Year —
USD-ISDA
Swap Rate —
0.04] | | | 0.04 | % | | 2/22/2023 | | Goldman
Sachs
Inter-
national | | | 9,204,500,000 | | | | 2,531,238 | | | | 920,450 | | |
27
FPA CRESCENT FUND
PORTFOLIO OF INVESTMENTS (Continued)
December 31, 2021
Description | | Pay/
Receive
Floating
Rate | | Floating
Rate
Index | | Exercise
Rate | | Expiration
Date | | Counter-
party | | Notional
Amount | | Premium | | Fair Value | |
Call —
CMS Cap
Swap(c)(e) | | Receive | | Maximum of
[0, 30-Year —
3-Year —
USD-ISDA
Swap Rate —
0.04] | | | 0.04 | % | | 3/01/2023 | | Goldman
Sachs
Inter-
national | | $ | 9,204,500,000 | | | $ | 2,531,237 | | | $ | 948,063 | | |
Call —
CMS Cap
Swap(c)(e) | | Receive | | Maximum of
[0, 30-Year —
3-Year —
USD-ISDA
Swap Rate —
0.04] | | | 0.04 | % | | 3/08/2023 | | Goldman
Sachs
Inter-
national | | | 9,204,500,000 | | | | 2,531,238 | | | | 975,677 | | |
Call —
CMS Cap
Swap(c)(e) | | Receive | | Maximum of
[0, 30-Year —
3-Year —
USD-ISDA
Swap Rate —
0.04] | | | 0.04 | % | | 2/15/2023 | | Morgan
Stanley | | | 5,062,500,000 | | | | 1,265,625 | | | | 374,625 | | |
Call —
CMS Cap
Swap(c)(e) | | Receive | | Maximum of
[0, 30-Year —
3-Year —
USD-ISDA
Swap Rate —
0.04] | | | 0.04 | % | | 2/22/2023 | | Morgan
Stanley | | | 5,062,500,000 | | | | 1,265,625 | | | | 394,875 | | |
Call —
CMS Cap
Swap(c)(e) | | Receive | | Maximum of
[0, 30-Year —
3-Year —
USD-ISDA
Swap Rate —
0.04] | | | 0.04 | % | | 3/01/2023 | | Morgan
Stanley | | | 5,062,500,000 | | | | 1,265,625 | | | | 415,125 | | |
Call —
CMS Cap
Swap(c)(e) | | Receive | | Maximum of
[0, 30-Year —
3-Year —
USD-ISDA
Swap Rate —
0.04] | | | 0.04 | % | | 3/08/2023 | | Morgan
Stanley | | | 5,062,500,000 | | | | 1,265,625 | | | | 440,438 | | |
Call —
OIS Cap
Swap(c)(e) | | Receive | | 3-Month
USD-LIBOR | | | 0.68 | % | | 1/11/2029 | | Morgan
Stanley | | | 260,061,813 | | | | 7,038,227 | | | | 14,960,836 | | |
| | | $ | 27,288,237 | | | $ | 23,221,610 | | |
28
FPA CRESCENT FUND
PORTFOLIO OF INVESTMENTS (Continued)
December 31, 2021
Written Options
Description | | Pay/
Receive
Floating
Rate | | Floating
Rate
Index | | Exercise
Rate | | Expiration
Date | | Counter-
party | | Notional
Amount | | Premium | | Fair Value | |
Put — OIS
Floor
Swap(c)(e) | | Pay | | 3-Month
USD-LIBOR | | | 0.35 | % | | 1/11/2029 | | Morgan
Stanley | | $ | (260,061,813 | ) | | $ | (7,038,227 | ) | | $ | (3,501,472 | ) | |
29
FPA CRESCENT FUND
PORTFOLIO OF INVESTMENTS — RESTRICTED SECURITIES
December 31, 2021
Issuer | | Acquisition
Date(s) | | Cost | | Fair Value | | Fair
Value as a %
of Net Assets | |
Altaba Escrow | | 09/01/2021 | | | — | | | $ | 28,204,147 | | | | 0.27 | % | |
CMS CAP SWAPTION 4.000
FEB23 4.000 CALL Barclays
Bank PLC 4.000% 02/15/2023 | | 02/26/2020 | | $ | 1,265,640 | | | | 682,968 | | | | 0.01 | % | |
CMS CAP SWAPTION 4.000
FEB23 4.000 CALL Barclays
Bank PLC
4.000% 02/22/2023 | | 02/26/2020 | | | 1,265,640 | | | | 702,072 | | | | 0.01 | % | |
CMS CAP SWAPTION 4.000
MAR23 4.000 CALL Barclays
Bank PLC 4.000% 03/01/2023 | | 02/26/2020 | | | 1,265,640 | | | | 740,280 | | | | 0.01 | % | |
CMS CAP SWAPTION 4.000
MAR23 4.000 CALL Barclays
Bank PLC 4.000% 03/08/2023 | | 02/26/2020 | | | 1,265,640 | | | | 764,160 | | | | 0.01 | % | |
CMS CAP SWAPTION 4.000
FEB23 4.000 CALL Goldman
Sachs International 4.000%
02/15/2023 | | 02/26/2020 | | | 2,531,237 | | | | 902,041 | | | | 0.01 | % | |
CMS CAP SWAPTION 4.000
FEB23 4.000 CALL Goldman
Sachs International 4.000%
02/22/2023 | | 02/26/2020 | | | 2,531,238 | | | | 920,450 | | | | 0.01 | % | |
CMS CAP SWAPTION 4.000
MAR23 4.000 CALL Goldman
Sachs International 4.000%
03/01/2023 | | 02/26/2020 | | | 2,531,237 | | | | 948,063 | | | | 0.01 | % | |
CMS CAP SWAPTION 4.000
MAR23 4.000 CALL Goldman
Sachs International 4.000%
03/08/2023 | | 02/26/2020 | | | 2,531,238 | | | | 975,677 | | | | 0.01 | % | |
CMS CAP SWAPTION 4.000
FEB23 4.000 CALL Morgan
Stanley 4.000% 02/15/2023 | | 02/26/2020 | | | 1,265,625 | | | | 374,625 | | | | 0.00 | % | |
CMS CAP SWAPTION 4.000
FEB23 4.000 CALL Morgan
Stanley 4.000% 02/22/2023 | | 02/26/2020 | | | 1,265,625 | | | | 394,875 | | | | 0.00 | % | |
CMS CAP SWAPTION 4.000
MAR23 4.000 CALL Morgan
Stanley 4.000% 03/01/2023 | | 02/26/2020 | | | 1,265,625 | | | | 415,125 | | | | 0.00 | % | |
CMS CAP SWAPTION 4.000
MAR23 4.000 CALL Morgan
Stanley 4.000% 03/08/2023 | | 02/26/2020 | | | 1,265,625 | | | | 440,438 | | | | 0.00 | % | |
30
FPA CRESCENT FUND
PORTFOLIO OF INVESTMENTS — RESTRICTED SECURITIES (Continued)
December 31, 2021
Issuer | | Acquisition
Date(s) | | Cost | | Fair Value | | Fair
Value as a %
of Net Assets | |
Epic Games, Inc. | | 06/25/2020 | | $ | 19,049,750 | | | $ | 29,320,050 | | | | 0.28 | % | |
FPS LLC (Marine Shipping)
| | 01/11/2021, 04/13/2021,
07/06/2021, 12/21/2021 | | | 100,019,744 | | | | 83,704,351 | | | | 0.81 | % | |
FPS Shelby Holding I LLC
(Marine Shipping) | | 02/04/2020, 03/26/2020,
04/29/2020, 07/24/2020 | | | 10,191,935 | | | | 8,876,468 | | | | 0.09 | % | |
Footpath Ventures SpV IV LP | | 09/24/2021 | | | 15,180,000 | | | | 15,108,448 | | | | 0.15 | % | |
GACP II L.P. (Credit) | | 01/17/2020 | | | 17,691,919 | | | | 29,634,927 | | | | 0.29 | % | |
McDermott International, Inc. | | 12/31/2020 | | | — | | | | 13,554,380 | | | | 0.13 | % | |
McDermott LC, 1M USD
LIBOR + 4.000% — 4.131%
12/31/2025 | | 03/04/2021, 03/05/2021 | | | 35,777,645 | | | | 17,142,040 | | | | 0.17 | % | |
McDermott Technology Americas,
Inc., 1M USD LIBOR +
1.000% — 1.087% 6/30/2025
| | 01/29/2021, 02/26/2021,
03/31/2021, 04/30/2021,
05/31/2021, 06/30/2021,
07/30/2021,08/31/2021,
09/30/2021, 10/29/2021,
11/30/2021 | | | 68,814,705 | | | | 14,225,729 | | | | 0.14 | % | |
McDermott Technology Americas,
Inc., 1M USD LIBOR +
3.000% — 3.090% 6/30/2024 | | 07/01/2020 | | | 1,074,102 | | | | 612,238 | | | | 0.01 | % | |
OIS CAP SWAPTION 0.680
JAN29 0.680 CALL Morgan
Stanley 0.680% 01/11/2029 | | 10/19/2020 | | | 7,038,227 | | | | 14,960,836 | | | | 0.14 | % | |
OIS FLOOR SWAPTION 0.350
JAN29 0.350 PUT Morgan
Stanley 0.350% 01/11/2029 | | 10/19/2020 | | | (7,038,227 | ) | | | (3,501,472 | ) | | | (0.03 | )% | |
Sound Holding FP | | 10/07/2013 | | | 68,546,025 | | | | 55,564,380 | | | | 0.54 | % | |
Steenbok LUX Financial 2
SARL, PIK — 10.750%
12/31/2022 | | 06/30/2021, 12/31/2021 | | | 774,873 | | | | 763,446 | | | | 0.01 | % | |
U.S. Farming Realty Trust II, L.P.
(Real Estate)
| | 12/24/2012, 04/29/2013,
06/17/2013, 10/28/2013,
01/14/2014, 04/22/2014,
06/25/2014, 09/09/2014,
10/08/2014, 12/18/2014,
06/18/2015, 07/29/2015 | | | 9,498,194 | | | | 8,343,236 | | | | 0.08 | % | |
31
FPA CRESCENT FUND
PORTFOLIO OF INVESTMENTS — RESTRICTED SECURITIES (Continued)
December 31, 2021
Issuer | | Acquisition
Date(s) | | Cost | | Fair Value | | Fair
Value as a %
of Net Assets | |
U.S. Farming Realty Trust, L.P.
(Real Estate)
| | 11/26/2010, 01/31/2011,
03/09/2011, 04/15/2011,
05/10/2011, 06/27/2011,
08/15/2011, 10/17/2011,
10/28/2011, 11/28/2011,
01/03/2012, 01/26/2012,
04/05/2012, 07/13/2012,
12/07/2012, 08/01/2013 | | | — | | | $ | 5,966,001 | | | | 0.06 | % | |
Viking Acquisitions (Norway) | | 06/03/2021 | | $ | 7,607,534 | | | | 7,238,931 | | | | 0.07 | % | |
TOTAL RESTRICTED
SECURITIES | | | | $ | 374,476,436 | | | $ | 337,978,910 | | | | 3.29 | % | |
See accompanying Notes to Financial Statements.
32
FPA CRESCENT FUND
STATEMENT OF ASSETS AND LIABILITIES
December 31, 2021
ASSETS | |
| Investment securities — at fair value (identified cost $6,630,082,694) | | $ | 9,593,852,970 | | |
| Investments in affiliates — at fair value (identified cost $378,524,996) | | | 217,843,405 | | |
Short-term investments — at amortized cost (maturities 60 days or less) | | | 590,003,246 | | |
Purchased options, at value (premiums paid $27,288,237) | | | 23,221,610 | | |
Deposits for securities sold short | | | 200,949,412 | | |
Cash | | | 2,603,729 | | |
Foreign currencies, at value (identified cost $431,563) | | | 433,749 | | |
Receivable for: | |
Investment securities sold | | | 54,929,510 | | |
Dividends and interest | | | 16,968,233 | | |
Capital Stock sold | | | 2,823,573 | | |
Prepaid expenses and other assets | | | 133,147 | | |
Total assets | | | 10,703,762,584 | | |
LIABILITIES | |
Securities sold short — at fair value (proceeds $188,622,673) | | | 258,336,390 | | |
Written options, at value (premiums received $7,038,227) | | | 3,501,472 | | |
Payable for: | |
Investment securities purchased | | | 123,999,928 | | |
Due to broker — OTC derivatives collateral | | | 16,844,124 | | |
Advisory fees | | | 7,956,957 | | |
Capital Stock repurchased | | | 5,452,107 | | |
Accrued expenses and other liabilities | | | 2,715,613 | | |
Total liabilities | | | 418,806,591 | | |
NET ASSETS | | $ | 10,284,955,993 | | |
SUMMARY OF SHAREHOLDERS' EQUITY | |
Capital Stock — no par value; unlimited authorized shares;
277,906,528 outstanding shares | | $ | 7,619,890,262 | | |
| Distributable earnings | | | 2,665,065,731 | | |
NET ASSETS | | $ | 10,284,955,993 | | |
Institutional Class: | |
Net Assets | | $ | 8,394,401,553 | | |
Shares outstanding, no par value; unlimited authorized shares | | | 226,818,699 | | |
Offering and redemption price per share | | $ | 37.01 | | |
Supra Institutional Class: | |
Net Assets | | $ | 1,890,554,440 | | |
Shares outstanding, no par value; unlimited authorized shares | | | 51,087,829 | | |
Offering and redemption price per share | | $ | 37.01 | | |
See accompanying Notes to Financial Statements.
33
FPA CRESCENT FUND
STATEMENT OF OPERATIONS
For the Year Ended December 31, 2021
INVESTMENT INCOME | |
Dividends (net of foreign taxes withheld of $4,842,819) | | $ | 112,947,887 | | |
Interest | | | 8,841,456 | | |
Total investment income | | | 121,789,343 | | |
EXPENSES | |
Advisory fees | | | 98,798,209 | | |
Short sale dividend expense | | | 9,081,861 | | |
Transfer agent fees and expenses | | | 6,359,107 | | |
Custodian fees | | | 528,330 | | |
Other professional fees | | | 412,533 | | |
Administrative services fees — Institutional Class | | | 6,612,982 | | |
Trustee fees and expenses | | | 340,633 | | |
Administrative services fees — Supra Institutional Class | | | 245,903 | | |
Legal fees | | | 335,157 | | |
Filing fees | | | 221,139 | | |
Reports to shareholders | | | 198,911 | | |
Audit and tax services fees | | | 36,084 | | |
Redemption liquidity service | | | 614,129 | | |
Total expenses | | | 123,784,978 | | |
Reimbursement from Adviser | | | (3,720,948 | ) | |
Net expenses | | | 120,064,030 | | |
Net investment income | | | 1,725,313 | | |
NET REALIZED AND UNREALIZED GAIN (LOSS) | |
Net realized gain (loss) on: | |
| Investments | | | 1,101,996,252 | | |
Investments in affiliates | | | (12,199,048 | ) | |
In-kind redemptions | | | 289,418,221 | | |
Swap contracts | | | (3,630,439 | ) | |
Investments in foreign currency transactions | | | (388,500 | ) | |
Net change in unrealized appreciation (depreciation) of: | |
| Investments | | | 109,642,608 | | |
| Investments in affiliates | | | 22,600,771 | | |
Investment securities sold short | | | (36,766,853 | ) | |
Written options | | | 2,851,838 | | |
Purchased options | | | (624,475 | ) | |
Swap contracts | | | 1,591,624 | | |
Translation of foreign currency denominated amounts | | | (689,303 | ) | |
Net realized and unrealized gain | | | 1,473,802,696 | | |
NET INCREASE IN NET ASSETS RESULTING FROM OPERATIONS | | $ | 1,475,528,009 | | |
See accompanying Notes to Financial Statements.
34
FPA CRESCENT FUND
STATEMENTS OF CHANGES IN NET ASSETS
| | | Year Ended
December 31, 2021 | | Year Ended
December 31, 2020 | |
INCREASE (DECREASE) IN NET ASSETS | |
Operations: | |
Net investment income | | $ | 1,725,313 | | | $ | 59,992,476 | | |
Net realized gain | | | 1,375,196,486 | | | | 816,651,617 | | |
Net change in unrealized appreciation (depreciation) | | | 98,606,210 | | | | (296,372,002 | ) | |
Net increase in net assets resulting from operations | | | 1,475,528,009 | | | | 580,272,091 | | |
Distributions to shareholders — Institutional Class | | | (919,984,099 | ) | | | (510,592,905 | ) | |
Distributions to shareholders — Supra Institutional Class | | | (200,997,258 | ) | | | (12,461,447 | )(a) | |
Total distributions to shareholders | | | (1,120,981,357 | ) | | | (523,054,352 | ) | |
Capital Stock transactions:(b) | |
Proceeds from Capital Stock sold | | | 1,976,165,831 | | | | 2,408,393,979 | | |
Proceeds from shares issued to shareholders upon reinvestment of
dividends and distributions | | | 964,804,823 | | | | 458,862,950 | | |
Cost of Capital Stock repurchased(c) | | | (3,093,196,869 | ) | | | (6,850,927,376 | ) | |
Net decrease from Capital Stock transactions | | | (152,226,215 | ) | | | (3,983,670,447 | ) | |
Total change in net assets | | | 202,320,437 | | | | (3,926,452,708 | ) | |
NET ASSETS | |
Beginning of Year | | | 10,082,635,556 | | | | 14,009,088,264 | | |
End of Year | | $ | 10,284,955,993 | | | $ | 10,082,635,556 | | |
(a) Period from September 4, 2020, date operations commenced, through December 31, 2020.
(b) See Note 9, Capital Stock, in the Notes to Financial Statements.
(c) Net of redemption fees of $431,341 and $444,210 for the year ended December 31, 2021 and year ended December 31, 2020, respectively, see Note 7 in the Notes to Financial Statements.
See accompanying Notes to Financial Statements.
35
FPA CRESCENT FUND
FINANCIAL HIGHLIGHTS
Selected Data for Each Share of Capital Stock Outstanding Throughout Each Period
| | | Year Ended December 31 | |
| | | 2021 | | 2020 | | 2019 | | 2018 | | 2017 | |
Institutional Class | |
Per share operating performance: | |
Net asset value at beginning of year | | $ | 35.97 | | | $ | 33.83 | | | $ | 29.53 | | | $ | 34.69 | | | $ | 32.61 | | |
Income from investment operations: | |
Net investment income(a) | | | — | (b) | | | 0.18 | | | | 0.62 | | | | 0.24 | | | | 0.23 | | |
Net realized and unrealized gain (loss)
on investment securities | | | 5.34 | | | | 3.69 | | | | 5.25 | | | | (2.78 | ) | | | 3.14 | | |
Total from investment operations | | | 5.34 | | | | 3.87 | | | | 5.87 | | | | (2.54 | ) | | | 3.37 | | |
Less distributions: | |
Dividends from net investment income | | | (0.29 | ) | | | (0.11 | ) | | | (0.80 | ) | | | (0.21 | ) | | | (0.34 | ) | |
Distributions from net realized
capital gains | | | (4.01 | ) | | | (1.62 | ) | | | (0.77 | ) | | | (2.41 | ) | | | (0.95 | ) | |
Total distributions | | | (4.30 | ) | | | (1.73 | ) | | | (1.57 | ) | | | (2.62 | ) | | | (1.29 | ) | |
Redemption fees | | | — | (b) | | | — | (b) | | | — | (b) | | | — | (b) | | | — | (b) | |
Net asset value at end of year | | $ | 37.01 | | | $ | 35.97 | | | $ | 33.83 | | | $ | 29.53 | | | $ | 34.69 | | |
Total investment return | | | 15.17 | % | | | 12.11 | % | | | 20.02 | % | | | (7.43 | )% | | | 10.39 | % | |
Ratios/supplemental data: | |
Net assets, end of year (000's) | | $ | 8,394,402 | | | $ | 8,903,455 | | | $ | 14,009,883 | | | $ | 13,707,240 | | | $ | 17,484,747 | | |
Ratio of expenses to average net assets: | |
Before reimbursement from Adviser | | | 1.17 | %(c) | | | 1.15 | %(c) | | | 1.23 | %(c) | | | 1.18 | %(c) | | | 1.10 | %(c) | |
After reimbursement from Adviser | | | 1.14 | %(c) | | | 1.13 | %(c) | | | 1.23 | %(c) | | | 1.18 | %(c) | | | 1.10 | %(c) | |
Net investment income: | |
Before reimbursement from Adviser | | | (0.03 | )% | | | 0.54 | % | | | 1.90 | % | | | 0.70 | % | | | 0.66 | % | |
After reimbursement from Adviser | | | 0.01 | % | | | 0.56 | % | | | 1.90 | % | | | 0.70 | % | | | 0.66 | % | |
Portfolio turnover rate | | | 20 | % | | | 29 | % | | | 23 | % | | | 64 | % | | | 18 | % | |
(a) Per share amount is based on average shares outstanding.
(b) Rounds to less than $0.01 per share.
(c) For the periods ended December 31, 2021, December 31, 2020, December 31, 2019, December 31, 2018 and December 31, 2017, the expense ratio includes short sale dividend expense equal to 0.09%, 0.07%, 0.16%, 0.11% and 0.03% of average net assets, respectively.
See accompanying Notes to Financial Statements.
36
FPA CRESCENT FUND
FINANCIAL HIGHLIGHTS
Selected Data for Each Share of Capital Stock Outstanding Throughout Each Period
| | | Year Ended
December 31, 2021 | | Period from
September 4,
through
December 31, 2020 | |
Supra Institutional Class | |
Per share operating performance: | |
Net asset value at beginning of period | | $ | 35.98 | | | $ | 31.96 | | |
Income from investment operations: | |
Net investment income(a) | | | 0.02 | | | | 0.01 | | |
Net realized and unrealized gain on investment securities | | | 5.33 | | | | 4.81 | | |
Total from investment operations | | | 5.35 | | | | 4.82 | | |
Less distributions: | |
Dividends from net investment income | | | (0.31 | ) | | | — | | |
Distributions from net realized capital gains | | | (4.01 | ) | | | (0.80 | ) | |
Total distributions | | | (4.32 | ) | | | (0.80 | ) | |
Redemption fees | | | — | (b) | | | — | (b) | |
Net asset value at end of period | | $ | 37.01 | | | $ | 35.98 | | |
Total investment return | | | 15.24 | % | | | 15.08 | % | |
Ratios/supplemental data: | |
Net assets, end of period (in 000's) | | $ | 1,890,554 | | | $ | 1,179,180 | | |
Ratio of expenses to average net assets: | |
Before reimbursement from Adviser | | | 1.12 | %(d) | | | 1.14 | %(c)(d) | |
After reimbursement from Adviser | | | 1.09 | %(d) | | | 1.11 | %(c)(d) | |
Net investment income: | |
Before reimbursement from Adviser | | | 0.02 | % | | | 0.07 | %(c) | |
After reimbursement from Adviser | | | 0.06 | % | | | 0.10 | %(c) | |
Portfolio turnover rate | | | 20 | % | | | 29 | % | |
(a) Per share amount is based on average shares outstanding.
(b) Rounds to less than $0.01 per share.
(c) Annualized.
(d) For the periods ended December 31, 2021 and December 31, 2020, the expense ratio includes short sale dividend expense equal to 0.10% and 0.13% of average net assets, respectively.
See accompanying Notes to Financial Statements.
37
FPA CRESCENT FUND
NOTES TO FINANCIAL STATEMENTS
December 31, 2021
NOTE 1 — Significant Accounting Policies
FPA Crescent Fund (the "Fund"), a series of the FPA Funds Trust, is registered under the Investment Company Act of 1940 as an open-end, diversified, management investment company. The Fund's investment objective is to seek to generate equity-like returns over the long-term, take less risk than the market and avoid permanent impairment of capital. The Fund qualifies as an investment company pursuant to Financial Accounting Standard Board (FASB) Accounting Standards Codification (ASC) No. 946, Financial Services — Investment Companies.
The following is a summary of significant accounting policies consistently followed by the Fund in the preparation of its financial statements.
A. Security Valuation
The Fund's investments are reported at fair value as defined by accounting principles generally accepted in the United States of America, ("U.S. GAAP"). The Fund generally determines its net asset value as of approximately 4:00 p.m. New York time each day the New York Stock Exchange is open. Further discussion of valuation methods, inputs and classifications can be found under Disclosure of Fair Value Measurements.
B. Securities Transactions and Related Investment Income
Securities transactions are accounted for on the date the securities are purchased or sold. Dividend income and distributions to shareholders are recorded on the ex-dividend date. Interest income and expenses are recorded on an accrual basis. Market discounts and premiums on fixed income securities are amortized over the expected life of the securities using effective interest rate method. Realized gains or losses are based on the specific identification method. The books and records of the Fund are maintained in U.S. dollars as follows: (1) the foreign currency fair value of investment securities, and other assets and liabilities stated in foreign currencies, are translated using the daily spot rate; and (2) purchases, sales, income and expenses are translated at the rate of exchange prevailing on the respective dates of such transactions. The resultant exchange gains and losses are included in net realized or net unrealized gain (loss) in the statement of operations.
C. Use of Estimates
The preparation of the financial statements in accordance with U.S. GAAP requires management to make estimates and assumptions that affect the amounts reported. Actual results could differ from those estimates. Actual results could differ from those estimates.
D. Recent Accounting Pronouncements
In March 2020, the FASB issued ASU 2020-04, Reference Rate Reform (Topic 848) Facilitation of the Effects of Reference Rate Reform on Financial Reporting, which provides optional expedients and exceptions for applying U.S. GAAP to contracts, hedging relationships, and other transaction to ease the potential burden in accounting for (or recognizing the effects of) reference rate reform on financial reporting if certain criteria are met. The guidance is effective from March 12, 2020 through December 31, 2022. The Adviser is currently evaluating the impact of this new guidance on the Fund's financial statements.
NOTE 2 — Risk Considerations
Investing in the Fund may involve certain risks including, but not limited to, those described below.
Market Risk: Because the values of the Fund's investments will fluctuate with market conditions, so will the value of your investment in the Fund. You could lose money on your investment in the Fund or the Fund could underperform other investments.
38
FPA CRESCENT FUND
NOTES TO FINANCIAL STATEMENTS (Continued)
Common Stocks and Other Securities (Long): The prices of common stocks and other securities held by the Fund may decline in response to certain events taking place around the world, including; those directly involving companies whose securities are owned by the Fund; conditions affecting the general economy; overall market changes; local, regional or global political, social or economic instability; and currency, interest rate and commodity price fluctuations.
Common Stocks and Other Securities (Short): The prices of common stocks and other securities sold short rise between the date of the short sale and the date on which the Fund replaces the borrowed security. In addition, the Fund repays the person that lent it the security for any interest or dividends that may have accrued.
Interest Rate and Credit Risk: The values of, and the income generated by, most debt securities held by the Fund may be affected by changing interest rates and by changes in the effective maturities and credit rating of these securities. For example, the value of debt securities in the Fund's portfolio generally will decline when interest rates rise and increase when interest rates fall. In addition, falling interest rates may cause an issuer to redeem, call or refinance a security before its stated maturity, which may result in the Fund having to reinvest the proceeds in lower yielding securities. Debt securities are subject to credit risk, meaning that the issuer of the debt security may default or fail to make timely payments of principal or interest. The values of any of the Fund's investments may also decline in response to events affecting the issuer or its credit rating. The lower rated debt securities in which the Fund may invest are considered speculative and are generally subject to greater volatility and risk of loss than investment grade securities, particularly in deteriorating economic conditions.
Repurchase Agreements: Repurchase agreements permit the Fund to maintain liquidity and earn income over periods of time as short as overnight. Repurchase agreements held by the Fund are fully collateralized by U.S. Government securities, or securities issued by U.S. Government agencies, or securities that are within the three highest credit categories assigned by established rating agencies (Aaa, Aa, or A by Moody's or AAA, AA or A by Standard & Poor's) or, if not rated by Moody's or Standard & Poor's, are of equivalent investment quality as determined by the Adviser. Such collateral is in the possession of the Fund's custodian. The collateral is evaluated daily to ensure its fair value equals or exceeds the current fair value of the repurchase agreements including accrued interest. In the event of default on the obligation to repurchase, the Fund has the right to liquidate the collateral and apply the proceeds in satisfaction of the obligation.
The Fund may enter into repurchase agreements, under the terms of a Master Repurchase Agreement ("MRA"). The MRA permits the Fund, under certain circumstances including an event of default (such as bankruptcy or insolvency), to offset payables and/or receivables under the MRA with collateral held and/or posted to the counterparty and create one single net payment due to or from the Fund. However, bankruptcy or insolvency laws of a particular jurisdiction may impose restrictions on or prohibitions against such a right of offset in the event of a MRA counterparty's bankruptcy or insolvency. Pursuant to the terms of the MRA, the Fund receives securities as collateral with a fair value in excess of the repurchase price to be received by the Fund upon the maturity of the repurchase transaction. Upon a bankruptcy or insolvency of the MRA counterparty, the Fund recognizes a liability with respect to such excess collateral to reflect the Fund's obligation under bankruptcy law to return the excess to the counterparty. Repurchase agreements outstanding at the end of the period are listed in the Fund's Portfolio of Investments.
Special Purpose Acquisition Companies Risk — The Fund may invest in stock, warrants, and other securities of special purpose acquisition companies ("SPACs") or similar special purpose entities that pool funds to seek potential acquisition opportunities. Because SPACs and similar entities are in essence blank check companies
39
FPA CRESCENT FUND
NOTES TO FINANCIAL STATEMENTS (Continued)
without operating history or ongoing business other than seeking acquisitions, the value of their securities is particularly dependent on the ability of the entity's management to identify and complete a profitable acquisition. An investment in a SPAC is subject to a variety of risks, including that (i) a portion of the monies raised by the SPAC for the purpose of effecting an acquisition or merger may be expended prior to the transaction for payment of taxes and other purposes; (ii) prior to any acquisition or merger, a SPAC's assets are typically invested in government securities, money market funds and similar investments whose returns or yields may be significantly lower than those of the Fund's other investments; (iii) the Fund generally will not receive significant income from its investments in SPACs (both prior to and after any acquisition or merger) and, therefore, the Fund's investments in SPACs will not significantly contribute to the Fund's distributions to shareholders; (iv) an attractive acquisition or merger target may not be identified at all, in which case the SPAC will be required to return any remaining monies to shareholders; (v) if an acquisition or merger target is identified, the Fund may elect not to participate in the proposed transaction or the Fund may be required to divest its interests in the SPAC due to regulatory or other considerations, in which case the warrants or other rights with respect to the SPAC held by the Fund may expire worthless or may be repurchased or retired by the SPAC at an unfavorable price; (vi) any proposed merger or acquisition may be unable to obtain the requisite approval, if any, of SPAC shareholders; (vii) under any circumstances in which the Fund receives a refund of all or a portion of its original investment (which typically represents a pro rata share of the proceeds of the SPAC's assets, less any applicable taxes), the returns on that investment may be negligible, and the Fund may be subject to opportunity costs to the extent that alternative investments would have produced higher returns; (viii) to the extent an acquisition or merger is announced or completed, shareholders who redeem their shares prior to that time may not reap any resulting benefits; (ix) the Fund may be delayed in receiving any redemption or liquidation proceeds from a SPAC to which it is entitled; (x) an acquisition or merger once effected may prove unsuccessful and an investment in the SPAC may lose value; (xi) an investment in a SPAC may be diluted by additional later offerings of interests in the SPAC or by other investors exercising existing rights to purchase shares of the SPAC; (xii) only a thinly traded market for shares of or interests in a SPAC may develop, or there may be no market at all, leaving the Fund unable to sell its interest in a SPAC or to sell its interest only at a price below what the Fund believes is the SPAC interest's intrinsic value; and (xiii) the values of investments in SPACs may be highly volatile and may depreciate significantly over time.
Many countries have experienced outbreaks of infectious illnesses in recent decades, including swine flu, avian influenza, SARS and, more recently, COVID-19. The global outbreak of COVID-19 in early 2020 has resulted in various disruptions, including travel and border restrictions, quarantines, supply chain disruptions, lower consumer demand and general market uncertainty. The full effects, duration and costs of the COVID-19 pandemic are impossible to predict, and the circumstances surrounding the COVID-19 pandemic will continue to evolve, including the risk of future increased rates of infection due to low vaccination rates and/or the lack of effectiveness of current vaccines against new variants. Similar consequences could arise as a result of the spread of other infectious diseases. Management will continue to monitor the impact COVID-19 has on the Fund and reflect the consequences as appropriate in the Fund's accounting and financial reporting.
NOTE 3 — Purchases and Sales of Investment Securities
Cost of purchases of investment securities (excluding short-term investments) aggregated $1,694,852,711 for the year ended December 31, 2021. The proceeds and cost of securities sold resulting in net realized gains of $1,379,291,697 aggregated $3,237,975,672 and $1,858,683,975, respectively, for the year ended December 31, 2021.
40
FPA CRESCENT FUND
NOTES TO FINANCIAL STATEMENTS (Continued)
NOTE 4 — Federal Income Tax
No provision for federal income tax is required because the Fund has elected to be taxed as a "regulated investment company" under the Internal Revenue Code (the "Code") and intends to maintain this qualification and to distribute each year to its shareholders, in accordance with the minimum distribution requirements of the Code, its taxable net investment income and taxable net realized gains on investments.
Distributions paid to shareholders are based on net investment income and net realized gains determined on a tax reporting basis, which may differ from financial reporting.
For federal income tax purposes, the Fund had the following components of distributable earnings at December 31, 2021:
Unrealized appreciation | | $ | 2,599,243,686 | | |
Undistributed capital gains | | | 60,186,345 | | |
Undistributed ordinary income | | | 5,635,700 | | |
The tax status of distributions paid during the fiscal years ended December 31, 2021 and 2020 were as follows:
| | | 2021 | | 2020 | |
Dividends from ordinary income | | $ | 122,817,067 | | | $ | 110,604,770 | | |
Distributions from long-term capital gains | | | 998,164,291 | | | | 412,449,582 | | |
The Fund utilizes the provisions of federal income tax laws that provide for the carryforward of capital losses for prior years, offsetting such losses against any future realized capital gains. The Fund did not generate or utilize capital losses during the current tax year.
The cost of investment securities held at December 31, 2021 was $7,759,532,758 for federal income tax purposes. Gross unrealized appreciation and depreciation for all investments at December 31, 2021, for federal income tax purposes was $2,751,914,148 and $152,670,462, respectively resulting in net unrealized appreciation of $2,599,243,686. As of and during the year ended December 31, 2021, the Fund did not have any liability for unrecognized tax benefits. The Fund recognizes interest and penalties, if any, related to unrecognized tax benefits as income tax expense in the Statement of Operations. During the year, the Fund did not incur any interest or penalties. The statute of limitations remains open for the last 3 years, once a return is filed. No examinations are in progress at this time.
During the year ended December 31, 2021, the Fund reclassified $441,303,768 from Distributable Earnings to Paid in Capital to align financial reporting to tax reporting. These permanent differences are primarily due to redemptions in kind, distributions made in connection with redemption of fund shares, and prior period adjustments. Net assets were not affected by these reclassifications.
NOTE 5 — Advisory Fees and Other Affiliated Transactions
Pursuant to an Investment Advisory Agreement (the "Agreement"), advisory fees were paid by the Fund to First Pacific Advisors, LP (the "Adviser").
Effective September 4, 2020, the Board approved the addition of the Supra Institutional Class shares and the reduction in the annual advisory fee rate paid by the Fund to 0.93%. The current management fee rate paid by
41
FPA CRESCENT FUND
NOTES TO FINANCIAL STATEMENTS (Continued)
Institutional Class shares is 1.00% and Supra Institutional Class shares is 0.94%, which includes both the advisory fee of 0.93% and a class-specific administrative service fee of 0.07% for Institutional Class and 0.01% for Supra Institutional Class. In addition, the Adviser has contractually agreed to reimburse operating expenses in excess of 0.05% of the average daily net assets of the Fund, excluding management fees, administrative service fees, short sale dividend expenses and interest expenses on cash deposits relating to short sales, brokerage fees and commissions, redemption liquidity service expense, interest, taxes, fees and expenses of other funds in which the Fund invests, and extraordinary expenses, including litigation expenses not incurred in the Fund's ordinary course of business, through April 30, 2022. The Adviser has also contractually agreed to reimburse the Fund for redemption liquidity service expenses in excess of 0.0044% of the average net assets of the Fund through April 30, 2022. This agreement may only be terminated earlier by the Fund's Board of Trustees (the "Board") or upon termination of the Advisory Agreement. The reductions and reimbursements are in amounts that maintain total operating expenses at or below certain limits. The limit is expressed as a percentage of average daily net assets attributable to the Fund on an annualized basis during the reporting period. The expenses borne by the Adviser are subject to reimbursement by the Fund through the fiscal year end, provided no reimbursement will be made if it would result in the Fund exceeding the total operating expense limits. Any amounts outstanding at the end of the period are shown as an expense reimbursement from Adviser or expense reimbursement to Adviser on the Statement of Assets and Liabilities.
For the year ended December 31, 2021, the Fund paid aggregate fees and expenses of $340,633 to all Trustees who are not affiliated persons of the Adviser. Certain officers of the Fund are also officers of the Adviser.
NOTE 6 — Securities Sold Short
The Fund maintains cash deposits and segregates marketable securities in amounts equal to the current fair value of the securities sold short or the fair value of the securities at the time they were sold short, whichever is greater. The Fund considers cash deposits held in connection with securities sold short to be restricted cash. The restriction will lapse when the related short positions are terminated. Possible losses from short sales may be unlimited, whereas losses from purchases cannot exceed the total amount invested. The dividends on securities sold short are reflected as short sale dividend expense.
NOTE 7 — Redemption Fees
A redemption fee of 2% applies to redemptions within 90 days of purchase. For the year ended December 31, 2021, the Fund collected $431,341 in redemption fees. The impact of these fees is less than $0.01 per share. Subsequent to the December 31, 2021, the Board unanimously approved the elimination of the Fund's 2% redemption fee effective February 18, 2022.
The Funds may participate in the ReFlow Fund, LLC ("ReFlow") liquidity program, which is designed to provide an alternative liquidity source on days when redemptions of Fund shares exceed purchases. Under the program, ReFlow is available to provide cash to the Funds to meet all, or a portion, of daily net shareowner redemptions. Following purchases of Fund shares, ReFlow then generally redeems those shares when the Fund experiences net sales, at the end of a maximum holding period determined by ReFlow (currently 14 days) or at other times at ReFlow's discretion. For use of the ReFlow service, a participating Fund pays a fee to ReFlow each time it purchases Fund shares, calculated by applying to the purchase amount a fee rate determined through an automated daily "Dutch auction" among other participating mutual funds seeking liquidity that day. The current minimum fee rate is 0.20% of the value of the Fund shares purchased by ReFlow, although the Fund may submit a bid at a higher fee rate if it determines that doing so is in the best interest of Fund shareowners. In accordance with federal securities laws, ReFlow is prohibited from acquiring more than 3% of the outstanding voting securities of a Fund. ReFlow will periodically redeem its entire share position in the Fund and request that
42
FPA CRESCENT FUND
NOTES TO FINANCIAL STATEMENTS (Continued)
such redemption be met in kind in accordance with the Fund's in-kind redemption policies. There is no assurance that ReFlow will have sufficient funds available to meet the Funds' liquidity needs on a particular day. During the year ended December 31, 2021, only FPA Crescent Fund participated in ReFlow. Fees associated with ReFlow are disclosed in the Statements of Operations within redemption liquidity service fees.
NOTE 8 — Disclosure of Fair Value Measurements
The Fund uses the following methods and inputs to establish the fair value of its assets and liabilities. Use of particular methods and inputs may vary over time based on availability and relevance as market and economic conditions evolve.
Equity securities are generally valued each day at the official closing price of, or the last reported sale price on, the exchange or market on which such securities principally are traded, as of the close of business on that day. If there have been no sales that day, equity securities are generally valued at the last available bid price. Securities that are unlisted and fixed-income and convertible securities listed on a national securities exchange for which the over-the-counter ("OTC") market more accurately reflects the securities' value in the judgment of the Fund's officers, are valued at the most recent bid price. Events occurring after the close of trading on non-U.S. exchanges may result in adjustments to the valuation of foreign securities to reflect their fair value as of the close of regular trading on the NYSE. The Fund may utilize an independent fair valuation service in adjusting the valuations of foreign securities. However, most fixed income securities are generally valued at prices obtained from pricing vendors and brokers. Vendors value such securities based on one or more of the following inputs: transactions, bids, offers quotations from dealers and trading systems, spreads and other relationships observed in the markets among comparable securities, benchmarks, underlying equity of the issuer, and proprietary pricing models such as cash flows, financial or collateral performance and other reference data (includes prepayments, defaults, collateral, credit enhancements, and interest rate volatility). Currency forwards are valued at the closing currency exchange rate which is not materially different from the forward rate. Short-term corporate notes with maturities of 60 days or less at the time of purchase are valued at amortized cost.
Securities for which representative market quotations are not readily available or are considered unreliable by the Adviser are valued as determined in good faith under procedures adopted by the authority of the Fund's Board of Trustees. Various inputs may be reviewed in order to make a good faith determination of a security's value. These inputs include, but are not limited to, the type and cost of the security; contractual or legal restrictions on resale of the security; relevant financial or business developments of the issuer; actively traded similar or related securities; conversion or exchange rights on the security; related corporate actions; significant events occurring after the close of trading in the security; and changes in overall market conditions. Investments in limited partnerships are valued, as a practical expedient, utilizing the net asset valuations provided by the underlying limited partnerships in a manner consistent with U.S. GAAP for investment companies. The Fund applies the practical expedient to its investments in limited partnerships on an investment-by-investment basis, and consistently with the Fund's entire position in a particular investment, unless it is probable that the Fund will sell a portion of an investment at an amount different from the net asset valuation. Investments in limited partnerships are included in Level 3 of the fair value hierarchy based on the limited rights of withdrawal by the Fund as specified in the respective agreements. Fair valuations and valuations of investments that are not actively trading involve judgment and may differ materially from valuations of investments that would have been used had greater market activity occurred.
Investments in open-end investment companies are valued at their net asset value each business day and are categorized as Level 1. The investments in limited partnerships represent investments in private funds which are valued at their net asset value as a practical expedient. The net asset value of the limited partnerships has been estimated primarily based upon the pro-rata ownership of the fair value of the limited partnerships as reported by
43
FPA CRESCENT FUND
NOTES TO FINANCIAL STATEMENTS (Continued)
the Management of the limited partnerships. Investments in private funds can never be redeemed. Instead, the nature of the investments in this category is that distributions are received through the liquidation of the underlying assets of the limited partnerships.
The Fund classifies its assets based on three valuation methodologies. Level 1 values are based on quoted market prices in active markets for identical assets. Level 2 values are based on significant observable market inputs, such as quoted prices for similar assets and quoted prices in inactive markets or other market observable inputs as noted above including spreads, cash flows, financial performance, prepayments, defaults, collateral, credit enhancements, and interest rate volatility. Level 3 values are based on significant unobservable inputs that reflect the Fund's determination of assumptions that market participants might reasonably use in valuing the assets. The valuation levels are not necessarily an indication of the risk associated with investing in those securities. The following table presents the valuation levels of the Fund's investments as of December 31, 2021: (see Portfolio of Investments for industry categories):
Investments | | Level 1 | | Level 2 | | Level 3 | | Total | |
Common Stocks | |
Internet Media | | $ | 1,246,288,420 | | | | — | | | | — | | | $ | 1,246,288,420 | | |
Semiconductor Devices | | | 750,982,320 | | | | — | | | | — | | | | 750,982,320 | | |
Cable & Satellite | | | 606,171,982 | | | | — | | | | — | | | | 606,171,982 | | |
Application Software | | | 432,602,901 | | | | — | | | $ | 29,320,050 | | | | 461,922,951 | | |
Cement & Aggregates | | | 351,198,517 | | | | — | | | | — | | | | 351,198,517 | | |
Electrical Components | | | 313,728,857 | | | | — | | | | — | | | | 313,728,857 | | |
Diversified Banks | | | 310,815,455 | | | | — | | | | — | | | | 310,815,455 | | |
P&C Insurance | | | 295,394,921 | | | | — | | | | — | | | | 295,394,921 | | |
Banks | | | 258,597,446 | | | | — | | | | — | | | | 258,597,446 | | |
Industrial Distribution & Rental | | | 255,295,531 | | | | — | | | | — | | | | 255,295,531 | | |
Insurance Brokers | | | 237,530,765 | | | | — | | | | — | | | | 237,530,765 | | |
Base Metals | | | 233,777,756 | | | | — | | | | — | | | | 233,777,756 | | |
Investment Companies | | | 227,886,352 | | | | — | | | | — | | | | 227,886,352 | | |
Institutional Brokerage | | | 182,266,220 | | | | — | | | | — | | | | 182,266,220 | | |
Food Services | | | 177,975,418 | | | | — | | | | — | | | | 177,975,418 | | |
E-Commerce Discretionary | | | 135,650,774 | | | | — | | | | — | | | | 135,650,774 | | |
Chemicals | | | 130,657,238 | | | | — | | | | — | | | | 130,657,238 | | |
Infrastructure Software | | | 116,022,209 | | | | — | | | | — | | | | 116,022,209 | | |
Hotels, Restaurants & Leisure | | | 114,575,764 | | | | — | | | | — | | | | 114,575,764 | | |
Railroad Rolling Stock | | | 103,443,122 | | | | — | | | | — | | | | 103,443,122 | | |
Apparel, Footwear & Accessory
Design | | | 101,746,095 | | | | — | | | | — | | | | 101,746,095 | | |
Specialty Chemicals | | | 98,854,522 | | | | — | | | | — | | | | 98,854,522 | | |
Wealth Management | | | 97,124,362 | | | | — | | | | — | | | | 97,124,362 | | |
Telecom Carriers | | | 92,732,866 | | | | — | | | | — | | | | 92,732,866 | | |
44
FPA CRESCENT FUND
NOTES TO FINANCIAL STATEMENTS (Continued)
Investments | | Level 1 | | Level 2 | | Level 3 | | Total | |
Midstream — Oil & Gas | | $ | 83,469,546 | | | | — | | | | — | | | $ | 83,469,546 | | |
Commercial & Residential
Building Equipment & Systems | | | 80,246,092 | | | | — | | | | — | | | | 80,246,092 | | |
Computer Hardware & Storage | | | 66,993,341 | | | | — | | | | — | | | | 66,993,341 | | |
Real Estate Owners & Developers | | | 57,520,515 | | | | — | | | | — | | | | 57,520,515 | | |
Marine Shipping | | | — | | | | — | | | $ | 55,564,380 | | | | 55,564,380 | | |
Industrials | | | 49,631,577 | | | | — | | | | — | | | | 49,631,577 | | |
Integrated Utilities | | | 43,674,998 | | | | — | | | | — | | | | 43,674,998 | | |
Entertainment Content | | | 25,656,715 | | | | — | | | | — | | | | 25,656,715 | | |
Oil & Gas Services & Equipment | | | 19,180,792 | | | | — | | | | — | | | | 19,180,792 | | |
Closed End Fund | | | — | | | $ | 28,204,147 | | | | — | | | | 28,204,147 | | |
Limited Partnerships | | | — | | | | — | | | | 151,633,431 | | | | 151,633,431 | | |
Preferred Stocks | |
Engineering Services | | | — | | | | — | | | | 13,554,380 | | | | 13,554,380 | | |
Energy | | | — | | | | — | | | | 727,363 | | | | 727,363 | | |
Warrant | |
Energy | | | 2,767,270 | | | | — | | | | — | | | | 2,767,270 | | |
Special Purpose Acquisition
Companies | | | 318,711,714 | | | | — | | | | 7,238,931 | | | | 325,950,645 | | |
Corporate Bank Debt | | | — | | | | 15,601,413 | | | | 7,815,830 | | | | 23,417,243 | | |
U.S. Treasuries | | | — | | | | 1,882,864,077 | | | | — | | | | 1,882,864,077 | | |
Short-Term Investments | | | — | | | | 590,003,246 | | | | — | | | | 590,003,246 | | |
| | | $ | 7,619,172,373 | | | $ | 2,516,672,883 | | | $ | 265,854,365 | | | $ | 10,401,699,621 | | |
Purchased Options (interest rate risk) | | | — | | | | — | | | $ | 23,221,610 | | | $ | 23,221,610 | | |
Written Options (interest rate risk) | | | — | | | | — | | | | (3,501,472 | ) | | | (3,501,472 | ) | |
| | | | — | | | | — | | | $ | 19,720,138 | | | $ | 19,720,138 | | |
Common Stock Sold Short | | $ | (258,336,390 | ) | | | — | | | | — | | | $ | (258,336,390 | ) | |
45
FPA CRESCENT FUND
NOTES TO FINANCIAL STATEMENTS (Continued)
The following table summarizes the Fund's Level 3 investment securities and related transactions during the year ended December 31, 2021:
Investments | | Beginning
Value at
December 31,
2020 | | Net Realized and
Unrealized Gains
(Losses)* | | Purchases | | (Sales) | | Gross
Transfers
In/(Out) | | Ending
Value at
December 31,
2021 | | Net Change
in Unrealized
Appreciation
(Depreciation)
related to
Investments held
at December 31,
2021 | |
Common Stocks | | $ | 50,973,743 | | | $ | 33,910,687 | | | | — | | | | — | | | | — | | | $ | 84,884,430 | | | $ | 33,910,687 | | |
Closed End Fund | | | 67,513,975 | | | | (36,741,491 | ) | | | — | | | $ | (2,568,337 | ) | | $ | (28,204,147 | ) | | | — | | | | — | | |
Limited Partnerships | | | 139,460,218 | | | | 22,801,321 | | | $ | 31,798,163 | | | | (42,426,271 | ) | | | — | | | | 151,633,431 | | | | 22,801,321 | | |
Preferred Stock | | | 7,906,722 | | | | 5,101,094 | | | | 1,274,000 | | | | (73 | ) | | | — | | | | 14,281,743 | | | | 5,102,496 | | |
Special Purpose
Acquisition
Companies | | | — | | | | (368,605 | ) | | | 7,607,535 | | | | — | | | | — | | | | 7,238,930 | | | | (368,605 | ) | |
Asset-Backed
Securities —
Marine Shipping | | | 4,410,116 | | | | 634,907 | | | | — | | | | (5,045,023 | ) | | | — | | | | — | | | | — | | |
Corporate Bank Debt | | | 22,136,102 | | | | (14,048,873 | ) | | | 51,258,510 | | | | (51,529,909 | ) | | | — | | | | 7,815,830 | | | | (7,845,374 | ) | |
Purchased Options
(interest rate risk) | | | 23,846,085 | | | | (624,475 | ) | | | — | | | | — | | | | — | | | | 23,221,610 | | | | (624,475 | ) | |
Written Options
(interest rate risk) | | | (6,353,310 | ) | | | 2,851,838 | | | | — | | | | — | | | | — | | | | (3,501,472 | ) | | | 2,851,838 | | |
Credit Default Swaps
(credit risk) | | | (59,388 | ) | | | (1,024,582 | ) | | | 59,693,808 | | | | (58,609,838 | ) | | | — | | | | — | | | | — | | |
| | | $ | 309,834,263 | | | $ | 12,491,821 | | | $ | 151,632,016 | | | $ | (160,179,451 | ) | | $ | (28,204,147 | ) | | $ | 285,574,502 | | | $ | 55,827,888 | | |
* Net realized and unrealized gains (losses) are included in the related amounts in the statement of operations.
Transfers of investments between different levels of the fair value hierarchy are recorded at fair value as of the end of the reporting period. There were transfers of $28,204,147 out of Level 3 into Level 2. Transfers out of Level 3 were due to change in valuation technique from recent trade activity to vendor priced.
The following table summarizes the quantitative inputs and assumptions used for items categorized as Level 3 of the fair value hierarchy as of December 31, 2021:
| Financial Assets | | Fair Value at
December 31, 2021 | | Valuation Technique(s) | | Unobservable
Inputs | | Price/Range | | Weighted
Average | |
Special Purpose Acquisition
Companies | | $ | 7,238,930 | | | Restricted Security(a) | | Cost | | $ | 0.76 | | | $ | 0.76 | | |
Corporate Bank Debt | | $ | 7,815,830 | | | Pricing Model(b) | | Quotes/Prices | | $ | 47.00-$53.00 | | | $ | 50.89 | | |
Preferred Stock | | $ | 14,281,743 | | | Pricing Model(b) | | Quotes/Prices | | $ | 540.79-$600.00 | | | $ | 596.98 | | |
Purchased Options (interest rate risk) | | $ | 23,221,610 | | | Third-Party Broker Quote(c) | | Quotes/Prices | | $ | 0.00-$0.06 | | | $ | 0.04 | | |
Written Options (interest rate risk) | | $ | (3,501,472 | ) | | Third-Party Broker Quote(c) | | Quotes/Prices | | $ | 0.01 | | | $ | 0.01 | | |
46
FPA CRESCENT FUND
NOTES TO FINANCIAL STATEMENTS (Continued)
| Financial Assets | | Fair Value at
December 31, 2021 | | Valuation Technique(s) | | Unobservable
Inputs | | Price/Range | | Weighted
Average | |
Common Stocks — Long | | $ | 55,564,380 | | | Market Approach(d)
| | Shipping Broker
Valuations | |
N/A | | N/A | |
| | | | | | Discounts | | 59% | | 59% | |
| | | | 29,320,050 | | | Most Recent Capitalization
(Funding)(e) | |
Quotes/Prices | | $885.00 | | $885.00 | |
Limited Partnerships | | $ | 29,634,927 | | | NAV as Practical Expedient(g) | | Market Discount | | 15% | | 15% | |
| | | | 92,580,819 | | | Market Approach(d) | | Shipping Broker
Valuations | | N/A | | N/A | |
| | | | | | Discounts | | 35%-69% | | 38% | |
| | | 15,108,448 | | | NAV as Practical Expedient(f) | | Market Discount | | N/A | | N/A | |
| | | | 14,309,237 | | | Discounted NAV(g) | | Market Discount | | 26%-31% | | 28% | |
(a) The fair value of the investment is based on the initial purchase price. If the financial condition of the underlying assets were to deteriorate, or if the market comparables were to fall, the value of the investment could be lower.
(b) The Pricing Model technique for Level 3 securities involves recently quoted funding prices of the security.
(c) The Third Party Broker Quote technique involves obtaining an third-party broker quote for the security.
(d) The fair value of the investment is based on the market approach, which involves obtaining broker quotes for the underlysing vessels based on free and clear charter rates, and further discounting those quotes for vessel-specific contracted charter rates.
(e) The fair value of the investment is based on capital funding terms. If the financial condition of the underlying assets were to deteriorate, or if the market comparables were to fall, the valuve of the investment could be lower.
(f) No adjustments were made to the NAV provided by the administrator of the Limited Partnerships. Adjustments to the NAV would be considered if the practical expedient NAV was not as of Fund's measurement date; it was probable that the Limited Partnerships would be sold at a value materially different than the reported expedient NAV; or it was determined in accordance with the Fund's valuation procedures that the Limited Partnerships are not being reported at fair value.
(g) The NAV provided by the general partner has been discounted for the possible impact from various long-term exit strategies under consideration by the general partner.
Options Contracts: An option contract is a commitment that gives the purchaser of the contract the right, but not the obligation, to buy or sell an underlying asset at a specific price on or before a specified future date. On the other hand, the writer of an option contract is obligated, upon the exercise of the option, to buy or sell an underlying asset at a specific price on or before a specified future date. A swaption is an option contract granting the owner the right to enter into an underlying swap. Inflation-capped options are options on U.S. inflation rates at a stated strike price. The seller of an inflation-capped option receives an upfront premium and in return the buyer receives the right to receive a payment at the expiration of the option if the cumulative annualized inflation rate over the life of the option is above (for caps) or below (for floors) the stated strike price. The purpose of inflation-capped options is to protect the buyer from inflation erosion above a certain rate on a given notional exposure. A floor can be used to give downside protection to investments in inflation-linked products below a certain rate on a given notional exposure. Writing put options or purchasing call options tends to increase a Fund's exposure to the underlying instrument. Writing call options or purchasing put options tends to decrease a Fund's exposure to the underlying instrument. When a Fund writes or purchases a call, put, or inflation-capped option, an amount equal to the premium received or paid by the Fund is recorded as a liability or an investment, respectively, and subsequently adjusted to the current market value, based on the quoted daily settlement price of the option written or purchased. Certain options may be written or purchased with premiums to be determined on a future date. The premiums for these options are based upon implied volatility parameters at specified terms. Premiums received or paid from writing or purchasing options, which expire unexercised, are treated by a Fund
47
FPA CRESCENT FUND
NOTES TO FINANCIAL STATEMENTS (Continued)
on the expiration date as realized gains or losses. The difference between the premium and the amount paid or received on a closing purchase or sale transaction, including brokerage commissions, is also treated as a realized gain or loss. If an option is exercised, the premium paid or realized is added to the cost of the purchase or proceeds from the sale in determining whether the Fund has realized a gain or loss on investment transactions. A Fund, as a writer of an option, may have no control over whether the underlying instrument may be sold (call) or purchased (put) and as a result bears the market risk of an unfavorable change in the price of the underlying written option. In addition, an illiquid market may make it difficult for a Fund to close out an option contract. The maximum risk of loss associated with writing put options is limited to the exercised fair value of the option contract. The maximum risk of loss associated with writing call options is potentially unlimited. Listed option contracts present minimal counterparty credit risk since they are exchange traded and the exchange's clearinghouse, as counterparty to all exchange-traded options, guarantees the options against default. A Fund's maximum risk of loss from counterparty credit risk related to OTC option contracts is limited to the premiums paid.
Forward foreign currency contracts: Forward foreign currency contracts are agreements to exchange one currency for another at a future date and at a specified price. The Funds' transactions in forward foreign currency contracts are limited to transaction and portfolio hedging. The contractual amounts of forward foreign currency contracts do not necessarily represent the amounts potentially subject to risk. The measurement of the risks associated with these instruments is meaningful only when all related and offsetting transactions are considered and could exceed the net unrealized value shown in the tables below. Risks arise from the possible inability of counterparties to meet the terms of their contracts and from movements in currency values. Forward foreign currency contracts are valued daily at the foreign exchange rates as of the close of the New York Stock Exchange. Unrealized appreciation or depreciation on the contracts as measured by the difference between the forward foreign exchange rates at the dates of entry into the contracts and the foreign exchange rates at the end of the period is included in the Statement of Assets and Liabilities under the caption "Forward Foreign Currency Contracts." Realized gains and losses and the net change in unrealized appreciation (depreciation) on forward foreign currency contracts for the year are included in the Statement of Operations under the caption "Forward Foreign Currency Contracts."
Credit Default Swaps: The Fund enters into credit default swap contracts for investment purposes and to manage its credit risk. Credit default swap agreements involve one party making a stream of payments (referred to as the buyer of protection) to another party (the seller of protection) in exchange for the right to receive a specified return in the event of a default or other credit event for the referenced entity, obligation or index. The Fund may purchase or sell protection. A seller of protection generally receives an upfront payment or periodic payments throughout the term of the swap provided there is no credit event. Such periodic payments received are accrued daily and accounted for as realized gains. If a credit event occurs, as defined under the terms of the swap agreement, the Fund will either (i) pay to the buyer of protection an amount equal to the notional amount of the swap and take delivery of the referenced obligation or underlying securities comprising the referenced index or (ii) pay a net settlement amount in the form of cash or securities equal to the notional amount of the swap less the recovery value of the referenced obligation or underlying securities comprising the referenced index. The buyer of protection generally pays an upfront premium or periodic payments throughout the term of the swap provided there is no credit event. Such periodic payments paid are accrued daily and accounted for as realized losses.
Entering into credit default swaps involves, to varying degrees, elements of credit, market and documentation risk in excess of the related amounts recognized in the Consolidated Statement of Assets and Liabilities. Such risks involve the possibility that there will be no liquid market for these agreements, that the counterparty to the
48
FPA CRESCENT FUND
NOTES TO FINANCIAL STATEMENTS (Continued)
agreements may default on its obligations to perform or disagree as to the meaning of the contractual terms in the agreements, and that there will be unfavorable changes in net interest rates.
| | | Asset Derivatives | | Liability Derivatives | |
Derivative Type | | Statement of Assets
and Liabilities
Location | | Fair Value | | Statement of Assets
and Liabilities
Location | | Fair Value | |
Interest rate
contracts | | Purchased options,
at value | | $ | 23,221,610 | | | Written options,
at value | | $ | (3,501,472 | ) | |
Derivative Type | | Location of Gain or
(Loss) on Derivatives
Within Statement of
Operations | | Realized Gain or
(Loss) on
Derivatives | | Change in Unrealized
Appreciation or (Depreciation) | |
Credit contracts | | Swap contracts | | $ | (3,630,439 | ) | | $ | 1,591,624 | | |
Interest rate
contracts | | Written options,
Purchased options | | | —
— | | | | 2,851,838
(624,475) | | |
Total | | | | $ | (3,630,439 | ) | | $ | 3,818,987 | | |
The following table represents the average monthly volume of the Fund's derivative transactions during the year ended December 31, 2021:
Purchased Options | |
Average notional amount | |
Calls | | $ | 76,432,061,813 | | |
Written Options | |
Average notional amount | |
Puts | | $ | (260,061,813 | ) | |
Swaps | |
Average notional amount | | $ | 24,872,420 | | |
49
FPA CRESCENT FUND
NOTES TO FINANCIAL STATEMENTS (Continued)
NOTE 9 — Capital Stock
| | | Year Ended
December 31, 2021 | | Year Ended
December 31, 2020 | |
| | | Shares | | Amount | | Shares | | Amount | |
Capital Stock sold | |
Institutional Class | | | 21,888,320 | | | $ | 862,574,874 | | | | 32,818,768 | | | $ | 1,033,674,881 | | |
Supra Institutional Class | | | 28,356,842 | | | | 1,113,590,957 | | | | 39,911,145 | (a) | | | 1,374,719,098 | (a) | |
Issued to shareholders upon
reinvestment of dividends and
distributions | |
Institutional Class | | | 21,538,321 | | | | 793,113,350 | | | | 14,134,128 | | | | 450,582,121 | | |
Supra Institutional Class | | | 4,686,401 | | | | 171,691,473 | | | | 233,585 | (a) | | | 8,280,829 | (a) | |
Capital Stock repurchased | |
Institutional Class | | | (64,107,130 | ) | | | (2,510,889,410 | ) | | | (213,605,986 | ) | | | (6,622,737,320 | ) | |
Supra Institutional Class | | | (14,728,481 | ) | | | (582,307,459 | ) | | | (7,371,663 | )(a) | | | (228,190,056 | )(a) | |
Change in Capital Stock outstanding | | | (2,365,727 | ) | | $ | (152,226,215 | ) | | | (133,880,023 | ) | | $ | (3,983,670,447 | ) | |
(a) Period from September 4, 2020, date operations commenced, through December 31, 2020.
NOTE 10 — Collateral Requirements
For derivatives traded under an ISDA Master Agreement, the collateral requirements are typically calculated by netting the mark to market amount for each transaction under such agreement and comparing that amount to the value of any collateral currently pledged by a Fund and the counterparty. Cash collateral that has been pledged to cover obligations of a Fund and cash collateral received from the counterparty, if any, is reported separately on the Statement of Assets and Liabilities as cash pledged as collateral and cash received as collateral, respectively. Non-cash collateral pledged by a Fund, if any, is noted in the Portfolio of Investments. Generally, the amount of collateral due from or to a party is delivered to/pledged by the Fund on the next business day. Typically, the Fund and counterparties are not permitted to sell, repledge or use the collateral they receive. To the extent amounts due to the Fund from its counterparties are not fully collateralized, contractually or otherwise, the Fund bears the risk of loss from counterparty non-performance. The Fund attempts to mitigate counterparty risk by entering into agreements only with counterparties that it believes have the financial resources to honor their obligations and by monitoring the financial stability of those counterparties.
For financial reporting purposes, the Fund does not offset derivative assets and derivative liabilities that are subject to netting arrangements in the Statement of Assets and Liabilities.
FASB Accounting Standards Update No. 2011-11, Disclosures about Offsetting Assets and Liabilities, requires disclosures to make financial statements that are prepared under U.S. GAAP more comparable to those prepared under International Financial Reporting Standards. Under this guidance the Fund discloses both gross and net information about instruments and transactions eligible for offset such as instruments and transactions
50
FPA CRESCENT FUND
NOTES TO FINANCIAL STATEMENTS (Continued)
subject to an agreement similar to a master netting arrangement. The following table presents the Fund's OTC derivative assets, liabilities and master repurchase agreements by counterparty net of amounts available for the offset under an ISDA Master agreement or similar agreements and net of the related collateral received or pledged by the Fund as of December 31, 2021:
Counterparty | | Product | | Gross Assets
(Liabilities) in
the Statement
of Assets and
Liabilities | | Cash
Collateral
(Received)
Pledged | | Financial
Instruments
(Received)
Pledged | | Assets
(Liabilities)
Available for
Offset | | Net Amount
of Asset and
(Liabilities)(a) | |
State Street Bank
and Trust
Company: | |
| | | Repurchase Agreement | | $ | 104,822,000 | | | | | $ | (104,822,000 | )(b) | | | — | | | | — | | |
Barclays Bank PLC: | |
| | | Purchased Options | | $ | 2,889,480 | | | | — | | | | 2,159,793 | | | | — | | | $ | 5,049,273 | | |
Goldman Sachs
International: | |
| | | Purchased Options | | $ | 3,746,231 | | | $ | (3,746,231 | )(c) | | | — | | | | — | | | | — | | |
Morgan Stanley: | |
| | | Purchased Options | | $ | 16,585,899 | | | $ | (13,084,427 | )(d) | | | — | | | $ | (3,501,472 | ) | | | — | | |
| | | Written Options | | $ | (3,501,472 | ) | | | — | | | | — | | | $ | 3,501,472 | | | | — | | |
(a) Represents the net amount receivable (payable) from the counterparty in the event of default.
(b) Collateral with a value of $106,918,513 has been received in connection with a master repurchase agreement. Excess of collateral received from the individual master repurchase agreement is not shown for financial reporting purposes.
(c) Collateral with a value of $3,755,124 has been received in connection with a master repurchase agreement. Excess of collateral received from the individual master repurchase agreement is not shown for financial reporting purposes.
(d) Collateral with a value of $13,089,000 has been received in connection with a master repurchase agreement. Excess of collateral received from the individual master repurchase agreement is not shown for financial reporting purposes.
NOTE 11 — Commitments
As of December 31, 2021 the Fund was liable for the following unfunded commitments:
Asset Class | | Unfunded
Commitment | |
Corporate Bank Debt | | $ | 10,038,100 | | |
51
FPA CRESCENT FUND
NOTES TO FINANCIAL STATEMENTS (Continued)
NOTE 12 — Affiliated Investments
A company is considered an affiliate of a fund under the Investment Company Act of 1940 if the Fund's holdings in that company represent 5% or more of the outstanding voting shares of that company. Further details on such holdings and related transactions during the year ended December 31, 2021, appear below:
| Investments | | Shares
Held as of
December 31,
2020 | | Beginning
Value as of
December 31,
2020 | | Purchases
at Cost | | Proceeds
from Sales | | Net
Realized
Gain/(Loss)
on sales of
Affiliated
Investments | | Change in
Unrealized
Appreciation/
Depreciation | | Transfers In
(Out) | | Ending
Value as of
December 31,
2021 | | Shares
as of
December 31,
2021 | | Dividend
Income
from
Affiliated
Investments | |
Common
Stocks — 0.73% | |
Oil & Gas
Services &
Equipment — 0.19% | |
McDermott
International
Ltd.(a)(b) | | | 39,633,209 | | | $ | 32,102,899 | | | $ | 16,331,720 | | | $ | (12,757,114 | ) | | | — | | | $ | (16,496,713 | ) | | | — | | | $ | 19,180,792 | | | | 46,782,420 | | | | — | | |
Marine
Shipping — 0.54% | |
Sound Holding FP
(Luxembourg)(b)(c)(d)(e) | | | 1,146,250 | | | | 31,923,993 | | | | — | | | | — | | | | — | | | | 23,640,387 | | | | — | | | | 55,564,380 | | | | 1,146,250 | | | | — | | |
Corporate
Bank Debt — 0.22% | |
McDermott LC,
1M USD
LIBOR —
4.000% —
4.131%
12/31/2025(c)(d)(e)(f)(g) | | | 22,648,178 | | | | 27,920,992 | | | | 1,707,660 | | | | — | | | $ | (2,343,243 | ) | | | (10,143,369 | ) | | | — | | | | 17,142,040 | | | | 28,718,370 | | | | — | | |
McDermott
Senior Exit
LC — 3.000%
6/30/2024(e)(f) | | | 12,520,193 | | | | (1,252,019 | ) | | | 428,679 | | | | (9,425,613 | ) | | | 365,229 | | | | 557,514 | | | | — | | | | (9,326,210 | ) | | | 19,843,000 | | | | — | | |
McDermott
Technology
Americas, Inc.,
1M USD LIBOR +
1.000% — 1.087%
6/30/2025(c)(g) | | | 32,176,109 | | | | 20,270,949 | | | | 906,981 | | | | — | | | | — | | | | (6,952,201 | ) | | | — | | | | 14,225,729 | | | | 33,083,090 | | | | — | | |
McDermott
Technology Americas,
Inc., 1M USD
LIBOR +
3.000% — 3.090%
6/30/2024(c)(g) | | | 1,074,102 | | | | 859,281 | | | | — | | | | — | | | | — | | | | (247,043 | ) | | | — | | | | 612,238 | | | | 1,074,102 | | | | — | | |
| | | | | 47,799,203 | | | | 3,043,320 | | | | (9,425,613 | ) | | | (1,978,014 | ) | | | (16,785,099 | ) | | | — | | | | 22,653,797 | | | | | | | | — | | |
52
FPA CRESCENT FUND
NOTES TO FINANCIAL STATEMENTS (Continued)
| Investments | | Shares
Held as of
December 31,
2020 | | Beginning
Value as of
December 31,
2020 | | Purchases
at Cost | | Proceeds
from Sales | | Net
Realized
Gain/(Loss)
on sales of
Affiliated
Investments | | Change in
Unrealized
Appreciation/
Depreciation | | Transfers In
(Out) | | Ending
Value as of
December 31,
2021 | | Shares
as of
December 31,
2021 | | Dividend
Income
from
Affiliated
Investments | |
Limted
Partnerships — 1.04% | |
FPS LLC(b)(c)(d)(e) | | | 1,076,253 | | | $ | 65,661,790 | | | $ | 16,618,162 | | | $ | (14,192,470 | ) | | | — | | | $ | 15,616,869 | | | | — | | | $ | 83,704,351 | | | | 1,185,446 | | | | — | | |
FPS Shelby Holding I
LLC(b)(c)(d)(e) | | | 107,799 | | | | 9,464,470 | | | | — | | | | (588,000 | ) | | | — | | | | (2 | ) | | | — | | | | 8,876,468 | | | | 107,799 | | | | — | | |
U.S. Farming Realty
Trust, L.P.(b)(c)(d)(e) | | | 350,000 | | | | 17,906,499 | | | | — | | | | (14,150,050 | ) | | | — | | | | 2,209,552 | | | | — | | | | 5,966,001 | | | | 350,000 | | | | — | | |
U.S. Farming Realty
Trust II, L.P.(b)(c)(d)(e) | | | 120,000 | | | | 8,544,132 | | | | — | | | | — | | | | — | | | | (200,896 | ) | | | — | | | | 8,343,236 | | | | 120,000 | | | | — | | |
| | | | | 101,576,891 | | | | 16,618,162 | | | | (28,930,520 | ) | | | — | | | | 17,625,523 | | | | — | | | | 106,890,056 | | | | | | | | — | | |
Preferred
Stocks — 0.13% | |
Engineering
Services — 0.13% | |
McDermott
International,
Inc.(c)(d)(e) | | | 225,906 | | | | 7,906,722 | | | | — | | | | — | | | | — | | | | 5,647,658 | | | | — | | | | 13,554,380 | | | | 22,591 | | | | — | | |
Total Affiliate
Investments — 2.12% | | | | $ | 221,309,708 | | | $ | 35,993,202 | | | $ | (51,113,247 | ) | | $ | (1,978,014 | ) | | $ | 13,631,756 | | | | — | | | $ | 217,843,405 | | | | | | | | — | | |
(a) Non-income producing security.
(b) Controlled company.
(c) Restricted securities. These securities are considered liquid by the Adviser. Most of these securities are not registered and may not be sold to the public. There are legal and/or contractual restrictions on resale. The Fund does not have the right to demand that such securities be registered. The values of these securities are determined by valuations provided by pricing services, brokers, dealers, market makers, or in good faith under policies adopted by authority of the Fund's Board of Trustees.
(d) These securities have been valued in good faith under policies adopted by authority of the Board of Trustee in accordance with the Fund's fair value procedures.
(e) Investments categorized as a significant unobservable input (Level 3) (See Note 8 of the Notes to Financial Statements).
(f) All or a portion of this holding is subject to unfunded loan commitments. The stated interest rate reflects the weighted average of the reference rate and spread for the funded portion, if any, and the commitment fees on the portion of the loan that is unfunded.
(g) Variable/Floating Rate Security — The rate shown is based on the latest available information as of December 31, 2021. For Corporate Bank Debt, the rate shown may represent a weighted average interest rate. Certain variable rate securities are not based on a published rate and spread but are determined by the issuer or agent and are based on current market conditions. These securities do not indicate a reference rate and spread in their description.
53
FPA CRESCENT FUND
REPORT OF INDEPENDENT REGISTERED
PUBLIC ACCOUNTING FIRM
TO THE SHAREHOLDERS AND
BOARD OF TRUSTEES OF FPA CRESCENT FUND
Opinion on the Financial Statements
We have audited the accompanying statement of assets and liabilities of FPA Crescent Fund (the "Fund") (one of the funds constituting the FPA Funds Trust (the "Trust")), including the portfolio of investments, as of December 31, 2021, the related statement of operations for the year then ended, the statement of changes in net assets for each of the two years in the period then ended, and the financial highlights for each of the four years in the period then ended, and the related notes (collectively referred to as the "financial statements"). The financial highlights for the year ended December 31, 2017 was audited by another independent registered public accounting firm whose report, dated February 20, 2018, expressed an unqualified opinion on those financial highlights. In our opinion, the financial statements present fairly, in all material respects, the financial position of the Fund (one of the funds constituting the FPA Funds Trust) at December 31, 2021, the results of its operations for the year then ended, the chan ges in its net assets for each of the two years in the period then ended, and its financial highlights for each of the four years in the period then ended, in conformity with U.S. generally accepted accounting principles.
Basis for Opinion
These financial statements are the responsibility of the Fund's management. Our responsibility is to express an opinion on the Fund's financial statements based on our audits. We are a public accounting firm registered with the Public Company Accounting Oversight Board (United States) ("PCAOB") and are required to be independent with respect to the Fund in accordance with the U.S. federal securities laws and the applicable rules and regulations of the Securities and Exchange Commission and the PCAOB.
We conducted our audits in accordance with the standards of the PCAOB. Those standards require that we plan and perform the audit to obtain reasonable assurance about whether the financial statements are free of material misstatement, whether due to error or fraud. The Fund is not required to have, nor were we engaged to perform, an audit of the Fund's internal control over financial reporting. As part of our audits, we are required to obtain an understanding of internal control over financial reporting but not for the purpose of expressing an opinion on the effectiveness of the Fund's internal control over financial reporting. Accordingly, we express no such opinion.
Our audits included performing procedures to assess the risks of material misstatement of the financial statements, whether due to error or fraud, and performing procedures that respond to those risks. Such procedures included examining, on a test basis, evidence regarding the amounts and disclosures in the financial statements. Our procedures included confirmation of securities owned as of December 31, 2021, by correspondence with the custodian and brokers or by other appropriate auditing procedures where replies from brokers were not received. Our audits also included evaluating the accounting principles used and significant estimates made by management, as well as evaluating the overall presentation of the financial statements. We believe that our audits provide a reasonable basis for our opinion.

We have served as the auditor of one or more FPA investment companies since 2018.
Los Angeles, CA
February 28, 2022
54
FPA CRESCENT FUND
APPROVAL OF INVESTMENT ADVISORY AGREEMENT
(Unaudited)
Approval of the Advisory Agreement. At a meeting of the Board of Directors held on August 9, 2021, the Directors approved the continuation of the advisory agreement between the Fund and the Adviser (the "Advisory Agreement") for an additional one-year period through September 30, 2022, on the recommendation of the Independent Directors, who met in executive session on August 9, 2021 prior to the Board meeting to review and discuss the proposed continuation of the Advisory Agreement. The Board had also met on July 12, 2021, with the Independent Directors meeting separately prior to the Meeting in executive session with the management of the Adviser and then separately with independent counsel to evaluate the renewal of the Advisory Agreement. Prior to their July 12 meeting, the Independent Directors, through their independent counsel, had requested and received extensive materials prepared in connection with the review of the Advisory Agreements. The materials provided a broad range of information regarding the Fund, including a description of, among other matters, the terms of the Advisory Agreement; the services provided by the Adviser; the experience of the relevant investment personnel; the Fund's performance in absolute terms and as compared to the performance of peers and appropriate benchmark(s); the fees and expenses of the Fund in absolute terms and as compared to peers; and the profitability of the Adviser from serving as adviser to the Fund.
In addition to the executive sessions, the Boards, acting directly or through their committees, met regularly throughout the year and received information on a variety of topics that were relevant to their annual consideration of the renewal of each Advisory Agreement including, among other matters, Fund investment performance, compliance, risk management, liquidity, valuation, trade execution, service provider oversight and other matters relating to Fund operations. The Independent Directors also had met with management of the Adviser (including key investment personnel) at their quarterly meetings as well as with management at other times between the quarterly meetings throughout the year. The materials specifically provided in connection with the annual review of the Advisory Agreements supplement the information received throughout the year.
At their regular Board meetings and executive sessions, the Independent Directors were also advised by independent legal counsel. In addition to the materials provided by the Adviser, the Independent Directors received a legal memorandum from independent counsel that outlined, among other matters: the duties of the Independent Directors and relevant requirements under the 1940 Act; the general principles under state law relevant to considering the approval of advisory contracts; an adviser's fiduciary duty with respect to advisory agreements and compensation; the standards used by courts in determining whether investment advisers and investment company boards of trustees have fulfilled their duties; and factors to be considered by the Independent Directors when voting on advisory agreements. During both executive sessions, independent legal counsel reviewed with Independent Directors these duties, standards and factors summarized in the legal memorandum described above. The following paragraphs summarize the material information and factors considered by the Board and the Independent Directors, as well as the Directors' conclusions relative to such factors.
Nature, Extent and Quality of Services. The Board and the Independent Trustees considered information provided by the Adviser in response to their requests, as well as information provided throughout the year regarding: the Adviser and its staffing in connection with the Fund, including the Fund's portfolio managers and the number and quality of analysts the Adviser has hired who are under the direct supervision of the Fund's portfolio managers; the scope of services supervised and provided by the Adviser; and the absence of any significant service problems reported to the Board. The Independent Trustees especially noted the experience, length of service and the outstanding reputation of the Fund's portfolio managers: Steven Romick, who has managed the Fund since its inception in 1993, Mark Landecker, who joined the Adviser in 2009 and has served as portfolio manager since 2013 and Brian A. Selmo, who joined the Adviser in 2008 and has served as portfolio
55
FPA CRESCENT FUND
APPROVAL OF INVESTMENT ADVISORY AGREEMENT (Continued)
(Unaudited)
manager since 2013. The Board and the Independent Trustees concluded that the nature, extent and quality of services provided by the Adviser have benefitted and should continue to benefit the Fund and its shareholders.
Investment Performance. The Board and the Independent Trustees reviewed the overall investment performance of the Fund. They also received information from an independent consultant, Broadridge, regarding the Fund's performance relative to a peer group of flexible (domestic and international) funds selected by Broadridge (the "Peer Group"). The Board and the Independent Trustees considered the Adviser's representation that the Fund's investment strategy is significantly different from other funds in the Peer Group in that the Fund has a much broader universe of investment possibilities, which requires a greater degree of portfolio management effort on the part of the Adviser. The Board and the Independent Trustees also considered the Adviser's representation that no other Broadridge category or peer grouping adequately represents the breadth and style of investing performed by the Fund's portfolio managers on behalf of the Fund (as a report previously prepared for the Board by an independent consultant had concluded). The Board and the Independent Trustees also considered FPA's representation that the Fund's size did not impede its ability to manage the Fund. The Board and the Independent Trustees noted the Fund's strong long-term investment performance and low volatility of returns when compared to the Peer Group and concluded that the Fund's investment performance has been strong. The Board and the Independent Trustees noted the Fund outperformed its Peer Group median for the one-, three-, five-, and ten-year periods ending March 31, 2021. The Board and the Independent Trustees further noted the Fund underperformed the comparative S&P 500 Index for the one-, three-, five- and 10-year periods ending March 31, 2021. They also noted that Morningstar continues to give the Fund a "Gold" Analyst Rating. In addition, they considered a comparison of the Fund's performance to that of hedge funds managed by the Adviser in a similar style. The Board and the Independent Trustees concluded that the Adviser's continued management of the Fund's investments should benefit the Fund and its shareholders.
Advisory Fees and Fund Expenses; Comparison with Peer Group and Institutional Fees. The Board and the Independent Trustees considered information provided by the Adviser regarding the Fund's advisory fees and total expense levels. The Board and the Independent Trustees reviewed comparative information regarding fees and expenses for the mutual fund industry generally and for the Peer Group. The Board and the Independent Trustees noted that the Fund's current management fee rate and total expense ratio each ranked towards the higher end of those of the Peer Group. They considered the Adviser's representation that the Fund's broader investment strategy makes comparisons to the advisory fees of the funds in the Peer Group less relevant, noting the Adviser's representation that most of the funds in the Peer Group are traditional balanced funds with different investment objectives and strategies, generally encompassing bond components that traditionally have lower advisory fees. The Board and the Independent Trustees considered the fees charged by the Adviser for advising institutional accounts and hedge funds and for sub-advising other mutual funds and the Adviser's discussion of the differences between the services provided by the Adviser to the Fund and those provided by the Adviser to the sub-advised funds, institutional accounts, and hedge funds. The Board and the Independent Trustees concluded that the continued payment of advisory fees and expenses by the Fund to the Adviser was fair and reasonable and should continue to benefit the Fund and its shareholders.
Adviser Profitability and Costs. The Board and the Independent Trustees considered information provided by the Adviser regarding the Adviser's costs in providing services to the Fund, the profitability of the Adviser and the benefits to the Adviser from its relationship to the Fund. They reviewed and considered the Adviser's representations regarding its assumptions and methods of allocating certain costs, such as personnel costs, which constitute the Adviser's largest operating cost, overhead and trading costs with respect to the provision of
56
FPA CRESCENT FUND
APPROVAL OF INVESTMENT ADVISORY AGREEMENT (Continued)
(Unaudited)
investment advisory services. The Independent Trustees discussed with the Adviser the general process through which individuals' compensation is determined and then reviewed by the management committee of the Adviser, as well as the Adviser's methods for determining that its compensation levels are set at appropriate levels to attract and retain the personnel necessary to provide high quality professional investment advice. In evaluating the Adviser's profitability, they excluded certain distribution and marketing-related expenses. The Board and the Independent Trustees recognized that the Adviser is entitled under the law to earn a reasonable level of profits for the services that it provides to the Fund. The Board and the Independent Trustees concluded that the Adviser's level of profitability from its relationship with the Fund did not indicate that the Adviser's compensation was unreasonable or excessive.
Economies of Scale and Sharing of Economies of Scale. The Board and the Independent Trustees considered, and discussed at length with the Adviser, whether there have been economies of scale with respect to the management of the Fund, whether the Fund has appropriately benefited from any economies of scale, and whether the fee rate is reasonable in relation to the Fund's asset levels and any economies of scale that may exist. While the Independent Trustees noted that the Fund experienced significant increases in its net assets several years ago, in recent years asset levels have declined. They also considered the Adviser's representation that its internal costs of providing investment management services to the Fund have also significantly increased in recent years as a result of a number of factors, including the ongoing and growing complexity of the Fund's investments, as well as the Adviser's substantial investment in additional professional resources and staffing. The Board and the Independent Trustees considered both quantitative and qualitative information regarding the Adviser's representation that it has also made significant investments in: (1) maintaining a portfolio management team of three and a team of analysts, traders and other investment personnel who assist with the management of the Fund; (2) new compliance, operations, and administrative personnel; (3) information technology, portfolio accounting and trading systems; and (4) office space, each of which enhances the quality of services provided to the Fund. The Board and Independent Trustees also considered the Adviser's representation that it would continue making such investments to maintain and increase the level and quality of services that it provides to the Fund. The Board and the Independent Trustees also considered that the Adviser had agreed to forgo the compensation for providing certain financial services that it had previously received from the Fund. The Board and the Independent Trustees also considered the Adviser's willingness to close funds to new investors when it believed that the Fund had limited capacity to grow or that it otherwise would benefit fund shareholders. The Board also noted that even though the Fund has experienced net outflows during the recent period, the Adviser has continued to make investments in the services it provides to the Fund. The Board noted that the Fund does not charge sales loads.
The Board and the Independent Trustees recognized that the advisory fee schedule for the Fund does not have breakpoints. They considered that many mutual funds have breakpoints in the advisory fee structure as a means by which to share in the benefits of potential economies of scale as a fund's assets grow. They also considered that not all funds have breakpoints in their fee structures and that breakpoints are not the exclusive means of sharing potential economies of scale. The Board and the Independent Trustees considered the Adviser's statement that it believes that breakpoints currently remain inappropriate for the Fund given the ongoing additional investments the Adviser is making in its business for the benefit of the Fund, uncertainties regarding the direction of the economy, and uncertainties regarding future growth or contraction in the Fund's assets, all of which could negatively impact the profitability of the Adviser. The Board and the Independent Directors also noted that the Adviser has contractually agreed to reimburse the Fund for operating expenses in excess of 0.05% of the average
57
FPA CRESCENT FUND
APPROVAL OF INVESTMENT ADVISORY AGREEMENT (Continued)
(Unaudited)
net assets of the Fund, excluding management fees, administrative service fees, short sale dividend expenses and interest expenses on cash deposits relating to short sales, brokerage fees and commissions, redemption liquidity service expenses, interest, taxes, fees and expenses of other funds in which the Fund invests, and extraordinary expenses, including litigation expenses not incurred in the Fund's ordinary course of business, through April 30, 2022. The Board and the Independent Trustees concluded that the Fund is benefitting from the ongoing investments made by the Adviser in its team of personnel serving the Fund and in the Adviser's service infrastructure, and that in light of these investments, the addition of breakpoints to the Fund's advisory fee structure was not warranted at current asset levels.
Ancillary Benefits. The Board and the Independent Trustees considered other actual and potential benefits to the Adviser from managing the Fund, including the acquisition and use of research services with commissions generated by the Fund, in concluding that the contractual advisory and other fees are fair and reasonable for the Funds. They noted that the Adviser does not have any affiliates that benefit from the Adviser's relationship to the Fund.
Conclusions. The Board and the Independent Trustees determined that the Fund continues to benefit from the services of the Adviser's highly experienced portfolio managers and portfolio management team, which has produced outstanding long-term returns with low relative volatility. In addition, the Board and the Independent Trustees agreed that the Fund continues to receive high quality services from the Adviser. The Board and the Independent Trustees concluded that the current advisory fee rate is reasonable and fair to the Fund and its shareholders in light of the nature and quality of the services provided by the Adviser and the Adviser's profitability and costs. In reaching their conclusions, the Independent Trustees also noted their intention to continue monitoring the factors relevant to the Adviser's compensation, such as changes in the Fund's asset levels, changes in portfolio management personnel and the cost and quality of the services provided by the Adviser to the Fund. On the basis of the foregoing, and without assigning particular weight to any single factor, none of which was dispositive, the Board and the Independent Trustees concluded that it would be in the best interests of the Fund to continue to be advised and managed by the Adviser and determined to approve the continuation of the current Advisory Agreement for another one-year period through September 30, 2022.
58
FPA CRESCENT FUND
SHAREHOLDER EXPENSE EXAMPLE
December 31, 2021 (Unaudited)
Fund Expenses
Mutual fund shareholders generally incur two types of costs: (1) transaction costs, and (2) ongoing costs, including advisory and administrative fees; shareholder service fees; and other Fund expenses. The Example is intended to help you understand your ongoing costs (in dollars) of investing in the Fund and to compare these costs with the ongoing costs of investing in other mutual funds. The Example is based on an investment of $1,000 invested at the beginning of the year and held for the entire year.
Actual Expenses
The information in the table under the heading "Actual Performance" provides information about actual account values and actual expenses. You may use the information in this column, together with the amount you invested, to estimate the expenses that you paid over the period. Simply divide your account value by $1,000 (for example, an $8,600 account value divided by $1,000 = 8.6), then multiply the result by the number in the first column in the row entitled "Expenses Paid During Period" to estimate the expenses you paid on your account during this period.
Hypothetical Example for Comparison Purposes
The information in the table under the heading "Hypothetical Performance (5% return before expenses)" provides information about hypothetical account values and hypothetical expenses based on the Fund's actual expense ratio and an assumed rate of return of 5% per year before expenses, which is not the Fund's actual return. The hypothetical account values and expenses may not be used to estimate the actual ending account balance or expenses you paid for the period. You may use this information to compare the ongoing costs of investing in the Fund and other funds. To do so, compare this 5% hypothetical example with the 5% hypothetical examples that appear in the shareholder reports of other funds.
Please note that the expenses shown in the table are meant to highlight your ongoing costs only and do not reflect any transactional costs. Therefore, the information under the heading "Hypothetical Performance (5% return before expenses)" is useful in comparing ongoing costs only, and will not help you determine the relative total costs of owning different funds. In addition, if these transactional costs were included, your costs would have been higher. Even though the Fund does not charge transaction fees, if you purchase shares through a broker, the broker may charge you a fee. You should evaluate other mutual funds' transaction fees and any applicable broker fees to assess the total cost of ownership for comparison purposes.
| | | Actual Performance | | Hypothetical Performance
(5% return before expenses) | |
Institutional Class | |
Beginning Account Value June 30, 2021 | | $ | 1,000.00 | | | $ | 1,000.00 | | |
Ending Account Value December 31, 2021 | | $ | 1,016.20 | | | $ | 1,019.21 | | |
Expenses Paid During Period(a) | | $ | 6.05 | | | $ | 6.06 | | |
Supra Institutional Class | |
Beginning Account Value June 30, 2021 | | $ | 1,000.00 | | | $ | 1,000.00 | | |
Ending Account Value December 31, 2021 | | $ | 1,016.80 | | | $ | 1,019.51 | | |
Expenses Paid During Period(b) | | $ | 5.74 | | | $ | 5.75 | | |
(a) Expenses are equal to the class's annualized expense ratio of 1.19%, multiplied by the average account value over the period and prorated for the six-months ended December 31, 2021 (184/365 days).
(b) Expenses are equal to the class's annualized expense ratio of 1.13%, multiplied by the average account value over the period and prorated for the six-months ended December 31, 2021 (184/365 days).
59
FPA CRESCENT FUND
PRIVACY POLICY
(Unaudited)
The following is the privacy notice of the mutual funds managed by First Pacific Advisors, LP ("FPA", and the mutual funds, the "FPA Funds"). A complete list of funds is provided below.
The FPA Funds take privacy seriously and consider privacy to be a fundamental aspect of its relationships with its former, prospective, and current investors. The FPA Funds are committed to maintaining the confidentiality, integrity and security of its former, current, and prospective investors' non-public personal information and other personal information. This privacy policy describes our privacy practices surrounding the collection and sharing of non-public personal information of current, former, and prospective investors.
Sources and Collection of Non-Public Personal Information.
While providing investors and/or prospective investors (collectively, "investors") with products and services, the FPA Funds, and certain service providers, such as the FPA Fund's Transfer Agents and/or Administrators, may obtain non-public personal information about such investors, which may come directly from the investor or their intermediaries from sources such as: (i) account applications, subscription agreements and other forms, (ii) written, electronic or verbal correspondence, (iii) investor transactions, (iv) an investor's brokerage or financial advisory firm, financial advisor or consultant, and/or (v) from information captured on applicable websites, including information you may voluntarily provide when you subscribe to receive FPA's quarterly updates or request us to mail you information about the FPA Funds. In addition, the FPA Funds may collect additional non-public personal information from different sources, such as: (i) affiliates or their service providers; (ii) public websites or other publicly available sources such as government records; and/or (iii) from credit reporting agencies, sanctions screening databases, or from sources designed to detect and prevent fraud.
The non-public personal information collected about an investor may include: (i) identifiers and similar information such as the investor's name, address, tax identification number, birth date, driver's license number, and potentially email address and phone number (if provided); (ii) commercial information like an investment selection, beneficiary information, or transaction and account history with the FPA Funds; (iii) internet or other electronic network activity like interactions with the FPA website; and (iv) professional or employment-related information like an investor's occupation and job title.
Purpose for Collecting Non-Public Personal Information.
We may collect or use all or a few of these categories of non-public personal information listed above for the following business or commercial purposes: (i) performing services on behalf of FPA or the FPA Funds, including, for example, maintaining or servicing accounts, providing customer service, processing transactions, verifying information, processing payments, or providing similar services; (ii) performing our contractual obligations, including providing updates on FPA Funds performance and other operational matters; (iii) detecting security incidents, protecting against malicious, deceptive, fraudulent, or illegal activity, including, preventing fraud and conducting "Know Your Client," anti-money laundering, terrorist financing, and conflict checks; or (iv) enabling or effecting commercial transactions, including, using bank account details to remit funds and process distributions.
Disclosure of Non-Public Personal Information.
The FPA Funds do not disclose any non-public personal information provided by investors or gathered by the FPA Funds to third parties, except as required or permitted by law or as necessary for such third parties to perform their agreements with respect to the FPA Funds. Non-affiliated companies may from time to time be used to provide certain services, such as maintaining investor accounts, preparing and mailing prospectuses, reports, account statements and other information, conducting Know Your Client reviews, performing checks
60
FPA CRESCENT FUND
PRIVACY POLICY (Continued)
(Unaudited)
against sanctions lists, and gathering shareholder proxies. In many instances, the investor will be a client of a third party, but the FPA Funds may also provide an investor's non-public personal information and account information to the investor's respective custodian, brokerage or financial advisory firm and/or financial advisor or consultant.
Sharing Information with Third Parties.
The FPA Funds reserve the right to report or disclose non-public personal information or account information to third parties in circumstances where the FPA Funds believe in good faith that disclosure is required or permitted under law, to cooperate with regulators or law enforcement authorities, to protect their rights or property, or upon reasonable request by the FPA Funds in which an investor has invested. In addition, the FPA Funds may disclose information about an investor or an investor's accounts to a third party at the investor's request or direction or with the consent of the investor.
Rights to Limited Sharing.
Federal law gives you the right to limit some but not all sharing of your nonpublic personal information. We do not: (i) share non-public personal information with non-affiliates to market to you; (ii) engage in joint marketing with non-affiliates; (iii) share non-public personal information with affiliates to market to you; or (iv) share non-public personal information about your creditworthiness with affiliates.
Procedures to Safeguard Private Information.
The FPA Funds will take reasonable steps and use security measures appropriate to the nature of the information and that comply with applicable laws to protect investors' non-public personal information against unauthorized access and exfiltration, acquisition, theft, or disclosure. In addition to this policy, the FPA Funds have implemented internal procedures that are designed to help guard investors' personal data. Given the nature of information security, there is no guarantee that such safeguards will always be successful.
Changes to the Privacy Policy.
From time to time, the FPA Funds may update or revise this privacy policy. If there are changes to the terms of this privacy policy, documents containing the revised policy will be updated.
FPA Funds.
FPA Crescent Fund, FPA New Income, Inc., FPA Flexible Fixed Income Fund, FPA U.S. Core Equity Fund, Inc., FPA Queens Road Value Fund, FPA Queens Road Small Cap Value Fund, Source Capital, Inc.
Contact Us.
Questions, comments, and requests regarding this privacy policy are welcomed and should be addressed to dataprotection@fpa.com.
Revised: January 2022
61
FPA CRESCENT FUND
TRUSTEE AND OFFICER INFORMATION
(Unaudited)
Sandra Brown, Mark L. Lipson, Alfred E. Osborne, Jr., A. Robert Pisano, and Patrick B. Purcell are all Trustees of the Fund who are not "interested persons" of the Fund, as that term is defined in the 1940 Act (collectively, the "Independent Trustees"). Trustees serve until their resignation, removal or retirement. The Statement of Additional Information includes additional information about the Trustees and is available, without charge, upon request by calling (800) 982-4372.
Name, Address(1)
and Year of Birth | | Position(s)
Held with
the Fund | | Year First
Elected as
Trustee of
the Fund | | Principal Occupation(s)
During the
Past Five Years | | Number of
FPA Funds
Overseen
by Trustee | | Other
Directorships
Held by Trustee
During the Past
Five Years | |
Independent Trustees | |
Sandra Brown,
1955 | | Trustee | | | 2016 | | | Consultant (since 2009). Formerly, CEO and President of Transamerica Financial Advisers, Inc. (1999-2009); President, Transamerica Securities Sales Corp. (1998-2009); Vice President, Bank of America Mutual Fund Administration (1990-1998). Director/Trustee of FPA Funds Trust, FPA New Income, Inc., FPA U.S. Core Equity Fund, and Source Capital (since 2016), and Trustee of Bragg Capital Trust (since 2020). | | | 7 | | | None | |
Mark L. Lipson,
1949 | | Trustee & Chairman | | | 2015 | | | Registered Investment Adviser, ML2 Advisors, LLC (since 2014). Formerly Managing Director, Bessemer Trust (2007-2014) and US Trust (2003-2006); Chairman and CEO of the Northstar Mutual Funds (1993-2001); and President and CEO of the National Mutual Funds (1988-1993). Director/Trustee of FPA Funds Trust, FPA New Income, Inc., FPA U.S. Core Equity Fund, and Source Capital (since 2015), and Trustee of Bragg Capital Trust (since 2020). | | | 7 | | | None | |
Alfred E. Osborne, Jr.,
1944 | | Trustee | | | 2002 | | | Senior Associate Dean, (2003-Present), Interim Dean (2018-June 2019), Professor and Faculty Director (since 2003) Price Center for Entrepreneurship and Innovation at the John E. Anderson School of Management at UCLA. Dr. Osborne has been at UCLA since 1972. Director/Trustee of FPA Funds Trust, FPA New Income, Inc., FPA U.S. Core Equity Fund, and Source Capital (since 2013), and Trustee of Bragg Capital Trust (since 2020). | | | 7 | | | Kaiser Aluminum, Wedbush Capital and Waverley Capital Acquisition Corporation | |
62
FPA CRESCENT FUND
TRUSTEE AND OFFICER INFORMATION (Continued)
(Unaudited)
Name, Address(1)
and Year of Birth | | Position(s)
Held with
the Fund | | Year First
Elected as
Trustee of
the Fund | | Principal Occupation(s)
During the
Past Five Years | | Number of
FPA Funds
Overseen
by Trustee | | Other
Directorships
Held by Trustee
During the Past
Five Years | |
A. Robert Pisano,
1943 | | Trustee | | | 2013 | | | Consultant (since 2012). Formerly, President and Chief Operating Officer of The Motion Picture Association of America, Inc. (2005-2011). Formerly, National Executive Director and Chief Executive Officer of The Screen Actors Guild (2001-2005). Director/Trustee of FPA Funds Trust, FPA New Income, Inc., FPA U.S. Core Equity Fund, and Source Capital (since 2013), and Trustee of Bragg Capital Trust (since 2020). | | | 7 | | | Resources Global Professionals | |
Patrick B. Purcell,
1943 | | Trustee | | | 2006 | | | Retired (since 2000). Formerly, Consultant to Paramount Pictures 1998-2000; Executive Vice President, Chief Financial and Administrative Officer of Paramount Pictures (1983-1998). Director/Trustee of FPA Funds Trust and FPA New Income, Inc. (since 2006), of Source Capital, Inc. (since 2010), of FPA U.S. Core Equity Fund, Inc (since 2012), and Bragg Capital Trust (since 2020). | | | 7 | | | None | |
"Interested" Trustees(2) | |
Steven Romick,
1963 | | Trustee | | | 2002 | | | Director and President of FPA GP, Inc., the General Partner of the Adviser (since 2018). Vice President (since 2015) and Portfolio Manager of FPA Crescent Fund (since 1993) and of Source Capital, Inc. (since 2015). Formerly, Managing Partner of FPA (2010-2018). Formerly, President of the Trust (2002-2015). | | | 2 | | | None | |
J. Richard Atwood,
1960 | | Trustee | | | 2016 | | | Director and President of FPA GP, Inc., the General Partner of the Adviser (since 2018). Director/Trustee and President of each FPA Fund. Formerly, Managing Partner of the Advier (2006-2018). | | | 7 | | | None | |
(1) The address of each Trustee is 11601 Wilshire Boulevard, Suite 1200, Los Angeles, California 90025.
(2) "Interested person" within the meaning of the 1940 Act by virtue of their affiliation with the Fund's Adviser.
63
FPA CRESCENT FUND
TRUSTEE AND OFFICER INFORMATION (Continued)
(Unaudited)
Officers of the Fund. Officers of the Fund are elected annually by the Board.
Name, Address(1)
and Year of Birth | | Position
with Fund | | Year First
Elected as
Officer of the
Fund | | Principal Occupation(s)
During the Past Five Years | |
J. Richard Atwood,
1960 | | President | | | 1997 | | | Director and President of FPA GP, Inc., the General Partner of the Adviser (since 2018). Director/Trustee of each FPA Fund. President of each FPA Fund. Formerly, Managing Partner of Adviser (2006-2018). | |
Steven Romick,
1963 | | Vice President and Portfolio Manager | | | 2002 | | | Director and President of FPA GP, Inc., the General Partner of the Adviser (since 2018). Vice President (since 2015) and Portfolio Manager of FPA Crescent Fund (since 1993) and of Source Capital, Inc. (since 2015). Formerly, Managing Partner of FPA (2010-2018). Formerly, President of the Trust (2002-2015). | |
Mark Landecker,
1975 | | Vice President and Portfolio Manager | | | 2013 | | | Partner of FPA (since 2013). Formerly, Managing Director (January 2013-December 2013). Vice President and Portfolio Manager of Source Capital, Inc. (since 2015). | |
Brian Selmo,
1977 | | Vice President and Portfolio Manager | | | 2013 | | | Partner of FPA (since 2013). Formerly, Managing Director (January 2013-December 2013). Vice President and Portfolio Manager of Source Capital, Inc. (since 2015). | |
Karen E. Richards,
1969 | | Chief Compliance Officer | | | 2019 | | | Chief Compliance Officer of the Adviser (since 2018); and Chief Compliance Officer of each FPA Fund (since 2019, except Bragg Capital Trust since 2020). Formerly, Deputy Chief Compliance Officer of First Republic Investment Management, LLC (from 2016 to 2018), and Vice President, Senior Compliance Officer of Pacific Investment Management Company (from 2010 to 2016). | |
E. Lake Setzler III,
1967 | | Treasurer | | | 2006 | | | Managing Director and CFO of the Adviser (since 2022); and Treasurer of each FPA Fund. Formerly, Senior Vice President and Controller of the Adviser. | |
Rebecca D. Gilding,
1979 | | Secretary | | | 2019 | | | Vice President and Counsel, State Street Bank and Trust Company (since 2016); and Secretary of each FPA Fund (since 2019, except Bragg Capital Trust since 2020). Formerly, Assistant Vice President and Associate Counsel, Brown Brothers Harriman & Co. (2013 to 2016). | |
(1) The address for each Officer (except Ms. Gilding) is 11601 Wilshire Boulevard, Suite 1200, Los Angeles, California 90025. Ms. Gilding's address is State Street Bank and Trust Company, One Lincoln Street, Boston, Massachusetts 02111.
64
FPA CRESCENT FUND
(Unaudited)
INVESTMENT ADVISER
First Pacific Advisors, LP
11601 Wilshire Boulevard, Suite 1200
Los Angeles, CA 90025
TRANSFER & SHAREHOLDER SERVICE AGENT
UMB Fund Services, Inc.
P.O. Box 2175
Milwaukee, WI 53201-2175
or
235 West Galena Street
Milwaukee, WI 53212-3948
(800) 638-3060
CUSTODIAN AND ADMINISTRATOR
State Street Bank and Trust Company
One Lincoln Street
Boston, Massachusetts 02111
Institutional Class:
TICKER SYMBOL: FPACX
CUSIP: 30254T759
Supra Institutional Class:
TICKER SYMBOL: FPCSX
CUSIP: 30254T676
DISTRIBUTOR
UMB Distribution Services, LLC
235 West Galena Street
Milwaukee, Wisconsin 53212-3948
LEGAL COUNSEL
Dechert LLP
One Bush Street, Suite 1600
San Francisco, California 94104
INDEPENDENT REGISTERED PUBLIC ACCOUNTING FIRM
Ernst & Young LLP
725 South Figueroa Street
Los Angeles, California 90017
This report has been prepared for the information of shareholders of FPA CRESCENT FUND, and is not authorized for distribution to prospective investors unless preceded or accompanied by an effective prospectus.
A description of the policies and procedures that the Adviser uses to vote proxies related to the Fund's portfolio securities is set forth in the Fund's Statement of Additional Information which is available without charge, upon request, on the Fund's website at www.fpa.com or by calling (800) 982-4372 and on the Securities and Exchange Commission's website at www.sec.gov.
The Fund's complete proxy voting record for the 12 months ended June 30, 2021 is available without charge, upon request by calling (800) 982-4372 and on the SEC's website at www.sec.gov.
The Fund's schedule of portfolio holdings, filed the first and third quarter of the Fund's fiscal year on Form N-PORT with the SEC, is available on the SEC's website at www.sec.gov.
Additional information about the Fund is available online at www.fpa.com. This information includes, among other things, holdings, top sectors, and performance, and is updated on or about the 15th business day after the end of each quarter.

Distributor:
UMB DISTRIBUTION SERVICES, LLC
235 West Galena Street
Milwaukee, Wisconsin 53212
FPA Flexible Fixed Income Fund
FPA FLEXIBLE FIXED INCOME FUND
LETTER TO SHAREHOLDERS
INTRODUCTION
Dear Fellow Shareholders,
FPA Flexible Fixed Income Fund (the "Fund") returned 0.19% in the fourth quarter of 2021 and 1.77% for the year ended December 31, 2021.
As of December 31, 2021, the portfolio had a yield-to-worst of 1.98%1 and an effective duration of 0.98 years. With inflation proving to be more persistent than expected, the Federal Reserve began the process of tightening monetary policy. During the quarter, the Fed first announced a tapering of its asset purchases then doubled the pace of its tapering. Further, the Fed's most recent projections in December showed a greater number of expected increases in the Fed Funds rate in 2022.2 Accordingly, Treasury yields rose during the fourth quarter, particularly in short- to intermediate-maturity bonds, with two- and three-year maturity Treasury yields increasing 45 basis points (bps) and five-year maturity Treasury yields increasing 30 bps. Treasury bonds maturing beyond 10 years declined in yield. As a consequence, fixed-rate bond prices declined across a range of maturities.
Despite higher risk-free rates, spreads and yields in credit (investments rated BBB or lower) remain near historically low levels, creating a challenging investing environment in credit. Meanwhile, higher risk-free rates create an opportunity to extend duration in high-quality investments rated single-A or higher as these bonds now offer sufficient compensation for the duration risk (i.e., duration is cheaper). While we patiently sift potential investments in credit, we will seek to invest in these longer duration, high-quality investments or retain cash while we wait for attractive investment opportunities.
The Fund's credit exposure (investments rated BBB or lower) increased from 22.1% as of September 30, 2021 to 24.1% as of December 31, 2021. Cash and equivalents decreased from 13.7% of the portfolio as of September 30, 2021 to 11.4% on December 31, 2021.
Portfolio Attribution3
Fourth Quarter 2021
The largest contributors to performance during the quarter were corporate holdings, with much of the return due to income. In particular, the corporate holdings benefited from dividends on common stocks, in
1 Yield to Worst ("YTW") is presented gross of fees and reflects the lowest possible yield on a callable bond without the issuer defaulting. It does not represent the yield an investor should expect to receive. As of December 31, 2021, the Fund's subsidized/unsubsidized 30-day SEC standardized yield ("SEC Yield") was 1.57%/1.22% respectively. The SEC Yield calculation is an annualized measure of the Fund's dividend and interest payments for the last 30 days, less the Fund expenses. Subsidized yield reflects fee waivers and/or expense reimbursements during the period. Without waivers and/or reimbursements, yields would be reduced. Unsubsidized yield does not adjust for any fee waivers and/or expense reimbursements in effect. The SEC Yield calculation shows investors what they would earn in yield over the course of a 12-month period if the fund continued earning the same rate for the rest of the year.
2 Source: The Federal Reserve. https://www.federalreserve.gov/monetarypolicy/files/fomcprojtabl20211215.pdf
3 This information is not a recommendation for a specific security or sector and these securities/sectors may not be in the Fund at the time you receive this report. The information provided does not reflect all positions or sectors purchased, sold or recommended by FPA during the quarter. The portfolio holdings as of the most recent quarter end may be obtained at www.fpa.com.
Past performance is no guarantee, nor is it indicative, of future results.
1
FPA FLEXIBLE FIXED INCOME FUND
LETTER TO SHAREHOLDERS
(Continued)
addition to an increase in the overall market value of those stocks.4 The second-largest contributors to performance during the quarter were collateralized loan obligations (CLOs), which are part of the asset-backed securities (ABS) sector, owing mostly to coupon payments. The vast majority of the CLOs had floating rates, and therefore did not experience significant price declines amid rising risk-free rates during the quarter. The third-largest contributors to performance were ABS backed by loans to late-stage, mostly software companies with the return due to coupon payments, partially offset by lower prices induced by rising risk-free rates.
The largest detractors from Fund performance were ABS backed by auto loans or leases, followed by ABS backed by equipment, and then ABS backed by insurance premium loans. For all three investments, the performance was driven by price declines caused by the increase in risk-free rates that occurred during the quarter.
Calendar Year 2021
For the year ended December 31, 2021, the largest contributors to Fund performance were the corporate holdings (which includes corporate bonds, bank debt and equity). While the corporate holdings benefited from coupon payments on loans and bonds and dividends on common stocks, the majority of the return came from price appreciation as credit spreads compressed and risk assets appreciated in value over the course of the year.
The second-largest contributors to performance during the year were CLOs, which are part of the ABS sector, with coupon payments representing the primary source of return. As the vast majority of these holdings are floating rate, their price was not materially impacted by the increase in risk-free rates over the year.
The third-largest contributors to performance in 2021 were ABS backed by equipment, with the overall return driven by coupon payments, partially offset by price declines as a result of higher risk-free rates.
The largest detractors from performance were agency commercial mortgage-backed securities (CMBS). The prepayment speeds on these bonds ended up being too fast relative to the premium on the bond, resulting in a total return loss over this time period. At the sector level, there were no other meaningful detractors from performance, though there were individual investments in some sectors that detracted from performance.
4 The Fund's dividends have recently been higher than expected due to the distribution of non-recurring dividend income received on the Fund's common stock holdings. These common stocks are in the portfolio as a result of restructurings of debt investments previously held in the Fund. Dividends on these common stocks represent an avenue toward realizing the recovery of our debt investments. Dividends are not guaranteed.
Past performance is no guarantee, nor is it indicative, of future results.
2
FPA FLEXIBLE FIXED INCOME FUND
LETTER TO SHAREHOLDERS
(Continued)
Portfolio Activity
The table below shows the portfolio's sector-level exposures as of December 31, 2020 and September 30, 2021 compared to December 31, 2021:
| Sector | | % Portfolio
12/31/2021 | | % Portfolio
9/30/2021 | | % Portfolio
12/31/2020 | |
ABS | | | 65.2 | % | | | 62.8 | % | | | 62.0 | % | |
Mortgage Backed (CMO)5 | | | 7.4 | % | | | 5.6 | % | | | 6.5 | % | |
Stripped Mortgage-backed | | | 0.2 | % | | | 0.3 | % | | | 0.7 | % | |
Corporate | | | 7.0 | % | | | 7.0 | % | | | 8.3 | % | |
CMBS5 | | | 8.8 | % | | | 10.6 | % | | | 9.6 | % | |
Mortgage Pass-through | | | 0.0 | % | | | 0.0 | % | | | 0.1 | % | |
Cash and equivalents | | | 11.4 | % | | | 13.7 | % | | | 12.8 | % | |
Total | | | 100.0 | % | | | 100.0 | % | | | 100.0 | % | |
Yield-to-worst6 | | | 1.98 | % | | | 1.63 | % | | | 1.85 | % | |
Effective Duration (years) | | | 0.98 | | | | 0.74 | | | | 1.09 | | |
Average Life (years) | | | 1.94 | | | | 1.51 | | | | 1.47 | | |
As discussed in more detail below, Treasury yields rose during the quarter due to an expected near-term tightening in monetary policy driven by more persistent than expected inflation. Though higher risk-free rates led to higher absolute yields in investment grade and high-yield-rated debt, credit spreads across the ratings spectrum remain near historically low levels. In credit specifically (investments rated BBB or lower), though yields were higher over the past quarter, they remain low on an absolute basis, and spreads declined during the quarter. We were able to find some investments in credit — much of it in short-duration investments — but, on the whole, investing in credit remains a challenge due to valuations that are unappealing on an absolute and relative basis. Our credit investments this quarter included newly issued bonds backed by non-performing residential mortgages, bank loans, bonds backed by telecom infrastructure or data centers, bonds backed by loans to late-stage, mostly software companies, and bonds backed by consumer loans. Net of maturities of existing holdings, these investments resulted in the Fund's credit exposure increasing from 22.1% at September 30, 2021 to 24.1% at year-end.
5 Collateralized mortgage obligations ("CMO") are mortgage-backed bonds that separate mortgage pools into different maturity classes. Commercial mortgage-backed securities ("CMBS") are securities backed by commercial mortgages rather than residential mortgages.
6 Yield to Worst ("YTW") is presented gross of fees and reflects the lowest possible yield on a callable bond without the issuer defaulting. It does not represent the yield an investor should expect to receive. As of December 31, 2021, the Fund's subsidized/unsubsidized 30-day SEC standardized yield ("SEC Yield") was 1.57%/1.22% respectively. The SEC Yield calculation is an annualized measure of the Fund's dividend and interest payments for the last 30 days, less the Fund expenses. Subsidized yield reflects fee waivers and/or expense reimbursements during the period. Without waivers and/or reimbursements, yields would be reduced. Unsubsidized yield does not adjust for any fee waivers and/or expense reimbursements in effect. The SEC Yield calculation shows investors what they would earn in yield over the course of a 12-month period if the fund continued earning the same rate for the rest of the year.
Past performance is no guarantee, nor is it indicative, of future results.
3
FPA FLEXIBLE FIXED INCOME FUND
LETTER TO SHAREHOLDERS
(Continued)
Beyond credit, with more compensation available for duration risk, we took advantage of higher yields by buying longer-duration bonds. As a reminder, rather than make speculative bets on the direction and timing of interest rate moves, we instead seek to buy bonds that we expect will have at least a breakeven total return over the course of a year if we assume that a bond's yield will increase by approximately 100 bps over that time period. Using this test as a guide, this past quarter we bought high-quality (rated single-A or higher), fixed-rate bonds with a weighted average life of approximately two years. These investments included, but were not limited to, ABS backed by subprime auto loans, ABS backed by equipment, ABS backed by insurance premium loans, and ABS backed by prime auto loans or leases. In addition, we made high-quality investments in floating-rate tranches of CLOs backed by corporate loans and CLOs backed by commercial real estate loans. Approximately a third of the Fund is comprised of floating-rate investments in the form of CLOs backed by corporate loans, CLOs backed by commercial real estate loans, bank loans and other structured product investments. To the extent that the Federal Reserve raises the Fed Funds rate, we expect that the price of these floating-rate investments will not be significantly impacted by higher risk-free rates and these investments should positively contribute to the Fund's return via higher coupon payments.
Investments during the quarter were funded with a combination of proceeds from the amortization and maturity of existing holdings and sales of short-maturity bonds. As a residual of the investment process, cash and equivalents decreased from 13.7% of the portfolio as of September 30, 2021 to 11.4% on December 31, 2021.
Market Commentary
Inflation continues to be a hot topic. The chart below shows that as of December 31, 2021, inflation excluding food and energy prices increased, measuring 5.5% on a year-over-year basis and 3.5% compared to two years ago. For reference, overall inflation was 7.1% and 4.2% for those same time periods, respectively. These levels of inflation haven't been seen since the 1980s.
4
FPA FLEXIBLE FIXED INCOME FUND
LETTER TO SHAREHOLDERS
(Continued)
CPI Urban Consumers Less Food and Energy
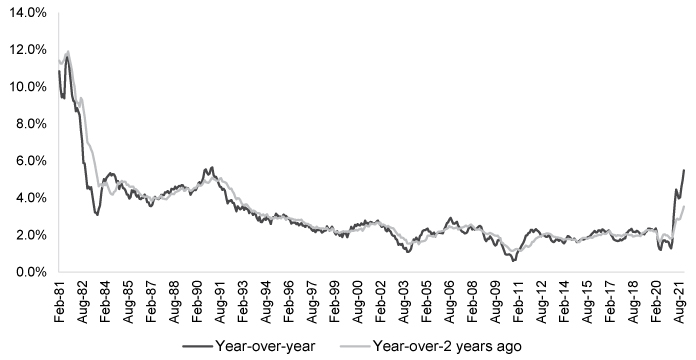
Source: Bureau of Labor Statistics. Chart data thru December 31, 2021. The "Consumer Price Index for All Urban Consumers: All Items Less Food & Energy" is an aggregate of prices paid by urban consumers for a typical basket of goods, excluding food and energy. This measurement, known as "Core CPI," is widely used by economists because food and energy prices can be volatile. The all urban consumer group represents about 93 percent of the total U.S. population. It is based on the expenditures of almost all residents of urban or metropolitan areas, including professionals, the self-employed, the unemployed, and retired people, as well as urban wage earners and clerical workers. Not included in the CPI are the spending patterns of people living in rural nonmetropolitan areas, those in farm households, people in the Armed Forces, and those in institutions, such as prisons and mental hospitals.
5
FPA FLEXIBLE FIXED INCOME FUND
LETTER TO SHAREHOLDERS
(Continued)
Though the Federal Reserve ("the Fed") previously viewed inflation as "transitory," apparently, it's not transitory enough. With inflation increasing, Federal Reserve Chairman Jerome Powell said it's time to retire the word "transitory" in describing inflation, and he clarified that the use of the word was intended to mean that inflation will not "leave a permanent mark in the form of higher inflation."7 Descriptions aside, it is what it is: prices are going up and the pace of price increases has not abated as quickly as the Fed expected. With that recognition and with concerns that today's higher inflation is causing people to expect higher inflation in the future, the Fed abruptly pivoted to telegraphing tighter monetary policy in an effort to rein in price increases. First, in November 2021, the Fed announced it would begin tapering its asset purchases, reducing its monthly purchases of agency mortgage-backed securities and Treasuries.8 A month later, the Fed announced it would double the rate at which it would reduce its monthly asset purchases.9 The Fed expects to cease adding to its balance sheet by March 2022. In conjunction with the December taper announcement, the Fed published updated projections of the Fed Funds rate that showed a greater number of expected Fed Funds rate increases in 2022. The chart below plots the Fed's forecast for the Fed Funds rate in 2022 as of each past meeting date and shows the projected increases. This chart also highlights that the majority of Federal Open Market Committee (FOMC) members now think that multiple rate hikes in 2022 are appropriate.
Implied Fed Funds Target Rate
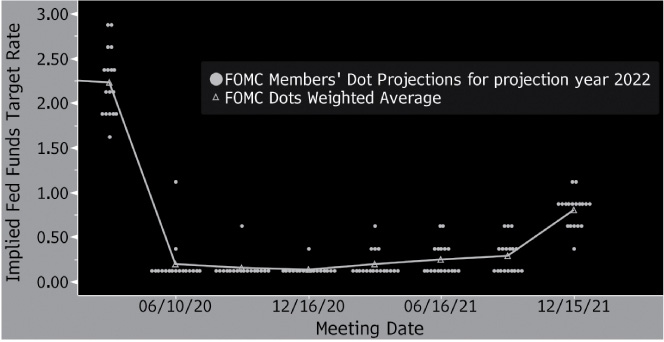
Source: Bloomberg, Federal Reserve Bank. As of 12/15/2021.
7 Source: https://www.bloomberg.com/news/articles/2021-11-30/powell-ditches-transitory-inflation-tag-paves-way-for-rate-hike
8 Source: .CNBC (https://www.cnbc.com/2021/10/12/feds-bullard-says-bond-purchases-should-be-tapered-quickly-in-case-rate-hikes-are-needed.html)
9 Source: The Federal Reserve. https://www.federalreserve.gov/monetarypolicy/files/fomcprojtabl20211215.pdf
6
FPA FLEXIBLE FIXED INCOME FUND
LETTER TO SHAREHOLDERS
(Continued)
Since December, these forecasts and commentary from the Fed have led the market to price in more than four cumulative rate hikes in 2022, an increase from three hikes that the market was expecting as of December 2021. Assuming that each rate hike represents a 25-bps increase in the Fed Funds rate, the market expects that rate to reach 1.27% by the end of 2022, a 119-bps increase from today.
The Fed also recently communicated that it expects to not only stop adding to its balance sheet by March 2022, but it also expects to subsequently begin quantitative tightening. Quantitative tightening uses a reduction in the size of the Fed's balance sheet to tighten monetary policy — a step beyond tapering, which is a reduction in the growth of the Fed's balance sheet.
The Fed is using the Fed Funds rate and its balance sheet as levers in an attempt to rein in inflation. Yet, it's not clear that those levers are connected to the things that are actually driving inflation. Monetary policy can impact aggregate demand, but can it stabilize supply chains? Can monetary policy make COVID-19 innocuous enough that people can return to work at full capacity? Indeed, monetary policy changes may lower aggregate demand, and thus lower inflation, but it may also lead to undesirable outcomes such as slower economic growth or — perhaps — a recession. For these reasons, despite the Fed's projections and market expectations, it's not a certainty that there will be three or four (or even five) rate hikes in 2022. In fact, history tells us that the Fed has an institutional bias toward overestimating economic growth and the level of interest rates.10 Moreover, the market has often been an inaccurate predictor of the Fed's near-term policy actions, as shown in the chart below, where the dashed lines represent the market's expectations for the Fed Funds rate and the solid blue line represents the actual Fed Funds rate.
Fed Funds Rate and Future
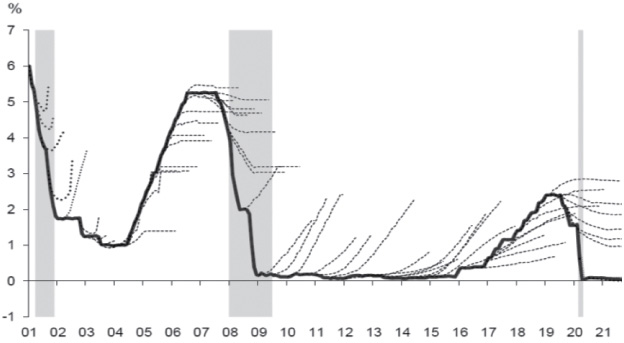
Source: Deutsche Bank, Bloomberg Finance LP, Federal Reserve. As of 12/15/2021. Global Financial Crisis ("GFC") was from February 2007-December 2009. Shaded areas reflect market recessions.
10 Rosenberg, Dave. "Breakfast with Dave," Nov. 25, 2021.
7
FPA FLEXIBLE FIXED INCOME FUND
LETTER TO SHAREHOLDERS
(Continued)
Regardless, the Fed is reacting to inflation and the market is reacting to the Fed. The following chart shows that Treasury yields increased throughout 2021, including in the fourth quarter. Treasury yields have increased further thus far in 2022.
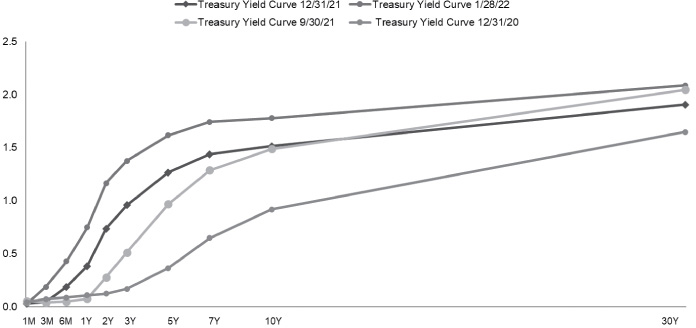
Source: Bloomberg. Chart data as of the dates shown.
Higher Treasury yields have led to higher yields in investment grade bonds (including short-duration bonds) and high-yield bonds. The three charts below show the yield, spread and real yield of the Bloomberg Aggregate Bond Index, the Bloomberg Aggregate 1-3 yr. Bond Index and the BB-rated component of the Bloomberg High-Yield Index excluding energy, respectively.11 12 With respect to the aggregate indices, overall yields are higher as of late, but spreads remain near historical lows and real yields are deeply negative.
11 Real yield is calculated as an index's yield-to-worst less the breakeven inflation implied by Treasury Inflation-Protected Securities (TIPS) with a similar duration to the index.
12 We focus on this sub-index within the overall high-yield index to remove distortions in the historical data associated with changes over time in the representation of BB-rated bonds and bonds issued by energy companies.
8
FPA FLEXIBLE FIXED INCOME FUND
LETTER TO SHAREHOLDERS
(Continued)
Bloomberg U.S. Aggregate Bond Index
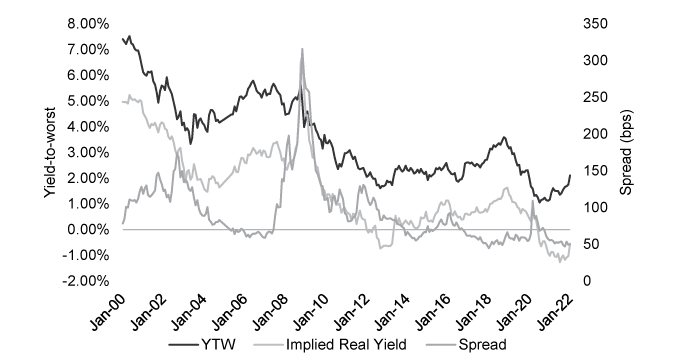
Source: Bloomberg. Chart data is as of 1/28/2022. YTW is Yield-to-Worst. Implied Real Yield is an interest rate that has been adjusted to remove expected inflation to reflect the expected real cost of funds to the borrower and the real yield to the lender or to an investor. Spread refers to the difference between the yield-to-worst and yield on a risk-free investment of similar duration. Please refer to the end of the presentation for Important Disclosures and Glossary of Terms.
9
FPA FLEXIBLE FIXED INCOME FUND
LETTER TO SHAREHOLDERS
(Continued)
Bloomberg U.S. 1-3 Year Aggregate Bond Index
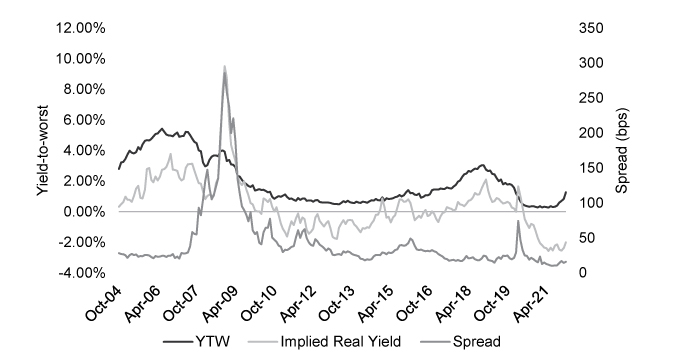
Source: Bloomberg. Chart data is as of 1/28/2022. YTW is Yield-to-Worst. Implied Real Yield is an interest rate that has been adjusted to remove expected inflation to reflect the expected real cost of funds to the borrower and the real yield to the lender or to an investor. Spread refers to the difference between the yield-to-worst and yield on a risk-free investment of similar duration. Please refer to the end of the presentation for Important Disclosures and Glossary of Terms.
With respect to the high-yield index shown, yields are also higher and spreads are also near historically low levels. While the real yield on this high-yield index is positive, it is barely so and, as a general statement, certainly not positive enough to compensate for the risk of a permanent impairment of capital associated with credit losses.
10
FPA FLEXIBLE FIXED INCOME FUND
LETTER TO SHAREHOLDERS
(Continued)
Bloomberg U.S. High Yield BB excl. Energy
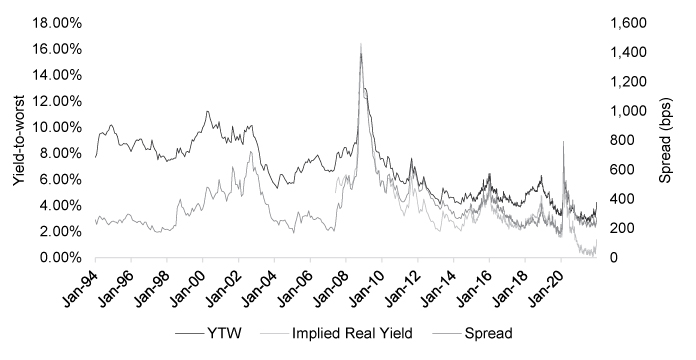
Source: Bloomberg. Chart data is as of 1/28/2022. YTW is Yield-to-Worst. Implied Real Yield is an interest rate that has been adjusted to remove expected inflation to reflect the expected real cost of funds to the borrower and the real yield to the lender or to an investor. Spread refers to the difference between the yield-to-worst and yield on a risk-free investment of similar duration. Please refer to the end of the presentation for Important Disclosures and Glossary of Terms.
Less apparent in the valuation data is the froth that we see firsthand in the bond market that has been ginned up by historically low yields and spreads over the past couple of years. These signs of froth include new issuers and new asset classes — oftentimes with limited track records — raising debt in the public markets. All things being equal, we like higher yields because higher yields make duration cheaper, which means that we can buy more duration (i.e., longer maturity bonds) and, on the margin, the opportunity set is broader. As discussed above, we have been using our 100-bps duration test as a guide to buy longer-duration bonds as yields rise. Adding duration in this manner allows us to seek to improve the upside versus downside return profile of the Fund based on future changes in yield. However, we remain cognizant of low spreads and the signs of froth that we see. We tread carefully to avoid owning debt that we may later regret owning, both in high-yield rated and investment grade debt.
This tact is part of our approach to near-term capital preservation, which we believe is the best approach for beating inflation over the long term. We believe that beating inflation is not something that can or should be done every day but rather is something that is best accomplished over time. To underscore that concept, we refer back to the negative real yields in the investment grade bond market and the de-minimis real yields in the high-yield bond market. If the goal is to beat inflation every day, that is difficult to do because positive real yields are either not available or require taking on uncompensated risk. Of course, one could make speculative bets and
11
FPA FLEXIBLE FIXED INCOME FUND
LETTER TO SHAREHOLDERS
(Continued)
hope for inflation-beating returns through higher prices. Speculating doesn't resonate with us though because we believe it's hard to predict when rates (and consequently, prices) will move, in what direction and by how much. In a normal environment, making accurate predictions is difficult to do, let alone consistently. Making such predictions is even harder today when the pandemic and the fiscal and monetary attempts to combat it have created market conditions unlike anything ever experienced. Consequently, one would expect that exiting this situation would also be unlike anything ever experienced. The market's negative performance in the fourth quarter of 2021 and so far in 2022 demonstrate the difficulty of timing in this environment and support our view that investing based on speculation is hard to do with predictability and repeatability.
For these reasons, rather than make bets, we prefer to let the market be our guide, using our aforementioned 100-bps test as a guide to direct the duration of our holdings and using our absolute value philosophy to direct our investments in credit. In relation to 2021, this approach helped us avoid owning too much duration in an historically expensive market. Looking forward to 2022, the market is on the verge of what may be a significant tightening of monetary policy and we believe our active management will help us navigate a potentially turbulent year in the bond market. As it relates to inflation, if we can preserve capital in the near-term, then we are well-placed to recycle capital at more attractive valuations if and when they arrive, and we expect we will be able to thereby deliver inflation-beating returns over the long term.
We launched FPA Flexible Fixed Income three years ago with the idea of creating an investment vehicle that could harness the investment philosophy behind the FPA New Income Fund's 37-year track record of positive calendar year returns but arm that philosophy with a greater capacity to take advantage of market dislocations. From the outset, the long-term goal of FPA Flexible Fixed Income has been to employ a flexible, absolute value approach to fixed income investing to seek to achieve attractive long-term risk-adjusted returns. In the past three years, we have endured a pandemic, an historic contraction in GDP, historically low yields, historically high asset valuations, multi-decade highs in inflation and — more recently — a significant re-pricing of assets. Through it all, the Fund performed better than its peers on risk-adjusted basis:
| As of 12/31/21 | | FFI | | Non-Traditional
Bonds* | |
1/1/20-12/31/20 Max Drawdown | | | -3.32 | % | | | -10.10 | % | |
6/30/21-12/31/21 Max Drawdown | | | -0.14 | % | | | -1.15 | % | |
Risk-adjusted returns: Sortino Ratio (3-Year) | | | 1.58 | | | | 0.94 | | |
Source: Morningstar Direct. * Reflects peer group bond fund category as defined by Morningstar. Maximum drawdown is the maximum observed loss from a peak to a trough of a portfolio before a new peak is attained. Sortino Ratio, which takes a portfolio's return, subtracts the risk-free rate and then divides by the portfolio's downside standard deviation, differentiates between good and bad volatility in the Sharpe ratio. This differentiation of upwards and downwards volatility allows the calculation to provide a risk-adjusted measure of a security or fund's performance without penalizing it for upward price changes. Past performance is no guarantee, nor is it indicative, of future results.
12
FPA FLEXIBLE FIXED INCOME FUND
LETTER TO SHAREHOLDERS
(Continued)
We are grateful and humbled that our fellow shareholders have trusted us with their hard-earned money, particularly those who joined us at inception when the Fund did not yet have proof of concept. We hope that thus far we have sufficiently rewarded your faith in us and we look forward to navigating the challenges and opportunities ahead together.
Respectfully submitted,

Thomas H. Atteberry
Portfolio Manager

Abhijeet Patwardhan
Portfolio Manager
January 2022
Important Disclosures
This Commentary is for informational and discussion purposes only and does not constitute, and should not be construed as, an offer or solicitation for the purchase or sale of any securities, products or services discussed, and neither does it provide investment advice. Any such offer or solicitation shall only be made pursuant to the Fund's Prospectus, which supersedes the information contained herein in its entirety.
The views expressed herein and any forward-looking statements are as of the date of the publication and are those of the portfolio management team. Future events or results may vary significantly from those expressed and are subject to change at any time in response to changing circumstances and industry developments. This information and data have been prepared from sources believed reliable, but the accuracy and completeness of the information cannot be guaranteed and is not a complete summary or statement of all available data. You should not construe the contents of this document as legal, tax, accounting, investment or other advice or recommendations.
Portfolio composition will change due to ongoing management of the Fund. References to individual securities or sectors are for informational purposes only and should not be construed as recommendations by the Fund, the portfolio managers, the Adviser, or the distributor. It should not be assumed that future investments will be profitable or will equal the performance of the security or sector examples discussed. The portfolio holdings as of the most recent quarter-end may be obtained at www.fpa.com.
The statements made herein may be forward-looking and/or based on current expectations, projections, and/or information currently available. Actual results may differ from those anticipated. The portfolio managers and/or FPA cannot assure future results and disclaims any obligation to update or alter any statistical data and/or
13
FPA FLEXIBLE FIXED INCOME FUND
LETTER TO SHAREHOLDERS
(Continued)
references thereto, as well as any forward-looking statements, whether as a result of new information, future events, or otherwise. Such statements may or may not be accurate over the long-term.
Investments, including investments in mutual funds, carry risks and investors may lose principal value. Capital markets are volatile and can decline significantly in response to adverse issuer, political, regulatory, market, or economic developments. The Fund may purchase foreign securities, including American Depository Receipts (ADRs) and other depository receipts, which are subject to interest rate, currency exchange rate, economic and political risks; this may be enhanced when investing in emerging markets. Foreign investments, especially those of companies in emerging markets, can be riskier, less liquid, harder to value, and more volatile than investments in the United States. The securities of smaller, less well-known companies can be more volatile than those of larger companies.
The return of principal in a bond fund is not guaranteed. Bond funds have the same issuer, interest rate, inflation and credit risks that are associated with underlying bonds owned by the Fund. Lower rated bonds, convertible securities and other types of debt obligations involve greater risks than higher rated bonds.
Interest rate risk is the risk that when interest rates go up, the value of fixed income instruments, such as bonds, typically go down and investors may lose principal value. Credit risk is the risk of loss of principal due to the issuer's failure to repay a loan. Generally, the lower the quality rating of a fixed income instrument, the greater the risk that the issuer will fail to pay interest fully and return principal in a timely manner. If an issuer defaults the fixed income instrument may lose some or all of its value.
Mortgage securities and collateralized mortgage obligations (CMOs) are subject to prepayment risk and the risk of default on the underlying mortgages or other assets; such derivatives may increase volatility. Convertible securities are generally not investment grade and are subject to greater credit risk than higher-rated investments. High yield securities can be volatile and subject to much higher instances of default.
Collateralized debt obligations ("CDOs"), which include collateralized loan obligations ("CLOs"), collateralized bond obligations ("CBOs"), and other similarly structured securities, carry additional risks in addition to interest rate risk and default risk. This includes, but is not limited to: (i) distributions from the underlying collateral may not be adequate to make interest or other payments; (ii) the quality of the collateral may decline in value or default; and (iii) the complex structure of the security may not be fully understood at the time of investment and may produce disputes with the issuer or unexpected investment results. Investments in CDOs are also more difficult to value than other investments.
Value style investing presents the risk that the holdings of securities may never reach their full market value because the market fails to recognize what the portfolio management team considers the true business value or because the portfolio management team has misjudged those values. In addition, value style investing may fall out of favor and underperform growth or other styles of investing during given periods.
The ratings agencies that provide ratings are Standard and Poor's, Moody's, and Fitch. Credit ratings range from AAA (highest) to D (lowest). Bonds rated BBB or above are considered investment grade. Credit ratings of BB and below are lower-rated securities (junk bonds). High-yielding, non-investment grade bonds (junk bonds) involve higher risks than investment grade bonds. Bonds with credit ratings of CCC or below have high default risk.
Please refer to the Fund's Prospectus for a complete overview of the primary risks associated with the Fund.
14
FPA FLEXIBLE FIXED INCOME FUND
LETTER TO SHAREHOLDERS
(Continued)
The Fund is not authorized for distribution unless preceded or accompanied by a current prospectus. The prospectus can be accessed at: https://fpa.com/docs/default-source/funds/fpa-flexible-fixed-income-fund/literature/fpa-flexible-fixed-income-fund-prospectus_04-16-21_web-ready.pdf?sfvrsn=bc4f919d_4.
Index / Category Definitions
Comparison to any index is for illustrative purposes only and should not be relied upon as a fully accurate measure of comparison. The Fund will be less diversified than the indices noted herein, and may hold non-index securities or securities that are not comparable to those contained in an index. Indices will hold positions that are not within the Fund's investment strategy. Indices are unmanaged, do not reflect any commissions, fees or expenses which would be incurred by an investor purchasing the underlying securities. The Fund does not include outperformance of any index or benchmark in its investment objectives. Investors cannot invest directly in an index.
Bloomberg US Aggregate Bond Index provides a measure of the performance of the U.S. investment grade bonds market, which includes investment grade U.S. Government bonds, investment grade corporate bonds, mortgage pass-through securities and asset-backed securities that are publicly offered for sale in the United States. The securities in the Index must have at least 1 year remaining in maturity. In addition, the securities must be denominated in U.S. dollars and must be fixed rate, nonconvertible, and taxable.
Bloomberg US Aggregate 1-3 Year Bond Index provides a measure of the performance of the U.S. investment grade bonds market, which includes investment grade U.S. Government bonds, investment grade corporate bonds, mortgage pass-through securities and asset-backed securities that are publicly offered for sale in the United States. The securities in the Index must have a remaining maturity of 1 to 3 years. In addition, the securities must be denominated in U.S. dollars and must be fixed rate, nonconvertible, and taxable.
Bloomberg U.S. High Yield Index measures the market of USD-denominated, non-investment grade, fixed-rate, taxable corporate bonds.
Bloomberg U.S. High Yield Index ex. Energy measures the market of USD-denominated, non-investment grade, fixed-rate, taxable corporate bonds excluding Energy sector.
Bloomberg U.S. Universal Bond Index represents the union of the following Bloomberg Barclay's indices: U.S. Aggregate Index, the U.S. Corporate High-Yield Index, the 144A Index, the Eurodollar Index, the Emerging Markets Index, and the non-ERISA portion of the CMBS Index. Municipal debt, private placements, and non-dollar-denominated issues are excluded from the Universal Index. The only constituent of the index that includes floating-rate debt is the Emerging Markets Index.
The Consumer Price Index (CPI) is an unmanaged index representing the rate of the inflation of U.S. consumer prices as determined by the U.S. Department of Labor Statistics. There can be no guarantee that the CPI will reflect the exact level of inflation at any given time. This index reflects non-seasonally adjusted returns.
The CPI + 200 bps is created by adding 2% to the annual percentage change in the CPI. This index reflects non-seasonally adjusted returns.
Morningstar Nontraditional Bond Category contains funds that pursue strategies divergent in one or more ways from conventional practice in the broader bond fund universe. Many funds in this group describe themselves as "absolute return" portfolios, which seek to avoid losses and produce returns uncorrelated with the overall bond market; they employ a variety of methods to achieve those aims. Another large subset are self described "unconstrained" portfolios that have more flexibility to invest tactically across a wide swath of individual sectors, including high yield and foreign debt, and typically with very large allocations. Funds in the latter group typically have broad freedom to manage interest rate sensitivity, but attempt to tactically manage those exposures
15
FPA FLEXIBLE FIXED INCOME FUND
LETTER TO SHAREHOLDERS
(Continued)
in order to minimize volatility. The category is also home to a subset of portfolios that attempt to minimize volatility by maintaining short or ultra short duration portfolios, but explicitly court significant credit and foreign bond market risk in order to generate high returns. Funds within this category often will use credit default swaps and other fixed income derivatives to a significant level within their portfolios. There were 329 funds in the category at 12/31/2021.
Other Definitions
Basis Point (bps) is equal to one hundredth of one percent, or 0.01%. 100 basis points = 1%.
Corporate holdings include bank debt, corporate bonds and common stock.
Coupon or coupon payment is the annual interest rate paid on a bond, expressed as a percentage of the face value and paid from issue date until maturity.
Credit Spread is the difference in yield between a U.S. Treasury bond and another debt security of the same maturity but different credit quality.
GDP is Gross Domestic Product and it measures the monetary value of all finished goods and services (i.e., bought by the final user) made within a country during a specific period.
Effective Duration (years) is the duration calculation for bonds with embedded options. Effective duration takes into account that expected cash flows will fluctuate as interest rates change.
Nominal yield is the coupon rate on a bond.
A bond premium occurs when the price of the bond has increased in the secondary market. A bond might trade at a premium because its interest rate is higher than current rates in the market.
Real yield is the nominal yield of a bond minus the rate of inflation
Repo (Repurchase Agreement) is a form of short-term borrowing for dealers in government securities.
The risk-free rate reflects the yield of the Treasury bond matching the investment's duration.
Sharpe Ratio measures risk-adjusted performance. The Sharpe ratio is calculated by subtracting the risk-free rate — such as that of the 10-year U.S. Treasury bond — from the rate of return for a portfolio and dividing the result by the standard deviation of the portfolio returns..
Weighted Average Life (years) is the average length of time that each dollar of unpaid principal on a loan, a mortgage or an amortizing bond remains outstanding.
Yield to Maturity is the rate of return anticipated on a bond if held until the end of its lifetime. YTM is considered a long-term bond yield expressed as an annual rate. The YTM calculation takes into account the bond's current market price, par value, coupon interest rate and time to maturity. It is also assumed that all coupon payments are reinvested at the same rate as the bond's current yield.
©2021 Morningstar, Inc. All Rights Reserved. The information contained herein: (1) is proprietary to Morningstar and/or its content providers; (2) may not be copied or distributed; and (3) is not warranted by Morningstar to be accurate, complete or timely. Neither Morningstar nor its content providers are responsible for any damages or losses arising from any use of this information. Past performance is no guarantee of future results.
The FPA Funds are distributed by UMB Distribution Services, LLC, 235 W. Galena Street, Milwaukee, WI, 53212.
16
FPA FLEXIBLE FIXED INCOME FUND
LETTER TO SHAREHOLDERS
(Continued)
The discussions of Fund investments represent the views of the Fund's managers at the time of this report and are subject to change without notice. References to individual securities are for informational purposes only and should not be construed as recommendations to purchase or sell individual securities.
FUND RISKS
Investments in mutual funds carry risks and investors may lose principal value. Stock markets are volatile and can decline significantly in response to adverse issuer, political, regulatory, market, or economic developments. The funds may purchase foreign securities which are subject to interest rate, currency exchange rate, economic and political risks: this may be enhanced when investing in emerging markets. The securities of smaller, less well-known companies can be more volatile than those of larger companies. The return of principal in a bond fund is not guaranteed. Bond funds have the same issuer, interest rate, inflation and credit risks that are associated with underlying bonds owned by the fund. Lower rated bonds, convertible securities and other types of debt obligations involve greater risks than higher rated bonds. Mortgage securities and collateralized mortgage obligations (CMOs) are subject to prepayment risk and the risk of default on the underlying mortgages or other assets; derivatives may increase volatility. High yield securities can be volatile and subject to much higher instances of default.
FORWARD LOOKING STATEMENT DISCLOSURE
As mutual fund managers, one of our responsibilities is to communicate with shareholders in an open and direct manner. Insofar as some of our opinions and comments in our letters to shareholders are based on our current expectations, they are considered "forward-looking statements" which may or may not prove to be accurate over the long term. While we believe we have a reasonable basis for our comments and we have confidence in our opinions, actual results may differ materially from those we anticipate. You can identify forward-looking statements by words such as "believe," "expect," "may," "anticipate," and other similar expressions when discussing prospects for particular portfolio holdings and/or the markets, generally. We cannot, however, assure future results and disclaim any obligation to update or alter any forward-looking statements, whether as a result of new information, future events, or otherwise. Further, information provided in this report should not be construed as a recommendation to purchase or sell any particular security.
17
FPA FLEXIBLE FIXED INCOME FUND
HISTORICAL PERFORMANCE
(Unaudited)
Change in Value of a $10,000 Investment in FPA Flexible Fixed Income Fund vs Bloomberg Barclays U.S. Universal Bond Index and Consumer Price Index + 200 Basis Points from December 31, 2018 to December 31, 2021
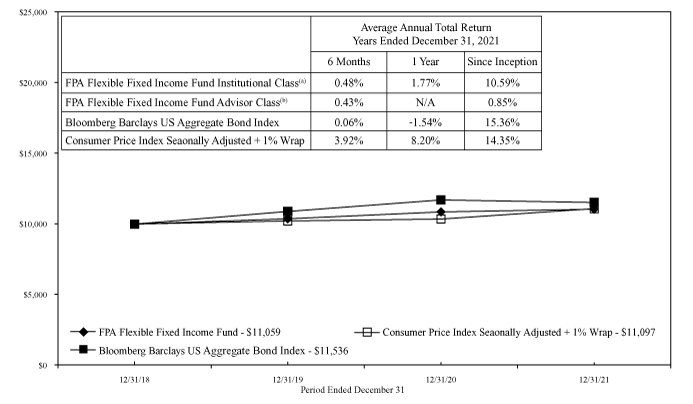
(a) Inception 12/31/18
(b) Inception 04/16/21
Past performance is not indicative of future performance. The Bloomberg Barclays U.S. Universal Bond Index represents the union of the following Bloomberg Barclays' indices: U.S. Aggregate Index, U.S. High-Yield Corporate Index,144A Index, Eurodollar Index, Emerging Markets Index and non-ERISA portion of the CMBS Index. Municipal debt, private placements, and non-dollar-denominated issues are excluded from the Universal Index. The only constituent of the index that includes floating-rate debt is the Emerging Markets Index. The CPI + 200 Basis Points index is created by adding 2% to the annual percentage change in the Consumer Price Index ("CPI"). The Consumer Price Index is an unmanaged index representing the rate of inflation of U.S. consumer prices as determined by the U.S. Department of Labor Statistics. There can be no guarantee that the CPI or other indexes will reflect the exact level of inflation at any given time. An investor cannot invest directly in an index. The performance of the Fund and of the Averages is computed on a total return basis, which includes reinvestment of all distributions.
Past performance is no guarantee of future results, and current performance may be higher or lower than the performance shown. This data represents past performance, and investors should understand that investment returns and principal values fluctuate, so that when you redeem your investment it may be worth more or less than its original cost. Current month-end performance data can be obtained by visiting the website at www.fpa.com or by calling toll-free, 1-800-982-4372. Information regarding the Fund's expense ratio can be found on pages 44 and 45.
The Prospectus details the Fund's objective and policies, charges, and other matters of interest to prospective investors. Please read the prospectus carefully before investing. The Prospectus may be obtained by visiting the website at www.fpa.com, by email at crm@fpa.com, toll-free by calling 1-800-982-4372 or by contacting the Fund in writing.
18
FPA FLEXIBLE FIXED INCOME FUND
PORTFOLIO SUMMARY
December 31, 2021
Common Stocks | | | | | 0.4 | % | |
Retailing | | | 0.2 | % | | | | | |
Energy | | | 0.2 | % | | | | | |
Rights | | | | | 0.0 | % | |
Bonds & Debentures | | | | | 98.3 | % | |
Asset-Backed Securities | | | 65.0 | % | | | | | |
U.S. Treasuries | | | 10.4 | % | | | | | |
Commercial Mortgage-Backed Securities | | | 9.0 | % | | | | | |
Residential Mortgage-Backed Securities | | | 7.4 | % | | | | | |
Corporate Bank Debt | | | 4.8 | % | | | | | |
Corporate Bonds & Notes | | | 1.7 | % | | | | | |
Short-term Investments | | | | | 1.5 | % | |
Other Assets And Liabilities, Net | | | | | (0.2 | )% | |
Net Assets | | | | | 100.0 | % | |
19
FPA FLEXIBLE FIXED INCOME FUND
PORTFOLIO OF INVESTMENTS
December 31, 2021
COMMON STOCKS | | Shares or
Principal
Amount | | Fair Value | |
RETAILING — 0.2% | |
Copper Earn Out Trust(a)(b)(c) | | | 7,803 | | | $ | 91,685 | | |
Copper Property CTL Pass Through Trust(a)(b)(c) | | | 58,520 | | | | 1,375,220 | | |
| | | $ | 1,466,905 | | |
ENERGY — 0.2% | |
PHI Group, Inc.(a)(b)(c) | | | 23,814 | | | $ | 364,354 | | |
PHI Group, Inc., Restricted(a)(b)(c) | | | 51,478 | | | | 787,614 | | |
| | | $ | 1,151,968 | | |
| TOTAL COMMON STOCKS — 0.4% (Cost $1,555,635) | | $ | 2,618,873 | | |
RIGHTS — 0.0% | |
MIDSTREAM — OIL & GAS — 0.0% | |
Windstream Holdings, Inc.(a)(b)(c)(d) (Cost $372,781) | | | 11,258 | | | $ | 163,241 | | |
BONDS & DEBENTURES | |
COMMERCIAL MORTGAGE-BACKED SECURITIES — 9.0% | |
AGENCY — 0.0% | |
Freddie Mac Multifamily Structured Pass Through Certificates K042 A1 —
2.267% 6/25/2024 | | $ | 142,465 | | | $ | 144,574 | | |
AGENCY STRIPPED — 0.2% | |
Government National Mortgage Association 2015-19 IO —
0.322% 1/16/2057(e) | | $ | 1,510,865 | | | $ | 33,114 | | |
Government National Mortgage Association 2015-7 IO —
0.549% 1/16/2057(e) | | | 1,710,946 | | | | 48,933 | | |
Government National Mortgage Association 2020-75 —
0.973% 2/16/2062(e) | | | 5,984,428 | | | | 455,252 | | |
Government National Mortgage Association 2020-42 IO —
0.973% 3/16/2062(e) | | | 3,760,499 | | | | 283,982 | | |
Government National Mortgage Association 2020-71 —
1.070% 1/16/2062(e) | | | 3,032,364 | | | | 245,643 | | |
Government National Mortgage Association 2020-43 —
1.279% 11/16/2061(e) | | | 2,245,991 | | | | 188,469 | | |
| | | $ | 1,255,393 | | |
NON-AGENCY — 8.8% | |
A10 Bridge Asset Financing LLC 2020-C A — 2.021% 8/15/2040(f) | | $ | 453,110 | | | $ | 453,809 | | |
ACRE Commercial Mortgage Ltd. 2021-FL4 A,
1M USD LIBOR + 0.830% — 0.934% 12/18/2037(e)(f) | | | 483,042 | | | | 480,867 | | |
20
FPA FLEXIBLE FIXED INCOME FUND
PORTFOLIO OF INVESTMENTS (Continued)
December 31, 2021
BONDS & DEBENTURES — Continued | | Principal
Amount | | Fair Value | |
ACRES Commercial Realty Ltd. 2021-FL1, 1M USD LIBOR + 1.200% —
1.310% 6/15/2036(e)(f) | | $ | 2,604,000 | | | $ | 2,603,302 | | |
Arbor Realty Commercial Real Estate Notes Ltd. 2021-FL1 A,
1M USD LIBOR + 0.970% — 1.080% 12/15/2035(e)(f) | | | 2,210,000 | | | | 2,199,642 | | |
Arbor Realty Commercial Real Estate Notes Ltd. 2021-FL2,
1M USD LIBOR + 1.100% — 1.210% 5/15/2036(e)(f) | | | 2,370,000 | | | | 2,365,554 | | |
Arbor Realty Commercial Real Estate Notes Ltd. 2021-FL4 A,
1M USD LIBOR + 1.350% — 1.440% 11/15/2036(e)(f) | | | 3,148,000 | | | | 3,150,443 | | |
AREIT Trust 2019-CRE3 A, 1M USD LIBOR + 1.020% —
1.185% 9/14/2036(e)(f) | | | 139,816 | | | | 139,732 | | |
BDS 2021-FL8 A, 1M USD LIBOR + 0.920% —
1.024% 1/18/2036(e)(f) | | | 988,000 | | | | 982,721 | | |
BDS Ltd. 2019-FL4 A, 1M USD LIBOR + 1.100% —
1.209% 8/15/2036(e)(f) | | | 1,000,695 | | | | 1,000,822 | | |
BDS Ltd. 2019-FL4, 1M USD LIBOR + 1.400% —
1.509% 8/15/2036(e)(f) | | | 268,000 | | | | 268,045 | | |
BPCRE Ltd. 2021-FL1 A, 1M USD LIBOR + 0.850% —
0.959% 2/15/2037(e)(f) | | | 3,417,147 | | | | 3,413,243 | | |
BX Commercial Mortgage Trust 2021-VOLT E,
1M USD LIBOR + 2.000% — 2.110% 9/15/2036(e)(f) | | | 1,410,000 | | | | 1,397,666 | | |
BX Commercial Mortgage Trust 2021-VOLT F,
1M USD LIBOR + 2.400% — 2.510% 9/15/2036(e)(f) | | | 2,319,000 | | | | 2,297,269 | | |
BXMT Ltd. 2021-FL4, 1M USD LIBOR + 1.050% —
1.160% 5/15/2038(e)(f) | | | 2,899,000 | | | | 2,893,559 | | |
Citigroup Commercial Mortgage Trust 2013-GC11 AAB —
2.690% 4/10/2046 | | | 25,327 | | | | 25,554 | | |
Citigroup Commercial Mortgage Trust 2013-GC11 A3 —
2.815% 4/10/2046 | | | 744,604 | | | | 751,984 | | |
Citigroup Commercial Mortgage Trust 2013-GC11 A4 —
3.093% 4/10/2046 | | | 90,000 | | | | 91,559 | | |
Citigroup Commercial Mortgage Trust 2013-GC11 AS —
3.422% 4/10/2046 | | | 800,000 | | | | 815,962 | | |
COMM 2013-CCRE7 Mortgage Trust 2013-CR7 A4 —
3.213% 3/10/2046 | | | 1,153,226 | | | | 1,176,727 | | |
COMM Mortgage Trust 2013-LC6 A4 — 2.941% 1/10/2046 | | | 1,421,597 | | | | 1,438,509 | | |
CoreVest American Finance Trust 2018-1 A — 3.804% 6/15/2051(f) | | | 315,358 | | | | 319,848 | | |
Grand Avenue CRE 2019-FL1 AS, 1M USD LIBOR + 1.500% —
1.610% 6/15/2037(e)(f) | | | 165,652 | | | | 163,424 | | |
Greystone CRE Notes Ltd. 2021-FL3 A, 1M USD LIBOR + 1.020% —
1.130% 7/15/2039(e)(f) | | | 3,000,000 | | | | 2,996,915 | | |
21
FPA FLEXIBLE FIXED INCOME FUND
PORTFOLIO OF INVESTMENTS (Continued)
December 31, 2021
BONDS & DEBENTURES — Continued | | Principal
Amount | | Fair Value | |
GS Mortgage Securities Corp. II 2015-GC30 AAB — 3.120% 5/10/2050 | | $ | 328,708 | | | $ | 337,021 | | |
GS Mortgage Securities Corp. Trust 2012-ALOH A —
3.551% 4/10/2034(f) | | | 988,000 | | | | 987,509 | | |
Hawaii Hotel Trust 2019-MAUI C, 1M USD LIBOR + 1.650% —
1.760% 5/15/2038(e)(f) | | | 1,384,000 | | | | 1,377,091 | | |
HERA Commercial Mortgage Ltd. 2021-FL1 A,
1M USD LIBOR + 1.050% — 1.154% 2/18/2038(e)(f) | | | 2,823,000 | | | | 2,821,296 | | |
JP Morgan Chase Commercial Mortgage Securities Trust 2013-LC11 A4 —
2.694% 4/15/2046 | | | 92,885 | | | | 94,033 | | |
JP Morgan Chase Commercial Mortgage Securities Trust 2012-HSBC A —
3.093% 7/5/2032(f) | | | 890,274 | | | | 894,981 | | |
JP Morgan Chase Commercial Mortgage Securities Trust 2012-C8 AS —
3.424% 10/15/2045(f) | | | 687,000 | | | | 694,129 | | |
JPMBB Commercial Mortgage Securities Trust 2015-C30 ASB —
3.559% 7/15/2048 | | | 651,582 | | | | 671,335 | | |
KREF Ltd. 2021-FL2 A, 1M USD LIBOR + 1.070% —
1.179% 2/15/2039(e)(f) | | | 834,000 | | | | 833,636 | | |
LCCM Trust 2021-FL2 A, 1M USD LIBOR + 1.200% —
1.310% 12/13/2038(e)(f) | | | 390,000 | | | | 389,762 | | |
LoanCore Issuer Ltd. 2021-CRE4 A, 1M USD LIBOR + 0.914% —
0.965% 7/15/2035(e)(f) | | | 845,609 | | | | 839,281 | | |
LoanCore Issuer Ltd. 2019-CRE3 A, 1M USD LIBOR + 1.050% —
1.160% 4/15/2034(e)(f) | | | 617,283 | | | | 616,929 | | |
LoanCore Issuer Ltd. 2021-CRE5 A, 1M USD LIBOR + 1.300% —
1.410% 7/15/2036(e)(f) | | | 363,000 | | | | 362,769 | | |
MF1 Ltd. 2021-FL7 A, 1M USD LIBOR + 1.080% —
1.188% 10/16/2036(e)(f) | | | 2,750,000 | | | | 2,739,697 | | |
MF1 Ltd. 2020-FL4 A, 1M USD LIBOR + 1.700% —
1.865% 11/15/2035(e)(f) | | | 585,000 | | | | 587,056 | | |
PFP Ltd. 2021-7 A, 1M USD LIBOR + 0.850% —
0.960% 4/14/2038(e)(f) | | | 2,499,875 | | | | 2,497,209 | | |
Ready Capital Mortgage Financing LLC 2021-FL5 A,
1M USD LIBOR + 1.000% — 1.102% 4/25/2038(e)(f) | | | 998,016 | | | | 992,563 | | |
Shelter Growth CRE Issuer Ltd. 2021-FL3 A, 1M USD LIBOR + 1.080% —
1.190% 9/15/2036(e)(f) | | | 928,097 | | | | 925,854 | | |
STWD Ltd. 2021-FL2, 1M USD LIBOR + 1.200% —
1.309% 4/18/2038(e)(f) | | | 1,468,000 | | | | 1,467,539 | | |
TPG Real Estate Finance Issuer Ltd. 2018-FL2 A,
1M USD LIBOR + 1.130% — 1.239% 11/15/2037(e)(f) | | | 827,299 | | | | 827,307 | | |
22
FPA FLEXIBLE FIXED INCOME FUND
PORTFOLIO OF INVESTMENTS (Continued)
December 31, 2021
BONDS & DEBENTURES — Continued | | Principal
Amount | | Fair Value | |
TRTX Issuer Ltd. 2019-FL3 A, 1M USD LIBOR + 1.264% —
1.315% 10/15/2034(e)(f) | | $ | 364,656 | | | $ | 364,542 | | |
UBS-Barclays Commercial Mortgage Trust 2012-C4 A5 —
2.850% 12/10/2045 | | | 1,697,000 | | | | 1,708,366 | | |
VCC Trust 2020-MC1 A — 4.500% 6/25/2045(e)(f) | | | 186,151 | | | | 186,213 | | |
VMC Finance LLC 2021-HT1 A, 1M USD LIBOR + 1.650% —
1.753% 1/18/2037(e)(f) | | | 1,461,000 | | | | 1,461,917 | | |
VNDO E Mortgage Trust 2012-6AVE A — 2.996% 11/15/2030(f) | | | 109,000 | | | | 110,331 | | |
VNDO E Mortgage Trust 2012-6AVE B — 3.298% 11/15/2030(f) | | | 1,250,000 | | | | 1,261,379 | | |
Wells Fargo Commercial Mortgage Trust 2014-LC18 ASB —
3.244% 12/15/2047 | | | 590,026 | �� | | | 607,303 | | |
WFRBS Commercial Mortgage Trust 2013-C11 A5 —
3.071% 3/15/2045 | | | 243,409 | | | | 246,548 | | |
| | | $ | 58,330,752 | | |
TOTAL COMMERICAL MORTGAGE-BACKED SECURITIES
(Cost $59,856,357) | | $ | 59,730,719 | | |
RESIDENTIAL MORTGAGE-BACKED SECURITIES — 7.4% | |
AGENCY COLLATERALIZED MORTGAGE OBLIGATION — 0.4% | |
Fannie Mae REMICS 2012-47 HA — 1.500% 5/25/2027 | | $ | 138,008 | | | $ | 138,436 | | |
Fannie Mae REMICS 2013-35 QB — 1.750% 2/25/2043 | | | 576,827 | | | | 583,172 | | |
Fannie Mae REMICS 2012-144 PD — 3.500% 4/25/2042 | | | 107,216 | | | | 111,734 | | |
Freddie Mac REMICS 4220 EH — 2.500% 6/15/2028 | | | 107,665 | | | | 110,632 | | |
Freddie Mac REMICS 4336 WV — 3.000% 10/15/2025 | | | 323,361 | | | | 324,061 | | |
Freddie Mac REMICS 4387 VA — 3.000% 2/15/2026 | | | 613,824 | | | | 619,465 | | |
Freddie Mac REMICS 4235 QE — 3.000% 8/15/2031 | | | 89,309 | | | | 91,071 | | |
Freddie Mac REMICS 4162 P — 3.000% 2/15/2033 | | | 375,408 | | | | 388,423 | | |
| | | $ | 2,366,994 | | |
AGENCY POOL FIXED RATE — 0.0% | |
Fannie Mae Pool AL1576 — 4.000% 3/1/2027 | | $ | 132,938 | | | $ | 139,813 | | |
Fannie Mae Pool FM1102 — 4.000% 3/1/2031 | | | 58,692 | | | | 61,672 | | |
| | | $ | 201,485 | | |
AGENCY STRIPPED — 0.0% | |
Fannie Mae Interest Strip 284 1 — 0.000% 7/25/2027(g) | | $ | 153,927 | | | $ | 145,652 | | |
NON-AGENCY COLLATERALIZED MORTGAGE OBLIGATION — 7.0% | |
Bravo Residential Funding Trust 2019-1 A1C — 3.500% 3/25/2058(f) | | $ | 280,471 | | | $ | 283,514 | | |
Cascade Funding Mortgage Trust 2021-HB6 A — 0.898% 6/25/2036(e)(f) | | | 866,688 | | | | 865,413 | | |
23
FPA FLEXIBLE FIXED INCOME FUND
PORTFOLIO OF INVESTMENTS (Continued)
December 31, 2021
BONDS & DEBENTURES — Continued | | Principal
Amount | | Fair Value | |
CFMT LLC 2021-HB5 A — 0.801% 2/25/2031(e)(f) | | $ | 1,474,371 | | | $ | 1,471,711 | | |
CFMT LLC 2020-HB4 A — 0.946% 12/26/2030(e)(f) | | | 435,689 | | | | 435,926 | | |
CFMT LLC 2021-HB7 A — 1.151% 10/27/2031(e)(f) | | | 1,134,720 | | | | 1,130,867 | | |
CFMT LLC 2021-HB7 M1 — 2.125% 10/27/2031(e)(f) | | | 1,183,000 | | | | 1,181,791 | | |
CIM Trust 2017-7 A — 3.000% 4/25/2057(e)(f) | | | 204,814 | | | | 205,717 | | |
CIM Trust 2018-R3 A1 — 5.000% 12/25/2057(e)(f) | | | 379,479 | | | | 392,382 | | |
Finance of America HECM Buyout 2021-HB1 A —
0.875% 2/25/2031(e)(f) | | | 3,489,557 | | | | 3,486,413 | | |
Finance of America HECM Buyout 2021-HB1 M1 —
1.588% 2/25/2031(e)(f) | | | 804,000 | | | | 795,204 | | |
Finance of America HECM Buyout 2020-HB2 A —
1.710% 7/25/2030(e)(f) | | | 1,254,614 | | | | 1,256,229 | | |
PRET LLC 2021-NPL5 A1 — 2.487% 10/25/2051(f)(h) | | | 5,713,758 | | | | 5,702,287 | | |
PRET LLC 2021-NPL6 A1 — 2.487% 7/25/2051(a)(f)(h) | | | 2,134,000 | | | | 2,134,000 | | |
Pretium Mortgage Credit Partners I LLC 2021-NPL2 A1 —
1.992% 6/27/2060(f)(h) | | | 2,181,063 | | | | 2,156,969 | | |
Pretium Mortgage Credit Partners I LLC 2021-NPL4 A1 —
2.363% 10/27/2060(f)(h) | | | 5,743,485 | | | | 5,719,258 | | |
PRPM LLC 2021-2 A1 — 2.115% 3/25/2026(e)(f) | | | 1,175,472 | | | | 1,174,150 | | |
PRPM LLC 2021-9 A1 — 2.363% 10/25/2026(e)(f) | | | 2,772,218 | | | | 2,756,525 | | |
PRPM LLC 2021-10 A1 — 2.487% 10/25/2026(f)(h) | | | 2,659,557 | | | | 2,652,797 | | |
PRPM LLC 2021-11 A1 — 2.487% 11/25/2026(a)(f)(h) | | | 3,302,052 | | | | 3,293,136 | | |
RCO VII Mortgage LLC 2021-2 A1 — 2.116% 9/25/2026(f)(h) | | | 2,467,135 | | | | 2,446,521 | | |
Towd Point Mortgage Trust 2017-2 A1 — 2.750% 4/25/2057(e)(f) | | | 482,806 | | | | 486,570 | | |
Towd Point Mortgage Trust 2018-1 A1 — 3.000% 1/25/2058(e)(f) | | | 33,694 | | | | 34,346 | | |
Towd Point Mortgage Trust 2018-2 A1 — 3.250% 3/25/2058(e)(f) | | | 677,947 | | | | 692,969 | | |
Towd Point Mortgage Trust 2018-5 A1A — 3.250% 7/25/2058(e)(f) | | | 70,940 | | | | 72,355 | | |
VCAT LLC 2021 NPL2 A1 — 2.115% 3/27/2051(f)(h) | | | 1,279,214 | | | | 1,278,656 | | |
VCAT LLC 2021-NPL1 A1 — 2.289% 12/26/2050(f)(h) | | | 357,286 | | | | 356,071 | | |
VOLT C LLC 2021-NPL9 — 1.992% 5/25/2051(f)(h) | | | 1,431,748 | | | | 1,426,052 | | |
VOLT XCIV LLC 2021-NPL3 A1 — 2.240% 2/27/2051(f)(h) | | | 1,472,228 | | | | 1,468,551 | | |
VOLT XCV LLC 2021-NPL4 — 2.240% 3/27/2051(f)(h) | | | 1,550,325 | | | | 1,543,374 | | |
| | | $ | 46,899,754 | | |
TOTAL RESIDENTIAL MORTGAGE-BACKED SECURITIES
(Cost $49,713,089) | | $ | 49,613,885 | | |
24
FPA FLEXIBLE FIXED INCOME FUND
PORTFOLIO OF INVESTMENTS (Continued)
December 31, 2021
BONDS & DEBENTURES — Continued | | Principal
Amount | | Fair Value | |
ASSET-BACKED SECURITIES — 65.0% | |
AUTO — 20.5% | |
American Credit Acceptance Receivables Trust 2021-3 B —
0.660% 2/13/2026(f) | | $ | 806,000 | | | $ | 801,332 | | |
American Credit Acceptance Receivables Trust 2021-2 B —
0.680% 5/13/2025(f) | | | 400,000 | | | | 399,134 | | |
American Credit Acceptance Receivables Trust 2021-1 C —
0.830% 3/15/2027(f) | | | 4,750,000 | | | | 4,728,128 | | |
American Credit Acceptance Receivables Trust 2021-4 B —
0.860% 2/13/2026(f) | | | 502,000 | | | | 498,548 | | |
American Credit Acceptance Receivables Trust 2021-2 C —
0.970% 7/13/2027(f) | | | 2,670,000 | | | | 2,655,071 | | |
American Credit Acceptance Receivables Trust 2021-3 C —
0.980% 11/15/2027(f) | | | 1,731,000 | | | | 1,710,191 | | |
American Credit Acceptance Receivables Trust 2020-4 C —
1.310% 12/14/2026(f) | | | 3,501,000 | | | | 3,503,453 | | |
American Credit Acceptance Receivables Trust 2021-4 C —
1.320% 2/14/2028(f) | | | 1,827,000 | | | | 1,809,806 | | |
American Credit Acceptance Receivables Trust 2020-3 C —
1.850% 6/15/2026(f) | | | 1,033,000 | | | | 1,039,314 | | |
AmeriCredit Automobile Receivables Trust 2021-3 A3 —
0.760% 8/18/2026 | | | 1,153,000 | | | | 1,146,780 | | |
AmeriCredit Automobile Receivables Trust 2020-2 C —
1.480% 2/18/2026 | | | 342,000 | | | | 343,999 | | |
CarMax Auto Owner Trust 2020-3 C — 1.690% 4/15/2026 | | | 61,000 | | | | 61,370 | | |
CarMax Auto Owner Trust 2019-1 A4 — 3.260% 8/15/2024 | | | 200,000 | | | | 204,790 | | |
CarMax Auto Owner Trust 2019-1 B — 3.450% 11/15/2024 | | | 107,000 | | | | 109,820 | | |
CarMax Auto Owner Trust 2018-4 B — 3.670% 5/15/2024 | | | 95,000 | | | | 97,513 | | |
Drive Auto Receivables Trust 2021-2 B — 0.580% 12/15/2025 | | | 3,025,000 | | | | 3,002,063 | | |
Drive Auto Receivables Trust 2021-1 B — 0.650% 7/15/2025 | | | 737,000 | | | | 736,665 | | |
Drive Auto Receivables Trust 2021-3 A3 — 0.790% 10/15/2025 | | | 1,907,000 | | | | 1,900,523 | | |
Drive Auto Receivables Trust 2021-2 C — 0.870% 10/15/2027 | | | 2,324,000 | | | | 2,292,335 | | |
Drive Auto Receivables Trust 2021-1 C — 1.020% 6/15/2027 | | | 2,000,000 | | | | 2,003,050 | | |
Drive Auto Receivables Trust 2021-3 B — 1.110% 5/15/2026 | | | 3,814,000 | | | | 3,796,821 | | |
Drive Auto Receivables Trust 2021-3 C — 1.470% 1/15/2027 | | | 3,814,000 | | | | 3,788,497 | | |
DT Auto Owner Trust 2021-3A B — 0.580% 11/17/2025(f) | | | 908,000 | | | | 896,520 | | |
DT Auto Owner Trust 2021-1A B — 0.620% 9/15/2025(f) | | | 190,000 | | | | 189,094 | | |
DT Auto Owner Trust 2021-2A B — 0.810% 1/15/2027(f) | | | 394,000 | | | | 392,927 | | |
DT Auto Owner Trust 2021-1A C — 0.840% 10/15/2026(f) | | | 168,000 | | | | 166,595 | | |
DT Auto Owner Trust 2021-3A C — 0.870% 5/17/2027(f) | | | 800,000 | | | | 786,707 | | |
25
FPA FLEXIBLE FIXED INCOME FUND
PORTFOLIO OF INVESTMENTS (Continued)
December 31, 2021
BONDS & DEBENTURES — Continued | | Principal
Amount | | Fair Value | |
DT Auto Owner Trust 2020-3A B — 0.910% 12/16/2024(f) | | $ | 395,000 | | | $ | 395,589 | | |
DT Auto Owner Trust 2021-4A B — 1.020% 5/15/2026(f) | | | 704,000 | | | | 700,411 | | |
DT Auto Owner Trust 2021-2A C — 1.100% 2/16/2027(f) | | | 4,000,000 | | | | 3,963,680 | | |
DT Auto Owner Trust 2020-3A C — 1.470% 6/15/2026(f) | | | 2,884,000 | | | | 2,888,115 | | |
DT Auto Owner Trust 2021-4A C — 1.500% 9/15/2027(f) | | | 704,000 | | | | 699,385 | | |
Exeter Automobile Receivables Trust 2021-2A — 0.570% 9/15/2025 | | | 1,945,000 | | | | 1,935,632 | | |
Exeter Automobile Receivables Trust 2021-3A B — 0.690% 1/15/2026 | | | 4,737,000 | | | | 4,699,851 | | |
Exeter Automobile Receivables Trust 2021-1A C — 0.740% 1/15/2026 | | | 500,000 | | | | 498,392 | | |
Exeter Automobile Receivables Trust 2021-4A B — 1.050% 5/15/2026 | | | 2,241,000 | | | | 2,234,666 | | |
Exeter Automobile Receivables Trust 2020-3A C — 1.320% 7/15/2025 | | | 3,084,000 | | | | 3,097,430 | | |
Exeter Automobile Receivables Trust 2021-4A C — 1.460% 10/15/2027 | | | 2,169,000 | | | | 2,158,095 | | |
First Investors Auto Owner Trust 2021-2A A — 0.480% 3/15/2027(f) | | | 5,941,181 | | | | 5,903,472 | | |
Flagship Credit Auto Trust 2021-2 C — 1.270% 6/15/2027(f) | | | 1,004,000 | | | | 993,292 | | |
Flagship Credit Auto Trust 2021-4 B — 1.490% 2/15/2027(f) | | | 456,000 | | | | 454,337 | | |
Ford Credit Auto Lease Trust 2021-B B — 0.660% 1/15/2025 | | | 1,055,000 | | | | 1,046,072 | | |
Ford Credit Auto Lease Trust 2021-B C — 0.900% 5/15/2026 | | | 1,044,000 | | | | 1,031,563 | | |
Ford Credit Auto Lease Trust 2020-B C — 1.700% 2/15/2025 | | | 348,000 | | | | 350,873 | | |
Ford Credit Auto Owner Trust 2019-A A4 — 2.850% 8/15/2024 | | | 676,000 | | | | 688,295 | | |
GM Financial Automobile Leasing Trust 2021-2 B — 0.690% 5/20/2025 | | | 284,000 | | | | 281,566 | | |
GM Financial Automobile Leasing Trust 2020-3 C — 1.110% 10/21/2024 | | | 1,000,000 | | | | 1,002,666 | | |
GM Financial Consumer Automobile Receivables Trust 2020-3 C —
1.370% 1/16/2026 | | | 142,000 | | | | 142,008 | | |
Honda Auto Receivables Owner Trust 2021-4 A3 — 0.880% 1/21/2026 | | | 2,354,000 | | | | 2,348,137 | | |
Honda Auto Receivables Owner Trust 2019-2 A4 — 2.540% 3/21/2025 | | | 1,000,000 | | | | 1,015,961 | | |
Hyundai Auto Lease Securitization Trust 2021-B A4 —
0.380% 8/15/2025(f) | | | 124,000 | | | | 122,687 | | |
Hyundai Auto Lease Securitization Trust 2021-A B —
0.610% 10/15/2025(f) | | | 187,000 | | | | 186,080 | | |
Hyundai Auto Receivables Trust 2021-C A3 —
0.740% 5/15/2026 | | | 1,523,000 | | | | 1,512,587 | | |
Hyundai Auto Receivables Trust 2019-A A4 —
2.710% 5/15/2025 | | | 1,000,000 | | | | 1,014,507 | | |
Nissan Auto Lease Trust 2021-A A3 — 0.520% 8/15/2024 | | | 3,510,000 | | | | 3,491,726 | | |
Nissan Auto Receivables Owner Trust 2019-A A4 —
3.000% 9/15/2025 | | | 252,000 | | | | 257,166 | | |
Prestige Auto Receivables Trust 2021-1A A3 — 0.830% 7/15/2025(f) | | | 658,000 | | | | 655,589 | | |
Prestige Auto Receivables Trust 2021-1A B — 1.190% 4/15/2026(f) | | | 1,965,000 | | | | 1,951,920 | | |
Prestige Auto Receivables Trust 2021-1A C — 1.530% 2/15/2028(f) | | | 705,000 | | | | 699,232 | | |
Santander Consumer Auto Receivables Trust 2020-AA B —
2.260% 12/15/2025(f) | | | 688,000 | | | | 694,950 | | |
26
FPA FLEXIBLE FIXED INCOME FUND
PORTFOLIO OF INVESTMENTS (Continued)
December 31, 2021
BONDS & DEBENTURES — Continued | | Principal
Amount | | Fair Value | |
Santander Drive Auto Receivables Trust 2021-4 A3 — 0.510% 8/15/2025 | | $ | 1,781,000 | | | $ | 1,773,413 | | |
Santander Drive Auto Receivables Trust 2021-2 B — 0.590% 9/15/2025 | | | 1,232,000 | | | | 1,229,226 | | |
Santander Drive Auto Receivables Trust 2021-3 B — 0.600% 12/15/2025 | | | 5,042,000 | | | | 5,022,034 | | |
Santander Drive Auto Receivables Trust 2021-4 B — 0.880% 6/15/2026 | | | 4,910,000 | | | | 4,871,773 | | |
Santander Drive Auto Receivables Trust 2021-2 C — 0.900% 6/15/2026 | | | 740,000 | | | | 737,672 | | |
Santander Drive Auto Receivables Trust 2020-3 C — 1.120% 1/15/2026 | | | 1,699,000 | | | | 1,704,642 | | |
Santander Drive Auto Receivables Trust 2021-4 C — 1.260% 2/16/2027 | | | 3,197,000 | | | | 3,162,845 | | |
Santander Retail Auto Lease Trust 2021-C A3 — 0.500% 3/20/2025(f) | | | 2,420,000 | | | | 2,400,881 | | |
Toyota Auto Receivables Owner Trust 2019-A A4 — 3.000% 5/15/2024 | | | 252,000 | | | | 257,147 | | |
Volkswagen Auto Loan Enhanced Trust 2021-1 A3 — 1.020% 6/22/2026 | | | 2,858,000 | | | | 2,857,516 | | |
Westlake Automobile Receivables Trust 2021-2A B —
0.620% 7/15/2026(f) | | | 1,558,000 | | | | 1,545,175 | | |
Westlake Automobile Receivables Trust 2021-1A B —
0.640% 3/16/2026(f) | | | 1,809,000 | | | | 1,800,618 | | |
Westlake Automobile Receivables Trust 2020-3A B —
0.780% 11/17/2025(f) | | | 934,000 | | | | 932,742 | | |
Westlake Automobile Receivables Trust 2021-2A C —
0.890% 7/15/2026(f) | | | 2,450,000 | | | | 2,423,126 | | |
Westlake Automobile Receivables Trust 2021-3A A3 —
0.950% 6/16/2025(f) | | | 3,401,000 | | | | 3,392,337 | | |
Westlake Automobile Receivables Trust 2021-1A C —
0.950% 3/16/2026(f) | | | 1,738,000 | | | | 1,727,342 | | |
Westlake Automobile Receivables Trust 2020-3A C —
1.240% 11/17/2025(f) | | | 783,000 | | | | 784,710 | | |
Westlake Automobile Receivables Trust 2021-3A B —
1.290% 1/15/2027(f) | | | 3,653,000 | | | | 3,639,335 | | |
Westlake Automobile Receivables Trust 2021-3A C —
1.580% 1/15/2027(f) | | | 3,647,000 | | | | 3,635,320 | | |
Westlake Automobile Receivables Trust 2020-2A C —
2.010% 7/15/2025(f) | | | 530,000 | | | | 535,865 | | |
Westlake Automobile Receivables Trust 2020-1A C —
2.520% 4/15/2025(f) | | | 2,933,000 | | | | 2,974,200 | | |
World Omni Auto Receivables Trust 2021 B B — 1.040% 6/15/2027 | | | 300,000 | | | | 295,673 | | |
World Omni Auto Receivables Trust 2020-C C — 1.390% 5/17/2027 | | | 176,000 | | | | 175,654 | | |
World Omni Auto Receivables Trust 2019-A B — 3.340% 6/16/2025 | | | 252,000 | | | | 258,174 | | |
| | | $ | 136,314,398 | | |
COLLATERALIZED LOAN OBLIGATION — 19.5% | |
ABPCI Direct Lending Fund CLO I LLC 2016-1A E2,
3M USD LIBOR + 8.730% — 8.862% 7/20/2033(e)(f) | | $ | 2,944,000 | | | $ | 2,881,958 | | |
27
FPA FLEXIBLE FIXED INCOME FUND
PORTFOLIO OF INVESTMENTS (Continued)
December 31, 2021
BONDS & DEBENTURES — Continued | | Principal
Amount | | Fair Value | |
ABPCI Direct Lending Fund CLO II LLC 2017-1A ER,
3M USD LIBOR + 7.600% — 7.732% 4/20/2032(e)(f) | | $ | 3,062,000 | | | $ | 2,935,322 | | |
ABPCI Direct Lending Fund CLO X LP 2020-10A A1A,
3M USD LIBOR + 1.950% — 2.082% 1/20/2032(e)(f) | | | 678,000 | | | | 678,144 | | |
ABPCI Direct Lending Fund IX LLC 2020-9A A1R,
3M USD LIBOR + 1.400% — 1.524% 11/18/2031(e)(f) | | | 2,378,000 | | | | 2,377,246 | | |
AMMC CLO 16 Ltd. 2015-16A AR2, 3M USD LIBOR + 0.980% —
1.107% 4/14/2029(e)(f) | | | 2,706,567 | | | | 2,706,561 | | |
Barings Middle Market CLO Ltd. 2021-IA D,
3M USD LIBOR + 83650% — 8.799% 7/20/2033(e)(f) | | | 1,460,000 | | | | 1,430,704 | | |
Blackrock DLF VIII-L CLO Trust 2021-1A,
3M USD LIBOR + 1.350% — 1.472% 4/17/2032(e)(f) | | | 1,153,090 | | | | 1,152,921 | | |
Blackrock Mount Adams CLO IX LP 2021-9A A1,
3M USD LIBOR + 1.370% — 1.584% 9/22/2031(e)(f) | | | 1,395,000 | | | | 1,395,029 | | |
Brightwood Capital MM CLO Ltd. 2021-2A A,
3M USD LIBOR + 1.650% — 1.778% 11/15/2030(e)(f) | | | 4,401,000 | | | | 4,400,987 | | |
BTC Holdings Fund I LLC — 2.880% 1/28/2027(a)(c) | | | 1,720,980 | | | | 1,720,980 | | |
BTC Offshore Holdings Fund — 0.000% 1/20/2022(a)(c)(i) | | | 1,000,000 | | | | — | | |
BTC Offshore Holdings Fund, 3M USD LIBOR + 2.650% —
2.778% 10/20/2029(a)(c) | | | 1,000,000 | | | | 1,000,000 | | |
Cerberus Loan Funding XXIX LP 2020-2A A,
3M USD LIBOR + 1.900% — 2.024% 10/15/2032(e)(f) | | | 2,733,000 | | | | 2,733,727 | | |
Cerberus Loan Funding XXV LP 2018-4RA A1TR,
3M USD LIBOR + 1.530% — 1.654% 10/15/2030(e)(f) | | | 1,247,000 | | | | 1,246,812 | | |
Cerberus Loan Funding XXVI LP 2019-1A, 3M USD LIBOR + 1.500% —
1.624% 4/15/2031(e)(f) | | | 436,000 | | | | 435,614 | | |
Cerberus Loan Funding XXVIII LP 2020-1A A,
3M USD LIBOR + 1.850% — 1.974% 10/15/2031(e)(f) | | | 2,412,000 | | | | 2,412,642 | | |
Cerberus Loan Funding XXVIII LP 2020-1A D,
3M USD LIBOR + 5.300% — 5.424% 10/15/2031(e)(f) | | | 2,236,000 | | | | 2,237,509 | | |
Cerberus Loan Funding XXXI LP 2021-1A A,
3M USD LIBOR + 1.500% — 1.624% 4/15/2032(e)(f) | | | 1,598,000 | | | | 1,598,631 | | |
Cerberus Loan Funding XXXIV LP 2021-4A A,
3M USD LIBOR + 1.500% — 1.624% 8/13/2033(e)(f) | | | 2,164,425 | | | | 2,162,252 | | |
Cerberus Loan Funding XXXVI LP 2021-6A A,
3M USD LIBOR + 1.400% — 1.553% 11/22/2033(e)(f) | | | 5,199,000 | | | | 5,200,019 | | |
Ellington CLO IV Ltd. 2019-4A AR, 3M USD LIBOR + 1.580% —
1.704% 4/15/2029(e)(f) | | | 1,421,251 | | | | 1,421,028 | | |
Fortress Credit Opportunities IX CLO Ltd. 2017-9A A1TR,
3M USD LIBOR + 1.550%, — 1.672% 10/15/2033(e)(f) | | | 5,645,000 | | | | 5,644,215 | | |
28
FPA FLEXIBLE FIXED INCOME FUND
PORTFOLIO OF INVESTMENTS (Continued)
December 31, 2021
BONDS & DEBENTURES — Continued | | Principal
Amount | | Fair Value | |
Fortress Credit Opportunities IX CLO Ltd. 2017-9A ER,
3M USD LIBOR + 8.060%, — 8.182% 10/15/2033(e)(f) | | $ | 8,814,000 | | | $ | 8,560,959 | | |
Fortress Credit Opportunities VI CLO Ltd. 2015-6A,
3M USD LIBOR + 1.600% — 1.721% 7/10/2030(e)(f) | | | 4,000,000 | | | | 3,987,196 | | |
Fortress Credit Opportunities XI CLO Ltd. 2018-11A A1T,
3M USD LIBOR + 1.300% — 1.424% 4/15/2031(e)(f) | | | 1,928,000 | | | | 1,922,808 | | |
Golub Capital Partners CLO 36M Ltd. 2018-36A A,
3M USD LIBOR + 1.300% — 1.440% 2/5/2031(e)(f) | | | 3,439,000 | | | | 3,435,833 | | |
Golub Capital Partners CLO 38M Ltd. 2018-38A,
3M USD LIBOR + 2.800% — 2.932% 7/20/2030(e)(f) | | | 1,993,000 | | | | 1,992,992 | | |
Golub Capital Partners CLO 42M Ltd. 2019-42A A2,
3M USD LIBOR + 2.000% — 2.132% 4/20/2031(e)(f) | | | 3,006,000 | | | | 3,003,637 | | |
Golub Capital Partners TALF LLC 2020-2A A,
3M USD LIBOR + 1.850% — 1.990% 2/5/2030(e)(f) | | | 811,503 | | | | 813,127 | | |
Ivy Hill Middle Market Credit Fund IX Ltd. 9A CR,
3M USD LIBOR + 1.350% — 2.472% 1/18/2030(e)(f) | | | 2,092,000 | | | | 2,044,505 | | |
IVY Hill Middle Market Credit Fund XII Ltd. 12A DR,
3M USD LIBOR + 8.170% — 8.302% 7/20/2033(e)(f) | | | 1,086,000 | | | | 1,064,188 | | |
Ivy Hill Middle Market Credit Fund XVIII Ltd. 18A E,
3M USD LIBOR + 7.750% — 7.878% 4/22/2033(e)(f) | | | 3,766,000 | | | | 3,676,799 | | |
Lake Shore MM CLO III LLC 2019-2A A1R,
3M USD LIBOR + 1.480% — 1.602% 10/17/2031(e)(f) | | | 1,228,000 | | | | 1,227,998 | | |
Lake Shore MM CLO III LLC 2019-2A A2R —
2.403% 10/17/2031(f) | | | 575,000 | | | | 571,448 | | |
Lake Shore MM CLO IV Ltd. 2021-1A X, 3M USD LIBOR + 1.180% —
1.312% 10/15/2033(e)(f) | | | 881,000 | | | | 880,992 | | |
Madison Park Funding X Ltd. 2012-10A AR3,
3M USD LIBOR + 1.010% — 1.142% 1/20/2029(e)(f) | | | 3,343,406 | | | | 3,343,680 | | |
Madison Park Funding XIII Ltd. 2014-13A AR2,
3M USD LIBOR + 0.950% — 1.074% 4/19/2030(e)(f) | | | 541,074 | | | | 541,101 | | |
Madison Park Funding XXIII Ltd. 2017-23A AR,
3M USD LIBOR + 0.970% — 1.105% 7/27/2031(e)(f) | | | 3,380,000 | | | | 3,380,017 | | |
Madison Park Funding XXV Ltd. 2017-25A,
3M USD LIBOR + 0.970% — 1.094% 4/25/2029(e)(f) | | | 535,000 | | | | 535,021 | | |
Neuberger Berman CLO XV 2013-15A A1R2,
3M USD LIBOR + 0.920% — 1.044% 10/15/2029(e)(f) | | | 3,102,000 | | | | 3,103,892 | | |
OCP CLO Ltd. 2017-13A A1AR, 3M USD LIBOR + 0.960% —
1.084% 7/15/2030(e)(f) | | | 3,328,000 | | | | 3,330,127 | | |
Octagon Investment Partners XV Ltd. 2013-1A A1RR,
3M USD LIBOR + 0.970% — 1.099% 7/19/2030(e)(f) | | | 4,686,000 | | | | 4,685,991 | | |
29
FPA FLEXIBLE FIXED INCOME FUND
PORTFOLIO OF INVESTMENTS (Continued)
December 31, 2021
BONDS & DEBENTURES — Continued | | Principal
Amount | | Fair Value | |
OFSI BSL VIII Ltd. 2017-1A AR, 3M USD LIBOR + 1.000% —
1.122% 8/16/2029(e)(f) | | $ | 2,721,217 | | | $ | 2,721,225 | | |
Owl Rock CLO III Ltd. 2020-3A A1L, 3M USD LIBOR + 1.800% —
1.932% 4/20/2032(e)(f) | | | 800,000 | | | | 800,874 | | |
Owl Rock CLO VI Ltd. 2021-6A, 3M USD LIBOR + 1.450% —
1.572% 6/21/2032(e)(f) | | | 3,634,000 | | | | 3,635,588 | | |
Palmer Square Loan Funding Ltd. 2019-1A A1,
3M USD LIBOR + 1.050% — 1.182% 4/20/2027(e)(f) | | | 139,050 | | | | 139,070 | | |
Parliament CLO II Ltd. 2021-2A A, 3M USD LIBOR + 1.350% —
1.475% 8/20/2032(e)(f) | | | 1,756,000 | | | | 1,756,112 | | |
Parliament CLO II Ltd. 2021-2A D, 3M USD LIBOR + 3.700% —
3.825% 8/20/2032(e)(f) | | | 2,646,000 | | | | 2,645,979 | | |
Parliament Funding II Ltd. 2020-1A AR, 3M USD LIBOR + 1.250% —
1.490% 10/20/2031(e)(f) | | | 2,164,000 | | | | 2,161,944 | | |
TCP Whitney CLO Ltd. 2017-1A ER, 3M USD LIBOR + 8.160% —
8.302% 8/20/2033(e)(f) | | | 2,429,000 | | | | 2,379,036 | | |
Telos CLO Ltd. 2014-5A A1R, 3M USD LIBOR + 0.950% —
1.072% 4/17/2028(e)(f) | | | 51,622 | | | | 51,618 | | |
VCP CLO II Ltd. 2021-2A A1, 3M USD LIBOR + 1.670% —
1.794% 4/15/2031(e)(f) | | | 3,500,000 | | | | 3,491,600 | | |
VCP CLO II Ltd. 2021-2A E, 3M USD LIBOR + 8.400% —
8.524% 4/15/2031(e)(f) | | | 4,460,000 | | | | 4,349,526 | | |
Venture XX CLO Ltd. 2015-20A B1R, 3M USD LIBOR + 1.250% —
1.374% 4/15/2027(e)(f) | | | 769,000 | | | | 768,895 | | |
Venture Xxv CLO Ltd. 2016-25A ARR, 3M USD LIBOR + 1.020% —
1.152% 4/20/2029(e)(f) | | | 422,531 | | | | 421,958 | | |
Woodmont Trust 2019-6A A1R, 3M USD LIBOR + 1.480% —
1.604% 7/15/2031(e)(f) | | | 2,657,000 | | | | 2,657,000 | | |
Woodmont Trust 2019 6A A1R2, 1M USD LIBOR + 1.480% —
1.694% 7/15/2031(e)(f) | | | 1,679,000 | | | | 1,679,000 | | |
Zais CLO 7 Ltd. 2017-2A A, 3M USD LIBOR + 1.290% —
1.414% 4/15/2030(e)(f) | | | 620,583 | | | | 619,244 | | |
| | | $ | 130,153,281 | | |
CREDIT CARD — 0.9% | |
American Express Credit Account Master Trust 2019-2 A —
2.670% 11/15/2024 | | $ | 268,000 | | | $ | 269,913 | | |
American Express Credit Account Master Trust 2019-2 B —
2.860% 11/15/2024 | | | 1,160,000 | | | | 1,168,508 | | |
American Express Credit Account Master Trust 2019-1 A —
2.870% 10/15/2024 | | | 1,545,000 | | | | 1,553,884 | | |
30
FPA FLEXIBLE FIXED INCOME FUND
PORTFOLIO OF INVESTMENTS (Continued)
December 31, 2021
BONDS & DEBENTURES — Continued | | Principal
Amount | | Fair Value | |
Barclays Dryrock Issuance Trust 2019-1 A — 1.960% 5/15/2025 | | $ | 869,000 | | | $ | 876,477 | | |
Capital One Multi-Asset Execution Trust 2019-A2 A2 —
1.720% 8/15/2024 | | | 49,000 | | | | 49,405 | | |
Discover Card Execution Note Trust 2019-A1 A1 —
3.040% 7/15/2024 | | | 174,000 | | | | 174,168 | | |
Synchrony Card Funding LLC 2019-A2 A — 2.340% 6/15/2025 | | | 1,144,000 | | | | 1,154,489 | | |
Synchrony Card Funding LLC 2019-A1 A — 2.950% 3/15/2025 | | | 989,000 | | | | 994,554 | | |
| | | $ | 6,241,398 | | |
EQUIPMENT — 9.4% | |
ARI Fleet Lease Trust 2020-A B — 2.060% 11/15/2028(f) | | $ | 1,239,000 | | | $ | 1,251,465 | | |
Avis Budget Rental Car Funding AESOP LLC 2017-2A A —
2.970% 3/20/2024(f) | | | 268,000 | | | | 273,474 | | |
Avis Budget Rental Car Funding AESOP LLC 2017-1A A —
3.070% 9/20/2023(f) | | | 2,192,000 | | | | 2,220,145 | | |
Avis Budget Rental Car Funding AESOP LLC 2019-1A A —
3.450% 3/20/2023(f) | | | 127,000 | | | | 127,431 | | |
CCG Receivables Trust 2021-2 A2 — 0.540% 3/14/2029(f) | | | 2,687,000 | | | | 2,671,287 | | |
Chesapeake Funding II LLC 2020-1A C — 2.140% 8/16/2032(f) | | | 368,000 | | | | 372,052 | | |
Chesapeake Funding II LLC 2019-1A B — 3.110% 4/15/2031(f) | | | 676,000 | | | | 685,606 | | |
Coinstar Funding LLC 2017-1A A2 — 5.216% 4/25/2047(f) | | | 2,543,165 | | | | 2,542,417 | | |
Dell Equipment Finance Trust 2021-1 C — 0.810% 5/22/2026(f) | | | 2,100,000 | | | | 2,083,732 | | |
Dell Equipment Finance Trust 2021-2 C — 0.940% 12/22/2026(f) | | | 665,000 | | | | 656,987 | | |
Dell Equipment Finance Trust 2020-2 C — 1.370% 1/22/2024(f) | | | 2,200,000 | | | | 2,207,906 | | |
Dell Equipment Finance Trust 2020-2 D — 1.920% 3/23/2026(f) | | | 6,801,000 | | | | 6,865,099 | | |
Dell Equipment Finance Trust 2020-1 C — 4.260% 6/22/2023(f) | | | 664,000 | | | | 679,577 | | |
Donlen Fleet Lease Funding 2 LLC 2021-2 A2 — 0.560% 12/11/2034(f) | | | 2,625,000 | | | | 2,610,864 | | |
Encina Equipment Finance LLC 2021-1A A2 — 0.740% 12/15/2026(f) | | | 945,000 | | | | 942,567 | | |
Enterprise Fleet Financing LLC 2021-2 A2 — 0.480% 5/20/2027(f) | | | 4,034,000 | | | | 3,997,252 | | |
Enterprise Fleet Financing LLC 2021-3 A2 — 0.770% 8/20/2027(f) | | | 2,941,000 | | | | 2,922,452 | | |
Enterprise Fleet Financing LLC 2018-3 A2 — 3.380% 5/20/2024(f) | | | 607 | | | | 608 | | |
Ford Credit Floorplan Master Owner Trust 2020-1 B —
0.980% 9/15/2025 | | | 1,000,000 | | | | 996,772 | | |
GMF Floorplan Owner Revolving Trust 2020-1 A —
0.680% 8/15/2025(f) | | | 990,000 | | | | 985,308 | | |
GMF Floorplan Owner Revolving Trust 2020-2 A —
0.690% 10/15/2025(f) | | | 1,850,000 | | | | 1,843,848 | | |
GMF Floorplan Owner Revolving Trust 2020-2 B —
0.960% 10/15/2025(f) | | | 6,240,000 | | | | 6,208,817 | | |
31
FPA FLEXIBLE FIXED INCOME FUND
PORTFOLIO OF INVESTMENTS (Continued)
December 31, 2021
BONDS & DEBENTURES — Continued | | Principal
Amount | | Fair Value | |
GreatAmerica Leasing Receivables Funding LLC 2019-1 B —
3.370% 2/18/2025(f) | | $ | 252,000 | | | $ | 258,170 | | |
HPEFS Equipment Trust 2021-1A — 0.750% 3/20/2031(f) | | | 1,300,000 | | | | 1,289,290 | | |
HPEFS Equipment Trust 2020-2A C — 2.000% 7/22/2030(f) | | | 711,000 | | | | 719,180 | | |
HPEFS Equipment Trust 2020-1A C — 2.030% 2/20/2030(f) | | | 815,000 | | | | 819,807 | | |
HPEFS Equipment Trust 2020-1A D — 2.260% 2/20/2030(f) | | | 1,000,000 | | | | 1,011,112 | | |
HPEFS Equipment Trust 2019-1A D — 2.720% 9/20/2029(f) | | | 4,500,000 | | | | 4,552,150 | | |
HPEFS Equipment Trust 2020-2A D — 2.790% 7/22/2030(f) | | | 2,000,000 | | | | 2,046,775 | | |
Kubota Credit Owner Trust 2020-1A A4 — 2.260% 7/15/2026(f) | | | 762,000 | | �� | | 778,804 | | |
Navistar Financial Dealer Note Master Trust 2020-1 A,
1M USD LIBOR + 0.950% — 1.052% 7/25/2025(e)(f) | | | 1,572,000 | | | | 1,575,622 | | |
Navistar Financial Dealer Note Master Trust 2020-1 C,
1M USD LIBOR + 2.150% — 2.252% 7/25/2025(e)(f) | | | 1,563,000 | | | | 1,572,629 | | |
NextGear Floorplan Master Owner Trust 2019-2A A2 —
2.070% 10/15/2024(f) | | | 971,000 | | | | 981,675 | | |
Pawneee Equipment Receivables LLC 2021-1 A2 —
1.100% 7/15/2027(f) | | | 1,089,000 | | | | 1,082,626 | | |
Verizon Owner Trust 2019-C B — 2.060% 4/22/2024 | | | 925,000 | | | | 938,351 | | |
Verizon Owner Trust 2020-A C — 2.060% 7/22/2024 | | | 230,000 | | | | 232,510 | | |
Verizon Owner Trust 2019-C C — 2.160% 4/22/2024 | | | 290,000 | | | | 294,033 | | |
Verizon Owner Trust 2019-B A1A — 2.330% 12/20/2023 | | | 64,836 | | | | 65,287 | | |
Verizon Owner Trust 2019-B B — 2.400% 12/20/2023 | | | 1,006,000 | | | | 1,019,452 | | |
Verizon Owner Trust 2019-A C — 3.220% 9/20/2023 | | | 200,000 | | | | 203,036 | | |
Wheels SPV 2 LLC 2020-1A A3 — 0.620% 8/20/2029(f) | | | 347,000 | | | | 343,844 | | |
| | | $ | 62,930,019 | | |
OTHER — 14.7% | |
ABPCI Direct Lending Fund ABS I Ltd. 2020-1A A —
3.199% 12/20/2030(f) | | $ | 1,284,000 | | | $ | 1,284,194 | | |
ABPCI Direct Lending Fund ABS I Ltd. 2020-1A B —
4.935% 12/20/2030(f) | | | 3,273,000 | | | | 3,273,766 | | |
CARS-DB4 LP 2020-1A A1 — 2.690% 2/15/2050(f) | | | 294,852 | | | | 298,509 | | |
Cologix Data Centers US Issuer LLC 2021-1A A2 —
3.300% 12/26/2051(f) | | | 2,673,000 | | | | 2,684,761 | | |
Cologix Data Centers US Issuer LLC 2021-1A C —
5.990% 12/26/2051(f) | | | 3,235,000 | | | | 3,272,406 | | |
Conn's Receivables Funding LLC 2021-A B — 2.870% 5/15/2026(f) | | | 2,369,000 | | | | 2,361,037 | | |
Conn's Receivables Funding LLC 2020-A B — 4.270% 6/16/2025(f) | | | 305,331 | | | | 306,875 | | |
DataBank Issuer 2021-1A C — 4.430% 2/27/2051(f) | | | 1,500,000 | | | | 1,455,216 | | |
Diamond Infrastructure Funding LLC 2021-1A C — 3.475% 4/15/2049(f) | | | 512,000 | | | | 509,040 | | |
Diamond Issuer 2021-1A C — 3.787% 11/20/2051(f) | | | 1,718,000 | | | | 1,708,022 | | |
32
FPA FLEXIBLE FIXED INCOME FUND
PORTFOLIO OF INVESTMENTS (Continued)
December 31, 2021
BONDS & DEBENTURES — Continued | | Principal
Amount | | Fair Value | |
Elm Trust 2020-4A A2 — 2.286% 10/20/2029(f) | | $ | 330,000 | | | $ | 324,562 | | |
Elm Trust 2020-3A A2 — 2.954% 8/20/2029(f) | | | 362,000 | | | | 357,829 | | |
Elm Trust 2020-4A B — 3.866% 10/20/2029(f) | | | 985,000 | | | | 969,114 | | |
Elm Trust 2020-3A B — 4.481% 8/20/2029(f) | | | 897,000 | | | | 885,440 | | |
FCI Funding LLC 2021-1A A — 1.130% 4/15/2033(f) | | | 533,276 | | | | 530,401 | | |
Golub Capital Partners ABS Funding Ltd. 2021-1A A2 —
2.773% 4/20/2029(f) | | | 1,668,000 | | | | 1,661,210 | | |
Golub Capital Partners ABS Funding Ltd. 2021-2A A —
2.944% 10/19/2029(f) | | | 4,896,000 | | | | 4,855,931 | | |
Golub Capital Partners ABS Funding Ltd. 2020-1A A2 —
3.208% 1/22/2029(f) | | | 2,267,000 | | | | 2,276,068 | | |
Golub Capital Partners ABS Funding Ltd. 2021-1A B —
3.816% 4/20/2029(f) | | | 1,924,000 | | | | 1,899,340 | | |
Golub Capital Partners ABS Funding Ltd. 2021-2A B —
3.994% 10/19/2029(f) | | | 5,697,000 | | | | 5,652,791 | | |
Golub Capital Partners ABS Funding Ltd. 2020-1A B —
4.496% 1/22/2029(f) | | | 1,404,000 | | | | 1,402,430 | | |
Gracie Point International Funding 2021-1A, 1M USD LIBOR + 0.750% —
0.849% 11/1/2023(e)(f) | | | 1,802,714 | | | | 1,806,916 | | |
Hotwire Funding LLC 2021-1 C — 4.459% 11/20/2051(f) | | | 1,250,000 | | | | 1,241,032 | | |
Legal Fee Funding LLC 2006-1A A — 8.000% 7/20/2036(f) | | | 262,210 | | | | 268,687 | | |
Monroe Capital ABS Funding Ltd. 2021-1A A2 — 2.815% 4/22/2031(f) | | | 1,579,000 | | | | 1,554,131 | | |
Monroe Capital ABS Funding Ltd. 2021-1A B — 3.908% 4/22/2031(f) | | | 907,000 | | | | 891,724 | | |
New Residential Advance Receivables Trust Advance Receivables Backed
Notes 2020-APT1 AT1 — 1.035% 12/16/2052(f) | | | 734,000 | | | | 732,438 | | |
NRZ Advance Receivables Trust 2020-T3 AT3 — 1.317% 10/15/2052(f) | | | 508,200 | | | | 507,511 | | |
NRZ Advance Receivables Trust 2020-T2 AT2 — 1.475% 9/15/2053(f) | | | 2,720,000 | | | | 2,700,678 | | |
Oasis Securitization Funding LLC 2021-1A A — 2.579% 2/15/2033(f) | | | 327,841 | | | | 327,908 | | |
Ocwen Master Advance Receivables Trust 2020-T1 AT1 —
1.278% 8/15/2052(f) | | | 2,793,000 | | | | 2,793,239 | | |
Oportun Funding XIV LLC 2021-A — 1.210% 3/8/2028(f) | | | 532,000 | | | | 532,617 | | |
Oportun Issuance Trust 2021-B — 1.470% 5/8/2031(f) | | | 1,020,000 | | | | 1,017,009 | | |
Oportun Issuance Trust 2021-C A — 2.180% 10/8/2031(f) | | | 4,976,000 | | | | 4,963,127 | | |
Owl Rock Technology Financing LLC 2020-1A A,
3M USD LIBOR + 2.950% — 3.076% 1/15/2031(e)(f) | | | 3,099,000 | | | | 3,099,183 | | |
PFS Financing Corp. 2021-A A — 0.710% 4/15/2026(f) | | | 2,543,000 | | | | 2,507,956 | | |
PFS Financing Corp. 2021-B A — 0.770% 8/15/2026(f) | | | 1,925,000 | | | | 1,892,020 | | |
PFS Financing Corp. 2021-A B — 0.960% 4/15/2026(f) | | | 310,000 | | | | 305,639 | | |
PFS Financing Corp. 2020-G A — 0.970% 2/15/2026(f) | | | 3,210,000 | | | | 3,193,736 | | |
PFS Financing Corp. 2020-E A — 1.000% 10/15/2025(f) | | | 898,000 | | | | 894,757 | | |
33
FPA FLEXIBLE FIXED INCOME FUND
PORTFOLIO OF INVESTMENTS (Continued)
December 31, 2021
BONDS & DEBENTURES — Continued | | Principal
Amount | | Fair Value | |
PFS Financing Corp. 2021 B B — 1.090% 8/15/2026(f) | | $ | 328,000 | | | $ | 323,641 | | |
PFS Financing Corp. 2020-A A — 1.270% 6/15/2025(f) | | | 2,988,000 | | | | 2,996,698 | | |
PFS Financing Corp. 2020-E B — 1.570% 10/15/2025(f) | | | 4,503,000 | | | | 4,518,061 | | |
PFS Financing Corp. 2020-A B — 1.770% 6/15/2025(f) | | | 5,819,000 | | | | 5,862,465 | | |
PFS Financing Corp. 2019-C A — 2.230% 10/15/2024(f) | | | 947,000 | | | | 958,279 | | |
PFS Financing Corp. 2019-C B — 2.420% 10/15/2024(f) | | | 4,300,000 | | | | 4,349,584 | | |
SMB Private Education Loan Trust 2021-A A1,
1M USD LIBOR + 0.500% — 0.610% 1/15/2053(e)(f) | | | 137,465 | | | | 137,506 | | |
SpringCastle America Funding LLC 2020-AA A — 1.970% 9/25/2037(f) | | | 1,971,291 | | | | 1,989,483 | | |
TVEST LLC 2020-A A — 4.500% 7/15/2032(f) | | | 362,338 | | | | 364,183 | | |
VCP RRL ABS I Ltd. 2021-1A A — 2.152% 10/20/2031(f) | | | 2,531,000 | | | | 2,515,455 | | |
VCP RRL ABS I Ltd. 2021-1A B — 2.848% 10/20/2031(f) | | | 2,135,000 | | | | 2,125,685 | | |
VCP RRL ABS I Ltd. 2021-1A C — 5.425% 10/20/2031(f) | | | 2,667,000 | | | | 2,639,650 | | |
| | | $ | 97,979,940 | | |
| TOTAL ASSET-BACKED SECURITIES (Cost $434,434,820) | | $ | 433,619,036 | | |
CORPORATE BONDS & NOTES — 1.7% | |
COMMUNICATIONS — 0.2% | |
Consolidated Communications, Inc. — 6.500% 10/1/2028(f) | | $ | 1,119,000 | | | $ | 1,193,134 | | |
Frontier Communications Holdings LLC — 5.875% 10/15/2027(f) | | | 398,000 | | | | 420,885 | | |
| | | $ | 1,614,019 | | |
CONSUMER, CYCLICAL — 0.4% | |
Air Canada Pass-Through Trust — 10.500% 7/15/2026(f) | | $ | 1,030,000 | | | $ | 1,260,378 | | |
Aramark Services, Inc. — 6.375% 5/1/2025(f) | | | 316,000 | | | | 329,035 | | |
CD&R Smokey Buyer, Inc. — 6.750% 7/15/2025(f) | | | 462,000 | | | | 485,678 | | |
Royal Caribbean Cruises Ltd. — 11.500% 6/1/2025(f) | | | 354,000 | | | | 398,250 | | |
| | | $ | 2,473,341 | | |
CONSUMER, NON-CYCLICAL — 0.1% | |
Cimpress PLC — 7.000% 6/15/2026(f) | | $ | 335,000 | | | $ | 349,974 | | |
ENERGY — 0.1% | |
Natural Resource Partners LP/NRP Finance Corp. — 9.125% 6/30/2025(f) | | $ | 831,000 | | | $ | 843,465 | | |
34
FPA FLEXIBLE FIXED INCOME FUND
PORTFOLIO OF INVESTMENTS (Continued)
December 31, 2021
BONDS & DEBENTURES — Continued | | Principal
Amount | | Fair Value | |
FINANCIAL — 0.9% | |
Golub Capital BDC, Inc. — 3.375% 4/15/2024 | | $ | 1,487,000 | | | $ | 1,528,233 | | |
Midcap Financial Issuer Trust — 6.500% 5/1/2028(f) | | | 4,098,000 | | | | 4,282,410 | | |
| | | $ | 5,810,643 | | |
| TOTAL CORPORATE BONDS & NOTES (Cost $10,325,494) | | $ | 11,091,442 | | |
CORPORATE BANK DEBT — 4.8% | |
ABG Intermediate Holdings 2 LLC, 3M USD LIBOR + 3.250% —
4.000% 9/29/2024(c)(e) | | $ | 1,826,576 | | | $ | 1,818,959 | | |
Applied Systems, Inc., 3M USD LIBOR + 3.000% —
3.500% 9/19/2024(c)(e) | | | 1,714,000 | | | | 1,709,286 | | |
Asurion LLC, 1M USD LIBOR + 3.000% — 3.104% 11/3/2024(c)(e) | | | 3,550,684 | | | | 3,534,422 | | |
Axiom Global, Inc. — 5.500% 10/1/2026(c) | | | 3,111,000 | | | | 3,048,780 | | |
BJ Services, Inc., 7.000% — 8.500% 1/3/2023(a)(b)(c) | | | 13,847 | | | | 13,155 | | |
Capstone Acquisition Holdings, Inc. 2020 Delayed Draw Term Loan,
1M USD LIBOR + 2.200% 11/12/2027(c)(i) | | | 239,930 | | | | 91,189 | | |
Capstone Acquisition Holdings, Inc. 2020 Term Loan,
1M USD LIBOR + 4.750% — 5.750% 11/12/2027(c)(e) | | | 1,802,833 | | | | 1,802,833 | | |
Cimpress Public Ltd., 1M USD LIBOR + 3.500% —
4.000% 5/17/2028(c)(e) | | | 1,212,905 | | | | 1,211,389 | | |
Emerald Topco, Inc., 1M USD LIBOR + 3.500% —
0.000% 7/24/2026(c)(e) | | | 2,103,000 | | | | 2,090,739 | | |
Frontier Communications Corp., 3M USD LIBOR + 3.750% —
4.500% 5/1/2028(c)(e) | | | 1,118,548 | | | | 1,116,456 | | |
GHX Ultimate Parent Corp., 3M USD LIBOR + 3.250% —
4.250% 6/28/2024(c)(e) | | | 3,128,011 | | | | 3,116,281 | | |
Hanjin International Corp., 3M USD LIBOR + 5.000% —
5.500% 12/23/2022(c)(e) | | | 1,627,000 | | | | 1,633,101 | | |
Heartland Dental LLC, 1M USD LIBOR + 4.000% —
4.104% 4/30/2025(c)(e) | | | 3,139,542 | | | | 3,131,693 | | |
JC Penney Corp., Inc., 3M USD LIBOR + 4.250% —
5.250% 6/23/2023(c)(e) | | | 480,181 | | | | 48 | | |
McDermott Super Senior Exit LC — 0.500% 6/30/2024(c)(i) | | | 640,000 | | | | (144,000 | ) | |
Mediaco Holding, Inc. Class A 8.400%, PIK — 1.000%
11/25/2024(a)(b)(c) | | | 1,169,512 | | | | 1,087,646 | | |
Packers Holdings LLC, 6M USD LIBOR + 3.250% —
4.000% 3/9/2028(c)(e) | | | 2,096,571 | | | | 2,080,847 | | |
PetVet Care Centers LLC, 1M USD LIBOR + 3.500% —
4.250% 2/14/2025(c)(e) | | | 1,158,038 | | | | 1,156,591 | | |
35
FPA FLEXIBLE FIXED INCOME FUND
PORTFOLIO OF INVESTMENTS (Continued)
December 31, 2021
BONDS & DEBENTURES — Continued | | Principal
Amount | | Fair Value | |
Polaris Newco, LLC Term Loan B, 3M USD LIBOR + 4.000% —
4.500% 6/2/2028(c)(e) | | $ | 2,077,793 | | | $ | 2,076,504 | | |
Polyconcept North America Holdings, Inc., 6M USD LIBOR + 4.500% —
5.500% 8/16/2023(c)(e) | | | 747,168 | | | | 743,432 | | |
Windstream Services LLC, 1M USD LIBOR + 6.250% —
7.250% 9/21/2027(c)(e) | | | 837,161 | | | | 839,254 | | |
| TOTAL CORPORATE BANK DEBT (Cost $32,272,904) | | $ | 32,158,605 | | |
U.S. TREASURIES — 10.4% | |
U.S. Treasury Bills — 0.030% 1/13/2022(g) | | $ | 50,928,000 | | | $ | 50,927,715 | | |
U.S. Treasury Bills — 0.018% 1/18/2022(g) | | | 18,224,000 | | | | 18,223,701 | | |
| TOTAL U.S. TREASURIES (Cost $69,151,340) | | $ | 69,151,416 | | |
| TOTAL BONDS & DEBENTURES — 98.3% (Cost $655,754,004) | | $ | 655,365,103 | | |
| TOTAL INVESTMENT SECURITIES — 98.7% (Cost $657,682,420) | | $ | 658,147,217 | | |
SHORT-TERM INVESTMENTS — 1.5% | |
State Street Bank Repurchase Agreement — 0.00% 1/3/2022
(Dated 12/31/2021, repurchase price of $10,069,000, collateralized by
$10,732,000 principal amount U.S. Treasury Notes — 0.625% 2027,
fair value $10,270,438)(j) | | $ | 10,069,000 | | | $ | 10,069,000 | | |
| TOTAL SHORT-TERM INVESTMENTS (Cost $10,069,000) | | $ | 10,069,000 | | |
| TOTAL INVESTMENTS — 100.2% (Cost $667,751,420) | | $ | 668,216,217 | | |
Other assets and liabilities, net — (0.2)% | | | (1,398,143 | ) | |
NET ASSETS — 100.0% | | $ | 666,818,074 | | |
(a) Investments categorized as a significant unobservable input (Level 3) (See Note 6 of the Notes to Financial Statements).
(b) These securities have been valued in good faith under policies adopted by authority of the Board of Trustees in accordance with the Fund's fair value procedures. These securities constituted 0.58% of total net assets at December 31, 2021.
36
FPA FLEXIBLE FIXED INCOME FUND
PORTFOLIO OF INVESTMENTS (Continued)
December 31, 2021
(c) Restricted securities. These restricted securities constituted 5.65% of total net assets at December 31, 2021, most of which are considered liquid by the Adviser. These securities are not registered and may not be sold to the public. There are legal and/or contractual restrictions on resale. The Fund does not have the right to demand that such securities be registered. The values of these securities are determined by valuations provided by pricing services, brokers, dealers, market makers, or in good faith under policies adopted by authority of the Fund's Board of Trustees.
(d) Non-income producing security.
(e) Variable/Floating Rate Security — The rate shown is based on the latest available information as of December 31, 2021. For Corporate Bank Debt, the rate shown may represent a weighted average interest rate. Certain variable rate securities are not based on a published rate and spread but are determined by the issuer or agent and are based on current market conditions. These securities do not indicate a reference rate and spread in their description.
(f) Security exempt from registration under Rule 144A of the Securities Act of 1933. These securities may be resold in transactions exempt from registration, typically only to qualified institutional buyers. Unless otherwise indicated, these securities are not considered to be illiquid.
(g) Zero coupon bond. Coupon amount represents effective yield to maturity.
(h) Step Coupon — Coupon rate increases in increments to maturity. Rate disclosed is as of December 31, 2021.
(i) All or a portion of this holding is subject to unfunded loan commitments. The stated interest rate reflects the weighted average of the reference rate and spread for the funded portion, if any, and the commitment fees on the portion of the loan that is unfunded (See Note 9 of the Notes to Financial Statements).
(j) Security pledged as collateral (See Note 8 of the Notes to Financial Statements).
37
FPA FLEXIBLE FIXED INCOME FUND
PORTFOLIO OF INVESTMENTS — RESTRICTED SECURITIES
December 31, 2021
Issuer | | Acquisition
Date(s) | | Cost | | Fair Value | | Fair
Value as a %
of Net Assets | |
ABG Intermediate Holdings 2 LLC,
3M USD LIBOR + 3.250% —
4.000% 9/29/2024
| | 03/06/2020, 03/12/2020,
03/20/2020, 02/02/2021,
03/17/2021, 03/18/2021 | | $ | 1,760,478 | | | $ | 1,818,959 | | | | 0.27 | % | |
Applied Systems, Inc.,
3M USD LIBOR + 3.000% —
3.500% 9/19/2024
| | 07/28/2021, 08/03/2021,
08/04/2021 | | | 1,710,025 | | | | 1,709,286 | | | | 0.26 | % | |
Asurion LLC, 1M USD LIBOR +
3.000% — 3.104% 11/3/2024
| | 01/06/2021, 03/01/2021,
03/02/2021, 05/21/2021,
07/14/2021, 08/17/2021 | | | 3,540,830 | | | | 3,534,422 | | | | 0.53 | % | |
Axiom Global, Inc. — 5.500%
10/1/2026 | | 11/19/2021 | | | 3,081,134 | | | | 3,048,780 | | | | 0.46 | % | |
BJ Services, Inc., 7.000% —
8.500% 1/3/2023 | | 12/31/2019 | | | 13,759 | | | | 13,155 | | | | 0.00 | % | |
BTC Holdings Fund I LLC —
2.880% 1/28/2027 | | 09/01/2021 | | | 1,720,980 | | | | 1,720,980 | | | | 0.26 | % | |
BTC Offshore Holdings Fund,
3M USD LIBOR + 2.650% —
2.778% 10/20/2029 | | 10/25/2021 | | | 1,000,000 | | | | 1,000,000 | | | | 0.15 | % | |
Capstone Acquisition Holdings,
Inc. 2020 Delayed Draw
Term Loan, 1M USD LIBOR +
2.200% 11/12/2027 | | 04/30/2021 | | | 90,781 | | | | 91,189 | | | | 0.01 | % | |
Capstone Acquisition Holdings,
Inc. 2020 Term Loan,
1M USD LIBOR + 4.750% —
5.750% 11/12/2027 | | 04/30/2021 | | | 1,789,502 | | | | 1,802,833 | | | | 0.27 | % | |
Cimpress Public Ltd.,
1M USD LIBOR + 3.500% —
4.000% 5/17/2028 | | 04/30/2021 | | | 1,201,823 | | | | 1,211,389 | | | | 0.18 | % | |
Copper Earn Out Trust | | 12/07/2020 | | | — | | | | 91,685 | | | | 0.01 | % | |
Copper Property CTL Pass
Through Trust
| | 01/17/2019, 02/08/2019,
03/11/2019, 06/08/2020,
07/10/2020 | | | 939,850 | | | | 1,375,220 | | | | 0.21 | % | |
Emerald Topco, Inc.,
1M USD LIBOR + 3.500% —
0.000% 7/24/2026 | | 09/20/2021, 12/02/2021 | | | 2,089,856 | | | | 2,090,739 | | | | 0.31 | % | |
38
FPA FLEXIBLE FIXED INCOME FUND
PORTFOLIO OF INVESTMENTS — RESTRICTED SECURITIES (Continued)
December 31, 2021
Issuer | | Acquisition
Date(s) | | Cost | | Fair Value | | Fair
Value as a %
of Net Assets | |
Frontier Communications Corp.,
3M USD LIBOR + 3.750% —
4.500% 5/1/2028 | | 04/09/2021 | | $ | 1,108,285 | | | $ | 1,116,456 | | | | 0.17 | % | |
GHX Ultimate Parent Corp.,
3M USD LIBOR + 3.250% —
4.250% 6/28/2024
| | 05/20/2021, 07/23/2021,
08/05/2021, 08/17/2021,
12/02/2021 | | | 3,116,864 | | | | 3,116,281 | | | | 0.47 | % | |
Hanjin International Corp.,
3M USD LIBOR + 5.000% —
5.500% 12/23/2022 | | 12/23/2020, 02/25/2021 | | | 1,622,838 | | | | 1,633,101 | | | | 0.25 | % | |
Heartland Dental LLC,
1M USD LIBOR + 4.000% —
4.104% 4/30/2025
| | 06/10/2021, 08/02/2021,
08/03/2021, 08/12/2021,
12/02/2021 | | | 3,122,759 | | | | 3,131,693 | | | | 0.47 | % | |
JC Penney Corp., Inc.,
3M USD LIBOR + 4.250% —
5.250% 6/23/2023 | | 02/03/2021 | | | — | | | | 48 | | | | 0.00 | % | |
McDermott Super Senior
Exit LC — 0.500% 6/30/2024 | | 02/28/2020 | | | (3,763 | ) | | | (144,000 | ) | | | (0.02 | )% | |
Mediaco Holding, Inc.
Class A
8.400%, PIK — 1.000%
11/25/2024
| | 06/01/2021, 07/01/2021,
08/01/2021, 09/01/2021,
10/01/2021, 11/01/2021,
12/01/2021 | | | 1,162,173 | | | | 1,087,646 | | | | 0.16 | % | |
PHI Group, Inc. | | 08/19/2019 | | | 188,003 | | | | 364,354 | | | | 0.06 | % | |
PHI Group, Inc., Restricted | | 08/19/2019 | | | 427,782 | | | | 787,614 | | | | 0.12 | % | |
Packers Holdings LLC,
6M USD LIBOR + 3.250% —
4.000% 3/9/2028
| | 04/16/2021, 08/03/2021,
12/02/2021 | | | 2,084,189 | | | | 2,080,847 | | | | 0.31 | % | |
PetVet Care Centers LLC,
1M USD LIBOR + 3.500% —
4.250% 2/14/2025 | | 11/22/2021 | | | 1,155,191 | | | | 1,156,591 | | | | 0.17 | % | |
Polaris Newco, LLC Term Loan B,
3M USD LIBOR + 4.000% —
4.500% 6/2/2028
| | 06/03/2021, 07/30/2021,
12/02/2021 | | | 2,072,650 | | | | 2,076,504 | | | | 0.31 | % | |
39
FPA CRESCENT FUND
PORTFOLIO OF INVESTMENTS — RESTRICTED SECURITIES (Continued)
December 31, 2021
Issuer | | Acquisition
Date(s) | | Cost | | Fair Value | | Fair
Value as a %
of Net Assets | |
Polyconcept North America
Holdings, Inc., 6M USD LIBOR +
4.500% — 5.500% 8/16/2023 | | 11/18/2019 | | $ | 743,812 | | | $ | 743,432 | | | | 0.11 | % | |
Windstream Holdings, Inc. | | 11/16/2020 | | | 372,781 | | | | 163,241 | | | | 0.02 | % | |
Windstream Services LLC,
1M USD LIBOR + 6.250% —
7.250% 9/21/2027 | | 08/11/2020 | | | 809,718 | | | | 839,254 | | | | 0.13 | % | |
TOTAL RESTRICTED
SECURITIES | | | | $ | 36,922,300 | | | $ | 37,661,699 | | | | 5.65 | % | |
See accompanying Notes to Financial Statements.
40
FPA FLEXIBLE FIXED INCOME FUND
STATEMENT OF ASSETS AND LIABILITIES
December 31, 2021
ASSETS | |
Investment securities — at fair value (identified cost $657,682,420) | | $ | 658,147,217 | | |
Short-term investments — repurchase agreements | | | 10,069,000 | | |
Cash | | | 34,143 | | |
Receivable for: | |
Capital Stock sold | | | 5,017,979 | | |
Dividends and interest | | | 1,663,301 | | |
Prepaid expenses and other assets | | | 15,573 | | |
Total assets | | | 674,947,213 | | |
LIABILITIES | |
Payable for: | |
Investment securities purchased | | | 7,134,218 | | |
Capital Stock repurchased | | | 663,751 | | |
Advisory fees | | | 83,942 | | |
Accrued expenses and other liabilities | | | 247,228 | | |
Total liabilities | | | 8,129,139 | | |
NET ASSETS | | $ | 666,818,074 | | |
SUMMARY OF SHAREHOLDERS' EQUITY | |
Capital Stock — no par value; unlimited authorized shares;
65,148,058 outstanding shares | | $ | 65,148,058 | | |
Additional Paid-in Capital | | | 600,988,161 | | |
Distributable earnings | | | 681,855 | | |
NET ASSETS | | $ | 666,818,074 | | |
Advisor class: | |
Net Assets | | $ | 31,743 | | |
Shares outstanding, no par value; unlimited authorized shares | | | 3,101 | | |
Offering and redemption price per share | | $ | 10.24 | | |
Institutional Class: | |
Net Assets | | $ | 666,786,331 | | |
Shares outstanding, no par value; unlimited authorized shares | | | 65,144,957 | | |
Offering and redemption price per share | | $ | 10.24 | | |
See accompanying Notes to Financial Statements.
41
FPA FLEXIBLE FIXED INCOME FUND
STATEMENT OF OPERATIONS
For the Year Ended December 31, 2021
INVESTMENT INCOME | |
Dividends | | $ | 455,567 | | |
Interest | | | 11,254,490 | | |
Total investment income | | | 11,710,057 | | |
EXPENSES | |
Advisory fees | | | 2,431,180 | | |
Transfer agent fees and expenses | | | 363,481 | | |
Filing fees | | | 174,184 | | |
Legal fees | | | 147,458 | | |
Trustee fees and expenses | | | 122,957 | | |
Custodian fees | | | 86,070 | | |
Reports to shareholders | | | 70,842 | | |
Audit and tax services fees | | | 38,500 | | |
Administrative services fees — Institutional Class | | | 19,532 | | |
Other professional fees | | | 10,202 | | |
Total expenses | | | 3,464,406 | | |
Reimbursement from Adviser | | | (1,079,162 | ) | |
Net expenses | | | 2,385,244 | | |
Net investment income | | | 9,324,813 | | |
NET REALIZED AND UNREALIZED GAIN (LOSS) | |
Net realized gain (loss) on: | |
Investments | | | 1,762,341 | | |
Net change in unrealized appreciation (depreciation) of: | |
Investments | | | (3,618,685 | ) | |
Net realized and unrealized loss | | | (1,856,344 | ) | |
NET INCREASE IN NET ASSETS RESULTING FROM OPERATIONS | | $ | 7,468,469 | | |
See accompanying Notes to Financial Statements.
42
FPA FLEXIBLE FIXED INCOME FUND
STATEMENTS OF CHANGES IN NET ASSETS
| | | Year Ended
December 31, 2021 | | Year Ended
December 31, 2020 | |
INCREASE (DECREASE) IN NET ASSETS | |
Operations: | |
Net investment income | | $ | 9,324,813 | | | $ | 5,769,444 | | |
Net realized gain | | | 1,762,341 | | | | 1,895,677 | | |
Net change in unrealized appreciation (depreciation) | | | (3,618,685 | ) | | | 3,305,098 | | |
Net increase in net assets resulting from operations | | | 7,468,469 | | | | 10,970,219 | | |
Distributions to shareholders — Advisor Class(a) | | | (516 | ) | | | — | | |
Distributions to shareholders — Institutional Class | | | (11,361,830 | ) | | | (7,145,741 | ) | |
Total distributions to shareholders | | | (11,362,346 | ) | | | (7,145,741 | ) | |
Capital Stock transactions:(b) | |
Proceeds from Capital Stock sold | | | 418,144,557 | | | | 244,623,377 | | |
Proceeds from shares issued to shareholders upon reinvestment of
dividends and distributions | | | 9,322,247 | | | | 5,929,562 | | |
Cost of Capital Stock repurchased | | | (89,131,463 | ) | | | (62,090,169 | ) | |
Net increase from Capital Stock transactions | | | 338,335,341 | | | | 188,462,770 | | |
Total change in net assets | | | 334,441,464 | | | | 192,287,248 | | |
NET ASSETS | |
Beginning of Year | | | 332,376,610 | | | | 140,089,362 | | |
End of Year | | $ | 666,818,074 | | | $ | 332,376,610 | | |
(a) Period from April 16, 2021, date operations commenced, through December 31, 2021.
(b) See Note 7, Capital Stock, in the Notes to Financial Statements.
See accompanying Notes to Financial Statements.
43
FPA FLEXIBLE FIXED INCOME FUND
FINANCIAL HIGHLIGHTS
Selected Data for Each Share of Capital Stock Outstanding Throughout Each Year
| | | Period from
April 16,
through
December 31
2021 | |
Advisor Class | |
Per share operating performance: | |
Net asset value at beginning of period | | $ | 10.32 | | |
Income from investment operations: | |
Net investment income(a) | | | 0.13 | | |
Net realized and unrealized gain (loss) on investment securities | | | (0.05 | ) | |
Total from investment operations | | | 0.08 | | |
Less distributions: | |
Dividends from net investment income | | | (0.13 | ) | |
Distributions from net realized capital gains | | | (0.03 | ) | |
Total distributions | | | (0.16 | ) | |
Net asset value at end of period | | $ | 10.24 | | |
Total investment return(b) | | | 0.85 | % | |
Ratios/supplemental data: | |
Net assets, end of period (in $000's) | | $ | 32 | | |
Ratio of expenses to average net assets: | |
Before reimbursement from Adviser | | | 3.06 | %† | |
After reimbursement from Adviser | | | 0.59 | %† | |
Ratio of net investment income to average net assets: | |
Before reimbursement from Adviser | | | (0.69 | )%† | |
After reimbursement from Adviser | | | 1.79 | %† | |
Portfolio turnover rate | | | 35 | % | |
(a) Per share amount is based on average shares outstanding.
(b) Return is based on net asset value per share, adjusted for reinvestment of distributions, and does not reflect deduction of the sales charge.
† Annualized
See accompanying Notes to Financial Statements.
44
FPA FLEXIBLE FIXED INCOME FUND
FINANCIAL HIGHLIGHTS
Selected Data for Each Share of Capital Stock Outstanding Throughout Each Year
| | | Year Ended December 31 | |
| | | 2021 | | 2020 | | 2019 | |
Institutional Class | |
Per share operating performance: | |
Net asset value at beginning of year | | $ | 10.29 | | | $ | 10.13 | | | $ | 10.00 | | |
Income from investment operations: | |
Net investment income(a) | | | 0.20 | | | | 0.27 | | | | 0.28 | | |
Net realized and unrealized gain (loss) on investment securities | | | (0.02 | ) | | | 0.20 | | | | 0.10 | | |
Total from investment operations | | | 0.18 | | | | 0.47 | | | | 0.38 | | |
Less distributions: | |
Dividends from net investment income | | | (0.20 | ) | | | (0.27 | ) | | | (0.25 | ) | |
Distributions from net realized capital gains | | | (0.03 | ) | | | (0.04 | ) | | | — | | |
Total distributions | | | (0.23 | ) | | | (0.31 | ) | | | (0.25 | ) | |
Net asset value at end of year | | $ | 10.24 | | | $ | 10.29 | | | $ | 10.13 | | |
Total investment return(b) | | | 1.77 | % | | | 4.70 | % | | | 3.78 | % | |
Ratios/supplemental data: | |
Net assets, end of year (000's) | | $ | 666,786 | | | $ | 332,377 | | | $ | 140,089 | | |
Ratio of expenses to average net assets: | |
Before reimbursement from Adviser | | | 0.71 | % | | | 0.77 | % | | | 1.01 | % | |
After reimbursement from Adviser | | | 0.49 | % | | | 0.39 | % | | | 0.39 | % | |
Ratio of net investment income to average net assets: | |
Before reimbursement from Adviser | | | 1.69 | % | | | 2.25 | % | | | 2.11 | % | |
After reimbursement from Adviser | | | 1.91 | % | | | 2.63 | % | | | 2.74 | % | |
Portfolio turnover rate | | | 35 | % | | | 39 | % | | | 30 | % | |
(a) Per share amount is based on average shares outstanding.
(b) Return is based on net asset value per share, adjusted for reinvestment of distributions, and does not reflect deduction of the sales charge.
See accompanying Notes to Financial Statements.
45
FPA FLEXIBLE FIXED INCOME FUND
NOTES TO FINANCIAL STATEMENTS
December 31, 2021
NOTE 1 — Significant Accounting Policies
FPA Flexible Fixed Income Fund (the "Fund") is registered under the Investment Company Act of 1940, as a diversified, open-end, management investment company. The Fund's primary investment objective is to seek current income and long-term total return. Capital preservation is also a consideration. The Fund qualifies as an investment company pursuant to Financial Accounting Standard Board (FASB) Accounting Standards Codification (ASC) No. 946, Financial Services — Investment Companies. The following is a summary of significant accounting policies consistently followed by the Fund in the preparation of its financial statements.
Effective April 16, 2021, the Advisor class commenced operations and was funded by the Institutional class.
A. Security Valuation
The Fund's investments are reported at fair value as defined by accounting principles generally accepted in the United States of America, ("U.S. GAAP"). The Fund generally determines its net asset value as of approximately 4:00 p.m. New York time each day the New York Stock Exchange is open. Further discussion of valuation methods, inputs and classifications can be found under Disclosure of Fair Value Measurements.
B. Securities Transactions and Related Investment Income
Securities transactions are accounted for on the date the securities are purchased or sold. Dividend income and distributions to shareholders are recorded on the ex-dividend date. Interest income and expenses are recorded on an accrual basis. Market discounts and premiums on fixed income securities are amortized over the expected life of the securities using effective interest rate method. Realized gains or losses are based on the specific identification method.
C. Use of Estimates
The preparation of the financial statements in accordance with U.S. GAAP requires management to make estimates and assumptions that affect the amounts reported. Actual results could differ from those estimates.
D. Recent Accounting Pronouncements
In March 2020, the FASB issued ASU 2020-04, Reference Rate Reform (Topic 848) Facilitation of the Effects of Reference Rate Reform on Financial Reporting, which provides optional expedients and exceptions for applying U.S. GAAP to contracts, hedging relationships, and other transaction to ease the potential burden in accounting for (or recognizing the effects of) reference rate reform on financial reporting if certain criteria are met. The guidance is effective from March 12, 2020 through December 31, 2022. The Adviser is currently evaluating the impact of this new guidance on the Fund's financial statements.
NOTE 2 — Risk Considerations
Investing in the Fund may involve certain risks including, but not limited to, those described below.
Market Risk: Because the values of the Fund's investments will fluctuate with market conditions, so will the value of your investment in the Fund. You could lose money on your investment in the Fund or the Fund could underperform other investments.
Interest Rate and Credit Risk: The values of, and the income generated by, most debt securities held by the Fund may be affected by changing interest rates and by changes in the effective maturities and credit rating of these securities. For example, the value of debt securities in the Fund's portfolio generally will decline when interest rates rise and increase when interest rates fall. In addition, falling interest rates may cause an issuer to
46
FPA FLEXIBLE FIXED INCOME FUND
NOTES TO FINANCIAL STATEMENTS (Continued)
redeem, call or refinance a security before its stated maturity, which may result in the Fund having to reinvest the proceeds in lower yielding securities.
Mortgage-Backed and Other Asset-Backed Securities Risk: The values of some mortgage-backed and other asset-backed securities may expose the Fund to a lower rate of return upon reinvestment of principal. When interest rates rise, the value of mortgage-related securities generally will decline; however, when interest rates are declining, the value of mortgage related-securities with prepayment features may not increase as much as other fixed income securities. The rate of prepayments on underlying mortgages will affect the price and volatility of a mortgage-related security, and may shorten or extend the effective maturity of the security beyond what was anticipated at the time of purchase. If an unanticipated rate of prepayment on underlying mortgages increases the effective maturity of a mortgage-related security, the volatility of the security can be expected to increase. The value of these securities may also fluctuate in response to the market's perception of the creditworthiness of the issuers. Additionally, although mortgages and mortgage-related securities are generally supported by some form of government or private guarantee and/or insurance, there is no assurance that private guarantors or insurers will meet their obligations.
Stripped Mortgage-Backed Interest Only ("I/O") and Principal Only ("P/O") Securities: Stripped mortgage backed securities are usually structured with two classes that receive different proportions of the interest and principal distributions on a pool of mortgage assets. In certain cases, one class will receive all of the interest payments on the underlying mortgages (the I/O class), while the other class will receive all of the principal payments (the P/O class). The Fund currently has investments in I/O securities. The yield to maturity on I/Os is sensitive to the rate of principal repayments (including prepayments) on the related underlying mortgage assets, and principal payments may have a material effect on yield-to-maturity. If the underlying mortgage assets experience greater than anticipated prepayments of principal, a Fund may not fully recoup its initial investment in I/Os.
Credit Risk: Debt securities are subject to credit risk, meaning that the issuer of the debt security may default or fail to make timely payments of principal or interest. The values of any of the Fund's investments may also decline in response to events affecting the issuer or its credit rating. The lower rated debt securities in which the Fund may invest are considered speculative and are generally subject to greater volatility and risk of loss than investment grade securities, particularly in deteriorating economic conditions. The Fund invests a significant portion of its assets in securities of issuers that hold mortgage-and asset-backed securities and direct investments in securities backed by commercial and residential mortgage loans and other financial assets. The value and related income of these securities is sensitive to changes in economic conditions, including delinquencies and/or defaults. Continuing shifts in the market's perception of credit quality on securities backed by commercial and residential mortgage loans and other financial assets may result in increased volatility of market price and periods of illiquidity that can negatively impact the valuation of certain securities held by the Fund.
Repurchase Agreements: Repurchase agreements permit the Fund to maintain liquidity and earn income over periods of time as short as overnight. Repurchase agreements held by the Fund are fully collateralized by U.S. Government securities, or securities issued by U.S. Government agencies, or securities that are within the three highest credit categories assigned by established rating agencies (Aaa, Aa, or A by Moody's or AAA, AA or A by Standard & Poor's) or, if not rated by Moody's or Standard & Poor's, are of equivalent investment quality as determined by the Adviser. Such collateral is in the possession of the Fund's custodian. The collateral is evaluated daily to ensure its fair value equals or exceeds the current fair value of the repurchase agreements
47
FPA FLEXIBLE FIXED INCOME FUND
NOTES TO FINANCIAL STATEMENTS (Continued)
including accrued interest. In the event of default on the obligation to repurchase, the Fund has the right to liquidate the collateral and apply the proceeds in satisfaction of the obligation.
The Fund may enter into repurchase agreements, under the terms of a Master Repurchase Agreement ("MRA"). The MRA permits the Fund, under certain circumstances including an event of default (such as bankruptcy or insolvency), to offset payables and/or receivables under the MRA with collateral held and/or posted to the counterparty and create one single net payment due to or from the Fund. However, bankruptcy or insolvency laws of a particular jurisdiction may impose restrictions on or prohibitions against such a right of offset in the event of a MRA counterparty's bankruptcy or insolvency. Pursuant to the terms of the MRA, the Fund receives securities as collateral with a fair value in excess of the repurchase price to be received by the Fund upon the maturity of the repurchase transaction. Upon a bankruptcy or insolvency of the MRA counterparty, the Fund recognizes a liability with respect to such excess collateral to reflect the Fund's obligation under bankruptcy law to return the excess to the counterparty. Repurchase agreements outstanding at the end of the period are listed in the Fund's Portfolio of Investments.
Many countries have experienced outbreaks of infectious illnesses in recent decades, including swine flu, avian influenza, SARS and, more recently, COVID-19. The global outbreak of COVID-19 in early 2020 has resulted in various disruptions, including travel and border restrictions, quarantines, supply chain disruptions, lower consumer demand and general market uncertainty. The full effects, duration and costs of the COVID-19 pandemic are impossible to predict, and the circumstances surrounding the COVID-19 pandemic will continue to evolve, including the risk of future increased rates of infection due to low vaccination rates and/or the lack of effectiveness of current vaccines against new variants. Similar consequences could arise as a result of the spread of other infectious diseases. Management will continue to monitor the impact COVID-19 has on the Fund and reflect the consequences as appropriate in the Fund's accounting and financial reporting.
NOTE 3 — Purchases and Sales of Investment Securities
Cost of purchases of investment securities (excluding short-term investments) aggregated $504,819,161 for the year ended December 31, 2021. The proceeds and cost of securities sold resulting in net realized gains of $1,762,341 aggregated $154,429,430 and $152,667,089, respectively, for the year ended December 31, 2021.
NOTE 4 — Advisory Fees and Other Affiliated Transactions
Pursuant to an Investment Advisory Agreement (the "Agreement"), advisory fees were paid by the Fund to First Pacific Advisors, LP (the "Adviser"). Under the terms of this Agreement, the Fund pays the Adviser a monthly fee calculated at the annual rate of 0.50% of the Fund's average daily net assets. In addition, the Adviser has contractually agreed to reimburse the Fund for Total Annual Fund Operating Expenses (excluding interest, taxes, brokerage fees and commissions payable by the Fund in connection with the purchase or sale of portfolio securities, redemption liquidity service expenses, and extraordinary expenses, including litigation expenses not incurred in the Fund's ordinary course of business) in 0.59% of the average net assets of the Fund attributable to the Advisor Class and excess of 0.49% of the average net assets of the Fund attributable to the Institutional Class for the period ending April 30, 2022, and in excess of 0.69% of the average the net assets of the Fund attributable to the Advisor Class and 0.59% of the average net assets of the Fund attributable to the Institutional Class for the one-year period ending April 30, 2023. During the term of the current expense limit agreement, beginning April 16, 2021 and ending April 30, 2023, any expenses reimbursed to the Fund by the Adviser during any of the previous 36 months may be recouped by the Adviser, provided the Fund's Total Annual Fund Operating Expenses do not exceed the then-applicable expense limit. Beginning May 1, 2023, any expenses reimbursed to
48
FPA FLEXIBLE FIXED INCOME FUND
NOTES TO FINANCIAL STATEMENTS (Continued)
the Fund by the Adviser during any of the previous 36 months may be recouped by the Adviser, provided the Fund's Total Annual Fund Operating Expenses do not exceed 0.74% of the average net assets of the Fund attributable to the Advisor Class and 0.64% of the average net assets of the Fund attributable to the Institutional Class for any subsequent calendar year, regardless of whether there is a then-effective higher expense limit. This agreement may only be terminated earlier by the Fund's Board of Trustees (the "Board") or upon termination of the Agreement. As of December 31, 2021, the Adviser may seek recoupment of expense reimbursements in the amounts of $825,067 and $1,079,162 no later than December 31, 2023 and December 31, 2024, respectively.
For the year ended December 31, 2021, the Fund paid aggregate fees and expenses of $122,957 to all Trustees who are not affiliated persons of the Adviser. Certain officers of the Fund are also officers of the Adviser.
NOTE 5 — Federal Income Tax
No provision for federal income tax is required because the Fund has elected to be taxed as a "regulated investment company" under the Internal Revenue Code (the "Code") and intends to maintain this qualification and to distribute each year to its shareholders, in accordance with the minimum distribution requirements of the Code, its taxable net investment income and taxable net realized gains on investments.
Distributions paid to shareholders are based on net investment income and net realized gains determined on a tax reporting basis, which may differ from financial reporting. For federal income tax purposes, the Fund had the following components of distributable earnings at December 31, 2021:
Unrealized appreciation | | $ | 464,134 | | |
Undistributed ordinary income | | | 24,916 | | |
Undistributed Capital Gains | | | 192,804 | | |
The tax status of distributions paid during the fiscal years ended December 31, 2021 and 2020 were as follows:
| | | 2021 | | 2020 | |
Dividends from ordinary income | | $ | 10,836,332 | | | $ | 6,890,731 | | |
Distributions from long-term capital gains | | | 526,014 | | | | 255,010 | | |
The Fund utilizes the provisions of federal income tax laws that provide for the carryforward of capital losses for prior years, offsetting such losses against any future realized capital gains. The Fund did not generate or utilize capital losses during the current tax year.
The cost of investment securities held at December 31, 2021 was $667,752,083 for federal income tax purposes. Gross unrealized appreciation and depreciation for all investment at December 31, 2021, for federal income tax purposes was $3,010,338 and $2,546,204, respectively resulting in net unrealized appreciation of $464,134. As of and during the year ended December 31, 2021, the Fund did not have any liability for unrecognized tax benefits.
The Fund recognizes interest and penalties, if any, related to unrecognized tax benefits as income tax expense in the Statement of Operations. During the year, the Fund did not incur any interest or penalties. The statute of limitations remains open for the last 3 years, once a return is filed. No examinations are in progress at this time.
49
FPA FLEXIBLE FIXED INCOME FUND
NOTES TO FINANCIAL STATEMENTS (Continued)
NOTE 6 — Disclosure of Fair Value Measurements
The Fund uses the following methods and inputs to establish the fair value of its assets and liabilities. Use of particular methods and inputs may vary over time based on availability and relevance as market and economic conditions evolve.
Equity securities are generally valued each day at the official closing price of, or the last reported sale price on, the exchange or market on which such securities principally are traded, as of the close of business on that day.
If there have been no sales that day, equity securities are generally valued at the last available bid price. Securities that are unlisted and fixed-income and convertible securities listed on a national securities exchange for which the over-the-counter ("OTC") market more accurately reflects the securities' value in the judgment of the Fund's officers, are valued at the most recent bid price. However, most fixed income securities are generally valued at prices obtained from pricing vendors and brokers. Vendors value such securities based on one or more of the following inputs: transactions, bids, offers quotations from dealers and trading systems, spreads and other relationships observed in the markets among comparable securities, benchmarks, underlying equity of the issuer, and proprietary pricing models such as cash flows, financial or collateral performance and other reference data (includes prepayments, defaults, collateral, credit enhancements, and interest rate volatility). Short-term corporate notes with maturities of 60 days or less at the time of purchase are valued at amortized cost.
Securities for which representative market quotations are not readily available or are considered unreliable by the Adviser are valued as determined in good faith under procedures adopted by the authority of the Fund's Board of Trustees. Various inputs may be reviewed in order to make a good faith determination of a security's value. These inputs include, but are not limited to, the type and cost of the security; contractual or legal restrictions on resale of the security; relevant financial or business developments of the issuer; actively traded similar or related securities; conversion or exchange rights on the security; related corporate actions; significant events occurring after the close of trading in the security; and changes in overall market conditions. Fair valuations and valuations of investments that are not actively trading involve judgment and may differ materially from valuations of investments that would have been used had greater market activity occurred.
The Fund classifies its assets based on three valuation methodologies. Level 1 values are based on quoted market prices in active markets for identical assets. Level 2 values are based on significant observable market inputs, such as quoted prices for similar assets and quoted prices in inactive markets or other market observable inputs as noted above including spreads, cash flows, financial performance, prepayments, defaults, collateral, credit enhancements, and interest rate volatility. Level 3 values are based on significant unobservable inputs that reflect the Fund's determination of assumptions that market participants might reasonably use in valuing the assets. The valuation levels are not necessarily an indication of the risk associated with investing in those securities.
50
FPA FLEXIBLE FIXED INCOME FUND
NOTES TO FINANCIAL STATEMENTS (Continued)
The following table presents the valuation levels of the Fund's investments as of December 31, 2021: (see Portfolio of Investments for industry categories):
Investments | | Level 1 | | Level 2 | | Level 3 | | Total | |
Common Stocks | |
Retailing | | | — | | | | — | | | $ | 1,466,905 | | | $ | 1,466,905 | | |
Energy | | | — | | | | — | | | | 1,151,968 | | | | 1,151,968 | | |
Rights | |
Midstream — Oil & Gas | | | — | | | | — | | | | 163,241 | | | | 163,241 | | |
Commercial Mortgage-Backed Securities | |
Agency | | | — | | | $ | 144,574 | | | | — | | | | 144,574 | | |
Agency Stripped | | | — | | | | 1,255,393 | | | | — | | | | 1,255,393 | | |
Non-Agency | | | — | | | | 58,330,752 | | | | — | | | | 58,330,752 | | |
Residential Mortgage-Backed Securities | |
Agency Collateralized Mortgage Obligation | | | — | | | | 2,366,994 | | | | — | | | | 2,366,994 | | |
Agency Pool Fixed Rate | | | — | | | | 201,485 | | | | — | | | | 201,485 | | |
Agency Stripped | | | — | | | | 145,652 | | | | — | | | | 145,652 | | |
Non-Agency Collateralized Mortgage
Obligation | | | — | | | | 41,472,618 | | | | 5,427,136 | | | | 46,899,754 | | |
Asset-Backed Securities | |
Auto | | | — | | | | 136,314,398 | | | | — | | | | 136,314,398 | | |
Collateralized Loan Obligation | | | — | | | | 127,432,301 | | | | 2,720,980 | | | | 130,153,281 | | |
Credit Card | | | — | | | | 6,241,398 | | | | — | | | | 6,241,398 | | |
Equipment | | | — | | | | 62,930,019 | | | | — | | | | 62,930,019 | | |
Other | | | — | | | | 97,979,940 | | | | — | | | | 97,979,940 | | |
Corporate Bonds & Notes | | | — | | | | 11,091,442 | | | | — | | | | 11,091,442 | | |
Corporate Bank Debt | | | — | | | | 31,057,804 | | | | 1,100,801 | | | | 32,158,605 | | |
U.S. Treasuries | | | — | | | | 69,151,416 | | | | — | | | | 69,151,416 | | |
Short-Term Investment | | | — | | | | 10,069,000 | | | | — | | | | 10,069,000 | | |
| | | | — | | | $ | 656,185,186 | | | $ | 12,031,031 | | | $ | 668,216,217 | | |
51
FPA FLEXIBLE FIXED INCOME FUND
NOTES TO FINANCIAL STATEMENTS (Continued)
The following table summarizes the Fund's Level 3 investment securities and related transactions during the year ended December 31, 2021:
Investments | | Beginning
Value at
December 31,
2020 | | Net
Realized
and
Unrealized
Gains
(Losses)* | | Purchases | | (Sales) | | Gross
Transfers
In/(Out) | | Ending
Value at
December 31,
2021 | | Net Change
in Unrealized
Appreciation
(Depreciation)
related to
Investments
held at
December 31,
2021 | |
Common Stocks | | $ | 46,818 | | | $ | 480,237 | | | $ | 939,850 | | | | — | | | $ | 1,151,968 | | | $ | 2,618,873 | | | $ | 480,237 | | |
Rights | | | 123,838 | | | | 39,403 | | | | — | | | | — | | | | — | | | | 163,241 | | | | 39,403 | | |
Residential Mortgage-Backed
Securities Non-Agency
Collateralized Mortgage
Obligation | | | 756,323 | | | | (8,995 | ) | | | 5,444,994 | | | $ | (329,260 | ) | | | (435,926 | ) | | | 5,427,136 | | | | (8,916 | ) | |
Asset-Backed Securities
Collateralized Loan
Obligation | | | — | | | | — | | | | 3,200,000 | | | | (479,020 | ) | | | — | | | | 2,720,980 | | | | — | | |
Corporate Bank Debt | | | 2,746,622 | | | | (60,007 | ) | | | 714,177 | | | | (170,890 | ) | | | (2,129,101 | ) | | | 1,100,801 | | | | 5,803 | | |
| | | $ | 3,673,601 | | | $ | 450,638 | | | $ | 10,299,021 | | | $ | (979,170 | ) | | $ | (1,413,059 | ) | | $ | 12,031,031 | | | $ | 516,527 | | |
* Net realized and unrealized gains (losses) are included in the related amounts in the statement of operations.
Transfers of investments between different levels of the fair value hierarchy are recorded at fair value as of the end of the reporting period. There were transfers of $2,565,027 out of Level 3 into Level 2 and $1,151,968 out of Level 1 into Level 3 during the year ended December 31, 2021. Transfers out of Level 3 were due to change in valuation technique from recent trade activity to vendor priced. Transfers into Level 3 were due to change in valuation technique from vendor priced to third party broker quoted.
The following table summarizes the quantitative inputs and assumptions used for items categorized as Level 3 of the fair value hierarchy as of December 31, 2021:
Financial Assets | | Fair Value at
December 31, 2021 | | Valuation Technique(s) | | Unobservable
Inputs | | Price/Range | | Weighted
Average
Price | |
Common Stocks | | $ | 1,466,905 | | | Pricing Model(a) | | Quotes/Prices | | $ | 11.75-$23.50 | | | $ | 22.77 | | |
| | $ | 1,151,968 | | | Pricing Model(b) | | Executed Trades | | $ | 15.30 | | | $ | 15.30 | | |
Rights | | $ | 163,241 | | | Pricing Model(a) | | Quotes/Prices | | $ | 14.50 | | | $ | 14.50 | | |
Residential Mortgage-Backed
Securities Non-Agency
Collateralized Mortgage
Obligation | | $ | 5,427,136 | | | Third-Party Broker Quote(c) | | Quotes/Prices | | $ | 99.73-$100.00 | | | $ | 99.84 | | |
52
FPA FLEXIBLE FIXED INCOME FUND
NOTES TO FINANCIAL STATEMENTS (Continued)
| Financial Assets | | Fair Value at
December 31, 2021 | | Valuation Technique(s) | | Unobservable
Inputs | | Price/Range | | Weighted
Average
Price | |
Asset-Backed Securities
Collateralized Loan
Obligation | | $ | 2,720,980 | | | Third-Party Broker Quote(c) | | Quotes/Prices | | $ | 100.00 | | | $ | 100.00 | | |
Corporate Bank Debt | | $ | 1,100,801 | | | Pricing Model(d) | | Discounts | | | 9.60 | %-14.20% | | | 14.12 | % | |
(a) The Pricing Model technique for Level 3 securities involves recently quoted funding prices of the security.
(b) The Pricing Model technique for Level 3 securities involves the last executed trade in the security
(c) The Third Party Broker Quote technique involves obtaining an independent third-party broker quote for the security.
(d) The Pricing Model technique for Level 3 securities involves external valuation by an independent third party who utilized a discounted cash flow model.
NOTE 7 — Capital Stock
| | | Year Ended
December 31, 2021 | | Year Ended
December 31, 2020 | |
| | | Shares | | Amount | | Shares | | Amount | |
Capital Stock sold | |
Advisor Class(a) | | | 3,051 | | | $ | 31,486 | | | | N/A | | | | N/A | | |
Institutional Class | | | 40,588,638 | | | | 418,113,071 | | | | 23,989,390 | | | $ | 244,623,377 | | |
Issued to shareholders upon
reinvestment of dividends and
distributions | |
Advisor Class(a) | | | 50 | | | | 516 | | | | N/A | | | | N/A | | |
Institutional Class | | | 906,445 | | | | 9,321,731 | | | | 580,866 | | | | 5,929,562 | | |
Capital Stock repurchased | |
Advisor Class(a) | | | — | | | | — | | | | N/A | | | | N/A | | |
Institutional Class | | | (8,664,119 | ) | | | (89,131,463 | ) | | | (6,090,039 | ) | | | (62,090,169 | ) | |
Change in Capital Stock outstanding | | | 32,834,065 | | | $ | 338,335,341 | | | | 18,480,217 | | | $ | 188,462,770 | | |
(a) Period from April 16, 2021, date operations commenced, through December 31, 2021.
NOTE 8 — Collateral Requirements
FASB Accounting Standards Update No. 2011-11, Disclosures about Offsetting Assets and Liabilities, requires disclosures to make financial statements that are prepared under U.S. GAAP more comparable to those prepared under International Financial Reporting Standards. Under this guidance the Fund discloses both gross and net information about instruments and transactions eligible for offset such as instruments and transactions subject to an agreement similar to a master netting arrangement. In addition, the Fund discloses collateral received and posted in connection with master netting agreements or similar arrangements.
53
FPA FLEXIBLE FIXED INCOME FUND
NOTES TO FINANCIAL STATEMENTS (Continued)
The following table presents the Fund's OTC derivative assets, liabilities and master repurchase agreements by counterparty net of amounts available for offset under an ISDA Master agreement or similar agreements and net of the related collateral received or pledged by the Fund as of December 31, 2021:
| | | | | Gross Amounts Not Offset in the
Statement of Assets and Liabilities | | | |
Counterparty | | Gross Assets
(Liabilities)
in the Statement of
Assets and Liabilities | | Security
Collateral
Received
(Pledged) | | Assets (Liabilities)
Available for Offset | | Net Amount
of Assets
(Liabilities)(a) | |
State Street Bank and
Trust Company: | |
Repurchase Agreement | | $ | 10,069,000 | | | $ | (10,069,000 | )(b) | | | — | | | | — | | |
(a) Represents the net amount receivable from the counterparty in the event of default.
(b) Collateral with a value of $10,270,438 has been received in connection with a master repurchase agreement. Excess of collateral received from the individual master repurchase agreement is not shown for financial reporting purposes.
NOTE 9 — Commitments
As of December 31, 2021 the Fund was liable for the following unfunded commitments:
Asset Class | | Unfunded
Commitment | |
Corporate Bank Debt | | $ | 1,788,141 | | |
54
FPA FLEXIBLE FIXED INCOME FUND
REPORT OF INDEPENDENT REGISTERED
PUBLIC ACCOUNTING FIRM
TO THE SHAREHOLDERS AND
BOARD OF TRUSTEES OF FPA FLEXIBLE FIXED INCOME FUND
Opinion on the Financial Statements
We have audited the accompanying statement of assets and liabilities of FPA Flexible Fixed Income Fund (the "Fund") (one of the funds constituting the FPA Funds Trust (the "Trust")), including the portfolio of investments, as of December 31, 2021, the related statement of operations for the year then ended, the statement of changes in net assets for each of the two years in the period then ended, and the financial highlights for each of the three years in the period then ended, and the related notes (collectively referred to as the "financial statements"). In our opinion, the financial statements present fairly, in all material respects, the financial position of the Fund (one of the funds constituting the FPA Funds Trust) at December 31, 2021, the results of its operations for the year then ended, and the changes in its net assets for each of the two years in the period then ended and its financial highlights for each of the three years in the period then ended, in conformity with U.S. generally accepted accounting principles.
Basis for Opinion
These financial statements are the responsibility of the Fund's management. Our responsibility is to express an opinion on the Fund's financial statements based on our audit. We are a public accounting firm registered with the Public Company Accounting Oversight Board (United States) ("PCAOB") and are required to be independent with respect to the Fund in accordance with the U.S. federal securities laws and the applicable rules and regulations of the Securities and Exchange Commission and the PCAOB.
We conducted our audit in accordance with the standards of the PCAOB. Those standards require that we plan and perform the audit to obtain reasonable assurance about whether the financial statements are free of material misstatement, whether due to error or fraud. The Fund is not required to have, nor were we engaged to perform, an audit of the Fund's internal control over financial reporting. As part of our audit, we are required to obtain an understanding of internal control over financial reporting but not for the purpose of expressing an opinion on the effectiveness of the Fund's internal control over financial reporting. Accordingly, we express no such opinion.
Our audit included performing procedures to assess the risks of material misstatement of the financial statements, whether due to error or fraud, and performing procedures that respond to those risks. Such procedures included examining, on a test basis, evidence regarding the amounts and disclosures in the financial statements. Our procedures included confirmation of securities owned as of December 31, 2021, by correspondence with the custodian and brokers or by other appropriate auditing procedures where replies from brokers were not received. Our audit also included evaluating the accounting principles used and significant estimates made by management, as well as evaluating the overall presentation of the financial statements. We believe that our audit provides a reasonable basis for our opinion.

We have served as the auditor of one or more FPA investment companies since 2018.
Los Angeles, CA
February 28, 2022
55
FPA FLEXIBLE FIXED INCOME FUND
APPROVAL OF THE ADVISORY AGREEMENT
(Unaudited)
Approval of the Advisory Agreement. At a meeting of the Board of Directors held on August 9, 2021, the Directors approved the continuation of the advisory agreement between the Fund and the Adviser (the "Advisory Agreement") for an additional one-year period through September 30, 2022, on the recommendation of the Independent Directors, who met in executive session on August 9, 2021 prior to the Board meeting to review and discuss the proposed continuation of the Advisory Agreement. The Board had also met on July 12, 2021, with the Independent Directors meeting separately prior to the Meeting in executive session with the management of the Adviser and then separately with independent counsel to evaluate the renewal of the Advisory Agreement. Prior to their July 12 meeting, the Independent Directors, through their independent counsel, had requested and received extensive materials prepared in connection with the review of the Advisory Agreements. The materials provided a broad range of information regarding the Fund, including a description of, among other matters, the terms of the Advisory Agreement; the services provided by the Adviser; the experience of the relevant investment personnel; the Fund's performance in absolute terms and as compared to the performance of peers and appropriate benchmark(s); the fees and expenses of the Fund in absolute terms and as compared to peers; and the profitability of the Adviser from serving as adviser to the Fund.
In addition to the executive sessions, the Boards, acting directly or through their committees, met regularly throughout the year and received information on a variety of topics that were relevant to their annual consideration of the renewal of each Advisory Agreement including, among other matters, Fund investment performance, compliance, risk management, liquidity, valuation, trade execution, service provider oversight and other matters relating to Fund operations. The Independent Directors also had met with management of the Adviser (including key investment personnel) at their quarterly meetings as well as with management at other times between the quarterly meetings throughout the year. The materials specifically provided in connection with the annual review of the Advisory Agreements supplement the information received throughout the year.
At their regular Board meetings and executive sessions, the Independent Directors were also advised by independent legal counsel. In addition to the materials provided by the Adviser, the Independent Directors received a legal memorandum from independent counsel that outlined, among other matters: the duties of the Independent Directors and relevant requirements under the 1940 Act; the general principles under state law relevant to considering the approval of advisory contracts; an adviser's fiduciary duty with respect to advisory agreements and compensation; the standards used by courts in determining whether investment advisers and investment company boards of trustees have fulfilled their duties; and factors to be considered by the Independent Directors when voting on advisory agreements. During both executive sessions, independent legal counsel reviewed with Independent Directors these duties, standards and factors summarized in the legal memorandum described above. The following paragraphs summarize the material information and factors considered by the Board and the Independent Directors, as well as the Directors' conclusions relative to such factors.
Nature, Extent and Quality of Services. The Board and the Independent Directors considered information provided by the Adviser in response to their requests, as well as information provided throughout the year regarding: the Adviser and its staffing in connection with the Fund, including the Fund's portfolio managers and the senior analysts supporting them; the scope of services supervised and provided by the Adviser; and the absence of any significant service problems reported to the Board. The Board and the Independent Directors noted the experience, length of service and the outstanding reputation of the Fund's portfolio managers: Tom Atteberry, who has been with the Adviser since 1997 and has served as portfolio manager since 2018 and Abhijeet V. Patwardhan, who joined the Adviser in 2010 and has served as portfolio manager since 2018. After discussion,
56
FPA FLEXIBLE FIXED INCOME FUND
APPROVAL OF THE ADVISORY AGREEMENT (Continued)
(Unaudited)
the Board and the Independent Directors concluded that the nature, extent and quality of services provided by the Adviser have benefited and should continue to benefit the Fund and its shareholders.
Investment Performance. The Board and the Independent Directors reviewed the overall investment performance of the Fund. The Directors also received information from an independent consultant, Broadridge, regarding the Fund's performance relative to a peer group of alternative credit focus funds selected by Broadridge (the "Peer Group"). The Board and the Independent Directors recognized that the Fund is less than 3 years old and has not yet had time to develop a meaningful, long-term track record. However, in light of the Adviser's long history, the Board and the Independent Directors noted the Adviser's experience and track record, as well as the long-term investment performance of NI, which is managed by the same portfolio management team. The Board and the Independent Directors noted the Fund underperformed its Peer Group median for the one-year period ending March 31, 2021, and outperformed the comparative Bloomberg Barclays U.S. Universal Bond Index, for the one-year period ending March 31, 2021. After discussion, the Board and the Independent Directors determined that the Fund's investment results were reasonable in light of the Fund's objectives and concluded that the Adviser's continued management of the Fund should benefit the Fund and its shareholders.
Advisory Fees and Fund Expenses; Comparison with Peer Group and Institutional Fees. The Board and the Independent Directors considered information provided by the Adviser regarding the Fund's advisory fees and total expense levels. The Board and the Independent Directors reviewed comparative information regarding fees and expenses for the Peer Group. The Board and the Independent Directors noted that the Fund's advisory is fee equal to that of the Peer Group median and its overall net expense ratio was also below the Peer Group median. In addition, the Directors noted that the fee rate charged to the Fund is higher than institutional accounts managed in a similar style by the portfolio managers but considered the Adviser's discussion of the differences between the services provided by the Adviser to the Fund and those provided by the Adviser to the institutional accounts. The Board and the Independent Directors concluded that the continued payment of advisory fees and expenses by the Fund to the Adviser was fair and reasonable and should continue to benefit the Fund and its shareholders.
Adviser Profitability and Costs. The Board and the Independent Directors considered information provided by the Adviser regarding the Adviser's costs in providing services to the Fund, the profitability of the Adviser and the benefits to the Adviser from its relationship to the Fund. They reviewed and considered the Adviser's representations regarding its assumptions and methods of allocating certain costs, such as personnel costs, which constitute the Adviser's largest operating cost, overhead and trading costs with respect to the provision of investment advisory services. The Independent Directors discussed with the Adviser the general process through which individuals' compensation is determined and then reviewed by the management committee of the Adviser, as well as the Adviser's methods for determining that its compensation levels are set at appropriate levels to attract and retain the personnel necessary to provide high quality professional investment advice. In evaluating the Adviser's profitability, they excluded certain distribution and marketing-related expenses. The Board and the Independent Directors recognized that the Adviser is entitled under the law to earn a reasonable level of profits for the services that it provides to the Fund. The Board and the Independent Directors concluded that the Adviser's level of profitability from its relationship with the Fund did not indicate that the Adviser's compensation was unreasonable or excessive.
Economies of Scale and Sharing of Economies of Scale. The Board and the Independent Directors considered whether there have been economies of scale with respect to the management of the Fund, whether the
57
FPA FLEXIBLE FIXED INCOME FUND
APPROVAL OF THE ADVISORY AGREEMENT (Continued)
(Unaudited)
Fund has appropriately benefited from any economies of scale, and whether the fee rate is reasonable in relation to the Fund's asset levels and any economies of scale that may exist. The Board and the Independent Directors considered the Adviser's representation that its internal costs of providing investment management services to the Fund have significantly increased in recent years as a result of a number of factors, including the Adviser's substantial investment in additional professional resources and staffing. The Board and the Independent Directors considered both quantitative and qualitative information regarding the Adviser's representation that it has also made significant investments in: (1) the two portfolio managers, five analysts, traders and other investment personnel who assist with the management of the Fund; (2) new compliance, operations, and administrative personnel; (3) information technology, portfolio accounting and trading systems; and (4) office space, each of which enhances the quality of services provided to the Fund. The Board and the Independent Directors also considered the Adviser's willingness to close funds to new investors when it believed that a fund may have limited capacity to grow or that it otherwise would benefit fund shareholders. The Board noted that the Fund does not charge sales loads.
The Board and the Independent Directors recognized that the advisory fee rate schedule for the Fund does not have breakpoints. They considered that many mutual funds have breakpoints in the advisory fee structure as a means by which to share in the benefits of potential economies of scale as a fund's assets grow. They also considered that not all funds have breakpoints in their fee structures and that breakpoints are not the exclusive means of sharing potential economies of scale. The Board and the Independent Directors considered the Adviser's statement that it believes that breakpoints currently remain inappropriate for the Fund given the ongoing investments the Adviser is making in its business for the benefit of the Fund, uncertainties regarding the direction of the economy, rising inflation, increasing costs for personnel and systems, and growth or contraction in the Fund's assets, all of which could negatively impact the profitability of the Adviser. The Board and the Independent Directors also noted that the Adviser has contractually agreed to reimburse the Fund for Total Annual Fund Operating Expenses (excluding interest, taxes, brokerage fees and commissions payable by the Fund in connection with the purchase or sale of portfolio securities, and extraordinary expenses, including litigation expenses not incurred in the Fund's ordinary course of business) in excess of 0.49% of the average net assets of the Fund attributable to the Institutional Class and 0.59% of the average net assets of the Fund attributable to the Advisor Class for the period ending April 30, 2022, and in excess of 0.59% of the average net assets of the Fund attributable to the Institutional Class and 0.69% of the average the net assets of the Fund attributable to the Advisor Class for the one-year period ending April 30, 2023. The Board and the Independent Directors concluded that the Fund is benefitting from the ongoing investments made by the Adviser in its team of personnel serving the Fund and in the Adviser's service infrastructure, and that in light of these investments, the addition of breakpoints in the Fund's advisory fee structure was not warranted at current asset levels.
Ancillary Benefits. The Board and the Independent Directors considered other actual and potential benefits to the Adviser from managing the Fund, including the acquisition and use of research services with commissions generated by the Fund, in concluding that the contractual advisory and other fees are fair and reasonable for the Fund. They noted that the Adviser does not have any affiliates that benefit from the Adviser's relationship to the Fund.
Conclusions. The Board and the Independent Directors determined that the Fund continues to benefit from the services of the Adviser's highly experienced portfolio management team. In addition, the Board and the Independent Directors agreed that the Fund continues to receive high quality services from the Adviser. The Board and the Independent Directors concluded that the current advisory fee rate is reasonable and fair to the
58
FPA FLEXIBLE FIXED INCOME FUND
APPROVAL OF THE ADVISORY AGREEMENT (Continued)
(Unaudited)
Fund and its shareholders in light of the nature and quality of the services provided by the Adviser and the Adviser's profitability and costs. The Board and the Independent Directors also noted their intention to continue monitoring the factors relevant to the Adviser's compensation, such as changes in the Fund's asset levels, changes in portfolio management personnel and the cost and quality of the services provided by the Adviser to the Fund. On the basis of the foregoing, and without assigning particular weight to any single factor, none of which was dispositive, the Board and the Independent Directors concluded that it would be in the best interests of the Fund to continue to be advised and managed by the Adviser and determined to approve the continuation of the current Advisory Agreement for another one-year period through September 30, 2022.
59
FPA FLEXIBLE FIXED INCOME FUND
SHAREHOLDER EXPENSE EXAMPLE
December 31, 2021 (Unaudited)
Fund Expenses
Mutual fund shareholders generally incur two types of costs: (1) transaction costs, and (2) ongoing costs, including advisory and administrative fees; shareholder service fees; and other Fund expenses. The Example is intended to help you understand your ongoing costs (in dollars) of investing in the Fund and to compare these costs with the ongoing costs of investing in other mutual funds. The Example is based on an investment of $1,000 invested at the beginning of the year and held for the entire year.
Actual Expenses
The information in the table under the heading "Actual Performance" provides information about actual account values and actual expenses. You may use the information in this column, together with the amount you invested, to estimate the expenses that you paid over the period. Simply divide your account value by $1,000 (for example, an $8,600 account value divided by $1,000 = 8.6), then multiply the result by the number in the first column in the row entitled "Expenses Paid During Period" to estimate the expenses you paid on your account during this period.
Hypothetical Example for Comparison Purposes
The information in the table under the heading "Hypothetical Performance (5% return before expenses)" provides information about hypothetical account values and hypothetical expenses based on the Fund's actual expense ratio and an assumed rate of return of 5% per year before expenses, which is not the Fund's actual return. The hypothetical account values and expenses may not be used to estimate the actual ending account balance or expenses you paid for the period. You may use this information to compare the ongoing costs of investing in the Fund and other funds. To do so, compare this 5% hypothetical example with the 5% hypothetical examples that appear in the shareholder reports of other funds.
Please note that the expenses shown in the table are meant to highlight your ongoing costs only and do not reflect any transactional costs. Therefore, the information under the heading "Hypothetical Performance (5% return before expenses)" is useful in comparing ongoing costs only, and will not help you determine the relative total costs of owning different funds. In addition, if these transactional costs were included, your costs would have been higher. Even though the Fund does not charge transaction fees, if you purchase shares through a broker, the broker may charge you a fee. You should evaluate other mutual funds' transaction fees and any applicable broker fees to assess the total cost of ownership for comparison purposes.
| | | Actual Performance | | Hypothetical Performance
(5% return before expenses) | |
Advisor Class | |
Beginning Account Value June 30, 2021 | | $ | 1,000.00 | | | $ | 1,000.00 | | |
Ending Account Value December 31, 2021 | | $ | 1,004.30 | | | $ | 1,022.38 | | |
Expenses Paid During Period(a) | | $ | 2.83 | | | $ | 2.85 | | |
Institutional Class | |
Beginning Account Value June 30, 2021 | | $ | 1,000.00 | | | $ | 1,000.00 | | |
Ending Account Value December 31, 2021 | | $ | 1,004.80 | | | $ | 1,022.74 | | |
Expenses Paid During Period(b) | | $ | 2.48 | | | $ | 2.50 | | |
(a) Expenses are equal to the Fund's annualized expense ratio of 0.59%, multiplied by the average account value over the period and prorated for the six-months ended December 31, 2021 (184/365 days).
(b) Expenses are equal to the Fund's annualized expense ratio of 0.49%, multiplied by the average account value over the period and prorated for the six-months ended December 31, 2021 (184/365 days).
60
FPA FLEXIBLE FIXED INCOME FUND
PRIVACY POLICY
(Unaudited)
The following is the privacy notice of the mutual funds managed by First Pacific Advisors, LP ("FPA", and the mutual funds, the "FPA Funds"). A complete list of funds is provided below.
The FPA Funds take privacy seriously and consider privacy to be a fundamental aspect of its relationships with its former, prospective, and current investors. The FPA Funds are committed to maintaining the confidentiality, integrity and security of its former, current, and prospective investors' non-public personal information and other personal information. This privacy policy describes our privacy practices surrounding the collection and sharing of non-public personal information of current, former, and prospective investors.
Sources and Collection of Non-Public Personal Information.
While providing investors and/or prospective investors (collectively, "investors") with products and services, the FPA Funds, and certain service providers, such as the FPA Fund's Transfer Agents and/or Administrators, may obtain non-public personal information about such investors, which may come directly from the investor or their intermediaries from sources such as: (i) account applications, subscription agreements and other forms, (ii) written, electronic or verbal correspondence, (iii) investor transactions, (iv) an investor's brokerage or financial advisory firm, financial advisor or consultant, and/or (v) from information captured on applicable websites, including information you may voluntarily provide when you subscribe to receive FPA's quarterly updates or request us to mail you information about the FPA Funds. In addition, the FPA Funds may collect additional non-public personal information from different sources, such as: (i) affiliates or their service providers; (ii) public websites or other publicly available sources such as government records; and/or (iii) from credit reporting agencies, sanctions screening databases, or from sources designed to detect and prevent fraud.
The non-public personal information collected about an investor may include: (i) identifiers and similar information such as the investor's name, address, tax identification number, birth date, driver's license number, and potentially email address and phone number (if provided); (ii) commercial information like an investment selection, beneficiary information, or transaction and account history with the FPA Funds; (iii) internet or other electronic network activity like interactions with the FPA website; and (iv) professional or employment-related information like an investor's occupation and job title.
Purpose for Collecting Non-Public Personal Information.
We may collect or use all or a few of these categories of non-public personal information listed above for the following business or commercial purposes: (i) performing services on behalf of FPA or the FPA Funds, including, for example, maintaining or servicing accounts, providing customer service, processing transactions, verifying information, processing payments, or providing similar services; (ii) performing our contractual obligations, including providing updates on FPA Funds performance and other operational matters; (iii) detecting security incidents, protecting against malicious, deceptive, fraudulent, or illegal activity, including, preventing fraud and conducting "Know Your Client," anti-money laundering, terrorist financing, and conflict checks; or (iv) enabling or effecting commercial transactions, including, using bank account details to remit funds and process distributions.
Disclosure of Non-Public Personal Information.
The FPA Funds do not disclose any non-public personal information provided by investors or gathered by the FPA Funds to third parties, except as required or permitted by law or as necessary for such third parties to perform their agreements with respect to the FPA Funds. Non-affiliated companies may from time to time be used to provide certain services, such as maintaining investor accounts, preparing and mailing prospectuses, reports, account statements and other information, conducting Know Your Client reviews, performing checks
61
FPA FLEXIBLE FIXED INCOME FUND
PRIVACY POLICY (Continued)
(Unaudited)
against sanctions lists, and gathering shareholder proxies. In many instances, the investor will be a client of a third party, but the FPA Funds may also provide an investor's non-public personal information and account information to the investor's respective custodian, brokerage or financial advisory firm and/or financial advisor or consultant.
Sharing Information with Third Parties.
The FPA Funds reserve the right to report or disclose non-public personal information or account information to third parties in circumstances where the FPA Funds believe in good faith that disclosure is required or permitted under law, to cooperate with regulators or law enforcement authorities, to protect their rights or property, or upon reasonable request by the FPA Funds in which an investor has invested. In addition, the FPA Funds may disclose information about an investor or an investor's accounts to a third party at the investor's request or direction or with the consent of the investor.
Rights to Limited Sharing.
Federal law gives you the right to limit some but not all sharing of your nonpublic personal information. We do not: (i) share non-public personal information with non-affiliates to market to you; (ii) engage in joint marketing with non-affiliates; (iii) share non-public personal information with affiliates to market to you; or (iv) share non-public personal information about your creditworthiness with affiliates.
Procedures to Safeguard Private Information.
The FPA Funds will take reasonable steps and use security measures appropriate to the nature of the information and that comply with applicable laws to protect investors' non-public personal information against unauthorized access and exfiltration, acquisition, theft, or disclosure. In addition to this policy, the FPA Funds have implemented internal procedures that are designed to help guard investors' personal data. Given the nature of information security, there is no guarantee that such safeguards will always be successful.
Changes to the Privacy Policy.
From time to time, the FPA Funds may update or revise this privacy policy. If there are changes to the terms of this privacy policy, documents containing the revised policy will be updated.
FPA Funds.
FPA Crescent Fund, FPA New Income, Inc., FPA Flexible Fixed Income Fund, FPA U.S. Core Equity Fund, Inc., FPA Queens Road Value Fund, FPA Queens Road Small Cap Value Fund, Source Capital, Inc.
Contact Us.
Questions, comments, and requests regarding this privacy policy are welcomed and should be addressed to dataprotection@fpa.com.
Revised: January 2022
62
FPA FLEXIBLE FIXED INCOME FUND
TRUSTEE AND OFFICER INFORMATION
(Unaudited)
Sandra Brown, Mark L. Lipson, Alfred E. Osborne, Jr., A. Robert Pisano, and Patrick B. Purcell are all Trustees of the Fund who are not "interested persons" of the Fund, as that term is defined in the 1940 Act (collectively, the "Independent Trustees"). Trustees serve until their resignation, removal or retirement. The Statement of Additional Information includes additional information about the Trustees and is available, without charge, upon request by calling (800) 982-4372.
Name, Address(1)
and Year of Birth | | Position(s)
Held with
the Fund | | Year First
Elected as
Trustee of
the Fund | | Principal Occupation(s)
During the
Past Five Years | | Number of
FPA Funds
Overseen
by Trustee | | Other
Directorships
Held by Trustee
During the Past
Five Years | |
Independent Trustees | |
Sandra Brown,
1955 | | Trustee | | | 2016 | | | Consultant (since 2009). Formerly, CEO and President of Transamerica Financial Advisers, Inc. (1999-2009); President, Transamerica Securities Sales Corp. (1998-2009); Vice President, Bank of America Mutual Fund Administration (1990-1998). Director/Trustee of FPA Funds Trust, FPA New Income, Inc., FPA U.S. Core Equity Fund, and Source Capital (since 2016), and Trustee of Bragg Capital Trust (since 2020). | | | 7 | | | None | |
Mark L. Lipson,
1949 | | Trustee & Chairman | | | 2015 | | | Managing Member, ML2 Advisors, LLC (since 2014). Formerly Managing Director, Bessemer Trust (2007-2014) and US Trust (2003-2006); Chairman and CEO of the Northstar Mutual Funds (1993-2001); and President and CEO of the National Mutual Funds (1988-1993). Director/Trustee of FPA Funds Trust, FPA New Income, Inc., FPA U.S. Core Equity Fund, and Source Capital (since 2015), and Trustee of Bragg Capital Trust (since 2020). | | | 7 | | | None | |
Alfred E. Osborne, Jr.,
1944 | | Trustee | | | 2002 | | | Senior Associate Dean, (2003-Present), Interim Dean (2018-June 2019), Professor and Faculty Director (since 2003) Price Center for Entrepreneurship and Innovation at the John E. Anderson School of Management at UCLA. Dr. Osborne has been at UCLA since 1972. Director/Trustee of FPA Funds Trust, FPA New Income, Inc., FPA U.S. Core Equity Fund, and Source Capital (since 2013), and Trustee of Bragg Capital Trust (since 2020). | | | 7 | | | Kaiser Aluminum, Wedbush Capital and Waverley Capital Acquisition Corporation | |
63
FPA FLEXIBLE FIXED INCOME FUND
TRUSTEE AND OFFICER INFORMATION (Continued)
(Unaudited)
Name, Address(1)
and Year of Birth | | Position(s)
Held with
the Fund | | Year First
Elected as
Trustee of
the Fund | | Principal Occupation(s)
During the
Past Five Years | | Number of
FPA Funds
Overseen
by Trustee | | Other
Directorships
Held by Trustee
During the Past
Five Years | |
A. Robert Pisano,
1943 | | Trustee | | | 2013 | | | Consultant (since 2012). Formerly, President and Chief Operating Officer of The Motion Picture Association of America, Inc. (2005-2011). Formerly, National Executive Director and Chief Executive Officer of The Screen Actors Guild (2001-2005). Director/Trustee of FPA Funds Trust, FPA New Income, Inc., FPA U.S. Core Equity Fund, and Source Capital (since 2013), and Trustee of Bragg Capital Trust (since 2020). | | | 7 | | | Resources Global Professionals | |
Patrick B. Purcell,
1943 | | Trustee | | | 2006 | | | Retired (since 2000). Formerly, Consultant to Paramount Pictures 1998-2000; Executive Vice President, Chief Financial and Administrative Officer of Paramount Pictures (1983-1998). Director/Trustee of FPA Funds Trust and FPA New Income, Inc. (since 2006), of Source Capital, Inc. (since 2010), of FPA U.S. Core Equity Fund, Inc (since 2012), and Bragg Capital Trust (since 2020). | | | 7 | | | None | |
"Interested" Trustee(2) | |
Steven Romick,
1963 | | Trustee | | | 2002 | | | Director and President of FPA GP, Inc., the General Partner of the Adviser (since 2018). Vice President (since 2015) and Portfolio Manager of FPA Crescent Fund (since 1993) and of Source Capital, Inc. (since 2015). Formerly, Managing Partner of FPA (2010-2018). Formerly, President of the Trust (2002-2015). | | | 2 | | | None | |
J. Richard Atwood,
1960 | | Trustee | | | 2016 | | | Director and President of FPA GP, Inc., the General Partner of the Adviser (since 2018). Director/Trustee and President of each FPA Fund. Formerly, Managing Partner of the Adviser (2006-2018). | | | 7 | | | None | |
(1) The address of each Trustee is 11601 Wilshire Boulevard, Suite 1200, Los Angeles, California 90025.
(2) "Interested person" within the meaning of the 1940 Act by virtue of their affiliation with the Fund's Adviser.
64
FPA FLEXIBLE FIXED INCOME FUND
TRUSTEE AND OFFICER INFORMATION (Continued)
(Unaudited)
Officers of the Fund. Officers of the Fund are elected annually by the Board.
Name, Address(1)
and Year of Birth | | Position
with Fund | | Year First
Elected as
Officer of the
Fund | | Principal Occupation(s)
During the Past Five Years | |
J. Richard Atwood,
1960 | | President | | | 2002 | | | Director and President of FPA GP, Inc., the General Partner of the Adviser (since 2018). Director/Trustee of each FPA Fund. President of each FPA Fund. Formerly, Managing Partner of the Adviser (2006-2018). | |
Thomas. H. Atteberry,
1953 | | Vice President and Portfolio Manager | | | 2018 | | | Partner of FPA. Formerly Chief Executive Officer of the Fund (until 2015). Vice President and Portfolio Manager of FPA Flexible Fixed Income Fund (since 2018). | |
Abhijeet Patwardhan,
1979 | | Vice President and Portfolio Manager | | | 2018 | | | Partner (since 2017) and a Director of Research (since 2015) of FPA; Managing Director of FPA from 2015 to 2017, Senior Vice President of FPA from 2014 to 2015; Analyst and Vice President of FPA from 2010 to 2013. Vice President and Portfolio Manager of FPA Flexible Fixed Income Fund (since 2018). | |
Karen E. Richards,
1969 | | Chief Compliance Officer | | | 2019 | | | Chief Compliance Officer of the Adviser (since 2018); and Chief Compliance Officer of each FPA Fund (since 2019, except Bragg Capital Trust since 2020). Formerly, Deputy Chief Compliance Officer of First Republic Investment Management, LLC (from 2016 to 2018), and Vice President, Senior Compliance Officer of Pacific Investment Management Company (from 2010 to 2016). | |
E. Lake Setzler III,
1967 | | Treasurer | | | 2006 | | | Managing Director and CFO of the Adviser (since 2022); and Treasurer of each FPA Fund. Formerly, Senior Vice President and Controller of the Adviser. | |
Rebecca D. Gilding,
1979 | | Secretary | | | 2019 | | | Vice President and Counsel, State Street Bank and Trust Company (since 2016); and Secretary of each FPA Fund (since 2019, except Bragg Capital Trust since 2020). Formerly, Assistant Vice President and Associate Counsel, Brown Brothers Harriman & Co. (2013 to 2016). | |
(1) The address for each Officer (except Ms. Gilding) is 11601 Wilshire Boulevard, Suite 1200, Los Angeles, California 90025. Ms. Gilding's address is State Street Bank and Trust Company, One Lincoln Street, Boston, Massachusetts 02111.
65
FPA FLEXIBLE FIXED INCOME FUND
(Unaudited)
INVESTMENT ADVISER
First Pacific Advisors, LP
11601 Wilshire Boulevard, Suite 1200
Los Angeles, CA 90025
TRANSFER & SHAREHOLDER
SERVICE AGENT
UMB Fund Services, Inc.
P.O. Box 2175
Milwaukee, WI 53201-2175
or
235 West Galena Street
Milwaukee, WI 53212-3948
(800) 638-3060
CUSTODIAN AND ADMINISTRATOR
State Street Bank and Trust Company
One Lincoln Street
Boston, Massachusetts 02111
Advisor Class:
TICKER SYMBOL: FPFAX
CUSIP: 30254T650
Institutional Class:
TICKER SYMBOL: FPFIX
CUSIP: 30254T718
DISTRIBUTOR
UMB Distribution Services, LLC
235 West Galena Street
Milwaukee, Wisconsin 53212-3948
LEGAL COUNSEL
Dechert LLP
One Bush Street, Suite 1600
San Francisco, California 94104
INDEPENDENT REGISTERED PUBLIC ACCOUNTING FIRM
Ernst & Young LLP
725 South Figueroa Street
Los Angeles, California 90017
This report has been prepared for the information of shareholders of FPA FLEXIBLE FIXED INCOME FUND, and is not authorized for distribution to prospective investors unless preceded or accompanied by an effective prospectus.
A description of the policies and procedures that the Adviser uses to vote proxies related to the Fund's portfolio securities is set forth in the Fund's Statement of Additional Information which is available without charge, upon request, on the Fund's website at www.fpa.com or by calling (800) 982-4372 and on the Securities and Exchange Commission's website at www.sec.gov.
The Fund's complete proxy voting record for the 12 months ended June 30, 2021 is available without charge, upon request by calling (800) 982-4372 and on the SEC's website at www.sec.gov.
The Fund's schedule of portfolio holdings, filed the first and third quarter of the Fund's fiscal year on Form N-PORT with the SEC, is available on the SEC's website at www.sec.gov.
Additional information about the Fund is available online at www.fpa.com. This information includes, among other things, holdings, top sectors, and performance, and is updated on or about the 15th business day after the end of each quarter.
Item 2. Code of Ethics.
| (a) | The registrant has adopted a code of ethics that applies to the registrant’s principal executive and financial officers. |
| (c) | During the period covered by this report, there were no amendments to the provisions of the code of ethics adopted in 2(a) above. |
| (d) | During the period covered by this report, there were not any implicit or explicit waivers to the provisions of the code of ethics adopted in 2(a). |
| (f) | A copy of the registrant’s code of ethics is filed as an exhibit to this Form N-CSR. |
Item 3. Audit Committee Financial Expert.
The registrant’s board of directors has determined that Patrick B. Purcell and Sandra Brown, who are members of the registrant’s audit committee and board of directors, are an “audit committee financial expert” and are “independent,” as those terms are defined in this Item. This designation will not increase either designee’s duties, obligations or liability as compared to his or her duties, obligations or liability as a member of the audit committee and of the board of directors. This designation does not affect the duties, obligations or liability of any other member of the audit committee or the board of directors. Mr. Purcell retired from the audit committee and board of directors on February 28, 2022.
Item 4. Principal Accountant Fees and Services.
| FPA Crescent Fund | | 2020 | | | 2021 | |
| (a) | Audit Fees | | $ | 56,000 | | | $ | 57,750 | |
| (b) | Audit Related Fees | | $ | -0- | | | $ | -0- | |
| (c) | Tax Fees(1) | | $ | 11,900 | | | $ | 12,300 | |
| (d) | All Other Fees(2) | | $ | 1,667 | | | $ | 1,602 | |
(1) Tax fees are for the preparation of the Fund’s tax return(s).
(2) Other fees are for the identification of any PFIC holdings in the Fund.
| FPA Flexible Fixed Income Fund | | 2020 | | | 2021 | |
| (a) | Audit Fees | | $ | 26,000 | | | $ | 32,000 | |
| (b) | Audit Related Fees | | $ | -0- | | | $ | -0- | |
| (c) | Tax Fees(1) | | $ | 6,500 | | | $ | 6,700 | |
| (d) | All Other Fees | | $ | -0- | | | $ | -0- | |
(1) Tax fees are for the preparation of the Fund’s tax return(s).
| (e)(1) | The audit committee shall pre-approve all audit and permissible non-audit services that the committee considers compatible with maintaining the independent auditors’ independence. The pre-approval requirement will extend to all non-audit services provided to the registrant, the adviser, and any entity controlling, controlled by, or under common control with the adviser that provides ongoing services to the registrant, if the engagement relates directly to the operations and financial reporting of the registrant; provided, however, that an engagement of the registrant’s independent auditors to perform attest services for the registrant, the adviser or its affiliates required by generally accepted auditing standards to complete the examination of the registrant’s financial statements (such as an examination conducted in accordance with Statement on Standards for Attestation Engagements Number 16, or a Successor Statement, issued by the American Institute of Certified Public Accountants), will be deem pre-approved if: |
| | (i) | the registrant’s independent auditors inform the audit committee of the engagement, |
| | | |
| | (ii) | the registrant’s independent auditors advise the audit committee at least annually that the performance of this engagement will not impair the independent auditor’s independence with respect to the registrant, and |
| | | |
| | (iii) | the audit committee receives a copy of the independent auditor’s report prepared in connection with such services. The committee may delegate to one or more committee members the authority to review and pre-approve audit and permissible non-audit services. Actions taken under any such delegation will be reported to the full committee at its next meeting. |
| (e)(2) | 0% of the services provided to the registrant described in paragraphs b-d of this Item were approved by the Audit Committee pursuant to paragraph (c)(7)(i)(C) of Rule 2-01 of Regulation S-X. There were no services provided to the investment adviser or any entity controlling, controlled by or under common control with the adviser described in paragraphs (b) — (d) of this Item that were required to be pre-approved by the audit committee. |
| (f) | For the fiscal year ended December 31, 2021, if greater than 50%, specify the percentage of hours spent on the audit of the registrant’s financial statements for the most recent fiscal year that were attributed to work performed by persons who are not full-time, permanent employees of the principal accountant Ernst & Young LLP (“EY”). According to EY, such amount was below 50%; therefore disclosure item not applicable to this filing. |
| (g) | For the fiscal years ended December 31, 2021 and December 31, 2020, the aggregate non-audit fees billed by EY for services rendered to the investment advisor were $50,820 and $43,500, respectively. |
| (h) | The registrant’s Audit Committee has considered whether the provision of non-audit services that were rendered to the registrant’s investment advisor, which were not pre-approved (not requiring pre-approval), is compatible with maintaining EY’s independence. |
Item 5. Audit Committee of Listed Registrants.
Not applicable.
Item 6. Investments.
| (a) | Schedule of Investments is included as a part of the report to shareholders filed under Item 1 of this Form N-CSR. |
Item 7. Disclosure of Proxy Voting Policies and Procedures for Closed-End Management Investment Companies.
Not applicable.
Item 8. Portfolio Managers of Closed-End Management Investment Companies.
Not applicable.
Item 9. Purchases of Equity Securities by Closed-End Management Investment Company and Affiliated Purchasers.
Not applicable.
Item 10. Submission of Matters to a Vote of Security Holders.
There have been no material changes to the procedures by which the shareholders may recommend nominees to the registrant’s board of directors.
Item 11. Controls and Procedures.
| (a) | The principal executive officer and principal financial officer of the registrant have concluded that the registrant’s disclosure controls and procedures (as defined in Rule 30a-3(c) under the Investment Company Act of 1940) are effective based on their evaluation of the disclosure controls and procedures as of a date within 90 days of the filing date of this report. |
| (b) | There have been no significant changes in the registrant’s internal controls over financial reporting (as defined in Rule 30a-3(d) under the Investment Company Act of 1940) that occurred during the registrant’s second fiscal quarter of the period covered by this report that have materially affected, or is reasonably likely to materially affect, the registrant’s internal controls over financial reporting. |
Item 12. Disclosure of Securities Lending Activities for Closed-End Management Investment Companies
Not applicable.
Item 13. Exhibits.
SIGNATURES
Pursuant to the requirements of the Securities Exchange Act of 1934 and the Investment Company Act of 1940, the registrant has duly caused this report to be signed on its behalf by the undersigned, thereunto duly authorized.
FPA FUNDS TRUST
| By: | /s/ J. Richard Atwood | |
| | J. Richard Atwood | |
| | President (principal executive officer) | |
Pursuant to the requirements of the Securities Exchange Act of 1934 and the Investment Company Act of 1940, this report has been signed below by the following persons on behalf of the registrant and in the capacities and on the dates indicated.
| By: | /s/ J. Richard Atwood | |
| | J. Richard Atwood | |
| | President (principal executive officer) | |
| By: | /s/ E. Lake Setzler III | |
| | E. Lake Setzler III | |
| | Treasurer (principal financial officer) | |