UNITED STATES
SECURITIES AND EXCHANGE COMMISSION
Washington, D.C. 20549
FORM N-CSR
CERTIFIED SHAREHOLDER REPORT OF REGISTERED
MANAGEMENT INVESTMENT COMPANIES
Investment Company Act file number: 811-08544
FPA FUNDS TRUST
(Exact Name of Registrant as Specified in Charter)
235 West Galena Street
Milwaukee, Wisconsin 53212
(Address of Principal Executive Offices, including Zip Code)
Diane J. Drake
Mutual Fund Administration, LLC
2220 E. Route 66, Suite 226
Glendora, California 91740
(Name and Address of Agent for Service)
COPIES TO:
Laurie Anne Dee
Morgan, Lewis & Bockius LLP
600 Anton Boulevard, Suite 1800
Costa Mesa, California 92626
Registrant’s telephone number, including area code: (626) 385-5777
Date of fiscal year end: September 30
Date of reporting period: September 30, 2023
Item 1: Report to Shareholders.
| (a) | The Reports to Shareholders are attached herewith. |

Distributor:
UMB DISTRIBUTION SERVICES, LLC
235 West Galena Street
Milwaukee, Wisconsin 53212
Annual Report
September 30, 2023
FPA NEW INCOME FUND
LETTER TO SHAREHOLDERS
Dear Fellow Shareholders,
FPA New Income Fund (the "Fund") returned 1.32% in the third quarter of 2023 and 3.60% year-to-date through September 30, 2023.
Sector | | As of 9/30/2023 | |
Yield-to-worst1 | | | 6.61 | % | |
Effective Duration | | | 2.22 years | | |
Spread Duration | | | 2.52 years | | |
High Quality Exposure2 | | | 90 | % | |
Credit Exposure3 | | | 10 | % | |
During the quarter, the Federal Reserve continued its efforts to lower inflation, raising the Fed Funds rate by 25 basis points in July before leaving the Fed Funds rate unchanged in September.4 Tighter monetary policy and Fed commentary, along with macroeconomic data that does not consistently point to weaker inflation, drove risk-free rates higher during the quarter. In general, investment-grade and high-yield debt spreads were essentially unchanged during the quarter, while higher risk-free rates led to higher overall yields.5 On an absolute basis, we continue to see attractive opportunities to buy longer-duration, High Quality bonds (rated single-A or higher) that we believe will enhance the Fund's long-term returns and the Fund's short-term upside versus downside return profile. We do not generally view Credit (investments rated BBB or lower) as attractively priced, but we continue to search for, and will seek to opportunistically invest in, Credit when we believe the price adequately compensates for the risk of permanent impairment of capital and near-term mark-to-market risk. The Fund's Credit exposure was essentially unchanged at 10% as of September 30, 2023 versus 10.2% as of June 30, 2023. Cash and equivalents represented 3.5% of the portfolio on September 30, 2023 versus 4.0% on June 30, 2023.
Portfolio Attribution6
The largest contributors to performance during the quarter were the corporate holdings — including bonds, loans, and common stock. The common stock of PHI Group, Inc. (PHI) contributed a significant portion
1 Yield-to-worst ("YTW") is presented gross of fees and reflects the lowest potential yield that can be received on a debt investment without the issuer defaulting. YTW considers the impact of expected prepayments, calls and/or sinking funds, among other things. Average YTW is based on the weighted average YTW of the investments held in the Fund's portfolio. YTW may not represent the yield an investor should expect to receive. As of September 30, 2023, the Fund's subsidized/unsubsidized 30-day SEC standardized yield ("SEC Yield") was 4.91%/4.77% respectively. The SEC Yield calculation is an annualized measure of the Fund's dividend and interest payments for the last 30 days, less the Fund expenses. Subsidized yield reflects fee waivers and/or expense reimbursements during the period. Without waivers and/or reimbursements, yields would be reduced. Unsubsidized yield does not adjust for any fee waivers and/or expense reimbursements in effect. The SEC Yield calculation shows investors what they would earn in yield over the course of a 12-month period if the fund continued earning the same rate for the rest of the year.
2 High Quality is defined as investments rated A or higher, Treasuries, and cash and equivalents.
3 Credit is defined as investments rated BBB or lower, including non-rated investments.
4 Source: Bloomberg. Federal Reserve; https://www.federalreserve.gov/newsevents/pressreleases/monetary20230816a.htm; https://www.federalreserve.gov/newsevents/pressreleases/monetary20231011a.htm
5 Source: Bloomberg.
6 This information is not a recommendation for a specific security or sector and these securities/sectors may not be in the Fund at the time you receive this report. The information provided does not reflect all positions purchased, sold or recommended by FPA during the quarter. The portfolio holdings as of the most recent quarter-end may be obtained at www.fpa.com.
1
FPA NEW INCOME FUND
LETTER TO SHAREHOLDERS
(Continued)
of the corporate holdings' return due to price appreciation and dividends. PHI represented approximately 0.6% of the portfolio, on average, during the quarter, and common stock holdings in total represented approximately 1.2% of the portfolio, on average, during the quarter. The common stock holdings in the portfolio represent value received for past investments in either corporate bonds or loans that have been restructured. We generally intend to hold these common stock investments until their market price better reflects our estimate of their intrinsic value. Corporate bonds and loans also contributed to performance during the quarter.
The second- and third-largest contributors to performance were collateralized loan obligations (CLOs) backed by corporate loans and CLOs backed by commercial real estate loans, respectively, due mostly to income from coupon payments with some additional benefit from higher prices due to lower spreads. These CLOs are highly-rated, and most are floating rate bonds that have benefited from increases in their coupons as interest rates have risen.
Agency-guaranteed commercial mortgage backed securities (CMBS) and Treasury bonds were the largest and second-largest detractors from performance during the quarter, respectively, due to lower prices caused by higher risk-free rates. There were no other meaningful detractors from performance during the quarter.
Portfolio Activity7
The table below shows the portfolio's sector-level exposures at September 30, 2023 compared to June 30, 2023:
| Sector | | % Portfolio
9/30/2023 | | % Portfolio
6/30/2023 | |
ABS | | | 47.3 | | | | 47.0 | | |
CLO | | | 12.2 | | | | 13.4 | | |
Corporate | | | 6.9 | | | | 6.7 | | |
Agency CMBS | | | 11.0 | | | | 6.5 | | |
Non-Agency CMBS | | | 8.5 | | | | 8.9 | | |
Agency RMBS | | | 1.9 | | | | 2.0 | | |
Non-Agency RMBS | | | 4.9 | | | | 5.3 | | |
Stripped Mortgage-backed | | | 0.4 | | | | 0.4 | | |
U.S. Treasury | | | 3.4 | | | | 5.8 | | |
Cash and equivalents | | | 3.5 | | | | 4.0 | | |
Total | | | 100.0 | % | | | 100.0 | % | |
Yield-to-worst1 | | | 6.61 | % | | | 6.64 | % | |
Effective Duration (years) | | | 2.22 | | | | 1.99 | | |
Spread Duration (years) | | | 2.52 | | | | 2.35 | | |
Average Life (years) | | | 2.89 | | | | 2.67 | | |
We continue to take advantage of higher yields by actively buying longer-duration, High Quality bonds. The duration of these investments is guided by our duration test, which seeks to identify the longest-duration bonds that we expect will produce at least a breakeven return over a 12-month period, assuming a bond's yield will increase by 100 bps during that period. Consistent with this test, during the third quarter, we bought: agency-guaranteed CMBS; Treasury bonds; AAA-rated asset-backed securities (ABS) backed by equipment; AAA-rated ABS backed by prime quality credit card receivables; AAA-rated ABS backed by prime quality auto loans;
7 Portfolio composition will change due to ongoing management of the Fund.
2
FPA NEW INCOME FUND
LETTER TO SHAREHOLDERS
(Continued)
AAA-rated non-agency CMBS secured by single family homes; and AAA-rated ABS backed by cell towers. On average, these investments had a duration of 4.3 years.
Within Credit, we bought a BBB-rated corporate bond. We also added to an existing high-yield bond investment that was largely paid for by selling a pari passu loan, because we believe the bond has a more attractive return profile than the loan.
In addition to the loan sale referenced above, to fund this quarter's investments we sold existing short-duration holdings, including High Quality ABS, CLOs, and CMBS with an average duration of less than one year. We also sold Treasuries to buy other similar- or longer-duration bonds. Lastly, we sold another corporate loan where the price was high enough that the prospective returns no longer made the investment attractive to own.
Market Commentary
We believe we are in the midst of one of the most attractive bond markets we have seen in over a decade and have been taking advantage of the attractive investment opportunities we see to seek to improve the short- and long-term return profile of the Fund. In contrast, we have encountered fixed income investors who are caught up in the game of trying to time the market and call a bottom, or — in bond terms — call the peak in rates. We do not believe that trying to bet on rates or time the market is a good way to make money in either the short or long term. We believe betting on interest rates is speculative and, thus, fraught with risk. Moreover, we believe trying to forecast the direction of interest rates and time the market has an unimpressive track record.
To support our contention that trying to predict the direction of interest rates is a difficult way to make money, research shows that "forecasters were often only slightly more accurate than chance, and usually lost to simple extrapolation algorithms. Also, forecasters with the biggest news media profiles tended to lose to their lower profile colleagues, suggesting a rather perverse inverse relationship between fame and accuracy."8 Forecasting is hard and we would be in awe of anyone who had a consistent track record of forecasting success. Given the difficulties of forecasting, we are puzzled why people even attempt to forecast, let alone bet capital on those forecasts.
We believe our approach to bond investing is different from other bonds managers in two respects. First, we don't try to time the market or speculate on the market because we believe that approach is too risky and is a low-conviction way to make money in the short and long term. Instead, we focus on whether the price of an investment compensates us for that investment's risks. Second, we invest with a flexible mandate. Whereas many other bond funds track an index, we believe index-based investing is fundamentally flawed because index-tracking funds, generally speaking, are required to own a certain part of the market all of the time, regardless of price. It's obvious to us that one should pay attention to price and valuation to help avoid bubbles or expensive markets and, in the process, maximize long-term returns.
For decades, we have been investing using price as our guide. The chart below shows the value of a $10,000 investment in New Income over the last ten years compared to the Aggregate Bond Index, the 1-3- year Index, and short-term bond funds. It is clear that the Fund has enjoyed not only a higher return than the overall bond market and other comparable funds but also a much smoother ride along the way, with the smoother ride evidenced by New Income's generally smaller drawdowns during periods of market turbulence.
8 Philip E. Tetlock, Professor, Univ. of Pennsylvania, co-author of "Superforecasting: The Art and Science of Prediction", https://www.sas.upenn.edu/tetlock/publications
3
FPA NEW INCOME FUND
LETTER TO SHAREHOLDERS
(Continued)
Growth of $10,000 over ten years
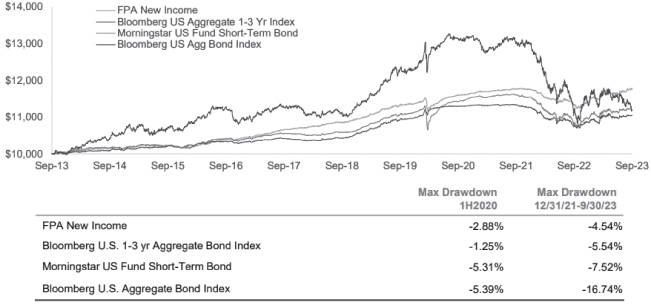
Source: Morningstar Direct; As of 9/30/2023. FPNIX Inception is July 11, 1984. The following 10-year performance is as of September 30, 2023: FPA New Income, 1.66%; Bloomberg U.S. 1-3 yr Aggregate Bond Index, 1.01%; Morningstar U.S. Fund Short-Term Bond, 1.28%; Bloomberg U.S. Aggregate Bond Index, 1.13%. Past performance is no guarantee of future results and current performance may be higher or lower than the performance shown. This data represents past performance and investors should understand that investment returns and principal values fluctuate, so that when you redeem your investment it may be worth more or less than its original cost. Current month-end performance data, which may be higher or lower than the performance data quoted, may be obtained at www.fpa.com or by calling toll-free, 1-800-982-4372. As of its most recent prospectus, the Fund's total expense ratio is 0.58% and net expense ratio is 0.45%.
It is nice to have an investment whose price does not move much in the short-term but the smoother ride (lower volatility) is also an important contributor to long-term returns, because it creates the opportunity to redeploy capital at close to 100 cents on the dollar into cheaper, more attractive investments if and when those opportunities arise — precisely the situation that we find ourselves in today.
4
FPA NEW INCOME FUND
LETTER TO SHAREHOLDERS
(Continued)
As shown in the following chart, Treasury yields are at 10-15- year highs:
Treasury Yield
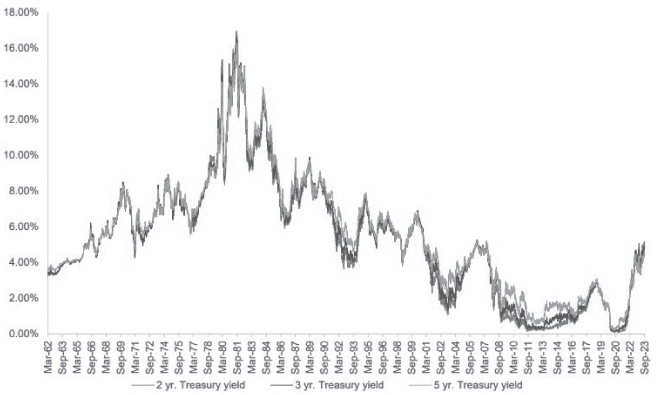
Source: Bloomberg; As of 9/30/2023
5
FPA NEW INCOME FUND
LETTER TO SHAREHOLDERS
(Continued)
Similarly, the yield on investment grade bonds in general is at 10-15- year highs, as shown by the yield of the Aggregate Bond index in the following chart:
Bloomberg U.S. Aggregate Bond Index
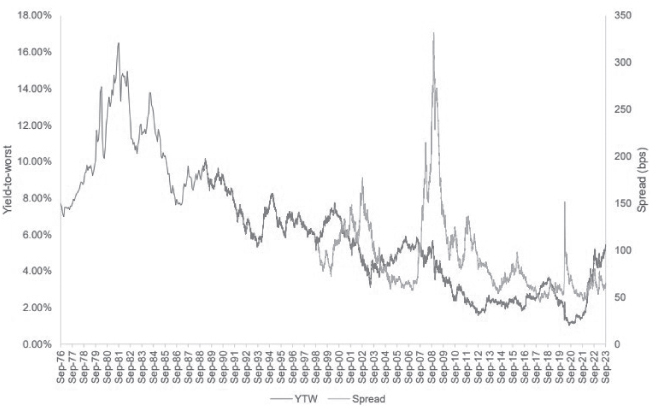
Source: Bloomberg. As of 9/30/2023. YTW is yield-to-worst. Spread reflects the quoted spread of a bond that is relative to the security off which it is priced, typically an on the-run treasury. Past performance is no guarantee, nor is it indicative, of future results. Please refer to the end of the presentation for Important Disclosures and Index definitions.
We do not know how long rates will stay at these levels. We hope that yields remain this high or higher indefinitely because that is a path to making more money for our investors but, to quote Master Shifu in Kung Fu Panda: "Yesterday is history, tomorrow is a mystery, but today is a gift. That is why it is called the present." We don't take investing advice from cartoons, but we can't argue with Master Shifu's sentiment. We want to take advantage of the yields available today by locking them in for as long as possible, because we believe that over the long term our investors will be better off earning these yields for multiple years. That said, circling back to the value of limiting short-term volatility, we want to be vigilant and thoughtful about limiting the short-term price risk or duration risk related to increases in interest rates.
6
FPA NEW INCOME FUND
LETTER TO SHAREHOLDERS
(Continued)
Rather than using duration to bet on interest rates or, alternatively, instead of being stuck with the duration of an index, we choose the duration of our investments by investing in bonds that have enough yield to compensate for their duration. We compare yield to duration, specifically by employing our 100 bps duration test described earlier. The following chart applies this test to the Treasury yield curve:
Hypothetical 12-month U.S. Treasury Returns
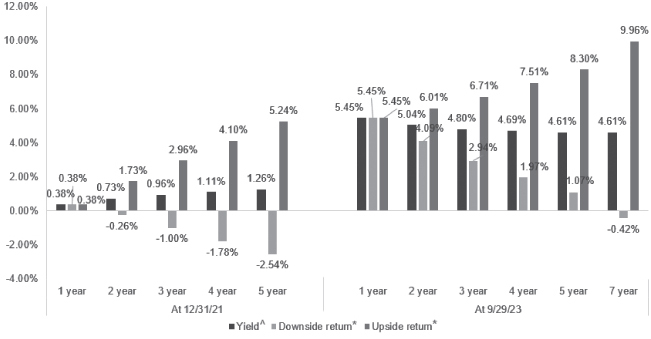
Source: Bloomberg, FPA; As of the dates noted.^ Yield to Maturity is the annualized total return anticipated on a bond if the bond is held until it matures and assumes all payments are made as scheduled and are reinvested at the same rate. The expected return assumes no change in interest rates over the next 12 months. * Upside return estimates the 12-month total return assuming yields decline by 100 bps over 12 months. Downside return estimates the 12-month total return assuming yields increase by 100 bps over 12 months. Return estimates assume gradual change in yield over 12 months. The hypothetical stress test data provided herein is for illustrative and informational purposes only and is intended to demonstrate the mathematical impact of a change in Treasury yields on hypothetical Treasury returns. No representation is being made that any account, product or strategy will or is likely to achieve profits, losses, or results similar to those shown. Hypothetical results do not reflect trading in actual accounts, and does not reflect the impact that all economic, market or other factors may have on the management of the account. Hypothetical results have certain inherent limitations. There are frequently sharp differences between simulated results and the actual results subsequently achieved by any particular account, product or strategy. Past performance is no guarantee, nor is it indicative, of future results. Please refer to the back of this commentary for important disclosures.
7
FPA NEW INCOME FUND
LETTER TO SHAREHOLDERS
(Continued)
The first bar shown for each period represents Treasury yields of various maturities. The second bar shown for each period represents the results of our 100 bps duration test, which assumes yields increase by 100 bps over twelve months and which we view as a short-term downside scenario with respect to interest rate changes. For example, if one bought the 5-year Treasury at a 4.61% yield on September 29, 2023 and yields subsequently increased by 100 bps, the 5-year Treasury would produce a total return of 1.07% over twelve months. The same analysis applied to a 7-year Treasury would result in a total return loss of -0.42%. Consequently, the 5-year Treasury would be a candidate for the Fund's portfolio but the 7-year Treasury would not.
Conversely, the third bar for each period represents above show the total return on Treasuries over twelve months if yields decreased by 100 bps. We view that scenario as a short-term upside scenario with respect to interest rate changes. The 5-year Treasury offered a potential upside return of 8.30%. Although the 7-year Treasury offered a higher potential upside return, that result has to be balanced with the prospect of losing money in the short-term. The 5-year Treasury captures over 80% of the upside return of the 7-year Treasury and offers a positive downside return versus the 7-year Treasury's negative downside return. We've learned after many years of patient investing that reaching for every last basis point often doesn't turn out well; it is better in the long term to balance the potential reward with the risk of realizing that reward. Of course, our investment universe is not limited to 5- and 7-year maturities. We can therefore avail ourselves of opportunities in bonds maturing between five and seven years as well as other investment grade bonds besides Treasuries that still have breakeven or positive expected downside returns while approaching the upside of 7-year bonds.
By way of comparison, the market was very different in 2021, as shown on the left side of the chart above. Yields were incredibly low at that time, which meant compensation for taking on risk was much lower. During that time, other bond managers may have maintained a longer duration portfolio in line with their respective benchmarks, regardless of price or yield. In our eyes, the potential reward of those longer duration investments wasn't worth the risk. To explain: note that the upside return assumes that yields decline by 100 bps which, given the starting yields in 2021, meant that yields would have to get very close to zero or negative to realize the upside. Zero or negative yields were possible, but again, we emphasize that one of the keys to attractive long-term returns is balancing potential reward with the risk of realizing that reward.
We believe that always owning any part of the market, regardless of price, is not a good strategy for achieving attractive short- and long-term returns. We believe that an important part of our value-add is actively managing duration based on the price of duration so, consequently, we do not track an index. In 2021, our investment approach, which emphasizes price and flexibility, proved its power when we used its flexibility to steer toward shorter-duration bonds because the low yield on bonds led us to that conclusion. Today, yields are higher, and the duration test described above leads us to own longer duration bonds. As noted earlier, this past quarter, the average duration of our new investments was 4.3 years. Compared to a bond manager that may bet on the direction of interest rates, we believe our price-driven approach is more transparent, less subject to a manager's changing opinions, and less risky than trying to invest based on forecasts of the future.
Since the end of 2021, we have increased the Fund's duration by 0.8 years — from 1.4 years to 2.2 years at the end of September. The Fund's duration is now in line with the Morningstar short-term bond category, which was 2.2 years at the end of September.9 We will continue to add longer duration bonds to the portfolio and increase the Fund's duration as long as yields are high enough. Our active duration management makes the Fund one of the most actively managed bond funds in its category with respect to duration.
9 Source: Morningstar Direct.
8
FPA NEW INCOME FUND
LETTER TO SHAREHOLDERS
(Continued)
Looking ahead, we believe the Fund's active management offers a compelling way to invest in the bond market. We also believe our disciplined, absolute value-driven rotation into longer duration bonds is making the portfolio more attractive in both the short and long term. Nevertheless, investors often ask why they should invest in an actively-managed portfolio of bonds like ours versus owning cash or core duration bonds10. Answering those questions assumes that we can time the market. We will be the first to admit that we can neither predict the future nor time the market. No one can know what the future holds. If bond investors were good at forecasting rates, then most bond investors would not have had such poor returns in 2022.11 The Fund, however, had a return of -3.10% in 2022 as compared to the Bloomberg Aggregate Bond Index return of -13.01% and the -5.22% return of the Morningstar Short Term Bond category, because our focus is on valuation at the security level rather than trying to predict the future.
It is important to focus on what is knowable in advance and consider upside versus downside. We know there is an opportunity cost to holding cash: foregoing returns available on other investments. We also know we can capture more yield and much of the short-term upside of core duration but with better downside protection via our investments in 4-6 year maturity bonds. We will be thrilled to buy core duration if and when yields are high enough to compensate for that longer duration. Presently, yields are not there. Until yields are high enough to buy core duration, we believe it makes more sense to have multiple ways to win rather than to bet the ranch on a singular outcome (i.e., lower yields).
From a duration perspective, we believe the Fund is positioned to benefit in the following ways: First, we believe we are buying attractive long-term yields via highly-rated, longer-maturity bonds that we believe will yield more than core bonds (using the Aggregate Bond Index as a proxy for core bonds). Second, as described above, we believe we are buying bonds with short-term downside protection against rates rising 100 bps over the next twelve months. And third, we are introducing upside optionality into the portfolio that captures much of the short-term upside of core bonds in the event that rates decline for any reason.
10 "Core duration bonds" or "core bonds" refer to bonds similar in duration to Bloomberg U.S. Aggregate Bond Index. As of 9/30/2023, the duration of the Bloomberg U.S. Aggregate Bond Index is 6.1 years.
11 Source: CNBC, January 7, 2023; https://www.cnbc.com/2023/01/07/2022-was-the-worst-ever-year-for-us-bonds-how-to-position-for-2023.html
Past performance is no guarantee, nor is it indicative, of future results.
9
FPA NEW INCOME FUND
LETTER TO SHAREHOLDERS
(Continued)
Regarding that last possibility, we note that the yield curve is presently inverted and that history indicates Treasury yields tend to decline after yield curve inversions, as shown in the following chart:
2 yr. and 5 yr. Treasury Yield
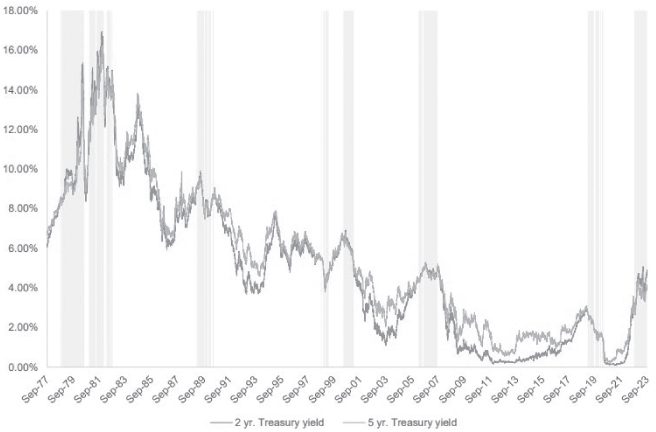
Source: Bloomberg; As of 9/30/2023
We're not betting on this outcome; it's just one of multiple ways we could win (i.e., achieve positive outcomes for our investors).
Although we see compelling opportunity in longer-maturity, investment-grade bonds, we see little opportunity in lower- or high-yield rated debt. To understand whether the return on lower-rated debt is worth the risk, we must understand the risk. Rising interest rates have called into question companies' ability to sustain their capital structures due to decreasing debt service coverage ratios. Even if one believed that debt were well covered by enterprise or asset value, whether that debt will be paid depends on whether the owners of the equity want to pay it. Leveraged loans and high-yield bonds are supposed to have protections against companies impairing lenders by changing lenders' claim on assets or taking asset value away from lenders. The expensive debt market prior to 2022 was characterized by low yields and weak protections for lenders (i.e., debt investors),
10
FPA NEW INCOME FUND
LETTER TO SHAREHOLDERS
(Continued)
as shown in the charts below. In combination with defaults, these weak protections have led to lower recoveries on high-yield bonds and loans.
Covenant Review's Documentation Score
Three-Month Rolling Average
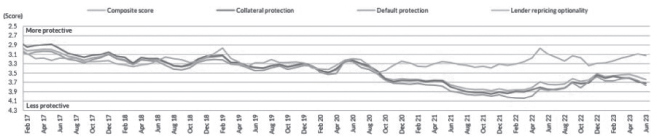
Chart covers the period February 2017 through June 2023. Source: Fitch Ratings; North American and EMEA Leveraged Finance Chart Book: 1H23 — Limited Activity Amid Rates, Default Concerns; August 3, 2023. Chart Source: Covenant Review. Note: Covenant Review's Documentation Scoring Overview. The score, sub scores and qualitative scores will be expressed as follows: 1, Most Protective; 2, Fairly Protective; 3, Flexible; 4, Deficient; 5, Seriously Deficient. Analysis includes the U.S. 1st Lien institutional loan universe.
11
FPA NEW INCOME FUND
LETTER TO SHAREHOLDERS
(Continued)
High yield: focus should be on risk vs. reward
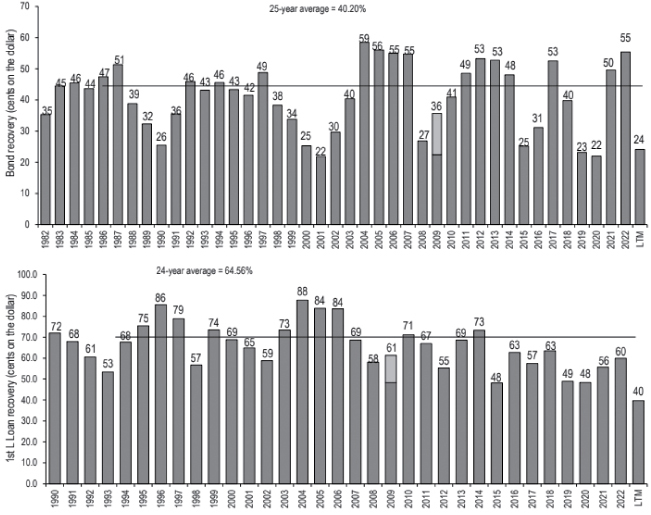
Source: J.P. Morgan; Moody's Investors Service; S&P/HIS Markit; Pitchbook Data, Inc.; US High Yield and Leveraged Loan Strategy (JPM); October 9, 2023.
12
FPA NEW INCOME FUND
LETTER TO SHAREHOLDERS
(Continued)
Bloomberg U.S. Corporate High Yield BB excl. Energy
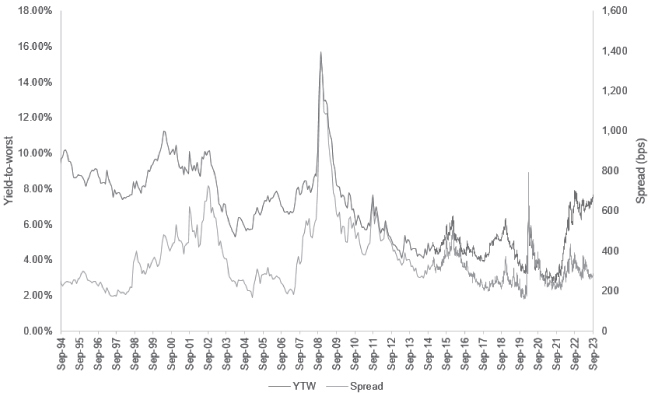
Source: Bloomberg. As of September 30, 2023. YTW is Yield-to-Worst. Spread reflects the quoted spread of a bond that is relative to the security off which it is priced, typically an on the-run Treasury. Past performance is no guarantee, nor is it indicative, of future results.
While yields on high yield rated debt are at 10-15 year highs, we believe the extra compensation to own high-yield rated debt instead of investment grade rated debt is generally not attractive compared to the significant incremental credit risk associated with high-yield rated debt. As always, we are bottom-up investors, so we continue to hunt for attractively priced investment opportunities in lower rated debt, but we generally end up concluding that the price isn't right yet.
In summary, successfully timing the market is hard. No one can credibly ring a bell and say now is the time to buy. We believe that focusing on valuation avoids the need to time the market. Using that approach, we believe buying longer-duration, but not quite core-duration bonds, at least not yet, is one of the best investment opportunities we currently see. This is why most of our investment activity during the quarter was directed toward highly-rated, longer-maturity, fixed-rate bonds. We hope that through the Fund — managed with our time-tested and disciplined approach — investors can avoid the anxiety of trying get the timing right.
13
FPA NEW INCOME FUND
LETTER TO SHAREHOLDERS
(Continued)
Investment Team Update
The success of our investment process depends on having a team of philosophically-aligned investors, all rowing in the same direction. Speaking personally, I couldn't be more proud of our team: Joe Choi, Nazanin Pajoom, Prakash Gopinath, Ryan Taylor, and Felix Moy. It is through their hard work and discipline that we have been able to achieve what I consider to be best-in-class returns.
We are delighted to announce a recent addition to the team: Felix Partow will initially focus on residential mortgage-related investments and will take the seat of our former longtime mortgage analyst, Julian Mann, who recently retired. We're very excited to have Felix Partow as part of our team.
We're also excited to announce that Prakash has been appointed as Co-Director of Research. Prakash has been part of our team since 2015, working on a variety of investments and providing sound counsel along the way. Prakash is a thoughtful, measured, and long-term-oriented value investor — very consistent with the multi-decade philosophy with which we have managed the Fund. Prakash and I will work together to guide our investment process.
Thomas (Tom) Atteberry previously co-managed the Fund, retired as an FPA partner in July 2022 and transitioned to a senior advisory role to the investment team and to FPA. He would have stepped in as Portfolio Manager of the Fund if I were incapacitated. Going forward, Prakash will assume my responsibilities if I am unavailable. Tom will no longer be a Senior Advisor to our investment team but will remain a Senior Advisor to FPA.
Thank you for your confidence and continued support.
Abhijeet Patwardhan
Portfolio Manager
November 2023
14
FPA NEW INCOME FUND
LETTER TO SHAREHOLDERS
(Continued)
Appendix: Attribution and portfolio activity for the fiscal year ending September 30, 2023
Portfolio Attribution12
Largest contributors to performance:
• Collateralized loan obligations (CLOs) backed by corporate loans
• Corporate holdings, including loans, bonds and common stock
• Non-agency commercial mortgage-backed securities (CMBS), particularly CLOs backed by commercial real estate loans
Largest detractors from performance:
• Agency-guaranteed CMBS
While there were individual investments that detracted from performance during the fiscal year, there were no other meaningful detractors from performance at the sector level.
Portfolio Activity13
| Sector | | % Portfolio
9/30/2023 | | % Portfolio
9/30/2022 | |
ABS | | | 47.3 | | | | 66.3 | | |
CLO | | | 12.2 | | | | 19.5 | | |
Corporate | | | 6.9 | | | | 5.8 | | |
Agency CMBS | | | 11.0 | | | | 3.5 | | |
Non-Agency CMBS | | | 8.5 | | | | 7.6 | | |
Agency RMBS | | | 1.9 | | | | 2.1 | | |
Non-Agency RMBS | | | 4.9 | | | | 5.1 | | |
Stripped Mortgage-backed | | | 0.4 | | | | 0.4 | | |
U.S. Treasury | | | 3.4 | | | | 9.0 | | |
Cash and equivalents | | | 3.5 | | | | 0.6 | | |
Total | | | 100.0 | % | | | 100.0 | % | |
Yield-to-worst | | | 6.61 | % | | | 5.70 | % | |
Effective Duration (years) | | | 2.22 | | | | 1.71 | | |
Spread Duration (years) | | | 2.52 | | | | 2.21 | | |
Average Life (years) | | | 2.89 | | | | 2.44 | | |
12 This information is not a recommendation for a specific security or sector and these securities/sectors may not be in the Fund at the time you receive this report. The information provided does not reflect all positions purchased, sold or recommended by FPA during the quarter. The portfolio holdings as of the most recent quarter-end may be obtained at www.fpa.com.
13 Portfolio composition will change due to ongoing management of the Fund.
Past performance is no guarantee, nor is it indicative, of future results.
15
FPA NEW INCOME FUND
LETTER TO SHAREHOLDERS
(Continued)
Important Disclosures
This Commentary is for informational and discussion purposes only and does not constitute, and should not be construed as, an offer or solicitation for the purchase or sale of any securities, products or services discussed, and neither does it provide investment advice. Any such offer or solicitation shall only be made pursuant to the Fund's Prospectus, which supersedes the information contained herein in its entirety.
The views expressed herein and any forward-looking statements are as of the date of the publication and are those of the portfolio management team. Future events or results may vary significantly from those expressed and are subject to change at any time in response to changing circumstances and industry developments. This information and data has been prepared from sources believed reliable, but the accuracy and completeness of the information cannot be guaranteed and is not a complete summary or statement of all available data. You should not construe the contents of this document as legal, tax, accounting, investment or other advice or recommendations.
Abhijeet Patwardhan has been portfolio manager for the Fund since November 2015. Thomas Atteberry managed/co-managed the Fund from November 2004 through June 2022. Effective July 1, 2022, Mr. Atteberry transitioned to a Senior Advisory role. There were no material changes to the investment process due to this transition. Effective September 30, 2023, Mr. Atteberry no longer acts as a Senior Advisor to the investment team, but he remains as Senior Advisor to FPA.
Effective July 28, 2023, FPA New Income, Inc. (the "Predecessor Fund") was reorganized into the FPA Funds Trust and its new name is FPA New Income Fund. There was no change in its investment objective, investment strategy or fundamental investment policies. FPA continues to be the adviser to the Fund. For more information, please refer to the announcement on FPA's website at: https://fpa.com/news-special-commentaries/fund-announcements/2023/06/26/fpa-announces-fund-reorganizations.
Portfolio composition will change due to ongoing management of the Fund. References to individual securities or sectors are for informational purposes only and should not be construed as recommendations by the Fund, the portfolio manager, the Adviser, or the distributor. It should not be assumed that future investments will be profitable or will equal the performance of the security or sector examples discussed. The portfolio holdings as of the most recent quarter-end may be obtained at www.fpa.com.
The statements made herein may be forward-looking and/or based on current expectations, projections, and/or information currently available. Actual results may differ from those anticipated. The portfolio manager and/or FPA cannot assure future results and disclaims any obligation to update or alter any statistical data and/or references thereto, as well as any forward-looking statements, whether as a result of new information, future events, or otherwise. Such statements may or may not be accurate over the long-term.
Investments, including investments in mutual funds, carry risks and investors may lose principal value. Capital markets are volatile and can decline significantly in response to adverse issuer, political, regulatory, market, or economic developments. The Fund may purchase foreign securities, including depository receipts, which are subject to interest rate, currency exchange rate, economic and political risks; these risks may be elevated when investing in emerging markets. Foreign investments, especially those of companies in emerging markets, can be riskier, less liquid, harder to value, and more volatile than investments in the United States. The securities of smaller, less well-known companies can be more volatile than those of larger companies.
16
FPA NEW INCOME FUND
LETTER TO SHAREHOLDERS
(Continued)
The return of principal in a bond fund is not guaranteed. Bond funds have the same issuer, interest rate, inflation and credit risks that are associated with underlying bonds owned by the Fund. Lower rated bonds, convertible securities and other types of debt obligations involve greater risks than higher rated bonds.
Interest rate risk is the risk that when interest rates go up, the value of fixed income instruments, such as bonds, typically go down and investors may lose principal value. Credit risk is the risk of loss of principal due to the issuer's failure to repay a loan. Generally, the lower the quality rating of a fixed income instrument, the greater the risk that the issuer will fail to pay interest fully and return principal in a timely manner. If an issuer defaults the fixed income instrument may lose some or all of its value.
Mortgage securities and collateralized mortgage obligations (CMOs) are subject to prepayment risk and the risk of default on the underlying mortgages or other assets; such derivatives may increase volatility. Convertible securities are generally not investment grade and are subject to greater credit risk than higher-rated investments. High yield securities can be volatile and subject to much higher instances of default.
Collateralized debt obligations ("CDOs"), which include collateralized loan obligations ("CLOs"), collateralized bond obligations ("CBOs"), and other similarly structured securities, carry additional risks in addition to interest rate risk and default risk. This includes, but is not limited to: (i) distributions from the underlying collateral may not be adequate to make interest or other payments; (ii) the quality of the collateral may decline in value or default; and (iii) the complex structure of the security may not be fully understood at the time of investment and may produce disputes with the issuer or unexpected investment results. Investments in CDOs are also more difficult to value than other investments.
Value style investing presents the risk that the holdings or securities may never reach their full market value because the market fails to recognize what the portfolio management team considers the true business value or because the portfolio management team has misjudged those values. In addition, value style investing may fall out of favor and underperform growth or other styles of investing during given periods.
The ratings agencies that provide ratings are the Nationally Recognized Statistical Ratings Organizations (NRSROs) DBRS, Inc., Fitch Ratings, Inc., Kroll Bond Rating Agency, Inc., Moody's Investors Service, Inc., and S&P Global Ratings. Credit ratings range from AAA (highest) to D (lowest). Bonds rated BBB or above are considered investment grade. Credit ratings of BB and below are lower-rated securities (junk bonds). High-yielding, non-investment grade bonds (junk bonds) involve higher risks than investment grade bonds. Bonds with credit ratings of CCC or below have higher default risk.
Please refer to the Fund's Prospectus for a complete overview of the primary risks associated with the Fund.
The Fund is not authorized for distribution unless preceded or accompanied by a current prospectus. The prospectus can be accessed at: https://fpa.com/request-funds-literature.
Important Disclosures for Hypothetical Stress-Tested Results
The hypothetical and estimated data provided herein is for illustrative and informational purposes only. No representation is being made that FPNIX will or is likely to achieve profits, losses, or results similar to those shown. Hypothetical and estimated results do not reflect trading in actual accounts, and do not reflect the impact that economic, market or other factors may have on the management of the account.
The hypothetical and estimated results as set forth in this commentary do not represent actual results; actual results may significantly differ from the theoretical data being presented. Hypothetical/estimated results
17
FPA NEW INCOME FUND
LETTER TO SHAREHOLDERS
(Continued)
have certain inherent limitations. Hypothetical models theoretically may be changed from time to time to obtain more favorable results. There may be sharp differences between simulated or estimated results and the actual results subsequently achieved by any particular account, product or strategy. In addition, simulated/estimated results cannot account for the impact of certain market risks such as a lack of liquidity or default risk. There are numerous other factors related to the markets in general or the implementation of any specific strategy which cannot be fully accounted for in the preparation of simulated or estimated results, all of which can adversely affect actual results.
A client's individual portfolio results may vary from any hypothetical or estimated results because of the timing of trades, deposits and withdrawals, the impact of management fees and taxes, market fluctuations, trading costs, cash flows, custodian fees, among other factors. Hypothetical results are not meant to be construed as a prediction of the future return of the Fund. Past performance is no guarantee, nor is it indicative, of future results.
Index / Category Definitions
Comparison to any index is for illustrative purposes only and should not be relied upon as a fully accurate measure of comparison. The Fund will be less diversified than the indices noted herein and may hold non-index securities or securities that are not comparable to those contained in an index. Indices will hold positions that are not within the Fund's investment strategy. Indices are unmanaged, do not reflect any commissions, fees or expenses which would be incurred by an investor purchasing the underlying securities. The Fund does not include outperformance of any index or benchmark in its investment objectives. Investors cannot invest directly in an index.
Bloomberg U.S. Aggregate Bond Index provides a measure of the performance of the U.S. investment grade bonds market, which includes investment grade U.S. Government bonds, investment grade corporate bonds, mortgage pass-through securities and asset-backed securities that are publicly offered for sale in the United States. The securities in the Index must have at least 1 year remaining in maturity. In addition, the securities must be denominated in U.S. dollars and must be fixed rate, nonconvertible, and taxable.
Bloomberg U.S. Aggregate 1-3 Year Bond Index provides a measure of the performance of the U.S. investment grade bonds market, which includes investment grade U.S. Government bonds, investment grade corporate bonds, mortgage pass-through securities and asset-backed securities that are publicly offered for sale in the United States. The securities in the Index must have a remaining maturity of 1 to 3 years. In addition, the securities must be denominated in U.S. dollars and must be fixed rate, nonconvertible, and taxable.
Bloomberg U.S. High Yield Index measures the market of USD-denominated, non-investment grade, fixed-rate, taxable corporate bonds. Bloomberg U.S. High Yield BB ex Energy Index measures the market of USD-denominated, non-investment grade, fixed-rate, taxable BB-rated corporate bonds excluding energy sector. Bloomberg U.S. High Yield B ex Energy Index measures the market of USD-denominated, non-investment grade, fixed-rate, taxable B-rated corporate bonds excluding energy sector.
The Consumer Price Index (CPI) is an unmanaged index representing the rate of the inflation of U.S. consumer prices as determined by the U.S. Department of Labor Statistics. There can be no guarantee that the CPI will reflect the exact level of inflation at any given time. This index reflects non-seasonally adjusted returns.
CPI + 100 bps is the measure of the CPI plus an additional 100 basis points.
Morningstar Short-term Bond Category portfolios invest primarily in corporate and other investment-grade U.S. fixed-income issues and typically have durations of 1.0 to 3.5 years. These portfolios are attractive to
18
FPA NEW INCOME FUND
LETTER TO SHAREHOLDERS
(Continued)
fairly conservative investors, because they are less sensitive to interest rates than portfolios with longer durations. Morningstar calculates monthly breakpoints using the effective duration of the Morningstar Core Bond Index in determining duration assignment. Short-term is defined as 25% to 75% of the three-year average effective duration of the Morningstar Core Bond Index. As of March 31, 2023, there were 597 funds in this category.
Other Definitions
ABS (Asset Backed Securities): financial securities backed by a loan, lease or receivables against assets other than real estate and mortgage-backed securities.
Basis Point (bps) is equal to one hundredth of one percent, or 0.01%. 100 basis points = 1%.
CLO (Collateralized Loan Obligation): is a single security backed by a pool of debt.
CMBS (Commercial Mortgage Backed Security): a mortgage-backed security backed by commercial mortgages rather than residential mortgages.
Core duration bonds (also known as core bonds) refer to bonds similar in duration to Bloomberg U.S. Aggregate Bond Index.
Coupon or coupon payment is the annual interest rate paid on a bond, expressed as a percentage of the face value and paid from issue date until maturity.
Corporate Holdings include bank debt, corporate bonds and common stock.
Effective Duration (years) is the duration calculation for bonds with embedded options. Effective duration takes into account that expected cash flows will fluctuate as interest rates change.
Mark-to-market is a method of recording the price or value of a security, portfolio, or account to reflect the current market value rather than book value.
A bond premium occurs when the price of the bond has increased in the secondary market. A bond might trade at a premium because its interest rate is higher than current rates in the market.
RMBS (Residential Mortgage Backed Securities): mortgage-backed securities backed by residential mortgages.
Stripped Mortgage-Backed Securities: a trust comprised of mortgage-backed securities which are split into principal-only strips and interest-only strips.
Weighted Average Life (years) is the average length of time that each dollar of unpaid principal on a loan, a mortgage or an amortizing bond remains outstanding.
Yield-to-Maturity (YTM) is the expected rate of return anticipated on a bond if held until it matures. YTM is considered a long-term bond yield expressed as an annual rate. The YTM calculation takes into account the bond's current market price, par value, coupon interest rate and time to maturity. It is also assumed that all coupon payments are reinvested at the same rate as the bond's current yield.
©2023 Morningstar, Inc. All Rights Reserved. The information contained herein: (1) is proprietary to Morningstar and/or its content providers; (2) may not be copied or distributed; and (3) is not warranted by Morningstar to be accurate, complete or timely. Neither Morningstar nor its content providers are responsible for any damages or losses arising from any use of this information. Past performance is no guarantee of future results.
The FPA Funds are distributed by UMB Distribution Services, LLC, (the "Distributor"), 235 W. Galena Street, Milwaukee, WI, 53212. The Distributor is not affiliated with FPA.
19
FPA NEW INCOME FUND
HISTORICAL PERFORMANCE
(Unaudited)
Change in Value of a $10,000 Investment in FPA New Income Fund vs. Barclays U.S. Aggregate Index and Consumer Price Index + 100 Basis Points from October 1, 2013 to September 30, 2023. The Average Annual Total Return table and Growth of Assumed $10,000 Investment graph do not reflect the deduction of taxes that a shareholder would pay on Fund distributions or the redemption of Fund shares.
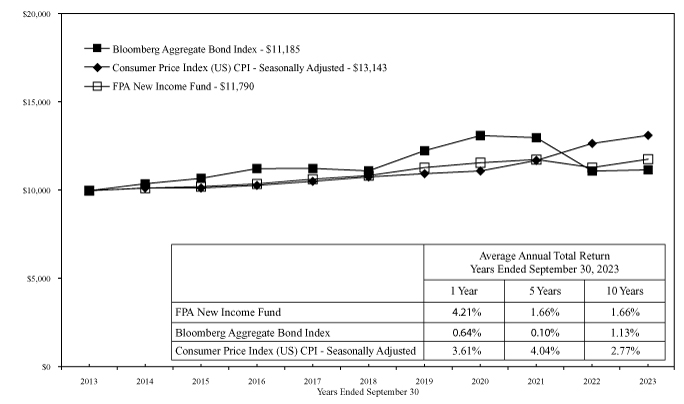
Past performance is not indicative of future performance. The Bloomberg Barclays U.S. Aggregate Bond Index a broad-based unmanaged composite of four major subindexes: U.S. Government Index; U.S. Credit Index; U.S. Mortgage-Backed Securities Index; and U.S. Asset-Backed Securities Index. The index holds investment quality bonds. The Consumer Price Index is an unmanaged index representing the rate of inflation of U.S. consumer prices as determined by the US Department of Labor Statistics. The performance of the Fund and of the Averages is computed on a total return basis which includes reinvestment of all distributions.
Past performance is no guarantee of future results, and current performance may be higher or lower than the performance shown. This data represents past performance, and investors should understand that investment returns and principal values fluctuate, so that when you redeem your investment it may be worth more or less than its original cost. The returns shown do not reflect the deduction of taxes that a shareholder would pay on Fund distributions or on the redemptions of Fund shares. Current month-end performance data can be obtained by visiting the website at www.fpa.com or by calling toll-free, 1-800-982-4372. Information regarding the Fund's expense ratio can be found in the Financial Highlights section of this report.
The Prospectus details the Fund's objective and policies, charges, and other matters of interest to prospective investors. Please read the prospectus carefully before investing. The Prospectus may be obtained by visiting the website at https://fpa.com/request-funds-literature.
20
FPA NEW INCOME FUND
SCHEDULE OF INVESTMENTS
As of September 30, 2023
| BONDS & DEBENTURES — 94.8% | | Principal
Amount | | Value | |
ASSET-BACKED SECURITIES — 56.4% | |
AUTO — 12.5% | |
Ally Auto Receivables Trust
Series 2023-1, Class A4, 5.270%, 11/15/2028 | | $ | 8,996,000 | | | $ | 8,965,538 | | |
BMW Vehicle Owner Trust
Series 2022-A, Class A4, 3.440%, 12/26/2028 | | | 25,298,000 | | | | 24,123,629 | | |
Series 2023-A, Class A4, 5.250%, 11/26/2029 | | | 6,776,000 | | | | 6,744,948 | | |
Capital One Prime Auto Receivables Trust
Series 2022-2, Class A4, 3.690%, 12/15/2027 | | | 15,513,000 | | | | 14,773,612 | | |
CarMax Auto Owner Trust
Series 2020-3, Class C, 1.690%, 4/15/2026 | | | 1,064,000 | | | | 1,027,550 | | |
Series 2022-3, Class A4, 4.060%, 2/15/2028 | | | 63,819,000 | | | | 61,390,534 | | |
Series 2022-3, Class B, 4.690%, 2/15/2028 | | | 19,152,000 | | | | 18,497,019 | | |
Series 2023-2, Class A4, 5.010%, 11/15/2028 | | | 21,176,000 | | | | 20,849,290 | | |
Series 2023-1, Class A4, 4.650%, 1/16/2029 | | | 10,892,000 | | | | 10,641,745 | | |
Series 2023-3, Class A4, 5.260%, 2/15/2029 | | | 20,637,000 | | | | 20,473,470 | | |
Drive Auto Receivables Trust
Series 2021-3, Class C, 1.470%, 1/15/2027 | | | 36,980,000 | | | | 35,920,974 | | |
DT Auto Owner Trust
Series 2021-3A, Class C, 0.870%, 5/17/2027(a) | | | 18,106,000 | | | | 17,462,596 | | |
Series 2021-4A, Class C, 1.500%, 9/15/2027(a) | | | 13,540,000 | | | | 12,842,063 | | |
Series 2022-1A, Class C, 2.960%, 11/15/2027(a) | | | 18,926,000 | | | | 18,437,934 | | |
Exeter Automobile Receivables Trust
Series 2022-1A, Class C, 2.560%, 6/15/2028 | | | 49,707,000 | | | | 48,132,521 | | |
Flagship Credit Auto Trust
Series 2021-2, Class C, 1.270%, 6/15/2027(a) | | | 17,609,000 | | | | 16,529,854 | | |
Ford Credit Auto Owner Trust
Series 2020-B, Class B, 1.190%, 1/15/2026 | | | 400,000 | | | | 391,035 | | |
Series 2023-A, Class A4, 4.560%, 12/15/2028 | | | 14,487,000 | | | | 14,128,858 | | |
Series 2023-B, Class A4, 5.060%, 2/15/2029 | | | 7,137,000 | | | | 7,056,046 | | |
GM Financial Consumer Automobile Receivables Trust
Series 2022-3, Class A4, 3.710%, 12/16/2027 | | | 25,555,000 | | | | 24,497,087 | | |
Series 2023-1, Class A4, 4.590%, 7/17/2028 | | | 15,767,000 | | | | 15,327,965 | | |
Series 2023-3, Class A4, 5.340%, 12/18/2028 | | | 13,758,000 | | | | 13,761,364 | | |
GM Financial Revolving Receivables Trust
Series 2021-1, Class A, 1.170%, 6/12/2034(a) | | | 38,305,000 | | | | 33,690,676 | | |
Series 2023-1, Class A, 5.120%, 4/11/2035(a) | | | 49,942,000 | | | | 48,909,849 | | |
Honda Auto Receivables Owner Trust
Series 2022-2, Class A4, 3.760%, 12/18/2028 | | | 6,350,000 | | | | 6,110,103 | | |
Hyundai Auto Receivables Trust
Series 2022-B, Class A4, 3.800%, 8/15/2028 | | | 14,340,000 | | | | 13,749,155 | | |
Series 2023-B, Class A4, 5.310%, 8/15/2029 | | | 10,743,000 | | | | 10,703,286 | | |
21
FPA NEW INCOME FUND
SCHEDULE OF INVESTMENTS (Continued)
As of September 30, 2023
| BONDS & DEBENTURES — Continued | | Principal
Amount | | Value | |
Mercedes-Benz Auto Receivables Trust
Series 2023-1, Class A4, 4.310%, 4/16/2029 | | $ | 10,006,000 | | | $ | 9,704,336 | | |
Nissan Auto Receivables Owner Trust
Series 2022-B, Class A4, 4.450%, 11/15/2029 | | | 13,366,000 | | | | 12,989,473 | | |
Series 2023-A, Class A4, 4.850%, 6/17/2030 | | | 15,538,000 | | | | 15,256,330 | | |
Porsche Financial Auto Securitization Trust
Series 2023-1A, Class A4, 4.720%, 6/23/2031(a) | | | 17,279,000 | | | | 17,001,755 | | |
Prestige Auto Receivables Trust
Series 2021-1A, Class C, 1.530%, 2/15/2028(a) | | | 13,545,000 | | | | 12,711,853 | | |
Santander Drive Auto Receivables Trust
Series 2022-1, Class C, 2.560%, 4/17/2028 | | | 33,202,000 | | | | 32,060,615 | | |
SFS Auto Receivables Securitization Trust
Series 2023-1A, Class A4, 5.470%, 12/20/2029(a) | | | 8,951,000 | | | | 8,805,043 | | |
Toyota Auto Loan Extended Note Trust
Series 2022-1A, Class A, 3.820%, 4/25/2035(a) | | | 54,519,000 | | | | 51,255,509 | | |
Series 2023-1A, Class A, 4.930%, 6/25/2036(a) | | | 43,813,000 | | | | 42,857,255 | | |
Toyota Auto Receivables Owner Trust
Series 2022-C, Class A4, 3.770%, 2/15/2028 | | | 10,600,000 | | | | 10,112,966 | | |
Series 2023-A, Class A4, 4.420%, 8/15/2028 | | | 16,189,000 | | | | 15,729,848 | | |
Series 2023-B, Class A4, 4.660%, 9/15/2028 | | | 19,879,000 | | | | 19,366,106 | | |
Series 2023-C, Class A4, 5.010%, 2/15/2029 | | | 25,523,000 | | | | 25,193,684 | | |
Volkswagen Auto Loan Enhanced Trust
Series 2023-1, Class A4, 5.010%, 1/22/2030 | | | 11,637,000 | | | | 11,491,739 | | |
Westlake Automobile Receivables Trust
Series 2021-3A, Class C, 1.580%, 1/15/2027(a) | | | 69,605,000 | | | | 66,621,869 | | |
Series 2022-1A, Class C, 3.110%, 3/15/2027(a) | | | 52,910,000 | | | | 51,120,790 | | |
World Omni Auto Receivables Trust
Series 2020-C, Class C, 1.390%, 5/17/2027 | | | 3,415,000 | | | | 3,224,191 | | |
Series 2023-A, Class A4, 4.660%, 5/15/2029 | | | 14,612,000 | | | | 14,247,200 | | |
Series 2023-B, Class A4, 4.680%, 5/15/2029 | | | 21,627,000 | | | | 21,127,375 | | |
Series 2023-C, Class A4, 5.030%, 11/15/2029 | | | 10,417,000 | | | | 10,303,661 | | |
| | $ | 976,320,299 | | |
COLLATERALIZED LOAN OBLIGATION — 12.2% | |
ABPCI Direct Lending Fund CLO X LP
Series 2020-10A, Class A1A, 7.538% (3-Month Term SOFR+221.161
basis points), 1/20/2032(a),(b) | | | $19,397,000 | | | | $19,177,892 | | |
ABPCI Direct Lending Fund IX LLC
Series 2020-9A, Class A1R, 7.019% (3-Month Term SOFR+166.161
basis points), 11/18/2031(a),(b) | | | 43,972,000 | | | | 43,357,140 | | |
Blackrock Mount Adams CLO IX LP
Series 2021-9A, Class A1, 7.028% (3-Month Term SOFR+163.161
basis points), 9/22/2031(a),(b) | | | 22,452,459 | | | | 22,329,060 | | |
22
FPA NEW INCOME FUND
SCHEDULE OF INVESTMENTS (Continued)
As of September 30, 2023
| BONDS & DEBENTURES — Continued | | Principal
Amount | | Value | |
Brightwood Capital MM CLO Ltd.
Series 2021-2A, Class A, 7.219% (3-Month Term SOFR+191.161
basis points), 11/15/2030(a),(b) | | | $73,757,094 | | | | $72,927,916 | | |
BTC Holdings Fund I LLC
8.362%, 1/28/2027(c),(d) | | | 957,183 | | | | 957,183 | | |
BTC Offshore Holdings Fund
8.245%, 10/20/2029(c),(d) | | | 18,000,000 | | | | 18,000,000 | | |
Cerberus Loan Funding XL LLC
Series 2023-1A, Class A, 7.708% (3-Month Term SOFR+240
basis points), 3/22/2035(a),(b) | | | 10,299,000 | | | | 10,274,818 | | |
Cerberus Loan Funding XLI LLC
Series 2023-2A, Class A1, 7.801% (3-Month Term SOFR+255
basis points), 7/15/2035(a),(b) | | | 51,840,000 | | | | 51,832,950 | | |
Cerberus Loan Funding XXIX LP
Series 2020-2A, Class A, 7.469% (3-Month Term SOFR+216.161
basis points), 10/15/2032(a),(b) | | | 79,469,000 | | | | 79,267,069 | | |
Fortress Credit Opportunities IX CLO Ltd.
Series 2017-9A, Class A1TR, 7.119% (3-Month Term SOFR+181.161
basis points), 10/15/2033(a),(b) | | | 118,776,000 | | | | 115,619,172 | | |
Golub Capital Partners CLO 36M Ltd.
Series 2018-36A, Class A, 6.931% (3-Month Term SOFR+156.161
basis points), 2/5/2031(a),(b) | | | 61,004,870 | | | | 60,636,644 | | |
Golub Capital Partners CLO 42M Ltd.
Series 2019-42A, Class A2, 7.588% (3-Month Term SOFR+226.161
basis points), 4/20/2031(a),(b) | | | 13,772,000 | | | | 13,638,453 | | |
Golub Capital Partners CLO 45M Ltd.
Series 2019-45A, Class B1, 8.138% (3-Month Term SOFR+281.161
basis points), 10/20/2031(a),(b) | | | 17,314,000 | | | | 16,875,921 | | |
Golub Capital Partners CLO 67M Ltd.
Series 2023-67A, Class A1, 7.631% (3-Month Term SOFR+250
basis points), 5/9/2036(a),(b) | | | 43,478,000 | | | | 43,473,348 | | |
Lake Shore MM CLO III LLC
Series 2019-2A, Class A2R, 2.525%, 10/17/2031(a) | | | 11,083,000 | | | | 10,113,504 | | |
Series 2019-2A, Class A1R, 7.050% (3-Month Term SOFR+174.161
basis points), 10/17/2031(a),(b) | | | 23,662,000 | | | | 23,240,438 | | |
Lake Shore MM CLO IV Ltd.
Series 2021-1A, Class X, 6.750% (3-Month Term SOFR+144.161
basis points), 10/15/2033(a),(b) | | | 10,375,799 | | | | 10,343,322 | | |
LCM XX LP
Series 20A, Class AR, 6.628% (3-Month Term SOFR+130.161
basis points), 10/20/2027(a),(b) | | | 52,852 | | | | 52,841 | | |
23
FPA NEW INCOME FUND
SCHEDULE OF INVESTMENTS (Continued)
As of September 30, 2023
| BONDS & DEBENTURES — Continued | | Principal
Amount | | Value | |
Owl Rock CLO VI Ltd.
Series 2021-6A, Class A, 7.109% (3-Month Term SOFR+171.161
basis points), 6/21/2032(a),(b) | | | $66,692,000 | | | | $65,323,213 | | |
Parliament CLO II Ltd.
Series 2021-2A, Class A, 6.991% (3-Month Term SOFR+161.161
basis points), 8/20/2032(a),(b) | | | 40,086,125 | | | | 39,251,772 | | |
Parliament Funding II Ltd.
Series 2020-1A, Class AR, 6.838% (3-Month Term SOFR+151.161
basis points), 10/20/2031(a),(b) | | | 39,877,451 | | | | 39,390,428 | | |
Saranac CLO III Ltd.
Series 2014-3A, Class ALR, 7.258% (3-Month USD Libor+160
basis points), 6/22/2030(a),(b) | | | 15,749,533 | | | | 15,728,272 | | |
VCP CLO II Ltd.
Series 2021-2A, Class A1, 7.239% (3-Month Term SOFR+193.161
basis points), 4/15/2031(a),(b) | | | 101,155,000 | | | | 100,327,249 | | |
Woodmont Trust
Series 2019-6A, Class A1R, 7.050% (3-Month Term SOFR+174.161
basis points), 7/15/2031(a),(b) | | | 62,588,000 | | | | 61,934,456 | | |
Series 2019-6A, Class A1R2, 7.050% (3-Month Term SOFR+174.161
basis points), 7/15/2031(a),(b) | | | 16,952,000 | | | | 16,774,987 | | |
| | $ | 950,848,048 | | |
CREDIT CARD — 3.5% | |
American Express Credit Account Master Trust
Series 2022-2, Class A, 3.390%, 5/15/2027 | | $ | 53,566,000 | | | $ | 51,778,079 | | |
Series 2023-2, Class A, 4.800%, 5/15/2030 | | | 66,293,000 | | | | 65,084,810 | | |
Series 2023-4, Class A, 5.150%, 9/16/2030 | | | 62,969,000 | | | | 62,708,352 | | |
Chase Issuance Trust
Series 2023-A2, Class A, 5.080%, 9/16/2030 | | | 45,545,000 | | | | 44,913,578 | | |
Discover Card Execution Note Trust
Series 2022-A2, Class A, 3.320%, 5/15/2027 | | | 50,645,000 | | | | 48,858,027 | | |
| | $ | 273,342,846 | | |
EQUIPMENT — 16.7% | |
ARI Fleet Lease Trust
Series 2022-A, Class A3, 3.430%, 1/15/2031(a) | | $ | 10,094,000 | | | $ | 9,742,934 | | |
Avis Budget Rental Car Funding AESOP LLC
Series 2019-3A, Class A, 2.360%, 3/20/2026(a) | | | 8,591,000 | | | | 8,194,481 | | |
Series 2021-2A, Class A, 1.660%, 2/20/2028(a) | | | 4,211,000 | | | | 3,679,291 | | |
Series 2023-1A, Class A, 5.250%, 4/20/2029(a) | | | 13,136,000 | | | | 12,688,178 | | |
Series 2023-4A, Class A, 5.490%, 6/20/2029(a) | | | 38,251,000 | | | | 37,223,639 | | |
Series 2023-6A, Class A, 5.810%, 12/20/2029(a) | | | 48,017,000 | | | | 47,341,607 | | |
Series 2023-8A, Class A, 6.020%, 2/20/2030(a) | | | 34,038,000 | | | | 33,758,197 | | |
24
FPA NEW INCOME FUND
SCHEDULE OF INVESTMENTS (Continued)
As of September 30, 2023
| BONDS & DEBENTURES — Continued | | Principal
Amount | | Value | |
CNH Equipment Trust
Series 2021-B, Class A3, 0.440%, 8/17/2026 | | $ | 1,389,305 | | | $ | 1,333,366 | | |
Series 2022-A, Class A3, 2.940%, 7/15/2027 | | | 19,831,000 | | | | 18,998,066 | | |
Series 2022-B, Class A4, 3.910%, 3/15/2028 | | | 7,414,000 | | | | 7,058,113 | | |
Series 2023-A, Class A4, 4.770%, 10/15/2030 | | | 6,738,000 | | | | 6,569,347 | | |
Series 2023-B, Class A4, 5.460%, 3/17/2031 | | | 17,009,000 | | | | 16,957,575 | | |
Coinstar Funding LLC
Series 2017-1A, Class A2, 5.216%, 4/25/2047(a) | | | 12,024,375 | | | | 10,072,126 | | |
Dell Equipment Finance Trust
Series 2022-2, Class B, 4.400%, 7/22/2027(a) | | | 5,100,000 | | | | 4,958,885 | | |
Series 2022-2, Class C, 4.740%, 7/22/2027(a) | | | 4,700,000 | | | | 4,523,036 | | |
Series 2022-1, Class C, 2.940%, 8/23/2027(a) | | | 17,567,000 | | | | 17,000,552 | | |
Enterprise Fleet Financing LLC
Series 2022-2, Class A3, 4.790%, 5/21/2029(a) | | | 32,246,000 | | | | 31,348,581 | | |
Series 2022-3, Class A3, 4.290%, 7/20/2029(a) | | | 9,703,000 | | | | 9,285,914 | | |
Series 2023-1, Class A3, 5.420%, 10/22/2029(a) | | | 28,811,000 | | | | 28,274,891 | | |
Series 2022-4, Class A3, 5.650%, 10/22/2029(a) | | | 18,980,000 | | | | 18,849,235 | | |
Series 2023-2, Class A3, 5.500%, 4/22/2030(a) | | | 37,963,000 | | | | 37,234,904 | | |
Enterprise Fleet Funding LLC
Series 2021-1, Class A3, 0.700%, 12/21/2026(a) | | | 2,050,000 | | | | 1,964,693 | | |
Ford Credit Floorplan Master Owner Trust A
Series 2020-2, Class A, 1.060%, 9/15/2027 | | | 5,070,000 | | | | 4,620,664 | | |
Series 2018-4, Class A, 4.060%, 11/15/2030 | | | 78,467,000 | | | | 72,948,196 | | |
GMF Floorplan Owner Revolving Trust
Series 2023-2, Class A, 5.340%, 6/15/2030(a) | | | 18,848,000 | | | | 18,579,041 | | |
GreatAmerica Leasing Receivables
Series 2023-1, Class A4, 5.060%, 3/15/2030(a) | | | 16,501,000 | | | | 16,024,727 | | |
GreatAmerica Leasing Receivables Funding LLC
Series 2022-1, Class A4, 5.350%, 7/16/2029(a) | | | 17,738,000 | | | | 17,569,296 | | |
Hertz Vehicle Financing III LLC
Series 2023-4A, Class A, 6.150%, 3/25/2030(a) | | | 31,918,000 | | | | 31,752,799 | | |
Hertz Vehicle Financing III LP
Series 2021-2A, Class A, 1.680%, 12/27/2027(a) | | | 44,631,000 | | | | 39,180,885 | | |
Hertz Vehicle Financing LLC
Series 2022-4A, Class A, 3.730%, 9/25/2026(a) | | | 11,875,000 | | | | 11,393,107 | | |
Series 2022-2A, Class A, 2.330%, 6/26/2028(a) | | | 38,642,000 | | | | 34,160,475 | | |
Series 2022-5A, Class A, 3.890%, 9/25/2028(a) | | | 72,333,000 | | | | 66,738,816 | | |
HPEFS Equipment Trust
Series 2022-2A, Class B, 4.200%, 9/20/2029(a) | | | 9,732,000 | | | | 9,340,713 | | |
Series 2022-2A, Class C, 4.430%, 9/20/2029(a) | | | 5,634,000 | | | | 5,383,899 | | |
25
FPA NEW INCOME FUND
SCHEDULE OF INVESTMENTS (Continued)
As of September 30, 2023
| BONDS & DEBENTURES — Continued | | Principal
Amount | | Value | |
John Deere Owner Trust
Series 2022-B, Class A4, 3.800%, 5/15/2029 | | $ | 17,226,000 | | | $ | 16,496,970 | | |
Series 2023-A, Class A4, 5.010%, 12/17/2029 | | | 15,675,000 | | | | 15,514,986 | | |
Series 2023-B, Class A4, 5.110%, 5/15/2030 | | | 11,706,000 | | | | 11,498,229 | | |
Series 2023-C, Class A4, 5.390%, 8/15/2030 | | | 15,742,000 | | | | 15,681,414 | | |
Kubota Credit Owner Trust
Series 2022-1A, Class A3, 2.670%, 10/15/2026(a) | | | 88,222,000 | | | | 84,360,991 | | |
Series 2022-2A, Class A4, 4.170%, 6/15/2028(a) | | | 34,050,000 | | | | 32,463,726 | | |
Series 2023-2A, Class A4, 5.230%, 6/15/2028(a) | | | 12,897,000 | | | | 12,712,030 | | |
Series 2023-1A, Class A4, 5.070%, 2/15/2029(a) | | | 9,456,000 | | | | 9,313,971 | | |
M&T Equipment Notes
Series 2023-1A, Class A4, 5.750%, 7/15/2030(a) | | | 9,785,000 | | | | 9,656,219 | | |
MMAF Equipment Finance LLC
Series 2023-A, Class A4, 5.500%, 12/13/2038(a) | | | 24,563,000 | | | | 24,254,614 | | |
Series 2020-A, Class A5, 1.560%, 10/9/2042(a) | | | 7,081,000 | | | | 6,163,709 | | |
NextGear Floorplan Master Owner Trust
Series 2022-1A, Class A2, 2.800%, 3/15/2027(a) | | | 72,271,000 | | | | 69,092,218 | | |
Prosper Marketplace Issuance Trust
Series 2017-1A, 5.300%, 3/15/2042(c) | | | 16,279,678 | | | | 13,878,426 | | |
Verizon Master Trust
Series 2022-4, Class A, 3.400%, 11/20/2028 | | | 77,914,000 | | | | 75,040,158 | | |
Series 2022-4, Class B, 3.640%, 11/20/2028 | | | 34,616,000 | | | | 32,757,328 | | |
Series 2022-4, Class C, 3.890%, 11/20/2028 | | | 8,987,000 | | | | 8,497,777 | | |
Series 2022-6, Class A, 3.670%, 1/22/2029 | | | 37,943,000 | | | | 36,605,115 | | |
Series 2023-3, Class A, 4.730%, 4/21/2031(a) | | | 59,567,000 | | | | 58,640,048 | | |
Series 2023-6, Class A, 5.350%, 9/22/2031(a) | | | 76,585,000 | | | | 76,151,690 | | |
| | $ | 1,303,529,848 | | |
NON-AGENCY — 0.3% | |
Progress Residential Trust
Series 2023-SFR2, Class A, 4.500%, 10/17/2028(a) | | $ | 27,217,000 | | | $ | 25,541,984 | | |
OTHER — 11.2% | |
ABPCI Direct Lending Fund ABS I Ltd.
Series 2020-1A, Class A, 3.199%, 12/20/2030(a) | | $ | 37,013,521 | | | $ | 34,843,788 | | |
ABPCI Direct Lending Fund ABS II LLC
Series 2022-2A, Class A1, 7.457% (3-Month Term SOFR+210
basis points), 3/1/2032(a),(b) | | | 26,204,000 | | | | 25,968,164 | | |
Cologix Data Centers US Issuer LLC
Series 2021-1A, Class A2, 3.300%, 12/26/2051(a) | | | 58,068,000 | | | | 51,166,183 | | |
26
FPA NEW INCOME FUND
SCHEDULE OF INVESTMENTS (Continued)
As of September 30, 2023
| BONDS & DEBENTURES — Continued | | Principal
Amount | | Value | |
DataBank Issuer
Series 2021-1A, Class A2, 2.060%, 2/27/2051(a) | | $ | 14,750,000 | | | $ | 12,947,431 | | |
Elm Trust
Series 2020-3A, Class A2, 2.954%, 8/20/2029(a) | | | 8,016,482 | | | | 7,529,144 | | |
Series 2020-4A, Class A2, 2.286%, 10/20/2029(a) | | | 7,970,271 | | | | 7,375,306 | | |
FCI Funding LLC
Series 2021-1A, Class A, 1.130%, 4/15/2033(a) | | | 2,803,401 | | | | 2,720,533 | | |
Golub Capital Partners ABS Funding Ltd.
Series 2020-1A, Class A2, 3.208%, 1/22/2029(a) | | | 31,156,087 | | | | 29,498,583 | | |
Series 2021-1A, Class A2, 2.773%, 4/20/2029(a) | | | 56,366,000 | | | | 52,517,104 | | |
Series 2021-2A, Class A, 2.944%, 10/19/2029(a) | | | 95,445,000 | | | | 84,033,978 | | |
Louisiana Local Government Environmental Facilities & Community
Development Auth Rev. 3.615%, 2/1/2029 | | | 38,683,391 | | | | 37,202,328 | | |
Monroe Capital ABS Funding Ltd.
Series 2021-1A, Class A2, 2.815%, 4/22/2031(a) | | | 45,379,000 | | | | 43,333,542 | | |
Oklahoma Development Finance Authority
4.135%, 12/1/2033 | | | 29,797,806 | | | | 28,032,776 | | |
4.285%, 2/1/2034 | | | 10,600,097 | | | | 10,184,763 | | |
3.877%, 5/1/2037 | | | 24,775,835 | | | | 22,813,273 | | |
Oportun Funding XIV LLC
Series 2021-A, Class A, 1.210%, 3/8/2028(a) | | | 6,565,494 | | | | 6,333,373 | | |
Oportun Issuance Trust
Series 2021-C, Class A, 2.180%, 10/8/2031(a) | | | 64,181,000 | | | | 58,339,348 | | |
PFS Financing Corp.
Series 2022-A, Class A, 2.470%, 2/15/2027(a) | | | 105,379,000 | | | | 100,559,386 | | |
Series 2022-A, Class B, 2.770%, 2/15/2027(a) | | | 21,651,000 | | | | 20,517,282 | | |
Series 2022-C, Class A, 3.890%, 5/15/2027(a) | | | 77,233,000 | | | | 74,739,911 | | |
Series 2022-C, Class B, 4.390%, 5/15/2027(a) | | | 11,913,000 | | | | 11,541,391 | | |
Series 2022-D, Class A, 4.270%, 8/15/2027(a) | | | 71,781,000 | | | | 69,909,870 | | |
SpringCastle America Funding LLC
Series 2020-AA, Class A, 1.970%, 9/25/2037(a) | | | 14,347,392 | | | | 12,981,491 | | |
Texas Natural Gas Securitization Finance Corp.
5.102%, 4/1/2035 | | | 8,561,000 | | | | 8,373,805 | | |
TVEST LLC
Series 2020-A, Class A, 4.500%, 7/15/2032(a) | | | 1,696,361 | | | | 1,681,677 | | |
Vantage Data Centers Issuer LLC
Series 2020-1A, Class A2, 1.645%, 9/15/2045(a) | | | 19,214,000 | | | | 17,301,928 | | |
VCP RRL ABS I Ltd.
Series 2021-1A, Class A, 2.152%, 10/20/2031(a) | | | 39,655,209 | | | | 36,055,745 | | |
27
FPA NEW INCOME FUND
SCHEDULE OF INVESTMENTS (Continued)
As of September 30, 2023
| BONDS & DEBENTURES — Continued | | Principal
Amount | | Value | |
WEPCo Environmental Trust Finance LLC
Series 2021-1, Class A, 1.578%, 12/15/2035 | | $ | 10,109,233 | | | $ | 8,340,411 | | |
| | $ | 876,842,514 | | |
| TOTAL ASSET-BACKED SECURITIES (Cost $4,548,099,157) | | $ | 4,406,425,539 | | |
COMMERCIAL MORTGAGE-BACKED SECURITIES — 19.7% | |
AGENCY — 11.1% | |
Federal Home Loan Mortgage Corp.
Series K051, Class A2, 3.308%, 9/25/2025 | | $ | 38,614,000 | | | $ | 37,091,485 | | |
Series K054, Class A2, 2.745%, 1/25/2026 | | | 3,600,000 | | | | 3,397,592 | | |
Series K057, Class A2, 2.570%, 7/25/2026 | | | 87,324,000 | | | | 81,399,626 | | |
Series K058, Class A2, 2.653%, 8/25/2026 | | | 13,173,000 | | | | 12,253,479 | | |
Series K061, Class A2, 3.347%, 11/25/2026(b) | | | 78,855,000 | | | | 74,638,521 | | |
Series K062, Class A2, 3.413%, 12/25/2026 | | | 41,061,276 | | | | 38,831,788 | | |
Series K063, Class A2, 3.430%, 1/25/2027(b) | | | 16,539,000 | | | | 15,644,806 | | |
Series K065, Class A2, 3.243%, 4/25/2027 | | | 9,702,802 | | | | 9,106,518 | | |
Series K066, Class A2, 3.117%, 6/25/2027 | | | 7,223,000 | | | | 6,724,660 | | |
Series K068, Class A2, 3.244%, 8/25/2027 | | | 8,509,735 | | | | 7,929,427 | | |
Series K072, Class A2, 3.444%, 12/25/2027 | | | 12,338,034 | | | | 11,529,101 | | |
Series K073, Class A2, 3.350%, 1/25/2028 | | | 29,086,020 | | | | 27,056,691 | | |
Series K076, Class A2, 3.900%, 4/25/2028 | | | 16,051,256 | | | | 15,226,701 | | |
Series K077, Class A2, 3.850%, 5/25/2028(b) | | | 4,086,000 | | | | 3,864,737 | | |
Series K079, Class A2, 3.926%, 6/25/2028 | | | 30,559,000 | | | | 28,946,172 | | |
Series K080, Class A2, 3.926%, 7/25/2028(b) | | | 23,177,000 | | | | 21,937,941 | | |
Series K081, Class A2, 3.900%, 8/25/2028(b) | | | 62,589,000 | | | | 59,110,666 | | |
Series K082, Class A2, 3.920%, 9/25/2028(b) | | | 45,702,000 | | | | 43,164,657 | | |
Series K083, Class A2, 4.050%, 9/25/2028(b) | | | 23,453,000 | | | | 22,269,543 | | |
Series K084, Class A2, 3.780%, 10/25/2028(b) | | | 55,047,723 | | | | 51,494,739 | | |
Series K085, Class A2, 4.060%, 10/25/2028(b) | | | 27,924,000 | | | | 26,525,566 | | |
Series K089, Class A2, 3.563%, 1/25/2029 | | | 24,117,714 | | | | 22,309,148 | | |
Series K091, Class A2, 3.505%, 3/25/2029 | | | 16,203,000 | | | | 14,927,382 | | |
Series K093, Class A2, 2.982%, 5/25/2029 | | | 3,986,000 | | | | 3,568,365 | | |
Series K095, Class A2, 2.785%, 6/25/2029 | | | 77,253,000 | | | | 68,237,328 | | |
Series K094, Class A2, 2.903%, 6/25/2029 | | | 60,450,000 | | | | 53,711,300 | | |
Series K097, Class A2, 2.508%, 7/25/2029 | | | 40,814,000 | | | | 35,366,086 | | |
Series K096, Class A2, 2.519%, 7/25/2029 | | | 77,308,000 | | | | 67,116,169 | | |
| | $ | 863,380,194 | | |
28
FPA NEW INCOME FUND
SCHEDULE OF INVESTMENTS (Continued)
As of September 30, 2023
| BONDS & DEBENTURES — Continued | | Principal
Amount | | Value | |
AGENCY STRIPPED — 0.4% | |
Government National Mortgage Association
Series 2014-77, Class IO, 0.580%, 12/16/2047(b) | | $ | 11,168,121 | | | $ | 106,048 | | |
Series 2012-25, Class IO, 0.398%, 8/16/2052(b) | | | 495,939 | | | | 193 | | |
Series 2012-150, Class IO, 0.437%, 11/16/2052(b) | | | 16,844,778 | | | | 267,470 | | |
Series 2012-114, Class IO, 0.621%, 1/16/2053(b) | | | 14,977,448 | | | | 296,663 | | |
Series 2012-125, Class IO, 0.176%, 2/16/2053(b) | | | 36,655,160 | | | | 229,564 | | |
Series 2012-79, Class IO, 0.353%, 3/16/2053(b) | | | 37,038,850 | | | | 473,812 | | |
Series 2012-45, Class IO, 0.000%, 4/16/2053(b),(e) | | | 973,999 | | | | 1 | | |
Series 2013-45, Class IO, 0.085%, 12/16/2053(b) | | | 21,363,524 | | | | 20,966 | | |
Series 2013-125, Class IO, 0.229%, 10/16/2054(b) | | | 7,037,361 | | | | 101,464 | | |
Series 2014-157, Class IO, 0.190%, 5/16/2055(b) | | | 24,687,616 | | | | 175,670 | | |
Series 2014-153, Class IO, 0.341%, 4/16/2056(b) | | | 29,169,639 | | | | 384,120 | | |
Series 2014-175, Class IO, 0.536%, 4/16/2056(b) | | | 66,809,696 | | | | 1,129,284 | | |
Series 2014-138, Class IO, 0.539%, 4/16/2056(b) | | | 5,280,691 | | | | 102,171 | | |
Series 2014-187, Class IO, 0.617%, 5/16/2056(b) | | | 67,177,905 | | | | 1,506,706 | | |
Series 2015-41, Class IO, 0.277%, 9/16/2056(b) | | | 7,274,069 | | | | 88,797 | | |
Series 2015-108, Class IO, 0.337%, 10/16/2056(b) | | | 1,489,912 | | | | 19,632 | | |
Series 2014-110, Class IO, 0.181%, 1/16/2057(b) | | | 12,474,861 | | | | 75,240 | | |
Series 2015-19, Class IO, 0.295%, 1/16/2057(b) | | | 27,941,729 | | | | 417,458 | | |
Series 2015-7, Class IO, 0.454%, 1/16/2057(b) | | | 16,901,265 | | | | 336,847 | | |
Series 2015-169, Class IO, 0.258%, 7/16/2057(b) | | | 45,063,455 | | | | 584,009 | | |
Series 2015-150, Class IO, 0.364%, 9/16/2057(b) | | | 7,641,003 | | | | 147,639 | | |
Series 2016-125, Class IO, 0.829%, 12/16/2057(b) | | | 53,439,174 | | | | 2,046,373 | | |
Series 2016-65, Class IO, 0.494%, 1/16/2058(b) | | | 29,348,653 | | | | 710,182 | | |
Series 2016-106, Class IO, 0.969%, 9/16/2058(b) | | | 84,781,601 | | | | 3,818,563 | | |
Series 2020-43, Class IO, 1.260%, 11/16/2061(b) | | | 42,256,542 | | | | 3,127,677 | | |
Series 2020-71, Class IO, 1.086%, 1/16/2062(b) | | | 55,397,356 | | | | 3,739,698 | | |
Series 2020-75, Class IO, 0.869%, 2/16/2062(b) | | | 100,289,504 | | | | 5,965,551 | | |
Series 2020-42, Class IO, 0.937%, 3/16/2062(b) | | | 126,353,057 | | | | 7,756,839 | | |
| | $ | 33,628,637 | | |
NON-AGENCY — 8.2% | |
A10 Bridge Asset Financing LLC
Series 2021-D, Class A1FX, 2.589%, 10/1/2038(a) | | $ | 6,174,991 | | | $ | 5,824,494 | | |
ACRE Commercial Mortgage Ltd.
Series 2021-FL4, Class A, 6.275% (1-Month Term SOFR+94.448
basis points), 12/18/2037(a),(b) | | | 6,551,002 | | | | 6,507,052 | | |
ACRES Commercial Realty Ltd.
Series 2021-FL1, Class A, 6.647% (1-Month Term SOFR+131.448
basis points), 6/15/2036(a),(b) | | | 55,344,441 | | | | 54,412,059 | | |
Series 2021-FL2, Class A, 6.847% (1-Month Term SOFR+151.448
basis points), 1/15/2037(a),(b) | | | 13,444,000 | | | | 13,310,478 | | |
29
FPA NEW INCOME FUND
SCHEDULE OF INVESTMENTS (Continued)
As of September 30, 2023
| BONDS & DEBENTURES — Continued | | Principal
Amount | | Value | |
Arbor Realty Commercial Real Estate Notes Ltd.
Series 2021-FL1, Class A, 6.417% (1-Month Term SOFR+108.448
basis points), 12/15/2035(a),(b) | | | $14,920,000 | | | | $14,778,966 | | |
Series 2021-FL2, Class A, 6.547% (1-Month Term SOFR+121.448
basis points), 5/15/2036(a),(b) | | | 45,859,000 | | | | 45,442,279 | | |
Series 2021-FL4, Class A, 6.797% (1-Month Term SOFR+146.448
basis points), 11/15/2036(a),(b) | | | 59,062,000 | | | | 58,491,113 | | |
Series 2022-FL1, Class A, 6.763% (30-Day SOFR Average+145
basis points), 1/15/2037(a),(b) | | | 57,822,000 | | | | 57,171,474 | | |
Series 2022-FL2, Class A, 7.182% (1-Month Term SOFR+185
basis points), 5/15/2037(a),(b) | | | 35,540,000 | | | | 35,401,799 | | |
BBCMS Trust
Series 2015-SRCH, Class A1, 3.312%, 8/10/2035(a) | | | 10,440,595 | | | | 9,603,930 | | |
BDS Ltd. | |
Series 2021-FL8, Class A, 6.365% (1-Month Term SOFR+103.448
basis points), 1/18/2036(a),(b) | | | 11,823,494 | | | | 11,718,792 | | |
BX Commercial Mortgage Trust | |
Series 2021-VOLT, Class E, 7.446% (1-Month Term SOFR+211.448
basis points), 9/15/2036(a),(b) | | | 28,900,000 | | | | 27,563,225 | | |
HERA Commercial Mortgage Ltd. | |
Series 2021-FL1, Class A, 6.495% (1-Month Term SOFR+116.448
basis points), 2/18/2038(a),(b) | | | 47,157,048 | | | | 45,780,849 | | |
Independence Plaza Trust
Series 2018-INDP, Class A, 3.763%, 7/10/2035(a) | | | 11,081,000 | | | | 10,412,921 | | |
JPMBB Commercial Mortgage Securities Trust
Series 2015-C30, Class ASB, 3.559%, 7/15/2048 | | | 2,088,589 | | | | 2,045,192 | | |
Series 2015-C31, Class A3, 3.801%, 8/15/2048 | | | 7,556,451 | | | | 7,131,869 | | |
KREF Ltd. | |
Series 2021-FL2, Class A, 6.517% (1-Month Term SOFR+118.448
basis points), 2/15/2039(a),(b) | | | 19,179,000 | | | | 18,770,261 | | |
LCCM Trust | |
Series 2021-FL2, Class A, 6.647% (1-Month Term SOFR+131.448
basis points), 12/13/2038(a),(b) | | | 9,121,958 | | | | 8,977,798 | | |
LoanCore Issuer Ltd. | |
Series 2021-CRE4, Class A, 6.228% (30-Day SOFR Average+91.448
basis points), 7/15/2035(a),(b) | | | 3,621,183 | | | | 3,600,426 | | |
Series 2021-CRE5, Class A, 6.747% (1-Month USD Libor+130
basis points), 7/15/2036(a),(b) | | | 8,879,000 | | | | 8,686,631 | | |
MF1 Ltd. | |
Series 2020-FL4, Class A, 7.146% (1-Month Term SOFR+181.448
basis points), 11/15/2035(a),(b) | | | 9,042,657 | | | | 9,024,407 | | |
30
FPA NEW INCOME FUND
SCHEDULE OF INVESTMENTS (Continued)
As of September 30, 2023
| BONDS & DEBENTURES — Continued | | Principal
Amount | | Value | |
Progress Residential Trust
Series 2021-SFR11, Class A, 2.283%, 1/17/2039(a) | | $ | 13,809,396 | | | $ | 11,508,012 | | |
Series 2021-SFR7, Class A, 1.692%, 8/17/2040(a) | | | 14,323,782 | | | | 11,743,759 | | |
Series 2021-SFR9, Class A, 2.013%, 11/17/2040(a) | | | 8,797,640 | | | | 7,336,064 | | |
Series 2021-SFR10, Class A, 2.393%, 12/17/2040(a) | | | 56,864,236 | | | | 47,565,882 | | |
Ready Capital Mortgage Financing LLC | |
Series 2021-FL5, Class A, 6.434% (1-Month Term SOFR+111.448
basis points), 4/25/2038(a),(b) | | | 10,267,028 | | | | 10,164,275 | | |
Shelter Growth CRE Issuer Ltd. | |
Series 2021-FL3, Class A, 6.527% (1-Month Term SOFR+119.448
basis points), 9/15/2036(a),(b) | | | 9,885,030 | | | | 9,759,664 | | |
STWD Ltd. | |
Series 2021-FL2, Class A, 6.645% (1-Month Term SOFR+131.448
basis points), 4/18/2038(a),(b) | | | 33,755,000 | | | | 32,860,452 | | |
TRTX Issuer Ltd. | |
Series 2022-FL5, Class A, 6.963% (30-Day SOFR Average+165
basis points), 2/15/2039(a),(b) | | | 37,857,000 | | | | 37,104,327 | | |
VMC Finance LLC | |
Series 2021-HT1, Class A, 7.095% (1-Month Term SOFR+176.448
basis points), 1/18/2037(a),(b) | | | 20,143,100 | | | | 19,663,831 | | |
| | $ | 642,362,281 | | |
TOTAL COMMERCIAL MORTGAGE-BACKED SECURITIES
(Cost $1,605,655,682) | | $ | 1,539,371,112 | | |
CORPORATE BANK DEBT — 0.9% | |
Axiom Global, Inc.
10.175% (1-Month Term SOFR+475 basis points), 10/1/2026(b),(d),(f) | | $ | 22,718,997 | | | $ | 21,980,630 | | |
Capstone Acquisition Holdings, Inc. 2020 Delayed Draw Term Loan
10.165% (1-Month Term SOFR+0.000 basis points),
11/12/2027(c),(d),(f),(g) | | | 1,072,728 | | | | 1,029,819 | | |
Capstone Acquisition Holdings, Inc. 2020 Term Loan
10.165% (1-Month Term SOFR+0.000 basis points), 11/12/2027(c),(d),(f) | | | 18,440,272 | | | | 17,702,661 | | |
Frontier Communications Holdings LLC
9.179% (1-Month Term SOFR+375 basis points), 10/8/2027(b),(d),(f) | | | 23,204,025 | | | | 22,522,523 | | |
JC Penney Corp., Inc.
9.384% (1-Month USD Libor+425 basis points), 6/23/2025*,(b),(d),(f) | | | 27,218,055 | | | | 2,722 | | |
Lealand Finance Company B.V. Senior Exit LC
10.069%, 6/30/2024(c),(d),(f),(g),(h) | | | 12,477,102 | | | | (3,493,589 | ) | |
31
FPA NEW INCOME FUND
SCHEDULE OF INVESTMENTS (Continued)
As of September 30, 2023
| BONDS & DEBENTURES — Continued | | Principal
Amount | | Value | |
McDermott Tanks Secured LC
10.066%, 12/31/2026(c),(d),(f),(g) | | $ | 4,292,898 | | | $ | (601,005 | ) | |
Windstream Services LLC
11.664% (1-Month Term SOFR+625 basis points), 9/21/2027(b),(d),(f) | | | 13,030,760 | | | | 12,428,087 | | |
| TOTAL CORPORATE BANK DEBT (Cost $77,321,481) | | $ | 71,571,848 | | |
CORPORATE BONDS — 7.6% | |
COMMUNICATIONS — 0.1% | |
Frontier Communications Holdings LLC
5.875%, 10/15/2027(a) | | $ | 5,925,000 | | | $ | 5,367,043 | | |
CONSUMER DISCRETIONARY — 0.2% | |
Amazon.com, Inc.
1.650%, 5/12/2028 | | $ | 22,427,000 | | | $ | 19,300,284 | | |
FINANCIALS — 4.4% | |
American Tower Trust 1
5.490%, 3/15/2028(a) | | $ | 77,012,000 | | | $ | 75,448,579 | | |
Apollo Debt Solution Delayed Draw Term Loan
8.620%, 9/28/2028(c),(d),(f),(g) | | | 26,023,000 | | | | 26,023,000 | | |
Ares Capital Corp.
2.875%, 6/15/2028 | | | 41,510,000 | | | | 34,659,024 | | |
Blackstone Private Credit Fund
3.250%, 3/15/2027 | | | 33,271,000 | | | | 28,875,335 | | |
Blue Owl Credit Income Corp.
5.500%, 3/21/2025 | | | 30,238,000 | | | | 29,250,236 | | |
4.700%, 2/8/2027 | | | 40,949,000 | | | | 37,165,984 | | |
7.750%, 9/16/2027 | | | 49,529,000 | | | | 49,127,929 | | |
7.950%, 6/13/2028(a) | | | 22,579,000 | | | | 22,400,610 | | |
SBA Tower Trust
1.631%, 11/15/2026(a) | | | 14,427,000 | | | | 12,494,333 | | |
2.328%, 1/15/2028(a) | | | 17,196,000 | | | | 14,595,994 | | |
6.599%, 1/15/2028(a) | | | 12,423,000 | | | | 12,428,448 | | |
| | $ | 342,469,472 | | |
HEALTH CARE — 0.5% | |
Heartland Dental LLC/Heartland Dental Finance Corp.
10.500% (1-Month Term SOFR+0.000 basis points), 4/30/2028(a),(d),(f) | | $ | 38,381,000 | | | $ | 38,381,000 | | |
32
FPA NEW INCOME FUND
SCHEDULE OF INVESTMENTS (Continued)
As of September 30, 2023
| BONDS & DEBENTURES — Continued | | Principal
Amount | | Value | |
TECHNOLOGY — 0.5% | |
Hlend Senior Notes
8.170%, 3/15/2028(c),(d) | | $ | 42,500,000 | | | $ | 42,500,000 | | |
UTILITIES — 1.9% | |
Brazos Securitization LLC
5.014%, 9/1/2031(a) | | $ | 9,560,553 | | | $ | 9,261,423 | | |
Cleco Securitization I LLC
4.016%, 3/1/2031 | | | 21,572,719 | | | | 20,043,546 | | |
Kansas Gas Service Securitization I LLC
5.486%, 8/1/2032 | | | 49,237,745 | | | | 48,597,502 | | |
PG&E Recovery Funding LLC
5.045%, 7/15/2032 | | | 25,126,227 | | | | 24,544,899 | | |
PG&E Wildfire Recovery Funding LLC
4.022%, 6/1/2031 | | | 50,415,477 | | | | 47,653,863 | | |
| | $ | 150,101,233 | | |
| TOTAL CORPORATE BONDS (Cost $612,333,363) | | $ | 598,119,032 | | |
RESIDENTIAL MORTGAGE-BACKED SECURITIES — 6.8% | |
AGENCY COLLATERALIZED MORTGAGE OBLIGATION — 0.1% | |
Federal Home Loan Mortgage Corp.
Series 3828, Class VE, 4.500%, 1/15/2024 | | $ | 61,120 | | | $ | 60,898 | | |
Series 3862, Class MB, 3.500%, 5/15/2026 | | | 2,632,569 | | | | 2,568,127 | | |
Series 3914, Class MA, 3.000%, 6/15/2026 | | | 268,440 | | | | 260,870 | | |
Series 3979, Class HD, 2.500%, 12/15/2026 | | | 285,896 | | | | 278,303 | | |
Series 4304, Class DA, 2.500%, 1/15/2027 | | | 44,262 | | | | 43,887 | | |
Series 4010, Class DE, 2.500%, 2/15/2027 | | | 369,740 | | | | 359,060 | | |
Series 4170, Class QE, 2.000%, 5/15/2032 | | | 447,509 | | | | 431,659 | | |
Federal National Mortgage Association
Series 2011-80, Class KB, 3.500%, 8/25/2026 | | | 1,559,422 | | | | 1,522,591 | | |
Series 2013-135, Class KM, 2.500%, 3/25/2028 | | | 7,312 | | | | 7,282 | | |
Series 2014-21, Class ED, 2.250%, 4/25/2029 | | | 18,463 | | | | 17,743 | | |
Series 2012-144, Class PD, 3.500%, 4/25/2042 | | | 1,303,942 | | | | 1,236,155 | | |
Series 2013-93, Class PJ, 3.000%, 7/25/2042 | | | 637,289 | | | | 595,210 | | |
| | $ | 7,381,785 | | |
AGENCY POOL ADJUSTABLE RATE — 0.0% | |
Federal National Mortgage Association
4.500% (RFUCCT1Y+190.6 basis points), 3/1/2036(b) | | $ | 262,013 | | | $ | 258,357 | | |
33
FPA NEW INCOME FUND
SCHEDULE OF INVESTMENTS (Continued)
As of September 30, 2023
| BONDS & DEBENTURES — Continued | | Principal
Amount | | Value | |
AGENCY POOL FIXED RATE — 1.8% | |
Federal Home Loan Mortgage Corp.
6.000%, 1/1/2024 | | $ | 44 | | | $ | 44 | | |
5.000%, 6/1/2024 | | | 1,140 | | | | 1,137 | | |
5.000%, 8/1/2024 | | | 9 | | | | 9 | | |
5.500%, 12/1/2024 | | | 6,179 | | | | 6,153 | | |
5.500%, 12/1/2024 | | | 90 | | | | 90 | | |
5.000%, 6/1/2026 | | | 3,025 | | | | 3,009 | | |
5.000%, 6/1/2026 | | | 21,357 | | | | 21,256 | | |
4.500%, 9/1/2026 | | | 172,004 | | | | 169,565 | | |
4.500%, 9/1/2026 | | | 29,870 | | | | 29,625 | | |
4.500%, 9/1/2026 | | | 183,129 | | | | 181,198 | | |
2.500%, 11/1/2027 | | | 1,601,174 | | | | 1,509,043 | | |
2.500%, 2/1/2028 | | | 1,164,987 | | | | 1,099,498 | | |
2.500%, 8/1/2028 | | | 587,500 | | | | 550,115 | | |
2.500%, 11/1/2028 | | | 65,402,026 | | | | 61,429,435 | | |
Federal National Mortgage Association
5.500%, 7/1/2025 | | | 1,479 | | | | 1,469 | | |
5.500%, 9/1/2025 | | | 4,109 | | | | 4,076 | | |
5.500%, 9/1/2025 | | | 205 | | | | 204 | | |
5.000%, 6/1/2026 | | | 3,255 | | | | 3,232 | | |
2.500%, 1/1/2028 | | | 640,912 | | | | 604,034 | | |
2.500%, 11/1/2030 | | | 32,747,126 | | | | 30,914,351 | | |
4.000%, 3/1/2031 | | | 1,525,942 | | | | 1,493,438 | | |
2.500%, 10/1/2031 | | | 4,011,610 | | | | 3,777,562 | | |
2.500%, 2/1/2035 | | | 39,900,271 | | | | 37,511,406 | | |
| | $ | 139,309,949 | | |
AGENCY STRIPPED — 0.0% | |
Federal Home Loan Mortgage Corp.
Series 217, Class PO, 0.000%, 1/1/2032(e) | | $ | 63,248 | | | $ | 52,103 | | |
Series 217, Class IO, 6.500%, 1/1/2032 | | | 60,901 | | | | 10,379 | | |
Federal National Mortgage Association
Series 2010-25, Class NI, 5.000%, 3/25/2025 | | | 2 | | | | — | | |
Series 2003-64, Class XI, 5.000%, 7/25/2033 | | | 170,645 | | | | 23,142 | | |
Series 2010-43, Class MK, 5.500%, 5/25/2040 | | | 376,620 | | | | 372,957 | | |
| | $ | 458,581 | | |
NON-AGENCY COLLATERALIZED MORTGAGE OBLIGATION — 4.9% | |
Cascade Funding Mortgage Trust
Series 2021-HB6, Class A, 0.898%, 6/25/2036(a),(b) | | $ | 11,171,981 | | | $ | 10,823,035 | | |
CFMT LLC
Series 2021-HB5, Class A, 0.801%, 2/25/2031(a),(b) | | | 16,202,934 | | | | 15,817,790 | | |
Series 2021-HB7, Class A, 1.151%, 10/27/2031(a),(b) | | | 13,985,237 | | | | 13,340,770 | | |
Series 2021-HB7, Class M1, 2.125%, 10/27/2031(a),(b) | | | 15,406,000 | | | | 14,259,177 | | |
34
FPA NEW INCOME FUND
SCHEDULE OF INVESTMENTS (Continued)
As of September 30, 2023
| BONDS & DEBENTURES — Continued | | Principal
Amount | | Value | |
Citigroup Mortgage Loan Trust
Series 2014-A, Class A, 4.000%, 1/25/2035(a),(b) | | $ | 2,319,225 | | | $ | 2,136,853 | | |
PRET LLC
Series 2021-NPL6, Class A1, 2.487%, 7/25/2051(a),(i) | | | 12,430,490 | | | | 11,660,873 | | |
Series 2021-NPL5, Class A1, 2.487%, 10/25/2051(a),(i) | | | 55,766,265 | | | | 52,396,376 | | |
Pretium Mortgage Credit Partners I LLC
Series 2021-NPL2, Class A1, 1.992%, 6/27/2060(a),(i) | | | 23,298,361 | | | | 21,461,043 | | |
Series 2021-NPL4, Class A1, 2.363%, 10/27/2060(a),(i) | | | 36,751,837 | | | | 33,859,232 | | |
PRPM LLC
Series 2021-2, Class A1, 2.115%, 3/25/2026(a),(b) | | | 15,434,655 | | | | 14,672,546 | | |
Series 2021-9, Class A1, 2.363%, 10/25/2026(a),(i) | | | 18,777,001 | | | | 17,566,769 | | |
Series 2021-10, Class A1, 2.487%, 10/25/2026(a),(i) | | | 24,628,160 | | | | 22,956,902 | | |
Series 2021-11, Class A1, 2.487%, 11/25/2026(a),(i) | | | 29,000,783 | | | | 27,035,101 | | |
Towd Point Mortgage Trust
Series 2018-2, Class A1, 3.250%, 3/25/2058(a),(b) | | | 18,862,573 | | | | 18,006,289 | | |
Series 2018-5, Class A1A, 3.250%, 7/25/2058(a),(b) | | | 11,792,629 | | | | 11,293,467 | | |
Series 2020-4, Class A1, 1.750%, 10/25/2060(a) | | | 8,705,631 | | | | 7,440,474 | | |
Series 2023-1, Class A1, 3.750%, 1/25/2063(a) | | | 24,156,157 | | | | 22,108,450 | | |
VCAT LLC
Series 2021-NPL1, Class A1, 2.289%, 12/26/2050(a),(i) | | | 2,417,068 | | | | 2,344,937 | | |
Series 2021-NPL2, Class A1, 2.115%, 3/27/2051(a),(i) | | | 15,472,886 | | | | 14,790,372 | | |
VOLT C LLC
Series 2021-NPL9, Class A1, 1.992%, 5/25/2051(a),(i) | | | 14,303,634 | | | | 13,148,117 | | |
VOLT XCIV LLC
Series 2021-NPL3, Class A1, 2.239%, 2/27/2051(a),(i) | | | 19,310,436 | | | | 18,519,658 | | |
VOLT XCV LLC
Series 2021-NPL4, Class A1, 2.240%, 3/27/2051(a),(i) | | | 18,603,680 | | | | 17,777,495 | | |
| | $ | 383,415,726 | | |
TOTAL RESIDENTIAL MORTGAGE-BACKED SECURITIES
(Cost $563,839,434) | | $ | 530,824,398 | | |
U.S. TREASURY NOTES & BONDS — 3.4% | |
United States Treasury Note
4.000%, 6/30/2028 | | $ | 30,609,000 | | | $ | 29,791,023 | | |
4.375%, 8/31/2028 | | | 201,103,000 | | | | 199,095,147 | | |
2.875%, 4/30/2029 | | | 43,157,000 | | | | 39,403,360 | | |
| TOTAL U.S. TREASURY NOTES & BONDS (Cost $269,889,393) | | $ | 268,289,530 | | |
| TOTAL BONDS & DEBENTURES (Cost $7,677,138,510) | | $ | 7,414,601,459 | | |
35
FPA NEW INCOME FUND
SCHEDULE OF INVESTMENTS (Continued)
As of September 30, 2023
| COMMON STOCKS — 1.5% | | Shares or
Principal
Amount | | Value | |
METALS & MINING — 0.5% | |
Boart Longyear Group Ltd.*,(c),(j) | | | 43,018,605 | | | $ | 41,212,449 | | |
REAL ESTATE SERVICES — 0.1% | |
Copper Earn Out Trust(c),(d) | | | 69,361 | | | $ | 59,650 | | |
Copper Property CTL Pass Through Trust(d) | | | 520,208 | | | | 5,514,205 | | |
| | $ | 5,573,855 | | |
TRANSPORTATION & LOGISTICS — 0.9% | |
PHI Group, Inc.*,(c),(d),(j) | | | 3,806,420 | | | $ | 69,467,165 | | |
| TOTAL COMMON STOCKS (Cost $139,264,410) | | $ | 116,253,469 | | |
SHORT-TERM INVESTMENTS — 3.7% | |
MONEY MARKET INVESTMENTS — 0.9% | |
Morgan Stanley Institutional Liquidity Treasury Portfolio — Institutional
Class, 5.14%(k) | | | 69,192,818 | | | $ | 69,192,818 | | |
TREASURY BILLS — 2.8% | |
U.S. Treasury Bill, 3.55%, 10/3/2023(l) | | $ | 222,347,000 | | | $ | 222,314,337 | | |
| TOTAL SHORT-TERM INVESTMENTS (Cost $291,474,966) | | $ | 291,507,155 | | |
| TOTAL INVESTMENTS — 100.0% (Cost $8,107,877,886) | | $ | 7,822,362,083 | | |
Liabilities in Excess of Other Assets — (0.0)% | | | (3,296,730 | ) | |
TOTAL NET ASSETS — 100.0% | | $ | 7,819,065,353 | | |
AR — Argentina
IO — Interest Only
LLC — Limited Liability Company
LP — Limited Partnership
US — United States
* Non-income producing security.
36
FPA NEW INCOME FUND
SCHEDULE OF INVESTMENTS (Continued)
As of September 30, 2023
(a) Security exempt from registration under Rule 144A of the Securities Act of 1933. These securities are restricted and may be resold in transactions exempt from registration normally to qualified institutional buyers. The total value of these securities is $4,273,627,547, which represents 54.66% of Net Assets.
(b) Variable or floating rate security.
(c) Level 3 securities fair valued under procedures established by the Board of Trustees, represents 2.90% of Net Assets. The total value of these securities is $226,735,760.
(d) Restricted securities. These restricted securities constituted 3.50% of total net assets at September 30, 2023, most of which are considered liquid by the Adviser. These securities are not registered and may not be sold to the public. There are legal and/or contractual restrictions on resale. The Fund does not have the right to demand that such securities be registered. The values of these securities are determined by valuations provided by pricing services, brokers, dealers, market makers, or in good faith under policies adopted by authority of the Fund's Board of Directors.
(e) Zero-coupon bond.
(f) Bank loans generally pay interest at rates which are periodically determined by reference to a base lending rate plus a premium. All loans carry a variable rate of interest. These base lending rates are generally (i) the Prime Rate offered by one or more major United States banks, (ii) the lending rate offered by one or more European banks such as the London Interbank Offered Rate ("LIBOR"), (iii) the Certificate of Deposit rate, or (iv) Secured Overnight Financing Rate ("SOFR"). Bank Loans, while exempt from registration, under the Securities Act of 1933, contain certain restrictions on resale and cannot be sold publicly. Floating rate bank loans often require prepayments from excess cash flow or permit the borrower to repay at its election. The degree to which borrowers repay, whether as a contractual requirement or at their election, cannot be predicted with accuracy.
(g) As of September 30, 2023, the Fund had entered into commitments to fund various delayed draw debt-related investments. Such commitments are subject to the satisfaction of certain conditions set forth in the documents governing those investments and there can be no assurance that such conditions will be satisfied. At September 30, 2023, unfunded commitments totaled $16,770,000.
(h) All or a portion of the loan is unfunded.
(i) Step rate security.
(j) Affiliated company.
(k) The rate is the annualized seven-day yield at period end.
(l) Treasury bill discount rate.
37
FPA NEW INCOME FUND
SUMMARY OF INVESTMENTS
As of September 30, 2023
| Security Type/Industry | | Percent of Total
Net Assets | |
Bonds & Debentures | |
Asset-Backed Securities | | | 56.4 | % | |
Commercial Mortgage-Backed Securities | | | 19.7 | % | |
Corporate Bonds | | | 7.6 | % | |
Residential Mortgage-Backed Securities | | | 6.8 | % | |
U.S. Treasury Notes & Bonds | | | 3.4 | % | |
| Corporate Bank Debt | | | 0.9 | % | |
Total Bonds & Debentures | | | 94.8 | % | |
Common Stocks | |
Transportation & Logistics | | | 0.9 | % | |
Metals & Mining | | | 0.5 | % | |
Real Estate Services | | | 0.1 | % | |
Total Common Stocks | | | 1.5 | % | |
Short-Term Investments | | | 3.7 | % | |
Total Investments | | | 100.0 | % | |
Liabilities in Excess of Other Assets | | | (0.0 | )% | |
Total Net Assets | | | 100.0 | % | |
38
FPA NEW INCOME FUND
SCHEDULE OF INVESTMENTS — RESTRICTED SECURITIES
As of September 30, 2023
Issuer
| | Initial
Acquisition
Date | |
Cost
| |
Fair Value
| | Fair
Value as a %
of Net Assets | |
Apollo Debt Solution Delayed Draw
Term Loan, 8.620%, 9/28/2028 | | 08/10/2023 | | $ | 26,023,000 | | | $ | 26,023,000 | | | 0.30% | |
Axiom Global, Inc., 10.175%
(1-Month Term SOFR+475
basis points), 10/01/2026 | | 11/18/2021 | | | 22,564,002 | | | | 21,980,630 | | | 0.30% | |
BTC Holdings Fund I LLC 8.362%,
01/28/2027 | | 09/01/2021 | | | 957,183 | | | | 957,183 | | | 0.00% | |
BTC Offshore Holdings Fund, 8.245%,
10/20/2029 | | 10/25/2021 | | | 18,000,000 | | | | 18,000,000 | | | 0.20% | |
Capstone Acquisition Holdings, Inc.
2020 Delayed Draw Term Loan, 10.165%
(1-Month Term SOFR+0.000
basis points), 11/12/2027 | | 04/30/2021 | | | 1,069,400 | | | | 1,029,819 | | | 0.00% | |
Capstone Acquisition Holdings, Inc.
2020 Term Loan, 10.165%
(1-Month Term SOFR+0.000
basis points), 11/12/2027 | | 04/30/2021 | | | 18,333,833 | | | | 17,702,661 | | | 0.20% | |
Copper Earn Out Trust | | 12/07/2020 | | | — | | | | 59,650 | | | 0.00% | |
Copper Property CTL Pass Through Trust | | 10/05/2017 | | | 25,752,396 | | | | 5,514,205 | | | 0.10% | |
Frontier Communications Holdings LLC,
9.179% (1-Month Term SOFR+375
basis points), 10/08/2027 | | 04/09/2021 | | | 23,042,674 | | | | 22,522,523 | | | 0.30% | |
Heartland Dental LLC/Heartland
Dental Finance Corp. 10.500%
(1-Month Term SOFR+0.000
basis points), 04/30/2028 | | 08/02/2021 | | | 38,046,791 | | | | 38,381,000 | | | 0.50% | |
Hlend Senior Notes, 8.170%, 03/15/2028 | | 02/16/2023 | | | 42,500,000 | | | | 42,500,000 | | | 0.50% | |
JC Penney Corp., Inc., 9.384%
(1-Month USD Libor+425
basis points), 06/23/2025 | | 02/03/2021 | | | — | | | | 2,722 | | | 0.00% | |
Lealand Finance Company B.V. Senior
Exit LC, 10.069%, 06/30/2024 | | 02/28/2020 | | | (28,324) | | | | (3,493,589) | | | 0.00% | |
McDermott Tanks Secured LC,
10.066%, 12/31/2026 | | 02/28/2020 | | | (9,672) | | | | (601,005) | | | 0.00% | |
PHI Group, Inc. | | 08/19/2019 | | | 31,131,405 | | | | 69,467,165 | | | 0.90% | |
Windstream Services LLC, 11.664%
(1-Month Term SOFR+625
basis points), 09/21/2027 | | 08/11/2020 | | | 12,349,568 | | | | 12,428,087 | | | 0.20% | |
| | | | $ | 259,732,256 | | | $ | 272,474,051 | | | 3.50% | |
See accompanying Notes to Financial Statements.
39
FPA NEW INCOME FUND
STATEMENT OF ASSETS AND LIABILITIES
As of September 30, 2023
ASSETS | |
Investments, at value (cost $7,994,365,872) | | $ | 7,711,682,469 | | |
Investments in affiliates, at value (cost $113,512,014) | | | 110,679,614 | | |
Receivables: | |
Investment securities sold | | | 55,132 | | |
Fund shares sold | | | 3,615,956 | | |
Dividends and interest | | | 34,022,123 | | |
Prepaid expenses | | | 37,362 | | |
Total assets | | | 7,860,092,656 | | |
LIABILITIES | |
Payables: | |
Investment securities purchased | | | 25,590,006 | | |
Fund shares redeemed | | | 11,125,031 | | |
Advisory fees | | | 2,332,196 | | |
Fund services fees | | | 1,465,201 | | |
Shareholder reporting fees | | | 157,808 | | |
Auditing fees | | | 50,930 | | |
Trustees' fees and expenses | | | 5,538 | | |
Chief Compliance Officer fees | | | 4,338 | | |
Accrued other expenses | | | 296,255 | | |
Total liabilities | | | 41,027,303 | | |
Commitments and contingencies (Note 7) | |
NET ASSETS | | $ | 7,819,065,353 | | |
COMPONENTS OF NET ASSETS | |
Capital Stock — par value $0.01 per share; authorized 1,500,000,000 shares;
outstanding 822,204,587 shares | | $ | 8,780,855,351 | | |
Total distributable earnings (accumulated deficit) | | | (961,789,998 | ) | |
NET ASSETS | | $ | 7,819,065,353 | | |
NUMBER OF SHARES ISSUED AND OUTSTANDING | | | 822,204,587 | | |
NET ASSET VALUE PER SHARE | | $ | 9.51 | | |
See accompanying Notes to Financial Statements.
40
FPA NEW INCOME FUND
STATEMENT OF OPERATIONS
For the Year Ended September 30, 2023
INVESTMENT INCOME | |
Dividends | | $ | 1,960,124 | | |
Dividends from affiliated issuers | | | 9,401,857 | | |
Interest | | | 340,169,902 | | |
Total investment income | | | 351,531,883 | | |
EXPENSES | |
Advisory fees | | | 42,033,178 | | |
Fund services fees | | | 6,058,516 | | |
Shareholder reporting fees | | | 479,297 | | |
Registration fees | | | 240,346 | | |
Trustees' fees and expenses | | | 231,909 | | |
Insurance fees | | | 140,746 | | |
Miscellaneous | | | 107,206 | | |
Legal fees | | | 101,422 | | |
Chief Compliance Officer fees | | | 89,827 | | |
Auditing fees | | | 52,755 | | |
Total expenses | | | 49,535,202 | | |
Advisory fees waived | | | (11,705,341 | ) | |
Net expenses | | | 37,829,861 | | |
Net investment income (loss) | | | 313,702,022 | | |
REALIZED AND UNREALIZED GAIN (LOSS) | |
Net realized gain (loss) on: | |
Investments | | | (117,023,775 | ) | |
Total realized gain (loss) | | | (117,023,775 | ) | |
Net change in unrealized appreciation (depreciation) on: | |
Investments | | | 146,384,939 | | |
Investments in affiliated issuers | | | 2,562,294 | | |
Net change in unrealized appreciation (depreciation) | | | 148,947,233 | | |
Net realized and unrealized gain (loss) | | | 31,923,458 | | |
NET INCREASE (DECREASE) IN NET ASSETS FROM OPERATIONS | | $ | 345,625,480 | | |
See accompanying Notes to Financial Statements.
41
FPA NEW INCOME FUND
STATEMENTS OF CHANGES IN NET ASSETS
| | For the Year Ended
September 30, 2023 | | For the Year Ended
September 30, 2022 | |
INCREASE (DECREASE) IN NET ASSETS FROM | |
Operations: | |
Net investment income (loss) | | $ | 313,702,022 | | | $ | 168,824,901 | | |
Total realized gain (loss) on investments | | | (117,023,775 | ) | | | (166,885,511 | ) | |
Net change in unrealized appreciation (depreciation)
on investments | | | 148,947,233 | | | | (422,683,796 | ) | |
Net increase (decrease) in net assets resulting
from operations | | | 345,625,480 | | | | (420,744,406 | ) | |
Distributions to Shareholders: | |
Total distributions to shareholders | | | (314,654,099 | ) | | | (167,625,868 | ) | |
Capital Transactions: | |
Net proceeds from shares sold | | | 2,447,040,759 | | | | 4,152,249,227 | | |
Reinvestment of distributions | | | 278,157,295 | | | | 145,427,559 | | |
Cost of shares redeemed | | | (4,402,768,672 | ) | | | (6,187,832,799 | ) | |
Net increase (decrease) in net assets from capital
transactions | | | (1,677,570,618 | ) | | | (1,890,156,013 | ) | |
Total increase (decrease) in net assets | | | (1,646,599,237 | ) | | | (2,478,526,287 | ) | |
NET ASSETS | |
Beginning of period | | | 9,465,664,590 | | | | 11,944,190,877 | | |
End of period | | $ | 7,819,065,353 | | | $ | 9,465,664,590 | | |
CAPITAL SHARE TRANSACTIONS | |
Shares sold | | | 257,247,782 | | | | 422,004,794 | | |
Shares reinvested | | | 29,263,126 | | | | 14,933,014 | | |
Shares redeemed | | | (462,666,892 | ) | | | (630,833,675 | ) | |
Net increase (decrease) in capital share transactions | | | (176,155,984 | ) | | | (193,895,867 | ) | |
See accompanying Notes to Financial Statements.
42
FPA NEW INCOME FUND
FINANCIAL HIGHLIGHTS
For the Year Ended September 30, 2023
Per share operating performance.
For a capital share outstanding throughout each period.
| | For the Year Ended | |
| | 2023 | | 2022 | | 2021 | | 2020 | | 2019 | |
Net asset value, beginning of period | | $ | 9.48 | | | $ | 10.02 | | | $ | 10.00 | | | $ | 10.00 | | | $ | 9.94 | | |
Income from Investment Operations: | |
Net investment income(1) | | | 0.36 | | | | 0.15 | | | | 0.13 | | | | 0.23 | | | | 0.28 | | |
Net realized and unrealized gain (loss) | | | 0.03 | | | | (0.53 | ) | | | 0.03 | | | | 0.01 | (2) | | | 0.13 | | |
Total from investment operations | | | 0.39 | | | | (0.38 | ) | | | 0.16 | | | | 0.24 | | | | 0.41 | | |
Less Distributions: | |
From net investment income | | | (0.36 | ) | | | (0.16 | ) | | | (0.14 | ) | | | (0.24 | ) | | | (0.35 | ) | |
Total distributions | | | (0.36 | ) | | | (0.16 | ) | | | (0.14 | ) | | | (0.24 | ) | | | (0.35 | ) | |
Net asset value, end of period | | $ | 9.51 | | | $ | 9.48 | | | $ | 10.02 | | | $ | 10.00 | | | $ | 10.00 | | |
Total return(3) | | | 4.21 | % | | | (3.87 | )% | | | 1.56 | % | | | 2.41 | % | | | 4.20 | % | |
Ratios and Supplemental Data: | |
Net assets, end of period (in thousands) | | $ | 7,819,065 | | | $ | 9,465,665 | | | $ | 11,944,191 | | | $ | 8,646,909 | | | $ | 7,327,404 | | |
Ratio of expenses to average net assets: | |
Before fees waived and expenses absorbed | | | 0.59 | % | | | 0.59 | % | | | 0.58 | % | | | 0.57 | % | | | 0.57 | % | |
After fees waived and expenses absorbed | | | 0.45 | % | | | 0.46 | % | | | 0.48 | % | | | 0.49 | %(4) | | | 0.50 | % | |
Ratio of net investment income (loss) to
average net assets: | |
Before fees waived and expenses absorbed | | | 3.59 | % | | | 1.43 | % | | | 1.18 | % | | | 2.24 | % | | | 2.73 | % | |
After fees waived and expenses absorbed | | | 3.73 | % | | | 1.56 | % | | | 1.28 | % | | | 2.32 | %(5) | | | 2.80 | % | |
| Portfolio turnover rate | | | 50 | % | | | 103 | % | | | 81 | % | | | 54 | % | | | 25 | % | |
(1) Based on average shares outstanding for the period.
(2) Due to timing of sales and repurchase of capital shares, the net realized and unrealized gain (loss) per share is not in accordance with the Fund's change in net realized and unrealized gain (loss) on investment transaction for the period.
(3) Total returns would have been higher/lower had expenses not been recovered/waived and absorbed by the Adviser. Returns shown do not reflect the deduction of taxes that a shareholder would pay on Fund distributions or the redemption of Fund shares.
(4) Includes voluntary fee waiver which reduced the ratio of expenses to average net assets after reimbursement from Adviser by 0.01%.
(5) Includes voluntary fee waiver which increased the ratio of net investment income to average net assets after reimbursement form Adviser by 0.01%.
See accompanying Notes to Financial Statements.
43
FPA NEW INCOME FUND
NOTES TO FINANCIAL STATEMENTS
September 30, 2023
NOTE 1 — Organization
FPA New Income Fund (the "Fund") is a diversified series of FPA Funds Trust (the "Trust") which is registered as an open-end management company under the Investment Company Act of 1940, as amended (the "1940 Act"). The Fund's primary investment objective is to seek current income and long-term total return taking into consideration capital preservation. First Pacific Advisors, LP (the "Adviser") has served as the Fund's investment adviser since July 11, 1984.
On July 28, 2023, the Fund acquired the assets and assumed the liabilities of FPA New Income, Inc. (the "Predecessor Fund") in a tax-free reorganization pursuant to the Agreement and Plan of Reorganization (the "Plan of Reorganization"). The Plan of Reorganization was approved by the Trust's Board and by the Predecessor Fund's Board on May 8, 2023. The tax-free reorganization was accomplished on July 28, 2023. As a result of the reorganization, the Fund assumed the performance and accounting history of the Predecessor Fund. Financial information included for the dates prior to the reorganization is that of the Predecessor Fund.
The reorganization was accomplished by the following tax-free exchange in which each shareholder of the Fund received the same aggregate share net asset value as noted below:
| Shares Issued | | Net Assets | |
| | 830,265,591 | | | $ | 7,897,367,462 | | |
The net unrealized depreciation of investments transferred was $299,644,964 as of the date of the acquisition.
The Fund is an investment company and accordingly follows the investment company accounting and reporting guidance of the Financial Accounting Standards Board (FASB) Accounting Standard Codification Topic 946 "Financial Services — Investment Companies".
NOTE 2 — Accounting Policies
The following is a summary of the significant accounting policies consistently followed by the Fund in the preparation of its financial statements. The preparation of financial statements in conformity with accounting principles generally accepted in the United States of America ("GAAP") requires management to make estimates and assumptions that affect the reported amounts and disclosures in the financial statements. Actual results could differ from these estimates.
(a) Valuation of Investments
The Fund values equity securities at the last reported sale price on the principal exchange or in the principal over the counter ("OTC") market in which such securities are traded, as of the close of regular trading on the NYSE on the day the securities are being valued or, if the last-quoted sales price is not readily available, the securities will be valued at the last bid or the mean between the last available bid and ask price. Securities traded on the NASDAQ are valued at the NASDAQ Official Closing Price ("NOCP"). Investments in open-end investment companies are valued at the daily closing net asset value of the respective investment company. Debt securities are valued by utilizing a price supplied by independent pricing service providers. The independent pricing service providers may use various valuation methodologies including matrix pricing and other analytical pricing models as well as market transactions and dealer quotations. These models generally consider such factors as yields or prices of bonds of comparable quality, type of issue, coupon, maturity, ratings and general market conditions. If a price is not readily available for a portfolio security, the security will be valued at fair value (the amount which the Fund might reasonably expect to receive for the
44
FPA NEW INCOME FUND
NOTES TO FINANCIAL STATEMENTS (Continued)
security upon its current sale). The Board of Trustees has designated the Adviser as the Fund's valuation designee (the "Valuation Designee") to make all fair value determinations with respect to the Fund's portfolio investments, subject to the Board's oversight. As the Valuation Designee, the Adviser has adopted and implemented policies and procedures to be followed when the Fund must utilize fair value pricing. Securities for which representative market quotations are not readily available or are considered unreliable by the Adviser are valued as determined in good faith under procedures adopted by the authority of the Fund's Board of Directors. Various inputs may be reviewed in order to make a good faith determination of a security's value. These inputs include, but are not limited to, the type and cost of the security; contractual or legal restrictions on resale of the security; relevant financial or business developments of the issuer; actively traded similar or related securities; conversion or exchange rights on the security; related corporate actions; significant events occurring after the close of trading in the security; and changes in overall market conditions. Fair valuations and valuations of investments that are not actively trading involve judgment and may differ materially from valuations of investments that would have been used had greater market activity occurred.
(b) Investment Transactions, Investment Income and Expenses
Investment transactions are accounted for on the trade date. Realized gains and losses on investments are determined on the identified cost basis. Dividend income is recorded net of applicable withholding taxes on the ex-dividend date and interest income is recorded on an accrual basis. Withholding taxes on foreign dividends, if applicable, are paid (a portion of which may be reclaimable) or provided for in accordance with the applicable country's tax rules and rates and are disclosed in the Statement of Operations. Withholding tax reclaims are filed in certain countries to recover a portion of the amounts previously withheld. The Fund records a reclaim receivable based on a number of factors, including a jurisdiction's legal obligation to pay reclaims as well as payment history and market convention. Discounts on debt securities are accreted or amortized to interest income over the lives of the respective securities using the effective interest method. Premiums for callable debt securities are amortized to the earliest call date, if the call price was less than the purchase price. If the call price was not at par and the security was not called, the security is amortized to the next call price and date. Expenses incurred by the Trust with respect to more than one fund are allocated in proportion to the net assets of each fund except where allocation of direct expenses to each fund or an alternative allocation method can be more appropriately made.
(c) Mortgage-Backed Securities
The Funds may invest in mortgage-backed securities ("MBS"), representing direct or indirect interests in pools of underlying residential or commercial mortgage loans that are secured by real property. These securities provide investors with payments consisting of both principal and interest as the mortgages in the underlying mortgage pools are paid.
The timely payment of principal and interest (but not the market value) on MBS issued or guaranteed by Ginnie Mae (formally known as the Government National Mortgage Association or GNMA) is backed by Ginnie Mae and the full faith and credit of the US government. Obligations issued by Fannie Mae (formally known as the Federal National Mortgage Association or FNMA) and Freddie Mac (formally known as the Federal Home Loan Mortgage Corporation or FHLMC) are historically supported only by the credit of the issuer, but currently are guaranteed by the US government in connection with such agencies being placed temporarily into conservatorship by the US government. Some MBS are sponsored or issued by private entities. Payments of principal and interest (but not the market value) of such private MBS may be supported by pools of residential or commercial mortgage loans or other MBS that are guaranteed, directly or indirectly, by the US government or one of its agencies or instrumentalities, or they may be issued without any
45
FPA NEW INCOME FUND
NOTES TO FINANCIAL STATEMENTS (Continued)
government guarantee of the underlying mortgage assets but may contain some form of non-government credit enhancement.
Collateralized mortgage obligations ("CMO") are a type of MBS. A CMO is a debt security that may be collateralized by whole mortgage loans or mortgage pass-through securities. The mortgage loans or mortgage pass-through securities are divided into classes or tranches with each class having its own characteristics. Investors typically receive payments out of the interest and principal on the underlying mortgages. The portions of these payments that investors receive, as well as the priority of their rights to receive payments, are determined by the specific terms of the CMO class.
The yield characteristics of MBS differ from those of traditional debt securities. Among the major differences are that interest and principal payments are made more frequently, usually monthly, and that principal may be prepaid at any time because the underlying mortgage loans or other obligations generally may be prepaid at any time. Prepayments on a pool of mortgage loans are influenced by a variety of economic, geographic, social and other factors. Generally, prepayments on fixed-rate mortgage loans will increase during a period of falling interest rates and decrease during a period of rising interest rates. Certain classes of CMOs and other MBS are structured in a manner that makes them extremely sensitive to changes in prepayment rates.
(d) Federal Income Taxes
The Fund intends to comply with the requirements of Subchapter M of the Internal Revenue Code applicable to regulated investment companies and to distribute substantially all of their net investment income and any net realized gains to their shareholders. Therefore, no provision is made for federal income or excise taxes. Due to the timing of dividend distributions and the differences in accounting for income and realized gains and losses for financial statement and federal income tax purposes, the fiscal year in which amounts are distributed may differ from the year in which the income and realized gains and losses are recorded by the Fund.
Accounting for Uncertainty in Income Taxes (the "Income Tax Statement") requires an evaluation of tax positions taken (or expected to be taken) in the course of preparing a Fund's tax returns to determine whether these positions meet a "more-likely-than-not" standard that, based on the technical merits, have a more than fifty percent likelihood of being sustained by a taxing authority upon examination. A tax position that meets the "more-likely-than-not" recognition threshold is measured to determine the amount of benefit to recognize in the financial statements. The Fund recognizes interest and penalties, if any, related to unrecognized tax benefits as income tax expense in the Statement of Operations.
The Income Tax Statement requires management of the Fund to analyze tax positions taken in the prior three open tax years, if any, and tax positions expected to be taken in the Fund's current tax year, as defined by the IRS statute of limitations for all major jurisdictions, including federal tax authorities and certain state tax authorities. As of September 30, 2023, and during the prior three open tax years the Fund did not have a liability for any unrecognized tax benefits. The Fund has no examinations in progress and is not aware of any tax positions for which it is reasonably possible that the total amounts of unrecognized tax benefits will significantly change in the next twelve months.
(e) Distributions to Shareholders
The Fund will make distributions of net investment income monthly and net capital gains, if any, at least annually. Distributions to shareholders are recorded on the ex-dividend date. The amount and timing of distributions are determined in accordance with federal income tax regulations, which may differ from GAAP.
46
FPA NEW INCOME FUND
NOTES TO FINANCIAL STATEMENTS (Continued)
The character of distributions made during the year from net investment income or net realized gains may differ from the characterization for federal income tax purposes due to differences in the recognition of income, expense and gain (loss) items for financial statement and tax purposes.
(f) Illiquid Securities
Pursuant to Rule 22e-4 under the 1940 Act, the Fund has adopted a Liquidity Risk Management Program ("LRMP") that requires, among other things, that the Fund limits its illiquid investments that are assets to no more than 15% of net assets. An illiquid investment is any security which may not reasonably be expected to be sold or disposed of in current market conditions in seven calendar days or less without the sale or disposition significantly changing the market value of the investment. If the Adviser, at any time determines that the value of illiquid securities held by the Fund exceeds 15% of its net asset value, the Adviser will take such steps as it considers appropriate to reduce them as soon as reasonably practicable in accordance with the Fund's written LRMP.
(g) Use of Estimates
The presentation of financial statements in conformity with GAAP requires management to make estimates and assumptions that affect the reported amounts of assets and liabilities at the date of the financial statements and the reported amounts of income and expenses during the reporting period. Actual results could differ from those estimates.
(h) Stripped Mortgage-Backed Interest Only ("I/O") and Principal Only ("P/O") Securities
Stripped mortgage-backed securities are usually structured with two classes that receive different proportions of the interest and principal distributions on a pool of mortgage assets. In certain cases, one class will receive all of the interest payments on the underlying mortgages (the I/O class), while the other class will receive all of the principal payments (the P/O class). The Fund currently has investments in I/O securities. The yield to maturity on I/Os is sensitive to the rate of principal repayments (including prepayments) on the related underlying mortgage assets, and principal payments may have a material effect on yield-to-maturity. If the underlying mortgage assets experience greater than anticipated prepayments of principal, a Fund may not fully recoup its initial investment in I/Os.
(i) Credit Risk
Debt securities are subject to credit risk, meaning that the issuer of the debt security may default or fail to make timely payments of principal or interest. The values of any of the Fund's investments may also decline in response to events affecting the issuer or its credit rating. The lower rated debt securities in which the Fund may invest are considered speculative and are generally subject to greater volatility and risk of loss than investment grade securities, particularly in deteriorating economic conditions. The Fund invests a significant portion of its assets in securities of issuers that hold mortgage-and asset-backed securities and direct investments in securities backed by commercial and residential mortgage loans and other financial assets. The value and related income of these securities is sensitive to changes in economic conditions, including delinquencies and/or defaults. Continuing shifts in the market's perception of credit quality on securities backed by commercial and residential mortgage loans and other financial assets may result in increased volatility of market price and periods of illiquidity that can negatively impact the valuation of certain securities held by the Fund.
(j) Repurchase Agreements
Repurchase agreements permit the Fund to maintain liquidity and earn income over periods of time as short as overnight. Repurchase agreements held by the Fund are fully collateralized by U.S. Government securities, or securities issued by U.S. Government agencies, or securities that are within the three highest
47
FPA NEW INCOME FUND
NOTES TO FINANCIAL STATEMENTS (Continued)
credit categories assigned by established rating agencies (Aaa, Aa, or A by Moody's or AAA, AA or A by Standard & Poor's) or, if not rated by Moody's or Standard & Poor's, are of equivalent investment quality as determined by the Adviser. Such collateral is in the possession of the Fund's custodian. The collateral is evaluated daily to ensure its fair value equals or exceeds the current fair value of the repurchase agreements including accrued interest. In the event of default on the obligation to repurchase, the Fund has the right to liquidate the collateral and apply the proceeds in satisfaction of the obligation.
The Fund may enter into repurchase agreements, under the terms of a Master Repurchase Agreement ("MRA"). The MRA permits the Fund, under certain circumstances including an event of default (such as bankruptcy or insolvency), to offset payables and/or receivables under the MRA with collateral held and/or posted to the counterparty and create one single net payment due to or from the Fund. However, bankruptcy or insolvency laws of a particular jurisdiction may impose restrictions on or prohibitions against such a right of offset in the event of a MRA counterparty's bankruptcy or insolvency. Pursuant to the terms of the MRA, the Fund receives securities as collateral with a fair value in excess of the repurchase price to be received by the Fund upon the maturity of the repurchase transaction. Upon a bankruptcy or insolvency of the MRA counterparty, the Fund recognizes a liability with respect to such excess collateral to reflect the Fund's obligation under bankruptcy law to return the excess to the counterparty. Repurchase agreements outstanding at the end of the period are listed in the Fund's Portfolio of Investments.
NOTE 3 — Investment Advisory and Other Agreements
The Trust, on behalf of the Fund, entered into an Investment Advisory Agreement (the "Agreement") with the Adviser. Under the terms of the Agreement, the Fund pays a monthly investment advisory fee to the Adviser at the annual rate of 0.50% of the Fund's average daily net assets. The Adviser has contractually agreed to waive its fees and/or pay for operating expenses of the Fund to ensure that total annual fund operating expenses (excluding any taxes, leverage interest, brokerage commissions, dividend and interest expenses on short sales, acquired fund fees and expenses (as determined in accordance with Form N-1A), professional fees related to services for the collection of foreign tax reclaims, expenses incurred in connection with any merger or reorganization, and extraordinary expenses such as litigation expenses) do not exceed 0.45% of the average daily net assets. This agreement is in effect until January 31, 2024, and it may be terminated before that date only by the Trust's Board of Trustees. For the year ended September 30, 2023, the Adviser waived a portion of its advisory fees totaling $11,705,341.
UMB Fund Services, Inc. ("UMBFS") served as the Predecessor Fund's transfer agent. The Predecessor Fund's allocated fees incurred for transfer agency for the period October 1, 2022 to July 28, 2023, was $4,369,193. The inclusion of such fees are reported on the Statement of Operations.
Prior to July 29, 2023, State Street Bank and Trust Company served as the Predecessor Fund's fund accountant, administrator and custodian. The Predecessor Fund's allocated fees incurred for fund accounting, fund administration and custody services for the period from October 1, 2022 to July 28, 2023, was $694,011. The inclusion of such fees are reported on the Statement of Operations.
UMBFS serves as the Fund's fund accountant, transfer agent and co-administrator; and Mutual Fund Administration, LLC ("MFAC") serves as the Fund's other co-administrator. UMB Bank, n.a., an affiliate of UMBFS, serves as the Fund's custodian. The Fund's allocated fees incurred for fund accounting, fund administration, transfer agency and custody services for the period from July 29, 2023 through September 30, 2023, were $995,312. The inclusion of such fees are reported on the Statement of Operations.
48
FPA NEW INCOME FUND
NOTES TO FINANCIAL STATEMENTS (Continued)
UMB Distribution Services, LLC ("UMB Distribution Services"), a wholly owned subsidiary of UMBFS, served as the Predecessor Fund's distributor for the period October 1, 2023 through July 28, 2023. The Adviser paid the fees for the Predecessor Fund's distribution-related services. UMB Distribution Services serves as the Fund's distributor and the Adviser paid the fees for the Fund's distribution-related services for the period July 29, 2023 through September 30, 2023.
Certain trustees and officers of the Trust are employees of UMBFS, MFAC or Adviser. The Fund does not compensate trustees and officers affiliated with the Fund's co-administrators. For the period from July 29, 2023 through September 30, 2023, the Fund's allocated fees incurred to Trustees of the Trust who are not "interested persons" of the Trust, as that term is defined in the 1940 Act (collectively, the "Independent Trustees") were $41,211. The inclusion of such fees are reported on the Statement of Operations.
Prior to July 29, 2023, the Predecessor Fund's allocated fees incurred for Independent Trustees services for the period from October 1, 2022 to July 28, 2023, was $190,698. The inclusion of such fees are reported on the Statement of Operations.
Dziura Compliance Consulting, LLC provides CCO services to the Trust. The Fund's allocated fees incurred for CCO services for the period from July 29, 2023 through September 30, 2023, were $3,199. The inclusion of such fees are reported on the Statement of Operations.
Prior to July 29, 2023, Ms. Karen Richards provided the Predecessor Fund's Chief Compliance Officer ("CCO") services to the Trust. The Predecessor Fund's allocated fees incurred for CCO services for the period from October 1, 2022 to July 28, 2023, was $86,628. The inclusion of such fees are reported on the Statement of Operations.
NOTE 4 — Federal Income Taxes
At September 30, 2023, gross unrealized appreciation/(depreciation) of investments, based on cost for federal income tax purposes were as follows:
Cost of investments | | $ | 8,108,305,074 | | |
Gross unrealized appreciation | | $ | 41,591,809 | | |
Gross unrealized depreciation | | | (327,534,800 | ) | |
Net unrealized appreciation/(depreciation) | | $ | (285,942,991 | ) | |
The difference between cost amounts for financial statement and federal income tax purposes is due primarily to timing differences in recognizing certain gains and losses in security transactions.
GAAP requires that certain components of net assets be reclassified between financial and tax reporting. These reclassifications have no effect on net assets or net asset value per share. For the year ended September 30, 2023, permanent differences in book and tax have been reclassified to paid-in capital and total distributable earnings/(deficit) as follows:
Increase (Decrease) | |
Paid-in Capital | | Total accumulated
earnings/(deficit) | |
$ | (758,135 | ) | | $ | 758,135 | | |
49
FPA NEW INCOME FUND
NOTES TO FINANCIAL STATEMENTS (Continued)
As of September 30, 2023, the components of accumulated earnings/(deficit) on a tax basis were as follows:
Undistributed ordinary income | | | — | | |
Undistributed long-term capital gains | | | — | | |
Tax accumulated earnings | | | — | | |
Accumulated capital and other losses | | $ | (681,390,413 | ) | |
Other gain | | | 5,543,406 | | |
Net unrealized appreciation (depreciation) on investments | | | (285,942,991 | ) | |
Total accumulated earnings/(deficit) | | $ | (961,789,998 | ) | |
The tax character of distributions paid during the fiscal years ended September 30, 2023 and September 30, 2022, were as follows:
| | 2023 | | 2022 | |
Distributions paid from: | |
Ordinary income | | $ | 314,654,099 | | | $ | 167,625,868 | | |
Net long-term capital gains | | | — | | | | — | | |
Total distributions paid | | $ | 314,654,099 | | | $ | 167,625,868 | | |
As of September 30, 2023, the Fund had non-expiring capital loss carryforwards as follows:
| | 2023 | |
Short-term | | $ | (305,072,249 | ) | |
Long-term | | | (376,318,164 | ) | |
Total capital loss carryforwards | | $ | (681,390,413 | ) | |
During the tax year ended September 30, 2023, the Fund utilized $0 of short-term and $0 of long-term non-expiring capital loss carryforwards, respectively.
NOTE 5 — Investment Transactions
For the year ended September 30, 2023, purchases and sales of investments, excluding short-term investments, were $4,131,036,842 and $6,039,291,896, respectively.
NOTE 6 — Indemnifications
In the normal course of business, the Fund enters into contracts that contain a variety of representations which provide general indemnifications. The Fund's maximum exposure under these arrangements is unknown, as this would involve future claims that may be made against the Fund that have not yet occurred. However, the Fund expects the risk of loss to be remote.
50
FPA NEW INCOME FUND
NOTES TO FINANCIAL STATEMENTS (Continued)
NOTE 7 — Commitments and Contingencies
The Fund may enter into unfunded loan commitments. Unfunded loan commitments may be partially or wholly unfunded. During the contractual period, the Fund is obliged to provide funding to the borrower upon demand. Unfunded loan commitments are fair valued in accordance with the valuation policy described in Note 2(a) and unrealized appreciation or depreciation, if any, is recorded on the Statement of Assets and Liabilities. As of September 30, 2023, the total unfunded amount was 0.21% of the Fund's net assets.
As of September 30, 2023, the Fund had the following unfunded loan commitments outstanding:
| Loan | | Principal | | Cost | | Value | | Unrealized
Appreciation/
(Depreciation) | |
Lealand Finance Super Senior Exit LC | | $ | 12,477,102 | | | $ | (28,324 | ) | | $ | (3,493,589 | ) | | $ | (3,465,265 | ) | |
McDermott Tanks Secured LC | | $ | 4,292,898 | | | $ | (9,672 | ) | | $ | (601,005 | ) | | $ | (591,334 | ) | |
NOTE 8 — Fair Value Measurements and Disclosure
Fair Value Measurements and Disclosures defines fair value, establishes a framework for measuring fair value in accordance with GAAP, and expands disclosure about fair value measurements. It also provides guidance on determining when there has been a significant decrease in the volume and level of activity for an asset or a liability, when a transaction is not orderly, and how that information must be incorporated into a fair value measurement.
Under Fair Value Measurements and Disclosures, various inputs are used in determining the value of the Fund's investments. These inputs are summarized into three broad Levels as described below:
• Level 1 — Unadjusted quoted prices in active markets for identical assets or liabilities that the Fund has the ability to access.
• Level 2 — Observable inputs other than quoted prices included in level 1 that are observable for the asset or liability, either directly or indirectly. These inputs may include quoted prices for the identical instrument on an inactive market, prices for similar instruments, interest rates, prepayment speeds, credit risk, yield curves, default rates and similar data.
• Level 3 — Unobservable inputs for the asset or liability, to the extent relevant observable inputs are not available, representing the Fund's own assumptions about the assumptions a market participant would use in valuing the asset or liability, and would be based on the best information available.
The availability of observable inputs can vary from security to security and is affected by a wide variety of factors, including, for example, the type of security, whether the security is new and not yet established in the marketplace, the liquidity of markets, and other characteristics particular to the security. To the extent that valuation is based on models or inputs that are less observable or unobservable in the market, the determination of fair value requires more judgment. Accordingly, the degree of judgment exercised in determining fair value is greatest for instruments categorized in Level 3.
The inputs used to measure fair value may fall into different Levels of the fair value hierarchy. In such cases, for disclosure purposes, the Level in the fair value hierarchy within which the fair value measurement falls in its entirety, is determined based on the lowest Level input that is significant to the fair value measurement in its entirety.
51
FPA NEW INCOME FUND
NOTES TO FINANCIAL STATEMENTS (Continued)
The inputs or methodology used for valuing securities are not an indication of the risk associated with investing in those securities. The following is a summary of the inputs used, as of September 30, 2023, in valuing the Fund's assets carried at fair value:
Investments | | Level 1 | | Level 2 | | Level 3 | | Total | |
Asset-Backed Securities | |
Auto | | | — | | | $ | 976,320,299 | | | | — | | | $ | 976,320,299 | | |
Collateralized Loan Obligation | | | — | | | | 931,890,864 | | | $ | 18,957,184 | | | | 950,848,048 | | |
Credit Card | | | — | | | | 273,342,846 | | | | — | | | | 273,342,846 | | |
Equipment | | | — | | | | 1,289,651,422 | | | | 13,878,426 | | | | 1,303,529,848 | | |
Non-Agency | | | — | | | | 25,541,984 | | | | — | | | | 25,541,984 | | |
Other | | | — | | | | 876,842,514 | | | | — | | | | 876,842,514 | | |
Commercial Mortgage-Backed Securities | |
Agency | | | — | | | | 863,380,194 | | | | — | | | | 863,380,194 | | |
Agency Stripped | | | — | | | | 33,628,637 | | | | — | | | | 33,628,637 | | |
Non-Agency | | | — | | | | 642,362,281 | | | | — | | | | 642,362,281 | | |
Corporate Bank Debt | | | — | | | | 56,933,962 | | | | 14,637,886 | | | | 71,571,848 | | |
Corporate Bonds | |
Communications | | | — | | | | 5,367,043 | | | | — | | | | 5,367,043 | | |
Consumer Discretionary | | | — | | | | 19,300,284 | | | | — | | | | 19,300,284 | | |
Financials | | | — | | | | 316,446,472 | | | | 26,023,000 | | | | 342,469,472 | | |
Health Care | | | — | | | | 38,381,000 | | | | — | | | | 38,381,000 | | |
Technology | | | — | | | | — | | | | 42,500,000 | | | | 42,500,000 | | |
Utilities | | | — | | | | 150,101,233 | | | | — | | | | 150,101,233 | | |
Residential Mortgage-Backed Securities | |
Agency Collateralized Mortgage Obligation | | | — | | | | 7,381,785 | | | | — | | | | 7,381,785 | | |
Agency Pool Adjustable Rate | | | — | | | | 258,357 | | | | — | | | | 258,357 | | |
Agency Pool Fixed Rate | | | — | | | | 139,309,949 | | | | — | | | | 139,309,949 | | |
Agency Stripped | | | — | | | | 458,581 | | | | — | | | | 458,581 | | |
Non-Agency Collateralized Mortgage Obligation | | | — | | | | 383,415,726 | | | | — | | | | 383,415,726 | | |
U.S. Treasury Notes & Bonds | | | — | | | | 268,289,530 | | | | — | | | | 268,289,530 | | |
Common Stocks | |
Industrials | | | — | | | | — | | | | 69,467,165 | | | | 69,467,165 | | |
Materials | | | — | | | | — | | | | 41,212,449 | | | | 41,212,449 | | |
Real Estate | | $ | 5,514,205 | | | | — | | | | 59,650 | | | | 5,573,855 | | |
Short-Term Investments | | | 69,192,818 | | | | 222,314,337 | | | | — | | | | 291,507,155 | | |
| | $ | 74,707,023 | | | $ | 7,520,919,300 | | | $ | 226,735,760 | | | $ | 7,822,362,083 | | |
52
FPA NEW INCOME FUND
NOTES TO FINANCIAL STATEMENTS (Continued)
The following is a reconciliation of assets in which significant unobservable inputs (Level 3) were used in determining value:
| | Asset-Backed
Securities —
Collateralized Loan
Obligation | | Asset-Backed
Securities —
Equipment | | Corporate
Bank Debt | | Corporate
Bonds | | Common
Stocks | |
Beginning balance September 30, 2022 | | $ | 22,787,445 | | | $ | 14,837,423 | | | $ | 10,660,190 | | | | — | | | $ | 54,724,440 | | |
Transfers into Level 3 during the period | | | — | | | | — | | | | 14,637,885 | | | | — | | | | 41,212,449 | | |
Transfers out of Level 3 during the period | | | — | | | | — | | | | — | | | | — | | | | 5,514,205 | | |
Total realized gain/(loss) | | | — | | | | 398 | | | | — | | | | — | | | | — | | |
Total unrealized appreciation/(depreciation) | | | — | | | | (184,564 | ) | | | 747,020 | | | | — | | | | 20,316,580 | | |
| Net purchases | | | — | | | | — | | | | — | | | | 68,523,000 | | | | — | | |
Net sales | | | 3,830,261 | | | | 774,831 | | | | 11,407,209 | | | | — | | | | — | | |
Balance as of September 30, 2023 | | $ | 18,957,184 | | | $ | 13,878,426 | | | $ | 14,637,886 | | | $ | 68,523,000 | | | $ | 110,739,264 | | |
The following table presents additional quantitative information about valuation methodologies and inputs used for investments that are measured at fair value and categorized within Level 3 as of September 30, 2023.
| Asset Class | | Fair Value
September 30,
2023 | | Valuation
Methodologies | | Unobservable
Input | | Input
Range/Value | | Valuation
Weighted
Average of Input | | Impact to
Valuation from
an Increase in
Input(1) | |
Asset-Backed Securities —
Collateralized Loan
Obligations | | $ | 18,957,184 | | | Third-Party Broker Quote(2) | | Quotes/Prices | | $ | 100.00 | | | $ | 100.00 | | | Increase | |
Asset-Backed Securities —
Equipment | | $ | 13,878,426 | | | Third-Party Broker Quote(2) | | Quotes/Prices | | $ | 85.25 | | | $ | 85.25 | | | Increase | |
Common Stocks | | $ | 110,679,614 | | | Pricing Model(3) | | Last Executed Trade | | $ | 0.96-$18.25 | | | $ | 11.81 | | | Increase | |
| | $ | 59,650 | | | Pricing Model(4) | | Quotes/Prices | | $ | 0.86 | | | $ | 0.86 | | | Increase | |
Corporate Bank Debt | | $ | 18,732,480 | | | Third-Party Broker Quote(2) | | Quotes/Prices | | $ | 96.00 | | | $ | 96.00 | | | Increase | |
| | $ | (4,094,549 | ) | | Pricing Model(4) | | Quotes/Prices | | $ | 55.00 | | | $ | 55.00 | | | Increase | |
Corporate Bonds | | $ | 68,523,000 | | | Pricing Model(5) | | Cost | | $ | 100.00 | | | $ | 100.00 | | | Decrease | |
(1) This column represents the directional change in the fair value of the Level 3 investments that would result from an increase to the corresponding unobservable input. A decrease to the unobservable input would have the opposite effect.
(2) The Third Party Broker Quote technique involves obtaining an independent third-party broker quote for the security.
(3) The Pricing Model technique for Level 3 securities involves the last reported trade in the security.
(4) The Pricing Model technique for Level 3 securities involves recently quoted funding prices of the security.
(5) The fair value of the investment is based on the initial purchase price or more recent capital activity. If the financial condition of the underlying assets were to deteriorate, or if the market comparables were to fall, the value of the investment could be lower.
NOTE 9 — Investments in Affiliated Issuers
An affiliated issuer is an entity in which the Fund has ownership of a least 5% of the voting securities. Issuers that are affiliates of the Fund at period-end are noted in the Fund's Schedule of Investments. Additional security purchases and the reduction of certain securities shares outstanding of existing portfolio holdings that were not considered affiliated in prior years may result in the Fund owning in excess of 5% of the outstanding shares at period-end. The table below reflects transactions during the period with entities that are affiliates as of
53
FPA NEW INCOME FUND
NOTES TO FINANCIAL STATEMENTS (Continued)
September 30, 2023 and may include acquisitions of new investments, prior year holdings that became affiliated during the period and prior period affiliated holdings that are no longer affiliated as of period-end:
| Security Description | | Shares
Held as of
September 30,
2022 | | Beginning
Value as of
September 30,
2022 | | Purchases
at Cost | | Proceeds
from Sales | | Net
Realized
Gain (Loss)
on sales
Affiliated
Investment | | Change in
Unrealized
Appreciation
(Depreciation) | | Transfers
In (Out) | | Ending
Value as of
September 30,
2023 | | Shares
as of
September 30,
2023 | | Dividend
Income
from
Affiliated
Investments | |
Boart Longyear Group
Ltd.(a) | | | 43,018,605 | | | $ | 60,537,070 | | | | — | | | | — | | | | — | | | $ | (19,324,621 | ) | | | — | | | $ | 41,212,449 | | | | 43,018,605 | | | | — | | |
PHI Group, Inc.(a)(b)(c) | | | 3,806,420 | | | | 47,580,250 | | | | — | | | | — | | | | — | | | | 21,886,915 | | | | — | | | | 69,467,165 | | | | 3,806,420 | | | | — | | |
Total | | | | $ | 108,117,320 | | | | — | | | | — | | | | — | | | $ | 2,562,294 | | | | — | | | $ | 110,679,614 | | | | | | — | | |
(a) These securities have been valued in good faith under policies adopted by authority of the Board of Trustees in accordance with the Fund's fair value procedures. These securities constituted 1.42% of total net assets at September, 30, 2023.
(b) Investments categorized as a significant unobservable input (Level 3) (See Note 3 of the Notes to Financial Statements).
(c) Restricted securities. These restricted securities constituted 0.90% of total net assets at September 30, 2023, most of which are considered liquid by the Adviser. These securities are not registered and may not be sold to the public. There are legal and/or contractual restrictions on resale. The Fund does not have the right to demand that such securities be registered. The values of these securities are determined by valuations provided by pricing services, brokers, dealers, market makers, or in good faith under policies adopted by authority of the Fund's Board of Directors.
NOTE 10 — Restricted Securities
Restricted securities include securities that have not been registered under the Securities Act of 1933, as amended, and securities that are subject to restrictions on resale. The Fund may invest in restricted securities that are consistent with the Fund's investment objective and investment strategies. Investments in restricted securities are valued at net asset value as a practical expedient for fair value, or fair value as determined in good faith in accordance with procedures adopted by the Board. It is possible that the estimated value may differ significantly from the amount that might ultimately be realized in the near term, and the difference could be material.
As of September 30, 2023, the Fund invested in the following restricted securities:
| Issuer | | Initial
Acquisition
Date | | Cost | | Fair Value | | Fair Value as a
% of Net Assets | |
Apollo Debt Solution Delayed Draw
Term Loan, 8.620%, 9/28/2028 | | 8/10/2023 | | $ | 26,023,000 | | | $ | 26,023,000 | | | | 0.30 | % | |
Axiom Global, Inc., 10.175% (1-Month
Term SOFR+475 basis points), 10/01/2026 | | 11/18/2021 | | | 22,564,002 | | | | 21,980,630 | | | | 0.30 | % | |
BTC Holdings Fund I LLC 8.362%,
01/28/2027 | | 09/01/2021 | | | 957,183 | | | | 957,183 | | | | 0.00 | % | |
BTC Offshore Holdings Fund, 8.245%,
10/20/2029 | | 10/25/2021 | | | 18,000,000 | | | | 18,000,000 | | | | 0.20 | % | |
Capstone Acquisition Holdings, Inc. 2020
Delayed Draw Term Loan, 10.165%
(1-Month Term SOFR+0.000 basis points),
11/12/2027 | | 04/30/2021 | | | 1,069,400 | | | | 1,029,819 | | | | 0.00 | % | |
54
FPA NEW INCOME FUND
NOTES TO FINANCIAL STATEMENTS (Continued)
Issuer | | Initial
Acquisition
Date | |
Cost | |
Fair Value | |
Fair Value as a
% of Net Assets | |
Capstone Acquisition Holdings, Inc. 2020
Term Loan, 10.165% (1-Month Term
SOFR+0.000 basis points), 11/12/2027 | | 04/30/2021 | | $ | 18,333,833 | | | $ | 17,702,661 | | | | 0.20 | % | |
Copper Earn Out Trust | | 12/7/2020 | | | — | | | | 59,650 | | | | 0.00 | % | |
Copper Property CTL Pass Through Trust | | 10/5/2017 | | | 25,752,396 | | | | 5,514,205 | | | | 0.10 | % | |
Frontier Communications Holdings LLC,
9.179% (1-Month Term SOFR+375 basis
points), 10/08/2027 | | 04/09/2021 | | | 23,042,674 | | | | 22,522,523 | | | | 0.30 | % | |
Heartland Dental LLC/Heartland Dental
Finance Corp. 10.500% (1-Month Term
SOFR+0.000 basis points), 04/30/2028 | | 8/2/2021 | | | 38,046,791 | | | | 38,381,000 | | | | 0.50 | % | |
Hlend Senior Notes, 8.170%, 03/15/2028 | | 02/16/2023 | | | 42,500,000 | | | | 42,500,000 | | | | 0.50 | % | |
JC Penney Corp., Inc., 9.384% (1-Month
USD Libor+425 basis points), 06/23/2025 | | 02/03/2021 | | | — | | | | 2,722 | | | | 0.00 | % | |
Lealand Finance Company B.V. Senior
Exit LC, 10.069%, 06/30/2024 | | 02/28/2020 | | | (28,324 | ) | | | (3,493,589 | ) | | | 0.00 | % | |
McDermott Tanks Secured LC, 10.066%,
12/31/2026 | | 02/28/2020 | | | (9,672 | ) | | | (601,005 | ) | | | 0.00 | % | |
PHI Group, Inc. | | 08/19/2019 | | | 31,131,405 | | | | 69,467,165 | | | | 0.90 | % | |
Windstream Services LLC, 11.664%
(1-Month Term SOFR+625 basis points),
09/21/2027 | | 08/11/2020 | | | 12,349,568 | | | | 12,428,087 | | | | 0.20 | % | |
| | | | $ | 259,732,256 | | | $ | 272,474,051 | | | | 3.50 | % | |
NOTE 11 — Market Disruption and Geopolitical Risks
Certain local, regional or global events such as war, acts of terrorism, the spread of infectious illness or other public health issues, or other events could have a significant impact on a security or instrument. Since 2020, the novel strain of coronavirus (COVID-19) has negatively affected the worldwide economy, as well as the economies of individual countries, the financial health of individual companies and the market in general in significant and unforeseen ways. Following Russia's large-scale invasion of Ukraine, the President of the United States signed an Executive Order in February 2022 prohibiting U.S. persons from entering transactions with the Central Bank of Russia and Executive Orders in March 2022 prohibiting U.S. persons from importing oil and gas from Russia as well as other popular Russian exports, such as diamonds, seafood and vodka. There may also be restrictions on investments in Chinese companies. For example, the President of the United States of America signed an Executive Order in June 2021 affirming and expanding the U.S. policy prohibiting U.S. persons from purchasing or investing in publicly-traded securities of companies identified by the U.S. Government as "Chinese Military-Industrial Complex Companies." The list of such companies can change from time to time, and as a result of forced selling or an inability to participate in an investment the Adviser otherwise believes is attractive, the Fund may incur losses. The duration of the coronavirus outbreak and the Russian-Ukraine conflict could
55
FPA NEW INCOME FUND
NOTES TO FINANCIAL STATEMENTS (Continued)
adversely affect the Fund's performance, the performance of the securities in which the Fund invests and may lead to losses on your investment. The ultimate impact of COVID-19 and Russia Invasion on the financial performance of the Fund's investments is not reasonably estimable at this time. Management is actively monitoring these events.
NOTE 12 — New Accounting Pronouncements
Effective January 24, 2023, the Securities and Exchange Commission (the "SEC") adopted rule and form amendments to require mutual funds and exchange-traded funds ("ETFs") to transmit concise and visually engaging streamlined annual and semiannual reports to shareholders that highlight key information deemed important for retail investors to assess and monitor their fund investments. Certain information, including financial statements, will no longer appear in the funds' streamlined shareholder reports but must be available online, delivered free of charge upon request, and filed on a semiannual basis on Form N-CSR. The rule and form amendments have a compliance date of July 24, 2024. At this time, management is evaluating the impact of these rule and form amendment changes on the content of the current shareholder report and the newly created annual and semiannual streamlined shareholder reports.
For new and existing contracts, the Fund may elect to apply the amendments as of March 12, 2020 through December 31, 2022. Management is currently assessing the impact of the ASU's adoption to the Fund's financial statements and various filings.
NOTE 13 — Events Subsequent to the Fiscal Period End
The Fund has adopted financial reporting rules regarding subsequent events which require an entity to recognize in the financial statements the effects of all subsequent events that provide additional evidence about conditions that existed at the date of the balance sheet. Management has evaluated the Fund's related events and transactions that occurred through the date of issuance of the Fund's financial statements.
There were no events or transactions that occurred during this period that materially impacted the amounts or disclosures in the Fund's financial statements.
56
FPA NEW INCOME FUND
REPORT OF INDEPENDENT REGISTERED
PUBLIC ACCOUNTING FIRM
TO THE BOARD OF TRUSTEES AND
THE SHAREHOLDERS OF THE FPA NEW INCOME FUND
Opinion on the Financial Statements
We have audited the accompanying statement of assets and liabilities of the FPA New Income Fund (the "Fund"), a series of FPA Funds Trust, including the schedule of investments, as of September 30, 2023, the related statement of operations, the statement of changes in net assets, and financial highlights for the year then ended, and the related notes (collectively referred to as the "financial statements"). In our opinion, the financial statements present fairly, in all material respects, the financial position of the Fund as of September 30, 2023, the results of its operations, the changes in its net assets, and the financial highlights for the year then ended, in conformity with accounting principles generally accepted in the United States of America.
The statement of changes in net assets for the year ended September 30, 2022, and the financial highlights for each of the four years in the period ended September 30, 2022, were audited by other auditors, whose report dated November 28, 2022 expressed unqualified opinions on those financial highlights.
Basis for Opinion
These financial statements are the responsibility of the Fund's management. Our responsibility is to express an opinion on the Fund's financial statements based on our audit. We are a public accounting firm registered with the Public Company Accounting Oversight Board (United States) ("PCAOB") and are required to be independent with respect to the Fund in accordance with the U.S. federal securities laws and the applicable rules and regulations of the Securities and Exchange Commission and the PCAOB. We have served as the auditor of the Fund since 2023.
We conducted our audit in accordance with the standards of the PCAOB. Those standards require that we plan and perform the audit to obtain reasonable assurance about whether the financial statements are free of material misstatement, whether due to error or fraud. The Fund is not required to have, nor were we engaged to perform, an audit of its internal control over financial reporting. As part of our audit, we are required to obtain an understanding of internal control over financial reporting, but not for the purpose of expressing an opinion on the effectiveness of the Fund's internal control over financial reporting. Accordingly, we express no such opinion.
Our audit included performing procedures to assess the risks of material misstatement of the financial statements, whether due to error or fraud, and performing procedures that respond to those risks. Such procedures included examining, on a test basis, evidence regarding the amounts and disclosures in the financial statements. Our audit also included evaluating the accounting principles used and significant estimates made by management, as well as evaluating the overall presentation of the financial statements. Our procedures included confirmation of securities owned as of September 30, 2023 by correspondence with the custodian, agent banks, and brokers or by other appropriate auditing procedures where replies were not received. We believe that our audit provides a reasonable basis for our opinion.

TAIT, WELLER & BAKER LLP
Philadelphia, Pennsylvania
November 29, 2023
57
FPA NEW INCOME FUND
BOARD CONSIDERATION OF INVESTMENT ADVISORY
AGREEMENT
(Unaudited)
At an in-person meeting held on August 14, 2023, the Board of Trustees (the "Board") of FPA Funds Trust (the "Trust"), including the trustees who are not "interested persons" of the Trust (the "Independent Trustees") as defined in the Investment Company Act of 1940, as amended (the "1940 Act"), reviewed and unanimously approved the renewal of the investment advisory agreement (the "Advisory Agreement") between the Trust and First Pacific Advisors, LP (the "Investment Advisor") with respect to the FPA New Income Fund series of the Trust (the "Fund") for an additional one-year period from when it otherwise would expire. In approving renewal of the Advisory Agreement, the Board, including the Independent Trustees, determined that such renewal was in the best interests of the Fund and its shareholders.
Background. In advance of the meeting, the Board received information about the Fund and the Advisory Agreement from the Investment Advisor and from Mutual Fund Administration, LLC and UMB Fund Services, Inc., the Trust's co-administrators, certain portions of which are discussed below. The materials, among other things, included information about the organization and financial condition of the Investment Advisor; information regarding the background, experience, and compensation structure of relevant personnel providing services to the Fund; information about the Investment Advisor's compliance policies and procedures, disaster recovery and contingency planning, and policies with respect to portfolio execution and trading; information regarding the profitability of the Investment Advisor's overall relationship with the Fund; reports comparing the performance of the Fund with returns of the Bloomberg U.S. Aggregate Bond Index, the Consumer Price Index ("CPI") + 100 basis points, and a group of comparable funds (the "Peer Group") selected by Broadridge Financial Solutions, Inc. ("Broadridge") from Morningstar, Inc.'s Short-Term Bond category (the "Fund Universe") for the one-, three-, five-, and ten-year periods ended May 31, 2023; and reports comparing the investment advisory fee and total expenses of the Fund with those of the Peer Group and Fund Universe. The Board also received a memorandum from legal counsel to the Trust and the Independent Trustees discussing the legal standards under the 1940 Act and other applicable law for their consideration of the proposed renewal of the Advisory Agreement. In addition, the Board considered information reviewed by the Board during the year at other Board and Board committee meetings.
In renewing the Advisory Agreement, the Independent Trustees met separately in an Executive Session prior to the meeting with the Board to consider the Advisory Agreement including the items discussed below, and were represented by their legal counsel with respect to the matters considered. The Board, including all the Independent Trustees, then met and also considered a variety of factors for renewal of the Advisory Agreement including those discussed below. In their deliberations, the Board and the Independent Trustees did not identify any particular factor that was controlling, and each Trustee may have attributed different weights to the various factors.
Nature, Extent and Quality of Services. The Board and the Independent Trustees considered information provided by the Investment Advisor in response to their requests, as well as information provided throughout the year regarding: the Investment Advisor and its staffing in connection with the Fund, including the Fund's portfolio manager and the senior analysts supporting him; the scope of services supervised and provided by the Investment Advisor; and the absence of any significant service problems reported to the Board. The Board and the Independent Trustees noted the experience, length of service and the outstanding reputation of the Fund's portfolio manager: Abhijeet V. Patwardhan, who joined the Investment Advisor in 2010 and has served as portfolio manager since 2015. After discussion, the Board and the Independent Trustees concluded that the nature, extent and quality of services provided by the Investment Advisor have benefited and should continue to benefit the Fund and its shareholders.
58
FPA NEW INCOME FUND
BOARD CONSIDERATION OF INVESTMENT ADVISORY
AGREEMENT (Continued)
(Unaudited)
Investment Performance. The Board and the Independent Trustees reviewed the overall investment performance of the Fund. The Board also received information from an independent consultant, Broadridge, regarding the Fund's performance relative to its comparative indices, the Peer Group and the Fund Universe. The Board and the Independent Trustees considered the Investment Advisor's representation that the Fund's investment style, as evidenced by the short-term duration of most of its portfolio securities, as well as the Fund's flexibility to invest in a variety of areas, complicated Peer Group comparisons in that the Fund is managed in a more conservative style than the typical fixed income fund and the funds in the Peer Group. The Board and the Independent Trustees noted the Fund's absolute investment results and its long-term investment performance when compared to the Peer Group and Fund Universe. The Board noted that for the ten-year period, the Fund's annualized total return outperformed the Peer Group median return, the Fund Universe median return, and the Bloomberg U.S. Aggregate Bond Index return, but underperformed the CPI + 100 basis points by 2.23%. For the one- and three-year periods, the Board noted that the Fund's annualized total returns were above the Fund Universe median returns and the Bloomberg U.S. Aggregate Bond Index returns, were the same as the Peer Group median returns, but were below the CPI + 100 basis points by 3.68% and 6.15%, respectively, for those periods. The Board observed that for the five-year period, the Fund's annualized total return outperformed the Fund Universe median return and the Bloomberg U.S. Aggregate Bond Index return, but underperformed the Peer Group median return by 0.05% and the CPI + 100 basis points by 3.35%. The Board considered that none of the funds in the Peer Group outperformed the CPI + 100 basis points for any of the periods. The Board also observed that the Fund's volatility of returns, as measured by its standard deviation, and its downside volatility, as measured by its Morningstar risk score, ranked it in the first or second quartile of the funds (which are the most favorable) in the Peer Group and Fund Universe for the one-, three-, five-, and ten-year periods. After discussion, the Board determined that the Fund's investment results were reasonable in light of the Fund's objectives and concluded that the Investment Advisor's continued management of the Fund should benefit the Fund and its shareholders.
Advisory Fee and Fund Expenses; Comparison with Peer Group and Institutional Fees. The Board and the Independent Trustees considered information provided by the Investment Advisor regarding the Fund's advisory fee and total expense levels. The Board and the Independent Trustees reviewed comparative information regarding fees and expenses for the Peer Group and the Fund Universe. The Board and the Independent Trustees noted that at the Fund's current asset level, the annual investment advisory fee was higher than the Fund Universe and Peer Group medians by 0.1975% and 0.20%, respectively, and that its net expense ratio was slightly above the Fund Universe and Peer Group medians by 0.01% and 0.03%, respectively. The Board considered that that the Fund's net expense ratio was not in the highest quartile of the Peer Group or the Fund Universe. In addition, the Trustees noted that the advisory fee rate charged to the Fund was higher than the advisory fee that the Investment Advisor charges to manage separate accounts for institutional investors with similar objectives and policies as the Fund. The Board observed, however, that management of mutual fund assets requires compliance with certain requirements under the 1940 Act that do not apply to the institutional separate accounts that the Investment Advisor manages, and noted the differences between the services provided by the Investment Advisor to the Fund and those provided to the institutional separate accounts. The Board also noted that the Fund's advisory fee was among the lowest of the advisory fees paid by other series of the Trust managed by the Investment Advisor. The Board concluded that the continued payment of the advisory fee by the Fund to the Investment Advisor was fair and reasonable and should continue to benefit the Fund and its shareholders.
59
FPA NEW INCOME FUND
BOARD CONSIDERATION OF INVESTMENT ADVISORY
AGREEMENT (Continued)
(Unaudited)
Investment Advisor Profitability and Costs. The Board and the Independent Trustees considered information provided by the Investment Advisor regarding the Investment Advisor's costs in providing services to the Fund, the profitability of the Investment Advisor and the benefits to the Investment Advisor from its relationship to the Fund. They reviewed and considered the Investment Advisor's representations regarding its assumptions and methods of allocating certain costs, such as personnel costs, which constitute the Investment Advisor's largest operating cost, overhead and trading costs with respect to the provision of investment advisory services. The Independent Trustees discussed with the Investment Advisor the general process through which individuals' compensation is determined and then reviewed by the management committee of the Investment Advisor, as well as the Investment Advisor's methods for determining that its compensation levels are set at appropriate levels to attract and retain the personnel necessary to provide high quality professional investment advice. In evaluating the Investment Advisor's profitability, they excluded certain distribution and marketing-related expenses. The Board and the Independent Trustees recognized that the Investment Advisor is entitled under the law to earn a reasonable level of profits for the services that it provides to the Fund. The Board observed that the Investment Advisor reimbursed certain of the Fund's operating expenses and concluded that the Investment Advisor's level of profitability from its relationship with the Fund did not indicate that the Investment Advisor's compensation was unreasonable or excessive.
Economies of Scale and Sharing of Economies of Scale. The Board and the Independent Trustees considered whether there have been economies of scale with respect to the management of the Fund, whether the Fund has appropriately benefited from any economies of scale, and whether the advisory fee rate is reasonable in relation to the Fund's asset levels and any economies of scale that may exist. The Board and the Independent Trustees considered the Investment Advisor's representation that its internal costs of providing investment management services to the Fund have significantly increased in recent years as a result of a number of factors, including the Investment Advisor's substantial investment in additional professional resources and staffing. The Board and the Independent Trustees considered both quantitative and qualitative information regarding the Investment Advisor's representation that it has also made significant investments in: (1) the portfolio manager, analysts, traders and other investment personnel who assist with the management of the Fund; (2) new compliance, operations, and administrative personnel; (3) information technology, portfolio accounting and trading systems; and (4) office space, each of which enhances the quality of services provided to the Fund. The Board and the Independent Trustees also considered the Investment Advisor's willingness to close funds to new investors when it believed that a fund may have limited capacity to grow or that it otherwise would benefit fund shareholders.
The Board and the Independent Trustees recognized that the advisory fee rate schedule for the Fund does not have breakpoints. They considered that many mutual funds have breakpoints in the advisory fee structure as a means by which to share in the benefits of potential economies of scale as a fund's assets grow. They also considered that not all funds have breakpoints in their fee structures and that breakpoints are not the exclusive means of sharing potential economies of scale. The Board and the Independent Trustees considered the Investment Advisor's belief that breakpoints for the Fund are currently not warranted given the ongoing investments the Investment Advisor is making in its business for the benefit of the Fund, uncertainties regarding the direction of the economy, rising inflation, increasing costs for personnel and systems, and growth or contraction in the Fund's assets, all of which could negatively impact the profitability of the Investment Advisor. The Board and the Independent Trustees also noted that the Investment Advisor has contractually agreed to reimburse the Fund for total annual fund operating expenses in excess of 0.45% of the average daily net assets of the Fund through July 27, 2024. The Board concluded that the Fund is benefitting from the ongoing investments made by the
60
FPA NEW INCOME FUND
BOARD CONSIDERATION OF INVESTMENT ADVISORY
AGREEMENT (Continued)
(Unaudited)
Investment Advisor in its team of personnel serving the Fund and in the Investment Advisor's service infrastructure, and that in light of these investments, the addition of breakpoints in the Fund's advisory fee structure was not warranted at current asset levels.
Ancillary Benefits. The Board and the Independent Trustees considered other "fall out" benefits to the Investment Advisor as a result of its relationship with the Fund, other than the advisory fee, including research services provided to it by broker-dealers providing execution services to the Fund, beneficial effects from the review by the Trust's Chief Compliance Officer of the Investment Advisor's compliance program, the intangible benefits of its association with the Fund generally, and any favorable publicity arising in connection with the Fund's performance. They noted that the Investment Advisor does not have any affiliates that benefit from the Investment Advisor's relationship to the Fund.
Conclusions. The Board and the Independent Trustees determined that the Fund continues to benefit from the services of the Investment Advisor's highly experienced portfolio management team, which has produced reasonable long-term returns. In addition, the Board and the Independent Trustees agreed that the Fund continues to receive high quality services from the Investment Advisor. The Board and the Independent Trustees concluded that the current advisory fee rate is reasonable and fair to the Fund and its shareholders in light of the nature and quality of the services provided by the Investment Advisor and the Investment Advisor's profitability and costs. The Board and the Independent Trustees also noted their intention to continue monitoring the factors relevant to the Investment Advisor's compensation, such as changes in the Fund's asset levels, changes in portfolio management personnel and the cost and quality of the services provided by the Investment Advisor to the Fund. On the basis of the foregoing, and without assigning particular weight to any single factor, none of which was dispositive, the Board concluded that it would be in the best interests of the Fund to continue to be advised and managed by the Investment Advisor and determined to approve the continuation of the current Advisory Agreement for another one-year period through September 30, 2024.
61
FPA NEW INCOME FUND
STATEMENT REGARDING LIQUIDITY RISK
MANAGEMENT PROGRAM
(Unaudited)
In compliance with SEC Rule 22e-4 under the U.S. Investment Company Act of 1940 (the "Liquidity Rule"), the Fund has adopted and implemented a written liquidity risk management program (the "Program"). The Fund's Board of Trustees have also designated the Adviser to serve as the administrator of the Program.
The Liquidity Rule requires that the Program be reasonably designed to assess and manage the Fund's liquidity risk. A Fund's "liquidity risk" is the risk that the Fund could not meet requests to redeem shares issued by the Fund without significant dilution of the remaining investors' interests in the Fund. The Program includes a number of elements that support the assessment, management and review of liquidity risk. In accordance with the Program, the Fund's liquidity risk is assessed no less frequently than annually taking into consideration a variety of factors, including, as applicable, the Fund's investment strategy and liquidity of portfolio investments, cash flow projections, and holdings of cash and cash equivalents, as well as borrowing arrangements and other funding sources. Certain factors are considered under both normal and reasonably foreseeable stressed conditions. There is no guarantee that the Program will achieve its objective under all circumstances.
Under the Program, each Fund portfolio investment is classified into one of four liquidity categories based on a determination of the number of days it is reasonably expected to take to convert the investment to cash, or sell or dispose of the investment, in current market conditions without significantly changing the investment's market value. The Program is reasonably designed to meet Liquidity Rule requirements relating to "highly liquid investment minimums" (i.e., the minimum amount of Fund net assets to be invested in highly liquid investments that are assets) and to monitor compliance with the Liquidity Rule's limitations on a Fund's investments in illiquid investments. Under the Liquidity Rule, a Fund is prohibited from acquiring any illiquid investment if, immediately after the acquisition, the Fund would have invested more than 15% of its net assets in illiquid investments that are assets.
During the period covered by this shareholder report, the Fund's Board of Trustees received reports prepared by the Adviser addressing the Program's operation and assessing the adequacy and effectiveness of its implementation for the period from October 1, 2022 to June 30, 2023. The reports concluded that the Program operated effectively, the Program had been and continued to be reasonably designed to assess and manage the Fund's liquidity risk, and the Program has been adequately and effectively implemented to monitor and respond to the Fund's liquidity developments, as applicable.
62
FPA NEW INCOME FUND
PRIVACY POLICY
(Unaudited)
The following is the privacy notice of the mutual funds managed by First Pacific Advisors, LP ("FPA", and the mutual funds, the "FPA Funds"). A complete list of funds is provided below.
The FPA Funds take privacy seriously and consider privacy to be a fundamental aspect of its relationships with its former, prospective, and current investors. The FPA Funds are committed to maintaining the confidentiality, integrity and security of its former, current, and prospective investors' non-public personal information and other personal information. This privacy policy describes our privacy practices surrounding the collection and sharing of non-public personal information of current, former, and prospective investors.
Sources and Collection of Non-Public Personal Information. While providing investors and/or prospective investors (collectively, "investors") with products and services, the FPA Funds, and certain service providers, such as the FPA Fund's Transfer Agents and/or Administrators, may obtain non-public personal information about such investors, which may come directly from the investor or their intermediaries from sources such as: (i) account applications, subscription agreements and other forms, (ii) written, electronic or verbal correspondence, (iii) investor transactions, (iv) an investor's brokerage or financial advisory firm, financial advisor or consultant, and/or (v) from information captured on applicable websites, including information you may voluntarily provide when you subscribe to receive FPA's quarterly updates or request us to mail you information about the FPA Funds. In addition, the FPA Funds may collect additional non-public personal information from different sources, such as: (i) affiliates or their service providers; (ii) public websites or other publicly available sources such as government records; and/or (iii) from credit reporting agencies, sanctions screening databases, or from sources designed to detect and prevent fraud.
The non-public personal information collected about an investor may include: (i) identifiers and similar information such as the investor's name, address, tax identification number, birth date, driver's license number, and potentially email address and phone number (if provided); (ii) commercial information like an investment selection, beneficiary information, or transaction and account history with the FPA Funds; (iii) internet or other electronic network activity like interactions with the FPA website; and (iv) professional or employment-related information like an investor's occupation and job title.
Purpose for Collecting Non-Public Personal Information. We may collect or use all or a few of these categories of non-public personal information listed above for the following business or commercial purposes: (i) performing services on behalf of FPA or the FPA Funds, including, for example, maintaining or servicing accounts, providing customer service, processing transactions, verifying information, processing payments, or providing similar services; (ii) performing our contractual obligations, including providing updates on FPA Funds performance and other operational matters; (iii) detecting security incidents, protecting against malicious, deceptive, fraudulent, or illegal activity, including, preventing fraud and conducting "Know Your Client," anti-money laundering, terrorist financing, and conflict checks; or (iv) enabling or effecting commercial transactions, including, using bank account details to remit funds and process distributions.
Disclosure of Non-Public Personal Information. The FPA Funds do not disclose any non-public personal information provided by investors or gathered by the FPA Funds to third parties, except as required or permitted by law or as necessary for such third parties to perform their agreements with respect to the FPA Funds. Non-affiliated companies may from time to time be used to provide certain services, such as maintaining investor accounts, preparing and mailing prospectuses, reports, account statements and other information, conducting Know Your Client reviews, performing checks against sanctions lists, and gathering shareholder proxies. In many
63
FPA NEW INCOME FUND
PRIVACY POLICY (Continued)
(Unaudited)
instances, the investor will be a client of a third party, but the FPA Funds may also provide an investor's non-public personal information and account information to the investor's respective custodian, brokerage or financial advisory firm and/or financial advisor or consultant.
Sharing Information with Third Parties. The FPA Funds reserve the right to report or disclose non-public personal information or account information to third parties in circumstances where the FPA Funds believe in good faith that disclosure is required or permitted under law, to cooperate with regulators or law enforcement authorities, to protect their rights or property, or upon reasonable request by the FPA Funds in which an investor has invested. In addition, the FPA Funds may disclose information about an investor or an investor's accounts to a third party at the investor's request or direction or with the consent of the investor.
Rights to Limited Sharing. Federal law gives you the right to limit some but not all sharing of your nonpublic personal information. We do not: (i) share non-public personal information with non-affiliates to market to you; (ii) engage in joint marketing with non-affiliates; (iii) share non-public personal information with affiliates to market to you; or (iv) share non-public personal information about your creditworthiness with affiliates.
Procedures to Safeguard Private Information. The FPA Funds will take reasonable steps and use security measures appropriate to the nature of the information and that comply with applicable laws to protect investors' non-public personal information against unauthorized access and exfiltration, acquisition, theft, or disclosure. In addition to this policy, the FPA Funds have implemented internal procedures that are designed to help guard investors' personal data. Given the nature of information security, there is no guarantee that such safeguards will always be successful.
Changes to the Privacy Policy. From time to time, the FPA Funds may update or revise this privacy policy. If there are changes to the terms of this privacy policy, documents containing the revised policy will be updated.
FPA Funds. FPA Crescent Fund, FPA New Income Fund, FPA Flexible Fixed Income Fund, FPA Queens Road Value Fund, FPA Queens Road Small Cap Value Fund and Source Capital, Inc.
Contact Us. Questions, comments, and requests regarding this privacy policy are welcomed and should be addressed to dataprotection@fpa.com.
64
FPA NEW INCOME FUND
SUPPLEMENTAL INFORMATION
(Unaudited)
Trustees and Officers Information
Additional information about the Trustees is included in the Fund's Statement of Additional Information which is available, without charge, upon request by calling (800) 982-4372. The Trustees and officers of the Fund and their principal occupations during the past five years are as follows:
Name, Address(1)
and Age | | Position(s)
with Trust | | Term of
Office and
Length of
Time
Served | | Principal Occupations
During Past Five Years | | Number of
Portfolios
in FPA Fund
Complex
Overseen
by Trustee | | Other
Directorships
Held by Trustee
During Past
Five Years | |
Independent Trustees | |
Sandra Brown,
1955 | | Trustee | | | Unlimited; Since 2016 | | | Consultant (since 2009). Formerly, CEO and President of Transamerica Financial Advisers, Inc. (1999-2009); President, Transamerica Securities Sales Corp. (1998-2009); Vice President, Bank of America Mutual Fund Administration (1990-1998). Director/Trustee of each FPA Fund since 2016 (Bragg Capital Trust 2020-2023). | | | 6 | | | None | |
Robert F. Goldrich,
1962 | | Trustee | | | Unlimited; Since 2022 | | | Former President/CFO of the Leon Levy Foundation (2015-2022). Director/Trustee of each FPA Fund since 2022 (Bragg Capital Trust 2022-2023). | | | 6 | | | Uluru, Inc (2015-2017) | |
John P. Zader,
1961 | | Trustee | | | Unlimited; Since 2023 | | | Retired (June 2014-present); CEO, Formerly, UMB Fund Services, Inc. (December 2006-June 2014), a mutual fund and hedge fund service provider. President, Investment Managers Series Trust (2007-2014). Director/Trustee of each FPA Fund since 2023. | | | 6 | | | Investment Managers Series Trust (2007-2022) and Investment Managers Series Trust II (2013-present). | |
Interested Trustees | |
J. Richard Atwood,
1960(2) | | Trustee | | | Unlimited; Since 2016 | | | Director and President of FPA GP, Inc., the General Partner of the Adviser (since 2018) and Managing Partner of FPA. Director/Trustee of each FPA Fund since 2016. President of each FPA Fund (2016-2023). | | | 6 | | | None | |
65
FPA NEW INCOME FUND
SUPPLEMENTAL INFORMATION (Continued)
(Unaudited)
Name, Address(1)
and Age | | Position(s)
with Trust | | Term of
Office and
Length of
Time
Served | | Principal Occupations
During Past Five Years | | Number of
Portfolios
in FPA Fund
Complex
Overseen
by Trustee | | Other
Directorships
Held by Trustee
During Past
Five Years | |
Maureen Quill
1963(3) | | Trustee and President | | | Unlimited; Since 2023 | | | President of each FPA Fund (2023-present); President (2019-present), Investment Managers Series Trust; EVP/Executive Director Registered Funds (January 2018-present), Chief Operating Officer (June 2014-January 2018), and Executive Vice President (January 2007-June 2014), UMB Fund Services, Inc.; President, UMB Distribution Services (March 2013-December 2020); Vice President, Investment Managers Series Trust (December 2013-June 2014). Director/Trustee of each FPA Fund since 2023. | | | 6 | | | Investment Managers Series Trust (2019-present) | |
(1) The address of each Trustee, other than Mr. Atwood, is 235 West Galena Street, Milwaukee, Wisconsin 53212. Mr. Atwood's address is 11601 Wilshire Boulevard, Suite 1200, Los Angeles, California 90025
(2) Mr. Atwood is an "interested person" within the meaning of the 1940 Act by virtue of his affiliation with the Fund's Adviser.
(3) Ms. Quill is an "interested person" within the meaning of the 1940 Act by virtue of her affiliation with UMB Distribution Services, LLC.
66
FPA NEW INCOME FUND
SUPPLEMENTAL INFORMATION (Continued)
(Unaudited)
Officers of the Trust. Officers of the Trust are elected annually by the Board. The following individuals serve as officers of the Trust.
Name, Address(1)
and Year of Birth | | Position
with Trust | | Year First
Elected as
Officer of the
Trust | | Principal Occupation(s)
During the Past Five Years | |
Rita Dam
1966 | | Treasurer | | | 2023 | | | Co-Chief Executive Officer (2016-present), and Vice President (2006-2015), Mutual Fund Administration, LLC; Treasurer and Assistant Secretary, Investment Managers Series Trust (December 2007-present); Co-President, Foothill Capital Management, LLC, a registered investment advisor (2018-2022). | |
Diane Drake
1967 | | Secretary | | | 2023 | | | Senior Counsel, Mutual Fund Administration, LLC (October 2015-present); Chief Compliance Officer, Foothill Capital Management, LLC, a registered investment advisor (2018-2019). | |
Martin Dziura
1959 | | Chief Compliance Officer | | | 2023 | | | Principal, Dziura Compliance Consulting, LLC (October 2014-present); Managing Director, Cipperman Compliance Services (2010-September 2014); Chief Compliance Officer, Hanlon Investment Management (2009-2010); Vice President-Compliance, Morgan Stanley Investment Management (2000-2009). | |
Max Banhazl
1987 | | Vice President | | | 2023 | | | Vice President, Mutual Fund Administration, LLC (2012-present); Managing Director, Marketing and Sales Director, Foothill Capital Management (2018-2022). | |
Korey Bauer
1989 | | Vice President | | | 2023 | | | Vice President/Business Development, Mutual Fund Administration, LLC (2022-present); Chief Investment Officer, Managing Director, and Portfolio Manager of Foothill Capital Management (2018-2022); Portfolio Manager, AXS Investments, LLC (2020-2022); President, Chief Executive Officer and Chief Compliance Officer of Bauer Capital Management, LLC (2014-2018). | |
(1) The address for Ms. Dam, Ms. Drake, Mr. Banhazl, and Mr. Bauer: 2220 E. Route 66, Suite 226, Glendora, California 91740. The address for Mr. Dziura: 309 Woodridge Lane, Media, Pennsylvania 19063
67
FPA NEW INCOME FUND
EXPENSE EXAMPLE
For the Six Months Ended September 30, 2023 (Unaudited)
Expense Example
As a shareholder of the Fund, you incur two types of costs: (1) transaction costs, and (2) ongoing costs, including management fees and other Fund expenses. The examples below are intended to help you understand your ongoing costs (in dollars) of investing in the Fund and to compare these costs with the ongoing costs of investing in other mutual funds.
These examples are based on an investment of $1,000 invested at the beginning of the period and held for the entire period from April 1, 2023 to September 30, 2023.
Actual Expenses
The information in the row titled "Actual Performance" of the table below provides actual account values and actual expenses. You may use the information in these columns, together with the amount you invested, to estimate the expenses that you paid over the period. Simply divide your account value by $1,000 (for example, an $8,600 account value divided by $1,000 = 8.6), then multiply the result by the number in the appropriate row under the column titled "Expenses Paid During Period" to estimate the expenses you paid on your account during this period.
Hypothetical Example for Comparison Purposes
The information in the row titled "Hypothetical (5% annual return before expenses)" of the table below provides hypothetical account values and hypothetical expenses based on the Fund's actual expense ratios and an assumed rate of return of 5% per year before expenses, which is not the Fund's actual return. The hypothetical account values and expenses may not be used to estimate the actual ending account balance or expenses you paid for the period. You may use this information to compare the ongoing costs of investing in the Fund and other funds. To do so, compare these 5% hypothetical examples with the 5% hypothetical examples that appear in the shareholder reports of the other funds.
Please note that the expenses shown in the table are meant to highlight your ongoing costs only and do not reflect any transaction costs, such as sales charges (load) or contingent deferred sales charges. Therefore, the information in the row titled "Hypothetical (5% annual return before expenses)" is useful in comparing ongoing costs only, and will not help you determine the relative total costs of owning different funds. In addition, if these transactional costs were included, your costs would have been higher.
| | Actual Performance | | Hypothetical (5% annual
return before expenses) | |
Beginning Account Value 4/1/23 | | $ | 1,000.00 | | | $ | 1,000.00 | | |
Ending Account Value 9/30/23 | | $ | 1,015.40 | | | $ | 1,022.81 | | |
Expenses Paid During Period* 4/1/23-9/30/23 | | $ | 2.27 | | | $ | 2.28 | | |
* Expenses are equal to the Fund's annualized expense ratio of 0.45%, multiplied by the average account value over the period, multiplied by 183/365 (to reflect the six month period). The expense ratios reflect an expense waiver. Assumes all dividends and distributions were reinvested.
68
FPA NEW INCOME FUND
(Unaudited)
INVESTMENT ADVISER
First Pacific Advisors, LP
11601 Wilshire Boulevard, Suite 1200
Los Angeles, California 90025
FUND CO-ADMINISTRATOR, TRANSFER AGENT AND FUND ACCOUNTANT
UMB Fund Services, Inc.
P.O. Box 2175
Milwaukee, Wisconsin 53201-2175
or
235 West Galena Street
Milwaukee, Wisconsin 53212-3948
(800) 638-3060
CO-ADMINISTRATOR
Mutual Fund Administration, LLC
2220 E. Route 66, Suite 226
Glendora, California 91740
TICKER SYMBOL: FPNIX
CUSIP: 302544101
CUSTODIAN
UMB Bank, n.a.,
928 Grand Boulevard
Kansas City, Missouri 64106
DISTRIBUTOR
UMB Distribution Services, LLC
235 West Galena Street
Milwaukee, Wisconsin 53212-3948
LEGAL COUNSEL
Morgan, Lewis & Bockius LLP
600 Anton Boulevard, Suite 1800
Costa Mesa, California 92626
INDEPENDENT REGISTERED PUBLIC ACCOUNTING FIRM
Tait, Weller & Baker LLP
Two Liberty Place
50 South 16th Street, Suite 2900
Philadelphia, Pennsylvania 19102
This report has been prepared for the information of shareholders of FPA New Income Fund and is not authorized for distribution to prospective investors unless preceded or accompanied by an effective prospectus.
A description of the policies and procedures that the Adviser uses to vote proxies related to the Fund's portfolio securities is set forth in the Fund's Statement of Additional Information which is available without charge, upon request, on the Fund's website at fpa.com/funds or by calling (800) 982-4372 and on the Securities and Exchange Commission's website at www.sec.gov.
The Fund's complete proxy voting record for the 12 months ended June 30, 2023 is available without charge, upon request by calling (800) 982-4372 and on the SEC's website at www.sec.gov.
The Fund's schedule of portfolio holdings, filed the first and third quarter of the Fund's fiscal year on Form N-PORT with the SEC, is available on the SEC's website at www.sec.gov.
Additional information about the Fund is available online at fpa.com/funds. This information includes, among other things, holdings, top sectors, and performance, and is updated on or about the 15th business day after the end of each quarter.
Item 2. Code of Ethics.
The Registrant has adopted a code of ethics that applies to the Registrant's principal executive officer and principal financial officer. The Registrant has not made any amendments to its code of ethics during the period covered by this report. The Registrant has not granted any waivers from any provisions of the code of ethics during the period covered by this report.
Item 3. Audit Committee Financial Expert.
The Board of Trustees of the Registrant has determined that Sandra Brown, who is a member of the Registrant’s Audit Committee and Board of Trustees, is an “audit committee financial expert” and is “independent” as those terms are defined in this Item.
Item 4. Principal Accountant Fees and Services.
The Registrant has engaged its principal accountant to perform audit services, audit-related services, tax services and other services during the past two fiscal years. “Audit services” refer to performing an audit of the registrant’s annual financial statements or services that are normally provided by the accountant in connection with statutory and regulatory filings or engagements for those fiscal years. “Audit-related services” refer to the assurance and related services by the principal accountant that are reasonably related to the performance of the audit. “Tax services” refer to professional services rendered by the principal accountant for tax compliance, tax advice, and tax planning. There were no “other services” provided by the principal accountant. The following table details the aggregate fees billed or expected to be billed for each of the last two fiscal years for audit fees, audit-related fees, tax fees and other fees by the principal accountant.
| | | | FYE 09/30/2023 | | | FYE 09/30/2022 | |
| (a) | Audit Fees | | $ | 12,500 | | | $ | 36,500 | |
| (b) | Audit Related Fees | | $ | - | | | $ | - | |
| (c) | Tax Fees (1) | | $ | 2,500 | | | $ | 6,800 | |
| (d) | All Other Fees | | $ | - | | | $ | - | |
| (1) | Tax Fees are for preparation of the Fund’s tax return(s). |
The audit committee has adopted pre-approval policies and procedures that require the audit committee to pre-approve all audit and non-audit services of the registrant, including services provided to any entity affiliated with the registrant.
The percentage of fees billed by principal accountant applicable to non-audit services pursuant to waiver of pre-approval requirement were as follows:
| | | FYE 09/30/2023 | | | FYE 09/30/2022 | |
| Audit Related Fees | | | 0 | % | | | 0 | % |
| Tax Fees | | | 0 | % | | | 0 | % |
| All Other Fees | | | 0 | % | | | 0 | % |
All of the principal accountant’s hours spent on auditing the registrant’s financial statements were attributed to work performed by full-time permanent employees of the principal accountant.
The following table indicates the non-audit fees billed or expected to be billed by the registrant’s accountant for services to the registrant and to the registrant’s investment adviser (and any other controlling entity, etc.—not sub-adviser) for the last two years. The audit committee of the Board of Trustees has considered whether the provision of non-audit services that were rendered to the registrant’s investment adviser is compatible with maintaining the principal accountant’s independence and has concluded that the provision of such non-audit services by the accountant has not compromised the accountant’s independence.
| Non-Audit Related Fees | | | FYE 09/30/2023 | | | | FYE 09/30/2022 | |
| Registrant | | | N/A | | | | N/A | |
| Registrant’s Investment Advisor | | | N/A | | | | N/A | |
Item 5. Audit Committee of Listed Registrants.
Not applicable.
Item 6. Investments.
| (a) | Schedule of Investments is included as a part of the report to shareholders filed under Item 1 of this Form N-CSR. |
Item 7. Disclosure of Proxy Voting Policies and Procedures for Closed-End Management Investment Companies.
Not applicable.
Item 8. Portfolio Managers of Closed-End Management Investment Companies.
Not applicable.
Item 9. Purchases of Equity Securities by Closed-End Management Investment Company and Affiliated Purchasers.
Not applicable.
Item 10. Submission of Matters to a Vote of Security Holders.
There have been no material changes to the procedures by which the shareholders may recommend nominees to the registrant’s board of directors.
Item 11. Controls and Procedures.
| (a) | The principal executive officer and principal financial officer of the registrant have concluded that the registrant’s disclosure controls and procedures (as defined in Rule 30a-3(c) under the Investment Company Act of 1940) are effective based on their evaluation of the disclosure controls and procedures as of a date within 90 days of the filing date of this report. |
| (b) | There have been no significant changes in the registrant’s internal controls over financial reporting (as defined in Rule 30a-3(d) under the Investment Company Act of 1940) that occurred during the period covered by this report that have materially affected, or is reasonably likely to materially affect, the registrant’s internal controls over financial reporting. |
Item 12. Disclosure of Securities Lending Activities for Closed-End Management Investment Companies
Not applicable.
Item 13. Exhibits.
SIGNATURES
Pursuant to the requirements of the Securities Exchange Act of 1934 and the Investment Company Act of 1940, the registrant has duly caused this report to be signed on its behalf by the undersigned, thereunto duly authorized.
| FPA FUNDS TRUST | |
| | | |
| By: | /s/ Maureen A. Quill | |
| | Maureen A. Quill | |
| | President (principal executive officer) | |
Date: December 6, 2023
Pursuant to the requirements of the Securities Exchange Act of 1934 and the Investment Company Act of 1940, this report has been signed below by the following persons on behalf of the registrant and in the capacities and on the dates indicated.
| By: | /s/ Maureen A. Quill | |
| | Maureen A. Quill | |
| | President (principal executive officer) | |
Date: December 6, 2023
| By: | /s/ Rita Dam | |
| | Rita Dam | |
| | Treasurer (principal financial officer) | |
Date: December 6, 2023