UNITED STATES
SECURITIES AND EXCHANGE COMMISSION
Washington, D.C. 20549
FORM N-CSR
CERTIFIED SHAREHOLDER REPORT OF REGISTERED
MANAGEMENT INVESTMENT COMPANIES
Investment Company Act file number: 811-08544
Investment Managers Series Trust III
(Exact Name of Registrant as Specified in Charter)
235 West Galena Street
Milwaukee, Wisconsin 53212
(Address of Principal Executive Offices, including Zip Code)
��
Diane J. Drake
Mutual Fund Administration, LLC
2220 E. Route 66, Suite 226
Glendora, California 91740
(Name and Address of Agent for Service)
COPIES TO:
Laurie Anne Dee
Morgan, Lewis & Bockius LLP
600 Anton Boulevard, Suite 1800
Costa Mesa, California 92626
Registrant’s telephone number, including area code: (626) 385-5777
Date of fiscal year end: May 31
Date of reporting period: November 30, 2023
Item 1: Report to Shareholders.
| (a) | The Reports to Shareholders are attached herewith. |

Distributor:
UMB DISTRIBUTION SERVICES, LLC
235 West Galena Street
Milwaukee, Wisconsin 53212
Semi-Annual Report
November 30, 2023
FPA Queens Road Small Cap Value Fund
FPA QUEENS ROAD SMALL CAP VALUE FUND
LETTER TO SHAREHOLDERS
Dear Fellow Shareholders,
FPA Queens Road Small Cap Value Fund's ("Fund") Investor Class returned 7.72% in the first half of fiscal year 2024 (June 1, 2023 to November 30, 2023). This compares to the Russell 2000 Value Index return of 7.37% for the same period. For the 12 months ended November 30, 2023, the Fund returned 2.37% vs -4.73% for the Russell 2000 Value Index. As a reminder, we expect to outperform in down markets and trail somewhat in speculative markets as a result of our diligent, disciplined, and patient process.
15% or Larger Russell 2000 Value Drawdowns Since Fund Inception1
| | | Jun 02-
Oct 02 | | Jun 07-
Mar 09 | | May 11-
Oct 11 | | Jun 15-
Feb 16 | | Sep 18-
Dec 18 | | Jan 20-
Mar 20 | | Nov 21-
Sep 22 | | Average of Each
Period Since
Inception | |
FPA Queens Road Small
Cap Value | | | -16.70 | % | | | -50.69 | % | | | -17.07 | % | | | -10.17 | % | | | -13.90 | % | | | -32.91 | % | | | -19.68 | % | | | — | | |
Russell 2000 Value TR
USD | | | -27.28 | % | | | -61.71 | % | | | -28.13 | % | | | -22.55 | % | | | -24.22 | % | | | -44.65 | % | | | -25.44 | % | | | — | | |
Downside capture ratio | | | 61.2 | % | | | 82.1 | % | | | 60.7 | % | | | 45.1 | % | | | 57.4 | % | | | 73.7 | % | | | 77.4 | % | | | 65.37 | % | |
Outperformance (bps) | | | 1058 | | | | 1102 | | | | 1106 | | | | 1238 | | | | 1032 | | | | 1174 | | | | 576 | | | | — | | |
Market Commentary
We are fundamental, bottom-up stock pickers and spend our time researching companies one by one. We don't make macro bets, and we don't try to predict the short-term direction of the market. We do, however, consider issues that we believe broadly affect small-cap indices. Right now, the two most relevant issues for small-caps as an asset class are elevated profit margins and rising debt servicing costs. We think that these issues further the case for active management in small-cap investing.
Headline valuation ratios for small-caps are cheap relative to large-caps.2 But, from our bottom-up perspective, valuations for most quality small companies are still full. As we discussed in our last letter, some of this valuation discount at the index level is compositional.3 Even excluding the large number of unprofitable companies in the Russell 2000, small-cap indices include many more financial companies (especially banks)
1 As of September 30, 2023. Source: Morningstar Direct, FPA. Data shown for the FPA Queens Road Small Cap Value Fund — Investor Class ("Fund"). Inception of the Fund was June 13, 2002. The periods referenced above reflect Russell 2000 Value drawdowns 15% or greater and are calculated from that index's peak and trough dates, (i.e., 6/14/2002-10/9/2002, 6/5/2007-3/9/2009, 5/10/2011-10/3/2011, 6/24/2015-2/11/2016, 9/20/2018-12/24/2018, 1/16/2020-3/23/2020, 11/8/2021-9/30/22). Please see the end of this presentation for Important Disclosures and Definitions of key terms. Past performance is not indicative, nor is it a guarantee, of future results.
2 Source: Morningstar; Small-Cap Stocks Are Really Cheap; December 2, 2022; https://www.morningstar.com/markets/small-cap-stocks-are-really-cheap; also; Market Brief: Fading Recession Fears, Cheap Valuations Have Small-Cap Stocks Looking Attractive; June 2, 2023 https://www.morningstar.com/markets/fading-recession-fears-cheap-valuations-have-small-cap-stocks-looking-attractive.
3 Source: FPA; https://fpa.com/docs/default-source/funds/fpa-queens-road-small-cap-value-fund/literature/fpa-qr-small-cap-value-fund-commentary-2023-06_final.pdf?sfvrsn=74749f9d_8
1
FPA QUEENS ROAD SMALL CAP VALUE FUND
LETTER TO SHAREHOLDERS
(Continued)
that we believe deserve to trade at low multiples and fewer tech companies that tend to trade at higher multiples. And some of the small-cap discount can be attributed to a large number of small companies that appear to be overearning, pushing their headline valuations lower (home builders and housing materials, specialty retailers, trucking and shipping, et al.). As shown in the chart below from Ed Yardeni, small-cap profit margins are significantly elevated relative to history. But estimates for 2024 margins, the lower red line, are declining (Yardeni looks at the S&P 600 rather than the Russell 2000 Value Index, the Fund's benchmark. The companies in the S&P 600 are required to be profitable and tend to be larger and higher quality than those in the Russell 2000 Value Index, but the point holds).4
S&P 600 Projected Profit Margin
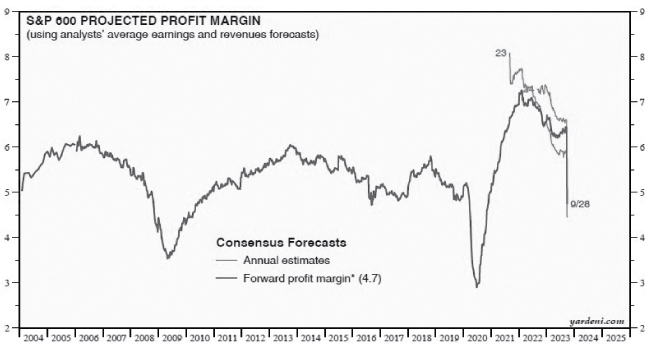
* Time-weighted average of the consensus estimates for current year and next year. Monthly through December 2005, weekly thereafter. Source: Yardeni; I/B/E/S data by Refinitiv. The two red line represent the 2023 and 2024 annual earnings estimates of the companies in the index.
The second big picture issue we are monitoring is debt service. Interest rates are up significantly from a year ago and are starting to impact corporate interest costs, with the ripple effect of slowing the economy. Many small-cap companies are lower quality than large-caps. But, according to research by RBC Capital Markets, their debt profile also tends to be worse. Small-caps generally have more debt, a shorter weighted-average maturity
4 Source: Yardeni Research, Inc.; Global Index Briefing: S&P 600; October 16, 2023; We like the chart packages from Yardeni, but the data on small-cap index valuations and margins are consistent with other authors and methodologies; https://www.yardeni.com/pub/int-sap600.pdf
2
FPA QUEENS ROAD SMALL CAP VALUE FUND
LETTER TO SHAREHOLDERS
(Continued)
(4.8 years for the Russell 2000 vs. 8.8 years for the S&P 500), and more floating rate debt (slightly more than 50% vs. slightly under 40% for the S&P 500).5 In the most-recent rate-driven market sell-off since the July peak, the Russell 2000 performed worse than the S&P 500, -11% vs. -7% respectively.
The chart below, from a recent article in the Financial Times and data from Ned Davis and Capital IQ, shows the recent spike in small-cap interest expense. This will accelerate as low-cost fixed-rate debt continues to roll off company balance sheets.6
Smaller companies are paying record interest expense, without a major boost from interest income
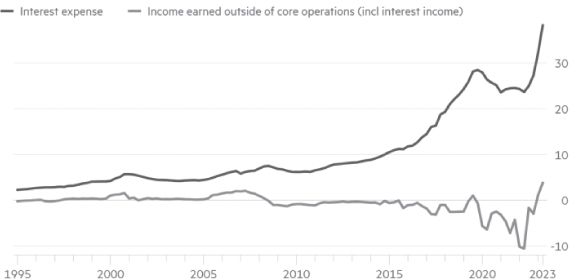
Per-share measures for the small-cap S&P 600 ($). Source: Financial Times, Ned Davis Research, S&P-capital IQ
These factors help make an attractive case for active ownership of small-caps. When we look across our portfolio, we see a collection of higher-quality, smaller companies with strong franchises and constructive long-term outlooks. Its our belief that the companies the Fund own have conservative debt loads and are in favorable industries. And while quality small companies aren't on sale as they were during the financial crisis, the depths of Covid, or even the taper tantrum at the end of 2018, we believe valuations on the companies the Fund owns are attractive.
5 Source: RBC; Small Cap Balance Sheet Fears — Transcript refers to the S&P 500; October 24, 2022; https://www.rbccm.com/en/insights/transcripts/small_cap_balance_sheet_fears.page
6 Source: The Financial Times; US small-cap stocks wilt in the heat of higher interest rates; September 26, 2023; https://www.ft.com/content/9de514d5-678b-4b52-91e1-86fd53794d13
Past performance is not indicative, nor is it a guarantee, of future results.
3
FPA QUEENS ROAD SMALL CAP VALUE FUND
LETTER TO SHAREHOLDERS
(Continued)
Quality and the Four Pillar Process
Our investment process has four pillars:
1. Balance-Sheet Strength — We seek companies with strong balance sheets. We are not comfortable owning companies that have significant liabilities (e.g., debt, legal, regulatory, pension, or something inherent in their business models) that could cause insolvency concerns when there is an economic, financial, or any other kind of crisis. We want to make sure we are invested in companies that have staying power.
2. Valuation — We normalize economic earnings over full market cycles, primarily using free cash-flow discount valuation models. We demand a margin of safety.
3. Management — We evaluate management's track record of laying out a long-term strategy and successfully executing their stated objectives.
4. Sector and Industry Analysis — We own companies in growing industries with stable competitive dynamics and favorable economics. We avoid commoditized or overly-competitive industries.
We have a preference for long-term compounders — i.e., high-quality franchises with strong balance sheets, proven management teams, and attractive industry dynamics that we hope to own forever. Compounders don't usually come cheap, and while we are always valuation-conscious, we are generally willing to pay a little bit more for higher quality companies.
So, what do we mean by quality? At the most basic level, quality means we can have confidence that a company's earnings and cash flows will be greater in three-to-five years than they are today. Different investors look at different metrics to describe quality. High returns on-capital, high operating margins, organic growth, high cash conversion, and low debt are all indicators of quality. But at the end of the day, we take a holistic look at our companies, seek to identify their risks, try to remain conservative and judicious, and compare their current prices to our confidence in their futures. Our four pillars — balance sheet strength, valuation, management, and industry analysis — guide this process.
Historically, quality has been a large contributor to outperformance during market downturns.7 Low leverage allows companies to survive and reinvest during downturns. Strong management teams can be trusted to shepherd their companies through headwinds and seek out new growth opportunities. Entrenched competitive positions and industries with favorable outlooks mean that the passage of time is our friend. In practice, it is never this easy. It is rare to find a company that sits cleanly atop each of our four pillars. But when things get complicated and the future seems uncertain, the four-pillar framework helps us keep a long term perspective.
7 Please refer to the table on page 1 for performance of the Fund during 15% or greater downturns in the Russell 2000 Value Index.
4
FPA QUEENS ROAD SMALL CAP VALUE FUND
LETTER TO SHAREHOLDERS
(Continued)
Trailing Twelve Months (TTM) and Semi-Annual Contributors and Detractors8
Contributors | | Performance
Contribution | | Percent of
Portfolio | | Detractors | | Performance
Contribution | | Percent of
Portfolio | |
| 1H Fiscal Year 2024 | | | | | | | | | | | |
Fabrinet | | | 2.03 | % | | | 5.4 | % | | MasTec | | | -0.86 | % | | | 1.8 | % | |
American Equity
Invt Life | | | 1.12 | % | | | 3.4 | % | | United Natural Foods | | | -0.82 | % | | | 1.2 | % | |
Deckers Outdoor | | | 0.98 | % | | | 2.6 | % | | Darling Ingredients | | | -0.75 | % | | | 1.9 | % | |
G-III Apparel Group | | | 0.94 | % | | | 1.6 | % | | Livent | | | -0.66 | % | | | 1.2 | % | |
InterDigital | | | 0.85 | % | | | 4.0 | % | | UGI | | | -0.44 | % | | | 2.1 | % | |
| | | | 5.93 | % | | | 17.0 | % | | | | | -3.54 | % | | | 8.1 | % | |
TTM | | | | | | | | | | | |
InterDigital | | | 2.38 | % | | | 3.6 | % | | United Natural Foods | | | -2.08 | % | | | 1.7 | % | |
Deckers Outdoor | | | 1.35 | % | | | 2.5 | % | | ServisFirst Bancshares | | | -1.25 | % | | | 3.4 | % | |
Fabrinet | | | 1.15 | % | | | 5.0 | % | | UGI | | | -1.10 | % | | | 2.3 | % | |
PVH | | | 0.97 | % | | | 2.4 | % | | Darling Ingredients | | | -0.90 | % | | | 1.9 | % | |
American Equity
Invt Life | | | 0.93 | % | | | 3.4 | % | | Livent | | | -0.76 | % | | | 1.1 | % | |
| | | | 6.78 | % | | | 17.0 | % | | | | | -6.10 | % | | | 10.4 | % | |
Trailing Twelve Months (TTM) Contributors
• InterDigital is a research and development organization that develops and acquires wireless and video patents across key technologies. The company has a history of strong financial performance, opportunistically buys back shares, and pays a modest dividend. Shares jumped earlier this year when InterDigital announced licensing renewals with Samsung, LG, and Panasonic and then reported strong fourth quarter 2022 results.9
• Deckers is a footwear and apparel company that owns the UGG, Hoka, Teva, Sanuk, and Koolaburra brands. Management has done a masterful job growing and extending the UGG franchise. Now they are repeating their success with Hoka running shoes which surpassed $1 billion in sales last year.10 At over
8 Reflects the top contributors and top detractors to the Fund's performance based on contribution to return for the trailing twelve months (TTM). Contribution is presented gross of investment management fees, transactions costs, and Fund operating expenses, which if included, would reduce the returns presented. The information provided does not reflect all positions purchased, sold or recommended during the TTM. A copy of the methodology used and a list of every holding's contribution to the overall Fund's performance during the TTM is available by contacting crm@fpa.com. It should not be assumed that recommendations made in the future will be profitable or will equal the performance of the securities listed. Totals may not sum due to rounding. 'Percent of Portfolio' reflects the average weight over the period.
9 Source: Foss Patents; InterDigital announces arbitration agreement with Samsung, renewal with Panasonic, video codec license deal with LG; January 2023; http://www.fosspatents.com/2023/01/interdigital-announces-arbitration.html; Source: InterDigital; InterDigital Press Release; January 2023; https://ir.interdigital.com/news-events/press-releases/news-details/2023/InterDigital-Issues-Preliminary-Financial-Results-for-Fourth-Quarter-2022/default.aspx
10 Source: Deckers; https://ir.deckers.com/news-events/press-releases/press-release/2023/DECKERS-BRANDS-REPORTS-FOURTH-QUARTER-AND-FULL-FISCAL-YEAR-2023-FINANCIAL-RESULTS/default.aspx
5
FPA QUEENS ROAD SMALL CAP VALUE FUND
LETTER TO SHAREHOLDERS
(Continued)
20 times earnings (as of Sep 30, 2023), we have weighed Deckers' full valuation against the quality of the management team, strong brands, and net cash balance sheet and are comfortable with the Fund's current position.11
• Fabrinet is a contract manufacturer of optical communications sensors and equipment. The company has dominant scale in hard-to-replicate precision-manufacturing technologies and an enviable track record of execution. The majority of sales are to optical communications equipment manufacturers, but Fabrinet has been successfully diversifying into the data center, industrial, auto, and medical end-markets. The stock jumped after reporting June 2023 earnings — datacenter sales increased 50% sequentially and more than 100% over the previous year, driven by their 800-gigabyte transceivers for Artificial Intelligence applications. The company also announced that Nvidia is a 10%+ customer.12 Fabrinet was a top-five holding in the Fund before their latest earnings announcement and, although we have trimmed our position, is currently the largest holding. While we continue to evaluate what we believe is a positive step change in the company's earnings power, we are seeking to take some profits in keeping with our risk management policies.
• PVH owns the Tommy Hilfiger and Calvin Klein brands globally. While the US business has struggled, the international business is a gem. Particularly in Europe, Tommy and Calvin have a superior brand positioning, grow consistently, have high margins and a strong direct to consumer presence. CEO Stephan Larsson, who replaced long time leader Manny Chirico in 2021, has done an excellent job improving the operations, strengthening the brand, growing in Asia and digitally and fixing the US business. PVH throws off a lot of cash, most of which returns to shareholders through buybacks.
• AEL is a leading writer of fixed-index annuities. The company is undergoing an ambitious transformation plan, led by CEO Anant Bhalla, to diversify into alternatives and move assets off balance sheet, creating a fee income stream and freeing up-capital for buybacks (a program they refer to as AEL 2.0). As of 23Q2, AEL had 25% of its balance sheet in private assets.13 The company has had several takeover offers over the years and on June 27, 2023 Brookfield bid $55 per share for the business.14
Trailing Twelve Months (TTM) Detractors
• United Natural Foods (UNFI) distributes natural and organic food. Whole Foods is a 20% customer, but UNFI has done a reasonable job diversifying its product and customer base, with a big boost from its acquisition of SuperValu in 2018.15 The company's share price has declined with three successive earnings misses and guidance revisions this year.16 UNFI is suffering from a combination of volatile food prices, consumers trading down from high-priced organic food items, and pricing and execution
11 Source: Deckers; https://ir.deckers.com/news-events/press-releases/press-release/2023/DECKERS-BRANDS-REPORTS-SECOND-QUARTER-FISCAL-2024-FINANCIAL-RESULTS/default.aspx
12 Source: Fabrinet fiscal Q4 2023 earnings release and call; https://investor.fabrinet.com/events/event-details/fabrinets-fourth-quarter-2023-financial-results-conference-call
13 Source: AEL 23Q2 earnings release; https://ir.american-equity.com/financial-reporting/quarterly-results
14 Source: https://www.wsj.com/articles/brookfield-seeks-hard-to-get-prize-in-american-equity-deal-d8e02445
15 Source: UNFI Annual Report; July 30, 2022; page 11, https://s22.q4cdn.com/589001886/files/doc_financials/2022/annual/UNFI-2022-10-K-as-filed.pdf
16 Source: UNFI fiscal 23Q2, 23Q3 and 23Q4 earnings releases and calls; https://ir.unfi.com/financials/quarterly-results/default.aspx
Past performance is no guarantee, nor is it indicative, of future results.
6
FPA QUEENS ROAD SMALL CAP VALUE FUND
LETTER TO SHAREHOLDERS
(Continued)
mistakes by the company. Distribution is usually a resilient business model and, on a normalized basis, UNFI looks cheap. But the company is now in full-bore turnaround mode, and we have been judicious about adding to our position.
• ServisFirst Bank is a conservatively-run lending franchise led by founder Tom Broughton. ServisFirst hires local bankers but doesn't build branches, which promotes best-in-class efficiency metrics while maintaining a strong and conservative lending culture. Return on equity (ROE) and average earnings-per-share growth have been near 20% for the last 10 years through year end 202217 — very attractive results for a conservative, vanilla commercial lender. ServisFirst shares declined significantly following the failure of Silicon Valley Bank but have outperformed the regional bank ETFs on a year-to-date basis.18 We think investors are concerned about ServisFirst's uninsured commercial deposits and the stock's premium price-to-book valuation. But we are comfortable that although the bank will raise deposit rates, its commercial relationships are sticky, and ServisFirst's high net interest margin and return on equity (ROE) will allow it to weather the storm better than its competitors. SFBS' 23Q2 earnings report validated our confidence in the company.19
• UGI owns gas utilities and pipelines in Pennsylvania and West Virginia and the largest propane distribution businesses in the United States and Europe. This is our kind of company — despite its disparate parts, UGI has increased earnings at a relatively steady high single digit rate historically while distributing excess cash through dividends.20 We believe shares are down primarily because of poor execution at AmeriGas, UGI's U.S. propane business, but also because of losses at the company's European energy marketing business and the negative effects of warm weather on earnings. We believe UGI is attractive at less than 10x earnings, and we have been incrementally adding to the Fund's position.
• Darling Ingredients is the largest global processor of animal fats and proteins and other excesses from the food supply chain. Darling collects waste from slaughter houses and butchers, used cooking oil, scraps from bakeries and has a handful of related businesses. The company then processes this material into useful commodities and ingredients. Darling is the combination of an industrial with scale advantages in their collection and rendering operations and a commodity processor with exposure to commodity prices and spreads. Adding to the complication, in 2021 Darling vertically integrated into biodiesel with their Diamond Green Diesel (DGD) refinery, a joint venture with Valero. The stock did very well in 2021 and 2022 as higher soft commodity prices translated to higher earnings and the company planned for growth at DGD. In 2023, the stock has given some of those gains back as commodity prices ticked lower, the market for renewable investment numbers (RINs) ticked lower and there were operational hiccups at DGD. In addition, Darling did a handful of large, debt funded acquisitions in 2022 and 2023 and the market appetite for levered companies has deteriorated.21 Darling is quickly de-levering and we are comfortable with the company's long term earnings power at its current size in the portfolio.
17 Source: Factset. Cumulative average growth rate is based on diluted earnings per share for year ends 2013-2022.
18 Source: Factset. YTD performance for SFBS vs. iShares US Regional Banks ETF (ARCX: IAT) and SPDR S&P Regional Banking ETF (ARCX: KRE) Sep 30, 2023].
19 Source: ServisFirst Bank 23Q2 earnings release and call; https://www.servisfirstbancshares.com/news-events/events-presentations
20 Source: Company financials and Factset.
21 Source: Darling 23Q3 earnings and transcript; https://ir.darlingii.com/quarterly-results?item=47
7
FPA QUEENS ROAD SMALL CAP VALUE FUND
LETTER TO SHAREHOLDERS
(Continued)
• Livent is an integrated, low-cost lithium producer that was spun out from FMC Corporation in 2018. This is an unusual investment for us — we normally avoid the commodity and materials sectors and have kept our position in Livent small. But we believe Livent has a unique position in an industry with a strong long-term outlook. The company generates cash, is virtually debt-free (as of Sep 30, 2023), and has considerable capacity additions planned near-term. In May, Livent announced an all-stock combination with Australia's Allkem that should add scale, allow for cost reductions, and help consolidate the market. 22 The company's share price has declined along with lithium prices despite Livent's relatively long-term contracts and reiteration of 2023 guidance.23
Portfolio Positioning
The Fund's cash position is generally a residual of the investment process. When we cannot find companies that meet our stringent criteria, we will allow cash to build. Over the long term, we would prefer to own a diversified portfolio of quality companies (acquired at reasonable prices) instead of cash. But we weigh this objective against our reluctance to sacrifice a margin of safety and risk of permanent impairment of-capital. As of November 30, 2023, the Fund's cash position was 10.2%.
During the quarter, we added one new position, added to fifteen current holdings, and reduced one current holding.
Despite the recent market volatility and an uncertain macro environment, we feel better about the Fund's long-term prospects than we have in quite some time. We do not make short term predictions on market direction. But the current portfolio valuations, competitive positions, and track records of execution of the Fund's holdings give us confidence that they will be worth more in three-to-five years than they are today.
As always, and as significant co-investors in the Fund, we appreciate your trust in us to be good stewards of your-capital. If you would like to discuss performance or the Fund's portfolio holdings in greater detail, please let us know.
Respectfully,

Steve Scruggs, CFA, Portfolio Manager
Ben Mellman, Senior Analyst
November 30, 2023
22 Source: https://ir.livent.com/news/news-details/2023/Allkem-and-Livent-to-Create-a-Leading-Global-Integrated-Lithium-Chemicals-Producer/default.aspx
23 Source: Livent 23Q2 earnings release and transcript; https://ir.livent.com/financials-and-filings/quarterly-results/default.aspx
Past performance is no guarantee, nor is it indicative, of future results.
8
FPA QUEENS ROAD SMALL CAP VALUE FUND
LETTER TO SHAREHOLDERS
(Continued)
Important Disclosures
This Commentary is for informational and discussion purposes only and does not constitute, and should not be construed as, an offer or solicitation for the purchase or sale of any securities, products or services discussed, and neither does it provide investment advice. Any such offer or solicitation shall only be made pursuant to the Fund's Prospectus, which supersedes the information contained herein in its entirety. This Commentary does not constitute an investment management agreement or offering circular.
The statements contained herein reflect the opinions and views of the portfolio managers as of the date written, is subject to change without notice, and may be forward-looking and/or based on current expectations, projections, and/or information currently available. Such information may not be accurate over the long-term. These views may differ from other portfolio managers and analysts of the firm as a whole and are not intended to be a forecast of future events, a guarantee of future results or investment advice.
Portfolio composition will change due to ongoing management of the Fund. References to individual securities or sectors are for informational purposes only and should not be construed as recommendations by the Fund, the portfolio manager, the Adviser, the Sub-Adviser or the distributor. It should not be assumed that future investments will be profitable or will equal the performance of the security or sector examples discussed. The portfolio holdings as of the most recent quarter-end may be obtained at https://fpa.com.
Future events or results may vary significantly from those expressed and are subject to change at any time in response to changing circumstances and industry developments. The information and data contained herein has been prepared from sources believed reliable, but the accuracy and completeness of the information cannot be guaranteed and is not a complete summary or statement of all available data.
The information contained herein is not complete, may change, and is subject to, and is qualified in its entirety by, the more complete disclosures, risk factors, and other information contained in the Fund's Prospectus and Statement of Additional Information. The information is furnished as of the date shown. No representation is made with respect to its completeness or timeliness. The information is not intended to be, nor shall it be construed as, investment advice or a recommendation of any kind.
Certain statements contained in this presentation may be forward-looking and/or based on current expectations, projections, and information currently available. Actual events or results may differ from materially those we anticipate, or the actual performance of any investments described herein may differ from those reflected or contemplated in such forward-looking statements, due to various risks and uncertainties. We cannot assure future results and disclaim any obligation to update or alter any forward-looking statements, whether as a result of new information, future events, or otherwise. Such statements may or may not be accurate over the long-term. Statistical data or references thereto were taken from sources which we deem to be reliable, but their accuracy cannot be guaranteed.
The reader is advised that the Fund's investment strategy includes active management with corresponding changes in allocations from one period of time to the next. Therefore, any data with respect to investment allocations as of a given date is of limited use and may not be reflective of the portfolio manager's more general views with respect to proper geographic, instrument and /or sector allocations. The data is presented for indicative purposes only and, as a result, may not be relied upon for any purposes whatsoever.
In making any investment decision, you must rely on your own examination of the Fund, including the risks involved in an investment. Investments mentioned herein may not be suitable for all recipients and in each case, potential investors are advised not to make any investment decision unless they have taken independent
9
FPA QUEENS ROAD SMALL CAP VALUE FUND
LETTER TO SHAREHOLDERS
(Continued)
advice from an appropriately authorized advisor. An investment in any security mentioned herein does not guarantee a positive return as securities are subject to market risks, including the potential loss of principal. You should not construe the contents of this document as legal, tax, investment or other advice or recommendations.
Fund performance presented is calculated on a total return basis, which includes the reinvestment of all income, plus realized and unrealized gains/losses, if applicable. Unless otherwise indicated, performance results are presented on a net of fees basis and reflect the deduction of, among other things: management fees, brokerage commissions, operating and administrative expenses, and accrued performance fee/allocation, if applicable.
The information provided in this presentation is based upon data existing as of the date(s) of the report and has not been audited or reviewed. While we believe the information to be accurate, it is subject in all respects to adjustments that may be made after proper review and reconciliation.
Investments, including mutual fund investments, carry risks and investors may lose principal value. Capital markets are volatile and can decline significantly in response to adverse issuer, political, regulatory, market, or economic developments. Small and mid-cap stocks involve greater risks and they can fluctuate in price more than larger company stocks. Short-selling involves increased risks and transaction costs. You risk paying more for a security than you received from its sale. Groups of stocks, such as value and growth, go in and out of favor which may cause certain funds to underperform other equity funds. The value of an individual security can be more volatile than the market as a whole and can perform differently than the value of the market as a whole.
The Fund primarily invests in equity securities (common stocks, preferred stocks and convertible securities) of small-capitalization U.S. companies, defined as those with market-capitalization, at the time of purchase, that is no greater than the largest market-capitalization of any company included in the Russell 2000 Index. Investing in small companies involves special risks including, but not limited to, the following: smaller companies typically have more risk and their company stock prices are more volatile than that of large companies; their securities may be less liquid and may be thinly traded which makes it more difficult to dispose of them at prevailing market prices; these companies may be more adversely affected by poor economic or market conditions; they may have limited product lines, limited access to financial resources, and may be dependent on a limited management group; and small-cap stocks may fluctuate independently of large-cap stocks. All investment decisions are made at the discretion of the Portfolio Manager, in accordance with the then current Prospectus. Comparison to any index is for illustrative purposes only.
The prices of securities held by the Fund may decline in response to certain events taking place around the world, including those directly involving the companies whose securities are owned by the Fund. Securities in the Fund's portfolio may underperform due to inflation (or expectations for inflation), interest rates, global demand for particular products or resources, natural disasters, pandemics, epidemics, terrorism, regulatory events and governmental or quasi-governmental actions. There is a risk that you may lose money by investing in the Fund.
Value style investing presents the risk that the holdings or securities may never reach their full market value because the market fails to recognize what the portfolio management team considers the true business value or because the portfolio management team has misjudged those values. In addition, value style investing may fall out of favor and underperform growth or other styles of investing during given periods.
Please refer to the Fund's Prospectus for a complete overview of the primary risks associated with the Fund.
The FPA Funds are distributed by UMB Distribution Services, LLC, 235 W. Galena Street, Milwaukee, WI, 53212. UMB and FPA are not affiliated.
10
FPA QUEENS ROAD SMALL CAP VALUE FUND
LETTER TO SHAREHOLDERS
(Continued)
Index / Benchmark / Category Definitions
Comparison to any index or benchmark is for illustrative purposes only and should not be relied upon as a fully accurate measure of comparison. The Fund may be less diversified than the indices noted herein and may hold non-index securities or securities that are not comparable to those contained in an index. Indices will hold positions that are not within the Fund's investment strategy. Indices are unmanaged and do not reflect any commissions, transaction costs, or fees and expenses which would be incurred by an investor purchasing the underlying securities and which would reduce the performance in an actual account. You cannot invest directly in an index.
Russell 2000 Index is a small-cap stock market index of the smallest 2,000 stocks in the Russell 3000 Index.
The Russell 2000 Value Index is a subset of the Russell 2000 Index, and tracks the stocks of small domestic companies, based on total market-capitalization. The Russell 2000 Value Index represents those stocks of the Russell 2000 with lower price-to-book ratios and lower relative forecasted growth rates. A total return index computes the index value based on-capital gains plus cash payments such as dividends and interest.
Standard & Poor's 500 Stock Index (S&P 500) is a-capitalization-weighted index which covers industrial, utility, transportation and financial service companies, and represents approximately 75% of the New York Stock Exchange (NYSE)-capitalization and 30% of NYSE issues. The S&P 500 is considered a measure of large-capitalization stock performance.
Standard & Poor's 600 Stock Index (S&P 600) is an index of small-cap stocks managed by Standard & poor's. It tracks a broad range of small-sized companies that meet specific liquidity and stability requirements. This is determined by specific metrics such as public float, market capitalization, and financial viability, among other factors.
Small-cap Value Companies: The term small-cap describes companies with a relatively small market-capitalization. A company's market-capitalization is the market value of its outstanding shares. The definition for small-cap varies, but generally means a company with $300 million to $2 billion in market-capitalization.
Other Definitions
Downside-capture ratio is used to evaluate how well an investment manager performed relative to an index during periods when that index has fallen. The ratio is calculated by dividing the manager's returns by the returns of the index during the down market, and multiplying that factor by 100. BPS or basis points; 1 bps is equal to 0.01%.
Earnings per share (EPS) is calculated as a company's profit divided by the outstanding shares of its common stock.
Earnings yield is the earnings per share for the most recent 12-month period divided by the current market price per share.
Expected earnings are an estimate for a company's future quarterly or annual earnings per share (EPS).
Forward earnings are an estimate of the next period's earnings of a company, usually through the completion of the current fiscal year and sometimes to the following fiscal year.
Free cash flow (FCF) is the cash a company generates after taking into consideration cash outflows that support its operations and maintain its-capital assets.
11
FPA QUEENS ROAD SMALL CAP VALUE FUND
LETTER TO SHAREHOLDERS
(Continued)
Margin of safety is a principle of investing in which an investor only purchases securities when their market price is significantly below their intrinsic value.
Net income margin measures how much net income or profit is generated as a percentage of revenue.
The Operating margin measures how much profit a company makes on a dollar of sales after paying for variable costs of production.
The Price-to-earnings (P/E) ratio is the ratio for valuing a company that measures its current share price relative to its earnings per share.
Return on Equity (ROE) is a measure of financial performance calculated by dividing net income by shareholders' equity.
12
FPA QUEENS ROAD SMALL CAP VALUE FUND
LETTER TO SHAREHOLDERS
(Continued)
The discussions of Fund investments represent the views of the Fund's managers at the time of this report and are subject to change without notice. References to individual securities are for informational purposes only and should not be construed as recommendations to purchase or sell individual securities. While the Fund's managers believe that the Fund's holdings are value stocks, there can be no assurance that others will consider them as such. Further, investing in value stocks presents the risk that value stocks may fall out of favor with investors and underperform growth stocks during given periods.
FORWARD LOOKING STATEMENT DISCLOSURE
As mutual fund managers, one of our responsibilities is to communicate with shareholders in an open and direct manner. Insofar as some of our opinions and comments in our letters to shareholders are based on our current expectations, they are considered "forward-looking statements" which may or may not prove to be accurate over the long term. While we believe we have a reasonable basis for our comments and we have confidence in our opinions, actual results may differ materially from those we anticipate. You can identify forward-looking statements by words such as "believe," "expect," "may," "anticipate," and other similar expressions when discussing prospects for particular portfolio holdings and/or the markets, generally. We cannot, however, assure future results and disclaim any obligation to update or alter any forward-looking statements, whether as a result of new information, future events, or otherwise. Further, information provided in this report should not be construed as a recommendation to purchase or sell any particular security.
13
FPA QUEENS ROAD SMALL CAP VALUE FUND
SCHEDULE OF INVESTMENTS
As of November 30, 2023
(Unaudited)
COMMON STOCKS — 89.8% | | Number
of Shares | | Value | |
AEROSPACE & DEFENSE — 0.7% | |
Ducommun, Inc.* | | | 93,372 | | | $ | 4,704,081 | | |
APPAREL & TEXTILE PRODUCTS — 7.7% | |
Deckers Outdoor Corp.* | | | 27,860 | | | $ | 18,498,204 | | |
Levi Strauss & Co. | | | 503,935 | | | | 7,805,953 | | |
PVH Corp. | | | 231,226 | | | | 22,609,279 | | |
| | | $ | 48,913,436 | | |
BANKING — 5.1% | |
Axos Financial, Inc.* | | | 338,282 | | | $ | 12,946,052 | | |
ServisFirst Bancshares, Inc. | | | 384,754 | | | | 19,684,015 | | |
| | | $ | 32,630,067 | | |
CHEMICALS — 1.5% | |
Livent Corp.* | | | 506,508 | | | $ | 6,969,550 | | |
Mativ Holdings, Inc. | | | 231,233 | | | | 2,705,426 | | |
| | | $ | 9,674,976 | | |
COMMERCIAL SUPPORT SERVICES — 0.3% | |
UniFirst Corp. | | | 12,712 | | | $ | 2,194,091 | | |
CONSTRUCTION MATERIALS — 1.5% | |
Knife River Corp.* | | | 67,921 | | | $ | 4,053,525 | | |
MDU Resources Group, Inc. | | | 284,095 | | | | 5,437,578 | | |
| | | $ | 9,491,103 | | |
CONSUMER SERVICES — 1.1% | |
Aaron's, Inc. | | | 160,894 | | | $ | 1,417,476 | | |
Upbound Group, Inc. | | | 200,418 | | | | 5,832,164 | | |
| | | $ | 7,249,640 | | |
CONTAINERS & PACKAGING — 1.0% | |
Graphic Packaging Holding Co. | | | 272,999 | | | $ | 6,188,887 | | |
ELECTRICAL EQUIPMENT — 0.3% | |
Littelfuse, Inc. | | | 9,682 | | | $ | 2,253,970 | | |
ENGINEERING & CONSTRUCTION — 0.1% | |
MasTec, Inc.* | | | 11,598 | | | $ | 703,303 | | |
14
FPA QUEENS ROAD SMALL CAP VALUE FUND
SCHEDULE OF INVESTMENTS (Continued)
As of November 30, 2023
(Unaudited)
COMMON STOCKS — Continued | | Number
of Shares | | Value | |
FOOD — 2.7% | |
Darling Ingredients, Inc.* | | | 229,666 | | | $ | 10,075,447 | | |
TreeHouse Foods, Inc.* | | | 174,987 | | | | 7,123,721 | | |
| | | $ | 17,199,168 | | |
GAS & WATER UTILITIES — 4.3% | |
New Jersey Resources Corp. | | | 321,890 | | | $ | 13,583,758 | | |
UGI Corp. | | | 619,097 | | | | 13,613,943 | | |
| | | $ | 27,197,701 | | |
HEALTH CARE FACILITIES & SVCS — 0.4% | |
Owens & Minor, Inc.* | | | 127,203 | | | $ | 2,528,796 | | |
INDUSTRIAL INTERMEDIATE PRODUCTS — 0.3% | |
L B Foster Co. — Class A* | | | 112,678 | | | $ | 2,249,053 | | |
INDUSTRIAL SUPPORT SERVICES — 3.5% | |
MSC Industrial Direct Co., Inc. — Class A | | | 193,539 | | | $ | 18,854,569 | | |
VSE Corp. | | | 55,401 | | | | 3,347,883 | | |
| | | $ | 22,202,452 | | |
INSURANCE — 12.7% | |
American Equity Investment Life Holding Co.* | | | 408,928 | | | $ | 22,556,469 | | |
CNO Financial Group, Inc. | | | 514,304 | | | | 13,629,056 | | |
Enstar Group Ltd.* | | | 29,635 | | | | 8,138,956 | | |
Horace Mann Educators Corp. | | | 440,798 | | | | 14,749,101 | | |
RLI Corp. | | | 160,450 | | | | 21,757,020 | | |
| | | $ | 80,830,602 | | |
INTERNET MEDIA & SERVICES — 2.1% | |
IAC, Inc.* | | | 278,407 | | | $ | 13,316,207 | | |
MACHINERY — 6.9% | |
AGCO Corp. | | | 14,871 | | | $ | 1,688,305 | | |
CSW Industrials, Inc. | | | 81,255 | | | | 14,408,949 | | |
Graco, Inc. | | | 112,171 | | | | 9,061,173 | | |
Oshkosh Corp. | | | 195,640 | | | | 19,033,816 | | |
| | | $ | 44,192,243 | | |
MEDICAL EQUIPMENT & DEVICES — 0.1% | |
Enovis Corp.* | | | 20,053 | | | $ | 991,821 | | |
15
FPA QUEENS ROAD SMALL CAP VALUE FUND
SCHEDULE OF INVESTMENTS (Continued)
As of November 30, 2023
(Unaudited)
COMMON STOCKS — Continued | | Number
of Shares | | Value | |
PUBLISHING & BROADCASTING — 2.1% | |
Scholastic Corp. | | | 350,990 | | | $ | 13,334,110 | | |
REIT — 0.3% | |
Equity Commonwealth | | | 88,505 | | | $ | 1,663,009 | | |
RETAIL — CONSUMER STAPLES — 2.4% | |
Sprouts Farmers Market, Inc.* | | | 353,810 | | | $ | 15,242,135 | | |
SEMICONDUCTORS — 4.7% | |
Qorvo, Inc.* | | | 36,153 | | | $ | 3,488,765 | | |
Synaptics, Inc.* | | | 132,326 | | | | 13,396,684 | | |
Vishay Intertechnology, Inc. | | | 602,814 | | | | 13,400,555 | | |
| | | $ | 30,286,004 | | |
SOFTWARE — 2.8% | |
Concentrix Corp. | | | 189,995 | | | $ | 17,857,630 | | |
SPECIALTY FINANCE — 2.1% | |
MGIC Investment Corp. | | | 750,202 | | | $ | 13,196,053 | | |
TECHNOLOGY HARDWARE — 16.3% | |
Arrow Electronics, Inc.* | | | 114,675 | | | $ | 13,595,868 | | |
Fabrinet* | | | 197,415 | | | | 31,961,488 | | |
InterDigital, Inc. | | | 284,626 | | | | 28,439,830 | | |
TD SYNNEX Corp. | | | 304,061 | | | | 29,992,577 | | |
| | | $ | 103,989,763 | | |
TECHNOLOGY SERVICES — 3.9% | |
CSG Systems International, Inc. | | | 264,386 | | | $ | 13,005,147 | | |
Science Applications International Corp. | | | 99,470 | | | | 11,678,773 | | |
| | | $ | 24,683,920 | | |
WHOLESALE — CONSUMER STAPLES — 0.9% | |
United Natural Foods, Inc.* | | | 383,805 | | | $ | 5,584,363 | | |
WHOLESALE — DISCRETIONARY — 2.0% | |
G-III Apparel Group Ltd.* | | | 447,328 | | | $ | 12,869,626 | | |
| TOTAL COMMON STOCKS (Cost $453,659,057) | | $ | 573,418,210 | | |
16
FPA QUEENS ROAD SMALL CAP VALUE FUND
SCHEDULE OF INVESTMENTS (Continued)
As of November 30, 2023
(Unaudited)
PREFERRED STOCKS — 0.0% | | Number
of Shares | | Value | |
INDUSTRIALS — 0.0% | |
WESCO International, Inc., 10.625%(a),(b) | | | 6,085 | | | $ | 164,295 | | |
| TOTAL PREFERRED STOCKS (Cost $161,252) | | $ | 164,295 | | |
SHORT-TERM INVESTMENTS — 10.4% | |
MONEY MARKET INVESTMENTS — 10.4% | |
Morgan Stanley Institutional Liquidity Treasury Portfolio — Institutional
Class, 5.16%(c) | | | 66,600,339 | | | $ | 66,600,339 | | |
| TOTAL SHORT-TERM INVESTMENTS (Cost $66,600,339) | | $ | 66,600,339 | | |
| TOTAL INVESTMENTS — 100.2% (Cost $520,420,648) | | $ | 640,182,844 | | |
Liabilities in Excess of Other Assets — (0.2)% | | | | | (1,571,649 | ) | |
TOTAL NET ASSETS — 100.0% | | $ | 638,611,195 | | |
REIT — Real Estate Investment Trust
* Non-income producing security.
(a) Perpetual security. Maturity date is not applicable.
(b) Variable or floating rate security.
(c) The rate is the annualized seven-day yield at period end.
See accompanying Notes to Financial Statements.
17
FPA QUEENS ROAD SMALL CAP VALUE FUND
SUMMARY OF INVESTMENTS
As of November 30, 2023
(Unaudited)
Security Type/Industry | | Percent of Total
Net Assets | |
Common Stocks | |
Technology Hardware | | | 16.3 | % | |
Insurance | | | 12.7 | % | |
Apparel & Textile Products | | | 7.7 | % | |
Machinery | | | 6.9 | % | |
Banking | | | 5.1 | % | |
Semiconductors | | | 4.7 | % | |
Gas & Water Utilities | | | 4.3 | % | |
Technology Services | | | 3.9 | % | |
Industrial Support Services | | | 3.5 | % | |
Software | | | 2.8 | % | |
Food | | | 2.7 | % | |
Retail — Consumer Staples | | | 2.4 | % | |
Publishing & Broadcasting | | | 2.1 | % | |
Internet Media & Services | | | 2.1 | % | |
Specialty Finance | | | 2.1 | % | |
Wholesale — Discretionary | | | 2.0 | % | |
Chemicals | | | 1.5 | % | |
Construction Materials | | | 1.5 | % | |
Consumer Services | | | 1.1 | % | |
Containers & Packaging | | | 1.0 | % | |
Wholesale — Consumer Staples | | | 0.9 | % | |
Aerospace & Defense | | | 0.7 | % | |
Health Care Facilities & Svcs | | | 0.4 | % | |
Electrical Equipment | | | 0.3 | % | |
Industrial Intermediate Products | | | 0.3 | % | |
Commercial Support Services | | | 0.3 | % | |
REIT | | | 0.3 | % | |
Medical Equipment & Devices | | | 0.1 | % | |
Engineering & Construction | | | 0.1 | % | |
Total Common Stocks | | | 89.8 | % | |
Preferred Stocks | |
Industrials | | | 0.0 | % | |
Short-Term Investments | | | 10.4 | % | |
Total Investments | | | 100.2 | % | |
Liabilities in Excess of Other Assets | | | (0.2 | )% | |
Total Net Assets | | | 100.0 | % | |
See accompanying Notes to Financial Statements.
18
FPA QUEENS ROAD SMALL CAP VALUE FUND
STATEMENT OF ASSETS AND LIABILITIES
As of November 30, 2023
(Unaudited)
ASSETS | |
Investments, at value (cost $520,420,648) | | $ | 640,182,844 | | |
Receivables: | |
Fund shares sold | | | 287,348 | | |
Dividends and interest | | | 749,537 | | |
Prepaid expenses | | | 1,441 | | |
Total assets | | | 641,221,170 | | |
LIABILITIES | |
Payables: | |
Investment securities purchased | | | 1,685,735 | | |
Fund shares redeemed | | | 413,544 | | |
Advisory fees | | | 337,309 | | |
Shareholder servicing fees | | | 81,672 | | |
Fund services fees | | | 14,198 | | |
Registration fees | | | 29,175 | | |
Shareholder reporting fees | | | 20,435 | | |
Legal fees | | | 12,725 | | |
Auditing fees | | | 7,593 | | |
Chief Compliance Officer fees | | | 1,719 | | |
Trustees' fees and expenses | | | 337 | | |
Accrued other expenses | | | 5,533 | | |
Total liabilities | | | 2,609,975 | | |
NET ASSETS | | $ | 638,611,195 | | |
COMPONENTS OF NET ASSETS | |
Capital Stock (no par value with an unlimited number of shares authorized) | | $ | 502,574,256 | | |
Total distributable earnings (accumulated deficit) | | | 136,036,939 | | |
NET ASSETS | | $ | 638,611,195 | | |
Maximum Offering Price per Share: | |
Investor Class Shares: | |
Net assets applicable to shares outstanding | | $ | 75,810,742 | | |
Shares of beneficial interest issued and outstanding | | | 2,191,028 | | |
Redemption price per share | | $ | 34.60 | | |
Institutional Class Shares: | |
Net assets applicable to shares outstanding | | $ | 515,075,534 | | |
Shares of beneficial interest issued and outstanding | | | 14,882,135 | | |
Redemption price per share | | $ | 34.61 | | |
Advisor Class Shares: | |
Net assets applicable to shares outstanding | | $ | 47,724,919 | | |
Shares of beneficial interest issued and outstanding | | | 1,381,911 | | |
Redemption price per share | | $ | 34.54 | | |
See accompanying Notes to Financial Statements.
19
FPA QUEENS ROAD SMALL CAP VALUE FUND
STATEMENT OF OPERATIONS
For the Six Months Ended November 30, 2023
(Unaudited)
INVESTMENT INCOME | |
Dividends | | $ | 3,653,741 | | |
Interest | | | 1,618,818 | | |
Total investment income | | | 5,272,559 | | |
EXPENSES | |
Advisory fees | | | 1,919,822 | | |
Shareholder servicing fees — Investor Class | | | 89,937 | | |
Shareholder servicing fees — Institutional Class | | | 79,001 | | |
Shareholder servicing fees — Advisor Class | | | 37,490 | | |
Fund services fees | | | 68,975 | | |
Registration fees | | | 67,310 | | |
Shareholder reporting fees | | | 41,020 | | |
Trustees' fees and expenses | | | 24,928 | | |
Auditing fees | | | 19,458 | | |
Legal fees | | | 14,566 | | |
Insurance fees | | | 6,187 | | |
Chief Compliance Officer fees | | | 6,127 | | |
Miscellaneous | | | 2,834 | | |
Total expenses | | | 2,377,655 | | |
Net investment income (loss) | | | 2,894,904 | | |
REALIZED AND UNREALIZED GAIN (LOSS) | |
Net realized gain (loss) on: | |
Investments | | | 6,098,690 | | |
Total realized gain (loss) | | | 6,098,690 | | |
Net change in unrealized appreciation (depreciation) on: | |
Investments | | | 28,359,012 | | |
Net change in unrealized appreciation (depreciation) | | | 28,359,012 | | |
Net realized and unrealized gain (loss) | | | 34,457,702 | | |
NET INCREASE (DECREASE) IN NET ASSETS FROM OPERATIONS | | $ | 37,352,606 | | |
See accompanying Notes to Financial Statements.
20
FPA QUEENS ROAD SMALL CAP VALUE FUND
STATEMENTS OF CHANGES IN NET ASSETS
| | | For the
Six Months Ended
November 30, 2023
(Unaudited) | | For the
Year Ended
May 31, 2023 | |
INCREASE (DECREASE) IN NET ASSETS FROM | |
Operations: | |
Net investment income (loss) | | $ | 2,894,904 | | | $ | 5,432,079 | | |
Total realized gain (loss) on investments | | | 6,098,690 | | | | 3,757,854 | | |
Net change in unrealized appreciation (depreciation) on
investments | | | 28,359,012 | | | | (26,702,622 | ) | |
Net increase (decrease) in net assets resulting
from operations | | | 37,352,606 | | | | (17,512,689 | ) | |
Distributions to Shareholders: | |
Distributions: | |
Investor Class | | | — | | | | (1,557,544 | ) | |
Institutional Class | | | — | | | | (8,052,504 | ) | |
Advisor Class | | | — | | | | (1,089,516 | ) | |
Total distributions to shareholders | | | — | | | | (10,699,564 | ) | |
Capital Transactions: | |
Net proceeds from shares sold: | |
Investor Class | | | 7,097,966 | | | | 16,625,634 | | |
Institutional Class | | | 146,153,755 | | | | 48,824,693 | | |
Advisor Class | | | 5,227,938 | | | | 27,492,955 | | |
Reinvestment of distributions: | |
Investor Class | | | — | | | | 1,554,936 | | |
Institutional Class | | | — | | | | 7,158,896 | | |
Advisor Class | | | — | | | | 1,070,683 | | |
Cost of shares redeemed: | |
Investor Class | | | (9,606,177 | ) | | | (23,164,064 | ) | |
Institutional Class | | | (27,155,854 | ) | | | (42,946,511 | ) | |
Advisor Class | | | (4,400,813 | ) | | | (22,364,382 | ) | |
Net increase (decrease) in net assets from capital
transactions | | | 117,316,815 | | | | 14,252,840 | | |
Total increase (decrease) in net assets | | | 154,669,421 | | | | (13,959,413 | ) | |
See accompanying Notes to Financial Statements.
21
FPA QUEENS ROAD SMALL CAP VALUE FUND
STATEMENTS OF CHANGES IN NET ASSETS (Continued)
| | | For the
Six Months Ended
November 30, 2023
(Unaudited) | | For the
Year Ended
May 31, 2023 | |
NET ASSETS: | |
Beginning of period | | $ | 483,941,774 | | | $ | 497,901,187 | | |
End of period | | $ | 638,611,195 | | | $ | 483,941,774 | | |
CAPITAL SHARE TRANSACTIONS: | |
Shares sold: | |
Investor Class | | | 209,698 | | | | 506,018 | | |
Institutional Class | | | 4,235,060 | | | | 1,472,580 | | |
Advisor Class | | | 154,022 | | | | 834,047 | | |
Shares reinvested: | |
Investor Class | | | — | | | | 48,395 | | |
Institutional Class | | | — | | | | 223,151 | | |
Advisor Class | | | — | | | | 33,407 | | |
Shares redeemed: | |
Investor Class | | | (285,804 | ) | | | (710,415 | ) | |
Institutional Class | | | (806,164 | ) | | | (1,311,351 | ) | |
Advisor Class | | | (129,923 | ) | | | (665,204 | ) | |
Net increase (decrease) in capital share transactions | | | 3,376,889 | | | | 430,628 | | |
See accompanying Notes to Financial Statements.
22
FPA QUEENS ROAD SMALL CAP VALUE FUND
FINANCIAL HIGHLIGHTS
For a Capital Share Outstanding Throughout Each Period.
| | | For the
Six Months
Ended
November 30,
2023 | | For the Year Ended May 31, | |
| | | (Unaudited) | | 2023(1) | | 2022(1) | | 2021(1) | | 2020(2) | | 2019(2) | |
Investor Class | |
Per share operating performance: | |
Net asset value, beginning of period | | $ | 32.12 | | | $ | 34.03 | | | $ | 35.52 | | | $ | 23.22 | | | $ | 23.61 | | | $ | 27.32 | | |
Income from Investment Operations: | |
Net investment income(3) | | | 0.14 | | | | 0.31 | | | | 0.07 | | | | 0.06 | | | | 0.03 | | | | 0.05 | | |
Net realized and unrealized gain (loss) | | | 2.34 | | | | (1.54 | ) | | | (0.95 | ) | | | 12.34 | | | | 0.55 | | | | (1.28 | ) | |
Total from investment operations | | | 2.48 | | | | (1.23 | ) | | | (0.88 | ) | | | 12.40 | | | | 0.58 | | | | (1.23 | ) | |
Less Distributions: | |
From net investment income | | | — | | | | — | | | | — | | | | (0.09 | ) | | | (0.01 | ) | | | (0.03 | ) | |
From net realized gain | | | — | | | | (0.68 | ) | | | (0.61 | ) | | | (0.01 | ) | | | (0.96 | ) | | | (2.45 | ) | |
Total distributions | | | — | | | | (0.68 | ) | | | (0.61 | ) | | | (0.10 | ) | | | (0.97 | ) | | | (2.48 | ) | |
Net asset value, end of period | | $ | 34.60 | | | $ | 32.12 | | | $ | 34.03 | | | $ | 35.52 | | | $ | 23.22 | | | $ | 23.61 | | |
Total return(4) | | | 7.72 | %(5) | | | (3.63 | )% | | | (2.52 | )% | | | 53.51 | % | | | 1.89 | % | | | (4.26 | )% | |
Ratios and Supplemental Data: | |
Net assets, end of period (in thousands) | | $ | 75,811 | | | $ | 72,820 | | | $ | 82,461 | | | $ | 193,922 | | | $ | 127,037 | | | $ | 118,454 | | |
Ratio of expenses to average net assets: | |
Before fees waived and expenses absorbed | | | 0.98 | %(6) | | | 1.00 | % | | | 1.00 | % | | | 1.11 | % | | | 1.18 | % | | | 1.18 | % | |
After fees waived and expenses absorbed | | | 0.98 | %(6) | | | 1.00 | % | | | 1.00 | % | | | 1.09 | %(7) | | | 1.18 | % | | | 1.18 | % | |
Ratio of net investment income (loss) to
average net assets: | |
Before fees waived and expenses absorbed | | | 0.83 | %(6) | | | 0.95 | % | | | 0.21 | % | | | 0.22 | % | | | 0.10 | % | | | 0.20 | % | |
After fees waived and expenses absorbed | | | 0.83 | %(6) | | | 0.95 | % | | | 0.21 | % | | | 0.20 | % | | | 0.10 | % | | | 0.20 | % | |
Portfolio turnover rate | | | 6 | %(5) | | | 13 | % | | | 10 | % | | | 15 | % | | | 24 | % | | | 27 | % | |
(1) Audits performed for the fiscal years indicated by the Fund's previous auditor, Ernst & Young LLP.
(2) Audits performed for the fiscal years indicated by the Fund's previous auditor, Cohen & Company, Ltd.
(3) Based on average shares outstanding for the period.
(4) Return is based on net asset value per share, adjusted for reinvestment of distributions, and does not reflect deduction of the sales charge.
(5) Not annualized.
(6) Annualized.
(7) Effective November 1, 2020, the Advisor contractually agreed to limit the annual fund operating expenses to 1.04%. Prior to November 1, 2020, the Fund had a unitary fee structure that limited annual operating expenses to 1.18%.
See accompanying Notes to Financial Statements.
23
FPA QUEENS ROAD SMALL CAP VALUE FUND
FINANCIAL HIGHLIGHTS
For a Capital Share Outstanding Throughout Each Period.
| | | For the
Six Months
Ended
November 30,
2023 | | For the Year Ended
May 31, | | For the
Period
Ended
May 31, | |
| | | (Unaudited) | | 2023(1) | | 2022(1) | | 2021(1)(2) | |
Institutional Class | |
Per share operating performance: | |
Net asset value, beginning of period | | $ | 32.10 | | | $ | 33.99 | | | $ | 35.52 | | | $ | 28.16 | | |
Income from Investment Operations: | |
Net investment income (loss)(3) | | | 0.17 | | | | 0.37 | | | | 0.13 | | | | 0.02 | | |
Net realized and unrealized gain (loss) | | | 2.34 | | | | (1.54 | ) | | | (0.94 | ) | | | 7.44 | | |
Total from investment operations | | | 2.51 | | | | (1.17 | ) | | | (0.81 | ) | | | 7.46 | | |
Less Distributions: | |
From net investment income | | | — | | | | (0.04 | ) | | | (0.11 | ) | | | (0.09 | ) | |
From net realized gain | | | — | | | | (0.68 | ) | | | (0.61 | ) | | | (0.01 | ) | |
Total distributions | | | — | | | | (0.72 | ) | | | (0.72 | ) | | | (0.10 | ) | |
Net asset value, end of period | | $ | 34.61 | | | $ | 32.10 | | | $ | 33.99 | | | $ | 35.52 | | |
Total return(4) | | | 7.82 | %(5) | | | (3.44 | )% | | | (2.34 | )% | | | 26.59 | %(5) | |
Ratios and Supplemental Data: | |
Net assets, end of period (in thousands) | | $ | 515,076 | | | $ | 367,607 | | | $ | 376,221 | | | $ | 301,941 | | |
Ratio of expenses to average net assets: | |
Before fees waived and expenses absorbed | | | 0.78 | %(6) | | | 0.81 | % | | | 0.83 | % | | | 0.91 | %(6) | |
After fees waived and expenses absorbed | | | 0.78 | %(6) | | | 0.81 | % | | | 0.83 | % | | | 0.89 | %(6) | |
Ratio of net investment income (loss) to
average net assets: | |
Before fees waived and expenses absorbed | | | 1.03 | %(6) | | | 1.14 | % | | | 0.38 | % | | | 0.08 | %(6) | |
After fees waived and expenses absorbed | | | 1.03 | %(6) | | | 1.14 | % | | | 0.38 | % | | | 0.10 | %(6) | |
Portfolio turnover rate | | | 6 | %(5) | | | 13 | % | | | 10 | % | | | 15 | %(5) | |
(1) Audits performed for the fiscal years indicated by the Fund's previous auditor, Ernst & Young LLP.
(2) The Institutional Class commenced operations on December 1, 2020. The data shown reflects operations for the period December 1, 2020 to May 31, 2021.
(3) Based on average shares outstanding for the period.
(4) Return is based on net asset value per share, adjusted for reinvestment of distributions, and does not reflect deduction of the sales charge.
(5) Not annualized.
(6) Annualized.
See accompanying Notes to Financial Statements.
24
FPA QUEENS ROAD SMALL CAP VALUE FUND
FINANCIAL HIGHLIGHTS
For a Capital Share Outstanding Throughout Each Period.
| | | For the
Six Months
Ended
November 30,
2023 | | For the Year Ended
May 31, | | For the
Period
Ended
May 31, | |
| | | (Unaudited) | | 2023(1) | | 2022(1) | | 2021(1)(2) | |
Advisor Class | |
Per share operating performance: | |
Net asset value, beginning of period | | $ | 32.05 | | | $ | 33.94 | | | $ | 35.52 | | | $ | 28.16 | | |
Income from Investment Operations: | |
Net investment income(3) | | | 0.15 | | | | 0.34 | | | | 0.10 | | | | 0.02 | | |
Net realized and unrealized gain (loss) | | | 2.34 | | | | (1.54 | ) | | | (0.95 | ) | | | 7.44 | | |
Total from investment operations | | | 2.49 | | | | (1.20 | ) | | | (0.85 | ) | | | 7.46 | | |
Less Distributions: | |
From net investment income | | | — | | | | (0.01 | ) | | | (0.12 | ) | | | (0.09 | ) | |
From net realized gain | | | — | | | | (0.68 | ) | | | (0.61 | ) | | | (0.01 | ) | |
From return of capital | | | — | | | | — | | | | — | | | | — | | |
Total distributions | | | — | | | | (0.69 | ) | | | (0.73 | ) | | | (0.10 | ) | |
Net asset value, end of period | | $ | 34.54 | | | $ | 32.05 | | | $ | 33.94 | | | $ | 35.52 | | |
Total return(4) | | | 7.77 | %(5) | | | (3.56 | )% | | | (2.46 | )% | | | 26.58 | %(5) | |
Ratios and Supplemental Data: | |
Net assets, end of period (in thousands) | | $ | 47,725 | | | $ | 43,514 | | | $ | 39,219 | | | $ | 724 | | |
Ratio of expenses to average net assets: | |
Before fees waived and expenses absorbed | | | 0.91 | %(6) | | | 0.93 | % | | | 0.93 | % | | | 0.90 | %(6) | |
After fees waived and expenses absorbed | | | 0.91 | %(6) | | | 0.93 | % | | | 0.93 | % | | | 0.90 | %(6) | |
Ratio of net investment income to average
net assets: | |
Before fees waived and expenses absorbed | | | 0.90 | %(6) | | | 1.04 | % | | | 0.28 | % | | | 0.10 | %(6) | |
After fees waived and expenses absorbed | | | 0.90 | %(6) | | | 1.04 | % | | | 0.28 | % | | | 0.10 | %(6) | |
Portfolio turnover rate | | | 6 | %(5) | | | 13 | % | | | 10 | % | | | 15 | %(5) | |
(1) Audits performed for the fiscal years indicated by the Fund's previous auditor, Ernst & Young LLP.
(2) The Advisor Class commenced operations on December 1, 2020. The data shown reflects operations for the period December 1, 2020 to May 31, 2021.
(3) Based on average shares outstanding for the period.
(4) Return is based on net asset value per share, adjusted for reinvestment of distributions, and does not reflect deduction of the sales charge.
(5) Not annualized.
(6) Annualized.
See accompanying Notes to Financial Statements.
25
FPA QUEENS ROAD SMALL CAP VALUE FUND
NOTES TO FINANCIAL STATEMENTS
November 30, 2023
(Unaudited)
NOTE 1 — Organization
FPA Queens Road Small Cap Value Fund (the "Fund") is a diversified series of FPA Funds Trust (the "Trust") which is registered as an open-end management investment company under the Investment Company Act of 1940, as amended (the "1940 Act"). Effective January 10, 2024, the name of the Trust has been changed to Investment Managers Series Trust III. The Fund's primary investment objective is to seek long-term capital growth. First Pacific Advisors, LP (the "Adviser") has served as the Fund's investment adviser since November 1, 2020.
On July 28, 2023, the Fund acquired the assets and assumed the liabilities of FPA Queens Road Small Cap Value Fund, a series of Bragg Capital Trust, (the "Predecessor Fund") in a tax-free reorganization pursuant to the Agreement and Plan of Reorganization (the "Plan of Reorganization"). The Plan of Reorganization was approved by the Trust's Board and by the Predecessor Fund's Board on May 8, 2023. The tax-free reorganization was accomplished on July 28, 2023. As a result of the reorganization, the Fund assumed the performance and accounting history of the Predecessor Fund. Financial information included for the dates prior to the reorganization is that of the Predecessor Fund.
The reorganization was accomplished by the following tax-free exchange in which each shareholder of the Fund received the same aggregate share net asset value as noted below:
| | | Shares Issued | | Net Assets | |
Advisor Class | | | 1,368,270 | | | $ | 46,786,651 | | |
Institutional Class | | | 11,400,634 | | | | 390,478,859 | | |
Investor Class | | | 2,273,791 | | | | 77,924,349 | | |
The net unrealized appreciation of investments transferred was $138,240,430 as of the date of the acquisition.
The Fund is an investment company and accordingly follows the investment company accounting and reporting guidance of the Financial Accounting Standards Board (FASB) Accounting Standard Codification Topic 946 "Financial Services — Investment Companies".
NOTE 2 — Accounting Policies
The following is a summary of the significant accounting policies consistently followed by the Fund in the preparation of its financial statements. The preparation of financial statements in conformity with accounting principles generally accepted in the United States of America ("GAAP") requires management to make estimates and assumptions that affect the reported amounts and disclosures in the financial statements. Actual results could differ from these estimates.
(a) Valuation of Investments
The Fund values equity securities at the last reported sale price on the principal exchange or in the principal over the counter ("OTC") market in which such securities are traded, as of the close of regular trading on the NYSE on the day the securities are being valued or, if the last-quoted sales price is not readily available, the securities will be valued at the last bid or the mean between the last available bid and ask price. Securities traded on the NASDAQ are valued at the NASDAQ Official Closing Price ("NOCP"). Investments in open-end investment companies are valued at the daily closing net asset value of the respective investment company. Debt securities are valued by utilizing a price supplied by independent pricing service providers. The independent pricing service providers may use various valuation methodologies including matrix pricing
26
FPA QUEENS ROAD SMALL CAP VALUE FUND
NOTES TO FINANCIAL STATEMENTS (Continued)
(Unaudited)
and other analytical pricing models as well as market transactions and dealer quotations. These models generally consider such factors as yields or prices of bonds of comparable quality, type of issue, coupon, maturity, ratings and general market conditions. If a price is not readily available for a portfolio security, the security will be valued at fair value (the amount which the Fund might reasonably expect to receive for the security upon its current sale). The Board of Trustees has designated the Adviser as the Fund's valuation designee (the "Valuation Designee") to make all fair value determinations with respect to the Fund's portfolio investments, subject to the Board's oversight. As the Valuation Designee, the Adviser has adopted and implemented policies and procedures to be followed when the Fund must utilize fair value pricing. Securities for which representative market quotations are not readily available or are considered unreliable by the Adviser are valued as determined in good faith under procedures adopted by the authority of the Fund's Board of Directors. Various inputs may be reviewed in order to make a good faith determination of a security's value. These inputs include, but are not limited to, the type and cost of the security; contractual or legal restrictions on resale of the security; relevant financial or business developments of the issuer; actively traded similar or related securities; conversion or exchange rights on the security; related corporate actions; significant events occurring after the close of trading in the security; and changes in overall market conditions. Fair valuations and valuations of investments that are not actively trading involve judgment and may differ materially from valuations of investments that would have been used had greater market activity occurred.
(b) Investment Transactions, Investment Income and Expenses
Investment transactions are accounted for on the trade date. Realized gains and losses on investments are determined on the identified cost basis. Dividend income is recorded net of applicable withholding taxes on the ex-dividend date and interest income is recorded on an accrual basis. Withholding taxes on foreign dividends, if applicable, are paid (a portion of which may be reclaimable) or provided for in accordance with the applicable country's tax rules and rates and are disclosed in the Statement of Operations. Withholding tax reclaims are filed in certain countries to recover a portion of the amounts previously withheld. The Fund records a reclaim receivable based on a number of factors, including a jurisdiction's legal obligation to pay reclaims as well as payment history and market convention. Discounts on debt securities are accreted or amortized to interest income over the lives of the respective securities using the effective interest method. Premiums for callable debt securities are amortized to the earliest call date, if the call price was less than the purchase price. If the call price was not at par and the security was not called, the security is amortized to the next call price and date. Expenses incurred by the Trust with respect to more than one fund are allocated in proportion to the net assets of each fund except where allocation of direct expenses to each fund or an alternative allocation method can be more appropriately made.
(c) Federal Income Taxes
The Fund intends to comply with the requirements of Subchapter M of the Internal Revenue Code applicable to regulated investment companies and to distribute substantially all of their net investment income and any net realized gains to their shareholders. Therefore, no provision is made for federal income or excise taxes. Due to the timing of dividend distributions and the differences in accounting for income and realized gains and losses for financial statement and federal income tax purposes, the fiscal year in which amounts are distributed may differ from the year in which the income and realized gains and losses are recorded by the Fund.
Accounting for Uncertainty in Income Taxes (the "Income Tax Statement") requires an evaluation of tax positions taken (or expected to be taken) in the course of preparing a Fund's tax returns to determine whether these positions meet a "more-likely-than-not" standard that, based on the technical merits, have a more than
27
FPA QUEENS ROAD SMALL CAP VALUE FUND
NOTES TO FINANCIAL STATEMENTS (Continued)
(Unaudited)
fifty percent likelihood of being sustained by a taxing authority upon examination. A tax position that meets the "more-likely-than-not" recognition threshold is measured to determine the amount of benefit to recognize in the financial statements. The Fund recognizes interest and penalties, if any, related to unrecognized tax benefits as income tax expense in the Statement of Operations.
The Income Tax Statement requires management of the Fund to analyze tax positions taken in the prior three open tax years, if any, and tax positions expected to be taken in the Fund's current tax year, as defined by the IRS statute of limitations for all major jurisdictions, including federal tax authorities and certain state tax authorities. As of November 30, 2023, and during the prior three open tax years, the Fund did not have a liability for any unrecognized tax benefits. The Fund has no examinations in progress and is not aware of any tax positions for which it is reasonably possible that the total amounts of unrecognized tax benefits will significantly change in the next twelve months.
(d) Distributions to Shareholders
The Fund will make distributions of net investment income annually and net capital gains, if any, at least annually. Distributions to shareholders are recorded on the ex-dividend date. The amount and timing of distributions are determined in accordance with federal income tax regulations, which may differ from GAAP.
The character of distributions made during the year from net investment income or net realized gains may differ from the characterization for federal income tax purposes due to differences in the recognition of income, expense and gain (loss) items for financial statement and tax purposes.
(e) Illiquid Securities
Pursuant to Rule 22e-4 under the 1940 Act, the Fund has adopted a Liquidity Risk Management Program ("LRMP") that requires, among other things, that the Fund limits its illiquid investments that are assets to no more than 15% of net assets. An illiquid investment is any security which may not reasonably be expected to be sold or disposed of in current market conditions in seven calendar days or less without the sale or disposition significantly changing the market value of the investment. If the Adviser, at any time determines that the value of illiquid securities held by the Fund exceeds 15% of its net asset value, the Adviser will take such steps as it considers appropriate to reduce them as soon as reasonably practicable in accordance with the Fund's written LRMP.
(f) Use of Estimates
The presentation of financial statements in conformity with GAAP requires management to make estimates and assumptions that affect the reported amounts of assets and liabilities at the date of the financial statements and the reported amounts of income and expenses during the reporting period. Actual results could differ from those estimates.
NOTE 3 — Investment Advisory and Other Agreements
The Trust, on behalf of the Fund, entered into an Investment Advisory Agreement (the "Agreement") with the Adviser. Under the terms of the Agreement, the Fund pays a monthly investment advisory fee to the Adviser at the annual rate of 0.75% of the Fund's average daily net assets up to $50 million and 0.65% of the Fund's average daily net assets in excess of $50 million. The Adviser engages Bragg Financial Advisors, Inc. (the "Sub-Adviser") to manage the Fund and pays the Sub-Adviser from its advisory fees.
The Adviser has contractually agreed to waive its fees and/or pay for operating expenses of the Fund to ensure that total annual fund operating expenses (excluding any interests, taxes, brokerage fees and commissions payable by the Fund in connection with the purchase or sale of portfolio securities, fees and expenses of other
28
FPA QUEENS ROAD SMALL CAP VALUE FUND
NOTES TO FINANCIAL STATEMENTS (Continued)
(Unaudited)
funds in which the Fund invests, and extraordinary expenses, including litigation expenses not incurred in the Fund's ordinary course of business) do not exceed 1.04%, 0.99% and 0.89% for Investor Class, Advisor Class, and Institutional Class shares, respectively. These fee waivers and expense reimbursements are subject to possible recoupment by the Advisor from the Fund in future years (within three years from the date when the amount is waived or reimbursed) if such recoupment can be achieved within the lesser of the foregoing expense limits or the then-current expense limit. This agreement is in effect until July 27, 2024, and it may be terminated before that date only by the Trust's Board of Trustees. For the six months ended November 30, 2023, the Adviser did not waive or reimburse expenses of the Fund. As of November 30, 2023, there are no expenses subject to recapture.
UMB Fund Services, Inc. ("UMBFS") serves as the Fund's fund accountant, transfer agent and co-administrator; and Mutual Fund Administration, LLC ("MFAC") serves as the Fund's other co-administrator. UMB Bank, n.a., an affiliate of UMBFS, serves as the Fund's custodian. The Fund's allocated fees incurred for fund accounting, fund administration, transfer agency and custody services for the period from July 29, 2023 through November 30, 2023, were $47,069. The inclusion of such fees are reported on the Statement of Operations.
Prior to July 29, 2023, State Street Bank and Trust Company served as the Predecessor Fund's fund accountant, administrator and custodian. The Predecessor Fund's allocated fees incurred for fund accounting, fund administration and custody services for the period from June 1, 2023 to July 28, 2023, was $11,290. The inclusion of such fees are reported on the Statement of Operations.
UMB Distribution Services, LLC ("UMB Distribution Services"), a wholly owned subsidiary of UMBFS, serves as the Fund's distributor. The Adviser paid the fees for the Fund's distribution-related services.
Certain trustees and officers of the Trust are employees of UMBFS, MFAC or Adviser. The Fund does not compensate trustees and officers affiliated with the Fund's Adviser or co-administrators. For the period from July 29, 2023 through November 30, 2023, the Fund's allocated fees incurred to Trustees of the Trust who are not "interested persons" of the Trust, as that term is defined in the 1940 Act (collectively, the "Independent Trustees") were $8,844. The inclusion of such fees are reported on the Statement of Operations.
Prior to July 29, 2023, the Predecessor Fund's allocated fees incurred for Independent Trustees services for the period from June 1, 2023 to July 28, 2023, was $16,084. The inclusion of such fees are reported on the Statement of Operations.
Dziura Compliance Consulting, LLC provides Chief Compliance Officer ("CCO") services to the Trust. The Fund's allocated fees incurred for CCO services for the period from July 29, 2023 through November 30, 2023, were $2,821. The inclusion of such fees are reported on the Statement of Operations.
Prior to July 29, 2023, Ms. Karen Richards served as the Predecessor Fund's CCO. The Predecessor Fund's allocated fees incurred for CCO services for the period from June 1, 2023 to July 28, 2023, was $3,306. The inclusion of such fees are reported on the Statement of Operations.
NOTE 4 — Federal Income Taxes
At November 30, 2023, gross unrealized appreciation/(depreciation) of investments, based on cost for federal income tax purposes were as follows:
Cost of investments | | $ | 521,500,868 | | |
Gross unrealized appreciation | | $ | 157,930,968 | | |
Gross unrealized depreciation | | | (39,248,992 | ) | |
Net unrealized appreciation/(depreciation) | | $ | 118,681,976 | | |
29
FPA QUEENS ROAD SMALL CAP VALUE FUND
NOTES TO FINANCIAL STATEMENTS (Continued)
(Unaudited)
The difference between cost amounts for financial statement and federal income tax purposes is due primarily to timing differences in recognizing certain gains and losses in security transactions.
NOTE 5 — Investment Transactions
For the six months ended November 30, 2023, purchases and sales of investments, excluding short-term investments, were $203,927,780 and $29,822,059, respectively.
NOTE 6 — Indemnifications
In the normal course of business, the Fund enters into contracts that contain a variety of representations which provide general indemnifications. The Fund's maximum exposure under these arrangements is unknown, as this would involve future claims that may be made against the Fund that have not yet occurred. However, the Fund expects the risk of loss to be remote.
NOTE 7 — Fair Value Measurements and Disclosure
Fair Value Measurements and Disclosures defines fair value, establishes a framework for measuring fair value in accordance with GAAP, and expands disclosure about fair value measurements. It also provides guidance on determining when there has been a significant decrease in the volume and level of activity for an asset or a liability, when a transaction is not orderly, and how that information must be incorporated into a fair value measurement.
Under Fair Value Measurements and Disclosures, various inputs are used in determining the value of the Fund's investments. These inputs are summarized into three broad Levels as described below:
• Level 1 — Unadjusted quoted prices in active markets for identical assets or liabilities that the Fund has the ability to access.
• Level 2 — Observable inputs other than quoted prices included in level 1 that are observable for the asset or liability, either directly or indirectly. These inputs may include quoted prices for the identical instrument on an inactive market, prices for similar instruments, interest rates, prepayment speeds, credit risk, yield curves, default rates and similar data.
• Level 3 — Unobservable inputs for the asset or liability, to the extent relevant observable inputs are not available, representing the Fund's own assumptions about the assumptions a market participant would use in valuing the asset or liability, and would be based on the best information available.
The availability of observable inputs can vary from security to security and is affected by a wide variety of factors, including, for example, the type of security, whether the security is new and not yet established in the marketplace, the liquidity of markets, and other characteristics particular to the security. To the extent that valuation is based on models or inputs that are less observable or unobservable in the market, the determination of fair value requires more judgment. Accordingly, the degree of judgment exercised in determining fair value is greatest for instruments categorized in Level 3.
The inputs used to measure fair value may fall into different Levels of the fair value hierarchy. In such cases, for disclosure purposes, the Level in the fair value hierarchy within which the fair value measurement falls in its entirety, is determined based on the lowest Level input that is significant to the fair value measurement in its entirety.
30
FPA QUEENS ROAD SMALL CAP VALUE FUND
NOTES TO FINANCIAL STATEMENTS (Continued)
(Unaudited)
The inputs or methodology used for valuing securities are not an indication of the risk associated with investing in those securities. The following is a summary of the inputs used, as of November 30, 2023, in valuing the Fund's assets carried at fair value:
| | | Level 1 | | Level 2 | | Level 3 | | Total | |
Common Stocks* | | $ | 573,418,210 | | | | — | | | | — | | | $ | 573,418,210 | | |
Preferred Stocks* | | | 164,295 | | | | — | | | | — | | | | 164,295 | | |
Short-Term Investments | | | 66,600,339 | | | | — | | | | — | | | | 66,600,339 | | |
Total | | $ | 640,182,844 | | | | — | | | | — | | | $ | 640,182,844 | | |
* All sub-categories within Common Stocks and Preferred Stocks represent Level 1 investments. See Schedule of Investments for industry categories.
Transfers of investments between different levels of the fair value hierarchy are recorded at fair value as of the end of the reporting period. There were no significant transfers into or out of Level 3 during the six months ended November 30, 2023.
The Fund did not hold derivatives as of November 30, 2023.
NOTE 8 — Market Disruption and Geopolitical Risks
Certain local, regional or global events such as war, acts of terrorism, the spread of infectious illness or other public health issues, or other events could have a significant impact on a security or instrument. Since 2020, the novel strain of coronavirus (COVID-19) has negatively affected the worldwide economy, as well as the economies of individual countries, the financial health of individual companies and the market in general in significant and unforeseen ways. Following Russia's large-scale invasion of Ukraine, the President of the United States signed an Executive Order in February 2022 prohibiting U.S. persons from entering transactions with the Central Bank of Russia and Executive Orders in March 2022 prohibiting U.S. persons from importing oil and gas from Russia as well as other popular Russian exports, such as diamonds, seafood and vodka. There may also be restrictions on investments in Chinese companies. For example, the President of the United States of America signed an Executive Order in June 2021 affirming and expanding the U.S. policy prohibiting U.S. persons from purchasing or investing in publicly-traded securities of companies identified by the U.S. Government as "Chinese Military-Industrial Complex Companies." The list of such companies can change from time to time, and as a result of forced selling or an inability to participate in an investment the Adviser otherwise believes is attractive, the Fund may incur losses. The duration of the coronavirus outbreak and the Russian-Ukraine conflict could adversely affect the Fund's performance, the performance of the securities in which the Fund invests and may lead to losses on your investment. The ultimate impact of COVID-19 and Russia Invasion on the financial performance of the Fund's investments is not reasonably estimable at this time. Management is actively monitoring these events.
NOTE 9 — New Accounting Pronouncements
Effective January 24, 2023, the Securities and Exchange Commission (the "SEC") adopted rule and form amendments to require mutual funds and exchange-traded funds ("ETFs") to transmit concise and visually engaging streamlined annual and semiannual reports to shareholders that highlight key information deemed important for retail investors to assess and monitor their fund investments. Certain information, including financial statements, will no longer appear in the funds' streamlined shareholder reports but must be available online, delivered free of charge upon request, and filed on a semiannual basis on Form N-CSR. The rule and form
31
FPA QUEENS ROAD SMALL CAP VALUE FUND
NOTES TO FINANCIAL STATEMENTS (Continued)
(Unaudited)
amendments have a compliance date of July 24, 2024. At this time, management is evaluating the impact of these rule and form amendment changes on the content of the current shareholder report and the newly created annual and semiannual streamlined shareholder reports.
NOTE 10 — Events Subsequent to the Fiscal Period End
The Fund has adopted financial reporting rules regarding subsequent events which require an entity to recognize in the financial statements the effects of all subsequent events that provide additional evidence about conditions that existed at the date of the balance sheet. Management has evaluated the Fund's related events and transactions that occurred through the date of issuance of the Fund's financial statements.
There were no events or transactions that occurred during this period that materially impacted the amounts or disclosures in the Fund's financial statements.
32
FPA QUEENS ROAD SMALL CAP VALUE FUND
BOARD CONSIDERATION OF INVESTMENT ADVISORY
AND SUB-ADVISORY AGREEMENTS
(Unaudited)
At an in-person meeting held on August 14, 2023, the Board of Trustees (the "Board") of Investment Managers Series Trust III (the "Trust"), including the trustees who are not "interested persons" of the Trust (the "Independent Trustees") as defined in the Investment Company Act of 1940, as amended (the "1940 Act"), reviewed and unanimously approved the renewal of the investment advisory agreement (the "Advisory Agreement") between the Trust and First Pacific Advisors, LP (the "Advisor"), and the sub-advisory agreement (the "Sub-Advisory Agreement") among the Trust, the Advisor, and Bragg Financial Advisors, Inc. (the "Sub-Advisor"), with respect to the FPA Queens Road Small Cap Value Fund series of the Trust (the "Fund") for additional one-year terms from when they otherwise would expire. The Advisory Agreement and the Sub-Advisory Agreement are referred to below as the "Fund Advisory Agreements." In approving renewal of each Fund Advisory Agreement, the Board, including the Independent Trustees, determined that such renewal was in the best interests of the Fund and its shareholders.
Background
In advance of the meeting, the Board received information about the Fund and the Fund Advisory Agreements from the Advisor, the Sub-Advisor, and Mutual Fund Administration, LLC and UMB Fund Services, Inc., the Trust's co-administrators, certain portions of which are discussed below. The materials, among other things, included information about the organization and financial condition of the Advisor and the Sub-Advisor; information regarding the background, experience, and compensation structure of relevant personnel providing services to the Fund; information about the Advisor's and the Sub-Advisor's compliance policies and procedures, disaster recovery and contingency planning, and policies with respect to portfolio execution and trading; information regarding the profitability of the Advisor's overall relationship with the Fund; reports comparing the performance of the Fund with returns of the Russell 2000 Value Index and a group of comparable funds (the "Peer Group") selected by Broadridge Financial Solutions, Inc. ("Broadridge") from Morningstar, Inc.'s Small Value category (the "Fund Universe") for the one-, three-, five-, and ten-year periods ended May 31, 2023; reports comparing the investment advisory fee and total expenses of the Fund with those of the Peer Group and Fund Universe; and the advisory and sub-advisory fees paid pursuant to the Advisory Agreement and Sub-Advisory Agreement, respectively. The Board also received a memorandum from legal counsel to the Trust and the Independent Trustees discussing the legal standards under the 1940 Act and other applicable law for their consideration of the proposed renewal of the Fund Advisory Agreements. In addition, the Board considered information reviewed by the Board during the year at other Board and Board committee meetings.
In renewing the Fund Advisory Agreements, the Independent Trustees met separately in an executive session prior to the meeting with the Board to consider the Fund Advisory Agreements, including the items discussed below, and were represented by their legal counsel with respect to the matters considered. The Board, including all of the Independent Trustees, then met and also considered a variety of factors for renewal of the Fund Advisory Agreements, including those discussed below. In their deliberations, the Board and the Independent Trustees did not identify any particular factor that was controlling, and each Trustee may have attributed different weights to the various factors.
First Pacific Advisors, LP
Nature, Extent, and Quality of Services
The Board and the Independent Trustees considered information provided by the Advisor in response to their requests, as well as information provided throughout the year regarding: the Advisor and its staffing in
33
FPA QUEENS ROAD SMALL CAP VALUE FUND
BOARD CONSIDERATION OF INVESTMENT ADVISORY
AND SUB-ADVISORY AGREEMENTS (Continued)
(Unaudited)
connection with the Fund, including the investment professionals who monitor and oversee the Sub-Advisor and portfolio manager; the scope of services supervised and provided by the Advisor; and the absence of any significant service problems reported to the Board. After discussion, the Board concluded that the nature, extent, and quality of services provided by the Advisor have benefited and should continue to benefit the Fund and its shareholders.
Investment Performance
The Board and the Independent Trustees reviewed the overall investment performance of the Fund. The Board also received information from an independent consultant, Broadridge, regarding the Fund's performance relative to its comparative index, the Peer Group and the Fund Universe. The Board and the Independent Trustees noted the Fund's long-term investment performance when compared to the Peer Group and concluded that the Fund's investment performance has been strong. The Board noted that for the one-, five-, and ten-year periods, the Fund's annualized total returns outperformed the Peer Group and Fund Universe median returns and the Russell 2000 Value Index returns. The Board observed that for the three-year period, the Fund's annualized total return underperformed the Russell 2000 Value Index return and the Peer Group and Fund Universe median returns by 0.62%, 1.24%, and 2.58%, respectively. In considering the Fund's performance, the Trustees considered that the Advisor generally expected its funds to underperform in up markets and outperform in down markets, and that the Advisor focuses on full market cycles, rather than short-term performance, in evaluating its funds' performance. The Board also observed that the Fund's volatility of returns, as measured by its standard deviation, and its downside volatility, as measured by its Morningstar risk score, ranked it in the first quartile of the funds (which is the most favorable) in the Peer Group and Fund Universe for the one-, three-, five-, and ten-year periods. The Board and the Independent Trustees concluded that the Advisor's continued oversight of the management of the Fund's investments should benefit the Fund and its shareholders.
Advisory Fee and Fund Expenses; Comparison with Peer Group and Institutional Fees
The Board and the Independent Trustees considered information provided by the Advisor regarding the Fund's advisory fee and total expense levels. The Board and the Independent Trustees reviewed comparative information regarding fees and expenses for the Peer Group and Fund Universe. The Board and the Independent Trustees noted that at the Fund's current asset level, the annual investment advisory fee was below the Peer Group and Fund Universe medians, and that its net expense ratio was also below the Peer Group and Fund Universe medians. The Trustees considered that the Advisor does not manage any other accounts with the same objectives and policies as the Fund, and therefore they did not have a good basis for comparing the Fund's advisory fee with those of other similar client accounts of the Advisor. The Board also noted that the Fund's advisory fee was within the range of advisory fees paid by other series of the Trust managed by the Advisor. The Board and the Independent Trustees concluded that the continued payment of the advisory fee by the Fund to the Advisor was fair and reasonable and should continue to benefit the Fund and its shareholders.
Advisor Profitability and Costs
The Board and the Independent Trustees considered information provided by the Advisor regarding the Advisor's costs in providing services to the Fund, the profitability of the Advisor and the benefits to the Advisor from its relationship to the Fund. They reviewed and considered the Advisor's representations regarding its assumptions and methods of allocating certain costs, such as personnel costs, which constitute the Advisor's largest operating cost, and overhead costs with respect to the provision of investment advisory services. The
34
FPA QUEENS ROAD SMALL CAP VALUE FUND
BOARD CONSIDERATION OF INVESTMENT ADVISORY
AND SUB-ADVISORY AGREEMENTS (Continued)
(Unaudited)
Independent Trustees discussed with the Advisor the general process through which individuals' compensation is determined and then reviewed by the management committee of the Advisor, as well as the Advisor's methods for determining that its compensation levels are set at appropriate levels to attract and retain the personnel necessary to provide high quality professional investment advice. In evaluating the Advisor's profitability, they excluded certain distribution and marketing-related expenses. The Board and the Independent Trustees recognized that the Advisor is entitled under the law to earn a reasonable level of profits for the services that it provides to the Fund. The Board observed, however, that the Advisor did not realize a profit with respect to the Fund.
Economies of Scale
The Board and the Independent Trustees considered whether there have been economies of scale with respect to the management of the Fund, whether the Fund has appropriately benefited from any economies of scale, and whether the advisory fee rate is reasonable in relation to the Fund's asset levels and any economies of scale that may exist. The Board and the Independent Trustees considered the Advisor's representation that its internal costs of providing investment management services to the Fund have significantly increased in recent years as a result of a number of factors, including the Advisor's substantial investments in additional professional resources and staffing. The Board and the Independent Trustees considered both quantitative and qualitative information regarding the Advisor's representation that it has also made significant investments in: (1) the portfolio manager, analysts, traders, and other investment personnel who assist with the management of the Fund; (2) new compliance, operations, and administrative personnel; (3) information technology, portfolio accounting, and trading systems; and (4) office space, each of which enhances the quality of services provided to the Fund. The Board and the Independent Trustees also considered the Advisor's willingness to close funds to new investors when it believes that a fund may have limited capacity to grow or that it otherwise would benefit fund shareholders.
The Independent Trustees noted that the advisory fee rate contained a breakpoint as the Fund's assets increased. They considered that many registered funds have breakpoints in the advisory fee structure as a means by which to share in the benefits of potential economies of scale as a fund's assets grow. They also considered that not all funds have breakpoints in their fee structures and that breakpoints are not the exclusive means of sharing potential economies of scale. The Board and the Independent Trustees considered the Advisor's statement that it believes that additional breakpoints for the Fund are not warranted at this time given the ongoing investments the Advisor is making in its business for the benefit of the Fund, uncertainties regarding the direction of the economy, rising inflation, increasing costs for personnel and systems, and growth or contraction in the Fund's assets, all of which could negatively impact the profitability of the Advisor. The Board and the Independent Trustees noted that the Advisor had not proposed to increase the fee rate charged to the Fund despite the Advisor's representation that its internal costs of providing investment management services to the Fund have increased significantly in recent years. The Board and the Independent Trustees also noted that the Advisor has contractually agreed to reimburse the Fund for total annual fund operating expenses in excess of 1.04% of the average net assets of the Fund attributable to the Investor Class, 0.99% of the average net assets of the Fund attributable to the Advisor Class, and 0.89% of the average net assets of the Fund attributable to the Institutional Class until July 27, 2024. The Board concluded that the Fund is benefitting from the ongoing investments made by the Advisor in its team of personnel serving the Fund and in the Advisor's service infrastructure, and that in light of these investments, additional breakpoints in the Fund's advisory fee structure were not warranted at current asset levels.
35
FPA QUEENS ROAD SMALL CAP VALUE FUND
BOARD CONSIDERATION OF INVESTMENT ADVISORY
AND SUB-ADVISORY AGREEMENTS (Continued)
(Unaudited)
Ancillary Benefits to the Advisor
The Board and the Independent Trustees considered other "fall out" benefits to the Advisor as a result of its relationship with the Fund, other than the advisory fee, including the beneficial effects from the review by the Trust's Chief Compliance Officer of the Advisor's compliance program, the intangible benefits of its association with the Fund generally, and any favorable publicity arising in connection with the Fund's performance. They noted that the Advisor does not have any affiliates that benefit from the Advisor's relationship to the Fund.
Conclusions
The Board and the Independent Trustees determined that the Fund continues to benefit from the services of the Advisor's highly experienced portfolio management team. In addition, the Board and the Independent Trustees agreed that the Fund continues to receive high quality services from the Advisor. The Board and the Independent Trustees concluded that the current advisory fee rate is reasonable and fair to the Fund and its shareholders in light of the nature and quality of the services provided by the Advisor and the Advisor's profitability and costs. On the basis of the foregoing, and without assigning particular weight to any single factor, none of which was dispositive, the Board concluded that it would be in the best interests of the Fund to continue to be advised and managed by the Advisor and determined to approve the renewal of the current Advisory Agreement for another one-year period through September 30, 2024.
Bragg Financial Advisors, Inc.
Nature, Extent, and Quality of Services
The Board and the Independent Trustees considered information provided by the Sub-Advisor in response to their requests, as well as information provided throughout the year regarding: the Sub-Advisor and its staffing in connection with the Fund, including the Sub-Advisor's portfolio manager and analyst; the scope of services provided by the Sub-Advisor; and the absence of any significant service problems reported to the Board. After discussion, the Board concluded that the nature, extent, and quality of services provided by the Sub-Advisor have benefited and should continue to benefit the Fund and its shareholders.
Investment Performance
The Board and the Independent Trustees noted that as the sole sub-advisor to the Fund, the Sub-Advisor is primarily responsible for the day-to-day management of the Fund and its investment performance, which the Board had discussed when considering the Advisory Agreement.
Sub-Advisory Fee
The Board and the Independent Trustees considered information provided by the Sub-Advisor regarding the Fund's sub-advisory fee. The Board and the Independent Trustees noted that the Fund's sub-advisory fee was within the range of the advisory fees that the Sub-Advisor charges to manage separate accounts using similar strategies as the Fund, and lower than the sub-advisory fee that the Sub-Advisor charges with respect to the FPA Queens Road Value Fund, another series of the Trust. The Board observed that the Advisor pays the Sub-Advisor's sub-advisory fee out of the Advisor's advisory fee, and considered the relative levels and types of services provided by the Advisor and the Sub-Advisor.
36
FPA QUEENS ROAD SMALL CAP VALUE FUND
BOARD CONSIDERATION OF INVESTMENT ADVISORY
AND SUB-ADVISORY AGREEMENTS (Continued)
(Unaudited)
Ancillary Benefits to the Sub-Advisor
The Board and the Independent Trustees considered other "fall out" benefits to the Sub-Advisor as a result of its relationship with the Fund, other than the sub-advisory fee, including research services provided to it by broker-dealers providing execution services to the Fund, the beneficial effects from the review by the Trust's Chief Compliance Officer of the Sub-Advisor's compliance program, the intangible benefits of its association with the Fund generally, and any favorable publicity arising in connection with the Fund's performance. They noted that the Sub-Advisor does not have any affiliates that benefit from the Sub-Advisor's relationship to the Fund.
Conclusions
The Board and the Independent Trustees determined that the Fund continues to benefit from the services of the Sub-Advisor's experienced portfolio management team. In addition, the Board and the Independent Trustees agreed that the Fund continues to receive high quality services from the Sub-Advisor. The Board and the Independent Trustees concluded that the current sub-advisory fee rate is reasonable and fair in light of the nature and quality of the services provided by the Sub-Advisor. On the basis of the foregoing, and without assigning particular weight to any single factor, none of which was dispositive, the Board concluded that it would be in the best interests of the Fund to continue to be sub-advised by the Sub-Advisor and determined to approve the renewal of the current Sub-Advisory Agreement for another one-year period through September 30, 2024.
37
FPA QUEENS ROAD SMALL CAP VALUE FUND
LIQUIDITY RISK MANAGEMENT PROGRAM
(Unaudited)
Statement Regarding Liquidity Risk Management Program
In compliance with SEC Rule 22e-4 under the U.S. Investment Company Act of 1940 (the "Liquidity Rule"), the Fund has adopted and implemented a written liquidity risk management program (the "Program"). The Fund's Board of Trustees have also designated the Adviser to serve as the administrator of the Program.
The Liquidity Rule requires that the Program be reasonably designed to assess and manage the Fund's liquidity risk. A Fund's "liquidity risk" is the risk that the Fund could not meet requests to redeem shares issued by the Fund without significant dilution of the remaining investors' interests in the Fund. The Program includes a number of elements that support the assessment, management and review of liquidity risk. In accordance with the Program, the Fund's liquidity risk is assessed no less frequently than annually taking into consideration a variety of factors, including, as applicable, the Fund's investment strategy and liquidity of portfolio investments, cash flow projections, and holdings of cash and cash equivalents, as well as borrowing arrangements and other funding sources. Certain factors are considered under both normal and reasonably foreseeable stressed conditions. There is no guarantee that the Program will achieve its objective under all circumstances.
Under the Program, each Fund portfolio investment is classified into one of four liquidity categories based on a determination of the number of days it is reasonably expected to take to convert the investment to cash, or sell or dispose of the investment, in current market conditions without significantly changing the investment's market value. The Program is reasonably designed to meet Liquidity Rule requirements relating to "highly liquid investment minimums" (i.e., the minimum amount of Fund net assets to be invested in highly liquid investments that are assets) and to monitor compliance with the Liquidity Rule's limitations on a Fund's investments in illiquid investments. Under the Liquidity Rule, a Fund is prohibited from acquiring any illiquid investment if, immediately after the acquisition, the Fund would have invested more than 15% of its net assets in illiquid investments that are assets.
During the period covered by this shareholder report, the Fund's Board of Trustees received reports prepared by the Adviser addressing the Program's operation and assessing the adequacy and effectiveness of its implementation for the period from October 1, 2022 to June 30, 2023. The reports concluded that the Program operated effectively, the Program had been and continued to be reasonably designed to assess and manage the Fund's liquidity risk, and the Program has been adequately and effectively implemented to monitor and respond to the Fund's liquidity developments, as applicable.
38
FPA QUEENS ROAD SMALL CAP VALUE FUND
EXPENSE EXAMPLE
For the Six Months Ended November 30, 2023 (Unaudited)
Expense Example
As a shareholder of the Fund, you incur two types of costs: (1) transaction costs, and (2) ongoing costs, including management fees and other Fund expenses. The examples below are intended to help you understand your ongoing costs (in dollars) of investing in the Fund and to compare these costs with the ongoing costs of investing in other mutual funds.
These examples are based on an investment of $1,000 invested at the beginning of the period and held for the entire period from June 1, 2023 to November 30, 2023.
Actual Expenses
The information in the row titled "Actual Performance" of the table below provides actual account values and actual expenses. You may use the information in these columns, together with the amount you invested, to estimate the expenses that you paid over the period. Simply divide your account value by $1,000 (for example, an $8,600 account value divided by $1,000 = 8.6), then multiply the result by the number in the appropriate row under the column titled "Expenses Paid During Period" to estimate the expenses you paid on your account during this period.
Hypothetical Example for Comparison Purposes
The information in the row titled "Hypothetical (5% annual return before expenses)" of the table below provides hypothetical account values and hypothetical expenses based on the Fund's actual expense ratios and an assumed rate of return of 5% per year before expenses, which is not the Fund's actual return. The hypothetical account values and expenses may not be used to estimate the actual ending account balance or expenses you paid for the period. You may use this information to compare the ongoing costs of investing in the Fund and other funds. To do so, compare these 5% hypothetical examples with the 5% hypothetical examples that appear in the shareholder reports of the other funds.
Please note that the expenses shown in the table are meant to highlight your ongoing costs only and do not reflect any transaction costs, such as sales charges (load) or contingent deferred sales charges. Therefore, the information in the row titled "Hypothetical (5% annual return before expenses)" is useful in comparing ongoing costs only, and will not help you determine the relative total costs of owning different funds. In addition, if these transactional costs were included, your costs would have been higher.
| | | Actual Performance | | Hypothetical (5% annual
return before expenses) | |
Investor Class | |
Beginning Account Value 6/1/23 | | $ | 1,000.00 | | | $ | 1,000.00 | | |
Ending Account Value 11/30/23 | | $ | 1,077.20 | | | $ | 1,020.17 | | |
Expenses Paid During Period* 6/1/23-11/30/23 | | $ | 5.09 | | | $ | 4.95 | | |
Institutional Class | |
Beginning Account Value 6/1/23 | | $ | 1,000.00 | | | $ | 1,000.00 | | |
Ending Account Value 11/30/23 | | $ | 1,078.20 | | | $ | 1,021.18 | | |
Expenses Paid During Period* 6/1/23-11/30/23 | | $ | 4.05 | | | $ | 3.93 | | |
39
FPA QUEENS ROAD SMALL CAP VALUE FUND
EXPENSE EXAMPLE (Continued)
For the Six Months Ended November 30, 2023 (Unaudited)
| | | Actual Performance | | Hypothetical (5% annual
return before expenses) | |
Advisor Class | |
Beginning Account Value 6/1/23 | | $ | 1,000.00 | | | $ | 1,000.00 | | |
Ending Account Value 11/30/23 | | $ | 1,077.70 | | | $ | 1,020.54 | | |
Expenses Paid During Period* 6/1/23-11/30/23 | | $ | 4.70 | | | $ | 4.57 | | |
* Expenses are equal to the Fund's annualized expense ratio of 0.98%, 0.78%, and 0.91%, for the Investor Class, Institutional Class and Advisor Class shares, respectively, multiplied by the average account value over the period, multiplied by 183/366 (to reflect the six month period). Assumes all dividends and distributions were reinvested.
40
FPA QUEENS ROAD SMALL CAP VALUE FUND
(Unaudited)
INVESTMENT ADVISER
First Pacific Advisors, LP
11601 Wilshire Boulevard, Suite 1200
Los Angeles, CA 90025
INVESTMENT SUB-ADVISER
Bragg Financial Advisors, Inc.
1031 Caldwell Street, Suite 200
Charlotte, NC 28203
FUND CO-ADMINISTRATOR, TRANSFER AGENT AND FUND ACCOUNTANT
UMB Fund Services, Inc.
P.O. Box 2175
Milwaukee, WI 53201-2175
or
235 West Galena Street
Milwaukee, WI 53212-3948
(800) 638-3060
Advisor Class:
TICKER SYMBOL: QRSAX
CUSIP: 30254T627
Institutional Class:
TICKER SYMBOL: QRSIX
CUSIP: 30254T619
Investor Class:
TICKER SYMBOL: QRSVX
CUSIP: 30254T635
CUSTODIAN
UMB Bank, n.a.,
928 Grand Boulevard
Kansas City, Missouri 64106
DISTRIBUTOR
UMB Distribution Services, LLC
235 West Galena Street
Milwaukee, Wisconsin 53212-3948
LEGAL COUNSEL
Morgan, Lewis & Bockius LLP
600 Anton Boulevard, Suite 1800
Costa Mesa, California 92626
INDEPENDENT REGISTERED PUBLIC ACCOUNTING FIRM
Tait, Weller & Baker LLP
Two Liberty Place
50 South 16th Street, Suite 2900
Philadelphia, Pennsylvania 19102
CO-ADMINISTRATOR
Mutual Fund Administration, LLC
2220 E. Route 66, Suite 226
Glendora, California 91740
This report has been prepared for the information of shareholders of FPA QUEENS ROAD SMALL CAP VALUE FUND, and is not authorized for distribution to prospective investors unless preceded or accompanied by an effective prospectus.
A description of the policies and procedures that the Adviser uses to vote proxies related to the Fund's portfolio securities is set forth in the Fund's Statement of Additional Information which is available without charge, upon request, on the Fund's website at www.fpa.com or by calling (800) 982-4372 and on the Securities and Exchange Commission's website at www.sec.gov.
The Fund's complete proxy voting record for the 12 months ended June 30, 2023 is available without charge, upon request by calling (800) 982-4372 and on the SEC's website at www.sec.gov.
The Fund's schedule of portfolio holdings, filed the first and third quarter of the Fund's fiscal year on Form N-PORT with the SEC, is available on the SEC's website at www.sec.gov.
Additional information about the Fund is available online at www.fpa.com. This information includes, among other things, holdings, top sectors, and performance, and is updated on or about the 15th business day after the end of each quarter.

Distributor:
UMB DISTRIBUTION SERVICES, LLC
235 West Galena Street
Milwaukee, Wisconsin 53212
FPA Queens Road Value Fund
FPA QUEENS ROAD VALUE FUND
LETTER TO SHAREHOLDERS
Dear Fellow Shareholders,
FPA Queens Road Value Fund ("Fund") returned 12.28% in the first half of fiscal year 2024 (June 1, 2023 to November 30, 2023, the "Period"). This compares to the S&P 500 Value Index return of 10.38% for the same Period. For the 12 months ended November 30, 2023, the Fund returned 7.16% vs 11.29% for the S&P 500 Value Index.
For the 12 months ending September 30, 2023, both losses and gains were well distributed. Pfizer, VFC, Elevance, Disney and RTX were the largest negative contributors to QRV Fund's trailing twelve month performance. In a year dominated by mega cap technology stocks, two of the fund's technology holdings — Oracle and Intel were among the best performers. Other significant contributors to performance were industrials, Eaton and Trane Technologies as well as financial service provider Fiserv.
Trailing Twelve Months (TTM) and Semi-Annual Contributors and Detractors1
Contributors | | Performance
Contribution | | Percent of
Portfolio | | Detractors | | Performance
Contribution | | Percent of
Portfolio | |
| 1H Fiscal Year 2024 | | | | | | | | | | | |
Eaton | | | 2.22 | % | | | 8.1 | % | | Pfizer | | | -0.67 | % | | | 3.2 | % | |
Trane Technologies | | | 2.09 | % | | | 6.1 | % | | Merck & Co. | | | -0.29 | % | | | 4.4 | % | |
Ameriprise | | | 1.19 | % | | | 6.1 | % | | RTX | | | -0.20 | % | | | 1.7 | % | |
General Dynamics | | | 1.16 | % | | | 5.4 | % | | T. Rowe Price Group | | | -0.12 | % | | | 2.5 | % | |
Intel | | | 1.13 | % | | | 2.8 | % | | Cisco Systems | | | -0.06 | % | | | 4.8 | % | |
| | | | 7.79 | % | | | 28.5 | % | | | | | -1.33 | % | | | 16.6 | % | |
TTM | | | | | | | | | | | |
Eaton | | | 2.68 | % | | | 7.3 | % | | Pfizer | | | -1.68 | % | | | 3.6 | % | |
Oracle | | | 2.43 | % | | | 6.7 | % | | Danaher | | | -0.80 | % | | | 4.6 | % | |
Trane Technologies | | | 1.59 | % | | | 5.8 | % | | Elevance Health | | | -0.61 | % | | | 6.3 | % | |
Intel | | | 1.23 | % | | | 2.5 | % | | T. Rowe Price Group | | | -0.47 | % | | | 2.6 | % | |
Fiserv | | | 0.96 | % | | | 4.2 | % | | V.F. Corp | | | -0.31 | % | | | 0.3 | % | |
| | | | 8.88 | % | | | 26.6 | % | | | | | -3.87 | % | | | 17.6 | % | |
During the Period we sold out of retail apparel company, V.F. Corporation due to balance sheet deterioration and what we believe are structural issues with their Vans brand.
We also trimmed the Fund's positions in Ameriprise and Oracle. While we continue to feel good about the long-term prospects of these companies, market performance had increased the holding size of each to a level we weren't comfortable with. We think of trimming these positions as prudent risk management.
1 As of November 30, 2023. Reflects the top five contributors and detractors to the Fund's performance based on contribution to return for the trailing twelve months ("TTM"). Contribution is presented gross of investment management fees, transactions costs, and Fund operating expenses, which if included, would reduce the returns presented. The information provided does not reflect all positions purchased, sold or recommended during the quarter. A copy of the methodology used and a list of every holding's contribution to the overall Fund's performance during the TTM is available by contacting FPA Client Service at crm@fpa.com. It should not be assumed that recommendations made in the future will be profitable or will equal the performance of the securities listed. Past performance is no guarantee, nor is it indicative, of future results.
1
FPA QUEENS ROAD VALUE FUND
LETTER TO SHAREHOLDERS
(Continued)
During the Period the Fund received a new position, Veralto Corporation which was spun out of portfolio holding, Danaher.2 Veralto is in the water and product quality businesses. We have since sold out of the position.
At its most basic, our process compares a company's current price to what we expect the business to look like three to five years out. Our four pillars — balance sheet strength, valuation, management, and industry analysis — provide guidance and guardrails. Taking a long-term view has served us well in the past and we are confident that our disciplined and patient approach will continue to be rewarded over the long-term.
In our experience, when there is exuberance in the markets, it is usually overdone. But when markets get volatile and the pundits predict doom and gloom, it is usually overdone as well. We acknowledge the heightened uncertainty as well as the headwinds the economy faces. But, given the current valuations and long-term fundamentals of the Fund's holdings, we feel more positive about the portfolio than we have in several years.
Respectfully,

Steve Scruggs, CFA, Portfolio Manager
Ben Mellman, Senior Analyst
November 30, 2023
Important Disclosures
This Commentary is for informational and discussion purposes only and does not constitute, and should not be construed as, an offer or solicitation for the purchase or sale of any securities, products or services discussed, and neither does it provide investment advice. Any such offer or solicitation shall only be made pursuant to the Fund's Prospectus, which supersedes the information contained herein in its entirety. This Commentary does not constitute an investment management agreement or offering circular.
The statements contained herein reflect the opinions and views of the portfolio managers as of the date written, is subject to change without notice, and may be forward-looking and/or based on current expectations, projections, and/or information currently available. Such information may not be accurate over the long-term. These views may differ from other portfolio managers and analysts of the firm as a whole and are not intended to be a forecast of future events, a guarantee of future results or investment advice.
Portfolio composition will change due to ongoing management of the Fund. References to individual securities or sectors are for informational purposes only and should not be construed as recommendations by the Fund, the portfolio manager, the Adviser, the Sub-Adviser or the distributor. It should not be assumed that future investments will be profitable or will equal the performance of the security or sector examples discussed. The portfolio holdings as of the most recent quarter-end may be obtained at https://fpa.com.
Future events or results may vary significantly from those expressed and are subject to change at any time in response to changing circumstances and industry developments. The information and data contained herein
2 Danaher Corp. completes separation of Veralto Corp. (https://investors.danaher.com/2023-09-30-Danaher-Corporation-Completes-Separation-of-Veralto-Corporation).
2
FPA QUEENS ROAD VALUE FUND
LETTER TO SHAREHOLDERS
(Continued)
has been prepared from sources believed reliable, but the accuracy and completeness of the information cannot be guaranteed and is not a complete summary or statement of all available data.
The information contained herein is not complete, may change, and is subject to, and is qualified in its entirety by, the more complete disclosures, risk factors, and other information contained in the Fund's Prospectus and Statement of Additional Information. The information is furnished as of the date shown. No representation is made with respect to its completeness or timeliness. The information is not intended to be, nor shall it be construed as, investment advice or a recommendation of any kind.
Certain statements contained in this presentation may be forward-looking and/or based on current expectations, projections, and information currently available. Actual events or results may differ from materially those we anticipate, or the actual performance of any investments described herein may differ from those reflected or contemplated in such forward-looking statements, due to various risks and uncertainties. We cannot assure future results and disclaim any obligation to update or alter any forward-looking statements, whether as a result of new information, future events, or otherwise. Such statements may or may not be accurate over the long-term. Statistical data or references thereto were taken from sources which we deem to be reliable, but their accuracy cannot be guaranteed.
The reader is advised that the Fund's investment strategy includes active management with corresponding changes in allocations from one period of time to the next. Therefore, any data with respect to investment allocations as of a given date is of limited use and may not be reflective of the portfolio manager's more general views with respect to proper geographic, instrument and/or sector allocations. The data is presented for indicative purposes only and, as a result, may not be relied upon for any purposes whatsoever.
In making any investment decision, you must rely on your own examination of the Fund, including the risks involved in an investment. Investments mentioned herein may not be suitable for all recipients and in each case, potential investors are advised not to make any investment decision unless they have taken independent advice from an appropriately authorized advisor. An investment in any security mentioned herein does not guarantee a positive return as securities are subject to market risks, including the potential loss of principal. You should not construe the contents of this document as legal, tax, investment or other advice or recommendations.
Fund performance presented is calculated on a total return basis, which includes the reinvestment of all income, plus realized and unrealized gains/losses, if applicable. Unless otherwise indicated, performance results are presented on a net of fees basis and reflect the deduction of, among other things: management fees, brokerage commissions, operating and administrative expenses, and accrued performance fee/allocation, if applicable.
The information provided in this presentation is based upon data existing as of the date(s) of the report and has not been audited or reviewed. While we believe the information to be accurate, it is subject in all respects to adjustments that may be made after proper review and reconciliation.
Investments, including mutual fund investments, carry risks and investors may lose principal value. Capital markets are volatile and can decline significantly in response to adverse issuer, political, regulatory, market, or economic developments. Small and mid-cap stocks involve greater risks and they can fluctuate in price more than larger company stocks. Short-selling involves increased risks and transaction costs. You risk paying more for a security than you received from its sale. Groups of stocks, such as value and growth, go in and out of favor which may cause certain funds to underperform other equity funds. The value of an individual security can be more volatile than the market as a whole and can perform differently than the value of the market as a whole.
3
FPA QUEENS ROAD VALUE FUND
LETTER TO SHAREHOLDERS
(Continued)
The prices of securities held by the Fund may decline in response to certain events taking place around the world, including those directly involving the companies whose securities are owned by the Fund. Securities in the Fund's portfolio may underperform due to inflation (or expectations for inflation), interest rates, global demand for particular products or resources, natural disasters, pandemics, epidemics, terrorism, regulatory events and governmental or quasi-governmental actions. There is a risk that you may lose money by investing in the Fund.
Value style investing presents the risk that the holdings or securities may never reach their full market value because the market fails to recognize what the portfolio management team considers the true business value or because the portfolio management team has misjudged those values. In addition, value style investing may fall out of favor and underperform growth or other styles of investing during given periods.
Please refer to the Fund's Prospectus for a complete overview of the primary risks associated with the Fund.
The FPA Funds are distributed by UMB Distribution Services, LLC, 235 W. Galena Street, Milwaukee, WI, 53212. UMB and FPA are not affiliated.
Index / Benchmark / Category Definitions
The Fund will typically be less diversified than the indices noted herein and may hold non-index securities or securities that are not comparable to those contained in an index. Indices will hold positions that are not within the Fund's investment strategy. Indices are unmanaged and do not reflect any commissions, transaction costs, or fees and expenses which would be incurred by an investor purchasing the underlying securities and which would reduce the performance in an actual account. You cannot invest directly in an index.
Standard & Poor's 500 Stock Index (S&P 500) is a capitalization-weighted index which covers industrial, utility, transportation and financial service companies, and represents approximately 75% of the New York Stock Exchange (NYSE) capitalization and 30% of NYSE issues. The S&P 500 is considered a measure of large capitalization stock performance.
The S&P 500 Value Index is a market cap-weighted index. The value factors used to determine a stock's value score are book value to price ratio, cash flow to price ratio, sales to price ratio and dividend yield. S&P Style Indices divide the complete market capitalization of each parent index into growth and value segments. Constituents are drawn from the S&P 500.
Other Definitions
Margin of safety is a principle of investing in which an investor only purchases securities when their market price is significantly below their intrinsic value.
4
FPA QUEENS ROAD VALUE FUND
LETTER TO SHAREHOLDERS
(Continued)
The discussions of Fund investments represent the views of the Fund's managers at the time of this report and are subject to change without notice. References to individual securities are for informational purposes only and should not be construed as recommendations to purchase or sell individual securities. While the Fund's managers believe that the Fund's holdings are value stocks, there can be no assurance that others will consider them as such. Further, investing in value stocks presents the risk that value stocks may fall out of favor with investors and underperform growth stocks during given periods.
FORWARD LOOKING STATEMENT DISCLOSURE
As mutual fund managers, one of our responsibilities is to communicate with shareholders in an open and direct manner. Insofar as some of our opinions and comments in our letters to shareholders are based on our current expectations, they are considered "forward-looking statements" which may or may not prove to be accurate over the long term. While we believe we have a reasonable basis for our comments and we have confidence in our opinions, actual results may differ materially from those we anticipate. You can identify forward-looking statements by words such as "believe," "expect," "may," "anticipate," and other similar expressions when discussing prospects for particular portfolio holdings and/or the markets, generally. We cannot, however, assure future results and disclaim any obligation to update or alter any forward-looking statements, whether as a result of new information, future events, or otherwise. Further, information provided in this report should not be construed as a recommendation to purchase or sell any particular security.
5
FPA QUEENS ROAD VALUE FUND
SCHEDULE OF INVESTMENTS
As of November 30, 2023
(Unaudited)
COMMON STOCKS — 99.3% | | Number
of Shares | | Value | |
AEROSPACE & DEFENSE — 7.2% | |
General Dynamics Corp. | | | 8,000 | | | $ | 1,975,760 | | |
RTX Corp. | | | 6,600 | | | | 537,768 | | |
| | | $ | 2,513,528 | | |
ASSET MANAGEMENT — 8.4% | |
Ameriprise Financial, Inc. | | | 6,000 | | | $ | 2,121,060 | | |
T. Rowe Price Group, Inc. | | | 7,900 | | | | 791,027 | | |
| | | $ | 2,912,087 | | |
BANKING — 4.1% | |
JPMorgan Chase & Co. | | | 9,000 | | | $ | 1,404,720 | | |
BIOTECH & PHARMA — 6.8% | |
Merck & Co., Inc. | | | 13,820 | | | $ | 1,416,274 | | |
Pfizer, Inc. | | | 31,000 | | | | 944,570 | | |
| | | $ | 2,360,844 | | |
DIVERSIFIED INDUSTRIALS — 9.6% | |
3M Co. | | | 3,600 | | | $ | 356,652 | | |
Eaton Corp. PLC | | | 13,000 | | | | 2,959,970 | | |
| | | $ | 3,316,622 | | |
ELECTRICAL EQUIPMENT — 7.7% | |
Allegion PLC | | | 3,400 | | | $ | 360,706 | | |
Trane Technologies PLC | | | 10,200 | | | | 2,299,182 | | |
| | | $ | 2,659,888 | | |
ENTERTAINMENT CONTENT — 1.4% | |
Walt Disney Co.* | | | 5,151 | | | $ | 477,446 | | |
FOOD — 1.8% | |
Mondelez International, Inc. — Class A | | | 9,000 | | | $ | 639,540 | | |
HEALTH CARE FACILITIES & SVCS — 6.2% | |
Elevance Health, Inc. | | | 4,500 | | | $ | 2,157,705 | | |
HOUSEHOLD PRODUCTS — 0.5% | |
Clorox Co. | | | 1,200 | | | $ | 172,020 | | |
INSTITUTIONAL FINANCIAL SVCS — 2.0% | |
Bank of New York Mellon Corp. | | | 14,500 | | | $ | 700,640 | | |
6
FPA QUEENS ROAD VALUE FUND
SCHEDULE OF INVESTMENTS (Continued)
As of November 30, 2023
(Unaudited)
COMMON STOCKS — Continued | | Number
of Shares | | Value | |
INSURANCE — 7.5% | |
Berkshire Hathaway, Inc. — Class A* | | | 3 | | | $ | 1,637,700 | | |
Prudential Financial, Inc. | | | 10,000 | | | | 977,800 | | |
| | | $ | 2,615,500 | | |
LEISURE FACILITIES & SERVICES — 3.4% | |
McDonald's Corp. | | | 4,225 | | | $ | 1,190,774 | | |
MACHINERY — 2.3% | |
Ingersoll Rand, Inc. | | | 9,000 | | | $ | 642,870 | | |
Veralto Corp.* | | | 2,100 | | | | 162,225 | | |
| | | $ | 805,095 | | |
MEDICAL EQUIPMENT & DEVICES — 4.1% | |
Danaher Corp. | | | 6,300 | | | $ | 1,406,853 | | |
SEMICONDUCTORS — 3.4% | |
Intel Corp. | | | 26,000 | | | $ | 1,162,200 | | |
SOFTWARE — 6.8% | |
Oracle Corp. | | | 20,395 | | | $ | 2,370,103 | | |
SPECIALTY FINANCE — 5.4% | |
American Express Co. | | | 11,000 | | | $ | 1,878,470 | | |
TECHNOLOGY HARDWARE — 4.3% | |
Cisco Systems, Inc. | | | 30,700 | | | $ | 1,485,266 | | |
TECHNOLOGY SERVICES — 4.5% | |
Fiserv, Inc.* | | | 12,000 | | | $ | 1,567,320 | | |
TRANSPORTATION & LOGISTICS — 1.9% | |
Union Pacific Corp. | | | 3,000 | | | $ | 675,810 | | |
| TOTAL COMMON STOCKS (Cost $10,911,269) | | $ | 34,472,431 | | |
7
FPA QUEENS ROAD VALUE FUND
SCHEDULE OF INVESTMENTS (Continued)
As of November 30, 2023
(Unaudited)
SHORT-TERM INVESTMENTS — 0.8% | | Number
of Shares | | Value | |
MONEY MARKET INVESTMENTS — 0.8% | |
Morgan Stanley Institutional Liquidity Treasury Portfolio — Institutional
Class, 5.16%(a) | | | 276,216 | | | $ | 276,216 | | |
| TOTAL SHORT-TERM INVESTMENTS (Cost $276,216) | | $ | 276,216 | | |
| TOTAL INVESTMENTS — 100.1% (Cost $11,187,485) | | $ | 34,748,647 | | |
Liabilities in Excess of Other Assets — (0.1)% | | | (48,285 | ) | |
TOTAL NET ASSETS — 100.0% | | $ | 34,700,362 | | |
PLC — Public Limited Company
* Non-income producing security.
(a) The rate is the annualized seven-day yield at period end.
See accompanying Notes to Financial Statements.
8
FPA QUEENS ROAD VALUE FUND
SUMMARY OF INVESTMENTS
As of November 30, 2023
(Unaudited)
Security Type/Industry | | Percent of Total
Net Assets | |
Common Stocks | |
Diversified Industrials | | | 9.6 | % | |
Asset Management | | | 8.4 | % | |
Electrical Equipment | | | 7.7 | % | |
Insurance | | | 7.5 | % | |
Aerospace & Defense | | | 7.2 | % | |
Software | | | 6.8 | % | |
Biotech & Pharma | | | 6.8 | % | |
Health Care Facilities & Svcs | | | 6.2 | % | |
Specialty Finance | | | 5.4 | % | |
Technology Services | | | 4.5 | % | |
Technology Hardware | | | 4.3 | % | |
Medical Equipment & Devices | | | 4.1 | % | |
Banking | | | 4.1 | % | |
Leisure Facilities & Services | | | 3.4 | % | |
Semiconductors | | | 3.4 | % | |
Machinery | | | 2.3 | % | |
Institutional Financial Svcs | | | 2.0 | % | |
Transportation & Logistics | | | 1.9 | % | |
Food | | | 1.8 | % | |
Entertainment Content | | | 1.4 | % | |
Household Products | | | 0.5 | % | |
Total Common Stocks | | | 99.3 | % | |
Short-Term Investments | | | 0.8 | % | |
Total Investments | | | 100.1 | % | |
Liabilities in Excess of Other Assets | | | (0.1 | )% | |
Total Net Assets | | | 100.0 | % | |
See accompanying Notes to Financial Statements.
9
FPA QUEENS ROAD VALUE FUND
STATEMENT OF ASSETS AND LIABILITIES
As of November 30, 2023
(Unaudited)
ASSETS | |
Investments, at value (cost $11,187,485) | | $ | 34,748,647 | | |
Receivables: | |
Dividends and interest | | | 53,951 | | |
Due from Advisor | | | 815 | | |
Prepaid expenses | | | 6,879 | | |
Total assets | | | 34,810,292 | | |
LIABILITIES | |
Payables: | |
Fund services fees | | | 17,734 | | |
Sub-transfer agent fees | | | 8,495 | | |
Legal fees | | | 29,832 | | |
Registration fees | | | 23,725 | | |
Shareholder reporting fees | | | 22,578 | | |
Auditing fees | | | 2,688 | | |
Chief Compliance Officer fees | | | 1,700 | | |
Trustees' fees and expenses | | | 608 | | |
Accrued other expenses | | | 2,570 | | |
Total liabilities | | | 109,930 | | |
Commitments and contingencies (Note 3) | |
NET ASSETS | | $ | 34,700,362 | | |
COMPONENTS OF NET ASSETS | |
Capital Stock (no par value with an unlimited number of shares authorized) | | $ | 10,158,272 | | |
Total distributable earnings (accumulated deficit) | | | 24,542,090 | | |
NET ASSETS | | $ | 34,700,362 | | |
NUMBER OF SHARES ISSUED AND OUTSTANDING | | | 1,295,147 | | |
NET ASSET VALUE PER SHARE | | $ | 26.79 | | |
See accompanying Notes to Financial Statements.
10
FPA QUEENS ROAD VALUE FUND
STATEMENT OF OPERATIONS
For the Six Months Ended November 30, 2023
(Unaudited)
INVESTMENT INCOME | |
Dividends | | $ | 338,345 | | |
Interest | | | 8,579 | | |
Total investment income | | | 346,924 | | |
EXPENSES | |
Advisory fees | | | 159,089 | | |
Fund services fees | | | 24,179 | | |
Sub-transfer agent fees | | | 13,239 | | |
Registration fees | | | 24,295 | | |
Shareholder reporting fees | | | 17,362 | | |
Trustees' fees and expenses | | | 16,692 | | |
Legal fees | | | 13,597 | | |
Auditing fees | | | 9,178 | | |
Chief Compliance Officer fees | | | 5,045 | | |
Insurance fees | | | 3,704 | | |
Miscellaneous | | | 1,494 | | |
Total expenses | | | 287,874 | | |
Advisory fees waived | | | (159,089 | ) | |
Other expenses absorbed | | | (19,934 | ) | |
Net expenses | | | 108,851 | | |
Net investment income (loss) | | | 238,073 | | |
REALIZED AND UNREALIZED GAIN (LOSS) | |
Net realized gain (loss) on: | |
Investments | | | 549,821 | | |
Total realized gain (loss) | | | 549,821 | | |
Net change in unrealized appreciation (depreciation) on: | |
Investments | | | 3,065,439 | | |
Net change in unrealized appreciation (depreciation) | | | 3,065,439 | | |
Net realized and unrealized gain (loss) | | | 3,615,260 | | |
NET INCREASE (DECREASE) IN NET ASSETS FROM OPERATIONS | | $ | 3,853,333 | | |
See accompanying Notes to Financial Statements.
11
FPA QUEENS ROAD VALUE FUND
STATEMENTS OF CHANGES IN NET ASSETS
| | | For the
Six Months Ended
November 30, 2023
(Unaudited) | | For the
Year Ended
May 31, 2023 | |
INCREASE (DECREASE) IN NET ASSETS FROM | |
Operations: | |
Net investment income (loss) | | $ | 238,073 | | | $ | 487,795 | | |
Total realized gain (loss) on investments | | | 549,821 | | | | 110,157 | | |
Net change in unrealized appreciation (depreciation)
on investments | | | 3,065,439 | | | | (372,912 | ) | |
Net increase (decrease) in net assets resulting
from operations | | | 3,853,333 | | | | 225,040 | | |
Distributions to Shareholders: | |
Total distributions to shareholders | | | — | | | | (898,023 | ) | |
Capital Transactions: | |
Net proceeds from shares sold | | | 658,981 | | | | 1,004,574 | | |
Reinvestment of distributions | | | — | | | | 888,790 | | |
Cost of shares redeemed | | | (1,541,221 | ) | | | (3,826,471 | ) | |
Net increase (decrease) in net assets from capital
transactions | | | (882,240 | ) | | | (1,933,107 | ) | |
Total increase (decrease) in net assets | | | 2,971,093 | | | | (2,606,090 | ) | |
NET ASSETS | |
Beginning of period | | | 31,729,269 | | | | 34,335,359 | | |
End of period | | $ | 34,700,362 | | | $ | 31,729,269 | | |
CAPITAL SHARE TRANSACTIONS | |
Shares sold | | | 25,474 | | | | 42,795 | | |
Shares reinvested | | | — | | | | 37,328 | | |
Shares redeemed | | | (59,867 | ) | | | (159,297 | ) | |
Net increase (decrease) in capital share transactions | | | (34,393 | ) | | | (79,174 | ) | |
See accompanying Notes to Financial Statements.
12
FPA QUEENS ROAD VALUE FUND
FINANCIAL HIGHLIGHTS
For a Capital Share Outstanding Throughout Each Period.
| | | For the
Six
Months
Ended
November 30,
2023 | | For the Year Ended May 31, | |
| | | (Unaudited) | | 2023(1) | | 2022(1) | | 2021(1) | | 2020(2) | | 2019(2) | |
Per share operating performance: | |
Net asset value, beginning of period | | $ | 23.86 | | | $ | 24.37 | | | $ | 29.21 | | | $ | 22.45 | | | $ | 22.67 | | | $ | 22.79 | | |
Income from Investment Operations: | |
Net investment income(3) | | | 0.18 | | | | 0.36 | | | | 0.32 | | | | 0.39 | | | | 0.43 | | | | 0.35 | | |
Net realized and unrealized gain (loss) | | | 2.75 | | | | (0.20 | ) | | | (0.63 | ) | | | 7.99 | | | | 0.20 | | | | 0.94 | | |
Total from investment operations | | | 2.93 | | | | 0.16 | | | | (0.31 | ) | | | 8.38 | | | | 0.63 | | | | 1.29 | | |
Less Distributions: | |
From net investment income | | | — | | | | (0.36 | ) | | | (0.37 | ) | | | (0.48 | ) | | | (0.37 | ) | | | (0.34 | ) | |
From net realized gains | | | — | | | | (0.31 | ) | | | (4.16 | ) | | | (1.14 | ) | | | (0.48 | ) | | | (1.07 | ) | |
Total distributions | | | — | | | | (0.67 | ) | | | (4.53 | ) | | | (1.62 | ) | | | (0.85 | ) | | | (1.41 | ) | |
Net asset value, end of period | | $ | 26.79 | | | $ | 23.86 | | | $ | 24.37 | | | $ | 29.21 | | | $ | 22.45 | | | $ | 22.67 | | |
Per share market value at end of period | | | — | | | | — | | | | — | | | | — | | | | — | | | | — | | |
Total return(4) | | | 12.28 | %(5) | | | 0.65 | % | | | (2.19 | )% | | | 38.62 | % | | | 2.41 | % | | | 6.36 | % | |
Ratios and Supplemental Data: | |
Net assets, end of period (in thousands) | | $ | 34,700 | | | $ | 31,729 | | | $ | 34,335 | | | $ | 41,935 | | | $ | 34,580 | | | $ | 39,423 | | |
Ratio of expenses to average net assets: | |
Before fees waived and expenses absorbed | | | 1.72 | %(6) | | | 2.10 | % | | | 1.95 | % | | | 1.43 | % | | | 0.95 | % | | | 0.95 | % | |
After fees waived and expenses absorbed | | | 0.65 | %(6) | | | 0.65 | % | | | 0.65 | % | | | 0.77 | %(7) | | | 0.95 | % | | | 0.95 | % | |
Ratio of net investment income (loss) to
average net assets: | |
Before fees waived and expenses absorbed | | | 0.35 | %(6) | | | 0.04 | % | | | (0.18 | )% | | | 0.89 | % | | | 1.84 | % | | | 1.52 | % | |
After fees waived and expenses absorbed | | | 1.42 | %(6) | | | 1.49 | % | | | 1.12 | % | | | 1.55 | % | | | 1.84 | % | | | 1.52 | % | |
Portfolio turnover rate | | | 0 | %(5) | | | 0 | % | | | 4 | % | | | 0 | % | | | 1 | % | | | 1 | % | |
(1) Audits performed for the fiscal years indicated by the Fund's previous auditor, Ernst & Young LLP.
(2) Audits performed for the fiscal years indicated by the Fund's previous auditor, Cohen & Company, Ltd.
(3) Based on average shares outstanding for the period.
(4) Total returns would have been higher/lower had expenses not been recovered/waived and absorbed by the Advisor. Returns shown do not reflect the deduction of taxes that a shareholder would pay on Fund distributions or the redemption of Fund shares.
(5) Not annualized.
(6) Annualized.
(7) Effective November 1, 2020, the Advisor contractually agreed to limit the annual fund operating expenses to 0.65%. Prior to November 1, 2020, the Fund had a unitary fee structure that limited annual operating expenses to 0.95%.
See accompanying Notes to Financial Statements.
13
FPA QUEENS ROAD VALUE FUND
NOTES TO FINANCIAL STATEMENTS
November 30, 2023
(Unaudited)
NOTE 1 — Organization
FPA Queens Road Value Fund (the "Fund") is a diversified series of FPA Funds Trust (the "Trust") which is registered as an open-end management investment company under the Investment Company Act of 1940, as amended (the "1940 Act"). Effective January 10, 2024, the name of the Trust has been changed to Investment Managers Series Trust III. The Fund's primary investment objective is to seek long-term capital growth. First Pacific Advisors, LP (the "Adviser") has served as the Fund's investment adviser since November 1, 2020.
On July 28, 2023, the Fund acquired the assets and assumed the liabilities of FPA Queens Road Value Fund, a series of Bragg Capital Trust, (the "Predecessor Fund") in a tax-free reorganization pursuant to the Agreement and Plan of Reorganization (the "Plan of Reorganization"). The Plan of Reorganization was approved by the Trust's Board and by the Predecessor Fund's Board on May 8, 2023. The tax-free reorganization was accomplished on July 28, 2023. As a result of the reorganization, the Fund assumed the performance and accounting history of the Predecessor Fund. Financial information included for the dates prior to the reorganization is that of the Predecessor Fund.
The reorganization was accomplished by the following tax-free exchange in which each shareholder of the Fund received the same aggregate share net asset value as noted below:
| Shares Issued | | Net Assets | |
| 1,309,954 | | $ | 34,362,082 | | |
The net unrealized appreciation of investments transferred was $22,847,187 as of the date of the acquisition.
The Fund is an investment company and accordingly follows the investment company accounting and reporting guidance of the Financial Accounting Standards Board (FASB) Accounting Standard Codification Topic 946 "Financial Services — Investment Companies".
NOTE 2 — Accounting Policies
The following is a summary of the significant accounting policies consistently followed by the Fund in the preparation of its financial statements. The preparation of financial statements in conformity with accounting principles generally accepted in the United States of America ("GAAP") requires management to make estimates and assumptions that affect the reported amounts and disclosures in the financial statements. Actual results could differ from these estimates.
(a) Valuation of Investments
The Fund values equity securities at the last reported sale price on the principal exchange or in the principal over the counter ("OTC") market in which such securities are traded, as of the close of regular trading on the NYSE on the day the securities are being valued or, if the last-quoted sales price is not readily available, the securities will be valued at the last bid or the mean between the last available bid and ask price. Securities traded on the NASDAQ are valued at the NASDAQ Official Closing Price ("NOCP"). Investments in open-end investment companies are valued at the daily closing net asset value of the respective investment company. Debt securities are valued by utilizing a price supplied by independent pricing service providers. The independent pricing service providers may use various valuation methodologies including matrix pricing and other analytical pricing models as well as market transactions and dealer quotations. These models generally consider such factors as yields or prices of bonds of comparable quality, type of issue, coupon, maturity, ratings and general market conditions. If a price is not readily available for a portfolio security, the security will be valued at fair value (the amount which the Fund might reasonably expect to receive for the
14
FPA QUEENS ROAD VALUE FUND
NOTES TO FINANCIAL STATEMENTS (Continued)
(Unaudited)
security upon its current sale). The Board of Trustees has designated the Adviser as the Fund's valuation designee (the "Valuation Designee") to make all fair value determinations with respect to the Fund's portfolio investments, subject to the Board's oversight. As the Valuation Designee, the Adviser has adopted and implemented policies and procedures to be followed when the Fund must utilize fair value pricing. Securities for which representative market quotations are not readily available or are considered unreliable by the Adviser are valued as determined in good faith under procedures adopted by the authority of the Fund's Board of Directors. Various inputs may be reviewed in order to make a good faith determination of a security's value. These inputs include, but are not limited to, the type and cost of the security; contractual or legal restrictions on resale of the security; relevant financial or business developments of the issuer; actively traded similar or related securities; conversion or exchange rights on the security; related corporate actions; significant events occurring after the close of trading in the security; and changes in overall market conditions. Fair valuations and valuations of investments that are not actively trading involve judgment and may differ materially from valuations of investments that would have been used had greater market activity occurred.
(b) Investment Transactions, Investment Income and Expenses
Investment transactions are accounted for on the trade date. Realized gains and losses on investments are determined on the identified cost basis. Dividend income is recorded net of applicable withholding taxes on the ex-dividend date and interest income is recorded on an accrual basis. Withholding taxes on foreign dividends, if applicable, are paid (a portion of which may be reclaimable) or provided for in accordance with the applicable country's tax rules and rates and are disclosed in the Statement of Operations. Withholding tax reclaims are filed in certain countries to recover a portion of the amounts previously withheld. The Fund records a reclaim receivable based on a number of factors, including a jurisdiction's legal obligation to pay reclaims as well as payment history and market convention. Discounts on debt securities are accreted or amortized to interest income over the lives of the respective securities using the effective interest method. Premiums for callable debt securities are amortized to the earliest call date, if the call price was less than the purchase price. If the call price was not at par and the security was not called, the security is amortized to the next call price and date. Expenses incurred by the Trust with respect to more than one fund are allocated in proportion to the net assets of each fund except where allocation of direct expenses to each fund or an alternative allocation method can be more appropriately made.
(c) Federal Income Taxes
The Fund intends to comply with the requirements of Subchapter M of the Internal Revenue Code applicable to regulated investment companies and to distribute substantially all of their net investment income and any net realized gains to their shareholders. Therefore, no provision is made for federal income or excise taxes. Due to the timing of dividend distributions and the differences in accounting for income and realized gains and losses for financial statement and federal income tax purposes, the fiscal year in which amounts are distributed may differ from the year in which the income and realized gains and losses are recorded by the Fund.
Accounting for Uncertainty in Income Taxes (the "Income Tax Statement") requires an evaluation of tax positions taken (or expected to be taken) in the course of preparing a Fund's tax returns to determine whether these positions meet a "more-likely-than-not" standard that, based on the technical merits, have a more than fifty percent likelihood of being sustained by a taxing authority upon examination. A tax position that meets the "more-likely-than-not" recognition threshold is measured to determine the amount of benefit to recognize in the financial statements. The Fund recognizes interest and penalties, if any, related to unrecognized tax benefits as income tax expense in the Statement of Operations.
15
FPA QUEENS ROAD VALUE FUND
NOTES TO FINANCIAL STATEMENTS (Continued)
(Unaudited)
The Income Tax Statement requires management of the Fund to analyze tax positions taken in the prior three open tax years, if any, and tax positions expected to be taken in the Fund's current tax year, as defined by the IRS statute of limitations for all major jurisdictions, including federal tax authorities and certain state tax authorities. As of November 30, 2023, and during the prior three open tax years, the Fund did not have a liability for any unrecognized tax benefits. The Fund has no examinations in progress and is not aware of any tax positions for which it is reasonably possible that the total amounts of unrecognized tax benefits will significantly change in the next twelve months.
(d) Distributions to Shareholders
The Fund will make distributions of net investment income and net capital gains, if any, at least annually. Distributions to shareholders are recorded on the ex-dividend date. The amount and timing of distributions are determined in accordance with federal income tax regulations, which may differ from GAAP.
The character of distributions made during the year from net investment income or net realized gains may differ from the characterization for federal income tax purposes due to differences in the recognition of income, expense and gain (loss) items for financial statement and tax purposes.
(e) Illiquid Securities
Pursuant to Rule 22e-4 under the 1940 Act, the Fund has adopted a Liquidity Risk Management Program ("LRMP") that requires, among other things, that the Fund limits its illiquid investments that are assets to no more than 15% of net assets. An illiquid investment is any security which may not reasonably be expected to be sold or disposed of in current market conditions in seven calendar days or less without the sale or disposition significantly changing the market value of the investment. If the Adviser, at any time determines that the value of illiquid securities held by the Fund exceeds 15% of its net asset value, the Adviser will take such steps as it considers appropriate to reduce them as soon as reasonably practicable in accordance with the Fund's written LRMP.
(f) Use of Estimates
The presentation of financial statements in conformity with GAAP requires management to make estimates and assumptions that affect the reported amounts of assets and liabilities at the date of the financial statements and the reported amounts of income and expenses during the reporting period. Actual results could differ from those estimates.
NOTE 3 — Investment Advisory and Other Agreements
The Trust, on behalf of the Fund, entered into an Investment Advisory Agreement (the "Agreement") with the Adviser. Under the terms of the Agreement, the Fund pays a monthly investment advisory fee to the Adviser at the annual rate of 0.95% of the Fund's average daily net assets. The Adviser engages Bragg Financial Advisors, Inc. (the "Sub-Adviser") to manage the Fund and pays the Sub-Adviser from its advisory fees.
The Adviser has contractually agreed to waive its fees and/or pay for operating expenses of the Fund to ensure that total annual fund operating expenses (excluding any interest, taxes, brokerage fees and commissions payable by the Fund in connection with the purchase or sale of portfolio securities, fees and expenses of other funds in which the Fund invests, and extraordinary expenses, including litigation expenses not incurred in the Fund's ordinary course of business) do not exceed 0.65% of the average daily net assets. This agreement is in effect until July 27, 2024, and it may be terminated before that date only by the Trust's Board of Trustees. For the six months ended November 30, 2023, the Adviser waived advisory fees and reimbursed expenses totaling $179,023.
16
FPA QUEENS ROAD VALUE FUND
NOTES TO FINANCIAL STATEMENTS (Continued)
(Unaudited)
These expense reimbursements are subject to possible recoupment by the Adviser from the Fund in future years (within the three years from the date when the amount is waived or reimbursed) if such recoupment can be achieved within the lesser of the foregoing expense limits or the then-current expense limits. Similarly, the Adviser is permitted to seek reimbursement from the Fund, subject to certain limitations, of fees waived or payments made by the Adviser to the Predecessor Fund prior to the Predecessor Fund's reorganization on July 28, 2023 for a period ending three years after the date of the waiver or payment. The potential recoverable amount is noted as "Commitments and contingencies" as reported on the Statement of Assets and Liabilities. As of November 30, 2023, the Adviser may seek recoupment for previously waived or reimbursed expenses, subject to the limitations noted above, no later than the dates as outlined below:
May 31, 2024 | | $ | 249,095 | | |
May 31, 2025 | | | 511,891 | | |
May 31, 2026 | | | 474,577 | | |
May 31, 2027 | | | 179,023 | | |
Total | | $ | 1,414,586 | | |
UMB Fund Services, Inc. ("UMBFS") serves as the Fund's fund accountant, transfer agent and co-administrator; and Mutual Fund Administration, LLC ("MFAC") serves as the Fund's other co-administrator. UMB Bank, n.a., an affiliate of UMBFS, serves as the Fund's custodian. The Fund's allocated fees incurred for fund accounting, fund administration, transfer agency and custody services for the period from July 29, 2023 through November 30, 2023, were $16,759. The inclusion of such fees are reported on the Statement of Operations.
Prior to July 29, 2023, State Street Bank and Trust Company served as the Predecessor Fund's fund accountant, administrator and custodian. The Predecessor Fund's allocated fees incurred for fund accounting, fund administration and custody services for the period from June 1, 2023 to July 28, 2023, was $4,327. The inclusion of such fees are reported on the Statement of Operations.
UMB Distribution Services, LLC ("UMB Distribution Services"), a wholly owned subsidiary of UMBFS, serves as the Fund's distributor. The Adviser paid the fees for the Fund's distribution-related services.
Certain trustees and officers of the Trust are employees of UMBFS, MFAC or Adviser. The Fund does not compensate trustees and officers affiliated with the Fund's Adviser or co-administrators. For the period from July 29, 2023 through November 30, 2023, the Fund's allocated fees incurred to Trustees of the Trust who are not "interested persons" of the Trust, as that term is defined in the 1940 Act (collectively, the "Independent Trustees") were $5,639. The inclusion of such fees are reported on the Statement of Operations.
Prior to July 29, 2023, the Predecessor Fund's allocated fees incurred for Independent Trustees services for the period from June 1, 2023 to July 28, 2023, was $11,053. The inclusion of such fees are reported on the Statement of Operations.
Dziura Compliance Consulting, LLC provides Chief Compliance Officer ("CCO") services to the Trust. The Fund's allocated fees incurred for CCO services for the period from July 29, 2023 through November 30, 2023, were $2,572. The inclusion of such fees are reported on the Statement of Operations.
Prior to July 29, 2023, Ms. Karen Richards served as the Predecessor Fund's CCO services to the Trust. The Predecessor Fund's allocated fees incurred for CCO services for the period from June 1, 2023 to July 28, 2023, was $2,473. The inclusion of such fees are reported on the Statement of Operations.
17
FPA QUEENS ROAD VALUE FUND
NOTES TO FINANCIAL STATEMENTS (Continued)
(Unaudited)
NOTE 4 — Federal Income Taxes
At November 30, 2023, gross unrealized appreciation/(depreciation) of investments, based on cost for federal income tax purposes were as follows:
Cost of investments | | $ | 11,195,719 | | |
Gross unrealized appreciation | | $ | 23,552,928 | | |
Gross unrealized depreciation | | | — | | |
Net unrealized appreciation/(depreciation) | | $ | 23,552,928 | | |
The difference between cost amounts for financial statement and federal income tax purposes is due primarily to timing differences in recognizing certain gains and losses in security transactions.
NOTE 5 — Investment Transactions
For the six months ended November 30, 2023, purchases and sales of investments, excluding short-term investments, were $0 and $838,616, respectively.
NOTE 6 — Indemnifications
In the normal course of business, the Fund enters into contracts that contain a variety of representations which provide general indemnifications. The Fund's maximum exposure under these arrangements is unknown, as this would involve future claims that may be made against the Fund that have not yet occurred. However, the Fund expects the risk of loss to be remote.
NOTE 7 — Fair Value Measurements and Disclosure
Fair Value Measurements and Disclosures defines fair value, establishes a framework for measuring fair value in accordance with GAAP, and expands disclosure about fair value measurements. It also provides guidance on determining when there has been a significant decrease in the volume and level of activity for an asset or a liability, when a transaction is not orderly, and how that information must be incorporated into a fair value measurement.
Under Fair Value Measurements and Disclosures, various inputs are used in determining the value of the Fund's investments. These inputs are summarized into three broad Levels as described below:
• Level 1 — Unadjusted quoted prices in active markets for identical assets or liabilities that the Fund has the ability to access.
• Level 2 — Observable inputs other than quoted prices included in level 1 that are observable for the asset or liability, either directly or indirectly. These inputs may include quoted prices for the identical instrument on an inactive market, prices for similar instruments, interest rates, prepayment speeds, credit risk, yield curves, default rates and similar data.
• Level 3 — Unobservable inputs for the asset or liability, to the extent relevant observable inputs are not available, representing the Fund's own assumptions about the assumptions a market participant would use in valuing the asset or liability, and would be based on the best information available.
The availability of observable inputs can vary from security to security and is affected by a wide variety of factors, including, for example, the type of security, whether the security is new and not yet established in the marketplace, the liquidity of markets, and other characteristics particular to the security. To the extent that valuation is based on models or inputs that are less observable or unobservable in the market, the determination of fair value requires more judgment. Accordingly, the degree of judgment exercised in determining fair value is greatest for instruments categorized in Level 3.
18
FPA QUEENS ROAD VALUE FUND
NOTES TO FINANCIAL STATEMENTS (Continued)
(Unaudited)
The inputs used to measure fair value may fall into different Levels of the fair value hierarchy. In such cases, for disclosure purposes, the Level in the fair value hierarchy within which the fair value measurement falls in its entirety, is determined based on the lowest Level input that is significant to the fair value measurement in its entirety.
The inputs or methodology used for valuing securities are not an indication of the risk associated with investing in those securities. The following is a summary of the inputs used, as of November 30, 2023, in valuing the Fund's assets carried at fair value:
| | | Level 1 | | Level 2 | | Level 3 | | Total | |
Common Stocks* | | $ | 34,472,431 | | | | — | | | | — | | | $ | 34,472,431 | | |
Short-Term Investments | | | 276,216 | | | | — | | | | — | | | | 276,216 | | |
Total | | $ | 34,748,647 | | | | — | | | | — | | | $ | 34,748,647 | | |
* All sub-categories within Common Stocks represent Level 1 investments. See Schedule of Investments for industry categories.
Transfers of investments between different levels of the fair value hierarchy are recorded at fair value as of the end of the reporting period. There were no significant transfers into or out of Level 3 during the six months ended November 30, 2023.
The Fund did not hold derivatives as of November 30, 2023.
NOTE 8 — Market Disruption and Geopolitical Risks
Certain local, regional or global events such as war, acts of terrorism, the spread of infectious illness or other public health issues, or other events could have a significant impact on a security or instrument. Since 2020, the novel strain of coronavirus (COVID-19) has negatively affected the worldwide economy, as well as the economies of individual countries, the financial health of individual companies and the market in general in significant and unforeseen ways. Following Russia's large-scale invasion of Ukraine, the President of the United States signed an Executive Order in February 2022 prohibiting U.S. persons from entering transactions with the Central Bank of Russia and Executive Orders in March 2022 prohibiting U.S. persons from importing oil and gas from Russia as well as other popular Russian exports, such as diamonds, seafood and vodka. There may also be restrictions on investments in Chinese companies. For example, the President of the United States of America signed an Executive Order in June 2021 affirming and expanding the U.S. policy prohibiting U.S. persons from purchasing or investing in publicly-traded securities of companies identified by the U.S. Government as "Chinese Military-Industrial Complex Companies." The list of such companies can change from time to time, and as a result of forced selling or an inability to participate in an investment the Adviser otherwise believes is attractive, the Fund may incur losses. The duration of the coronavirus outbreak and the Russian-Ukraine conflict could adversely affect the Fund's performance, the performance of the securities in which the Fund invests and may lead to losses on your investment. The ultimate impact of COVID-19 and Russia Invasion on the financial performance of the Fund's investments is not reasonably estimable at this time. Management is actively monitoring these events.
NOTE 9 — New Accounting Pronouncements
Effective January 24, 2023, the Securities and Exchange Commission (the "SEC") adopted rule and form amendments to require mutual funds and exchange-traded funds ("ETFs") to transmit concise and visually engaging streamlined annual and semiannual reports to shareholders that highlight key information deemed important for retail investors to assess and monitor their fund investments. Certain information, including financial
19
FPA QUEENS ROAD VALUE FUND
NOTES TO FINANCIAL STATEMENTS (Continued)
(Unaudited)
statements, will no longer appear in the funds' streamlined shareholder reports but must be available online, delivered free of charge upon request, and filed on a semiannual basis on Form N-CSR. The rule and form amendments have a compliance date of July 24, 2024. At this time, management is evaluating the impact of these rule and form amendment changes on the content of the current shareholder report and the newly created annual and semiannual streamlined shareholder reports.
NOTE 10 — Events Subsequent to the Fiscal Period End
The Fund has adopted financial reporting rules regarding subsequent events which require an entity to recognize in the financial statements the effects of all subsequent events that provide additional evidence about conditions that existed at the date of the balance sheet. Management has evaluated the Fund's related events and transactions that occurred through the date of issuance of the Fund's financial statements.
There were no events or transactions that occurred during this period that materially impacted the amounts or disclosures in the Fund's financial statements.
20
FPA QUEENS ROAD VALUE FUND
BOARD CONSIDERATION OF INVESTMENT ADVISORY AND SUB-ADVISORY AGREEMENTS
(Unaudited)
At an in-person meeting held on August 14, 2023, the Board of Trustees (the "Board") of Investment Managers Series Trust III (the "Trust"), including the trustees who are not "interested persons" of the Trust (the "Independent Trustees") as defined in the Investment Company Act of 1940, as amended (the "1940 Act"), reviewed and unanimously approved the renewal of the investment advisory agreement (the "Advisory Agreement") between the Trust and First Pacific Advisors, LP (the "Advisor"), and the sub-advisory agreement (the "Sub-Advisory Agreement") among the Trust, the Advisor, and Bragg Financial Advisors, Inc. (the "Sub-Advisor"), with respect to the FPA Queens Road Value Fund series of the Trust (the "Fund") for additional one-year terms from when they otherwise would expire. The Advisory Agreement and the Sub-Advisory Agreement are referred to below as the "Fund Advisory Agreements." In approving renewal of each Fund Advisory Agreement, the Board, including the Independent Trustees, determined that such renewal was in the best interests of the Fund and its shareholders.
Background
In advance of the meeting, the Board received information about the Fund and the Fund Advisory Agreements from the Advisor, the Sub-Advisor, and Mutual Fund Administration, LLC and UMB Fund Services, Inc., the Trust's co-administrators, certain portions of which are discussed below. The materials, among other things, included information about the organization and financial condition of the Advisor and the Sub-Advisor; information regarding the background, experience, and compensation structure of relevant personnel providing services to the Fund; information about the Advisor's and the Sub-Advisor's compliance policies and procedures, disaster recovery and contingency planning, and policies with respect to portfolio execution and trading; information regarding the profitability of the Advisor's overall relationship with the Fund; reports comparing the performance of the Fund with returns of the S&P 500 Value Index and a group of comparable funds (the "Peer Group") selected by Broadridge Financial Solutions, Inc. ("Broadridge") from Morningstar, Inc.'s Large Value category (the "Fund Universe") for the one-, three-, five-, and ten-year periods ended May 31, 2023; reports comparing the investment advisory fee and total expenses of the Fund with those of the Peer Group and Fund Universe; and the advisory and sub-advisory fees paid pursuant to the Advisory Agreement and Sub-Advisory Agreement, respectively. The Board also received a memorandum from legal counsel to the Trust and the Independent Trustees discussing the legal standards under the 1940 Act and other applicable law for their consideration of the proposed renewal of the Fund Advisory Agreements. In addition, the Board considered information reviewed by the Board during the year at other Board and Board committee meetings.
In renewing the Fund Advisory Agreements, the Independent Trustees met separately in an executive session prior to the meeting with the Board to consider the Fund Advisory Agreements, including the items discussed below, and were represented by their legal counsel with respect to the matters considered. The Board, including all of the Independent Trustees, then met and also considered a variety of factors for renewal of the Fund Advisory Agreements, including those discussed below. In their deliberations, the Board and the Independent Trustees did not identify any particular factor that was controlling, and each Trustee may have attributed different weights to the various factors.
First Pacific Advisors, LP
Nature, Extent, and Quality of Services
The Board and the Independent Trustees considered information provided by the Advisor in response to their requests, as well as information provided throughout the year regarding: the Advisor and its staffing in
21
FPA QUEENS ROAD VALUE FUND
BOARD CONSIDERATION OF INVESTMENT ADVISORY AND SUB-ADVISORY AGREEMENTS (Continued)
(Unaudited)
connection with the Fund, including the investment professionals who monitor and oversee the Sub-Advisor and portfolio manager; the scope of services supervised and provided by the Advisor; and the absence of any significant service problems reported to the Board. After discussion, the Board concluded that the nature, extent, and quality of services provided by the Advisor have benefited and should continue to benefit the Fund and its shareholders.
Investment Performance
The Board and the Independent Trustees reviewed the overall investment performance of the Fund. The Trustees also received information from an independent consultant, Broadridge, regarding the Fund's performance relative to its comparative index, the Peer Group and the Fund Universe. The Board and the Independent Trustees noted the Fund's long-term investment performance when compared to the Peer Group and concluded that the Fund's investment performance has been strong. The Board noted that for the five-year period, the Fund's annualized total return outperformed the Peer Group and Fund Universe median returns, but underperformed the S&P 500 Value Index return by 0.85%. For the one-year period, the Board considered that the Fund's total return outperformed the Peer Group and Fund Universe median returns, but underperformed the S&P 500 Value Index return by 1.71%. The Board noted that for the ten-year period, the Fund's annualized total return outperformed the Fund Universe median return and was the same as the Peer Group median return, but underperformed the S&P 500 Value Index return by 0.63%. The Board observed that for the three-year period, the Fund's annualized total return underperformed the Peer Group median return, the Fund Universe median return, and the S&P 500 Value Index return by 0.87%, 2.28%, and 2.71%, respectively. In considering the Fund's performance, the Trustees considered that the Advisor generally expected its funds to underperform in up markets and outperform in down markets, and that the Advisor focuses on full market cycles, rather than short-term performance, in evaluating its funds' performance. The Trustees also observed that the Fund's volatility of returns, as measured by its standard deviation; its risk-adjusted returns, as measured by its Sharpe ratio; and its downside volatility, as measured by its Morningstar risk score, ranked it in the first or second quartile of the funds (which are the most favorable) in the Peer Group for the five- and ten-year periods. The Board and the Independent Trustees concluded that the Advisor's continued oversight of the management of the Fund's investments should benefit the Fund and its shareholders.
Advisory Fee and Fund Expenses; Comparison with Peer Group and Institutional Fees
The Board and the Independent Trustees considered information provided by the Advisor regarding the Fund's advisory fee and total expense levels. The Board and the Independent Trustees reviewed comparative information regarding fees and expenses for the Peer Group and Fund Universe. The Board and the Independent Trustees noted that at the Fund's current asset level, the annual investment advisory fee was higher than the Peer Group and Fund Universe medians by 0.30% and 0.325%, respectively. The Board also noted that the Fund's net expense ratio was lower than the Peer Group and Fund Universe medians. The Trustees considered that the Advisor does not manage any other accounts with the same objectives and policies as the Fund, and therefore they did not have a good basis for comparing the Fund's advisory fee with those of other similar client accounts of the Advisor. The Board also noted that the Fund's advisory fee was within the range of advisory fees paid by other series of the Trust managed by the Advisor. The Board and the Independent Trustees concluded that the continued payment of the advisory fee by the Fund to the Advisor was fair and reasonable and should continue to benefit the Fund and its shareholders.
22
FPA QUEENS ROAD VALUE FUND
BOARD CONSIDERATION OF INVESTMENT ADVISORY AND SUB-ADVISORY AGREEMENTS (Continued)
(Unaudited)
Advisor Profitability and Costs
The Board and the Independent Trustees considered information provided by the Advisor regarding the Advisor's costs in providing services to the Fund, the profitability of the Advisor and the benefits to the Advisor from its relationship to the Fund. They reviewed and considered the Advisor's representations regarding its assumptions and methods of allocating certain costs, such as personnel costs, which constitute the Advisor's largest operating cost, and overhead costs with respect to the provision of investment advisory services. The Independent Trustees discussed with the Advisor the general process through which individuals' compensation is determined and then reviewed by the management committee of the Advisor, as well as the Advisor's methods for determining that its compensation levels are set at appropriate levels to attract and retain the personnel necessary to provide high quality professional investment advice. In evaluating the Advisor's profitability, they excluded certain distribution and marketing-related expenses. The Board and the Independent Trustees recognized that the Advisor is entitled under the law to earn a reasonable level of profits for the services that it provides to the Fund. The Board observed, however, that the Advisor reimbursed certain of the Fund's operating expenses and did not realize a profit with respect to the Fund.
Economies of Scale
The Board and the Independent Trustees considered whether there have been economies of scale with respect to the management of the Fund, whether the Fund has appropriately benefited from any economies of scale, and whether the advisory fee rate is reasonable in relation to the Fund's asset levels and any economies of scale that may exist. The Board and the Independent Trustees considered the Advisor's representation that its internal costs of providing investment management services to the Fund have significantly increased in recent years as a result of a number of factors, including the Advisor's substantial investments in additional professional resources and staffing. The Board and the Independent Trustees considered both quantitative and qualitative information regarding the Advisor's representation that it has also made significant investments in: (1) new compliance, operations, and administrative personnel; (2) information technology and portfolio accounting trading systems; and (3) office space, each of which enhances the quality of services provided to the Fund.
The Board and the Independent Trustees recognized that the advisory fee schedule for the Fund does not have breakpoints. They considered that many registered funds have breakpoints in the advisory fee structure as a means by which to share in the benefits of potential economies of scale as a fund's assets grow. They also considered that not all funds have breakpoints in their fee structures and that breakpoints are not the exclusive means of sharing potential economies of scale. The Board and the Independent Trustees considered the Advisor's statement that it believes that breakpoints are currently not warranted for the Fund given the ongoing additional investments the Advisor is making in its business for the benefit of the Fund, uncertainties regarding the direction of the economy, and uncertainties regarding future growth or contraction in the Fund's assets, all of which could negatively impact the profitability of the Advisor. The Board and the Independent Trustees also noted that the Advisor has contractually agreed to reimburse the Fund for operating expenses in excess of 0.65% of the average net assets of the Fund. The Board concluded that the Fund is benefitting from the ongoing investments made by the Advisor in its team of personnel serving the Fund and in the Advisor's service infrastructure, and that in light of these investments, the addition of breakpoints to the Fund's advisory fee structure was not warranted at current asset levels.
23
FPA QUEENS ROAD VALUE FUND
BOARD CONSIDERATION OF INVESTMENT ADVISORY AND SUB-ADVISORY AGREEMENTS (Continued)
(Unaudited)
Ancillary Benefits to the Advisor
The Board and the Independent Trustees considered other "fall out" benefits to the Advisor as a result of its relationship with the Fund, other than the advisory fee, including the beneficial effects from the review by the Trust's Chief Compliance Officer of the Advisor's compliance program, the intangible benefits of its association with the Fund generally, and any favorable publicity arising in connection with the Fund's performance. They noted that the Advisor does not have any affiliates that benefit from the Advisor's relationship to the Fund.
Conclusions
The Board and the Independent Trustees determined that the Fund continues to benefit from the services of the Advisor's highly experienced portfolio management team. In addition, the Board and the Independent Trustees agreed that the Fund continues to receive high quality services from the Advisor. The Board and the Independent Trustees concluded that the current advisory fee rate is reasonable and fair to the Fund and its shareholders in light of the nature and quality of the services provided by the Advisor and the Advisor's profitability and costs. On the basis of the foregoing, and without assigning particular weight to any single factor, none of which was dispositive, the Board concluded that it would be in the best interests of the Fund to continue to be advised and managed by the Advisor and determined to approve the renewal of the current Advisory Agreement for another one-year period through September 30, 2024.
Bragg Financial Advisors, Inc.
Nature, Extent, and Quality of Services
The Board and the Independent Trustees considered information provided by the Sub-Advisor in response to their requests, as well as information provided throughout the year regarding: the Sub-Advisor and its staffing in connection with the Fund, including the Sub-Advisor's portfolio manager and analyst; the scope of services provided by the Sub-Advisor; and the absence of any significant service problems reported to the Board. After discussion, the Board concluded that the nature, extent, and quality of services provided by the Sub-Advisor have benefited and should continue to benefit the Fund and its shareholders.
Investment Performance
The Board and the Independent Trustees noted that as the sole sub-advisor to the Fund, the Sub-Advisor is primarily responsible for the day-to-day management of the Fund and its investment performance, which the Board had discussed when considering the Advisory Agreement.
Sub-Advisory Fee
The Board and the Independent Trustees considered information provided by the Sub-Advisor regarding the Fund's sub-advisory fee. The Board and the Independent Trustees noted that the Fund's sub-advisory fee was within the range of the advisory fees that the Sub-Advisor charges to manage separate accounts using similar strategies as the Fund, and within the range of the sub-advisory fee that the Sub-Advisor charges with respect to the FPA Queens Road Small Cap Value Fund, another series of the Trust. The Board observed that the Advisor pays the Sub-Advisor's sub-advisory fee out of the Advisor's advisory fee, and considered the relative levels and types of services provided by the Advisor and the Sub-Advisor.
24
FPA QUEENS ROAD VALUE FUND
BOARD CONSIDERATION OF INVESTMENT ADVISORY AND SUB-ADVISORY AGREEMENTS (Continued)
(Unaudited)
Ancillary Benefits to the Sub-Advisor
The Board and the Independent Trustees considered other "fall out" benefits to the Sub-Advisor as a result of its relationship with the Fund, other than the sub-advisory fee, including research services provided to it by broker-dealers providing execution services to the Fund, the beneficial effects from the review by the Trust's Chief Compliance Officer of the Sub-Advisor's compliance program, the intangible benefits of its association with the Fund generally, and any favorable publicity arising in connection with the Fund's performance. They noted that the Sub-Advisor does not have any affiliates that benefit from the Sub-Advisor's relationship to the Fund.
Conclusions
The Board and the Independent Trustees determined that the Fund continues to benefit from the services of the Sub-Advisor's experienced portfolio management team. In addition, the Board and the Independent Trustees agreed that the Fund continues to receive high quality services from the Sub-Advisor. The Board and the Independent Trustees concluded that the current sub-advisory fee rate is reasonable and fair in light of the nature and quality of the services provided by the Sub-Advisor. On the basis of the foregoing, and without assigning particular weight to any single factor, none of which was dispositive, the Board concluded that it would be in the best interests of the Fund to continue to be sub-advised by the Sub-Advisor and determined to approve the renewal of the current Sub-Advisory Agreement for another one-year period through September 30, 2024.
25
FPA QUEENS ROAD VALUE FUND
LIQUIDITY RISK MANAGEMENT PROGRAM
(Unaudited)
Statement Regarding Liquidity Risk Management Program
In compliance with SEC Rule 22e-4 under the U.S. Investment Company Act of 1940 (the "Liquidity Rule"), the Fund has adopted and implemented a written liquidity risk management program (the "Program"). The Fund's Board of Trustees have also designated the Adviser to serve as the administrator of the Program.
The Liquidity Rule requires that the Program be reasonably designed to assess and manage the Fund's liquidity risk. A Fund's "liquidity risk" is the risk that the Fund could not meet requests to redeem shares issued by the Fund without significant dilution of the remaining investors' interests in the Fund. The Program includes a number of elements that support the assessment, management and review of liquidity risk. In accordance with the Program, the Fund's liquidity risk is assessed no less frequently than annually taking into consideration a variety of factors, including, as applicable, the Fund's investment strategy and liquidity of portfolio investments, cash flow projections, and holdings of cash and cash equivalents, as well as borrowing arrangements and other funding sources. Certain factors are considered under both normal and reasonably foreseeable stressed conditions. There is no guarantee that the Program will achieve its objective under all circumstances.
Under the Program, each Fund portfolio investment is classified into one of four liquidity categories based on a determination of the number of days it is reasonably expected to take to convert the investment to cash, or sell or dispose of the investment, in current market conditions without significantly changing the investment's market value. The Program is reasonably designed to meet Liquidity Rule requirements relating to "highly liquid investment minimums" (i.e., the minimum amount of Fund net assets to be invested in highly liquid investments that are assets) and to monitor compliance with the Liquidity Rule's limitations on a Fund's investments in illiquid investments. Under the Liquidity Rule, a Fund is prohibited from acquiring any illiquid investment if, immediately after the acquisition, the Fund would have invested more than 15% of its net assets in illiquid investments that are assets.
During the period covered by this shareholder report, the Fund's Board of Trustees received reports prepared by the Adviser addressing the Program's operation and assessing the adequacy and effectiveness of its implementation for the period from October 1, 2022 to June 30, 2023. The reports concluded that the Program operated effectively, the Program had been and continued to be reasonably designed to assess and manage the Fund's liquidity risk, and the Program has been adequately and effectively implemented to monitor and respond to the Fund's liquidity developments, as applicable.
26
FPA QUEENS ROAD VALUE FUND
EXPENSE EXAMPLE
For the Six Months Ended November 30, 2023 (Unaudited)
Expense Example
As a shareholder of the Fund, you incur two types of costs: (1) transaction costs, and (2) ongoing costs, including management fees and other Fund expenses. The examples below are intended to help you understand your ongoing costs (in dollars) of investing in the Fund and to compare these costs with the ongoing costs of investing in other mutual funds.
These examples are based on an investment of $1,000 invested at the beginning of the period and held for the entire period from June 1, 2023 to November 30, 2023.
Actual Expenses
The information in the row titled "Actual Performance" of the table below provides actual account values and actual expenses. You may use the information in these columns, together with the amount you invested, to estimate the expenses that you paid over the period. Simply divide your account value by $1,000 (for example, an $8,600 account value divided by $1,000 = 8.6), then multiply the result by the number in the appropriate row under the column titled "Expenses Paid During Period" to estimate the expenses you paid on your account during this period.
Hypothetical Example for Comparison Purposes
The information in the row titled "Hypothetical (5% annual return before expenses)" of the table below provides hypothetical account values and hypothetical expenses based on the Fund's actual expense ratios and an assumed rate of return of 5% per year before expenses, which is not the Fund's actual return. The hypothetical account values and expenses may not be used to estimate the actual ending account balance or expenses you paid for the period. You may use this information to compare the ongoing costs of investing in the Fund and other funds. To do so, compare these 5% hypothetical examples with the 5% hypothetical examples that appear in the shareholder reports of the other funds.
Please note that the expenses shown in the table are meant to highlight your ongoing costs only and do not reflect any transaction costs, such as sales charges (load) or contingent deferred sales charges. Therefore, the information in the row titled "Hypothetical (5% annual return before expenses)" is useful in comparing ongoing costs only, and will not help you determine the relative total costs of owning different funds. In addition, if these transactional costs were included, your costs would have been higher.
| | | Actual Performance | | Hypothetical (5% annual
return before expenses) | |
Beginning Account Value 6/1/23 | | $ | 1,000.00 | | | $ | 1,000.00 | | |
Ending Account Value 11/30/23 | | $ | 1,122.80 | | | $ | 1,021.82 | | |
Expenses Paid During Period* 6/1/23-11/30/23 | | $ | 3.45 | | | $ | 3.28 | | |
* Expenses are equal to the Fund's annualized expense ratio of 0.65%, multiplied by the average account value over the period, multiplied by 183/366 (to reflect the six month period). The expense ratios reflect an expense waiver. Assumes all dividends and distributions were reinvested.
27
FPA QUEENS ROAD VALUE FUND
(Unaudited)
INVESTMENT ADVISER
First Pacific Advisors, LP
11601 Wilshire Boulevard, Suite 1200
Los Angeles, CA 90025
INVESTMENT SUB-ADVISER
Bragg Financial Advisors, Inc.
1031 Caldwell Street, Suite 200
Charlotte, NC 28203
FUND CO-ADMINISTRATOR, TRANSFER AGENT AND FUND ACCOUNTANT
UMB Fund Services, Inc.
P.O. Box 2175
Milwaukee, WI 53201-2175
or
235 West Galena Street
Milwaukee, WI 53212-3948
(800) 638-3060
TICKER SYMBOL: QRVLX
CUSIP: 30254T593
CUSTODIAN
UMB Bank, n.a.,
928 Grand Boulevard
Kansas City, Missouri 64106
DISTRIBUTOR
UMB Distribution Services, LLC
235 West Galena Street
Milwaukee, Wisconsin 53212-3948
LEGAL COUNSEL
Morgan, Lewis & Bockius LLP
600 Anton Boulevard, Suite 1800
Costa Mesa, California 92626
INDEPENDENT REGISTERED PUBLIC ACCOUNTING FIRM
Tait, Weller & Baker LLP
Two Liberty Place
50 South 16th Street, Suite 2900
Philadelphia, Pennsylvania 19102
CO-ADMINISTRATOR
Mutual Fund Administration, LLC
2220 E. Route 66, Suite 226
Glendora, California 91740
This report has been prepared for the information of shareholders of FPA QUEENS ROAD VALUE FUND, and is not authorized for distribution to prospective investors unless preceded or accompanied by an effective prospectus.
A description of the policies and procedures that the Adviser uses to vote proxies related to the Fund's portfolio securities is set forth in the Fund's Statement of Additional Information which is available without charge, upon request, on the Fund's website at www.fpa.com or by calling (800) 982-4372 and on the Securities and Exchange Commission's website at www.sec.gov.
The Fund's complete proxy voting record for the 12 months ended June 30, 2023 is available without charge, upon request by calling (800) 982-4372 and on the SEC's website at www.sec.gov.
The Fund's schedule of portfolio holdings, filed the first and third quarter of the Fund's fiscal year on Form N-PORT with the SEC, is available on the SEC's website at www.sec.gov.
Additional information about the Fund is available online at www.fpa.com. This information includes, among other things, holdings, top sectors, and performance, and is updated on or about the 15th business day after the end of each quarter.
Item 2. Code of Ethics.
The Registrant has adopted a code of ethics that applies to the Registrant's principal executive officer and principal financial officer. The Registrant has not made any amendments to its code of ethics during the period covered by this report. The Registrant has not granted any waivers from any provisions of the code of ethics during the period covered by this report.
Item 3. Audit Committee Financial Expert.
The Board of Trustees of the Registrant has determined that Sandra Brown, who is a member of the Registrant’s Audit Committee and Board of Trustees, is an “audit committee financial expert” and is “independent” as those terms are defined in this Item.
Item 4. Principal Accountant Fees and Services.
Not applicable.
Item 5. Audit Committee of Listed Registrants.
Not applicable.
Item 6. Investments.
| (a) | Schedule of Investments is included as a part of the report to shareholders filed under Item 1 of this Form N-CSR. |
Item 7. Disclosure of Proxy Voting Policies and Procedures for Closed-End Management Investment Companies.
Not applicable.
Item 8. Portfolio Managers of Closed-End Management Investment Companies.
Not applicable.
Item 9. Purchases of Equity Securities by Closed-End Management Investment Company and Affiliated Purchasers.
Not applicable.
Item 10. Submission of Matters to a Vote of Security Holders.
There have been no material changes to the procedures by which the shareholders may recommend nominees to the registrant’s board of directors.
Item 11. Controls and Procedures.
| (a) | The principal executive officer and principal financial officer of the registrant have concluded that the registrant’s disclosure controls and procedures (as defined in Rule 30a-3(c) under the Investment Company Act of 1940) are effective based on their evaluation of the disclosure controls and procedures as of a date within 90 days of the filing date of this report. |
| (b) | There have been no significant changes in the registrant’s internal controls over financial reporting (as defined in Rule 30a-3(d) under the Investment Company Act of 1940) that occurred during the period covered by this report that have materially affected, or is reasonably likely to materially affect, the registrant’s internal controls over financial reporting. |
Item 12. Disclosure of Securities Lending Activities for Closed-End Management Investment Companies
Not applicable.
Item 13. Exhibits.
SIGNATURES
Pursuant to the requirements of the Securities Exchange Act of 1934 and the Investment Company Act of 1940, the registrant has duly caused this report to be signed on its behalf by the undersigned, thereunto duly authorized.
Investment Managers Series Trust III
| By: | /s/ Maureen A. Quill | |
| | Maureen A. Quill | |
| | President (principal executive officer) | |
| | |
| Date: | February 5, 2024 | |
Pursuant to the requirements of the Securities Exchange Act of 1934 and the Investment Company Act of 1940, this report has been signed below by the following persons on behalf of the registrant and in the capacities and on the dates indicated.
| By: | /s/ Maureen A. Quill | |
| | Maureen A. Quill | |
| | President (principal executive officer) | |
| | | |
| Date: | February 5, 2024 | |
| | |
| By: | /s/ Rita Dam | |
| | Rita Dam | |
| | Treasurer (principal financial officer) | |
| | |
| Date: | February 5, 2024 | |