UNITED STATES
SECURITIES AND EXCHANGE COMMISSION
Washington, D.C. 20549
FORM N-CSR
CERTIFIED SHAREHOLDER REPORT OF REGISTERED
MANAGEMENT INVESTMENT COMPANIES
Investment Company Act File Number 811-01597
Steward Funds, Inc.
(Exact name of registrant as specified in charter)
15375 Memorial Drive
Suite 200
Houston, Texas 77079
(Address of principal executive offices) (Zip code)
John Marten
Vedder Price P.C.
222 North LaSalle Street
Chicago, Illinois 60601
(Name and address of agent for service)
Registrant’s telephone number, including area code: (800) 262-6631
Date of fiscal year end: April 30
Date of reporting period: April 30, 2021
Item 1. Reports to Stockholders.
| (a) | The following is a copy of the report transmitted to shareholders pursuant to Rule 30e-1 under the Investment Company Act of 1940 (the “Act”) (17 CFR 270.30e-1): |
1

CROSSMARKGLOBAL.COM April 30, 2021 STEWARD FUNDS ANNUAL REPORT


| 15375 Memorial Drive, Suite 200, Houston, TX 77079 800-262-6631 | crossmarkglobal.com/stewardfund s |


| |
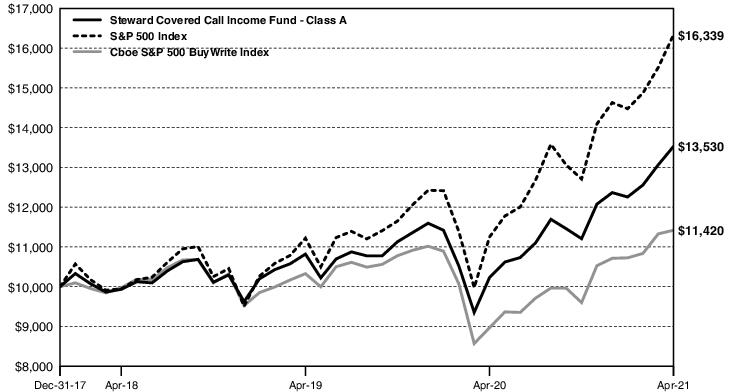
| One Year | Since Inception**** | Expense Ratio‡ | |||
Steward Covered Call Income Fund — Class A | 32.27% | 9.40% | 1.25% | ||
S&P 500 Index | 45.98% | 16.60% | N/A | ||
Cboe S&P 500 BuyWrite Index | 27.36% | 4.15% | N/A |
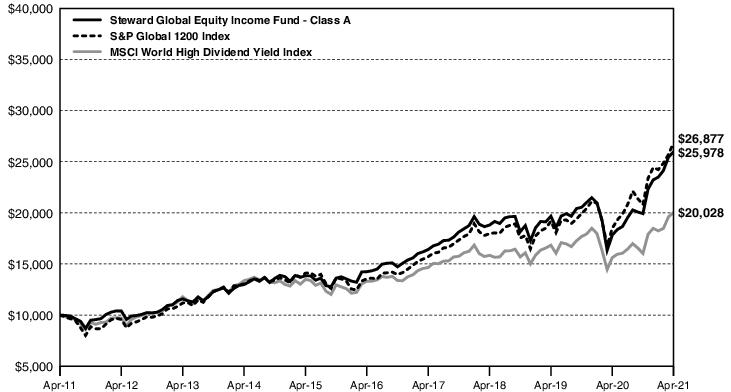
| One Year | Five Year | Ten Year | Expense Ratio‡ | ||||
Steward Global Equity Income Fund — Class A | 45.81% | 12.77% | 10.02% | 1.29% | |||
S&P Global 1200 Index | 45.42% | 14.68% | 10.39% | N/A | |||
MSCI World High Dividend Yield Index | 28.21% | 8.51% | 7.19% | N/A |
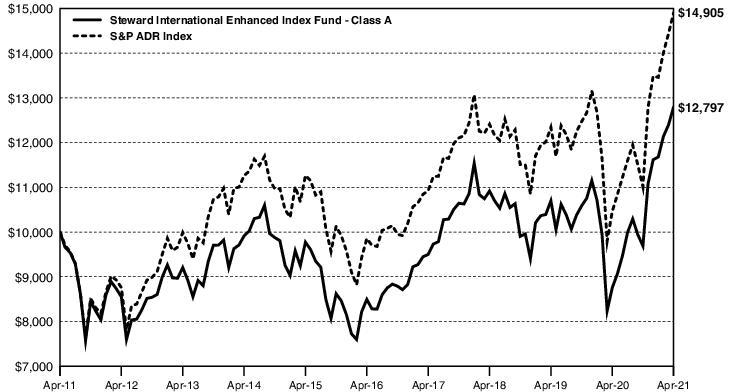
| One Year | Five Year | Ten Year | Expense Ratio‡ | ||||
Steward International Enhanced Index Fund — Class A | 46.20% | 8.55% | 2.50% | 1.07% | |||
S&P ADR Index | 42.56% | 8.63% | 4.07% | N/A |
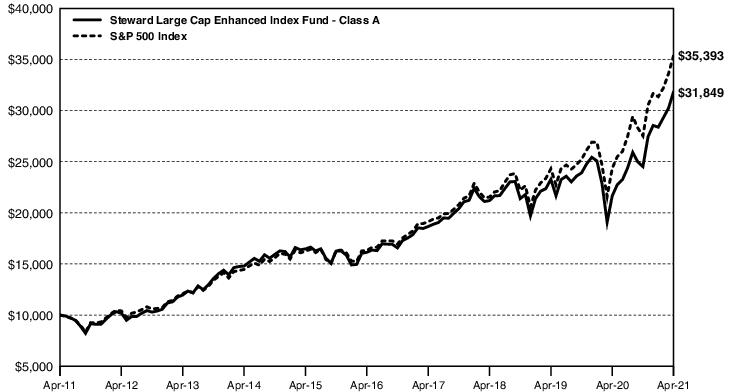
| One Year | Five Year | Ten Year | Expense Ratio‡ | ||||
Steward Large Cap Enhanced Index Fund — Class A | 47.01% | 14.57% | 12.28% | 0.85% | |||
S&P 500 Index | 45.98% | 17.42% | 14.17% | N/A |

| One Year | Five Year | Ten Year | Expense Ratio‡ | ||||
Steward Select Bond Fund — Class A | 0.04% | 1.82% | 1.90% | 1.00% | |||
Bloomberg Barclays Capital U.S. Government/Credit Bond Index | -0.46% | 3.45% | 3.66% | N/A |

| One Year | Five Year | Ten Year | Expense Ratio‡ | ||||
Steward Small-Mid Cap Enhanced Index Fund — Class A | 72.56% | 13.10% | 10.79% | 0.82% | |||
S&P 1000 Index | 70.49% | 15.31% | 12.36% | N/A |
| Industry Diversification | Percent* | |
| Software | 7.6% | |
| IT Services | 7.0 | |
| Semiconductors & Semiconductor Equipment | 6.8 | |
| Interactive Media & Services | 6.7 | |
| Banks | 5.9 | |
| Technology Hardware, Storage & Peripherals | 4.7 | |
| Health Care Equipment & Supplies | 4.2 | |
| Hotels, Restaurants & Leisure | 3.8 | |
| Internet & Direct Marketing Retail | 3.8 | |
| Electric Utilities | 3.0 | |
| Biotechnology | 2.9 | |
| Automobiles | 2.9 | |
| Capital Markets | 2.7 | |
| Aerospace & Defense | 2.7 | |
| Beverages | 2.6 | |
| Household Products | 2.4 | |
| Oil, Gas & Consumable Fuels | 2.3 | |
| Specialty Retail | 2.3 | |
| Food & Staples Retailing | 2.2 | |
| Diversified Telecommunication Services | 2.2 | |
| Entertainment | 2.1 |
| Industry Diversification | Percent* | |
| Diversified Financial Services | 2.0% | |
| Chemicals | 2.0 | |
| Media | 1.9 | |
| Industrial Conglomerates | 1.9 | |
| Consumer Finance | 1.4 | |
| Insurance | 1.3 | |
| Communications Equipment | 1.2 | |
| Air Freight & Logistics | 1.2 | |
| Money Market Fund | 1.2 | |
| Electrical Equipment | 1.1 | |
| Road & Rail | 1.0 | |
| Food Products | 1.0 | |
| Equity Real Estate Investment Trusts | 1.0 | |
| Textiles, Apparel & Luxury Goods | 0.9 | |
| Pharmaceuticals | 0.9 | |
| Machinery | 0.7 | |
| Wireless Telecommunication Services | 0.7 | |
| Health Care Providers & Services | 0.6 | |
| Multiline Retail | 0.5 | |
| Total Investments | 103.3% |
| * | Percentages indicated are based on net assets as of April 30, 2021. |
| Shares | Value | ||
| COMMON STOCKS (102.1%) | |||
| AEROSPACE & DEFENSE (2.7%) | |||
| Boeing Co. (The)(a) | 800 | $ 187,448 | |
| General Dynamics Corp. | 1,600 | 304,368 | |
| Lockheed Martin Corp. | 500 | 190,280 | |
| Raytheon Technologies Corp. | 3,599 | 299,580 | |
| 981,676 | |||
| AIR FREIGHT & LOGISTICS (1.2%) | |||
| FedEx Corp. | 500 | 145,155 | |
| United Parcel Service, Inc., Class B | 1,500 | 305,790 | |
| 450,945 | |||
| AUTOMOBILES (2.9%) | |||
| Ford Motor Co.(a) | 20,100 | 231,954 | |
| General Motors Co.(a) | 3,200 | 183,104 | |
| Tesla, Inc.(a) | 900 | 638,496 | |
| 1,053,554 | |||
| BANKS (5.9%) | |||
| Bank of America Corp. | 15,000 | 607,950 | |
| Citigroup, Inc. | 4,000 | 284,960 | |
| JPMorgan Chase & Co. | 4,600 | 707,526 | |
| U.S. Bancorp | 4,600 | 273,010 | |
| Wells Fargo & Co. | 5,800 | 261,290 | |
| 2,134,736 | |||
| BEVERAGES (2.6%) | |||
| Coca-Cola Co. (The) | 8,500 | 458,830 | |
| PepsiCo, Inc. | 3,500 | 504,560 | |
| 963,390 | |||
| BIOTECHNOLOGY (2.9%) | |||
| AbbVie, Inc. | 3,000 | 334,500 | |
| Amgen, Inc. | 1,100 | 263,604 | |
| Biogen, Inc.(a) | 1,000 | 267,330 | |
| Gilead Sciences, Inc. | 3,200 | 203,104 | |
| 1,068,538 | |||
| CAPITAL MARKETS (2.7%) | |||
| Bank of New York Mellon Corp. (The) | 3,000 | 149,640 | |
| BlackRock, Inc. | 300 | 245,790 | |
| Goldman Sachs Group, Inc. (The) | 900 | 313,605 | |
| Morgan Stanley | 3,500 | 288,925 | |
| 997,960 | |||
| CHEMICALS (2.0%) | |||
| Dow, Inc. | 3,200 | 200,000 | |
| Shares | Value | ||
| DuPont de Nemours, Inc. | 3,000 | $ 231,330 | |
| Linde PLC | 1,000 | 285,840 | |
| 717,170 | |||
| COMMUNICATIONS EQUIPMENT (1.2%) | |||
| Cisco Systems, Inc. | 8,500 | 432,735 | |
| CONSUMER FINANCE (1.4%) | |||
| American Express Co. | 1,600 | 245,360 | |
| Capital One Financial Corp. | 1,700 | 253,436 | |
| 498,796 | |||
| DIVERSIFIED FINANCIAL SERVICES (2.0%) | |||
| Berkshire Hathaway, Inc., Class B(a) | 2,700 | 742,365 | |
| DIVERSIFIED TELECOMMUNICATION SERVICES (2.2%) | |||
| AT&T, Inc. | 12,500 | 392,625 | |
| Verizon Communications, Inc. | 7,000 | 404,530 | |
| 797,155 | |||
| ELECTRIC UTILITIES (3.0%) | |||
| Duke Energy Corp. | 1,900 | 191,311 | |
| Exelon Corp. | 4,200 | 188,748 | |
| NextEra Energy, Inc. | 5,000 | 387,550 | |
| Southern Co. (The) | 4,700 | 310,999 | |
| 1,078,608 | |||
| ELECTRICAL EQUIPMENT (1.1%) | |||
| Emerson Electric Co. | 4,300 | 389,107 | |
| ENTERTAINMENT (2.1%) | |||
| Netflix, Inc.(a) | 600 | 308,082 | |
| Walt Disney Co. (The)(a) | 2,500 | 465,050 | |
| 773,132 | |||
| EQUITY REAL ESTATE INVESTMENT TRUSTS (1.0%) | |||
| American Tower Corp. | 800 | 203,816 | |
| Simon Property Group, Inc. | 1,200 | 146,088 | |
| 349,904 | |||
| FOOD & STAPLES RETAILING (2.2%) | |||
| Costco Wholesale Corp. | 1,000 | 372,090 | |
| Walgreens Boots Alliance, Inc. | 1,700 | 90,270 | |
| Walmart, Inc. | 2,500 | 349,775 | |
| 812,135 | |||
| Shares | Value | ||
| FOOD PRODUCTS (1.0%) | |||
| Kraft Heinz Co. (The) | 3,000 | $ 123,870 | |
| Mondelez International, Inc., Class A | 4,100 | 249,321 | |
| 373,191 | |||
| HEALTH CARE EQUIPMENT & SUPPLIES (4.2%) | |||
| Abbott Laboratories | 3,100 | 372,248 | |
| Danaher Corp. | 2,500 | 634,850 | |
| Medtronic PLC | 3,900 | 510,588 | |
| 1,517,686 | |||
| HEALTH CARE PROVIDERS & SERVICES (0.6%) | |||
| CVS Health Corp. | 3,100 | 236,840 | |
| HOTELS, RESTAURANTS & LEISURE (3.8%) | |||
| Booking Holdings, Inc.(a) | 200 | 493,216 | |
| McDonald's Corp. | 2,000 | 472,160 | |
| Starbucks Corp. | 3,600 | 412,164 | |
| 1,377,540 | |||
| HOUSEHOLD PRODUCTS (2.4%) | |||
| Colgate-Palmolive Co. | 3,200 | 258,240 | |
| Procter & Gamble Co. (The) | 4,500 | 600,390 | |
| 858,630 | |||
| INDUSTRIAL CONGLOMERATES (1.9%) | |||
| 3M Co. | 1,200 | 236,568 | |
| Honeywell International, Inc. | 2,000 | 446,080 | |
| 682,648 | |||
| INSURANCE (1.3%) | |||
| American International Group, Inc. | 3,600 | 174,420 | |
| MetLife, Inc. | 4,700 | 299,061 | |
| 473,481 | |||
| INTERACTIVE MEDIA & SERVICES (6.7%) | |||
| Alphabet, Inc., Class A(a) | 400 | 941,400 | |
| Alphabet, Inc., Class C†(a) | 200 | 482,024 | |
| Facebook, Inc., Class A(a) | 3,100 | 1,007,748 | |
| 2,431,172 | |||
| INTERNET & DIRECT MARKETING RETAIL (3.8%) | |||
| Amazon.com, Inc.(a) | 400 | 1,386,968 | |
| IT SERVICES (7.0%) | |||
| Accenture PLC, Class A | 1,700 | 492,949 | |
| International Business Machines Corp. | 2,000 | 283,760 | |
| Shares | Value | ||
| Mastercard, Inc., Class A | 1,300 | $ 496,678 | |
| PayPal Holdings, Inc.(a) | 2,000 | 524,580 | |
| Visa, Inc., Class A | 3,200 | 747,392 | |
| 2,545,359 | |||
| MACHINERY (0.7%) | |||
| Caterpillar, Inc. | 1,200 | 273,732 | |
| MEDIA (1.9%) | |||
| Charter Communications, Inc., Class A(a) | 500 | 336,725 | |
| Comcast Corp., Class A | 6,300 | 353,745 | |
| 690,470 | |||
| MULTILINE RETAIL (0.5%) | |||
| Target Corp. | 800 | 165,808 | |
| OIL, GAS & CONSUMABLE FUELS (2.3%) | |||
| Chevron Corp. | 2,600 | 267,982 | |
| ConocoPhillips | 3,000 | 153,420 | |
| Exxon Mobil Corp. | 7,000 | 400,680 | |
| 822,082 | |||
| PHARMACEUTICALS (0.9%) | |||
| Eli Lilly and Co. | 1,700 | 310,709 | |
| ROAD & RAIL (1.0%) | |||
| Union Pacific Corp. | 1,600 | 355,344 | |
| SEMICONDUCTORS & SEMICONDUCTOR EQUIPMENT (6.8%) | |||
| Broadcom, Inc. | 800 | 364,960 | |
| Intel Corp. | 6,500 | 373,945 | |
| NVIDIA Corp. | 1,500 | 900,570 | |
| QUALCOMM, Inc. | 2,100 | 291,480 | |
| Texas Instruments, Inc. | 3,000 | 541,530 | |
| 2,472,485 | |||
| SOFTWARE (7.6%) | |||
| Adobe, Inc.(a) | 900 | 457,506 | |
| Microsoft Corp. | 6,400 | 1,613,952 | |
| Oracle Corp. | 4,500 | 341,055 | |
| salesforce.com, Inc.(a) | 1,600 | 368,512 | |
| 2,781,025 | |||
| SPECIALTY RETAIL (2.3%) | |||
| Home Depot, Inc. (The) | 1,700 | 550,239 | |
| Lowe’s Cos., Inc. | 1,500 | 294,375 | |
| 844,614 | |||
| Shares | Value | ||
| TECHNOLOGY HARDWARE, STORAGE & PERIPHERALS (4.7%) | |||
| Apple, Inc. | 13,000 | $ 1,708,980 | |
| TEXTILES, APPAREL & LUXURY GOODS (0.9%) | |||
| NIKE, Inc., Class B | 2,600 | 344,812 | |
| WIRELESS TELECOMMUNICATION SERVICES (0.7%) | |||
| T-Mobile U.S., Inc.(a) | 2,000 | 264,260 | |
| TOTAL COMMON STOCKS (COST $33,123,729) | 37,159,742 | ||
| MONEY MARKET FUND (1.2%) | |||
| Northern Institutional Treasury Portfolio (Premier Class), 0.01%(b) | 451,068 | 451,068 | |
| TOTAL MONEY MARKET FUND (COST $451,068) | 451,068 | ||
| TOTAL INVESTMENTS (COST $33,574,797) 103.3% | 37,610,810 | ||
| Value | ||
| WRITTEN CALL OPTIONS -3.5% (PREMIUMS RECEIVED $(772,910)) | $ (1,264,243) | |
| OTHER ASSETS IN EXCESS OF LIABILITIES 0.2% | 45,647 | |
| NET ASSETS 100.0% | $ 36,392,214 | |
| Securities in this Fund are pledged as collateral for call options written. | ||
| † | Security is not pledged as collateral for call options written. |
| (a) | Represents non-income producing security. |
| (b) | 7-day current yield as of April 30, 2021 is disclosed. |
| PLC — Public Limited Company |
| Description | Type | Number of Contracts | Notional Amount* | Exercise Price | Expiration Date | Value | ||||||
| 3M Co. | Call | 10 | $ (200,000) | $ 200.00 | 5/21/21 | $ (1,850) | ||||||
| Abbott Laboratories | Call | 25 | (312,500) | 125.00 | 5/21/21 | (1,400) | ||||||
| AbbVie, Inc. | Call | 25 | (275,000) | 110.00 | 5/21/21 | (7,263) | ||||||
| Accenture PLC, Class A | Call | 15 | (412,500) | 275.00 | 5/21/21 | (25,200) | ||||||
| Adobe, Inc. | Call | 5 | (275,000) | 550.00 | 7/16/21 | (4,840) | ||||||
| Alphabet, Inc., Class A | Call | 2 | (460,000) | 2,300.00 | 5/21/21 | (25,400) | ||||||
| Amazon.com, Inc. | Call | 3 | (990,000) | 3,300.00 | 5/21/21 | (59,340) | ||||||
| American Express Co. | Call | 15 | (232,500) | 155.00 | 7/16/21 | (9,338) | ||||||
| American International Group, Inc. | Call | 30 | (138,000) | 46.00 | 7/16/21 | (11,625) | ||||||
| American Tower Corp. | Call | 5 | (135,000) | 270.00 | 7/16/21 | (1,650) | ||||||
| Amgen, Inc. | Call | 10 | (275,000) | 275.00 | 7/16/21 | (795) | ||||||
| Apple, Inc. | Call | 115 | (1,495,000) | 130.00 | 5/21/21 | (42,550) | ||||||
| AT&T, Inc. | Call | 100 | (300,000) | 30.00 | 6/18/21 | (16,600) | ||||||
| Bank of America Corp. | Call | 125 | (425,000) | 34.00 | 5/21/21 | (82,187) | ||||||
| Bank of New York Mellon Corp. (The) | Call | 15 | (67,500) | 45.00 | 6/18/21 | (8,100) | ||||||
| Berkshire Hathaway, Inc., Class B | Call | 25 | (650,000) | 260.00 | 6/18/21 | (44,300) | ||||||
| Biogen, Inc. | Call | 7 | (231,000) | 330.00 | 6/18/21 | (9,449) | ||||||
| BlackRock, Inc. | Call | 2 | (170,000) | 850.00 | 6/18/21 | (2,342) | ||||||
| Boeing Co. (The) | Call | 5 | (130,000) | 260.00 | 6/18/21 | (1,850) | ||||||
| Booking Holdings, Inc. | Call | 2 | (520,000) | 2,600.00 | 6/18/21 | (11,486) | ||||||
| Broadcom, Inc. | Call | 5 | (260,000) | 520.00 | 7/16/21 | (2,100) | ||||||
| Capital One Financial Corp. | Call | 15 | (202,500) | 135.00 | 6/18/21 | (24,150) | ||||||
| Caterpillar, Inc. | Call | 10 | (240,000) | 240.00 | 6/18/21 | (3,950) | ||||||
| Charter Communications, Inc., Class A | Call | 5 | (330,000) | 660.00 | 6/18/21 | (15,450) | ||||||
| Chevron Corp. | Call | 20 | (200,000) | 100.00 | 6/18/21 | (9,750) | ||||||
| Cisco Systems, Inc. | Call | 75 | (412,500) | 55.00 | 7/16/21 | (5,100) | ||||||
| Citigroup, Inc. | Call | 35 | (280,000) | 80.00 | 7/16/21 | (3,675) | ||||||
| Coca-Cola Co. (The) | Call | 80 | (420,000) | 52.50 | 5/21/21 | (13,520) | ||||||
| Colgate-Palmolive Co. | Call | 30 | (232,500) | 77.50 | 5/21/21 | (10,800) | ||||||
| Comcast Corp., Class A | Call | 55 | (302,500) | 55.00 | 6/18/21 | (13,392) | ||||||
| ConocoPhillips | Call | 25 | (125,000) | 50.00 | 5/21/21 | (5,675) | ||||||
| Costco Wholesale Corp. | Call | 5 | (180,000) | 360.00 | 6/18/21 | (9,000) | ||||||
| CVS Health Corp. | Call | 30 | (225,000) | 75.00 | 5/21/21 | (7,740) | ||||||
| Danaher Corp. | Call | 20 | (460,000) | 230.00 | 6/18/21 | (52,900) | ||||||
| Dow, Inc. | Call | 25 | (150,000) | 60.00 | 6/18/21 | (9,425) | ||||||
| Duke Energy Corp. | Call | 15 | (157,500) | 105.00 | 7/16/21 | (1,425) | ||||||
| DuPont de Nemours, Inc. | Call | 20 | (150,000) | 75.00 | 5/21/21 | (6,800) | ||||||
| Eli Lilly & Co. | Call | 15 | (292,500) | 195.00 | 6/18/21 | (3,555) | ||||||
| Emerson Electric Co. | Call | 35 | (315,000) | 90.00 | 6/18/21 | (11,235) | ||||||
| Exelon Corp. | Call | 35 | (154,000) | 44.00 | 7/16/21 | (6,650) | ||||||
| Exxon Mobil Corp. | Call | 60 | (345,000) | 57.50 | 7/16/21 | (14,880) | ||||||
| Facebook, Inc., Class A | Call | 25 | (725,000) | 290.00 | 5/21/21 | (91,000) | ||||||
| FedEx Corp. | Call | 5 | (145,000) | 290.00 | 6/18/21 | (5,725) | ||||||
| Ford Motor Co. | Call | 175 | (210,000) | 12.00 | 6/18/21 | (8,750) | ||||||
| General Dynamics Corp. | Call | 15 | (292,500) | 195.00 | 8/20/21 | (9,600) |
| Description | Type | Number of Contracts | Notional Amount* | Exercise Price | Expiration Date | Value | ||||||
| General Motors Co. | Call | 25 | $ (162,500) | $ 65.00 | 6/18/21 | $ (1,950) | ||||||
| Gilead Sciences, Inc. | Call | 25 | (168,750) | 67.50 | 7/16/21 | (3,125) | ||||||
| Goldman Sachs Group, Inc. (The) | Call | 5 | (177,500) | 355.00 | 5/21/21 | (2,638) | ||||||
| Home Depot, Inc. (The) | Call | 15 | (510,000) | 340.00 | 6/18/21 | (5,475) | ||||||
| Honeywell International, Inc. | Call | 15 | (345,000) | 230.00 | 6/18/21 | (4,508) | ||||||
| Intel Corp. | Call | 60 | (375,000) | 62.50 | 7/16/21 | (5,850) | ||||||
| International Business Machines Corp. | Call | 15 | (202,500) | 135.00 | 6/18/21 | (11,212) | ||||||
| JPMorgan Chase & Co. | Call | 40 | (640,000) | 160.00 | 6/18/21 | (10,560) | ||||||
| Kraft Heinz Co. (The) | Call | 30 | (120,000) | 40.00 | 7/16/21 | (6,900) | ||||||
| Linde PLC | Call | 5 | (145,000) | 290.00 | 7/16/21 | (4,800) | ||||||
| Lockheed Martin Corp. | Call | 3 | (108,000) | 360.00 | 6/18/21 | (6,600) | ||||||
| Lowe’s Cos., Inc. | Call | 10 | (220,000) | 220.00 | 7/16/21 | (2,090) | ||||||
| Mastercard, Inc., Class A | Call | 10 | (395,000) | 395.00 | 6/18/21 | (8,150) | ||||||
| McDonald's Corp. | Call | 15 | (330,000) | 220.00 | 5/21/21 | (23,175) | ||||||
| Medtronic PLC | Call | 35 | (420,000) | 120.00 | 5/21/21 | (39,987) | ||||||
| MetLife, Inc. | Call | 40 | (250,000) | 62.50 | 6/18/21 | (11,540) | ||||||
| Microsoft Corp. | Call | 55 | (1,512,500) | 275.00 | 7/16/21 | (14,520) | ||||||
| Mondelez International, Inc., Class A | Call | 35 | (210,000) | 60.00 | 6/18/21 | (6,563) | ||||||
| Morgan Stanley | Call | 25 | (193,750) | 77.50 | 5/21/21 | (13,875) | ||||||
| Netflix, Inc. | Call | 3 | (160,500) | 535.00 | 6/18/21 | (3,120) | ||||||
| NextEra Energy, Inc. | Call | 45 | (360,000) | 80.00 | 6/18/21 | (5,175) | ||||||
| NIKE, Inc., Class B | Call | 20 | (280,000) | 140.00 | 7/16/21 | (6,650) | ||||||
| NVIDIA Corp. | Call | 10 | (550,000) | 550.00 | 5/21/21 | (56,100) | ||||||
| Oracle Corp. | Call | 40 | (280,000) | 70.00 | 6/18/21 | (26,400) | ||||||
| PayPal Holdings, Inc. | Call | 15 | (375,000) | 250.00 | 5/21/21 | (26,175) | ||||||
| PepsiCo, Inc. | Call | 30 | (420,000) | 140.00 | 6/18/21 | (16,350) | ||||||
| Procter & Gamble Co. (The) | Call | 9 | (117,000) | 130.00 | 5/21/21 | (3,735) | ||||||
| QUALCOMM, Inc. | Call | 15 | (210,000) | 140.00 | 6/18/21 | (7,500) | ||||||
| Raytheon Technologies Corp. | Call | 30 | (225,000) | 75.00 | 5/21/21 | (25,050) | ||||||
| salesforce.com, Inc. | Call | 10 | (220,000) | 220.00 | 5/21/21 | (12,125) | ||||||
| Simon Property Group, Inc. | Call | 10 | (120,000) | 120.00 | 7/16/21 | (9,000) | ||||||
| Southern Co. (The) | Call | 40 | (240,000) | 60.00 | 5/21/21 | (25,000) | ||||||
| Starbucks Corp. | Call | 30 | (360,000) | 120.00 | 7/16/21 | (6,510) | ||||||
| Target Corp. | Call | 5 | (110,000) | 220.00 | 6/18/21 | (1,700) | ||||||
| Tesla, Inc. | Call | 5 | (387,500) | 775.00 | 5/21/21 | (5,575) | ||||||
| Texas Instruments, Inc. | Call | 25 | (475,000) | 190.00 | 6/18/21 | (6,900) | ||||||
| T-Mobile U.S., Inc. | Call | 17 | (229,500) | 135.00 | 5/21/21 | (3,978) | ||||||
| U.S. Bancorp | Call | 40 | (230,000) | 57.50 | 6/18/21 | (13,400) | ||||||
| Union Pacific Corp. | Call | 10 | (220,000) | 220.00 | 5/21/21 | (5,775) | ||||||
| United Parcel Service, Inc., Class B | Call | 10 | (170,000) | 170.00 | 6/18/21 | (34,800) | ||||||
| Verizon Communications, Inc. | Call | 60 | (345,000) | 57.50 | 6/18/21 | (8,490) | ||||||
| Visa, Inc., Class A | Call | 30 | (675,000) | 225.00 | 5/21/21 | (31,200) | ||||||
| Walgreens Boots Alliance, Inc. | Call | 15 | (86,250) | 57.50 | 7/16/21 | (1,455) | ||||||
| Walmart, Inc. | Call | 20 | (280,000) | 140.00 | 5/21/21 | (5,860) | ||||||
| Walt Disney Co. (The) | Call | 20 | (400,000) | 200.00 | 6/18/21 | (6,140) |
| Description | Type | Number of Contracts | Notional Amount* | Exercise Price | Expiration Date | Value | ||||||
| Wells Fargo & Co. | Call | 50 | $ (225,000) | $ 45.00 | 7/16/21 | $ (12,750) | ||||||
| Total (Premiums received $772,910) | $(1,264,243) |
| * | Notional amount is expressed as the number of contracts multiplied by the strike price multiplied by 100. |
The table below sets forth the diversification of the Steward Global Equity Income Fund investments by Country.
| Country Diversification | Percent* | |
| United States | 60.7% | |
| Canada | 15.7 | |
| United Kingdom | 5.2 | |
| Ireland (Republic of) | 3.7 | |
| Republic of Korea (South) | 3.3 | |
| Japan | 3.1 | |
| India | 2.4 | |
| Taiwan | 2.4 | |
| Switzerland | 1.4 | |
| Chile | 1.1 | |
| Belgium | 1.0 | |
| Total Investments | 100.0% |
| * | Percentages indicated are based on net assets as of April 30, 2021. |
| Shares | Value | ||
| COMMON STOCKS (98.6%) | |||
| AEROSPACE & DEFENSE (1.0%) | |||
| General Dynamics Corp. | 17,190 | $ 3,270,054 | |
| AIR FREIGHT & LOGISTICS (1.7%) | |||
| C.H. Robinson Worldwide, Inc. | 61,450 | 5,965,566 | |
| AUTO COMPONENTS (1.2%) | |||
| BorgWarner, Inc. | 83,330 | 4,048,171 | |
| BANKS (12.1%) | |||
| Bank of Nova Scotia (The) | 56,350 | 3,588,932 | |
| Canadian Imperial Bank of Commerce | 45,120 | 4,690,675 | |
| Huntington Bancshares, Inc. | 231,490 | 3,546,427 | |
| KB Financial Group, Inc., ADR | 117,150 | 5,730,978 | |
| People's United Financial, Inc. | 150,080 | 2,720,950 | |
| Royal Bank of Canada | 46,240 | 4,411,296 | |
| Shinhan Financial Group Co. Ltd., ADR | 158,090 | 5,650,137 | |
| Sumitomo Mitsui Financial Group, Inc., Sponsored ADR | 729,150 | 5,133,216 | |
| Toronto-Dominion Bank (The) | 89,430 | 6,148,312 | |
| 41,620,923 | |||
| BEVERAGES (1.9%) | |||
| PepsiCo, Inc. | 45,070 | 6,497,291 | |
| BIOTECHNOLOGY (3.3%) | |||
| AbbVie, Inc. | 45,900 | 5,117,850 | |
| Amgen, Inc. | 26,640 | 6,384,010 | |
| 11,501,860 | |||
| CAPITAL MARKETS (1.6%) | |||
| Nomura Holdings, Inc., Sponsored ADR | 1,025,020 | 5,576,109 | |
| COMMUNICATIONS EQUIPMENT (1.7%) | |||
| Cisco Systems, Inc. | 113,670 | 5,786,940 | |
| CONSTRUCTION MATERIALS (1.7%) | |||
| CRH PLC, Sponsored ADR | 123,750 | 5,849,662 | |
| DIVERSIFIED TELECOMMUNICATION SERVICES (3.3%) | |||
| BCE, Inc. | 107,120 | 5,061,420 | |
| TELUS Corp. | 296,050 | 6,143,038 | |
| 11,204,458 | |||
| ELECTRIC UTILITIES (4.0%) | |||
| Duke Energy Corp. | 45,180 | 4,549,174 | |
| Enel Americas SA, ADR | 504,400 | 3,621,592 | |
| Fortis, Inc. | 127,810 | 5,700,326 | |
| 13,871,092 | |||
| Shares | Value | ||
| ELECTRONIC EQUIPMENT, INSTRUMENTS & COMPONENTS (1.0%) | |||
| National Instruments Corp. | 82,040 | $ 3,397,276 | |
| EQUITY REAL ESTATE INVESTMENT TRUSTS (2.1%) | |||
| Medical Properties Trust, Inc. | 149,050 | 3,286,553 | |
| Physicians Realty Trust | 211,180 | 3,955,401 | |
| 7,241,954 | |||
| FOOD PRODUCTS (1.9%) | |||
| General Mills, Inc. | 52,000 | 3,164,720 | |
| Kellogg Co. | 56,020 | 3,496,768 | |
| 6,661,488 | |||
| HEALTH CARE EQUIPMENT & SUPPLIES (3.7%) | |||
| Medtronic PLC | 53,730 | 7,034,332 | |
| Smith & Nephew PLC, Sponsored ADR | 133,390 | 5,758,446 | |
| 12,792,778 | |||
| HEALTH CARE PROVIDERS & SERVICES (2.0%) | |||
| Quest Diagnostics, Inc. | 50,710 | 6,687,635 | |
| HOTELS, RESTAURANTS & LEISURE (2.5%) | |||
| McDonald's Corp. | 36,380 | 8,588,590 | |
| HOUSEHOLD DURABLES (5.5%) | |||
| Garmin Ltd. | 36,310 | 4,983,184 | |
| KB Home | 156,260 | 7,536,420 | |
| Leggett & Platt, Inc. | 59,950 | 2,977,717 | |
| Whirlpool Corp. | 14,920 | 3,527,834 | |
| 19,025,155 | |||
| INDUSTRIAL CONGLOMERATES (1.3%) | |||
| 3M Co. | 22,570 | 4,449,450 | |
| IT SERVICES (5.4%) | |||
| Amdocs Ltd. | 59,780 | 4,587,517 | |
| Infosys Ltd., Sponsored ADR | 449,980 | 8,135,638 | |
| Paychex, Inc. | 61,630 | 6,008,309 | |
| 18,731,464 | |||
| MACHINERY (3.5%) | |||
| Cummins, Inc. | 28,030 | 7,064,681 | |
| Snap-on, Inc. | 21,460 | 5,098,896 | |
| 12,163,577 | |||
| MEDIA (5.2%) | |||
| Comcast Corp., Class A | 132,280 | 7,427,522 | |
| Shares | Value | ||
| Interpublic Group of Cos., Inc. (The) | 152,950 | $ 4,856,162 | |
| ViacomCBS, Inc., Class B | 132,430 | 5,432,279 | |
| 17,715,963 | |||
| METALS & MINING (1.8%) | |||
| Kirkland Lake Gold Ltd. | 168,810 | 6,256,099 | |
| OIL, GAS & CONSUMABLE FUELS (3.4%) | |||
| Euronav N.V. | 420,930 | 3,586,324 | |
| Pembina Pipeline Corp. | 158,550 | 4,892,853 | |
| TC Energy Corp. | 64,650 | 3,198,235 | |
| 11,677,412 | |||
| PERSONAL PRODUCTS (1.6%) | |||
| Unilever PLC, Sponsored ADR | 96,070 | 5,641,230 | |
| PHARMACEUTICALS (2.2%) | |||
| Eli Lilly and Co. | 42,190 | 7,711,066 | |
| PROFESSIONAL SERVICES (1.9%) | |||
| RELX PLC, Sponsored ADR | 253,790 | 6,618,843 | |
| SEMICONDUCTORS & SEMICONDUCTOR EQUIPMENT (10.8%) | |||
| Analog Devices, Inc. | 42,780 | 6,552,185 | |
| Intel Corp. | 105,940 | 6,094,728 | |
| KLA Corp. | 12,760 | 4,023,866 | |
| Silicon Motion Technology Corp. ADR | 56,870 | 4,084,403 | |
| Taiwan Semiconductor Manufacturing Co. Ltd., Sponsored ADR | 69,390 | 8,100,589 | |
| Texas Instruments, Inc. | 47,020 | 8,487,580 | |
| 37,343,351 | |||
| SOFTWARE (2.5%) | |||
| Open Text Corp. | 84,980 | 4,002,558 | |
| Oracle Corp. | 62,450 | 4,733,086 | |
| 8,735,644 | |||
| Shares | Value | ||
| SPECIALTY RETAIL (2.4%) | |||
| Best Buy Co., Inc. | 25,480 | $ 2,962,560 | |
| Home Depot, Inc. (The) | 16,060 | 5,198,140 | |
| 8,160,700 | |||
| TECHNOLOGY HARDWARE, STORAGE & PERIPHERALS (4.4%) | |||
| HP, Inc. | 223,740 | 7,631,771 | |
| NetApp, Inc. | 99,030 | 7,396,551 | |
| 15,028,322 | |||
| TOTAL COMMON STOCKS (COST $265,923,424) | 339,820,123 | ||
| MONEY MARKET FUND (1.4%) | |||
| Northern Institutional Treasury Portfolio (Premier Class), 0.01%(a) | 4,849,202 | 4,849,202 | |
| TOTAL MONEY MARKET FUND (COST $4,849,202) | 4,849,202 | ||
| TOTAL INVESTMENTS (COST $270,772,626) 100.0% | 344,669,325 | ||
| OTHER ASSETS IN EXCESS OF LIABILITIES 0.0% | 169,321 | ||
| NET ASSETS 100.0% | $ 344,838,646 | ||
| (a) | 7-day current yield as of April 30, 2021 is disclosed. |
| ADR — American Depositary Receipt |
| PLC — Public Limited Company |
The table below sets forth the diversification of the Steward International Enhanced Index Fund investments by Country.
| Country Diversification | Percent* | |
| Canada | 28.1% | |
| United Kingdom | 14.9 | |
| United States | 9.8 | |
| Netherlands | 8.3 | |
| Taiwan | 6.2 | |
| Japan | 5.7 | |
| Switzerland | 3.7 | |
| Brazil | 3.6 | |
| Germany | 3.0 | |
| India | 2.6 | |
| Australia | 2.5 | |
| France | 1.9 | |
| Republic of Korea (South) | 1.6 | |
| Spain | 1.3 | |
| Mexico | 1.3 | |
| Ireland (Republic of) | 1.0 | |
| China | 0.8 | |
| Sweden | 0.6 | |
| Denmark | 0.5 | |
| Chile | 0.5 | |
| Italy | 0.4 | |
| Finland | 0.3 | |
| Norway | 0.3 | |
| Jersey | 0.3 | |
| South Africa | 0.2 | |
| Indonesia | 0.2 | |
| Belgium | 0.1 | |
| Colombia | 0.1 | |
| Total Investments | 99.8% |
| * | Percentages indicated are based on net assets as of April 30, 2021. |
| Shares | Value | ||
| COMMON STOCKS (96.6%) | |||
| AIR FREIGHT & LOGISTICS (0.3%) | |||
| ZTO Express Cayman, Inc., ADR | 14,390 | $ 462,782 | |
| AIRLINES (0.2%) | |||
| Ryanair Holdings PLC, Sponsored ADR(a) | 2,828 | 330,452 | |
| AUTO COMPONENTS (0.5%) | |||
| Magna International, Inc., ADR | 8,970 | 846,947 | |
| AUTOMOBILES (2.3%) | |||
| Ferrari N.V. | 4,880 | 1,041,343 | |
| Honda Motor Co. Ltd., Sponsored ADR | 48,650 | 1,450,743 | |
| NIO, Inc., ADR(a) | 18,030 | 718,315 | |
| Stellantis N.V. | 54,910 | 909,859 | |
| Tata Motors Ltd., Sponsored ADR(a) | 6,170 | 119,390 | |
| 4,239,650 | |||
| BANKS (17.0%) | |||
| Banco Bilbao Vizcaya Argentaria SA, Sponsored ADR(a) | 130,110 | 728,616 | |
| Banco de Chile, ADR | 9,779 | 212,987 | |
| Banco Santander Chile, ADR | 5,574 | 123,966 | |
| Banco Santander SA, Sponsored ADR(a) | 310,085 | 1,181,424 | |
| Bank of Montreal | 19,410 | 1,831,139 | |
| Bank of Nova Scotia (The) | 35,430 | 2,256,537 | |
| Barclays PLC, Sponsored ADR | 81,079 | 775,926 | |
| Canadian Imperial Bank of Commerce | 15,600 | 1,621,776 | |
| Credicorp Ltd. | 2,537 | 302,918 | |
| HDFC Bank Ltd., ADR(a) | 18,940 | 1,331,103 | |
| HSBC Holdings PLC, Sponsored ADR | 102,551 | 3,201,642 | |
| ICICI Bank Ltd., Sponsored ADR(a) | 41,800 | 681,340 | |
| ING Groep N.V., Sponsored ADR | 86,940 | 1,107,616 | |
| KB Financial Group, Inc., ADR | 16,310 | 797,885 | |
| Lloyds Banking Group PLC, ADR | 305,785 | 761,405 | |
| Mitsubishi UFJ Financial Group, Inc., Sponsored ADR | 297,360 | 1,596,823 | |
| Mizuho Financial Group, Inc., ADR | 239,140 | 695,897 | |
| Natwest Group PLC, Sponsored ADR | 33,078 | 178,952 | |
| Royal Bank of Canada | 44,710 | 4,265,334 | |
| Shinhan Financial Group Co. Ltd., ADR | 14,890 | 532,169 | |
| Sumitomo Mitsui Financial Group, Inc., Sponsored ADR | 173,710 | 1,222,918 | |
| Toronto-Dominion Bank (The) | 51,710 | 3,555,062 | |
| Westpac Banking Corp., Sponsored ADR | 89,465 | 1,726,675 | |
| 30,690,110 | |||
| BEVERAGES (0.5%) | |||
| Fomento Economico Mexicano SAB de CV, Sponsored ADR | 11,440 | 886,600 | |
| Shares | Value | ||
| BIOTECHNOLOGY (1.4%) | |||
| Argenx SE, ADR(a) | 2,290 | $ 656,566 | |
| BeiGene Ltd., ADR(a) | 950 | 326,363 | |
| Galapagos N.V., Sponsored ADR(a) | 2,530 | 196,758 | |
| Genmab A/S, Sponsored ADR(a) | 26,680 | 983,691 | |
| Zai Lab Ltd. ADR(a) | 1,680 | 279,233 | |
| 2,442,611 | |||
| CAPITAL MARKETS (2.7%) | |||
| Brookfield Asset Management, Inc., Class A | 35,947 | 1,638,464 | |
| Credit Suisse Group, Sponsored ADR | 52,549 | 555,443 | |
| Deutsche Bank AG(a) | 47,520 | 665,280 | |
| Nomura Holdings, Inc., Sponsored ADR | 75,430 | 410,339 | |
| UBS Group AG | 103,500 | 1,582,515 | |
| 4,852,041 | |||
| CHEMICALS (0.5%) | |||
| Nutrien Ltd. | 17,423 | 961,575 | |
| COMMERCIAL SERVICES & SUPPLIES (1.2%) | |||
| Waste Connections, Inc. | 17,550 | 2,090,380 | |
| COMMUNICATIONS EQUIPMENT (1.0%) | |||
| Nokia Oyj, Sponsored ADR(a) | 130,990 | 613,033 | |
| Telefonaktiebolaget LM Ericsson, Sponsored ADR | 83,330 | 1,149,121 | |
| 1,762,154 | |||
| CONSTRUCTION MATERIALS (1.1%) | |||
| CEMEX SAB de CV, Sponsored ADR(a) | 55,045 | 434,305 | |
| CRH PLC, Sponsored ADR | 22,920 | 1,083,429 | |
| James Hardie Industries PLC, Sponsored ADR | 12,070 | 401,086 | |
| 1,918,820 | |||
| DIVERSIFIED CONSUMER SERVICES (0.4%) | |||
| GSX Techedu, Inc., ADR(a) | 1,620 | 51,759 | |
| New Oriental Education & Technology Group Inc., Sponsored ADR(a) | 26,400 | 402,864 | |
| TAL Education Group, ADR(a) | 6,270 | 357,077 | |
| 811,700 | |||
| DIVERSIFIED FINANCIAL SERVICES (0.4%) | |||
| ORIX Corp., Sponsored ADR | 7,980 | 645,103 | |
| DIVERSIFIED TELECOMMUNICATION SERVICES (3.7%) | |||
| BCE, Inc. | 45,525 | 2,151,056 | |
| Chunghwa Telecom Co. Ltd., Sponsored ADR | 35,365 | 1,444,660 | |
| Orange SA, Sponsored ADR | 66,020 | 826,570 | |
| Telefonica SA, Sponsored ADR(a) | 100,553 | 471,594 | |
| Shares | Value | ||
| Telkom Indonesia Persero Tbk PT, ADR | 14,830 | $ 327,150 | |
| TELUS Corp. | 66,420 | 1,378,215 | |
| 6,599,245 | |||
| ELECTRIC UTILITIES (0.9%) | |||
| Enel Americas SA, ADR | 37,710 | 270,758 | |
| Enel Chile SA, ADR | 14,260 | 49,767 | |
| Fortis, Inc. | 28,600 | 1,275,560 | |
| 1,596,085 | |||
| ELECTRICAL EQUIPMENT (1.2%) | |||
| ABB Ltd., Sponsored ADR | 64,430 | 2,089,465 | |
| ENTERTAINMENT (0.8%) | |||
| Bilibili, Inc., Sponsored ADR(a) | 2,570 | 284,910 | |
| iQIYI, Inc., ADR(a) | 7,300 | 107,383 | |
| NetEase, Inc., ADR | 7,555 | 846,614 | |
| Tencent Music Entertainment Group, ADR(a) | 10,750 | 187,265 | |
| 1,426,172 | |||
| FOOD PRODUCTS (0.1%) | |||
| BRF SA, ADR(a) | 30,790 | 119,465 | |
| HEALTH CARE EQUIPMENT & SUPPLIES (2.5%) | |||
| Alcon, Inc.(a) | 20,870 | 1,574,224 | |
| Koninklijke Philips N.V., Sponsored NYS(a) | 38,685 | 2,191,119 | |
| Smith & Nephew PLC, Sponsored ADR | 19,530 | 843,110 | |
| 4,608,453 | |||
| HEALTH CARE PROVIDERS & SERVICES (0.4%) | |||
| Fresenius Medical Care AG & Co. KGaA, ADR | 17,830 | 711,239 | |
| HOTELS, RESTAURANTS & LEISURE (0.5%) | |||
| Huazhu Group Ltd. ADR(a) | 1,820 | 107,307 | |
| InterContinental Hotels Group PLC, ADR(a) | 3,223 | 229,188 | |
| Restaurant Brands International, Inc. | 8,505 | 583,528 | |
| 920,023 | |||
| HOUSEHOLD DURABLES (1.8%) | |||
| Sony Corp., Sponsored ADR | 33,280 | 3,333,325 | |
| INSURANCE (2.6%) | |||
| Aegon N.V., Sponsored NYS | 32,878 | 150,910 | |
| China Life Insurance Co. Ltd., ADR | 76,810 | 784,230 | |
| Manulife Financial Corp. | 57,000 | 1,245,450 | |
| Prudential PLC, ADR | 33,530 | 1,423,684 | |
| Sun Life Financial, Inc. | 21,720 | 1,171,577 | |
| 4,775,851 | |||
| Shares | Value | ||
| INTERACTIVE MEDIA & SERVICES (0.5%) | |||
| Baidu, Inc., Sponsored ADR(a) | 4,353 | $ 915,566 | |
| INTERNET & DIRECT MARKETING RETAIL (4.3%) | |||
| Alibaba Group Holding Ltd., Sponsored ADR(a) | 23,220 | 5,362,659 | |
| JD.com, Inc., ADR(a) | 14,760 | 1,141,833 | |
| Pinduoduo, Inc., ADR(a) | 5,360 | 717,865 | |
| Trip.com Group Ltd., ADR(a) | 9,570 | 373,996 | |
| Vipshop Holdings Ltd., ADR(a) | 7,640 | 235,083 | |
| 7,831,436 | |||
| IT SERVICES (3.6%) | |||
| CGI, Inc.(a) | 10,050 | 889,023 | |
| GDS Holdings Ltd., ADR(a) | 2,360 | 195,809 | |
| Infosys Ltd., Sponsored ADR | 79,710 | 1,441,157 | |
| Pagseguro Digital Ltd., Class A(a) | 4,210 | 192,565 | |
| Shopify, Inc., Class A(a) | 2,690 | 3,180,952 | |
| StoneCo Ltd., Class A(a) | 4,190 | 270,842 | |
| Wipro Ltd., ADR | 56,023 | 401,125 | |
| 6,571,473 | |||
| LIFE SCIENCES TOOLS & SERVICES (0.4%) | |||
| QIAGEN N.V.(a) | 15,624 | 751,983 | |
| MACHINERY (0.2%) | |||
| CNH Industrial N.V. | 24,760 | 367,438 | |
| MEDIA (0.9%) | |||
| Grupo Televisa SAB, Sponsored ADR(a) | 13,510 | 167,254 | |
| Pearson PLC, Sponsored ADR | 27,360 | 314,640 | |
| Shaw Communications, Inc., Class B | 23,550 | 681,301 | |
| WPP PLC, Sponsored ADR | 7,280 | 491,546 | |
| 1,654,741 | |||
| METALS & MINING (8.6%) | |||
| Agnico-Eagle Mines Ltd. | 7,540 | 470,798 | |
| AngloGold Ashanti Ltd., Sponsored ADR | 7,390 | 152,086 | |
| ArcelorMittal SA, Sponsored NYS(a) | 14,583 | 427,136 | |
| Barrick Gold Corp., ADR | 53,503 | 1,136,939 | |
| BHP Group Ltd., Sponsored ADR | 37,960 | 2,761,969 | |
| BHP Group PLC, ADR | 26,820 | 1,622,610 | |
| Franco Nevada Corp. | 7,690 | 1,070,756 | |
| Gold Fields Ltd., Sponsored ADR | 12,570 | 117,907 | |
| Kinross Gold Corp. | 28,810 | 202,822 | |
| Kirkland Lake Gold Ltd. | 7,790 | 288,697 | |
| POSCO, Sponsored ADR | 13,210 | 1,075,426 | |
| Rio Tinto PLC, Sponsored ADR | 27,292 | 2,321,457 | |
| Sibanye Stillwater Ltd., ADR | 6,250 | 116,562 | |
| Shares | Value | ||
| Southern Copper Corp. | 3,343 | $ 232,038 | |
| Teck Resources Ltd., Class B | 7,223 | 152,911 | |
| Vale SA, Sponsored ADR | 134,930 | 2,714,792 | |
| Wheaton Precious Metals Corp. | 15,380 | 635,502 | |
| 15,500,408 | |||
| MULTI-UTILITIES (1.4%) | |||
| Algonquin Power & Utilities Corp. | 41,230 | 665,452 | |
| National Grid PLC, Sponsored ADR | 29,659 | 1,867,924 | |
| 2,533,376 | |||
| OIL, GAS & CONSUMABLE FUELS (9.4%) | |||
| BP PLC, Sponsored ADR | 78,282 | 1,969,575 | |
| Cameco Corp. | 11,350 | 190,793 | |
| Canadian Natural Resources, Ltd. | 25,710 | 781,070 | |
| Cenovus Energy, Inc. | 15,050 | 116,939 | |
| China Petroleum & Chemical Corp., ADR | 13,666 | 672,231 | |
| Ecopetrol SA, Sponsored ADR | 6,810 | 80,562 | |
| Enbridge, Inc. | 61,470 | 2,370,898 | |
| Eni S.p.A., Sponsored ADR | 30,250 | 721,160 | |
| Equinor ASA, Sponsored ADR | 28,377 | 575,202 | |
| Imperial Oil Ltd. | 4,170 | 120,721 | |
| Pembina Pipeline Corp. | 10,600 | 327,116 | |
| Petroleo Brasileiro SA, Sponsored ADR | 65,590 | 556,203 | |
| Royal Dutch Shell PLC, Class A, Sponsored ADR | 48,535 | 1,844,330 | |
| Royal Dutch Shell PLC, Class B, Sponsored ADR | 43,650 | 1,563,106 | |
| Suncor Energy, Inc. | 35,148 | 752,870 | |
| TC Energy Corp. | 32,500 | 1,607,775 | |
| TOTAL SE, Sponsored ADR | 60,560 | 2,681,597 | |
| Ultrapar Participacoes SA, Sponsored ADR | 29,720 | 115,314 | |
| 17,047,462 | |||
| PAPER & FOREST PRODUCTS (0.1%) | |||
| Suzano SA, Sponsored ADR(a) | 13,980 | 177,266 | |
| PERSONAL PRODUCTS (2.8%) | |||
| Natura & Co. Holding SA, ADR(a) | 16,480 | 293,509 | |
| Unilever PLC, Sponsored ADR | 82,014 | 4,815,862 | |
| 5,109,371 | |||
| PHARMACEUTICALS (0.6%) | |||
| Bausch Health Cos., Inc.(a) | 12,258 | 394,340 | |
| Dr. Reddy's Laboratories Ltd., ADR | 10,790 | 744,726 | |
| 1,139,066 | |||
| Shares | Value | ||
| PROFESSIONAL SERVICES (1.7%) | |||
| RELX PLC, Sponsored ADR | 70,513 | $ 1,838,979 | |
| Thomson Reuters Corp. | 12,864 | 1,192,621 | |
| 3,031,600 | |||
| REAL ESTATE MANAGEMENT & DEVELOPMENT (0.1%) | |||
| KE Holdings, Inc.(a) | 2,920 | 151,986 | |
| ROAD & RAIL (2.6%) | |||
| Canadian National Railway Co. | 26,470 | 2,849,495 | |
| Canadian Pacific Railway, Ltd. | 4,890 | 1,824,606 | |
| 4,674,101 | |||
| SEMICONDUCTORS & SEMICONDUCTOR EQUIPMENT (9.8%) | |||
| ASE Industrial Holding Co. Ltd., ADR | 55,075 | 457,673 | |
| ASML Holding N.V., Sponsored NYS | 10,907 | 7,068,827 | |
| STMicroelectronics N.V., Sponsored NYS | 21,720 | 809,939 | |
| Taiwan Semiconductor Manufacturing Co. Ltd., Sponsored ADR | 71,490 | 8,345,742 | |
| United Microelectronics Corp., Sponsored ADR | 97,750 | 969,680 | |
| 17,651,861 | |||
| SOFTWARE (2.7%) | |||
| Open Text Corp. | 19,470 | 917,037 | |
| SAP SE, Sponsored ADR | 28,550 | 3,995,287 | |
| 4,912,324 | |||
| TECHNOLOGY HARDWARE, STORAGE & PERIPHERALS (1.0%) | |||
| Canon, Inc., Sponsored ADR | 40,040 | 950,149 | |
| Logitech International SA | 8,170 | 905,890 | |
| 1,856,039 | |||
| TEXTILES, APPAREL & LUXURY GOODS (0.1%) | |||
| Gildan Activewear, Inc.(a) | 3,940 | 136,679 | |
| WIRELESS TELECOMMUNICATION SERVICES (1.8%) | |||
| America Movil SAB de CV, Class L, Sponsored ADR | 57,060 | 795,417 | |
| Rogers Communications, Inc., Class B | 17,010 | 837,402 | |
| SK Telecom Co. Ltd., Sponsored ADR | 14,160 | 425,366 | |
| Vodafone Group PLC, Sponsored ADR | 65,639 | 1,243,859 | |
| 3,302,044 | |||
| TOTAL COMMON STOCKS (COST $145,729,307) | 174,436,468 | ||
| Shares | Value | ||
| MASTER LIMITED PARTNERSHIPS (0.3%) | |||
| MULTI-UTILITIES (0.3%) | |||
| Brookfield Infrastructure Partners LP | 10,100 | $ 543,077 | |
| REAL ESTATE MANAGEMENT & DEVELOPMENT (0.0%) | |||
| Brookfield Property Partners LP | 4,170 | 75,018 | |
| TOTAL MASTER LIMITED PARTNERSHIPS (COST $547,235) | 618,095 | ||
| MONEY MARKET FUND (1.3%) | |||
| Northern Institutional Treasury Portfolio (Premier Class), 0.01%(b) | 2,378,046 | 2,378,046 | |
| TOTAL MONEY MARKET FUND (COST $2,378,046) | 2,378,046 | ||
| PREFERRED STOCKS (1.6%) | |||
| BANKS (1.1%) | |||
| Banco Bradesco SA, ADR, (a) | 199,171 | 866,396 | |
| Bancolombia SA, Sponsored ADR, 0.88%(c) | 2,090 | 62,554 | |
| Itau Unibanco Holding SA, Sponsored ADR, 0.62%(c) | 197,327 | 986,635 | |
| 1,915,585 | |||
| CHEMICALS (0.1%) | |||
| Sociedad Quimica y Minera de Chile SA, Sponsored ADR, 0.13%(c) | 4,080 | 215,179 | |
| Shares | Value | ||
| METALS & MINING (0.0%) | |||
| Gerdau SA, Sponsored ADR, 1.49%(c) | 7,250 | $ 44,515 | |
| OIL, GAS & CONSUMABLE FUELS (0.4%) | |||
| Petroleo Brasileiro SA, Sponsored ADR, 3.40%(c) | 76,930 | 665,445 | |
| TOTAL PREFERRED STOCKS (COST $3,155,141) | 2,840,724 | ||
| TOTAL INVESTMENTS (COST $151,809,729) 99.8% | 180,273,333 | ||
| OTHER ASSETS IN EXCESS OF LIABILITIES 0.2% | 319,784 | ||
| NET ASSETS 100.0% | $ 180,593,117 | ||
| (a) | Represents non-income producing security. |
| (b) | 7-day current yield as of April 30, 2021 is disclosed. |
| (c) | Current yield is disclosed. Dividends are calculated based on a percentage of the issuer’s net income. |
| ADR — American Depositary Receipt |
| LP — Limited Partnership |
| NYS — New York Shares |
| PLC — Public Limited Company |
The table below sets forth the diversification of the Steward Large Cap Enhanced Index Fund investments by Industry.
| Industry Diversification | Percent* | |
| Software | 10.0% | |
| Semiconductors & Semiconductor Equipment | 8.2 | |
| Health Care Equipment & Supplies | 5.7 | |
| Interactive Media & Services | 5.0 | |
| Banks | 4.9 | |
| Technology Hardware, Storage & Peripherals | 4.6 | |
| Internet & Direct Marketing Retail | 4.4 | |
| IT Services | 4.1 | |
| Capital Markets | 3.5 | |
| Insurance | 3.1 | |
| Health Care Providers & Services | 2.5 | |
| Oil, Gas & Consumable Fuels | 2.4 | |
| Automobiles | 2.2 | |
| Chemicals | 2.1 | |
| Specialty Retail | 2.0 | |
| Hotels, Restaurants & Leisure | 1.9 | |
| Life Sciences Tools & Services | 1.8 | |
| Entertainment | 1.7 | |
| Equity Real Estate Investment Trusts | 1.6 | |
| Media | 1.5 | |
| Aerospace & Defense | 1.3 | |
| Food Products | 1.3 | |
| Electric Utilities | 1.3 | |
| Beverages | 1.3 | |
| Pharmaceuticals | 1.3 | |
| Food & Staples Retailing | 1.2 | |
| Biotechnology | 1.2 | |
| Diversified Telecommunication Services | 1.2 | |
| Diversified Financial Services | 1.1 | |
| Machinery | 1.1 | |
| Road & Rail | 1.0 | |
| Household Products | 1.0 | |
| Communications Equipment | 0.9 | |
| Electrical Equipment | 0.9 |
| Industry Diversification | Percent* | |
| Commercial Services & Supplies | 0.9% | |
| Electronic Equipment, Instruments & Components | 0.8 | |
| Trading Companies & Distributors | 0.7 | |
| Multi-Utilities | 0.7 | |
| Multiline Retail | 0.7 | |
| Money Market Fund | 0.7 | |
| Consumer Finance | 0.6 | |
| Distributors | 0.6 | |
| Industrial Conglomerates | 0.6 | |
| Household Durables | 0.5 | |
| Air Freight & Logistics | 0.5 | |
| Textiles, Apparel & Luxury Goods | 0.5 | |
| Professional Services | 0.5 | |
| Building Products | 0.4 | |
| Metals & Mining | 0.4 | |
| Containers & Packaging | 0.4 | |
| Airlines | 0.2 | |
| Wireless Telecommunication Services | 0.2 | |
| Auto Components | 0.1 | |
| Real Estate Management & Development | 0.1 | |
| Energy Equipment & Services | 0.1 | |
| Independent Power and Renewable Electricity Producers | 0.1 | |
| Health Care Technology | 0.1 | |
| Water Utilities | 0.1 | |
| Personal Products | 0.1 | |
| Construction Materials | 0.1 | |
| Gas Utilities | 0.0 | |
| Construction & Engineering | 0.0 | |
| Leisure Products | 0.0 | |
| Total Investments | 100.0% |
| * | Percentages indicated are based on net assets as of April 30, 2021. |
| Shares | Value | ||
| COMMON STOCKS (99.3%) | |||
| AEROSPACE & DEFENSE (1.3%) | |||
| Boeing Co. (The)(a) | 3,744 | $ 877,257 | |
| General Dynamics Corp. | 2,444 | 464,922 | |
| Howmet Aerospace, Inc.(a) | 7,173 | 229,249 | |
| Huntington Ingalls Industries, Inc. | 1,272 | 270,071 | |
| L3Harris Technologies, Inc. | 1,548 | 323,888 | |
| Lockheed Martin Corp. | 1,819 | 692,239 | |
| Northrop Grumman Corp. | 1,137 | 402,998 | |
| Raytheon Technologies Corp. | 12,841 | 1,068,885 | |
| Teledyne Technologies, Inc.(a) | 210 | 94,027 | |
| Textron, Inc. | 5,370 | 344,969 | |
| TransDigm Group, Inc.(a) | 328 | 201,307 | |
| 4,969,812 | |||
| AIR FREIGHT & LOGISTICS (0.5%) | |||
| C.H. Robinson Worldwide, Inc. | 1,190 | 115,525 | |
| Expeditors International of Washington, Inc. | 1,540 | 169,184 | |
| FedEx Corp. | 1,596 | 463,335 | |
| United Parcel Service, Inc., Class B | 5,260 | 1,072,304 | |
| 1,820,348 | |||
| AIRLINES (0.2%) | |||
| Alaska Air Group, Inc.(a) | 620 | 42,867 | |
| American Airlines Group, Inc.(a) | 7,840 | 170,285 | |
| Delta Air Lines, Inc.(a) | 4,770 | 223,808 | |
| Southwest Airlines Co.(a) | 4,660 | 292,555 | |
| United Airlines Holdings, Inc.(a) | 1,020 | 55,488 | |
| 785,003 | |||
| AUTO COMPONENTS (0.1%) | |||
| Aptiv PLC(a) | 1,680 | 241,735 | |
| BorgWarner, Inc. | 6,420 | 311,884 | |
| 553,619 | |||
| AUTOMOBILES (2.2%) | |||
| Ford Motor Co.(a) | 95,990 | 1,107,725 | |
| General Motors Co.(a) | 16,960 | 970,451 | |
| Tesla, Inc.(a) | 9,130 | 6,477,187 | |
| 8,555,363 | |||
| BANKS (4.9%) | |||
| Bank of America Corp. | 65,279 | 2,645,758 | |
| Citigroup, Inc. | 19,290 | 1,374,219 | |
| Citizens Financial Group, Inc. | 11,000 | 509,080 | |
| Comerica, Inc. | 5,200 | 390,832 | |
| Fifth Third Bancorp | 16,450 | 666,883 | |
| First Republic Bank | 1,030 | 188,737 | |
| Shares | Value | ||
| Huntington Bancshares, Inc. | 24,180 | $ 370,438 | |
| JPMorgan Chase & Co. | 22,044 | 3,390,588 | |
| KeyCorp | 33,270 | 723,955 | |
| M&T Bank Corp. | 2,330 | 367,418 | |
| People's United Financial, Inc. | 27,500 | 498,575 | |
| PNC Financial Services Group, Inc. (The) | 3,544 | 662,551 | |
| Regions Financial Corp. | 31,732 | 691,758 | |
| SVB Financial Group(a) | 5,727 | 3,274,870 | |
| Truist Financial Corp. | 14,077 | 834,907 | |
| U.S. Bancorp | 13,160 | 781,046 | |
| Wells Fargo & Co. | 39,108 | 1,761,815 | |
| Zions Bancorp | 7,120 | 397,296 | |
| 19,530,726 | |||
| BEVERAGES (1.3%) | |||
| Coca-Cola Co. (The) | 33,340 | 1,799,693 | |
| Monster Beverage Corp.(a) | 16,960 | 1,645,968 | |
| PepsiCo, Inc. | 10,991 | 1,584,463 | |
| 5,030,124 | |||
| BIOTECHNOLOGY (1.2%) | |||
| AbbVie, Inc. | 14,990 | 1,671,385 | |
| Alexion Pharmaceuticals, Inc.(a) | 2,691 | 453,918 | |
| Amgen, Inc. | 5,088 | 1,219,288 | |
| Biogen, Inc.(a) | 1,614 | 431,471 | |
| Gilead Sciences, Inc. | 13,440 | 853,037 | |
| Incyte Corp.(a) | 3,970 | 338,958 | |
| 4,968,057 | |||
| BUILDING PRODUCTS (0.4%) | |||
| A.O. Smith Corp. | 1,680 | 113,820 | |
| Allegion PLC | 563 | 75,656 | |
| Carrier Global Corp. | 6,536 | 284,839 | |
| Fortune Brands Home & Security, Inc. | 880 | 92,382 | |
| Johnson Controls International PLC | 7,021 | 437,689 | |
| Masco Corp. | 3,130 | 199,944 | |
| Trane Technologies PLC | 1,780 | 309,418 | |
| 1,513,748 | |||
| CAPITAL MARKETS (3.5%) | |||
| Ameriprise Financial, Inc. | 706 | 182,430 | |
| Bank of New York Mellon Corp. (The) | 14,771 | 736,778 | |
| BlackRock, Inc. | 1,016 | 832,409 | |
| Cboe Global Markets, Inc. | 1,050 | 109,589 | |
| Charles Schwab Corp. (The) | 11,190 | 787,776 | |
| CME Group, Inc. | 2,670 | 539,313 | |
| Franklin Resources, Inc. | 14,320 | 429,600 | |
| Goldman Sachs Group, Inc. (The) | 3,462 | 1,206,334 | |
| Shares | Value | ||
| Intercontinental Exchange, Inc. | 4,625 | $ 544,409 | |
| Invesco Ltd. | 27,140 | 732,780 | |
| MarketAxess Holdings, Inc. | 2,730 | 1,333,496 | |
| Moody's Corp. | 1,248 | 407,734 | |
| Morgan Stanley | 13,786 | 1,138,034 | |
| MSCI, Inc. | 4,012 | 1,948,909 | |
| Nasdaq, Inc. | 1,070 | 172,848 | |
| Northern Trust Corp. | 1,600 | 182,080 | |
| Raymond James Financial, Inc. | 2,380 | 311,256 | |
| S&P Global, Inc. | 4,295 | 1,676,725 | |
| State Street Corp. | 5,597 | 469,868 | |
| T. Rowe Price Group, Inc. | 1,790 | 320,768 | |
| 14,063,136 | |||
| CHEMICALS (2.1%) | |||
| Air Products and Chemicals, Inc. | 1,563 | 450,894 | |
| Albemarle Corp. | 10,900 | 1,833,053 | |
| CF Industries Holdings, Inc. | 2,020 | 98,233 | |
| Corteva, Inc. | 10,555 | 514,662 | |
| Dow, Inc. | 5,102 | 318,875 | |
| DuPont de Nemours, Inc. | 4,385 | 338,127 | |
| Eastman Chemical Co. | 700 | 80,773 | |
| Ecolab, Inc. | 1,826 | 409,243 | |
| FMC Corp. | 12,350 | 1,460,264 | |
| International Flavors & Fragrances, Inc. | 1,660 | 236,002 | |
| Linde PLC | 3,673 | 1,049,890 | |
| LyondellBasell Industries N.V., Class A | 1,470 | 152,498 | |
| Mosaic Co. (The) | 12,220 | 429,900 | |
| PPG Industries, Inc. | 1,918 | 328,438 | |
| Sherwin-Williams Co. (The) | 1,853 | 507,481 | |
| 8,208,333 | |||
| COMMERCIAL SERVICES & SUPPLIES (0.9%) | |||
| Cintas Corp. | 504 | 173,951 | |
| Copart, Inc.(a) | 10,550 | 1,313,580 | |
| Republic Services, Inc. | 2,056 | 218,553 | |
| Rollins, Inc. | 35,475 | 1,322,508 | |
| Waste Management, Inc. | 3,260 | 449,782 | |
| 3,478,374 | |||
| COMMUNICATIONS EQUIPMENT (0.9%) | |||
| Arista Networks, Inc.(a) | 4,081 | 1,286,209 | |
| Cisco Systems, Inc. | 32,750 | 1,667,302 | |
| F5 Networks, Inc.(a) | 480 | 89,645 | |
| Juniper Networks, Inc. | 6,190 | 157,164 | |
| Motorola Solutions, Inc. | 1,151 | 216,733 | |
| 3,417,053 | |||
| Shares | Value | ||
| CONSTRUCTION & ENGINEERING (0.0%) | |||
| Quanta Services, Inc. | 920 | $ 88,909 | |
| CONSTRUCTION MATERIALS (0.1%) | |||
| Martin Marietta Materials, Inc. | 396 | 139,836 | |
| Vulcan Materials Co. | 943 | 168,080 | |
| 307,916 | |||
| CONSUMER FINANCE (0.6%) | |||
| American Express Co. | 4,840 | 742,214 | |
| Capital One Financial Corp. | 6,218 | 926,979 | |
| Discover Financial Services | 1,980 | 225,720 | |
| Synchrony Financial | 8,420 | 368,291 | |
| 2,263,204 | |||
| CONTAINERS & PACKAGING (0.4%) | |||
| Avery Dennison Corp. | 870 | 186,328 | |
| Ball Corp. | 3,430 | 321,185 | |
| International Paper Co. | 6,990 | 405,420 | |
| Packaging Corp. of America | 1,070 | 157,985 | |
| Sealed Air Corp. | 1,390 | 68,666 | |
| Westrock Co. | 9,869 | 550,197 | |
| 1,689,781 | |||
| DISTRIBUTORS (0.6%) | |||
| Genuine Parts Co. | 900 | 112,473 | |
| LKQ Corp.(a) | 6,880 | 321,365 | |
| Pool Corp. | 4,610 | 1,947,817 | |
| 2,381,655 | |||
| DIVERSIFIED FINANCIAL SERVICES (1.1%) | |||
| Berkshire Hathaway, Inc., Class B(a) | 16,357 | 4,497,357 | |
| DIVERSIFIED TELECOMMUNICATION SERVICES (1.2%) | |||
| AT&T, Inc. | 70,110 | 2,202,155 | |
| Lumen Technologies, Inc. | 58,549 | 751,183 | |
| Verizon Communications, Inc. | 32,930 | 1,903,025 | |
| 4,856,363 | |||
| ELECTRIC UTILITIES (1.3%) | |||
| Alliant Energy Corp. | 2,090 | 117,395 | |
| American Electric Power Co., Inc. | 4,450 | 394,760 | |
| Duke Energy Corp. | 6,084 | 612,598 | |
| Edison International | 3,610 | 214,615 | |
| Entergy Corp. | 150 | 16,394 | |
| Evergy, Inc. | 2,440 | 156,087 | |
| Eversource Energy | 2,840 | 244,865 | |
| Exelon Corp. | 13,889 | 624,172 | |
| Shares | Value | ||
| FirstEnergy Corp. | 5,119 | $ 194,112 | |
| NextEra Energy, Inc. | 15,126 | 1,172,416 | |
| NRG Energy, Inc. | 2,260 | 80,953 | |
| Pinnacle West Capital Corp. | 1,260 | 106,659 | |
| PPL Corp. | 7,780 | 226,631 | |
| Southern Co. (The) | 9,790 | 647,804 | |
| Xcel Energy, Inc. | 5,620 | 400,706 | |
| 5,210,167 | |||
| ELECTRICAL EQUIPMENT (0.9%) | |||
| AMETEK, Inc. | 1,880 | 253,668 | |
| Eaton Corp. PLC | 2,970 | 424,502 | |
| Emerson Electric Co. | 4,840 | 437,972 | |
| Generac Holdings, Inc.(a) | 7,220 | 2,338,919 | |
| Rockwell Automation, Inc. | 826 | 218,279 | |
| 3,673,340 | |||
| ELECTRONIC EQUIPMENT, INSTRUMENTS & COMPONENTS (0.8%) | |||
| Amphenol Corp., Class A | 5,510 | 371,043 | |
| CDW Corp. | 880 | 156,930 | |
| Corning, Inc. | 7,180 | 317,428 | |
| FLIR Systems, Inc. | 1,270 | 76,162 | |
| IPG Photonics Corp.(a) | 240 | 52,106 | |
| Keysight Technologies, Inc.(a) | 1,470 | 212,195 | |
| TE Connectivity Ltd. | 2,340 | 314,660 | |
| Trimble, Inc.(a) | 18,560 | 1,521,920 | |
| Zebra Technologies Corp., Class A(a) | 370 | 180,464 | |
| 3,202,908 | |||
| ENERGY EQUIPMENT & SERVICES (0.1%) | |||
| Baker Hughes Co. | 6,719 | 134,918 | |
| Halliburton Co. | 5,740 | 112,274 | |
| NOV, Inc.(a) | 5,216 | 77,979 | |
| Schlumberger N.V. | 9,404 | 254,378 | |
| 579,549 | |||
| ENTERTAINMENT (1.7%) | |||
| Activision Blizzard, Inc. | 6,160 | 561,731 | |
| Electronic Arts, Inc. | 2,540 | 360,883 | |
| Live Nation, Inc.(a) | 1,030 | 84,336 | |
| Netflix, Inc.(a) | 6,770 | 3,476,192 | |
| Walt Disney Co. (The)(a) | 12,740 | 2,369,895 | |
| 6,853,037 | |||
| EQUITY REAL ESTATE INVESTMENT TRUSTS (1.6%) | |||
| Alexandria Real Estate Equities, Inc. | 810 | 146,691 | |
| American Tower Corp. | 3,019 | 769,151 | |
| Shares | Value | ||
| AvalonBay Communities, Inc. | 659 | $ 126,528 | |
| Boston Properties, Inc. | 260 | 28,431 | |
| Crown Castle International Corp. | 3,020 | 570,961 | |
| Digital Realty Trust, Inc. | 2,050 | 316,335 | |
| Duke Realty Corp. | 5,140 | 239,113 | |
| Equinix, Inc. | 573 | 412,995 | |
| Equity Residential | 2,580 | 191,513 | |
| Essex Property Trust, Inc. | 257 | 74,664 | |
| Extra Space Storage, Inc. | 980 | 145,716 | |
| Healthpeak Properties, Inc. | 8,580 | 294,637 | |
| Host Hotels & Resorts, Inc.(a) | 12,433 | 225,783 | |
| Iron Mountain, Inc. | 3,019 | 121,122 | |
| Kimco Realty Corp. | 10,690 | 224,490 | |
| Mid-America Apartment Communities, Inc. | 590 | 92,825 | |
| Prologis, Inc. | 5,352 | 623,669 | |
| Public Storage | 1,216 | 341,891 | |
| Realty Income Corp. | 2,450 | 169,417 | |
| Regency Centers Corp. | 750 | 47,745 | |
| SBA Communications Corp. | 721 | 216,098 | |
| Simon Property Group, Inc. | 1,940 | 236,176 | |
| UDR, Inc. | 2,330 | 108,229 | |
| Ventas, Inc. | 2,350 | 130,331 | |
| Vornado Realty Trust | 825 | 37,744 | |
| Welltower, Inc. | 2,540 | 190,576 | |
| Weyerhaeuser Co. | 6,589 | 255,456 | |
| 6,338,287 | |||
| FOOD & STAPLES RETAILING (1.2%) | |||
| Costco Wholesale Corp. | 3,196 | 1,189,200 | |
| Kroger Co. (The) | 22,900 | 836,766 | |
| Sysco Corp. | 3,580 | 303,333 | |
| Walgreens Boots Alliance, Inc. | 16,550 | 878,805 | |
| Walmart, Inc. | 11,340 | 1,586,579 | |
| 4,794,683 | |||
| FOOD PRODUCTS (1.3%) | |||
| Archer-Daniels-Midland Co. | 13,810 | 871,825 | |
| Campbell Soup Co. | 3,350 | 159,963 | |
| Conagra Brands, Inc. | 6,220 | 230,700 | |
| General Mills, Inc. | 7,690 | 468,013 | |
| Hershey Co. (The) | 1,430 | 234,949 | |
| Hormel Foods Corp. | 6,330 | 292,446 | |
| J.M. Smucker Co. (The) | 2,580 | 337,954 | |
| Kellogg Co. | 4,580 | 285,884 | |
| Kraft Heinz Co. (The) | 14,296 | 590,282 | |
| Lamb Weston Holdings, Inc. | 1,000 | 80,500 | |
| Shares | Value | ||
| McCormick & Co., Inc. | 2,640 | $ 238,550 | |
| Mondelez International, Inc., Class A | 13,170 | 800,868 | |
| Tyson Foods, Inc., Class A | 7,820 | 605,659 | |
| 5,197,593 | |||
| GAS UTILITIES (0.0%) | |||
| Atmos Energy Corp. | 1,350 | 139,847 | |
| HEALTH CARE EQUIPMENT & SUPPLIES (5.7%) | |||
| Abbott Laboratories | 14,232 | 1,708,979 | |
| ABIOMED, Inc.(a) | 5,363 | 1,720,075 | |
| Align Technology, Inc.(a) | 4,927 | 2,934,176 | |
| Baxter International, Inc. | 5,890 | 504,714 | |
| Becton Dickinson and Co. | 2,446 | 608,589 | |
| Boston Scientific Corp.(a) | 15,327 | 668,257 | |
| Danaher Corp. | 5,960 | 1,513,482 | |
| DENTSPLY SIRONA, Inc. | 2,670 | 180,252 | |
| DexCom, Inc.(a) | 5,600 | 2,162,160 | |
| Edwards Lifesciences Corp.(a) | 6,251 | 597,096 | |
| Hologic, Inc.(a) | 2,990 | 195,995 | |
| IDEXX Laboratories, Inc.(a) | 4,490 | 2,464,965 | |
| Intuitive Surgical, Inc.(a) | 919 | 794,935 | |
| Medtronic PLC | 11,433 | 1,496,808 | |
| ResMed, Inc. | 6,360 | 1,195,489 | |
| STERIS PLC | 1,120 | 236,342 | |
| Stryker Corp. | 2,844 | 746,920 | |
| Teleflex, Inc. | 477 | 201,523 | |
| West Pharmaceutical Services, Inc. | 6,800 | 2,233,936 | |
| Zimmer Holdings, Inc. | 1,910 | 338,376 | |
| 22,503,069 | |||
| HEALTH CARE PROVIDERS & SERVICES (2.5%) | |||
| AmerisourceBergen Corp. | 3,480 | 420,384 | |
| Anthem, Inc. | 4,711 | 1,787,306 | |
| Cardinal Health, Inc. | 9,040 | 545,474 | |
| Cigna Corp. | 5,200 | 1,294,852 | |
| CVS Health Corp. | 18,217 | 1,391,779 | |
| DaVita, Inc.(a) | 17,290 | 2,014,804 | |
| Henry Schein, Inc.(a) | 3,950 | 286,375 | |
| Humana, Inc. | 2,027 | 902,501 | |
| Laboratory Corporation of America Holdings(a) | 940 | 249,918 | |
| McKesson Corp. | 3,555 | 666,776 | |
| Quest Diagnostics, Inc. | 1,800 | 237,384 | |
| 9,797,553 | |||
| HEALTH CARE TECHNOLOGY (0.1%) | |||
| Cerner Corp. | 4,180 | 313,709 | |
| Shares | Value | ||
| HOTELS, RESTAURANTS & LEISURE (1.9%) | |||
| Booking Holdings, Inc.(a) | 276 | $ 680,638 | |
| Carnival Corp.(a) | 6,650 | 185,934 | |
| Chipotle Mexican Grill, Inc.(a) | 1,141 | 1,702,406 | |
| Domino's Pizza, Inc. | 4,220 | 1,782,275 | |
| Expedia Group, Inc.(a) | 915 | 161,250 | |
| Hilton Worldwide Holdings, Inc.(a) | 1,820 | 234,234 | |
| Marriott International, Inc., Class A(a) | 1,766 | 262,286 | |
| McDonald's Corp. | 5,231 | 1,234,934 | |
| Norwegian Cruise Line Holdings Ltd.(a) | 2,830 | 87,872 | |
| Royal Caribbean Cruises Ltd.(a) | 1,340 | 116,513 | |
| Starbucks Corp. | 8,310 | 951,412 | |
| Yum! Brands, Inc. | 2,480 | 296,410 | |
| 7,696,164 | |||
| HOUSEHOLD DURABLES (0.5%) | |||
| D.R. Horton, Inc. | 1,756 | 172,597 | |
| Garmin Ltd. | 1,240 | 170,178 | |
| Leggett & Platt, Inc. | 870 | 43,213 | |
| Lennar Corp., Class A | 3,850 | 398,860 | |
| Mohawk Industries, Inc.(a) | 2,724 | 559,782 | |
| Newell Brands, Inc. | 4,820 | 129,947 | |
| NVR, Inc.(a) | 14 | 70,253 | |
| PulteGroup, Inc. | 1,165 | 68,875 | |
| Whirlpool Corp. | 1,432 | 338,597 | |
| 1,952,302 | |||
| HOUSEHOLD PRODUCTS (1.0%) | |||
| Church & Dwight Co., Inc. | 3,330 | 285,514 | |
| Clorox Co. (The) | 1,280 | 233,600 | |
| Colgate-Palmolive Co. | 8,620 | 695,634 | |
| Kimberly-Clark Corp. | 3,420 | 455,954 | |
| Procter & Gamble Co. (The) | 18,661 | 2,489,751 | |
| 4,160,453 | |||
| INDEPENDENT POWER AND RENEWABLE ELECTRICITY PRODUCERS (0.1%) | |||
| AES Corp. (The) | 7,070 | 196,687 | |
| INDUSTRIAL CONGLOMERATES (0.6%) | |||
| 3M Co. | 4,634 | 913,547 | |
| Honeywell International, Inc. | 5,032 | 1,122,337 | |
| Roper Technologies, Inc. | 766 | 341,973 | |
| 2,377,857 | |||
| INSURANCE (3.1%) | |||
| Aflac, Inc. | 13,220 | 710,311 | |
| Allstate Corp. (The) | 5,550 | 703,740 | |
| Shares | Value | ||
| American International Group, Inc. | 13,884 | $ 672,680 | |
| Aon PLC, Class A | 1,701 | 427,700 | |
| Arthur J. Gallagher & Co. | 1,720 | 249,314 | |
| Assurant, Inc. | 2,710 | 421,676 | |
| Chubb Ltd. | 4,351 | 746,588 | |
| Cincinnati Financial Corp. | 3,512 | 395,732 | |
| Everest Re Group Ltd. | 1,600 | 443,120 | |
| Globe Life, Inc. | 2,617 | 268,216 | |
| Hartford Financial Services Group, Inc. (The) | 11,730 | 773,711 | |
| Lincoln National Corp. | 11,426 | 732,749 | |
| Loews Corp. | 8,500 | 473,875 | |
| Marsh & McLennan Cos., Inc. | 4,070 | 552,299 | |
| MetLife, Inc. | 16,470 | 1,047,986 | |
| Principal Financial Group, Inc. | 9,900 | 632,313 | |
| Progressive Corp. (The) | 5,170 | 520,826 | |
| Prudential Financial, Inc. | 8,245 | 827,468 | |
| Travelers Cos., Inc. (The) | 3,870 | 598,534 | |
| Unum Group | 31,120 | 879,451 | |
| Willis Towers Watson PLC | 917 | 237,375 | |
| 12,315,664 | |||
| INTERACTIVE MEDIA & SERVICES (5.0%) | |||
| Alphabet, Inc., Class A(a) | 2,455 | 5,777,843 | |
| Alphabet, Inc., Class C(a) | 2,349 | 5,661,372 | |
| Facebook, Inc., Class A(a) | 22,048 | 7,167,364 | |
| Twitter, Inc.(a) | 25,570 | 1,411,975 | |
| 20,018,554 | |||
| INTERNET & DIRECT MARKETING RETAIL (4.4%) | |||
| Amazon.com, Inc.(a) | 3,580 | 12,413,364 | |
| eBay, Inc. | 31,160 | 1,738,416 | |
| Etsy, Inc.(a) | 16,070 | 3,194,555 | |
| 17,346,335 | |||
| IT SERVICES (4.1%) | |||
| Accenture PLC, Class A | 4,527 | 1,312,694 | |
| Akamai Technologies, Inc.(a) | 1,490 | 161,963 | |
| Automatic Data Processing, Inc. | 3,230 | 603,978 | |
| Broadridge Financial Solutions, Inc. | 890 | 141,181 | |
| Cognizant Technology Solutions Corp., Class A | 4,150 | 333,660 | |
| DXC Technology Co.(a) | 6,747 | 222,044 | |
| Fidelity National Information Services, Inc. | 4,386 | 670,619 | |
| Fiserv, Inc.(a) | 4,220 | 506,906 | |
| FleetCor Technologies, Inc.(a) | 510 | 146,737 | |
| Gartner, Inc.(a) | 470 | 92,064 | |
| Global Payments, Inc. | 2,007 | 430,762 | |
| International Business Machines Corp. | 6,086 | 863,482 | |
| Shares | Value | ||
| Jack Henry & Associates, Inc. | 700 | $ 113,981 | |
| Mastercard, Inc., Class A | 6,032 | 2,304,586 | |
| Paychex, Inc. | 3,250 | 316,843 | |
| PayPal Holdings, Inc.(a) | 19,150 | 5,022,853 | |
| VeriSign, Inc.(a) | 722 | 157,952 | |
| Visa, Inc., Class A | 12,054 | 2,815,332 | |
| Western Union Co. (The) | 6,970 | 179,547 | |
| 16,397,184 | |||
| LEISURE PRODUCTS (0.0%) | |||
| Hasbro, Inc. | 780 | 77,571 | |
| LIFE SCIENCES TOOLS & SERVICES (1.8%) | |||
| Agilent Technologies, Inc. | 5,000 | 668,200 | |
| Bio-Rad Laboratories, Inc., Class A(a) | 3,370 | 2,123,538 | |
| Illumina, Inc.(a) | 1,247 | 489,871 | |
| IQVIA Holdings, Inc.(a) | 2,550 | 598,460 | |
| Mettler-Toledo International, Inc.(a) | 1,193 | 1,566,791 | |
| PerkinElmer, Inc. | 10,530 | 1,365,004 | |
| Waters Corp.(a) | 1,067 | 319,961 | |
| 7,131,825 | |||
| MACHINERY (1.1%) | |||
| Caterpillar, Inc. | 3,890 | 887,348 | |
| Cummins, Inc. | 1,007 | 253,804 | |
| Deere & Co. | 2,173 | 805,857 | |
| Dover Corp. | 810 | 120,844 | |
| Fortive Corp. | 2,800 | 198,296 | |
| IDEX Corp. | 510 | 114,342 | |
| Illinois Tool Works, Inc. | 2,014 | 464,146 | |
| Ingersoll Rand, Inc.(a) | 2,638 | 130,344 | |
| Otis Worldwide Corp. | 3,803 | 296,140 | |
| PACCAR, Inc. | 2,855 | 256,607 | |
| Parker-Hannifin Corp. | 718 | 225,316 | |
| Snap-on, Inc. | 300 | 71,280 | |
| Stanley Black & Decker, Inc. | 892 | 184,439 | |
| Westinghouse Air Brake Technologies Corp. | 2,980 | 244,569 | |
| Xylem, Inc. | 1,410 | 156,016 | |
| 4,409,348 | |||
| MEDIA (1.5%) | |||
| Charter Communications, Inc., Class A(a) | 2,840 | 1,912,598 | |
| Comcast Corp., Class A | 33,490 | 1,880,463 | |
| Discovery, Inc., Class A(a) | 5,380 | 202,611 | |
| Discovery, Inc., Class C(a) | 4,541 | 146,720 | |
| DISH Network Corp., Class A(a) | 7,730 | 346,227 | |
| Fox Corp., Class A | 5,730 | 214,417 | |
| Fox Corp., Class B | 2,640 | 96,043 | |
| Shares | Value | ||
| Interpublic Group of Cos., Inc. (The) | 10,430 | $ 331,152 | |
| News Corp., Class A | 7,990 | 209,298 | |
| News Corp., Class B | 5,390 | 131,031 | |
| Omnicom Group, Inc. | 1,590 | 130,793 | |
| ViacomCBS, Inc., Class B | 11,430 | 468,859 | |
| 6,070,212 | |||
| METALS & MINING (0.4%) | |||
| Freeport-McMoRan, Inc. | 11,368 | 428,687 | |
| Newmont Corp. | 6,890 | 430,005 | |
| Nucor Corp. | 6,640 | 546,207 | |
| 1,404,899 | |||
| MULTILINE RETAIL (0.7%) | |||
| Dollar General Corp. | 7,960 | 1,709,410 | |
| Dollar Tree, Inc.(a) | 1,692 | 194,411 | |
| Target Corp. | 3,520 | 729,555 | |
| 2,633,376 | |||
| MULTI-UTILITIES (0.7%) | |||
| Ameren Corp. | 2,990 | 253,672 | |
| CenterPoint Energy, Inc. | 8,970 | 219,675 | |
| CMS Energy Corp. | 4,000 | 257,560 | |
| Consolidated Edison, Inc. | 5,020 | 388,598 | |
| Dominion Energy, Inc. | 6,852 | 547,475 | |
| DTE Energy Co. | 970 | 135,819 | |
| NiSource, Inc. | 7,770 | 202,175 | |
| Public Service Enterprise Group, Inc. | 4,616 | 291,547 | |
| Sempra Energy | 1,800 | 247,626 | |
| WEC Energy Group, Inc. | 3,145 | 305,600 | |
| 2,849,747 | |||
| OIL, GAS & CONSUMABLE FUELS (2.4%) | |||
| APA Corp. | 3,040 | 60,800 | |
| Cabot Oil & Gas Corp. | 4,320 | 72,014 | |
| Chevron Corp. | 14,133 | 1,456,688 | |
| ConocoPhillips | 8,497 | 434,537 | |
| Devon Energy Corp. | 5,350 | 125,083 | |
| Diamondback Energy, Inc. | 640 | 52,307 | |
| EOG Resources, Inc. | 4,724 | 347,875 | |
| Exxon Mobil Corp. | 38,380 | 2,196,871 | |
| Hess Corp. | 1,320 | 98,353 | |
| HollyFrontier Corp. | 21,620 | 756,700 | |
| Kinder Morgan, Inc. | 43,610 | 743,551 | |
| Marathon Oil Corp. | 40,090 | 451,414 | |
| Marathon Petroleum Corp. | 9,558 | 531,903 | |
| Occidental Petroleum Corp. | 6,003 | 152,236 | |
| ONEOK, Inc. | 2,730 | 142,888 | |
| Phillips 66 | 8,309 | 672,281 | |
| Shares | Value | ||
| Pioneer Natural Resources Co. | 1,956 | $ 300,892 | |
| Valero Energy Corp. | 11,070 | 818,737 | |
| Williams Cos., Inc. (The) | 12,570 | 306,205 | |
| 9,721,335 | |||
| PERSONAL PRODUCTS (0.1%) | |||
| Estee Lauder Cos., Inc., (The) Class A | 1,688 | 529,694 | |
| PHARMACEUTICALS (1.3%) | |||
| Catalent, Inc.(a) | 18,060 | 2,031,208 | |
| Eli Lilly and Co. | 6,520 | 1,191,660 | |
| Perrigo Co. PLC | 8,661 | 360,558 | |
| Viatris, Inc.(a) | 44,870 | 596,771 | |
| Zoetis, Inc. | 5,450 | 943,014 | |
| 5,123,211 | |||
| PROFESSIONAL SERVICES (0.5%) | |||
| Equifax, Inc. | 800 | 183,384 | |
| IHS Markit Ltd. | 3,230 | 347,484 | |
| Jacobs Engineering Group, Inc. | 880 | 117,577 | |
| Nielsen Holdings PLC | 4,160 | 106,704 | |
| Robert Half International, Inc. | 1,240 | 108,636 | |
| Verisk Analytics, Inc. | 5,860 | 1,102,852 | |
| 1,966,637 | |||
| REAL ESTATE MANAGEMENT & DEVELOPMENT (0.1%) | |||
| CBRE Group, Inc., Class A(a) | 4,570 | 389,364 | |
| ROAD & RAIL (1.0%) | |||
| CSX Corp. | 5,940 | 598,455 | |
| J.B. Hunt Transport Services, Inc. | 720 | 122,911 | |
| Kansas City Southern Industries, Inc. | 520 | 151,949 | |
| Norfolk Southern Corp. | 1,628 | 454,603 | |
| Old Dominion Freight Line, Inc. | 6,460 | 1,665,453 | |
| Union Pacific Corp. | 4,645 | 1,031,608 | |
| 4,024,979 | |||
| SEMICONDUCTORS & SEMICONDUCTOR EQUIPMENT (8.2%) | |||
| Advanced Micro Devices, Inc.(a) | 29,100 | 2,375,142 | |
| Analog Devices, Inc. | 2,464 | 377,386 | |
| Applied Materials, Inc. | 18,550 | 2,461,770 | |
| Broadcom, Inc. | 2,722 | 1,241,776 | |
| Enphase Energy, Inc.(a) | 14,200 | 1,977,350 | |
| Intel Corp. | 28,290 | 1,627,524 | |
| KLA Corp. | 7,300 | 2,302,055 | |
| Lam Research Corp. | 4,036 | 2,504,136 | |
| Maxim Integrated Products, Inc. | 2,230 | 209,620 | |
| Microchip Technology, Inc. | 1,440 | 216,418 | |
| Micron Technology, Inc.(a) | 7,930 | 682,535 | |
| Shares | Value | ||
| Monolithic Power Systems, Inc. | 7,400 | $ 2,674,212 | |
| NVIDIA Corp. | 8,312 | 4,990,359 | |
| NXP Semiconductors N.V. | 1,580 | 304,166 | |
| Qorvo, Inc.(a) | 7,690 | 1,447,027 | |
| QUALCOMM, Inc. | 17,940 | 2,490,072 | |
| Skyworks Solutions, Inc. | 1,030 | 186,770 | |
| Teradyne, Inc. | 20,210 | 2,527,867 | |
| Texas Instruments, Inc. | 6,270 | 1,131,798 | |
| Xilinx, Inc. | 8,490 | 1,086,380 | |
| 32,814,363 | |||
| SOFTWARE (10.0%) | |||
| Adobe, Inc.(a) | 7,151 | 3,635,139 | |
| ANSYS, Inc.(a) | 3,593 | 1,313,817 | |
| Autodesk, Inc.(a) | 8,200 | 2,393,662 | |
| Cadence Design Systems, Inc.(a) | 13,890 | 1,830,285 | |
| Citrix Systems, Inc. | 1,100 | 136,235 | |
| Fortinet, Inc.(a) | 11,450 | 2,338,434 | |
| Intuit, Inc. | 4,982 | 2,053,381 | |
| Microsoft Corp. | 57,340 | 14,460,001 | |
| NortonLifeLock, Inc. | 8,472 | 183,080 | |
| Oracle Corp. | 13,951 | 1,057,346 | |
| Paycom Software, Inc.(a) | 4,480 | 1,722,157 | |
| salesforce.com, Inc.(a) | 13,660 | 3,146,171 | |
| ServiceNow, Inc.(a) | 5,790 | 2,931,882 | |
| Synopsys, Inc.(a) | 6,600 | 1,630,596 | |
| Tyler Technologies, Inc.(a) | 2,400 | 1,019,664 | |
| 39,851,850 | |||
| SPECIALTY RETAIL (2.0%) | |||
| Advance Auto Parts, Inc. | 1,076 | 215,372 | |
| AutoZone, Inc.(a) | 141 | 206,441 | |
| Best Buy Co., Inc. | 1,610 | 187,195 | |
| CarMax, Inc.(a) | 2,220 | 295,793 | |
| Gap, Inc. (The) | 6,460 | 213,826 | |
| Home Depot, Inc. (The) | 7,409 | 2,398,071 | |
| L Brands, Inc.(a) | 1,580 | 104,122 | |
| Lowe’s Cos., Inc. | 5,100 | 1,000,875 | |
| O'Reilly Automotive, Inc.(a) | 462 | 255,430 | |
| Ross Stores, Inc. | 2,070 | 271,046 | |
| TJX Cos., Inc. (The) | 8,640 | 613,440 | |
| Tractor Supply Co. | 11,600 | 2,187,760 | |
| Ulta Beauty, Inc.(a) | 361 | 118,895 | |
| 8,068,266 | |||
| TECHNOLOGY HARDWARE, STORAGE & PERIPHERALS (4.6%) | |||
| Apple, Inc. | 120,134 | 15,792,816 | |
| Shares | Value | ||
| Hewlett Packard Enterprise Co. | 64,820 | $ 1,038,416 | |
| HP, Inc. | 20,170 | 687,999 | |
| NetApp, Inc. | 1,920 | 143,405 | |
| Seagate Technology PLC | 2,000 | 185,680 | |
| Western Digital Corp.(a) | 6,701 | 473,291 | |
| 18,321,607 | |||
| TEXTILES, APPAREL & LUXURY GOODS (0.5%) | |||
| Hanesbrands, Inc. | 8,270 | 174,166 | |
| NIKE, Inc., Class B | 9,010 | 1,194,906 | |
| PVH Corp.(a) | 1,690 | 191,274 | |
| Tapestry, Inc.(a) | 2,330 | 111,490 | |
| Under Armour, Inc., Class A(a) | 4,150 | 100,887 | |
| Under Armour, Inc., Class C(a) | 1,024 | 20,388 | |
| VF Corp. | 1,695 | 148,584 | |
| 1,941,695 | |||
| TRADING COMPANIES & DISTRIBUTORS (0.7%) | |||
| Fastenal Co. | 5,840 | 305,315 | |
| United Rentals, Inc.(a) | 7,010 | 2,242,849 | |
| W.W. Grainger, Inc. | 288 | 124,860 | |
| 2,673,024 | |||
| WATER UTILITIES (0.1%) | |||
| American Water Works Co., Inc. | 1,470 | 229,305 | |
| WIRELESS TELECOMMUNICATION SERVICES (0.2%) | |||
| T-Mobile U.S., Inc.(a) | 5,220 | 689,719 | |
| TOTAL COMMON STOCKS (COST $275,386,406) | 394,965,850 | ||
| MONEY MARKET FUND (0.7%) | |||
| Northern Institutional Treasury Portfolio (Premier Class), 0.01%(b) | 2,867,962 | 2,867,962 | |
| TOTAL MONEY MARKET FUND (COST $2,867,962) | 2,867,962 | ||
| TOTAL INVESTMENTS (COST $278,254,368) 100.0% | 397,833,812 | ||
| OTHER ASSETS IN EXCESS OF LIABILITIES 0.0% | 137,726 | ||
| NET ASSETS 100.0% | $ 397,971,538 | ||
| (a) | Represents non-income producing security. |
| (b) | 7-day current yield as of April 30, 2021 is disclosed. |
| MSCI — Morgan Stanley Capital International |
| PLC — Public Limited Company |
| S&P — Standard & Poor's |
The table below sets forth the diversification of the Steward Select Bond Fund investments by Industry.
| Industry Diversification | Percent* | |
| U.S. Government Agencies | 11.7% | |
| U.S. Treasury Obligations | 9.1 | |
| Money Market Fund | 6.1 | |
| U.S. Government Agency Mortgage-Backed Obligations | 5.9 | |
| Semiconductors & Semiconductor Equipment | 5.0 | |
| IT Services | 4.2 | |
| Textiles, Apparel & Luxury Goods | 4.0 | |
| Oil, Gas & Consumable Fuels | 3.6 | |
| Air Freight & Logistics | 3.5 | |
| Software | 3.5 | |
| Hotels, Restaurants & Leisure | 3.2 | |
| Food & Staples Retailing | 3.0 | |
| Food Products | 2.6 | |
| Aerospace & Defense | 2.4 | |
| Banks | 2.3 | |
| Specialty Retail | 2.3 | |
| Capital Markets | 2.0 | |
| Beverages | 1.9 | |
| Biotechnology | 1.8 | |
| Health Care Providers & Services | 1.8 | |
| Internet & Direct Marketing Retail | 1.8 |
| Industry Diversification | Percent* | |
| Machinery | 1.7% | |
| Media | 1.7 | |
| Technology Hardware, Storage & Peripherals | 1.6 | |
| Insurance | 1.4 | |
| Multiline Retail | 1.2 | |
| Communications Equipment | 1.2 | |
| Consumer Finance | 1.2 | |
| Commercial Services & Supplies | 1.2 | |
| Industrial Conglomerates | 1.2 | |
| Entertainment | 1.2 | |
| Road & Rail | 1.1 | |
| Health Care Equipment & Supplies | 1.1 | |
| Chemicals | 1.1 | |
| Household Products | 0.6 | |
| Electronic Equipment, Instruments & Components | 0.6 | |
| Pharmaceuticals | 0.5 | |
| Household Durables | 0.5 | |
| Municipal Bonds | 0.2 | |
| Thrifts & Mortgage Finance | 0.1 | |
| Total Investments | 101.1% |
| * | Percentages indicated are based on net assets as of April 30, 2021. |
| Principal Amount | Value | ||
| CORPORATE BONDS (67.6%) | |||
| AEROSPACE & DEFENSE (2.4%) | |||
| General Dynamics Corp., 3.75%, 5/15/28, (Callable 2/15/28 @ 100) | $ 2,000,000 | $ 2,238,841 | |
| Raytheon Technologies Corp., 4.13%, 11/16/28, (Callable 8/16/28 @ 100) | 2,000,000 | 2,270,458 | |
| 4,509,299 | |||
| AIR FREIGHT & LOGISTICS (3.5%) | |||
| FedEx Corp., 4.00%, 1/15/24 | 2,000,000 | 2,188,365 | |
| United Parcel Service, Inc., 3.05%, 11/15/27, (Callable 8/15/27 @ 100) | 1,000,000 | 1,098,906 | |
| United Parcel Service, Inc., 3.75%, 11/15/47, (Callable 5/15/47 @ 100) | 1,000,000 | 1,121,487 | |
| United Parcel Service, Inc., 3.90%, 4/1/25, (Callable 3/1/25 @ 100) | 2,000,000 | 2,223,349 | |
| 6,632,107 | |||
| BANKS (2.1%) | |||
| Citigroup, Inc., 6.63%, 6/15/32 | 1,000,000 | 1,334,899 | |
| U.S. Bank NA/Cincinnati OH, 2.80%, 1/27/25, (Callable 12/27/24 @ 100) | 2,500,000 | 2,679,787 | |
| 4,014,686 | |||
| BEVERAGES (1.9%) | |||
| PepsiCo, Inc., 3.00%, 8/25/21 | 3,435,000 | 3,465,019 | |
| BIOTECHNOLOGY (1.8%) | |||
| AbbVie, Inc., 4.50%, 5/14/35, (Callable 11/14/34 @ 100) | 1,500,000 | 1,758,938 | |
| Celgene Corp., 3.88%, 8/15/25, (Callable 5/15/25 @ 100) | 472,000 | 518,175 | |
| Gilead Sciences, Inc., 4.40%, 12/1/21, (Callable 9/1/21 @ 100) | 1,000,000 | 1,013,490 | |
| 3,290,603 | |||
| CAPITAL MARKETS (2.0%) | |||
| Charles Schwab Corp. (The), 2.00%, 3/20/28, (Callable 1/20/28 @ 100) | 2,000,000 | 2,020,581 | |
| Goldman Sachs Group, Inc. (The), 5.95%, 1/15/27 | 1,500,000 | 1,816,374 | |
| 3,836,955 | |||
| CHEMICALS (1.1%) | |||
| Sherwin-Williams Co. (The), 2.95%, 8/15/29, (Callable 5/15/29 @ 100) | 1,000,000 | 1,053,034 | |
| Sherwin-Williams Co. (The), 3.80%, 8/15/49, (Callable 2/15/49 @ 100) | 1,000,000 | 1,080,926 | |
| 2,133,960 | |||
| COMMERCIAL SERVICES & SUPPLIES (1.2%) | |||
| Waste Management, Inc., 3.15%, 11/15/27, (Callable 8/15/27 @ 100) | 2,000,000 | 2,176,051 | |
| COMMUNICATIONS EQUIPMENT (1.2%) | |||
| Cisco Systems, Inc., 2.50%, 9/20/26, (Callable 6/20/26 @ 100) | 2,000,000 | 2,152,935 | |
| Principal Amount | Value | ||
| CONSUMER FINANCE (1.2%) | |||
| American Express Co., 3.40%, 2/22/24, (Callable 1/22/24 @ 100) | $ 1,000,000 | $ 1,080,064 | |
| American Express Credit Corp., 3.30%, 5/3/27, (Callable 4/3/27 @ 100) | 1,000,000 | 1,106,266 | |
| 2,186,330 | |||
| ELECTRONIC EQUIPMENT, INSTRUMENTS & COMPONENTS (0.6%) | |||
| Corning, Inc., 3.70%, 11/15/23, (Callable 8/15/23 @ 100) | 1,000,000 | 1,069,596 | |
| ENTERTAINMENT (1.2%) | |||
| Walt Disney Co. (The), 3.80%, 3/22/30 | 2,000,000 | 2,238,226 | |
| FOOD & STAPLES RETAILING (3.0%) | |||
| Sysco Corp., 3.25%, 7/15/27, (Callable 4/15/27 @ 100) | 2,000,000 | 2,163,657 | |
| Walgreens Boots Alliance, Inc., 4.50%, 11/18/34, (Callable 5/18/34 @ 100) | 2,000,000 | 2,305,439 | |
| Walmart, Inc., 3.25%, 7/8/29, (Callable 4/8/29 @ 100) | 1,000,000 | 1,108,793 | |
| 5,577,889 | |||
| FOOD PRODUCTS (2.6%) | |||
| General Mills, Inc., 4.20%, 4/17/28, (Callable 1/17/28 @ 100) | 2,000,000 | 2,279,057 | |
| J.M. Smucker Co. (The), 3.50%, 10/15/21 | 500,000 | 507,087 | |
| Tyson Foods, Inc., 4.50%, 6/15/22, (Callable 3/15/22 @ 100) | 2,000,000 | 2,071,250 | |
| 4,857,394 | |||
| HEALTH CARE EQUIPMENT & SUPPLIES (1.1%) | |||
| Abbott Laboratories, 2.95%, 3/15/25, (Callable 12/15/24 @ 100) | 2,000,000 | 2,152,585 | |
| HEALTH CARE PROVIDERS & SERVICES (1.8%) | |||
| CVS Health Corp., 4.00%, 12/5/23, (Callable 9/5/23 @ 100) | 2,000,000 | 2,159,125 | |
| Evernorth Health, Inc., 4.50%, 2/25/26, (Callable 11/27/25 @ 100) | 1,000,000 | 1,128,129 | |
| 3,287,254 | |||
| HOTELS, RESTAURANTS & LEISURE (3.2%) | |||
| McDonald’s Corp., 3.70%, 1/30/26, (Callable 10/30/25 @ 100) | 2,500,000 | 2,780,322 | |
| McDonald's Corp., 3.60%, 7/1/30, (Callable 4/1/30 @ 100) | 1,000,000 | 1,102,865 | |
| Starbucks Corp., 3.75%, 12/1/47, (Callable 6/1/47 @ 100) | 2,000,000 | 2,121,041 | |
| 6,004,228 | |||
| HOUSEHOLD DURABLES (0.5%) | |||
| Newell Brands, Inc., 4.00%, 6/15/22, (Callable 3/15/22 @ 100) | 1,000,000 | 1,027,500 | |
| Principal Amount | Value | ||
| HOUSEHOLD PRODUCTS (0.6%) | |||
| Procter & Gamble Co. (The), 3.10%, 8/15/23 | $ 1,000,000 | $ 1,064,848 | |
| INDUSTRIAL CONGLOMERATES (1.2%) | |||
| 3M Co., 2.88%, 10/15/27, (Callable 7/15/27 @ 100) | 2,000,000 | 2,158,235 | |
| INSURANCE (1.1%) | |||
| Prudential Financial, Inc., 5.88% (US0003M + 418 bps), 9/15/42, (Callable 9/15/22 @ 100)(a) | 2,000,000 | 2,118,955 | |
| INTERNET & DIRECT MARKETING RETAIL (1.8%) | |||
| Amazon.com, Inc., 3.80%, 12/5/24, (Callable 9/5/24 @ 100) | 3,000,000 | 3,328,301 | |
| IT SERVICES (4.2%) | |||
| Fiserv, Inc., 4.20%, 10/1/28, (Callable 7/1/28 @ 100) | 1,000,000 | 1,135,298 | |
| Mastercard, Inc., 3.38%, 4/1/24 | 2,000,000 | 2,168,046 | |
| PayPal Holdings, Inc., 2.85%, 10/1/29, (Callable 7/1/29 @ 100) | 2,000,000 | 2,113,333 | |
| Visa, Inc., 4.30%, 12/14/45, (Callable 6/14/45 @ 100) | 2,000,000 | 2,461,306 | |
| 7,877,983 | |||
| MACHINERY (1.7%) | |||
| Caterpillar, Inc., 3.90%, 5/27/21 | 1,000,000 | 1,002,267 | |
| John Deere Capital Corp., 3.45%, 3/13/25 | 2,000,000 | 2,196,299 | |
| 3,198,566 | |||
| MEDIA (1.7%) | |||
| Comcast Corp., 3.70%, 4/15/24, (Callable 3/15/24 @ 100) | 3,000,000 | 3,271,002 | |
| MULTILINE RETAIL (1.2%) | |||
| Target Corp., 3.50%, 7/1/24 | 2,000,000 | 2,190,322 | |
| OIL, GAS & CONSUMABLE FUELS (3.6%) | |||
| Apache Corp., 3.25%, 4/15/22, (Callable 1/15/22 @ 100) | 724,000 | 729,430 | |
| ConocoPhillips Co., 4.95%, 3/15/26, (Callable 12/15/25 @ 100) | 1,000,000 | 1,167,680 | |
| Gulf South Pipeline Co. LP, 4.00%, 6/15/22, (Callable 3/17/22 @ 100) | 1,500,000 | 1,537,495 | |
| Valero Energy Corp., 4.00%, 4/1/29, (Callable 1/1/29 @ 100) | 3,000,000 | 3,274,172 | |
| 6,708,777 | |||
| PHARMACEUTICALS (0.5%) | |||
| Teva Pharmaceutical Finance, 3.65%, 11/10/21 | 901,000 | 905,505 | |
| Principal Amount | Value | ||
| ROAD & RAIL (1.1%) | |||
| Union Pacific Corp., 4.16%, 7/15/22, (Callable 4/15/22 @ 100) | $ 2,000,000 | $ 2,071,905 | |
| SEMICONDUCTORS & SEMICONDUCTOR EQUIPMENT (5.0%) | |||
| Intel Corp., 4.00%, 12/15/32 | 2,000,000 | 2,330,488 | |
| NVIDIA Corp., 2.85%, 4/1/30, (Callable 1/1/30 @ 100) | 2,000,000 | 2,121,295 | |
| Qualcomm, Inc., 4.65%, 5/20/35, (Callable 11/20/34 @ 100) | 4,000,000 | 4,928,380 | |
| 9,380,163 | |||
| SOFTWARE (3.5%) | |||
| Adobe, Inc., 3.25%, 2/1/25, (Callable 11/1/24 @ 100) | 2,000,000 | 2,167,870 | |
| Microsoft Corp., 3.45%, 8/8/36, (Callable 2/8/36 @ 100) | 2,000,000 | 2,229,719 | |
| Oracle Corp., 3.25%, 11/15/27, (Callable 8/15/27 @ 100) | 1,000,000 | 1,084,469 | |
| Salesforce.com, Inc., 3.70%, 4/11/28, (Callable 1/11/28 @ 100) | 1,000,000 | 1,123,042 | |
| 6,605,100 | |||
| SPECIALTY RETAIL (2.3%) | |||
| Home Depot, Inc. (The), 3.75%, 2/15/24, (Callable 11/15/23 @ 100) | 2,000,000 | 2,171,965 | |
| Lowe's Cos., Inc., 3.65%, 4/5/29, (Callable 1/5/29 @ 100) | 1,000,000 | 1,105,384 | |
| Lowe's Cos., Inc., 3.80%, 11/15/21, (Callable 8/15/21 @ 100) | 1,000,000 | 1,009,643 | |
| 4,286,992 | |||
| TECHNOLOGY HARDWARE, STORAGE & PERIPHERALS (1.6%) | |||
| Apple, Inc., 1.65%, 5/11/30, (Callable 2/11/30 @ 100) | 2,000,000 | 1,942,604 | |
| Apple, Inc., 3.45%, 2/9/45 | 1,000,000 | 1,075,186 | |
| 3,017,790 | |||
| TEXTILES, APPAREL & LUXURY GOODS (4.0%) | |||
| NIKE, Inc., 2.85%, 3/27/30, (Callable 12/27/29 @ 100) | 3,000,000 | 3,194,137 | |
| Ralph Lauren Corp., 2.95%, 6/15/30, (Callable 3/15/30 @ 100) | 1,000,000 | 1,040,553 | |
| Tapestry, Inc., 4.13%, 7/15/27, (Callable 4/15/27 @ 100) | 3,000,000 | 3,286,374 | |
| 7,521,064 | |||
| THRIFTS & MORTGAGE FINANCE (0.1%) | |||
| Opteum Mortgage Acceptance Corp., Class 2AD2, 5.85%, 12/25/35, (Callable 5/25/21 @ 100)(a) | 182,364 | 184,524 | |
| TOTAL CORPORATE BONDS (COST $122,901,250) | 126,502,649 | ||
| Principal Amount | Value | ||
| MUNICIPAL BONDS (0.2%) | |||
| Louisiana State Highway Improvement Taxable Revenue Refunding Bonds, Series A, 1.59%, 6/15/30 | $ 100,000 | $ 97,837 | |
| Oklahoma Development Finance Authority Lease Taxable Revenue Bonds, State System of Higher Education, 5.65%, 6/1/41, (Callable 6/1/21 @ 100) | 150,000 | 150,615 | |
| Uptown Development Authority Contract Tax Allocation Increment Revenue Bonds, Series B (AGM Insured), 2.58%, 9/1/31 | 100,000 | 101,754 | |
| TOTAL MUNICIPAL BONDS (COST $350,397) | 350,206 | ||
| U.S. GOVERNMENT AGENCIES (11.7%) | |||
| Federal Farm Credit Bank, 3.00%, 11/25/30 | 1,000,000 | 1,119,891 | |
| Federal Home Loan Bank | |||
| 0.50%, 3/30/26, (Callable 6/30/21 @ 100) (Step to 0.55% on 6/30/21)(b) | 1,000,000 | 1,000,041 | |
| 0.50%, 4/13/26, (Callable 10/13/21 @ 100) (Step to 0.60% on 10/13/21)(b) | 1,000,000 | 999,966 | |
| 0.65%, 4/28/26, (Callable 7/28/21 @ 100) (Step to 0.75% on 10/28/21)(b) | 1,000,000 | 1,000,366 | |
| 5/18/26, (Callable 8/18/21 @ 100) (c) | 1,000,000 | 999,017 | |
| 0.80%, 3/8/27, (Callable 5/14/21 @ 100) | 1,000,000 | 981,690 | |
| 0.85%, 2/26/26, (Callable 5/26/21 @ 100) | 1,000,000 | 996,551 | |
| 0.88%, 3/23/26, (Callable 6/23/21 @ 100) | 1,000,000 | 998,949 | |
| 0.90%, 12/1/27, (Callable 6/1/21 @ 100) | 2,000,000 | 1,949,500 | |
| 1.00%, 4/29/31, (Callable 7/29/21 @ 100) (Step to 1.50% on 4/29/23)(b) | 1,000,000 | 998,607 | |
| 1.07%, 1/25/30, (Callable 1/25/22 @ 100) | 1,000,000 | 957,765 | |
| 2.50%, 5/23/22 | 1,000,000 | 1,025,063 | |
| 3.50%, 7/29/21 | 2,000,000 | 2,016,074 | |
| 13,923,589 | |||
| Federal Home Loan Mortgage Corp. | |||
| 1.05%, 7/21/28, (Callable 7/21/21 @ 100) | 1,000,000 | 968,916 | |
| 2.50%, 3/29/22 | 1,000,000 | 1,021,514 | |
| 1,990,430 | |||
| Federal National Mortgage Association | |||
| 0.40%, 10/29/24, (Callable 10/29/21 @ 100) | 1,000,000 | 995,921 | |
| 0.55%, 8/19/25, (Callable 8/19/22 @ 100) | 1,000,000 | 991,848 | |
| 0.56%, 10/28/25, (Callable 10/28/22 @ 100) | 1,000,000 | 986,753 | |
| Principal Amount | Value | ||
| 0.58%, 8/25/25, (Callable 2/25/22 @ 100) | $ 1,000,000 | $ 991,222 | |
| 0.60%, 8/28/25, (Callable 2/28/22 @ 100) | 1,000,000 | 992,072 | |
| 4,957,816 | |||
| TOTAL U.S. GOVERNMENT AGENCIES (COST $22,000,937) | 21,991,726 | ||
| U.S. GOVERNMENT AGENCY MORTGAGE-BACKED OBLIGATIONS (5.9%) | |||
| Federal Home Loan Mortgage Corp. | |||
| 2.29% (US0012M + 179 bps), 10/1/37(a) | 18,941 | 19,092 | |
| 3.00%, 7/15/41 | 1,979,096 | 2,065,728 | |
| 3.50%, 2/1/34 | 380,191 | 407,421 | |
| 3.50%, 10/1/49 | 577,689 | 614,286 | |
| 3.50%, 12/15/48 | 609,861 | 663,827 | |
| 3.75% (H15T1Y + 225 bps), 5/1/36(a) | 26,379 | 26,615 | |
| 4.00%, 12/15/25 | 2,500,000 | 2,733,857 | |
| 5.00%, 11/1/37 | 7,630 | 8,549 | |
| 6.00%, 3/1/38 | 21,424 | 25,429 | |
| 6,564,804 | |||
| Federal National Mortgage Association | |||
| 0.53% (US0001M + 42 bps), 11/25/36(a) | 48,731 | 49,165 | |
| 1.50%, 11/25/44 | 1,953,354 | 1,983,929 | |
| 2.54% (US0012M + 204 bps), 10/1/36(a) | 16,483 | 16,472 | |
| 2.70% (US0012M + 182 bps), 5/1/36(a) | 66,603 | 69,952 | |
| 3.50%, 2/1/43 | 268,438 | 290,877 | |
| 3.50%, 4/1/48 | 589,902 | 644,380 | |
| 4.00%, 9/1/33 | 265,880 | 283,504 | |
| 4.00%, 10/1/46 | 498,806 | 542,213 | |
| 5.50%, 9/1/36 | 9,141 | 9,691 | |
| 6.00%, 6/1/36 | 182,643 | 200,232 | |
| 6.00%, 9/1/36 | 41,049 | 45,289 | |
| 6.00%, 5/1/37 | 25,051 | 27,943 | |
| 4,163,647 | |||
| Government National Mortgage Association | |||
| 3.00% (H15T1Y + 150 bps), 1/20/39(a) | 9,458 | 9,483 | |
| 4.50%, 6/15/40 | 86,944 | 97,839 | |
| 4.50%, 8/20/38 | 41,694 | 44,535 | |
| 5.00%, 5/20/40 | 52,000 | 57,302 | |
| 5.50%, 12/20/38 | 7,249 | 8,085 | |
| 6.00%, 10/15/37 | 24,938 | 29,709 | |
| Principal Amount | Value | ||
| 6.00%, 6/15/37 | $ 25,149 | $ 29,989 | |
| 6.50%, 10/20/38 | 1,781 | 1,947 | |
| 278,889 | |||
| TOTAL U.S. GOVERNMENT AGENCY MORTGAGE-BACKED OBLIGATIONS (COST $10,601,681) | 11,007,340 | ||
| U.S. TREASURY OBLIGATIONS (9.1%) | |||
| U.S. Treasury Bond, 1.13%, 5/15/40 | 2,000,000 | 1,672,891 | |
| U.S. Treasury Notes | |||
| 0.38%, 1/15/27 (TIPS) | 1,088,820 | 1,215,209 | |
| 1.63%, 11/30/26 | 1,000,000 | 1,034,258 | |
| 1.75%, 11/15/29 | 1,000,000 | 1,020,742 | |
| 2.00%, 11/15/21 | 5,000,000 | 5,052,344 | |
| 2.00%, 2/15/22 | 7,000,000 | 7,107,187 | |
| 15,429,740 | |||
| TOTAL U.S. TREASURY OBLIGATIONS (COST $17,063,114) | 17,102,631 | ||
| Shares | Value | ||
| MONEY MARKET FUND (6.1%) | |||
| Northern Institutional Treasury Portfolio (Premier Class), 0.01%(d) | 11,360,833 | $ 11,360,833 | |
| TOTAL MONEY MARKET FUND (COST $11,360,833) | 11,360,833 | ||
| PREFERRED STOCKS (0.5%) | |||
| BANKS (0.2%) | |||
| JPMorgan Chase & Co. − Preferred, 6.10% | 20,000 | 506,000 | |
| INSURANCE (0.3%) | |||
| Globe Life, Inc. − Preferred, 6.13% | 20,000 | 515,800 | |
| TOTAL PREFERRED STOCKS (COST $1,071,358) | 1,021,800 | ||
| Shares | Value | ||
| TOTAL INVESTMENTS (COST $185,349,570) 101.1% | $ 189,337,185 | ||
| LIABILITIES IN EXCESS OF OTHER ASSETS (1.1)% | (2,064,505) | ||
| NET ASSETS 100.0% | $ 187,272,680 | ||
| (a) | Variable rate security. The interest rate shown represents the rate in effect at April 30, 2021. For securities based on published reference rate and spread, the reference rate and spread are indicated in the description. Certain variable rate securities are not based on a published reference rate and spread but are determined by the issuer and are based on current market conditions. These securities do not indicate a reference rate and spread in their description. |
| (b) | Step Bond. Coupon rate is set for an initial period and then adjusted at a specified date. The rate shown represents the rate as of April 30, 2021. |
| (c) | When-Issued Security. Coupon rate is not in effect at April 30, 2021. |
| (d) | 7-day current yield as of April 30, 2021 is disclosed. |
| AGM — Assured Guarantee Municipal Corporation |
| bps — Basis Points |
| H15T1Y — 1 Year Treasury Constant Maturity Rate |
| LP — Limited Partnership |
| TIPS — Treasury Inflation-Protected Security |
| US0001M — 1 Month US Dollar LIBOR |
| US0003M — 3 Month US Dollar LIBOR |
| US0012M — 12 Month US Dollar LIBOR |
The table below sets forth the diversification of the Steward Small-Mid Cap Enhanced Index Fund investments by Industry.
| Industry Diversification | Percent | |
| Banks | 6.4% | |
| Equity Real Estate Investment Trusts | 6.2 | |
| Specialty Retail | 5.3 | |
| Insurance | 4.3 | |
| Machinery | 4.3 | |
| Semiconductors & Semiconductor Equipment | 4.0 | |
| Software | 4.0 | |
| Health Care Equipment & Supplies | 3.7 | |
| Health Care Providers & Services | 3.4 | |
| Household Durables | 3.2 | |
| Electronic Equipment, Instruments & Components | 3.0 | |
| Chemicals | 2.3 | |
| Biotechnology | 2.3 | |
| Capital Markets | 2.2 | |
| Life Sciences Tools & Services | 2.2 | |
| Building Products | 2.1 | |
| Oil, Gas & Consumable Fuels | 2.0 | |
| Auto Components | 1.8 | |
| Professional Services | 1.8 | |
| Metals & Mining | 1.7 | |
| Food Products | 1.6 | |
| Thrifts & Mortgage Finance | 1.6 | |
| Textiles, Apparel & Luxury Goods | 1.5 | |
| IT Services | 1.5 | |
| Hotels, Restaurants & Leisure | 1.5 | |
| Commercial Services & Supplies | 1.4 | |
| Pharmaceuticals | 1.3 | |
| Leisure Products | 1.2 | |
| Construction & Engineering | 1.2 | |
| Road & Rail | 1.1 | |
| Media | 1.1 | |
| Multiline Retail | 1.1 | |
| Consumer Finance | 1.1 |
| Industry Diversification | Percent | |
| Aerospace & Defense | 1.1% | |
| Electrical Equipment | 1.1 | |
| Money Market Fund | 1.1 | |
| Communications Equipment | 1.0 | |
| Trading Companies & Distributors | 0.9 | |
| Internet & Direct Marketing Retail | 0.8 | |
| Gas Utilities | 0.7 | |
| Health Care Technology | 0.7 | |
| Diversified Consumer Services | 0.6 | |
| Real Estate Management & Development | 0.6 | |
| Energy Equipment & Services | 0.6 | |
| Air Freight & Logistics | 0.6 | |
| Food & Staples Retailing | 0.6 | |
| Electric Utilities | 0.5 | |
| Diversified Telecommunication Services | 0.5 | |
| Personal Products | 0.5 | |
| Beverages | 0.5 | |
| Containers & Packaging | 0.5 | |
| Mortgage Real Estate Investment Trusts | 0.4 | |
| Paper & Forest Products | 0.4 | |
| Automobiles | 0.4 | |
| Airlines | 0.3 | |
| Water Utilities | 0.3 | |
| Multi-Utilities | 0.3 | |
| Technology Hardware, Storage & Peripherals | 0.3 | |
| Industrial Conglomerates | 0.2 | |
| Wireless Telecommunication Services | 0.2 | |
| Construction Materials | 0.2 | |
| Household Products | 0.2 | |
| Marine | 0.2 | |
| Interactive Media & Services | 0.2 | |
| Entertainment | 0.1 | |
| Total Investments | 100.0% |
| Shares | Value | ||
| COMMON STOCKS (98.9%) | |||
| AEROSPACE & DEFENSE (1.1%) | |||
| AAR Corp.(a) | 4,150 | $ 166,996 | |
| Aerojet Rocketdyne Holdings, Inc. | 3,960 | 185,011 | |
| AeroVironment, Inc.(a) | 4,880 | 538,606 | |
| Axon Enterprise, Inc.(a) | 6,820 | 1,033,980 | |
| Cubic Corp. | 1,680 | 125,731 | |
| Curtiss-Wright Corp. | 1,600 | 204,640 | |
| Hexcel Corp.(a) | 4,150 | 234,102 | |
| Kaman Corp. | 1,040 | 55,484 | |
| Mercury Systems, Inc.(a) | 4,830 | 363,409 | |
| Moog, Inc., Class A | 1,170 | 101,264 | |
| National Presto Industries, Inc. | 170 | 17,490 | |
| Park Aerospace Corp. | 770 | 10,387 | |
| Triumph Group, Inc.(a) | 3,570 | 60,404 | |
| 3,097,504 | |||
| AIR FREIGHT & LOGISTICS (0.6%) | |||
| Atlas Air Worldwide Holdings, Inc.(a) | 3,050 | 207,126 | |
| Echo Global Logistics, Inc.(a) | 2,220 | 72,594 | |
| Forward Air Corp. | 3,980 | 351,394 | |
| Hub Group, Inc., Class A(a) | 3,180 | 208,990 | |
| XPO Logistics, Inc.(a) | 5,010 | 696,991 | |
| 1,537,095 | |||
| AIRLINES (0.3%) | |||
| Allegiant Travel Co.(a) | 656 | 154,639 | |
| Hawaiian Holdings, Inc.(a) | 3,750 | 94,162 | |
| JetBlue Airways Corp.(a) | 20,350 | 414,326 | |
| SkyWest, Inc.(a) | 3,950 | 196,157 | |
| 859,284 | |||
| AUTO COMPONENTS (1.8%) | |||
| Adient PLC(a) | 6,040 | 279,894 | |
| American Axle & Manufacturing Holdings, Inc.(a) | 10,140 | 94,099 | |
| Cooper Tire & Rubber Co. | 4,060 | 231,379 | |
| Cooper-Standard Holdings, Inc.(a) | 820 | 23,813 | |
| Dana, Inc. | 14,690 | 371,657 | |
| Dorman Products, Inc.(a) | 3,040 | 301,507 | |
| Fox Factory Holding Corp.(a) | 5,500 | 842,765 | |
| Gentex Corp. | 14,660 | 515,739 | |
| Gentherm, Inc.(a) | 1,860 | 132,432 | |
| Goodyear Tire & Rubber Co. (The)(a) | 19,400 | 333,874 | |
| LCI Industries | 2,460 | 360,390 | |
| Lear Corp. | 3,000 | 551,520 | |
| Motorcar Parts of America, Inc.(a) | 1,910 | 41,256 | |
| Patrick Industries, Inc. | 6,065 | 543,424 | |
| Shares | Value | ||
| Standard Motor Products, Inc. | 1,160 | $ 49,683 | |
| Visteon Corp.(a) | 1,350 | 164,443 | |
| 4,837,875 | |||
| AUTOMOBILES (0.4%) | |||
| Harley-Davidson, Inc. | 7,200 | 348,264 | |
| Thor Industries, Inc. | 3,320 | 470,079 | |
| Winnebago Industries, Inc. | 1,700 | 135,915 | |
| 954,258 | |||
| BANKS (6.4%) | |||
| Allegiance Bancshares, Inc. | 1,040 | 41,184 | |
| Ameris Bancorp | 4,982 | 269,476 | |
| Associated Banc-Corp | 15,098 | 330,495 | |
| Banc of California, Inc. | 2,870 | 51,373 | |
| BancFirst Corp. | 910 | 63,254 | |
| BancorpSouth Bank | 4,230 | 125,166 | |
| Bank of Hawaii Corp. | 2,390 | 217,227 | |
| Bank OZK | 9,050 | 370,960 | |
| BankUnited, Inc. | 5,980 | 278,728 | |
| Banner Corp. | 2,670 | 151,763 | |
| Berkshire Hills Bancorp, Inc. | 4,220 | 93,642 | |
| Boston Private Financial Holdings, Inc. | 6,700 | 98,624 | |
| Brookline Bancorp, Inc. | 6,100 | 98,210 | |
| Cadence BanCorp | 8,870 | 197,358 | |
| Cathay General Bancorp | 4,090 | 165,563 | |
| Central Pacific Financial Corp. | 1,180 | 31,801 | |
| CIT Group, Inc. | 5,810 | 309,615 | |
| City Holding Co. | 810 | 62,694 | |
| Columbia Banking System, Inc. | 3,710 | 161,496 | |
| Commerce Bancshares, Inc. | 5,621 | 437,370 | |
| Community Bank System, Inc. | 2,850 | 221,246 | |
| Cullen/Frost Bankers, Inc. | 3,020 | 362,581 | |
| Customers Bancorp, Inc.(a) | 4,920 | 169,838 | |
| CVB Financial Corp. | 6,320 | 134,047 | |
| Dime Community Bancshares, Inc., Class B | 2,942 | 97,439 | |
| Eagle Bancorp, Inc. | 1,880 | 100,411 | |
| East West Bancorp, Inc. | 8,400 | 639,660 | |
| F.N.B. Corp. | 24,300 | 313,227 | |
| FB Financial Corp. | 1,063 | 44,603 | |
| First Bancorp | 1,390 | 58,936 | |
| First BanCorp | 14,592 | 183,421 | |
| First Commonwealth Financial Corp. | 4,960 | 71,870 | |
| First Financial Bancorp | 4,760 | 116,668 | |
| First Financial Bankshares, Inc. | 7,880 | 386,750 | |
| First Hawaiian, Inc. | 4,030 | 110,664 | |
| First Horizon Corp. | 20,070 | 367,080 | |
| Shares | Value | ||
| First Midwest Bancorp, Inc. | 6,240 | $ 130,853 | |
| Fulton Financial Corp. | 11,140 | 189,937 | |
| Glacier Bancorp, Inc. | 4,840 | 285,318 | |
| Great Western Bancorp, Inc. | 3,280 | 108,404 | |
| Hancock Whitney Corp. | 6,129 | 283,405 | |
| Hanmi Financial Corp. | 3,441 | 69,852 | |
| Heritage Financial Corp. | 1,430 | 40,183 | |
| Hilltop Holdings, Inc. | 2,640 | 92,928 | |
| Home Bancshares, Inc. | 9,712 | 270,285 | |
| Hope Bancorp, Inc. | 8,372 | 125,664 | |
| Independent Bank Corp. | 1,730 | 141,687 | |
| Independent Bank Group, Inc. | 2,560 | 193,306 | |
| International Bancshares Corp. | 4,010 | 190,034 | |
| Investors Bancorp, Inc. | 3,470 | 50,801 | |
| National Bank Holdings Corp., Class A | 1,950 | 77,805 | |
| NBT Bancorp, Inc. | 1,820 | 68,960 | |
| OFG Bancorp | 2,890 | 68,464 | |
| Old National Bancorp | 12,610 | 238,329 | |
| Pacific Premier Bancorp, Inc. | 7,222 | 317,985 | |
| PacWest Bancorp | 6,940 | 301,265 | |
| Park National Corp. | 870 | 108,828 | |
| Pinnacle Financial Partners, Inc. | 5,270 | 461,863 | |
| Preferred Bank | 1,180 | 77,337 | |
| Prosperity Bancshares, Inc. | 5,541 | 406,488 | |
| Renasant Corp. | 3,450 | 145,349 | |
| Seacoast Banking Corp. of Florida(a) | 3,510 | 127,589 | |
| ServisFirst Bancshares, Inc. | 7,800 | 493,272 | |
| Signature Bank | 2,880 | 724,349 | |
| Simmons First National Corp., Class A | 8,140 | 231,990 | |
| Southside Bancshares, Inc. | 1,154 | 46,333 | |
| Sterling Bancorp | 17,099 | 429,698 | |
| Synovus Financial Corp. | 9,462 | 443,389 | |
| TCF Financial Corp. | 9,561 | 435,217 | |
| Texas Capital Bancshares, Inc.(a) | 3,300 | 226,479 | |
| Tompkins Financial Corp. | 390 | 30,479 | |
| Triumph Bancorp, Inc.(a) | 6,580 | 583,185 | |
| Trustmark Corp. | 3,420 | 110,842 | |
| UMB Financial Corp. | 3,130 | 303,704 | |
| Umpqua Holdings Corp. | 20,610 | 384,170 | |
| United Bankshares, Inc. | 7,383 | 289,930 | |
| United Community Banks, Inc. | 5,222 | 170,864 | |
| Valley National Bancorp | 19,464 | 268,019 | |
| Veritex Holdings, Inc. | 2,803 | 94,685 | |
| Webster Financial Corp. | 5,990 | 316,931 | |
| Westamerica BanCorp | 1,210 | 76,714 | |
| Wintrust Financial Corp. | 4,400 | 339,240 | |
| 17,506,849 |
| Shares | Value | ||
| BEVERAGES (0.5%) | |||
| Celsius Holdings, Inc.(a) | 14,230 | $ 815,379 | |
| Coca-Cola Consolidated, Inc. | 231 | 67,741 | |
| National Beverage Corp. | 10,290 | 499,991 | |
| 1,383,111 | |||
| BIOTECHNOLOGY (2.3%) | |||
| Anika Therapeutics, Inc.(a) | 870 | 34,957 | |
| Arrowhead Pharmaceuticals, Inc.(a) | 8,080 | 587,901 | |
| Coherus Biosciences, Inc.(a) | 34,510 | 510,748 | |
| Cytokinetics, Inc.(a) | 13,400 | 340,896 | |
| Eagle Pharmaceuticals, Inc.(a) | 1,190 | 48,588 | |
| Emergent BioSolutions, Inc.(a) | 7,610 | 464,058 | |
| Enanta Pharmaceuticals, Inc.(a) | 1,440 | 73,066 | |
| Exelixis, Inc.(a) | 31,040 | 764,205 | |
| Halozyme Therapeutics, Inc.(a) | 16,290 | 813,685 | |
| Ligand Pharmaceuticals, Inc.(a) | 870 | 126,924 | |
| Myriad Genetics, Inc.(a) | 4,300 | 129,946 | |
| Neurocrine Biosciences, Inc.(a) | 6,790 | 641,587 | |
| REGENXBIO, Inc.(a) | 7,890 | 273,704 | |
| Spectrum Pharmaceuticals, Inc.(a) | 12,140 | 37,755 | |
| United Therapeutics Corp.(a) | 2,293 | 462,177 | |
| Vanda Pharmaceuticals, Inc.(a) | 3,970 | 65,902 | |
| Vericel Corp.(a) | 9,350 | 583,627 | |
| Xencor, Inc.(a) | 10,710 | 455,817 | |
| 6,415,543 | |||
| BUILDING PRODUCTS (2.1%) | |||
| AAON, Inc. | 6,268 | 409,990 | |
| American Woodmark Corp.(a) | 590 | 58,681 | |
| Apogee Enterprises, Inc. | 3,940 | 138,412 | |
| Builders FirstSource, Inc.(a) | 10,350 | 503,734 | |
| Gibraltar Industries, Inc.(a) | 4,260 | 391,324 | |
| Griffon Corp. | 8,350 | 226,452 | |
| Insteel Industries, Inc. | 960 | 36,605 | |
| Lennox International, Inc. | 1,609 | 539,562 | |
| Owens Corning | 5,000 | 484,050 | |
| PGT Innovations, Inc.(a) | 14,210 | 374,149 | |
| Quanex Building Products Corp. | 3,355 | 91,558 | |
| Resideo Technologies, Inc.(a) | 11,480 | 344,515 | |
| Simpson Manufacturing Co., Inc. | 4,410 | 497,007 | |
| Trex Co., Inc.(a) | 11,500 | 1,241,885 | |
| UFP Industries, Inc. | 3,170 | 266,407 | |
| 5,604,331 | |||
| CAPITAL MARKETS (2.2%) | |||
| Affiliated Managers Group, Inc. | 2,150 | 346,515 | |
| Blucora, Inc.(a) | 3,730 | 53,693 | |
| Shares | Value | ||
| Brightsphere Investment Group, Inc. | 25,070 | $ 564,326 | |
| Donnelley Financial Solutions, Inc.(a) | 2,401 | 73,375 | |
| Evercore, Inc., Class A | 2,240 | 313,891 | |
| FactSet Research Systems, Inc. | 2,288 | 769,271 | |
| Federated Hermes, Inc. | 5,590 | 160,992 | |
| Greenhill & Co., Inc. | 1,360 | 20,645 | |
| Interactive Brokers Group, Inc., Class A | 6,750 | 482,760 | |
| Janus Henderson Group PLC | 10,500 | 361,095 | |
| Jefferies Financial Group, Inc. | 16,470 | 535,440 | |
| Piper Sandler Cos. | 740 | 85,833 | |
| SEI Investments Co. | 6,350 | 390,144 | |
| Stifel Financial Corp. | 5,737 | 396,943 | |
| StoneX Group, Inc.(a) | 9,670 | 614,238 | |
| Virtus Investment Partners, Inc. | 2,017 | 551,569 | |
| Waddell & Reed Financial, Inc., Class A | 4,850 | 121,153 | |
| WisdomTree Investments, Inc. | 6,910 | 46,884 | |
| 5,888,767 | |||
| CHEMICALS (2.3%) | |||
| AdvanSix, Inc.(a) | 7,020 | 204,142 | |
| American Vanguard Corp. | 1,350 | 26,703 | |
| Ashland Global Holdings, Inc. | 2,550 | 219,835 | |
| Avient Corp. | 4,750 | 241,157 | |
| Balchem Corp. | 1,745 | 221,946 | |
| Cabot Corp. | 2,920 | 160,250 | |
| Chemours Co. (The) | 8,760 | 264,552 | |
| Ferro Corp.(a) | 4,310 | 71,805 | |
| FutureFuel Corp. | 1,390 | 17,653 | |
| GCP Applied Technologies, Inc.(a) | 2,420 | 62,170 | |
| H.B. Fuller Co. | 2,560 | 171,059 | |
| Hawkins, Inc. | 960 | 32,016 | |
| Ingevity Corp.(a) | 1,920 | 149,914 | |
| Innospec, Inc. | 1,000 | 97,410 | |
| Koppers Holdings, Inc.(a) | 4,700 | 156,228 | |
| Kraton Corp.(a) | 1,690 | 60,434 | |
| Livent Corp.(a) | 22,340 | 402,567 | |
| Minerals Technologies, Inc. | 2,100 | 164,094 | |
| NewMarket Corp. | 229 | 79,369 | |
| Olin Corp. | 7,320 | 314,980 | |
| Quaker Chemical Corp. | 2,040 | 494,394 | |
| Rayonier Advanced Materials, Inc.(a) | 20,003 | 181,827 | |
| RPM International, Inc. | 6,450 | 611,718 | |
| Scotts Miracle-Gro Co. (The) | 4,720 | 1,091,075 | |
| Sensient Technologies Corp. | 2,020 | 166,125 | |
| Stepan Co. | 1,000 | 130,660 | |
| Shares | Value | ||
| Tredegar Corp. | 2,040 | $ 29,825 | |
| Trinseo SA | 2,880 | 178,301 | |
| Valvoline, Inc. | 10,396 | 326,434 | |
| 6,328,643 | |||
| COMMERCIAL SERVICES & SUPPLIES (1.4%) | |||
| ABM Industries, Inc. | 5,630 | 289,438 | |
| Brady Corp., Class A | 2,500 | 136,425 | |
| Brink's Co. (The) | 2,490 | 199,001 | |
| Clean Harbors, Inc.(a) | 2,470 | 219,731 | |
| Corecivic, Inc.(a) | 14,638 | 113,737 | |
| Deluxe Corp. | 3,270 | 143,945 | |
| Harsco Corp.(a) | 5,250 | 94,133 | |
| Healthcare Services Group, Inc. | 4,472 | 133,936 | |
| Herman Miller, Inc. | 3,300 | 136,950 | |
| HNI Corp. | 2,310 | 97,805 | |
| IAA, Inc.(a) | 6,940 | 435,902 | |
| Interface, Inc. | 5,560 | 71,390 | |
| KAR Auction Services, Inc.(a) | 9,910 | 148,551 | |
| Matthews International Corp., Class A | 2,160 | 89,381 | |
| MSA Safety, Inc. | 1,840 | 295,798 | |
| Pitney Bowes, Inc. | 13,330 | 99,575 | |
| Stericycle, Inc.(a) | 4,620 | 352,414 | |
| Team, Inc.(a) | 3,740 | 36,914 | |
| Tetra Tech, Inc. | 4,280 | 546,257 | |
| U.S. Ecology, Inc.(a) | 1,600 | 67,936 | |
| UniFirst Corp. | 780 | 174,868 | |
| Viad Corp.(a) | 1,160 | 48,326 | |
| 3,932,413 | |||
| COMMUNICATIONS EQUIPMENT (1.0%) | |||
| ADTRAN, Inc. | 2,480 | 42,383 | |
| Applied Optoelectronics, Inc.(a) | 4,710 | 34,901 | |
| CalAmp Corp.(a) | 4,110 | 56,513 | |
| Ciena Corp.(a) | 7,800 | 393,666 | |
| Comtech Telecommunications Corp. | 5,260 | 126,135 | |
| Digi International, Inc.(a) | 3,340 | 59,686 | |
| Extreme Networks, Inc.(a) | 17,630 | 200,629 | |
| Harmonic, Inc.(a) | 23,160 | 181,111 | |
| Lumentum Holdings, Inc.(a) | 6,105 | 519,230 | |
| NETGEAR, Inc.(a) | 2,800 | 104,188 | |
| NetScout Systems, Inc.(a) | 6,330 | 165,814 | |
| Plantronics, Inc.(a) | 1,900 | 75,981 | |
| Shares | Value | ||
| ViaSat, Inc.(a) | 5,250 | $ 271,898 | |
| Viavi Solutions, Inc.(a) | 22,820 | 373,335 | |
| 2,605,470 | |||
| CONSTRUCTION & ENGINEERING (1.2%) | |||
| AECOM (a) | 8,222 | 546,187 | |
| Aegion Corp.(a) | 3,660 | 110,166 | |
| Arcosa, Inc. | 2,293 | 138,245 | |
| Comfort Systems USA, Inc. | 8,040 | 662,174 | |
| Dycom Industries, Inc.(a) | 2,160 | 202,630 | |
| EMCOR Group, Inc. | 3,440 | 412,112 | |
| Fluor Corp.(a) | 6,820 | 156,724 | |
| Granite Construction, Inc. | 6,660 | 253,746 | |
| MasTec, Inc.(a) | 3,800 | 396,568 | |
| Matrix Service Co.(a) | 9,490 | 125,363 | |
| MYR Group, Inc.(a) | 800 | 62,320 | |
| Valmont Industries, Inc. | 1,070 | 264,129 | |
| 3,330,364 | |||
| CONSTRUCTION MATERIALS (0.2%) | |||
| Eagle Materials, Inc.(a) | 2,130 | 294,238 | |
| U.S. Concrete, Inc.(a) | 3,520 | 223,203 | |
| 517,441 | |||
| CONSUMER FINANCE (1.1%) | |||
| Encore Capital Group, Inc.(a) | 4,060 | 159,720 | |
| Enova International, Inc.(a) | 5,203 | 178,151 | |
| EZCORP, Inc., Class A(a) | 44,690 | 251,605 | |
| FirstCash, Inc. | 2,028 | 146,077 | |
| Green Dot Corp., Class A(a) | 10,950 | 501,072 | |
| LendingTree, Inc.(a) | 482 | 99,528 | |
| Navient Corp. | 19,270 | 324,314 | |
| PRA Group, Inc.(a) | 7,550 | 284,484 | |
| PROG Holdings, Inc. | 3,470 | 176,762 | |
| SLM Corp. | 45,300 | 890,598 | |
| World Acceptance Corp.(a) | 190 | 24,840 | |
| 3,037,151 | |||
| CONTAINERS & PACKAGING (0.5%) | |||
| AptarGroup, Inc. | 3,350 | 505,213 | |
| Greif, Inc., Class A | 3,250 | 196,658 | |
| Myers Industries, Inc. | 1,870 | 42,187 | |
| O-I Glass, Inc.(a) | 11,100 | 183,039 | |
| Silgan Holdings, Inc. | 4,570 | 192,717 | |
| Sonoco Products Co. | 5,410 | 354,139 | |
| 1,473,953 | |||
| DIVERSIFIED CONSUMER SERVICES (0.6%) | |||
| Adtalem Global Education, Inc.(a) | 4,890 | 167,776 | |
| Shares | Value | ||
| American Public Education, Inc.(a) | 1,300 | $ 39,598 | |
| Graham Holdings Co., Class B | 457 | 290,474 | |
| Grand Canyon Education, Inc.(a) | 2,470 | 267,476 | |
| H&R Block, Inc. | 9,330 | 207,686 | |
| Perdoceo Education Corp.(a) | 6,540 | 76,257 | |
| Regis Corp.(a) | 3,100 | 40,114 | |
| Service Corp. International | 8,750 | 467,600 | |
| Strategic Education, Inc. | 1,519 | 114,016 | |
| WW International, Inc.(a) | 2,880 | 79,891 | |
| 1,750,888 | |||
| DIVERSIFIED TELECOMMUNICATION SERVICES (0.5%) | |||
| ATN International, Inc. | 310 | 14,130 | |
| Cincinnati Bell, Inc.(a) | 16,992 | 262,186 | |
| Cogent Communications Holdings, Inc. | 2,170 | 163,857 | |
| Consolidated Communications Holdings, Inc.(a) | 38,750 | 279,000 | |
| Iridium Communications, Inc.(a) | 5,910 | 224,521 | |
| Vonage Holdings Corp.(a) | 27,810 | 376,825 | |
| 1,320,519 | |||
| ELECTRIC UTILITIES (0.5%) | |||
| ALLETE, Inc. | 3,000 | 211,080 | |
| Hawaiian Electric Industries, Inc. | 6,070 | 261,374 | |
| IDACORP, Inc. | 2,450 | 251,076 | |
| OGE Energy Corp. | 10,600 | 355,736 | |
| PNM Resources, Inc. | 4,590 | 226,563 | |
| 1,305,829 | |||
| ELECTRICAL EQUIPMENT (1.1%) | |||
| Acuity Brands, Inc. | 1,700 | 315,384 | |
| AZZ, Inc. | 1,120 | 58,957 | |
| Encore Wire Corp. | 1,240 | 92,603 | |
| EnerSys | 1,770 | 162,097 | |
| Hubbell, Inc. | 2,610 | 501,146 | |
| nVent Electric PLC | 8,980 | 273,441 | |
| Powell Industries, Inc. | 2,960 | 104,310 | |
| Regal Beloit Corp. | 1,990 | 287,416 | |
| Sunrun, Inc.(a) | 15,790 | 773,710 | |
| Vicor Corp.(a) | 5,890 | 543,235 | |
| 3,112,299 | |||
| ELECTRONIC EQUIPMENT, INSTRUMENTS & COMPONENTS (3.0%) | |||
| Arlo Technologies, Inc.(a) | 39,521 | 242,264 | |
| Arrow Electronics, Inc.(a) | 4,750 | 541,833 | |
| Avnet, Inc. | 9,420 | 413,726 | |
| Badger Meter, Inc. | 3,260 | 304,451 | |
| Bel Fuse, Inc., Class B | 9,380 | 186,943 | |
| Shares | Value | ||
| Belden, Inc. | 1,880 | $ 81,366 | |
| Benchmark Electronics, Inc. | 4,230 | 126,985 | |
| Cognex Corp. | 10,700 | 921,484 | |
| Coherent, Inc.(a) | 1,214 | 315,628 | |
| CTS Corp. | 2,250 | 73,170 | |
| Daktronics, Inc.(a) | 24,320 | 150,054 | |
| ePlus, Inc.(a) | 760 | 76,274 | |
| Fabrinet (a) | 1,870 | 160,109 | |
| FARO Technologies, Inc.(a) | 880 | 66,744 | |
| II-VI, Inc.(a) | 12,721 | 854,088 | |
| Insight Enterprises, Inc.(a) | 3,040 | 305,125 | |
| Itron, Inc.(a) | 2,130 | 191,572 | |
| Jabil, Inc. | 8,890 | 466,014 | |
| Knowles Corp.(a) | 5,710 | 119,339 | |
| Littelfuse, Inc. | 1,035 | 274,523 | |
| Methode Electronics, Inc. | 1,950 | 87,614 | |
| National Instruments Corp. | 6,495 | 268,958 | |
| OSI Systems, Inc.(a) | 850 | 82,085 | |
| PC Connection, Inc. | 1,730 | 78,456 | |
| Plexus Corp.(a) | 1,460 | 134,962 | |
| Rogers Corp.(a) | 910 | 178,214 | |
| Sanmina Corp.(a) | 7,380 | 301,399 | |
| ScanSource, Inc.(a) | 5,210 | 157,498 | |
| SYNNEX Corp. | 3,498 | 423,958 | |
| TTM Technologies, Inc.(a) | 16,630 | 249,450 | |
| Vishay Intertechnology, Inc. | 8,280 | 203,440 | |
| Vontier Corp.(a) | 7,280 | 228,155 | |
| 8,265,881 | |||
| ENERGY EQUIPMENT & SERVICES (0.6%) | |||
| Archrock, Inc. | 16,610 | 155,137 | |
| Bristow Group, Inc.(a) | 2,520 | 66,679 | |
| ChampionX Corp.(a) | 7,340 | 154,213 | |
| Core Laboratories N.V. | 2,030 | 57,205 | |
| DMC Global, Inc.(a) | 4,220 | 227,880 | |
| Dril-Quip, Inc.(a) | 1,350 | 41,378 | |
| Helix Energy Solutions Group, Inc.(a) | 30,130 | 129,258 | |
| Helmerich & Payne, Inc. | 4,200 | 107,646 | |
| Nabors Industries Ltd.(a) | 818 | 66,135 | |
| Oceaneering International, Inc.(a) | 7,100 | 76,325 | |
| Oil States International, Inc.(a) | 12,080 | 67,769 | |
| Patterson-UTI Energy, Inc. | 18,990 | 128,372 | |
| ProPetro Holding Corp.(a) | 21,900 | 210,897 | |
| RPC, Inc.(a) | 20,460 | 99,436 | |
| U.S. Silica Holdings, Inc.(a) | 12,190 | 129,824 | |
| 1,718,154 | |||
| Shares | Value | ||
| ENTERTAINMENT (0.1%) | |||
| Cinemark Holdings, Inc.(a) | 5,860 | $ 124,232 | |
| Marcus Corp. (The)(a) | 2,660 | 53,094 | |
| World Wrestling Entertainment, Inc., Class A | 2,550 | 140,530 | |
| 317,856 | |||
| EQUITY REAL ESTATE INVESTMENT TRUSTS (6.2%) | |||
| Acadia Realty Trust | 5,897 | 123,188 | |
| Agree Realty Corp. | 3,320 | 233,595 | |
| Alexander & Baldwin, Inc. | 5,813 | 106,552 | |
| American Assets Trust, Inc. | 2,570 | 90,079 | |
| American Campus Communities, Inc. | 7,330 | 331,389 | |
| Apartment Income REIT Corp. | 6,660 | 300,699 | |
| Armada Hoffler Properties, Inc. | 9,190 | 125,260 | |
| Brixmor Property Group, Inc. | 15,740 | 351,632 | |
| Camden Property Trust | 4,850 | 584,328 | |
| CareTrust REIT, Inc. | 5,808 | 140,437 | |
| Centerspace | 530 | 37,307 | |
| Chatham Lodging Trust(a) | 2,050 | 28,434 | |
| Community Healthcare Trust, Inc. | 4,840 | 246,453 | |
| Coresite Realty Corp. | 2,060 | 250,269 | |
| Corporate Office Properties Trust | 5,850 | 164,034 | |
| Cousins Properties, Inc. | 9,839 | 360,796 | |
| CyrusOne, Inc. | 6,000 | 436,980 | |
| DiamondRock Hospitality Co.(a) | 15,570 | 162,239 | |
| Diversified Healthcare Trust | 30,200 | 133,333 | |
| Douglas Emmett, Inc. | 9,010 | 302,195 | |
| Easterly Government Properties, Inc. | 4,400 | 94,292 | |
| EastGroup Properties, Inc. | 1,770 | 280,828 | |
| EPR Properties(a) | 3,550 | 169,371 | |
| Essential Properties Realty Trust, Inc. | 18,270 | 478,491 | |
| First Industrial Realty Trust, Inc. | 7,330 | 364,814 | |
| Four Corners Property Trust, Inc. | 5,927 | 171,113 | |
| Franklin Street Properties Corp. | 3,260 | 17,213 | |
| Geo Group, Inc. (The) | 13,904 | 76,611 | |
| Getty Realty Corp. | 2,470 | 78,003 | |
| Global Net Lease, Inc. | 4,270 | 81,984 | |
| Healthcare Realty Trust, Inc. | 7,960 | 255,994 | |
| Hersha Hospitality Trust(a) | 7,230 | 83,579 | |
| Highwoods Properties, Inc. | 5,760 | 257,990 | |
| Hudson Pacific Properties, Inc. | 4,900 | 137,739 | |
| Independence Realty Trust, Inc. | 2,480 | 41,763 | |
| Industrial Logistics Properties Trust | 2,480 | 61,504 | |
| Innovative Industrial Properties, Inc. | 5,240 | 959,601 | |
| iStar, Inc. | 7,790 | 144,193 | |
| Shares | Value | ||
| JBG Smith Properties | 6,400 | $ 208,704 | |
| Kilroy Realty Corp. | 4,730 | 324,194 | |
| Kite Realty Group Trust | 7,835 | 163,046 | |
| Lamar Advertising Co., Class A | 4,310 | 426,862 | |
| Lexington Realty Trust | 15,915 | 194,800 | |
| Life Storage, Inc. | 3,840 | 368,870 | |
| LTC Properties, Inc. | 2,170 | 92,290 | |
| Macerich Co. (The) | 10,049 | 138,576 | |
| Mack-Cali Realty Corp. | 5,020 | 82,127 | |
| Medical Properties Trust, Inc. | 31,440 | 693,252 | |
| National Retail Properties, Inc. | 9,120 | 423,350 | |
| National Storage Affiliates Trust | 3,830 | 174,035 | |
| NexPoint Residential Trust, Inc. | 1,120 | 56,179 | |
| Office Properties Income Trust | 3,047 | 84,554 | |
| Omega Healthcare Investors, Inc. | 11,976 | 455,088 | |
| Park Hotels & Resorts, Inc.(a) | 13,594 | 303,282 | |
| Pebblebrook Hotel Trust | 9,846 | 235,122 | |
| Physicians Realty Trust | 5,000 | 93,650 | |
| PotlatchDeltic Corp. | 3,592 | 213,221 | |
| PS Business Parks, Inc. | 870 | 141,262 | |
| Rayonier, Inc. | 7,010 | 254,323 | |
| Retail Opportunity Investments Corp. | 8,910 | 156,816 | |
| Rexford Industrial Realty, Inc. | 7,520 | 417,736 | |
| RPT Realty | 2,440 | 31,012 | |
| Sabra Health Care REIT, Inc. | 12,749 | 231,649 | |
| Safehold, Inc. | 8,650 | 611,642 | |
| Service Properties Trust | 8,860 | 109,111 | |
| SL Green Realty Corp. | 4,280 | 316,763 | |
| Spirit Realty Capital, Inc. | 5,070 | 241,028 | |
| STORE Capital Corp. | 11,100 | 397,269 | |
| Summit Hotel Properties, Inc.(a) | 13,160 | 133,837 | |
| Tanger Factory Outlet Centers, Inc. | 6,800 | 118,660 | |
| Uniti Group, Inc. | 10,194 | 116,212 | |
| Universal Health Realty Income Trust | 490 | 32,806 | |
| Urban Edge Properties | 5,600 | 105,560 | |
| Urstadt Biddle Properties, Inc., Class A | 3,470 | 63,050 | |
| Washington Real Estate Investment Trust | 3,790 | 88,004 | |
| Weingarten Realty Investors | 7,820 | 252,899 | |
| Whitestone REIT | 1,040 | 10,161 | |
| Xenia Hotels & Resorts, Inc.(a) | 8,050 | 156,412 | |
| 16,981,696 | |||
| FOOD & STAPLES RETAILING (0.6%) | |||
| Andersons, Inc. (The) | 8,415 | 241,679 | |
| BJ's Wholesale Club Holdings, Inc.(a) | 8,970 | 400,690 | |
| Chefs' Warehouse, Inc. (The)(a) | 1,640 | 52,857 | |
| Grocery Outlet Holding Corp.(a) | 4,410 | 178,120 | |
| Shares | Value | ||
| PriceSmart, Inc. | 1,270 | $ 106,731 | |
| SpartanNash Co. | 11,554 | 223,801 | |
| Sprouts Farmers Market, Inc.(a) | 10,190 | 260,966 | |
| United Natural Foods, Inc.(a) | 3,020 | 111,317 | |
| 1,576,161 | |||
| FOOD PRODUCTS (1.6%) | |||
| B&G Foods, Inc. | 15,710 | 458,418 | |
| Calavo Growers, Inc. | 820 | 64,067 | |
| Cal-Maine Foods, Inc. | 1,710 | 63,886 | |
| Darling Ingredients, Inc.(a) | 14,530 | 1,009,108 | |
| Flowers Foods, Inc. | 10,913 | 261,475 | |
| Fresh Del Monte Produce, Inc. | 7,320 | 206,424 | |
| Hain Celestial Group, Inc. (The)(a) | 4,470 | 183,315 | |
| Ingredion, Inc. | 4,000 | 373,640 | |
| J & J Snack Foods Corp. | 840 | 138,272 | |
| John B. Sanfilippo & Son, Inc. | 740 | 65,046 | |
| Lancaster Colony Corp. | 1,090 | 201,334 | |
| Pilgrim's Pride Corp.(a) | 5,080 | 121,717 | |
| Post Holdings, Inc.(a) | 2,905 | 330,531 | |
| Sanderson Farms, Inc. | 1,080 | 177,692 | |
| Seneca Foods Corp., Class A(a) | 4,380 | 201,743 | |
| Simply Good Foods Co. (The)(a) | 3,570 | 123,343 | |
| Tootsie Roll Industries, Inc. | 1,015 | 32,044 | |
| TreeHouse Foods, Inc.(a) | 4,680 | 222,768 | |
| 4,234,823 | |||
| GAS UTILITIES (0.7%) | |||
| Chesapeake Utilities Corp. | 1,170 | 138,668 | |
| National Fuel Gas Co. | 4,760 | 236,382 | |
| New Jersey Resources Corp. | 4,940 | 207,233 | |
| Northwest Natural Holding Co. | 870 | 46,910 | |
| ONE Gas, Inc. | 2,310 | 185,886 | |
| South Jersey Industries, Inc. | 5,050 | 124,987 | |
| Southwest Gas Holdings, Inc. | 2,990 | 208,463 | |
| Spire, Inc. | 2,290 | 172,529 | |
| UGI Corp. | 11,460 | 500,917 | |
| 1,821,975 | |||
| HEALTH CARE EQUIPMENT & SUPPLIES (3.7%) | |||
| AngioDynamics, Inc.(a) | 3,770 | 91,611 | |
| Avanos Medical, Inc.(a) | 10,770 | 465,372 | |
| Cantel Medical Corp.(a) | 1,977 | 173,798 | |
| Cardiovascular Systems, Inc.(a) | 2,550 | 102,816 | |
| CONMED Corp. | 1,530 | 215,653 | |
| CryoLife, Inc.(a) | 2,660 | 77,619 | |
| Cutera, Inc.(a) | 1,330 | 39,940 | |
| Shares | Value | ||
| Glaukos Corp.(a) | 2,440 | $ 229,750 | |
| Globus Medical, Inc., Class A(a) | 4,170 | 299,281 | |
| Haemonetics Corp.(a) | 2,560 | 172,186 | |
| Heska Corp.(a) | 1,340 | 244,751 | |
| Hill-Rom Holdings, Inc. | 3,330 | 367,033 | |
| ICU Medical, Inc.(a) | 984 | 204,938 | |
| Inogen, Inc.(a) | 750 | 49,043 | |
| Integer Holdings Corp.(a) | 1,610 | 151,147 | |
| Integra LifeSciences Holdings Corp.(a) | 4,010 | 297,061 | |
| Invacare Corp.(a) | 18,770 | 169,493 | |
| Lantheus Holdings, Inc.(a) | 4,605 | 109,138 | |
| LeMaitre Vascular, Inc. | 4,530 | 237,689 | |
| LivaNova PLC(a) | 2,480 | 210,478 | |
| Masimo Corp.(a) | 3,670 | 853,899 | |
| Meridian Bioscience, Inc.(a) | 27,030 | 529,247 | |
| Merit Medical Systems, Inc.(a) | 9,385 | 596,886 | |
| Mesa Laboratories, Inc. | 240 | 59,676 | |
| Natus Medical, Inc.(a) | 2,130 | 54,422 | |
| Neogen Corp.(a) | 2,889 | 277,373 | |
| NuVasive, Inc.(a) | 2,760 | 197,202 | |
| OraSure Technologies, Inc.(a) | 3,830 | 35,045 | |
| Orthofix Medical, Inc.(a) | 720 | 31,932 | |
| Penumbra, Inc.(a) | 3,060 | 936,329 | |
| Quidel Corp.(a) | 5,100 | 534,429 | |
| STAAR Surgical Co.(a) | 8,840 | 1,211,168 | |
| Surmodics, Inc.(a) | 870 | 46,536 | |
| Tactile Systems Technology, Inc.(a) | 3,870 | 221,751 | |
| Varex Imaging Corp.(a) | 2,360 | 56,026 | |
| Zynex, Inc.(a) | 32,720 | 483,274 | |
| 10,033,992 | |||
| HEALTH CARE PROVIDERS & SERVICES (3.4%) | |||
| Acadia Healthcare Co., Inc.(a) | 4,990 | 303,991 | |
| Addus HomeCare Corp.(a) | 2,630 | 278,254 | |
| Amedisys, Inc.(a) | 2,899 | 782,295 | |
| AMN Healthcare Services, Inc.(a) | 2,570 | 203,801 | |
| Chemed Corp. | 1,051 | 500,917 | |
| CorVel Corp.(a) | 690 | 80,737 | |
| Covetrus, Inc.(a) | 5,620 | 161,013 | |
| Cross Country Healthcare, Inc.(a) | 5,310 | 70,729 | |
| Encompass Health Corp. | 5,560 | 471,822 | |
| Ensign Group, Inc. (The) | 7,470 | 641,299 | |
| Fulgent Genetics, Inc.(a) | 14,590 | 1,123,722 | |
| Hanger, Inc.(a) | 3,660 | 91,244 | |
| HealthEquity, Inc.(a) | 8,650 | 657,140 | |
| LHC Group, Inc.(a) | 2,580 | 537,337 | |
| Magellan Health Services, Inc.(a) | 2,830 | 266,586 | |
| Shares | Value | ||
| ModivCare, Inc.(a) | 2,850 | $ 399,228 | |
| Molina Healthcare, Inc.(a) | 2,935 | 748,718 | |
| Owens & Minor, Inc. | 3,855 | 139,127 | |
| Patterson Cos., Inc. | 5,480 | 176,127 | |
| Pennant Group, Inc. (The)(a) | 10,495 | 424,208 | |
| R1 RCM, Inc.(a) | 30,900 | 842,952 | |
| RadNet, Inc.(a) | 4,210 | 94,051 | |
| Select Medical Holdings Corp.(a) | 7,320 | 276,110 | |
| Tivity Health, Inc.(a) | 2,553 | 61,732 | |
| U.S. Physical Therapy, Inc. | 730 | 82,089 | |
| 9,415,229 | |||
| HEALTH CARE TECHNOLOGY (0.7%) | |||
| Allscripts Healthcare Solutions, Inc.(a) | 18,346 | 285,464 | |
| Computer Programs and Systems, Inc. | 890 | 26,718 | |
| HealthStream, Inc.(a) | 1,710 | 41,314 | |
| NextGen Healthcare, Inc.(a) | 4,380 | 80,198 | |
| Omnicell, Inc.(a) | 3,810 | 552,526 | |
| Simulations Plus, Inc. | 9,000 | 568,260 | |
| Tabula Rasa HealthCare, Inc.(a) | 4,990 | 237,324 | |
| 1,791,804 | |||
| HOTELS, RESTAURANTS & LEISURE (1.5%) | |||
| Choice Hotels International, Inc.(a) | 1,540 | 175,252 | |
| Cracker Barrel Old Country Store, Inc. | 1,290 | 216,036 | |
| Dine Brands Global, Inc.(a) | 4,260 | 411,729 | |
| El Pollo Loco Holdings, Inc.(a) | 4,210 | 71,317 | |
| Fiesta Restaurant Group, Inc.(a) | 1,990 | 29,333 | |
| Jack in the Box, Inc. | 2,430 | 293,179 | |
| Marriott Vacations Worldwide Corp.(a) | 2,106 | 374,089 | |
| Papa John's International, Inc. | 1,830 | 176,998 | |
| Shake Shack, Inc., Class A(a) | 3,600 | 391,500 | |
| Six Flags Entertainment Corp.(a) | 4,260 | 200,135 | |
| Travel + Leisure Co. | 4,890 | 315,552 | |
| Wendy's Co. (The) | 12,810 | 289,122 | |
| Wingstop, Inc. | 5,110 | 809,475 | |
| Wyndham Hotels & Resorts, Inc. | 4,860 | 355,314 | |
| 4,109,031 | |||
| HOUSEHOLD DURABLES (3.2%) | |||
| Cavco Industries, Inc.(a) | 420 | 87,961 | |
| Century Communities, Inc.(a) | 13,420 | 992,275 | |
| Ethan Allen Interiors, Inc. | 4,730 | 135,798 | |
| Helen of Troy Ltd.(a) | 2,450 | 517,465 | |
| Installed Building Products, Inc. | 5,410 | 728,457 | |
| iRobot Corp.(a) | 9,060 | 985,728 | |
| KB Home | 6,720 | 324,106 | |
| Shares | Value | ||
| La-Z-Boy, Inc. | 2,770 | $ 123,154 | |
| LGI Homes, Inc.(a) | 5,630 | 933,341 | |
| M.D.C Holdings, Inc. | 3,493 | 204,899 | |
| M/I Homes, Inc.(a) | 4,050 | 282,366 | |
| Meritage Homes Corp.(a) | 5,780 | 614,934 | |
| Taylor Morrison Home Corp.(a) | 12,402 | 387,066 | |
| Tempur Sealy International, Inc. | 16,160 | 616,342 | |
| Toll Brothers, Inc. | 6,000 | 376,200 | |
| TopBuild Corp.(a) | 4,160 | 925,101 | |
| Tri Pointe Homes, Inc.(a) | 17,220 | 410,180 | |
| Tupperware Brands Corp.(a) | 7,390 | 180,094 | |
| Universal Electronics, Inc.(a) | 870 | 49,460 | |
| 8,874,927 | |||
| HOUSEHOLD PRODUCTS (0.2%) | |||
| Central Garden & Pet Co.(a) | 410 | 22,198 | |
| Central Garden & Pet Co., Class A(a) | 2,790 | 137,463 | |
| Energizer Holdings, Inc. | 3,060 | 150,858 | |
| WD-40 Co. | 1,322 | 328,834 | |
| 639,353 | |||
| INDUSTRIAL CONGLOMERATES (0.2%) | |||
| Carlisle Cos., Inc. | 2,330 | 446,544 | |
| Raven Industries, Inc. | 1,930 | 78,397 | |
| 524,941 | |||
| INSURANCE (4.3%) | |||
| Alleghany Corp.(a) | 687 | 466,452 | |
| Ambac Financial Group, Inc.(a) | 4,210 | 72,202 | |
| American Equity Investment Life Holding Co. | 7,960 | 246,601 | |
| American Financial Group, Inc. | 4,200 | 516,012 | |
| AMERISAFE, Inc. | 960 | 59,597 | |
| Assured Guaranty Ltd. | 6,120 | 311,202 | |
| Brighthouse Financial, Inc.(a) | 18,160 | 849,706 | |
| Brown & Brown, Inc. | 17,830 | 948,200 | |
| CNO Financial Group, Inc. | 15,280 | 390,098 | |
| eHealth, Inc.(a) | 5,060 | 357,944 | |
| Employers Holdings, Inc. | 2,610 | 105,653 | |
| First American Financial Corp. | 7,050 | 454,725 | |
| Genworth Financial, Inc., Class A(a) | 97,500 | 421,200 | |
| Hanover Insurance Group, Inc. (The) | 2,320 | 320,879 | |
| HCI Group, Inc. | 5,210 | 382,518 | |
| Horace Mann Educators Corp. | 3,660 | 146,766 | |
| James River Group Holdings Ltd. | 1,860 | 87,625 | |
| Kemper Corp. | 4,012 | 313,177 | |
| Kinsale Capital Group, Inc. | 3,690 | 642,097 | |
| Mercury General Corp. | 3,310 | 206,114 | |
| Shares | Value | ||
| Old Republic International Corp. | 23,710 | $ 583,740 | |
| Palomar Holdings, Inc.(a) | 6,420 | 451,711 | |
| Primerica, Inc. | 3,200 | 511,264 | |
| ProAssurance Corp. | 3,130 | 78,250 | |
| Reinsurance Group of America, Inc. | 4,440 | 579,553 | |
| RenaissanceRe Holdings Ltd. | 2,310 | 389,951 | |
| RLI Corp. | 2,110 | 235,181 | |
| Safety Insurance Group, Inc. | 1,170 | 95,975 | |
| Selective Insurance Group, Inc. | 3,520 | 268,013 | |
| SiriusPoint Ltd.(a) | 18,430 | 194,989 | |
| Stewart Information Services Corp. | 3,800 | 222,870 | |
| Trupanion, Inc.(a) | 7,710 | 625,281 | |
| United Fire Group, Inc. | 2,900 | 87,754 | |
| United Insurance Holdings Corp. | 10,170 | 56,850 | |
| Universal Insurance Holdings, Inc. | 2,360 | 32,922 | |
| 11,713,072 | |||
| INTERACTIVE MEDIA & SERVICES (0.2%) | |||
| QuinStreet, Inc.(a) | 13,600 | 275,672 | |
| TripAdvisor, Inc.(a) | 4,990 | 235,179 | |
| Yelp, Inc.(a) | 3,900 | 153,270 | |
| 664,121 | |||
| INTERNET & DIRECT MARKETING RETAIL (0.8%) | |||
| Grubhub, Inc.(a) | 10,630 | 723,265 | |
| Liquidity Services, Inc.(a) | 2,330 | 41,777 | |
| PetMed Express, Inc. | 7,610 | 223,924 | |
| Shutterstock, Inc. | 5,940 | 517,849 | |
| Stamps.com, Inc.(a) | 3,680 | 755,762 | |
| 2,262,577 | |||
| IT SERVICES (1.5%) | |||
| Alliance Data Systems Corp. | 3,040 | 358,264 | |
| BM Technologies, Inc.(a) | 695 | 6,818 | |
| Cardtronics PLC, Class A(a) | 2,140 | 83,118 | |
| Concentrix Corp.(a) | 2,038 | 316,664 | |
| CSG Systems International, Inc. | 2,300 | 105,777 | |
| EVERTEC, Inc. | 7,690 | 306,831 | |
| ExlService Holdings, Inc.(a) | 4,080 | 376,910 | |
| LiveRamp Holdings, Inc.(a) | 3,200 | 156,736 | |
| MAXIMUS, Inc. | 3,360 | 307,910 | |
| Perficient, Inc.(a) | 5,850 | 383,819 | |
| Perspecta, Inc. | 8,930 | 261,381 | |
| Sabre Corp.(a) | 17,510 | 262,300 | |
| Sykes Enterprises, Inc.(a) | 2,690 | 117,903 | |
| TTEC Holdings, Inc. | 5,240 | 533,065 | |
| Shares | Value | ||
| Unisys Corp.(a) | 4,390 | $ 105,360 | |
| WEX, Inc.(a) | 2,062 | 423,143 | |
| 4,105,999 | |||
| LEISURE PRODUCTS (1.2%) | |||
| Brunswick Corp. | 3,880 | 415,664 | |
| Callaway Golf Co. | 5,630 | 162,989 | |
| Mattel, Inc.(a) | 22,700 | 487,142 | |
| Polaris, Inc. | 2,870 | 401,886 | |
| Sturm Ruger & Co., Inc. | 980 | 63,641 | |
| Vista Outdoor, Inc.(a) | 30,720 | 1,001,779 | |
| YETI Holdings, Inc.(a) | 10,000 | 854,200 | |
| 3,387,301 | |||
| LIFE SCIENCES TOOLS & SERVICES (2.2%) | |||
| Bio-Techne Corp. | 2,694 | 1,151,658 | |
| Luminex Corp. | 8,510 | 312,232 | |
| Medpace Holdings, Inc.(a) | 5,140 | 872,155 | |
| NeoGenomics, Inc.(a) | 14,870 | 728,481 | |
| PRA Health Sciences, Inc.(a) | 5,140 | 857,815 | |
| Repligen Corp.(a) | 5,780 | 1,223,684 | |
| Syneos Health, Inc.(a) | 9,850 | 835,772 | |
| 5,981,797 | |||
| MACHINERY (4.3%) | |||
| AGCO Corp. | 3,100 | 452,352 | |
| Alamo Group, Inc. | 1,790 | 281,478 | |
| Albany International Corp., Class A | 1,580 | 140,999 | |
| Astec Industries, Inc. | 1,150 | 86,262 | |
| Barnes Group, Inc. | 1,900 | 94,848 | |
| Chart Industries, Inc.(a) | 5,990 | 962,174 | |
| CIRCOR International, Inc.(a) | 1,050 | 36,089 | |
| Colfax Corp.(a) | 6,030 | 272,496 | |
| Crane Co. | 2,280 | 214,457 | |
| Donaldson Co., Inc. | 6,480 | 407,462 | |
| Enerpac Tool Group Corp. | 3,220 | 85,652 | |
| EnPro Industries, Inc. | 720 | 61,668 | |
| ESCO Technologies, Inc. | 1,050 | 114,198 | |
| Federal Signal Corp. | 9,270 | 384,056 | |
| Flowserve Corp. | 4,530 | 179,569 | |
| Franklin Electric Co., Inc. | 4,100 | 333,207 | |
| Graco, Inc. | 10,250 | 787,200 | |
| Greenbrier Cos., Inc. (The) | 6,170 | 291,471 | |
| Hillenbrand, Inc. | 3,930 | 192,924 | |
| ITT, Inc. | 4,540 | 428,167 | |
| John Bean Technologies Corp. | 1,555 | 226,066 | |
| Kennametal, Inc. | 4,390 | 176,302 | |
| Lincoln Electric Holdings, Inc. | 4,000 | 512,200 | |
| Shares | Value | ||
| Lindsay Corp. | 560 | $ 92,837 | |
| Lydall, Inc.(a) | 1,340 | 49,379 | |
| Meritor, Inc.(a) | 3,720 | 100,552 | |
| Middleby Corp. (The)(a) | 2,720 | 493,190 | |
| Mueller Industries, Inc. | 3,700 | 166,019 | |
| Nordson Corp. | 2,550 | 539,095 | |
| Oshkosh Corp. | 3,890 | 484,033 | |
| Proto Labs, Inc.(a) | 3,290 | 368,677 | |
| SPX Corp.(a) | 2,280 | 138,305 | |
| SPX FLOW, Inc. | 2,240 | 149,162 | |
| Standex International Corp. | 370 | 35,083 | |
| Tennant Co. | 900 | 71,019 | |
| Terex Corp. | 4,010 | 188,430 | |
| Timken Co. (The) | 6,740 | 565,284 | |
| Titan International, Inc.(a) | 5,670 | 61,179 | |
| Toro Co. (The) | 7,200 | 825,120 | |
| Trinity Industries, Inc. | 6,380 | 176,343 | |
| Wabash National Corp. | 5,900 | 103,899 | |
| Watts Water Technologies, Inc., Class A | 1,300 | 161,915 | |
| Woodward, Inc. | 2,640 | 330,026 | |
| 11,820,844 | |||
| MARINE (0.2%) | |||
| Kirby Corp.(a) | 3,350 | 213,395 | |
| Matson, Inc. | 6,430 | 420,072 | |
| 633,467 | |||
| MEDIA (1.1%) | |||
| AMC Networks, Inc., Class A(a) | 2,930 | 147,320 | |
| Cable One, Inc. | 364 | 651,560 | |
| EW Scripps Co. (The), Class A | 7,790 | 168,420 | |
| Gannett Co., Inc.(a) | 25,722 | 116,778 | |
| John Wiley & Sons, Inc., Class A | 2,580 | 146,905 | |
| Meredith Corp.(a) | 2,540 | 78,994 | |
| New York Times Co. (The), Class A | 9,480 | 430,487 | |
| Scholastic Corp. | 3,560 | 107,975 | |
| TechTarget, Inc.(a) | 10,170 | 780,039 | |
| TEGNA, Inc. | 13,450 | 269,807 | |
| 2,898,285 | |||
| METALS & MINING (1.7%) | |||
| Allegheny Technologies, Inc.(a) | 8,380 | 194,919 | |
| Arconic Corp.(a) | 5,220 | 149,292 | |
| Carpenter Technology Corp. | 4,900 | 185,563 | |
| Century Aluminum Co.(a) | 4,040 | 63,266 | |
| Cleveland-Cliffs, Inc.(a) | 37,818 | 675,429 | |
| Commercial Metals Co. | 12,530 | 366,127 | |
| Compass Minerals International, Inc. | 1,620 | 110,030 | |
| Shares | Value | ||
| Haynes International, Inc. | 1,040 | $ 30,410 | |
| Kaiser Aluminum Corp. | 480 | 57,826 | |
| Materion Corp. | 900 | 63,729 | |
| Olympic Steel, Inc. | 9,700 | 281,785 | |
| Reliance Steel & Aluminum Co. | 3,370 | 540,245 | |
| Royal Gold, Inc. | 2,970 | 332,224 | |
| Steel Dynamics, Inc. | 11,640 | 631,121 | |
| SunCoke Energy, Inc. | 31,620 | 213,435 | |
| TimkenSteel Corp.(a) | 13,065 | 157,041 | |
| United States Steel Corp. | 16,280 | 374,603 | |
| Warrior Met Coal, Inc. | 5,470 | 86,699 | |
| Worthington Industries, Inc. | 1,960 | 127,910 | |
| 4,641,654 | |||
| MORTGAGE REAL ESTATE INVESTMENT TRUSTS (0.4%) | |||
| Apollo Commercial Real Estate Finance, Inc. | 13,240 | 201,380 | |
| Armour Residential REIT, Inc. | 3,580 | 44,499 | |
| Capstead Mortgage Corp. | 12,460 | 80,741 | |
| Granite Point Mortgage Trust, Inc. | 6,490 | 85,928 | |
| Invesco Mortgage Capital, Inc. | 14,479 | 56,468 | |
| KKR Real Estate Finance Trust, Inc. | 1,220 | 25,742 | |
| New York Mortgage Trust, Inc. | 22,570 | 103,596 | |
| Pennymac Mortgage Investment Trust | 9,370 | 187,869 | |
| Ready Capital Corp. | 7,140 | 103,601 | |
| Redwood Trust, Inc. | 11,370 | 126,321 | |
| 1,016,145 | |||
| MULTILINE RETAIL (1.1%) | |||
| Big Lots, Inc. | 16,200 | 1,116,828 | |
| Kohl's Corp. | 11,210 | 657,579 | |
| Macy's, Inc.(a) | 18,660 | 309,383 | |
| Nordstrom, Inc.(a) | 5,790 | 212,377 | |
| Ollie's Bargain Outlet Holdings, Inc.(a) | 7,380 | 680,952 | |
| 2,977,119 | |||
| MULTI-UTILITIES (0.3%) | |||
| Avista Corp. | 3,820 | 175,796 | |
| Black Hills Corp. | 3,170 | 218,667 | |
| MDU Resources Group, Inc. | 11,290 | 377,763 | |
| NorthWestern Corp. | 2,150 | 146,265 | |
| 918,491 | |||
| OIL, GAS & CONSUMABLE FUELS (2.0%) | |||
| Antero Midstream Corp. | 47,910 | 413,942 | |
| Bonanza Creek Energy, Inc.(a) | 21,430 | 709,119 | |
| Callon Petroleum Co.(a) | 5,015 | 187,511 | |
| Cimarex Energy Co. | 4,830 | 319,746 | |
| CNX Resources Corp.(a) | 25,020 | 335,768 | |
| Shares | Value | ||
| CONSOL Energy, Inc.(a) | 25,607 | $ 224,829 | |
| Dorian LPG Ltd.(a) | 1,410 | 18,739 | |
| EQT Corp.(a) | 13,940 | 266,254 | |
| Equitrans Midstream Corp. | 18,840 | 153,734 | |
| Green Plains, Inc.(a) | 10,020 | 298,596 | |
| Laredo Petroleum, Inc.(a) | 457 | 18,527 | |
| Matador Resources Co. | 5,740 | 151,019 | |
| Murphy Oil Corp. | 8,150 | 137,979 | |
| Par Pacific Holdings, Inc.(a) | 4,610 | 70,026 | |
| PBF Energy, Inc., Class A(a) | 11,450 | 162,361 | |
| PDC Energy, Inc.(a) | 4,998 | 182,477 | |
| Penn Virginia Corp.(a) | 4,830 | 65,833 | |
| Range Resources Corp.(a) | 14,540 | 142,783 | |
| Renewable Energy Group, Inc.(a) | 13,840 | 768,397 | |
| REX American Resources Corp.(a) | 150 | 12,110 | |
| SM Energy Co. | 13,340 | 210,772 | |
| Southwestern Energy Co.(a) | 45,040 | 192,321 | |
| Talos Energy, Inc.(a) | 11,910 | 133,273 | |
| World Fuel Services Corp. | 8,600 | 265,998 | |
| 5,442,114 | |||
| PAPER & FOREST PRODUCTS (0.4%) | |||
| Clearwater Paper Corp.(a) | 4,330 | 144,882 | |
| Domtar Corp.(a) | 8,030 | 316,542 | |
| Glatfelter Corp. | 4,190 | 61,677 | |
| Louisiana-Pacific Corp. | 5,850 | 385,398 | |
| Mercer International, Inc. | 7,110 | 117,244 | |
| 1,025,743 | |||
| PERSONAL PRODUCTS (0.5%) | |||
| Coty, Inc., Class A(a) | 7,880 | 78,879 | |
| Edgewell Personal Care Co. | 3,960 | 151,272 | |
| elf Beauty, Inc.(a) | 1,090 | 32,973 | |
| Inter Parfums, Inc. | 1,240 | 91,264 | |
| Medifast, Inc. | 3,800 | 862,942 | |
| Nu Skin Enterprises, Inc., Class A | 2,800 | 148,008 | |
| USANA Health Sciences, Inc.(a) | 580 | 52,194 | |
| 1,417,532 | |||
| PHARMACEUTICALS (1.3%) | |||
| Amphastar Pharmaceuticals, Inc.(a) | 3,210 | 55,854 | |
| ANI Pharmaceuticals, Inc.(a) | 800 | 26,624 | |
| Collegium Pharmaceutical, Inc.(a) | 20,060 | 447,338 | |
| Corcept Therapeutics, Inc.(a) | 28,980 | 660,454 | |
| ENDO International PLC(a) | 15,320 | 87,784 | |
| Innoviva, Inc.(a) | 26,830 | 307,204 | |
| Jazz Pharmaceuticals PLC(a) | 3,870 | 636,228 | |
| Lannett Co., Inc.(a) | 14,020 | 61,267 | |
| Shares | Value | ||
| Nektar Therapeutics(a) | 9,540 | $ 187,079 | |
| Pacira BioSciences, Inc.(a) | 8,420 | 531,976 | |
| Phibro Animal Health Corp., Class A | 1,400 | 34,328 | |
| Prestige Consumer Healthcare, Inc.(a) | 3,020 | 131,551 | |
| Supernus Pharmaceuticals, Inc.(a) | 15,730 | 478,978 | |
| 3,646,665 | |||
| PROFESSIONAL SERVICES (1.8%) | |||
| ASGN, Inc.(a) | 5,650 | 594,267 | |
| CACI International, Inc., Class A(a) | 1,127 | 287,227 | |
| CoreLogic, Inc. | 7,790 | 620,863 | |
| Exponent, Inc. | 5,080 | 489,356 | |
| Forrester Research, Inc.(a) | 2,810 | 122,095 | |
| FTI Consulting, Inc.(a) | 3,500 | 485,975 | |
| Heidrick & Struggles International, Inc. | 1,020 | 43,146 | |
| Insperity, Inc. | 3,940 | 344,908 | |
| KBR, Inc. | 8,910 | 352,480 | |
| Kelly Services, Inc., Class A(a) | 9,060 | 226,953 | |
| Korn Ferry | 3,190 | 216,569 | |
| ManpowerGroup, Inc. | 3,850 | 465,426 | |
| ManTech International Corp., Class A | 1,450 | 123,757 | |
| Resources Connection, Inc. | 3,160 | 44,588 | |
| Science Applications International Corp. | 2,904 | 259,676 | |
| TrueBlue, Inc.(a) | 6,910 | 195,553 | |
| 4,872,839 | |||
| REAL ESTATE MANAGEMENT & DEVELOPMENT (0.6%) | |||
| Jones Lang LaSalle, Inc.(a) | 3,018 | 567,112 | |
| Marcus & Millichap, Inc.(a) | 1,590 | 56,159 | |
| RE/MAX Holdings, Inc., Class A | 930 | 34,159 | |
| Realogy Holdings Corp.(a) | 14,770 | 255,226 | |
| St Joe Co. (The) | 18,000 | 824,220 | |
| 1,736,876 | |||
| ROAD & RAIL (1.1%) | |||
| ArcBest Corp. | 4,040 | 293,950 | |
| Avis Budget Group, Inc.(a) | 2,590 | 232,090 | |
| Heartland Express, Inc. | 2,983 | 55,454 | |
| Knight-Swift Transportation Holdings, Inc. | 13,420 | 632,350 | |
| Landstar System, Inc. | 2,090 | 360,065 | |
| Marten Transport Ltd. | 8,959 | 149,795 | |
| Ryder System, Inc. | 4,290 | 342,514 | |
| Saia, Inc.(a) | 3,660 | 858,270 | |
| Werner Enterprises, Inc. | 2,690 | 124,359 | |
| 3,048,847 | |||
| SEMICONDUCTORS & SEMICONDUCTOR EQUIPMENT (4.0%) | |||
| Advanced Energy Industries, Inc. | 6,140 | 677,303 | |
| Shares | Value | ||
| Amkor Technology, Inc. | 3,320 | $ 67,130 | |
| Axcelis Technologies, Inc.(a) | 1,780 | 73,923 | |
| Brooks Automation, Inc. | 10,310 | 1,044,712 | |
| CEVA, Inc.(a) | 6,660 | 369,230 | |
| Cirrus Logic, Inc.(a) | 2,780 | 206,860 | |
| CMC Materials, Inc. | 3,330 | 610,822 | |
| Cohu, Inc.(a) | 7,410 | 296,474 | |
| Cree, Inc.(a) | 5,620 | 558,740 | |
| Diodes, Inc.(a) | 5,340 | 410,165 | |
| DSP Group, Inc.(a) | 1,130 | 15,696 | |
| First Solar, Inc.(a) | 8,010 | 613,005 | |
| FormFactor, Inc.(a) | 12,420 | 486,243 | |
| Ichor Holdings Ltd.(a) | 1,410 | 78,636 | |
| Kulicke & Soffa Industries, Inc. | 3,370 | 191,585 | |
| MaxLinear, Inc.(a) | 3,630 | 130,644 | |
| MKS Instruments, Inc. | 3,360 | 601,810 | |
| Onto Innovation, Inc.(a) | 7,359 | 504,239 | |
| PDF Solutions, Inc.(a) | 1,280 | 22,694 | |
| Photronics, Inc.(a) | 7,750 | 98,425 | |
| Power Integrations, Inc. | 6,410 | 530,812 | |
| Rambus, Inc.(a) | 8,140 | 154,497 | |
| Semtech Corp.(a) | 2,950 | 199,833 | |
| Silicon Laboratories, Inc.(a) | 1,990 | 280,491 | |
| SMART Global Holdings, Inc.(a) | 700 | 32,305 | |
| SolarEdge Technologies, Inc.(a) | 4,600 | 1,212,284 | |
| Synaptics, Inc.(a) | 1,750 | 244,773 | |
| Ultra Clean Holdings, Inc.(a) | 9,210 | 470,355 | |
| Universal Display Corp. | 2,610 | 583,831 | |
| Veeco Instruments, Inc.(a) | 3,679 | 84,654 | |
| 10,852,171 | |||
| SOFTWARE (4.0%) | |||
| 8x8, Inc.(a) | 12,850 | 422,637 | |
| ACI Worldwide, Inc.(a) | 6,600 | 249,348 | |
| Agilysys, Inc.(a) | 6,310 | 318,087 | |
| Alarm.com Holdings, Inc.(a) | 9,590 | 860,798 | |
| Blackbaud, Inc.(a) | 2,530 | 179,934 | |
| Bottomline Technologies DE, Inc.(a) | 2,240 | 108,774 | |
| CDK Global, Inc. | 6,580 | 352,622 | |
| Ceridian HCM Holding, Inc.(a) | 6,370 | 601,838 | |
| CommVault Systems, Inc.(a) | 2,410 | 167,519 | |
| Ebix, Inc. | 8,770 | 264,065 | |
| Fair Isaac Corp.(a) | 1,878 | 979,208 | |
| InterDigital, Inc. | 1,570 | 108,989 | |
| J2 Global, Inc.(a) | 2,200 | 266,200 | |
| LivePerson, Inc.(a) | 8,450 | 461,793 | |
| Manhattan Associates, Inc.(a) | 3,170 | 435,051 | |
| Shares | Value | ||
| MicroStrategy, Inc., Class A(a) | 1,589 | $ 1,044,227 | |
| OneSpan, Inc.(a) | 7,010 | 187,938 | |
| Paylocity Holding Corp.(a) | 4,230 | 817,405 | |
| Progress Software Corp. | 2,750 | 120,065 | |
| PTC, Inc.(a) | 7,010 | 917,889 | |
| Qualys, Inc.(a) | 3,910 | 396,318 | |
| Sailpoint Technologies Holdings, Inc.(a) | 11,930 | 582,542 | |
| SPS Commerce, Inc.(a) | 6,670 | 683,275 | |
| Teradata Corp.(a) | 6,010 | 297,315 | |
| Xperi Holding Corp. | 6,239 | 128,211 | |
| 10,952,048 | |||
| SPECIALTY RETAIL (5.3%) | |||
| Aaron's Co., Inc. (The) | 10,815 | 334,075 | |
| Abercrombie & Fitch Co., Class A(a) | 6,950 | 260,555 | |
| American Eagle Outfitters, Inc. | 9,070 | 313,550 | |
| America's Car-Mart, Inc.(a) | 370 | 55,807 | |
| Asbury Automotive Group, Inc.(a) | 1,580 | 313,804 | |
| AutoNation, Inc.(a) | 4,840 | 496,003 | |
| Barnes & Noble Education, Inc.(a) | 18,970 | 150,053 | |
| Bed Bath & Beyond, Inc.(a) | 10,630 | 269,152 | |
| Boot Barn Holdings, Inc.(a) | 1,650 | 116,391 | |
| Buckle, Inc. (The) | 2,025 | 84,929 | |
| Caleres, Inc. | 2,455 | 57,226 | |
| Cato Corp. (The), Class A(a) | 8,760 | 117,384 | |
| Chico's FAS, Inc.(a) | 58,740 | 176,220 | |
| Children's Place, Inc. (The)(a) | 750 | 58,763 | |
| Conn's, Inc.(a) | 11,900 | 240,856 | |
| Designer Brands, Inc., Class A(a) | 4,540 | 80,358 | |
| Dick's Sporting Goods, Inc. | 4,860 | 401,339 | |
| Five Below, Inc.(a) | 4,410 | 887,601 | |
| Foot Locker, Inc. | 7,660 | 451,787 | |
| Genesco, Inc.(a) | 3,150 | 157,500 | |
| Group 1 Automotive, Inc. | 1,730 | 283,997 | |
| Guess?, Inc. | 2,710 | 73,278 | |
| Haverty Furniture Cos., Inc. | 1,520 | 70,634 | |
| Hibbett Sports, Inc.(a) | 11,390 | 904,935 | |
| Lithia Motors, Inc., Class A | 2,830 | 1,087,795 | |
| Lumber Liquidators Holdings, Inc.(a) | 16,350 | 391,909 | |
| MarineMax, Inc.(a) | 21,590 | 1,226,312 | |
| Monro, Inc. | 1,615 | 114,003 | |
| ODP Corp. (The)(a) | 6,668 | 269,587 | |
| Rent-A-Center, Inc. | 11,600 | 667,580 | |
| RH (a) | 2,060 | 1,417,321 | |
| Sally Beauty Holdings, Inc.(a) | 7,810 | 156,747 | |
| Shoe Carnival, Inc. | 2,080 | 124,696 | |
| Signet Jewelers Ltd.(a) | 5,300 | 316,675 | |
| Shares | Value | ||
| Sleep Number Corp.(a) | 7,110 | $ 795,538 | |
| Sonic Automotive, Inc., Class A | 3,120 | 153,941 | |
| Urban Outfitters, Inc.(a) | 5,610 | 201,399 | |
| Williams-Sonoma, Inc. | 6,920 | 1,181,590 | |
| Zumiez, Inc.(a) | 1,460 | 62,736 | |
| 14,524,026 | |||
| TECHNOLOGY HARDWARE, STORAGE & PERIPHERALS (0.3%) | |||
| 3D Systems Corp.(a) | 6,800 | 146,472 | |
| Diebold Nixdorf, Inc.(a) | 5,640 | 84,656 | |
| NCR Corp.(a) | 8,190 | 374,693 | |
| Xerox Holdings Corp. | 13,010 | 314,061 | |
| 919,882 | |||
| TEXTILES, APPAREL & LUXURY GOODS (1.5%) | |||
| Capri Holdings Ltd.(a) | 7,670 | 422,464 | |
| Carter's, Inc.(a) | 2,050 | 223,020 | |
| Columbia Sportswear Co. | 1,530 | 166,785 | |
| Crocs, Inc.(a) | 9,930 | 994,192 | |
| Deckers Outdoor Corp.(a) | 2,510 | 848,882 | |
| Fossil Group, Inc.(a) | 3,240 | 41,796 | |
| G-III Apparel Group Ltd.(a) | 8,900 | 289,161 | |
| Kontoor Brands, Inc. | 2,560 | 160,845 | |
| Movado Group, Inc. | 1,370 | 42,977 | |
| Oxford Industries, Inc. | 770 | 70,247 | |
| Skechers USA, Inc., Class A(a) | 7,250 | 351,552 | |
| Steven Madden Ltd. | 4,605 | 187,285 | |
| Unifi, Inc.(a) | 4,610 | 124,608 | |
| Vera Bradley, Inc.(a) | 8,990 | 99,789 | |
| Wolverine World Wide, Inc. | 4,650 | 193,998 | |
| 4,217,601 | |||
| THRIFTS & MORTGAGE FINANCE (1.6%) | |||
| Axos Financial, Inc.(a) | 11,350 | 512,452 | |
| Essent Group Ltd. | 5,410 | 284,458 | |
| Flagstar Bancorp, Inc. | 2,380 | 110,765 | |
| HomeStreet, Inc. | 1,670 | 68,203 | |
| Meta Financial Group, Inc. | 2,360 | 116,254 | |
| MGIC Investment Corp. | 16,020 | 244,145 | |
| Mr. Cooper Group, Inc.(a) | 34,190 | 1,178,871 | |
| New York Community Bancorp, Inc. | 27,620 | 330,335 | |
| NMI Holdings, Inc., Class A(a) | 13,830 | 357,367 | |
| Northfield Bancorp, Inc. | 4,990 | 80,738 | |
| Northwest Bancshares, Inc. | 3,460 | 48,578 | |
| Provident Financial Services, Inc. | 3,730 | 87,916 | |
| TrustCo Bank Corp. NY | 4,000 | 29,260 | |
| Walker & Dunlop, Inc. | 4,390 | 486,632 | |
| Shares | Value | ||
| Washington Federal, Inc. | 4,240 | $ 138,012 | |
| WSFS Financial Corp. | 3,010 | 153,781 | |
| 4,227,767 | |||
| TRADING COMPANIES & DISTRIBUTORS (0.9%) | |||
| Applied Industrial Technologies, Inc. | 1,780 | 170,275 | |
| Boise Cascade Co. | 4,070 | 271,550 | |
| DXP Enterprises, Inc.(a) | 4,140 | 121,178 | |
| GATX Corp. | 2,060 | 201,283 | |
| GMS, Inc.(a) | 4,540 | 198,443 | |
| MSC Industrial Direct Co., Inc., Class A | 2,210 | 199,254 | |
| NOW, Inc.(a) | 19,230 | 188,839 | |
| Univar Solutions, Inc.(a) | 11,350 | 265,022 | |
| Veritiv Corp.(a) | 8,420 | 352,629 | |
| Watsco, Inc. | 1,630 | 477,362 | |
| 2,445,835 | |||
| WATER UTILITIES (0.3%) | |||
| American States Water Co. | 1,950 | 154,421 | |
| California Water Service Group | 2,710 | 159,212 | |
| Essential Utilities, Inc. | 10,912 | 514,283 | |
| 827,916 | |||
| WIRELESS TELECOMMUNICATION SERVICES (0.2%) | |||
| Shenandoah Telecommunications Co. | 2,630 | 124,294 | |
| Spok Holdings, Inc. | 8,180 | 84,009 | |
| Telephone and Data Systems, Inc. | 12,770 | 293,454 | |
| 501,757 | |||
| TOTAL COMMON STOCKS (COST $192,836,481) | 270,785,901 | ||
| Shares | Value | ||
| RIGHT (0.0%) | |||
| BIOTECHNOLOGY (0.0%) | |||
| Progenics Pharmaceuticals, Inc.(a)(b) | 7,180 | $ — | |
| TOTAL RIGHT (COST $—) | — | ||
| MONEY MARKET FUND (1.1%) | |||
| Northern Institutional Treasury Portfolio (Premier Class), 0.01%(c) | 2,906,188 | 2,906,188 | |
| TOTAL MONEY MARKET FUND (COST $2,906,188) | 2,906,188 | ||
| TOTAL INVESTMENTS (COST $195,742,669) 100.0% | 273,692,089 | ||
| LIABILITIES IN EXCESS OF OTHER ASSETS 0.0% | (64,820) | ||
| NET ASSETS 100.0% | $ 273,627,269 | ||
| Amounts designated as ‘‘—’’ are $0 or have been rounded to $0. | |||
| (a) | Represents non-income producing security. |
| (b) | Security is a Level 3 investment. |
| (c) | 7-day current yield as of April 30, 2021 is disclosed. |
| PLC — Public Limited Company |
| REIT — Real Estate Investment Trust |
| Steward Covered Call Income Fund | Steward Global Equity Income Fund | Steward International Enhanced Index Fund | |||
| Assets: | |||||
| Investments, at value (cost $33,574,797, $270,772,626 and $151,809,729, respectively) | $ 37,610,810 | $ 344,669,325 | $ 180,273,333 | ||
| Interest and dividend receivable | 33,667 | 720,485 | 343,600 | ||
| Receivable for capital shares issued | 37,543 | 582,496 | 79,775 | ||
| Reclaims receivable | — | 83,235 | 116,691 | ||
| Prepaid investment advisory fees | 69,366 | — | — | ||
| Prepaid expenses and other assets | 8,695 | 26,672 | 17,094 | ||
| Total assets | 37,760,081 | 346,082,213 | 180,830,493 | ||
| Liabilities: | |||||
| Payable for capital shares redeemed | 4,410 | 756,607 | 48,351 | ||
| Written options at fair value (premiums received $772,910, $0 and $0, respectively) | 1,264,243 | — | — | ||
| Accrued expenses and other payables: | |||||
| Investment advisory fees | — | 176,817 | 53,734 | ||
| Administration fees | 2,214 | 21,218 | 11,041 | ||
| Distribution fees - Class A | 22 | 15,147 | 5,646 | ||
| Distribution fees - Class C | 4,372 | 41,898 | — | ||
| Sub-accounting service fees - Class A | 3 | 4,696 | 897 | ||
| Sub-accounting service fees - Class C | 23 | 469 | — | ||
| Sub-accounting service fees - Institutional Class | 6,963 | 35,255 | 18,243 | ||
| Fund accounting and sub-administration fees | 31,962 | 110,360 | 48,201 | ||
| Transfer agent fees | 15,000 | 15,000 | 15,000 | ||
| Custodian fees | 24,151 | 23,678 | 11,065 | ||
| Printing fees | 718 | 6,095 | 3,648 | ||
| Professional fees | 3,265 | 30,786 | 16,009 | ||
| Other accrued liabilities | 10,521 | 5,541 | 5,541 | ||
| Total liabilities | 1,367,867 | 1,243,567 | 237,376 | ||
| Net Assets | $ 36,392,214 | $ 344,838,646 | $ 180,593,117 | ||
| Composition of Net Assets: | |||||
| Capital (par value and paid-in surplus) | 35,904,123 | 250,465,235 | 150,884,182 | ||
| Total distributable earnings | 488,091 | 94,373,411 | 29,708,935 | ||
| Net Assets | $ 36,392,214 | $ 344,838,646 | $ 180,593,117 | ||
| Class A | |||||
| Net Assets | $ 10,956 | $ 47,363,292 | $ 8,721,112 | ||
| Shares authorized | 16,000,000 | 16,000,000 | 16,000,000 | ||
| Shares issued and outstanding ($0.001 par value) | 1,108 | 1,266,745 | 350,932 | ||
| Net asset value, offering and redemption price per share | $ 9.88 | $ 37.39 | $ 24.85 | ||
| Class C | |||||
| Net Assets | $ 195,302 | $ 3,884,798 | $ 11 | ||
| Shares authorized | 15,000,000 | 15,000,000 | 15,000,000 | ||
| Shares issued and outstanding ($0.001 par value) | 19,711 | 99,169 | 1 | ||
| Net asset value, offering and redemption price per share(a) | $ 9.91 | $ 39.17 | $ 20.65 | ||
| Class R6 | |||||
| Net Assets | $ 13 | $ 238,969 | $ 635,155 | ||
| Shares authorized | 16,000,000 | 16,000,000 | 16,000,000 | ||
| Shares issued and outstanding ($0.001 par value) | 1 | 6,769 | 30,376 | ||
| Net asset value, offering and redemption price per share(a) | $ 9.89 | $ 35.30 | $ 20.91 | ||
| Institutional Class | |||||
| Net Assets | $ 36,185,943 | $ 293,351,587 | $ 171,236,839 | ||
| Shares authorized | 20,000,000 | 20,000,000 | 20,000,000 | ||
| Shares issued and outstanding ($0.001 par value) | 3,649,207 | 7,831,965 | 6,885,866 | ||
| Net asset value, offering and redemption price per share | $ 9.92 | $ 37.46 | $ 24.87 |
| (a) | Per share amounts may not recalculate due to rounding of net assets and shares outstanding. |
| Steward Large Cap Enhanced Index Fund | Steward Select Bond Fund | Steward Small-Mid Cap Enhanced Index Fund | |||
| Assets: | |||||
| Investments, at value (cost $278,254,368, $185,349,570 and $195,742,669, respectively) | $ 397,833,812 | $ 189,337,185 | $ 273,692,089 | ||
| Interest and dividend receivable | 239,245 | 1,328,002 | 63,397 | ||
| Receivable for investments sold | — | 3,873 | — | ||
| Receivable for capital shares issued | 283,257 | 128,254 | 145,525 | ||
| Prepaid expenses and other assets | 21,186 | 15,290 | 23,881 | ||
| Total assets | 398,377,500 | 190,812,604 | 273,924,892 | ||
| Liabilities: | |||||
| Payable for investments purchased | — | 2,193,860 | — | ||
| Payable for when-issued securities | — | 1,000,000 | — | ||
| Payable for capital shares redeemed | 27,063 | 154,634 | 39,337 | ||
| Accrued expenses and other payables: | |||||
| Investment advisory fees | 69,802 | 47,929 | 48,700 | ||
| Administration fees | 24,350 | 11,412 | 16,989 | ||
| Distribution fees - Class A | 12,962 | 965 | 19,792 | ||
| Sub-accounting service fees - Class A | 2,566 | 350 | 2,448 | ||
| Sub-accounting service fees - Institutional Class | 49,671 | 24,563 | 22,037 | ||
| Fund accounting and sub-administration fees | 130,312 | 47,461 | 70,722 | ||
| Transfer agent fees | 15,000 | 15,000 | 15,000 | ||
| Custodian fees | 32,911 | 11,622 | 26,294 | ||
| Printing fees | 1,373 | 2,894 | 6,333 | ||
| Professional fees | 34,411 | 16,933 | 24,430 | ||
| Other accrued liabilities | 5,541 | 12,301 | 5,541 | ||
| Total liabilities | 405,962 | 3,539,924 | 297,623 | ||
| Net Assets | $ 397,971,538 | $ 187,272,680 | $ 273,627,269 | ||
| Composition of Net Assets: | |||||
| Capital (par value and paid-in surplus) | 226,237,704 | 185,508,446 | 180,529,344 | ||
| Total distributable earnings | 171,733,834 | 1,764,234 | 93,097,925 | ||
| Net Assets | $ 397,971,538 | $ 187,272,680 | $ 273,627,269 | ||
| Class A | |||||
| Net Assets | $ 28,750,822 | $ 5,988,905 | $ 64,996,595 | ||
| Shares authorized | 16,000,000 | 16,000,000 | 16,000,000 | ||
| Shares issued and outstanding ($0.001 par value) | 541,287 | 239,082 | 3,709,445 | ||
| Net asset value, offering and redemption price per share(a) | $ 53.12 | $ 25.05 | $ 17.52 | ||
| Class C | |||||
| Net Assets | $ 14 | $ 4,408 | $ 14 | ||
| Shares authorized | 15,000,000 | 15,000,000 | 15,000,000 | ||
| Shares issued and outstanding ($0.001 par value) | 1 | 155 | 1 | ||
| Net asset value, offering and redemption price per share(a) | $ 47.63 | $ 28.38 | $ 16.14 | ||
| Class R6 | |||||
| Net Assets | $ 519,814 | $ 10 | $ 125,444 | ||
| Shares authorized | 16,000,000 | 16,000,000 | 16,000,000 | ||
| Shares issued and outstanding ($0.001 par value) | 10,835 | 1 | 7,663 | ||
| Net asset value, offering and redemption price per share(a) | $ 47.97 | $ 27.97 | $ 16.37 | ||
| Institutional Class | |||||
| Net Assets | $ 368,700,888 | $ 181,279,357 | $ 208,505,216 | ||
| Shares authorized | 20,000,000 | 20,000,000 | 20,000,000 | ||
| Shares issued and outstanding ($0.001 par value) | 6,962,953 | 7,279,958 | 11,666,839 | ||
| Net asset value, offering and redemption price per share(a) | $ 52.95 | $ 24.90 | $ 17.87 |
| (a) | Per share amounts may not recalculate due to rounding of net assets and shares outstanding. |
| Steward Covered Call Income Fund | Steward Global Equity Income Fund | Steward International Enhanced Index Fund | |||
| Investment Income: | |||||
| Dividends (net of foreign witholding tax of $0, $716,941 and $547,363, respectively) | $ 542,975 | $ 8,935,854 | $ 4,123,836 | ||
| Interest | 217 | 640 | 517 | ||
| Total investment income | 543,192 | 8,936,494 | 4,124,353 | ||
| Expenses: | |||||
| Investment advisory fees | 196,710 | 1,899,059 | 570,499 | ||
| Administration fees | 23,605 | 227,889 | 117,227 | ||
| Distribution fees - Class A | 23 | 113,092 | 30,210 | ||
| Distribution fees - Class C | 2,462 | 41,554 | — | ||
| Sub-accounting services fees - Class A | 25 | 62,344 | 13,651 | ||
| Sub-accounting services fees - Class C | 362 | 4,360 | — | ||
| Sub-accounting services fees - Institutional Class | 36,593 | 265,445 | 163,566 | ||
| Fund accounting and sub-administration fees | 63,962 | 178,199 | 85,081 | ||
| Transfer agent fees | 31,875 | 31,875 | 31,875 | ||
| Custodian fees | 49,456 | 45,676 | 21,952 | ||
| Registration fees | 82,659 | 65,851 | 71,522 | ||
| Directors fees | 3,797 | 35,489 | 18,810 | ||
| Professional fees | 10,917 | 102,483 | 53,216 | ||
| Printing fees | 1,769 | 20,564 | 9,204 | ||
| Options commission charges | 108,278 | — | — | ||
| Miscellaneous fees | 19,835 | 55,984 | 28,777 | ||
| Total expenses before fee reductions | 632,328 | 3,149,864 | 1,215,590 | ||
| Fees waived/reimbursed by the Adviser | (314,550) | — | — | ||
| Net expenses | 317,778 | 3,149,864 | 1,215,590 | ||
| Net investment income | 225,414 | 5,786,630 | 2,908,763 | ||
| Realized and Unrealized Gain/(Loss): | |||||
| Net realized gains/(losses) from investment transactions and foreign currency translation | (606,166) | 20,757,692 | 4,458,867 | ||
| Net realized gains on options transactions | 2,161,055 | — | — | ||
| Change in unrealized appreciation on investment transactions and foreign currency transactions | 7,067,633 | 88,915,096 | 51,387,146 | ||
| Change in unrealized appreciation on options transactions | 79,098 | — | — | ||
| Net realized and unrealized gains from investment transactions, foreign currency translations and options transactions | 8,701,620 | 109,672,788 | 55,846,013 | ||
| Change in net assets resulting from operations | $ 8,927,034 | $ 115,459,418 | $ 58,754,776 |
| Steward Large Cap Enhanced Index Fund | Steward Select Bond Fund | Steward Small-Mid Cap Enhanced Index Fund | |||
| Investment Income: | |||||
| Dividends (net of foreign witholding tax of $0, $0 and $950, respectively) | $ 6,543,825 | $ 81,638 | $ 2,519,542 | ||
| Interest | 912 | 3,652,335 | 603 | ||
| Total investment income | 6,544,737 | 3,733,973 | 2,520,145 | ||
| Expenses: | |||||
| Investment advisory fees | 910,030 | 522,051 | 499,758 | ||
| Administration fees | 317,456 | 124,298 | 174,336 | ||
| Distribution fees - Class A | 69,436 | 13,934 | 138,680 | ||
| Distribution fees - Class C | — | 7 | — | ||
| Sub-accounting services fees - Class A | 33,078 | 5,339 | 30,137 | ||
| Sub-accounting services fees - Institutional Class | 361,932 | 183,232 | 177,613 | ||
| Fund accounting and sub-administration fees | 231,840 | 90,840 | 121,559 | ||
| Transfer agent fees | 31,875 | 31,875 | 31,875 | ||
| Custodian fees | 63,478 | 23,181 | 48,306 | ||
| Registration fees | 65,931 | 59,433 | 60,698 | ||
| Directors fees | 52,256 | 20,215 | 27,182 | ||
| Professional fees | 139,341 | 58,059 | 78,579 | ||
| Printing fees | 17,954 | 8,787 | 17,965 | ||
| Miscellaneous fees | 76,967 | 40,443 | 40,770 | ||
| Total expenses before fee reductions | 2,371,574 | 1,181,694 | 1,447,458 | ||
| Net investment income | 4,173,163 | 2,552,279 | 1,072,687 | ||
| Realized and Unrealized Gain/(Loss): | |||||
| Net realized gains from investment transactions and foreign currency translation | 54,670,535 | 50,747 | 15,835,699 | ||
| Change in unrealized appreciation/(depreciation) on investment transactions and foreign currency transactions | 104,040,813 | (2,585,111) | 109,285,221 | ||
| Net realized and unrealized gains/(losses) from investment transactions, foreign currency translations and options transactions | 158,711,348 | (2,534,364) | 125,120,920 | ||
| Change in net assets resulting from operations | $ 162,884,511 | $ 17,915 | $ 126,193,607 |
| For the Year Ended April 30, 2021 | For the Year Ended April 30, 2020 | ||
| Change in net assets resulting from operations: | |||
| Net investment income | $ 225,414 | $ 320,358 | |
| Net realized gain from investment transactions, foreign currency transactions and option transactions | 1,554,889 | 1,643,943 | |
| Net change in unrealized appreciation/(depreciation) on investment transactions, foreign currency transactions and option transactions | 7,146,731 | (3,721,825) | |
| Change in net assets resulting from operations | 8,927,034 | (1,757,524) | |
| Distributions to shareholders from: | |||
| Class A | (1,275) | (1,939) | |
| Class C | (26,063) | (19,972) | |
| Class R6 | (2) | — | |
| Institutional Class | (4,420,248) | (2,022,168) | |
| Total distributions to shareholders | (4,447,588) | (2,044,079) | |
| Capital Transactions: | |||
| Class A | |||
| Proceeds from shares issued | 5,206 | 33,908 | |
| Dividends reinvested | 1,275 | 1,939 | |
| Cost of shares redeemed | (5,520) | (56,261) | |
| Change in Class A from capital transactions | 961 | (20,414) | |
| Class C | |||
| Proceeds from shares issued | 15 | 325,900 | |
| Dividends reinvested | 22,553 | 18,253 | |
| Cost of shares redeemed | (170,071) | (84,821) | |
| Change in Class C from capital transactions | (147,503) | 259,332 | |
| Class R6 | |||
| Dividends reinvested | 2 | 1 | |
| Change in Class R6 from capital transactions | 2 | 1 | |
| Institutional Class | |||
| Proceeds from shares issued | 6,798,116 | 5,385,631 | |
| Dividends reinvested | 4,416,213 | 2,020,396 | |
| Cost of shares redeemed | (6,805,114) | (5,108,648) | |
| Change in Institutional Class from capital transactions | 4,409,215 | 2,297,379 | |
| Change in net assets from capital transactions | 4,262,675 | 2,536,298 | |
| Change in net assets | 8,742,121 | (1,265,305) | |
| Net Assets: | |||
| Beginning of year | 27,650,093 | 28,915,398 | |
| End of year | $ 36,392,214 | $ 27,650,093 | |
| Shares Transactions: | |||
| Class A | |||
| Issued | 548 | 3,432 | |
| Reinvested | 143 | 198 | |
| Redeemed | (579) | (5,783) | |
| Change in Class A | 112 | (2,153) | |
| Class C | |||
| Issued | — | 34,200 | |
| Reinvested | 2,507 | 1,849 | |
| Redeemed | (17,415) | (9,448) | |
| Change in Class C | (14,908) | 26,601 | |
| Class R6 | |||
| Reinvested | — | — | |
| Change in Class R6 | — | — | |
| Institutional Class | |||
| Issued | 719,227 | 575,018 | |
| Reinvested | 492,152 | 207,173 | |
| Redeemed | (722,305) | (575,105) | |
| Change in Institutional Class | 489,074 | 207,086 |
| For the Year Ended April 30, 2021 | For the Year Ended April 30, 2020 | ||
| Change in net assets resulting from operations: | |||
| Net investment income | $ 5,786,630 | $ 6,745,226 | |
| Net realized gain from investment transactions and foreign currency transactions | 20,757,692 | 17,550,945 | |
| Net change in unrealized appreciation/(depreciation) on investments and foreign currency transactions | 88,915,096 | (54,202,823) | |
| Change in net assets resulting from operations | 115,459,418 | (29,906,652) | |
| Distributions to shareholders from: | |||
| Class A | (1,301,291) | (4,795,394) | |
| Class C | (93,570) | (186,792) | |
| Class R6 | (7,194) | (91,595) | |
| Institutional Class | (8,635,038) | (20,487,257) | |
| Total distributions to shareholders | (10,037,093) | (25,561,038) | |
| Capital Transactions: | |||
| Class A | |||
| Proceeds from shares issued | 11,753,111 | 16,615,465 | |
| Dividends reinvested | 1,288,584 | 4,754,759 | |
| Cost of shares redeemed | (33,530,552) | (31,449,628) | |
| Change in Class A from capital transactions | (20,488,857) | (10,079,404) | |
| Class C | |||
| Proceeds from shares issued | 1,507,147 | 2,276,695 | |
| Dividends reinvested | 93,528 | 185,723 | |
| Cost of shares redeemed | (1,582,290) | (37,614) | |
| Change in Class C from capital transactions | 18,385 | 2,424,804 | |
| Class R6 | |||
| Proceeds from shares issued | 126,474 | 230,539 | |
| Dividends reinvested | 7,194 | 91,596 | |
| Cost of shares redeemed | (77,180) | (101,765) | |
| Change in Class R6 from capital transactions | 56,488 | 220,370 | |
| Institutional Class | |||
| Proceeds from shares issued | 63,187,035 | 79,424,757 | |
| Dividends reinvested | 8,395,695 | 20,192,212 | |
| Cost of shares redeemed | (81,504,930) | (82,721,805) | |
| Change in Institutional Class from capital transactions | (9,922,200) | 16,895,164 | |
| Change in net assets from capital transactions | (30,336,184) | 9,460,934 | |
| Change in net assets | 75,086,141 | (46,006,756) | |
| Net Assets: | |||
| Beginning of year | 269,752,505 | 315,759,261 | |
| End of year | $ 344,838,646 | $ 269,752,505 | |
| Shares Transactions: | |||
| Class A | |||
| Issued | 371,788 | 558,561 | |
| Reinvested | 40,353 | 150,184 | |
| Redeemed | (1,127,822) | (1,033,659) | |
| Change in Class A | (715,681) | (324,914) | |
| Class C(a) | |||
| Issued | 52,576 | 75,582 | |
| Reinvested | 2,808 | 5,293 | |
| Redeemed | (42,617) | (1,438) | |
| Change in Class C | 12,767 | 79,437 | |
| Class R6(a) | |||
| Issued | 4,105 | 5,084 | |
| Reinvested | 231 | 3,026 | |
| Redeemed | (2,393) | (3,408) | |
| Change in Class R6 | 1,943 | 4,702 | |
| Institutional Class | |||
| Issued | 1,999,743 | 2,603,869 | |
| Reinvested | 256,955 | 637,836 | |
| Redeemed | (2,539,631) | (2,854,580) | |
| Change in Institutional Class | (282,933) | 387,125 |
| (a) | Effective March 9, 2020, the share class had a one-for-ten reverse stock split. Share amounts for the periods have been adjusted to give effect to the one-for-ten stock split. |
| For the Year Ended April 30, 2021 | For the Year Ended April 30, 2020 | ||
| Change in net assets resulting from operations: | |||
| Net investment income | $ 2,908,763 | $ 3,557,658 | |
| Net realized gain from investment transactions and foreign currency transactions | 4,458,867 | 1,404,630 | |
| Net change in unrealized appreciation/(depreciation) on investments and foreign currency transactions | 51,387,146 | (30,912,113) | |
| Change in net assets resulting from operations | 58,754,776 | (25,949,825) | |
| Distributions to shareholders from: | |||
| Class A | (393,830) | (734,117) | |
| Class C | — | (1) | |
| Class R6 | (29,454) | (13,125) | |
| Institutional Class | (5,976,777) | (2,929,713) | |
| Total distributions to shareholders | (6,400,061) | (3,676,956) | |
| Capital Transactions: | |||
| Class A | |||
| Proceeds from shares issued | 947,159 | 11,574,206 | |
| Dividends reinvested | 383,904 | 707,467 | |
| Cost of shares redeemed | (24,915,204) | (7,815,192) | |
| Change in Class A from capital transactions | (23,584,141) | 4,466,481 | |
| Class C | |||
| Dividends reinvested | — | 1 | |
| Change in Class C from capital transactions | — | 1 | |
| Class R6 | |||
| Proceeds from shares issued | 231,745 | 760,083 | |
| Dividends reinvested | 29,454 | 13,125 | |
| Cost of shares redeemed | (295,121) | (208,727) | |
| Change in Class R6 from capital transactions | (33,922) | 564,481 | |
| Institutional Class | |||
| Proceeds from shares issued | 44,363,825 | 19,490,166 | |
| Dividends reinvested | 5,907,762 | 2,817,398 | |
| Cost of shares redeemed | (25,348,828) | (17,205,803) | |
| Change in Institutional Class from capital transactions | 24,922,759 | 5,101,761 | |
| Change in net assets from capital transactions | 1,304,696 | 10,132,724 | |
| Change in net assets | 53,659,411 | (19,494,057) | |
| Net Assets: | |||
| Beginning of year | 126,933,706 | 146,427,763 | |
| End of year | $ 180,593,117 | $ 126,933,706 | |
| Shares Transactions: | |||
| Class A | |||
| Issued | 44,854 | 584,792 | |
| Reinvested | 17,981 | 34,399 | |
| Redeemed | (1,304,325) | (377,922) | |
| Change in Class A | (1,241,490) | 241,269 | |
| Class C(a) | |||
| Reinvested | — | — | |
| Change in Class C | — | — | |
| Class R6(a) | |||
| Issued | 12,422 | 42,055 | |
| Reinvested | 1,583 | 740 | |
| Redeemed | (15,399) | (11,026) | |
| Change in Class R6 | (1,394) | 31,769 | |
| Institutional Class | |||
| Issued | 2,205,226 | 987,104 | |
| Reinvested | 266,480 | 137,147 | |
| Redeemed | (1,161,675) | (833,061) | |
| Change in Institutional Class | 1,310,031 | 291,190 |
| (a) | Effective March 9, 2020, the share class had a one-for-two reverse stock split. Share amounts for the periods have been adjusted to give effect to the one-for-two stock split. |
| For the Year Ended April 30, 2021 | For the Year Ended April 30, 2020 | ||
| Change in net assets resulting from operations: | |||
| Net investment income | $ 4,173,163 | $ 6,295,788 | |
| Net realized gain from investment transactions and foreign currency transactions | 54,670,535 | 33,725,621 | |
| Net change in unrealized appreciation/(depreciation) on investments and foreign currency transactions | 104,040,813 | (67,409,526) | |
| Change in net assets resulting from operations | 162,884,511 | (27,388,117) | |
| Distributions to shareholders from: | |||
| Class A | (2,136,505) | (1,052,587) | |
| Class C | (1) | (1) | |
| Class R6 | (5,862,155) | (5,899,887) | |
| Institutional Class | (29,587,525) | (8,704,134) | |
| Total distributions to shareholders | (37,586,186) | (15,656,609) | |
| Capital Transactions: | |||
| Class A | |||
| Proceeds from shares issued | 5,643,539 | 12,510,600 | |
| Dividends reinvested | 2,094,344 | 1,028,668 | |
| Cost of shares redeemed | (26,456,395) | (12,300,328) | |
| Change in Class A from capital transactions | (18,718,512) | 1,238,940 | |
| Class C | |||
| Dividends reinvested | 1 | 1 | |
| Change in Class C from capital transactions | 1 | 1 | |
| Class R6 | |||
| Proceeds from shares issued | 8,384,888 | 6,898,246 | |
| Dividends reinvested | 5,862,155 | 5,899,887 | |
| Cost of shares redeemed | (76,721,797) | (9,642,114) | |
| Change in Class R6 from capital transactions | (62,474,754) | 3,156,019 | |
| Institutional Class | |||
| Proceeds from shares issued | 70,180,378 | 98,165,158 | |
| Dividends reinvested | 29,296,352 | 8,542,479 | |
| Cost of shares redeemed | (141,221,982) | (98,173,843) | |
| Change in Institutional Class from capital transactions | (41,745,252) | 8,533,794 | |
| Change in net assets from capital transactions | (122,938,517) | 12,928,754 | |
| Change in net assets | 2,359,808 | (30,115,972) | |
| Net Assets: | |||
| Beginning of year | 395,611,730 | 425,727,702 | |
| End of year | $ 397,971,538 | $ 395,611,730 | |
| Shares Transactions: | |||
| Class A | |||
| Issued | 123,119 | 302,130 | |
| Reinvested | 44,716 | 23,828 | |
| Redeemed | (621,155) | (287,882) | |
| Change in Class A | (453,320) | 38,076 | |
| Class C(a) | |||
| Reinvested | — | — | |
| Change in Class C | — | — | |
| Class R6(a) | |||
| Issued | 203,202 | 177,444 | |
| Reinvested | 138,240 | 142,182 | |
| Redeemed | (1,716,031) | (243,028) | |
| Change in Class R6 | (1,374,589) | 76,598 | |
| Institutional Class | |||
| Issued | 1,563,002 | 2,354,753 | |
| Reinvested | 626,366 | 200,128 | |
| Redeemed | (3,049,002) | (2,341,086) | |
| Change in Institutional Class | (859,634) | 213,795 |
| (a) | Effective March 9, 2020, the share class had a one-for-five reverse stock split. Share amounts for the periods have been adjusted to give effect to the one-for-five stock split. |
| For the Year Ended April 30, 2021 | For the Year Ended April 30, 2020 | ||
| Change in net assets resulting from operations: | |||
| Net investment income | $ 2,552,279 | $ 3,546,998 | |
| Net realized gain/(loss) from investment transactions and foreign currency transactions | 50,747 | (58,674) | |
| Net change in unrealized appreciation/(depreciation) on investments and foreign currency transactions | (2,585,111) | 6,507,196 | |
| Change in net assets resulting from operations | 17,915 | 9,995,520 | |
| Distributions to shareholders from: | |||
| Class A | (72,836) | (190,989) | |
| Class C | (9) | — | |
| Class R6 | — | (1) | |
| Institutional Class | (2,792,973) | (3,359,056) | |
| Total distributions to shareholders | (2,865,818) | (3,550,046) | |
| Capital Transactions: | |||
| Class A | |||
| Proceeds from shares issued | 3,625,108 | 1,113,569 | |
| Dividends reinvested | 72,681 | 189,375 | |
| Cost of shares redeemed | (6,848,510) | (2,560,718) | |
| Change in Class A from capital transactions | (3,150,721) | (1,257,774) | |
| Class C | |||
| Proceeds from shares issued | 4,503 | — | |
| Dividends reinvested | 9 | — | |
| Change in Class C from capital transactions | 4,512 | — | |
| Class R6 | |||
| Dividends reinvested | — | 1 | |
| Change in Class R6 from capital transactions | — | 1 | |
| Institutional Class | |||
| Proceeds from shares issued | 64,285,949 | 22,675,458 | |
| Dividends reinvested | 2,791,483 | 3,359,056 | |
| Cost of shares redeemed | (25,465,310) | (42,038,444) | |
| Change in Institutional Class from capital transactions | 41,612,122 | (16,003,930) | |
| Change in net assets from capital transactions | 38,465,913 | (17,261,703) | |
| Change in net assets | 35,618,010 | (10,816,229) | |
| Net Assets: | |||
| Beginning of year | 151,654,670 | 162,470,899 | |
| End of year | $ 187,272,680 | $ 151,654,670 | |
| Shares Transactions: | |||
| Class A | |||
| Issued | 141,925 | 44,481 | |
| Reinvested | 2,856 | 7,664 | |
| Redeemed | (269,448) | (103,579) | |
| Change in Class A | (124,667) | (51,434) | |
| Class C(a) | |||
| Issued | 154 | — | |
| Reinvested | — | — | |
| Change in Class C | 154 | — | |
| Class R6(a) | |||
| Reinvested | — | — | |
| Change in Class R6 | — | — | |
| Institutional Class | |||
| Issued | 2,538,759 | 914,921 | |
| Reinvested | 110,211 | 136,646 | |
| Redeemed | (1,003,236) | (1,699,013) | |
| Change in Institutional Class | 1,645,734 | (647,446) |
| (a) | Effective March 9, 2020, the share class had a one-for-three reverse stock split. Share amounts for the periods have been adjusted to give effect to the one-for-three stock split. |
| For the Year Ended April 30, 2021 | For the Year Ended April 30, 2020 | ||
| Change in net assets resulting from operations: | |||
| Net investment income | $ 1,072,687 | $ 1,643,705 | |
| Net realized gain from investment transactions and foreign currency transactions | 15,835,699 | 7,987,142 | |
| Net change in unrealized appreciation/(depreciation) on investments and foreign currency transactions | 109,285,221 | (52,917,504) | |
| Change in net assets resulting from operations | 126,193,607 | (43,286,657) | |
| Distributions to shareholders from: | |||
| Class A | (2,097,853) | (2,608,082) | |
| Class C | — | (1) | |
| Class R6 | (4,590) | (6,229) | |
| Institutional Class | (7,168,235) | (6,470,384) | |
| Total distributions to shareholders | (9,270,678) | (9,084,696) | |
| Capital Transactions: | |||
| Class A | |||
| Proceeds from shares issued | 8,766,909 | 9,903,543 | |
| Dividends reinvested | 1,998,977 | 2,495,589 | |
| Cost of shares redeemed | (24,204,534) | (17,452,015) | |
| Change in Class A from capital transactions | (13,438,648) | (5,052,883) | |
| Class C | |||
| Dividends reinvested | — | 1 | |
| Change in Class C from capital transactions | — | 1 | |
| Class R6 | |||
| Proceeds from shares issued | 73,687 | 95,565 | |
| Dividends reinvested | 4,590 | 6,229 | |
| Cost of shares redeemed | (36,939) | (46,608) | |
| Change in Class R6 from capital transactions | 41,338 | 55,186 | |
| Institutional Class | |||
| Proceeds from shares issued | 34,424,594 | 49,668,229 | |
| Dividends reinvested | 6,433,567 | 6,217,171 | |
| Cost of shares redeemed | (62,241,118) | (32,329,095) | |
| Change in Institutional Class from capital transactions | (21,382,957) | 23,556,305 | |
| Change in net assets from capital transactions | (34,780,267) | 18,558,609 | |
| Change in net assets | 82,142,662 | (33,812,744) | |
| Net Assets: | |||
| Beginning of year | 191,484,607 | 225,297,351 | |
| End of year | $ 273,627,269 | $ 191,484,607 | |
| Shares Transactions: | |||
| Class A | |||
| Issued | 644,627 | 816,205 | |
| Reinvested | 137,561 | 187,150 | |
| Redeemed | (1,878,446) | (1,343,613) | |
| Change in Class A | (1,096,258) | (340,258) | |
| Class C(a) | |||
| Reinvested | — | — | |
| Change in Class C | — | — | |
| Class R6(a) | |||
| Issued | 5,251 | 7,611 | |
| Reinvested | 337 | 484 | |
| Redeemed | (2,593) | (3,619) | |
| Change in Class R6 | 2,995 | 4,476 | |
| Institutional Class | |||
| Issued | 2,494,426 | 4,394,565 | |
| Reinvested | 434,814 | 459,117 | |
| Redeemed | (4,367,860) | (2,570,495) | |
| Change in Institutional Class | (1,438,620) | 2,283,187 |
| (a) | Effective March 9, 2020, the share class had a one-for-two reverse stock split. Share amounts for the periods have been adjusted to give effect to the one-for-two stock split. |
| Investment Operations: | ||||
| Net Asset Value, Beginning of Period | Net Investment Income/(Loss) | Net Realized and Unrealized Gain/(Loss) from Investments | Total from Investment Operations | |
| Steward Covered Call Income Fund | ||||
| Class A | ||||
| Year ended April 30, 2021 | $ 8.64 | $ 0.05(d) | $ 2.59 | $ 2.64 |
| Year ended April 30, 2020 | 9.77 | 0.08 (d) | (0.54) | (0.46) |
| Year ended April 30, 2019 | 9.92 | 0.04 | 0.71 | 0.75 |
| Period ended April 30, 2018(f) | 10.00 | 0.03 | (0.09) | (0.06) |
| Class C | ||||
| Year ended April 30, 2021 | $ 8.70 | $(0.02) (d)(g) | $ 2.60 | $ 2.58 |
| Year ended April 30, 2020 | 9.84 | — (d) | (0.53) | (0.53) |
| Year ended April 30, 2019 | 9.95 | 0.01 | 0.71 | 0.72 |
| Period ended April 30, 2018(f) | 10.00 | — (h) | (0.05) | (0.05) |
| Class R6 | ||||
| Year ended April 30, 2021 | $ 8.64 | $ —(d) | $ 2.65 | $ 2.65 |
| Year ended April 30, 2020 | 9.80 | — (d)(h) | (0.49) | (0.49) |
| Year ended April 30, 2019 | 9.92 | — (h) | 0.69 | 0.69 |
| Period ended April 30, 2018(f) | 10.00 | — (h) | (0.05) | (0.05) |
| Institutional Class | ||||
| Year ended April 30, 2021 | $ 8.65 | $ 0.07(d) | $ 2.61 | $ 2.68 |
| Year ended April 30, 2020 | 9.75 | 0.10 (d) | (0.53) | (0.43) |
| Year ended April 30, 2019 | 9.92 | 0.11 | 0.65 | 0.76 |
| Period ended April 30, 2018(f) | 10.00 | 0.03 | (0.08) | (0.05) |
| Steward Global Equity Income Fund | ||||
| Class A | ||||
| Year ended April 30, 2021 | $ 26.39 | $ 0.53(d) | $ 11.40 | $ 11.93 |
| Year ended April 30, 2020 | 31.36 | 0.59 (d) | (3.16) | (2.57) |
| Year ended April 30, 2019 | 33.06 | 0.70 (d) | 0.43 | 1.13 |
| Year ended April 30, 2018 | 31.00 | 0.60 | 3.87 | 4.47 |
| Year ended April 30, 2017 | 28.72 | 0.51 | 3.72 | 4.23 |
| Class C | ||||
| Year ended April 30, 2021 | $ 27.65 | $ 0.32(d) | $ 11.92 | $ 12.24 |
| Year ended April 30, 2020(i) | 53.40 | 0.31 (d) | (23.63) | (23.32) |
| Year ended April 30, 2019(i) | 80.20 | 0.70 (d) | (0.90) (g) | (0.20) |
| Period ended April 30, 2018(f)(i) | 100.00 | — (h) | 0.70 | 0.70 |
| Class R6 | ||||
| Year ended April 30, 2021 | $ 25.00 | $ 0.62(d) | $ 10.79 | $ 11.41 |
| Year ended April 30, 2020(i) | 50.50 | 0.59 (d) | (23.57) | (22.98) |
| Year ended April 30, 2019(i) | 79.90 | 2.10 (d) | (2.10) (g) | — |
| Period ended April 30, 2018(f)(i) | 100.00 | — (h) | 0.80 | 0.80 |
| Institutional Class | ||||
| Year ended April 30, 2021 | $ 26.48 | $ 0.62(d) | $ 11.45 | $ 12.07 |
| Year ended April 30, 2020 | 31.45 | 0.68 (d) | (3.16) | (2.48) |
| Year ended April 30, 2019 | 33.15 | 0.79 (d) | 0.44 | 1.23 |
| Year ended April 30, 2018 | 31.06 | 0.71 | 3.88 | 4.59 |
| Year ended April 30, 2017 | 28.77 | 0.63 | 3.70 | 4.33 |
| (a) | Not annualized for periods less than one year. |
| (b) | Annualized for periods less than one year. |
| (c) | Portfolio turnover is calculated on the basis of the Fund, as a whole, without distinguishing between the classes of shares issued. |
| (d) | Calculated based on average shares outstanding. |
| (e) | During the year, additional fees were voluntary waived or reimbursed. Had these fees not been waived or reimbursed, the net expense ratio for each class would have been 0.34% higher. |
| (f) | For the period December 14, 2017 (commencement of operations) through April 30, 2018. |
| (g) | Realized and unrealized gains and losses per share in this caption are balancing amounts necessary to reconcile the change in net asset value per share for the period, and may not reconcile with the aggregate gains and losses in the Statement of Operations due to share transactions for the period. |
| (h) | Expressed as ‘‘—’’ as the income and/or expenses accrued for the class were considered immaterial for presentation purposes relative to the size of the class. |
| (i) | Effective March 9, 2020, the share class had a one-for-ten reverse stock split. Share amounts for the periods have been adjusted to give effect to the one-for-ten stock split. |
| Distributions: | Supplemental data and ratios: | ||||||||
| Net Investment Income | Capital Gains | Total Distributions | Net Asset Value, End of Period | Total Return(a) | Net Assets, End of Period (000's) | Ratio of Expenses to Average Net Assets Prior to Waivers(b) | Ratio of Expenses to Average Net Assets Net of Waivers(b) | Ratio of Net Investment Income/(Loss) to Average Net Assets(b) | Portfolio Turnover Rate(a)(c) |
| $(0.07) | $ (1.33) | $ (1.40) | $ 9.88 | 32.27% | $ 11 | 2.42% | 1.25 (e)% | 0.51% | 156% |
| (0.10) | (0.57) | (0.67) | 8.64 | (5.45) | 9 | 1.65 | 1.25 | 0.85 | 135 |
| (0.09) | (0.81) | (0.90) | 9.77 | 8.91 | 31 | 1.44 | 1.25 | 0.79 | 117 |
| (0.02) | — | (0.02) | 9.92 | (0.56) | 3 | 1.42 | 1.25 | 0.81 | 29 |
| $(0.04) | $ (1.33) | $ (1.37) | $ 9.91 | 31.33% | $ 195 | 2.96% | 2.00 (e)% | (0.18)% | 156% |
| (0.04) | (0.57) | (0.61) | 8.70 | (6.10) | 301 | 2.48 | 2.00 | 0.02 | 135 |
| (0.02) | (0.81) | (0.83) | 9.84 | 8.52 | 79 | 2.23 | 2.00 | 0.05 | 117 |
| — | — | — | 9.95 | (0.50) | — | — (h) | — (h) | — (h) | 29 |
| $(0.07) | $ (1.33) | $ (1.40) | $ 9.89 | 32.48% | $ — | — (h)% | — (h)% | — (h)% | 156% |
| (0.10) | (0.57) | (0.67) | 8.64 | (5.81) | — | — (h) | — (h) | — (h) | 135 |
| — | (0.81) | (0.81) | 9.80 | 8.27 | — | — (h) | — (h) | — (h) | 117 |
| (0.03) | — | (0.03) | 9.92 | (0.55) | — | — (h) | — (h) | — (h) | 29 |
| $(0.08) | $ (1.33) | $ (1.41) | $ 9.92 | 32.73% | $ 36,186 | 2.00% | 1.00 (e)% | 0.75% | 156% |
| (0.10) | (0.57) | (0.67) | 8.65 | (5.15) | 27,340 | 1.32 | 1.00 | 1.08 | 135 |
| (0.12) | (0.81) | (0.93) | 9.75 | 9.06 | 28,806 | 1.14 | 1.00 | 1.10 | 117 |
| (0.03) | — | (0.03) | 9.92 | (0.54) | 25,417 | 1.16 | 1.00 | 0.84 | 29 |
| $(0.48) | $ (0.45) | $ (0.93) | $37.39 | 45.81% | $ 47,363 | 1.26% | 1.26% | 1.71% | 67% |
| (0.58) | (1.82) | (2.40) | 26.39 | (9.41) | 52,326 | 1.21 | 1.21 | 1.91 | 48 |
| (0.67) | (2.16) | (2.83) | 31.36 | 4.61 | 72,351 | 0.97 | 0.97 | 2.18 | 28 |
| (0.59) | (1.82) | (2.41) | 33.06 | 14.58 | 67,213 | 0.99 | 0.99 | 1.80 | 59 |
| (0.56) | (1.39) | (1.95) | 31.00 | 15.22 | 60,865 | 0.99 | 0.99 | 1.78 | 48 |
| $(0.27) | $ (0.45) | $ (0.72) | $39.17 | 44.75% | $ 3,885 | 1.98% | 1.98% | 0.95% | 67% |
| (0.61) | (1.82) | (2.43) | 27.65 | (10.12) | 2,389 | 2.08 | 2.08 | 0.95 | 48 |
| (5.00) | (21.60) | (26.60) | 53.40 | 4.52 | 372 | 1.64 | 1.64 | 1.24 | 28 |
| (2.30) | (18.20) | (20.50) | 80.20 | 0.83 | — | — (h) | — (h) | — (h) | 59 |
| $(0.66) | $ (0.45) | $ (1.11) | $35.30 | 46.35% | $ 239 | 0.87% | 0.87% | 2.03% | 67% |
| (0.70) | (1.82) | (2.52) | 25.00 | (9.09) | 121 | 0.90 | 0.90 | 1.72 | 48 |
| (7.80) | (21.60) | (29.40) | 50.50 | 5.04 | 6 | 0.61 | 0.61 | 2.75 | 28 |
| (2.70) | (18.20) | (20.90) | 79.90 | 0.86 | — | — (h) | — (h) | — (h) | 59 |
| $(0.64) | $ (0.45) | $ (1.09) | $37.46 | 46.24% | $293,352 | 0.98% | 0.98% | 1.95% | 67% |
| (0.67) | (1.82) | (2.49) | 26.48 | (9.09) | 214,917 | 0.88 | 0.88 | 2.22 | 48 |
| (0.77) | (2.16) | (2.93) | 31.45 | 4.90 | 243,030 | 0.67 | 0.67 | 2.47 | 28 |
| (0.68) | (1.82) | (2.50) | 33.15 | 14.96 | 220,152 | 0.68 | 0.68 | 2.12 | 59 |
| (0.65) | (1.39) | (2.04) | 31.06 | 15.58 | 181,716 | 0.66 | 0.66 | 2.11 | 48 |
| Investment Operations: | ||||
| Net Asset Value, Beginning of Period | Net Investment Income/(Loss) | Net Realized and Unrealized Gain/(Loss) from Investments | Total from Investment Operations | |
| Steward International Enhanced Index Fund | ||||
| Class A | ||||
| Year ended April 30, 2021 | $17.59 | $0.37 (d) | $ 7.65 | $ 8.02 |
| Year ended April 30, 2020 | 22.01 | 0.46 (d) | (4.40) | (3.94) |
| Year ended April 30, 2019 | 23.01 | 0.53 | (1.01) | (0.48) |
| Year ended April 30, 2018 | 20.45 | 0.43 | 2.59 | 3.02 |
| Year ended April 30, 2017 | 18.65 | 0.36 | 1.81 | 2.17 |
| Class C | ||||
| Year ended April 30, 2021 | $14.90 | $ —(d) | $ 6.48 | $ 6.48 |
| Year ended April 30, 2020(f) | 19.46 | — (d)(e) | (4.12) | (4.12) |
| Year ended April 30, 2019(f) | 20.16 | — (e) | (0.70) | (0.70) |
| Period ended April 30, 2018(f)(g) | 20.00 | — (e) | 0.46 | 0.46 |
| Class R6 | ||||
| Year ended April 30, 2021 | $14.95 | $0.36 (d) | $ 6.50 | $ 6.86 |
| Year ended April 30, 2020(f) | 19.42 | 0.37 (d) | (4.28) | (3.91) |
| Year ended April 30, 2019(f) | 20.10 | — (e) | (0.68) | (0.68) |
| Period ended April 30, 2018(f)(g) | 20.00 | — (e) | 0.46 | 0.46 |
| Institutional Class | ||||
| Year ended April 30, 2021 | $17.66 | $0.40 (d) | $ 7.70 | $ 8.10 |
| Year ended April 30, 2020 | 22.08 | 0.53 (d) | (4.40) | (3.87) |
| Year ended April 30, 2019 | 23.09 | 0.59 | (1.01) | (0.42) |
| Year ended April 30, 2018 | 20.51 | 0.51 | 2.59 | 3.10 |
| Year ended April 30, 2017 | 18.70 | 0.43 | 1.81 | 2.24 |
| Steward Large Cap Enhanced Index Fund | ||||
| Class A | ||||
| Year ended April 30, 2021 | $39.31 | $0.35 (d) | $17.55 | $17.90 |
| Year ended April 30, 2020 | 43.28 | 0.51 (d) | (3.41) | (2.90) |
| Year ended April 30, 2019 | 41.50 | 0.47 | 3.24 | 3.71 |
| Year ended April 30, 2018 | 36.89 | 0.41 | 4.60 | 5.01 |
| Year ended April 30, 2017 | 32.25 | 0.39 | 4.63 | 5.02 |
| Class C | ||||
| Year ended April 30, 2021 | $35.97 | $ —(d)(e) | $15.64 | $15.64 |
| Year ended April 30, 2020(h) | 43.70 | — (d)(e) | (6.69) (i) | (6.69) |
| Year ended April 30, 2019(h) | 48.95 | — (e) | 2.30 | 2.30 |
| Period ended April 30, 2018(g)(h) | 50.00 | — (e) | (0.10) | (0.10) |
| Class R6 | ||||
| Year ended April 30, 2021 | $35.83 | $0.51 (d) | $15.92 | $16.43 |
| Year ended April 30, 2020(h) | 42.75 | 0.66 (d) | (6.40) | (5.74) |
| Year ended April 30, 2019(h) | 48.80 | 0.20 | 2.30 | 2.50 |
| Period ended April 30, 2018(g)(h) | 50.00 | — (e) | 0.05 | 0.05 |
| Institutional Class | ||||
| Year ended April 30, 2021 | $39.23 | $0.45 (d) | $17.54 | $17.99 |
| Year ended April 30, 2020 | 43.16 | 0.65 (d) | (3.42) | (2.77) |
| Year ended April 30, 2019 | 41.34 | 0.60 | 3.23 | 3.83 |
| Year ended April 30, 2018 | 36.72 | 0.53 | 4.57 | 5.10 |
| Year ended April 30, 2017 | 32.07 | 0.48 | 4.63 | 5.11 |
| (a) | Not annualized for periods less than one year. |
| (b) | Annualized for periods less than one year. |
| (c) | Portfolio turnover is calculated on the basis of the Fund, as a whole, without distinguishing between the classes of shares issued. |
| (d) | Calculated based on average shares outstanding. |
| (e) | Expressed as ‘‘—’’ as the income and/or expenses accrued for the class were considered immaterial for presentation purposes relative to the size of the class. |
| (f) | Effective March 9, 2020, the share class had a one-for-two reverse stock split. Share amounts for the periods have been adjusted to give effect to the one-for-two stock split. |
| (g) | For the period December 14, 2017 (commencement of operations) through April 30, 2018. |
| (h) | Effective March 9, 2020, the share class had a one-for-five reverse stock split. Share amounts for the periods have been adjusted to give effect to the one-for-five stock split. |
| (i) | Realized and unrealized gains and losses per share in this caption are balancing amounts necessary to reconcile the change in net asset value per share for the period, and may not reconcile with the aggregate gains and losses in the Statement of Operations due to share transactions for the period. |
| Distributions: | Supplemental data and ratios: | ||||||||
| Net Investment Income | Capital Gains | Total Distributions | Net Asset Value, End of Period | Total Return(a) | Net Assets, End of Period (000's) | Ratio of Expenses to Average Net Assets(b) | Ratio of Net Investment Income/(Loss) to Average Net Assets(b) | Portfolio Turnover Rate(a)(c) | |
| $(0.25) | $(0.51) | $(0.76) | $24.85 | 46.20% | $ 8,721 | 1.00% | 1.81% | 14% | |
| (0.48) | — | (0.48) | 17.59 | (18.18) | 28,007 | 1.06 | 2.20 | 15 | |
| (0.52) | — | (0.52) | 22.01 | (1.99) | 29,734 | 1.01 | 2.43 | 10 | |
| (0.46) | — | (0.46) | 23.01 | 14.92 | 27,085 | 1.02 | 1.88 | 10 | |
| (0.37) | — | (0.37) | 20.45 | 11.85 | 17,922 | 1.01 | 1.88 | 16 | |
| $(0.22) | $(0.51) | $(0.73) | $20.65 | 44.09% | $ — | — (e)% | — (e)% | 14% | |
| (0.44) | — | (0.44) | 14.90 | (19.85) | — | — (e) | — (e) | 15 | |
| — | — | — | 19.46 | (3.47) | — | — (e) | — (e) | 10 | |
| (0.30) | — | (0.30) | 20.16 | 2.32 | — | — (e) | — (e) | 10 | |
| $(0.39) | $(0.51) | $(0.90) | $20.91 | 46.71% | $ 635 | 0.64% | 1.98% | 14% | |
| (0.56) | — | (0.56) | 14.95 | (18.52) | 475 | 0.68 | 2.14 | 15 | |
| — | — | — | 19.42 | (3.38) | — | — (e) | — (e) | 10 | |
| (0.36) | — | (0.36) | 20.10 | 2.32 | — | — (e) | — (e) | 10 | |
| $(0.38) | $(0.51) | $(0.89) | $24.87 | 46.56% | $171,237 | 0.76% | 1.86% | 14% | |
| (0.55) | — | (0.55) | 17.66 | (17.87) | 98,451 | 0.72 | 2.55 | 15 | |
| (0.59) | — | (0.59) | 22.08 | (1.74) | 116,694 | 0.71 | 2.73 | 10 | |
| (0.52) | — | (0.52) | 23.09 | 15.29 | 112,524 | 0.71 | 2.28 | 10 | |
| (0.43) | — | (0.43) | 20.51 | 12.24 | 114,580 | 0.67 | 2.22 | 16 | |
| $(0.35) | $(3.74) | $(4.09) | $53.12 | 47.01% | $ 28,751 | 0.82% | 0.75% | 32% | |
| (0.40) | (0.67) | (1.07) | 39.31 | (6.91) | 39,094 | 0.84 | 1.18 | 32 | |
| (0.42) | (1.51) | (1.93) | 43.28 | 9.78 | 41,401 | 0.80 | 1.09 | 27 | |
| (0.40) | — | (0.40) | 41.50 | 13.61 | 47,998 | 0.84 | 1.02 | 23 | |
| (0.38) | — | (0.38) | 36.89 | 15.63 | 47,052 | 0.82 | 1.10 | 25 | |
| $(0.24) | $(3.74) | $(3.98) | $47.63 | 44.88% | $ — | — (e)% | — (e)% | 32% | |
| (0.37) | (0.67) | (1.04) | 35.97 | (9.02) | — | — (e) | — (e) | 32 | |
| — | (7.55) | (7.55) | 43.70 | 8.13 | — | — (e) | — (e) | 27 | |
| (0.95) | — | (0.95) | 48.95 | (0.27) | — | — (e) | — (e) | 23 | |
| $(0.55) | $(3.74) | $(4.29) | $47.97 | 47.55% | $ 520 | 0.45% | 1.23% | 32% | |
| (0.51) | (0.67) | (1.18) | 35.83 | (6.63) | 49,643 | 0.46 | 1.60 | 32 | |
| (1.00) | (7.55) | (8.55) | 42.75 | 8.70 | 55,924 | 0.46 | 1.20 | 27 | |
| (1.25) | — | (1.25) | 48.80 | 0.02 | — | — (e) | — (e) | 23 | |
| $(0.53) | $(3.74) | $(4.27) | $52.95 | 47.40% | $368,701 | 0.55% | 0.97% | 32% | |
| (0.49) | (0.67) | (1.16) | 39.23 | (6.61) | 306,875 | 0.52 | 1.51 | 32 | |
| (0.50) | (1.51) | (2.01) | 43.16 | 10.13 | 328,404 | 0.50 | 1.39 | 27 | |
| (0.48) | — | (0.48) | 41.34 | 13.93 | 345,522 | 0.54 | 1.32 | 23 | |
| (0.46) | — | (0.46) | 36.72 | 16.02 | 319,230 | 0.50 | 1.40 | 25 | |
| Investment Operations: | ||||
| Net Asset Value, Beginning of Period | Net Investment Income/(Loss) | Net Realized and Unrealized Gain/(Loss) from Investments | Total from Investment Operations | |
| Steward Select Bond Fund | ||||
| Class A | ||||
| Year ended April 30, 2021 | $25.38 | $0.34 (d) | $(0.33) | $ 0.01 |
| Year ended April 30, 2020 | 24.36 | 0.47 (d) | 1.03 | 1.50 |
| Year ended April 30, 2019 | 23.96 | 0.49 | 0.39 | 0.88 |
| Year ended April 30, 2018 | 24.58 | 0.40 | (0.60) | (0.20) |
| Year ended April 30, 2017 | 24.99 | 0.43 | (0.40) | 0.03 |
| Class C | ||||
| Year ended April 30, 2021 | $28.84 | $0.24 (d) | $(0.50) | $(0.26) |
| Year ended April 30, 2020(e) | 29.13 | — (d)(f) | 0.12 | 0.12 |
| Year ended April 30, 2019(e) | 28.71 | — (f) | 0.42 | 0.42 |
| Period ended April 30, 2018(e)(g) | 30.00 | — (f) | (0.66) | (0.66) |
| Class R6 | ||||
| Year ended April 30, 2021 | $28.72 | $ —(d)(f) | $(0.29) | $(0.29) |
| Year ended April 30, 2020(e) | 28.98 | — (d)(f) | 0.31 | 0.31 |
| Year ended April 30, 2019(e) | 28.56 | — (f) | 0.42 | 0.42 |
| Period ended April 30, 2018(e)(g) | 30.00 | — (f) | (0.69) | (0.69) |
| Institutional Class | ||||
| Year ended April 30, 2021 | $25.28 | $0.39 (d) | $(0.32) | $ 0.07 |
| Year ended April 30, 2020 | 24.25 | 0.55 (d) | 1.03 | 1.58 |
| Year ended April 30, 2019 | 23.85 | 0.55 | 0.40 | 0.95 |
| Year ended April 30, 2018 | 24.47 | 0.48 | (0.61) | (0.13) |
| Year ended April 30, 2017 | 24.87 | 0.51 | (0.39) | 0.12 |
| Steward Small-Mid Cap Enhanced Index Fund | ||||
| Class A | ||||
| Year ended April 30, 2021 | $10.54 | $0.04 (d) | $ 7.49 | $ 7.53 |
| Year ended April 30, 2020 | 13.94 | 0.07 (d) | (2.91) | (2.84) |
| Year ended April 30, 2019 | 15.70 | 0.09 | 0.03 (h) | 0.12 |
| Year ended April 30, 2018 | 15.44 | 0.11 | 1.37 | 1.48 |
| Year ended April 30, 2017 | 13.26 | 0.06 | 2.64 | 2.70 |
| Class C | ||||
| Year ended April 30, 2021 | $ 9.84 | $ —(d) | $ 6.81 | $ 6.81 |
| Year ended April 30, 2020(i) | 13.64 | — (d)(f) | (3.27) | (3.27) |
| Year ended April 30, 2019(i) | 17.52 | — (f) | (0.32) | (0.32) |
| Period ended April 30, 2018(g)(i) | 20.00 | — (f) | (0.08) | (0.08) |
| Class R6 | ||||
| Year ended April 30, 2021 | $ 9.87 | $0.08 (d) | $ 7.01 | $ 7.09 |
| Year ended April 30, 2020(i) | 13.56 | 0.14 (d) | (3.24) | (3.10) |
| Year ended April 30, 2019(i) | 17.48 | — (f) | (0.36) | (0.36) |
| Period ended April 30, 2018(g)(i) | 20.00 | — (f) | (0.08) | (0.08) |
| Institutional Class | ||||
| Year ended April 30, 2021 | $10.74 | $0.07 (d) | $ 7.65 | $ 7.72 |
| Year ended April 30, 2020 | 14.19 | 0.11 (d) | (2.98) | (2.87) |
| Year ended April 30, 2019 | 15.93 | 0.13 | 0.04 (h) | 0.17 |
| Year ended April 30, 2018 | 15.65 | 0.15 | 1.39 | 1.54 |
| Year ended April 30, 2017 | 13.43 | 0.11 | 2.67 | 2.78 |
| (a) | Not annualized for periods less than one year. |
| (b) | Annualized for periods less than one year. |
| (c) | Portfolio turnover is calculated on the basis of the Fund, as a whole, without distinguishing between the classes of shares issued. |
| (d) | Calculated based on average shares outstanding. |
| (e) | Effective March 9, 2020, the share class had a one-for-three reverse stock split. Share amounts for the periods have been adjusted to give effect to the one-for-three stock split. |
| (f) | Expressed as ‘‘—’’ as the income and/or expenses accrued for the class were considered immaterial for presentation purposes relative to the size of the class. |
| (g) | For the period December 14, 2017 (commencement of operations) through April 30, 2018. |
| (h) | Realized and unrealized gains and losses per share in this caption are balancing amounts necessary to reconcile the change in net asset value per share for the period, and may not reconcile with the aggregate gains and losses in the Statement of Operations due to share transactions for the period. |
| (i) | Effective March 9, 2020, the share class had a one-for-two reverse stock split. Share amounts for the periods have been adjusted to give effect to the one-for-two stock split. |
| Distributions: | Supplemental data and ratios: | ||||||||
| Net Investment Income | Capital Gains | Total Distributions | Net Asset Value, End of Period | Total Return(a) | Net Assets, End of Period (000's) | Ratio of Expenses to Average Net Assets(b) | Ratio of Net Investment Income/(Loss) to Average Net Assets(b) | Portfolio Turnover Rate(a)(c) | |
| $(0.34) | $ — | $(0.34) | $25.05 | 0.04% | $ 5,989 | 0.94% | 1.34% | 24% | |
| (0.48) | — | (0.48) | 25.38 | 6.21 | 9,234 | 0.99 | 1.87 | 22 | |
| (0.48) | — | (0.48) | 24.36 | 3.72 | 10,115 | 0.95 | 1.97 | 25 | |
| (0.42) | — | (0.42) | 23.96 | (0.82) | 11,134 | 0.96 | 1.67 | 5 | |
| (0.44) | — | (0.44) | 24.58 | 0.11 | 10,664 | 0.95 | 1.71 | 18 | |
| $(0.20) | $ — | $(0.20) | $28.38 | (0.90)% | $ 5 | 1.12% | 0.85% | 24% | |
| (0.41) | — | (0.41) | 28.84 | 2.08 | — | — (f) | — (f) | 22 | |
| — | — | — | 29.13 | 1.46 | — | — (f) | — (f) | 25 | |
| (0.63) | — | (0.63) | 28.71 | (2.27) | — | — (f) | — (f) | 5 | |
| $(0.46) | $ — | $(0.46) | $27.97 | (1.04)% | $ — | — (f)% | — (f)% | 24% | |
| (0.57) | — | (0.57) | 28.72 | 3.34 | — | — (f) | — (f) | 22 | |
| — | — | — | 28.98 | 1.47 | — | — (f) | — (f) | 25 | |
| (0.75) | — | (0.75) | 28.56 | (2.30) | — | — (f) | — (f) | 5 | |
| $(0.45) | $ — | $(0.45) | $24.90 | 0.26% | $181,279 | 0.70% | 1.54% | 24% | |
| (0.55) | — | (0.55) | 25.28 | 6.60 | 142,421 | 0.65 | 2.24 | 22 | |
| (0.55) | — | (0.55) | 24.25 | 4.05 | 152,356 | 0.66 | 2.28 | 25 | |
| (0.49) | — | (0.49) | 23.85 | (0.54) | 151,593 | 0.66 | 1.98 | 5 | |
| (0.52) | — | (0.52) | 24.47 | 0.50 | 147,953 | 0.61 | 2.05 | 18 | |
| $(0.06) | $(0.49) | $(0.55) | $17.52 | 72.56% | $ 64,997 | 0.78% | 0.31% | 36% | |
| (0.10) | (0.46) | (0.56) | 10.54 | (21.24) | 50,646 | 0.81 | 0.58 | 28 | |
| (0.10) | (1.78) | (1.88) | 13.94 | 3.18 | 71,719 | 0.81 | 0.56 | 33 | |
| (0.08) | (1.14) | (1.22) | 15.70 | 9.59 | 77,227 | 0.83 | 0.69 | 29 | |
| (0.07) | (0.45) | (0.52) | 15.44 | 20.44 | 69,001 | 0.87 | 0.43 | 36 | |
| $(0.01) | $(0.50) | $(0.51) | $16.14 | 70.10% | $ — | — (f)% | — (f)% | 36% | |
| (0.07) | (0.46) | (0.53) | 9.84 | (22.17) | — | — (f) | — (f) | 28 | |
| — | (3.56) | (3.56) | 13.64 | 2.55 | — | — (f) | — (f) | 33 | |
| (0.12) | (2.28) | (2.40) | 17.52 | (0.48) | — | — (f) | — (f) | 29 | |
| $(0.10) | $(0.49) | $(0.59) | $16.37 | 73.12% | $ 125 | 0.47% | 0.52% | 36% | |
| (0.13) | (0.46) | (0.59) | 9.87 | (20.85) | 46 | 0.50 | 1.11 | 28 | |
| — | (3.56) | (3.56) | 13.56 | 2.27 | 3 | — (f) | — (f) | 33 | |
| (0.16) | (2.28) | (2.44) | 17.48 | (0.56) | — | — (f) | — (f) | 29 | |
| $(0.09) | $(0.50) | $(0.59) | $17.87 | 73.00% | $208,505 | 0.57% | 0.51% | 36% | |
| (0.12) | (0.46) | (0.58) | 10.74 | (21.05) | 140,792 | 0.55 | 0.86 | 28 | |
| (0.13) | (1.78) | (1.91) | 14.19 | 3.51 | 153,576 | 0.53 | 0.84 | 33 | |
| (0.12) | (1.14) | (1.26) | 15.93 | 9.87 | 154,975 | 0.57 | 0.95 | 29 | |
| (0.11) | (0.45) | (0.56) | 15.65 | 20.80 | 130,717 | 0.58 | 0.72 | 36 | |
| Note 1 | — | Organization: |
| Note 2 | — | Investment Objectives and Strategies: |
| Note 3 | — | Significant Accounting Policies: |
| Investments in Securities | ||||||||
| Fund | LEVEL 1 | LEVEL 2 | LEVEL 3 | Total | ||||
| Steward Covered Call Income Fund | ||||||||
| Security Type | ||||||||
Common Stocks* | $ 37,159,742 | $ — | $ — | $ 37,159,742 | ||||
Money Market Fund | 451,068 | — | — | 451,068 | ||||
Total Investment Securities | $ 37,610,810 | $ — | $ — | $ 37,610,810 | ||||
| Other Financial Instruments:^ | ||||||||
Written Call Options | $ (1,264,243) | $ — | $ — | $ (1,264,243) | ||||
Total Investments | $ 36,346,567 | $ — | $ — | $ 36,346,567 | ||||
| Steward Global Equity Income Fund | ||||||||
| Security Type | ||||||||
Common Stocks* | $ 339,820,123 | $ — | $ — | $ 339,820,123 | ||||
Money Market Fund | 4,849,202 | — | — | 4,849,202 | ||||
Total Investments | $ 344,669,325 | $ — | $ — | $ 344,669,325 | ||||
| Steward International Enhanced Index Fund | ||||||||
| Security Type | ||||||||
Common Stocks* | $ 174,436,468 | $ — | $ — | $ 174,436,468 | ||||
Master Limited Partnerships* | 618,095 | — | — | 618,095 | ||||
Preferred Stocks* | 2,840,724 | — | — | 2,840,724 | ||||
Money Market Fund | 2,378,046 | — | — | 2,378,046 | ||||
Total Investments | $ 180,273,333 | $ — | $ — | $ 180,273,333 | ||||
| Steward Large Cap Enhanced Index Fund | ||||||||
| Security Type | ||||||||
Common Stocks* | $ 394,965,850 | $ — | $ — | $ 394,965,850 | ||||
Money Market Fund | 2,867,962 | — | — | 2,867,962 | ||||
Total Investments | $ 397,833,812 | $ — | $ — | $ 397,833,812 | ||||
| Steward Select Bond Fund | ||||||||
| Security Type | ||||||||
Corporate Bonds* | $ — | $ 126,502,649 | $ — | $ 126,502,649 | ||||
Municipal Bonds | — | 350,206 | — | 350,206 | ||||
U.S. Government Agencies | — | 21,991,726 | — | 21,991,726 | ||||
U.S. Government Agency Mortgage-Backed Obligations | — | 11,007,340 | — | 11,007,340 | ||||
U.S. Treasury Obligations | — | 17,102,631 | — | 17,102,631 | ||||
Preferred Stocks* | 1,021,800 | — | — | 1,021,800 | ||||
Money Market Fund | 11,360,833 | — | — | 11,360,833 | ||||
Total Investments | $ 12,382,633 | $ 176,954,552 | $ — | $ 189,337,185 | ||||
| Steward Small-Mid Cap Enhanced Index Fund | ||||||||
| Security Type | ||||||||
Common Stocks* | $ 270,785,901 | $ — | $ — | $ 270,785,901 | ||||
Right* | — | — | —** | — | ||||
Money Market Fund | 2,906,188 | — | — | 2,906,188 | ||||
Total Investments | $ 273,692,089 | $ — | $ — | $ 273,692,089 | ||||
| * | Please refer to the Schedule of Portfolio Investments to view common stocks, master limited partnerships, corporate bonds, preferred stocks, and rights segregated by industry type. |
| ** | Level 3 security has zero value. |
| ^ | Other Financial Instruments would include any derivative instruments, such as written options contracts. These investments are generally recorded in the financial statements at fair value. |
| Liability Derivatives | ||||||
| Fund | Primary Risk Exposure | Statements of Asset and Liabilities Location | Total Fair Value | |||
Steward Covered Call Income Fund | Equity Risk Options Contracts | Written options at fair value | $(1,264,243) |
| Realized Gain/(Loss) on Derivatives Recognized as a Result from Operations | Change in Unrealized Appreciation/(Depreciation) on Derivatives Recognized as a Result from Operations | |||||
| Fund | Primary Risk Exposure | Net realized gains on options transactions | Change in unrealized appreciation on options transactions | |||
Steward Covered Call Income Fund | Equity Risk | $2,161,055 | $79,098 |
| Note 4 | — | Investment Advisory and Other Agreements: |
| Steward Covered Call Income Fund | Steward Large Cap Enhanced Index Fund |
| — 0.625% of the first $1 billion | — 0.215% of the first $1 billion |
| — 0.5625% of assets over $1 billion | — 0.1935% of assets over $1 billion |
| Steward Global Equity Income Fund | Steward Select Bond Fund |
| — 0.625% of the first $1 billion | — 0.315% of the first $1 billion |
| — 0.5625% of assets over $1 billion | — 0.2835% of assets over $1 billion |
| Steward International Enhanced Index Fund | Steward Small-Mid Cap Enhanced Index Fund |
| — 0.365% of the first $1 billion | — 0.215% of the first $1 billion |
| — 0.3285% of assets over $1 billion | — 0.1935% of assets over $1 billion |
| In effect through August 30, 2021 | ||||||||
| Fund | Class A | Class C | Class R6 | Institutional Class | ||||
Steward Covered Call Income Fund | 1.25% | 2.00% | 0.90% | 1.00% | ||||
| Fund | Expires April 30, 2022 | Expires April 30, 2023 | Expires April 30, 2024 | |||
Steward Covered Call Income Fund | $37,844 | $96,611 | $314,550 |
| Note 5 | — | Purchases and Sales of Securities: |
| Fund | Purchases | Sales | ||
Steward Covered Call Income Fund | $ 52,565,983 | $ 49,771,893 | ||
Steward Global Equity Income Fund | 199,586,385 | 231,841,743 | ||
Steward International Enhanced Index Fund | 21,414,107 | 24,443,388 | ||
Steward Large Cap Enhanced Index Fund | 132,776,574 | 285,652,903 | ||
Steward Select Bond Fund | 52,732,092 | 30,917,140 | ||
Steward Small-Mid Cap Enhanced Index Fund | 81,551,440 | 123,606,136 |
| Fund | Purchases | Sales | ||
Steward Select Bond Fund | $ 25,160,997 | $ 7,099,695 |
| Note 6 | — | Federal Income Tax Information: |
| Fund | Tax Cost of Securities | Unrealized Appreciation | Unrealized Depreciation | Net Unrealized Appreciation/(Depreciation) | ||||
Steward Covered Call Income Fund | $ 36,455,414 | $ 587,173 | $ (696,020) | $ (108,847) | ||||
Steward Global Equity Income Fund | 271,222,378 | 75,095,300 | (1,648,353) | 73,446,947 | ||||
Steward International Enhanced Index Fund | 152,618,146 | 43,807,185 | (16,151,998) | 27,655,187 | ||||
Steward Large Cap Enhanced Index Fund | 279,446,072 | 124,164,941 | (5,777,201) | 118,387,740 | ||||
Steward Select Bond Fund | 185,349,570 | 5,485,675 | (1,498,060) | 3,987,615 | ||||
Steward Small-Mid Cap Enhanced Index Fund | 196,120,882 | 85,645,582 | (8,074,375) | 77,571,207 |
| Distributions Paid From | ||||||
| Fund | Ordinary Income | Net Long-Term Capital Gains | Total Distribution Paid | |||
Steward Covered Call Income Fund | $ 4,447,588 | $ — | $ 4,447,588 | |||
Steward Global Equity Income Fund | 6,364,964 | 3,672,129 | 10,037,093 | |||
Steward International Enhanced Index Fund | 2,962,781 | 3,437,280 | 6,400,061 | |||
Steward Large Cap Enhanced Index Fund | 10,913,675 | 26,672,511 | 37,586,186 | |||
Steward Select Bond Fund | 2,865,818 | — | 2,865,818 | |||
Steward Small-Mid Cap Enhanced Index Fund | 2,713,061 | 6,557,617 | 9,270,678 | |||
| Distributions Paid From | ||||||
| Fund | Ordinary Income | Net Long-Term Capital Gains | Total Distribution Paid | |||
Steward Covered Call Income Fund | $ 1,965,928 | $ 78,151 | $ 2,044,079 | |||
Steward Global Equity Income Fund | 6,711,644 | 18,849,394 | 25,561,038 | |||
Steward International Enhanced Index Fund | 3,676,956 | — | 3,676,956 | |||
Steward Large Cap Enhanced Index Fund | 5,813,851 | 9,842,758 | 15,656,609 | |||
Steward Select Bond Fund | 3,550,046 | — | 3,550,046 | |||
Steward Small-Mid Cap Enhanced Index Fund | 1,843,538 | 7,241,158 | 9,084,696 | |||
| Fund | Undistributed Ordinary Income | Undistributed Long-Term Capital Gains | Distributed Earnings | Accumulated Capital and Other Losses | Unrealized Appreciation/(Depreciation) | Total Distributable Earnings/(Accumulated Deficit) | ||||||
Steward Covered Call Income Fund | $ 636,772 | $ — | $ 636,772 | $ (39,834) | $ (108,847) | $ 488,091 | ||||||
Steward Global Equity Income Fund | 11,110,717 | 9,815,747 | 20,926,464 | — | 73,446,947 | 94,373,411 | ||||||
Steward International Enhanced Index Fund | 762,795 | 1,290,953 | 2,053,748 | — | 27,655,187 | 29,708,935 | ||||||
Steward Large Cap Enhanced Index Fund | 4,655,700 | 48,690,394 | 53,346,094 | — | 118,387,740 | 171,733,834 | ||||||
Steward Select Bond Fund | 292,561 | — | 292,561 | (2,515,942) | 3,987,615 | 1,764,234 | ||||||
Steward Small-Mid Cap Enhanced Index Fund | 5,319,097 | 10,207,621 | 15,526,718 | — | 77,571,207 | 93,097,925 |
| Fund | Short-Term Amount | Long-Term Amount | Total | |||
Steward Covered Call Income Fund | $ — | $ — | $ — | |||
Steward Global Equity Income Fund | — | — | — | |||
Steward International Enhanced Index Fund | — | — | — | |||
Steward Large Cap Enhanced Index Fund | — | — | — | |||
Steward Select Bond Fund | 109,401 | 2,406,541 | 2,515,942 | |||
Steward Small-Mid Cap Enhanced Index Fund | — | — | — |
| Note 7 | — | Reclassifications: |
| Note 8 | — | Control Ownership: |
| Percent Owned | ||||
| Steward Covered Call Income Fund | MSCS Financial Services, LLC | 88% | ||
| Steward Global Equity Income Fund | MSCS Financial Services, LLC | 39% | ||
| Steward Global Equity Income Fund | National Financial Services LLC | 30% | ||
| Steward International Enhanced Index Fund | MSCS Financial Services, LLC | 43% | ||
| Steward International Enhanced Index Fund | National Financial Services LLC | 49% | ||
| Steward Large Cap Enhanced Index Fund | MSCS Financial Services, LLC | 51% | ||
| Steward Large Cap Enhanced Index Fund | National Financial Services LLC | 33% | ||
| Steward Select Bond Fund | MSCS Financial Services, LLC | 56% | ||
| Steward Select Bond Fund | National Financial Services LLC | 39% | ||
| Steward Small-Mid Cap Enhanced Index Fund | MSCS Financial Services, LLC | 39% | ||
| Steward Small-Mid Cap Enhanced Index Fund | National Financial Services LLC | 25% | ||
| Note 9 | — | LIBOR Transition: |
| Fund | Amount | |
Steward Covered Call Income Fund | $ 24,447 | |
Steward Global Equity Income Fund | 1,292,671 | |
Steward International Enhanced Index Fund | 925,790 | |
Steward Large Cap Enhanced Index Fund | 372,670 | |
Steward Select Bond Fund | 558,657 | |
Steward Small-Mid Cap Enhanced Index Fund | 179,241 |

REPORT OF INDEPENDENT REGISTERED PUBLIC ACCOUNTING FIRM
To the Shareholders and Board of Directors of
Steward Funds, Inc.
Opinion on the Financial Statements
We have audited the accompanying statements of assets and liabilities, including the schedules of portfolio investments, of Steward Funds, Inc. comprising the funds listed below (the “Funds”) as of April 30, 2021, the related statements of operations, the statements of changes in net assets, the related notes, and the financial highlights for each of the periods indicated below (collectively referred to as the “financial statements”). In our opinion, the financial statements present fairly, in all material respects, the financial position of each of the Funds as of April 30, 2021, the results of their operations, the changes in net assets, and the financial highlights for each of the periods indicated below in conformity with accounting principles generally accepted in the United States of America.
Fund Name | Statements of Operations and Cash Flows | Statements of Changes in Net Assets | Financial Highlights | |||
Steward Global Equity Income Fund, Steward International Enhanced Index Fund, Steward Large Cap Enhanced Index Fund, Steward Select Bond Fund, and Steward Small-Mid Cap Enhanced Index Fund | For the year ended April 30, 2021 | For the years ended April 30, 2021 and 2020 | For the years ended April 30, 2021, 2020, 2019, 2018, and 2017 | |||
Steward Covered Call Income Fund | For the year ended April 30, 2021 | For the years ended April 30, 2021 and 2020 | For the years ended April 30, 2021, 2020, 2019 and for the period from December 14, 2017 (commencement of operations) through April 30, 2018 | |||
Basis for Opinion
These financial statements are the responsibility of the Funds’ management. Our responsibility is to express an opinion on the Funds’ financial statements based on our audits. We are a public accounting firm registered with the Public Company Accounting Oversight Board (United States) (“PCAOB”) and are required to be independent with respect to the Funds in accordance with the U.S. federal securities laws and the applicable rules and regulations of the Securities and Exchange Commission and the PCAOB.

We conducted our audits in accordance with the standards of the PCAOB. Those standards require that we plan and perform the audit to obtain reasonable assurance about whether the financial statements are free of material misstatement whether due to error or fraud.
Our audits included performing procedures to assess the risks of material misstatement of the financial statements, whether due to error or fraud, and performing procedures that respond to those risks. Such procedures included examining, on a test basis, evidence regarding the amounts and disclosures in the financial statements. Our procedures included confirmation of securities owned as of April 30, 2021, by correspondence with the custodians and brokers. Our audits also included evaluating the accounting principles used and significant estimates made by management, as well as evaluating the overall presentation of the financial statements. We believe that our audits provide a reasonable basis for our opinion.
We have served as the Funds’ auditor since 2007.

COHEN & COMPANY, LTD.
Chicago, Illinois
June 28, 2021
| Fund | Dividends Received Deduction | |
Steward Covered Call Income Fund | 0.72% | |
Steward Global Equity Income Fund | 31.19% | |
Steward International Enhanced Index Fund | 0.11% | |
Steward Large Cap Enhanced Index Fund | 29.12% | |
Steward Select Bond Fund | 2.85% | |
Steward Small-Mid Cap Enhanced Index Fund | 12.54% |
| Fund | Qualified Dividend Income | |
Steward Covered Call Income Fund | 0.72% | |
Steward Global Equity Income Fund | 58.86% | |
Steward International Enhanced Index Fund | 90.75% | |
Steward Large Cap Enhanced Index Fund | 30.48% | |
Steward Select Bond Fund | 2.85% | |
Steward Small-Mid Cap Enhanced Index Fund | 12.67% |
| Fund | Long-Term Capital Gains | |
Steward Covered Call Income Fund | $ — | |
Steward Global Equity Income Fund | 3,672,129 | |
Steward International Enhanced Index Fund | 3,437,280 | |
Steward Large Cap Enhanced Index Fund | 26,672,511 | |
Steward Select Bond Fund | — | |
Steward Small-Mid Cap Enhanced Index Fund | 6,557,617 |
| Fund | Short-Term Capital Gains | |
Steward Covered Call Income Fund | $4,197,905 | |
Steward Global Equity Income Fund | 536,369 | |
Steward International Enhanced Index Fund | 273,975 | |
Steward Large Cap Enhanced Index Fund | 6,144,355 | |
Steward Select Bond Fund | — | |
Steward Small-Mid Cap Enhanced Index Fund | 1,634,327 |
| Fund | Foreign Source Income | Foreign Tax Expense | ||
Steward International Enhanced Index Fund | $0.47 | $0.05 |
| Fund | Beginning Account Value 11/1/20 | Ending Account Value 4/30/21 | Expenses Paid During Period 11/1/20 – 4/30/21* | Expense Ratio During Period 11/1/20 – 4/30/21** | ||||
| Steward Covered Call Income Fund | ||||||||
Class A | $1,000.00 | $1,207.30 | $ 6.84 | 1.25% | ||||
Class C | 1,000.00 | 1,203.60 | 10.93 | 2.00% | ||||
Class R6(1) | 1,000.00 | 1,215.60 | — | —% | ||||
Institutional Class | 1,000.00 | 1,210.40 | 5.48 | 1.00% | ||||
| Steward Global Equity Income Fund | ||||||||
Class A | 1,000.00 | 1,303.80 | 6.80 | 1.19% | ||||
Class C | 1,000.00 | 1,298.50 | 11.51 | 2.02% | ||||
Class R6 | 1,000.00 | 1,306.30 | 4.92 | 0.86% | ||||
Institutional Class* | 1,000.00 | 1,305.40 | 5.77 | 1.01% | ||||
| Steward International Enhanced Index Fund | ||||||||
Class A | 1,000.00 | 1,320.70 | 3.91 | 0.68% | ||||
Class C | 1,000.00 | 1,315.00 | 7.58 | 1.32% | ||||
Class R6 | 1,000.00 | 1,321.20 | 3.74 | 0.65% | ||||
Institutional Class | 1,000.00 | 1,320.00 | 4.72 | 0.82% | ||||
| Steward Large Cap Enhanced Index Fund | ||||||||
Class A | 1,000.00 | 1,298.70 | 4.10 | 0.72% | ||||
Class C | 1,000.00 | 1,283.70 | 6.12 | 1.08% | ||||
Class R6 | 1,000.00 | 1,300.40 | 2.51 | 0.44% | ||||
Institutional Class | 1,000.00 | 1,299.40 | 3.42 | 0.60% | ||||
| Steward Select Bond Fund | ||||||||
Class A | 1,000.00 | 987.90 | 3.89 | 0.79% | ||||
Class C | 1,000.00 | 984.10 | 5.51 | 1.12% | ||||
Class R6(1) | 1,000.00 | 981.20 | — | —% | ||||
Institutional Class | 1,000.00 | 988.40 | 3.75 | 0.76% | ||||
| Steward Small-Mid Cap Enhanced Index Fund | ||||||||
Class A | 1,000.00 | 1,468.70 | 4.59 | 0.75% | ||||
Class C(1) | 1,000.00 | 1,456.70 | — | —% | ||||
Class R6 | 1,000.00 | 1,470.60 | 2.88 | 0.47% | ||||
Institutional Class | 1,000.00 | 1,469.10 | 3.73 | 0.61% |
| * | Expenses are equal to the average account value times the Fund’s annualized expense ratio multiplied by 181/365 (to reflect the one-half year period). |
| ** | The Expense Ratio for each class of Steward Covered Call Income Fund (other than Class R6) reflects an expense limitation. See Note 4 in the Notes to Financial Statements. |
| (1) | Expense Paid and Expense Ratio are expressed as — and —%, respectively, because the class is too small to accrue income and expenses during the period ended April 30, 2021. |
| Fund | Beginning Account Value 11/1/20 | Ending Account Value 4/30/21 | Expenses Paid During Period 11/1/20 – 4/30/21* | Expense Ratio During Period 11/1/20 – 4/30/21** | ||||
| Steward Covered Call Income Fund | ||||||||
Class A | $1,000.00 | $1,018.60 | $ 6.26 | 1.25% | ||||
Class C | 1,000.00 | 1,014.88 | 9.99 | 2.00% | ||||
Class R6(1) | 1,000.00 | 1,024.79 | — | —% | ||||
Institutional Class | 1,000.00 | 1,019.84 | 5.01 | 1.00% | ||||
| Steward Global Equity Income Fund | ||||||||
Class A | 1,000.00 | 1,018.89 | 5.96 | 1.19% | ||||
Class C | 1,000.00 | 1,014.78 | 10.09 | 2.02% | ||||
Class R6 | 1,000.00 | 1,020.53 | 4.31 | 0.86% | ||||
Institutional Class | 1,000.00 | 1,019.79 | 5.06 | 1.01% | ||||
| Steward International Enhanced Index Fund | ||||||||
Class A | 1,000.00 | 1,021.42 | 3.41 | 0.68% | ||||
Class C | 1,000.00 | 1,018.25 | 6.61 | 1.32% | ||||
Class R6 | 1,000.00 | 1,021.57 | 3.26 | 0.65% | ||||
Institutional Class | 1,000.00 | 1,020.73 | 4.11 | 0.82% | ||||
| Steward Large Cap Enhanced Index Fund | ||||||||
Class A | 1,000.00 | 1,021.22 | 3.61 | 0.72% | ||||
Class C | 1,000.00 | 1,019.44 | 5.41 | 1.08% | ||||
Class R6 | 1,000.00 | 1,022.61 | 2.21 | 0.44% | ||||
Institutional Class | 1,000.00 | 1,021.82 | 3.01 | 0.60% | ||||
| Steward Select Bond Fund | ||||||||
Class A | 1,000.00 | 1,020.88 | 3.96 | 0.79% | ||||
Class C | 1,000.00 | 1,019.24 | 5.61 | 1.12% | ||||
Class R6(1) | 1,000.00 | 1,024.79 | — | —% | ||||
Institutional Class | 1,000.00 | 1,021.03 | 3.81 | 0.76% | ||||
| Steward Small-Mid Cap Enhanced Index Fund | ||||||||
Class A | 1,000.00 | 1,021.08 | 3.76 | 0.75% | ||||
Class C(1) | 1,000.00 | 1,024.79 | — | —% | ||||
Class R6 | 1,000.00 | 1,022.46 | 2.36 | 0.47% | ||||
Institutional Class | 1,000.00 | 1,021.77 | 3.06 | 0.61% |
| * | Expenses are equal to the average account value times the Fund’s annualized expense ratio multiplied by 181/365 (to reflect the one-half year period). |
| ** | The Expense Ratio for each class of Steward Covered Call Income Fund (other than Class R6) reflects an expense limitation. See Note 4 in the Notes to Financial Statements. |
| (1) | Expense Paid and Expense Ratio are expressed as — and —%, respectively, because the class is too small to accrue income and expenses during the period ended April 30, 2021. |
| Name, Address, Age | Position(s) Held with Fund | Term of Office(1) and Length of Time Served | Principal Occupation(s) During Past 5 Years | Number of Portfolios in Fund Complex Overseen by Director or Nominee | Other Directorships Held by Director or Nominee During the Past 5 Years | ||||||||||
| Interested Directors | |||||||||||||||
| Michael L. Kern, III, CFA (2) c/o 15375 Memorial Drive, Suite 200 Houston, TX 77079 Birth Year: 1973 | Chairman of the Board; Director | Indefinite Term Since 2017 | President, CEO and Treasurer, Crossmark Global Holdings, Inc. (May 2015 − Present); President, CEO and Treasurer, Crossmark Global Investments, Inc. and Crossmark Distributors, Inc. (2016 − Present); Chief Compliance Officer, Crossmark Distributors, Inc. (August 1, 2017 − December 11, 2017); Secretary, Crossmark Global Investments, Inc. and Crossmark Distributors, Inc. (2016 − 2018) | 6 | Stratford Cambridge Group Investments − Advisory Board (2011 − 2017); Foundation Capital Resources (2015 − Present) | ||||||||||
| Kyle A. Dana CRPC(3) c/o 15375 Memorial Drive, Suite 200 Houston, TX 77079 Birth Year: 1978 | Director | Indefinite Term Since 2017 | Senior Vice President, Retirement & Investment Solutions of AGFinancial(4) (2000 − Present) | 6 | N/A | ||||||||||
| Independent Directors | |||||||||||||||
| Mark H. Barineau c/o 15375 Memorial Drive, Suite 200 Houston, TX 77079 Birth Year: 1968 | Director | Indefinite Term Since 2017 | President of Lionsmark Investment Group(5) (since April 2016); President & Owner of Radney Management & Investments, Inc.(6) (1996 – 2016) | 6 | N/A | ||||||||||
| Richard L. Peteka c/o 15375 Memorial Drive, Suite 200 Houston, TX 77079 Birth Year: 1961 | Director | Indefinite Term Since 2017 | Chief Financial Officer and Secretary of SLR Investment Corp., SLR Senior Investment Corp. (May 2012 - Present) and SCP Private Credit Income BDC LLC(7) (2018 − Present) | 6 | N/A | ||||||||||
| Adriana R. Posada c/o 15375 Memorial Drive, Suite 200 Houston, TX 77079 Birth Year: 1954 | Director | Indefinite Term Since 2017 | Retired; Sr. Portfolio Manager of American Beacon Advisors, Inc. (September 1998 − March 2016) | 6 | Trustee of Irving Firemen’s Relief and Retirement Plan (April 2009 – October 2015) | ||||||||||
| Richard J. Rossi c/o 15375 Memorial Drive, Suite 200 Houston, TX 77079 Birth Year: 1956 | Director; Lead Independent Director as of May 14, 2020 | Indefinite Term Since 2019 | Retired; President and Co–Chief Operating Officer, Eagle Asset Management, President, Eagle Mutual Funds and Eagle Fund Distributors (2000 – 2017) | 6 | N/A | ||||||||||
| Name, Address and Age | Position(s) Held with Fund | Term of Office(1) and Length of Time Served | Principal Occupation(s) During Past 5 Years | Other Directorships Held by Director or Nominee During the Past 5 Years | ||||||||
| Executive Officers | ||||||||||||
| Michael L. Kern, III, CFA 15375 Memorial Drive, Suite 200 Houston, TX 77079 Birth Year: 1973 | President and Treasurer | Since 2016 | President, CEO and Treasurer, Crossmark Global Holdings, Inc. (May 2015 − Present); President, CEO and Treasurer, Crossmark Global Investments, Inc. and Crossmark Distributors, Inc. (2016 − Present); Chief Compliance Officer, Crossmark Distributors, Inc. (August 1, 2017 − December 11, 2017); Secretary, Crossmark Global Investments, Inc. and Crossmark Distributors, Inc. (2016 − 2018) | Stratford Cambridge Group Investments − Advisory Board (2011 − 2017); Foundation Capital Resources (2015 − Present) | ||||||||
| John R. Wolf 15375 Memorial Drive, Suite 200 Houston, TX 77079 Birth Year: 1961 | Executive Vice President | Since 2004 | Managing Director, Crossmark Global Investments, Inc. (2019 – Present); Managing Director – Equity Investments, Crossmark Global Investments, Inc. (1996 – 2019) | N/A | ||||||||
| Brent Lium, CFA 15375 Memorial Drive, Suite 200 Houston, TX 77079 Birth Year: 1969 | Executive Vice President | Since 2019 | Managing Director - Head of Equity Investments, Crossmark Global Investments, Inc. (February 2021 - Present); Managing Director, Crossmark Global Investments, Inc. (2019 – February 2021); Portfolio Manager, Invesco Ltd. (2001 − 2019) | N/A | ||||||||
| Victoria Fernandez, CFA 15375 Memorial Drive, Suite 200 Houston, TX 77079 Birth Year: 1973 | Executive Vice President | Since 2014 | Chief Market Strategist, Crossmark Global Investments, Inc. (2018 − Present); Managing Director – Fixed Income Investments, Crossmark Global Investments, Inc. (2012 – 2018) | N/A | ||||||||
| Paul Townsen 15375 Memorial Drive, Suite 200 Houston, TX 77079 Birth Year: 1971 | Executive Vice President | Since 2017 | Managing Director − Head of Trading & Investment Operations, Crossmark Global Investments, Inc. (2021 − Present); Managing Director, Crossmark Global Investments, Inc. (2017 − 2021); Senior Vice President, Crossmark Global Investments, Inc. (2015 − 2017) | N/A | ||||||||
| Ryan Caylor, CFA 15375 Memorial Drive, Suite 200 Houston, TX 77079 Birth Year: 1988 | Executive Vice President | Since 2020 | Portfolio Manager, Crossmark Global Investments, Inc. (2020 − Present); Head of Research, Crossmark Global Investments, Inc. (2019 – Present); Senior Research Analyst, Crossmark Global Investments Inc. (2016 – 2019); Associate, Tudor, Pickering, Holt & Co. (2013 – 2016) | N/A | ||||||||
| Charles Sylvester 15375 Memorial Drive, Suite 200 Houston, TX 77079 Birth Year: 1964 | Executive Vice President | Since 2020 | Managing Director – Head of Sales & Distribution, Crossmark Global Investments, Inc. (October 2019 – Present); Senior Vice President, Crossmark Global Investments, Inc. (June 2019 – September 2019); Senior Vice President, Invesco Ltd. (April 2000 – May 2019) | N/A | ||||||||
| Name, Address and Age | Position(s) Held with Fund | Term of Office(1) and Length of Time Served | Principal Occupation(s) During Past 5 Years | Other Directorships Held by Director or Nominee During the Past 5 Years | ||||||||
| Executive Officers (continued) | ||||||||||||
| Patrick N. Garboden 15375 Memorial Drive, Suite 200 Houston, TX 77079 Birth Year: 1957 | Executive Vice President and Liquidity Risk Management Program Administrator | Since 2018 | Senior Portfolio Manager, Crossmark Global Investments, Inc. (October 2008 – Present) | N/A | ||||||||
| Jim A. Coppedge 15375 Memorial Drive, Suite 200 Houston, TX 77079 Birth Year: 1968 | Executive Vice President, Chief Compliance Officer, Secretary and Assistant Treasurer | Since 2017 | General Counsel and Chief Compliance Officer, Crossmark Global Investments, Inc. (2017 − Present); General Counsel and Chief Compliance Officer, Crossmark Distributors, Inc. (December 11, 2017 − Present); Secretary, Crossmark Global Investments, Inc. and Crossmark Distributors, Inc. (2018 − Present) | N/A | ||||||||
| Jessica Gunter 15375 Memorial Drive, Suite 200 Houston, TX 77079 Birth Year: 1987 | Assistant Secretary and Assistant Treasurer | Since 2020 | Senior Compliance Officer and Associate General Counsel, Crossmark Global Investments, Inc. (2020 - Present); Teacher, St. Laurence Catholic School (2015-2020) | N/A | ||||||||
| Patricia Mims 15375 Memorial Drive, Suite 200 Houston, TX 77079 Birth Year: 1960 | Assistant Treasurer | Since 2021 | Financial Operations Principal, Crossmark Distributors, Inc. (2018 - Present); Senior Compliance Officer, Crossmark Global Investments, Inc. (October 2018 - 2020); Assistant Secretary, Crossmark Global Investments, Inc. and Crossmark Distributors, Inc. (2018 - 2020); Senior Compliance Associate, Crossmark Global Investments, Inc. (April 2013 - October 2018) | N/A | ||||||||
Visit crossmarkglobal. us online at: com STEWARD FUNDS ANNUAL REPORT Steward Covered Call Income Fund Steward Global Equity Income Fund Steward International Enhanced Index Fund Steward Large Cap Enhanced Index Fund Steward Select Bond Fund Steward Small-Mid Cap Enhanced Index Fund Distributed by: Crossmark Distributors, Inc. 15375 Memorial Dr, Suite 200 Houston, TX 77079 888-845-6910 stewardfunds@crossmarkglobal.com the For Distributor more complete to receive information a prospectus. about the Please Steward read Funds, it carefully including before charges you invest and expenses, or send money. contact SF 04/30
| (b) | Not applicable. |
Item 2. Code of Ethics.
| (a) | The registrant has adopted a code of ethics that applies to the registrant’s principal executive officer, principal financial officer, principal accounting officer or controller, or persons performing similar functions. This code of ethics is included as an exhibit. |
| (c) | During the period covered by the report, with respect to the registrant’s code of ethics that applies to its principal executive officer, principal financial officer, principal accounting officer or controller, or persons performing similar functions, there have been no amendments to a provision that relates to any element of the code of ethics definition enumerated in paragraph (b) of this Item 2 of Form N-CSR. |
| (d) | During the period covered by the report, with respect to the registrant’s code of ethics that applies to its principal executive officer, principal financial officer, principal accounting officer or controller, or persons performing similar functions, there have been no waivers granted from a provision that relates to any element of the code of ethics definition enumerated in paragraph (b) of this Item 2 of Form N-CSR. |
Item 3. Audit Committee Financial Expert.
| (a) | (1) The registrant’s board of directors has determined that the registrant has at least one audit committee financial expert serving on its audit committee. |
| (a) | (2) The audit committee financial expert is Richard L. Peteka, who is “independent” for purposes of this Item 3 of Form N-CSR. |
Item 4. Principal Accountant Fees and Services.
2021 | 2020 | |||
(a) Audit Fees | $91,750 | $87,500 | ||
(b) Audit-Related Fees | $- | $- | ||
(c) Tax Fees | $18,000 | $18,000 | ||
(d) All Other Fees | $- | $- |
The audit fees are paid for professional services rendered by the auditor for the audit of the Funds’ annual financial statements or services that are normally provided by the auditor in connection with statutory and regulatory filings or engagements. The tax fees are paid for professional services rendered by the auditor for tax compliance, tax advice and tax planning.
| (e) | (1) The Audit Committee may pre-approve at any regularly scheduled Audit Committee meeting audit, audit-related, tax and other non-audit services to be rendered or that may be rendered by the auditor to the Funds and certain non-audit services to be rendered by the auditor to the Funds’ investment adviser which require pre-approval by the Audit Committee. In connection with such pre-approvals, the auditor, or a Fund officer, with the assistance of the auditor, shall provide the Audit Committee with a report containing information about each type of service to be pre-approved at the meeting. |
2
| (e) | (2) For the fiscal years ended April 30, 2021 and 2020, 100% of all the fees in paragraphs (b) through (d) were approved by the Audit Committee. |
| (f) | Not applicable. |
| (g) | For the fiscal year ended April 30, 2021, Cohen and Company, Ltd. billed $18,000. |
For the fiscal year ended April 30, 2020, Cohen and Company, Ltd. billed $18,000.
| (h) | Not applicable. |
Item 5. Audit Committee of Listed Registrants.
Not applicable.
Item 6. Schedule of Investments.
| (a) | The schedules of investments are included as part of the report to shareholders filed under Item 1(a) of this Form N-CSR. |
| (b) | Not applicable. |
Item 7. Disclosure of Proxy Voting Policies and Procedures for Closed-End Management Investment Companies.
Not applicable.
Item 8. Portfolio Managers of Closed-End Management Investment Companies.
Not applicable.
Item 9. Purchases of Equity Securities by Closed-End Management Investment Company and Affiliated Purchasers.
Not applicable.
Item 10. Submission of Matters to a Vote of Security Holders.
Not applicable.
Item 11. Controls and Procedures.
| (a) | The registrant’s principal executive officer and principal financial officer have concluded, based on their evaluation of the registrant’s disclosure controls and procedures as conducted within 90 days of the filing date of this report, that these disclosure controls and procedures are adequately designed and are operating effectively to ensure that information required to be disclosed by the registrant on Form N-CSR is recorded, processed, summarized and reported within the time periods specified in the Securities and Exchange Commission’s rules and forms. |
3
| (b) | There were no changes in the registrant’s internal control over financial reporting (as defined in Rule 30a-3(d) under the Act (17 CFR 270.30a-2(d)) that occurred during the period covered by this report that have materially affected or are reasonably likely to materially affect, the registrant’s internal control over financial reporting. |
Item 12. Disclosure of Securities Lending Activities for Closed-End Management Investment Companies.
Not applicable.
Item 13. Exhibits.
4
SIGNATURES
Pursuant to the requirements of the Securities Exchange Act of 1934 and the Investment Company Act of 1940, the registrant has duly caused this report to be signed on its behalf by the undersigned, thereunto duly authorized.
| Steward Funds, Inc. | ||
| By: | /s/ Michael L. Kern, III | |
| Michael L. Kern, III | ||
President and Treasurer (Principal Executive Officer and Principal Financial Officer) | ||
Date: July 1, 2021
Pursuant to the requirements of the Securities Exchange Act of 1934 and the Investment Company Act of 1940, this report has been signed below by the following persons on behalf of the registrant and in the capacities and on the dates indicated.
| By: | /s/ Michael L. Kern, III | |
| Michael L. Kern, III | ||
President and Treasurer (Principal Executive Officer and Principal Financial Officer) | ||
Date: July 1, 2021
5