UNITED STATES
SECURITIES AND EXCHANGE COMMISSION
Washington, D.C. 20549
FORM N-CSR
CERTIFIED SHAREHOLDER REPORT OF REGISTERED
MANAGEMENT INVESTMENT COMPANIES
Investment Company Act File Number 811-01597
Steward Funds, Inc.
(Exact name of registrant as specified in charter)
15375 Memorial Drive
Suite 200
Houston, Texas 77079
(Address of principal executive offices) (Zip code)
John Marten
Vedder Price P.C.
222 North LaSalle Street
Chicago, Illinois 60601
(Name and address of agent for service)
Registrant’s telephone number, including area code: (713) 260-9000
Date of fiscal year end: April 30
Date of reporting period: April 30, 2023
Item 1. Reports to Stockholders.
| (a) | The following is a copy of the report transmitted to shareholders pursuant to Rule 30e-1 under the Investment Company Act of 1940 (the “Act”) (17 CFR 270.30e-1): |
CROSSMARKGLOBAL.COM
April 30, 2023
STEWARD FUNDS
SEMI-ANNUAL STEWARD FUNDS REPORT
Dear Shareholders:
It is our pleasure to present you with the 2023 Steward Funds, Inc. Annual Report. Within the pages of this report, you will find detailed information regarding the Steward Funds, including performance, specific holdings and a summary of the key factors that have affected the Funds’ performance for the most recent fiscal year. I encourage you to review this information thoroughly and contact us if you have any questions.
Most mutual fund annual report letters written by the President of a mutual fund complex focus on the markets, the ways in which their specific funds have performed during the past market cycle, and what lies ahead. At Crossmark Global Investments (the exclusive investment manager of the Steward Funds), we have a number of experts that regularly provide fresh and real-time commentary on all of these issues. To be sure, we have many financial nerds (including me) walking the halls of our office! Rather than regurgitate those themes here (as important as they most certainly are), I would like to focus this year’s letter on one simple theme – purpose.
As investors, we have many options when it comes to investing our hard-earned money. There is certainly no shortage of investment products and strategies in the marketplace. Many, like our Steward Funds, have received meaningful awards evidencing their success over a short-, medium-, and long-term investing horizon, and as investors we would be well-served to thoroughly evaluate the strengths of these investment options before making a final selection.
In the midst of all of our due diligence and investigative efforts, however, I believe that one question needs to be front and center, namely this – do our investments align with our faith-based values? I believe that few people would disagree with the view that we should endeavor to earn our money in a God-honoring, ethical and lawful manner. And I suspect that few would disagree that we should use our money in that same way. We practice these virtues on the front end while we earn money, and we practice these virtues on the back end when we use our money or give it away. But what about the period in between?
I believe that the best approach to the topic of money is a holistic one that incorporates the entire money life cycle from beginning to end. If we only concern ourselves with the manner in which we earn money and the way in which we use it and give it away, but give no thought to the in-between stage, we are missing a critical element. Shouldn’t we be at least as intentional about the way in which we manage our money as we are with respect to earning it and giving it away? I believe the answer is yes, which brings me back to purpose.
At Crossmark Global Investments (and by extension our Steward Funds), our purpose is to inspire and equip our clients to go further in their pursuit of all that God has for them. Inspiration is good, and equipping is good, but the combination of inspiration and practical execution assistance is a game-changer! It has been our pleasure to serve our clients for over 35 years, inspiring them to incorporate their personal values within their investment portfolio, and equipping them to do so in a professional and intelligent manner. This is the core of who we are and what we do.
How far have you gone in your pursuit of all that God has for you, especially as it relates to your investment portfolio? By virtue of the fact that you are reading this letter as a shareholder of the Steward Funds, you are well on your way to achieving alignment between your investments and your values. Well done! I would like to encourage you to go even further in 2023!
On behalf of all of the professionals at the Steward Funds and Crossmark Global Investments, we sincerely thank you for the trust you have placed in us. We invite you to learn more about the Steward Funds, Crossmark Global Investments, and the various investment options available to you by visiting our website at crossmarkglobal.com. Additionally, if you are ever in Houston, we would love to meet you personally. Feel free to stop by our office at any time.
Again, thank you for choosing to invest in the Steward Funds.
Sincerely,
Michael L. Kern, III, CFA
Chairman of the Board and President of Steward Funds, Inc.
President, CEO, and Treasurer of Crossmark Global Investments, Inc.
15375 Memorial Drive, Suite 200, Houston, TX 77079 800-262-6631
| crossmarkglobal.com/stewardfund s |
STEWARD COVERED CALL INCOME FUND
Portfolio Management: Paul C. Townsen, Managing Director, and Ryan Caylor, CFA, Head of Research


Fund and Market Performance (Unaudited)
(Institutional Class Shares)
For the fiscal year that ended April 30, 2023, the Steward Covered Call Income Fund (the “Fund”) returned 5.41%. For comparison purposes, the total return of the Fund’s primary benchmark, the S&P 500 Index (“S&P 500”), was 2.66% over the same period. The Fund’s secondary benchmark, the Cboe S&P 500 BuyWrite Index (BXM), returned -1.12% over the same period, representing 653 basis points of outperformance by the Fund.
Positive and Negative Contributors to Performance
With regard to performance attribution for the Fund during the fiscal year ended April 30, 2023, there are several sectors and individual stocks worth highlighting. From a sector allocation standpoint for the stock portfolio, the sectors contributing the most to relative performance against the S&P 500 were real estate, healthcare, communication services and information technology. Detracting the most from relative performance were utilities and industrials. Several stocks that contributed the most to relative performance were Starbucks Corp., Eli Lilly & Co. and Nvidia Corp. Stocks detracting the most from relative performance were 3M Co., Target Corp., and Tesla, Inc. When considering the values-based screens we apply, the net impact to the Fund by not owning the screened-out companies was a positive 24 basis points, with almost all of the negative net impact coming from our embryonic stem cell research screens and abortion-related screens.
Looking Ahead
As we look to the rest of the 2023 calendar year, a key variable for investors to digest will be the impact of the banking crisis on the economy. We believe monetary tightening is either at, or close to, an end, but the markets will also be anxiously looking for an increase in leading economic indicators that could lead to a viable move higher in the markets. The probability of another rate hike currently sits around 55-65%, according to Bloomberg News, but the conversations are already shifting to when and how fast the Federal Reserve Board (the “Fed”) begins to cut rates. How markets react will largely depend on the rhetoric driving the anticipated rate cut season.
Principal Investment Strategy
The Fund’s principal investment strategy is to invest in a portfolio of large-cap, dividend-paying, equity securities that are listed on U.S. exchanges and to write (sell) covered call options on those securities with the overall goal of providing options premium income and lowering volatility of the Fund’s portfolio when compared to the broader uncovered large-cap securities market, subject to the limitations of the Fund’s values-based screening policies.
Under normal market circumstances, the Fund will:
• write (sell) call options on at least 80% of its equity securities
• invest at least 80% of its assets in the securities of companies included in the Fund’s benchmark
Covered call options may be written on the Fund’s equity securities. A call option gives the purchaser of the option the right to buy, and the writer, in this case, the Fund, the obligation to sell, the underlying security at a specified exercise price at any time prior and up to the expiration of the contract.
The covered call strategy used by the Fund is designed to earn extra premium income to moderate the impact of market declines and to reduce the volatility of the Fund’s portfolio. This strategy means that the Fund may be expected to underperform equity markets during periods of sharply rising prices; conversely, by using this strategy, the Fund would tend to outperform equity markets during periods of flat or declining prices due to the Fund’s receipt of premiums from selling the call options.
STEWARD EQUITY MARKET NEUTRAL FUND
Portfolio Management: Robert C. Doll, CFA, Chief Investment Officer, and Ryan Caylor, CFA, Head of Research

Fund and Market Performance (Unaudited)
(Institutional Class Shares)
For the fiscal year ended April 30, 2023, the Steward Equity Market Neutral Fund (the “Fund”) returned 5.28%, outperforming the ICE BofA 3 Month U.S. Treasury Bill Index return of 2.84% by 244 basis points.
Positive and Negative Contributors to Performance
The largest positive sector performance came from our long positions in healthcare and industrials and short positions in information technology and consumer discretionary. Our best stock contributors on the long side were Biogen, Inc., Cadence Design Systems Inc., and Gilead Sciences, Inc.; our worst long contributors were Kohl’s Corp., Jones Lang Lasalle, Inc., and Target Corp. Our biggest short contributors were Lyft Inc., Envive, and Wayfair, Inc.; our biggest short detractors were Sotera Health Co., Shoals Technologies Group, Inc. and Enphase Energy, Inc.
Current Positioning
We continue to favor companies that have reasonable valuations with strong earnings and cash flow profiles. Our largest sector net overweights are financials, information technology and consumer discretionary; our largest sector net underweights are healthcare and utilities. Our largest factor bets are pro-management quality, profitability, earings yield and anti-size.
Looking Ahead
The rally in U.S. stocks over the past month or so reflects better than expected Q1 earnings and investor expectations of interest rate cuts over the coming year. (The soft-landing story.) We believe a soft economic landing remains unlikely. It is only possible in our view if inflation soon falls close to the Fed’s 2% target, permitting the Fed to cut interest rates back to neutral levels, before the labor market weakens enough that the U.S. economy slips into recession. It is also unlikely in our view that financial markets are priced for a recession. We believe forward earnings have not yet adjusted to what is likely to be a double-digit percentage peak-to-trough decline in earnings during a recession, and the U.S. forward equity risk premium is below its historical average. Outside the U.S., the valuation picture for stocks is more attractive than in the U.S. Global ex-U.S. stocks may fare better versus the U.S. over the coming few years. These views warrant a cautious position toward equities and a neutral position toward fixed income, implying some cash (or short-term fixed income) is also in order.
Principal Investment Strategy
The Fund pursues its investment objective utilizing a market neutral strategy, the goal of which is to generate absolute returns that are due primarily to stock selection, rather than the returns and direction of the stock market. Under normal market conditions, the Fund invests at least 80% of its assets in equity securities. The Fund implements its market neutral strategy by establishing long and short positions in a diversified portfolio of equity securities, subject to the limitations of the Fund’s values-based screening policies on long positions. Substantially all of the equity securities in which the Fund takes long and short positions will be included in the Russell 1000 Index at the time of purchase. As a result, the Fund will invest significantly in large-capitalization companies.
Portfolio management will invest in long positions that are expected to deliver the overall returns of the stock market, plus additional performance unique to the specific stocks purchased by portfolio management. The short positions selected by portfolio management are expected to deliver the inverse of the overall returns of the stock market, plus additional performance unique to the specific stocks sold short by portfolio management. At any time, the Fund’s net long exposure to the stock market (long market value minus short market value) could range between -20% and 40%.
Portfolio management will select securities using an investment process that combines quantitative techniques, fundamental analysis and risk management. Securities generally are added to the portfolio as long or short positions based both on security rankings provided by multi-factor quantitative models and on fundamental analysis of the securities. In addition, portfolio management will utilize risk management techniques to establish constraints on the amounts invested in individual securities and sectors. Portfolio management generally will decrease or eliminate a short or long position in a security if the security’s model ranking changes significantly or research reveals a significant change in the company’s fundamentals.
Portfolio management may consider among other factors, a company’s valuation, financial strength, growth potential, competitive position in its industry, projected future earnings, cash flows and dividends when deciding whether to buy or sell investments. With respect to security rankings provided by the multi-factor quantitative models, the models include a values-based component for ranking companies.
STEWARD GLOBAL EQUITY INCOME FUND
Portfolio Management: Rob Botard, CFA, Managing Director, and Brent Lium, CFA, Managing Director


Fund and Market Performance (Unaudited)
(Institutional Class Shares)
For the fiscal year that ended April 30, 2023, the Steward Global Equity Income Fund (the “Fund”) returned -2.38%. The return for the global market as represented by the S&P Global 1200 Index (the “Benchmark”) was 3.83% for the same period. For dividend income comparison purposes, the MSCI World High Dividend Yield Index returned 1.84%.
Positive and Negative Contributors to Performance
The Fund’s allocation at the end of the period was 61.7% U.S. and 38.3% international with international stocks outperforming their domestic counterparts during the year.
Negative contributors to relative performance included Pan American Silver Corp. (0.66% of total net assets), which dropped -40.48% during the period held. The company, which operates nine mines in Argentina, Bolivia, Canada, Mexico and Peru, suffered from ongoing pandemic issues that continued to affect its workforce. While gold and silver production remained essentially flat, inflationary pressures drove mining costs higher. Shares of Advance Auto Parts, Inc. (1.21% of total net assets) declined -34.52% during the period. The aftermarket automotive products company lost share during the period as they were faced with inventory availability headwinds coupled with softer than expected demand from do-it-yourself customers. Management worked to improve margins as the company transitioned to offering a larger percentage of owned brands vs. national brands. Relative performance was also negatively impacted by NVIDIA Corp., Microsoft Corp., and Apple Inc. These stocks, which are in the Benchmark, rose 49.75%, 11.82%, and 8.28%, respectively, during the period, but were excluded from the Fund as their dividend yields failed to meet a longstanding Fund requirement that stocks in the portfolio must demonstrate a higher yield within their respective sector.
Positive relative performance for the fiscal year was led by Petroleo Brasileiro SA (1.86% of total net assets), which rose 26.75% during the period. Free cash flow for the oil and gas company has improved materially from the 2011-15 oil cycle due to lower upstream capital expenditure needs as well as positive margins in the refining business. For investors, this strength more than offset concerns regarding changes in the C-suite and Board of Directors. Ritchie Bros. Auctioneers Inc. (0.48% of total net assets), a Canadian company selling industrial equipment through onsite and online auctions, rose 27.38% during the period held. Improved pricing for commercial assets such as earthmoving equipment, tractors and trailers, oil and gas equipment, as well as construction and heavy machinery helped earnings beat consensus expectations and drove free cash flow to record levels.
Performance of the Fund can also be affected by the values-based investment policies. Compensating for a specific restricted industry or company whose total return deviates dramatically from the Benchmark is difficult regardless of its weight within the Benchmark. For the year ended April 30, 2023, the Fund’s values-based investment policies had a slightly positive impact on performance.
Looking Ahead
In the face of very aggressive monetary policy, domestic and international markets have held up remarkably well since the start of this new year. Both the S&P 500 Index and the Benchmark were up more than 9% over the first four months of this year. Yet the global economy continues to battle inflationary pressures in many parts of the world and significant geopolitical risks continue to be a worry. Expectations for Fed policy decisions remain mixed, tightening credit standards will likely impact company earnings, and fears of a recession loom in investors minds. Yet the market is trading at more than 18x forward earnings when inflation is still well above 4% and earnings are declining year over year. These challenges do offer opportunity for investing in a dividend strategy. Historically, dividends have contributed meaningfully to investors’ total return. We will continue to invest in high-quality, dividend paying companies with strong, free cash flow that support growing dividends and favorable earnings. We believe these stocks will provide downside protection and outperform over a full market cycle.
Principal Investment Strategy
The Fund pursues its investment objective through investment in U.S. and non-U.S. dividend-paying stocks that have demonstrated above-median yield and a positive trend in dividend payouts and favorable earnings growth, subject to the limitations of the Fund’s values-based screening policies. The Fund invests primarily in common stocks of companies that represent a broad spectrum of the
global economy and a range of market capitalizations, including large-cap, mid-cap and small-cap. The Fund may also invest in other investment companies and real estate investment trusts. The Fund will invest in dividend-paying securities of issuers throughout the world and the Fund will generally seek to have 30% to 50% of its net assets, and, under normal market conditions, no less than 30% of its net assets, invested in securities of non-U.S. issuers.
Under normal market conditions, the Fund will invest at least 80% (measured at the time of investment) of the value of its net assets, plus the amount of any borrowings for investment purposes, either directly or through other investment companies, in dividend-paying securities. The Fund will also, under normal market conditions, invest at least 80% (measured at the time of investment) of the value of its net assets, plus the amount of any borrowings for investment purposes, either directly or through other investment companies, in equity securities. The Fund may invest up to 80% of its total assets in securities of non-U.S. issuers and no more than 40% of its total assets in securities of companies in emerging market countries.
STEWARD INTERNATIONAL ENHANCED INDEX FUND
Portfolio Management: Brent Lium, CFA, Managing Director, and Ryan Caylor, CFA, Head of Research
Fund and Market Performance (Unaudited)
(Institutional Class Shares)
For the fiscal year that ended April 30, 2023, the total return for the Steward International Enhanced Index Fund (the “Fund”) was 3.82%. When compared against the 6.22% total return of the S&P Global 1200 ADR Index (the ”Benchmark”), the Fund underperformed by 240 basis points. The Fund’s dual market strategy – which allocates to both non-U.S. developed market (“DM”) ADR securities and to emerging market (“EM”) ADR securities – remained unchanged throughout the year at 85% non-U.S. DM and 15% EM. These allocation weights continue to represent our relatively neutral outlook between non-U.S. DM and EM going forward.
Positive and Negative Contributors to Performance
The allocation to EM drove 110 basis points of Fund underperformance during the year that ended April 30, 2023, as EM ADRs returned -1.09% representing 731 basis points of underperformance relative to the Benchmark. Much of the underperformance in EM ADRs was due to the exposure from Chinese stocks. Individual EM ADR stocks in the portfolio that provided the biggest detractions from relative performance versus the Benchmark included Alibaba Group Holding Ltd. (-12.77% total return), JD.com, Inc. (-39.83% total return), and NIO, Inc. (-52.87% total return).
Another sub-component affecting the Fund’s net performance relative to the Benchmark is the Fund’s values-based screens. For the year that ended April 30, 2023, the companies included in the Fund’s values-based screens represented an average of approximately 19% of the Benchmark’s market capitalization. Not owning these screened-out companies had a -125 basis point net impact on the Fund’s performance relative to the Benchmark. Overall, our restriction on stem cell research and abortion-related securities accounted for nearly all of the net negative impact, while the alcohol and tobacco screens provided a smaller negative net impact.
Looking Ahead
Looking forward, given the significant underperformance of the EMs over the last two years, we would expect that to mean revert at some point. We are monitoring fundamental and geopolitical issues as we look for an opportunity to take advantage of the weakness in the EMs. On the fundamental side, we are monitoring factors like the strength of the U.S. dollar, interest rates, global economic growth, and the volatility in commodity prices as all have outsized impacts on EM economies. In addition, we are monitoring the tensions between China and Taiwan given the exposure they have in EM indices.
Principal Investment Strategy
The Fund pursues its objective by seeking to enhance its performance over that of its primary benchmark index by 1) changing the relative weighting in the Fund’s portfolio of equity securities of developed market companies and of EM companies, and 2) utilizing computer-aided, quantitative analysis of valuation, growth, dividend yield, industry, and other factors to attempt to compensate for the exclusion of certain index securities due to the Fund’s values-based screening policies.
Under normal circumstances, the Fund will invest at least 80% of its assets in the securities of companies included in the Fund’s primary benchmark and will invest at least 80% of its assets in the securities of non-U.S. companies. The Fund’s investments are allocated in an attempt to match the characteristics of a blend of the primary benchmark with varied weightings from time to time of a secondary broad-based index that includes only securities of issuers in EM countries.
STEWARD LARGE CAP CORE FUND
Portfolio Management: Robert C. Doll, CFA, Chief Investment Officer, and Ryan Caylor, CFA, Head of Research
Fund and Market Performance (Unaudited)
(Institutional Class Shares)
For the fiscal year ended April 30, 2023, the Steward Large Cap Core Fund (the “Fund”) returned 0.67%, underperforming the benchmark Russell 1000 Index return of 1.82% by 115 basis points.
Positive and Negative Contributors to Performance
The largest positive contributors to performance were stock selection in healthcare (109 basis points) and consumer discretionary (64 basis points), while stock selection in industrials (-117 basis points) and information technology (-51 basis points) detracted from performance. Our best stocks were underweighting Tesla, Inc. (46 basis points), Gilead Sciences, Inc. (40 basis points), and Cardinal Health, Inc. (39 basis points); our worst performers included Kohl’s Corp. (-52 basis points), underweighting Nvidia Corp. (-49 basis points), and underweighting Exxon Mobil Corp. (-36 basis points).
Current Positioning
We continue to favor companies that have reasonable valuations with strong earnings and cash flow profiles. Our largest sector overweights are consumer discretionary (especially specialty retail) and information technology (especially software); our largest sector underweights are communication services and consumer staples. Our largest factor bets are pro-management quality and profitability and anti-size.
Looking Ahead
The rally in U.S. stocks over the past month or so reflects better than expected Q1 earnings and investor expectations of interest rate cuts over the coming year. (The soft-landing story.) We believe a soft economic landing remains unlikely. It is only possible, in our view, if inflation soon falls close to the Fed’s 2% target, permitting the Fed to cut interest rates back to neutral levels, before the labor market weakens enough that the U.S. economy slips into recession. It is also unlikely, in our view, that financial markets are priced for a recession. We believe forward earnings have not yet adjusted to what is likely to be a double-digit percentage peak-to-trough decline in earnings during a recession, and the U.S. forward equity risk premium is below its historical average. Outside the U.S., the valuation picture for stocks is more attractive than in the U.S. Global ex-U.S. stocks may fare better versus the U.S. over the coming few years. These views warrant a cautious position toward equities and a neutral position toward fixed income, implying some cash (or short-term fixed income) is also in order.
Principal Investment Strategy
The Fund’s principal investment strategy is to invest in a portfolio of large-cap equity securities, subject to limitations of the Fund’s values-based screening policies. Under normal market conditions, the Fund invests at least 80% of its assets in the securities of large-cap companies. The Fund’s benchmark index is the Russell 1000 Index. Substantially all of the equity securities in which the Fund invests will be included in the Fund’s benchmark index at the time of purchase.
Portfolio management will select securities using an investment process that combines quantitative techniques, fundamental analysis and risk management. Securities generally are added to the portfolio based both on security rankings provided by multi-factor quantitative models and on fundamental analysis of the securities. In addition, portfolio management will utilize risk management techniques to establish constraints on the amounts invested in individual securities and sectors. Portfolio management will generally sell a security if its model ranking declines significantly or research reveals a significant deterioration of the company’s fundamentals.
Portfolio management may consider among other factors, a company’s valuation, financial strength, growth potential, competitive position in its industry, projected future earnings, cash flows and dividends when deciding whether to buy or sell investments. With respect to security rankings provided by the multi-factor quantitative models, the models include a values-based component for ranking companies.
STEWARD LARGE CAP GROWTH FUND
Portfolio Management: Robert C. Doll, CFA, Chief Investment Officer, and Ryan Caylor, CFA, Head of Research
Fund and Market Performance (Unaudited)
(Institutional Class Shares)
For the fiscal year ended April 30, 2023, the Steward Large Cap Growth Fund (the “Fund”) returned 0.41%, underperforming the benchmark Russell 1000 Growth Index return of 2.34% by 193 basis points.
Positive and Negative Contributors to Performance
The largest positive contributor to performance was stock selection in technology; our largest negative contributors were overweighting real estate and underweighting healthcare. Our best stocks were Cardinal Health, Inc. (42 basis points), underweighting Tesla, Inc. (36 basis points), and Ulta Beauty, Inc. (36 basis points); our worst performers included underweighting Nividia Corp. (-48 basis points), Nordstrom, Inc. (-39 basis points), and Western Union, Co. (-36 basis points).
Current Positioning
We continue to favor companies that have reasonable valuations with strong earnings and cash flow profiles. Our largest sector overweights are financials (especially financial services) and real estate; our largest sector underweights are consumer staples and communication services. Our largest factor bets are pro-management quality and anti-size.
Looking Ahead
The rally in U.S. stocks over the past month or so reflects better than expected Q1 earnings and investor expectations of interest rate cuts over the coming year. (The soft-landing story.) We believe a soft economic landing remains unlikely. It is only possible in our view if inflation soon falls close to the Fed’s 2% target, permitting the Fed to cut interest rates back to neutral levels, before the labor market weakens enough that the U.S. economy slips into recession. It is also unlikely in our view that financial markets are priced for a recession. We believe forward earnings have not yet adjusted to what is likely to be a double-digit percentage peak-to-trough decline in earnings during a recession, and the U.S. forward equity risk premium is below its historical average. Outside the U.S., the valuation picture for stocks is more attractive than in the U.S. Global ex-U.S. stocks may fare better versus the U.S. over the coming few years. These views warrant a cautious position toward equities and a neutral position toward fixed income, implying some cash (or short-term fixed income) is also in order.
Principal Investment Strategy
The Fund’s principal investment strategy is to invest in a portfolio of large-cap growth securities, subject to limitations of the Fund’s values-based screening policies. Under normal market conditions, the Fund invests at least 80% of its assets in securities of large-cap companies. The Fund’s benchmark index is the Russell 1000 Growth Index. Substantially all of the equity securities in which the Fund invests will be included in the Fund’s benchmark index at the time of purchase. The Fund invests primarily in securities that are considered by portfolio management to have potential for earnings or revenue growth.
Portfolio management will select securities using an investment process that combines quantitative techniques, fundamental analysis and risk management. Securities generally are added to the portfolio based both on security rankings provided by multi-factor quantitative models and on fundamental analysis of the securities. In addition, portfolio management will utilize risk management techniques to establish constraints on the amounts invested in individual securities and sectors. Portfolio management will generally sell a security if its model ranking declines significantly or research reveals a significant deterioration of the company’s fundamentals.
Portfolio management may consider among other factors, a company’s valuation, financial strength, growth potential, competitive position in its industry, projected future earnings, cash flows and dividends when deciding whether to buy or sell investments. With respect to security rankings provided by the multi-factor quantitative models, the models include a values-based component for ranking companies.
STEWARD LARGE CAP VALUE FUND
Portfolio Management: Robert C. Doll, CFA, Chief Investment Officer, and Ryan Caylor, CFA, Head of Research
Fund and Market Performance (Unaudited)
(Institutional Class Shares)
For the fiscal year ended April 30, 2023, the Steward Large Cap Value Fund (the “Fund”) returned 0.71%, underperforming the benchmark Russell 1000 Value Index return of 1.21% by 50 basis points.
Positive and Negative Contributors to Performance
The largest positive contributors to performance were healthcare (191 basis points) and financials (89 basis points), while stock selection in industrials (-125 basis points) and consumer discretionary (-52 basis points) detracted from performance. Our best stocks were Biogen, Inc. (42 basis points), Marathon Petroleum Corp. (42 basis points), and Gilead Sciences, Inc. (40 basis points); our worst performers included Kohl’s Corp. (-53 basis points), Intel Corp. (-40 basis points), and Jones Lang Lasalle, Inc. (-40 basis points).
Current Positioning
We continue to favor companies that have reasonable valuations with strong earnings and cash flow profiles. Our largest sector overweights are consumer discretionary (especially specialty retail) and information technology (especially software); our largest sector underweights are communication services and utilities. Our largest factor bets are pro-management quality and profitability and anti-size.
Looking Ahead
The rally in U.S. stocks over the past month or so reflects better than expected Q1 earnings and investor expectations of interest rate cuts over the coming year. (The soft-landing story.) We believe a soft economic landing remains unlikely. It is only possible in our view if inflation soon falls close to the Fed’s 2% target, permitting the Fed to cut interest rates back to neutral levels, before the labor market weakens enough that the U.S. economy slips into recession. It is also unlikely in our view that financial markets are priced for a recession. We believe forward earnings have not yet adjusted to what is likely to be a double-digit percentage peak-to-trough decline in earnings during a recession, and the U.S. forward equity risk premium is below its historical average. Outside the U.S., the valuation picture for stocks is more attractive than in the U.S. Global ex-U.S. stocks may fare better versus the U.S. over the coming few years. These views warrant a cautious position toward equities and a neutral position toward fixed income, implying some cash (or short-term fixed income) is also in order.
Principal Investment Strategy
The Fund’s principal investment strategy is to invest in a portfolio of large-cap value securities, subject to limitations of the Fund’s values-based screening policies. Under normal market conditions, the Fund invests at least 80% of its assets in securities of large-cap companies. The Fund’s benchmark index is the Russell 1000 Value Index. Substantially all of the equity securities in which the Fund invests will be included in the Fund’s benchmark index at the time of purchase. The Fund invests primarily in securities that are considered by portfolio management to be undervalued with good prospects for capital appreciation.
Portfolio management will select securities using an investment process that combines quantitative techniques, fundamental analysis and risk management. Securities generally are added to the portfolio based both on security rankings provided by multi-factor quantitative models and on fundamental analysis of the securities. In addition, portfolio management will utilize risk management techniques to establish constraints on the amounts invested in individual securities and sectors. Portfolio management will generally sell a security if its model ranking declines significantly or research reveals a significant deterioration of the company’s fundamentals.
Portfolio management may consider among other factors, a company’s valuation, financial strength, growth potential, competitive position in its industry, projected future earnings, cash flows and dividends when deciding whether to buy or sell investments. With respect to security rankings provided by the multi-factor quantitative models, the models include a values-based component for ranking companies.
STEWARD SELECT BOND FUND
Portfolio Management: Victoria L. Fernandez, CFA, Chief Market Strategist

Fund and Market Performance (Unaudited)
(Institutional Class Shares)
For the fiscal year ended April 30, 2023, the Steward Select Bond Fund (the “Fund”) outperformed the Bloomberg U.S. Government/Credit Bond Index (the “Benchmark”) by 30 basis points, returning 0.04% and -0.26%, respectively.
Positive and Negative Contributors to Performance
For the fiscal year that ended April 30, 2023, there was tremendous volatility in the fixed-income markets as central banks around the globe wrestled with higher inflation and the resulting higher interest rates. Throughout this time period, the Federal Reserve continuously raised the Fed Funds rate as it struggled against sticky inflation, especially in the rent and housing sector, and a strong labor market that added wage pressure to the inflation mix. The Federal Reserve raised rates over 400 basis points while trying to fulfill their dual mandate of full employment and price stability. As the markets tried to anticipate the moves of not only the Federal Reserve but all central banks, yield volatility was at an all-time high.
For the Fund, the effects of a shorter duration positioning, the choice of bonds within the corporate sector, and the elevated levels of income associated with the Fund holdings were the largest positive contributors to the outperformance of the Fund as compared to the Benchmark. A shorter duration lessened the exposure of the Fund to market value fluctuations as yields vacillated over the past 12 months with a low during the time period of around 2.6% in August of 2022, up to a high of about 4.23% in October 2022, settling around 3.43% to finish off the 12-month period ended April 30, 2023. Cash was actually the best performing sector followed by the corporate sector on an absolute basis, while the overweight to the corporate sector made that the largest contribution to total return for the Fund. Some of the best performing holdings were the shorter duration corporate bonds like Oracle Corp., FiServ, Inc., and Salesforce, Inc. Due to the strong performance by the energy sector, Valero Energy Corp. was also one of the best performers for the 12-month period. The laggards in the portfolio were all associated with having long durations regardless of sector, including holdings like Sherwin-Williams Co., long maturity U.S. Treasury Notes, and Agency Mortgage-Backed Obligations where higher rates increased the duration of these bonds.
Looking Ahead
With the expectation that the October 2022 move in yields could be the peak for the cycle, our goal was to begin moving closer to neutral in our duration positioning. We made progress on that in 2022, although we have had duration come back down some in 2023 as we have taken advantage of higher yields on the short end of the curve due to the current curve inversion and a Federal Reserve continuing to raise the Fed Funds rate. As yields begin to normalize on the short end of the curve, we intend to reinvest those funds back out the yield curve increasing duration once again. The focus and resulting overweight to investment-grade corporate holdings are expected to continue until such time corporate spreads signal a change in course is necessary. This will be implemented through the investment process we utilize for the strategy that incorporates duration targets, yield-curve expectations, sector selection, and security selection.
Principal Investment Strategy
The Fund invests primarily in fixed-income securities, including, but not limited to, corporate bonds, mortgage-backed securities and government and agency bonds and notes, subject to the limitations of the Fund’s values-based screening policies. The Fund’s investments may include U.S. dollar-denominated instruments issued in the U.S. by foreign banks and branches and foreign corporations. Other security types may include fixed-rate preferred stock and municipal bonds. Normally, the Fund will invest at least 80% (measured at the time of investment) of the value of its net assets, plus the amount of any borrowings for investment purposes, either directly or through other investment companies, in these types of instruments.
STEWARD SMALL CAP GROWTH FUND
Portfolio Management: Brent Lium, CFA, Managing Director
Fund and Market Performance (Unaudited)
(Institutional Class Shares)
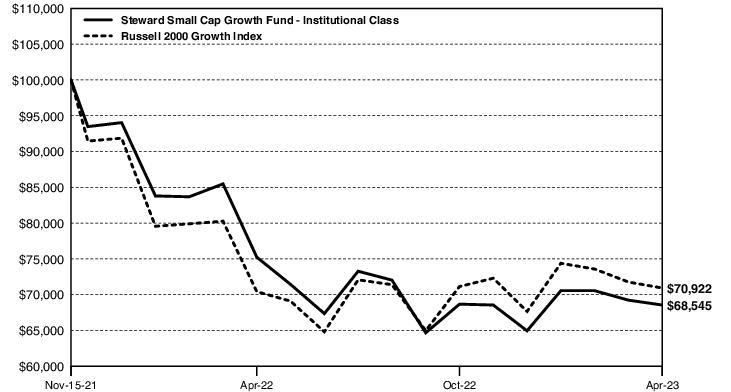
For the fiscal year ended April 30, 2023, the Steward Small Cap Growth Fund returned -8.88%. For comparison purposes, the return for the Russell 2000 Growth Index for the same period was 0.72%.
Positive and Negative Contributors to Performance
The time period was extremely rough for companies with high price-to-earnings ratios and/or companies that are low or no profit today but high profit in the future. As the Fed raised interest rates at unprecedented speed, the value of future earnings was diminished and therefore the valuation of those companies suffered. We believe that the Fund’s investment strategy that focuses on secular growth, better business models, and strong balance sheets will lead to outperformance over the long term.
While there were several macro factors affecting the market, like a slowing economy, strengthening U.S. dollar, volatile commodity prices, and high inflation, in small caps, as noted above, the overwhelming factor was the Fed’s rapid increase of interest rates.
Negative contributors to relative performance included SilverGate Capital Corp. (“SilverGate”), down -95.11%, and DigitalBridge Group, Inc. (“DigitalBridge”), down -26.44%, which were caught in the regional bank runs that also bankrupted Silicon Valley Bank and First Republic Bank. While we don’t own any traditional banks for that reason amongst others, SilverGate is not a traditional bank. 85-90% of their revenue resulted from the fees from operating a money transfer network allowing 24/7 transfers between digital currency focused banks, exchanges, and institutional clients. Traditional bank transfer networks do not operate 24/7 leaving SilverGate to dominate that market. SilverGate did not own or custody any digital currencies, they simply facilitated U.S. dollar transfers between exchanges, banks, and institutions. We viewed this as a low risk way to participate in the explosive growth of the digital currency markets. We did not anticipate a bank run where their customers pulled billions of dollars out of SilverGate in a very short time frame forcing SilverGate to realize billions in short term losses on their treasury bond holdings to fund the deposits leaving the bank. DigitalBridge, a real estate investment trust (“REIT”) focused on owning digital infrastructure like datacenters and cell towers, suffered like most REITs as the value of its future cash flow and dividends was diminished by higher interest rates. We sold both securities.
Shockwave Medical Inc. (“Shockwave Medical”), up 91.99%, and World Wrestling Entertainment Inc. (“World Wrestling Entertainment”), up 84.78%, were our top positive contributors. Shockwave Medical continued to grow revenue and earnings strongly during the time period. Revenues grew over 100% in 2022 and we expect revenues to grow approximately 50% in 2023. They offer a patented medical procedure that utilizes sound waves to treat calcified plaque in arteries (similar to how kidney stones are treated) instead of other procedures like angioplasty. We believe their procedure will become the standard of care and Shockwave will see years of strong growth. World Wrestling Entertainment, the owner and operator of the WWE, had a good year as they continued to run their business well and the value of live entertainment continued to increase. Despite not being fans of watching WWE personally, World Wrestling Entertainment is a great example of the type of companies we like to invest in. They have grown their audiences consistently over the years in addition to the value of their media rights increasing like all sports. They have very high margins with modest capital needs as their largest expense is paying the wrestlers. Lastly, they run the company balance sheet very conservatively with zero net debt. Both companies continue to be in our top 10 holdings.
Looking Ahead
We expect the market to continue to be volatile as it tries to determine if the Fed will successfully engineer the “soft landing” or send the economy into a recession. As data points accumulate pointing towards one outcome versus the other, we expect the market to move in that direction. We will continue to focus on investing companies with visible growth, strong business models, and strong balance sheets as we believe they will be able to outperform over the long term.
Principal Investment Strategy
The Fund’s principal investment strategy is to invest in a portfolio of small cap equity securities, subject to the Fund’s value-based screening policies. Under normal market conditions, the Fund invests at least 80% of its assets in securities of small-cap companies. The Fund’s benchmark is the Russell 2000 Growth Index. The Fund invests primarily in equity securities. The Fund may also invest in other investment companies and up to 15% of its net assets in real estate investment trusts. The Fund invests primarily in securities that are considered by portfolio management to have potential for earnings or revenue growth. The security selection process is based on a three-step process that includes fundamental, valuation and timeliness analysis. Portfolio management considers selling a security if the investment thesis for owning the security is no longer valid, the stock reaches its price target or timeliness factors indicate that the risk/return characteristics of the stock are viewed in the market as no longer attractive. Portfolio management may
consider, among other factors, a company’s valuation, financial strength, growth potential, competitive position in its industry, projected future earnings, cash flows and dividends when deciding whether to buy or sell investments. In making investment decisions, portfolio management will also consider a company’s values-based characteristics.
STEWARD VALUES-FOCUSED LARGE CAP ENHANCED INDEX FUND
Portfolio Management: Brent Lium, CFA, Managing Director, and Ryan Caylor, CFA, Head of Research
Fund and Market Performance (Unaudited)
(Institutional Class Shares)
For the fiscal year ended April 30, 2023, the Steward Values-Focused Large Cap Enhanced Index Fund returned 1.73%. For comparison purposes, the return for the S&P 500 Index (the “Benchmark”) for the same period was 2.66%.
Positive and Negative Contributors to Performance
The Fund implements a strategy to upweight companies that rank at the top of its values-focused composite rankings. At year end, the Fund screened out 9.3% of the Benchmark weight, therefore the Fund upweighted 93 companies by 10 basis points each. That is an increase of 21 companies from a year ago.
Performance of the Fund can also be affected by the Fund’s values-based screening policies. For the year ended April 30, 2023, the values-based screening policies had a slight positive performance impact on the Fund, adding 1 basis point. Not owning companies such as Pfizer, Inc. (embryonic stem cell research), down 18.04%, Johnson & Johnson (embryonic stem cell research), down 6.86%, and UnitedHealth Group, Inc. (abortion), down 1.93%, added 35 basis points to performance. Conversely, not owning companies such as Merck & Co., Inc. (embryonic stem cell research), up 34.07%, General Electric Company (embryonic stem cell research), up 68.79%, and Vertex Pharmaceuticals, Inc. (embryonic stem cell research), up 24.71%, negatively impacted performance by 38 basis points.
Looking Ahead
Based on the most recent economic data, the Fed seems to have successfully capped inflation in our view. However the question now shifts to whether the Fed raising interest rates to fight inflation will send us into recession or if they managed the economy into a soft landing. We expect the market to react accordingly as data points emerge supporting either scenario. The sudden bankruptcy of a few regional banks certainly put a scare in the markets for some time while the continued strength in the U.S. employment numbers has buoyed the stock market. We don’t expect the market to go sustainably in one direction until there is enough data pointing to one scenario.
Principal Investment Strategy
Under normal circumstances, the Fund will invest at least 80% of its assets in the securities of large-cap companies included in the Fund’s benchmark index that pass the Fund’s values-based screens. The Fund is an actively managed fund. The Fund’s investments are allocated in an attempt to match the weightings of the benchmark index, subject to the limitations of the Fund’s values-based screening policies and the reallocation of a portion of each screened security’s weighting in the benchmark index among certain remaining securities of companies that portfolio management believes exhibit positive values-based characteristics.
STEWARD VALUES-FOCUSED SMALL-MID CAP ENHANCED INDEX FUND
Portfolio Management: Brent Lium, CFA, Managing Director, and Ryan Caylor, CFA, Head of Research
Fund and Market Performance (Unaudited)
(Institutional Class Shares)
For the fiscal year ended April 30, 2023, the total return for the Steward Values-Focused Small-Mid Cap Enhanced Index Fund was -1.28%. When compared against the -0.23% total return of the S&P 1000 Index (the “Benchmark”), the Fund underperformed by 105 basis points.
Positive and Negative Contributors to Performance
The Fund implements a strategy to upweight companies that rank at the top of its values-focused composite rankings. At year end, the Fund screened out 3.6% of the Benchmark weight, therefore the Fund upweighted 36 companies by 10 basis points each. That is an increase of 6 companies from a year ago.
Performance of the Fund can also be affected by the Fund’s values-based screening policies. For the year ended April 30, 2023, the values-based screening policies had a slight positive performance impact on the Fund, adding 2 basis points. Not owning companies such as Medical Properties Trust, Inc. (abortion), down 47.35%, Cousins Properties Inc. (abortion), down 36.00%, and The Boston Beer Company, Inc. (alcohol), down 15.33%, added 24 basis points to performance. Conversely, not owning companies such as Churchill Downs Inc. (gambling), up 44.61%, Performance Food Group Co. (alcohol), up 27.29%, and Casey’s General Stores, Inc. (alcohol, tobacco), up 14.44%, negatively impacted performance by 21 basis points.
Looking Ahead
Looking ahead, we expect the market to continue to be driven by economic data points. The market appears to have put several large macro issues behind it, like the Ukraine/Russia conflict, rampant inflation, and Covid related supply chain issues. The Fed first raised rates almost a year ago in an attempt to slow the economy and cool inflation. With the most recent economic data, it seems they have inflation moving in the right direction. However, the concern is if the economy slows too much, we could end up in a recession.
Principal Investment Strategy
Under normal circumstances, the Fund will invest at least 80% of its assets in the securities of small- to mid-cap companies included in the Fund’s benchmark index that pass the Fund’s values-based screens. The Fund is an actively managed fund. The Fund’s investments are allocated in an attempt to match the weightings of the benchmark index, subject to the limitations of the Fund’s values-based screening policies and the reallocation of a portion of each screened security’s weighting in the benchmark index among certain remaining securities of companies that portfolio management believes exhibit positive values-based characteristics.
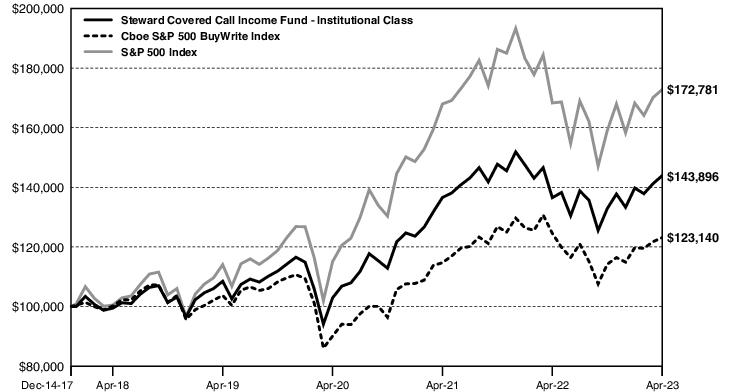
Comparison of Change in Value of a Hypothetical $100,000 Investment in Institutional Class Shares of the Steward Covered Call Income Fund*, the S&P 500 Index**, and the Cboe S&P 500 BuyWrite Index.*** (Unaudited)
Past performance is no guarantee of future results. The performance data quoted represents past performance and current returns may be lower or higher. The investment return and principal value will fluctuate so that an investor’s shares, when redeemed may be worth more or less than original cost. To obtain performance information current to the most recent month end, please call 800-262-6631.
Average Annual Total Return as of April 30, 2023
| | One Year | | Five Year | | Since
Inception**** | | Expense
Ratio‡ |
Steward Covered Call Income Fund — Institutional Class
| 5.41% | | 7.67% | | 7.00% | | 1.00% |
Cboe S&P 500 BuyWrite Index
| -1.12% | | 4.21% | | 3.95% | | N/A |
S&P 500 Index
| 2.66% | | 11.45% | | 10.71% | | N/A |
* The investment return and principal value of an investment will fluctuate and, therefore, an investor’s shares, when redeemed, may be worth more or less than their original cost. The Steward Covered Call Income Fund’s performance assumes the reinvestment of all income dividends and capital gains distributions, if any, but does not reflect the impact of taxes that a shareholder would pay on Fund distributions or the redemption of Fund shares. The performance above reflects any fee reductions during the applicable periods. If such fee reductions had not occurred, the quoted performance would be lower.
** The S&P 500 Index is a capitalization-weighted index of 500 stocks. The index is designed to measure performance of the broad domestic economy through changes in the aggregate market of 500 stocks representing all major industries. All market indices are unmanaged and do not reflect expenses that affect performance results. It is not possible to invest directly in any index. Index returns shown assume the reinvestment of all dividends and distributions, if any.
*** The Cboe S&P 500 BuyWrite Index (‘‘BXM’’) is a capitalization-weighted index of 500 stocks. BXM is a passive total return index based on buying an S& P 500 stock index portfolio and ‘‘writing’’ (or selling) the near-term S&P 500 Index ‘‘covered’’ call option. BXM is designed to show the hypothetical performance of a portfolio that engages in a buy-write strategy using S&P 500 index call options. All market indices are unmanaged and do not reflect expenses that affect performance results. It is not possible to invest directly in any index. Index returns shown assume the reinvestment of all dividends and distributions, if any.
**** Effective date of registration and commencement of operations are the same: December 14, 2017.
‡ See the August 28, 2022 prospectus for details. The expense ratio is as stated in the current prospectus and may differ from the the expense ratio disclosed in the financial highlights in this report.
Comparison of Change in Value of a Hypothetical $100,000 Investment in Institutional Class Shares of the Steward Equity Market Neutral Fund* and the ICE BofA 3 Month U.S. Treasury Bill Index.** (Unaudited)
Past performance is no guarantee of future results. The performance data quoted represents past performance and current returns may be lower or higher. The investment return and principal value will fluctuate so that an investor’s shares, when redeemed may be worth more or less than original cost. To obtain performance information current to the most recent month end, please call 800-262-6631.
Average Annual Total Return as of April 30, 2023
| | One Year | | Since Inception*** | | Expense
Ratio‡ |
Steward Equity Market Neutral Fund — Institutional Class
| 5.28% | | 7.89% | | 3.11% |
ICE BofA 3 Month U.S. Treasury Bill Index
| 2.84% | | 1.99% | | N/A |
* The investment return and principal value of an investment will fluctuate and, therefore, an investor’s shares, when redeemed, may be worth more or less than their original cost. The Steward Equity Market Neutral Fund’s performance assumes the reinvestment of all income dividends and capital gains distributions, if any, but does not reflect the impact of taxes that a shareholder would pay on Fund distributions or the redemption of Fund shares.
** The ICE BofA 3 Month U.S. Treasury Bill Index measures the performance of a single issue of outstanding treasury bill which matures closest to, but not beyond, three months from the rebalancing date. The issue is purchased at the beginning of the month and held for a full month; at the end of the month that issue is sold and rolled into a newly selected issue. All market indices are unmanaged and do not reflect expenses that affect performance results. It is not possible to invest directly in any index. Index returns shown assume the reinvestment of all dividends and distributions, if any.
*** Effective date of registration and commencement of operations are the same: November 15, 2021.
‡ See the August 28, 2022 prospectus for details. The expense ratio is as stated in the current prospectus and may differ from the the expense ratio disclosed in the financial highlights in this report.
Comparison of Change in Value of a Hypothetical $100,000 Investment in Institutional Class Shares of the Steward Global Equity Income Fund*, the S&P Global 1200 Index** and the MSCI World High Dividend Yield Index.*** (Unaudited)
Past performance is no guarantee of future results. The performance data quoted represents past performance and current returns may be lower or higher. The investment return and principal value will fluctuate so that an investor’s shares, when redeemed may be worth more or less than original cost. To obtain performance information current to the most recent month end, please call 800-262-6631.
Average Annual Total Return as of April 30, 2023
| | One Year | | Five Year | | Ten Year | | Expense
Ratio‡ |
Steward Global Equity Income Fund — Institutional Class
| -2.38%^ | | 6.37% | | 8.44% | | 0.99% |
MSCI World High Dividend Yield Index
| 1.84% | | 5.91% | | 6.01% | | N/A |
S&P Global 1200 Index
| 3.83% | | 8.52% | | 9.23% | | N/A |
* The investment return and principal value of an investment will fluctuate and, therefore, an investor’s shares, when redeemed, may be worth more or less than their original cost. The Steward Global Equity Income Fund’s performance assumes the reinvestment of all income dividends and capital gains distributions, if any, but does not reflect the impact of taxes that a shareholder would pay on Fund distributions or the redemption of Fund shares.
** The S&P Global 1200 Index is a global index of 1200 stocks comprised of the following seven S&P regional indices: S&P 500 Index (United States), S&P Europe 350 Index (Europe), S&P/TOPIX 150 Index (Japan), S&P/TSX 60 Index (Canada), S&P/ASX All Australia 50 Index (Australia), S&P Asia 50C Index (Asia Ex-Japan) and the S&P Latin America 40 Index (Latin America). All market indices are unmanaged and do not reflect expenses that affect performance results. It is not possible to invest directly in any index. Index returns shown assume the reinvestment of all dividends and distributions, if any.
*** The MSCI World High Dividend Yield Index is based on the MSCI World Index, its parent index, and includes large and mid cap stocks across 23 Developed Markets countries. The index is designed to reflect the performance of equities in the parent index (excluding REITs) with higher dividend income and quality characteristics than average dividend yields that are both sustainable and persistent. The MSCI World High Dividend Yield Index is the Fund's secondary index. All market indices are unmanaged and do not reflect expenses that affect performance results. It is not possible to invest directly in any index. Index returns shown assume the reinvestment of all dividends and distributions, if any.
^ Performance results do not include adjustments made for financial reporting purposes in accordance with U.S. generally accepted accounting principles and may differ from the amount reported in the Financial Highlights.
‡ See the August 28, 2022 prospectus for details. The expense ratio is as stated in the current prospectus and may differ from the the expense ratio disclosed in the financial highlights in this report.
Comparison of Change in Value of a Hypothetical $100,000 Investment in Institutional Class Shares of the Steward International Enhanced Index Fund* and the S&P Global 1200 ADR Index.** (Unaudited)
Past performance is no guarantee of future results. The performance data quoted represents past performance and current returns may be lower or higher. The investment return and principal value will fluctuate so that an investor’s shares, when redeemed may be worth more or less than original cost. To obtain performance information current to the most recent month end, please call 800-262-6631.
Average Annual Total Return as of April 30, 2023
| | One Year | | Five Year | | Ten Year | | Expense
Ratio‡ |
Steward International Enhanced Index Fund — Institutional Class
| 3.82% | | 2.54% | | 3.18% | | 0.76% |
S&P Global 1200 ADR Index
| 6.22% | | 4.65% | | 4.54% | | N/A |
* The investment return and principal value of an investment will fluctuate and, therefore, an investor’s shares, when redeemed, may be worth more or less than their original cost. The Steward International Enhanced Index Fund’s performance assumes the reinvestment of all income dividends and capital gains distributions, if any, but does not reflect the impact of taxes that a shareholder would pay on Fund distributions or the redemption of Fund shares.
** The S&P Global 1200 ADR Index, the Fund’s designated broad-based index, is based on the non-U.S. stocks comprising the S&P Global 1200 Index. The index is made up of those companies from the S&P Global 1200 Index that offer either Level II or Level III ADRs, global shares or ordinary shares in the case of Canadian equities. The index was developed with a base value of 1000 on December 31, 1997. All market indices are unmanaged and do not reflect expenses that affect performance results. It is not possible to invest directly in any index. Index returns shown assume the reinvestment of all dividends and distributions, if any.
‡ See the August 28, 2022 prospectus for details. The expense ratio is as stated in the current prospectus and may differ from the the expense ratio disclosed in the financial highlights in this report.
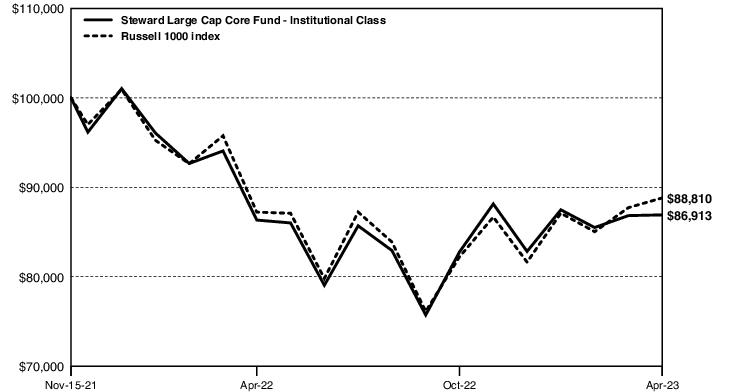
Comparison of Change in Value of a Hypothetical $100,000 Investment in Institutional Class Shares of the Steward Large Cap Core Fund* and the Russell 1000 Index** (Unaudited)
Past performance is no guarantee of future results. The performance data quoted represents past performance and current returns may be lower or higher. The investment return and principal value will fluctuate so that an investor’s shares, when redeemed may be worth more or less than original cost. To obtain performance information current to the most recent month end, please call 800-262-6631.
Average Annual Total Return as of April 30, 2023
| | One Year | | Since Inception*** | | Expense
Ratio‡ |
Steward Large Cap Core Fund — Institutional Class
| 0.67% | | -9.19% | | 0.75% |
Russell 1000 Index
| 1.82% | | -7.83% | | N/A |
* The investment return and principal value of an investment will fluctuate and, therefore, an investor’s shares, when redeemed, may be worth more or less than their original cost. The Steward Large Cap Core Fund’s performance assumes the reinvestment of all income dividends and capital gains distributions, if any, but does not reflect the impact of taxes that a shareholder would pay on Fund distributions or the redemption of Fund shares. The performance above reflects any fee reductions during the applicable periods. If such fee reductions had not occurred, the quoted performance would be lower.
** The Russell 1000 Index measures the performance of the large-cap segment of the US equity universe. It is a subset of the Russell 3000 Index and includes approximately 1,000 of the largest securities based on a combination of their market cap and current index membership. The Russell 1000 represents approximately 93% of the US market. It is constructed to provide a comprehensive and unbiased barometer for the large-cap segment and is completely reconstituted annually to ensure new and growing equities are included. All market indices are unmanaged and do not reflect expenses that affect performance results. It is not possible to invest directly in any index. Index returns shown assume the reinvestment of all dividends and distributions, if any.
*** Effective date of registration and commencement of operations are the same: November 15, 2021.
‡ See the August 28, 2022 prospectus for details. The expense ratio is as stated in the current prospectus and may differ from the the expense ratio disclosed in the financial highlights in this report.
Comparison of Change in Value of a Hypothetical $100,000 Investment in Institutional Class Shares of the Steward Large Cap Growth Fund* and the Russell 1000 Growth Index** (Unaudited)
Past performance is no guarantee of future results. The performance data quoted represents past performance and current returns may be lower or higher. The investment return and principal value will fluctuate so that an investor’s shares, when redeemed may be worth more or less than original cost. To obtain performance information current to the most recent month end, please call 800-262-6631.
Average Annual Total Return as of April 30, 2023
| | One Year | | Since Inception*** | | Expense
Ratio‡ |
Steward Large Cap Growth Fund — Institutional Class
| 0.41% | | -11.95% | | 0.75% |
Russell 1000 Growth Index
| 2.34% | | -12.32% | | N/A |
* The investment return and principal value of an investment will fluctuate and, therefore, an investor’s shares, when redeemed, may be worth more or less than their original cost. The Steward Large Cap Growth Fund’s performance assumes the reinvestment of all income dividends and capital gains distributions, if any, but does not reflect the impact of taxes that a shareholder would pay on Fund distributions or the redemption of Fund shares. The performance above reflects any fee reductions during the applicable periods. If such fee reductions had not occurred, the quoted performance would be lower.
** The Russell 1000 Growth Index measures the performance of the large cap growth segment of the US equity universe. It includes those Russell 1000 companies with relatively higher price-to-book ratios, higher I/B/E/S forecast medium term (2 year) growth and higher sales per share historical growth (5 years). The Russell 1000 Growth Index is constructed to provide a comprehensive and unbiased barometer for the large-cap growth segment. The index is completely reconstituted annually to ensure new and growing equities are included and that the represented companies continue to reflect growth characteristics. All market indices are unmanaged and do not reflect expenses that affect performance results. It is not possible to invest directly in any index. Index returns shown assume the reinvestment of all dividends and distributions, if any.
*** Effective date of registration and commencement of operations are the same: November 15, 2021.
‡ See the August 28, 2022 prospectus for details. The expense ratio is as stated in the current prospectus and may differ from the the expense ratio disclosed in the financial highlights in this report.
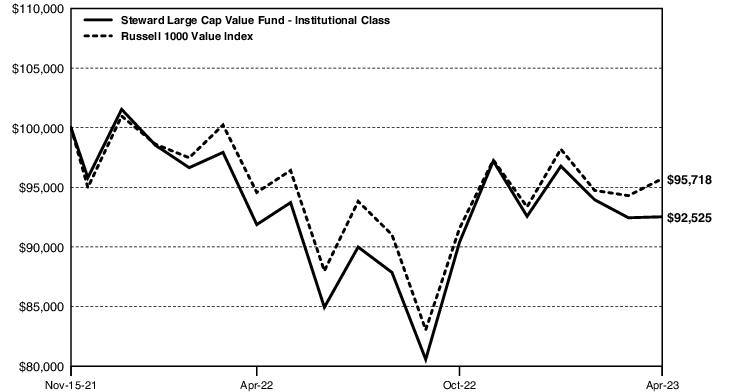
Comparison of Change in Value of a Hypothetical $100,000 Investment in Institutional Class Shares of the Steward Large Cap Value Fund* and Russell 1000 Value Index** (Unaudited)
Past performance is no guarantee of future results. The performance data quoted represents past performance and current returns may be lower or higher. The investment return and principal value will fluctuate so that an investor’s shares, when redeemed may be worth more or less than original cost. To obtain performance information current to the most recent month end, please call 800-262-6631.
Average Annual Total Return as of April 30, 2023
| | One Year | | Since Inception*** | | Expense
Ratio‡ |
Steward Large Cap Value Fund — Institutional Class
| 0.71% | | -5.20% | | 0.75% |
Russell 1000 Value Index
| 1.21% | | -2.96% | | N/A |
* The investment return and principal value of an investment will fluctuate and, therefore, an investor’s shares, when redeemed, may be worth more or less than their original cost. The Steward Large Cap Value Fund’s performance assumes the reinvestment of all income dividends and capital gains distributions, if any, but does not reflect the impact of taxes that a shareholder would pay on Fund distributions or the redemption of Fund shares. The performance above reflects any fee reductions during the applicable periods. If such fee reductions had not occurred, the quoted performance would be lower.
** The Russell 1000 Value Index measures the performance of the large-cap value segment of the US equity universe. It includes those Russell 1000 companies with relatively lower price-to-book ratios, lower I/B/E/S forecast medium term (2 year) growth and lower sales per share historical growth (5 years). The Russell 1000 Value Index is constructed to provide a comprehensive and unbiased barometer for the large-cap value segment. The index is completely reconstituted annually to ensure new and growing equities are included and that the represented companies continue to reflect value characteristics. All market indices are unmanaged and do not reflect expenses that affect performance results. It is not possible to invest directly in any index. Index returns shown assume the reinvestment of all dividends and distributions, if any.
*** Effective date of registration and commencement of operations are the same: November 15, 2021.
‡ See the August 28, 2022 prospectus for details. The expense ratio is as stated in the current prospectus and may differ from the the expense ratio disclosed in the financial highlights in this report.
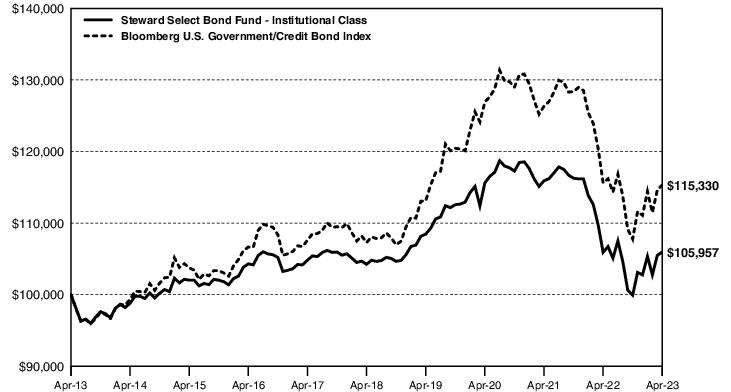
Comparison of Change in Value of a Hypothetical $100,000 Investment in Institutional Class Shares of the Steward Select Bond Fund* and the Bloomberg U.S. Government/Credit Bond Index.** (Unaudited)
Past performance is no guarantee of future results. The performance data quoted represents past performance and current returns may be lower or higher. The investment return and principal value will fluctuate so that an investor’s shares, when redeemed may be worth more or less than original cost. To obtain performance information current to the most recent month end, please call 800-262-6631.
Average Annual Total Return as of April 30, 2023
| | One Year | | Five Year | | Ten Year | | Expense
Ratio‡ |
Steward Select Bond Fund — Institutional Class
| 0.04% | | 0.33% | | 0.58% | | 0.72% |
Bloomberg U.S. Government/Credit Bond Index
| -0.26% | | 1.46% | | 1.44% | | N/A |
* The investment return and principal value of an investment will fluctuate and, therefore, an investor’s shares, when redeemed, may be worth more or less than their original cost. The Steward Select Bond Fund’s performance assumes the reinvestment of all income dividends and capital gains distributions, if any, but does not reflect the impact of taxes that a shareholder would pay on Fund distributions or the redemption of Fund shares.
** The Bloomberg U.S. Government/Credit Bond Index represents the government portion of the index, and includes publicly issued U.S. corporate and foreign debentures and secured notes that meet specified maturity, liquidity and quality requirements to represent the credit interests. All market indices are unmanaged and do not reflect expenses that affect performance results. It is not possible to invest directly in any index. Index returns shown assume the reinvestment of all dividends and distributions, if any.
‡ See the August 28, 2022 prospectus for details. The expense ratio is as stated in the current prospectus and may differ from the the expense ratio disclosed in the financial highlights in this report.
Comparison of Change in Value of a Hypothetical $100,000 Investment in Institutional Class Shares of the Steward Small Cap Growth Fund* and the Russell 2000 Growth Index** (Unaudited)
Past performance is no guarantee of future results. The performance data quoted represents past performance and current returns may be lower or higher. The investment return and principal value will fluctuate so that an investor’s shares, when redeemed may be worth more or less than original cost. To obtain performance information current to the most recent month end, please call 800-262-6631.
Average Annual Total Return as of April 30, 2023
| | One Year | | Since Inception*** | | Expense
Ratio‡ |
Steward Small Cap Growth Fund — Institutional Class
| -8.88% | | -22.86% | | 1.00% |
Russell 2000 Growth Index
| 0.72% | | -21.04% | | N/A |
* The investment return and principal value of an investment will fluctuate and, therefore, an investor’s shares, when redeemed, may be worth more or less than their original cost. The Steward Small Cap Growth Fund’s performance assumes the reinvestment of all income dividends and capital gains distributions, if any, but does not reflect the impact of taxes that a shareholder would pay on Fund distributions or the redemption of Fund shares. The performance above reflects any fee reductions during the applicable periods. If such fee reductions had not occurred, the quoted performance would be lower.
** The Russell 2000 Growth Index measures the performance of the small-cap growth segment of the US equity universe. It includes those Russell 2000 companies with relatively higher price-to-book ratios, higher I/B/E/S forecast medium term (2 year) growth and higher sales per share historical growth (5 years). The Russell 2000 Growth Index is constructed to provide a comprehensive and unbiased barometer for the small-cap growth segment. The index is completely reconstituted annually to ensure new and growing equities are included and that the represented companies continue to reflect growth characteristics. All market indices are unmanaged and do not reflect expenses that affect performance results. It is not possible to invest directly in any index. Index returns shown assume the reinvestment of all dividends and distributions, if any.
*** Effective date of registration and commencement of operations are the same: November 15, 2021.
‡ See the August 28, 2022 prospectus for details. The expense ratio is as stated in the current prospectus and may differ from the the expense ratio disclosed in the financial highlights in this report.
Comparison of Change in Value of a Hypothetical $100,000 Investment in Institutional Class Shares of the Steward Values-Focused Large Cap Enhanced Index Fund* and the S&P 500 Index.** (Unaudited)
Past performance is no guarantee of future results. The performance data quoted represents past performance and current returns may be lower or higher. The investment return and principal value will fluctuate so that an investor’s shares, when redeemed may be worth more or less than original cost. To obtain performance information current to the most recent month end, please call 800-262-6631.
Average Annual Total Return as of April 30, 2023
| | One Year | | Five Year | | Ten Year | | Expense
Ratio‡ |
Steward Values-Focused Large Cap Enhanced Index Fund — Institutional Class
| 1.73% | | 9.36% | | 10.92% | | 0.58% |
S&P 500 Index
| 2.66% | | 11.45% | | 12.20% | | N/A |
* The investment return and principal value of an investment will fluctuate and, therefore, an investor’s shares, when redeemed, may be worth more or less than their original cost. The Steward Values-Focused Large Cap Enhanced Index Fund’s performance assumes the reinvestment of all income dividends and capital gains distributions, if any, but does not reflect the impact of taxes that a shareholder would pay on Fund distributions or the redemption of Fund shares. Prior to October 29, 2021, the Fund had a different investment strategy. Performance would have been different if the Fund's current investment strategy had been in effect.
** The S&P 500 Index is a capitalization-weighted index of 500 stocks. The index is designed to measure performance of the broad domestic economy through changes in the aggregate market of 500 stocks representing all major industries. All market indices are unmanaged and do not reflect expenses that affect performance results. It is not possible to invest directly in any index. Index returns shown assume the reinvestment of all dividends and distributions, if any.
‡ See the August 28, 2022 prospectus for details. The expense ratio is as stated in the current prospectus and may differ from the the expense ratio disclosed in the financial highlights in this report.
Comparison of Change in Value of a Hypothetical $100,000 Investment in Institutional Class Shares of the Steward Values-Focused Small-Mid Cap Enhanced Index Fund* and the S&P 1000 Index.** (Unaudited)
Past performance is no guarantee of future results. The performance data quoted represents past performance and current returns may be lower or higher. The investment return and principal value will fluctuate so that an investor’s shares, when redeemed may be worth more or less than original cost. To obtain performance information current to the most recent month end, please call 800-262-6631.
Average Annual Total Return as of April 30, 2023
| | One Year | | Five Year | | Ten Year | | Expense
Ratio‡ |
Steward Values-Focused Small-Mid Cap Enhanced Index Fund — Institutional Class
| -1.28% | | 5.55% | | 8.66% | | 0.61% |
S&P 1000 Index
| -0.23% | | 6.93% | | 9.64% | | N/A |
* The investment return and principal value of an investment will fluctuate and, therefore, an investor’s shares, when redeemed, may be worth more or less than their original cost. The Steward Values-Focused Small-Mid Cap Enhanced Index Fund’s performance assumes the reinvestment of all income dividends and capital gains distributions, if any, but does not reflect the impact of taxes that a shareholder would pay on Fund distributions or the redemption of Fund shares. Prior to October 29, 2021, the Fund had a different investment strategy. Performance would have been different if the Fund's current investment strategy had been in effect.
** The S&P 1000 Index is a capitalization-weighted index combining the S&P Mid Cap 400 Index and the S&P Small Cap 600 Index. Both indices represent stocks chosen for market size, liquidity and industry group representation. All market indices are unmanaged and do not reflect expenses that affect performance results. It is not possible to invest directly in any index. Index returns shown assume the reinvestment of all dividends and distributions, if any.
‡ See the August 28, 2022 prospectus for details. The expense ratio is as stated in the current prospectus and may differ from the the expense ratio disclosed in the financial highlights in this report.
STEWARD FUNDS
SCHEDULE OF PORTFOLIO INVESTMENTS — April 30, 2023
STEWARD COVERED CALL INCOME FUND
The table below sets forth the diversification of the Steward Covered Call Income Fund investments by Industry.
| Industry Diversification | | Percent* |
| Software | | 8.1% |
| Semiconductors & Semiconductor Equipment | | 7.2 |
| Financial Services | | 5.9 |
| Interactive Media & Services | | 5.9 |
| Technology Hardware, Storage & Peripherals | | 4.8 |
| Oil, Gas & Consumable Fuels | | 4.5 |
| Electric Utilities | | 4.3 |
| Banks | | 4.0 |
| Beverages | | 3.9 |
| Capital Markets | | 3.5 |
| Hotels, Restaurants & Leisure | | 3.4 |
| Aerospace & Defense | | 3.3 |
| Consumer Staples Distribution & Retail | | 3.3 |
| Broadline Retail | | 3.1 |
| Household Products | | 2.9 |
| Health Care Equipment & Supplies | | 2.6 |
| Specialty Retail | | 2.6 |
| Automobiles | | 2.1 |
| Biotechnology | | 2.0 |
| Chemicals | | 1.9 |
| Industrial Conglomerates | | 1.9 |
| Pharmaceuticals | | 1.9 |
| Industry Diversification | | Percent* |
| Insurance | | 1.8% |
| IT Services | | 1.8 |
| Entertainment | | 1.5 |
| Life Sciences Tools & Services | | 1.5 |
| Food Products | | 1.4 |
| Air Freight & Logistics | | 1.3 |
| Communications Equipment | | 1.3 |
| Diversified Telecommunication Services | | 1.3 |
| Media | | 1.2 |
| Consumer Finance | | 1.1 |
| Wireless Telecommunication Services | | 1.1 |
| Textiles, Apparel & Luxury Goods | | 1.0 |
| Ground Transportation | | 0.9 |
| Electrical Equipment | | 0.7 |
| Machinery | | 0.7 |
| Retail Real Estate Investment Trusts | | 0.7 |
| Specialized Real Estate Investment Trusts | | 0.7 |
| Health Care Providers & Services | | 0.6 |
| Money Market Fund | | 0.6 |
| Total Investments | | 104.3% |
| * | Percentages indicated are based on net assets as of April 30, 2023.
|
See notes to financial statements.
STEWARD FUNDS
SCHEDULE OF PORTFOLIO INVESTMENTS — April 30, 2023
STEWARD COVERED CALL INCOME FUND
| | Shares | | Value |
| COMMON STOCKS - 103.7% |
| AEROSPACE & DEFENSE - 3.3% |
| Boeing Co. (The)(a) | 1,400 | | $ 289,492 |
| General Dynamics Corp. | 2,300 | | 502,182 |
| Lockheed Martin Corp. | 900 | | 418,005 |
| Raytheon Technologies Corp. | 6,199 | | 619,280 |
| | | | 1,828,959 |
| AIR FREIGHT & LOGISTICS - 1.3% |
| FedEx Corp. | 1,000 | | 227,780 |
| United Parcel Service, Inc., Class B | 2,800 | | 503,468 |
| | | | 731,248 |
| AUTOMOBILES - 2.1% |
| Ford Motor Co. | 11,700 | | 138,996 |
| General Motors Co. | 5,200 | | 171,808 |
| Tesla, Inc.(a) | 5,100 | | 837,981 |
| | | | 1,148,785 |
| BANKS - 4.0% |
| Bank of America Corp. | 16,500 | | 483,120 |
| Citigroup, Inc. | 4,900 | | 230,643 |
| JPMorgan Chase & Co. | 6,200 | | 857,088 |
| U.S. Bancorp | 7,300 | | 250,244 |
| Wells Fargo & Co. | 9,700 | | 385,575 |
| | | | 2,206,670 |
| BEVERAGES - 3.9% |
| Coca-Cola Co. (The) | 17,700 | | 1,135,455 |
| PepsiCo, Inc. | 5,300 | | 1,011,717 |
| | | | 2,147,172 |
| BIOTECHNOLOGY - 2.0% |
| Amgen, Inc. | 2,500 | | 599,350 |
| Gilead Sciences, Inc. | 6,200 | | 509,702 |
| | | | 1,109,052 |
| BROADLINE RETAIL - 3.1% |
| Amazon.com, Inc.(a) | 16,400 | | 1,729,380 |
| CAPITAL MARKETS - 3.5% |
| Bank of New York Mellon Corp. (The) | 6,900 | | 293,871 |
| BlackRock, Inc. | 800 | | 536,960 |
| Charles Schwab Corp. (The) | 4,800 | | 250,752 |
| Goldman Sachs Group, Inc. (The) | 1,100 | | 377,784 |
| Morgan Stanley | 5,100 | | 458,847 |
| | | | 1,918,214 |
| | Shares | | Value |
| CHEMICALS - 1.9% |
| Dow, Inc. | 7,400 | | $ 402,560 |
| Linde PLC | 1,700 | | 628,065 |
| | | | 1,030,625 |
| COMMUNICATIONS EQUIPMENT - 1.3% |
| Cisco Systems, Inc. | 15,100 | | 713,475 |
| CONSUMER FINANCE - 1.1% |
| American Express Co. | 2,200 | | 354,948 |
| Capital One Financial Corp. | 2,700 | | 262,710 |
| | | | 617,658 |
| CONSUMER STAPLES DISTRIBUTION & RETAIL - 3.3% |
| Costco Wholesale Corp. | 1,600 | | 805,152 |
| Target Corp. | 2,100 | | 331,275 |
| Walgreens Boots Alliance, Inc. | 3,700 | | 130,425 |
| Walmart, Inc. | 3,900 | | 588,783 |
| | | | 1,855,635 |
| DIVERSIFIED TELECOMMUNICATION SERVICES - 1.3% |
| AT&T, Inc. | 18,200 | | 321,594 |
| Verizon Communications, Inc. | 10,000 | | 388,300 |
| | | | 709,894 |
| ELECTRIC UTILITIES - 4.3% |
| Duke Energy Corp. | 6,800 | | 672,384 |
| Exelon Corp. | 10,300 | | 437,132 |
| NextEra Energy, Inc. | 7,100 | | 544,073 |
| Southern Co. (The) | 9,900 | | 728,145 |
| | | | 2,381,734 |
| ELECTRICAL EQUIPMENT - 0.7% |
| Emerson Electric Co. | 4,600 | | 382,996 |
| ENTERTAINMENT - 1.5% |
| Netflix, Inc.(a) | 1,000 | | 329,930 |
| Walt Disney Co. (The)(a) | 4,900 | | 502,250 |
| | | | 832,180 |
| FINANCIAL SERVICES - 5.9% |
| Berkshire Hathaway, Inc., Class B(a) | 4,200 | | 1,379,910 |
| Mastercard, Inc., Class A | 1,900 | | 722,057 |
| PayPal Holdings, Inc.(a) | 3,700 | | 281,200 |
| Visa, Inc., Class A | 3,800 | | 884,374 |
| | | | 3,267,541 |
See notes to financial statements.
STEWARD FUNDS
SCHEDULE OF PORTFOLIO INVESTMENTS — April 30, 2023
STEWARD COVERED CALL INCOME FUND
| | Shares | | Value |
| FOOD PRODUCTS - 1.4% |
| Kraft Heinz Co. (The) | 4,300 | | $ 168,861 |
| Mondelez International, Inc., Class A | 8,000 | | 613,760 |
| | | | 782,621 |
| GROUND TRANSPORTATION - 0.9% |
| Union Pacific Corp. | 2,600 | | 508,820 |
| HEALTH CARE EQUIPMENT & SUPPLIES - 2.6% |
| Abbott Laboratories | 7,400 | | 817,478 |
| Medtronic PLC | 6,800 | | 618,460 |
| | | | 1,435,938 |
| HEALTH CARE PROVIDERS & SERVICES - 0.6% |
| CVS Health Corp. | 4,700 | | 344,557 |
| HOTELS, RESTAURANTS & LEISURE - 3.4% |
| Booking Holdings, Inc.(a) | 200 | | 537,262 |
| McDonald's Corp. | 2,900 | | 857,675 |
| Starbucks Corp. | 4,400 | | 502,876 |
| | | | 1,897,813 |
| HOUSEHOLD PRODUCTS - 2.9% |
| Colgate-Palmolive Co. | 6,800 | | 542,640 |
| Procter & Gamble Co. (The) | 6,800 | | 1,063,384 |
| | | | 1,606,024 |
| INDUSTRIAL CONGLOMERATES - 1.9% |
| 3M Co. | 3,900 | | 414,258 |
| Honeywell International, Inc. | 3,200 | | 639,488 |
| | | | 1,053,746 |
| INSURANCE - 1.8% |
| American International Group, Inc. | 6,300 | | 334,152 |
| MetLife, Inc. | 11,100 | | 680,763 |
| | | | 1,014,915 |
| INTERACTIVE MEDIA & SERVICES - 5.9% |
| Alphabet, Inc., Class A(a) | 11,400 | | 1,223,676 |
| Alphabet, Inc., Class C†(a) | 9,600 | | 1,038,912 |
| Meta Platforms, Inc., Class A(a) | 4,200 | | 1,009,344 |
| | | | 3,271,932 |
| IT SERVICES - 1.8% |
| Accenture PLC, Class A | 2,400 | | 672,696 |
| International Business Machines Corp. | 2,800 | | 353,948 |
| | | | 1,026,644 |
| LIFE SCIENCES TOOLS & SERVICES - 1.5% |
| Danaher Corp. | 3,600 | | 852,876 |
| | Shares | | Value |
| MACHINERY - 0.7% |
| Caterpillar, Inc. | 1,900 | | $ 415,720 |
| MEDIA - 1.2% |
| Charter Communications, Inc., Class A(a) | 600 | | 221,220 |
| Comcast Corp., Class A | 11,000 | | 455,070 |
| | | | 676,290 |
| OIL, GAS & CONSUMABLE FUELS - 4.5% |
| Chevron Corp. | 4,700 | | 792,326 |
| ConocoPhillips | 5,100 | | 524,739 |
| Exxon Mobil Corp. | 10,100 | | 1,195,234 |
| | | | 2,512,299 |
| PHARMACEUTICALS - 1.9% |
| Eli Lilly & Co. | 2,700 | | 1,068,822 |
| RETAIL REAL ESTATE INVESTMENT TRUSTS - 0.7% |
| Simon Property Group, Inc. | 3,600 | | 407,952 |
| SEMICONDUCTORS & SEMICONDUCTOR EQUIPMENT - 7.2% |
| Advanced Micro Devices, Inc.(a) | 5,200 | | 464,724 |
| Broadcom, Inc. | 1,300 | | 814,450 |
| Intel Corp. | 10,100 | | 313,706 |
| NVIDIA Corp. | 5,100 | | 1,415,199 |
| QUALCOMM, Inc. | 3,600 | | 420,480 |
| Texas Instruments, Inc. | 3,500 | | 585,200 |
| | | | 4,013,759 |
| SOFTWARE - 8.1% |
| Adobe, Inc.(a) | 1,700 | | 641,852 |
| Microsoft Corp. | 9,200 | | 2,826,792 |
| Oracle Corp. | 4,800 | | 454,656 |
| Salesforce, Inc.(a) | 2,800 | | 555,436 |
| | | | 4,478,736 |
| SPECIALIZED REAL ESTATE INVESTMENT TRUSTS - 0.7% |
| American Tower Corp. | 2,000 | | 408,780 |
| SPECIALTY RETAIL - 2.6% |
| Home Depot, Inc. (The) | 2,800 | | 841,512 |
| Lowe’s Cos., Inc. | 2,900 | | 602,707 |
| | | | 1,444,219 |
| TECHNOLOGY HARDWARE, STORAGE & PERIPHERALS - 4.8% |
| Apple, Inc. | 15,800 | | 2,680,944 |
| TEXTILES, APPAREL & LUXURY GOODS - 1.0% |
| NIKE, Inc., Class B | 4,300 | | 544,896 |
See notes to financial statements.
STEWARD FUNDS
SCHEDULE OF PORTFOLIO INVESTMENTS — April 30, 2023
STEWARD COVERED CALL INCOME FUND
| | Shares | | Value |
| WIRELESS TELECOMMUNICATION SERVICES - 1.1% |
| T-Mobile U.S., Inc.(a) | 4,200 | | $ 604,380 |
TOTAL COMMON STOCKS
(COST $56,862,073) | | | 57,663,901 |
| MONEY MARKET FUND - 0.6% |
| Northern Institutional Treasury Portfolio (Premier Class), 4.56%(b) | 336,163 | | 336,163 |
TOTAL MONEY MARKET FUND
(COST $336,163) | | | 336,163 |
TOTAL INVESTMENTS
(COST $57,198,236) - 104.3% | | | 58,000,064 |
| | | | |
| | | Value |
WRITTEN CALL OPTIONS - (4.3)%
(PREMIUMS RECEIVED ($1,324,091)) | | $ (2,386,941) |
| LIABILITIES IN EXCESS OF OTHER ASSETS - 0.0% | | (27,047) |
| NET ASSETS - 100.0% | | $ 55,586,076 |
| Securities in this Fund are pledged as collateral for call options written. |
| † | Security is not pledged as collateral for call options written. |
| (a) | Represents non-income producing security. |
| (b) | 7-day current yield as of April 30, 2023 is disclosed.
|
| PLC — Public Limited Company |
See notes to financial statements.
STEWARD FUNDS
SCHEDULE OF PORTFOLIO INVESTMENTS — April 30, 2023
STEWARD COVERED CALL INCOME FUND
Exchange-traded options written as of April 30, 2023 were as follows:
| Description | | Type | | Number of
Contracts | | Notional
Amount* | | Exercise
Price | | Expiration
Date | | Value |
| 3M Co. | | Call | | 35 | | $ (402,500) | | $ 115.00 | | 7/21/23 | | $ (4,725) |
| Abbott Laboratories | | Call | | 70 | | (700,000) | | 100.00 | | 5/19/23 | | (76,650) |
| Accenture PLC, Class A | | Call | | 20 | | (540,000) | | 270.00 | | 5/19/23 | | (26,200) |
| Adobe, Inc. | | Call | | 10 | | (360,000) | | 360.00 | | 6/16/23 | | (29,475) |
| Advanced Micro Devices, Inc. | | Call | | 45 | | (427,500) | | 95.00 | | 7/21/23 | | (24,750) |
| Alphabet, Inc., Class A | | Call | | 80 | | (840,000) | | 105.00 | | 6/16/23 | | (53,200) |
| Amazon.com, Inc. | | Call | | 155 | | (1,627,500) | | 105.00 | | 5/19/23 | | (55,490) |
| American Express Co. | | Call | | 15 | | (247,500) | | 165.00 | | 6/16/23 | | (6,300) |
| American International Group, Inc. | | Call | | 60 | | (300,000) | | 50.00 | | 5/19/23 | | (22,800) |
| American Tower Corp. | | Call | | 15 | | (315,000) | | 210.00 | | 6/16/23 | | (7,650) |
| Amgen, Inc. | | Call | | 20 | | (500,000) | | 250.00 | | 7/21/23 | | (9,100) |
| Apple, Inc. | | Call | | 135 | | (2,092,500) | | 155.00 | | 5/19/23 | | (210,465) |
| AT&T, Inc. | | Call | | 170 | | (306,000) | | 18.00 | | 7/21/23 | | (9,010) |
| Bank of America Corp. | | Call | | 150 | | (450,000) | | 30.00 | | 6/16/23 | | (11,250) |
| Bank of New York Mellon Corp. (The) | | Call | | 55 | | (247,500) | | 45.00 | | 6/16/23 | | (3,850) |
| Berkshire Hathaway, Inc., Class B | | Call | | 35 | | (1,137,500) | | 325.00 | | 6/16/23 | | (40,880) |
| BlackRock, Inc. | | Call | | 6 | | (408,000) | | 680.00 | | 6/16/23 | | (10,800) |
| Boeing Co. (The) | | Call | | 10 | | (215,000) | | 215.00 | | 6/16/23 | | (5,425) |
| Booking Holdings, Inc. | | Call | | 2 | | (560,000) | | 2,800.00 | | 5/19/23 | | (7,898) |
| Broadcom, Inc. | | Call | | 10 | | (660,000) | | 660.00 | | 6/16/23 | | (12,400) |
| Capital One Financial Corp. | | Call | | 25 | | (250,000) | | 100.00 | | 6/16/23 | | (8,500) |
| Caterpillar, Inc. | | Call | | 15 | | (345,000) | | 230.00 | | 5/19/23 | | (2,085) |
| Charles Schwab Corp. (The) | | Call | | 35 | | (201,250) | | 57.50 | | 6/16/23 | | (3,150) |
| Charter Communications, Inc., Class A | | Call | | 5 | | (175,000) | | 350.00 | | 6/16/23 | | (14,850) |
| Chevron Corp. | | Call | | 35 | | (577,500) | | 165.00 | | 6/16/23 | | (26,075) |
| Cisco Systems, Inc. | | Call | | 140 | | (700,000) | | 50.00 | | 7/21/23 | | (12,810) |
| Citigroup, Inc. | | Call | | 45 | | (213,750) | | 47.50 | | 6/16/23 | | (7,875) |
| Coca-Cola Co. (The) | | Call | | 170 | | (1,062,500) | | 62.50 | | 6/16/23 | | (42,840) |
| Colgate-Palmolive Co. | | Call | | 55 | | (412,500) | | 75.00 | | 5/19/23 | | (28,600) |
| Comcast Corp., Class A | | Call | | 85 | | (318,750) | | 37.50 | | 7/21/23 | | (39,950) |
| ConocoPhillips | | Call | | 45 | | (495,000) | | 110.00 | | 6/16/23 | | (8,933) |
| Costco Wholesale Corp. | | Call | | 14 | | (728,000) | | 520.00 | | 6/16/23 | | (11,830) |
| CVS Health Corp. | | Call | | 40 | | (320,000) | | 80.00 | | 8/18/23 | | (7,000) |
| Danaher Corp. | | Call | | 30 | | (720,000) | | 240.00 | | 6/16/23 | | (19,950) |
| Dow, Inc. | | Call | | 70 | | (402,500) | | 57.50 | | 7/21/23 | | (7,910) |
| Duke Energy Corp. | | Call | | 55 | | (550,000) | | 100.00 | | 7/21/23 | | (16,500) |
| Eli Lilly & Co. | | Call | | 20 | | (680,000) | | 340.00 | | 5/19/23 | | (113,400) |
| Emerson Electric Co. | | Call | | 40 | | (340,000) | | 85.00 | | 6/16/23 | | (8,000) |
| Exelon Corp. | | Call | | 95 | | (408,500) | | 43.00 | | 6/16/23 | | (10,450) |
| Exxon Mobil Corp. | | Call | | 85 | | (935,000) | | 110.00 | | 5/19/23 | | (74,290) |
| FedEx Corp. | | Call | | 8 | | (192,000) | | 240.00 | | 7/21/23 | | (5,840) |
| Ford Motor Co. | | Call | | 100 | | (130,000) | | 13.00 | | 6/16/23 | | (2,600) |
| General Dynamics Corp. | | Call | | 20 | | (460,000) | | 230.00 | | 8/18/23 | | (9,500) |
| General Motors Co. | | Call | | 45 | | (166,500) | | 37.00 | | 6/16/23 | | (1,575) |
| Gilead Sciences, Inc. | | Call | | 55 | | (467,500) | | 85.00 | | 5/19/23 | | (2,750) |
See notes to financial statements.
STEWARD FUNDS
SCHEDULE OF PORTFOLIO INVESTMENTS — April 30, 2023
STEWARD COVERED CALL INCOME FUND
| Description | | Type | | Number of
Contracts | | Notional
Amount* | | Exercise
Price | | Expiration
Date | | Value |
| Goldman Sachs Group, Inc. (The) | | Call | | 10 | | $ (355,000) | | $ 355.00 | | 7/21/23 | | $ (10,275) |
| Home Depot, Inc. (The) | | Call | | 25 | | (750,000) | | 300.00 | | 5/19/23 | | (22,375) |
| Honeywell International, Inc. | | Call | | 25 | | (500,000) | | 200.00 | | 6/16/23 | | (13,725) |
| Intel Corp. | | Call | | 90 | | (261,000) | | 29.00 | | 7/21/23 | | (28,800) |
| International Business Machines Corp. | | Call | | 25 | | (337,500) | | 135.00 | | 7/21/23 | | (3,275) |
| JPMorgan Chase & Co. | | Call | | 55 | | (770,000) | | 140.00 | | 7/21/23 | | (29,425) |
| Kraft Heinz Co. (The) | | Call | | 40 | | (160,000) | | 40.00 | | 7/21/23 | | (4,080) |
| Linde PLC | | Call | | 15 | | (577,500) | | 385.00 | | 7/21/23 | | (12,000) |
| Lockheed Martin Corp. | | Call | | 7 | | (332,500) | | 475.00 | | 6/16/23 | | (4,970) |
| Lowe’s Cos., Inc. | | Call | | 25 | | (525,000) | | 210.00 | | 6/16/23 | | (20,375) |
| Mastercard, Inc., Class A | | Call | | 15 | | (570,000) | | 380.00 | | 6/16/23 | | (18,412) |
| McDonald's Corp. | | Call | | 25 | | (750,000) | | 300.00 | | 7/21/23 | | (16,438) |
| Medtronic PLC | | Call | | 60 | | (495,000) | | 82.50 | | 6/16/23 | | (57,000) |
| Meta Platforms, Inc., Class A | | Call | | 35 | | (787,500) | | 225.00 | | 5/19/23 | | (63,000) |
| MetLife, Inc. | | Call | | 100 | | (600,000) | | 60.00 | | 6/16/23 | | (32,000) |
| Microsoft Corp. | | Call | | 80 | | (2,160,000) | | 270.00 | | 5/19/23 | | (304,000) |
| Mondelez International, Inc., Class A | | Call | | 70 | | (490,000) | | 70.00 | | 6/16/23 | | (51,450) |
| Morgan Stanley | | Call | | 45 | | (416,250) | | 92.50 | | 7/21/23 | | (16,538) |
| Netflix, Inc. | | Call | | 8 | | (264,000) | | 330.00 | | 5/19/23 | | (8,120) |
| NextEra Energy, Inc. | | Call | | 50 | | (375,000) | | 75.00 | | 6/16/23 | | (17,000) |
| NIKE, Inc., Class B | | Call | | 40 | | (520,000) | | 130.00 | | 6/16/23 | | (11,840) |
| NVIDIA Corp. | | Call | | 45 | | (1,305,000) | | 290.00 | | 6/16/23 | | (58,275) |
| Oracle Corp. | | Call | | 30 | | (277,500) | | 92.50 | | 6/16/23 | | (16,200) |
| PayPal Holdings, Inc. | | Call | | 35 | | (288,750) | | 82.50 | | 6/16/23 | | (6,545) |
| PepsiCo, Inc. | | Call | | 50 | | (925,000) | | 185.00 | | 7/21/23 | | (48,500) |
| Procter & Gamble Co. (The) | | Call | | 60 | | (870,000) | | 145.00 | | 7/21/23 | | (84,000) |
| QUALCOMM, Inc. | | Call | | 30 | | (390,000) | | 130.00 | | 7/21/23 | | (7,830) |
| Raytheon Technologies Corp. | | Call | | 50 | | (500,000) | | 100.00 | | 5/19/23 | | (7,850) |
| Salesforce, Inc. | | Call | | 20 | | (370,000) | | 185.00 | | 6/16/23 | | (38,360) |
| Simon Property Group, Inc. | | Call | | 30 | | (330,000) | | 110.00 | | 5/19/23 | | (16,200) |
| Southern Co. (The) | | Call | | 85 | | (573,750) | | 67.50 | | 6/16/23 | | (53,550) |
| Starbucks Corp. | | Call | | 35 | | (367,500) | | 105.00 | | 6/16/23 | | (38,150) |
| Target Corp. | | Call | | 15 | | (262,500) | | 175.00 | | 7/21/23 | | (4,215) |
| Tesla, Inc. | | Call | | 45 | | (810,000) | | 180.00 | | 6/16/23 | | (24,390) |
| Texas Instruments, Inc. | | Call | | 30 | | (525,000) | | 175.00 | | 7/21/23 | | (12,480) |
| T-Mobile U.S., Inc. | | Call | | 35 | | (525,000) | | 150.00 | | 5/19/23 | | (1,435) |
| U.S. Bancorp | | Call | | 65 | | (227,500) | | 35.00 | | 7/21/23 | | (15,275) |
| Union Pacific Corp. | | Call | | 20 | | (400,000) | | 200.00 | | 5/19/23 | | (4,600) |
| United Parcel Service, Inc., Class B | | Call | | 25 | | (462,500) | | 185.00 | | 7/21/23 | | (11,125) |
| Verizon Communications, Inc. | | Call | | 85 | | (340,000) | | 40.00 | | 7/21/23 | | (6,885) |
| Visa, Inc., Class A | | Call | | 30 | | (690,000) | | 230.00 | | 5/19/23 | | (15,840) |
| Walgreens Boots Alliance, Inc. | | Call | | 30 | | (105,000) | | 35.00 | | 7/21/23 | | (5,430) |
| Walmart, Inc. | | Call | | 35 | | (525,000) | | 150.00 | | 6/16/23 | | (16,887) |
| Walt Disney Co. (The) | | Call | | 40 | | (400,000) | | 100.00 | | 6/16/23 | | (25,400) |
See notes to financial statements.
STEWARD FUNDS
SCHEDULE OF PORTFOLIO INVESTMENTS — April 30, 2023
STEWARD COVERED CALL INCOME FUND
| Description | | Type | | Number of
Contracts | | Notional
Amount* | | Exercise
Price | | Expiration
Date | | Value |
| Wells Fargo & Co. | | Call | | 90 | | $ (360,000) | | $ 40.00 | | 5/19/23 | | $ (6,840) |
| (Premiums received $1,324,091) | | | | | | | | | | | | $(2,386,941) |
| * | Notional amount is expressed as the number of contracts multiplied by the strike price multiplied by 100.
|
See notes to financial statements.
STEWARD FUNDS
SCHEDULE OF PORTFOLIO INVESTMENTS — April 30, 2023
STEWARD EQUITY MARKET NEUTRAL FUND
The table below sets forth the diversification of the Steward Equity Market Neutral Fund investments by Industry.
| Industry Diversification | | Percent ^* |
| Money Market Funds | | 12.5% |
| Financial Services | | 3.4 |
| Health Care Providers & Services | | 3.4 |
| Specialty Retail | | 3.0 |
| Real Estate Management & Development | | 2.7 |
| Air Freight & Logistics | | 2.4 |
| Software | | 2.4 |
| Consumer Finance | | 2.2 |
| Trading Companies & Distributors | | 2.2 |
| Technology Hardware, Storage & Peripherals | | 2.0 |
| Electrical Equipment | | 1.8 |
| Building Products | | 1.7 |
| Specialized Real Estate Investment Trusts | | 1.5 |
| Semiconductors & Semiconductor Equipment | | 1.4 |
| Consumer Staples Distribution & Retail | | 1.2 |
| Household Durables | | 1.2 |
| Automobile Components | | 1.1 |
| Banks | | 1.1 |
| Food Products | | 1.1 |
| Machinery | | 1.1 |
| Textiles, Apparel & Luxury Goods | | 1.0 |
| Automobiles | | 0.8 |
Electronic Equipment, Instruments
& Components | | 0.8 |
| Broadline Retail | | 0.7 |
| Capital Markets | | 0.7 |
| Life Sciences Tools & Services | | 0.7 |
| Distributors | | 0.6 |
| Construction & Engineering | | 0.5 |
| Containers & Packaging | | 0.4 |
| Professional Services | | 0.4 |
| Industry Diversification | | Percent ^* |
| Diversified Consumer Services | | 0.3% |
| Ground Transportation | | 0.1 |
| Water Utilities | | (0.2) |
| IT Services | | (0.3) |
| Media | | (0.4) |
| Metals & Mining | | (0.5) |
| Insurance | | (0.6) |
| Communications Equipment | | (0.7) |
| Multi-Utilities | | (0.7) |
| Pharmaceuticals | | (0.7) |
| Commercial Services & Supplies | | (0.9) |
| Electric Utilities | | (1.0) |
| Entertainment | | (1.0) |
| Gas Utilities | | (1.0) |
| Health Care Technology | | (1.0) |
| Independent Power and Renewable Electricity Producers | | (1.0) |
| Interactive Media & Services | | (1.0) |
| Oil, Gas & Consumable Fuels | | (1.3) |
| Chemicals | | (1.4) |
| Biotechnology | | (1.9) |
| Household Products | | (2.1) |
| Beverages | | (2.2) |
| Passenger Airlines | | (3.1) |
| Hotels, Restaurants & Leisure | | (3.5) |
| Aerospace & Defense | | (4.0) |
| Health Care Equipment & Supplies | | (5.1) |
| Total Investments | | 20.8% |
| ^ | Percentages indicated are net of Common Stocks and Common Stocks Sold Short. |
| * | Percentages indicated are based on net assets as of April 30, 2023.
|
See notes to financial statements.
STEWARD FUNDS
SCHEDULE OF PORTFOLIO INVESTMENTS — April 30, 2023
STEWARD EQUITY MARKET NEUTRAL FUND
| | Shares | | Value |
| COMMON STOCKS - 79.6% |
| AIR FREIGHT & LOGISTICS - 2.4% |
| C.H. Robinson Worldwide, Inc.(a) | 9,000 | | $ 907,830 |
| Expeditors International of Washington, Inc.(a) | 8,000 | | 910,720 |
| | | | 1,818,550 |
| AUTOMOBILE COMPONENTS - 1.1% |
| BorgWarner, Inc.(a) | 17,600 | | 847,088 |
| AUTOMOBILES - 0.8% |
| Harley-Davidson, Inc.(a) | 16,300 | | 604,730 |
| BANKS - 1.1% |
| Regions Financial Corp.(a) | 47,000 | | 858,220 |
| BIOTECHNOLOGY - 1.9% |
| Biogen, Inc.(a)(b) | 2,300 | | 699,729 |
| Gilead Sciences, Inc.(a) | 9,500 | | 780,995 |
| | | | 1,480,724 |
| BROADLINE RETAIL - 1.7% |
| Macy's, Inc.(a) | 46,700 | | 763,078 |
| Nordstrom, Inc. | 36,900 | | 570,474 |
| | | | 1,333,552 |
| BUILDING PRODUCTS - 1.7% |
| Carrier Global Corp. | 9,700 | | 405,654 |
| Owens Corning(a) | 8,200 | | 875,842 |
| | | | 1,281,496 |
| CAPITAL MARKETS - 4.2% |
| Ameriprise Financial, Inc.(a) | 2,800 | | 854,336 |
| Bank of New York Mellon Corp. (The)(a) | 19,600 | | 834,764 |
| Janus Henderson Group PLC | 28,700 | | 744,765 |
| Lazard Ltd., Class A | 5,300 | | 165,890 |
| LPL Financial Holdings, Inc. | 1,400 | | 292,376 |
| MSCI, Inc. | 700 | | 337,715 |
| | | | 3,229,846 |
| CONSTRUCTION & ENGINEERING - 0.5% |
| AECOM (a) | 5,000 | | 415,250 |
| CONSUMER FINANCE - 3.3% |
| American Express Co.(a) | 5,100 | | 822,834 |
| Discover Financial Services(a) | 7,900 | | 817,413 |
| Synchrony Financial(a) | 30,200 | | 891,202 |
| | | | 2,531,449 |
| | Shares | | Value |
| CONSUMER STAPLES DISTRIBUTION & RETAIL - 2.3% |
| Kroger Co. (The)(a) | 18,500 | | $ 899,655 |
| US Foods Holding Corp.(b) | 22,200 | | 852,480 |
| | | | 1,752,135 |
| CONTAINERS & PACKAGING - 0.4% |
| Berry Global Group, Inc. | 5,200 | | 300,612 |
| DISTRIBUTORS - 0.6% |
| Genuine Parts Co.(a) | 2,700 | | 454,437 |
| DIVERSIFIED CONSUMER SERVICES - 1.1% |
| Grand Canyon Education, Inc.(a)(b) | 7,300 | | 866,510 |
| ELECTRICAL EQUIPMENT - 2.2% |
| Acuity Brands, Inc. | 1,000 | | 157,380 |
| nVent Electric PLC | 16,600 | | 696,038 |
| Regal Rexnord Corp. | 6,500 | | 846,040 |
| | | | 1,699,458 |
ELECTRONIC EQUIPMENT, INSTRUMENTS & COMPONENTS -
0.8% |
| Jabil, Inc.(a) | 7,600 | | 593,940 |
| FINANCIAL SERVICES - 4.3% |
| Mastercard, Inc., Class A(a) | 2,400 | | 912,072 |
| Visa, Inc., Class A(a) | 3,800 | | 884,374 |
| Western Union Co. (The)(a) | 58,400 | | 638,312 |
| WEX, Inc.(b) | 4,600 | | 815,810 |
| | | | 3,250,568 |
| FOOD PRODUCTS - 1.2% |
| General Mills, Inc.(a) | 9,900 | | 877,437 |
| GROUND TRANSPORTATION - 2.2% |
| CSX Corp.(a) | 12,500 | | 383,000 |
| Landstar System, Inc.(a) | 3,300 | | 580,899 |
| Ryder System, Inc. | 8,900 | | 704,524 |
| | | | 1,668,423 |
| HEALTH CARE EQUIPMENT & SUPPLIES - 0.7% |
| Hologic, Inc.(a)(b) | 6,300 | | 541,863 |
| HEALTH CARE PROVIDERS & SERVICES - 6.9% |
| AmerisourceBergen Corp.(a) | 5,100 | | 850,935 |
| Cardinal Health, Inc.(a) | 10,900 | | 894,890 |
| Cigna Group (The)(a) | 3,000 | | 759,870 |
| DaVita, Inc.(b) | 5,600 | | 506,016 |
See notes to financial statements.
STEWARD FUNDS
SCHEDULE OF PORTFOLIO INVESTMENTS — April 30, 2023
STEWARD EQUITY MARKET NEUTRAL FUND
| | Shares | | Value |
| Elevance Health, Inc.(a) | 1,700 | | $ 796,705 |
| Humana, Inc.(a) | 1,100 | | 583,539 |
| McKesson Corp.(a) | 2,400 | | 874,176 |
| | | | 5,266,131 |
| HOTELS, RESTAURANTS & LEISURE - 1.4% |
| Booking Holdings, Inc.(b) | 400 | | 1,074,524 |
| HOUSEHOLD DURABLES - 1.2% |
| TopBuild Corp.(b) | 4,000 | | 901,920 |
| INSURANCE - 1.1% |
| Aflac, Inc.(a) | 7,400 | | 516,890 |
| Hartford Financial Services Group, Inc. (The)(a) | 4,000 | | 283,960 |
| | | | 800,850 |
| IT SERVICES - 1.5% |
| Gartner, Inc.(a)(b) | 1,400 | | 423,444 |
| VeriSign, Inc.(b) | 3,200 | | 709,760 |
| | | | 1,133,204 |
| LIFE SCIENCES TOOLS & SERVICES - 1.7% |
| Danaher Corp. | 2,200 | | 521,202 |
| QIAGEN N.V.(b) | 17,800 | | 794,058 |
| | | | 1,315,260 |
| MACHINERY - 1.2% |
| Ingersoll Rand, Inc. | 15,700 | | 895,214 |
| MEDIA - 0.7% |
| Interpublic Group of Cos., Inc. (The)(a) | 15,700 | | 560,961 |
| METALS & MINING - 0.1% |
| Reliance Steel & Aluminum Co. | 400 | | 99,120 |
| OIL, GAS & CONSUMABLE FUELS - 0.2% |
| ConocoPhillips | 1,300 | | 133,757 |
| PROFESSIONAL SERVICES - 1.8% |
| Booz Allen Hamilton Holding Corp. | 6,100 | | 583,892 |
| ManpowerGroup, Inc.(a) | 7,900 | | 598,109 |
| Robert Half International, Inc. | 2,300 | | 167,900 |
| | | | 1,349,901 |
| REAL ESTATE MANAGEMENT & DEVELOPMENT - 2.7% |
| CBRE Group, Inc., Class A(a)(b) | 11,800 | | 904,588 |
| | Shares | | Value |
| Howard Hughes Corp. (The)(b) | 6,400 | | $ 495,168 |
| Jones Lang LaSalle, Inc.(a)(b) | 4,700 | | 653,488 |
| | | | 2,053,244 |
| SEMICONDUCTORS & SEMICONDUCTOR EQUIPMENT - 3.3% |
| Applied Materials, Inc. | 1,100 | | 124,333 |
| Cirrus Logic, Inc.(a)(b) | 8,000 | | 686,320 |
| Lam Research Corp.(a) | 1,700 | | 890,936 |
| QUALCOMM, Inc.(a) | 7,100 | | 829,280 |
| | | | 2,530,869 |
| SOFTWARE - 8.8% |
| Adobe, Inc.(a)(b) | 2,300 | | 868,388 |
| ANSYS, Inc.(b) | 2,700 | | 847,584 |
| Autodesk, Inc.(b) | 4,400 | | 857,076 |
| Cadence Design Systems, Inc.(a)(b) | 3,900 | | 816,855 |
| Dolby Laboratories, Inc., Class A | 3,900 | | 326,391 |
| Dropbox, Inc., Class A(a)(b) | 34,200 | | 695,628 |
| Salesforce, Inc.(b) | 1,100 | | 218,207 |
| Synopsys, Inc.(a)(b) | 2,200 | | 816,904 |
| Teradata Corp.(a)(b) | 21,500 | | 832,265 |
| VMware, Inc., Class A(a)(b) | 3,800 | | 475,114 |
| | | | 6,754,412 |
| SPECIALIZED REAL ESTATE INVESTMENT TRUSTS - 1.5% |
| Equinix, Inc. | 300 | | 217,224 |
| Iron Mountain, Inc.(a) | 10,600 | | 585,544 |
| Weyerhaeuser Co.(a) | 10,100 | | 302,091 |
| | | | 1,104,859 |
| SPECIALTY RETAIL - 4.6% |
| Best Buy Co., Inc.(a) | 9,400 | | 700,488 |
| Gap, Inc. (The) | 82,600 | | 792,960 |
| Lowe’s Cos., Inc.(a) | 3,800 | | 789,754 |
| TJX Cos., Inc. (The) | 7,200 | | 567,504 |
| Ulta Beauty, Inc.(a)(b) | 1,200 | | 661,716 |
| | | | 3,512,422 |
| TECHNOLOGY HARDWARE, STORAGE & PERIPHERALS - 2.0% |
| Hewlett Packard Enterprise Co.(a) | 51,300 | | 734,616 |
| HP, Inc.(a) | 27,700 | | 822,967 |
| | | | 1,557,583 |
See notes to financial statements.
STEWARD FUNDS
SCHEDULE OF PORTFOLIO INVESTMENTS — April 30, 2023
STEWARD EQUITY MARKET NEUTRAL FUND
| | Shares | | Value |
| TEXTILES, APPAREL & LUXURY GOODS - 2.2% |
| Deckers Outdoor Corp.(b) | 1,700 | | $ 814,878 |
| PVH Corp. | 9,900 | | 849,519 |
| | | | 1,664,397 |
| TRADING COMPANIES & DISTRIBUTORS - 2.2% |
| W.W. Grainger, Inc.(a) | 1,200 | | 834,684 |
| WESCO International, Inc. | 5,800 | | 835,200 |
| | | | 1,669,884 |
TOTAL COMMON STOCKS
(COST $59,006,676) | | | 60,784,800 |
| MONEY MARKET FUNDS - 12.5% |
| Fidelity Government Cash Reserves, 4.50%(a)(c) | 929,696 | | 929,696 |
| Northern Institutional Treasury Portfolio (Premier Class), 4.56%(c) | 8,668,664 | | 8,668,664 |
TOTAL MONEY MARKET FUNDS
(COST $9,598,360) | | | 9,598,360 |
TOTAL INVESTMENTS
(COST $68,605,036) - 92.1% | | | 70,383,160 |
| | | | |
| COMMON STOCKS SOLD SHORT - (71.3)% |
| AEROSPACE & DEFENSE - (4.0)% |
| Boeing Co. (The) | (3,800) | | (785,764) |
| HEICO Corp., Class A | (5,900) | | (791,957) |
| Mercury Systems, Inc. | (15,600) | | (743,652) |
| Spirit AeroSystems Holdings, Inc., Class A | (25,400) | | (755,904) |
| | | | (3,077,277) |
| BEVERAGES - (2.2)% |
| Boston Beer Co., Inc. (The), Class A | (2,400) | | (762,024) |
| Constellation Brands, Inc., Class A | (3,300) | | (757,251) |
| Monster Beverage Corp. | (2,800) | | (156,800) |
| | | | (1,676,075) |
| BIOTECHNOLOGY - (3.8)% |
| Alnylam Pharmaceuticals, Inc. | (3,700) | | (737,040) |
| Ionis Pharmaceuticals, Inc. | (21,000) | | (742,770) |
| Natera, Inc. | (13,000) | | (659,360) |
| Seagen, Inc. | (3,900) | | (780,000) |
| | | | (2,919,170) |
| BROADLINE RETAIL - (1.0)% |
| Amazon.com, Inc. | (7,400) | | (780,330) |
| CAPITAL MARKETS - (3.5)% |
| Blackstone, Inc. | (8,500) | | (759,305) |
| | Shares | | Value |
| Blue Owl Capital, Inc. | (72,000) | | $ (810,720) |
| Carlyle Group, Inc. (The) | (9,200) | | (279,036) |
| KKR & Co., Inc. | (15,300) | | (811,971) |
| | | | (2,661,032) |
| CHEMICALS - (1.4)% |
| Albemarle Corp. | (900) | | (166,914) |
| Diversey Holdings Ltd. | (26,500) | | (215,445) |
| Scotts Miracle-Gro Co. (The) | (10,400) | | (694,824) |
| | | | (1,077,183) |
| COMMERCIAL SERVICES & SUPPLIES - (0.9)% |
| Stericycle, Inc. | (14,500) | | (661,925) |
| COMMUNICATIONS EQUIPMENT - (0.7)% |
| Ubiquiti, Inc. | (2,400) | | (558,120) |
| CONSUMER FINANCE - (1.1)% |
| Credit Acceptance Corp. | (1,600) | | (783,200) |
| Upstart Holdings, Inc. | (1,700) | | (23,630) |
| | | | (806,830) |
| CONSUMER STAPLES DISTRIBUTION & RETAIL - (1.1)% |
| Grocery Outlet Holding Corp. | (27,200) | | (810,016) |
| DIVERSIFIED CONSUMER SERVICES - (0.8)% |
| Mister Car Wash, Inc. | (68,700) | | (605,934) |
| ELECTRIC UTILITIES - (1.0)% |
| Constellation Energy Corp. | (10,200) | | (789,480) |
| ELECTRICAL EQUIPMENT - (0.4)% |
| Plug Power, Inc. | (7,900) | | (71,337) |
| Shoals Technologies Group, Inc., Class A | (12,400) | | (259,036) |
| | | | (330,373) |
| ENTERTAINMENT - (1.0)% |
| Roku, Inc. | (1,400) | | (78,694) |
| Warner Bros Discovery, Inc. | (49,800) | | (677,778) |
| | | | (756,472) |
| FINANCIAL SERVICES - (0.9)% |
| Rocket Cos., Inc., Class A | (25,800) | | (229,878) |
| Toast, Inc., Class A | (24,200) | | (440,440) |
| | | | (670,318) |
| FOOD PRODUCTS - (0.1)% |
| Freshpet, Inc. | (600) | | (41,382) |
See notes to financial statements.
STEWARD FUNDS
SCHEDULE OF PORTFOLIO INVESTMENTS — April 30, 2023
STEWARD EQUITY MARKET NEUTRAL FUND
| | Shares | | Value |
| GAS UTILITIES - (1.0)% |
| Atmos Energy Corp. | (7,000) | | $ (798,980) |
| GROUND TRANSPORTATION - (2.1)% |
| Lyft, Inc., Class A | (81,100) | | (831,275) |
| U-Haul Holding Co. | (12,900) | | (787,674) |
| | | | (1,618,949) |
| HEALTH CARE EQUIPMENT & SUPPLIES - (5.8)% |
| Enovis Corp. | (14,000) | | (815,500) |
| Envista Holdings Corp. | (19,400) | | (746,706) |
| Globus Medical, Inc., Class A | (3,000) | | (174,420) |
| ICU Medical, Inc. | (2,900) | | (548,506) |
| Masimo Corp. | (4,200) | | (794,388) |
| Novocure Ltd. | (8,200) | | (540,380) |
| STERIS PLC | (4,300) | | (810,765) |
| | | | (4,430,665) |
| HEALTH CARE PROVIDERS & SERVICES - (3.5)% |
| Acadia Healthcare Co., Inc. | (10,600) | | (766,274) |
| agilon health, Inc. | (25,900) | | (628,593) |
| Guardant Health, Inc. | (24,200) | | (545,952) |
| Oak Street Health, Inc. | (18,500) | | (720,945) |
| | | | (2,661,764) |
| HEALTH CARE TECHNOLOGY - (1.0)% |
| Certara, Inc. | (32,000) | | (773,440) |
| HOTELS, RESTAURANTS & LEISURE - (4.9)% |
| Aramark | (21,900) | | (759,930) |
| Carnival Corp. | (12,600) | | (116,046) |
| Choice Hotels International, Inc. | (6,000) | | (765,120) |
| Domino's Pizza, Inc. | (2,500) | | (793,675) |
| DraftKings, Inc., Class A | (3,800) | | (83,258) |
| Norwegian Cruise Line Holdings Ltd. | (43,100) | | (575,385) |
| Royal Caribbean Cruises Ltd. | (3,000) | | (196,290) |
| Sabre Corp. | (30,400) | | (121,600) |
| Six Flags Entertainment Corp. | (13,600) | | (330,072) |
| | | | (3,741,376) |
| HOUSEHOLD PRODUCTS - (2.1)% |
| Reynolds Consumer Products, Inc. | (29,900) | | (838,097) |
| Spectrum Brands Holdings, Inc. | (11,900) | | (791,350) |
| | | | (1,629,447) |
INDEPENDENT POWER AND RENEWABLE ELECTRICITY
PRODUCERS - (1.0)% |
| Vistra Corp. | (32,800) | | (782,608) |
| | Shares | | Value |
| INSURANCE - (1.7)% |
| Cincinnati Financial Corp. | (6,300) | | $ (670,572) |
| Kemper Corp. | (13,000) | | (632,450) |
| | | | (1,303,022) |
| INTERACTIVE MEDIA & SERVICES - (1.0)% |
| IAC, Inc. | (15,500) | | (802,435) |
| IT SERVICES - (1.8)% |
| Cloudflare, Inc., Class A | (10,800) | | (508,140) |
| Fastly, Inc., Class A | (5,800) | | (85,724) |
| MongoDB, Inc. | (3,100) | | (743,876) |
| | | | (1,337,740) |
| LIFE SCIENCES TOOLS & SERVICES - (1.0)% |
| Sotera Health Co. | (43,500) | | (729,495) |
| MACHINERY - (0.1)% |
| Stanley Black & Decker, Inc. | (1,000) | | (86,340) |
| MEDIA - (1.1)% |
| Liberty Broadband Corp., Class A | (10,200) | | (862,206) |
| METALS & MINING - (0.6)% |
| MP Materials Corp. | (20,600) | | (446,402) |
| MULTI-UTILITIES - (0.7)% |
| CenterPoint Energy, Inc. | (4,700) | | (143,209) |
| Dominion Energy, Inc. | (6,700) | | (382,838) |
| | | | (526,047) |
| OIL, GAS & CONSUMABLE FUELS - (1.5)% |
| Enviva, Inc. | (17,100) | | (367,650) |
| New Fortress Energy, Inc. | (25,700) | | (778,453) |
| | | | (1,146,103) |
| PASSENGER AIRLINES - (3.1)% |
| American Airlines Group, Inc. | (58,400) | | (796,576) |
| JetBlue Airways Corp. | (113,700) | | (811,818) |
| Southwest Airlines Co. | (24,200) | | (733,018) |
| | | | (2,341,412) |
| PHARMACEUTICALS - (0.7)% |
| Catalent, Inc. | (11,100) | | (556,332) |
| PROFESSIONAL SERVICES - (1.4)% |
| Dun & Bradstreet Holdings, Inc. | (31,700) | | (354,089) |
| Equifax, Inc. | (3,400) | | (708,492) |
| | | | (1,062,581) |
See notes to financial statements.
STEWARD FUNDS
SCHEDULE OF PORTFOLIO INVESTMENTS — April 30, 2023
STEWARD EQUITY MARKET NEUTRAL FUND
| | Shares | | Value |
| SEMICONDUCTORS & SEMICONDUCTOR EQUIPMENT - (1.9)% |
| Entegris, Inc. | (2,000) | | $ (149,840) |
| Monolithic Power Systems, Inc. | (1,700) | | (785,349) |
| Wolfspeed, Inc. | (11,600) | | (539,980) |
| | | | (1,475,169) |
| SOFTWARE - (6.4)% |
| Alteryx, Inc., Class A | (15,000) | | (616,950) |
| AppLovin Corp., Class A | (40,500) | | (688,500) |
| Aspen Technology, Inc. | (3,300) | | (584,100) |
| C3.ai, Inc., Class A | (10,700) | | (190,674) |
| Datadog, Inc., Class A | (10,600) | | (714,228) |
| Five9, Inc. | (1,600) | | (103,744) |
| nCino, Inc. | (11,600) | | (286,868) |
| Palantir Technologies, Inc., Class A | (84,800) | | (657,200) |
| Tyler Technologies, Inc. | (2,000) | | (758,060) |
| Unity Software, Inc. | (9,900) | | (267,003) |
| | | | (4,867,327) |
| SPECIALTY RETAIL - (1.6)% |
| Floor & Decor Holdings, Inc. | (1,700) | | (168,878) |
| GameStop Corp., Class A | (5,600) | | (108,024) |
| Petco Health & Wellness Co., Inc. | (21,800) | | (217,128) |
| Wayfair, Inc., Class A | (20,900) | | (727,947) |
| | | | (1,221,977) |
| | Shares | | Value |
| TEXTILES, APPAREL & LUXURY GOODS - (1.2)% |
| Skechers USA, Inc., Class A | (16,700) | | $ (888,273) |
| WATER UTILITIES - (0.2)% |
| American Water Works Co., Inc. | (1,200) | | (177,900) |
TOTAL COMMON STOCKS SOLD SHORT
(PROCEEDS ($56,697,724)) | | | (54,489,907) |
TOTAL SECURITIES SOLD SHORT
(PROCEEDS ($56,697,724)) - (71.3)% | | | (54,489,907) |
| OTHER ASSETS IN EXCESS OF LIABILITIES - 79.2% | | | 60,493,463 |
| NET ASSETS - 100.0% | | | $ 76,386,716 |
| |
| (a) | All or portion of the shares have been pledged as collateral for open short positions. |
| (b) | Represents non-income producing security. |
| (c) | 7-day current yield as of April 30, 2023 is disclosed.
|
| MSCI — Morgan Stanley Capital International |
| N.V. — Naamloze Vennootschap |
| PLC — Public Limited Company |
See notes to financial statements.
STEWARD FUNDS
SCHEDULE OF PORTFOLIO INVESTMENTS — April 30, 2023
STEWARD GLOBAL EQUITY INCOME FUND
The table below sets forth the diversification of the Steward Global Equity Income Fund investments by Country.
| Country Diversification | | Percent* |
| United States | | 61.7% |
| Canada | | 13.9 |
| Taiwan | | 4.7 |
| Switzerland | | 4.6 |
| Republic of Korea (South) | | 3.2 |
| Ireland (Republic of) | | 2.8 |
| Japan | | 1.8 |
| United Kingdom | | 1.6 |
| Brazil | | 1.6 |
| Colombia | | 1.4 |
| Netherlands | | 1.2 |
| Sweden | | 1.0 |
| Total Investments | | 99.5% |
| * | Percentages indicated are based on net assets as of April 30, 2023.
|
See notes to financial statements.
STEWARD FUNDS
SCHEDULE OF PORTFOLIO INVESTMENTS — April 30, 2023
STEWARD GLOBAL EQUITY INCOME FUND
| | Shares | | Value |
| COMMON STOCKS - 98.5% |
| AEROSPACE & DEFENSE - 1.1% |
| General Dynamics Corp. | 17,770 | | $ 3,879,902 |
| AIR FREIGHT & LOGISTICS - 1.8% |
| C.H. Robinson Worldwide, Inc. | 62,950 | | 6,349,766 |
| BANKS - 10.1% |
| Bank of Nova Scotia (The) | 72,260 | | 3,606,496 |
| Canadian Imperial Bank of Commerce | 92,500 | | 3,880,375 |
| KB Financial Group, Inc., ADR | 154,580 | | 5,764,288 |
| Mizuho Financial Group, Inc., ADR | 2,171,420 | | 6,318,832 |
| NatWest Group PLC, Sponsored ADR | 873,260 | | 5,789,714 |
| Royal Bank of Canada | 47,610 | | 4,728,149 |
| Toronto-Dominion Bank (The) | 91,690 | | 5,559,165 |
| | | | 35,647,019 |
| BEVERAGES - 2.1% |
| Coca-Cola Co. (The) | 113,710 | | 7,294,496 |
| BIOTECHNOLOGY - 1.8% |
| Gilead Sciences, Inc. | 79,500 | | 6,535,695 |
| CHEMICALS - 1.2% |
| Air Products and Chemicals, Inc. | 14,840 | | 4,368,302 |
| COMMUNICATIONS EQUIPMENT - 2.6% |
| Cisco Systems, Inc. | 117,220 | | 5,538,645 |
| Telefonaktiebolaget LM Ericsson, Sponsored ADR | 648,520 | | 3,560,375 |
| | | | 9,099,020 |
| CONSTRUCTION MATERIALS - 1.2% |
| James Hardie Industries PLC, Sponsored ADR | 189,680 | | 4,222,277 |
| DIVERSIFIED TELECOMMUNICATION SERVICES - 1.7% |
| Verizon Communications, Inc. | 151,720 | | 5,891,288 |
| ELECTRIC UTILITIES - 2.0% |
| Entergy Corp. | 34,850 | | 3,749,163 |
| Portland General Electric Co. | 66,960 | | 3,389,515 |
| | | | 7,138,678 |
| ELECTRICAL EQUIPMENT - 2.0% |
| ABB Ltd., Sponsored ADR | 195,960 | | 7,072,196 |
ELECTRONIC EQUIPMENT, INSTRUMENTS & COMPONENTS -
1.3% |
| Avnet, Inc. | 113,210 | | 4,671,045 |
| | Shares | | Value |
| FOOD PRODUCTS - 6.1% |
| Bunge Ltd. | 62,530 | | $ 5,852,808 |
| General Mills, Inc. | 51,290 | | 4,545,833 |
| Kellogg Co. | 88,160 | | 6,150,923 |
| Tyson Foods, Inc., Class A | 78,990 | | 4,936,085 |
| | | | 21,485,649 |
| GROUND TRANSPORTATION - 1.3% |
| Canadian National Railway Co. | 40,230 | | 4,798,232 |
| HEALTH CARE EQUIPMENT & SUPPLIES - 3.7% |
| Abbott Laboratories | 55,040 | | 6,080,269 |
| Becton, Dickinson and Co. | 26,610 | | 7,033,289 |
| | | | 13,113,558 |
| HEALTH CARE PROVIDERS & SERVICES - 7.5% |
| Cigna Group (The) | 36,570 | | 9,262,815 |
| Elevance Health, Inc. | 12,870 | | 6,031,526 |
| Quest Diagnostics, Inc. | 51,940 | | 7,209,792 |
| U.S. Physical Therapy, Inc. | 38,440 | | 4,092,322 |
| | | | 26,596,455 |
| HOTELS, RESTAURANTS & LEISURE - 3.1% |
| McDonald's Corp. | 37,430 | | 11,069,922 |
| HOUSEHOLD DURABLES - 1.0% |
| Garmin Ltd. | 37,480 | | 3,679,412 |
| INSURANCE - 1.4% |
| Sun Life Financial, Inc. | 104,720 | | 5,139,658 |
| IT SERVICES - 4.3% |
| Accenture PLC, Class A | 20,350 | | 5,703,901 |
| Amdocs Ltd. | 61,390 | | 5,601,838 |
| Cognizant Technology Solutions Corp., Class A | 62,860 | | 3,753,371 |
| | | | 15,059,110 |
| MACHINERY - 1.6% |
| Snap-on, Inc. | 22,100 | | 5,732,961 |
| MEDIA - 3.0% |
| Nexstar Media Group, Inc. | 31,450 | | 5,455,002 |
| Omnicom Group, Inc. | 55,740 | | 5,048,372 |
| | | | 10,503,374 |
| METALS & MINING - 2.4% |
| Agnico Eagle Mines Ltd. | 32,830 | | 1,862,446 |
See notes to financial statements.
STEWARD FUNDS
SCHEDULE OF PORTFOLIO INVESTMENTS — April 30, 2023
STEWARD GLOBAL EQUITY INCOME FUND
| | Shares | | Value |
| Pan American Silver Corp. | 133,300 | | $ 2,374,073 |
| Ternium SA, Sponsored ADR | 94,870 | | 4,112,614 |
| | | | 8,349,133 |
| OIL, GAS & CONSUMABLE FUELS - 6.4% |
| Canadian Natural Resources, Ltd. | 111,280 | | 6,784,741 |
| Ecopetrol SA, Sponsored ADR | 497,930 | | 4,839,880 |
| Petroleo Brasileiro SA, Sponsored ADR | 526,990 | | 5,596,634 |
| Suncor Energy, Inc. | 174,240 | | 5,457,197 |
| | | | 22,678,452 |
| PROFESSIONAL SERVICES - 3.3% |
| Broadridge Financial Solutions, Inc. | 32,080 | | 4,664,753 |
| Paychex, Inc. | 63,270 | | 6,950,842 |
| | | | 11,615,595 |
| SEMICONDUCTORS & SEMICONDUCTOR EQUIPMENT - 8.2% |
| ASE Industrial Holding Co. Ltd., ADR | 886,950 | | 6,084,477 |
| QUALCOMM, Inc. | 35,440 | | 4,139,392 |
| Taiwan Semiconductor Manufacturing Co. Ltd., Sponsored ADR | 71,040 | | 5,988,672 |
| Texas Instruments, Inc. | 48,220 | | 8,062,384 |
| United Microelectronics Corp., Sponsored ADR(a) | 585,870 | | 4,704,536 |
| | | | 28,979,461 |
| SOFTWARE - 2.5% |
| Gen Digital, Inc. | 224,180 | | 3,961,261 |
| Open Text Corp. | 134,060 | | 5,079,533 |
| | | | 9,040,794 |
| SPECIALIZED REAL ESTATE INVESTMENT TRUSTS - 2.7% |
| Crown Castle, Inc. | 33,300 | | 4,098,897 |
| Iron Mountain, Inc. | 99,520 | | 5,497,485 |
| | | | 9,596,382 |
| SPECIALTY RETAIL - 6.0% |
| Advance Auto Parts, Inc. | 25,630 | | 3,217,334 |
| | Shares | | Value |
| Best Buy Co., Inc. | 26,190 | | $ 1,951,679 |
| Home Depot, Inc. (The) | 16,600 | | 4,988,964 |
| Lowe’s Cos., Inc. | 30,330 | | 6,303,484 |
| Williams-Sonoma, Inc. | 38,260 | | 4,630,990 |
| | | | 21,092,451 |
| TECHNOLOGY HARDWARE, STORAGE & PERIPHERALS - 3.5% |
| HP, Inc. | 228,960 | | 6,802,402 |
| Logitech International SA | 91,490 | | 5,439,995 |
| | | | 12,242,397 |
| WIRELESS TELECOMMUNICATION SERVICES - 1.6% |
| SK Telecom Co. Ltd., Sponsored ADR | 282,650 | | 5,585,164 |
TOTAL COMMON STOCKS
(COST $335,520,789) | | | 348,527,844 |
| MONEY MARKET FUND - 1.0% |
| Northern Institutional Treasury Portfolio (Premier Class), 4.56%(b) | 3,417,784 | | 3,417,784 |
TOTAL MONEY MARKET FUND
(COST $3,417,784) | | | 3,417,784 |
TOTAL INVESTMENTS
(COST $338,938,573) - 99.5% | | | 351,945,628 |
| | | | |
| OTHER ASSETS IN EXCESS OF LIABILITIES - 0.5% | | | 1,689,528 |
| NET ASSETS - 100.0% | | | $ 353,635,156 |
| |
| (a) | Represents non-income producing security. |
| (b) | 7-day current yield as of April 30, 2023 is disclosed.
|
| ADR — American Depositary Receipt |
| PLC — Public Limited Company |
| SA — Societe Anonyme |
See notes to financial statements.
STEWARD FUNDS
SCHEDULE OF PORTFOLIO INVESTMENTS — April 30, 2023
STEWARD INTERNATIONAL ENHANCED INDEX FUND
The table below sets forth the diversification of the Steward International Enhanced Index Fund investments by Country.
| Country Diversification | | Percent* |
| Canada | | 27.0% |
| United Kingdom | | 16.3 |
| Taiwan | | 8.4 |
| China | | 8.4 |
| Netherlands | | 7.4 |
| Japan | | 5.0 |
| Brazil | | 3.4 |
| India | | 3.3 |
| Switzerland | | 2.9 |
| Germany | | 2.7 |
| France | | 2.6 |
| Mexico | | 2.0 |
| Australia | | 2.0 |
| Spain | | 1.6 |
| Republic of Korea (South) | | 1.4 |
| Ireland (Republic of) | | 0.8 |
| Denmark | | 0.7 |
| Italy | | 0.5 |
| Chile | | 0.5 |
| Norway | | 0.5 |
| South Africa | | 0.5 |
| Indonesia | | 0.4 |
| Finland | | 0.3 |
| Sweden | | 0.3 |
| United States | | 0.3 |
| Jersey | | 0.2 |
| Luxembourg | | 0.1 |
| Colombia | | 0.0** |
| Total Investments | | 99.5% |
| * | Percentages indicated are based on net assets as of April 30, 2023. |
| ** | Amount rounds to less than 0.1%.
|
See notes to financial statements.
STEWARD FUNDS
SCHEDULE OF PORTFOLIO INVESTMENTS — April 30, 2023
STEWARD INTERNATIONAL ENHANCED INDEX FUND
| | Shares | | Value |
| COMMON STOCKS - 97.7% |
| AEROSPACE & DEFENSE - 0.1% |
| CAE, Inc.(a) | 6,360 | | $ 143,227 |
| AIR FREIGHT & LOGISTICS - 0.2% |
| ZTO Express Cayman, Inc., ADR | 14,044 | | 388,738 |
| AUTOMOBILE COMPONENTS - 0.2% |
| Magna International, Inc., ADR | 6,535 | | 340,866 |
| AUTOMOBILES - 2.2% |
| Ferrari N.V. | 5,737 | | 1,598,557 |
| Honda Motor Co. Ltd., Sponsored ADR | 59,031 | | 1,569,044 |
| NIO, Inc., ADR(a) | 20,730 | | 163,145 |
| Stellantis N.V. | 60,290 | | 1,002,623 |
| Tata Motors Ltd., Sponsored ADR(a) | 12,760 | | 378,070 |
| | | | 4,711,439 |
| BANKS - 16.7% |
| Banco Bilbao Vizcaya Argentaria SA, Sponsored ADR | 165,860 | | 1,217,412 |
| Banco de Chile, ADR | 19,889 | | 421,647 |
| Banco Santander Chile, ADR | 6,164 | | 118,041 |
| Banco Santander SA, Sponsored ADR | 411,595 | | 1,428,235 |
| Bank of Montreal | 23,490 | | 2,118,563 |
| Bank of Nova Scotia (The) | 40,165 | | 2,004,635 |
| Barclays PLC, Sponsored ADR | 97,189 | | 784,315 |
| Canadian Imperial Bank of Commerce | 31,471 | | 1,320,208 |
| HDFC Bank Ltd., ADR | 39,365 | | 2,747,677 |
| HSBC Holdings PLC, Sponsored ADR | 116,789 | | 4,210,244 |
| ICICI Bank Ltd., Sponsored ADR | 86,345 | | 1,964,349 |
| ING Groep N.V., Sponsored ADR | 103,570 | | 1,282,197 |
| KB Financial Group, Inc., ADR | 21,000 | | 783,090 |
| Lloyds Banking Group PLC, ADR | 425,905 | | 1,030,690 |
| Mitsubishi UFJ Financial Group, Inc., Sponsored ADR | 341,190 | | 2,142,673 |
| Mizuho Financial Group, Inc., ADR | 315,100 | | 916,941 |
| NatWest Group PLC, Sponsored ADR | 82,660 | | 548,036 |
| NU Holdings Ltd., Class A(a) | 22,352 | | 115,336 |
| Royal Bank of Canada | 48,710 | | 4,837,390 |
| Shinhan Financial Group Co. Ltd., ADR | 28,230 | | 741,320 |
| Sumitomo Mitsui Financial Group, Inc., Sponsored ADR | 193,720 | | 1,590,441 |
| Toronto-Dominion Bank (The) | 58,829 | | 3,566,802 |
| Woori Financial Group, Inc., Sponsored ADR | 5,290 | | 140,661 |
| | | | 36,030,903 |
| BEVERAGES - 0.7% |
| Fomento Economico Mexicano SAB de CV, Sponsored ADR | 15,979 | | 1,550,283 |
| | Shares | | Value |
| BIOTECHNOLOGY - 1.6% |
| Argenx SE, ADR(a) | 3,199 | | $ 1,240,828 |
| BeiGene Ltd., ADR(a) | 2,494 | | 635,870 |
| Genmab A/S, Sponsored ADR(a) | 36,664 | | 1,503,591 |
| | | | 3,380,289 |
| BROADLINE RETAIL - 5.6% |
| Alibaba Group Holding Ltd., Sponsored ADR(a) | 101,942 | | 8,633,468 |
| JD.com, Inc., ADR | 61,147 | | 2,184,171 |
| PDD Holdings, Inc., ADR(a) | 14,099 | | 960,847 |
| Vipshop Holdings Ltd., ADR(a) | 12,148 | | 190,723 |
| | | | 11,969,209 |
| CAPITAL MARKETS - 1.6% |
| Brookfield Asset Management Ltd., Class A | 18,182 | | 610,006 |
| Credit Suisse Group, Sponsored ADR | 60,759 | | 54,373 |
| Deutsche Bank AG | 52,930 | | 582,760 |
| Nomura Holdings, Inc., Sponsored ADR | 85,620 | | 304,807 |
| UBS Group AG | 99,087 | | 2,006,512 |
| | | | 3,558,458 |
| CHEMICALS - 0.6% |
| Nutrien Ltd. | 15,022 | | 1,042,527 |
| Sasol Ltd., Sponsored ADR | 13,580 | | 176,811 |
| | | | 1,219,338 |
| COMMERCIAL SERVICES & SUPPLIES - 1.2% |
| Waste Connections, Inc. | 19,342 | | 2,691,439 |
| COMMUNICATIONS EQUIPMENT - 0.6% |
| Nokia Oyj, Sponsored ADR | 167,640 | | 702,412 |
| Telefonaktiebolaget LM Ericsson, Sponsored ADR | 110,090 | | 604,394 |
| | | | 1,306,806 |
| CONSTRUCTION MATERIALS - 0.8% |
| CEMEX SAB de CV, Sponsored ADR(a) | 55,045 | | 330,270 |
| CRH PLC, Sponsored ADR | 23,260 | | 1,128,110 |
| James Hardie Industries PLC, Sponsored ADR | 12,054 | | 268,322 |
| | | | 1,726,702 |
| DIVERSIFIED CONSUMER SERVICES - 0.3% |
| New Oriental Education & Technology Group, Inc., Sponsored ADR(a) | 3,846 | | 175,339 |
| Pearson PLC, Sponsored ADR | 34,477 | | 380,626 |
| | | | 555,965 |
| DIVERSIFIED TELECOMMUNICATION SERVICES - 4.4% |
| BCE, Inc. | 58,738 | | 2,823,536 |
See notes to financial statements.
STEWARD FUNDS
SCHEDULE OF PORTFOLIO INVESTMENTS — April 30, 2023
STEWARD INTERNATIONAL ENHANCED INDEX FUND
| | Shares | | Value |
| Chunghwa Telecom Co. Ltd., Sponsored ADR | 51,370 | | $ 2,117,471 |
| Orange SA, Sponsored ADR | 99,715 | | 1,298,289 |
| Telefonica SA, Sponsored ADR | 169,980 | | 766,610 |
| Telkom Indonesia Persero Tbk PT, ADR | 29,117 | | 838,570 |
| TELUS Corp. | 76,570 | | 1,624,050 |
| | | | 9,468,526 |
| ELECTRIC UTILITIES - 1.3% |
| Centrais Eletricas Brasileiras SA, Sponsored ADR | 73,898 | | 496,594 |
| Fortis, Inc. | 51,758 | | 2,272,694 |
| | | | 2,769,288 |
| ELECTRICAL EQUIPMENT - 0.9% |
| ABB Ltd., Sponsored ADR | 55,143 | | 1,990,111 |
| ENTERTAINMENT - 1.0% |
| Bilibili, Inc., Sponsored ADR(a) | 4,186 | | 85,227 |
| NetEase, Inc., ADR | 21,094 | | 1,880,108 |
| Tencent Music Entertainment Group, ADR(a) | 12,070 | | 89,439 |
| | | | 2,054,774 |
| FINANCIAL SERVICES - 0.4% |
| ORIX Corp., Sponsored ADR | 10,011 | | 854,038 |
| GROUND TRANSPORTATION - 2.3% |
| Canadian National Railway Co. | 21,360 | | 2,547,607 |
| Canadian Pacific Kansas City Ltd. | 30,781 | | 2,426,774 |
| | | | 4,974,381 |
| HEALTH CARE EQUIPMENT & SUPPLIES - 1.6% |
| Alcon, Inc. | 23,573 | | 1,708,571 |
| Koninklijke Philips N.V., Sponsored NYS | 27,175 | | 573,936 |
| Smith & Nephew PLC, Sponsored ADR | 36,393 | | 1,190,051 |
| | | | 3,472,558 |
| HEALTH CARE PROVIDERS & SERVICES - 0.2% |
| Fresenius Medical Care AG & Co. KGaA, ADR | 22,364 | | 541,656 |
| HOTELS, RESTAURANTS & LEISURE - 1.1% |
| H World Group Ltd., ADR(a) | 3,824 | | 179,345 |
| InterContinental Hotels Group PLC, ADR | 7,561 | | 523,826 |
| Restaurant Brands International, Inc. | 16,990 | | 1,191,509 |
| Trip.com Group Ltd., ADR(a) | 14,264 | | 506,515 |
| | | | 2,401,195 |
| | Shares | | Value |
| HOUSEHOLD DURABLES - 1.6% |
| Sony Group Corp., Sponsored ADR | 38,348 | | $ 3,438,665 |
| INSURANCE - 2.1% |
| Aegon N.V., Sponsored NYS | 40,717 | | 184,448 |
| Manulife Financial Corp. | 80,270 | | 1,585,332 |
| Prudential PLC, ADR | 38,270 | | 1,172,976 |
| Sun Life Financial, Inc. | 31,110 | | 1,526,879 |
| | | | 4,469,635 |
| INTERACTIVE MEDIA & SERVICES - 0.8% |
| Baidu, Inc., Sponsored ADR(a) | 14,679 | | 1,770,434 |
| IT SERVICES - 2.4% |
| CGI, Inc.(a) | 18,014 | | 1,826,800 |
| Infosys Ltd., Sponsored ADR | 110,930 | | 1,723,852 |
| Shopify, Inc., Class A(a) | 27,325 | | 1,323,896 |
| Wipro Ltd., ADR | 71,143 | | 334,372 |
| | | | 5,208,920 |
| LIFE SCIENCES TOOLS & SERVICES - 0.9% |
| QIAGEN N.V.(a) | 41,309 | | 1,842,795 |
| MACHINERY - 0.2% |
| CNH Industrial N.V. | 28,220 | | 397,902 |
| MEDIA - 0.2% |
| Grupo Televisa SAB, Sponsored ADR | 13,190 | | 66,741 |
| WPP PLC, Sponsored ADR | 6,850 | | 396,684 |
| | | | 463,425 |
| METALS & MINING - 7.8% |
| Agnico Eagle Mines Ltd. | 15,937 | | 904,106 |
| AngloGold Ashanti Ltd., Sponsored ADR | 11,490 | | 305,404 |
| ArcelorMittal SA, Sponsored NYS | 10,583 | | 301,298 |
| Barrick Gold Corp., ADR | 59,053 | | 1,124,369 |
| BHP Group Ltd., Sponsored ADR | 72,084 | | 4,255,839 |
| Franco Nevada Corp. | 8,568 | | 1,300,451 |
| Gold Fields Ltd., Sponsored ADR | 24,090 | | 374,840 |
| Kinross Gold Corp. | 44,170 | | 223,059 |
| POSCO Holdings, Inc., Sponsored ADR | 15,563 | | 1,106,841 |
| Rio Tinto PLC, Sponsored ADR | 31,770 | | 2,032,962 |
| Sibanye Stillwater Ltd., ADR | 17,340 | | 155,193 |
| Southern Copper Corp. | 4,665 | | 358,412 |
| Teck Resources Ltd., Class B | 10,513 | | 489,906 |
See notes to financial statements.
STEWARD FUNDS
SCHEDULE OF PORTFOLIO INVESTMENTS — April 30, 2023
STEWARD INTERNATIONAL ENHANCED INDEX FUND
| | Shares | | Value |
| Vale SA, Sponsored ADR | 197,362 | | $ 2,843,987 |
| Wheaton Precious Metals Corp. | 21,437 | | 1,058,559 |
| | | | 16,835,226 |
| MULTI-UTILITIES - 1.2% |
| Algonquin Power & Utilities Corp. | 44,800 | | 381,696 |
| National Grid PLC, Sponsored ADR | 31,913 | | 2,286,566 |
| | | | 2,668,262 |
| OIL, GAS & CONSUMABLE FUELS - 12.4% |
| BP PLC, Sponsored ADR | 89,598 | | 3,609,008 |
| Cameco Corp. | 8,615 | | 236,826 |
| Canadian Natural Resources, Ltd. | 29,032 | | 1,770,081 |
| Cenovus Energy, Inc. | 32,890 | | 552,552 |
| Ecopetrol SA, Sponsored ADR | 2,010 | | 19,537 |
| Enbridge, Inc. | 77,946 | | 3,099,133 |
| Eni S.p.A., Sponsored ADR | 34,569 | | 1,046,749 |
| Equinor ASA, Sponsored ADR | 35,317 | | 1,015,011 |
| Imperial Oil Ltd. | 6,600 | | 336,138 |
| Pembina Pipeline Corp. | 18,980 | | 625,011 |
| Petroleo Brasileiro SA, Sponsored ADR | 97,880 | | 1,039,486 |
| Shell PLC, ADR | 101,755 | | 6,306,775 |
| Suncor Energy, Inc. | 36,245 | | 1,135,193 |
| TC Energy Corp. | 36,670 | | 1,523,272 |
| TotalEnergies SE, Sponsored ADR | 67,780 | | 4,333,175 |
| | | | 26,647,947 |
| PAPER & FOREST PRODUCTS - 0.1% |
| Suzano SA, Sponsored ADR | 23,870 | | 190,244 |
| PASSENGER AIRLINES - 0.2% |
| Ryanair Holdings PLC, Sponsored ADR(a) | 3,588 | | 342,977 |
| PERSONAL CARE PRODUCTS - 3.3% |
| Haleon PLC, ADR | 133,290 | | 1,182,282 |
| Natura & Co. Holding SA, ADR | 19,090 | | 83,805 |
| Unilever PLC, Sponsored ADR | 106,865 | | 5,934,214 |
| | | | 7,200,301 |
| PROFESSIONAL SERVICES - 2.4% |
| RELX PLC, Sponsored ADR | 85,188 | | 2,820,575 |
| Thomson Reuters Corp. | 18,204 | | 2,394,008 |
| | | | 5,214,583 |
| | Shares | | Value |
| REAL ESTATE MANAGEMENT & DEVELOPMENT - 0.4% |
| FirstService Corp. | 3,603 | | $ 543,116 |
| KE Holdings, Inc., ADR(a) | 15,943 | | 250,146 |
| | | | 793,262 |
| SEMICONDUCTORS & SEMICONDUCTOR EQUIPMENT - 11.1% |
| ASE Industrial Holding Co. Ltd., ADR | 49,515 | | 339,673 |
| ASML Holding N.V., Sponsored NYS | 10,990 | | 6,999,091 |
| STMicroelectronics N.V., Sponsored NYS | 19,633 | | 841,863 |
| Taiwan Semiconductor Manufacturing Co. Ltd., Sponsored ADR | 172,517 | | 14,543,183 |
| United Microelectronics Corp., Sponsored ADR(a) | 145,630 | | 1,169,409 |
| | | | 23,893,219 |
| SOFTWARE - 2.5% |
| Open Text Corp. | 15,810 | | 599,041 |
| SAP SE, Sponsored ADR | 35,314 | | 4,776,925 |
| | | | 5,375,966 |
| TECHNOLOGY HARDWARE, STORAGE & PERIPHERALS - 0.2% |
| Logitech International SA | 6,686 | | 397,550 |
| TEXTILES, APPAREL & LUXURY GOODS - 0.1% |
| Gildan Activewear, Inc. | 4,100 | | 133,578 |
| TRANSPORTATION INFRASTRUCTURE - 0.3% |
| Grupo Aeroportuario del Pacifico SAB de CV, ADR | 1,669 | | 296,364 |
| Grupo Aeroportuario del Sureste SAB de CV, ADR | 1,492 | | 427,190 |
| | | | 723,554 |
| WIRELESS TELECOMMUNICATION SERVICES - 1.9% |
| America Movil SAB de CV, ADR(a) | 76,043 | | 1,634,164 |
| Rogers Communications, Inc., Class B | 25,227 | | 1,245,961 |
| SK Telecom Co. Ltd., Sponsored ADR | 13,622 | | 269,171 |
| Vodafone Group PLC, Sponsored ADR | 81,639 | | 975,586 |
| | | | 4,124,882 |
TOTAL COMMON STOCKS
(COST $207,154,225) | | | 210,233,516 |
See notes to financial statements.
STEWARD FUNDS
SCHEDULE OF PORTFOLIO INVESTMENTS — April 30, 2023
STEWARD INTERNATIONAL ENHANCED INDEX FUND
| | Shares | | Value |
| MASTER LIMITED PARTNERSHIPS - 0.3% |
| MULTI-UTILITIES - 0.3% |
| Brookfield Infrastructure Partners LP | 19,050 | | $ 663,511 |
TOTAL MASTER LIMITED PARTNERSHIPS
(COST $691,005) | | | 663,511 |
| MONEY MARKET FUND - 0.1% |
| Northern Institutional Treasury Portfolio (Premier Class), 4.56%(b) | 223,379 | | 223,379 |
TOTAL MONEY MARKET FUND
(COST $223,379) | | | 223,379 |
| PREFERRED STOCKS - 1.4% |
| BANKS - 0.6% |
| Bancolombia SA, Sponsored ADR, 11.36%(c) | 2,520 | | 61,740 |
| Itau Unibanco Holding SA, Sponsored ADR (a) | 232,207 | | 1,195,866 |
| | | | 1,257,606 |
| CHEMICALS - 0.2% |
| Sociedad Quimica y Minera de Chile SA, Sponsored ADR, 19.11%(c) | 7,159 | | 483,089 |
| ELECTRIC UTILITIES - 0.0% |
| Centrais Eletricas Brasileiras SA, ADR, 4.19%(c) | 6,770 | | 48,135 |
| METALS & MINING - 0.1% |
| Gerdau SA, Sponsored ADR, 2.87%(c) | 37,863 | | 188,936 |
| OIL, GAS & CONSUMABLE FUELS - 0.5% |
| Petroleo Brasileiro SA, Sponsored ADR, 8.79%(c) | 117,048 | | 1,110,786 |
TOTAL PREFERRED STOCKS
(COST $3,172,829) | | | 3,088,552 |
TOTAL INVESTMENTS
(COST $211,241,438) - 99.5% | | | 214,208,958 |
| | | | |
| OTHER ASSETS IN EXCESS OF LIABILITIES - 0.5% | | | 1,055,848 |
| NET ASSETS - 100.0% | | | $ 215,264,806 |
| |
| (a) | Represents non-income producing security. |
| (b) | 7-day current yield as of April 30, 2023 is disclosed. |
| (c) | Current yield is disclosed. Dividends are calculated based on a percentage of the issuer’s net income.
|
| ADR — American Depositary Receipt |
| AG — Aktiengesellschaft |
| ASA — Aksjeselskap |
| LP — Limited Partnership |
| N.V. — Naamloze Vennootschap |
| NYS — New York Shares |
| PLC — Public Limited Company |
| SA — Societe Anonyme |
| Tbk PT — Perseroan Terbatas |
See notes to financial statements.
STEWARD FUNDS
SCHEDULE OF PORTFOLIO INVESTMENTS — April 30, 2023
STEWARD LARGE CAP CORE FUND
The table below sets forth the diversification of the Steward Large Cap Core Fund investments by Industry.
| Industry Diversification | | Percent* |
| Software | | 13.5% |
| Health Care Providers & Services | | 7.8 |
| Technology Hardware, Storage & Peripherals | | 7.5 |
| Financial Services | | 7.1 |
| Specialty Retail | | 5.7 |
| Semiconductors & Semiconductor Equipment | | 5.5 |
| Biotechnology | | 3.7 |
| Broadline Retail | | 3.4 |
| Consumer Finance | | 3.3 |
| Ground Transportation | | 3.0 |
| Interactive Media & Services | | 2.6 |
| Hotels, Restaurants & Leisure | | 2.5 |
| Capital Markets | | 2.4 |
| Professional Services | | 2.3 |
| Building Products | | 2.2 |
| Air Freight & Logistics | | 2.1 |
| Insurance | | 2.1 |
| Diversified Consumer Services | | 1.9 |
| Food Products | | 1.9 |
| Specialized Real Estate Investment Trusts | | 1.9 |
| Real Estate Management & Development | | 1.7 |
| Industry Diversification | | Percent* |
| Communications Equipment | | 1.5% |
| Consumer Staples Distribution & Retail | | 1.5 |
| Oil, Gas & Consumable Fuels | | 1.3 |
| Banks | | 1.2 |
| Machinery | | 1.2 |
| Chemicals | | 1.1 |
| Trading Companies & Distributors | | 1.1 |
| Health Care Equipment & Supplies | | 1.0 |
| Textiles, Apparel & Luxury Goods | | 1.0 |
| Automobile Components | | 0.9 |
| Automobiles | | 0.9 |
Electronic Equipment, Instruments
& Components | | 0.9 |
| Media | | 0.9 |
| Containers & Packaging | | 0.7 |
| Electrical Equipment | | 0.6 |
| Money Market Fund | | 0.2 |
| Total Investments | | 100.1% |
| * | Percentages indicated are based on net assets as of April 30, 2023.
|
See notes to financial statements.
STEWARD FUNDS
SCHEDULE OF PORTFOLIO INVESTMENTS — April 30, 2023
STEWARD LARGE CAP CORE FUND
| | Shares | | Value |
| COMMON STOCKS - 99.9% |
| AIR FREIGHT & LOGISTICS - 2.1% |
| C.H. Robinson Worldwide, Inc. | 8,100 | | $ 817,047 |
| Expeditors International of Washington, Inc. | 7,700 | | 876,568 |
| | | | 1,693,615 |
| AUTOMOBILE COMPONENTS - 0.9% |
| BorgWarner, Inc. | 14,600 | | 702,698 |
| AUTOMOBILES - 0.9% |
| Harley-Davidson, Inc. | 15,800 | | 586,180 |
| Tesla, Inc.(a) | 600 | | 98,586 |
| | | | 684,766 |
| BANKS - 1.2% |
| JPMorgan Chase & Co. | 700 | | 96,768 |
| Regions Financial Corp. | 44,700 | | 816,222 |
| | | | 912,990 |
| BIOTECHNOLOGY - 3.7% |
| Amgen, Inc. | 4,200 | | 1,006,908 |
| Biogen, Inc.(a) | 3,000 | | 912,690 |
| Gilead Sciences, Inc. | 12,300 | | 1,011,183 |
| | | | 2,930,781 |
| BROADLINE RETAIL - 3.4% |
| Amazon.com, Inc.(a) | 11,200 | | 1,181,040 |
| Macy's, Inc. | 44,800 | | 732,032 |
| Nordstrom, Inc. | 48,100 | | 743,626 |
| | | | 2,656,698 |
| BUILDING PRODUCTS - 2.2% |
| Owens Corning | 7,700 | | 822,437 |
| Trane Technologies PLC | 5,000 | | 929,050 |
| | | | 1,751,487 |
| CAPITAL MARKETS - 2.4% |
| Ameriprise Financial, Inc. | 2,600 | | 793,312 |
| Bank of New York Mellon Corp. (The) | 18,400 | | 783,656 |
| Janus Henderson Group PLC | 4,200 | | 108,990 |
| MSCI, Inc. | 500 | | 241,225 |
| | | | 1,927,183 |
| CHEMICALS - 1.1% |
| Dow, Inc. | 16,100 | | 875,840 |
| COMMUNICATIONS EQUIPMENT - 1.5% |
| Cisco Systems, Inc. | 25,300 | | 1,195,425 |
| | Shares | | Value |
| CONSUMER FINANCE - 3.3% |
| American Express Co. | 6,200 | | $ 1,000,308 |
| Discover Financial Services | 7,200 | | 744,984 |
| Synchrony Financial | 27,900 | | 823,329 |
| | | | 2,568,621 |
| CONSUMER STAPLES DISTRIBUTION & RETAIL - 1.5% |
| Kroger Co. (The) | 17,200 | | 836,436 |
| US Foods Holding Corp.(a) | 10,000 | | 384,000 |
| | | | 1,220,436 |
| CONTAINERS & PACKAGING - 0.7% |
| Amcor PLC | 48,200 | | 528,754 |
| DIVERSIFIED CONSUMER SERVICES - 1.9% |
| Grand Canyon Education, Inc.(a) | 6,600 | | 783,420 |
| H&R Block, Inc. | 20,600 | | 698,546 |
| | | | 1,481,966 |
| ELECTRICAL EQUIPMENT - 0.6% |
| Acuity Brands, Inc. | 3,200 | | 503,616 |
ELECTRONIC EQUIPMENT, INSTRUMENTS & COMPONENTS -
0.9% |
| Jabil, Inc. | 9,100 | | 711,165 |
| FINANCIAL SERVICES - 7.1% |
| Berkshire Hathaway, Inc., Class B(a) | 1,400 | | 459,970 |
| Mastercard, Inc., Class A | 4,000 | | 1,520,120 |
| MGIC Investment Corp. | 38,600 | | 573,982 |
| Visa, Inc., Class A | 7,000 | | 1,629,110 |
| Western Union Co. (The) | 55,100 | | 602,243 |
| WEX, Inc.(a) | 4,500 | | 798,075 |
| | | | 5,583,500 |
| FOOD PRODUCTS - 1.9% |
| General Mills, Inc. | 10,300 | | 912,889 |
| Mondelez International, Inc., Class A | 8,000 | | 613,760 |
| | | | 1,526,649 |
| GROUND TRANSPORTATION - 3.0% |
| CSX Corp. | 26,500 | | 811,960 |
| Landstar System, Inc. | 4,500 | | 792,135 |
| Ryder System, Inc. | 9,300 | | 736,188 |
| | | | 2,340,283 |
| HEALTH CARE EQUIPMENT & SUPPLIES - 1.0% |
| Hologic, Inc.(a) | 9,600 | | 825,696 |
See notes to financial statements.
STEWARD FUNDS
SCHEDULE OF PORTFOLIO INVESTMENTS — April 30, 2023
STEWARD LARGE CAP CORE FUND
| | Shares | | Value |
| HEALTH CARE PROVIDERS & SERVICES - 7.8% |
| AmerisourceBergen Corp. | 4,900 | | $ 817,565 |
| Cardinal Health, Inc. | 10,300 | | 845,630 |
| Cigna Group (The) | 3,700 | | 937,173 |
| Elevance Health, Inc. | 2,200 | | 1,031,030 |
| Humana, Inc. | 1,700 | | 901,833 |
| McKesson Corp. | 2,600 | | 947,024 |
| Quest Diagnostics, Inc. | 4,700 | | 652,407 |
| | | | 6,132,662 |
| HOTELS, RESTAURANTS & LEISURE - 2.5% |
| Booking Holdings, Inc.(a) | 400 | | 1,074,524 |
| Hilton Worldwide Holdings, Inc. | 6,300 | | 907,326 |
| | | | 1,981,850 |
| INSURANCE - 2.1% |
| Aflac, Inc. | 13,500 | | 942,975 |
| Hartford Financial Services Group, Inc. (The) | 10,500 | | 745,395 |
| | | | 1,688,370 |
| INTERACTIVE MEDIA & SERVICES - 2.6% |
| Alphabet, Inc., Class A(a) | 16,200 | | 1,738,908 |
| Meta Platforms, Inc., Class A(a) | 1,300 | | 312,416 |
| | | | 2,051,324 |
| MACHINERY - 1.2% |
| Deere & Co. | 2,500 | | 945,050 |
| MEDIA - 0.9% |
| Interpublic Group of Cos., Inc. (The) | 20,400 | | 728,892 |
| OIL, GAS & CONSUMABLE FUELS - 1.3% |
| ConocoPhillips | 7,500 | | 771,675 |
| Exxon Mobil Corp. | 2,000 | | 236,680 |
| | | | 1,008,355 |
| PROFESSIONAL SERVICES - 2.3% |
| Booz Allen Hamilton Holding Corp. | 2,800 | | 268,016 |
| Genpact Ltd. | 17,600 | | 784,080 |
| ManpowerGroup, Inc. | 9,800 | | 741,958 |
| | | | 1,794,054 |
| REAL ESTATE MANAGEMENT & DEVELOPMENT - 1.7% |
| CBRE Group, Inc., Class A(a) | 11,700 | | 896,922 |
| Jones Lang LaSalle, Inc.(a) | 2,900 | | 403,216 |
| | | | 1,300,138 |
| SEMICONDUCTORS & SEMICONDUCTOR EQUIPMENT - 5.5% |
| Applied Materials, Inc. | 8,700 | | 983,361 |
| | Shares | | Value |
| Cirrus Logic, Inc.(a) | 7,900 | | $ 677,741 |
| Lam Research Corp. | 1,900 | | 995,752 |
| NVIDIA Corp. | 2,100 | | 582,729 |
| QUALCOMM, Inc. | 9,200 | | 1,074,560 |
| | | | 4,314,143 |
| SOFTWARE - 13.5% |
| Adobe, Inc.(a) | 3,200 | | 1,208,192 |
| Autodesk, Inc.(a) | 4,600 | | 896,034 |
| Cadence Design Systems, Inc.(a) | 4,400 | | 921,580 |
| Dropbox, Inc., Class A(a) | 33,300 | | 677,322 |
| Microsoft Corp. | 12,800 | | 3,932,928 |
| Salesforce, Inc.(a) | 2,700 | | 535,599 |
| Synopsys, Inc.(a) | 2,400 | | 891,168 |
| Teradata Corp.(a) | 18,800 | | 727,748 |
| VMware, Inc., Class A(a) | 6,700 | | 837,701 |
| | | | 10,628,272 |
| SPECIALIZED REAL ESTATE INVESTMENT TRUSTS - 1.9% |
| Equinix, Inc. | 1,300 | | 941,304 |
| Weyerhaeuser Co. | 19,600 | | 586,236 |
| | | | 1,527,540 |
| SPECIALTY RETAIL - 5.7% |
| AutoZone, Inc.(a) | 300 | | 798,993 |
| Best Buy Co., Inc. | 9,700 | | 722,844 |
| Lowe’s Cos., Inc. | 5,300 | | 1,101,499 |
| TJX Cos., Inc. (The) | 12,400 | | 977,368 |
| Ulta Beauty, Inc.(a) | 1,600 | | 882,288 |
| | | | 4,482,992 |
| TECHNOLOGY HARDWARE, STORAGE & PERIPHERALS - 7.5% |
| Apple, Inc. | 26,500 | | 4,496,520 |
| Hewlett Packard Enterprise Co. | 51,000 | | 730,320 |
| HP, Inc. | 24,300 | | 721,953 |
| | | | 5,948,793 |
| TEXTILES, APPAREL & LUXURY GOODS - 1.0% |
| Deckers Outdoor Corp.(a) | 1,700 | | 814,878 |
| TRADING COMPANIES & DISTRIBUTORS - 1.1% |
| W.W. Grainger, Inc. | 1,200 | | 834,684 |
TOTAL COMMON STOCKS
(COST $78,198,715) | | | 78,804,166 |
| MONEY MARKET FUND - 0.2% |
| Northern Institutional Treasury Portfolio (Premier Class), 4.56%(b) | 160,052 | | 160,052 |
TOTAL MONEY MARKET FUND
(COST $160,052) | | | 160,052 |
See notes to financial statements.
STEWARD FUNDS
SCHEDULE OF PORTFOLIO INVESTMENTS — April 30, 2023
STEWARD LARGE CAP CORE FUND
| | Shares | | Value |
TOTAL INVESTMENTS
(COST $78,358,767) - 100.1% | | | $ 78,964,218 |
| | | | |
| LIABILITIES IN EXCESS OF OTHER ASSETS - (0.1)% | | | (115,933) |
| NET ASSETS - 100.0% | | | $ 78,848,285 |
| |
| (a) | Represents non-income producing security. |
| (b) | 7-day current yield as of April 30, 2023 is disclosed.
|
| MSCI — Morgan Stanley Capital International |
| PLC — Public Limited Company |
See notes to financial statements.
STEWARD FUNDS
SCHEDULE OF PORTFOLIO INVESTMENTS — April 30, 2023
STEWARD LARGE CAP GROWTH FUND
The table below sets forth the diversification of the Steward Large Cap Growth Fund investments by Industry.
| Industry Diversification | | Percent* |
| Software | | 18.5% |
| Technology Hardware, Storage & Peripherals | | 13.0 |
| Financial Services | | 7.5 |
| Health Care Providers & Services | | 6.5 |
| Specialty Retail | | 6.0 |
| Semiconductors & Semiconductor Equipment | | 5.8 |
| Broadline Retail | | 4.8 |
| Interactive Media & Services | | 4.4 |
| Specialized Real Estate Investment Trusts | | 3.7 |
| Biotechnology | | 2.5 |
| Consumer Finance | | 2.4 |
| Air Freight & Logistics | | 2.2 |
| Textiles, Apparel & Luxury Goods | | 2.1 |
| Ground Transportation | | 2.0 |
| Professional Services | | 2.0 |
| Capital Markets | | 1.6 |
| Machinery | | 1.4 |
| Containers & Packaging | | 1.3 |
| Trading Companies & Distributors | | 1.3 |
| Automobiles | | 1.1 |
| Industry Diversification | | Percent* |
| Hotels, Restaurants & Leisure | | 1.1% |
| Real Estate Management & Development | | 1.1 |
| Retail Real Estate Investment Trusts | | 1.1 |
| Commercial Services & Supplies | | 1.0 |
| Distributors | | 1.0 |
| IT Services | | 1.0 |
Electronic Equipment, Instruments
& Components | | 0.9 |
| Diversified Consumer Services | | 0.8 |
| Chemicals | | 0.7 |
| Pharmaceuticals | | 0.4 |
| Money Market Fund | | 0.3 |
| Consumer Staples Distribution & Retail | | 0.2 |
| Household Durables | | 0.2 |
| Life Sciences Tools & Services | | 0.2 |
| Beverages | | 0.1 |
| Building Products | | 0.1 |
| Total Investments | | 100.3% |
| * | Percentages indicated are based on net assets as of April 30, 2023.
|
See notes to financial statements.
STEWARD FUNDS
SCHEDULE OF PORTFOLIO INVESTMENTS — April 30, 2023
STEWARD LARGE CAP GROWTH FUND
| | Shares | | Value |
| COMMON STOCKS - 100.0% |
| AIR FREIGHT & LOGISTICS - 2.2% |
| C.H. Robinson Worldwide, Inc. | 8,000 | | $ 806,960 |
| Expeditors International of Washington, Inc. | 7,100 | | 808,264 |
| | | | 1,615,224 |
| AUTOMOBILES - 1.1% |
| Tesla, Inc.(a) | 5,200 | | 854,412 |
| BEVERAGES - 0.1% |
| PepsiCo, Inc. | 600 | | 114,534 |
| BIOTECHNOLOGY - 2.5% |
| Amgen, Inc. | 4,600 | | 1,102,804 |
| Incyte Corp.(a) | 10,300 | | 766,423 |
| | | | 1,869,227 |
| BROADLINE RETAIL - 4.8% |
| Amazon.com, Inc.(a) | 27,100 | | 2,857,695 |
| Nordstrom, Inc. | 47,000 | | 726,620 |
| | | | 3,584,315 |
| BUILDING PRODUCTS - 0.1% |
| Trane Technologies PLC | 400 | | 74,324 |
| CAPITAL MARKETS - 1.6% |
| Ameriprise Financial, Inc. | 2,800 | | 854,336 |
| MSCI, Inc. | 700 | | 337,715 |
| | | | 1,192,051 |
| CHEMICALS - 0.7% |
| Dow, Inc. | 9,400 | | 511,360 |
| COMMERCIAL SERVICES & SUPPLIES - 1.0% |
| Ritchie Bros Auctioneers, Inc. | 13,400 | | 766,346 |
| CONSUMER FINANCE - 2.4% |
| American Express Co. | 4,700 | | 758,298 |
| Discover Financial Services | 5,400 | | 558,738 |
| Synchrony Financial | 15,300 | | 451,503 |
| | | | 1,768,539 |
| CONSUMER STAPLES DISTRIBUTION & RETAIL - 0.2% |
| Costco Wholesale Corp. | 300 | | 150,966 |
| CONTAINERS & PACKAGING - 1.3% |
| Berry Global Group, Inc. | 13,200 | | 763,092 |
| Graphic Packaging Holding Co. | 10,100 | | 249,066 |
| | | | 1,012,158 |
| | Shares | | Value |
| DISTRIBUTORS - 1.0% |
| Genuine Parts Co. | 4,400 | | $ 740,564 |
| DIVERSIFIED CONSUMER SERVICES - 0.8% |
| H&R Block, Inc. | 17,600 | | 596,816 |
ELECTRONIC EQUIPMENT, INSTRUMENTS & COMPONENTS -
0.9% |
| Jabil, Inc. | 8,900 | | 695,535 |
| FINANCIAL SERVICES - 7.5% |
| Mastercard, Inc., Class A | 5,300 | | 2,014,159 |
| Visa, Inc., Class A | 9,600 | | 2,234,208 |
| Western Union Co. (The) | 53,100 | | 580,383 |
| WEX, Inc.(a) | 4,400 | | 780,340 |
| | | | 5,609,090 |
| GROUND TRANSPORTATION - 2.0% |
| Landstar System, Inc. | 4,300 | | 756,929 |
| RXO, Inc.(a) | 40,200 | | 727,218 |
| | | | 1,484,147 |
| HEALTH CARE PROVIDERS & SERVICES - 6.5% |
| AmerisourceBergen Corp. | 5,300 | | 884,305 |
| Cardinal Health, Inc. | 6,700 | | 550,070 |
| Cigna Group (The) | 3,200 | | 810,528 |
| Elevance Health, Inc. | 1,900 | | 890,435 |
| Humana, Inc. | 1,800 | | 954,882 |
| McKesson Corp. | 2,200 | | 801,328 |
| | | | 4,891,548 |
| HOTELS, RESTAURANTS & LEISURE - 1.1% |
| Hilton Worldwide Holdings, Inc. | 5,500 | | 792,110 |
| HOUSEHOLD DURABLES - 0.2% |
| TopBuild Corp.(a) | 700 | | 157,836 |
| INTERACTIVE MEDIA & SERVICES - 4.4% |
| Alphabet, Inc., Class A(a) | 30,500 | | 3,273,870 |
| IT SERVICES - 1.0% |
| Gartner, Inc.(a) | 2,400 | | 725,904 |
| LIFE SCIENCES TOOLS & SERVICES - 0.2% |
| Danaher Corp. | 700 | | 165,837 |
| MACHINERY - 1.4% |
| AGCO Corp. | 2,500 | | 309,850 |
| Otis Worldwide Corp. | 8,900 | | 759,170 |
| | | | 1,069,020 |
See notes to financial statements.
STEWARD FUNDS
SCHEDULE OF PORTFOLIO INVESTMENTS — April 30, 2023
STEWARD LARGE CAP GROWTH FUND
| | Shares | | Value |
| PHARMACEUTICALS - 0.4% |
| Eli Lilly & Co. | 700 | | $ 277,102 |
| PROFESSIONAL SERVICES - 2.0% |
| Genpact Ltd. | 16,900 | | 752,895 |
| Robert Half International, Inc. | 10,500 | | 766,500 |
| | | | 1,519,395 |
| REAL ESTATE MANAGEMENT & DEVELOPMENT - 1.1% |
| CBRE Group, Inc., Class A(a) | 11,100 | | 850,926 |
| RETAIL REAL ESTATE INVESTMENT TRUSTS - 1.1% |
| Simon Property Group, Inc. | 7,400 | | 838,568 |
| SEMICONDUCTORS & SEMICONDUCTOR EQUIPMENT - 5.8% |
| Broadcom, Inc. | 400 | | 250,600 |
| Lam Research Corp. | 2,000 | | 1,048,160 |
| NVIDIA Corp. | 6,400 | | 1,775,936 |
| QUALCOMM, Inc. | 10,600 | | 1,238,080 |
| | | | 4,312,776 |
| SOFTWARE - 18.5% |
| Adobe, Inc.(a) | 3,200 | | 1,208,192 |
| Autodesk, Inc.(a) | 4,500 | | 876,555 |
| Cadence Design Systems, Inc.(a) | 4,600 | | 963,470 |
| Dropbox, Inc., Class A(a) | 27,300 | | 555,282 |
| Microsoft Corp. | 26,100 | | 8,019,486 |
| Synopsys, Inc.(a) | 2,500 | | 928,300 |
| Teradata Corp.(a) | 18,900 | | 731,619 |
| VMware, Inc., Class A(a) | 4,900 | | 612,647 |
| | | | 13,895,551 |
| SPECIALIZED REAL ESTATE INVESTMENT TRUSTS - 3.7% |
| American Tower Corp. | 4,800 | | 981,072 |
| Equinix, Inc. | 1,300 | | 941,304 |
| Iron Mountain, Inc. | 15,000 | | 828,600 |
| | | | 2,750,976 |
| SPECIALTY RETAIL - 6.0% |
| AutoZone, Inc.(a) | 200 | | 532,662 |
| Best Buy Co., Inc. | 10,400 | | 775,008 |
| | Shares | | Value |
| Lowe’s Cos., Inc. | 5,800 | | $ 1,205,414 |
| TJX Cos., Inc. (The) | 13,800 | | 1,087,716 |
| Ulta Beauty, Inc.(a) | 1,600 | | 882,288 |
| | | | 4,483,088 |
| TECHNOLOGY HARDWARE, STORAGE & PERIPHERALS - 13.0% |
| Apple, Inc. | 52,900 | | 8,976,072 |
| HP, Inc. | 24,500 | | 727,895 |
| | | | 9,703,967 |
| TEXTILES, APPAREL & LUXURY GOODS - 2.1% |
| Deckers Outdoor Corp.(a) | 1,700 | | 814,878 |
| Tapestry, Inc. | 17,800 | | 726,418 |
| | | | 1,541,296 |
| TRADING COMPANIES & DISTRIBUTORS - 1.3% |
| W.W. Grainger, Inc. | 1,300 | | 904,241 |
| WESCO International, Inc. | 700 | | 100,800 |
| | | | 1,005,041 |
TOTAL COMMON STOCKS
(COST $73,623,713) | | | 74,894,419 |
| MONEY MARKET FUND - 0.3% |
| Northern Institutional Treasury Portfolio (Premier Class), 4.56%(b) | 191,612 | | 191,612 |
TOTAL MONEY MARKET FUND
(COST $191,612) | | | 191,612 |
TOTAL INVESTMENTS
(COST $73,815,325) - 100.3% | | | 75,086,031 |
| | | | |
| LIABILITIES IN EXCESS OF OTHER ASSETS - (0.3)% | | | (204,021) |
| NET ASSETS - 100.0% | | | $ 74,882,010 |
| |
| (a) | Represents non-income producing security. |
| (b) | 7-day current yield as of April 30, 2023 is disclosed.
|
| MSCI — Morgan Stanley Capital International |
| PLC — Public Limited Company |
See notes to financial statements.
STEWARD FUNDS
SCHEDULE OF PORTFOLIO INVESTMENTS — April 30, 2023
STEWARD LARGE CAP VALUE FUND
The table below sets forth the diversification of the Steward Large Cap Value Fund investments by Industry.
| Industry Diversification | | Percent* |
| Banks | | 8.0% |
| Health Care Providers & Services | | 8.0 |
| Oil, Gas & Consumable Fuels | | 7.5 |
| Software | | 5.2 |
| Financial Services | | 4.8 |
| Specialty Retail | | 4.5 |
| Food Products | | 4.1 |
| Biotechnology | | 4.0 |
| Specialized Real Estate Investment Trusts | | 4.0 |
| Building Products | | 3.5 |
| Consumer Finance | | 3.5 |
| Insurance | | 3.3 |
| Capital Markets | | 3.2 |
| Professional Services | | 2.8 |
| Air Freight & Logistics | | 2.6 |
| Containers & Packaging | | 2.6 |
| Ground Transportation | | 2.2 |
| Communications Equipment | | 2.1 |
| Real Estate Management & Development | | 2.1 |
| Technology Hardware, Storage & Peripherals | | 2.1 |
| Broadline Retail | | 1.9 |
| Industry Diversification | | Percent* |
| Diversified Consumer Services | | 1.7% |
| Textiles, Apparel & Luxury Goods | | 1.6 |
| Consumer Staples Distribution & Retail | | 1.3 |
| Interactive Media & Services | | 1.3 |
| Metals & Mining | | 1.3 |
| Chemicals | | 1.2 |
| IT Services | | 1.2 |
| Automobile Components | | 1.1 |
| Hotels, Restaurants & Leisure | | 1.1 |
| Retail Real Estate Investment Trusts | | 1.1 |
Electronic Equipment, Instruments
& Components | | 1.0 |
| Media | | 1.0 |
| Pharmaceuticals | | 0.9 |
| Automobiles | | 0.8 |
| Semiconductors & Semiconductor Equipment | | 0.8 |
| Household Products | | 0.5 |
| Money Market Fund | | 0.2 |
| Total Investments | | 100.1% |
| * | Percentages indicated are based on net assets as of April 30, 2023.
|
See notes to financial statements.
STEWARD FUNDS
SCHEDULE OF PORTFOLIO INVESTMENTS — April 30, 2023
STEWARD LARGE CAP VALUE FUND
| | Shares | | Value |
| COMMON STOCKS - 99.9% |
| AIR FREIGHT & LOGISTICS - 2.6% |
| C.H. Robinson Worldwide, Inc. | 7,000 | | $ 706,090 |
| Expeditors International of Washington, Inc. | 6,300 | | 717,192 |
| FedEx Corp. | 1,100 | | 250,558 |
| | | | 1,673,840 |
| AUTOMOBILE COMPONENTS - 1.1% |
| BorgWarner, Inc. | 14,200 | | 683,446 |
| AUTOMOBILES - 0.8% |
| Harley-Davidson, Inc. | 12,900 | | 478,590 |
| BANKS - 8.0% |
| Bank of America Corp. | 44,900 | | 1,314,672 |
| Citigroup, Inc. | 9,100 | | 428,337 |
| JPMorgan Chase & Co. | 13,100 | | 1,810,944 |
| PNC Financial Services Group, Inc. (The) | 6,200 | | 807,550 |
| Regions Financial Corp. | 37,200 | | 679,272 |
| | | | 5,040,775 |
| BIOTECHNOLOGY - 4.0% |
| Amgen, Inc. | 2,900 | | 695,246 |
| Biogen, Inc.(a) | 2,700 | | 821,421 |
| Gilead Sciences, Inc. | 12,200 | | 1,002,962 |
| | | | 2,519,629 |
| BROADLINE RETAIL - 1.9% |
| Macy's, Inc. | 36,400 | | 594,776 |
| Nordstrom, Inc. | 39,100 | | 604,486 |
| | | | 1,199,262 |
| BUILDING PRODUCTS - 3.5% |
| Johnson Controls International PLC | 12,900 | | 771,936 |
| Owens Corning | 6,300 | | 672,903 |
| Trane Technologies PLC | 4,000 | | 743,240 |
| | | | 2,188,079 |
| CAPITAL MARKETS - 3.2% |
| Ameriprise Financial, Inc. | 2,100 | | 640,752 |
| Bank of New York Mellon Corp. (The) | 16,200 | | 689,958 |
| MSCI, Inc. | 1,400 | | 675,430 |
| | | | 2,006,140 |
| CHEMICALS - 1.2% |
| Dow, Inc. | 14,200 | | 772,480 |
| COMMUNICATIONS EQUIPMENT - 2.1% |
| Cisco Systems, Inc. | 27,600 | | 1,304,100 |
| | Shares | | Value |
| CONSUMER FINANCE - 3.5% |
| American Express Co. | 5,800 | | $ 935,772 |
| Discover Financial Services | 5,800 | | 600,126 |
| Synchrony Financial | 23,300 | | 687,583 |
| | | | 2,223,481 |
| CONSUMER STAPLES DISTRIBUTION & RETAIL - 1.3% |
| Kroger Co. (The) | 15,200 | | 739,176 |
| Walmart, Inc. | 700 | | 105,679 |
| | | | 844,855 |
| CONTAINERS & PACKAGING - 2.6% |
| Amcor PLC | 42,000 | | 460,740 |
| Berry Global Group, Inc. | 11,000 | | 635,910 |
| Graphic Packaging Holding Co. | 21,000 | | 517,860 |
| | | | 1,614,510 |
| DIVERSIFIED CONSUMER SERVICES - 1.7% |
| Grand Canyon Education, Inc.(a) | 5,300 | | 629,110 |
| H&R Block, Inc. | 13,500 | | 457,785 |
| | | | 1,086,895 |
ELECTRONIC EQUIPMENT, INSTRUMENTS & COMPONENTS -
1.0% |
| Jabil, Inc. | 7,800 | | 609,570 |
| FINANCIAL SERVICES - 4.8% |
| Berkshire Hathaway, Inc., Class B(a) | 4,200 | | 1,379,910 |
| MGIC Investment Corp. | 43,900 | | 652,793 |
| PayPal Holdings, Inc.(a) | 6,700 | | 509,200 |
| Western Union Co. (The) | 46,100 | | 503,873 |
| | | | 3,045,776 |
| FOOD PRODUCTS - 4.1% |
| Archer-Daniels-Midland Co. | 10,000 | | 780,800 |
| General Mills, Inc. | 9,300 | | 824,259 |
| Mondelez International, Inc., Class A | 13,300 | | 1,020,376 |
| | | | 2,625,435 |
| GROUND TRANSPORTATION - 2.2% |
| CSX Corp. | 24,500 | | 750,680 |
| Landstar System, Inc. | 300 | | 52,809 |
| Ryder System, Inc. | 7,500 | | 593,700 |
| | | | 1,397,189 |
| HEALTH CARE PROVIDERS & SERVICES - 8.0% |
| AmerisourceBergen Corp. | 3,500 | | 583,975 |
| Cardinal Health, Inc. | 8,700 | | 714,270 |
| Cigna Group (The) | 3,300 | | 835,857 |
| Elevance Health, Inc. | 2,000 | | 937,300 |
See notes to financial statements.
STEWARD FUNDS
SCHEDULE OF PORTFOLIO INVESTMENTS — April 30, 2023
STEWARD LARGE CAP VALUE FUND
| | Shares | | Value |
| Humana, Inc. | 1,400 | | $ 742,686 |
| McKesson Corp. | 2,200 | | 801,328 |
| Quest Diagnostics, Inc. | 3,100 | | 430,311 |
| | | | 5,045,727 |
| HOTELS, RESTAURANTS & LEISURE - 1.1% |
| Hilton Worldwide Holdings, Inc. | 4,800 | | 691,296 |
| HOUSEHOLD PRODUCTS - 0.5% |
| Kimberly-Clark Corp. | 1,600 | | 231,824 |
| Procter & Gamble Co. (The) | 600 | | 93,828 |
| | | | 325,652 |
| INSURANCE - 3.3% |
| Aflac, Inc. | 11,800 | | 824,230 |
| Hartford Financial Services Group, Inc. (The) | 9,000 | | 638,910 |
| Travelers Cos., Inc. (The) | 3,000 | | 543,420 |
| Unum Group | 2,200 | | 92,840 |
| | | | 2,099,400 |
| INTERACTIVE MEDIA & SERVICES - 1.3% |
| Meta Platforms, Inc., Class A(a) | 3,300 | | 793,056 |
| IT SERVICES - 1.2% |
| International Business Machines Corp. | 5,900 | | 745,819 |
| MEDIA - 1.0% |
| Interpublic Group of Cos., Inc. (The) | 18,400 | | 657,432 |
| METALS & MINING - 1.3% |
| Nucor Corp. | 1,400 | | 207,452 |
| Reliance Steel & Aluminum Co. | 2,600 | | 644,280 |
| | | | 851,732 |
| OIL, GAS & CONSUMABLE FUELS - 7.5% |
| Chevron Corp. | 2,900 | | 488,882 |
| ConocoPhillips | 8,700 | | 895,143 |
| Exxon Mobil Corp. | 8,700 | | 1,029,558 |
| Marathon Petroleum Corp. | 6,400 | | 780,800 |
| Phillips 66 | 8,000 | | 792,000 |
| Valero Energy Corp. | 6,800 | | 779,756 |
| | | | 4,766,139 |
| PHARMACEUTICALS - 0.9% |
| Jazz Pharmaceuticals PLC(a) | 4,200 | | 589,974 |
| | Shares | | Value |
| PROFESSIONAL SERVICES - 2.8% |
| Automatic Data Processing, Inc. | 2,300 | | $ 506,000 |
| Genpact Ltd. | 14,500 | | 645,975 |
| ManpowerGroup, Inc. | 8,100 | | 613,251 |
| | | | 1,765,226 |
| REAL ESTATE MANAGEMENT & DEVELOPMENT - 2.1% |
| CBRE Group, Inc., Class A(a) | 8,800 | | 674,608 |
| Jones Lang LaSalle, Inc.(a) | 4,700 | | 653,488 |
| | | | 1,328,096 |
| RETAIL REAL ESTATE INVESTMENT TRUSTS - 1.1% |
| Simon Property Group, Inc. | 6,400 | | 725,248 |
| SEMICONDUCTORS & SEMICONDUCTOR EQUIPMENT - 0.8% |
| Cirrus Logic, Inc.(a) | 5,800 | | 497,582 |
| SOFTWARE - 5.2% |
| Dropbox, Inc., Class A(a) | 13,500 | | 274,590 |
| Salesforce, Inc.(a) | 5,800 | | 1,150,546 |
| Synopsys, Inc.(a) | 1,600 | | 594,112 |
| Teradata Corp.(a) | 15,800 | | 611,618 |
| VMware, Inc., Class A | 5,500 | | 687,665 |
| | | | 3,318,531 |
| SPECIALIZED REAL ESTATE INVESTMENT TRUSTS - 4.0% |
| American Tower Corp. | 3,300 | | 674,487 |
| Equinix, Inc. | 1,000 | | 724,080 |
| Iron Mountain, Inc. | 11,000 | | 607,640 |
| Weyerhaeuser Co. | 18,300 | | 547,353 |
| | | | 2,553,560 |
| SPECIALTY RETAIL - 4.5% |
| AutoZone, Inc.(a) | 300 | | 798,993 |
| Best Buy Co., Inc. | 8,600 | | 640,872 |
| Lowe’s Cos., Inc. | 3,500 | | 727,405 |
| Ross Stores, Inc. | 6,400 | | 683,072 |
| | | | 2,850,342 |
| TECHNOLOGY HARDWARE, STORAGE & PERIPHERALS - 2.1% |
| Hewlett Packard Enterprise Co. | 43,500 | | 622,920 |
| HP, Inc. | 22,700 | | 674,417 |
| | | | 1,297,337 |
See notes to financial statements.
STEWARD FUNDS
SCHEDULE OF PORTFOLIO INVESTMENTS — April 30, 2023
STEWARD LARGE CAP VALUE FUND
| | Shares | | Value |
| TEXTILES, APPAREL & LUXURY GOODS - 1.6% |
| Deckers Outdoor Corp.(a) | 1,300 | | $ 623,142 |
| PVH Corp. | 1,100 | | 94,391 |
| Tapestry, Inc. | 6,800 | | 277,508 |
| | | | 995,041 |
TOTAL COMMON STOCKS
(COST $62,615,620) | | | 63,211,242 |
| MONEY MARKET FUND - 0.2% |
| Northern Institutional Treasury Portfolio (Premier Class), 4.56%(b) | 119,549 | | 119,549 |
TOTAL MONEY MARKET FUND
(COST $119,549) | | | 119,549 |
TOTAL INVESTMENTS
(COST $62,735,169) - 100.1% | | | 63,330,791 |
| | | | |
| LIABILITIES IN EXCESS OF OTHER ASSETS - (0.1)% | | | (65,924) |
| NET ASSETS - 100.0% | | | $ 63,264,867 |
| |
| (a) | Represents non-income producing security. |
| (b) | 7-day current yield as of April 30, 2023 is disclosed.
|
| MSCI — Morgan Stanley Capital International |
| PLC — Public Limited Company |
See notes to financial statements.
STEWARD FUNDS
SCHEDULE OF PORTFOLIO INVESTMENTS — April 30, 2023
STEWARD SELECT BOND FUND
The table below sets forth the diversification of the Steward Select Bond Fund investments by Industry.
| Industry Diversification | | Percent* |
| U.S. Government Agencies | | 27.5% |
| Semiconductors & Semiconductor Equipment | | 5.0 |
| Software | | 5.0 |
| Consumer Staples Distribution & Retail | | 4.9 |
| IT Services | | 4.3 |
| U.S. Government Agency Mortgage-Backed Obligations | | 4.2 |
| Capital Markets | | 3.3 |
| Municipal Bonds | | 3.2 |
| Aerospace & Defense | | 3.0 |
| Hotels, Restaurants & Leisure | | 2.9 |
| Money Market Fund | | 2.8 |
| Textiles, Apparel & Luxury Goods | | 2.8 |
| U.S. Treasury Obligations | | 2.8 |
| Air Freight & Logistics | | 2.5 |
| Specialty Retail | | 2.5 |
| Health Care Providers & Services | | 1.9 |
| Media | | 1.9 |
| Oil, Gas & Consumable Fuels | | 1.9 |
| Technology Hardware, Storage & Peripherals | | 1.7 |
| Industry Diversification | | Percent* |
| Banks | | 1.3% |
| Broadline Retail | | 1.3 |
| Consumer Finance | | 1.3 |
| Electric Utilities | | 1.3 |
| Food Products | | 1.3 |
| Machinery | | 1.3 |
| Communications Equipment | | 1.2 |
| Entertainment | | 1.2 |
| Industrial Conglomerates | | 1.2 |
| Pharmaceuticals | | 1.2 |
| Chemicals | | 1.1 |
| Biotechnology | | 0.9 |
| Diversified Telecommunication Services | | 0.6 |
| Household Products | | 0.6 |
| Insurance | | 0.3 |
| Financial Services | | 0.0** |
| Total Investments | | 100.2% |
| * | Percentages indicated are based on net assets as of April 30, 2023. |
| ** | Amount rounds to less than 0.1%.
|
See notes to financial statements.
STEWARD FUNDS
SCHEDULE OF PORTFOLIO INVESTMENTS — April 30, 2023
STEWARD SELECT BOND FUND
| | Principal
Amount | | Value |
| ASSET-BACKED SECURITIES - 0.0% |
| FINANCIAL SERVICES - 0.0% |
| Opteum Mortgage Acceptance Corp., Class 2AD2, 5.85% 12/25/35, (a) | $ 29,269 | | $ 28,944 |
TOTAL ASSET-BACKED SECURITIES
(COST $29,408) | | | 28,944 |
| CORPORATE BONDS - 59.7% |
| AEROSPACE & DEFENSE - 3.0% |
| General Dynamics Corp., 3.75%, 5/15/28 | 2,000,000 | | 1,961,943 |
| Lockheed Martin Corp., 3.55%, 1/15/26, (Callable 10/15/25 @ 100) | 1,000,000 | | 985,858 |
| Raytheon Technologies Corp., 3.75%, 11/1/46, (Callable 5/1/46 @ 100) | 2,000,000 | | 1,651,040 |
| | | | 4,598,841 |
| AIR FREIGHT & LOGISTICS - 2.5% |
| United Parcel Service, Inc., 3.05%, 11/15/27 | 1,000,000 | | 961,189 |
| United Parcel Service, Inc., 3.75%, 11/15/47 | 1,000,000 | | 864,451 |
| United Parcel Service, Inc., 3.90%, 4/1/25 | 2,000,000 | | 1,985,055 |
| | | | 3,810,695 |
| BANKS - 1.3% |
| Citigroup, Inc., 4.40%, 6/10/25 | 1,000,000 | | 982,985 |
| Citigroup, Inc., 6.63%, 6/15/32 | 1,000,000 | | 1,080,217 |
| | | | 2,063,202 |
| BIOTECHNOLOGY - 0.9% |
| AbbVie, Inc., 4.50%, 5/14/35, (Callable 11/14/34 @ 100) | 1,500,000 | | 1,459,854 |
| BROADLINE RETAIL - 1.3% |
| Amazon.com, Inc., 3.80%, 12/5/24, (Callable 9/5/24 @ 100) | 2,000,000 | | 1,982,105 |
| CAPITAL MARKETS - 3.3% |
| Charles Schwab Corp. (The), 2.00%, 3/20/28 | 2,000,000 | | 1,745,737 |
| Charles Schwab Corp. (The), 5.00% (H15T5Y + 326 bps), 6/1/27(a) | 1,000,000 | | 862,500 |
| Goldman Sachs Group, Inc. (The), 5.95%, 1/15/27 | 1,500,000 | | 1,547,423 |
| Morgan Stanley, 4.00%, 7/23/25 | 1,000,000 | | 985,605 |
| | | | 5,141,265 |
| CHEMICALS - 1.1% |
| Sherwin-Williams Co. (The), 2.95%, 8/15/29 | 1,000,000 | | 904,480 |
| Sherwin-Williams Co. (The), 3.80%, 8/15/49 | 1,000,000 | | 777,748 |
| | | | 1,682,228 |
| | Principal
Amount | | Value |
| COMMUNICATIONS EQUIPMENT - 1.2% |
| Cisco Systems, Inc., 2.50%, 9/20/26, (Callable 6/20/26 @ 100) | $ 2,000,000 | | $ 1,903,786 |
| CONSUMER FINANCE - 1.3% |
| American Express Co., 3.40%, 2/22/24, (Callable 1/22/24 @ 100) | 1,000,000 | | 986,296 |
| American Express Credit Corp., 3.30%, 5/3/27, (Callable 4/3/27 @ 100) | 1,000,000 | | 956,995 |
| | | | 1,943,291 |
| CONSUMER STAPLES DISTRIBUTION & RETAIL - 4.9% |
| Sysco Corp., 3.25%, 7/15/27 | 2,000,000 | | 1,906,445 |
| Target Corp., 3.50%, 7/1/24 | 2,000,000 | | 1,974,260 |
| Walgreens Boots Alliance, Inc., 4.50%, 11/18/34, (Callable 5/18/34 @ 100) | 2,000,000 | | 1,845,182 |
| Walmart, Inc., 3.25%, 7/8/29 | 2,000,000 | | 1,919,332 |
| | | | 7,645,219 |
| DIVERSIFIED TELECOMMUNICATION SERVICES - 0.6% |
| Verizon Communications, Inc., 4.50%, 8/10/33 | 1,000,000 | | 966,115 |
| ELECTRIC UTILITIES - 1.3% |
| Duke Energy Corp., 4.50%, 8/15/32 | 2,000,000 | | 1,941,469 |
| ENTERTAINMENT - 1.2% |
| Walt Disney Co. (The), 3.80%, 3/22/30 | 2,000,000 | | 1,934,841 |
| FOOD PRODUCTS - 1.3% |
| General Mills, Inc., 4.20%, 4/17/28 | 2,000,000 | | 1,989,231 |
| HEALTH CARE PROVIDERS & SERVICES - 1.9% |
| CVS Health Corp., 4.00%, 12/5/23, (Callable 9/5/23 @ 100) | 2,000,000 | | 1,983,797 |
| Evernorth Health, Inc., 4.50%, 2/25/26, (Callable 11/27/25 @ 100) | 1,000,000 | | 994,321 |
| | | | 2,978,118 |
| HOTELS, RESTAURANTS & LEISURE - 2.9% |
| McDonald's Corp., 3.60%, 7/1/30, (Callable 4/1/30 @ 100) | 1,000,000 | | 952,495 |
| McDonald's Corp., 3.63%, 9/1/49, (Callable 3/1/49 @ 100) | 2,500,000 | | 1,983,500 |
| Starbucks Corp., 3.75%, 12/1/47 | 2,000,000 | | 1,622,025 |
| | | | 4,558,020 |
| HOUSEHOLD PRODUCTS - 0.6% |
| Procter & Gamble Co. (The), 3.00%, 3/25/30 | 1,000,000 | | 940,857 |
| INDUSTRIAL CONGLOMERATES - 1.2% |
| 3M Co., 2.88%, 10/15/27 | 2,000,000 | | 1,879,468 |
See notes to financial statements.
STEWARD FUNDS
SCHEDULE OF PORTFOLIO INVESTMENTS — April 30, 2023
STEWARD SELECT BOND FUND
| | Principal
Amount | | Value |
| INSURANCE - 0.3% |
| Prudential Financial, Inc., 5.13% (H15T5Y + 316 bps), 3/1/52(a) | $ 500,000 | | $ 452,365 |
| IT SERVICES - 4.3% |
| Fiserv, Inc., 4.20%, 10/1/28 | 1,000,000 | | 975,415 |
| Mastercard, Inc., 3.38%, 4/1/24 | 2,000,000 | | 1,969,406 |
| PayPal Holdings, Inc., 2.85%, 10/1/29 | 2,000,000 | | 1,816,164 |
| Visa, Inc., 4.30%, 12/14/45, (Callable 6/14/45 @ 100) | 2,000,000 | | 1,941,154 |
| | | | 6,702,139 |
| MACHINERY - 1.3% |
| John Deere Capital Corp., 3.45%, 3/13/25 | 2,000,000 | | 1,963,598 |
| MEDIA - 1.9% |
| Comcast Corp., 3.70%, 4/15/24 | 3,000,000 | | 2,963,121 |
| OIL, GAS & CONSUMABLE FUELS - 1.9% |
| Valero Energy Corp., 4.00%, 4/1/29 | 3,000,000 | | 2,904,508 |
| PHARMACEUTICALS - 1.2% |
| Pfizer, Inc., 4.00%, 12/15/36 | 2,000,000 | | 1,925,819 |
| SEMICONDUCTORS & SEMICONDUCTOR EQUIPMENT - 5.0% |
| Intel Corp., 4.00%, 12/15/32 | 2,000,000 | | 1,904,454 |
| NVIDIA Corp., 2.85%, 4/1/30 | 2,000,000 | | 1,834,196 |
| Qualcomm, Inc., 4.65%, 5/20/35, (Callable 11/20/34 @ 100) | 4,000,000 | | 4,034,057 |
| | | | 7,772,707 |
| SOFTWARE - 5.0% |
| Adobe, Inc., 3.25%, 2/1/25, (Callable 11/1/24 @ 100) | 3,000,000 | | 2,943,228 |
| Microsoft Corp., 3.45%, 8/8/36, (Callable 2/8/36 @ 100) | 2,000,000 | | 1,857,847 |
| Oracle Corp., 3.25%, 11/15/27 | 2,000,000 | | 1,885,500 |
| Salesforce, Inc., 3.70%, 4/11/28 | 1,000,000 | | 992,243 |
| | | | 7,678,818 |
| SPECIALTY RETAIL - 2.5% |
| Home Depot, Inc. (The), 3.75%, 2/15/24, (Callable 11/15/23 @ 100) | 2,000,000 | | 1,981,444 |
| Lowe's Cos., Inc., 3.65%, 4/5/29 | 2,000,000 | | 1,907,495 |
| | | | 3,888,939 |
| TECHNOLOGY HARDWARE, STORAGE & PERIPHERALS - 1.7% |
| Apple, Inc., 1.65%, 5/11/30 | 2,000,000 | | 1,707,909 |
| Apple, Inc., 3.45%, 2/9/45 | 1,000,000 | | 854,443 |
| | | | 2,562,352 |
| TEXTILES, APPAREL & LUXURY GOODS - 2.8% |
| NIKE, Inc., 2.85%, 3/27/30 | 3,000,000 | | 2,773,573 |
| | Principal
Amount | | Value |
| Ralph Lauren Corp., 2.95%, 6/15/30, (Callable 3/15/30 @ 100) | $ 1,000,000 | | $ 902,016 |
| Tapestry, Inc., 4.13%, 7/15/27 | 689,000 | | 664,984 |
| | | | 4,340,573 |
TOTAL CORPORATE BONDS
(COST $101,787,178) | | | 92,573,544 |
| MUNICIPAL BONDS - 3.2% |
| California State University Taxable Revenue Refunding Bonds, Series B, 1.79%, 11/1/30 | 500,000 | | 417,060 |
| Connecticut State Taxable G.O. Unlimited Bonds, Series A, 1.50%, 6/1/27 | 200,000 | | 180,405 |
| Frisco Taxable Certificates G.O. Limited Bonds, Series B, 1.75%, 2/15/30 | 995,000 | | 849,767 |
| Houston Utility System First Lien Taxable Revenue Refunding Bonds, Series B, 1.93%, 11/15/31 | 1,240,000 | | 1,011,388 |
| Leander Independent School District Taxable G.O. Unlimited Refunding Bonds, Series B (PSF, Gtd.), 1.99%, 8/15/33 | 895,000 | | 716,241 |
| Louisiana State Highway Improvement Taxable Revenue Refunding Bonds, Series A, 1.59%, 6/15/30 | 100,000 | | 83,019 |
| Metropolitan Government Nashville & Davidson County Water & Sewer Taxable Revenue Refunding Bonds, Series B, Green Bond, 2.13%, 7/1/32 | 1,215,000 | | 998,619 |
| North Texas Tollway Authority Taxable Revenue Refunding Bonds, Series 2021A, 2.08%, 1/1/31 | 100,000 | | 85,087 |
| Northwest Independent School District Taxable G.O. Unlimited Refunding Bonds, Series A (PSF, Gtd.), 1.97%, 2/15/34, (Callable 2/15/30 @ 100) | 600,000 | | 472,606 |
| Uptown Development Authority Contract Tax Allocation Increment Revenue Bonds, Series B (AGM Insured), 2.58%, 9/1/31 | 100,000 | | 84,390 |
TOTAL MUNICIPAL BONDS
(COST $6,002,134) | | | 4,898,582 |
| U.S. GOVERNMENT AGENCIES - 27.5% |
| Federal Farm Credit Bank, 3.00%, 11/25/30 | 1,000,000 | | 935,249 |
| Federal Home Loan Bank | | | |
| 0.75%, 8/25/28(b) | 1,350,000 | | 1,189,518 |
| 0.75%, 9/30/26(b) | 2,000,000 | | 1,817,871 |
| 0.75%, 9/30/27(b) | 800,000 | | 719,404 |
| 0.80%, 3/8/27 | 1,000,000 | | 886,444 |
| 0.85%, 2/26/26, (Callable 5/26/23 @ 100) | 1,000,000 | | 911,524 |
| 0.88%, 3/23/26 | 1,000,000 | | 910,280 |
| 0.88%, 7/29/26, (Callable 7/29/23 @ 100) (b) | 1,000,000 | | 922,524 |
| 0.90%, 12/1/27 | 2,000,000 | | 1,749,051 |
| 0.90%, 3/30/26(b) | 1,000,000 | | 924,767 |
See notes to financial statements.
STEWARD FUNDS
SCHEDULE OF PORTFOLIO INVESTMENTS — April 30, 2023
STEWARD SELECT BOND FUND
| | Principal
Amount | | Value |
| 0.90%, 4/13/26, (Callable 4/13/23 @ 100) (b) | $ 1,000,000 | | $ 921,835 |
| 1.00%, 7/29/26 | 1,000,000 | | 905,672 |
| 1.00%, 3/16/27 | 2,000,000 | | 1,785,749 |
| 1.07%, 1/25/30 | 1,000,000 | | 811,662 |
| 1.50%, 4/29/31, (Callable 7/29/23 @ 100) (b) | 730,769 | | 637,730 |
| 2.25%, 3/10/27, (Callable 6/10/23 @ 100) (b) | 1,000,000 | | 955,244 |
| 2.75%, 2/22/34 | 1,000,000 | | 852,682 |
| 3.00%, 2/24/37, (Callable 5/9/23 @ 100) | 1,000,000 | | 830,576 |
| 3.00%, 10/27/23 | 1,000,000 | | 990,494 |
| 3.10%, 5/10/27 | 1,000,000 | | 959,986 |
| 3.50%, 5/24/27(b) | 1,000,000 | | 974,753 |
| 3.65%, 5/26/27 | 1,000,000 | | 967,764 |
| 5.00%, 11/24/27, (Callable 5/24/23 @ 100) (b) | 1,000,000 | | 995,676 |
| 5.00%, 1/5/24 | 2,000,000 | | 1,998,518 |
| 5.40%, 1/28/28, (Callable 7/28/23 @ 100) | 500,000 | | 496,397 |
| 5.50%, 3/7/25 | 1,000,000 | | 996,875 |
| 5.55%, 3/8/28 | 1,000,000 | | 997,390 |
| 5.80%, 9/27/24 | 875,000 | | 874,236 |
| 6.01%, 3/28/25 | 1,000,000 | | 998,741 |
| | | | 28,983,363 |
| Federal Home Loan Mortgage Corp. | | | |
| 0.80%, 10/27/26 | 1,000,000 | | 892,824 |
| 1.05%, 7/21/28 | 1,000,000 | | 862,976 |
| 2.00%, 12/24/24 | 1,000,000 | | 958,491 |
| 4.00%, 8/15/25(b) | 1,000,000 | | 992,867 |
| 5.00%, 9/27/24 | 1,000,000 | | 995,370 |
| 5.15%, 10/17/24 | 1,000,000 | | 998,410 |
| 5.20%, 2/24/26 | 1,000,000 | | 993,907 |
| 5.50%, 5/1/26, (Callable 8/1/23 @ 100) (c) | 1,500,000 | | 1,499,882 |
| | | | 8,194,727 |
| Federal National Mortgage Association | | | |
| 0.40%, 10/29/24 | 1,000,000 | | 937,671 |
| 0.55%, 8/19/25 | 1,000,000 | | 919,709 |
| 0.56%, 10/28/25 | 1,000,000 | | 915,211 |
| 0.58%, 8/25/25 | 1,000,000 | | 919,948 |
| 0.60%, 8/28/25 | 1,000,000 | | 920,172 |
| | | | 4,612,711 |
TOTAL U.S. GOVERNMENT AGENCIES
(COST $45,738,278) | | | 42,726,050 |
U.S. GOVERNMENT AGENCY MORTGAGE-BACKED
OBLIGATIONS - 4.2% |
| Federal Home Loan Mortgage Corp. | | | |
| | Principal
Amount | | Value |
| 3.00%, 7/15/41 | $ 777,062 | | $ 751,300 |
| 3.25% (H15T1Y + 225 bps), 5/1/36(a) | 12,064 | | 11,946 |
| 3.50%, 2/1/34 | 164,585 | | 160,705 |
| 3.50%, 10/1/49 | 241,301 | | 226,425 |
| 3.50%, 12/15/48 | 389,760 | | 370,643 |
| 4.00%, 12/15/25 | 2,500,000 | | 2,446,910 |
| 4.04% (US0012M + 179 bps), 10/1/37(a) | 7,729 | | 7,586 |
| 5.00%, 11/1/37 | 2,172 | | 2,174 |
| 6.00%, 3/1/38 | 14,805 | | 15,429 |
| | | | 3,993,118 |
| Federal National Mortgage Association | | | |
| 1.50%, 11/25/44 | 1,540,009 | | 1,343,455 |
| 3.50%, 2/1/43 | 132,480 | | 126,365 |
| 3.50%, 4/1/48 | 391,289 | | 371,885 |
| 3.57% (US0012M + 182 bps), 5/1/36(a) | 31,822 | | 31,326 |
| 4.00%, 9/1/33 | 113,262 | | 111,280 |
| 4.00%, 10/1/46 | 272,550 | | 265,576 |
| 4.29% (US0012M + 204 bps), 10/1/36(a) | 14,829 | | 14,665 |
| 5.44% (US0001M + 42 bps), 11/25/36(a) | 25,224 | | 24,949 |
| 6.00%, 6/1/36 | 78,525 | | 78,826 |
| 6.00%, 9/1/36 | 8,586 | | 8,526 |
| 6.00%, 5/1/37 | 20,694 | | 21,223 |
| | | | 2,398,076 |
| Government National Mortgage Association | | | |
| 2.63% (H15T1Y + 150 bps), 1/20/39(a) | 8,628 | | 8,400 |
| 4.50%, 6/15/40 | 63,556 | | 64,332 |
| 4.50%, 8/20/38 | 27,095 | | 26,591 |
| 5.00%, 5/20/40 | 31,655 | | 31,711 |
| 5.50%, 12/20/38 | 1,464 | | 1,477 |
| 6.00%, 10/15/37 | 17,224 | | 18,151 |
| 6.00%, 6/15/37 | 17,200 | | 17,989 |
| 6.50%, 10/20/38 | 1,653 | | 1,650 |
| | | | 170,301 |
TOTAL U.S. GOVERNMENT AGENCY MORTGAGE-BACKED OBLIGATIONS
(COST $7,043,555) | | | 6,561,495 |
| U.S. TREASURY OBLIGATIONS - 2.8% |
| U.S. Treasury Bond, 1.13%, 5/15/40 | 2,000,000 | | 1,340,156 |
| U.S. Treasury Inflationary Index Note, 0.38%, 1/15/27 | 1,232,460 | | 1,198,367 |
| U.S. Treasury Notes | | | |
See notes to financial statements.
STEWARD FUNDS
SCHEDULE OF PORTFOLIO INVESTMENTS — April 30, 2023
STEWARD SELECT BOND FUND
| | Principal
Amount | | Value |
| 1.63%, 11/30/26 | $ 1,000,000 | | $ 932,930 |
| 1.75%, 11/15/29 | 1,000,000 | | 903,320 |
| | | | 1,836,250 |
TOTAL U.S. TREASURY OBLIGATIONS
(COST $5,224,348) | | | 4,374,773 |
| | Shares | | Value |
| MONEY MARKET FUND - 2.8% |
| Northern Institutional Treasury Portfolio (Premier Class), 4.56%(d) | 4,342,580 | | $ 4,342,580 |
TOTAL MONEY MARKET FUND
(COST $4,342,580) | | | 4,342,580 |
TOTAL INVESTMENTS
(COST $170,167,481) - 100.2% | | | 155,505,968 |
| | | | |
| LIABILITIES IN EXCESS OF OTHER ASSETS - (0.2)% | | | (369,481) |
| NET ASSETS - 100.0% | | | $ 155,136,487 |
| |
| (a) | Variable rate security. The interest rate shown represents the rate in effect at April 30, 2023. For securities based on published reference rate and spread, the reference rate and spread are indicated in the description. Certain variable rate securities are not based on a published reference rate and spread but are determined by the issuer and are based on current market conditions. These securities do not indicate a reference rate and spread in their description. |
| (b) | Step Bond. Coupon rate is set for an initial period and then adjusted at a specified date. The rate shown represents the rate as of April 30, 2023. |
| (c) | When-Issued Security. Coupon rate is not in effect at April 30, 2023. |
| (d) | 7-day current yield as of April 30, 2023 is disclosed.
|
| AGM — Assured Guarantee Municipal Corporation |
| bp — Basis Points |
| G.O. — General Obligation |
| Gtd. — Guaranteed |
| H15T1Y — 1 Year Treasury Constant Maturity Rate |
| H15T5Y — 5 Year Treasury Constant Maturity Rate |
| PSF — Permanent School Fund |
| US0001M — 1 Month US Dollar LIBOR |
| US0012M — 12 Month US Dollar LIBOR |
See notes to financial statements.
STEWARD FUNDS
SCHEDULE OF PORTFOLIO INVESTMENTS — April 30, 2023
STEWARD SMALL CAP GROWTH FUND
The table below sets forth the diversification of the Steward Small Cap Growth Fund investments by Industry.
| Industry Diversification | | Percent* |
| Software | | 15.4% |
| Health Care Equipment & Supplies | | 9.3 |
| Machinery | | 6.3 |
| Health Care Providers & Services | | 4.5 |
| Food Products | | 4.4 |
| Pharmaceuticals | | 4.2 |
| Oil, Gas & Consumable Fuels | | 3.5 |
| Semiconductors & Semiconductor Equipment | | 3.5 |
| Hotels, Restaurants & Leisure | | 3.2 |
| Biotechnology | | 2.9 |
| Diversified Consumer Services | | 2.7 |
| Diversified Telecommunication Services | | 2.7 |
| Commercial Services & Supplies | | 2.6 |
| Entertainment | | 2.5 |
| Building Products | | 2.4 |
| Capital Markets | | 2.2 |
| Health Care Technology | | 2.1 |
| Specialty Retail | | 2.1 |
| Trading Companies & Distributors | | 1.9 |
| Independent Power and Renewable Electricity Producers | | 1.7 |
| Specialized Real Estate Investment Trusts | | 1.7 |
| Industry Diversification | | Percent* |
| Chemicals | | 1.6% |
| Insurance | | 1.6 |
| Ground Transportation | | 1.5 |
| Professional Services | | 1.4 |
| IT Services | | 1.2 |
| Life Sciences Tools & Services | | 1.2 |
| Automobile Components | | 1.1 |
| Air Freight & Logistics | | 1.0 |
| Electrical Equipment | | 1.0 |
| Money Market Fund | | 0.9 |
| Real Estate Management & Development | | 0.9 |
Electronic Equipment, Instruments
& Components | | 0.8 |
| Financial Services | | 0.8 |
| Interactive Media & Services | | 0.8 |
| Leisure Products | | 0.8 |
| Media | | 0.6 |
| Metals & Mining | | 0.6 |
| Household Durables | | 0.5 |
| Total Investments | | 100.1% |
| * | Percentages indicated are based on net assets as of April 30, 2023.
|
See notes to financial statements.
STEWARD FUNDS
SCHEDULE OF PORTFOLIO INVESTMENTS — April 30, 2023
STEWARD SMALL CAP GROWTH FUND
| | Shares | | Value |
| COMMON STOCKS - 99.2% |
| AIR FREIGHT & LOGISTICS - 1.0% |
| Forward Air Corp. | 2,380 | | $ 251,114 |
| AUTOMOBILE COMPONENTS - 1.1% |
| Visteon Corp.(a) | 1,920 | | 269,549 |
| BIOTECHNOLOGY - 2.9% |
| Arrowhead Pharmaceuticals, Inc.(a) | 1,880 | | 66,571 |
| Bioxcel Therapeutics, Inc.(a) | 12,000 | | 247,440 |
| Intellia Therapeutics, Inc.(a) | 2,490 | | 93,998 |
| Natera, Inc.(a) | 5,520 | | 279,974 |
| Twist Bioscience Corp.(a) | 2,040 | | 25,459 |
| | | | 713,442 |
| BUILDING PRODUCTS - 2.4% |
| Simpson Manufacturing Co., Inc. | 2,700 | | 339,606 |
| Tecnoglass, Inc. | 6,000 | | 263,100 |
| | | | 602,706 |
| CAPITAL MARKETS - 2.2% |
| Cboe Global Markets, Inc. | 3,940 | | 550,418 |
| CHEMICALS - 1.6% |
| Aspen Aerogels, Inc.(a) | 7,290 | | 45,635 |
| Sensient Technologies Corp. | 4,600 | | 342,516 |
| | | | 388,151 |
| COMMERCIAL SERVICES & SUPPLIES - 2.6% |
| Casella Waste Systems, Inc., Class A(a) | 4,470 | | 397,830 |
| Heritage-Crystal Clean, Inc.(a) | 7,100 | | 248,216 |
| | | | 646,046 |
| DIVERSIFIED CONSUMER SERVICES - 2.7% |
| Chegg, Inc.(a) | 15,690 | | 282,106 |
| Grand Canyon Education, Inc.(a) | 3,360 | | 398,832 |
| | | | 680,938 |
| DIVERSIFIED TELECOMMUNICATION SERVICES - 2.7% |
| Iridium Communications, Inc. | 10,670 | | 677,225 |
| ELECTRICAL EQUIPMENT - 1.0% |
| Bloom Energy Corp., Class A(a) | 9,430 | | 157,009 |
| Plug Power, Inc.(a) | 11,350 | | 102,491 |
| | | | 259,500 |
ELECTRONIC EQUIPMENT, INSTRUMENTS & COMPONENTS -
0.8% |
| 908 Devices, Inc.(a) | 7,910 | | 53,472 |
| Fabrinet (a) | 1,600 | | 151,920 |
| | | | 205,392 |
| | Shares | | Value |
| ENTERTAINMENT - 2.5% |
| World Wrestling Entertainment, Inc., Class A | 5,900 | | $ 632,303 |
| FINANCIAL SERVICES - 0.8% |
| International Money Express, Inc.(a) | 7,600 | | 195,928 |
| FOOD PRODUCTS - 4.4% |
| Calavo Growers, Inc. | 10,090 | | 322,476 |
| Flowers Foods, Inc. | 8,045 | | 221,318 |
| Lamb Weston Holdings, Inc. | 2,500 | | 279,525 |
| Lancaster Colony Corp. | 1,350 | | 282,312 |
| | | | 1,105,631 |
| GROUND TRANSPORTATION - 1.5% |
| Landstar System, Inc. | 2,074 | | 365,086 |
| HEALTH CARE EQUIPMENT & SUPPLIES - 9.3% |
| Figs, Inc., Class A(a) | 19,000 | | 136,800 |
| Inmode Ltd.(a) | 11,200 | | 417,312 |
| Inspire Medical Systems, Inc.(a) | 1,910 | | 511,173 |
| Omnicell, Inc.(a) | 3,230 | | 196,287 |
| Outset Medical, Inc.(a) | 9,860 | | 177,381 |
| PROCEPT BioRobotics Corp.(a) | 8,900 | | 270,471 |
| Shockwave Medical, Inc.(a) | 2,140 | | 620,943 |
| | | | 2,330,367 |
| HEALTH CARE PROVIDERS & SERVICES - 4.5% |
| HealthEquity, Inc.(a) | 8,900 | | 475,705 |
| Joint Corp. (The)(a) | 7,000 | | 110,530 |
| NeoGenomics, Inc.(a) | 11,600 | | 169,592 |
| R1 RCM, Inc.(a) | 23,910 | | 372,757 |
| | | | 1,128,584 |
| HEALTH CARE TECHNOLOGY - 2.1% |
| Doximity, Inc., Class A(a) | 3,640 | | 133,770 |
| Health Catalyst, Inc.(a) | 15,000 | | 189,000 |
| NextGen Healthcare, Inc.(a) | 12,440 | | 208,246 |
| | | | 531,016 |
| HOTELS, RESTAURANTS & LEISURE - 3.2% |
| Choice Hotels International, Inc. | 2,020 | | 257,590 |
| First Watch Restaurant Group, Inc.(a) | 16,630 | | 267,410 |
| Papa John's International, Inc. | 3,550 | | 265,505 |
| | | | 790,505 |
| HOUSEHOLD DURABLES - 0.5% |
| Lovesac (The), Co.(a) | 4,550 | | 119,620 |
See notes to financial statements.
STEWARD FUNDS
SCHEDULE OF PORTFOLIO INVESTMENTS — April 30, 2023
STEWARD SMALL CAP GROWTH FUND
| | Shares | | Value |
INDEPENDENT POWER AND RENEWABLE ELECTRICITY
PRODUCERS - 1.7% |
| Clearway Energy, Inc., Class C | 7,170 | | $ 217,753 |
| Vistra Corp. | 9,000 | | 214,740 |
| | | | 432,493 |
| INSURANCE - 1.6% |
| Kinsale Capital Group, Inc. | 750 | | 245,032 |
| Trupanion, Inc.(a) | 4,050 | | 142,196 |
| | | | 387,228 |
| INTERACTIVE MEDIA & SERVICES - 0.8% |
| Cars.com, Inc.(a) | 10,500 | | 205,485 |
| IT SERVICES - 1.2% |
| DigitalOcean Holdings, Inc.(a) | 9,390 | | 296,161 |
| LEISURE PRODUCTS - 0.8% |
| YETI Holdings, Inc.(a) | 5,000 | | 197,250 |
| LIFE SCIENCES TOOLS & SERVICES - 1.2% |
| Medpace Holdings, Inc.(a) | 1,510 | | 302,211 |
| MACHINERY - 6.3% |
| Chart Industries, Inc.(a) | 2,000 | | 266,200 |
| Donaldson Co., Inc. | 5,650 | | 359,057 |
| ESCO Technologies, Inc. | 4,240 | | 396,737 |
| John Bean Technologies Corp. | 2,750 | | 298,953 |
| Symbotic, Inc.(a) | 9,370 | | 248,867 |
| | | | 1,569,814 |
| MEDIA - 0.6% |
| WideOpenWest, Inc.(a) | 13,680 | | 156,362 |
| METALS & MINING - 0.6% |
| MP Materials Corp.(a) | 7,160 | | 155,157 |
| OIL, GAS & CONSUMABLE FUELS - 3.5% |
| Gulfport Energy Corp.(a) | 2,580 | | 233,387 |
| Magnolia Oil & Gas Corp., Class A | 15,940 | | 336,653 |
| Matador Resources Co. | 4,300 | | 210,829 |
| SilverBow Resources, Inc.(a) | 3,730 | | 88,960 |
| | | | 869,829 |
| PHARMACEUTICALS - 4.2% |
| Amphastar Pharmaceuticals, Inc.(a) | 8,170 | | 292,241 |
| Intra-Cellular Therapies, Inc.(a) | 7,140 | | 443,751 |
| Pacira BioSciences, Inc.(a) | 7,000 | | 317,170 |
| | | | 1,053,162 |
| | Shares | | Value |
| PROFESSIONAL SERVICES - 1.4% |
| Paycor HCM, Inc.(a) | 10,000 | | $ 235,000 |
| Upwork, Inc.(a) | 12,680 | | 121,348 |
| | | | 356,348 |
| REAL ESTATE MANAGEMENT & DEVELOPMENT - 0.9% |
| Tricon Residential, Inc. | 26,490 | | 212,715 |
| SEMICONDUCTORS & SEMICONDUCTOR EQUIPMENT - 3.5% |
| Lattice Semiconductor Corp.(a) | 3,500 | | 278,950 |
| Navitas Semiconductor Corp.(a) | 39,140 | | 208,616 |
| Silicon Laboratories, Inc.(a) | 2,820 | | 392,826 |
| | | | 880,392 |
| SOFTWARE - 15.4% |
| Appian Corp., Class A(a) | 7,990 | | 300,024 |
| Blackline, Inc.(a) | 5,260 | | 293,035 |
| Box, Inc., Class A(a) | 19,340 | | 511,736 |
| Five9, Inc.(a) | 4,410 | | 285,944 |
| Gitlab, Inc., Class A(a) | 2,420 | | 73,471 |
| PowerSchool Holdings, Inc., Class A(a) | 15,000 | | 313,200 |
| Procore Technologies, Inc.(a) | 5,150 | | 275,062 |
| Q2 Holdings, Inc.(a) | 7,030 | | 173,079 |
| Qualys, Inc.(a) | 3,890 | | 439,337 |
| Rapid7, Inc.(a) | 5,820 | | 282,910 |
| Sprout Social, Inc., Class A(a) | 4,320 | | 212,803 |
| Varonis Systems, Inc.(a) | 12,620 | | 292,279 |
| Workiva, Inc.(a) | 4,150 | | 387,693 |
| | | | 3,840,573 |
| SPECIALIZED REAL ESTATE INVESTMENT TRUSTS - 1.7% |
| National Storage Affiliates Trust | 10,680 | | 411,714 |
| SPECIALTY RETAIL - 2.1% |
| Academy Sports & Outdoors, Inc. | 8,390 | | 532,933 |
| TRADING COMPANIES & DISTRIBUTORS - 1.9% |
| Karat Packaging, Inc. | 15,756 | | 213,651 |
| SiteOne Landscape Supply, Inc.(a) | 1,750 | | 258,545 |
| | | | 472,196 |
TOTAL COMMON STOCKS
(COST $31,580,084) | | | 24,775,544 |
| MONEY MARKET FUND - 0.9% |
| Northern Institutional Treasury Portfolio (Premier Class), 4.56%(b) | 219,677 | | 219,677 |
TOTAL MONEY MARKET FUND
(COST $219,677) | | | 219,677 |
See notes to financial statements.
STEWARD FUNDS
SCHEDULE OF PORTFOLIO INVESTMENTS — April 30, 2023
STEWARD SMALL CAP GROWTH FUND
| | Shares | | Value |
TOTAL INVESTMENTS
(COST $31,799,761) - 100.1% | | | $ 24,995,221 |
| | | | |
| LIABILITIES IN EXCESS OF OTHER ASSETS - (0.1)% | | | (15,385) |
| NET ASSETS - 100.0% | | | $ 24,979,836 |
| |
| (a) | Represents non-income producing security. |
| (b) | 7-day current yield as of April 30, 2023 is disclosed.
|
See notes to financial statements.
STEWARD FUNDS
SCHEDULE OF PORTFOLIO INVESTMENTS — April 30, 2023
STEWARD VALUES-FOCUSED LARGE CAP ENHANCED INDEX FUND
The table below sets forth the diversification of the Steward Values-Focused Large Cap Enhanced Index Fund investments by Industry.
| Industry Diversification | | Percent* |
| Software | | 10.0% |
| Technology Hardware, Storage & Peripherals | | 7.3 |
| Semiconductors & Semiconductor Equipment | | 5.9 |
| Interactive Media & Services | | 4.6 |
| Financial Services | | 4.3 |
| Oil, Gas & Consumable Fuels | | 4.0 |
| Health Care Equipment & Supplies | | 3.6 |
| Banks | | 3.0 |
| Capital Markets | | 2.9 |
| Health Care Providers & Services | | 2.9 |
| Broadline Retail | | 2.6 |
| Specialty Retail | | 2.6 |
| Insurance | | 2.5 |
| Life Sciences Tools & Services | | 2.2 |
| Beverages | | 2.1 |
| Consumer Staples Distribution & Retail | | 2.1 |
| Electric Utilities | | 2.0 |
| Hotels, Restaurants & Leisure | | 1.9 |
| Chemicals | | 1.8 |
| Household Products | | 1.8 |
| Aerospace & Defense | | 1.7 |
| Food Products | | 1.7 |
| Machinery | | 1.7 |
| Specialized Real Estate Investment Trusts | | 1.7 |
| IT Services | | 1.5 |
| Pharmaceuticals | | 1.5 |
| Automobiles | | 1.4 |
| Entertainment | | 1.4 |
| Biotechnology | | 1.3 |
| Communications Equipment | | 1.0 |
| Media | | 1.0 |
| Multi-Utilities | | 1.0 |
| Professional Services | | 1.0 |
| Diversified Telecommunication Services | | 0.9 |
| Air Freight & Logistics | | 0.8 |
Electronic Equipment, Instruments
& Components | | 0.8 |
| Industry Diversification | | Percent* |
| Ground Transportation | | 0.8% |
| Building Products | | 0.6 |
| Commercial Services & Supplies | | 0.6 |
| Containers & Packaging | | 0.6 |
| Consumer Finance | | 0.5 |
| Electrical Equipment | | 0.5 |
| Industrial Conglomerates | | 0.5 |
| Textiles, Apparel & Luxury Goods | | 0.5 |
| Distributors | | 0.4 |
| Industrial Real Estate Investment Trusts | | 0.4 |
| Metals & Mining | | 0.4 |
| Residential Real Estate Investment Trusts | | 0.4 |
| Retail Real Estate Investment Trusts | | 0.4 |
| Energy Equipment & Services | | 0.3 |
| Money Market Fund | | 0.3 |
| Trading Companies & Distributors | | 0.3 |
| Wireless Telecommunication Services | | 0.3 |
| Automobile Components | | 0.2 |
| Health Care Real Estate Investment Trusts | | 0.2 |
| Household Durables | | 0.2 |
| Passenger Airlines | | 0.2 |
| Real Estate Management & Development | | 0.2 |
| Construction Materials | | 0.1 |
| Gas Utilities | | 0.1 |
| Independent Power and Renewable Electricity Producers | | 0.1 |
| Leisure Products | | 0.1 |
| Office Real Estate Investment Trusts | | 0.1 |
| Personal Care Products | | 0.1 |
| Water Utilities | | 0.1 |
| Construction & Engineering | | 0.0** |
| Hotel & Resort Real Estate Investment Trusts | | 0.0** |
| Total Investments | | 100.0% |
| * | Percentages indicated are based on net assets as of April 30, 2023. |
| ** | Amount rounds to less than 0.1%.
|
See notes to financial statements.
STEWARD FUNDS
SCHEDULE OF PORTFOLIO INVESTMENTS — April 30, 2023
STEWARD VALUES-FOCUSED LARGE CAP ENHANCED INDEX FUND
| | Shares | | Value |
| COMMON STOCKS - 99.7% |
| AEROSPACE & DEFENSE - 1.7% |
| Boeing Co. (The)(a) | 3,045 | | $ 629,645 |
| General Dynamics Corp. | 1,554 | | 339,300 |
| Howmet Aerospace, Inc. | 2,863 | | 126,802 |
| Huntington Ingalls Industries, Inc. | 202 | | 40,735 |
| L3Harris Technologies, Inc. | 1,161 | | 226,569 |
| Lockheed Martin Corp. | 1,490 | | 692,031 |
| Northrop Grumman Corp. | 904 | | 416,988 |
| Raytheon Technologies Corp. | 8,931 | | 892,207 |
| Textron, Inc. | 790 | | 52,883 |
| TransDigm Group, Inc. | 196 | | 149,940 |
| | | | 3,567,100 |
| AIR FREIGHT & LOGISTICS - 0.8% |
| C.H. Robinson Worldwide, Inc. | 2,770 | | 279,410 |
| Expeditors International of Washington, Inc. | 2,960 | | 336,966 |
| FedEx Corp. | 1,170 | | 266,503 |
| United Parcel Service, Inc., Class B | 4,360 | | 783,971 |
| | | | 1,666,850 |
| AUTOMOBILE COMPONENTS - 0.2% |
| Aptiv PLC(a) | 2,940 | | 302,409 |
| BorgWarner, Inc. | 1,280 | | 61,606 |
| | | | 364,015 |
| AUTOMOBILES - 1.4% |
| Ford Motor Co. | 24,591 | | 292,141 |
| General Motors Co. | 6,180 | | 204,187 |
| Tesla, Inc.(a) | 14,726 | | 2,419,629 |
| | | | 2,915,957 |
| BANKS - 3.0% |
| Bank of America Corp. | 40,676 | | 1,190,993 |
| Citigroup, Inc. | 10,192 | | 479,738 |
| Citizens Financial Group, Inc. | 2,290 | | 70,853 |
| Comerica, Inc. | 420 | | 18,215 |
| Fifth Third Bancorp | 5,090 | | 133,358 |
| First Republic Bank | 540 | | 1,895 |
| Huntington Bancshares, Inc. | 12,350 | | 138,320 |
| JPMorgan Chase & Co. | 16,476 | | 2,277,642 |
| KeyCorp | 7,900 | | 88,954 |
| M&T Bank Corp. | 764 | | 96,111 |
| PNC Financial Services Group, Inc. (The) | 1,542 | | 200,846 |
| Regions Financial Corp. | 7,892 | | 144,108 |
| Truist Financial Corp. | 7,110 | | 231,644 |
| U.S. Bancorp | 7,905 | | 270,983 |
| | Shares | | Value |
| Wells Fargo & Co. | 21,497 | | $ 854,506 |
| Zions Bancorp | 730 | | 20,338 |
| | | | 6,218,504 |
| BEVERAGES - 2.1% |
| Coca-Cola Co. (The) | 28,460 | | 1,825,709 |
| Keurig Dr Pepper, Inc. | 4,632 | | 151,467 |
| Monster Beverage Corp.(a) | 6,480 | | 362,880 |
| PepsiCo, Inc. | 11,042 | | 2,107,807 |
| | | | 4,447,863 |
| BIOTECHNOLOGY - 1.3% |
| Amgen, Inc. | 4,253 | | 1,019,614 |
| Biogen, Inc.(a) | 1,266 | | 385,155 |
| Gilead Sciences, Inc. | 10,734 | | 882,442 |
| Incyte Corp.(a) | 3,630 | | 270,109 |
| Moderna, Inc.(a) | 2,120 | | 281,727 |
| | | | 2,839,047 |
| BROADLINE RETAIL - 2.6% |
| Amazon.com, Inc.(a) | 49,033 | | 5,170,530 |
| eBay, Inc. | 3,770 | | 175,041 |
| Etsy, Inc.(a) | 509 | | 51,424 |
| | | | 5,396,995 |
| BUILDING PRODUCTS - 0.6% |
| A.O. Smith Corp. | 1,000 | | 68,290 |
| Allegion PLC | 263 | | 29,056 |
| Carrier Global Corp. | 5,556 | | 232,352 |
| Johnson Controls International PLC | 7,621 | | 456,041 |
| Masco Corp. | 1,841 | | 98,512 |
| Trane Technologies PLC | 2,476 | | 460,065 |
| | | | 1,344,316 |
| CAPITAL MARKETS - 2.9% |
| Ameriprise Financial, Inc. | 569 | | 173,613 |
| Bank of New York Mellon Corp. (The) | 5,081 | | 216,400 |
| BlackRock, Inc. | 840 | | 563,808 |
| Cboe Global Markets, Inc. | 940 | | 131,318 |
| Charles Schwab Corp. (The) | 8,753 | | 457,257 |
| CME Group, Inc. | 2,366 | | 439,532 |
| FactSet Research Systems, Inc. | 259 | | 106,628 |
| Franklin Resources, Inc. | 2,300 | | 61,824 |
| Goldman Sachs Group, Inc. (The) | 1,818 | | 624,374 |
| Intercontinental Exchange, Inc. | 3,417 | | 372,214 |
| Invesco Ltd. | 2,500 | | 42,825 |
| MarketAxess Holdings, Inc. | 240 | | 76,409 |
| Moody's Corp. | 1,518 | | 475,316 |
See notes to financial statements.
STEWARD FUNDS
SCHEDULE OF PORTFOLIO INVESTMENTS — April 30, 2023
STEWARD VALUES-FOCUSED LARGE CAP ENHANCED INDEX FUND
| | Shares | | Value |
| Morgan Stanley | 7,464 | | $ 671,536 |
| MSCI, Inc. | 396 | | 191,050 |
| Nasdaq, Inc. | 5,458 | | 302,209 |
| Northern Trust Corp. | 1,290 | | 100,826 |
| Raymond James Financial, Inc. | 1,290 | | 116,784 |
| S&P Global, Inc. | 1,888 | | 684,551 |
| State Street Corp. | 2,104 | | 152,035 |
| T. Rowe Price Group, Inc. | 1,119 | | 125,697 |
| | | | 6,086,206 |
| CHEMICALS - 1.8% |
| Air Products and Chemicals, Inc. | 1,298 | | 382,079 |
| Albemarle Corp. | 621 | | 115,171 |
| CF Industries Holdings, Inc. | 1,219 | | 87,256 |
| Corteva, Inc. | 4,787 | | 292,581 |
| Dow, Inc. | 4,715 | | 256,496 |
| DuPont de Nemours, Inc. | 2,897 | | 201,979 |
| Ecolab, Inc. | 2,551 | | 428,160 |
| FMC Corp. | 650 | | 80,327 |
| International Flavors & Fragrances, Inc. | 1,480 | | 143,501 |
| Linde PLC | 2,839 | | 1,048,869 |
| LyondellBasell Industries N.V., Class A | 1,530 | | 144,753 |
| Mosaic Co. (The) | 2,160 | | 92,556 |
| PPG Industries, Inc. | 1,288 | | 180,655 |
| Sherwin-Williams Co. (The) | 1,376 | | 326,855 |
| | | | 3,781,238 |
| COMMERCIAL SERVICES & SUPPLIES - 0.6% |
| Cintas Corp. | 604 | | 275,285 |
| Copart, Inc.(a) | 2,226 | | 175,965 |
| Republic Services, Inc. | 1,716 | | 248,168 |
| Rollins, Inc. | 2,895 | | 122,314 |
| Waste Management, Inc. | 2,860 | | 474,903 |
| | | | 1,296,635 |
| COMMUNICATIONS EQUIPMENT - 1.0% |
| Arista Networks, Inc.(a) | 1,454 | | 232,873 |
| Cisco Systems, Inc. | 29,629 | | 1,399,970 |
| F5, Inc.(a) | 270 | | 36,277 |
| Juniper Networks, Inc. | 2,860 | | 86,229 |
| Motorola Solutions, Inc. | 1,062 | | 309,467 |
| | | | 2,064,816 |
| | Shares | | Value |
| CONSTRUCTION & ENGINEERING - 0.0% |
| Quanta Services, Inc. | 680 | | $ 115,355 |
| CONSTRUCTION MATERIALS - 0.1% |
| Martin Marietta Materials, Inc. | 163 | | 59,202 |
| Vulcan Materials Co. | 783 | | 137,119 |
| | | | 196,321 |
| CONSUMER FINANCE - 0.5% |
| American Express Co. | 3,419 | | 551,621 |
| Capital One Financial Corp. | 1,528 | | 148,674 |
| Discover Financial Services | 1,436 | | 148,583 |
| Synchrony Financial | 7,009 | | 206,836 |
| | | | 1,055,714 |
| CONSUMER STAPLES DISTRIBUTION & RETAIL - 2.1% |
| Costco Wholesale Corp. | 2,582 | | 1,299,314 |
| Dollar General Corp. | 1,440 | | 318,902 |
| Dollar Tree, Inc.(a) | 1,282 | | 197,056 |
| Kroger Co. (The) | 4,672 | | 227,199 |
| Sysco Corp. | 3,228 | | 247,717 |
| Target Corp. | 3,750 | | 591,563 |
| Walgreens Boots Alliance, Inc. | 4,509 | | 158,942 |
| Walmart, Inc. | 8,949 | | 1,351,031 |
| | | | 4,391,724 |
| CONTAINERS & PACKAGING - 0.6% |
| Amcor PLC | 31,380 | | 344,239 |
| Avery Dennison Corp. | 1,620 | | 282,658 |
| Ball Corp. | 5,080 | | 270,154 |
| International Paper Co. | 3,089 | | 102,277 |
| Packaging Corp. of America | 590 | | 79,803 |
| Sealed Air Corp. | 1,390 | | 66,706 |
| Westrock Co. | 2,099 | | 62,823 |
| | | | 1,208,660 |
| DISTRIBUTORS - 0.4% |
| Genuine Parts Co. | 910 | | 153,162 |
| LKQ Corp. | 5,803 | | 335,007 |
| Pool Corp. | 742 | | 260,680 |
| | | | 748,849 |
See notes to financial statements.
STEWARD FUNDS
SCHEDULE OF PORTFOLIO INVESTMENTS — April 30, 2023
STEWARD VALUES-FOCUSED LARGE CAP ENHANCED INDEX FUND
| | Shares | | Value |
| DIVERSIFIED TELECOMMUNICATION SERVICES - 0.9% |
| AT&T, Inc. | 46,937 | | $ 829,377 |
| Verizon Communications, Inc. | 27,262 | | 1,058,583 |
| | | | 1,887,960 |
| ELECTRIC UTILITIES - 2.0% |
| Alliant Energy Corp. | 2,090 | | 115,243 |
| American Electric Power Co., Inc. | 3,215 | | 297,130 |
| Constellation Energy Corp. | 1,989 | | 153,949 |
| Duke Energy Corp. | 5,124 | | 506,661 |
| Edison International | 2,390 | | 175,904 |
| Entergy Corp. | 960 | | 103,277 |
| Evergy, Inc. | 1,840 | | 114,282 |
| Eversource Energy | 2,356 | | 182,849 |
| Exelon Corp. | 7,262 | | 308,199 |
| FirstEnergy Corp. | 4,259 | | 169,508 |
| NextEra Energy, Inc. | 11,605 | | 889,291 |
| NRG Energy, Inc. | 1,595 | | 54,501 |
| PG&E Corp.(a) | 8,106 | | 138,694 |
| Pinnacle West Capital Corp. | 510 | | 40,015 |
| PPL Corp. | 7,780 | | 223,441 |
| Southern Co. (The) | 7,424 | | 546,035 |
| Xcel Energy, Inc. | 3,882 | | 271,391 |
| | | | 4,290,370 |
| ELECTRICAL EQUIPMENT - 0.5% |
| AMETEK, Inc. | 1,347 | | 185,792 |
| Eaton Corp. PLC | 2,346 | | 392,063 |
| Emerson Electric Co. | 3,492 | | 290,744 |
| Generac Holdings, Inc.(a) | 11 | | 1,124 |
| Rockwell Automation, Inc. | 604 | | 171,180 |
| | | | 1,040,903 |
ELECTRONIC EQUIPMENT, INSTRUMENTS & COMPONENTS -
0.8% |
| Amphenol Corp., Class A | 4,219 | | 318,408 |
| CDW Corp. | 1,915 | | 324,765 |
| Corning, Inc. | 5,970 | | 198,323 |
| Keysight Technologies, Inc.(a) | 2,390 | | 345,689 |
| TE Connectivity Ltd. | 1,710 | | 209,253 |
| Teledyne Technologies, Inc.(a) | 269 | | 111,474 |
| Trimble, Inc.(a) | 4,690 | | 220,899 |
| Zebra Technologies Corp., Class A(a) | 145 | | 41,764 |
| | | | 1,770,575 |
| | Shares | | Value |
| ENERGY EQUIPMENT & SERVICES - 0.3% |
| Baker Hughes Co. | 5,217 | | $ 152,545 |
| Halliburton Co. | 4,080 | | 133,620 |
| Schlumberger N.V. | 7,989 | | 394,257 |
| | | | 680,422 |
| ENTERTAINMENT - 1.4% |
| Activision Blizzard, Inc. | 4,811 | | 373,863 |
| Electronic Arts, Inc. | 3,450 | | 439,116 |
| Live Nation, Inc.(a) | 740 | | 50,157 |
| Netflix, Inc.(a) | 2,416 | | 797,111 |
| Walt Disney Co. (The)(a) | 9,936 | | 1,018,440 |
| Warner Bros Discovery, Inc.(a) | 13,884 | | 188,961 |
| | | | 2,867,648 |
| FINANCIAL SERVICES - 4.3% |
| Berkshire Hathaway, Inc., Class B(a) | 10,222 | | 3,358,438 |
| Fidelity National Information Services, Inc. | 6,591 | | 387,024 |
| Fiserv, Inc.(a) | 3,670 | | 448,180 |
| FleetCor Technologies, Inc.(a) | 240 | | 51,341 |
| Global Payments, Inc. | 1,307 | | 147,312 |
| Jack Henry & Associates, Inc. | 521 | | 85,100 |
| Mastercard, Inc., Class A | 4,848 | | 1,842,386 |
| PayPal Holdings, Inc.(a) | 6,140 | | 466,640 |
| Visa, Inc., Class A | 9,421 | | 2,192,549 |
| | | | 8,978,970 |
| FOOD PRODUCTS - 1.7% |
| Archer-Daniels-Midland Co. | 3,449 | | 269,298 |
| Bunge Ltd. | 651 | | 60,934 |
| Campbell Soup Co. | 2,700 | | 146,610 |
| Conagra Brands, Inc. | 4,970 | | 188,661 |
| General Mills, Inc. | 5,527 | | 489,858 |
| Hershey Co. (The) | 1,508 | | 411,774 |
| Hormel Foods Corp. | 4,450 | | 179,958 |
| J M Smucker Co. (The) | 1,050 | | 162,130 |
| Kellogg Co. | 3,850 | | 268,614 |
| Kraft Heinz Co. (The) | 6,176 | | 242,532 |
| Lamb Weston Holdings, Inc. | 1,000 | | 111,810 |
| McCormick & Co., Inc. | 1,975 | | 173,504 |
| Mondelez International, Inc., Class A | 10,276 | | 788,375 |
| Tyson Foods, Inc., Class A | 1,875 | | 117,169 |
| | | | 3,611,227 |
See notes to financial statements.
STEWARD FUNDS
SCHEDULE OF PORTFOLIO INVESTMENTS — April 30, 2023
STEWARD VALUES-FOCUSED LARGE CAP ENHANCED INDEX FUND
| | Shares | | Value |
| GAS UTILITIES - 0.1% |
| Atmos Energy Corp. | 1,280 | | $ 146,099 |
| GROUND TRANSPORTATION - 0.8% |
| CSX Corp. | 14,090 | | 431,718 |
| J.B. Hunt Transport Services, Inc. | 1,566 | | 274,504 |
| Norfolk Southern Corp. | 1,196 | | 242,824 |
| Old Dominion Freight Line, Inc. | 460 | | 147,379 |
| Union Pacific Corp. | 3,356 | | 656,769 |
| | | | 1,753,194 |
| HEALTH CARE EQUIPMENT & SUPPLIES - 3.6% |
| Abbott Laboratories | 11,615 | | 1,283,109 |
| Align Technology, Inc.(a) | 407 | | 132,397 |
| Baxter International, Inc. | 3,771 | | 179,801 |
| Becton, Dickinson and Co. | 2,296 | | 606,856 |
| Boston Scientific Corp.(a) | 12,567 | | 654,992 |
| Cooper Cos., Inc. (The) | 401 | | 152,962 |
| DENTSPLY SIRONA, Inc. | 1,853 | | 77,696 |
| Dexcom, Inc.(a) | 2,400 | | 291,216 |
| Edwards Lifesciences Corp.(a) | 4,631 | | 407,435 |
| GE HealthCare Technologies, Inc.(a) | 2,313 | | 188,139 |
| Hologic, Inc.(a) | 2,143 | | 184,319 |
| IDEXX Laboratories, Inc.(a) | 519 | | 255,431 |
| Insulet Corp.(a) | 446 | | 141,846 |
| Intuitive Surgical, Inc.(a) | 2,146 | | 646,418 |
| Medtronic PLC | 8,898 | | 809,273 |
| ResMed, Inc. | 1,182 | | 284,815 |
| STERIS PLC | 825 | | 155,554 |
| Stryker Corp. | 2,354 | | 705,376 |
| Teleflex, Inc. | 397 | | 108,191 |
| Zimmer Holdings, Inc. | 1,697 | | 234,933 |
| | | | 7,500,759 |
| HEALTH CARE PROVIDERS & SERVICES - 2.9% |
| AmerisourceBergen Corp. | 2,110 | | 352,053 |
| Cardinal Health, Inc. | 2,702 | | 221,834 |
| Cigna Group (The) | 3,530 | | 894,114 |
| CVS Health Corp. | 8,901 | | 652,532 |
| DaVita, Inc.(a) | 770 | | 69,577 |
| Elevance Health, Inc. | 3,264 | | 1,529,674 |
| Henry Schein, Inc.(a) | 1,470 | | 118,791 |
| Humana, Inc. | 1,597 | | 847,193 |
| Laboratory Corporation of America Holdings | 1,740 | | 394,475 |
| McKesson Corp. | 1,299 | | 473,148 |
| Molina Healthcare, Inc.(a) | 1,071 | | 319,040 |
| Quest Diagnostics, Inc. | 1,318 | | 182,952 |
| | | | 6,055,383 |
| | Shares | | Value |
| HEALTH CARE REAL ESTATE INVESTMENT TRUSTS - 0.2% |
| Welltower, Inc. | 5,416 | | $ 429,056 |
| HOTEL & RESORT REAL ESTATE INVESTMENT TRUSTS - 0.0% |
| Host Hotels & Resorts, Inc. | 6,193 | | 100,141 |
| HOTELS, RESTAURANTS & LEISURE - 1.9% |
| Booking Holdings, Inc.(a) | 225 | | 604,420 |
| Carnival Corp.(a) | 6,190 | | 57,010 |
| Chipotle Mexican Grill, Inc.(a) | 138 | | 285,332 |
| Domino's Pizza, Inc. | 200 | | 63,494 |
| Expedia Group, Inc.(a) | 495 | | 46,510 |
| Hilton Worldwide Holdings, Inc. | 1,330 | | 191,547 |
| Marriott International, Inc., Class A | 1,416 | | 239,785 |
| McDonald's Corp. | 4,571 | | 1,351,873 |
| Norwegian Cruise Line Holdings Ltd.(a) | 2,830 | | 37,780 |
| Royal Caribbean Cruises Ltd.(a) | 710 | | 46,455 |
| Starbucks Corp. | 6,462 | | 738,542 |
| Yum! Brands, Inc. | 1,950 | | 274,131 |
| | | | 3,936,879 |
| HOUSEHOLD DURABLES - 0.2% |
| D.R. Horton, Inc. | 1,272 | | 139,691 |
| Garmin Ltd. | 960 | | 94,243 |
| Lennar Corp., Class A | 441 | | 49,749 |
| Mohawk Industries, Inc.(a) | 34 | | 3,601 |
| Newell Brands, Inc. | 5,782 | | 70,251 |
| NVR, Inc.(a) | 6 | | 35,040 |
| PulteGroup, Inc. | 325 | | 21,824 |
| Whirlpool Corp. | 42 | | 5,863 |
| | | | 420,262 |
| HOUSEHOLD PRODUCTS - 1.8% |
| Church & Dwight Co., Inc. | 2,740 | | 266,109 |
| Clorox Co. (The) | 930 | | 154,027 |
| Colgate-Palmolive Co. | 8,480 | | 676,704 |
| Kimberly-Clark Corp. | 3,000 | | 434,670 |
| Procter & Gamble Co. (The) | 15,098 | | 2,361,025 |
| | | | 3,892,535 |
INDEPENDENT POWER AND RENEWABLE ELECTRICITY
PRODUCERS - 0.1% |
| AES Corp. (The) | 5,250 | | 124,215 |
| INDUSTRIAL CONGLOMERATES - 0.5% |
| 3M Co. | 3,366 | | 357,537 |
| Honeywell International, Inc. | 4,022 | | 803,756 |
| | | | 1,161,293 |
See notes to financial statements.
STEWARD FUNDS
SCHEDULE OF PORTFOLIO INVESTMENTS — April 30, 2023
STEWARD VALUES-FOCUSED LARGE CAP ENHANCED INDEX FUND
| | Shares | | Value |
| INDUSTRIAL REAL ESTATE INVESTMENT TRUSTS - 0.4% |
| Prologis, Inc. | 6,837 | | $ 856,334 |
| INSURANCE - 2.5% |
| Aflac, Inc. | 4,384 | | 306,222 |
| Allstate Corp. (The) | 1,669 | | 193,203 |
| American International Group, Inc. | 4,254 | | 225,632 |
| Aon PLC, Class A | 1,290 | | 419,482 |
| Arch Capital Group Ltd.(a) | 2,072 | | 155,545 |
| Arthur J. Gallagher & Co. | 1,500 | | 312,090 |
| Assurant, Inc. | 358 | | 44,081 |
| Brown & Brown, Inc. | 2,240 | | 144,234 |
| Chubb Ltd. | 2,811 | | 566,585 |
| Cincinnati Financial Corp. | 902 | | 96,009 |
| Everest Re Group Ltd. | 336 | | 127,008 |
| Globe Life, Inc. | 487 | | 52,849 |
| Hartford Financial Services Group, Inc. (The) | 2,460 | | 174,635 |
| Lincoln National Corp. | 486 | | 10,561 |
| Loews Corp. | 880 | | 50,662 |
| Marsh & McLennan Cos., Inc. | 3,210 | | 578,410 |
| MetLife, Inc. | 4,858 | | 297,941 |
| Principal Financial Group, Inc. | 1,640 | | 122,492 |
| Progressive Corp. (The) | 4,020 | | 548,328 |
| Prudential Financial, Inc. | 2,235 | | 194,445 |
| Travelers Cos., Inc. (The) | 1,920 | | 347,789 |
| W.R. Berkley Corp. | 1,325 | | 78,069 |
| Willis Towers Watson PLC | 677 | | 156,793 |
| | | | 5,203,065 |
| INTERACTIVE MEDIA & SERVICES - 4.6% |
| Alphabet, Inc., Class A(a) | 33,066 | | 3,549,305 |
| Alphabet, Inc., Class C(a) | 28,723 | | 3,108,403 |
| Match Group, Inc.(a) | 1,300 | | 47,970 |
| Meta Platforms, Inc., Class A(a) | 12,267 | | 2,948,005 |
| | | | 9,653,683 |
| IT SERVICES - 1.5% |
| Accenture PLC, Class A | 4,356 | | 1,220,943 |
| Akamai Technologies, Inc.(a) | 3,215 | | 263,534 |
| Cognizant Technology Solutions Corp., Class A | 3,293 | | 196,625 |
| DXC Technology Co.(a) | 8,461 | | 201,795 |
| EPAM Systems, Inc.(a) | 292 | | 82,472 |
| Gartner, Inc.(a) | 467 | | 141,249 |
| International Business Machines Corp. | 6,896 | | 871,723 |
| VeriSign, Inc.(a) | 552 | | 122,434 |
| | | | 3,100,775 |
| | Shares | | Value |
| LEISURE PRODUCTS - 0.1% |
| Hasbro, Inc. | 3,719 | | $ 220,239 |
| LIFE SCIENCES TOOLS & SERVICES - 2.2% |
| Agilent Technologies, Inc. | 4,850 | | 656,835 |
| Bio-Rad Laboratories, Inc., Class A(a) | 336 | | 151,465 |
| Bio-Techne Corp. | 2,570 | | 205,292 |
| Danaher Corp. | 5,381 | | 1,274,813 |
| Illumina, Inc.(a) | 2,053 | | 422,015 |
| IQVIA Holdings, Inc.(a) | 1,810 | | 340,696 |
| Mettler-Toledo International, Inc.(a) | 385 | | 574,227 |
| PerkinElmer, Inc. | 1,520 | | 198,345 |
| Waters Corp.(a) | 1,552 | | 466,159 |
| West Pharmaceutical Services, Inc. | 682 | | 246,366 |
| | | | 4,536,213 |
| MACHINERY - 1.7% |
| Caterpillar, Inc. | 2,877 | | 629,488 |
| Cummins, Inc. | 1,517 | | 356,556 |
| Deere & Co. | 1,547 | | 584,797 |
| Dover Corp. | 730 | | 106,697 |
| Fortive Corp. | 2,460 | | 155,201 |
| IDEX Corp. | 390 | | 80,465 |
| Illinois Tool Works, Inc. | 1,691 | | 409,120 |
| Ingersoll Rand, Inc. | 2,638 | | 150,419 |
| Nordson Corp. | 279 | | 60,350 |
| Otis Worldwide Corp. | 2,776 | | 236,793 |
| PACCAR, Inc. | 3,322 | | 248,120 |
| Parker-Hannifin Corp. | 485 | | 157,567 |
| Pentair PLC | 540 | | 31,363 |
| Snap-on, Inc. | 280 | | 72,635 |
| Stanley Black & Decker, Inc. | 182 | | 15,714 |
| Westinghouse Air Brake Technologies Corp. | 820 | | 80,089 |
| Xylem, Inc. | 2,850 | | 295,944 |
| | | | 3,671,318 |
| MEDIA - 1.0% |
| Charter Communications, Inc., Class A(a) | 484 | | 178,451 |
| Comcast Corp., Class A | 25,553 | | 1,057,127 |
| DISH Network Corp., Class A(a) | 1,770 | | 13,293 |
| Fox Corp., Class A | 7,878 | | 262,022 |
| Fox Corp., Class B | 5,889 | | 179,850 |
| Interpublic Group of Cos., Inc. (The) | 6,516 | | 232,817 |
| News Corp., Class A | 2,690 | | 47,371 |
| News Corp., Class B | 1,680 | | 29,820 |
See notes to financial statements.
STEWARD FUNDS
SCHEDULE OF PORTFOLIO INVESTMENTS — April 30, 2023
STEWARD VALUES-FOCUSED LARGE CAP ENHANCED INDEX FUND
| | Shares | | Value |
| Omnicom Group, Inc. | 1,228 | | $ 111,220 |
| Paramount Global, Class B | 3,380 | | 78,855 |
| | | | 2,190,826 |
| METALS & MINING - 0.4% |
| Freeport-McMoRan, Inc. | 8,276 | | 313,743 |
| Newmont Corp. | 4,980 | | 236,052 |
| Nucor Corp. | 1,287 | | 190,708 |
| Steel Dynamics, Inc. | 820 | | 85,239 |
| | | | 825,742 |
| MULTI-UTILITIES - 1.0% |
| Ameren Corp. | 2,350 | | 209,079 |
| CenterPoint Energy, Inc. | 5,180 | | 157,835 |
| CMS Energy Corp. | 2,768 | | 172,336 |
| Consolidated Edison, Inc. | 2,760 | | 271,777 |
| Dominion Energy, Inc. | 5,070 | | 289,700 |
| DTE Energy Co. | 1,020 | | 114,658 |
| NiSource, Inc. | 4,370 | | 124,370 |
| Public Service Enterprise Group, Inc. | 3,381 | | 213,679 |
| Sempra Energy | 1,911 | | 297,141 |
| WEC Energy Group, Inc. | 2,545 | | 244,753 |
| | | | 2,095,328 |
| OFFICE REAL ESTATE INVESTMENT TRUSTS - 0.1% |
| Alexandria Real Estate Equities, Inc. | 785 | | 97,481 |
| Boston Properties, Inc. | 3,037 | | 162,055 |
| | | | 259,536 |
| OIL, GAS & CONSUMABLE FUELS - 4.0% |
| APA Corp. | 1,420 | | 52,327 |
| Chevron Corp. | 10,123 | | 1,706,535 |
| ConocoPhillips | 6,815 | | 701,195 |
| Coterra Energy, Inc. | 4,790 | | 122,624 |
| Devon Energy Corp. | 3,180 | | 169,907 |
| Diamondback Energy, Inc. | 680 | | 96,696 |
| EOG Resources, Inc. | 3,065 | | 366,176 |
| EQT Corp. | 1,460 | | 50,866 |
| Exxon Mobil Corp. | 23,483 | | 2,778,978 |
| Hess Corp. | 1,380 | | 200,183 |
| Kinder Morgan, Inc. | 18,540 | | 317,961 |
| Marathon Oil Corp. | 5,060 | | 122,250 |
| Marathon Petroleum Corp. | 2,716 | | 331,352 |
| Occidental Petroleum Corp. | 3,985 | | 245,197 |
| ONEOK, Inc. | 2,290 | | 149,789 |
| Phillips 66 | 2,469 | | 244,431 |
| | Shares | | Value |
| Pioneer Natural Resources Co. | 1,171 | | $ 254,751 |
| Targa Resources Corp. | 504 | | 38,067 |
| Valero Energy Corp. | 2,201 | | 252,389 |
| Williams Cos., Inc. (The) | 9,244 | | 279,724 |
| | | | 8,481,398 |
| PASSENGER AIRLINES - 0.2% |
| Alaska Air Group, Inc.(a) | 250 | | 10,865 |
| American Airlines Group, Inc.(a) | 5,650 | | 77,066 |
| Delta Air Lines, Inc.(a) | 3,850 | | 132,093 |
| Southwest Airlines Co. | 4,040 | | 122,372 |
| United Airlines Holdings, Inc.(a) | 1,020 | | 44,676 |
| | | | 387,072 |
| PERSONAL CARE PRODUCTS - 0.1% |
| Estee Lauder Cos., Inc., (The) Class A | 1,308 | | 322,710 |
| PHARMACEUTICALS - 1.5% |
| Catalent, Inc.(a) | 1,459 | | 73,125 |
| Eli Lilly & Co. | 5,378 | | 2,128,935 |
| Organon & Co. | 3,400 | | 83,742 |
| Zoetis, Inc. | 5,278 | | 927,767 |
| | | | 3,213,569 |
| PROFESSIONAL SERVICES - 1.0% |
| Automatic Data Processing, Inc. | 3,450 | | 759,000 |
| Broadridge Financial Solutions, Inc. | 1,941 | | 282,241 |
| Ceridian HCM Holding, Inc.(a) | 660 | | 41,897 |
| CoStar Group, Inc.(a) | 2,200 | | 169,290 |
| Equifax, Inc. | 620 | | 129,196 |
| Jacobs Solutions, Inc. | 560 | | 64,658 |
| Paychex, Inc. | 2,190 | | 240,593 |
| Paycom Software, Inc.(a) | 228 | | 66,204 |
| Robert Half International, Inc. | 3,110 | | 227,030 |
| Verisk Analytics, Inc. | 928 | | 180,134 |
| | | | 2,160,243 |
| REAL ESTATE MANAGEMENT & DEVELOPMENT - 0.2% |
| CBRE Group, Inc., Class A(a) | 4,460 | | 341,904 |
| RESIDENTIAL REAL ESTATE INVESTMENT TRUSTS - 0.4% |
| AvalonBay Communities, Inc. | 1,834 | | 330,798 |
| Camden Property Trust | 380 | | 41,819 |
| Equity Residential | 3,177 | | 200,945 |
| Essex Property Trust, Inc. | 227 | | 49,879 |
See notes to financial statements.
STEWARD FUNDS
SCHEDULE OF PORTFOLIO INVESTMENTS — April 30, 2023
STEWARD VALUES-FOCUSED LARGE CAP ENHANCED INDEX FUND
| | Shares | | Value |
| Mid-America Apartment Communities, Inc. | 670 | | $ 103,046 |
| UDR, Inc. | 2,330 | | 96,299 |
| | | | 822,786 |
| RETAIL REAL ESTATE INVESTMENT TRUSTS - 0.4% |
| Federal Realty Investment Trust | 1,868 | | 184,727 |
| Kimco Realty Corp. | 5,150 | | 98,828 |
| Realty Income Corp. | 3,880 | | 243,819 |
| Regency Centers Corp. | 1,869 | | 114,813 |
| Simon Property Group, Inc. | 1,690 | | 191,511 |
| | | | 833,698 |
| SEMICONDUCTORS & SEMICONDUCTOR EQUIPMENT - 5.9% |
| Advanced Micro Devices, Inc.(a) | 8,735 | | 780,647 |
| Analog Devices, Inc. | 2,948 | | 530,286 |
| Applied Materials, Inc. | 6,600 | | 745,998 |
| Broadcom, Inc. | 2,366 | | 1,482,299 |
| Enphase Energy, Inc.(a) | 741 | | 121,672 |
| First Solar, Inc.(a) | 584 | | 106,627 |
| Intel Corp. | 29,539 | | 917,481 |
| KLA Corp. | 747 | | 288,745 |
| Lam Research Corp. | 1,095 | | 573,868 |
| Microchip Technology, Inc. | 2,895 | | 211,306 |
| Micron Technology, Inc. | 6,072 | | 390,794 |
| Monolithic Power Systems, Inc. | 190 | | 87,774 |
| NVIDIA Corp. | 14,286 | | 3,964,222 |
| NXP Semiconductors N.V. | 1,110 | | 181,752 |
| ON Semiconductor Corp.(a) | 1,900 | | 136,724 |
| Qorvo, Inc.(a) | 230 | | 21,178 |
| QUALCOMM, Inc. | 6,255 | | 730,584 |
| Skyworks Solutions, Inc. | 560 | | 59,304 |
| SolarEdge Technologies, Inc.(a) | 295 | | 84,261 |
| Teradyne, Inc. | 810 | | 74,018 |
| Texas Instruments, Inc. | 5,301 | | 886,327 |
| | | | 12,375,867 |
| SOFTWARE - 10.0% |
| Adobe, Inc.(a) | 3,098 | | 1,169,681 |
| ANSYS, Inc.(a) | 1,160 | | 364,147 |
| Autodesk, Inc.(a) | 2,123 | | 413,539 |
| Cadence Design Systems, Inc.(a) | 2,740 | | 573,893 |
| Fair Isaac Corp.(a) | 150 | | 109,193 |
| Fortinet, Inc.(a) | 4,000 | | 252,200 |
| Gen Digital, Inc. | 13,682 | | 241,761 |
| Intuit, Inc. | 2,022 | | 897,667 |
| Microsoft Corp. | 42,013 | | 12,908,914 |
| Oracle Corp. | 9,096 | | 861,573 |
| | Shares | | Value |
| PTC, Inc.(a) | 2,345 | | $ 294,978 |
| Roper Technologies, Inc. | 716 | | 325,622 |
| Salesforce, Inc.(a) | 6,616 | | 1,312,416 |
| ServiceNow, Inc.(a) | 1,552 | | 713,020 |
| Synopsys, Inc.(a) | 1,501 | | 557,351 |
| Tyler Technologies, Inc.(a) | 170 | | 64,435 |
| | | | 21,060,390 |
| SPECIALIZED REAL ESTATE INVESTMENT TRUSTS - 1.7% |
| American Tower Corp. | 3,594 | | 734,578 |
| Crown Castle, Inc. | 3,920 | | 482,513 |
| Digital Realty Trust, Inc. | 3,477 | | 344,745 |
| Equinix, Inc. | 792 | | 573,471 |
| Extra Space Storage, Inc. | 730 | | 110,989 |
| Iron Mountain, Inc. | 5,082 | | 280,730 |
| Public Storage | 983 | | 289,818 |
| SBA Communications Corp. | 1,351 | | 352,462 |
| VICI Properties, Inc. | 3,562 | | 120,894 |
| Weyerhaeuser Co. | 6,614 | | 197,825 |
| | | | 3,488,025 |
| SPECIALTY RETAIL - 2.6% |
| Advance Auto Parts, Inc. | 340 | | 42,680 |
| AutoZone, Inc.(a) | 114 | | 303,617 |
| Bath & Body Works, Inc. | 1,330 | | 46,683 |
| Best Buy Co., Inc. | 3,555 | | 264,919 |
| CarMax, Inc.(a) | 3,080 | | 215,692 |
| Home Depot, Inc. (The) | 6,470 | | 1,944,494 |
| Lowe’s Cos., Inc. | 4,399 | | 914,244 |
| O'Reilly Automotive, Inc.(a) | 414 | | 379,766 |
| Ross Stores, Inc. | 1,790 | | 191,047 |
| TJX Cos., Inc. (The) | 7,140 | | 562,775 |
| Tractor Supply Co. | 1,507 | | 359,269 |
| Ulta Beauty, Inc.(a) | 369 | | 203,478 |
| | | | 5,428,664 |
| TECHNOLOGY HARDWARE, STORAGE & PERIPHERALS - 7.3% |
| Apple, Inc. | 82,310 | | 13,966,361 |
| Hewlett Packard Enterprise Co. | 27,327 | | 391,323 |
| HP, Inc. | 13,136 | | 390,270 |
| NetApp, Inc. | 3,869 | | 243,321 |
| Seagate Technology Holdings PLC | 4,040 | | 237,431 |
| Western Digital Corp.(a) | 2,097 | | 72,221 |
| | | | 15,300,927 |
| TEXTILES, APPAREL & LUXURY GOODS - 0.5% |
| NIKE, Inc., Class B | 6,677 | | 846,109 |
See notes to financial statements.
STEWARD FUNDS
SCHEDULE OF PORTFOLIO INVESTMENTS — April 30, 2023
STEWARD VALUES-FOCUSED LARGE CAP ENHANCED INDEX FUND
| | Shares | | Value |
| Ralph Lauren Corp. | 100 | | $ 11,479 |
| Tapestry, Inc. | 1,070 | | 43,667 |
| VF Corp. | 7,427 | | 174,609 |
| | | | 1,075,864 |
| TRADING COMPANIES & DISTRIBUTORS - 0.3% |
| Fastenal Co. | 4,234 | | 227,958 |
| United Rentals, Inc. | 126 | | 45,500 |
| W.W. Grainger, Inc. | 561 | | 390,215 |
| | | | 663,673 |
| WATER UTILITIES - 0.1% |
| American Water Works Co., Inc. | 1,150 | | 170,488 |
| WIRELESS TELECOMMUNICATION SERVICES - 0.3% |
| T-Mobile U.S., Inc.(a) | 4,550 | | 654,745 |
TOTAL COMMON STOCKS
(COST $194,738,412) | | | 209,749,138 |
| RIGHTS - 0.0% |
| HEALTH CARE EQUIPMENT & SUPPLIES - 0.0% |
| Contra Abiomed, Inc. (Contingent Value Rights)(a)(b)(c) | 373 | | — |
TOTAL RIGHTS
(COST $—) | | | — |
| | Shares | | Value |
| MONEY MARKET FUND - 0.3% |
| Northern Institutional Treasury Portfolio (Premier Class), 4.56%(d) | 563,488 | | $ 563,488 |
TOTAL MONEY MARKET FUND
(COST $563,488) | | | 563,488 |
TOTAL INVESTMENTS
(COST $195,301,900) - 100.0% | | | 210,312,626 |
| | | | |
| LIABILITIES IN EXCESS OF OTHER ASSETS - 0.0% | | | (71,724) |
| NET ASSETS - 100.0% | | | $ 210,240,902 |
| |
| (a) | Represents non-income producing security. |
| (b) | Security is a Level 3 investment. |
| (c) | Amounts designated as ‘‘—’’ are $0 or have been rounded to $0. |
| (d) | 7-day current yield as of April 30, 2023 is disclosed.
|
| MSCI — Morgan Stanley Capital International |
| N.V. — Naamloze Vennootschap |
| PLC — Public Limited Company |
| S&P — Standard & Poor's |
See notes to financial statements.
STEWARD FUNDS
SCHEDULE OF PORTFOLIO INVESTMENTS — April 30, 2023
STEWARD VALUES-FOCUSED SMALL-MID CAP ENHANCED INDEX FUND
The table below sets forth the diversification of the Steward Values-Focused Small-Mid Cap Enhanced Index Fund investments by Industry.
| Industry Diversification | | Percent* |
| Banks | | 6.7% |
| Machinery | | 4.7 |
Electronic Equipment, Instruments
& Components | | 4.2 |
| Health Care Equipment & Supplies | | 3.9 |
| Specialty Retail | | 3.9 |
| Insurance | | 3.7 |
| Professional Services | | 3.2 |
| Building Products | | 3.0 |
| Semiconductors & Semiconductor Equipment | | 3.0 |
| Oil, Gas & Consumable Fuels | | 2.9 |
| Chemicals | | 2.6 |
| Health Care Providers & Services | | 2.4 |
| Household Durables | | 2.4 |
| Metals & Mining | | 2.4 |
| Software | | 2.4 |
| Hotels, Restaurants & Leisure | | 2.0 |
| Textiles, Apparel & Luxury Goods | | 2.0 |
| Capital Markets | | 1.8 |
| Construction & Engineering | | 1.8 |
| Food Products | | 1.8 |
| Specialized Real Estate Investment Trusts | | 1.8 |
| Biotechnology | | 1.7 |
| Ground Transportation | | 1.7 |
| Aerospace & Defense | | 1.6 |
| Automobile Components | | 1.6 |
| Retail Real Estate Investment Trusts | | 1.6 |
| Commercial Services & Supplies | | 1.5 |
| Electrical Equipment | | 1.5 |
| Financial Services | | 1.5 |
| Trading Companies & Distributors | | 1.3 |
| Consumer Staples Distribution & Retail | | 1.2 |
| Diversified Consumer Services | | 1.2 |
| Electric Utilities | | 1.1 |
| Leisure Products | | 1.1 |
| Energy Equipment & Services | | 1.0 |
| Gas Utilities | | 1.0 |
| Industrial Real Estate Investment Trusts | | 1.0 |
| Industry Diversification | | Percent* |
| Life Sciences Tools & Services | | 1.0% |
| Media | | 1.0 |
| Communications Equipment | | 0.9 |
| Pharmaceuticals | | 0.9 |
| Office Real Estate Investment Trusts | | 0.8 |
| Personal Care Products | | 0.8 |
| Containers & Packaging | | 0.7 |
| Mortgage Real Estate Investment Trusts | | 0.7 |
| Water Utilities | | 0.7 |
| Consumer Finance | | 0.6 |
| Diversified Telecommunication Services | | 0.6 |
| Real Estate Management & Development | | 0.6 |
| Automobiles | | 0.5 |
| Residential Real Estate Investment Trusts | | 0.5 |
| Air Freight & Logistics | | 0.4 |
| Broadline Retail | | 0.4 |
| Health Care Real Estate Investment Trusts | | 0.4 |
| Hotel & Resort Real Estate Investment Trusts | | 0.4 |
| Interactive Media & Services | | 0.4 |
| Multi-Utilities | | 0.4 |
| Beverages | | 0.3 |
| Diversified Real Estate Investment Trusts | | 0.3 |
| Money Market Fund | | 0.3 |
| Passenger Airlines | | 0.3 |
| Technology Hardware, Storage & Peripherals | | 0.3 |
| Construction Materials | | 0.2 |
| Entertainment | | 0.2 |
| Health Care Technology | | 0.2 |
| Household Products | | 0.2 |
| IT Services | | 0.2 |
| Marine Transportation | | 0.2 |
| Paper & Forest Products | | 0.2 |
| Independent Power and Renewable Electricity Producers | | 0.1 |
| Wireless Telecommunication Services | | 0.1 |
| Total Investments | | 100.0% |
| * | Percentages indicated are based on net assets as of April 30, 2023.
|
See notes to financial statements.
STEWARD FUNDS
SCHEDULE OF PORTFOLIO INVESTMENTS — April 30, 2023
STEWARD VALUES-FOCUSED SMALL-MID CAP ENHANCED INDEX FUND
| | Shares | | Value |
| COMMON STOCKS - 99.7% |
| AEROSPACE & DEFENSE - 1.6% |
| AAR Corp.(a) | 2,060 | | $ 108,727 |
| Aerojet Rocketdyne Holdings, Inc.(a) | 4,248 | | 239,630 |
| AeroVironment, Inc.(a) | 1,419 | | 142,879 |
| Axon Enterprise, Inc.(a) | 3,631 | | 765,088 |
| Curtiss-Wright Corp. | 2,213 | | 375,834 |
| Hexcel Corp. | 4,407 | | 317,656 |
| Kaman Corp. | 1,770 | | 39,064 |
| Mercury Systems, Inc.(a) | 3,160 | | 150,637 |
| Moog, Inc., Class A | 1,888 | | 170,128 |
| National Presto Industries, Inc. | 379 | | 25,779 |
| Triumph Group, Inc.(a) | 3,570 | | 38,592 |
| Woodward, Inc. | 3,186 | | 305,920 |
| | | | 2,679,934 |
| AIR FREIGHT & LOGISTICS - 0.4% |
| Forward Air Corp. | 1,591 | | 167,866 |
| GXO Logistics, Inc.(a) | 6,359 | | 337,854 |
| Hub Group, Inc., Class A(a) | 1,900 | | 143,260 |
| | | | 648,980 |
| AUTOMOBILE COMPONENTS - 1.6% |
| Adient PLC(a) | 5,124 | | 189,280 |
| American Axle & Manufacturing Holdings, Inc.(a) | 6,850 | | 48,977 |
| Autoliv, Inc. | 4,154 | | 356,455 |
| Dana, Inc. | 7,151 | | 105,763 |
| Dorman Products, Inc.(a) | 1,636 | | 140,958 |
| Fox Factory Holding Corp.(a) | 2,359 | | 261,542 |
| Gentex Corp. | 12,445 | | 343,357 |
| Gentherm, Inc.(a) | 1,964 | | 117,153 |
| Goodyear Tire & Rubber Co. (The)(a) | 15,773 | | 168,298 |
| LCI Industries | 1,477 | | 166,842 |
| Lear Corp. | 3,183 | | 406,342 |
| Patrick Industries, Inc. | 1,379 | | 94,641 |
| Standard Motor Products, Inc. | 1,160 | | 41,772 |
| Visteon Corp.(a) | 1,552 | | 217,885 |
| XPEL, Inc.(a) | 1,144 | | 83,581 |
| | | | 2,742,846 |
| AUTOMOBILES - 0.5% |
| Harley-Davidson, Inc. | 11,302 | | 419,304 |
| Thor Industries, Inc. | 2,890 | | 228,368 |
| Winnebago Industries, Inc. | 1,898 | | 110,350 |
| | | | 758,022 |
| BANKS - 6.7% |
| Ameris Bancorp | 3,582 | | 119,997 |
| | Shares | | Value |
| Associated Banc-Corp | 7,939 | | $ 141,552 |
| Atlantic Union Bankshares Corp. | 1,684 | | 48,196 |
| Axos Financial, Inc.(a) | 2,829 | | 115,055 |
| Banc of California, Inc. | 2,870 | | 32,575 |
| BancFirst Corp. | 1,172 | | 93,631 |
| Bancorp, Inc. (The)(a) | 3,176 | | 101,346 |
| Bank of Hawaii Corp. | 2,122 | | 102,768 |
| Bank OZK | 5,795 | | 206,997 |
| BankUnited, Inc. | 4,314 | | 97,281 |
| Banner Corp. | 1,745 | | 87,110 |
| Berkshire Hills Bancorp, Inc. | 2,660 | | 56,578 |
| Brookline Bancorp, Inc. | 6,100 | | 58,194 |
| Cadence Bank | 9,945 | | 201,088 |
| Capitol Federal Financial, Inc. | 6,050 | | 37,510 |
| Cathay General Bancorp | 3,363 | | 107,179 |
| Central Pacific Financial Corp. | 1,180 | | 18,738 |
| City Holding Co. | 935 | | 85,263 |
| Columbia Banking System, Inc. | 11,557 | | 246,858 |
| Commerce Bancshares, Inc. | 5,730 | | 320,020 |
| Community Bank System, Inc. | 2,540 | | 126,898 |
| Cullen/Frost Bankers, Inc. | 3,395 | | 374,299 |
| Customers Bancorp, Inc.(a) | 1,740 | | 38,002 |
| CVB Financial Corp. | 7,440 | | 111,377 |
| Dime Community Bancshares, Inc., Class B | 2,282 | | 47,009 |
| Eagle Bancorp, Inc. | 1,440 | | 36,144 |
| East West Bancorp, Inc. | 7,341 | | 379,456 |
| F.N.B. Corp. | 20,435 | | 234,594 |
| FB Financial Corp. | 2,273 | | 66,894 |
| First Bancorp | 1,870 | | 57,559 |
| First BanCorp | 11,462 | | 134,678 |
| First Commonwealth Financial Corp. | 4,960 | | 61,901 |
| First Financial Bancorp | 4,760 | | 98,532 |
| First Financial Bankshares, Inc. | 6,616 | | 193,584 |
| First Hawaiian, Inc. | 6,464 | | 123,527 |
| First Horizon Corp. | 29,159 | | 511,740 |
| Fulton Financial Corp. | 11,140 | | 132,900 |
| Glacier Bancorp, Inc. | 5,777 | | 191,970 |
| Hancock Whitney Corp. | 4,366 | | 159,446 |
| Hanmi Financial Corp. | 1,901 | | 30,720 |
| Heritage Financial Corp. | 1,430 | | 25,182 |
| Hilltop Holdings, Inc. | 3,183 | | 98,737 |
| Home Bancshares, Inc. | 9,688 | | 210,908 |
| HomeStreet, Inc. | 1,010 | | 9,858 |
| Hope Bancorp, Inc. | 8,372 | | 76,185 |
| Independent Bank Corp. | 2,289 | | 128,184 |
| Independent Bank Group, Inc. | 1,750 | | 63,665 |
| International Bancshares Corp. | 2,972 | | 126,815 |
See notes to financial statements.
STEWARD FUNDS
SCHEDULE OF PORTFOLIO INVESTMENTS — April 30, 2023
STEWARD VALUES-FOCUSED SMALL-MID CAP ENHANCED INDEX FUND
| | Shares | | Value |
| Lakeland Financial Corp. | 1,600 | | $ 81,072 |
| National Bank Holdings Corp., Class A | 1,800 | | 57,240 |
| NBT Bancorp, Inc. | 2,040 | | 65,770 |
| New York Community Bancorp, Inc. | 37,350 | | 399,271 |
| Northfield Bancorp, Inc. | 4,010 | | 41,784 |
| Northwest Bancshares, Inc. | 4,090 | | 47,812 |
| OFG Bancorp | 2,890 | | 73,897 |
| Old National Bancorp | 16,416 | | 220,139 |
| Pacific Premier Bancorp, Inc. | 4,668 | | 103,816 |
| PacWest Bancorp | 6,950 | | 70,543 |
| Park National Corp. | 782 | | 84,706 |
| Pathward Financial, Inc. | 1,690 | | 75,256 |
| Pinnacle Financial Partners, Inc. | 3,846 | | 208,569 |
| Preferred Bank | 1,075 | | 51,686 |
| Prosperity Bancshares, Inc. | 4,300 | | 269,266 |
| Provident Financial Services, Inc. | 3,730 | | 65,200 |
| Renasant Corp. | 3,230 | | 90,828 |
| S&T Bancorp, Inc. | 1,690 | | 46,526 |
| Seacoast Banking Corp. of Florida | 3,510 | | 77,887 |
| ServisFirst Bancshares, Inc. | 2,709 | | 136,804 |
| Simmons First National Corp., Class A | 6,574 | | 109,852 |
| Southside Bancshares, Inc. | 1,884 | | 59,779 |
| SouthState Corp. | 3,940 | | 271,781 |
| Stellar Bancorp, Inc. | 3,905 | | 89,581 |
| Synovus Financial Corp. | 7,962 | | 245,230 |
| Texas Capital Bancshares, Inc.(a) | 2,350 | | 118,088 |
| Tompkins Financial Corp. | 841 | | 49,299 |
| Triumph Financial, Inc.(a) | 1,403 | | 72,900 |
| TrustCo Bank Corp. NY | 800 | | 23,872 |
| Trustmark Corp. | 3,420 | | 81,704 |
| UMB Financial Corp. | 2,375 | | 151,074 |
| United Bankshares, Inc. | 6,921 | | 229,293 |
| United Community Banks, Inc. | 5,632 | | 140,237 |
| Valley National Bancorp | 22,624 | | 212,213 |
| Veritex Holdings, Inc. | 2,803 | | 48,240 |
| Washington Federal, Inc. | 3,575 | | 100,243 |
| Webster Financial Corp. | 9,160 | | 341,668 |
| Westamerica BanCorp | 1,637 | | 66,315 |
| Wintrust Financial Corp. | 3,373 | | 230,612 |
| WSFS Financial Corp. | 3,095 | | 108,851 |
| | | | 11,147,604 |
| BEVERAGES - 0.3% |
| Celsius Holdings, Inc.(a) | 2,280 | | 217,900 |
| Coca-Cola Consolidated, Inc. | 255 | | 150,312 |
| National Beverage Corp.(a) | 1,540 | | 76,538 |
| | | | 444,750 |
| | Shares | | Value |
| BIOTECHNOLOGY - 1.7% |
| Anika Therapeutics, Inc.(a) | 870 | | $ 22,324 |
| Arcus Biosciences, Inc.(a) | 3,030 | | 54,086 |
| Arrowhead Pharmaceuticals, Inc.(a) | 5,857 | | 207,396 |
| Avid Bioservices, Inc.(a) | 3,521 | | 63,554 |
| Catalyst Pharmaceuticals, Inc.(a) | 5,390 | | 85,809 |
| Coherus Biosciences, Inc.(a) | 4,740 | | 34,270 |
| Cytokinetics, Inc.(a) | 5,120 | | 191,488 |
| Dynavax Technologies Corp.(a) | 6,528 | | 67,956 |
| Emergent BioSolutions, Inc.(a) | 3,000 | | 26,490 |
| Enanta Pharmaceuticals, Inc.(a) | 1,266 | | 45,006 |
| Exelixis, Inc.(a) | 17,599 | | 322,062 |
| Ironwood Pharmaceuticals, Inc.(a) | 7,030 | | 73,182 |
| iTeos Therapeutics, Inc.(a) | 1,460 | | 20,060 |
| Myriad Genetics, Inc.(a) | 4,317 | | 91,909 |
| Neurocrine Biosciences, Inc.(a) | 5,242 | | 529,652 |
| REGENXBIO, Inc.(a) | 2,560 | | 49,562 |
| uniQure N.V.(a) | 2,420 | | 46,972 |
| United Therapeutics Corp.(a) | 2,507 | | 576,936 |
| Vanda Pharmaceuticals, Inc.(a) | 3,970 | | 24,376 |
| Vericel Corp.(a) | 2,720 | | 85,707 |
| Vir Biotechnology, Inc.(a) | 4,180 | | 105,127 |
| Xencor, Inc.(a) | 3,272 | | 86,512 |
| | | | 2,810,436 |
| BROADLINE RETAIL - 0.4% |
| Big Lots, Inc. | 2,030 | | 18,250 |
| Kohl's Corp. | 6,295 | | 138,679 |
| Macy's, Inc. | 15,100 | | 246,734 |
| Nordstrom, Inc. | 6,457 | | 99,825 |
| Ollie's Bargain Outlet Holdings, Inc.(a) | 3,113 | | 203,123 |
| | | | 706,611 |
| BUILDING PRODUCTS - 3.0% |
| AAON, Inc. | 2,332 | | 228,536 |
| Advanced Drainage Systems, Inc. | 3,378 | | 289,562 |
| American Woodmark Corp.(a) | 978 | | 49,409 |
| Apogee Enterprises, Inc. | 1,260 | | 53,626 |
| AZZ, Inc. | 1,435 | | 54,143 |
| Builders FirstSource, Inc.(a) | 7,903 | | 748,967 |
| Carlisle Cos., Inc. | 2,839 | | 612,798 |
| Fortune Brands Innovations, Inc. | 6,492 | | 419,967 |
| Gibraltar Industries, Inc.(a) | 1,780 | | 89,071 |
| Griffon Corp. | 3,010 | | 85,634 |
| Insteel Industries, Inc. | 960 | | 26,429 |
| Lennox International, Inc. | 1,755 | | 494,752 |
| Masterbrand, Inc.(a) | 3,150 | | 25,421 |
See notes to financial statements.
STEWARD FUNDS
SCHEDULE OF PORTFOLIO INVESTMENTS — April 30, 2023
STEWARD VALUES-FOCUSED SMALL-MID CAP ENHANCED INDEX FUND
| | Shares | | Value |
| Owens Corning | 4,947 | | $ 528,389 |
| PGT Innovations, Inc.(a) | 3,525 | | 90,451 |
| Quanex Building Products Corp. | 2,025 | | 38,678 |
| Resideo Technologies, Inc.(a) | 17,325 | | 308,385 |
| Simpson Manufacturing Co., Inc. | 2,371 | | 298,224 |
| Trex Co., Inc.(a) | 5,831 | | 318,722 |
| UFP Industries, Inc. | 3,161 | | 248,202 |
| | | | 5,009,366 |
| CAPITAL MARKETS - 1.8% |
| Affiliated Managers Group, Inc. | 2,162 | | 312,150 |
| Avantax, Inc.(a) | 2,850 | | 72,304 |
| B. Riley Financial, Inc. | 1,259 | | 39,658 |
| Brightsphere Investment Group, Inc. | 2,520 | | 56,902 |
| Donnelley Financial Solutions, Inc.(a) | 1,621 | | 70,108 |
| Evercore, Inc., Class A | 2,095 | | 238,977 |
| Federated Hermes, Inc. | 4,553 | | 188,449 |
| Interactive Brokers Group, Inc., Class A | 5,620 | | 437,517 |
| Janus Henderson Group PLC | 13,432 | | 348,560 |
| Jefferies Financial Group, Inc. | 10,256 | | 328,500 |
| Piper Sandler Cos. | 818 | | 110,790 |
| SEI Investments Co. | 5,357 | | 315,581 |
| Stifel Financial Corp. | 5,707 | | 342,249 |
| StoneX Group, Inc.(a) | 1,094 | | 107,289 |
| Virtus Investment Partners, Inc. | 439 | | 79,990 |
| WisdomTree, Inc. | 6,910 | | 43,118 |
| | | | 3,092,142 |
| CHEMICALS - 2.6% |
| AdvanSix, Inc. | 1,540 | | 58,027 |
| American Vanguard Corp. | 1,350 | | 25,988 |
| Ashland, Inc. | 2,877 | | 292,332 |
| Avient Corp. | 4,516 | | 173,911 |
| Axalta Coating Systems Ltd.(a) | 7,970 | | 251,613 |
| Balchem Corp. | 1,856 | | 243,878 |
| Cabot Corp. | 2,891 | | 207,458 |
| Chemours Co. (The) | 7,953 | | 231,194 |
| FutureFuel Corp. | 1,390 | | 10,425 |
| H.B. Fuller Co. | 2,830 | | 187,261 |
| Hawkins, Inc. | 978 | | 39,453 |
| Ingevity Corp.(a) | 2,122 | | 152,232 |
| Innospec, Inc. | 1,468 | | 149,193 |
| Koppers Holdings, Inc. | 1,350 | | 44,294 |
| Livent Corp.(a) | 9,666 | | 211,202 |
| Minerals Technologies, Inc. | 2,068 | | 122,550 |
| NewMarket Corp. | 358 | | 143,057 |
| Olin Corp. | 6,605 | | 365,917 |
| Quaker Chemical Corp. | 726 | | 135,493 |
| | Shares | | Value |
| Rayonier Advanced Materials, Inc.(a) | 3,773 | | $ 20,525 |
| RPM International, Inc. | 6,883 | | 564,612 |
| Scotts Miracle-Gro Co. (The) | 2,324 | | 155,266 |
| Sensient Technologies Corp. | 2,565 | | 190,990 |
| Stepan Co. | 1,390 | | 128,158 |
| Trinseo PLC | 2,010 | | 36,421 |
| Westlake Corp. | 2,018 | | 229,608 |
| | | | 4,371,058 |
| COMMERCIAL SERVICES & SUPPLIES - 1.5% |
| ABM Industries, Inc. | 3,503 | | 149,158 |
| Brady Corp., Class A | 2,690 | | 137,271 |
| Brink's Co. (The) | 2,779 | | 174,660 |
| Clean Harbors, Inc.(a) | 2,847 | | 413,271 |
| Corecivic, Inc.(a) | 6,577 | | 57,812 |
| Deluxe Corp. | 2,730 | | 41,359 |
| Geo Group, Inc. (The)(a) | 7,434 | | 55,978 |
| Harsco Corp.(a) | 5,250 | | 36,068 |
| Healthcare Services Group, Inc. | 4,472 | | 69,808 |
| HNI Corp. | 2,470 | | 64,171 |
| Interface, Inc. | 3,860 | | 30,262 |
| KAR Auction Services, Inc.(a) | 5,891 | | 79,764 |
| Liquidity Services, Inc.(a) | 1,830 | | 23,918 |
| Matthews International Corp., Class A | 2,160 | | 81,799 |
| MillerKnoll, Inc. | 4,278 | | 72,769 |
| MSA Safety, Inc. | 2,094 | | 271,696 |
| Pitney Bowes, Inc. | 11,310 | | 39,698 |
| Stericycle, Inc.(a) | 4,863 | | 221,996 |
| Tetra Tech, Inc. | 2,885 | | 399,197 |
| UniFirst Corp. | 878 | | 143,711 |
| Viad Corp.(a) | 1,420 | | 27,023 |
| | | | 2,591,389 |
| COMMUNICATIONS EQUIPMENT - 0.9% |
| ADTRAN Holdings, Inc. | 4,010 | | 36,571 |
| Calix, Inc.(a) | 3,065 | | 140,070 |
| Ciena Corp.(a) | 8,020 | | 369,241 |
| Clearfield, Inc.(a) | 752 | | 32,847 |
| Comtech Telecommunications Corp. | 1,710 | | 17,699 |
| Digi International, Inc.(a) | 2,020 | | 60,923 |
| Extreme Networks, Inc.(a) | 6,896 | | 122,611 |
| Harmonic, Inc.(a) | 5,853 | | 82,469 |
| Lumentum Holdings, Inc.(a) | 3,603 | | 173,845 |
| NETGEAR, Inc.(a) | 1,810 | | 25,575 |
| NetScout Systems, Inc.(a) | 3,590 | | 97,684 |
| Viasat, Inc.(a) | 4,110 | | 143,973 |
| Viavi Solutions, Inc.(a) | 14,010 | | 125,530 |
| | | | 1,429,038 |
See notes to financial statements.
STEWARD FUNDS
SCHEDULE OF PORTFOLIO INVESTMENTS — April 30, 2023
STEWARD VALUES-FOCUSED SMALL-MID CAP ENHANCED INDEX FUND
| | Shares | | Value |
| CONSTRUCTION & ENGINEERING - 1.8% |
| AECOM | 7,250 | | $ 602,112 |
| Arcosa, Inc. | 2,708 | | 182,898 |
| Comfort Systems USA, Inc. | 1,979 | | 295,841 |
| Dycom Industries, Inc.(a) | 1,677 | | 155,324 |
| EMCOR Group, Inc. | 2,616 | | 447,336 |
| Fluor Corp.(a) | 7,455 | | 216,642 |
| Granite Construction, Inc. | 2,480 | | 94,562 |
| MasTec, Inc.(a) | 3,127 | | 277,709 |
| MDU Resources Group, Inc. | 10,521 | | 307,424 |
| MYR Group, Inc.(a) | 912 | | 116,727 |
| Valmont Industries, Inc. | 1,136 | | 330,076 |
| | | | 3,026,651 |
| CONSTRUCTION MATERIALS - 0.2% |
| Eagle Materials, Inc. | 2,029 | | 300,718 |
| CONSUMER FINANCE - 0.6% |
| Bread Financial Holdings, Inc. | 2,530 | | 69,828 |
| Encore Capital Group, Inc.(a) | 1,715 | | 88,117 |
| Enova International, Inc.(a) | 1,908 | | 83,799 |
| EZCORP, Inc., Class A(a) | 3,780 | | 32,546 |
| FirstCash Holdings, Inc. | 2,198 | | 226,460 |
| Green Dot Corp., Class A(a) | 3,060 | | 52,601 |
| LendingTree, Inc.(a) | 892 | | 21,256 |
| Navient Corp. | 5,911 | | 97,768 |
| PRA Group, Inc.(a) | 2,420 | | 87,773 |
| PROG Holdings, Inc.(a) | 2,970 | | 89,783 |
| SLM Corp. | 13,630 | | 204,723 |
| World Acceptance Corp.(a) | 243 | | 24,519 |
| | | | 1,079,173 |
| CONSUMER STAPLES DISTRIBUTION & RETAIL - 1.2% |
| Andersons, Inc. (The) | 2,005 | | 89,623 |
| BJ's Wholesale Club Holdings, Inc.(a) | 7,473 | | 570,713 |
| Chefs' Warehouse, Inc. (The)(a) | 2,222 | | 73,904 |
| Grocery Outlet Holding Corp.(a) | 5,084 | | 151,402 |
| PriceSmart, Inc. | 1,755 | | 129,308 |
| SpartanNash Co. | 2,424 | | 59,436 |
| Sprouts Farmers Market, Inc.(a) | 10,077 | | 349,269 |
| United Natural Foods, Inc.(a) | 3,380 | | 92,173 |
| US Foods Holding Corp.(a) | 14,924 | | 573,082 |
| | | | 2,088,910 |
| CONTAINERS & PACKAGING - 0.7% |
| AptarGroup, Inc. | 3,362 | | 398,431 |
| Greif, Inc., Class A | 1,684 | | 105,738 |
| Myers Industries, Inc. | 1,870 | | 35,437 |
| O-I Glass, Inc.(a) | 8,295 | | 186,389 |
| | Shares | | Value |
| Silgan Holdings, Inc. | 4,371 | | $ 215,315 |
| Sonoco Products Co. | 5,120 | | 310,374 |
| | | | 1,251,684 |
| DIVERSIFIED CONSUMER SERVICES - 1.2% |
| Adtalem Global Education, Inc.(a) | 2,720 | | 110,350 |
| Frontdoor, Inc.(a) | 10,420 | | 285,091 |
| Graham Holdings Co., Class B | 236 | | 135,835 |
| Grand Canyon Education, Inc.(a) | 1,906 | | 226,242 |
| H&R Block, Inc. | 8,685 | | 294,508 |
| Mister Car Wash, Inc.(a) | 6,790 | | 59,888 |
| Perdoceo Education Corp.(a) | 4,920 | | 63,862 |
| Service Corp. International | 8,560 | | 600,826 |
| Strategic Education, Inc. | 1,461 | | 128,568 |
| Stride, Inc.(a) | 2,607 | | 111,997 |
| | | | 2,017,167 |
| DIVERSIFIED REAL ESTATE INVESTMENT TRUSTS - 0.3% |
| Alexander & Baldwin, Inc. | 4,923 | | 94,669 |
| American Assets Trust, Inc. | 3,540 | | 64,428 |
| Armada Hoffler Properties, Inc. | 4,940 | | 57,897 |
| Essential Properties Realty Trust, Inc. | 7,880 | | 195,030 |
| Global Net Lease, Inc. | 5,720 | | 64,407 |
| | | | 476,431 |
| DIVERSIFIED TELECOMMUNICATION SERVICES - 0.6% |
| ATN International, Inc. | 686 | | 24,813 |
| Cogent Communications Holdings, Inc. | 2,643 | | 182,473 |
| Consolidated Communications Holdings, Inc.(a) | 6,340 | | 24,536 |
| Frontier Communications Parent, Inc.(a) | 12,136 | | 273,545 |
| Iridium Communications, Inc. | 6,743 | | 427,978 |
| | | | 933,345 |
| ELECTRIC UTILITIES - 1.1% |
| ALLETE, Inc. | 3,080 | | 192,130 |
| Hawaiian Electric Industries, Inc. | 5,902 | | 231,417 |
| IDACORP, Inc. | 2,773 | | 308,136 |
| OGE Energy Corp. | 11,565 | | 434,150 |
| Otter Tail Corp. | 2,399 | | 172,608 |
| PNM Resources, Inc. | 4,875 | | 234,634 |
| Portland General Electric Co. | 5,100 | | 258,162 |
| | | | 1,831,237 |
| ELECTRICAL EQUIPMENT - 1.5% |
| Acuity Brands, Inc. | 1,702 | | 267,861 |
| Encore Wire Corp. | 972 | | 151,953 |
| EnerSys | 2,311 | | 191,743 |
| Hubbell, Inc. | 2,851 | | 767,831 |
See notes to financial statements.
STEWARD FUNDS
SCHEDULE OF PORTFOLIO INVESTMENTS — April 30, 2023
STEWARD VALUES-FOCUSED SMALL-MID CAP ENHANCED INDEX FUND
| | Shares | | Value |
| nVent Electric PLC | 8,532 | | $ 357,747 |
| Powell Industries, Inc. | 490 | | 19,629 |
| Regal Rexnord Corp. | 3,498 | | 455,300 |
| SunPower Corp.(a) | 4,613 | | 60,984 |
| Sunrun, Inc.(a) | 11,480 | | 241,539 |
| Vicor Corp.(a) | 1,334 | | 57,322 |
| | | | 2,571,909 |
ELECTRONIC EQUIPMENT, INSTRUMENTS & COMPONENTS -
4.2% |
| Advanced Energy Industries, Inc. | 2,199 | | 190,213 |
| Arlo Technologies, Inc.(a) | 5,581 | | 35,942 |
| Arrow Electronics, Inc.(a) | 3,125 | | 357,594 |
| Avnet, Inc. | 8,980 | | 370,515 |
| Badger Meter, Inc. | 2,885 | | 381,772 |
| Belden, Inc. | 2,485 | | 196,042 |
| Benchmark Electronics, Inc. | 7,042 | | 150,347 |
| Cognex Corp. | 9,162 | | 436,936 |
| Coherent Corp.(a) | 7,522 | | 256,801 |
| CTS Corp. | 1,880 | | 73,715 |
| ePlus, Inc.(a) | 1,520 | | 66,181 |
| Fabrinet (a) | 2,079 | | 197,401 |
| FARO Technologies, Inc.(a) | 1,130 | | 26,385 |
| Insight Enterprises, Inc.(a) | 3,081 | | 372,647 |
| IPG Photonics Corp.(a) | 1,784 | | 205,124 |
| Itron, Inc.(a) | 5,875 | | 313,725 |
| Jabil, Inc. | 7,121 | | 556,506 |
| Knowles Corp.(a) | 5,710 | | 96,385 |
| Littelfuse, Inc. | 1,311 | | 317,577 |
| Methode Electronics, Inc. | 2,090 | | 85,669 |
| National Instruments Corp. | 6,945 | | 404,407 |
| Novanta, Inc.(a) | 3,006 | | 459,437 |
| OSI Systems, Inc.(a) | 996 | | 112,508 |
| PC Connection, Inc. | 730 | | 29,397 |
| Plexus Corp.(a) | 3,629 | | 317,429 |
| Rogers Corp.(a) | 1,047 | | 168,515 |
| Sanmina Corp.(a) | 3,050 | | 159,393 |
| ScanSource, Inc.(a) | 1,530 | | 41,845 |
| TD SYNNEX Corp. | 2,581 | | 229,812 |
| TTM Technologies, Inc.(a) | 6,480 | | 76,529 |
| Vishay Intertechnology, Inc. | 6,180 | | 131,572 |
| Vontier Corp. | 8,415 | | 228,299 |
| | | | 7,046,620 |
| ENERGY EQUIPMENT & SERVICES - 1.0% |
| Archrock, Inc. | 7,289 | | 75,004 |
| Bristow Group, Inc.(a) | 1,290 | | 28,857 |
| ChampionX Corp. | 10,626 | | 287,752 |
| | Shares | | Value |
| Core Laboratories N.V. | 2,630 | | $ 59,201 |
| DMC Global, Inc.(a) | 1,040 | | 19,698 |
| Dril-Quip, Inc.(a) | 1,791 | | 48,858 |
| Helix Energy Solutions Group, Inc.(a) | 7,737 | | 56,093 |
| Helmerich & Payne, Inc. | 5,058 | | 167,723 |
| Nabors Industries Ltd.(a) | 501 | | 49,970 |
| NOV, Inc. | 21,160 | | 354,430 |
| Oceaneering International, Inc.(a) | 5,418 | | 96,061 |
| Oil States International, Inc.(a) | 4,840 | | 34,074 |
| Patterson-UTI Energy, Inc. | 11,846 | | 132,557 |
| ProPetro Holding Corp.(a) | 6,670 | | 46,290 |
| RPC, Inc. | 5,720 | | 42,271 |
| U.S. Silica Holdings, Inc.(a) | 4,270 | | 55,723 |
| Valaris Ltd.(a) | 3,151 | | 189,060 |
| | | | 1,743,622 |
| ENTERTAINMENT - 0.2% |
| Cinemark Holdings, Inc.(a) | 6,029 | | 101,770 |
| Marcus Corp. (The) | 1,710 | | 29,959 |
| World Wrestling Entertainment, Inc., Class A | 2,489 | | 266,746 |
| | | | 398,475 |
| FINANCIAL SERVICES - 1.5% |
| Essent Group Ltd. | 5,723 | | 243,056 |
| Euronet Worldwide, Inc.(a) | 2,665 | | 295,122 |
| EVERTEC, Inc. | 3,561 | | 123,531 |
| MGIC Investment Corp. | 15,990 | | 237,771 |
| Mr. Cooper Group, Inc.(a) | 3,800 | | 175,940 |
| NMI Holdings, Inc., Class A(a) | 4,529 | | 105,979 |
| Payoneer Global, Inc.(a) | 11,244 | | 61,392 |
| Radian Group, Inc. | 4,831 | | 117,248 |
| Voya Financial, Inc. | 5,256 | | 401,979 |
| Walker & Dunlop, Inc. | 2,021 | | 136,034 |
| Western Union Co. (The) | 21,251 | | 232,274 |
| WEX, Inc.(a) | 2,398 | | 425,285 |
| | | | 2,555,611 |
| FOOD PRODUCTS - 1.8% |
| B&G Foods, Inc. | 4,180 | | 67,047 |
| Calavo Growers, Inc. | 1,040 | | 33,238 |
| Cal-Maine Foods, Inc. | 2,241 | | 106,448 |
| Darling Ingredients, Inc.(a) | 8,692 | | 517,783 |
| Flowers Foods, Inc. | 11,375 | | 312,926 |
| Fresh Del Monte Produce, Inc. | 2,440 | | 70,052 |
| Hain Celestial Group, Inc. (The)(a) | 4,952 | | 88,789 |
| Hostess Brands, Inc.(a) | 7,660 | | 197,322 |
| Ingredion, Inc. | 3,579 | | 379,982 |
See notes to financial statements.
STEWARD FUNDS
SCHEDULE OF PORTFOLIO INVESTMENTS — April 30, 2023
STEWARD VALUES-FOCUSED SMALL-MID CAP ENHANCED INDEX FUND
| | Shares | | Value |
| J & J Snack Foods Corp. | 950 | | $ 145,540 |
| John B. Sanfilippo & Son, Inc. | 597 | | 62,058 |
| Lancaster Colony Corp. | 1,106 | | 231,287 |
| Pilgrim's Pride Corp.(a) | 3,410 | | 77,782 |
| Post Holdings, Inc.(a) | 3,117 | | 282,057 |
| Seneca Foods Corp., Class A(a) | 496 | | 23,610 |
| Simply Good Foods Co. (The)(a) | 4,622 | | 168,102 |
| Tootsie Roll Industries, Inc. | 1,539 | | 62,914 |
| TreeHouse Foods, Inc.(a) | 2,910 | | 154,958 |
| | | | 2,981,895 |
| GAS UTILITIES - 1.0% |
| Chesapeake Utilities Corp. | 1,139 | | 140,667 |
| National Fuel Gas Co. | 4,650 | | 259,935 |
| New Jersey Resources Corp. | 5,204 | | 268,735 |
| Northwest Natural Holding Co. | 1,790 | | 84,058 |
| ONE Gas, Inc. | 2,906 | | 223,617 |
| Southwest Gas Holdings, Inc. | 3,535 | | 197,960 |
| Spire, Inc. | 2,710 | | 183,548 |
| UGI Corp. | 11,324 | | 383,657 |
| | | | 1,742,177 |
| GROUND TRANSPORTATION - 1.7% |
| ArcBest Corp. | 1,386 | | 130,838 |
| Avis Budget Group, Inc.(a) | 1,355 | | 239,388 |
| Heartland Express, Inc. | 2,983 | | 43,194 |
| Hertz Global Holdings, Inc.(a) | 7,216 | | 120,363 |
| Knight-Swift Transportation Holdings, Inc. | 8,612 | | 485,028 |
| Landstar System, Inc. | 2,015 | | 354,700 |
| Marten Transport Ltd. | 4,069 | | 82,153 |
| RXO, Inc.(a) | 6,353 | | 114,926 |
| Ryder System, Inc. | 4,785 | | 378,781 |
| Saia, Inc.(a) | 1,432 | | 426,407 |
| Werner Enterprises, Inc. | 3,400 | | 153,578 |
| XPO, Inc.(a) | 5,473 | | 241,797 |
| | | | 2,771,153 |
| HEALTH CARE EQUIPMENT & SUPPLIES - 3.9% |
| AngioDynamics, Inc.(a) | 2,440 | | 20,301 |
| Artivion, Inc.(a) | 2,660 | | 36,894 |
| Avanos Medical, Inc.(a) | 2,830 | | 83,598 |
| CONMED Corp. | 1,846 | | 231,802 |
| Cutera, Inc.(a) | 1,135 | | 25,878 |
| Embecta Corp. | 3,186 | | 88,412 |
| Enovis Corp.(a) | 2,703 | | 157,450 |
| Envista Holdings Corp.(a) | 8,983 | | 345,756 |
| Glaukos Corp.(a) | 2,805 | | 133,266 |
| Globus Medical, Inc., Class A(a) | 4,252 | | 247,211 |
| | Shares | | Value |
| Haemonetics Corp.(a) | 2,878 | | $ 240,917 |
| Heska Corp.(a) | 603 | | 70,648 |
| ICU Medical, Inc.(a) | 1,190 | | 225,077 |
| Inari Medical, Inc.(a) | 2,811 | | 186,707 |
| Inogen, Inc.(a) | 1,300 | | 17,303 |
| Integer Holdings Corp.(a) | 2,086 | | 171,782 |
| Integra LifeSciences Holdings Corp.(a) | 4,011 | | 221,889 |
| Lantheus Holdings, Inc.(a) | 3,725 | | 318,301 |
| LeMaitre Vascular, Inc. | 1,310 | | 70,740 |
| LivaNova PLC(a) | 2,890 | | 138,431 |
| Masimo Corp.(a) | 2,659 | | 502,923 |
| Merit Medical Systems, Inc.(a) | 5,256 | | 427,260 |
| Mesa Laboratories, Inc. | 308 | | 51,285 |
| Neogen Corp.(a) | 11,578 | | 199,373 |
| NuVasive, Inc.(a) | 2,940 | | 126,538 |
| Omnicell, Inc.(a) | 2,757 | | 167,543 |
| OraSure Technologies, Inc.(a) | 3,830 | | 26,044 |
| Orthofix Medical, Inc.(a) | 1,110 | | 20,901 |
| Penumbra, Inc.(a) | 2,070 | | 588,128 |
| QuidelOrtho Corp.(a) | 2,932 | | 263,733 |
| Shockwave Medical, Inc.(a) | 1,958 | | 568,133 |
| STAAR Surgical Co.(a) | 5,136 | | 361,934 |
| Tandem Diabetes Care, Inc.(a) | 3,510 | | 138,926 |
| Varex Imaging Corp.(a) | 2,360 | | 41,866 |
| Zynex, Inc.(a) | 1,703 | | 19,482 |
| | | | 6,536,432 |
| HEALTH CARE PROVIDERS & SERVICES - 2.4% |
| Acadia Healthcare Co., Inc.(a) | 5,052 | | 365,209 |
| AdaptHealth Corp.(a) | 4,790 | | 56,905 |
| Addus HomeCare Corp.(a) | 1,054 | | 86,154 |
| Agiliti, Inc.(a) | 1,960 | | 32,771 |
| Amedisys, Inc.(a) | 1,983 | | 159,235 |
| AMN Healthcare Services, Inc.(a) | 2,505 | | 216,307 |
| Apollo Medical Holdings, Inc.(a) | 2,320 | | 82,337 |
| Chemed Corp. | 811 | | 447,064 |
| CorVel Corp.(a) | 554 | | 111,925 |
| Cross Country Healthcare, Inc.(a) | 2,190 | | 48,136 |
| Encompass Health Corp. | 5,590 | | 358,598 |
| Enhabit, Inc.(a) | 2,905 | | 35,586 |
| Ensign Group, Inc. (The) | 3,173 | | 308,067 |
| Fulgent Genetics, Inc.(a) | 1,320 | | 39,032 |
| HealthEquity, Inc.(a) | 4,618 | | 246,832 |
| ModivCare, Inc.(a) | 904 | | 57,494 |
| NeoGenomics, Inc.(a) | 6,936 | | 101,404 |
| Option Care Health, Inc.(a) | 9,030 | | 290,314 |
| Owens & Minor, Inc.(a) | 4,565 | | 70,940 |
See notes to financial statements.
STEWARD FUNDS
SCHEDULE OF PORTFOLIO INVESTMENTS — April 30, 2023
STEWARD VALUES-FOCUSED SMALL-MID CAP ENHANCED INDEX FUND
| | Shares | | Value |
| Patterson Cos., Inc. | 4,983 | | $ 135,089 |
| Pediatrix Medical Group, Inc.(a) | 4,520 | | 64,772 |
| Progyny, Inc.(a) | 4,166 | | 138,478 |
| R1 RCM, Inc.(a) | 7,822 | | 121,945 |
| RadNet, Inc.(a) | 3,160 | | 87,406 |
| Select Medical Holdings Corp. | 5,951 | | 181,506 |
| U.S. Physical Therapy, Inc. | 848 | | 90,278 |
| | | | 3,933,784 |
| HEALTH CARE REAL ESTATE INVESTMENT TRUSTS - 0.4% |
| CareTrust REIT, Inc. | 5,808 | | 113,198 |
| LTC Properties, Inc. | 2,760 | | 92,322 |
| Omega Healthcare Investors, Inc. | 13,281 | | 355,399 |
| Sabra Health Care REIT, Inc. | 12,749 | | 145,339 |
| | | | 706,258 |
| HEALTH CARE TECHNOLOGY - 0.2% |
| Certara, Inc.(a) | 4,944 | | 119,497 |
| Computer Programs and Systems, Inc.(a) | 890 | | 23,033 |
| HealthStream, Inc. | 1,710 | | 42,134 |
| NextGen Healthcare, Inc.(a) | 4,090 | | 68,467 |
| Simulations Plus, Inc. | 1,100 | | 45,925 |
| Veradigm, Inc.(a) | 5,968 | | 74,540 |
| | | | 373,596 |
| HOTEL & RESORT REAL ESTATE INVESTMENT TRUSTS - 0.4% |
| Chatham Lodging Trust | 2,050 | | 20,992 |
| DiamondRock Hospitality Co. | 13,625 | | 110,499 |
| Park Hotels & Resorts, Inc. | 13,367 | | 161,072 |
| Pebblebrook Hotel Trust | 8,031 | | 114,281 |
| Service Properties Trust | 8,860 | | 77,702 |
| Summit Hotel Properties, Inc. | 8,030 | | 51,713 |
| Sunstone Hotel Investors, Inc. | 10,730 | | 102,257 |
| Xenia Hotels & Resorts, Inc. | 6,695 | | 84,759 |
| | | | 723,275 |
| HOTELS, RESTAURANTS & LEISURE - 2.0% |
| Aramark | 13,315 | | 462,031 |
| Brinker International, Inc.(a) | 2,790 | | 111,377 |
| Choice Hotels International, Inc. | 2,065 | | 263,329 |
| Dine Brands Global, Inc. | 1,651 | | 107,199 |
| El Pollo Loco Holdings, Inc. | 2,780 | | 25,910 |
| Hilton Grand Vacations, Inc.(a) | 4,213 | | 180,316 |
| Jack in the Box, Inc. | 1,427 | | 132,269 |
| Marriott Vacations Worldwide Corp. | 2,665 | | 358,602 |
| Papa John's International, Inc. | 2,397 | | 179,272 |
| Sabre Corp.(a) | 18,980 | | 75,920 |
| | Shares | | Value |
| Shake Shack, Inc., Class A(a) | 2,590 | | $ 141,958 |
| Six Flags Entertainment Corp.(a) | 4,770 | | 115,768 |
| Travel + Leisure Co. | 5,477 | | 209,605 |
| Wendy's Co. (The) | 11,410 | | 252,161 |
| Wingstop, Inc. | 1,676 | | 335,384 |
| Wyndham Hotels & Resorts, Inc. | 5,570 | | 379,985 |
| | | | 3,331,086 |
| HOUSEHOLD DURABLES - 2.4% |
| Cavco Industries, Inc.(a) | 420 | | 126,092 |
| Century Communities, Inc. | 1,818 | | 122,424 |
| Ethan Allen Interiors, Inc. | 1,520 | | 42,454 |
| Green Brick Partners, Inc.(a) | 1,830 | | 68,204 |
| Helen of Troy Ltd.(a) | 3,421 | | 343,263 |
| Installed Building Products, Inc. | 1,378 | | 171,244 |
| iRobot Corp.(a) | 1,685 | | 66,271 |
| KB Home | 4,546 | | 199,206 |
| La-Z-Boy, Inc. | 2,770 | | 79,582 |
| Leggett & Platt, Inc. | 12,620 | | 407,752 |
| LGI Homes, Inc.(a) | 1,289 | | 153,133 |
| M.D.C Holdings, Inc. | 3,328 | | 136,348 |
| M/I Homes, Inc.(a) | 1,710 | | 115,664 |
| Meritage Homes Corp. | 2,231 | | 285,680 |
| Sonos, Inc.(a) | 6,940 | | 146,712 |
| Taylor Morrison Home Corp.(a) | 5,848 | | 251,990 |
| Tempur Sealy International, Inc. | 9,491 | | 355,628 |
| Toll Brothers, Inc. | 5,692 | | 363,776 |
| TopBuild Corp.(a) | 1,735 | | 391,208 |
| Tri Pointe Homes, Inc.(a) | 5,596 | | 160,493 |
| | | | 3,987,124 |
| HOUSEHOLD PRODUCTS - 0.2% |
| Central Garden & Pet Co.(a) | 490 | | 18,052 |
| Central Garden & Pet Co., Class A(a) | 2,790 | | 98,571 |
| Energizer Holdings, Inc. | 3,903 | | 130,477 |
| WD-40 Co. | 783 | | 149,083 |
| | | | 396,183 |
INDEPENDENT POWER AND RENEWABLE ELECTRICITY
PRODUCERS - 0.1% |
| Ormat Technologies, Inc. | 2,847 | | 244,301 |
| INDUSTRIAL REAL ESTATE INVESTMENT TRUSTS - 1.0% |
| EastGroup Properties, Inc. | 2,615 | | 435,554 |
| First Industrial Realty Trust, Inc. | 8,252 | | 432,982 |
| Innovative Industrial Properties, Inc. | 1,747 | | 119,757 |
See notes to financial statements.
STEWARD FUNDS
SCHEDULE OF PORTFOLIO INVESTMENTS — April 30, 2023
STEWARD VALUES-FOCUSED SMALL-MID CAP ENHANCED INDEX FUND
| | Shares | | Value |
| LXP Industrial Trust | 15,915 | | $ 149,601 |
| Rexford Industrial Realty, Inc. | 10,410 | | 580,566 |
| | | | 1,718,460 |
| INSURANCE - 3.7% |
| Ambac Financial Group, Inc.(a) | 2,690 | | 42,906 |
| American Equity Investment Life Holding Co. | 3,892 | | 149,998 |
| American Financial Group, Inc. | 3,780 | | 463,919 |
| AMERISAFE, Inc. | 1,127 | �� | 62,718 |
| Assured Guaranty Ltd. | 3,150 | | 169,690 |
| Brighthouse Financial, Inc.(a) | 3,510 | | 155,142 |
| CNO Financial Group, Inc. | 7,111 | | 159,571 |
| Employers Holdings, Inc. | 1,580 | | 62,552 |
| First American Financial Corp. | 5,610 | | 323,192 |
| Genworth Financial, Inc., Class A(a) | 28,500 | | 165,585 |
| Hanover Insurance Group, Inc. (The) | 2,245 | | 268,412 |
| HCI Group, Inc. | 457 | | 23,152 |
| Horace Mann Educators Corp. | 2,500 | | 78,200 |
| James River Group Holdings Ltd. | 2,340 | | 45,560 |
| Kemper Corp. | 3,372 | | 164,048 |
| Kinsale Capital Group, Inc. | 1,173 | | 383,231 |
| Mercury General Corp. | 1,810 | | 55,042 |
| Old Republic International Corp. | 15,176 | | 383,498 |
| Palomar Holdings, Inc.(a) | 1,501 | | 75,440 |
| Primerica, Inc. | 2,101 | | 383,454 |
| ProAssurance Corp. | 3,130 | | 56,215 |
| Reinsurance Group of America, Inc. | 3,639 | | 517,902 |
| RenaissanceRe Holdings Ltd. | 2,418 | | 520,861 |
| RLI Corp. | 2,317 | | 322,179 |
| Safety Insurance Group, Inc. | 979 | | 71,555 |
| Selective Insurance Group, Inc. | 3,271 | | 315,095 |
| SiriusPoint Ltd.(a) | 6,324 | | 54,956 |
| Stewart Information Services Corp. | 1,812 | | 75,470 |
| Trupanion, Inc.(a) | 2,094 | | 73,520 |
| United Fire Group, Inc. | 1,440 | | 38,736 |
| Universal Insurance Holdings, Inc. | 2,360 | | 36,391 |
| Unum Group | 10,377 | | 437,909 |
| | | | 6,136,099 |
| INTERACTIVE MEDIA & SERVICES - 0.4% |
| Cars.com, Inc.(a) | 3,584 | | 70,139 |
| QuinStreet, Inc.(a) | 3,500 | | 38,885 |
| Shutterstock, Inc. | 1,557 | | 104,319 |
| TripAdvisor, Inc.(a) | 5,943 | | 105,369 |
| Yelp, Inc.(a) | 3,839 | | 114,863 |
| Ziff Davis, Inc.(a) | 2,878 | | 210,497 |
| | | | 644,072 |
| | Shares | | Value |
| IT SERVICES - 0.2% |
| Kyndryl Holdings, Inc.(a) | 11,138 | | $ 161,056 |
| Perficient, Inc.(a) | 2,149 | | 139,513 |
| | | | 300,569 |
| LEISURE PRODUCTS - 1.1% |
| Brunswick Corp. | 3,865 | | 327,713 |
| Mattel, Inc.(a) | 19,352 | | 348,336 |
| Polaris, Inc. | 2,918 | | 317,041 |
| Sturm Ruger & Co., Inc. | 1,010 | | 58,136 |
| Topgolf Callaway Brands Corp.(a) | 15,498 | | 343,591 |
| Vista Outdoor, Inc.(a) | 3,304 | | 79,626 |
| YETI Holdings, Inc.(a) | 8,620 | | 340,059 |
| | | | 1,814,502 |
| LIFE SCIENCES TOOLS & SERVICES - 1.0% |
| Azenta, Inc.(a) | 3,767 | | 163,827 |
| BioLife Solutions, Inc.(a) | 1,960 | | 34,418 |
| Bruker Corp. | 5,420 | | 428,885 |
| Medpace Holdings, Inc.(a) | 1,416 | | 283,398 |
| Repligen Corp.(a) | 2,806 | | 425,474 |
| Sotera Health Co.(a) | 5,467 | | 91,681 |
| Syneos Health, Inc.(a) | 5,490 | | 215,537 |
| | | | 1,643,220 |
| MACHINERY - 4.7% |
| 3D Systems Corp.(a) | 7,050 | | 64,578 |
| AGCO Corp. | 3,260 | | 404,044 |
| Alamo Group, Inc. | 533 | | 94,197 |
| Albany International Corp., Class A | 1,947 | | 177,586 |
| Astec Industries, Inc. | 1,240 | | 51,187 |
| Barnes Group, Inc. | 2,840 | | 119,365 |
| Chart Industries, Inc.(a) | 2,322 | | 309,058 |
| CIRCOR International, Inc.(a) | 1,050 | | 29,232 |
| Crane Co.(a) | 2,873 | | 207,057 |
| Crane NXT Co. | 2,873 | | 136,065 |
| Donaldson Co., Inc. | 6,006 | | 381,681 |
| Enerpac Tool Group Corp. | 3,220 | | 76,507 |
| EnPro Industries, Inc. | 1,223 | | 115,292 |
| Esab Corp. | 2,903 | | 169,419 |
| ESCO Technologies, Inc. | 1,449 | | 135,583 |
| Federal Signal Corp. | 3,225 | | 165,701 |
| Flowserve Corp. | 6,807 | | 227,286 |
| Franklin Electric Co., Inc. | 2,293 | | 205,155 |
| Graco, Inc. | 8,466 | | 671,269 |
| Greenbrier Cos., Inc. (The) | 1,971 | | 52,133 |
| Hillenbrand, Inc. | 3,572 | | 162,955 |
See notes to financial statements.
STEWARD FUNDS
SCHEDULE OF PORTFOLIO INVESTMENTS — April 30, 2023
STEWARD VALUES-FOCUSED SMALL-MID CAP ENHANCED INDEX FUND
| | Shares | | Value |
| ITT, Inc. | 4,182 | | $ 353,128 |
| John Bean Technologies Corp. | 1,801 | | 195,787 |
| Kennametal, Inc. | 3,900 | | 101,244 |
| Lincoln Electric Holdings, Inc. | 3,031 | | 508,602 |
| Lindsay Corp. | 629 | | 75,945 |
| Middleby Corp. (The)(a) | 2,864 | | 403,480 |
| Mueller Industries, Inc. | 2,979 | | 214,041 |
| Oshkosh Corp. | 3,350 | | 256,342 |
| Proto Labs, Inc.(a) | 1,568 | | 45,111 |
| SPX Technologies, Inc.(a) | 2,567 | | 163,467 |
| Standex International Corp. | 669 | | 82,160 |
| Tennant Co. | 986 | | 75,350 |
| Terex Corp. | 3,501 | | 156,110 |
| Timken Co. (The) | 3,434 | | 263,903 |
| Titan International, Inc.(a) | 3,580 | | 34,941 |
| Toro Co. (The) | 5,511 | | 574,577 |
| Trinity Industries, Inc. | 4,331 | | 103,727 |
| Wabash National Corp. | 2,810 | | 72,133 |
| Watts Water Technologies, Inc., Class A | 1,476 | | 238,714 |
| | | | 7,874,112 |
| MARINE TRANSPORTATION - 0.2% |
| Kirby Corp.(a) | 3,090 | | 221,986 |
| Matson, Inc. | 2,243 | | 152,591 |
| | | | 374,577 |
| MEDIA - 1.0% |
| AMC Networks, Inc., Class A(a) | 1,770 | | 31,311 |
| Cable One, Inc. | 286 | | 216,905 |
| EW Scripps Co. (The), Class A(a) | 4,230 | | 35,659 |
| Gannett Co., Inc.(a) | 9,232 | | 17,541 |
| John Wiley & Sons, Inc., Class A | 2,570 | | 99,125 |
| New York Times Co. (The), Class A | 8,946 | | 355,603 |
| Nexstar Media Group, Inc. | 2,220 | | 385,059 |
| Scholastic Corp. | 1,711 | | 65,822 |
| TechTarget, Inc.(a) | 1,873 | | 63,851 |
| TEGNA, Inc. | 18,600 | | 318,060 |
| Thryv Holdings, Inc.(a) | 2,106 | | 47,301 |
| | | | 1,636,237 |
| METALS & MINING - 2.4% |
| Alcoa Corp. | 9,495 | | 352,644 |
| Arconic Corp.(a) | 5,353 | | 132,487 |
| ATI, Inc.(a) | 6,784 | | 261,998 |
| Carpenter Technology Corp. | 2,544 | | 134,171 |
| Century Aluminum Co.(a) | 3,330 | | 28,605 |
| Cleveland-Cliffs, Inc.(a) | 27,815 | | 427,795 |
| Commercial Metals Co. | 6,035 | | 281,774 |
| | Shares | | Value |
| Compass Minerals International, Inc. | 2,013 | | $ 65,886 |
| Haynes International, Inc. | 630 | | 29,616 |
| Kaiser Aluminum Corp. | 988 | | 64,931 |
| Materion Corp. | 1,143 | | 123,798 |
| MP Materials Corp.(a) | 5,064 | | 109,737 |
| Olympic Steel, Inc. | 610 | | 28,408 |
| Reliance Steel & Aluminum Co. | 3,108 | | 770,162 |
| Royal Gold, Inc. | 4,731 | | 626,574 |
| SunCoke Energy, Inc. | 6,340 | | 49,325 |
| TimkenSteel Corp.(a) | 2,495 | | 41,766 |
| Tredegar Corp. | 2,040 | | 19,135 |
| United States Steel Corp. | 12,173 | | 278,518 |
| Warrior Met Coal, Inc. | 2,800 | | 96,796 |
| Worthington Industries, Inc. | 1,732 | | 102,864 |
| | | | 4,026,990 |
| MORTGAGE REAL ESTATE INVESTMENT TRUSTS - 0.7% |
| Annaly Capital Management, Inc. | 25,714 | | 513,766 |
| Apollo Commercial Real Estate Finance, Inc. | 9,200 | | 93,104 |
| Armour Residential REIT, Inc. | 3,580 | | 18,258 |
| Ellington Financial, Inc. | 2,800 | | 35,756 |
| Franklin BSP Realty Trust, Inc. | 3,716 | | 46,933 |
| Invesco Mortgage Capital, Inc. | 1,447 | | 15,353 |
| KKR Real Estate Finance Trust, Inc. | 3,250 | | 34,905 |
| New York Mortgage Trust, Inc. | 5,642 | | 58,000 |
| Pennymac Mortgage Investment Trust | 5,780 | | 71,845 |
| Ready Capital Corp. | 4,730 | | 50,753 |
| Redwood Trust, Inc. | 7,420 | | 46,598 |
| Starwood Property Trust, Inc. | 4,353 | | 77,875 |
| Two Harbors Investment Corp. | 4,867 | | 67,797 |
| | | | 1,130,943 |
| MULTI-UTILITIES - 0.4% |
| Avista Corp. | 3,990 | | 175,839 |
| Black Hills Corp. | 3,460 | | 225,903 |
| NorthWestern Corp. | 3,080 | | 180,550 |
| Unitil Corp. | 925 | | 51,421 |
| | | | 633,713 |
| OFFICE REAL ESTATE INVESTMENT TRUSTS - 0.8% |
| Brandywine Realty Trust | 27,490 | | 108,036 |
| Corporate Office Properties Trust | 13,220 | | 302,606 |
| Douglas Emmett, Inc. | 11,259 | | 145,016 |
| Easterly Government Properties, Inc. | 5,040 | | 70,913 |
| Highwoods Properties, Inc. | 6,990 | | 160,211 |
| Hudson Pacific Properties, Inc. | 9,340 | | 51,930 |
| JBG Smith Properties | 7,110 | | 101,460 |
See notes to financial statements.
STEWARD FUNDS
SCHEDULE OF PORTFOLIO INVESTMENTS — April 30, 2023
STEWARD VALUES-FOCUSED SMALL-MID CAP ENHANCED INDEX FUND
| | Shares | | Value |
| Kilroy Realty Corp. | 5,990 | | $ 175,147 |
| Office Properties Income Trust | 3,047 | | 19,866 |
| Orion Office REIT, Inc. | 3,380 | | 20,753 |
| SL Green Realty Corp. | 3,610 | | 85,449 |
| Vornado Realty Trust | 6,510 | | 97,715 |
| | | | 1,339,102 |
| OIL, GAS & CONSUMABLE FUELS - 2.9% |
| Antero Midstream Corp. | 19,287 | | 207,528 |
| Antero Resources Corp.(a) | 14,953 | | 343,769 |
| Callon Petroleum Co.(a) | 2,855 | | 94,615 |
| Chord Energy Corp. | 2,333 | | 332,056 |
| Civitas Resources, Inc. | 2,790 | | 192,650 |
| CNX Resources Corp.(a) | 9,353 | | 145,252 |
| Comstock Resources, Inc. | 5,170 | | 59,455 |
| CONSOL Energy, Inc. | 1,884 | | 111,797 |
| CVR Energy, Inc. | 1,679 | | 44,225 |
| Dorian LPG Ltd. | 1,830 | | 40,663 |
| DT Midstream, Inc. | 5,010 | | 246,843 |
| Equitrans Midstream Corp. | 24,280 | | 125,042 |
| Green Plains, Inc.(a) | 3,219 | | 109,993 |
| HF Sinclair Corp. | 7,258 | | 320,150 |
| Matador Resources Co. | 6,045 | | 296,386 |
| Murphy Oil Corp. | 7,700 | | 282,667 |
| Northern Oil and Gas, Inc. | 3,420 | | 113,441 |
| Par Pacific Holdings, Inc.(a) | 3,136 | | 73,476 |
| PBF Energy, Inc., Class A | 6,181 | | 215,470 |
| PDC Energy, Inc. | 4,940 | | 321,347 |
| Range Resources Corp. | 13,021 | | 344,405 |
| Ranger Oil Corp., Class A | 1,237 | | 50,964 |
| REX American Resources Corp.(a) | 830 | | 23,481 |
| SM Energy Co. | 6,590 | | 185,047 |
| Southwestern Energy Co.(a) | 61,200 | | 317,628 |
| Talos Energy, Inc.(a) | 3,810 | | 51,930 |
| Vital Energy, Inc.(a) | 1,052 | | 48,950 |
| World Fuel Services Corp. | 3,267 | | 77,232 |
| | | | 4,776,462 |
| PAPER & FOREST PRODUCTS - 0.2% |
| Clearwater Paper Corp.(a) | 980 | | 35,378 |
| Louisiana-Pacific Corp. | 3,773 | | 225,399 |
| Mercer International, Inc. | 3,670 | | 35,709 |
| Sylvamo Corp. | 1,920 | | 87,975 |
| | | | 384,461 |
| PASSENGER AIRLINES - 0.3% |
| Allegiant Travel Co.(a) | 1,139 | | 118,353 |
| Hawaiian Holdings, Inc.(a) | 3,750 | | 31,238 |
| | Shares | | Value |
| JetBlue Airways Corp.(a) | 20,350 | | $ 145,299 |
| SkyWest, Inc.(a) | 2,884 | | 81,617 |
| Sun Country Airlines Holdings, Inc.(a) | 2,350 | | 46,366 |
| | | | 422,873 |
| PERSONAL CARE PRODUCTS - 0.8% |
| BellRing Brands, Inc.(a) | 7,269 | | 261,611 |
| Coty, Inc., Class A(a) | 19,814 | | 235,192 |
| Edgewell Personal Care Co. | 2,983 | | 130,268 |
| elf Beauty, Inc.(a) | 2,841 | | 263,531 |
| Inter Parfums, Inc. | 1,025 | | 155,585 |
| Medifast, Inc. | 671 | | 61,497 |
| Nu Skin Enterprises, Inc., Class A | 2,850 | | 112,461 |
| USANA Health Sciences, Inc.(a) | 707 | | 46,924 |
| | | | 1,267,069 |
| PHARMACEUTICALS - 0.9% |
| Amphastar Pharmaceuticals, Inc.(a) | 2,550 | | 91,213 |
| Cara Therapeutics, Inc.(a) | 2,880 | | 12,096 |
| Collegium Pharmaceutical, Inc.(a) | 2,110 | | 49,100 |
| Harmony Biosciences Holdings, Inc.(a) | 1,869 | | 60,257 |
| Innoviva, Inc.(a) | 4,480 | | 52,550 |
| Jazz Pharmaceuticals PLC(a) | 3,456 | | 485,464 |
| Ligand Pharmaceuticals, Inc.(a) | 989 | | 75,510 |
| Pacira BioSciences, Inc.(a) | 2,600 | | 117,806 |
| Perrigo Co. PLC | 7,426 | | 276,173 |
| Phibro Animal Health Corp., Class A | 1,400 | | 21,784 |
| Prestige Consumer Healthcare, Inc.(a) | 2,840 | | 174,745 |
| Supernus Pharmaceuticals, Inc.(a) | 3,160 | | 116,478 |
| | | | 1,533,176 |
| PROFESSIONAL SERVICES - 3.2% |
| ASGN, Inc.(a) | 5,013 | | 358,881 |
| CACI International, Inc., Class A(a) | 1,314 | | 411,702 |
| Concentrix Corp. | 2,464 | | 237,801 |
| CSG Systems International, Inc. | 1,900 | | 100,092 |
| ExlService Holdings, Inc.(a) | 1,845 | | 329,111 |
| Exponent, Inc. | 2,920 | | 268,786 |
| Forrester Research, Inc.(a) | 780 | | 24,133 |
| FTI Consulting, Inc.(a) | 1,904 | | 343,672 |
| Genpact Ltd. | 9,011 | | 401,440 |
| Heidrick & Struggles International, Inc. | 1,020 | | 25,612 |
| Insperity, Inc. | 2,058 | | 252,023 |
| KBR, Inc. | 7,456 | | 422,979 |
| Kelly Services, Inc., Class A | 12,010 | | 197,084 |
| Korn Ferry | 3,080 | | 147,902 |
| ManpowerGroup, Inc. | 4,973 | | 376,506 |
| Maximus, Inc. | 3,295 | | 275,627 |
See notes to financial statements.
STEWARD FUNDS
SCHEDULE OF PORTFOLIO INVESTMENTS — April 30, 2023
STEWARD VALUES-FOCUSED SMALL-MID CAP ENHANCED INDEX FUND
| | Shares | | Value |
| NV5 Global, Inc.(a) | 754 | | $ 71,426 |
| Paylocity Holding Corp.(a) | 2,271 | | 438,961 |
| Resources Connection, Inc. | 2,150 | | 31,368 |
| Science Applications International Corp. | 3,025 | | 308,641 |
| TrueBlue, Inc.(a) | 10,932 | | 165,620 |
| TTEC Holdings, Inc. | 1,281 | | 43,644 |
| Verra Mobility Corp.(a) | 3,918 | | 66,410 |
| | | | 5,299,421 |
| REAL ESTATE MANAGEMENT & DEVELOPMENT - 0.6% |
| Anywhere Real Estate, Inc.(a) | 28,780 | | 183,329 |
| Cushman & Wakefield PLC(a) | 6,470 | | 63,729 |
| Douglas Elliman, Inc. | 2,230 | | 7,114 |
| Jones Lang LaSalle, Inc.(a) | 4,021 | | 559,080 |
| Marcus & Millichap, Inc. | 1,880 | | 59,164 |
| RE/MAX Holdings, Inc., Class A | 930 | | 17,958 |
| St Joe Co. (The) | 2,435 | | 100,078 |
| | | | 990,452 |
| RESIDENTIAL REAL ESTATE INVESTMENT TRUSTS - 0.5% |
| Apartment Income REIT Corp. | 9,258 | | 342,361 |
| Centerspace | 1,516 | | 85,472 |
| Elme Communities | 5,140 | | 88,562 |
| Independence Realty Trust, Inc. | 12,600 | | 209,790 |
| NexPoint Residential Trust, Inc. | 2,060 | | 88,436 |
| Veris Residential, Inc.(a) | 4,646 | | 75,962 |
| | | | 890,583 |
| RETAIL REAL ESTATE INVESTMENT TRUSTS - 1.6% |
| Acadia Realty Trust | 5,897 | | 79,668 |
| Agree Realty Corp. | 5,186 | | 352,596 |
| Brixmor Property Group, Inc. | 18,832 | | 401,687 |
| Getty Realty Corp. | 2,470 | | 82,325 |
| Kite Realty Group Trust | 12,926 | | 267,827 |
| Macerich Co. (The) | 12,789 | | 127,762 |
| National Retail Properties, Inc. | 11,045 | | 480,458 |
| Retail Opportunity Investments Corp. | 8,910 | | 116,097 |
| RPT Realty | 4,060 | | 37,758 |
| Saul Centers, Inc. | 1,102 | | 39,705 |
| SITE Centers Corp. | 11,131 | | 137,357 |
| Spirit Realty Capital, Inc. | 8,290 | | 318,833 |
| Tanger Factory Outlet Centers, Inc. | 6,055 | | 118,739 |
| Urban Edge Properties | 6,590 | | 96,675 |
| Urstadt Biddle Properties, Inc., Class A | 2,370 | | 40,811 |
| Whitestone REIT | 1,040 | | 9,308 |
| | | | 2,707,606 |
| SEMICONDUCTORS & SEMICONDUCTOR EQUIPMENT - 3.0% |
| Allegro MicroSystems, Inc.(a) | 3,274 | | 117,111 |
| | Shares | | Value |
| Alpha & Omega Semiconductor Ltd.(a) | 1,300 | | $ 31,044 |
| Amkor Technology, Inc. | 5,147 | | 115,138 |
| Axcelis Technologies, Inc.(a) | 1,787 | | 211,402 |
| CEVA, Inc.(a) | 1,400 | | 35,182 |
| Cirrus Logic, Inc.(a) | 4,666 | | 400,296 |
| Cohu, Inc.(a) | 2,700 | | 91,368 |
| Diodes, Inc.(a) | 2,521 | | 200,924 |
| FormFactor, Inc.(a) | 3,952 | | 107,929 |
| Ichor Holdings Ltd.(a) | 1,700 | | 47,345 |
| Kulicke & Soffa Industries, Inc. | 3,018 | | 143,838 |
| Lattice Semiconductor Corp.(a) | 7,275 | | 579,817 |
| MACOM Technology Solutions Holdings, Inc.(a) | 3,035 | | 177,062 |
| MaxLinear, Inc.(a) | 3,734 | | 90,101 |
| MKS Instruments, Inc. | 2,982 | | 250,100 |
| Onto Innovation, Inc.(a) | 2,745 | | 222,290 |
| PDF Solutions, Inc.(a) | 1,850 | | 66,693 |
| Photronics, Inc.(a) | 3,500 | | 50,610 |
| Power Integrations, Inc. | 3,021 | | 219,868 |
| Rambus, Inc.(a) | 5,634 | | 249,812 |
| Semtech Corp.(a) | 3,481 | | 67,845 |
| Silicon Laboratories, Inc.(a) | 1,715 | | 238,900 |
| SiTime Corp.(a) | 871 | | 94,477 |
| SMART Global Holdings, Inc.(a) | 2,820 | | 43,484 |
| Synaptics, Inc.(a) | 2,226 | | 197,135 |
| Ultra Clean Holdings, Inc.(a) | 2,670 | | 76,202 |
| Universal Display Corp. | 3,567 | | 476,052 |
| Veeco Instruments, Inc.(a) | 3,049 | | 56,163 |
| Wolfspeed, Inc.(a) | 6,662 | | 310,116 |
| | | | 4,968,304 |
| SOFTWARE - 2.4% |
| 8x8, Inc.(a) | 7,020 | | 20,147 |
| A10 Networks, Inc. | 3,800 | | 53,732 |
| ACI Worldwide, Inc.(a) | 6,207 | | 157,223 |
| Adeia, Inc. | 7,949 | | 60,730 |
| Alarm.com Holdings, Inc.(a) | 2,790 | | 133,055 |
| Aspen Technology, Inc.(a) | 1,598 | | 282,846 |
| Blackbaud, Inc.(a) | 2,610 | | 181,016 |
| Cerence, Inc.(a) | 2,290 | | 58,509 |
| CommVault Systems, Inc.(a) | 2,646 | | 154,182 |
| Consensus Cloud Solution, Inc.(a) | 1,172 | | 43,751 |
| Digital Trubine, Inc.(a) | 5,209 | | 61,102 |
| DoubleVerify Holdings, Inc.(a) | 4,260 | | 125,329 |
| Dynatrace, Inc.(a) | 11,757 | | 497,086 |
| Ebix, Inc. | 1,630 | | 26,504 |
| Envestnet, Inc.(a) | 3,032 | | 192,168 |
| InterDigital, Inc. | 1,609 | | 108,994 |
See notes to financial statements.
STEWARD FUNDS
SCHEDULE OF PORTFOLIO INVESTMENTS — April 30, 2023
STEWARD VALUES-FOCUSED SMALL-MID CAP ENHANCED INDEX FUND
| | Shares | | Value |
| LivePerson, Inc.(a) | 4,190 | | $ 19,400 |
| LiveRamp Holdings, Inc.(a) | 3,529 | | 85,014 |
| Manhattan Associates, Inc.(a) | 3,357 | | 556,188 |
| NCR Corp.(a) | 7,740 | | 172,525 |
| OneSpan, Inc.(a) | 2,560 | | 37,734 |
| Progress Software Corp. | 2,750 | | 150,920 |
| Qualys, Inc.(a) | 1,978 | | 223,395 |
| SPS Commerce, Inc.(a) | 2,009 | | 295,926 |
| Teradata Corp.(a) | 5,584 | | 216,157 |
| Xperi, Inc.(a) | 2,495 | | 23,678 |
| | | | 3,937,311 |
| SPECIALIZED REAL ESTATE INVESTMENT TRUSTS - 1.8% |
| CubeSmart | 11,708 | | 532,597 |
| EPR Properties | 4,350 | | 182,526 |
| Four Corners Property Trust, Inc. | 5,596 | | 142,754 |
| Lamar Advertising Co., Class A | 4,906 | | 518,466 |
| Life Storage, Inc. | 4,695 | | 630,914 |
| National Storage Affiliates Trust | 5,228 | | 201,539 |
| Outfront Media, Inc. | 8,400 | | 139,944 |
| PotlatchDeltic Corp. | 4,590 | | 212,196 |
| Rayonier, Inc. | 8,244 | | 258,532 |
| Safehold, Inc. | 2,623 | | 72,710 |
| Uniti Group, Inc. | 15,294 | | 52,305 |
| | | | 2,944,483 |
| SPECIALTY RETAIL - 3.9% |
| Aaron's Co., Inc. (The) | 2,165 | | 28,903 |
| Abercrombie & Fitch Co., Class A(a) | 2,980 | | 70,149 |
| Academy Sports & Outdoors, Inc. | 4,327 | | 274,851 |
| American Eagle Outfitters, Inc. | 9,910 | | 132,695 |
| America's Car-Mart, Inc.(a) | 471 | | 37,864 |
| Asbury Automotive Group, Inc.(a) | 1,253 | | 242,405 |
| AutoNation, Inc.(a) | 2,066 | | 272,092 |
| Boot Barn Holdings, Inc.(a) | 1,812 | | 131,316 |
| Buckle, Inc. (The) | 2,055 | | 68,904 |
| Caleres, Inc. | 2,285 | | 52,098 |
| Chico's FAS, Inc.(a) | 8,030 | | 40,471 |
| Children's Place, Inc. (The)(a) | 887 | | 26,291 |
| Designer Brands, Inc., Class A | 3,640 | | 29,812 |
| Dick's Sporting Goods, Inc. | 3,263 | | 473,168 |
| Five Below, Inc.(a) | 3,031 | | 598,198 |
| Foot Locker, Inc. | 4,385 | | 184,126 |
| GameStop Corp., Class A(a) | 13,656 | | 263,424 |
| Gap, Inc. (The) | 12,475 | | 119,760 |
| Genesco, Inc.(a) | 935 | | 32,407 |
| Group 1 Automotive, Inc. | 1,623 | | 364,331 |
| Guess?, Inc. | 2,710 | | 51,083 |
| | Shares | | Value |
| Haverty Furniture Cos., Inc. | 1,000 | | $ 30,140 |
| Hibbett, Inc. | 3,823 | | 207,704 |
| Leslie's, Inc.(a) | 8,617 | | 93,494 |
| Lithia Motors, Inc. | 1,559 | | 344,368 |
| MarineMax, Inc.(a) | 1,487 | | 43,301 |
| Monro, Inc. | 2,082 | | 101,768 |
| National Vision Holdings, Inc.(a) | 4,530 | | 95,311 |
| ODP Corp. (The)(a) | 2,418 | | 104,482 |
| PetMed Express, Inc. | 1,470 | | 22,594 |
| RH (a) | 1,093 | | 278,857 |
| Sally Beauty Holdings, Inc.(a) | 6,182 | | 87,970 |
| Shoe Carnival, Inc. | 1,370 | | 31,853 |
| Signet Jewelers Ltd. | 2,684 | | 197,489 |
| Sleep Number Corp.(a) | 1,423 | | 32,089 |
| Sonic Automotive, Inc., Class A | 1,346 | | 59,924 |
| Upbound Group, Inc. | 3,060 | | 81,580 |
| Urban Outfitters, Inc.(a) | 3,548 | | 96,009 |
| Valvoline, Inc. | 9,366 | | 323,595 |
| Victoria's Secret & Co.(a) | 4,450 | | 137,994 |
| Williams-Sonoma, Inc. | 5,050 | | 611,252 |
| Zumiez, Inc.(a) | 1,170 | | 20,457 |
| | | | 6,496,579 |
| TECHNOLOGY HARDWARE, STORAGE & PERIPHERALS - 0.3% |
| Avid Technology, Inc.(a) | 2,020 | | 59,610 |
| Corsair Gaming, Inc.(a) | 2,360 | | 41,111 |
| Super Micro Computer, Inc.(a) | 2,568 | | 270,745 |
| Xerox Holdings Corp. | 4,997 | | 78,303 |
| | | | 449,769 |
| TEXTILES, APPAREL & LUXURY GOODS - 2.0% |
| Capri Holdings Ltd.(a) | 6,838 | | 283,777 |
| Carter's, Inc. | 2,431 | | 169,611 |
| Columbia Sportswear Co. | 2,324 | | 194,147 |
| Crocs, Inc.(a) | 3,336 | | 412,563 |
| Deckers Outdoor Corp.(a) | 1,772 | | 849,390 |
| G-III Apparel Group Ltd.(a) | 2,890 | | 45,373 |
| Hanesbrands, Inc. | 25,947 | | 135,962 |
| Kontoor Brands, Inc. | 2,850 | | 128,734 |
| Movado Group, Inc. | 1,806 | | 46,270 |
| Oxford Industries, Inc. | 873 | | 90,085 |
| PVH Corp. | 3,426 | | 293,985 |
| Skechers USA, Inc., Class A(a) | 7,264 | | 386,372 |
| Steven Madden Ltd. | 3,892 | | 136,376 |
| Under Armour, Inc., Class A(a) | 13,750 | | 121,963 |
| Under Armour, Inc., Class C(a) | 6,490 | | 52,180 |
| Wolverine World Wide, Inc. | 4,373 | | 73,204 |
| | | | 3,419,992 |
See notes to financial statements.
STEWARD FUNDS
SCHEDULE OF PORTFOLIO INVESTMENTS — April 30, 2023
STEWARD VALUES-FOCUSED SMALL-MID CAP ENHANCED INDEX FUND
| | Shares | | Value |
| TRADING COMPANIES & DISTRIBUTORS - 1.3% |
| Applied Industrial Technologies, Inc. | 2,152 | | $ 291,940 |
| Boise Cascade Co. | 2,289 | | 156,362 |
| DXP Enterprises, Inc.(a) | 1,150 | | 28,980 |
| GATX Corp. | 2,088 | | 237,844 |
| GMS, Inc.(a) | 2,345 | | 136,151 |
| MSC Industrial Direct Co., Inc., Class A | 2,699 | | 244,880 |
| NOW, Inc.(a) | 5,970 | | 63,700 |
| Univar Solutions, Inc.(a) | 8,551 | | 303,560 |
| Veritiv Corp. | 746 | | 85,693 |
| Watsco, Inc. | 1,791 | | 620,367 |
| | | | 2,169,477 |
| WATER UTILITIES - 0.7% |
| American States Water Co. | 2,258 | | 200,397 |
| California Water Service Group | 3,146 | | 176,428 |
| Essential Utilities, Inc. | 12,921 | | 551,727 |
| Middlesex Water Co. | 1,122 | | 81,883 |
| SJW Group | 1,779 | | 135,062 |
| | | | 1,145,497 |
| WIRELESS TELECOMMUNICATION SERVICES - 0.1% |
| Gogo, Inc.(a) | 3,880 | | 52,031 |
| Shenandoah Telecommunications Co. | 2,630 | | 54,730 |
| Telephone and Data Systems, Inc. | 6,230 | | 62,300 |
| | | | 169,061 |
TOTAL COMMON STOCKS
(COST $166,327,250) | | | 166,726,165 |
| RIGHTS - 0.0% |
| BIOTECHNOLOGY - 0.0% |
| Omniab, Inc.(a)(b)(c) | 734 | | — |
| Progenics Pharmaceuticals, Inc.(a)(b)(c) | 7,180 | | — |
| | | | — |
TOTAL RIGHTS
(COST $—) | | | — |
| | Shares | | Value |
| MONEY MARKET FUND - 0.3% |
| Northern Institutional Treasury Portfolio (Premier Class), 4.56%(d) | 543,836 | | $ 543,836 |
TOTAL MONEY MARKET FUND
(COST $543,836) | | | 543,836 |
TOTAL INVESTMENTS
(COST $166,871,086) - 100.0% | | | 167,270,001 |
| | | | |
| OTHER ASSETS IN EXCESS OF LIABILITIES - 0.0% | | | 6,083 |
| NET ASSETS - 100.0% | | | $ 167,276,084 |
| |
| (a) | Represents non-income producing security. |
| (b) | Security is a Level 3 investment. |
| (c) | Amounts designated as ‘‘—’’ are $0 or have been rounded to $0. |
| (d) | 7-day current yield as of April 30, 2023 is disclosed.
|
| N.V. — Naamloze Vennootschap |
| PLC — Public Limited Company |
| REIT — Real Estate Investment Trust |
See notes to financial statements.
STEWARD FUNDS
STATEMENTS OF ASSETS AND LIABILITIES — April 30, 2023
| | Steward Covered Call Income Fund | | Steward Equity Market Neutral Fund | | Steward Global Equity Income Fund |
| Assets: | | | | | |
| Investments, at value (cost $57,198,236, $68,605,036 and $338,938,573, respectively) | $ 58,000,064 | | $ 70,383,160 | | $351,945,628 |
| Cash | — | | 121,884 | | — |
| Cash held at broker | — | | 60,428,754 | | — |
| Interest and dividend receivable | 61,526 | | 238,395 | | 1,997,535 |
| Receivable for investments sold | 15,225 | | 874,153 | | — |
| Receivable for capital shares issued | 167,783 | | 139,566 | | 189,334 |
| Reclaims receivable | — | | — | | 94,759 |
| Prepaid expenses and other assets | 6,413 | | 3,668 | | 13,988 |
| Total assets | 58,251,011 | | 132,189,580 | | 354,241,244 |
| Liabilities: | | | | | |
| Payable for investments purchased | — | | 622,896 | | 149,547 |
| Payable for capital shares redeemed | 221,791 | | 565,471 | | 104,098 |
| Short positions at fair value (proceeds $0, $56,697,724 and $0, respectively) | — | | 54,489,907 | | — |
| Written options at fair value (premiums received $1,324,091, $0 and $0, respectively) | 2,386,941 | | — | | — |
| Accrued expenses and other payables: | | | | | |
| Investment advisory fees | 11,652 | | 63,325 | | 180,265 |
| Administration fees | 3,380 | | 4,749 | | 21,632 |
| Distribution fees - Class A | 300 | | 1,382 | | 9,970 |
| Distribution fees - Class C | 2,227 | | — | | 1,406 |
| Dividends on short sales | — | | 6,970 | | — |
| Sub-accounting service fees - Class A | 145 | | 52 | | 686 |
| Sub-accounting service fees - Class C | 86 | | — | | 110 |
| Sub-accounting service fees - Institutional Class | 749 | | 10,241 | | 20,781 |
| Fund accounting and sub-administration fees | 10,667 | | 10,666 | | 29,473 |
| Transfer agent fees | 5,000 | | 1,250 | | 5,000 |
| Custodian fees | 7,182 | | 2,930 | | 10,277 |
| Directors fees | 9 | | 3 | | 13 |
| Printing fees | 502 | | 934 | | 3,332 |
| Professional fees | 7,960 | | 13,156 | | 55,534 |
| Other accrued liabilities | 6,344 | | 8,932 | | 13,964 |
| Total liabilities | 2,664,935 | | 55,802,864 | | 606,088 |
| Net Assets | $ 55,586,076 | | $ 76,386,716 | | $353,635,156 |
| Composition of Net Assets: | | | | | |
| Capital (par value and paid-in surplus) | 58,621,378 | | 72,558,797 | | 343,619,664 |
| Total distributable earnings/(accumulated deficit) | (3,035,302) | | 3,827,919 | | 10,015,492 |
| Net Assets | $ 55,586,076 | | $ 76,386,716 | | $353,635,156 |
| Class A | | | | | |
| Net Assets | $ 735,312 | | $ 6,605,029 | | $ 18,217,273 |
| Shares authorized | 16,000,000 | | 16,000,000 | | 16,000,000 |
| Shares issued and outstanding ($0.001 par value) | 98,444 | | 237,576 | | 632,143 |
| Net asset value, offering and redemption price per share(a) | $ 7.47 | | $ 27.80 | | $ 28.82 |
| Class C | | | | | |
| Net Assets | $ 1,100,440 | | — | | $ 1,060,719 |
| Shares authorized | 15,000,000 | | — | | 15,000,000 |
| Shares issued and outstanding ($0.001 par value) | 148,210 | | — | | 34,835 |
| Net asset value, offering and redemption price per share(a) | $ 7.42 | | — | | $ 30.45 |
| Class R6 | | | | | |
| Net Assets | $ 3,260 | | — | | $ 315,552 |
| Shares authorized | 16,000,000 | | — | | 16,000,000 |
| Shares issued and outstanding ($0.001 par value) | 433 | | — | | 11,781 |
| Net asset value, offering and redemption price per share(a) | $ 7.53 | | — | | $ 26.79 |
| Institutional Class | | | | | |
| Net Assets | $ 53,747,064 | | $ 69,781,687 | | $334,041,612 |
| Shares authorized | 20,000,000 | | 20,000,000 | | 20,000,000 |
| Shares issued and outstanding ($0.001 par value) | 7,113,036 | | 2,500,138 | | 11,573,623 |
| Net asset value, offering and redemption price per share(a) | $ 7.56 | | $ 27.91 | | $ 28.86 |
Amounts designated as "—" are $0 or have been rounded to $0.
| | |
| (a) | Per share amounts may not recalculate due to rounding of net assets and shares outstanding. |
See notes to financial statements.
STEWARD FUNDS
STATEMENTS OF ASSETS AND LIABILITIES — April 30, 2023
| | Steward International Enhanced Index Fund | | Steward Large Cap Core Fund | | Steward Large Cap Growth Fund |
| Assets: | | | | | |
| Investments, at value (cost $211,241,438, $78,358,767 and $73,815,325, respectively) | $214,208,958 | | $ 78,964,218 | | $ 75,086,031 |
| Interest and dividend receivable | 891,013 | | 28,542 | | 12,608 |
| Receivable for investments sold | 66,828 | | 190,816 | | 646,440 |
| Receivable for capital shares issued | 108,997 | | 23,663 | | 33,630 |
| Reclaims receivable | 184,307 | | — | | — |
| Prepaid expenses and other assets | 9,922 | | 3,410 | | 4,901 |
| Total assets | 215,470,025 | | 79,210,649 | | 75,783,610 |
| Liabilities: | | | | | |
| Payable for investments purchased | — | | 297,325 | | 736,828 |
| Payable for capital shares redeemed | 44,721 | | 14,756 | | 120,251 |
| Accrued expenses and other payables: | | | | | |
| Investment advisory fees | 64,921 | | 10,554 | | 3,235 |
| Administration fees | 13,340 | | 4,820 | | 4,543 |
| Distribution fees - Class A | 909 | | 455 | | 291 |
| Dividends on short sales | — | | — | | — |
| Sub-accounting service fees - Class A | 415 | | 52 | | 32 |
| Sub-accounting service fees - Institutional Class | 10,289 | | 2,306 | | 3,168 |
| Fund accounting and sub-administration fees | 18,941 | | 10,667 | | 10,666 |
| Transfer agent fees | 5,000 | | 1,250 | | 1,250 |
| Custodian fees | 5,382 | | 2,540 | | 2,498 |
| Directors fees | 2 | | — | | 13 |
| Printing fees | 1,901 | | 721 | | 761 |
| Professional fees | 33,946 | | 12,545 | | 11,854 |
| Other accrued liabilities | 5,452 | | 4,373 | | 6,210 |
| Total liabilities | 205,219 | | 362,364 | | 901,600 |
| Net Assets | $215,264,806 | | $ 78,848,285 | | $ 74,882,010 |
| Composition of Net Assets: | | | | | |
| Capital (par value and paid-in surplus) | 211,311,915 | | 88,226,647 | | 80,167,352 |
| Total distributable earnings/(accumulated deficit) | 3,952,891 | | (9,378,362) | | (5,285,342) |
| Net Assets | $215,264,806 | | $ 78,848,285 | | $ 74,882,010 |
| Class A | | | | | |
| Net Assets | $ 4,058,299 | | $ 490,405 | | $ 326,003 |
| Shares authorized | 16,000,000 | | 16,000,000 | | 16,000,000 |
| Shares issued and outstanding ($0.001 par value) | 183,738 | | 22,860 | | 15,801 |
| Net asset value, offering and redemption price per share(a) | $ 22.09 | | $ 21.45 | | $ 20.63 |
| Class C | | | | | |
| Net Assets | $ 4,608 | | — | | — |
| Shares authorized | 15,000,000 | | — | | — |
| Shares issued and outstanding ($0.001 par value) | 258 | | — | | — |
| Net asset value, offering and redemption price per share(a) | $ 17.86 | | — | | — |
| Class R6 | | | | | |
| Net Assets | $ 548,152 | | — | | — |
| Shares authorized | 16,000,000 | | — | | — |
| Shares issued and outstanding ($0.001 par value) | 29,930 | | — | | — |
| Net asset value, offering and redemption price per share(a) | $ 18.31 | | — | | — |
| Institutional Class | | | | | |
| Net Assets | $210,653,747 | | $ 78,357,880 | | $ 74,556,007 |
| Shares authorized | 20,000,000 | | 20,000,000 | | 20,000,000 |
| Shares issued and outstanding ($0.001 par value) | 9,526,972 | | 3,644,098 | | 3,604,587 |
| Net asset value, offering and redemption price per share(a) | $ 22.11 | | $ 21.50 | | $ 20.68 |
Amounts designated as "—" are $0 or have been rounded to $0.
| | |
| (a) | Per share amounts may not recalculate due to rounding of net assets and shares outstanding. |
See notes to financial statements.
STEWARD FUNDS
STATEMENTS OF ASSETS AND LIABILITIES — April 30, 2023
| | Steward Large Cap Value Fund | | Steward Select Bond Fund | | Steward Small Cap Growth Fund |
| Assets: | | | | | |
| Investments, at value (cost $62,735,169, $170,167,481 and $31,799,761, respectively) | $ 63,330,791 | | $155,505,968 | | $ 24,995,221 |
| Interest and dividend receivable | 39,974 | | 1,233,779 | | 828 |
| Receivable for investments sold | 715,490 | | — | | — |
| Receivable for capital shares issued | 21,549 | | 175,421 | | 10,361 |
| Receivable from Adviser | — | | — | | 86 |
| Prepaid expenses and other assets | 3,686 | | 8,985 | | 1,701 |
| Total assets | 64,111,490 | | 156,924,153 | | 25,008,197 |
| Liabilities: | | | | | |
| Payable for investments purchased | 789,468 | | — | | — |
| Payable for when-issued securities | — | | 1,500,000 | | — |
| Payable for capital shares redeemed | 14,115 | | 177,175 | | 6,416 |
| Accrued expenses and other payables: | | | | | |
| Investment advisory fees | 8,523 | | 39,791 | | — |
| Administration fees | 3,875 | | 9,474 | | 1,552 |
| Distribution fees - Class A | 465 | | 1,595 | | 175 |
| Distribution fees - Class C | — | | 267 | | — |
| Dividends on short sales | — | | — | | — |
| Sub-accounting service fees - Class A | 54 | | 172 | | 20 |
| Sub-accounting service fees - Institutional Class | 1,703 | | 4,916 | | 24 |
| Fund accounting and sub-administration fees | 10,666 | | 13,632 | | 10,667 |
| Transfer agent fees | 1,250 | | 5,000 | | 1,250 |
| Custodian fees | 2,318 | | 3,876 | | 951 |
| Directors fees | — | | 6 | | — |
| Printing fees | 560 | | 1,379 | | 220 |
| Professional fees | 9,993 | | 24,845 | | 4,043 |
| Other accrued liabilities | 3,633 | | 5,538 | | 3,043 |
| Total liabilities | 846,623 | | 1,787,666 | | 28,361 |
| Net Assets | $ 63,264,867 | | $155,136,487 | | $ 24,979,836 |
| Composition of Net Assets: | | | | | |
| Capital (par value and paid-in surplus) | 68,727,617 | | 172,655,774 | | 36,137,814 |
| Total accumulated deficit | (5,462,750) | | (17,519,287) | | (11,157,978) |
| Net Assets | $ 63,264,867 | | $155,136,487 | | $ 24,979,836 |
| Class A | | | | | |
| Net Assets | $ 639,762 | | $ 2,739,929 | | $ 170,341 |
| Shares authorized | 16,000,000 | | 16,000,000 | | 16,000,000 |
| Shares issued and outstanding ($0.001 par value) | 28,279 | | 123,410 | | 9,979 |
| Net asset value, offering and redemption price per share(a) | $ 22.62 | | $ 22.20 | | $ 17.07 |
| Class C | | | | | |
| Net Assets | — | | $ 129,479 | | — |
| Shares authorized | — | | 13,000,000 | | — |
| Shares issued and outstanding ($0.001 par value) | — | | 5,158 | | — |
| Net asset value, offering and redemption price per share(a) | — | | $ 25.10 | | — |
| Class R6 | | | | | |
| Net Assets | — | | $ 924 | | — |
| Shares authorized | — | | 16,000,000 | | — |
| Shares issued and outstanding ($0.001 par value) | — | | 38 | | — |
| Net asset value, offering and redemption price per share(a) | — | | $ 24.69 | | — |
| Institutional Class | | | | | |
| Net Assets | $ 62,625,105 | | $152,266,155 | | $ 24,809,495 |
| Shares authorized | 20,000,000 | | 20,000,000 | | 20,000,000 |
| Shares issued and outstanding ($0.001 par value) | 2,760,292 | | 6,895,633 | | 1,448,487 |
| Net asset value, offering and redemption price per share(a) | $ 22.69 | | $ 22.08 | | $ 17.13 |
Amounts designated as "—" are $0 or have been rounded to $0.
| | |
| (a) | Per share amounts may not recalculate due to rounding of net assets and shares outstanding. |
See notes to financial statements.
STEWARD FUNDS
STATEMENTS OF ASSETS AND LIABILITIES — April 30, 2023
| | Steward Values-Focused Large Cap Enhanced Index Fund | | Steward Values-Focused Small-Mid Cap Enhanced Index Fund |
| Assets: | | | |
| Investments, at value (cost $195,301,900 and $166,871,086, respectively) | $210,312,626 | | $167,270,001 |
| Interest and dividend receivable | 158,501 | | 67,004 |
| Receivable for investments sold | — | | 51,000 |
| Receivable for capital shares issued | 67,494 | | 115,037 |
| Prepaid expenses and other assets | 13,359 | | 10,317 |
| Total assets | 210,551,980 | | 167,513,359 |
| Liabilities: | | | |
| Payable for capital shares redeemed | 174,541 | | 108,745 |
| Accrued expenses and other payables: | | | |
| Investment advisory fees | 37,180 | | 30,510 |
| Administration fees | 12,970 | | 10,643 |
| Distribution fees - Class A | 1,739 | | 12,640 |
| Distribution fees - Class C | 161 | | — |
| Dividends on short sales | — | | — |
| Sub-accounting service fees - Class A | — | | 646 |
| Sub-accounting service fees - Class C | 2 | | — |
| Sub-accounting service fees - Institutional Class | 8,441 | | 8,546 |
| Fund accounting and sub-administration fees | 18,534 | | 15,976 |
| Transfer agent fees | 5,000 | | 5,000 |
| Custodian fees | 6,207 | | 8,886 |
| Printing fees | 1,907 | | 1,547 |
| Professional fees | 33,841 | | 27,644 |
| Other accrued liabilities | 10,555 | | 6,492 |
| Total liabilities | 311,078 | | 237,275 |
| Net Assets | $210,240,902 | | $167,276,084 |
| Composition of Net Assets: | | | |
| Capital (par value and paid-in surplus) | 190,821,691 | | 162,572,080 |
| Total distributable earnings | 19,419,211 | | 4,704,004 |
| Net Assets | $210,240,902 | | $167,276,084 |
| Class A | | | |
| Net Assets | $ 9,707,356 | | $ 41,713,158 |
| Shares authorized | 16,000,000 | | 16,000,000 |
| Shares issued and outstanding ($0.001 par value) | 357,000 | | 3,801,478 |
| Net asset value, offering and redemption price per share(a) | $ 27.19 | | $ 10.97 |
| Class C | | | |
| Net Assets | $ 36,308 | | $ 11,468 |
| Shares authorized | 15,000,000 | | 15,000,000 |
| Shares issued and outstanding ($0.001 par value) | 1,722 | | 1,207 |
| Net asset value, offering and redemption price per share(a) | $ 21.08 | | $ 9.50 |
| Class R6 | | | |
| Net Assets | $ 538,218 | | $ 311,227 |
| Shares authorized | 16,000,000 | | 16,000,000 |
| Shares issued and outstanding ($0.001 par value) | 24,485 | | 31,402 |
| Net asset value, offering and redemption price per share(a) | $ 21.98 | | $ 9.91 |
| Institutional Class | | | |
| Net Assets | $199,959,020 | | $125,240,231 |
| Shares authorized | 20,000,000 | | 20,000,000 |
| Shares issued and outstanding ($0.001 par value) | 7,376,855 | | 11,080,131 |
| Net asset value, offering and redemption price per share(a) | $ 27.11 | | $ 11.30 |
Amounts designated as "—" are $0 or have been rounded to $0.
| | |
| (a) | Per share amounts may not recalculate due to rounding of net assets and shares outstanding. |
See notes to financial statements.
STEWARD FUNDS
STATEMENTS OF OPERATIONS — For the year ended April 30, 2023
| | Steward Covered Call Income Fund | | Steward Equity Market Neutral Fund | | Steward Global Equity Income Fund |
| Investment Income: | | | | | |
| Dividends (net of foreign witholding tax of $363, $581 and $1,031,351, respectively) | $ 765,013 | | $ 1,257,648 | | $ 12,376,534 |
| Rebates on short sales, net of fees | — | | 918,227 | | — |
| Total investment income | 765,013 | | 2,175,875 | | 12,376,534 |
| Expenses: | | | | | |
| Dividends on securities sold short | — | | 310,270 | | — |
| Investment advisory fees | 247,172 | | 595,498 | | 1,930,165 |
| Administration fees | 29,661 | | 44,662 | | 231,620 |
| Distribution fees - Class A | 1,248 | | 3,091 | | 45,960 |
| Distribution fees - Class C | 6,139 | | — | | 8,529 |
| Sub-accounting services fees - Class A | 709 | | 644 | | 18,138 |
| Sub-accounting services fees - Class C | 755 | | — | | 1,032 |
| Sub-accounting services fees - Institutional Class | 40,564 | | 82,348 | | 314,551 |
| Fund accounting and sub-administration fees | 64,000 | | 64,000 | | 162,794 |
| Transfer agent fees | 30,000 | | 7,500 | | 30,000 |
| Custodian fees | 54,701 | | 15,283 | | 56,160 |
| Registration fees | 62,472 | | 52,277 | | 71,227 |
| Directors fees | 8,638 | | 13,101 | | 78,040 |
| Professional fees | 16,294 | | 24,860 | | 121,235 |
| Printing fees | 4,625 | | 2,935 | | 35,356 |
| Chief compliance officer fees | 6,569 | | 9,155 | | 53,470 |
| Miscellaneous fees | 30,997 | | 38,155 | | 57,859 |
| Total expenses | 604,544 | | 1,263,779 | | 3,216,136 |
| Fees waived/reimbursed by the Adviser | (201,684) | | — | | — |
| Net expenses | 402,860 | | 1,263,779 | | 3,216,136 |
| Net investment income/(loss) | 362,153 | | 912,096 | | 9,160,398 |
| Realized and Unrealized Gain/(Loss): | | | | | |
| Net realized gains/(losses) from investment transactions and foreign currency translations | (3,188,114) | | (2,530,200) | | 994,975 |
| Net realized gains on investment securities sold short | — | | 2,033,696 | | — |
| Net realized gains on options transactions | 3,867,068 | | — | | — |
| Change in unrealized appreciation/(depreciation) on investment transactions and foreign currency translations | 2,831,063 | | 3,807,562 | | (15,847,203) |
| Change in unrealized depreciation on investment securities sold short | — | | (1,799,464) | | — |
| Change in unrealized depreciation on options transactions | (1,067,116) | | — | | — |
| Net realized and unrealized gains/(losses) from investment transactions, foreign currency translations and options transactions | 2,442,901 | | 1,511,594 | | (14,852,228) |
| Change in net assets resulting from operations | $ 2,805,054 | | $ 2,423,690 | | $ (5,691,830) |
Amounts designated as "—" are $0 or have been rounded to $0.
See notes to financial statements.
STEWARD FUNDS
STATEMENTS OF OPERATIONS — For the year ended April 30, 2023
| | Steward International Enhanced Index Fund | | Steward Large Cap Core Fund | | Steward Large Cap Growth Fund |
| Investment Income: | | | | | |
| Dividends (net of foreign witholding tax of $1,011,599, $0 and $0, respectively) | $ 7,313,522 | | $ 1,262,036 | | $ 760,261 |
| Non-cash dividend income | 630,430 | | — | | — |
| Total investment income | 7,943,952 | | 1,262,036 | | 760,261 |
| Expenses: | | | | | |
| Investment advisory fees | 736,199 | | 360,811 | | 292,233 |
| Administration fees | 151,273 | | 54,122 | | 43,835 |
| Distribution fees - Class A | 11,896 | | 1,122 | | 677 |
| Distribution fees - Class C | 4 | | — | | — |
| Sub-accounting services fees - Class A | 5,935 | | 571 | | 335 |
| Sub-accounting services fees - Institutional Class | 226,200 | | 90,248 | | 72,278 |
| Fund accounting and sub-administration fees | 110,332 | | 64,000 | | 64,000 |
| Transfer agent fees | 30,000 | | 7,500 | | 7,500 |
| Custodian fees | 31,761 | | 14,369 | | 13,577 |
| Registration fees | 62,458 | | 34,102 | | 39,048 |
| Directors fees | 51,734 | | 18,279 | | 14,204 |
| Professional fees | 76,505 | | 27,684 | | 23,796 |
| Printing fees | 19,569 | | 4,453 | | 3,321 |
| Chief compliance officer fees | 34,451 | | 11,386 | | 9,006 |
| Miscellaneous fees | 39,077 | | 25,937 | | 26,581 |
| Total expenses | 1,587,394 | | 714,584 | | 610,391 |
| Fees waived/reimbursed by the Adviser | — | | (172,245) | | (171,362) |
| Net expenses | 1,587,394 | | 542,339 | | 439,029 |
| Net investment income/(loss) | 6,356,558 | | 719,697 | | 321,232 |
| Realized and Unrealized Gain/(Loss): | | | | | |
| Net realized losses from investment transactions and foreign currency translations | (2,177,640) | | (8,237,346) | | (4,705,393) |
| Change in unrealized appreciation on investment transactions and foreign currency translations | 3,162,701 | | 8,539,843 | | 7,265,881 |
| Net realized and unrealized gains from investment transactions, foreign currency translations and options transactions | 985,061 | | 302,497 | | 2,560,488 |
| Change in net assets resulting from operations | $ 7,341,619 | | $ 1,022,194 | | $ 2,881,720 |
Amounts designated as "—" are $0 or have been rounded to $0.
See notes to financial statements.
STEWARD FUNDS
STATEMENTS OF OPERATIONS — For the year ended April 30, 2023
| | Steward Large Cap Value Fund | | Steward Select Bond Fund | | Steward Small Cap Growth Fund |
| Investment Income: | | | | | |
| Dividends (net of foreign witholding tax of $0, $0 and $1,537, respectively) | $ 1,437,394 | | $ — | | $ 122,065 |
| Interest | — | | 3,625,325 | | — |
| Total investment income | 1,437,394 | | 3,625,325 | | 122,065 |
| Expenses: | | | | | |
| Investment advisory fees | 300,516 | | 458,490 | | 184,652 |
| Administration fees | 45,078 | | 109,165 | | 18,465 |
| Distribution fees - Class A | 1,284 | | 7,326 | | 434 |
| Distribution fees - Class C | — | | 337 | | — |
| Sub-accounting services fees - Class A | 616 | | 2,073 | | 203 |
| Sub-accounting services fees - Class C | — | | 30 | | — |
| Sub-accounting services fees - Institutional Class | 77,989 | | 149,920 | | 32,375 |
| Fund accounting and sub-administration fees | 64,000 | | 79,251 | | 64,000 |
| Transfer agent fees | 7,500 | | 30,000 | | 7,500 |
| Custodian fees | 14,675 | | 23,771 | | 6,508 |
| Registration fees | 33,821 | | 56,800 | | 32,982 |
| Directors fees | 15,488 | | 37,037 | | 6,829 |
| Professional fees | 22,721 | | 56,780 | | 9,058 |
| Printing fees | 3,370 | | 14,231 | | 247 |
| Chief compliance officer fees | 9,491 | | 26,122 | | 3,978 |
| Miscellaneous fees | 24,183 | | 38,196 | | 20,540 |
| Total expenses | 620,732 | | 1,089,529 | | 387,771 |
| Fees waived/reimbursed by the Adviser | (168,673) | | — | | (141,135) |
| Net expenses | 452,059 | | 1,089,529 | | 246,636 |
| Net investment income/(loss) | 985,335 | | 2,535,796 | | (124,571) |
| Realized and Unrealized Gain/(Loss): | | | | | |
| Net realized losses from investment transactions and foreign currency translations | (5,211,896) | | (899,152) | | (3,995,248) |
| Change in unrealized appreciation/(depreciation) on investment transactions and foreign currency translations | 4,793,248 | | (1,572,441) | | 1,749,574 |
| Net realized and unrealized losses from investment transactions, foreign currency translations and options transactions | (418,648) | | (2,471,593) | | (2,245,674) |
| Change in net assets resulting from operations | $ 566,687 | | $ 64,203 | | $ (2,370,245) |
Amounts designated as "—" are $0 or have been rounded to $0.
See notes to financial statements.
STEWARD FUNDS
STATEMENTS OF OPERATIONS — For the year ended April 30, 2023
| | Steward Values-Focused Large Cap Enhanced Index Fund | | Steward Values-Focused Small-Mid Cap Enhanced Index Fund |
| Investment Income: | | | |
| Dividends (net of foreign witholding tax of $812 and $0, respectively) | $ 3,520,663 | | $ 2,786,490 |
| Total investment income | 3,520,663 | | 2,786,490 |
| Expenses: | | | |
| Investment advisory fees | 449,019 | | 370,915 |
| Administration fees | 156,635 | | 129,389 |
| Distribution fees - Class A | 25,714 | | 111,898 |
| Distribution fees - Class C | 191 | | 4 |
| Sub-accounting services fees - Class A | 7,876 | | 17,568 |
| Sub-accounting services fees - Class C | 28 | | 9 |
| Sub-accounting services fees - Institutional Class | 189,308 | | 135,839 |
| Fund accounting and sub-administration fees | 111,200 | | 93,623 |
| Transfer agent fees | 30,000 | | 30,000 |
| Custodian fees | 35,029 | | 46,606 |
| Registration fees | 63,291 | | 60,903 |
| Directors fees | 54,778 | | 45,740 |
| Professional fees | 78,336 | | 64,246 |
| Printing fees | 21,360 | | 18,322 |
| Chief compliance officer fees | 38,835 | | 30,868 |
| Miscellaneous fees | 44,988 | | 38,700 |
| Total expenses | 1,306,588 | | 1,194,630 |
| Net investment income/(loss) | 2,214,075 | | 1,591,860 |
| Realized and Unrealized Gain/(Loss): | | | |
| Net realized gains from investment transactions and foreign currency translations | 4,083,513 | | 7,414,786 |
| Change in unrealized depreciation on investment transactions and foreign currency translations | (3,004,991) | | (10,868,601) |
| Net realized and unrealized gains/(losses) from investment transactions, foreign currency translations and options transactions | 1,078,522 | | (3,453,815) |
| Change in net assets resulting from operations | $ 3,292,597 | | $ (1,861,955) |
Amounts designated as "—" are $0 or have been rounded to $0.
See notes to financial statements.
STEWARD FUNDS
STATEMENTS OF CHANGES IN NET ASSETS
STEWARD COVERED CALL INCOME FUND
| | For the Year Ended April 30, 2023 | | For the Year Ended April 30, 2022 |
| Change in net assets resulting from operations: | | | |
| Net investment income | $ 362,153 | | $ 128,317 |
| Net realized gain from investment transactions, foreign currency translations and option transactions | 678,954 | | 7,133,592 |
| Net change in unrealized appreciation/(depreciation) on investments, foreign currency translations and options | 1,763,947 | | (5,569,649) |
| Change in net assets resulting from operations | 2,805,054 | | 1,692,260 |
| Distributions to shareholders from: | | | |
| Class A | (56,618) | | (3,005) |
| Class C | (89,182) | | (46,169) |
| Class R6 | (270) | | (210) |
| Institutional Class | (3,816,896) | | (3,185,783) |
| Total distributions to shareholders | (3,962,966) | | (3,235,167) |
| Capital Transactions: | | | |
| Class A | | | |
| Proceeds from shares issued | 686,384 | | 111,974 |
| Dividends reinvested | 49,870 | | 3,005 |
| Cost of shares redeemed | (93,512) | | (23,578) |
| Change in Class A from capital transactions | 642,742 | | 91,401 |
| Class C | | | |
| Proceeds from shares issued | 1,035,762 | | 137,055 |
| Dividends reinvested | 79,732 | | 46,169 |
| Cost of shares redeemed | (168,756) | | (131,769) |
| Change in Class C from capital transactions | 946,738 | | 51,455 |
| Class R6 | | | |
| Proceeds from shares issued | 9,538 | | 1,000 |
| Dividends reinvested | 270 | | 210 |
| Cost of shares redeemed | (7,644) | | — |
| Change in Class R6 from capital transactions | 2,164 | | 1,210 |
| Institutional Class | | | |
| Proceeds from shares issued | 34,812,569 | | 15,293,238 |
| Dividends reinvested | 3,814,339 | | 3,179,417 |
| Cost of shares redeemed | (6,722,340) | | (30,218,252) |
| Change in Institutional Class from capital transactions | 31,904,568 | | (11,745,597) |
| Change in net assets from capital transactions | 33,496,212 | | (11,601,531) |
| Change in net assets | 32,338,300 | | (13,144,438) |
| Net Assets: | | | |
| Beginning of period | 23,247,776 | | 36,392,214 |
| End of period | $ 55,586,076 | | $ 23,247,776 |
| Shares Transactions: | | | |
| Class A | | | |
| Issued | 91,587 | | 13,227 |
| Reinvested | 7,166 | | 357 |
| Redeemed | (12,287) | | (2,714) |
| Change in Class A | 86,466 | | 10,870 |
| Class C | | | |
| Issued | 134,303 | | 13,659 |
| Reinvested | 11,535 | | 5,441 |
| Redeemed | (23,607) | | (12,832) |
| Change in Class C | 122,231 | | 6,268 |
| Class R6 | | | |
| Issued | 1,307 | | 92 |
| Reinvested | 39 | | 25 |
| Redeemed | (1,031) | | — |
| Change in Class R6 | 315 | | 117 |
| Institutional Class | | | |
| Issued | 4,561,986 | | 1,762,737 |
| Reinvested | 541,088 | | 371,223 |
| Redeemed | (906,744) | | (2,866,461) |
| Change in Institutional Class | 4,196,330 | | (732,501) |
Amounts designated as "—" are $0 or have been rounded to $0.
See notes to financial statements.
STEWARD FUNDS
STATEMENTS OF CHANGES IN NET ASSETS
STEWARD EQUITY MARKET NEUTRAL FUND
| | For the Year Ended April 30, 2023 | | For the Period
November 15,
2021(1) through April 30, 2022 |
| Change in net assets resulting from operations: | | | |
| Net investment income (loss) | $ 912,096 | | $ (179,956) |
| Net realized loss from investment transactions and investment securities sold short | (496,504) | | (540,721) |
| Net change in unrealized appreciation on investments and foreign currency translations | 2,008,098 | | 1,977,843 |
| Change in net assets resulting from operations | 2,423,690 | | 1,257,166 |
| Distributions to shareholders from: | | | |
| Class A | (247) | | — |
| Institutional Class | (34,579) | | — |
| Total distributions to shareholders | (34,826) | | — |
| Capital Transactions: | | | |
| Class A | | | |
| Proceeds from shares issued | 6,460,557 | | 513,222 |
| Dividends reinvested | 233 | | — |
| Cost of shares redeemed | (343,041) | | (163,334) |
| Change in Class A from capital transactions | 6,117,749 | | 349,888 |
| Institutional Class | | | |
| Proceeds from shares issued | 92,799,986 | | 26,355,294 |
| Dividends reinvested | 34,384 | | — |
| Cost of shares redeemed | (51,377,738) | | (1,538,877) |
| Change in Institutional Class from capital transactions | 41,456,632 | | 24,816,417 |
| Change in net assets from capital transactions | 47,574,381 | | 25,166,305 |
| Change in net assets | 49,963,245 | | 26,423,471 |
| Net Assets: | | | |
| Beginning of period | 26,423,471 | | — |
| End of period | $ 76,386,716 | | $ 26,423,471 |
| Shares Transactions: | | | |
| Class A | | | |
| Issued | 237,256 | | 19,199 |
| Reinvested | 8 | | — |
| Redeemed | (12,606) | | (6,281) |
| Change in Class A | 224,658 | | 12,918 |
| Institutional Class | | | |
| Issued | 3,399,392 | | 1,042,669 |
| Reinvested | 1,211 | | — |
| Redeemed | (1,884,059) | | (59,075) |
| Change in Institutional Class | 1,516,544 | | 983,594 |
Amounts designated as "—" are $0 or have been rounded to $0.
| | |
| (1) | For the period November 15, 2021 (commencement of operations) through April 30, 2022. |
See notes to financial statements.
STEWARD FUNDS
STATEMENTS OF CHANGES IN NET ASSETS
STEWARD GLOBAL EQUITY INCOME FUND
| | For the Year Ended April 30, 2023 | | For the Year Ended April 30, 2022 |
| Change in net assets resulting from operations: | | | |
| Net investment income | $ 9,160,398 | | $ 5,413,141 |
| Net realized gain from investment transactions and foreign currency translations | 994,975 | | 41,099,633 |
| Net change in unrealized depreciation on investments and foreign currency translations | (15,847,203) | | (45,042,441) |
| Change in net assets resulting from operations | (5,691,830) | | 1,470,333 |
| Distributions to shareholders from: | | | |
| Class A | (1,475,672) | | (3,150,494) |
| Class C | (57,537) | | (131,145) |
| Class R6 | (28,044) | | (42,415) |
| Institutional Class | (24,729,430) | | (40,510,185) |
| Total distributions to shareholders | (26,290,683) | | (43,834,239) |
| Capital Transactions: | | | |
| Class A | | | |
| Proceeds from shares issued | 3,684,843 | | 7,749,742 |
| Dividends reinvested | 1,410,324 | | 2,913,423 |
| Cost of shares redeemed | (4,170,337) | | (36,136,421) |
| Change in Class A from capital transactions | 924,830 | | (25,473,256) |
| Class C | | | |
| Proceeds from shares issued | 552,451 | | 158,085 |
| Dividends reinvested | 57,421 | | 131,145 |
| Cost of shares redeemed | (276,670) | | (3,293,521) |
| Change in Class C from capital transactions | 333,202 | | (3,004,291) |
| Class R6 | | | |
| Proceeds from shares issued | 115,141 | | 118,012 |
| Dividends reinvested | 28,044 | | 42,415 |
| Cost of shares redeemed | (102,931) | | (45,860) |
| Change in Class R6 from capital transactions | 40,254 | | 114,567 |
| Institutional Class | | | |
| Proceeds from shares issued | 122,855,572 | | 104,631,017 |
| Dividends reinvested | 24,429,485 | | 40,331,603 |
| Cost of shares redeemed | (58,574,889) | | (123,465,165) |
| Change in Institutional Class from capital transactions | 88,710,168 | | 21,497,455 |
| Change in net assets from capital transactions | 90,008,454 | | (6,865,525) |
| Change in net assets | 58,025,941 | | (49,229,431) |
| Net Assets: | | | |
| Beginning of period | 295,609,215 | | 344,838,646 |
| End of period | $ 353,635,156 | | $ 295,609,215 |
| Shares Transactions: | | | |
| Class A | | | |
| Issued | 123,140 | | 208,536 |
| Reinvested | 49,918 | | 86,344 |
| Redeemed | (141,159) | | (961,381) |
| Change in Class A | 31,899 | | (666,501) |
| Class C | | | |
| Issued | 17,708 | | 4,147 |
| Reinvested | 1,928 | | 3,693 |
| Redeemed | (8,723) | | (83,087) |
| Change in Class C | 10,913 | | (75,247) |
| Class R6 | | | |
| Issued | 4,129 | | 3,464 |
| Reinvested | 1,069 | | 1,349 |
| Redeemed | (3,704) | | (1,295) |
| Change in Class R6 | 1,494 | | 3,518 |
| Institutional Class | | | |
| Issued | 4,142,378 | | 2,858,776 |
| Reinvested | 865,480 | | 1,196,827 |
| Redeemed | (1,971,848) | | (3,349,955) |
| Change in Institutional Class | 3,036,010 | | 705,648 |
Amounts designated as "—" are $0 or have been rounded to $0.
See notes to financial statements.
STEWARD FUNDS
STATEMENTS OF CHANGES IN NET ASSETS
STEWARD INTERNATIONAL ENHANCED INDEX FUND
| | For the Year Ended April 30, 2023 | | For the Year Ended April 30, 2022 |
| Change in net assets resulting from operations: | | | |
| Net investment income | $ 6,356,558 | | $ 4,634,993 |
| Net realized gain/(loss) from investment transactions and foreign currency translations | (2,177,640) | | 5,893,363 |
| Net change in unrealized appreciation/(depreciation) on investments and foreign currency translations | 3,162,701 | | (28,658,785) |
| Change in net assets resulting from operations | 7,341,619 | | (18,130,429) |
| Distributions to shareholders from: | | | |
| Class A | (129,669) | | (275,412) |
| Class C | (34) | | (45) |
| Class R6 | (20,531) | | (32,211) |
| Institutional Class | (5,594,084) | | (8,297,705) |
| Total distributions to shareholders | (5,744,318) | | (8,605,373) |
| Capital Transactions: | | | |
| Class A | | | |
| Proceeds from shares issued | 874,364 | | 1,377,181 |
| Dividends reinvested | 123,347 | | 265,254 |
| Cost of shares redeemed | (2,082,557) | | (4,501,594) |
| Change in Class A from capital transactions | (1,084,846) | | (2,859,159) |
| Class C | | | |
| Proceeds from shares issued | 3,503 | | 1,000 |
| Dividends reinvested | 34 | | 45 |
| Change in Class C from capital transactions | 3,537 | | 1,045 |
| Class R6 | | | |
| Proceeds from shares issued | 80,779 | | 180,045 |
| Dividends reinvested | 20,531 | | 32,211 |
| Cost of shares redeemed | (159,803) | | (160,512) |
| Change in Class R6 from capital transactions | (58,493) | | 51,744 |
| Institutional Class | | | |
| Proceeds from shares issued | 47,527,411 | | 73,833,932 |
| Dividends reinvested | 5,486,189 | | 8,202,279 |
| Cost of shares redeemed | (45,740,969) | | (25,552,480) |
| Change in Institutional Class from capital transactions | 7,272,631 | | 56,483,731 |
| Change in net assets from capital transactions | 6,132,829 | | 53,677,361 |
| Change in net assets | 7,730,130 | | 26,941,559 |
| Net Assets: | | | |
| Beginning of period | 207,534,676 | | 180,593,117 |
| End of period | $ 215,264,806 | | $ 207,534,676 |
| Shares Transactions: | | | |
| Class A | | | |
| Issued | 40,648 | | 55,918 |
| Reinvested | 6,073 | | 11,204 |
| Redeemed | (97,812) | | (183,225) |
| Change in Class A | (51,091) | | (116,103) |
| Class C | | | |
| Issued | 206 | | 47 |
| Reinvested | 2 | | 2 |
| Change in Class C | 208 | | 49 |
| Class R6 | | | |
| Issued | 4,665 | | 8,553 |
| Reinvested | 1,222 | | 1,635 |
| Redeemed | (9,006) | | (7,515) |
| Change in Class R6 | (3,119) | | 2,673 |
| Institutional Class | | | |
| Issued | 2,267,039 | | 2,984,321 |
| Reinvested | 270,123 | | 348,082 |
| Redeemed | (2,190,590) | | (1,037,869) |
| Change in Institutional Class | 346,572 | | 2,294,534 |
Amounts designated as "—" are $0 or have been rounded to $0.
See notes to financial statements.
STEWARD FUNDS
STATEMENTS OF CHANGES IN NET ASSETS
STEWARD LARGE CAP CORE FUND
| | For the Year Ended April 30, 2023 | | For the Period
November 15,
2021(1) through April 30, 2022 |
| Change in net assets resulting from operations: | | | |
| Net investment income | $ 719,697 | | $ 204,228 |
| Net realized loss from investment transactions and foreign currency translations | (8,237,346) | | (1,943,247) |
| Net change in unrealized appreciation/(depreciation) on investments and foreign currency translations | 8,539,843 | | (7,934,392) |
| Change in net assets resulting from operations | 1,022,194 | | (9,673,411) |
| Distributions to shareholders from: | | | |
| Class A | (3,836) | | (1) |
| Institutional Class | (662,370) | | (60,583) |
| Total distributions to shareholders | (666,206) | | (60,584) |
| Capital Transactions: | | | |
| Class A | | | |
| Proceeds from shares issued | 231,370 | | 2,338,319 |
| Dividends reinvested | 3,707 | | 1 |
| Cost of shares redeemed | (63,848) | | (1,939,631) |
| Change in Class A from capital transactions | 171,229 | | 398,689 |
| Institutional Class | | | |
| Proceeds from shares issued | 16,852,345 | | 83,086,361 |
| Dividends reinvested | 649,762 | | 60,583 |
| Cost of shares redeemed | (8,981,324) | | (4,011,353) |
| Change in Institutional Class from capital transactions | 8,520,783 | | 79,135,591 |
| Change in net assets from capital transactions | 8,692,012 | | 79,534,280 |
| Change in net assets | 9,048,000 | | 69,800,285 |
| Net Assets: | | | |
| Beginning of period | 69,800,285 | | — |
| End of period | $ 78,848,285 | | $ 69,800,285 |
| Shares Transactions: | | | |
| Class A | | | |
| Issued | 11,165 | | 104,568 |
| Reinvested | 180 | | — |
| Redeemed | (3,009) | | (90,044) |
| Change in Class A | 8,336 | | 14,524 |
| Institutional Class | | | |
| Issued | 815,971 | | 3,388,850 |
| Reinvested | 31,511 | | 2,477 |
| Redeemed | (426,708) | | (168,003) |
| Change in Institutional Class | 420,774 | | 3,223,324 |
Amounts designated as "—" are $0 or have been rounded to $0.
| | |
| (1) | For the period November 15, 2021 (commencement of operations) through April 30, 2022. |
See notes to financial statements.
STEWARD FUNDS
STATEMENTS OF CHANGES IN NET ASSETS
STEWARD LARGE CAP GROWTH FUND
| | For the Year Ended April 30, 2023 | | For the Period
November 15,
2021(1) through April 30, 2022 |
| Change in net assets resulting from operations: | | | |
| Net investment income | $ 321,232 | | $ 29,475 |
| Net realized loss from investment transactions and foreign currency translations | (4,705,393) | | (1,950,529) |
| Net change in unrealized appreciation/(depreciation) on investments and foreign currency translations | 7,265,881 | | (5,995,175) |
| Change in net assets resulting from operations | 2,881,720 | | (7,916,229) |
| Distributions to shareholders from: | | | |
| Class A | (819) | | — |
| Institutional Class | (229,264) | | (20,782) |
| Total distributions to shareholders | (230,083) | | (20,782) |
| Capital Transactions: | | | |
| Class A | | | |
| Proceeds from shares issued | 155,802 | | 205,150 |
| Dividends reinvested | 789 | | — |
| Cost of shares redeemed | (25,441) | | (717) |
| Change in Class A from capital transactions | 131,150 | | 204,433 |
| Institutional Class | | | |
| Proceeds from shares issued | 37,681,958 | | 53,399,897 |
| Dividends reinvested | 228,380 | | 20,782 |
| Cost of shares redeemed | (8,789,417) | | (2,709,799) |
| Change in Institutional Class from capital transactions | 29,120,921 | | 50,710,880 |
| Change in net assets from capital transactions | 29,252,071 | | 50,915,313 |
| Change in net assets | 31,903,708 | | 42,978,302 |
| Net Assets: | | | |
| Beginning of period | 42,978,302 | | — |
| End of period | $ 74,882,010 | | $ 42,978,302 |
| Shares Transactions: | | | |
| Class A | | | |
| Issued | 7,887 | | 9,196 |
| Reinvested | 42 | | — |
| Redeemed | (1,294) | | (30) |
| Change in Class A | 6,635 | | 9,166 |
| Institutional Class | | | |
| Issued | 1,958,780 | | 2,186,054 |
| Reinvested | 12,007 | | 856 |
| Redeemed | (435,781) | | (117,329) |
| Change in Institutional Class | 1,535,006 | | 2,069,581 |
Amounts designated as "—" are $0 or have been rounded to $0.
| | |
| (1) | For the period November 15, 2021 (commencement of operations) through April 30, 2022. |
See notes to financial statements.
STEWARD FUNDS
STATEMENTS OF CHANGES IN NET ASSETS
STEWARD LARGE CAP VALUE FUND
| | For the Year Ended April 30, 2023 | | For the Period
November 15,
2021(1) through April 30, 2022 |
| Change in net assets resulting from operations: | | | |
| Net investment income | $ 985,335 | | $ 397,320 |
| Net realized loss from investment transactions and foreign currency translations | (5,211,896) | | (1,110,138) |
| Net change in unrealized appreciation/(depreciation) on investments and foreign currency translations | 4,793,248 | | (4,197,626) |
| Change in net assets resulting from operations | 566,687 | | (4,910,444) |
| Distributions to shareholders from: | | | |
| Class A | (9,758) | | (2) |
| Institutional Class | (998,632) | | (105,357) |
| Total distributions to shareholders | (1,008,390) | | (105,359) |
| Capital Transactions: | | | |
| Class A | | | |
| Proceeds from shares issued | 358,214 | | 348,652 |
| Dividends reinvested | 9,075 | | 2 |
| Cost of shares redeemed | (54,945) | | (800) |
| Change in Class A from capital transactions | 312,344 | | 347,854 |
| Institutional Class | | | |
| Proceeds from shares issued | 13,965,428 | | 69,037,284 |
| Dividends reinvested | 998,631 | | 105,357 |
| Cost of shares redeemed | (12,212,285) | | (3,832,240) |
| Change in Institutional Class from capital transactions | 2,751,774 | | 65,310,401 |
| Change in net assets from capital transactions | 3,064,118 | | 65,658,255 |
| Change in net assets | 2,622,415 | | 60,642,452 |
| Net Assets: | | | |
| Beginning of period | 60,642,452 | | — |
| End of period | $ 63,264,867 | | $ 60,642,452 |
| Shares Transactions: | | | |
| Class A | | | |
| Issued | 15,962 | | 14,371 |
| Reinvested | 403 | | — |
| Redeemed | (2,424) | | (33) |
| Change in Class A | 13,941 | | 14,338 |
| Institutional Class | | | |
| Issued | 622,052 | | 2,783,170 |
| Reinvested | 44,206 | | 4,274 |
| Redeemed | (537,972) | | (155,438) |
| Change in Institutional Class | 128,286 | | 2,632,006 |
Amounts designated as "—" are $0 or have been rounded to $0.
| | |
| (1) | For the period November 15, 2021 (commencement of operations) through April 30, 2022. |
See notes to financial statements.
STEWARD FUNDS
STATEMENTS OF CHANGES IN NET ASSETS
STEWARD SELECT BOND FUND
| | For the Year Ended April 30, 2023 | | For the Year Ended April 30, 2022 |
| Change in net assets resulting from operations: | | | |
| Net investment income | $ 2,535,796 | | $ 2,338,350 |
| Net realized gain/(loss) from investment transactions and foreign currency translations | (899,152) | | 261,429 |
| Net change in unrealized depreciation on investments and foreign currency translations | (1,572,441) | | (17,076,687) |
| Change in net assets resulting from operations | 64,203 | | (14,476,908) |
| Distributions to shareholders from: | | | |
| Class A | (43,801) | | (67,530) |
| Class C | (407) | | (11) |
| Class R6 | (15) | | (7) |
| Institutional Class | (2,432,742) | | (2,326,303) |
| Total distributions to shareholders | (2,476,965) | | (2,393,851) |
| Capital Transactions: | | | |
| Class A | | | |
| Proceeds from shares issued | 455,551 | | 1,470,544 |
| Dividends reinvested | 42,888 | | 67,148 |
| Cost of shares redeemed | (1,527,917) | | (3,163,624) |
| Change in Class A from capital transactions | (1,029,478) | | (1,625,932) |
| Class C | | | |
| Proceeds from shares issued | 122,310 | | 5 |
| Dividends reinvested | 407 | | 11 |
| Cost of shares redeemed | (5) | | — |
| Change in Class C from capital transactions | 122,712 | | 16 |
| Class R6 | | | |
| Proceeds from shares issued | — | | 1,000 |
| Dividends reinvested | 15 | | 7 |
| Change in Class R6 from capital transactions | 15 | | 1,007 |
| Institutional Class | | | |
| Proceeds from shares issued | 29,268,757 | | 23,815,641 |
| Dividends reinvested | 2,416,248 | | 2,324,421 |
| Cost of shares redeemed | (23,947,517) | | (44,198,562) |
| Change in Institutional Class from capital transactions | 7,737,488 | | (18,058,500) |
| Change in net assets from capital transactions | 6,830,737 | | (19,683,409) |
| Change in net assets | 4,417,975 | | (36,554,168) |
| Net Assets: | | | |
| Beginning of period | 150,718,512 | | 187,272,680 |
| End of period | $ 155,136,487 | | $ 150,718,512 |
| Shares Transactions: | | | |
| Class A | | | |
| Issued | 20,684 | | 59,650 |
| Reinvested | 1,949 | | 2,707 |
| Redeemed | (68,848) | | (131,814) |
| Change in Class A | (46,215) | | (69,457) |
| Class C | | | |
| Issued | 4,986 | | — |
| Reinvested | 16 | | 1 |
| Change in Class C | 5,002 | | 1 |
| Class R6 | | | |
| Issued | — | | 36 |
| Reinvested | 1 | | — |
| Change in Class R6 | 1 | | 36 |
| Institutional Class | | | |
| Issued | 1,337,431 | | 971,016 |
| Reinvested | 110,501 | | 94,285 |
| Redeemed | (1,093,531) | | (1,804,027) |
| Change in Institutional Class | 354,401 | | (738,726) |
Amounts designated as "—" are $0 or have been rounded to $0.
See notes to financial statements.
STEWARD FUNDS
STATEMENTS OF CHANGES IN NET ASSETS
STEWARD SMALL CAP GROWTH FUND
| | For the Year Ended April 30, 2023 | | For the Period
November 15,
2021(1) through April 30, 2022 |
| Change in net assets resulting from operations: | | | |
| Net investment loss | $ (124,571) | | $ (49,635) |
| Net realized loss from investment transactions and foreign currency translations | (3,995,248) | | (305,173) |
| Net change in unrealized appreciation/(depreciation) on investments and foreign currency translations | 1,749,574 | | (8,554,114) |
| Change in net assets resulting from operations | (2,370,245) | | (8,908,922) |
| Distributions to shareholders from: | | | |
| Class A | — | | — |
| Institutional Class | — | | (10,843) |
| Total distributions to shareholders | — | | (10,843) |
| Capital Transactions: | | | |
| Class A | | | |
| Proceeds from shares issued | 88,066 | | 181,467 |
| Dividends reinvested | — | | — |
| Cost of shares redeemed | (67,640) | | (726) |
| Change in Class A from capital transactions | 20,426 | | 180,741 |
| Institutional Class | | | |
| Proceeds from shares issued | 6,024,811 | | 42,030,129 |
| Dividends reinvested | — | | 10,843 |
| Cost of shares redeemed | (10,016,130) | | (1,980,974) |
| Change in Institutional Class from capital transactions | (3,991,319) | | 40,059,998 |
| Change in net assets from capital transactions | (3,970,893) | | 40,240,739 |
| Change in net assets | (6,341,138) | | 31,320,974 |
| Net Assets: | | | |
| Beginning of period | 31,320,974 | | — |
| End of period | $ 24,979,836 | | $ 31,320,974 |
| Shares Transactions: | | | |
| Class A | | | |
| Issued | 5,054 | | 8,900 |
| Reinvested | — | | — |
| Redeemed | (3,942) | | (33) |
| Change in Class A | 1,112 | | 8,867 |
| Institutional Class | | | |
| Issued | 355,070 | | 1,749,903 |
| Reinvested | — | | 476 |
| Redeemed | (563,607) | | (93,355) |
| Change in Institutional Class | (208,537) | | 1,657,024 |
Amounts designated as "—" are $0 or have been rounded to $0.
| | |
| (1) | For the period November 15, 2021 (commencement of operations) through April 30, 2022. |
See notes to financial statements.
STEWARD FUNDS
STATEMENTS OF CHANGES IN NET ASSETS
STEWARD VALUES-FOCUSED LARGE CAP ENHANCED INDEX FUND
| | For the Year Ended April 30, 2023 | | For the Year Ended April 30, 2022 |
| Change in net assets resulting from operations: | | | |
| Net investment income | $ 2,214,075 | | $ 2,117,879 |
| Net realized gain from investment transactions and foreign currency translations | 4,083,513 | | 127,032,512 |
| Net change in unrealized depreciation on investments and foreign currency translations | (3,004,991) | | (101,563,727) |
| Change in net assets resulting from operations | 3,292,597 | | 27,586,664 |
| Distributions to shareholders from: | | | |
| Class A | (3,285,370) | | (4,284,340) |
| Class C | (11,137) | | (943) |
| Class R6 | (186,322) | | (154,723) |
| Institutional Class | (65,101,250) | | (67,506,360) |
| Total distributions to shareholders | (68,584,079) | | (71,946,366) |
| Capital Transactions: | | | |
| Class A | | | |
| Proceeds from shares issued | 3,006,588 | | 3,057,252 |
| Dividends reinvested | 3,133,110 | | 3,685,445 |
| Cost of shares redeemed | (4,763,746) | | (21,111,872) |
| Change in Class A from capital transactions | 1,375,952 | | (14,369,175) |
| Class C | | | |
| Proceeds from shares issued | 30,507 | | 3,004 |
| Dividends reinvested | 11,137 | | 943 |
| Change in Class C from capital transactions | 41,644 | | 3,947 |
| Class R6 | | | |
| Proceeds from shares issued | 103,081 | | 147,650 |
| Dividends reinvested | 186,322 | | 154,723 |
| Cost of shares redeemed | (104,014) | | (145,495) |
| Change in Class R6 from capital transactions | 185,389 | | 156,878 |
| Institutional Class | | | |
| Proceeds from shares issued | 38,219,649 | | 65,264,595 |
| Dividends reinvested | 64,385,367 | | 66,592,675 |
| Cost of shares redeemed | (47,593,678) | | (252,342,695) |
| Change in Institutional Class from capital transactions | 55,011,338 | | (120,485,425) |
| Change in net assets from capital transactions | 56,614,323 | | (134,693,775) |
| Change in net assets | (8,677,159) | | (179,053,477) |
| Net Assets: | | | |
| Beginning of period | 218,918,061 | | 397,971,538 |
| End of period | $ 210,240,902 | | $ 218,918,061 |
| Shares Transactions: | | | |
| Class A | | | |
| Issued | 90,824 | | 59,464 |
| Reinvested | 124,825 | | 81,343 |
| Redeemed | (147,135) | | (393,608) |
| Change in Class A | 68,514 | | (252,801) |
| Class C | | | |
| Issued | 1,065 | | 62 |
| Reinvested | 570 | | 24 |
| Change in Class C | 1,635 | | 86 |
| Class R6 | | | |
| Issued | 3,740 | | 3,330 |
| Reinvested | 9,192 | | 3,926 |
| Redeemed | (3,488) | | (3,050) |
| Change in Class R6 | 9,444 | | 4,206 |
| Institutional Class | | | |
| Issued | 1,158,440 | | 1,273,509 |
| Reinvested | 2,575,415 | | 1,476,625 |
| Redeemed | (1,502,453) | | (4,567,634) |
| Change in Institutional Class | 2,231,402 | | (1,817,500) |
Amounts designated as "—" are $0 or have been rounded to $0.
See notes to financial statements.
STEWARD FUNDS
STATEMENTS OF CHANGES IN NET ASSETS
STEWARD VALUES-FOCUSED SMALL-MID CAP ENHANCED INDEX FUND
| | For the Year Ended April 30, 2023 | | For the Year Ended April 30, 2022 |
| Change in net assets resulting from operations: | | | |
| Net investment income | $ 1,591,860 | | $ 1,281,069 |
| Net realized gain from investment transactions and foreign currency translations | 7,414,786 | | 57,304,128 |
| Net change in unrealized depreciation on investments and foreign currency translations | (10,868,601) | | (66,681,904) |
| Change in net assets resulting from operations | (1,861,955) | | (8,096,707) |
| Distributions to shareholders from: | | | |
| Class A | (9,717,491) | | (7,138,148) |
| Class C | (1,957) | | (133) |
| Class R6 | (74,342) | | (14,790) |
| Institutional Class | (27,461,304) | | (20,181,854) |
| Total distributions to shareholders | (37,255,094) | | (27,334,925) |
| Capital Transactions: | | | |
| Class A | | | |
| Proceeds from shares issued | 2,841,387 | | 3,207,439 |
| Dividends reinvested | 8,927,779 | | 6,477,306 |
| Cost of shares redeemed | (7,181,987) | | (16,814,731) |
| Change in Class A from capital transactions | 4,587,179 | | (7,129,986) |
| Class C | | | |
| Proceeds from shares issued | 10,347 | | 1,000 |
| Dividends reinvested | 1,957 | | 133 |
| Change in Class C from capital transactions | 12,304 | | 1,133 |
| Class R6 | | | |
| Proceeds from shares issued | 64,574 | | 348,495 |
| Dividends reinvested | 74,342 | | 14,790 |
| Cost of shares redeemed | (146,955) | | (42,528) |
| Change in Class R6 from capital transactions | (8,039) | | 320,757 |
| Institutional Class | | | |
| Proceeds from shares issued | 40,797,850 | | 44,680,673 |
| Dividends reinvested | 23,418,326 | | 17,411,342 |
| Cost of shares redeemed | (49,187,010) | | (106,707,033) |
| Change in Institutional Class from capital transactions | 15,029,166 | | (44,615,018) |
| Change in net assets from capital transactions | 19,620,610 | | (51,423,114) |
| Change in net assets | (19,496,439) | | (86,854,746) |
| Net Assets: | | | |
| Beginning of period | 186,772,523 | | 273,627,269 |
| End of period | $ 167,276,084 | | $ 186,772,523 |
| Shares Transactions: | | | |
| Class A | | | |
| Issued | 231,653 | | 180,929 |
| Reinvested | 830,491 | | 413,377 |
| Redeemed | (581,962) | | (982,455) |
| Change in Class A | 480,182 | | (388,149) |
| Class C | | | |
| Issued | 929 | | 58 |
| Reinvested | 210 | | 9 |
| Change in Class C | 1,139 | | 67 |
| Class R6 | | | |
| Issued | 5,098 | | 24,196 |
| Reinvested | 7,664 | | 1,021 |
| Redeemed | (11,647) | | (2,593) |
| Change in Class R6 | 1,115 | | 22,624 |
| Institutional Class | | | |
| Issued | 3,197,219 | | 2,586,807 |
| Reinvested | 2,117,390 | | 1,085,860 |
| Redeemed | (3,696,127) | | (5,877,857) |
| Change in Institutional Class | 1,618,482 | | (2,205,190) |
Amounts designated as "—" are $0 or have been rounded to $0.
See notes to financial statements.
(This page has been intentionally left blank)
STEWARD FUNDS
FINANCIAL HIGHLIGHTS
The following table sets forth the per share operating performance data for a share of capital stock outstanding, total return, ratios to average net assets and other supplemental data for the period indicated.
| | | Investment Operations: |
| | Net Asset
Value,
Beginning
of Period | Net
Investment
Income/(Loss) | Net
Realized
and
Unrealized
Gain/(Loss) from
Investments | Total from
Investment
Operations |
| Steward Covered Call Income Fund | | | | |
| Class A | | | | |
| Year ended April 30, 2023 | $ 7.79 | $ 0.05(d) | $ 0.29 | $ 0.34 |
| Year ended April 30, 2022 | 9.88 | 0.02 (d) | 0.14 | 0.16 |
| Year ended April 30, 2021 | 8.64 | 0.05 (d) | 2.59 | 2.64 |
| Year ended April 30, 2020 | 9.77 | 0.08 (d) | (0.54) | (0.46) |
| Year ended April 30, 2019 | 9.92 | 0.04 | 0.71 | 0.75 |
| Class C | | | | |
| Year ended April 30, 2023 | $ 7.77 | $(0.01) (d)(f) | $ 0.29 | $ 0.28 |
| Year ended April 30, 2022 | 9.91 | (0.05) (d) | 0.12 | 0.07 |
| Year ended April 30, 2021 | 8.70 | (0.02) (d)(f) | 2.60 | 2.58 |
| Year ended April 30, 2020 | 9.84 | — (d) | (0.53) | (0.53) |
| Year ended April 30, 2019 | 9.95 | 0.01 | 0.71 | 0.72 |
| Class R6 | | | | |
| Year ended April 30, 2023 | $ 7.85 | $ 0.07(d) | $ 0.30 | $ 0.37 |
| Year ended April 30, 2022 | 9.89 | 0.04 (d) | 0.16 | 0.20 |
| Year ended April 30, 2021 | 8.64 | — (d) | 2.65 | 2.65 |
| Year ended April 30, 2020 | 9.80 | — (d)(g) | (0.49) | (0.49) |
| Year ended April 30, 2019 | 9.92 | — (g) | 0.69 | 0.69 |
| Institutional Class | | | | |
| Year ended April 30, 2023 | $ 7.87 | $ 0.07(d) | $ 0.30 | $ 0.37 |
| Year ended April 30, 2022 | 9.92 | 0.05 (d) | 0.12 | 0.17 |
| Year ended April 30, 2021 | 8.65 | 0.07 (d) | 2.61 | 2.68 |
| Year ended April 30, 2020 | 9.75 | 0.10 (d) | (0.53) | (0.43) |
| Year ended April 30, 2019 | 9.92 | 0.11 | 0.65 | 0.76 |
| Steward Equity Market Neutral Fund | | | | |
| Class A | | | | |
| Year ended April 30, 2023 | $26.47 | $ 0.56(d) | $ 0.78(h) | $ 1.34 |
| Period ended April 30, 2022(j) | 25.00 | (0.14) | 1.61 | 1.47 |
| Institutional Class | | | | |
| Year ended April 30, 2023 | $26.52 | $ 0.42(d) | $ 0.98(h) | $ 1.40 |
| Period ended April 30, 2022(j) | 25.00 | (0.18) | 1.70 | 1.52 |
Amounts designated as "—" are $0 or have been rounded to $0.
| (a) | Not annualized for periods less than one year. |
| (b) | Annualized for periods less than one year. |
| (c) | Portfolio turnover is calculated on the basis of the Fund, as a whole, without distinguishing between the classes of shares issued. |
| (d) | Calculated based on average shares outstanding. |
| (e) | During the year, additional fees were voluntary waived or reimbursed. Had these fees not been waived or reimbursed, the net expense ratio for each class would have been 0.34% higher. |
| (f) | The amount shown for a share outstanding throughout the period may not correlate with the Statement of Operations for the period due to timing of sales and redemptions of Fund shares in relation to income earned and/or fluctuating market value of the investments of the Fund. |
| (g) | Expressed as ‘‘—’’ as the income and/or expenses accrued for the class were considered immaterial for presentation purposes relative to the size of the class. |
| (h) | The Adviser has reimbursed the Fund $2,372 for a procedural error. The impact was deemed immaterial to net realized and unrealized gain/loss on investments and the Fund’s total return, representing less than $0.005 per share. |
| (i) | The ratio for the Steward Equity Market Neutral Fund includes the effect of dividend expense on securities sold short and brokerage expense on securities sold short, which increased the ratio by 0.36% and 0.52% for Class A and Institutional Class, respectively, for the year ended April 30, 2023, and 1.56% and 1.39% for Class A and Institutional Class, respectively, for the period ended April 30, 2022. |
| (j) | For the period November 15, 2021 (commencement of operations) through April 30, 2022. |
See notes to financial statements.
| Distributions: | | | Supplemental data and ratios: |
Net
Investment
Income | Capital
Gains | Total
Distributions | Net Asset
Value, End
of Period | Total
Return(a) | Net Assets,
End of Period
(000's) | Ratio of
Expenses to
Average Net
Assets
Prior to
Waivers (b) | Ratio of
Expenses to
Average Net
Assets
Net of
Waivers(b) | Ratio of Net
Investment
Income/(Loss)
to Average
Net Assets(b) | Portfolio
Turnover
Rate(a)(c) |
| | | | | | | | | | |
| | | | | | | | | | |
| $(0.04) | $(0.62) | $(0.66) | $ 7.47 | 5.08% | $ 735 | 1.80% | 1.25% | 0.69% | 73% |
| (0.08) | (2.17) | (2.25) | 7.79 | (0.18) | 93 | 2.37 | 1.25 | 0.21 | 130 |
| (0.07) | (1.33) | (1.40) | 9.88 | 32.27 | 11 | 2.42 | 1.25 (e) | 0.51 | 156 |
| (0.10) | (0.57) | (0.67) | 8.64 | (5.45) | 9 | 1.65 | 1.25 | 0.85 | 135 |
| (0.09) | (0.81) | (0.90) | 9.77 | 8.91 | 31 | 1.44 | 1.25 | 0.79 | 117 |
| | | | | | | | | | |
| $(0.01) | $(0.62) | $(0.63) | $ 7.42 | 4.10% | $ 1,101 | 2.51% | 2.00% | (0.12)% | 73% |
| (0.04) | (2.17) | (2.21) | 7.77 | (0.96) | 202 | 2.82 | 2.00 | (0.55) | 130 |
| (0.04) | (1.33) | (1.37) | 9.91 | 31.33 | 195 | 2.96 | 2.00 (e) | (0.18) | 156 |
| (0.04) | (0.57) | (0.61) | 8.70 | (6.10) | 301 | 2.48 | 2.00 | 0.02 | 135 |
| (0.02) | (0.81) | (0.83) | 9.84 | 8.52 | 79 | 2.23 | 2.00 | 0.05 | 117 |
| | | | | | | | | | |
| $(0.07) | $(0.62) | $(0.69) | $ 7.53 | 5.42% | $ 3 | 1.42% | 0.90% | 0.96% | 73% |
| (0.07) | (2.17) | (2.24) | 7.85 | 0.31 | 1 | 2.11 | 0.90 | 0.44 | 130 |
| (0.07) | (1.33) | (1.40) | 9.89 | 32.48 | — | — (g) | — (g) | — (g) | 156 |
| (0.10) | (0.57) | (0.67) | 8.64 | (5.81) | — | — (g) | — (g) | — (g) | 135 |
| — | (0.81) | (0.81) | 9.80 | 8.27 | — | — (g) | — (g) | — (g) | 117 |
| | | | | | | | | | |
| $(0.06) | $(0.62) | $(0.68) | $ 7.56 | 5.41% | $53,747 | 1.51% | 1.00% | 0.93% | 73% |
| (0.05) | (2.17) | (2.22) | 7.87 | (0.04) | 22,952 | 1.61 | 1.00 | 0.46 | 130 |
| (0.08) | (1.33) | (1.41) | 9.92 | 32.73 | 36,186 | 2.00 | 1.00 (e) | 0.75 | 156 |
| (0.10) | (0.57) | (0.67) | 8.65 | (5.15) | 27,340 | 1.32 | 1.00 | 1.08 | 135 |
| (0.12) | (0.81) | (0.93) | 9.75 | 9.06 | 28,806 | 1.14 | 1.00 | 1.10 | 117 |
| | | | | | | | | | |
| | | | | | | | | | |
| $ — | $(0.01) | $(0.01) | $27.80 | 5.07% | $ 6,605 | 2.21 (i)% | 2.21 (i)% | 2.04% | 160% |
| — | — | — | 26.47 | 5.88 | 342 | 3.81 (i) | 3.81 (i) | (2.26) | 111 |
| | | | | | | | | | |
| $ — | $(0.01) | $(0.01) | $27.91 | 5.28% | $69,782 | 2.12 (i)% | 2.12 (i)% | 1.52% | 160% |
| — | — | — | 26.52 | 6.08 | 26,082 | 3.11 (i) | 3.11 (i) | (1.65) | 111 |
See notes to financial statements.
STEWARD FUNDS
FINANCIAL HIGHLIGHTS
| | | Investment Operations: |
| | Net Asset
Value,
Beginning
of Period | Net
Investment
Income/(Loss) | Net
Realized
and
Unrealized
Gain/(Loss) from
Investments | Total from
Investment
Operations |
| Steward Global Equity Income Fund | | | | |
| Class A | | | | |
| Year ended April 30, 2023 | $32.19 | $0.82 (d) | $ (1.76) | $ (0.94) |
| Year ended April 30, 2022 | 37.39 | 0.50 (d) | (0.39) | 0.11 |
| Year ended April 30, 2021 | 26.39 | 0.53 (d) | 11.40 | 11.93 |
| Year ended April 30, 2020 | 31.36 | 0.59 (d) | (3.16) | (2.57) |
| Year ended April 30, 2019 | 33.06 | 0.70 (d) | 0.43 | 1.13 |
| Class C | | | | |
| Year ended April 30, 2023 | $33.94 | $0.62 (d) | $ (1.89) | $ (1.27) |
| Year ended April 30, 2022 | 39.17 | 0.23 (d) | (0.38) | (0.15) |
| Year ended April 30, 2021 | 27.65 | 0.32 (d) | 11.92 | 12.24 |
| Year ended April 30, 2020(e) | 53.40 | 0.31 (d) | (23.63) | (23.32) |
| Year ended April 30, 2019(e) | 80.20 | 0.70 (d) | (0.90) (f) | (0.20) |
| Class R6 | | | | |
| Year ended April 30, 2023 | $30.09 | $0.86 (d) | $ (1.64) | $ (0.78) |
| Year ended April 30, 2022 | 35.30 | 0.61 (d) | (0.36) | 0.25 |
| Year ended April 30, 2021 | 25.00 | 0.62 (d) | 10.79 | 11.41 |
| Year ended April 30, 2020(e) | 50.50 | 0.59 (d) | (23.57) | (22.98) |
| Year ended April 30, 2019(e) | 79.90 | 2.10 (d) | (2.10) (f) | — |
| Institutional Class | | | | |
| Year ended April 30, 2023 | $32.23 | $0.89 (d) | $ (1.76) | $ (0.87) |
| Year ended April 30, 2022 | 37.46 | 0.60 (d) | (0.40) | 0.20 |
| Year ended April 30, 2021 | 26.48 | 0.62 (d) | 11.45 | 12.07 |
| Year ended April 30, 2020 | 31.45 | 0.68 (d) | (3.16) | (2.48) |
| Year ended April 30, 2019 | 33.15 | 0.79 (d) | 0.44 | 1.23 |
| Steward International Enhanced Index Fund | | | | |
| Class A | | | | |
| Year ended April 30, 2023 | $21.97 | $0.62 (d) | $ 0.11 | $ 0.73 |
| Year ended April 30, 2022 | 24.85 | 0.52 (d) | (2.41) | (1.89) |
| Year ended April 30, 2021 | 17.59 | 0.37 (d) | 7.65 | 8.02 |
| Year ended April 30, 2020 | 22.01 | 0.46 (d) | (4.40) | (3.94) |
| Year ended April 30, 2019 | 23.01 | 0.53 | (1.01) | (0.48) |
| Class C | | | | |
| Year ended April 30, 2023 | $17.92 | $0.52 (d) | $ 0.09 | $ 0.61 |
| Year ended April 30, 2022 | 20.65 | 0.46 (d) | (2.14) | (1.68) |
| Year ended April 30, 2021 | 14.90 | — (d)(g) | 6.48 | 6.48 |
| Year ended April 30, 2020(e) | 19.46 | — (d)(g) | (4.12) | (4.12) |
| Year ended April 30, 2019(e) | 20.16 | — (g) | (0.70) | (0.70) |
| Class R6 | | | | |
| Year ended April 30, 2023 | $18.33 | $0.58 (d) | $ 0.08 | $ 0.66 |
| Year ended April 30, 2022 | 20.91 | 0.51 (d) | (2.02) | (1.51) |
| Year ended April 30, 2021 | 14.95 | 0.36 (d) | 6.50 | 6.86 |
| Year ended April 30, 2020(e) | 19.42 | 0.37 (d) | (4.28) | (3.91) |
| Year ended April 30, 2019(e) | 20.10 | — (g) | (0.68) | (0.68) |
| Institutional Class | | | | |
| Year ended April 30, 2023 | $21.98 | $0.67 (d) | $ 0.12 | $ 0.79 |
| Year ended April 30, 2022 | 24.87 | 0.58 (d) | (2.42) | (1.84) |
| Year ended April 30, 2021 | 17.66 | 0.40 (d) | 7.70 | 8.10 |
| Year ended April 30, 2020 | 22.08 | 0.53 (d) | (4.40) | (3.87) |
| Year ended April 30, 2019 | 23.09 | 0.59 | (1.01) | (0.42) |
Amounts designated as "—" are $0 or have been rounded to $0.
| (a) | Not annualized for periods less than one year. |
| (b) | Annualized for periods less than one year. |
| (c) | Portfolio turnover is calculated on the basis of the Fund, as a whole, without distinguishing between the classes of shares issued. |
| (d) | Calculated based on average shares outstanding. |
| (e) | Effective March 9, 2020, the share class had a one-for-two reverse stock split. Share amounts for the periods have been adjusted to give effect to the one-for-two stock split. |
| (f) | Realized and unrealized gains and losses per share in this caption are balancing amounts necessary to reconcile the change in net asset value per share for the period, and may not reconcile with the aggregate gains and losses in the Statement of Operations due to share transactions for the period. |
| (g) | Expressed as ‘‘—’’ as the income and/or expenses accrued for the class were considered immaterial for presentation purposes relative to the size of the class. |
See notes to financial statements.
| Distributions: | | | Supplemental data and ratios: |
Net
Investment
Income | Capital
Gains | Total
Distributions | Net Asset
Value, End
of Period | Total
Return(a) | Net Assets,
End of Period
(000's) | Ratio of
Expenses to
Average
Net Assets (b) | Ratio of Net
Investment
Income/(Loss)
to Average
Net Assets(b) | Portfolio
Turnover
Rate(a)(c) | |
| | | | | | | | | | |
| | | | | | | | | | |
| $(0.75) | $ (1.68) | $ (2.43) | $28.82 | (2.67)% | $ 18,217 | 1.26% | 2.77% | 53% | |
| (0.56) | (4.75) | (5.31) | 32.19 | (0.20) | 19,325 | 1.23 | 1.36 | 73 | |
| (0.48) | (0.45) | (0.93) | 37.39 | 45.81 | 47,363 | 1.26 | 1.71 | 67 | |
| (0.58) | (1.82) | (2.40) | 26.39 | (9.41) | 52,326 | 1.21 | 1.91 | 48 | |
| (0.67) | (2.16) | (2.83) | 31.36 | 4.61 | 72,351 | 0.97 | 2.18 | 28 | |
| | | | | | | | | | |
| $(0.54) | $ (1.68) | $ (2.22) | $30.45 | (3.51)% | $ 1,061 | 2.04% | 1.98% | 53% | |
| (0.33) | (4.75) | (5.08) | 33.94 | (0.88) | 812 | 1.96 | 0.59 | 73 | |
| (0.27) | (0.45) | (0.72) | 39.17 | 44.75 | 3,885 | 1.98 | 0.95 | 67 | |
| (0.61) | (1.82) | (2.43) | 27.65 | (10.12) | 2,389 | 2.08 | 0.95 | 48 | |
| (5.00) | (21.60) | (26.60) | 53.40 | 4.52 | 372 | 1.64 | 1.24 | 28 | |
| | | | | | | | | | |
| $(0.84) | $ (1.68) | $ (2.52) | $26.79 | (2.25)% | $ 315 | 0.91% | 3.10% | 53% | |
| (0.71) | (4.75) | (5.46) | 30.09 | 0.15 | 309 | 0.90 | 1.79 | 73 | |
| (0.66) | (0.45) | (1.11) | 35.30 | 46.35 | 239 | 0.87 | 2.03 | 67 | |
| (0.70) | (1.82) | (2.52) | 25.00 | (9.09) | 121 | 0.90 | 1.72 | 48 | |
| (7.80) | (21.60) | (29.40) | 50.50 | 5.04 | 6 | 0.61 | 2.75 | 28 | |
| | | | | | | | | | |
| $(0.82) | $ (1.68) | $ (2.50) | $28.86 | (2.42)% | $334,042 | 1.02% | 2.98% | 53% | |
| (0.68) | (4.75) | (5.43) | 32.23 | 0.02 | 275,163 | 0.99 | 1.65 | 73 | |
| (0.64) | (0.45) | (1.09) | 37.46 | 46.24 | 293,352 | 0.98 | 1.95 | 67 | |
| (0.67) | (1.82) | (2.49) | 26.48 | (9.09) | 214,917 | 0.88 | 2.22 | 48 | |
| (0.77) | (2.16) | (2.93) | 31.45 | 4.90 | 243,030 | 0.67 | 2.47 | 28 | |
| | | | | | | | | | |
| | | | | | | | | | |
| $(0.36) | $ (0.25) | $ (0.61) | $22.09 | 3.55% | $ 4,058 | 1.04% | 2.94% | 18% | |
| (0.38) | (0.61) | (0.99) | 21.97 | (7.86) | 5,159 | 0.99 | 2.08 | 14 | |
| (0.25) | (0.51) | (0.76) | 24.85 | 46.20 | 8,721 | 1.00 | 1.81 | 14 | |
| (0.48) | — | (0.48) | 17.59 | (18.18) | 28,007 | 1.06 | 2.20 | 15 | |
| (0.52) | — | (0.52) | 22.01 | (1.99) | 29,734 | 1.01 | 2.43 | 10 | |
| | | | | | | | | | |
| $(0.42) | $ (0.25) | $ (0.67) | $17.86 | 3.66% | $ 5 | 1.07% | 3.01% | 18% | |
| (0.44) | (0.61) | (1.05) | 17.92 | (8.42) | 1 | 0.55 | 2.37 | 14 | |
| (0.22) | (0.51) | (0.73) | 20.65 | 44.09 | — | — (g) | — (g) | 14 | |
| (0.44) | — | (0.44) | 14.90 | (19.85) | — | — (g) | — (g) | 15 | |
| — | — | — | 19.46 | (3.47) | — | — (g) | — (g) | 10 | |
| | | | | | | | | | |
| $(0.43) | $ (0.25) | $ (0.68) | $18.31 | 3.92% | $ 548 | 0.67% | 3.29% | 18% | |
| (0.46) | (0.61) | (1.07) | 18.33 | (7.57) | 606 | 0.66 | 2.45 | 14 | |
| (0.39) | (0.51) | (0.90) | 20.91 | 46.71 | 635 | 0.64 | 1.98 | 14 | |
| (0.56) | — | (0.56) | 14.95 | (18.52) | 475 | 0.68 | 2.14 | 15 | |
| — | — | — | 19.42 | (3.38) | — | — (g) | — (g) | 10 | |
| | | | | | | | | | |
| $(0.41) | $ (0.25) | $ (0.66) | $22.11 | 3.82% | $210,654 | 0.78% | 3.16% | 18% | |
| (0.44) | (0.61) | (1.05) | 21.98 | (7.67) | 201,769 | 0.76 | 2.35 | 14 | |
| (0.38) | (0.51) | (0.89) | 24.87 | 46.56 | 171,237 | 0.76 | 1.86 | 14 | |
| (0.55) | — | (0.55) | 17.66 | (17.87) | 98,451 | 0.72 | 2.55 | 15 | |
| (0.59) | — | (0.59) | 22.08 | (1.74) | 116,694 | 0.71 | 2.73 | 10 | |
See notes to financial statements.
STEWARD FUNDS
FINANCIAL HIGHLIGHTS
| | | Investment Operations: |
| | Net Asset
Value,
Beginning
of Period | Net
Investment
Income/(Loss) | Net
Realized
and
Unrealized
Gain/(Loss) from
Investments | Total from
Investment
Operations |
| Steward Large Cap Core Fund | | | | |
| Class A | | | | |
| Year ended April 30, 2023 | $21.54 | $0.15 (d) | $(0.07) (e) | $ 0.08 |
| Period ended April 30, 2022(f) | 25.00 | 0.05 | (3.49) | (3.44) |
| Institutional Class | | | | |
| Year ended April 30, 2023 | $21.56 | $0.21 (d) | $(0.07) (e) | $ 0.14 |
| Period ended April 30, 2022(f) | 25.00 | 0.07 | (3.48) | (3.41) |
| Steward Large Cap Growth Fund | | | | |
| Class A | | | | |
| Year ended April 30, 2023 | $20.65 | $0.06 (d) | $(0.03) (e) | $ 0.03 |
| Period ended April 30, 2022(f) | 25.00 | — (d)(g) | (4.34) | (4.34) |
| Institutional Class | | | | |
| Year ended April 30, 2023 | $20.68 | $0.11 (d) | $(0.03) (e) | $ 0.08 |
| Period ended April 30, 2022(f) | 25.00 | 0.02 (d) | (4.33) | (4.31) |
| Steward Large Cap Value Fund | | | | |
| Class A | | | | |
| Year ended April 30, 2023 | $22.89 | $0.30 (d) | $(0.20) | $ 0.10 |
| Period ended April 30, 2022(f) | 25.00 | 0.09 | (2.15) | (2.06) |
| Institutional Class | | | | |
| Year ended April 30, 2023 | $22.92 | $0.37 (d) | $(0.21) | $ 0.16 |
| Period ended April 30, 2022(f) | 25.00 | 0.16 | (2.19) | (2.03) |
| Steward Select Bond Fund | | | | |
| Class A | | | | |
| Year ended April 30, 2023 | $22.59 | $0.34 (d) | $(0.40) | $(0.06) |
| Year ended April 30, 2022 | 25.05 | 0.28 | (2.46) | (2.18) |
| Year ended April 30, 2021 | 25.38 | 0.34 (d) | (0.33) | 0.01 |
| Year ended April 30, 2020 | 24.36 | 0.47 (d) | 1.03 | 1.50 |
| Year ended April 30, 2019 | 23.96 | 0.49 | 0.39 | 0.88 |
| Class C | | | | |
| Year ended April 30, 2023 | $25.62 | $0.24 (d) | $(0.53) | $(0.29) |
| Year ended April 30, 2022 | 28.38 | 0.06 | (2.75) | (2.69) |
| Year ended April 30, 2021 | 28.84 | 0.24 (d) | (0.50) | (0.26) |
| Year ended April 30, 2020(h) | 29.13 | — (d)(g) | 0.12 | 0.12 |
| Year ended April 30, 2019(h) | 28.71 | — (g) | 0.42 | 0.42 |
| Class R6 | | | | |
| Year ended April 30, 2023 | $25.10 | $0.40 (d) | $(0.42) | $(0.02) |
| Year ended April 30, 2022 | 27.97 | 0.34 | (2.86) | (2.52) |
| Year ended April 30, 2021 | 28.72 | — (d)(g) | (0.29) | (0.29) |
| Year ended April 30, 2020(h) | 28.98 | — (d)(g) | 0.31 | 0.31 |
| Year ended April 30, 2019(h) | 28.56 | — (g) | 0.42 | 0.42 |
| Institutional Class | | | | |
| Year ended April 30, 2023 | $22.45 | $0.38 (d) | $(0.38) | $ — |
| Year ended April 30, 2022 | 24.90 | 0.32 | (2.44) | (2.12) |
| Year ended April 30, 2021 | 25.28 | 0.39 (d) | (0.32) | 0.07 |
| Year ended April 30, 2020 | 24.25 | 0.55 (d) | 1.03 | 1.58 |
| Year ended April 30, 2019 | 23.85 | 0.55 | 0.40 | 0.95 |
Amounts designated as "—" are $0 or have been rounded to $0.
| (a) | Not annualized for periods less than one year. |
| (b) | Annualized for periods less than one year. |
| (c) | Portfolio turnover is calculated on the basis of the Fund, as a whole, without distinguishing between the classes of shares issued. |
| (d) | Calculated based on average shares outstanding. |
| (e) | Realized and unrealized gains and losses per share in this caption are balancing amounts necessary to reconcile the change in net asset value per share for the period, and may not reconcile with the aggregate gains and losses in the Statement of Operations due to share transactions for the period. |
| (f) | For the period November 15, 2021 (commencement of operations) through April 30, 2022. |
| (g) | Expressed as ‘‘—’’ as the income and/or expenses accrued for the class were considered immaterial for presentation purposes relative to the size of the class. |
| (h) | Effective March 9, 2020, the share class had a one-for-two reverse stock split. Share amounts for the periods have been adjusted to give effect to the one-for-two stock split. |
See notes to financial statements.
| Distributions: | | | Supplemental data and ratios: |
Net
Investment
Income | Total
Distributions | Net Asset
Value, End
of Period | Total
Return(a) | Net Assets,
End of Period
(000's) | Ratio of
Expenses to
Average Net
Assets
Prior to
Waivers (b) | Ratio of
Expenses to
Average Net
Assets
Net of
Waivers(b) | Ratio of Net
Investment
Income/(Loss)
to Average
Net Assets(b) | Portfolio
Turnover
Rate(a)(c) |
| | | | | | | | | |
| | | | | | | | | |
| $(0.17) | $(0.17) | $21.45 | 0.44% | $ 490 | 1.23% | 1.00% | 0.71% | 79% |
| (0.02) | (0.02) | 21.54 | (13.81) | 313 | 1.73 | 1.00 | 0.61 | 35 |
| | | | | | | | | |
| $(0.20) | $(0.20) | $21.50 | 0.67% | $ 78,358 | 0.99% | 0.75% | 1.00% | 79% |
| (0.03) | (0.03) | 21.56 | (13.67) | 69,487 | 0.89 | 0.75 | 0.68 | 35 |
| | | | | | | | | |
| | | | | | | | | |
| $(0.05) | $(0.05) | $20.63 | 0.19% | $ 326 | 1.29% | 1.00% | 0.31% | 56% |
| (0.01) | (0.01) | 20.65 | (17.38) | 189 | 2.49 | 1.00 | (0.12) | 37 |
| | | | | | | | | |
| $(0.08) | $(0.08) | $20.68 | 0.41% | $ 74,556 | 1.04% | 0.75% | 0.55% | 56% |
| (0.01) | (0.01) | 20.68 | (17.24) | 42,789 | 0.99 | 0.75 | 0.15 | 37 |
| | | | | | | | | |
| | | | | | | | | |
| $(0.37) | $(0.37) | $22.62 | 0.45% | $ 640 | 1.28% | 1.00% | 1.36% | 110% |
| (0.05) | (0.05) | 22.89 | (8.27) | 328 | 2.01 | 1.00 | 1.13 | 62 |
| | | | | | | | | |
| $(0.39) | $(0.39) | $22.69 | 0.71% | $ 62,625 | 1.03% | 0.75% | 1.64% | 110% |
| (0.05) | (0.05) | 22.92 | (8.13) | 60,314 | 0.91 | 0.75 | 1.55 | 62 |
| | | | | | | | | |
| | | | | | | | | |
| $(0.33) | $(0.33) | $22.20 | (0.22)% | $ 2,740 | 0.96% | 0.96% | 1.52% | 10% |
| (0.28) | (0.28) | 22.59 | (8.79) | 3,832 | 0.92 | 0.92 | 1.12 | 20 |
| (0.34) | (0.34) | 25.05 | 0.04 | 5,989 | 0.94 | 0.94 | 1.34 | 24 |
| (0.48) | (0.48) | 25.38 | 6.21 | 9,234 | 0.99 | 0.99 | 1.87 | 22 |
| (0.48) | (0.48) | 24.36 | 3.72 | 10,115 | 0.95 | 0.95 | 1.97 | 25 |
| | | | | | | | | |
| $(0.23) | $(0.23) | $25.10 | (1.11)% | $ 129 | 1.73% | 1.73% | 0.95% | 10% |
| (0.07) | (0.07) | 25.62 | (9.49) | 4 | 1.83 | 1.83 | 0.22 | 20 |
| (0.20) | (0.20) | 28.38 | (0.90) | 5 | 1.12 | 1.12 | 0.85 | 24 |
| (0.41) | (0.41) | 28.84 | 2.08 | — | — (g) | — (g) | — (g) | 22 |
| — | — | 29.13 | 1.46 | — | — (g) | — (g) | — (g) | 25 |
| | | | | | | | | |
| $(0.39) | $(0.39) | $24.69 | (0.04)% | $ 1 | 0.80% | 0.80% | 1.64% | 10% |
| (0.35) | (0.35) | 25.10 | (9.11) | 1 | 0.74 | 0.74 | 1.26 | 20 |
| (0.46) | (0.46) | 27.97 | (1.04) | — | — (g) | — (g) | — (g) | 24 |
| (0.57) | (0.57) | 28.72 | 3.34 | — | — (g) | — (g) | — (g) | 22 |
| — | — | 28.98 | 1.47 | — | — (g) | — (g) | — (g) | 25 |
| | | | | | | | | |
| $(0.37) | $(0.37) | $22.08 | 0.04% | $152,266 | 0.74% | 0.74% | 1.75% | 10% |
| (0.33) | (0.33) | 22.45 | (8.62) | 146,882 | 0.72 | 0.72 | 1.31 | 20 |
| (0.45) | (0.45) | 24.90 | 0.26 | 181,279 | 0.70 | 0.70 | 1.54 | 24 |
| (0.55) | (0.55) | 25.28 | 6.60 | 142,421 | 0.65 | 0.65 | 2.24 | 22 |
| (0.55) | (0.55) | 24.25 | 4.05 | 152,356 | 0.66 | 0.66 | 2.28 | 25 |
See notes to financial statements.
STEWARD FUNDS
FINANCIAL HIGHLIGHTS
| | | Investment Operations: |
| | Net Asset
Value,
Beginning
of Period | Net
Investment
Income/(Loss) | Net
Realized
and
Unrealized
Gain/(Loss) from
Investments | Total from
Investment
Operations |
| Steward Small Cap Growth Fund | | | | |
| Class A | | | | |
| Year ended April 30, 2023 | $18.78 | $(0.13) (d) | $ (1.58) | $ (1.71) |
| Period ended April 30, 2022(e) | 25.00 | (0.03) | (6.19) | (6.22) |
| Institutional Class | | | | |
| Year ended April 30, 2023 | $18.80 | $(0.09) (d) | $ (1.58) | $ (1.67) |
| Period ended April 30, 2022(e) | 25.00 | (0.02) | (6.17) | (6.19) |
| Steward Values-Focused Large Cap Enhanced Index Fund | | | | |
| Class A | | | | |
| Year ended April 30, 2023 | $40.35 | $ 0.28(d) | $ (0.77)(f) | $ (0.49) |
| Year ended April 30, 2022 | 53.12 | 0.20 (d) | 2.06 | 2.26 |
| Year ended April 30, 2021 | 39.31 | 0.35 (d) | 17.55 | 17.90 |
| Year ended April 30, 2020 | 43.28 | 0.51 (d) | (3.41) | (2.90) |
| Year ended April 30, 2019 | 41.50 | 0.47 | 3.24 | 3.71 |
| Class C | | | | |
| Year ended April 30, 2023 | $34.56 | $(0.01) (d)(g) | $ (0.77)(f) | $ (0.78) |
| Year ended April 30, 2022 | 47.63 | (0.13) (d) | 2.00 | 1.87 |
| Year ended April 30, 2021 | 35.97 | — (d)(h) | 15.64 | 15.64 |
| Year ended April 30, 2020(i) | 43.70 | — (d)(h) | (6.69) (f) | (6.69) |
| Year ended April 30, 2019(i) | 48.95 | — (h) | 2.30 | 2.30 |
| Class R6 | | | | |
| Year ended April 30, 2023 | $35.13 | $ 0.32(d) | $ (0.76)(f) | $ (0.44) |
| Year ended April 30, 2022 | 47.97 | 0.36 (d) | 2.02 | 2.38 |
| Year ended April 30, 2021 | 35.83 | 0.51 (d) | 15.92 | 16.43 |
| Year ended April 30, 2020(i) | 42.75 | 0.66 (d) | (6.40) | (5.74) |
| Year ended April 30, 2019(i) | 48.80 | 0.20 | 2.30 | 2.50 |
| Institutional Class | | | | |
| Year ended April 30, 2023 | $40.18 | $ 0.35(d) | $ (0.73)(f) | $ (0.38) |
| Year ended April 30, 2022 | 52.95 | 0.33 (d) | 2.07 | 2.40 |
| Year ended April 30, 2021 | 39.23 | 0.45 (d) | 17.54 | 17.99 |
| Year ended April 30, 2020 | 43.16 | 0.65 (d) | (3.42) | (2.77) |
| Year ended April 30, 2019 | 41.34 | 0.60 | 3.23 | 3.83 |
Amounts designated as "—" are $0 or have been rounded to $0.
| (a) | Not annualized for periods less than one year. |
| (b) | Annualized for periods less than one year. |
| (c) | Portfolio turnover is calculated on the basis of the Fund, as a whole, without distinguishing between the classes of shares issued. |
| (d) | Calculated based on average shares outstanding. |
| (e) | For the period November 15, 2021 (commencement of operations) through April 30, 2022. |
| (f) | Realized and unrealized gains and losses per share in this caption are balancing amounts necessary to reconcile the change in net asset value per share for the period, and may not reconcile with the aggregate gains and losses in the Statement of Operations due to share transactions for the period. |
| (g) | The amount shown for a share outstanding throughout the period may not correlate with the Statement of Operations for the period due to timing of sales and redemptions of Fund shares in relation to income earned and/or fluctuating market value of the investments of the Fund. |
| (h) | Expressed as ‘‘—’’ as the income and/or expenses accrued for the class were considered immaterial for presentation purposes relative to the size of the class. |
| (i) | Effective March 9, 2020, the share class had a one-for-five reverse stock split. Share amounts for the periods have been adjusted to give effect to the one-for-five stock split. |
See notes to financial statements.
| Distributions: | | | Supplemental data and ratios: |
Net
Investment
Income | Capital
Gains | Total
Distributions | Net Asset
Value, End
of Period | Total
Return(a) | Net Assets,
End of Period
(000's) | Ratio of
Expenses to
Average Net
Assets
Prior to
Waivers (b) | Ratio of
Expenses to
Average Net
Assets
Net of
Waivers(b) | Ratio of Net
Investment
Income/(Loss)
to Average
Net Assets(b) | Portfolio
Turnover
Rate(a)(c) |
| | | | | | | | | | |
| | | | | | | | | | |
| $ — | $ — | $ — | $17.07 | (9.15)% | $ 170 | 1.81% | 1.25% | (0.76)% | 27% |
| — | — | — | 18.78 | (24.83) | 167 | 2.88 | 1.25 | (0.90) | 25 |
| | | | | | | | | | |
| $ — | $ — | $ — | $17.13 | (8.88)% | $ 24,810 | 1.57% | 1.00% | (0.51)% | 27% |
| (0.01) | — | (0.01) | 18.80 | (24.77) | 31,154 | 1.31 | 1.00 | (0.34) | 25 |
| | | | | | | | | | |
| | | | | | | | | | |
| $(0.03) | $(12.64) | $(12.67) | $27.19 | 1.41% | $ 9,708 | 0.84% | 0.84% | 0.84% | 8% |
| (0.19) | (14.84) | (15.03) | 40.35 | 1.19 | 11,640 | 0.84 | 0.84 | 0.38 | 35 |
| (0.35) | (3.74) | (4.09) | 53.12 | 47.01 | 28,751 | 0.82 | 0.82 | 0.75 | 32 |
| (0.40) | (0.67) | (1.07) | 39.31 | (6.91) | 39,094 | 0.84 | 0.84 | 1.18 | 32 |
| (0.42) | (1.51) | (1.93) | 43.28 | 9.78 | 41,401 | 0.80 | 0.80 | 1.09 | 27 |
| | | | | | | | | | |
| $(0.06) | $(12.64) | $(12.70) | $21.08 | 0.68% | $ 36 | 1.67% | 1.67% | (0.03)% | 8% |
| (0.10) | (14.84) | (14.94) | 34.56 | 0.43 | 3 | 1.54 | 1.54 | (0.29) | 35 |
| (0.24) | (3.74) | (3.98) | 47.63 | 44.88 | — | — (h) | — (h) | — (h) | 32 |
| (0.37) | (0.67) | (1.04) | 35.97 | (9.02) | — | — (h) | — (h) | — (h) | 32 |
| — | (7.55) | (7.55) | 43.70 | 8.13 | — | — (h) | — (h) | — (h) | 27 |
| | | | | | | | | | |
| $(0.07) | $(12.64) | $(12.71) | $21.98 | 1.82% | $ 538 | 0.52% | 0.52% | 1.16% | 8% |
| (0.38) | (14.84) | (15.22) | 35.13 | 1.55 | 528 | 0.49 | 0.49 | 0.79 | 35 |
| (0.55) | (3.74) | (4.29) | 47.97 | 47.55 | 520 | 0.45 | 0.45 | 1.23 | 32 |
| (0.51) | (0.67) | (1.18) | 35.83 | (6.63) | 49,643 | 0.46 | 0.46 | 1.60 | 32 |
| (1.00) | (7.55) | (8.55) | 42.75 | 8.70 | 55,924 | 0.46 | 0.46 | 1.20 | 27 |
| | | | | | | | | | |
| $(0.05) | $(12.64) | $(12.69) | $27.11 | 1.73% | $199,959 | 0.61% | 0.61% | 1.07% | 8% |
| (0.33) | (14.84) | (15.17) | 40.18 | 1.45 | 206,747 | 0.58 | 0.58 | 0.64 | 35 |
| (0.53) | (3.74) | (4.27) | 52.95 | 47.40 | 368,701 | 0.55 | 0.55 | 0.97 | 32 |
| (0.49) | (0.67) | (1.16) | 39.23 | (6.61) | 306,875 | 0.52 | 0.52 | 1.51 | 32 |
| (0.50) | (1.51) | (2.01) | 43.16 | 10.13 | 328,404 | 0.50 | 0.50 | 1.39 | 27 |
See notes to financial statements.
STEWARD FUNDS
FINANCIAL HIGHLIGHTS
| | | Investment Operations: |
| | Net Asset
Value,
Beginning
of Period | Net
Investment
Income/(Loss) | Net
Realized
and
Unrealized
Gain/(Loss) from
Investments | Total from
Investment
Operations |
| Steward Values-Focused Small-Mid Cap Enhanced Index Fund | | | | |
| Class A | | | | |
| Year ended April 30, 2023 | $14.33 | $0.12 (d) | $(0.39) | $(0.27) |
| Year ended April 30, 2022 | 17.52 | 0.07 | (0.99) | (0.92) |
| Year ended April 30, 2021 | 10.54 | 0.04 (d) | 7.49 | 7.53 |
| Year ended April 30, 2020 | 13.94 | 0.07 (d) | (2.91) | (2.84) |
| Year ended April 30, 2019 | 15.70 | 0.09 | 0.03 (e) | 0.12 |
| Class C | | | | |
| Year ended April 30, 2023 | $12.88 | $0.10 (d) | $(0.35) | $(0.25) |
| Year ended April 30, 2022 | 16.14 | 0.04 | (1.00) | (0.96) |
| Year ended April 30, 2021 | 9.84 | — (d)(f) | 6.81 | 6.81 |
| Year ended April 30, 2020(g) | 13.64 | — (d)(f) | (3.27) | (3.27) |
| Year ended April 30, 2019(g) | 17.52 | — (f) | (0.32) | (0.32) |
| Class R6 | | | | |
| Year ended April 30, 2023 | $13.26 | $0.15 (d) | $(0.37) | $(0.22) |
| Year ended April 30, 2022 | 16.37 | 0.13 | (0.93) | (0.80) |
| Year ended April 30, 2021 | 9.87 | 0.08 (d) | 7.01 | 7.09 |
| Year ended April 30, 2020(g) | 13.56 | 0.14 (d) | (3.24) | (3.10) |
| Year ended April 30, 2019(g) | 17.48 | — (f) | (0.36) | (0.36) |
| Institutional Class | | | | |
| Year ended April 30, 2023 | $14.67 | $0.15 (d) | $(0.41) | $(0.26) |
| Year ended April 30, 2022 | 17.87 | 0.12 | (1.02) | (0.90) |
| Year ended April 30, 2021 | 10.74 | 0.07 (d) | 7.65 | 7.72 |
| Year ended April 30, 2020 | 14.19 | 0.11 (d) | (2.98) | (2.87) |
| Year ended April 30, 2019 | 15.93 | 0.13 | 0.04 (e) | 0.17 |
Amounts designated as "—" are $0 or have been rounded to $0.
| (a) | Not annualized for periods less than one year. |
| (b) | Annualized for periods less than one year. |
| (c) | Portfolio turnover is calculated on the basis of the Fund, as a whole, without distinguishing between the classes of shares issued. |
| (d) | Calculated based on average shares outstanding. |
| (e) | Realized and unrealized gains and losses per share in this caption are balancing amounts necessary to reconcile the change in net asset value per share for the period, and may not reconcile with the aggregate gains and losses in the Statement of Operations due to share transactions for the period. |
| (f) | Expressed as ‘‘—’’ as the income and/or expenses accrued for the class were considered immaterial for presentation purposes relative to the size of the class. |
| (g) | Effective March 9, 2020, the share class had a one-for-two reverse stock split. Share amounts for the periods have been adjusted to give effect to the one-for-two stock split. |
See notes to financial statements.
| Distributions: | | | Supplemental data and ratios: |
Net
Investment
Income | Capital
Gains | Total
Distributions | Net Asset
Value, End
of Period | Total
Return(a) | Net Assets,
End of Period
(000's) | Ratio of
Expenses to
Average
Net Assets (b) | Ratio of Net
Investment
Income/(Loss)
to Average
Net Assets(b) | Portfolio
Turnover
Rate(a)(c) | |
| | | | | | | | | | |
| | | | | | | | | | |
| $(0.09) | $(3.00) | $(3.09) | $10.97 | (1.44)% | $ 41,713 | 0.83% | 0.79% | 20% | |
| (0.09) | (2.18) | (2.27) | 14.33 | (6.35) | 47,599 | 0.80 | 0.39 | 33 | |
| (0.06) | (0.49) | (0.55) | 17.52 | 72.56 | 64,997 | 0.78 | 0.31 | 36 | |
| (0.10) | (0.46) | (0.56) | 10.54 | (21.24) | 50,646 | 0.81 | 0.58 | 28 | |
| (0.10) | (1.78) | (1.88) | 13.94 | 3.18 | 71,719 | 0.81 | 0.56 | 33 | |
| | | | | | | | | | |
| $(0.13) | $(3.00) | $(3.13) | $ 9.50 | (1.44)% | $ 12 | 0.83% | 0.78% | 20% | |
| (0.12) | (2.18) | (2.30) | 12.88 | (7.20) | 1 | 0.89 | 0.46 | 33 | |
| (0.01) | (0.50) | (0.51) | 16.14 | 70.10 | — | — (f) | — (f) | 36 | |
| (0.07) | (0.46) | (0.53) | 9.84 | (22.17) | — | — (f) | — (f) | 28 | |
| — | (3.56) | (3.56) | 13.64 | 2.55 | — | — (f) | — (f) | 33 | |
| | | | | | | | | | |
| $(0.13) | $(3.00) | $(3.13) | $ 9.91 | (1.13)% | $ 311 | 0.54% | 1.08% | 20% | |
| (0.13) | (2.18) | (2.31) | 13.26 | (6.09) | 402 | 0.53 | 0.67 | 33 | |
| (0.10) | (0.49) | (0.59) | 16.37 | 73.12 | 125 | 0.47 | 0.52 | 36 | |
| (0.13) | (0.46) | (0.59) | 9.87 | (20.85) | 46 | 0.50 | 1.11 | 28 | |
| — | (3.56) | (3.56) | 13.56 | 2.27 | 3 | — (f) | — (f) | 33 | |
| | | | | | | | | | |
| $(0.11) | $(3.00) | $(3.11) | $11.30 | (1.28)% | $125,240 | 0.65% | 0.97% | 20% | |
| (0.12) | (2.18) | (2.30) | 14.67 | (6.15) | 138,771 | 0.61 | 0.57 | 33 | |
| (0.09) | (0.50) | (0.59) | 17.87 | 73.00 | 208,505 | 0.57 | 0.51 | 36 | |
| (0.12) | (0.46) | (0.58) | 10.74 | (21.05) | 140,792 | 0.55 | 0.86 | 28 | |
| (0.13) | (1.78) | (1.91) | 14.19 | 3.51 | 153,576 | 0.53 | 0.84 | 33 | |
See notes to financial statements.
STEWARD FUNDS
NOTES TO FINANCIAL STATEMENTS — April 30, 2023
Steward Funds, Inc. (‘‘SFI’’), a Maryland corporation, is registered under the Investment Company Act of 1940, as amended (the ‘‘1940 Act’’), as a diversified open-end management investment company. As of April 30, 2023, SFI is composed of eleven separate operational funds, each a series of SFI (each a ‘‘Fund’’ and collectively the ‘‘Funds’’). The accompanying financial statements are presented for the following eleven Funds:
Steward Covered Call Income Fund
Steward Equity Market Neutral Fund
Steward Global Equity Income Fund
Steward International Enhanced Index Fund
Steward Large Cap Core Fund
Steward Large Cap Growth Fund
Steward Large Cap Value Fund
Steward Select Bond Fund
Steward Small Cap Growth Fund
Steward Values-Focused Large Cap Enhanced Index Fund
Steward Values-Focused Small-Mid Cap Enhanced Index Fund
Each Fund currently offers four classes of shares: ‘‘Class A’’, ‘‘Class C’’, ‘‘Class R6’’, and ‘‘Institutional Class’’ (each a ‘‘Class’’ and collectively the ‘‘Classes’’).* Each Class of shares has equal rights as to earnings, assets and voting privileges, except that each Class has a different expense structure. Each Class of shares has exclusive voting rights with respect to matters that affect just that Class or on which the interests of the Class differ from the interests of the other Classes. Income and realized and unrealized gains and losses on investments are allocated to each Class of shares based on its relative net assets.
*Class C shares and Class R6 shares of the Steward Equity Market Neutral Fund, Steward Large Cap Core Fund, Steward Large Cap Growth Fund, Steward Large Cap Value Fund and Steward Small Cap Growth Fund are not currently available for purchase.
| Note 2 | — | Investment Objectives and Strategies: |
Steward Covered Call Income Fund seeks to provide dividend income and options premium income, with the potential for capital appreciation and less volatility than the broad equity market. The Fund invests primarily in common stocks of large capitalization U.S. companies, most of which pay dividends, with sufficient liquidity and option market interest to suggest that call options can readily be written on those securities. The Fund writes (sells) covered call options on those securities with the overall goal of providing options premium income and lowering volatility of the Fund’s portfolio when compared to the broader uncovered large capitalization securities market.
Steward Equity Market Neutral Fund seeks to provide long-term capital appreciation independent of the U.S. equity market. The Fund invests primarily in long and short positions in equity securities of large capitalization companies.
Steward Global Equity Income Fund seeks to provide current income along with growth of capital. The Fund invests primarily in U.S. and non-U.S. dividend-paying common stocks of large, medium and small capitalization companies that represent a broad spectrum of the global economy. The Fund’s non-U.S. investments will be primarily in the form of depositary receipts (‘‘DRs’’) or dual listed securities, or U.S. dollar-denominated instruments representing securities of non-U.S. issuers that are traded in the U.S. or in non-U.S. markets.
Steward International Enhanced Index Fund seeks to provide long-term capital appreciation. The Fund invests primarily in DRs or dual listed securities representing securities of companies located or domiciled outside of the United States and allocates selectively between securities of developed market companies and emerging market companies.
Steward Large Cap Core Fund seeks to provide long-term capital appreciation. The Fund invests primarily in equity securities of large capitalization companies.
Steward Large Cap Growth Fund seeks to provide long-term capital appreciation. The Fund invests primarily in equity securities of large capitalization growth companies.
Steward Large Cap Value Fund seeks to provide long-term capital appreciation. The Fund invests primarily in equity securities of large capitalization value companies.
Steward Select Bond Fund seeks to provide high current income with capital appreciation. The Fund invests primarily in fixed income securities, such as corporate bonds, mortgage-backed securities and government and agency bonds and notes.
Steward Small Cap Growth Fund seeks to provide long-term capital appreciation. The Fund invests primarily in equity securities of small capitalization growth companies.
Steward Values-Focused Large Cap Enhanced Index Fund seeks to provide long-term capital appreciation. The Fund invests primarily in common stocks of large capitalization companies that represent a broad spectrum of the United States economy. The Fund’s investments are allocated in an attempt to match the weightings of the Fund’s benchmark index, subject to the application of the Fund’s values-based screens and the reallocation of a portion of each screened security’s weighting in the benchmark index among certain remaining securities of companies that portfolio management believes exhibit positive values-based characteristics.
Steward Values-Focused Small-Mid Cap Enhanced Index Fund seeks to provide long-term capital appreciation. The Fund invests primarily in common stocks of small and medium capitalization companies that represent a broad spectrum of the United States economy. The Fund’s investments are allocated in an attempt to match the weightings of the Fund’s benchmark index, subject to the application of the Fund’s values-based screens and the reallocation of a portion of each screened security’s weighting in the benchmark index among certain remaining securities of companies that portfolio management believes exhibit positive values-based characteristics.
In pursuing their investment objectives, the Funds apply a comprehensive set of values-based screens to all of their portfolio investments.
| Note 3 | — | Significant Accounting Policies: |
SFI follows the investment company accounting and reporting guidance under Financial Accounting Standards Board (‘‘FASB’’) Accounting Standards Codification (‘‘ASC’’) Topic 946 Financial Services — Investment Companies. The preparation of financial statements in conformity with accounting principles generally accepted in the United States of America (‘‘GAAP’’) requires management to make estimates and assumptions that affect the reported amounts of assets and liabilities and disclosure of contingent assets and liabilities at the date of the financial statements and the reported amounts of income and expenses during the reporting period. Actual results could differ materially from those estimates. The following summarizes the significant accounting policies of the Funds.
Portfolio Valuation: Fund investments are recorded at fair value. Effective September 8, 2022 and in accordance with of Rule 2a-5 under the 1940 Act, the Funds’ Board of Directors (the “Board”) designated the Funds’ investment adviser, Crossmark Global Investments, Inc. (“Crossmark Global Investments” or the “Adviser”), to serve as the valuation designee to perform fair value determinations for applicable Fund investments and approved the Adviser’s valuation procedures for the Funds. Fund investments are valued using various valuation methodologies, including the following:
Equity securities listed on a domestic exchange are valued at the official closing price or last trade price, or the last bid price if there was no trade that day. Equity securities traded on The NASDAQ Stock Market LLC (“NASDAQ”) use the official closing price, if available, and otherwise, use the last trade price, or the last bid price if there was no trade on that day. Equity securities that are traded in the over-the-counter market only, but that are not included on NASDAQ, are valued at the last trade price. Equity securities listed on a foreign exchange are valued at the official closing price or last trade price, or, if there was no trade that day, the last bid price or the mean of the last bid and asked prices, depending on the exchange. American Depositary Receipts (ADRs) and Global Depositary Receipts (GDRs) listed on an exchange are priced at the official closing price or the last trade price. Open-end money market mutual funds are valued at net asset value per share. Exchange-traded equity options are valued at the (i) settlement price (official closing price) or last trade price, or, (ii) if there was no trade that day, at the mean of the last bid and asked prices. Prices are generally provided by approved third-party pricing services.
Domestic fixed income securities, including short-term instruments, are priced at an evaluated bid price provided by an approved third-party pricing service. Foreign fixed income securities are priced at the mean of evaluated bid and asked prices provided by an approved third-party pricing service. Third-party pricing services typically use information provided by market makers or estimates of market values obtained from yield data relating to investments or securities with similar characteristics. The service providers’ internal models use inputs that are observable such as,among other things, issuer details, interest rates, yield curves, prepayment speeds, credit risks/spreads, default rates and quotedprices for similar assets. Short-term debt obligations (those with remaining maturities of 60 days or less) are valued at amortized cost.
If a Fund investment cannot be valued in accordance with the above valuation methodologies or other routine valuation methodologies established by the Adviser, the Adviser’s Valuation Committee will value the investment in accordance with the Adviser’s valuation procedures.
GAAP establishes a fair value hierarchy for inputs used in measuring fair value that maximizes the use of observable inputs and minimizes the use of unobservable inputs by requiring that the most observable inputs be used when available. Observable inputs are those that market participants would use in pricing the asset or liability based on market data obtained from sources independent of the Funds. Unobservable inputs reflect the Funds’ assumptions about the inputs market participants would use in pricing the asset or liability developed based on the best information available in the circumstances.
The fair value hierarchy is categorized into three levels based on the inputs as follows:
Level 1 — Quoted prices in active markets for identical securities and net asset values for money market funds.
Level 2 — Other significant observable inputs other than Level 1 quoted prices (including, but not limited to, quoted prices for similar securities, interest rates, prepayment speeds and credit risks).
Level 3 — Significant unobservable inputs (including the Funds’ own assumptions in determining the fair value of investments).
Pursuant to the Adviser's valuation procedures, equity securities and written options contracts are generally categorized as Level 1 securities in the fair value hierarchy (unless there is a fair valuation event, in which case affected securities are generally categorized as Level 2). Debt securities are generally categorized as Level 2 securities in the fair value hierarchy. Money market funds are generally categorized as Level 1 securities in the fair value hierarchy. Changes in valuation techniques may result in transfers in or out of an assigned level within the fair value hierarchy.
The following table presents a summary of inputs used to value the Funds’ investments as of April 30, 2023:
| | | Investments in Securities |
| Fund | | LEVEL 1 | | LEVEL 2 | | LEVEL 3 | | Total |
| Steward Covered Call Income Fund | | | | | | | | |
| Assets: | | | | | | | | |
| Security Type | | | | | | | | |
Common Stocks*
| | $ 57,663,901 | | $ — | | $ — | | $ 57,663,901 |
Money Market Fund
| | 336,163 | | — | | — | | 336,163 |
Total Assets - Investments
| | $ 58,000,064 | | $ — | | $ — | | $ 58,000,064 |
| | |
| | | | | | | | |
| | | | | | | | |
| Liabilities: | | | | | | | |
| Other Financial Instruments^ | | | | | | | |
Written Call Options
| $ (2,386,941) | | $ — | | $ — | | $ (2,386,941) |
Total Liabilities - Other Financial Instruments
| $ (2,386,941) | | $ — | | $ — | | $ (2,386,941) |
| | |
| | | | | | | | |
| Steward Equity Market Neutral Fund | | | | | | | |
| Assets: | | | | | | | |
| Security Type | | | | | | | |
Common Stocks*
| $ 60,784,800 | | $ — | | $ — | | $ 60,784,800 |
Money Market Funds
| 9,598,360 | | — | | — | | 9,598,360 |
Total Assets - Investments
| $ 70,383,160 | | $ — | | $ — | | $ 70,383,160 |
| | |
| | | | | | | | |
| | | | | | | | |
| Liabilities: | | | | | | | |
| Security Type | | | | | | | |
Common Stocks Sold Short*
| $ (54,489,907) | | $ — | | $ — | | $ (54,489,907) |
Total Liabilities - Securities Sold Short
| $ (54,489,907) | | $ — | | $ — | | $ (54,489,907) |
| | |
| | | | | | | | |
| Steward Global Equity Income Fund | | | | | | | |
| Assets: | | | | | | | |
| Security Type | | | | | | | |
Common Stocks*
| $ 348,527,844 | | $ — | | $ — | | $ 348,527,844 |
Money Market Fund
| 3,417,784 | | — | | — | | 3,417,784 |
Total Assets - Investments
| $ 351,945,628 | | $ — | | $ — | | $ 351,945,628 |
| | | Investments in Securities |
| Fund | | LEVEL 1 | | LEVEL 2 | | LEVEL 3 | | Total |
| Steward International Enhanced Index Fund | | | | | | | | |
| Assets: | | | | | | | | |
| Security Type | | | | | | | | |
Common Stocks*
| | $ 209,855,446 | | $ 378,070 | | $ — | | $ 210,233,516 |
Master Limited Partnerships*
| | 663,511 | | — | | — | | 663,511 |
Preferred Stocks*
| | 3,088,552 | | — | | — | | 3,088,552 |
Money Market Fund
| | 223,379 | | — | | — | | 223,379 |
Total Assets - Investments
| | $ 213,830,888 | | $ 378,070 | | $ — | | $ 214,208,958 |
| | |
| | | | | | | | |
| Steward Large Cap Core Fund | | | | | | | |
| Assets: | | | | | | | |
| Security Type | | | | | | | |
Common Stocks*
| $ 78,804,166 | | $ — | | $ — | | $ 78,804,166 |
Money Market Fund
| 160,052 | | — | | — | | 160,052 |
Total Assets - Investments
| $ 78,964,218 | | $ — | | $ — | | $ 78,964,218 |
| | |
| | | | | | | | |
| Steward Large Cap Growth Fund | | | | | | | |
| Assets: | | | | | | | |
| Security Type | | | | | | | |
Common Stocks*
| $ 74,894,419 | | $ — | | $ — | | $ 74,894,419 |
Money Market Fund
| 191,612 | | — | | — | | 191,612 |
Total Assets - Investments
| $ 75,086,031 | | $ — | | $ — | | $ 75,086,031 |
| | |
| | | | | | | | |
| Steward Large Cap Value Fund | | | | | | | |
| Assets: | | | | | | | |
| Security Type | | | | | | | |
Common Stocks*
| $ 63,211,242 | | $ — | | $ — | | $ 63,211,242 |
Money Market Fund
| 119,549 | | — | | — | | 119,549 |
Total Assets - Investments
| $ 63,330,791 | | $ — | | $ — | | $ 63,330,791 |
| | |
| | | | | | | | |
| Steward Select Bond Fund | | | | | | | |
| Assets: | | | | | | | |
| Security Type | | | | | | | |
Asset-Backed Securities
| $ — | | $ 28,944 | | $ — | | $ 28,944 |
Corporate Bonds*
| — | | 92,573,544 | | — | | 92,573,544 |
Municipal Bonds
| — | | 4,898,582 | | — | | 4,898,582 |
U.S. Government Agencies
| — | | 42,726,050 | | — | | 42,726,050 |
U.S. Government Agency Mortgage-Backed Obligations
| — | | 6,561,495 | | — | | 6,561,495 |
U.S. Treasury Obligations
| — | | 4,374,773 | | — | | 4,374,773 |
Money Market Fund
| 4,342,580 | | — | | — | | 4,342,580 |
Total Assets - Investments
| $ 4,342,580 | | $ 151,163,388 | | $ — | | $ 155,505,968 |
| | |
| | | | | | | | |
| Steward Small Cap Growth Fund | | | | | | | |
| Assets: | | | | | | | |
| Security Type | | | | | | | |
Common Stocks*
| $ 24,775,544 | | $ — | | $ — | | $ 24,775,544 |
Money Market Fund
| 219,677 | | — | | — | | 219,677 |
Total Assets - Investments
| $ 24,995,221 | | $ — | | $ — | | $ 24,995,221 |
| | | Investments in Securities |
| Fund | | LEVEL 1 | | LEVEL 2 | | LEVEL 3 | | Total |
| Steward Values-Focused Large Cap Enhanced Index Fund | | | | | | | | |
| Assets: | | | | | | | | |
| Security Type | | | | | | | | |
Common Stocks*
| | $ 209,749,138 | | $ — | | $ — | | $ 209,749,138 |
Rights*
| | — | | — | | — | ** | — |
Money Market Fund
| | 563,488 | | — | | — | | 563,488 |
Total Assets - Investments
| | $ 210,312,626 | | $ — | | $ — | | $ 210,312,626 |
| | |
| | | | | | | | |
| Steward Values-Focused Small-Mid Cap Enhanced Index Fund | | | | | | | |
| Assets: | | | | | | | |
| Security Type | | | | | | | |
Common Stocks*
| $ 166,726,165 | | $ — | | $ — | | $ 166,726,165 |
Rights*
| — | | — | | — | ** | — |
Money Market Fund
| 543,836 | | — | | — | | 543,836 |
Total Assets - Investments
| $ 167,270,001 | | $ — | | $ — | | $ 167,270,001 |
| * | Please refer to the Schedule of Portfolio Investments to view investments and securities sold short. |
| ** | Level 3 security has zero value. |
| ^ | Other Financial Instruments would include any derivative instruments, such as written options contracts. These investments are generally recorded in the financial statements at fair value.
|
As of April 30, 2023, there were no significant Level 3 holdings for the Funds.
Securities Transactions and Investment Income: Portfolio security transactions are recorded on the trade date. Net realized gains or losses on sales of securities are determined by the identified cost method. Interest income, adjusted for accretion of discounts and amortization of premiums, is recorded on the accrual basis. Debt obligations may be placed in non-accrual status and related interest income may be reduced by ceasing current accruals and writing off interest receivables when the collection of all or a portion of interest has become doubtful as identified by the Funds’ investment adviser. The treatment of such interest income may be different for federal income tax purposes. Discounts and premiums on securities purchased are amortized or accreted using the effective interest method. Dividend income is recorded on the ex-dividend date, or as soon as practical after a Fund determines the existence of a dividend declaration after exercising reasonable due diligence. Income and capital gains on some foreign securities may be subject to foreign withholdings taxes, which are accrued as applicable, and have been provided for in accordance with the Funds’ understanding of the applicable country’s tax rules and regulations.
Dividends and Distributions to Shareholders: Dividends from net investment income, if any, from Steward Equity Market Neutral Fund, Steward International Enhanced Index Fund, Steward Large Cap Core Fund, Steward Large Cap Growth Fund, Steward Large Cap Value Fund, Steward Small Cap Growth Fund, Steward Values-Focused Large Cap Enhanced Index Fund and Steward Values-Focused Small-Mid Cap Enhanced Index Fund are declared and paid annually and dividends from net investment income, if any, from Steward Covered Call Income Fund, Steward Global Equity Income Fund and Steward Select Bond Fund are declared and paid quarterly. All net realized long-term or short-term capital gains, if any, are declared and distributed at least annually.
Income dividends and capital gains distributions are recorded on the ex-dividend date and are determined in accordance with income tax regulations, which may differ from GAAP. These differences are primarily due to differing treatments of income, gains and losses on various investment securities held by the Funds, timing differences in the recognition of income, gains and losses and differing characterizations of distributions made by the Funds. To the extent they exceed net investment income and net realized capital gains for tax purposes, they are reported as distribution of capital.
Written Options Contracts: Steward Covered Call Income Fund may write (sell) covered call options. Premiums received from written options contracts are recorded as liabilities and are marked-to-market to reflect the current value of the options written. When writing an option, the Fund bears the market risk of unfavorable changes in the price of the underlying instrument.
The notional amount of written options outstanding at April 30, 2023 was $47,414,000. The monthly average notional amount for written options contracts for the year ended April 30, 2023 was $31,590,965. The net rebates are recognized as a component of investment income on the Statements of Operations.
Transactions in derivative instruments reflected on the Statements of Assets and Liabilities and Statements of Operations, categorized by risk exposure, as of April 30, 2023, are:
| | | | | Liability Derivatives | | |
| Fund | | Primary Risk Exposure | | Statements of Asset and
Liabilities Location | | Total Fair
Value |
Steward Covered Call Income Fund
| | Equity Risk Options Contracts
| | Written options at fair value | | $(2,386,941) |
| | | | | Realized Gain/(Loss) on
Derivatives Recognized
as a Result from
Operations | | Change in Unrealized
Appreciation/(Depreciation) on
Derivatives Recognized as
a Result from Operations |
| Fund | | Primary Risk Exposure | | Net realized gains on
options transactions | | Change in unrealized
depreciation on options
transactions |
Steward Covered Call Income Fund
| | Equity Risk
| | $3,867,068 | | $(1,067,116) |
Federal Income Taxes: The Funds intend to continue to qualify as regulated investment companies under Sub-Chapter M of the Internal Revenue Code and accordingly, will generally not be subject to federal and state income taxes or federal excise taxes to the extent that they intend to make sufficient distributions of net investment income and net realized capital gains.
As of and during the year ended April 30, 2023, the Funds did not have a liability for any unrecognized tax benefits. The Funds recognize interest and penalties, if any, related to unrecognized tax benefits as income tax expense in the Statements of Operations. During the period, the Funds did not incur any interest or penalties. For all open tax years, management of the Funds has concluded that there are no significant uncertain tax positions that would require recognition in the financial statements. Further, management of the Funds is not aware of any tax positions for which it is reasonably possible that the total amounts of any unrecognized tax benefits will significantly change over the next fiscal year.
Allocation of Expenses: Expenses directly attributable to a Fund or Class are charged directly to that Fund or Class, while expenses that are attributable to more than one Fund or Class are allocated among the respective Funds and their Classes based upon relative net assets or some other reasonable method.
Foreign Securities: Investments in securities of issuers in foreign countries involve risks not associated with domestic investments. These risks include, but are not limited to: (1) political and financial instability; (2) currency exchange rate fluctuations; (3) greater price volatility and less liquidity in particular securities and in certain foreign markets; (4) lack of uniform accounting, auditing and financial reporting standards; (5) less government regulation and supervision of some foreign stock exchanges, brokers and listed companies; (6) delays in transaction settlement in certain foreign markets; and (7) less availability of information. Securities of issuers in emerging and developing countries raise additional risks relative to investments in developed country issuers, including exposure to less mature and diversified economies and to less stable market and political systems, as well as to possible currency transfer restrictions, delays and disruptions in settlement of transactions, and higher volatility than found in developed countries.
Affiliated Securities Transactions: Pursuant to Rule 17a-7 under the 1940 Act, the Funds may engage in securities transactions with affiliated investment companies and advisory accounts managed by Crossmark Global Investments. Any such purchase or sale transaction must be effected without a brokerage commission or other remuneration, except for customary transfer fees. The transaction must be effected at the current market price, as described in the Portfolio Valuation Note above. During the year ended April 30, 2023, the Funds did not engage in any Rule 17a-7 transactions.
Short Sales: When Steward Equity Market Neutral Fund takes a short position, it sells at the current market price a stock it does not own but has borrowed in anticipation that the market price of the stock will decline. To complete, or close out, the short sale transaction, the Fund buys the same stock in the market and returns it to the lender. The price at such time may be more or less than the price at which the security was sold by the Fund. Until the security is replaced, the Fund is required to pay the lender amounts equal to any dividends or interest, which accrue during the period of the loan. To borrow the security, the Fund may also be required to pay a premium, which would increase the cost of the security sold.
The Fund may also incur stock loan fees which represent the cost of borrowing securities used for short sale transactions. The Fund may also earn rebates as an element of the custodian arrangement, which are recorded as an offset to stock loan fees on short sales transactions. The stock loan fees on short sales are recognized on the Statements of Operations. In the event that rebates exceed the stock loan fees on short sales, the net rebates are recognized as a component of investment income on the Statements of Operations.
When-Issued Securities: Steward Select Bond Fund may contract to purchase securities for a fixed price at a transaction date beyond the customary settlement period (i.e., ‘‘when issued”) consistent with the Fund's ability to manage its investment portfolio. No interest will be earned by the Fund on such purchases until the securities are delivered, however, the market value may change prior to delivery. When the Fund makes a commitment to purchase a security on a forward commitment basis, cash or liquid securities equal to the amount of such Fund’s commitments will be reserved for payment of the commitment.
| Note 4 | — | Investment Advisory and Other Agreements: |
Crossmark Global Investments, a wholly-owned subsidiary of Crossmark Global Holdings, Inc. (‘‘Crossmark Global Holdings’’), serves as investment adviser to the Funds. Crossmark Global Investments provides investment advisory services to investment companies, pension and profit sharing accounts, corporations and individuals. Subject to the authority of the Board, the Adviser provides the Funds with continuous investment advisory services in accordance with an investment advisory agreement between the Adviser and SFI, on behalf of the Funds. Crossmark Global Investments receives compensation for its services as investment adviser. The fee is accrued daily and paid monthly based on each Fund’s average daily net assets. Pursuant to the terms of the investment advisory agreement, Crossmark Global Investments has full discretion to manage the assets of the Funds in accordance with their investment objectives.
As compensation for its services as investment adviser, each Fund pays Crossmark Global Investments, on a monthly basis, an investment advisory fee calculated daily, based on the average daily net assets of the Fund, at the following annual rates:
| Steward Covered Call Income Fund | Steward Large Cap Value Fund |
| — 0.625% of the first $1 billion | — 0.50% of the first $1 billion |
| — 0.5625% of assets over $1 billion | — 0.45% of the next $1 billion |
| | — 0.40% of assets over $2 billion |
| Steward Equity Market Neutral Fund | Steward Select Bond Fund |
| — 1.00% of the first $1 billion | — 0.315% of the first $1 billion |
| — 0.90% of the next $1 billion | — 0.2835% of assets over $1 billion |
| — 0.80% of assets over $2 billion | |
| Steward Global Equity Income Fund | Steward Small Cap Growth Fund |
| — 0.625% of the first $1 billion | — 0.75% of the first $1 billion |
| — 0.5625% of assets over $1 billion | — 0.70% of the next $1 billion |
| | — 0.65% of assets over $2 billion |
| Steward International Enhanced Index Fund | Steward Values-Focused Large Cap
Enhanced Index Fund |
| — 0.365% of the first $1 billion | — 0.215% of the first $1 billion |
| — 0.3285% of assets over $1 billion | — 0.1935% of assets over $1 billion |
| Steward Large Cap Core Fund | Steward Values-Focused Small-Mid Cap
Enhanced Index Fund |
| — 0.50% of the first $1 billion | — 0.215% of the first $1 billion |
| — 0.45% of the next $1 billion | — 0.1935% of assets over $1 billion |
| — 0.40% of assets over $2 billion | |
| Steward Large Cap Growth Fund | |
| — 0.50% of the first $1 billion | |
| — 0.45% of the next $1 billion | |
| — 0.40% of assets over $2 billion | |
With respect to each Fund listed below, Crossmark Global Investments has entered into an expense limitation agreement. Under the terms of the agreement, to the extent that ordinary operating expenses incurred by each Class of a Fund in any fiscal year exceed the expense limit for such Class of the Fund, such excess amount will be the liability of the Adviser. Brokerage costs, interest, taxes, dividends on short positions, litigation and indemnification expenses, expenses associated with the investments in underlying
investment companies, and extraordinary expenses are excluded from the expense limitation agreement. The expense limitation agreement may be terminated by the Board at any time and will terminate automatically upon the termination of the Advisory Agreement. As of April 30, 2023, the contractual expense limitations were as follows:
| | | In effect through August 27, 2023 |
| Fund | | Class A | | Class C | | Class R6 | | Institutional Class |
Steward Covered Call Income Fund
| | 1.25% | | 2.00% | | 0.90% | | 1.00% |
Steward Equity Market Neutral Fund*
| | 2.25% | | N/A | | N/A | | 2.00% |
Steward Large Cap Core Fund*
| | 1.00% | | N/A | | N/A | | 0.75% |
Steward Large Cap Growth Fund*
| | 1.00% | | N/A | | N/A | | 0.75% |
Steward Large Cap Value Fund*
| | 1.00% | | N/A | | N/A | | 0.75% |
Steward Small Cap Growth Fund*
| | 1.25% | | N/A | | N/A | | 1.00% |
| | | | | | | | | |
| * | Class C and Class R6 shares of the Funds are not currently available for purchase. |
Steward Covered Call Income Fund, Steward Equity Market Neutral Fund, Steward Large Cap Core Fund, Steward Large Cap Growth Fund, Steward Large Cap Value Fund and Steward Small Cap Growth Fund have agreed to repay fees and expenses that were contractually waived or reimbursed by the Adviser for a period up to three fiscal years after the fiscal year in which such waiver or reimbursement was made to the extent such repayments would not cause the ordinary operating expenses of a Class to exceed the expense limitation in place at the time of the waiver or reimbursement or any expense limitation agreement in place at the time of repayment, whichever is lower. Any amounts repaid by the Fund and recouped by the Adviser during the year are reflected on the Statements of Operations as ‘��Recoupment of prior expenses reimbursed by the Adviser.’’
From time to time, the Adviser may voluntarily waive fees or reimburse expenses of a Fund. These voluntary waivers or reimbursements may be terminated at any time at the option of the Adviser. For the fiscal year ended April 30, 2023, the Adviser did not voluntarily waive or reimburse expenses of a Fund.
As of April 30, 2023, the amounts subject to repayment by the Funds in subsequent years under the expense limitation agreement and for voluntary waivers or reimbursements subject to recoupment were as follows:
| Fund | | Expires April 30, 2024 | | Expires April 30, 2025 | | Expires April 30, 2026 |
Steward Covered Call Income Fund
| | $314,550 | | $173,717 | | $201,684 |
Steward Equity Market Neutral Fund
| | N/A | | N/A | | N/A |
Steward Large Cap Core Fund
| | N/A | | 43,800 | | 172,245 |
Steward Large Cap Growth Fund
| | N/A | | 46,893 | | 171,362 |
Steward Large Cap Value Fund
| | N/A | | 41,105 | | 168,673 |
Steward Small Cap Growth Fund
| | N/A | | 44,894 | | 141,135 |
Crossmark Global Investments serves as the administrator of the Funds. For its administration and compliance services, Crossmark Global Investments receives a monthly fee from each Fund calculated at the annual rate of 0.075% of the first $1 billion of the average daily net assets of that Fund and 0.0675% of assets over $1 billion.
Crossmark Distributors, Inc. (‘‘Crossmark Distributors’’) serves as the distributor of the Funds’ shares. Crossmark Distributors is an affiliate of Crossmark Global Investments, and both are wholly-owned subsidiaries of Crossmark Global Holdings.
Each of the Funds has adopted a Service and Distribution Plan (the “Plan”) pursuant to Rule 12b-1 under the 1940 Act. The Plan allows each Fund, out of assets attributable to Class A shares, to compensate Crossmark Distributors at an annual rate of 0.25% for its services in connection with the sale and distribution of Class A shares and for services to Class A shareholders. The Plan allows each Fund, out of assets attributable to Class C shares, to compensate Crossmark Distributors at an annual rate of 1.00% for its services in connection with the sale and distribution of Class C shares and for services to Class C shareholders. Because these fees are paid out of Class A and Class C assets on an ongoing basis over time these fees will increase the cost of your investment in Class A and Class C shares and may cost you more than paying other types of sales charges. Institutional Class and Class R6 shares are not subject to the Plan.
Each of the Funds has also adopted a Sub-Accounting Services Plan with respect to its Class A, Class C and Institutional Class shares, which provides that each Fund shall reimburse Crossmark Distributors out of the assets of the Fund attributable to the applicable Class for payments by Crossmark Distributors to certain third party providers that assist in the servicing of certain group
accounts in which Fund shareholders of the applicable Class participate. For asset-based fee arrangements between Crossmark Distributors and third party providers, the amounts payable to Crossmark Distributors may not exceed, on an annual basis, 0.20% of the average daily net assets of the applicable Class of the Fund. For per-account arrangements between Crossmark Distributors and third party providers, the amounts payable to Crossmark Distributors may not exceed, on an annual basis, $20 per account. These fees are in addition to fees payable under the Service and Distribution Plan. Class R6 shares are not subject to the Sub-Accounting Services Plan.
Certain officers and directors of the Funds are also officers and/or directors of Crossmark Global Investments and/or Crossmark Distributors.
Effective January 1, 2023, Foreside Fund Officer Services, LLC ("Foreside") provides principal financial officer services to the Funds by making available a senior financial professional who serves as Treasurer of the Funds. Foreside receives a monthly fee from the Funds for the services provided and is also reimbursed by the Funds for certain out-of-pocket expenses. Effective March 8, 2023, Monique Labbe was appointed Treasurer of the Funds.
The Northern Trust Company (‘‘Northern Trust’’) acts as fund accounting and sub-administration services provider for each Fund. Under the terms of the Fund Administration and Accounting Services Agreement, Northern Trust is paid annual class fees which shall apply to each additional class of shares of each Fund that has more than a single share class, and is entitled to receive a monthly fee from each Fund calculated at the annual rate of 0.05% on the first $500 million of the Funds’ aggregate average daily net assets. The rate then declines to 0.04% on the next $500 million of aggregate average daily net assets, and to 0.03% on the next $1 billion of aggregate average daily net assets, and to 0.02% on aggregate average daily net assets over $2 billion thereafter subject to certain minimums and additional fees. Northern Trust receives additional fees for sub-administration services and reimbursement of certain expenses. Northern Trust also serves as the Funds’ transfer agent and is paid annual class and per account fees.
| Note 5 | — | Purchases and Sales of Securities: |
Purchases and sales of portfolio securities (excluding short-term securities and U.S. government securities) for the year ended April 30, 2023, were as follows:
| Fund | | Purchases | | Sales |
Steward Covered Call Income Fund
| | $ 65,736,712 | | $ 29,749,672 |
Steward Equity Market Neutral Fund
| | 121,107,995 | | 120,006,216 |
Steward Global Equity Income Fund
| | 238,037,090 | | 162,860,822 |
Steward International Enhanced Index Fund
| | 44,045,881 | | 36,719,805 |
Steward Large Cap Core Fund
| | 66,150,501 | | 57,381,827 |
Steward Large Cap Growth Fund
| | 62,610,579 | | 33,164,527 |
Steward Large Cap Value Fund
| | 69,216,726 | | 66,110,726 |
Steward Select Bond Fund
| | 7,987,700 | | 12,316,528 |
Steward Small Cap Growth Fund
| | 6,656,828 | | 10,459,083 |
Steward Values-Focused Large Cap Enhanced Index Fund
| | 17,097,825 | | 24,888,075 |
Steward Values-Focused Small-Mid Cap Enhanced Index Fund
| | 34,974,741 | | 48,543,999 |
Purchases and sales of U.S. government securities for the year ended April 30, 2023, were as follows:
| Fund | | Purchases | | Sales |
Steward Select Bond Fund
| | $ 14,371,500 | | $ 1,575,707 |
| Note 6 | — | Federal Income Tax Information: |
As of April 30, 2023, the cost, gross unrealized appreciation, gross unrealized depreciation and net unrealized appreciation/(depreciation) on investments, including written call options and short positions, for federal income tax purposes, were as follows:
| Fund | | Tax Cost of
Securities | | Unrealized
Appreciation | | Unrealized
Depreciation | | Net
Unrealized
Appreciation/(Depreciation) |
Steward Covered Call Income Fund
| | $ 60,413,130 | | $ 2,118,422 | | $ (6,918,429) | | $ (4,800,007) |
Steward Equity Market Neutral Fund
| | 13,586,566 | | 8,073,025 | | (5,766,338) | | 2,306,687 |
Steward Global Equity Income Fund
| | 339,173,565 | | 31,747,087 | | (18,975,024) | | 12,772,063 |
Steward International Enhanced Index Fund
| | 213,027,065 | | 23,613,246 | | (22,431,353) | | 1,181,893 |
Steward Large Cap Core Fund
| | 79,003,510 | | 4,357,167 | | (4,396,459) | | (39,292) |
Steward Large Cap Growth Fund
| | 75,511,556 | | 3,037,702 | | (3,463,227) | | (425,525) |
Steward Large Cap Value Fund
| | 63,059,911 | | 3,979,378 | | (3,708,498) | | 270,880 |
Steward Select Bond Fund
| | 170,167,481 | | 242,475 | | (14,903,988) | | (14,661,513) |
Steward Small Cap Growth Fund
| | 31,801,561 | | 2,096,382 | | (8,902,722) | | (6,806,340) |
Steward Values-Focused Large Cap Enhanced Index Fund
| | 196,662,076 | | 31,153,366 | | (17,502,816) | | 13,650,550 |
Steward Values-Focused Small-Mid Cap Enhanced Index Fund
| | 167,840,971 | | 24,642,555 | | (25,213,525) | | (570,970) |
The differences between book-basis and tax-basis unrealized appreciation/(depreciation) are primarily attributable to tax deferral of losses on wash sales, adjustments to income on certain securities and other temporary differences.
The tax character of distributions paid during the fiscal year ended April 30, 2023, was as follows:
| | | Distributions Paid From | | |
| Fund | | Ordinary
Income | | Net
Long-Term
Capital
Gains | | Total
Distribution
Paid |
Steward Covered Call Income Fund
| | $ 3,742,758 | | $ 220,208 | | $ 3,962,966 |
Steward Equity Market Neutral Fund
| | 34,826 | | — | | 34,826 |
Steward Global Equity Income Fund
| | 11,550,551 | | 14,740,132 | | 26,290,683 |
Steward International Enhanced Index Fund
| | 3,575,277 | | 2,169,041 | | 5,744,318 |
Steward Large Cap Core Fund
| | 666,206 | | — | | 666,206 |
Steward Large Cap Growth Fund
| | 230,083 | | — | | 230,083 |
Steward Large Cap Value Fund
| | 1,008,390 | | — | | 1,008,390 |
Steward Select Bond Fund
| | 2,476,965 | | — | | 2,476,965 |
Steward Small Cap Growth Fund
| | — | | — | | — |
Steward Values-Focused Large Cap Enhanced Index Fund
| | 8,522,800 | | 60,061,279 | | 68,584,079 |
Steward Values-Focused Small-Mid Cap Enhanced Index Fund
| | 5,175,140 | | 32,079,954 | | 37,255,094 |
The tax character of distributions paid during the fiscal year ended April 30, 2022, was as follows:
| | | Distributions Paid From | | |
| Fund | | Ordinary
Income | | Net
Long-Term
Capital
Gains | | Total
Distribution
Paid |
Steward Covered Call Income Fund
| | $ 2,177,626 | | $ 1,057,541 | | $ 3,235,167 |
Steward Equity Market Neutral Fund
| | — | | — | | — |
Steward Global Equity Income Fund
| | 18,666,571 | | 25,167,668 | | 43,834,239 |
Steward International Enhanced Index Fund
| | 3,719,850 | | 4,885,523 | | 8,605,373 |
Steward Large Cap Core Fund
| | 60,584 | | — | | 60,584 |
Steward Large Cap Growth Fund
| | 20,782 | | — | | 20,782 |
Steward Large Cap Value Fund
| | 105,359 | | — | | 105,359 |
Steward Select Bond Fund
| | 2,393,851 | | — | | 2,393,851 |
Steward Small Cap Growth Fund
| | 10,843 | | — | | 10,843 |
Steward Values-Focused Large Cap Enhanced Index Fund
| | 7,882,401 | | 64,063,965 | | 71,946,366 |
Steward Values-Focused Small-Mid Cap Enhanced Index Fund
| | 7,799,214 | | 19,535,711 | | 27,334,925 |
In addition to the Ordinary and Capital Gains distribution, during the fiscal year ended April 30, 2023, the following Funds utilized equalization for tax purposes whereby a portion of redemption payments were treated as distributions as noted below:
| Fund | | Ordinary Income | | Short-term Capital Gain | | Long-term Capital Gain | | Total
Equalization |
Steward Global Equity Income Fund
| | $ 586,181 | | $ — | | $ — | | $ 586,181 |
Steward International Enhanced Index Fund
| | 212,527 | | — | | — | | 212,527 |
Steward Values-Focused Large Cap Enhanced Index Fund
| | 177,613 | | — | | 326,575 | | 504,188 |
Steward Values-Focused Small-Mid Cap Enhanced Index Fund
| | 36,761 | | 24,888 | | 631,708 | | 693,357 |
As of April 30, 2023, the components of distributable earnings/(accumulated deficit) on a tax basis were as follows:
| Fund | | Undistributed
Ordinary
Income | | Undistributed
Long-Term
Capital Gains | | Distributable
Earnings | | Accumulated
Capital and
Other Losses | | Unrealized
Appreciation/(Depreciation) | | Total
Distributable
Earnings/(Accumulated
Deficit) |
Steward Covered Call Income Fund
| | $ 1,734,495 | | $ 31,576 | | $ 1,766,071 | | $ (1,366) | | $ (4,800,007) | | $ (3,035,302) |
Steward Equity Market Neutral Fund
| | 1,449,533 | | 71,699 | | 1,521,232 | | — | | 2,306,687 | | 3,827,919 |
Steward Global Equity Income Fund
| | 1,633,703 | | — | | 1,633,703 | | (4,390,274) | | 12,772,063 | | 10,015,492 |
Steward International Enhanced Index Fund
| | 4,148,688 | | — | | 4,148,688 | | (1,377,690) | | 1,181,893 | | 3,952,891 |
Steward Large Cap Core Fund
| | 196,780 | | — | | 196,780 | | (9,535,850) | | (39,292) | | (9,378,362) |
Steward Large Cap Growth Fund
| | 93,895 | | — | | 93,895 | | (4,953,712) | | (425,525) | | (5,285,342) |
Steward Large Cap Value Fund
| | 258,182 | | — | | 258,182 | | (5,991,812) | | 270,880 | | (5,462,750) |
Steward Select Bond Fund
| | 430,979 | | — | | 430,979 | | (3,288,753) | | (14,661,513) | | (17,519,287) |
Steward Small Cap Growth Fund
| | — | | — | | — | | (4,351,638) | | (6,806,340) | | (11,157,978) |
Steward Values-Focused Large Cap Enhanced Index Fund
| | 2,032,152 | | 3,736,509 | | 5,768,661 | | — | | 13,650,550 | | 19,419,211 |
Steward Values-Focused Small-Mid Cap Enhanced Index Fund
| | 469,019 | | 4,805,955 | | 5,274,974 | | — | | (570,970) | | 4,704,004 |
As of the end of the fiscal year ended April 30, 2023, the following Funds had capital loss carry forwards (‘‘CLCFs’’) as summarized in the tables below. The Board does not intend to authorize a distribution of any realized gain for the Funds until any applicable CLCF is offset.
CLCFs not subject to expiration:
| Fund | | Short-Term
Amount | | Long-Term
Amount | | Total |
Steward Covered Call Income Fund
| | $ — | | $ — | | $ — |
Steward Equity Market Neutral Fund
| | — | | — | | — |
Steward Global Equity Income Fund
| | — | | — | | — |
Steward International Enhanced Index Fund
| | 1,085,765 | | 291,925 | | 1,377,690 |
Steward Large Cap Core Fund
| | 8,994,749 | | 541,101 | | 9,535,850 |
Steward Large Cap Growth Fund
| | 4,225,189 | | 728,523 | | 4,953,712 |
Steward Large Cap Value Fund
| | 5,748,412 | | 243,400 | | 5,991,812 |
Steward Select Bond Fund
| | 116,206 | | 3,172,547 | | 3,288,753 |
Steward Small Cap Growth Fund
| | 3,823,886 | | 474,735 | | 4,298,621 |
Steward Values-Focused Large Cap Enhanced Index Fund
| | — | | — | | — |
Steward Values-Focused Small-Mid Cap Enhanced Index Fund
| | — | | — | | — |
During the tax year ended April 30, 2023, the following Fund utilized capital loss carryforwards as follows:
| Fund | | Total |
Steward Equity Market Neutral Fund
| | $ 301,309 |
Under the current tax law, capital/late year and ordinary losses realized after October 31 and December 31, respectively, of a Fund’s fiscal year may be deferred and treated as occurring on the first business day of the following fiscal year for tax purposes. The following Funds' deferred losses are as follows:
| Fund | | Late-Year Ordinary
Loss Deferred |
Steward Global Equity Income Fund
| | $ 4,390,274 |
Steward Small Cap Growth Fund
| | 53,017 |
| | | |
| | | |
| Note 7 | — | Reclassifications: |
In accordance with GAAP, the Funds will make reclassifications, if applicable, among their capital accounts. These reclassifications are intended to adjust the components of the Funds’ net assets to reflect the tax character of permanent book/tax differences (e.g., Foreign Currency Gain/Loss, return of capital basis adjustments sold, paydown gain/loss) and have no impact on the net assets or the net asset value of the Funds. As of April 30, 2023, the following reclassifications were made between the capital accounts and distributable earnings:
| Fund | | Distributable
Earnings | | Capital |
Steward Covered Call Income Fund
| | $ — | | $ — |
Steward Equity Market Neutral Fund
| | 3,826 | | (3,826) |
Steward Global Equity Income Fund
| | (586,181) | | 586,181 |
Steward International Enhanced Index Fund
| | (212,528) | | 212,528 |
Steward Large Cap Core Fund
| | — | | — |
Steward Large Cap Growth Fund
| | 32 | | (32) |
Steward Large Cap Value Fund
| | — | | — |
Steward Select Bond Fund
| | — | | — |
Steward Small Cap Growth Fund
| | 124,685 | | (124,685) |
Steward Values-Focused Large Cap Enhanced Index Fund
| | (601,633) | | 601,633 |
Steward Values-Focused Small-Mid Cap Enhanced Index Fund
| | (693,357) | | 693,357 |
| Note 8 | — | Control Ownership: |
The beneficial ownership, either directly or indirectly, of more than 25% of the voting securities of a Fund creates a presumption of control of the Fund, under Section 2(a)(9) of the 1940 Act. As of April 30, 2023, Assemblies of God Financial Services Group DBA AGFinancial, the parent company of Crossmark Global Holdings, through its subsidiary, Steward Financial Holdings, Inc., had effective voting control over SFI and each of the Funds, with the exception of Steward Equity Market Neutral Fund, Steward Global Equity Income Fund and Steward Values-Focused Small-Mid Cap Enhanced Index Fund. In addition, as of April 30, 2023, the following were record owners of the approximate amounts of each Fund listed below. Record ownership is not necessarily the same as beneficial ownership. The percentages below include shares over which Assemblies of God Financial Services Group DBA AGFinancial has voting control.
| | | | | Percent
Owned |
| Steward Covered Call Income Fund | | MSCS Financial Services, LLC | | 50% |
| Steward Covered Call Income Fund | | National Financial Services LLC | | 31% |
| | | | | |
| Steward Equity Market Neutral Fund | | MSCS Financial Services, LLC | | 27% |
| Steward Equity Market Neutral Fund | | National Financial Services LLC | | 27% |
| | | | | |
| Steward Global Equity Income Fund | | National Financial Services LLC | | 34% |
| | | | | |
| Steward International Enhanced Index Fund | | MSCS Financial Services, LLC | | 36% |
| Steward International Enhanced Index Fund | | National Financial Services LLC | | 38% |
| | | | | |
| | | | | Percent
Owned |
| Steward Large Cap Core Fund | | MSCS Financial Services, LLC | | 61% |
| Steward Large Cap Core Fund | | National Financial Services LLC | | 33% |
| | | | | |
| Steward Large Cap Growth Fund | | MSCS Financial Services, LLC | | 48% |
| Steward Large Cap Growth Fund | | National Financial Services LLC | | 33% |
| | | | | |
| Steward Large Cap Value Fund | | MSCS Financial Services, LLC | | 68% |
| Steward Large Cap Value Fund | | National Financial Services LLC | | 26% |
| | | | | |
| Steward Select Bond Fund | | MSCS Financial Services, LLC | | 64% |
| Steward Select Bond Fund | | National Financial Services LLC | | 36% |
| | | | | |
| Steward Small Cap Growth Fund | | MSCS Financial Services, LLC | | 84% |
| | | | | |
| Steward Values-Focused Large Cap Enhanced Index Fund | | MSCS Financial Services, LLC | | 35% |
| Steward Values-Focused Large Cap Enhanced Index Fund | | National Financial Services LLC | | 26% |
| | | | | |
| Steward Values-Focused Small-Mid Cap Enhanced Index Fund | | National Financial Services LLC | | 26% |
| | | | | |
| Note 9 | — | Commitments and Contingencies |
Under the Funds' organizational documents, the Funds' current and former officers and Directors are indemnified against certain liabilities arising out of the performance of their duties to the Funds. In addition, in the normal course of business, the Funds enter into contracts with service providers and other third parties that may provide for certain indemnifications. The Funds' maximum exposure under these indemnification provisions is unknown and may include future claims that may be made against the Funds. The Funds expect the risk of loss to be remote.
| Note 10 | — LIBOR Transition: |
Certain of Steward Select Bond Fund's investments, payment obligations and financing terms may be based on floating rates, such as the London Interbank Offered Rate (“LIBOR”). In March 2020, the FASB issued ASU 2020-04, Reference Rate Reform Topic 848 (“ASU 2020-04”), “Facilitation of the Effects of Reference Rate Reform on Financial Reporting,” which provides optional temporary financial reporting relief from the effect of certain types of contract modifications due to the planned discontinuation of the LIBOR and other interbank-offered based reference rates as of the end of 2021. The Financial Conduct Authority and Intercontinental Exchange Benchmark Administration have since announced that most LIBOR settings will no longer be published after December 31, 2021 and the remaining U.S. dollar LIBOR settings will cease publication after June 30, 2023. ASU 2020-04 is effective for certain reference rate-related contract modifications that occur during the period March 12, 2020 through December 31, 2022, and the adoption of ASU 2020-04 is elective. In December 2022, the FASB issued ASU 2022-06 which defers the sunset date of ASU 2020-04 from December 31, 2022 to December 31, 2024, after which entities will no longer be permitted to apply the relief in ASU 2020-04. ASU 2020-04 had no impact on the Fund during the current reporting period.
| Note 11 | — Subsequent Events: |
Management has evaluated subsequent events through the date these financial statements were issued.
There were no events that require adjustment or disclosure for the period subsequent to April 30, 2023 through the date of
issuance of these financial statements.

REPORT OF INDEPENDENT REGISTERED PUBLIC ACCOUNTING FIRM
To the Shareholders and Board of Directors of Steward Funds, Inc.
Opinion on the Financial Statements
We have audited the accompanying statements of assets and liabilities, including the schedules of portfolio investments, of Steward Funds, Inc. comprising the funds listed below (the “Funds”) as of April 30, 2023, and the related statements of operations, the statements of changes in net assets, the related notes, and the financial highlights for each of the periods indicated below (collectively referred to as the “financial statements”). In our opinion, the financial statements present fairly, in all material respects, the financial position of each of the Funds as of April 30, 2023, the results of their operations, the changes in net assets, and the financial highlights for each of the periods indicated below in conformity with accounting principles generally accepted in the United States of America.
| | | | | | |
| Fund Name | | Statements of Operations | | Statements of
Changes in Net
Assets | | Financial Highlights |
Steward Covered Call Income Fund,
Steward Global Equity Income Fund,
Steward International Enhanced Index
Fund, Steward Select Bond Fund,
Steward Values-Focused Large Cap
Enhanced Index Fund, and Steward
Values-Focused Small-Mid Cap
Enhanced Index Fund | | For the year ended April 30, 2023 | | For the years ended April 30, 2023 and 2022 | | For the years ended April 30, 2023, 2022, 2021, 2020, and 2019 |
| | | | | | |
Steward Equity Market Neutral Fund,
Steward Large Cap Core Fund,
Steward Large Cap Growth Fund,
Steward Large Cap Value Fund, and
Steward Small Cap Growth Fund | | For the year ended April 30, 2023 | | For the year ended April 30, 2023 and for the period from November 15, 2021 (commencement of operations) through April 30, 2022 |
Basis for Opinion
These financial statements are the responsibility of the Funds’ management. Our responsibility is to express an opinion on the Funds’ financial statements based on our audits. We are a public accounting firm registered with the Public Company Accounting Oversight Board (United States) (“PCAOB”) and are required to be independent with respect to the Funds in accordance with the U.S. federal securities laws and the applicable rules and regulations of the Securities and Exchange Commission and the PCAOB.
We conducted our audits in accordance with the standards of the PCAOB. Those standards require that we plan and perform the audit to obtain reasonable assurance about whether the financial statements are free of material misstatement whether due to error or fraud.
C O H E N & C O M P A N Y , L T D .
800.229.1099 | 866.818.4538 FAX | cohencpa.com
Registered with the Public Company Accounting Oversight Board
Our audits included performing procedures to assess the risks of material misstatement of the financial statements, whether due to error or fraud, and performing procedures that respond to those risks. Such procedures included examining, on a test basis, evidence regarding the amounts and disclosures in the financial statements. Our procedures included confirmation of securities owned as of April 30, 2023, by correspondence with the custodian and brokers. Our audits also included evaluating the accounting principles used and significant estimates made by management, as well as evaluating the overall presentation of the financial statements. We believe that our audits provide a reasonable basis for our opinion.
We have served as the Funds’ auditor since 2007.

COHEN & COMPANY, LTD.
Philadelphia, Pennsylvania
June 27, 2023
General Information (Unaudited)
Federal Income Tax Information:
For the fiscal year ended April 30, 2023, the following percentages of the total ordinary income distributions paid by the Funds qualify for the dividends received deduction available to corporate shareholders.
| Fund | | Dividends
Received Deduction |
Steward Covered Call Income Fund
| | 18.20% |
Steward Equity Market Neutral Fund
| | 100.00% |
Steward Global Equity Income Fund
| | 39.68% |
Steward International Enhanced Index Fund
| | 0.48% |
Steward Large Cap Core Fund
| | 100.00% |
Steward Large Cap Growth Fund
| | 100.00% |
Steward Large Cap Value Fund
| | 100.00% |
Steward Select Bond Fund
| | —% |
Steward Small Cap Growth Fund
| | —% |
Steward Values-Focused Large Cap Enhanced Index Fund
| | 37.01% |
Steward Values-Focused Small-Mid Cap Enhanced Index Fund
| | 41.69% |
For the fiscal year ended April 30, 2023, distributions paid by the Funds may be subject to a maximum tax rate of 15%, as provided by the Jobs and Growth Tax Relief Reconciliation Act of 2003. The Funds intend to designate the maximum amount allowable as taxed at a maximum rate of 15%. Complete information will be reported in conjunction with your 2023 Form 1099-DIV.
For the taxable year ended April 30, 2023, the percentages of Qualified Dividend Income are as follows:
| Fund | | Qualified
Dividend Income |
Steward Covered Call Income Fund
| | 18.99% |
Steward Equity Market Neutral Fund
| | 100.00% |
Steward Global Equity Income Fund
| | 100.00% |
Steward International Enhanced Index Fund
| | 100.00% |
Steward Large Cap Core Fund
| | 100.00% |
Steward Large Cap Growth Fund
| | 100.00% |
Steward Large Cap Value Fund
| | 100.00% |
Steward Select Bond Fund
| | —% |
Steward Small Cap Growth Fund
| | —% |
Steward Values-Focused Large Cap Enhanced Index Fund
| | 39.00% |
Steward Values-Focused Small-Mid Cap Enhanced Index Fund
| | 43.30% |
The Funds declared long-term distributions of realized gains as follows:
| Fund | | Long-Term
Capital Gains |
Steward Covered Call Income Fund
| | $ 220,208 |
Steward Equity Market Neutral Fund
| | — |
Steward Global Equity Income Fund
| | 14,740,132 |
Steward International Enhanced Index Fund
| | 2,169,041 |
Steward Large Cap Core Fund
| | — |
Steward Large Cap Growth Fund
| | — |
Steward Large Cap Value Fund
| | — |
Steward Select Bond Fund
| | — |
Steward Small Cap Growth Fund
| | — |
Steward Values-Focused Large Cap Enhanced Index Fund
| | 60,061,279 |
Steward Values-Focused Small-Mid Cap Enhanced Index Fund
| | 32,079,954 |
The Funds declared short-term distributions of realized gains as follows:
| Fund | | Short-Term
Capital Gains |
Steward Covered Call Income Fund
| | $3,417,980 |
Steward Equity Market Neutral Fund
| | 34,826 |
Steward Global Equity Income Fund
| | 3,474,647 |
Steward International Enhanced Index Fund
| | — |
Steward Large Cap Core Fund
| | — |
Steward Large Cap Growth Fund
| | — |
Steward Large Cap Value Fund
| | — |
Steward Select Bond Fund
| | — |
Steward Small Cap Growth Fund
| | — |
Steward Values-Focused Large Cap Enhanced Index Fund
| | 8,250,108 |
Steward Values-Focused Small-Mid Cap Enhanced Index Fund
| | 3,914,284 |
The Steward International Enhanced Index Fund intends to elect to pass-through to shareholders the income tax credit for taxes paid to foreign countries. Foreign source income and foreign tax expense per outstanding share on April 30, 2023 were as follows:
| Fund | | Foreign
Source Income | | Foreign
Tax Expense |
Steward International Enhanced Index Fund
| | $0.81 | | $0.09 |
Proxy Voting Policy and Voting Records
A description of the policies and procedures that the Funds use to determine how to vote proxies and information regarding how each Fund voted proxies during the most recent 12 month-period ended June 30, is available without charge, (i) by calling 1-888-845-6910, or (ii) on the Securities and Exchange Commission's ("SEC") website at http://www.sec.gov.
Availability of Quarterly Portfolio Schedule
Each Fund files its complete schedule of portfolio holdings with the SEC for the first and third quarters of each fiscal year as an exhibit to its reports on Form N-PORT. Portfolio holdings information included with Form N-PORT for the third month of each relevant fiscal quarter will be publicly available on the SEC’s website at www.sec.gov. Each Fund’s complete schedule of portfolio holdings for the second and fourth quarters of each fiscal year is included in the semi-annual and annual reports to shareholders, respectively, and is filed with the SEC on Form N-CSR. The semi-annual and annual report for each Fund is available to investors within 60 days after the period to which it relates. Each Fund’s Forms N-PORT and Forms N-CSR are available on the SEC’s website listed above.
EXPENSE EXAMPLES (Unaudited)
As a shareholder of the Funds, you may incur transaction costs, including contingent deferred sales charges on the lesser of the purchase price or redemption proceeds of Class C shares. You will also incur ongoing costs, including management fees, 12b-1 fees, and other Fund expenses. The following examples are intended to help you understand your ongoing costs (in dollars) of investing in the Funds and to compare these costs with the ongoing costs of investing in other mutual funds.
The Example is based on an investment of $1,000 invested at the beginning of the period and held for the entire period from November 1, 2022 through April 30, 2023.
Actual Expenses
The table below provides information about actual account values and actual expenses. You may use the information below, together with the amount you invested, to estimate the expenses that you paid over the period. Simply divide your account value by $1,000 (for example, an $8,600 account value divided by $1,000 = 8.6), then multiply the result by the number in the table under the heading entitled ‘‘Expenses Paid During Period’’ to estimate the expenses you paid on your account during this period.
| Fund | | Beginning
Account Value
11/1/22 | | Ending
Account Value
4/30/23 | | Expenses Paid
During Period
11/1/22 – 4/30/23* | | Expense Ratio
During Period
11/1/22 – 4/30/23** |
| Steward Covered Call Income Fund | | | | | | | | |
Class A
| | $1,000.00 | | $1,081.00 | | $ 6.45 | | 1.25% |
Class C
| | 1,000.00 | | 1,077.90 | | 10.30 | | 2.00% |
Class R6
| | 1,000.00 | | 1,082.50 | | 4.65 | | 0.90% |
Institutional Class
| | 1,000.00 | | 1,083.00 | | 5.16 | | 1.00% |
| Steward Equity Market Neutral Fund | | | | | | | | |
Class A
| | 1,000.00 | | 1,000.80 | | 9.43 | | 1.90% |
Institutional Class
| | 1,000.00 | | 1,001.50 | | 8.24 | | 1.66% |
| Steward Global Equity Income Fund | | | | | | | | |
Class A
| | 1,000.00 | | 1,059.50 | | 6.54 | | 1.28% |
Class C
| | 1,000.00 | | 1,055.80 | | 10.40 | | 2.04% |
Class R6
| | 1,000.00 | | 1,061.50 | | 4.70 | | 0.92% |
Institutional Class
| | 1,000.00 | | 1,061.30 | | 5.21 | | 1.02% |
| Steward International Enhanced Index Fund | | | | | | | | |
Class A
| | 1,000.00 | | 1,186.20 | | 6.07 | | 1.12% |
Class C
| | 1,000.00 | | 1,187.70 | | 6.29 | | 1.16% |
Class R6
| | 1,000.00 | | 1,188.90 | | 3.64 | | 0.67% |
Institutional Class
| | 1,000.00 | | 1,187.80 | | 4.23 | | 0.78% |
| Steward Large Cap Core Fund | | | | | | | | |
Class A
| | 1,000.00 | | 1,048.70 | | 5.08 | | 1.00% |
Institutional Class
| | 1,000.00 | | 1,050.10 | | 3.81 | | 0.75% |
| Steward Large Cap Growth Fund | | | | | | | | |
Class A
| | 1,000.00 | | 1,078.70 | | 5.15 | | 1.00% |
Institutional Class
| | 1,000.00 | | 1,080.30 | | 3.87 | | 0.75% |
| Steward Large Cap Value Fund | | | | | | | | |
Class A
| | 1,000.00 | | 1,021.90 | | 5.01 | | 1.00% |
Institutional Class
| | 1,000.00 | | 1,023.60 | | 3.76 | | 0.75% |
| Steward Select Bond Fund | | | | | | | | |
Class A
| | 1,000.00 | | 1,059.00 | | 5.05 | | 0.99% |
Class C
| | 1,000.00 | | 1,055.50 | | 8.82 | | 1.73% |
Class R6
| | 1,000.00 | | 1,059.70 | | 4.14 | | 0.81% |
Institutional Class
| | 1,000.00 | | 1,060.50 | | 3.78 | | 0.74% |
| Steward Small Cap Growth Fund | | | | | | | | |
Class A
| | 1,000.00 | | 996.50 | | 6.19 | | 1.25% |
Institutional Class
| | 1,000.00 | | 998.30 | | 4.95 | | 1.00% |
| Steward Values-Focused Large Cap Enhanced Index Fund | | | | | | | | |
Class A
| | 1,000.00 | | 1,081.10 | | 4.13 | | 0.80% |
Class C
| | 1,000.00 | | 1,077.20 | | 8.70 | | 1.69% |
Class R6
| | 1,000.00 | | 1,083.20 | | 2.69 | | 0.52% |
Institutional Class
| | 1,000.00 | | 1,083.10 | | 3.05 | | 0.59% |
EXPENSE EXAMPLES (Unaudited)
| Fund | | Beginning
Account Value
11/1/22 | | Ending
Account Value
4/30/23 | | Expenses Paid
During Period
11/1/22 – 4/30/23* | | Expense Ratio
During Period
11/1/22 – 4/30/23** |
| Steward Values-Focused Small-Mid Cap Enhanced Index Fund | | | | | | | | |
Class A
| | $1,000.00 | | $1,008.10 | | $4.13 | | 0.83% |
Class C
| | 1,000.00 | | 1,008.30 | | 4.18 | | 0.84% |
Class R6
| | 1,000.00 | | 1,009.30 | | 2.64 | | 0.53% |
Institutional Class
| | 1,000.00 | | 1,009.20 | | 3.14 | | 0.63% |
| * | Expenses are equal to the annualized expense ratio multiplied by the average account value over the period multiplied by 181/365 (to reflect the one-half year period). |
| ** | The expense ratio for each class of the following Funds reflects an expense limitation: Steward Covered Call Income Fund, Steward Large Cap Core Fund, Steward Large Cap Growth Fund, Steward Large Cap Value Fund and Steward Small Cap Growth Fund. See Note 4 in the Notes to Financial Statements. |
Hypothetical Example for Comparison Purposes (Unaudited)
The table below provides information about hypothetical account values and hypothetical expenses based on each Fund’s actual expense ratio and an assumed rate of return of 5% per year before expenses, which is not each Fund’s actual return. The hypothetical account values and expenses may not be used to estimate the actual ending account balance or expenses you paid for the period. You may use this information to compare this 5% hypothetical example with the 5% hypothetical examples that appear in the shareholder reports of other funds.
Please note that the expenses shown in the table are meant to highlight your ongoing costs only. Transactional costs, if any, such as sales charges (front or back end loads) or exchange fees, are not shown in the table. Therefore, this table is useful only in comparing ongoing costs and will not help you determine the relative costs of owning different funds.
| Fund | | Beginning
Account Value
11/1/22 | | Ending
Account Value
4/30/23 | | Expenses Paid
During Period
11/1/22 – 4/30/23* | | Expense Ratio
During Period
11/1/22 – 4/30/23** |
| Steward Covered Call Income Fund | | | | | | | | |
Class A
| | $1,000.00 | | $1,018.60 | | $ 6.26 | | 1.25% |
Class C
| | 1,000.00 | | 1,014.88 | | 9.99 | | 2.00% |
Class R6
| | 1,000.00 | | 1,020.33 | | 4.51 | | 0.90% |
Institutional Class
| | 1,000.00 | | 1,019.84 | | 5.01 | | 1.00% |
| Steward Equity Market Neutral Fund | | | | | | | | |
Class A
| | 1,000.00 | | 1,015.37 | | 9.49 | | 1.90% |
Institutional Class
| | 1,000.00 | | 1,016.56 | | 8.30 | | 1.66% |
| Steward Global Equity Income Fund | | | | | | | | |
Class A
| | 1,000.00 | | 1,018.45 | | 6.41 | | 1.28% |
Class C
| | 1,000.00 | | 1,014.68 | | 10.19 | | 2.04% |
Class R6
| | 1,000.00 | | 1,020.23 | | 4.61 | | 0.92% |
Institutional Class
| | 1,000.00 | | 1,019.74 | | 5.11 | | 1.02% |
| Steward International Enhanced Index Fund | | | | | | | | |
Class A
| | 1,000.00 | | 1,019.24 | | 5.61 | | 1.12% |
Class C
| | 1,000.00 | | 1,019.04 | | 5.81 | | 1.16% |
Class R6
| | 1,000.00 | | 1,021.47 | | 3.36 | | 0.67% |
Institutional Class
| | 1,000.00 | | 1,020.93 | | 3.91 | | 0.78% |
| Steward Large Cap Core Fund | | | | | | | | |
Class A
| | 1,000.00 | | 1,019.84 | | 5.01 | | 1.00% |
Institutional Class
| | 1,000.00 | | 1,021.08 | | 3.76 | | 0.75% |
| Steward Large Cap Growth Fund | | | | | | | | |
Class A
| | 1,000.00 | | 1,019.84 | | 5.01 | | 1.00% |
Institutional Class
| | 1,000.00 | | 1,021.08 | | 3.76 | | 0.75% |
| Steward Large Cap Value Fund | | | | | | | | |
Class A
| | 1,000.00 | | 1,019.84 | | 5.01 | | 1.00% |
Institutional Class
| | 1,000.00 | | 1,021.08 | | 3.76 | | 0.75% |
| Steward Select Bond Fund | | | | | | | | |
Class A
| | 1,000.00 | | 1,019.89 | | 4.96 | | 0.99% |
Class C
| | 1,000.00 | | 1,016.22 | | 8.65 | | 1.73% |
Class R6
| | 1,000.00 | | 1,020.78 | | 4.06 | | 0.81% |
Institutional Class
| | 1,000.00 | | 1,021.12 | | 3.71 | | 0.74% |
| Steward Small Cap Growth Fund | | | | | | | | |
Class A
| | 1,000.00 | | 1,018.60 | | 6.26 | | 1.25% |
Institutional Class
| | 1,000.00 | | 1,019.84 | | 5.01 | | 1.00% |
| Steward Values-Focused Large Cap Enhanced Index Fund | | | | | | | | |
Class A
| | 1,000.00 | | 1,020.83 | | 4.01 | | 0.80% |
Class C
| | 1,000.00 | | 1,016.41 | | 8.45 | | 1.69% |
Class R6
| | 1,000.00 | | 1,022.22 | | 2.61 | | 0.52% |
Institutional Class
| | 1,000.00 | | 1,021.87 | | 2.96 | | 0.59% |
| Steward Values-Focused Small-Mid Cap Enhanced Index Fund | | | | | | | | |
Class A
| | 1,000.00 | | 1,020.68 | | 4.16 | | 0.83% |
Class C
| | 1,000.00 | | 1,020.63 | | 4.21 | | 0.84% |
Class R6
| | 1,000.00 | | 1,022.17 | | 2.66 | | 0.53% |
Institutional Class
| | 1,000.00 | | 1,021.67 | | 3.16 | | 0.63% |
| * | Expenses are equal to the annualized expense ratio multiplied by the average account value over the period multiplied by 181/365 (to reflect the one-half year period). |
Hypothetical Example for Comparison Purposes (Unaudited)
| ** | The expense ratio for each class of the following Funds reflects an expense limitation: Steward Covered Call Income Fund, Steward Large Cap Core Fund, Steward Large Cap Growth Fund, Steward Large Cap Value Fund and Steward Small Cap Growth Fund. See Note 4 in the Notes to Financial Statements. |
DIRECTORS AND EXECUTIVE OFFICERS (Unaudited)
The business and affairs of the Funds are managed under the direction of the Funds’ Board of Directors and the Funds’ officers appointed by the Board of Directors. The tables below list the Directors and executive officers of the Funds and their principal occupations during the past five years, other directorships held by the Directors and their affiliations, if any, with Crossmark Global Investments, Inc. and Crossmark Distributors, Inc.
The Funds’ statement of additional information includes additional information about the Funds’ Directors and is available, without charge, upon request, by calling 1-888-845-6910.
| Name, Address, Age | | Position(s)
Held with
Fund | | Term of Office(1)
and Length of
Time Served | | Principal Occupation(s)
During Past 5 Years | | Number of
Portfolios in
Fund Complex
Overseen by
Director or
Nominee | | Other Directorships
Held by Director or
Nominee During
the Past 5 Years |
| Interested Directors | | | | | |
Michael L. Kern, III, CFA(2)
c/o 15375 Memorial Drive,
Suite 200
Houston, TX 77079
Birth Year: 1973 | | Chairman of the Board; Director | | Indefinite Term
Since 2017 | | President, CEO and Treasurer, Crossmark Global Holdings, Inc. (May 2015 − Present); President, CEO and Treasurer, Crossmark Global Investments, Inc. and Crossmark Distributors, Inc. (2016 − Present); Secretary, Crossmark Global Investments, Inc. and Crossmark Distributors, Inc. (2016 − 2018) Secretary, Crossmark Global Investments, Inc. and Crossmark Distributors, Inc. (2016 - 2018) | | 11 | | Foundation Capital
Resources (2015 -2022); GSV Fund
Management Company
(2020 - Present) |
Kyle A. Dana CRPC(3)
c/o 15375 Memorial Drive,
Suite 200
Houston, TX 77079
Birth Year: 1978 | | Director | | Indefinite
Term
Since 2017 | | Senior Vice President, Retirement
& Investment Solutions of
AGFinancial(4) (2000 − Present) | | 11 | | N/A |
| Independent Directors | | | | | |
Mark H. Barineau
c/o 15375 Memorial Drive,
Suite 200
Houston, TX 77079
Birth Year: 1968 | | Director | | Indefinite
Term
Since 2017 | | President of Lionsmark
Investment Group(5) (since April
2016); Co-Founder and
Managing Member, Starboard
Star Venture Capital LLC
(2021 - Present); President &
Owner of Radney Management
& Investments, Inc.(6)
(1996 – 2016) | | 11 | | N/A |
Richard L. Peteka
c/o 15375 Memorial Drive,
Suite 200
Houston, TX 77079
Birth Year: 1961 | | Director | | Indefinite
Term
Since 2017 | | Retired; Chief Financial Officer and Secretary of SLR Investment Corp.,
(May 2012 - April 2023),
SCP Private Credit Income
BDC LLC (2018 - April 2023)
and SLR HC BDC LLC (2020 - April 2023)(7) | | 11 | | N/A |
Adriana R. Posada
c/o 15375 Memorial Drive,
Suite 200
Houston, TX 77079
Birth Year: 1954 | | Director | | Indefinite
Term
Since 2017 | | Retired; Sr. Portfolio Manager of
American Beacon Advisors, Inc.
(September 1998 − March 2016) | | 11 | | N/A |
DIRECTORS AND EXECUTIVE OFFICERS (Unaudited)
| Name, Address, Age | | Position(s)
Held with
Fund | | Term of Office(1)
and Length of
Time Served | | Principal Occupation(s)
During Past 5 Years | | Number of
Portfolios in
Fund Complex
Overseen by
Director or
Nominee | | Other Directorships
Held by Director or
Nominee During
the Past 5 Years |
| Independent Directors (continued) | | | | | |
Richard J. Rossi
c/o 15375 Memorial Drive,
Suite 200
Houston, TX 77079
Birth Year: 1956 | | Director;
Lead Independent
Director as of
May 14, 2020 | | Indefinite
Term
Since 2019 | | Retired; President and Co–Chief
Operating Officer, Eagle Asset
Management, President, Eagle
Mutual Funds and Eagle Fund
Distributors (2000 – 2017) | | 11 | | N/A |
(1) Each Director serves on the Board from the time of his or her election or appointment until the election of Directors next succeeding his or her election or appointment and until his or her successor is elected and qualified. Because the Funds do not hold regular annual meetings of shareholders to elect Directors, each Director serves for an indefinite period.
(2) Mr. Kern is an ‘‘interested person’’ of SFI, as defined in the 1940 Act, because of his position with the Funds’ investment adviser, administrator and distributor.
(3) Mr. Dana is an ‘‘interested person’’ of SFI, as defined in the 1940 Act, because of his position with AGFinancial, which is an affiliate of the Funds’ investment adviser, administrator and distributor.
(4) AGFinancial is an affiliate of SFI’s investment adviser, administrator and distributor specializing in delivering financial products and services that align with faith and values.
(5) Lionsmark Investment Group is a private real estate investment and management company that Mr. Barineau formed in 2016. Its primary business is the acquisition, development and management of multi-family assets and other active and passive real estate investments.
(6) Radney Management & Investments, Inc. was established in 1982 and is an ACCREDITED MANAGEMENT ORGANIZATION(R) specializing in multi-family property management.
(7) SLR Investment Corp., SCP Private Credit Income BDC LLC and SLR HC BDC LLC are business development companies that invest primarily in senior secured loans of private middle-market companies to generate current income that is distributed to shareholders across economic cycles.
DIRECTORS AND EXECUTIVE OFFICERS (Unaudited)
Name, address,
Age | | Position(s) Held
with Fund | | Term of Office(1) and
Length of Time Served | | Principal Occupation(s)
During Past 5 Years | | Other
Directorships/ Trusteeships Held
by Officer
During
the Past 5 Years |
| Executive Officers | | | | |
Michael L. Kern, III, CFA
15375 Memorial
Drive,
Suite 200
Houston, TX 77079
Birth Year: 1973 | | President | | Since 2016 | | President, CEO and Treasurer, Crossmark Global Holdings, Inc. (May 2015 − Present); President, CEO and Treasurer, Crossmark Global Investments, Inc. and Crossmark Distributors, Inc. (2016 − Present); Secretary, Crossmark Global Investments, Inc. and Crossmark Distributors, Inc. (2016 − 2018) | | Foundation Capital Resources
(2015 − 2022); GSV Fund
Management Company (2020 − Present) |
Robert C. Doll, CFA
15375 Memorial Drive,
Suite 200
Houston, TX 77079
Birth Year: 1954 | | Executive Vice
President | | Since 2021 | | Chief Investment Officer, Crossmark
Global Investments, Inc. (2021 - Present);
Chief Equity Strategist and Senior
Portfolio Manager, Nuveen (November
2012 - March 2021) | | N/A |
James Jacoby
15375 Memorial
Drive,
Suite 200
Houston, TX
77079
Birth Year: 1968 | | Executive Vice President,
Derivatives Risk
Manager and
Liquidity Risk Management
Program
Administrator | | Since 2022 | | Chief Operating Officer, Crossmark Global Investments, Inc. (2022 - Present);
Global Head of Performance and Risk, Invesco, Ltd. (2007 - 2022) | | N/A |
Brent Lium, CFA
15375 Memorial Drive,
Suite 200
Houston, TX 77079
Birth Year: 1969 | | Executive Vice
President | | Since 2019 | | Managing Director - Head of Equity Investments, Crossmark Global Investments, Inc. (February 2021 -Present); Managing Director, Crossmark
Global Investments, Inc. (2019 – February
2021); Portfolio Manager,
Invesco Ltd. (2001 − 2019) | | N/A |
Rob Botard, CFA
15375 Memorial Drive,
Suite 200
Houston, TX 77079
Birth Year: 1970 | | Executive Vice
President | | Since 2022 | | Managing Director and Portfolio Manager,
Crossmark Global Investments, Inc. (April
2022 - Present); Portfolio Manager,
Invesco Ltd. (April 2011- April 2022) | | N/A |
DIRECTORS AND EXECUTIVE OFFICERS (Unaudited)
Name, address,
Age | | Position(s) Held
with Fund | | Term of Office(1) and
Length of Time Served | | Principal Occupation(s)
During Past 5 Years | | Other
Directorships/ Trusteeships Held
by Officer
During
the Past 5 Years |
| Executive Officers (continued) | | | | |
Victoria Fernandez, CFA
15375 Memorial Drive,
Suite 200
Houston, TX 77079
Birth Year: 1973 | | Executive Vice
President | | Since 2014 | | Chief Market Strategist, Crossmark
Global Investments, Inc. (2018 − Present);
Managing Director – Fixed Income
Investments, Crossmark Global
Investments, Inc. (2012 – 2018) | | N/A |
Paul Townsen
15375 Memorial Drive,
Suite 200
Houston, TX 77079
Birth Year: 1971 | | Executive Vice
President | | Since 2017 | | Managing Director – Head of Trading & Investment Operations (2021 - Present); Managing Director, Crossmark Global Investments, Inc, (2017 - 2021) | | N/A |
Ryan Caylor, CFA
15375 Memorial Drive,
Suite 200
Houston, TX 77079
Birth Year: 1988 | | Executive Vice
President | | Since 2020 | | Portfolio Manager, Crossmark Global Investments, Inc. (2020 − Present); Head
of Research, Crossmark Global
Investments, Inc. (2019 – Present); Senior
Research Analyst, Crossmark Global Investments Inc. (2016 – 2019) | | N/A |
Heather Lindsey
15375 Memorial Drive,
Suite 200
Houston, TX 77079
Birth Year: 1973 | | Executive Vice
President | | Since 2022 | | Managing Director – Head of Distributions Crossmark Global Investments, Inc.
(August 2021– Present); Senior Vice President, Head of Strategic Accounts,
Invesco Ltd. (March 2018 –March 2020); Senior Director - Retirement &
Insurance Platforms, Invesco Ltd. (April 2008 - February 2018). | | N/A |
DIRECTORS AND EXECUTIVE OFFICERS (Unaudited)
Name, address,
Age | | Position(s) Held
with Fund | | Term of Office(1) and
Length of Time Served | | Principal Occupation(s)
During Past 5 Years | | Other
Directorships/ Trusteeships Held
by Officer
During
the Past 5 Years |
| Executive Officers (continued) | | | | |
Jim A. Coppedge
15375 Memorial Drive,
Suite 200
Houston, TX 77079
Birth Year: 1968 | | Executive Vice
President, Chief
Compliance
Officer, Secretary
and Assistant Treasurer | | Since 2017 | | General Counsel and Chief Compliance Officer, Crossmark Global Investments, Inc. (2017 − Present); General Counsel and Chief Compliance Officer, Crossmark Distributors, Inc. (December 11, 2017 − Present); Secretary, Crossmark Global Investments, Inc. and Crossmark Distributors, Inc. (2018 − Present) | | N/A |
Monique Labbe
15375 Memorial Drive,
Suite 200
Houston, TX
77079
Birth Year: 1973 | | Treasurer | | Since 2023 | | Senior Principal Consultant, ACA Group (2022 - Present); Fund Treasurer and
Principal Financial Officer, Foreside Financial Group, LLC (2014 - 2022) | | N/A |
Brystal Eshenroder
15375 Memorial Drive,
Suite 200
Houston, TX 77079
Birth Year: 1989 | | Assistant Secretary | | Since 2023 | | Senior Compliance and Fund Administration Manager (2022 - Present); Regional
Compliance Manager for Private Wealth Management, Goldman Sachs & Co.
LLC (2021); Global Compliance Employee Services, Goldman Sachs & Co. LLC
(2017 - 2021) | | N/A |
DIRECTORS AND EXECUTIVE OFFICERS (Unaudited)
Name, address,
Age | | Position(s) Held
with Fund | | Term of Office(1) and
Length of Time Served | | Principal Occupation(s)
During Past 5 Years | | Other
Directorships/ Trusteeships Held
by Officer
During
the Past 5 Years |
| Executive Officers (continued) | | | | |
Patricia Mims
15375 Memorial Drive,
Suite 200
Houston, TX 77079
Birth Year: 1960 | | Assistant Treasurer | | Since 2021 | | Financial Operations Principal, Crossmark Distributors, Inc. (2018 - Present); Senior Compliance Officer, Crossmark Global Investments, Inc. (October 2018 - 2020); Assistant Secretary, Crossmark Global Investments, Inc. and Crossmark Distributors, Inc. (2018 - 2020); Senior Compliance Associate, Crossmark Global Investments, Inc. (April 2013 - October 2018) | | N/A |
(1) SFI officers are elected by the Board annually and hold office until the next annual Board meeting at which officers are elected and until his or her successor is elected and qualified.
Visit us online at:
crossmarkglobal.com
STEWARD FUNDS
ANNUAL REPORT
Steward Covered Call Income Fund
Steward Equity Market Neutral Fund
Steward Global Equity Income Fund
Steward International Enhanced Index Fund
Steward Large Cap Core Fund
Steward Large Cap Growth Fund
Steward Large Cap Value Fund
Steward Select Bond Fund
Steward Small Cap Growth Fund
Steward Values-Focused Large Cap Enhanced Index Fund
Steward Values-Focused Small-Mid Cap Enhanced Index Fund
Distributed by:
Crossmark Distributors, Inc.
15375 Memorial Dr, Suite 200
Houston, TX 77079
888-845-6910
stewardfunds@crossmarkglobal.com
For more complete information about the Steward Funds, including charges and expenses, contact the Distributor to receive a prospectus. Please read it carefully before you invest or send money.
Item 2. Code of Ethics.
| (a) | The registrant has adopted a code of ethics that applies to the registrant’s principal executive officer, principal financial officer, principal accounting officer or controller, or persons performing similar functions. This code of ethics is included as an exhibit. |
| (c) | During the period covered by the report, with respect to the registrant’s code of ethics that applies to its principal executive officer, principal financial officer, principal accounting officer or controller, or persons performing similar functions, there have been no amendments to a provision that relates to any element of the code of ethics definition enumerated in paragraph (b) of this Item 2 of Form N-CSR. |
| (d) | During the period covered by the report, with respect to the registrant’s code of ethics that applies to its principal executive officer, principal financial officer, principal accounting officer or controller, or persons performing similar functions, there have been no waivers granted from a provision that relates to any element of the code of ethics definition enumerated in paragraph (b) of this Item 2 of Form N-CSR. |
Item 3. Audit Committee Financial Expert.
| (a) | (1) The registrant’s board of directors has determined that the registrant has at least one audit committee financial expert serving on its audit committee. |
| (a) | (2) The audit committee financial expert is Richard L. Peteka, who is “independent” for purposes of this Item 3 of Form N-CSR. |
Item 4. Principal Accountant Fees and Services.
| | | | | | |
| | | 2023 | | 2022 | | |
(a) Audit Fees | | $187,250 | | $170,750 |
(b) Audit-Related Fees | | $- | | $- |
(c) Tax Fees | | $36,850 | | $35,750 |
(d) All Other Fees | | $- | | $- |
The audit fees are paid for professional services rendered by the auditor for the audit of the Funds’ annual financial statements or services that are normally provided by the auditor in connection with statutory and regulatory filings or engagements. The tax fees are paid for professional services rendered by the auditor for tax compliance, tax advice and tax planning.
| (e) | (1) The Audit Committee may pre-approve at any regularly scheduled Audit Committee meeting audit, audit-related, tax and other non-audit services to be rendered or that may be rendered by the auditor to the Funds and certain non-audit services to be rendered by the auditor to the Funds’ investment adviser which require pre-approval by the Audit Committee. In connection with such pre-approvals, the auditor, or a Fund officer, with the assistance of the auditor, shall provide the Audit Committee with a report containing information about each type of service to be pre-approved at the meeting. |
| (e) | (2) For the fiscal years ended April 30, 2023 and 2022, 0% of the fees disclosed in paragraphs (b)-(d) of Item 4 were approved by the Audit Committee pursuant to paragraph (c)(7)(i)(C) of Rule 2-01 of Regulation S-X. |
1
| (g) | For the fiscal year ended April 30, 2023, Cohen and Company, Ltd. billed $36,850. |
For the fiscal year ended April 30, 2022, Cohen and Company, Ltd. billed $35,750.
Item 5. Audit Committee of Listed Registrants.
Not applicable.
Item 6. Schedule of Investments.
| (a) | The schedules of investments are included as part of the report to shareholders filed under Item 1(a) of this Form N-CSR. |
Item 7. Disclosure of Proxy Voting Policies and Procedures for Closed-End Management Investment Companies.
Not applicable.
Item 8. Portfolio Managers of Closed-End Management Investment Companies.
Not applicable.
Item 9. Purchases of Equity Securities by Closed-End Management Investment Company and Affiliated Purchasers.
Not applicable.
Item 10. Submission of Matters to a Vote of Security Holders.
Not applicable.
Item 11. Controls and Procedures.
| (a) | The registrant’s principal executive officer and principal financial officer have concluded, based on their evaluation of the registrant’s disclosure controls and procedures as conducted within 90 days of the filing date of this report, that these disclosure controls and procedures are adequately designed and are operating effectively to ensure that information required to be disclosed by the registrant on Form N-CSR is recorded, processed, summarized and reported within the time periods specified in the Securities and Exchange Commission’s rules and forms. |
2
| (b) | There were no changes in the registrant’s internal control over financial reporting (as defined in Rule 30a-3(d) under the Act (17 CFR 270.30a-2(d)) that occurred during the period covered by this report that have materially affected, or are reasonably likely to materially affect, the registrant’s internal control over financial reporting. |
Item 12. Disclosure of Securities Lending Activities for Closed-End Management Investment Companies.
Not applicable.
Item 13. Exhibits.
3
SIGNATURES
Pursuant to the requirements of the Securities Exchange Act of 1934 and the Investment Company Act of 1940, the registrant has duly caused this report to be signed on its behalf by the undersigned, thereunto duly authorized.
Steward Funds, Inc.
| | |
| By: | | /s/ Michael L. Kern, III |
| | Michael L. Kern, III |
| | President |
| | (Principal Executive Officer) |
|
| Date: June 30, 2023 |
Pursuant to the requirements of the Securities Exchange Act of 1934 and the Investment Company Act of 1940, this report has been signed below by the following persons on behalf of the registrant and in the capacities and on the dates indicated.
| | |
| By: | | /s/ Michael L. Kern, III |
| | Michael L. Kern, III |
| | President |
| | (Principal Executive Officer) |
|
| Date: June 30, 2023 |
| |
| By: | | /s/ Monique D. Labbe |
| | Monique D. Labbe |
| | Treasurer |
| | (Principal Financial Officer) |
|
| Date: June 30, 2023 |
4