UNITED STATES
SECURITIES AND EXCHANGE COMMISSION
Washington, D.C. 20549
FORM 10-Q
[X] QUARTERLY REPORT PURSUANT TO SECTION 13 OR 15(d) OF THE SECURITIES EXCHANGE ACT OF 1934
For the quarterly period ended March 31, 2004
[ ] TRANSITION REPORT PURSUANT TO SECTION 13 OR 15(d) OF THE SECURITIES EXCHANGE ACT OF 1934
For the transition period from __________ to __________
Commission File Number 0-24796
CENTRAL EUROPEAN MEDIA ENTERPRISES LTD.
(Exact name of registrant as specified in its charter)
BERMUDA | N/A |
| (State or other jurisdiction of incorporation and organization) | (IRS Employer Identification No.) |
| Clarendon House, Church Street, Hamilton | HM CX Bermuda |
| (Address of principal executive offices) | (Zip Code) |
Registrant's telephone number, including area code: 441-296-1431
Indicate by check mark whether registrant: (1) has filed all reports required to be filed by Section 13 or 15 (d) of the Securities Exchange Act of 1934 during the preceding 12 months (or for each shorter period that the registrant was required to file such reports), and (2) has been subject to such filing requirements for the past 90 days.
Yes [ x] No [--]
Indicate by check mark whether the registrant is an accelerated filer (as defined by Rule 12b-2 of the Exchange Act)
Yes [ x] No [--]
Indicate the number of shares outstanding of each of the issuer's classes of common stock, as of the latest practicable date.
| Class | Outstanding as of May 3, 2004 |
|
|
| Class A Common Stock, par value $0.08 | 20,351,099 |
| Class B Common Stock, par value $0.08 | 7,334,736 |
CENTRAL EUROPEAN MEDIA ENTERPRISES LTD.
FORM 10-Q
For the quarterly period ended March 31, 2004
INDEX
| | Page |
Part I. Financial information | |
Item 1. Financial Statements | |
Consolidated Balance Sheets as at March 31, 2004 and December 31, 2003 | 3 |
Consolidated Statements of Operations for the Three Months Ended March 31, 2004 and 2003 | 5 |
Consolidated Statement of Shareholders' Equity for the Period from December 31, 2003 to March 31, 2004 | 7 |
Consolidated Statements of Cash Flows for the Three Months Ended March 31, 2004 and 2003 | 8 |
Notes to the Consolidated Financial Statements | 9 |
Item 2. Management's Discussion and Analysis of Financial Condition and Results of Operations | 23 |
Item 3. Quantitative and Qualitative Disclosures About Market Risk | 35 |
Item 4. Controls and Procedures | 36 |
Part II. Other Information | |
Item 1. Legal Proceedings | 37 |
Item 6. Exhibits and Reports on Form 8-K | 38 |
Signatures | 39 |
Exhibit Index | 39 |
Part I. Financial Information
Item 1. Financial Statements
CENTRAL EUROPEAN MEDIA ENTERPRISES LTD.
(US$000s, except share and per share data)
(Unaudited)
| | | | March 31, 2004 | | | December 31, 2003 (1) | |
ASSETS | | | | | | | |
Current Assets | | | | | | | |
| Cash and cash equivalents | | $ | 167,133 | | $ | 192,246 | |
| Restricted cash | | | 5,441 | | | 5,429 | |
| Accounts receivable (net of allowances of $5,869, $5,625, respectively) | | | 29,666 | | | 29,812 | |
| Other receivable | | | 20,207 | | | 20,103 | |
| Program rights | | | 17,906 | | | 10,160 | |
| Loans to related parties | | | 1,203 | | | 3,849 | |
| Other short-term assets | | | 6,181 | | | 5,292 | |
| | |
| |
| |
Total Current Assets | | | 247,737 | | | 266,891 | |
| Loans to related parties | | | 1,720 | | | 1,883 | |
| Investments in associated companies | | | 25,592 | | | 24,413 | |
| Property, plant and equipment (net of depreciation $58,932, $55,128, respectively) | | | 18,491 | | | 18,003 | |
| Other receivable | | | 18,200 | | | 18,200 | |
| Program rights | | | 8,568 | | | 9,682 | |
| Goodwill (Note 5) | | | 37,744 | | | 17,821 | |
| Other intangibles (Note 5) | | | 9,278 | | | 9,554 | |
| Other assets | | | 1,624 | | | 2,305 | |
| | |
| |
| |
Total Assets | | $ | 368,954 | | $ | 368,752 | |
| | |
| |
| |
(1) Restated to reflect the adoption of FASB Interpretation No. 46 (revised December 2003), “Consolidation of Variable Interest Entities” ("FIN 46 (R)").
CENTRAL EUROPEAN MEDIA ENTERPRISES LTD.
CONSOLIDATED BALANCE SHEETS (continued)
(US$000s, except share and per share data)
(Unaudited)
| | | | |
| | | | March 31, 2004 | | | December 31, 2003 (1) | |
LIABILITIES AND SHAREHOLDERS’ EQUITY | | | | | | | |
Current Liabilities: | | | | | | | |
| Accounts payable and accrued liabilities | | $ | 39,091 | | $ | 37,748 | |
| Duties and other taxes payable | | | 20,753 | | | 20,192 | |
| Income taxes payable | | | 4,096 | | | 12,991 | |
| Credit facilities and obligations under capital leases | | | 1,964 | | | 185 | |
| | |
| |
| |
Total Current Liabilities | | | 65,904 | | | 71,116 | |
Non-Current Liabilities | | | | | | | |
| Credit facilities and obligations under capital leases | | | 14,022 | | | 16,891 | |
| Income taxes payable | | | 5,000 | | | 6,000 | |
| Provision for losses in investments in associated companies | | | 70 | | | 227 | |
| | |
| |
| |
Total Non-Current Liabilities | | | 19,092 | | | 23,118 | |
| Minority interests in consolidated subsidiaries | | | 1,073 | | | 994 | |
| | | | | | | | |
SHAREHOLDERS' EQUITY: | | | | | | | |
Class A Common Stock, $0.08 par value: authorized: 100,000,000 shares at March 31, 2004 and December 31, 2003; issued and outstanding : 20,351,099 at March 31, 2004 and 19,269,766 at December 31, 2003 | | | 1,627 | | | 1,542 | |
Class B Common Stock, $0.08 par value: authorized: 15,000,000 shares at March 31, 2004 and December 31, 2003; issued and outstanding : 7,334,736 at March 31, 2004 and December 31, 2003 | | | 587 | | | 587 | |
| Additional paid-in capital | | | 377,700 | | | 372,662 | |
| Retained earnings/(accumulated deficit) | | | (100,828 | ) | | (105,999 | ) |
| Accumulated other comprehensive income/(loss) | | | 3,799 | | | 4,732 | |
| | |
| |
| |
Total shareholders' equity/(deficit) | | | 282,885 | | | 273,524 | |
| | |
| |
| |
Total liabilities and shareholders' equity | | $ | 368,954 | | $ | 368,752 | |
| | |
| |
| |
(1) Restated to reflect the adoption of FIN 46 (R).
All Class A and Class B Common Stock has been retrospectively adjusted to reflect the two-for-one stock splits which occurred on January 10, 2003 and November 5, 2003.
CENTRAL EUROPEAN MEDIA ENTERPRISES LTD.
CONSOLIDATED STATEMENTS OF OPERATIONS
(US$000s, except share and per share data)
(Unaudited)
| | | For the Three Months |
| | | EndedMarch 31 |
| | | 2004 | | 2003 (1) | |
Net revenues | | $ | 35,848 | | $ | 24,598 | |
| STATION EXPENSES: | | | | | | | |
| Operating costs | | | 6,071 | | | 5,916 | |
| Cost of programming | | | 13,613 | | | 10,905 | |
| Depreciation of station fixed assets and other intangibles | | | 1,462 | | | 1,315 | |
| | |
| |
| |
Total station operating costs and expenses | | | 21,146 | | | 18,136 | |
| Station selling, general and administrative expenses | | | 3,562 | | | 3,129 | |
| | |
| |
| |
Operating income/(loss) before corporate expenses | | | 11,140 | | | 3,333 | |
| CORPORATE EXPENSES: | | | | | | | |
| Corporate operating costs (excluding stock-based compensation) | | | 3,233 | | | 2,715 | |
| Stock-based compensation (Note 9) | | | 1,885 | | | 647 | |
| | |
| |
| |
Operating income/(loss) | | | 6,022 | | | (29 | ) |
| Interest income | | | 1,454 | | | 375 | |
| Interest expense | | | (218 | ) | | (4,991 | ) |
| Equity in income/(loss) of unconsolidated affiliates | | | 895 | | | (569 | ) |
| Other income/(expense) | | | (771 | ) | | (511 | ) |
| Foreign currency exchange gain/(loss), net | | | (633 | ) | | (2,081 | ) |
| | |
| |
| |
Income/(loss) before provision for income taxes, minority interest and discontinued operations | | | 6,749 | | | (7,806 | ) |
| Provision for income taxes | | | (1,170 | ) | | (285 | ) |
| | |
| |
| |
Income/(loss) before minority interest and discontinued operations | | | 5,579 | | | (8,091 | ) |
| Minority interest in (income)/loss of consolidated subsidiaries | | | (78 | ) | | (84 | ) |
| | |
| |
| |
Net income/(loss) from continuing operations | | | 5,501 | | | (8,175 | ) |
| Discontinued operations (Note 12): | | | | | | | |
| Pre-tax income/(loss) from discontinued operations (Czech Republic) | | | (330 | ) | | (3,112 | ) |
| | |
| |
| |
Net income/(loss) | | $ | 5,171 | | $ | (11,287 | ) |
| | |
| |
| |
(1) Restated to reflect the adoption of FIN 46 (R) and reclassified to reflect discontinued Czech Republic operations.
CENTRAL EUROPEAN MEDIA ENTERPRISES LTD.
CONSOLIDATED STATEMENTS OF OPERATIONS (continued)
(US$000s, except share and per share data)
(Unaudited)
| | | For the Three Months |
| | | EndedMarch 31 |
| | | 2004 | | 2003 (1) | |
| | | | | | | | |
| PER SHARE DATA: | | | | | | | |
| Net income/(loss) per share (Note 8) | | | | | | | |
| Continuing operations - Basic | | $ | 0.20 | | $ | (0.31 | ) |
| Continuing operations - Diluted | | $ | 0.18 | | $ | (0.31 | ) |
| Discontinued operations – Basic | | $ | (0.01 | ) | $ | (0.12 | ) |
| Discontinued operations – Diluted | | $ | (0.01 | ) | $ | (0.12 | ) |
| Total Net income/(loss) – Basic | | $ | 0.19 | | $ | (0.43 | ) |
| Total Net income/(loss) – Diluted | | $ | 0.17 | | $ | (0.43 | ) |
| | | | | | | | |
| Weighted average common shares used in computing per share amounts (2): | | | | | | | |
| Basic (‘000s) | | | 27,686 | | | 26,458 | |
| Diluted (‘000s) (3) - continuing | | | 30,008 | | | 26,458 | |
| Diluted (‘000s) (3) - discontinued | | | 27,686 | | | 26,458 | |
(1) Restated to reflect the adoption of FIN 46 (R) and reclassified to reflect discontinued Czech Republic operations.
(2) All per share data has been adjusted for the two-for-one stock splits which occurred on January 10, 2003 and November 5, 2003.
(3) Diluted EPS for the three months ended March 31, 2004 includes the impact of 2,322,384 stock options then outstanding. Diluted EPS for the three months ended March 31, 2003 does not include the impact of 1,700,316 stock options and 696,000 warrants then outstanding, as their inclusion would reduce the net loss per share and would be anti-dilutive.
CENTRAL EUROPEAN MEDIA ENTERPRISES LTD.
CONSOLIDATED STATEMENT OF SHAREHOLDERS' EQUITY
(US$ 000’s)
(Unaudited)
| | | Comprehensive Income/(Loss) | | Class A Common Stock | | Class B Common Stock | | Additional Paid-In Capital | | Accumulated Deficit | | Accumulated Other Comprehensive Income/(Loss) | | Total Shareholders' Equity/ (Deficit) |
BALANCE, December 31, 2003 (1) | | | | | $ | 1,542 | | $ | 587 | | $ | 372,662 | | $ | (105,999 | ) | $ | 4,732 | | $ | 273,524 | |
| Stock-based compensation | | | | | | | | | | | | 1,885 | | | | | | | | | 1,885 | |
| Stock options exercised | | | | | | 85 | | | | | | 3,153 | | | | | | | | | 3,238 | |
| Comprehensive income/(loss): | | | | | | | | | | | | | | | | | | | | | | |
| Net income/(loss) | | | 5,171 | | | | | | | | | | | | 5,171 | | | | | | 5,171 | |
| Other comprehensive income/(loss): | | | | | | | | | | | | | | | | | | | | | | |
| Unrealized translation adjustments | | | (933 | ) | | | | | | | | | | | | | | (933 | ) | | (933 | ) |
| | |
| | | | | | | | | | | | | | | | | | | |
| Comprehensive income/(loss) | | $ | 4,238 | | | | | | | | | | | | | | | | | | | |
| | |
| |
| |
| |
| |
| |
| |
| |
BALANCE, March 31, 2004 | | | | | $ | 1,627 | | $ | 587 | | $ | 377,700 | | $ | (100,828 | ) | $ | 3,799 | | $ | 282,885 | |
| | | | | |
| |
| |
| |
| |
| |
| |
(1) Restated to reflect the adoption of FIN 46 (R) and reclassified to reflect discontinued Czech Republic operations.
CENTRAL EUROPEAN MEDIA ENTERPRISES LTD.
CONSOLIDATED STATEMENTS OF CASH FLOWS
(US$ 000’s) - (Unaudited)
| | | For the Three Months |
| | | EndedMarch 31, |
| | | 2004 | | 2003 (1) | |
CASH FLOWS FROM OPERATING ACTIVITIES: | | | | | | | |
Net income/(loss) | | $ | 5,171 | | $ | (11,287 | ) |
| Adjustments to reconcile net income/(loss) to net cash used in operating activities: | | | | | | | |
| (Income)/loss from discontinued operations | | | 330 | | | 3,112 | |
| Equity in (income)/loss of unconsolidated affiliates | | | (895 | ) | | 569 | |
| Depreciation and amortization | | | 9,323 | | | 9,066 | |
| Interest received on loans | | | (767 | ) | | - | |
| Stock-based compensation | | | 1,885 | | | 647 | |
| Minority interest in loss of consolidated subsidiaries | | | 78 | | | 84 | |
| Foreign currency exchange (gain)/loss, net | | | 633 | | | 2,081 | |
| Net change in: | | | | | | | |
Restricted cash | | | (12 | ) | | 5,086 | |
Accounts receivable | | | (148 | ) | | 4,443 | |
Program rights costs | | | (10,385 | ) | | (9,244 | ) |
Other short-term assets | | | (723 | ) | | (366 | ) |
Accounts payable and accrued liabilities | | | (2,902 | ) | | (5,555 | ) |
Income and other taxes payable | | | (206 | ) | | (314 | ) |
| | |
| |
| |
Net cash provided by/(used in) continuing operating activities | | | 1,382 | | | (1,678 | ) |
| | |
| |
| |
CASH FLOWS FROM INVESTING ACTIVITIES: | | | | | | | |
| Acquisition of fixed assets | | | (2,281 | ) | | (1,882 | ) |
| Investments in subsidiaries and affiliates (2) | | | (16,894 | ) | | (5,039 | ) |
| Loans and advances to related parties | | | 163 | | | 607 | |
| License costs, other assets and intangibles | | | 67 | | | 1,488 | |
| | |
| |
| |
Net cash provided by/(used in) investing activities | | | (18,945 | ) | | (4,826 | ) |
| | |
| |
| |
CASH FLOWS FROM FINANCING ACTIVITIES: | | | | | | | |
| Cash facilities and payments under capital leases | | | (685 | ) | | 3,371 | |
| Issuance of stock | | | 3,238 | | | - | |
| Other long-term liabilities | | | - | | | (256 | ) |
| | |
| |
| |
Net cash received from/(used in) financing activities | | | 2,553 | | | 3,115 | |
| | |
| |
| |
NET CASH RECEIVED FROM/(USED IN) DISCONTINUED OPERATIONS | | | (9,334 | ) | | (3,110 | ) |
IMPACT OF EXCHANGE RATE FLUCTUATIONS ON CASH | | | (769 | ) | | 161 | |
| Net increase/(decrease) in cash and cash equivalents | | | (25,113 | ) | | (6,338 | ) |
CASH AND CASH EQUIVALENTS, beginning of period | | | 192,246 | | | 51,773 | |
| | |
| |
| |
CASH AND CASH EQUIVALENTS, end of period | | $ | 167,133 | | $ | 45,435 | |
| | |
| |
| |
| | | | | | | | |
| SUPPLEMENTAL INFORMATION OF CASH FLOW INFORMATION: | | | | | | | |
| Cash paid for interest | | $ | 144 | | $ | 7,758 | |
| Cash paid for income taxes (net of refunds) | | $ | 9,539 | | $ | 454 | |
| | | | | | | | |
(1) Restated to reflect the adoption of FIN 46 (R) and reclassified to reflect discontinued Czech Republic operations.
(2) For the three months ended March 31, 2004, Investments in subsidiaries and affiliates excluded non-cash investing activities of US$ 3.4 million relating to our increased investment in our Romanian operations. For further information, see Note 4, "Acquisitions and Disposals".
CENTRAL EUROPEAN MEDIA ENTERPRISES LTD.
Notes to the Consolidated Financial Statements
March 31, 2004
1. Basis of Presentation
Central European Media Enterprises Ltd. is a Bermuda company that, together with its subsidiaries and affiliates, invests in, develops and operates national and regional commercial television stations and networks in Central and Eastern Europe. At present, we have operations in Romania, the Slovak Republic, Slovenia and Ukraine.
The interim statements for the three months ended March 31, 2004 should be read in conjunction with the Notes to the Consolidated Financial Statements contained in our December 31, 2003 Form 10-K filed with the Securities and Exchange Commission ("SEC") on February 25, 2004 as amended by our Form 10-K/A filed with the SEC on March 12, 2004. In the opinion of management, the interim unaudited financial statements included herein reflect all adjustments necessary, consisting of normal recurring adjustments, for a presentation in conformity with United States Generally Accepted Accounting Principles ("US GAAP"). The consolidated results of operations for interim periods are not necessarily indicative of the results to be expected for a full year.
The preparation of financial statements in conformity with US GAAP requires management to make estimates and assumptions that affect the reported amounts of assets and liabilities and disclosure of contingent assets and liabilities at the date of the financial statements and the reported amounts of revenues and expenses during the reporting year. Actual results could differ from those estimates. Our significant accounting policies have not materially changed since our disclosure in Part II, Item 8, “Financial Statements and Supplementary Data” of our December 31, 2003 Form 10-K filed with the SEC on February 25, 2004 as amended by our Form 10-K/A filed with the SEC on March 12, 2004.
The consolidated financial statements include the accounts of Central European Media Enterprises Ltd. and investments in entities over which we have control. We consolidate the financial statements of entities in which we hold more than a majority voting interest and also those entities which are deemed to be a Variable Interest Entity of which we are the primary beneficiary as defined by FASB Interpretation No. 46 (revised December 2003), “Consolidation of Variable Interest Entities” ("FIN 46 (R)"). Entities in which we hold less than a majority voting interest but over which we have the ability to exercise significant influence are accounted for using the equity method. Other investments are accounted for using the cost method.
Following the adoption of FIN 46 (R), we now consolidate Studio 1+1, a license holding and broadcasting company in Ukraine. It is within the Ukraine operations and trades with the other companies within the group. Studio 1+1 has been consolidated retrospectively within the presented financial statements. The effect of restatement on the balance sheet for the comparable period is to remove from the balance sheet the net liabilities of Studio 1+1, previously classified under “Provision for losses in investments in associated companies” and this is replaced by the separable assets and liabilities of the entity. The effect of restatement on the Income Statement for the comparable period is to remove from the income statement the one line adjustment of our share of Studio 1+1’s results for the period previously classified under “Equity in income/(loss) of unconsolidat ed affiliates” and this is
replaced by amounts within the separable income and expense lines. For further information, see Note 2, "Group Operations" and Note 3, "Recent Accounting Pronouncements".
Certain reclassifications were made to prior period amounts to conform to current period classifications.
We, like other television operators, experience seasonality, with advertising sales tending to be lowest during the third quarter of each calendar year, which includes the summer holiday period (typically July and August), and highest during the fourth quarter of each calendar year.
On June 19, 2003, the Board of Central European Media Enterprises Ltd. decided to withdraw from our Czech operations. The revenues and expenses of the Czech operations and the income from an arbitration award relating to our former Czech operations and related legal expenses have therefore all been treated as discontinued operations and have been reclassified. For additional information, see Note 12, "Discontinued Operations".
Stock-based Compensation
Stock-based compensation costs are determined when options are issued and are measured under the fair value method as defined in SFAS 123, "Accounting for Stock-based Compensation" ("SFAS 123"). We adopted SFAS 123 prospectively for employee stock option awards granted, modified, or settled beginning January 1, 2003, as contemplated by SFAS 148, "Accounting for Stock-based Compensation - Transition & Disclosure" ("SFAS 148"). In prior periods, we used the intrinsic method of accounting as defined in APB 25, "Accounting for Stock Issued to Employees" ("APB 25")
Pro Forma Disclosures
Had compensation costs for employee stock option awards granted, modified or settled prior to January 1, 2003 been determined consistent with the fair value approach required by SFAS 123 for all periods presented, using the Black-Scholes option pricing model with the assumptions as estimated on the date of each grant, our net income/(loss) and net income/(loss) per common share would decrease/(increase) to the following pro forma amounts:
| | | | For the Three Months Ended March 31, (US$ 000’s, except per share data) |
| | | | | |
| |
| | | | | | | 2004 | | | 2003 | |
| | | | | |
| |
| |
| | | | | | | | | | | |
| Net Income/(Loss) | | | As Reported | | $ | 5,171 | | $ | (11,287 | ) |
| Add: Stock-based employee compensation expense included in reported net income, net of related tax effects | | | As Reported | | | 1,885 | | | 647 | |
| Deduct: Total stock-based employee compensation expense determined under fair value based method for all awards, net of related tax effects | | | Pro Forma Expense | | | (1,939 | ) | | (774 | ) |
| | | | | |
| |
| |
| Net Income/(Loss) | | | Pro Forma | | $ | 5,117 | | $ | (11,414 | ) |
| | | | | |
| |
| |
| | | | | | | | | | | |
| Net Income/(Loss) Per Common Share – Basic: | | | As Reported | | $ | 0.19 | | $ | (0.43 | ) |
| | | | Pro Forma | | $ | 0.18 | | $ | (0.43 | ) |
| | | | | | | | | | | |
| Net Income/(Loss) Per Common Share –Diluted: | | | As Reported | | $ | 0.17 | | $ | (0.43 | ) |
| | | | Pro Forma | | $ | 0.17 | | $ | (0.43 | ) |
2. Group Operations
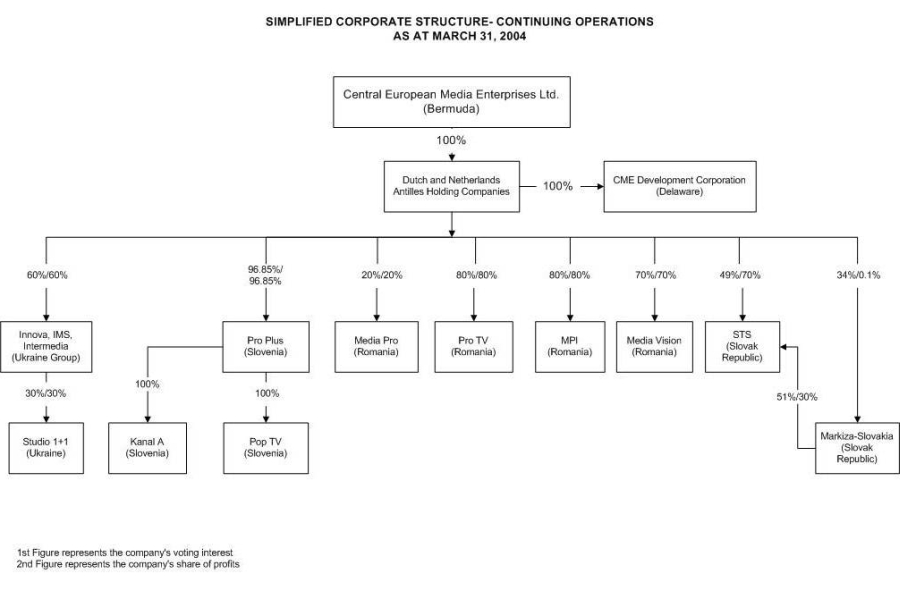
Central European Media Enterprises Ltd. was incorporated on June 15, 1994 under the laws of Bermuda. Our assets are held through a series of Dutch and Netherlands Antilles holding companies. In each market, we have interests both in license companies and in operating companies. License companies have been authorized by the relevant local regulatory authority to engage in television broadcasting in accordance with the terms of a particular license. Revenues are generated primarily through operating companies which acquire programming for broadcast by the corresponding license holding company and have agreements to sell advertising time on behalf of the license company to third parties. In Romania and Ukraine, the license company also acts as an operating company. Our share of profits in the operating companies corresponds with our voting interest other than in the Slovak Republic, wh ere we are entitled by contract to a share of profits that is in excess of our voting interest. Below is an overview of our operating structure, the accounting treatment for each entity and a chart entitled “Simplified Corporate Structure - Continuing Operations”.
Key Subsidiaries and Affiliates as at March 31, 2004 | | Voting Interest | | Share of Profits | | Accounting Treatment | | TV Network |
| |
| |
| |
| |
|
Continuing Operations | | | | | | | | |
| | | | | | | | |
Romania | | | | | | | | |
| Operating Companies: | | | | | | | | |
| | | | | | | | |
Media Pro International S.A. (MPI) | | 80% | | 80% | | Consolidated Subsidiary | | |
| Media Vision S.R.L. (Media Vision) | | 70% | | 70% | | Consolidated Subsidiary | | |
| License Companies: | | | | | | | | |
| | | | | | | | |
| Pro TV S.A. - formerly Pro TV S.R.L. (Pro TV) | | 80% | | 80% | | Consolidated Subsidiary | | PRO TV, ACASA, PRO CINEMA and PRO TV INTERNATIONAL |
| Media Pro S.R.L. (Media Pro) | | 20% | | 20% | | Equity Accounted Affiliate | | PRO FM (radio) |
Slovenia | | | | | | | | |
| Operating Company: | | | | | | | | |
| | | | | | | | |
| Produkcija Plus, d.o.o. (Pro Plus) | | 96.85% | | 96.85% | | Consolidated Subsidiary | | |
| License Companies: | | | | | | | | |
| | | | | | | | |
| Pop TV d.o.o. (Pop TV) | | 96.85% | | 96.85% | | Consolidated Subsidiary | | POP TV |
| Kanal A d.o.o. (Kanal A) | | 96.85% | | 96.85% | | Consolidated Subsidiary | | KANAL A |
Slovak Republic | | | | | | | | |
| Operating Company: | | | | | | | | |
| | | | | | | | |
| Slovenska Televizna Spolocnost, spol. s.r.o. (STS) | | 49% | | 70% | | Equity Accounted Affiliate | | |
| License Company: | | | | | | | | |
| | | | | | | | |
| Markiza-Slovakia s.r.o. (Markiza) | | 34% | | 0.1% | | Equity Accounted Affiliate | | MARKIZA TV |
Ukraine | | | | | | | | |
| Operating Companies: | | | | | | | | |
| | | | | | | | |
| Innova Film GmbH (Innova) | | 60% | | 60% | | Consolidated Subsidiary | | |
| International Media Services Ltd. (IMS) | | 60% | | 60% | | Consolidated Subsidiary | | |
| Enterprise "Inter-Media" (Inter-Media) | | 60% | | 60% | | Consolidated Subsidiary | | |
| License Company: | | | | | | | | |
| | | | | | | | |
| Broadcasting Company "Studio 1+1" (Studio 1+1) | | 18% | | 18% | | Consolidated Variable Interest Entity | | STUDIO 1+1 |
Romania
During March 2004 Adrian Sarbu, a local shareholder and the General Director of our Romanian operations acquired control of Rootland Trading Limited from Ion Tiriac, the other key local shareholder in our Romanian operations. On March 29, 2004 we acquired an additional 14% of MPI and Pro TV SA from Rootland Trading Limited to increase our stake in both companies from 66% to 80%.
We now have an 80% voting interest in Pro TV SA, the television license and operating holding company. We also have an 80% voting interest in MPI, a service providing company. For both companies we are entitled to an 80% share of their profits. Pro TV SA holds 21 of the 22 PRO TV licenses as well as the licenses for ACASA, PRO TV INTERNATIONAL and PRO CINEMA. We have the right to appoint three of the five members of the Council of Administration of each company, which directs the affairs of Pro TV SA and MPI. Although we have majority voting power in MPI and Pro TV SA, with respect to certain financial and corporate matters, the affirmative vote of Adrian Sarbu is required. These minority rights are in the nature of protective rights which are not an impediment to operation of the business or consolidation for accounting purposes.
In addition, in Romania, we have a 70% voting interest and share of profits in Media Vision SRL ("Media Vision"), a production and subtitling company.
The licenses for the PRO FM and PRO AM radio networks are held by Media Pro Srl, in which we hold 20% of the voting interest and share of profits. This stake was reduced from 44% on March 31, 2004 in order to comply with the Romanian media law. The remainder is owned by Mr. Sarbu and Rootland Trading Limited.
Slovenia
We have a 96.85% voting interest in Pro Plus, the operating company for our Slovenian operations, and are entitled to a 96.85% share of its profits. Pro Plus has a 100% voting interest and share of profits in Pop TV and Kanal A, giving us a 96.85% voting interest and share of profits in these companies. Pop TV holds all of the licenses for the operation of the POP TV network and Kanal A holds all licenses for the KANAL A network. Pro Plus has entered into an agreement with each of Pop TV and Kanal A under which Pro Plus provides all programming to the POP TV network and the KANAL A network and sells advertising on behalf of each network.
Slovak Republic
We have a 49% voting interest and are entitled to a 70% share of profits inSTS, the operating company for the MARKIZA TV network. We havea 34% voting interest in Markiza, the license holding company for theMARKIZA TV network, and are entitled to a 0.1% share of its profits.
Ukraine
Innova, IMS, Inter-Media and Studio 1+1 comprise "The Studio 1+1 Group". Through our 60% voting interest in Innova which in turn holds 100% of Inter-Media we control Inter-Media's 30% voting interest in Studio 1+1, the license holding company for the STUDIO 1+1 network and have an 18% economic interest in Studio 1+1. We are entitled to a 60% share of the profits in the operating companies servicing Studio 1+1 (Innova, IMS and Inter-Media).
3. Recent Accounting Pronouncements
Variable Interest Entities
In January 2003, the FASB issued Interpretation No. 46, "Consolidation of Variable Interest Entities, an Interpretation of ARB No. 51," ("FIN 46") which requires all variable interest entities ("VIEs") to be consolidated by the primary beneficiary. The primary beneficiary is the entity that holds the majority of the beneficial interests in the VIE. In addition, the interpretation expands disclosure requirements both
for VIEs that are consolidated and for VIEs in which the entity holds a significant but not a majority beneficial interest.
In December 2003, the FASB issued FASB Interpretation No. 46 (revised December 2003), “Consolidation of Variable Interest Entities” ("FIN 46 (R)"). We determined that one entity (Studio 1+1) should be consolidated. Studio 1+1 has been consolidated retrospectively within the presented financial statements.
Studio 1+1 is a license holding and broadcasting company in Ukraine. It is within the Ukraine operations and trades with the other companies within the group.
The adoption of FIN 46 (R) has not resulted in a cumulative effect of an accounting change, but we have increased our assets as of March 31, 2004 by US$ 6.1 million (December 31, 2003: US$ 3.0 million) and have increased our net revenues by US$ 3.9 million for the first three months of 2004 (2003: US$ 1.1 million). Loans and guarantees to other consolidated entities related to this variable interest entity total US$ 2.8 million as at March 31, 2004 and US$ 2.7 million as at December 31, 2003.
EITF Issue No. 03-1
EITF 03-1 "The Meaning of Other-Than-Temporary Impairment and Its Application to Certain Investments" is effective for fiscal years ending after December 15, 2003. The Abstract determines the meaning of other-than-temporary impairment and its application to investments classified as either available-for-sale or held-to-maturity under Statement 115 and investments accounted for under the cost method. The adoption of the provisions of EITF Issue No. 03-1 has had no effect on our results of operations and financial position.
EITF Issue No. 03-11
The Emerging Issues Task Force of the Financial Accounting Standards Board (EITF) at its July 2003 meeting came to a consensus concerning EITF Issue No. 03-11, “Reporting Realized Gains and Losses on Derivative Instruments That Are Subject to FASB Statement No. 133 and Not ‘Held for Trading Purposes’ as Defined in Issue No. 02-03.” The consensus reached was that determining realized gains and losses on physically settled derivative contracts not held for trading purposes reported in the income statement on a gross or net basis is a matter of judgment that depends on the relevant facts and circumstances. The adoption of the provisions of EITF Issue No. 03-11 has had no effect on our results of operations and financial position.
4. Acquisitions and Disposals
Romania
Acquisition of MPI and Pro TV SA
On March 29, 2004, we acquired an additional 14% share in each of our consolidated subsidiaries MPI and Pro TV SA from Rootland Trading Limited for purchase consideration of US$ 20.3 million. Rootland Trading Limited is controlled by Mr. Adrian Sarbu, who is the General Director of our Romanian operations. This acquisition brought our total voting interest and share of profits to 80% in both companies.
The consideration for the acquisition consisted of US$ 16.9 million cash and the settlement of loans receivable due from companies controlled by Mr. Adrian Sarbu that he had personally guaranteed (Inter-Media srl: US$ 1.8 million and Media Pro Pictures: US$ 1.6 million).
The purchase price was agreed by reference to an independent valuation report which was based on a multiple of MPI's and Pro TV SA's future earnings. Due to the transaction occurring completing on March 29, 2004, we were unable to complete the fair value exercise to allocate this purchase price to the acquired assets and liabilities. Upon completion of our fair value exercise, the purchase price allocation will include the broadcast license intangible asset and other intangible
assets identified by our fair value exercise. We have therefore provisionally recognized additional goodwill of US$ 20.3 million arising from these acquisitions which may be subject to adjustment following the completion of our fair value exercise.
Put Options
During the negotiations to purchase our additional interest in MPI and Pro TV SA, we agreed to enter into a put option arrangement with Mr. Adrian Sarbu which would oblige us to acquire the remaining minority interests in MPI and Pro TV SA held by Mr. Sarbu and Rootland Trading Limited during periods subsequent to 2006.
Once agreed, it is intended that:
a) between March 2006 and March 2009 Mr. Adrian Sarbu may directly sell or cause Rootland Trading Limited to sell to us an additional 5% of the outstanding stock of MPI and Pro TV SA; and
b) from March 2009 Mr. Adrian Sarbu may sell to us all the remaining stock in both companies.
Both put options are expected to be at exercise prices to be determined by independent valuations that approximate fair value at the time of exercise.
Disposal of Interest in Media Pro SRL
In light of our acquisition of MPI and Pro TV SA and in order to comply with Romanian Media Council regulations it was necessary to reduce our holding in Media Pro SRL, a radio license holding company, from 44% to 20%. Therefore on March 29, 2004, we sold a 24% holding in Media Pro SRL to Mr. Adrian Sarbu for consideration of US$ 40,000 with a resulting loss on disposal of US$ 18,000. The consideration was determined by an independent valuation of Media Pro SRL.
5. Goodwill and Intangible Assets
The carrying amount of goodwill and other intangibles as at March 31, 2004 and December 31, 2003 is as follows:
Goodwill:
| | | | Slovenian operations | | | Ukrainian operations | | | Romanian operations | | | Total | |
| | (US$000’s) | |
Carrying amount as at December 31, 2003 | | $ | 13,725 | | $ | 4,096 | | $ | - | | $ | 17,821 | |
| Additions in the period | | | - | | | - | | | 20,300 | | | 20,300 | |
| Foreign exchange movements | | | (377 | ) | | - | | | - | | | (377 | ) |
| | |
| |
| |
| |
| |
Carrying amount as at March 31, 2004 | | $ | 13,348 | | $ | 4,096 | | $ | 20,300 | | $ | 37,744 | |
| | |
| |
| |
| |
| |
Other intangibles:
| | | | License acquisition cost | | | Broadcast license | | | Trademarks | | | Total | |
| | (US$000’s) | |
Carrying amount as at December 31, 2003 | | $ | 1,628 | | $ | 5,447 | | $ | 2,479 | | $ | 9,554 | |
| Foreign exchange movements | | | - | | | (217 | ) | | (59 | ) | | (276 | ) |
| | |
| |
| |
| |
| |
Carrying amount as at March 31, 2004 | | $ | 1,628 | | $ | 5,230 | | $ | 2,420 | | $ | 9,278 | |
| | |
| |
| |
| |
| |
All license costs and other intangibles are assets with indefinite useful lives and are subject to annual impairment reviews as required.
6. Segment Data
We manage our business on a geographic basis, and review the performance of each geographic segment using data that reflects 100% of operating and license company results. Our segments are comprised of Romania, the Slovak Republic, Slovenia and Ukraine.
We evaluate the performance of our segments based on Segment EBITDA. Segment EBITDA includes STS and Markiza (our operating and license companies in the Slovak Republic) which are not consolidated under US GAAP.
Segment EBITDA is determined as segment net income/loss, which includes costs for program rights amortization, before interest, taxes, depreciation and amortization of intangible assets. Items that are not allocated to our segments for purposes of evaluating their performance, and therefore are not included in Segment EBITDA, include:
| · | expenses presented as corporate expenses in our consolidated statements of operations (i.e., corporate operating costs and stock-based compensation); |
| | |
| · | changes in the fair value of derivatives; |
| | |
| · | foreign currency exchange gains and losses; |
| | |
| · | certain unusual or infrequent items (e.g., gains and losses/impairments on assets or investments). |
Segment EBITDA is also used as a target for management bonuses.
Below is a table showing our Segment EBITDA by operation and reconciling these figures to our consolidated US GAAP results for the three months ended March 31, 2004 and 2003:
| | | SEGMENT FINANCIAL INFORMATION |
| | | For the Three Months Ended March 31, |
| | | (US $000's) |
| | | Segment Net Revenues (1) | Segment EBITDA |
| | | | 2004 | | | 2003 | | | 2004 | | | 2003 | |
| | |
| |
| |
| |
| |
Country | | | | | | | | | | | | | |
| | | | | | | | | | | | | |
| Romania (PRO TV, ACASA and PRO TV INTERNATIONAL) | | $ | 14,085 | | $ | 9,248 | | $ | 4,318 | | $ | 1,473 | |
| Slovak Republic (MARKIZA TV) | | | 11,895 | | | 9,488 | | | 1,331 | | | 912 | |
| Slovenia (POP TV and KANAL A) | | | 9,657 | | | 7,809 | | | 3,927 | | | 1,996 | |
| Ukraine (STUDIO 1+1) | | | 12,106 | | | 7,541 | | | 4,357 | | | 1,179 | |
| | |
| |
| |
| |
| |
Total Segment Data | | $ | 47,743 | | $ | 34,086 | | $ | 13,933 | | $ | 5,560 | |
| | |
| |
| |
| |
| |
| | | | | | | | | | | | | | |
Reconciliation to Consolidated Statement of Operations: | | | | | | | | | | | | | |
Consolidated Net Revenues / Income/(loss) before provision for income taxes, minority interest and discontinued operations | | | $ 35,848 | | | $ 24,598 | | | $ 6,749 | | | $ (7,806 | ) |
| Corporate operating costs | | | - | | | - | | | 3,233 | | | 2,715 | |
| Stock-based compensation | | | - | | | - | | | 1,885 | | | 647 | |
Unconsolidated Equity Affiliate: | | | | | | | | | | | | | |
| Slovak Republic (MARKIZA TV) | | | 11,895 | | | 9,488 | | | 1,331 | | | 912 | |
| Station Depreciation | | | - | | | - | | | 1,462 | | | 1,315 | |
| Interest income | | | - | | | - | | | (1,454 | ) | | (375 | ) |
| Interest expense | | | - | | | - | | | 218 | | | 4,991 | |
| Equity in (income)/loss of unconsolidated equity affiliates | | | - | | | - | | | (895 | ) | | 569 | |
| Other (income)/expense | | | - | | | - | | | 771 | | | 511 | |
| Foreign currency exchange (gain)/loss, net | | | - | | | - | | | 633 | | | 2,081 | |
| | |
| |
| |
| |
| |
Total Segment Data | | $ | 47,743 | | $ | 34,086 | | $ | 13,933 | | $ | 5,560 | |
| | |
| |
| |
| |
| |
(1) All net revenues are derived from external customers and there are no inter-segmental revenues.
7. Summary Financial Information for Significant Unconsolidated Affiliates
| | | STS (MARKIZA TV) |
| | |
| |
| | | | As at March 31, 2004 | | | As at December 31, 2003 | |
| | |
| |
| |
| | | | (US$ 000's | ) | | (US$ 000's | ) |
| | |
| |
| |
| Current assets | | $ | 22,340 | | $ | 21,224 | |
| Non-current assets | | | 14,475 | | | 14,831 | |
| Current liabilities | | | (13,393 | ) | | (13,249 | ) |
| Non-current liabilities | | | (2,479 | ) | | (2,457 | ) |
| | |
| |
| |
| Net Assets | | $ | 20,943 | | $ | 20,349 | |
| | |
| |
| |
| | | STS (MARKIZA TV) |
| | |
| |
| | | For the Three Months Ended March 31, |
| | |
| |
| | | | 2004 | | | 2003 | |
| | |
| |
| |
| | | (US$ 000's) | | | (US$ 000's) | |
| | |
| |
| |
| Net revenues | | $ | 11,895 | | $ | 9,488 | |
| Operating income/(loss) | | | 724 | | | (53 | ) |
| Net income/(loss) | | | 803 | | | 126 | |
| Movement in accumulated other comprehensive income/(loss) | | | 61 | | | (737 | ) |
Our share of income/(loss) in Unconsolidated Affiliates for STS was a profit of US$ 0.7 million and US$ 0.1 million for the first three months of 2004 and 2003, respectively.
Following the adoption of FIN 46 (R), we now consolidate Studio 1+1 which was previously accounted for as an unconsolidated affiliate.
8. Earnings Per Share
We account for earnings per share pursuant to FAS No. 128, “Earnings Per Share". Basic net income per common share (“Basic EPS”) is computed by dividing net income by the weighted average number of common shares outstanding. Diluted net income per common share (“Diluted EPS”) is computed by dividing net income by the weighted average number of common shares and dilutive common share equivalents then outstanding. FAS No. 128 requires the presentation of both Basic EPS and Diluted EPS on the face of the consolidated statement of operations. A reconciliation between the numerator and denominator of Basic EPS and Diluted EPS is as follows:
| | | For the Three Months Ended March 31, | |
| | |
| |
| | | Net Income/(Loss)(US$ 000's) | | Common Shares (000's) | | Net Income/(Loss) per Common Share | |
| | |
| |
| |
| |
| | | | 2004 | | | 2003 | | | 2004 | | | 2003 | | | 2004 | | | 2003 | |
| | |
| |
| |
| |
| |
| |
| |
| Basic EPS | | | | | | | | | | | | | | | | | | | |
| | | | | | | | | | | | | | | | | | | |
| Net income/(loss) attributable to common stock | | $ | 5,171 | | $ | (11,287 | ) | | 27,686 | | | 26,458 | | $ | 0.19 | | $ | (0.43 | ) |
| Effect of dilutive securities : stock options | | | - | | | - | | | 2,322 | | | - | | $ | (0.02 | ) | | - | |
| | |
| |
| |
| |
| |
| |
| |
| Diluted EPS | | | | | | | | | | | | | | | | | | | |
| | | | | | | | | | | | | | | | | | | |
| Net income/(loss) attributable to common stock | | $ | 5,171 | | $ | (11,287 | ) | | 30,008 | | | 26,458 | | $ | 0.17 | | $ | (0.43 | ) |
| | |
| |
| |
| |
| |
| |
| |
Diluted EPS for the three months ended March 31, 2004 includes the impact of 2,322,384 stock options then outstanding.
Diluted EPS for the three months ended March 31, 2003 does not include the impact of 1,700,316 stock options and 696,000 warrants then outstanding, as their inclusion would reduce the net loss per share and would be anti-dilutive.
On a fully diluted basis, we would have 22,531,484 shares of Class A Common Stock and 7,476,736 shares of Class B Common Stock as at March 31, 2004, and 21,444,252 shares of Class A Common Stock and 8,080,736 shares of Class B Common Stock as at March 31, 2003.
9. Stock-based Compensation
Stock-based compensation costs are determined when options are issued and are measured under the fair value method as defined in SFAS 123. We adopted SFAS 123 prospectively for employee stock option awards granted, modified, or settled beginning January 1, 2003, as contemplated by SFAS 148. In prior periods, we used the intrinsic method of accounting as defined in APB 25.
2004 Option Grants
Pursuant to the 1995 Amended Stock Option Plan, the Compensation Committee awarded 160,000 stock options, with vesting periods of 4 years, to Mr. Michael Garin, the Chief Executive Officer on February 2, 2004. The fair value of the option grant is estimated on the date of the grant using the Black-Scholes option pricing model, with the following assumptions used:
| Date of Option Grant | Risk Free Interest Rate |
| February 2, 2004 – 5 year rate | 3.18% |
Expected dividend yields for this award is assumed to be 0%; the expected life is estimated at 6 years; expected stock price volatility is calculated as 43.7% based on the preceding one year's daily closing prices. This basis represents the best indicator of expected volatility over the life of the option. The weighted average fair value of the grant made in the first quarter of 2004 is US$ 9.04 per option. No stock options were granted in the first quarter of 2003.
In accordance with SFAS 123 the total fair value for the award of US$ 1.4 million is recognized in the Statement of Operations using straight line amortization over the vesting period of the award. In the three months to March 31, 2004 a total charge of US$ 0.1 million was recognized (three months to March 31, 2003, US$ nil).
For certain options issued in 2000, our stock-based employee compensation charge is calculated according to FASB Interpretation 44, "Accounting for Certain Transactions involving Stock Compensation" ("FIN 44"). This requires that compensation costs for modified awards are adjusted for increases and decreases in the intrinsic value in subsequent periods until that award is exercised, forfeited or expires unexercised; subject to a minimum of the original intrinsic value at the original measurement date. For the first quarters of 2004 and 2003 there were charges of US$ 1.7 million and US$ 0.6 million, respectively in respect of variable plan accounting. This was a result of the increase in our stock price from US$ 17.50 to US$ 18.67 in the first three months of 2004 and from US$ 5.88 to US$ 6.48 in the first three months of 2003. Prior to the adoption of SFAS 123 we followed APB 25, "Accounting for Stock Issued to Employee", for all employee stock option awards granted, modified or settled before January 1, 2003.
The charge for stock-based employee compensation in our consolidated income statement can be summarized as follows:
| | | For the Three Months Ended March 31, (US$ 000’s) |
| | |
| |
| | | | 2004 | | | 2003 | |
| | |
| |
| |
| Stock-based compensation charged under FIN 44 (Variable Plan Accounting) | | $ | 1,726 | | $ | 647 | |
| Stock-based compensation charged under SFAS 123 | | | 159 | | | - | |
| | |
| |
| |
| Total stock-based compensation | | $ | 1,885 | | $ | 647 | |
| | |
| |
| |
10b5-1Trading Plan
Fred T. Klinkhammer, our Vice-Chairman, advised the Board that he intends to sell up to 900,000 shares of Class A common stock between March 1 and December 31, 2004 under a 10b5-1 Trading
Plan entered into pursuant to our insider trading policy. Fred T. Klinkhammer sold 200,000 shares of Class A common stock through April 30, 2004.
10. Warrants
As a result of our 2002 transaction with GoldenTree Asset Management LLC, 696,000 Class A warrants with an exercise price of US$ 2.504 were registered with the SEC on February 4, 2004 and exercised on February 19, 2004. We received US$ 1.7 million on exercise and the stock issued is included in our 20,351,099 of Class A Common Stock outstanding as at May 3, 2004.
11. Commitments and Contingencies
Litigation
Ukraine
In our Form 10-K filed with the SEC for the year ended December 31, 2003 as amended by our Form 10-K/A filed with the SEC on March 12, 2004, we reported that AITI, a television station in Ukraine, commenced a second court action in Ukraine against the Ukraine Media Council challenging certain aspects of the granting to Studio 1+1 its television broadcast license in Ukraine. Studio 1+1 was involved in this litigation as a third party acting together with the Ukraine Media Council. The claim was almost identical to one which was previously brought by AITI and was dismissed on April 5, 2001 by the Supreme Arbitration Court of Ukraine.
AITI’s allegations were that Studio 1+1 has, in effect, been granted two licenses by the Ukraine TV Council, entitling it to in excess of 32 hours of broadcast time a day on Ukraine's nationwide Channel N2 (UT-2). Further, AITI alleged that Studio 1+1 never paid the required license fee. After the more senior Court of Cassation had ruled on November 1, 2002 that the lower Economic Court of Kiev must re-hear the case, a court date of February 5, 2003 was set. On April 9, 2003 the Economic Court of Kiev dismissed the claim brought by AITI. This judgment was appealed by AITI to the Court of Appeal, which upheld the ruling by way of a decision handed down on June 19, 2003.
AITI subsequently appealed to the Court of Cassation, which initially rejected their request for an appeal on the grounds it was incorrectly filed. AITI requested that the Supreme Court of Ukraine rule that the appeal must be accepted for consideration by the Court of Cassation. The Supreme Court of Ukraine subsequently ordered that the Court of Cassation should accept the appeal and the hearing took place on April 6, 2004. The Court rejected AITI's appeal and it has 30 days in which to appeal to the Supreme Court, which is the final court of appeal in Ukraine. If no appeal is lodged by May 6, 2004 the court action will end in favor of the Ukraine Media Council and Studio 1+1.
We believe that the claim brought by AITI is groundless and will assist in the pursuit of the defense of this matter vigorously. The Economic Court of Kiev’s ruling dismissing AITI’s claim on April 9, 2003, the Court of Appeal's affirmation of that decision on June 19, 2003 and the Court of Cassation's affirmation on April 6, 2004 supports our belief that any appeal by AITI to the Supreme Court will be rejected. However, if the decision in the Ukraine court system is ultimately unfavorable, it could result in the loss of the broadcast license of Studio 1+1.
Slovenia
On November 20, 2002, we received notice of a claim filed by Mrs. Zdenka Meglic, the founder and a former shareholder of MMTV 1 d.o.o (MMTV), against MMTV, a subsidiary of CME Slovenia BV. In her claim against MMTV, Mrs. Meglic is seeking damages in the amount of SIT 190 million (approximately US$ 0.9 million) for repayment of monies advanced to MMTV from 1992 to 1994 (in the amount of approximately SIT 29 million (approximately US$ 0.1 million)) plus accrued interest. We believe Mrs. Meglic’s claim is without merit and will defend the claim vigorously.
General
We are, from time to time, a party to litigation that arises in the normal course of our business operations. Other than those claims discussed above, we are not presently a party to any such litigation which could reasonably be expected to have a material adverse effect on our business or operations.
Licenses
We believe that the licenses for the television license companies will be renewed prior to expiry. In Romania, the Slovak Republic and Slovenia local regulations do contain a qualified presumption for extensions of broadcast licenses; however, there can be no assurance that any of the licenses will be renewed upon expiration of their initial term. The failure of any such license to be renewed could adversely affect the results of our operations. However, to date, licenses have been renewed in the ordinary course of business. Access to the available frequencies is controlled by regulatory bodies in each country in which we operate.
Station Programming Rights Agreements
We had program rights commitments of US$ 15.8 million and US$ 3.2 million in respect of future programming which includes contracts signed with license periods starting after March 31, 2004 and 2003, respectively. US$ 6.7 million of our program rights commitments as at March 31, 2004 related to our Ukrainian operations and US$ 8.9 million related to our Romanian operations. This increase is as a result of our Ukrainian and Romanian operations entering into longer term contracts with programming providers.
Operating Lease Commitments
For the periods ended March 31, 2004 and 2003 we paid aggregate rent on all facilities of US$ 0.2 million and US$ 0.2 million, respectively. Future minimum operating lease payments at March 31, 2004 for non-cancelable operating leases with remaining terms in excess of one year (net of amounts to be recharged to third parties) are payable as follows:
| | As at March 31, 2004 (US$ 000’s) |
|
|
| 2004 | $ 1,549 |
| 2005 | 1,167 |
| 2006 | 1,167 |
| 2007 | 1,167 |
| 2008 | 935 |
| 2009 and thereafter | 734 |
|
|
Total | $ 6,719 |
|
|
Dutch Tax
On February 9, 2004 we entered into an agreement with the Dutch tax authorities to settle all outstanding years up to and including 2003 for a payment of US$ 9 million. We expect to continue to pay tax in the Netherlands of between US$ 1.0 and US$ 2.5 million for the foreseeable future and therefore have also agreed to a minimum tax payable of US$ 2.0 million per year for the years 2004-2008 and US$ 1.0 million for 2009. Should the Dutch Ministry of Finance later rule that such arbitration
awards are not taxable, we will be entitled to claim a tax loss, which can be offset against other taxable income, but will not reduce our minimum payment commitments.
We have provided US$ 6.0 million of Dutch tax as the difference between our obligation under this agreement and our estimate of the Dutch tax that may fall due over this period from business operations, based on current business structures and economic conditions. This provision was reflected in our financial statements as at March 31, 2004 and December 31, 2003.
12. Discontinued Operations
Czech Republic
| | | For the Three Months Ended March 31, (US$ 000's) |
| | | | 2004 | | | 2003 | |
| Net revenues of discontinued operation | | $ | - | | $ | 15 | |
| Expenses of discontinued operation | | | - | | | (106 | ) |
| Arbitration related costs | | | (330 | ) | | (3,143 | ) |
| Other income/(expense) of discontinued operation | | | - | | | 122 | |
| | |
| |
| |
Pre-tax income/(loss) from discontinued operations | | $ | (330 | ) | $ | (3,112 | ) |
| | |
| |
| |
| | | | | | | | |
On May 19, 2003, we received US$ 358.6million from the Czech Republic in final settlement of our UNCITRAL arbitration.On June 19, 2003, our Board of Directors decided to withdraw from Czech operations.
In the three months ended March 31, 2004, we incurred US$ 0.3 million of legal costs relating to our negotiations with the Dutch Tax Authorities with respect to Czech Republic operations. In the three months ended March 31, 2003, we incurred US$ 2.7 million of legal costs relating the arbitration proceedings against the Czech Republic and to the ICC Arbitration Tribunal against Dr Zelezny and US$ 0.4 million of legal costs relating to our negotiations with the Dutch Tax Authorities.
Item 2. Management's Discussion and Analysis of Financial Condition and Results of Operations
Contents
I. | Executive Summary |
II. | Analysis of Segment Results |
III. | Critical Accounting Policies and Estimates |
IV. | Analysis of the Results of Consolidated Operations |
V. | Liquidity and Capital Resources |
VI. | Forward-looking Statements |
I. Executive Summary
Management Changes
| · | On February 2, 2004, Michael N. Garin was appointed Chief Executive Officer, succeeding Fred T. Klinkhammer who continues to serve as Vice-Chairman. |
Continuing Operations
The following table provides a summary of our consolidated results for the three months ended March 31, 2004 and 2003:
| | | For the three months ended March 31, (US$000's) |
| | |
| |
| | | | 2004 | | | 2003 (1 | ) | | Movement | |
| | |
| |
| |
| |
| Net Revenues | | | 35,848 | | | 24,598 | | | 11,250 | |
| Operating income/(loss) before corporate expenses | | | 11,140 | | | 3,333 | | | 7,807 | |
| Operating income/(loss) | | | 6,022 | | | (29 | ) | | 6,051 | |
| Net income/(loss) from continuing operations | | | 5,501 | | | (8,175 | ) | | 13,676 | |
Net income/(loss) | | | 5,171 | | | (11,287 | ) | | 16,458 | |
Net cash provided by/(used in) continuing operating activities | | | 1,382 | | | (1,678 | ) | | 3,060 | |
(1) Restated to reflect the adoption of FIN 46 (R) and reclassified to reflect discontinued Czech Republic operations.
The principal events for the three months ended March 31, 2004 are as follows:
| · | For the first time since the first quarter of 1999, we recorded net income from continuing operations and net cash provided by continuing operations. |
| | |
| · | In the three months ended March 31, 2004, our total Operating Segments achieved a Segment EBITDA margin of 29% compared to 16% for the three months ended March 31, 2003 (Segment EBITDA is defined and reconciled to our consolidated US GAAP results in Part I, Note 6, "Segment Data"). |
| | |
| · | We increased our holding in our Romanian operations to 80.0% for a total consideration of US$ 20.3 million. |
| | |
| · | The Euro is the most likely currency in which we will make acquisitions and/or investments. On March 23, 2004, we entered into forward exchange contracts to buy US$ 100 million worth of |
| | Euros at various exchange rates ranging from Euro 0.8102-0.8106 to the US dollar. As at March 31, 2004, we recognized a loss of US$ 0.3 million with respect to these forward exchange contracts. |
| | |
| · | As at March 31, 2004 we had US$ 167.1 million of unrestricted cash. |
| | |
| · | On April 19, 2004 our Romanian operation launched a second cable channel, the PRO Cinema Network. This channel will focus on the broadcasting of acquired series and films. |
Future Trends
| · | During 2003 our Board, after extensive discussions with both management and outside advisors, agreed a strategic plan focusing on expansion through acquisition of additional shares in our existing stations and of appropriate additional businesses in new markets. It was decided that our geographic focus would remain in Central and Eastern Europe, and that our core business would be television. We are also prepared to consider relevant opportunities in related media. |
| | |
| · | Three categories of development are currently under consideration: |
| | · | Acquisition of additional ownership in our present operations, which is regarded as the strategy with the least risk due to our knowledge of the value of these operations; |
| | · | Acquisition of one or more established businesses in the Balkans, in particular states of the former Yugoslavia using the expertise of our successful Slovenian management team; and |
| | · | Acquisition of a broadcaster in one of the substantially larger markets of Central or Eastern Europe, which may give rise to a significant step change in the scale of our business. |
| | |
| · | In the second half of 2003 we conducted research throughout the Central and Eastern European market to assess possible acquisition opportunities. The general review is now complete and management is now assessing specific opportunities. |
| | |
| · | This strategy may result in the acquisition of a significant business in a major Central or Eastern European market. Such an acquisition would likely require funding beyond our current available resources. This could be achieved through funds raised in the form of debt or a public offering. We expect to be able to raise the necessary funding through a debt offering, but would consider partial funding through an equity offering if the share price rose to a level that would make this attractive. |
II. Analysis of Segment Results
OVERVIEW
We manage our business on a geographic basis, and review the performance of each geographic segment using data that reflects 100% of operating and license company results. Our segments are comprised of Romania, Slovak Republic, Slovenia and Ukraine.
For a full reconciliation of our Segment Net Revenues and Segment EBITDA by operation to our consolidated US GAAP results for the three months ended March 31, 2004 and 2003 see Part I, Note 6, "Segment Data".
A summary of our total Segment Net Revenues, Segment EBITDA and Segment EBITDA Margin is as follows.
| | | SEGMENT FINANCIAL INFORMATION |
| | | For the Three Months Ended March 31, (US $000's) |
| | | | 2004 | | | 2003 | | | Movement | |
| | |
| |
| |
| |
| Total Segment Net Revenues | | | 47,743 | | | 34,086 | | | 13,657 | |
| Total Segment EBITDA | | | 13,933 | | | 5,560 | | | 8,373 | |
| Total Segment EBITDA Margin (1) | | | 29 | % | | 16 | % | | 13 | % |
(1) Segment EBITDA Margin is Segment EBITDA expressed as a percentage of Segment Net Revenues.
ANALYSIS BY GEOGRAPHIC SEGMENT
(A) ROMANIA
| | | SEGMENT FINANCIAL INFORMATION |
| | | For the Three Months Ended March 31, (US $000's) |
| | | | 2004 | | | 2003 | | | Movement | |
| | |
| |
| |
| |
| Romanian Net Revenues | | | 14,085 | | | 9,248 | | | 4,837 | |
| Romanian Segment EBITDA | | | 4,318 | | | 1,473 | | | 2,845 | |
| Romanian Segment EBITDA Margin | | | 31 | % | | 16 | % | | 15 | % |
Market Background:Romania continues to have one of the fastest growing television advertising markets in Eastern Europe. We currently expect that Romania’s preparations to enter the European Union sometime after 2007 will support good growth rates in the period running up to entry as has been experienced by earlier entrants.
PRO TV and ACASA (a cable channel) are second and fifth in the market (of seven stations ranked), with all-day national audience shares in the first quarter of 2004 of 16.9% and 6.0%, respectively. The major competitors are the state channel TVR1, with 23.5%, and Antena 1, an independent channel with 13.2% share. TVR1 has a higher share because it is the only significant broadcaster with coverage across the majority of the country. Advertisers, however, evaluate audience share within a network’s coverage area and by this measure PRO TV ranks first and ACASA fourth in all-day audience. Both our stations cover the important urban markets.
On April 19, 2004 our Romanian operation launched a second cable channel, the PRO Cinema Network. This channel will focus on the broadcasting of acquired series and films.
| · | Net Revenuesfor the first three months of 2004increased by 52% compared to the first three months of 2003. This was driven by a combination of increased prices, a higher proportion of available airtime sold due in part to new domestic clients and to improved ratings. |
| | |
| · | Romanian Segment EBITDAfor the first three months of 2004increased by 193% compared to the first three months of 2003 to deliver a Segment EBITDA margin of 31%. |
| | |
| | Costs charged in arriving at Segment EBITDA for the first three months of 2004 increased by 26% compared to the first three months of 2003. The cost of programming in the first three months of 2004 increased by 45% or US$ 1.7 million compared to the first three months of 2003 primarily due to an increased investment in domestic production and increasing costs of acquired programming rights resulting in higher programming amortization. Staff costs also increased by 25% due to performance linked bonus provisions and salary increases. |
(B) SLOVAK REPUBLIC
| | SEGMENT FINANCIAL INFORMATION |
| | | For the Three Months Ended March 31, (US $000's) |
| | | | 2004 | | | 2003 | | | Movement | |
| | |
| |
| |
| |
| Slovak Republic Net Revenues | | | 11,895 | | | 9,488 | | | 2,407 | |
| Slovak Republic Segment EBITDA | | | 1,331 | | | 912 | | | 419 | |
| Slovak Republic Segment EBITDA Margin | | | 11 | % | | 10 | % | | 1 | % |
Market Background: The television advertising market has shown signs of modest growth in the first three months of 2004. The Slovak Republic joined the European Union on May 1, 2004. Peoplemeters, a more accurate method of measuring audience share, will be introduced to the market during the second half of 2004.
TV MARKIZA is the premier broadcaster with a national all-day audience share of 42.1% in the first quarter of 2004 compared to 45.0% in the same period of 2003. STV, a public broadcaster, re-branded at the end of 2003 and has increased its all-day share from 18.0% in the first quarter of 2003 to 20.3% in 2004. TV JOJ, the only other significant independent television station, increased their share from 9.8% to 13.3% in the same period.
| · | Net Revenuesfor the first three months of 2004 increased by 25% compared to the first three months of 2003. Approximately US$ 1.9 million (or 79%) of this increase was due to the weaker US dollar. Local currency net revenues increased by 5% due to US$ 0.4 million additional game show revenues, a European Union campaign by the Slovak government and increased ratings in prime time driving 3% spot sales growth. |
| | |
| · | Slovak Republic Segment EBITDAfor the first three months of 2004increased by 46% compared to the first three months of 2003, to deliver a Segment EBITDA margin of 11%. In local currency, Segment EBITDA increased by 23%. |
| | |
| | Costs charged in arriving at Segment EBITDA the first three months of 2004increased by 23% compared to the first three months of 2003. In local currency, costs charged in arriving at Segment EBITDA increased by 4%. In local currency terms, staff costs have increased by US$ 0.5 million due to higher bonus provision and salary increases. This is compensated in part by an 11% reduction in selling, general and administrative expenses and by holding increases in the cost of programming and broadcast operating expenses well below inflation. |
(C) SLOVENIA
| | SEGMENT FINANCIAL INFORMATION |
| | | For the Three Months Ended March 31, (US $000's) |
| | | | 2004 | | | 2003 | | | Movement | |
| | |
| |
| |
| |
| Slovenian Net Revenues | | | 9,657 | | | 7,809 | | | 1,848 | |
| Slovenian Segment EBITDA | | | 3,927 | | | 1,996 | | | 1,931 | |
| Slovenian Segment EBITDA Margin | | | 41 | % | | 26 | % | | 15 | % |
Market Background: Slovenia is our most prosperous market with the highest per capita GDP of any Eastern European country. Slovenia joined the European Union on May 1, 2004. We expect slow growth in the television advertising market during 2004.
POP TV and KANAL A are ranked first and fourth (of four stations ranked) in the market with national all day audience shares of 27.8% and 8.5% for the first three months in 2004, but were ranked first and third in prime time, respectively. The main competitors are state broadcasters SLO1 and SLO2 with national all day audience shares of 25.3 % and 12.8 %, respectively.
| · | Net Revenuesfor the first three months of 2004increased by 24% compared to the first three months of 2003. Approximately US$ 1.1 million (or 60%) of the increase in net revenues is due to the weakening of the US dollar. Local currency net revenues increased by 10% due to higher average spot prices and to major advertisers spending greater proportions of their annual advertising commitments in the earlier parts of the year. |
| |
| · | Slovenian Segment EBITDAfor the first three months of 2004increased by 97% compared to the first three months of 2003, to deliver a Segment EBITDA margin of 41%. In local currency Segment EBITDA increased by 75%. |
| | |
| | Costs charged in arriving at Segment EBITDA the first three months of 2004 decreased by 1% compared to the first three months of 2003. In local currency, costs charged in arriving at Segment EBITDA decreased by 12%. This reflects management’s ability to control costs, specifically reducing expenditure on programming by US$ 0.3 million through changes to the program schedule. Resolution of uncertainties affecting transmission fees resulted in both lower costs and a provision write-back which together generated a saving of US$ 0.5 million compared to the first three months of 2003. |
(D) UKRAINE
| | SEGMENT FINANCIAL INFORMATION |
| | | For the Three Months Ended March 31, (US $000's) |
| | | | 2004 | | | 2003 | | | Movement | |
| | |
| |
| |
| |
| Ukrainian Net Revenues | | | 12,106 | | | 7,541 | | | 4,565 | |
| Ukrainian Segment EBITDA | | | 4,357 | | | 1,179 | | | 3,178 | |
| Ukrainian Segment EBITDA Margin | | | 36 | % | | 16 | % | | 20 | % |
Market Background: Ukraine has the highest population (48.7 million) of all markets in which we operate, but is the least economically advanced. Market growth in 2004 is expected to be 25% to 30%.
STUDIO 1+1 has a license to broadcast for only 15 hours per day and is the number two station (of six stations ranked), with all-day audience share of 22.7% in its coverage area for the first two months of 2004. The number one position is held by Inter which holds a license permitting it to broadcast for 24 hours per day and has an all-day audience share of 23.3% for the first two months of 2004. Novi Kanal is the number three station with a 10.8% all-day audience share and generates effective national coverage through a collection of regional licenses.
| · | Net Revenuesfor the first three months of 2004increased by 61% compared to the first three months of 2003 due to two very successful prime time series enabling us to increase our share of a growing television advertising market. The two Russian prime time series, Poor Nastya and Undina are both achieving approximately 50% audience share and 15% to 20% ratings. These ratings have helped Studio 1+1 achieve a prime-time audience share within its coverage area of 30.9% for the first two months of 2004 compared to 22.2% for the first three months of 2003. |
| | |
| · | Ukrainian Segment EBITDAfor the first three months of 2004increased by 270% compared to the first three months of 2003, to deliver a Segment EBITDA margin of 36%. |
| | |
| | Costs charged in arriving at Segment EBITDA for the first three months of 2004increased by 22% compared to the first three months of 2003. The cost of programming increased by US$ 1.0 million due to increased investment in local programming, which accounts for a growing share of the schedule and higher program syndication charges as a result of the higher cost of acquired Russian programming. |
PROGRAMMING PAYMENTS AND PROGRAM AMORTIZATION
Our cost of programming for the first three months of 2004 and 2003 are as follows:
| | | For the Three Months Ended March 31, | |
| | |
| |
| | | (US$ 000's) | |
| | |
| |
| | | | 2004 | | | 2003 | |
| | |
| |
| |
| Production expenses | | $ | 5,778 | | $ | 3,842 | |
| Program amortization | | | 7,835 | | | 7,063 | |
| | |
| |
| |
Cost of programming | | $ | 13,613 | | $ | 10,905 | |
| | |
| |
| |
The amortization of acquired programming for each of our consolidated operations and for the Slovak Republic (MARKIZA TV) for the first three months of 2004 and 2003 is set out in the table below. For comparison the table also shows the cash paid for programming by each of our operations in the respective periods. The cash paid for programming by our operations in Romania, Slovenia and Ukraine is reflected within net cash provided by/(used in) continuing operating activities in our consolidated statement of cash flows.
| | | For the Three Months Ended March 31, | |
| | |
| |
| | | (US$ 000's) | |
| | |
| |
| | | | 2004 | | | 2003 | |
| | |
| |
| |
| Program amortization: | | | | | | | |
| Romania (PRO TV, ACASA and PRO TV INTERNATIONAL) | | $ | 3,156 | | $ | 2,576 | |
| Slovenia (POP TV and KANAL A) | | | 1,458 | | | 1,547 | |
| Ukraine (STUDIO 1+1) | | | 3,221 | | | 2,940 | |
| | |
| |
| |
| | | | 7,835 | | | 7,063 | |
| Slovak Republic (MARKIZA TV) | | | 2,393 | | | 2,069 | |
| | |
| |
| |
| | | $ | 10,228 | | $ | 9,132 | |
| | |
| |
| |
| | | | | | | | |
| Cash paid for programming: | | | | | | | |
| Romania (PRO TV, ACASA and PRO TV INTERNATIONAL) | | $ | 6,196 | | $ | 2,808 | |
| Slovenia (POP TV and KANAL A) | | | 1,225 | | | 1,527 | |
| Ukraine (STUDIO 1+1) | | | 4,821 | | | 3,776 | |
| | |
| |
| |
| | | | 12,242 | | | 8,111 | |
| Slovak Republic (MARKIZA TV) | | | 2,068 | | | 1,510 | |
| | |
| |
| |
| | | $ | 14,310 | | $ | 9,621 | |
| | |
| |
| |
III. Critical Accounting Policies
Our accounting policies affecting our financial condition and results of operations are more fully described in Note 3 to our consolidated financial statements that are included in Part II, Item 8 of our Form 10-K filed with the SEC on February 25, 2004 as amended by our Form 10-K/A filed with the SEC on March 12, 2004. The preparation of these financial statements requires us to make judgments in selecting appropriate assumptions for calculating financial estimates, which inherently contain some degree of uncertainty. We base our estimates on historical experience and on various other assumptions that are believed to be reasonable under the circumstances, the results of which form the basis of making judgments about the carrying values of assets and liabilities and the reported
amounts of revenues and expenses that are not readily apparent from other sources. Actual results may differ from these estimates under different assumptions or conditions.
We believe our critical accounting policies are as follow: Program Rights Costs, Valuation of Intangible Assets, Bad Debt Provision and Deferred Tax. These critical accounting policies affect our more significant judgments and estimates used in the preparation of our consolidated financial statements. There have been no significant change in our critical accounting policies since December 31, 2003.
IV. Analysis of the Results of Consolidated Operations
IV (a) Net Revenues for the first three months of 2004 compared to the first three months of 2003
| | | Consolidated Net Revenues |
| | | For the Three Months Ended March 31, (US $000's) |
| | | | 2004 | | | 2003 | | | Movement | |
| | |
| |
| |
| |
| Romania | | $ | 14,085 | | $ | 9,248 | | $ | 4,837 | |
| Slovenia | | | 9,657 | | | 7,809 | | | 1,848 | |
| Ukraine | | | 12,106 | | | 7,541 | | | 4,565 | |
| | |
| |
| |
| |
Total Consolidated Net Revenues | | $ | 35,848 | | $ | 24,598 | | $ | 11,250 | |
| | |
| |
| |
| |
Our consolidated net revenues increased by 46% for the first three months of 2004 compared to the first three months of 2003 due to a:
| · | 52% increase in the net revenues of our Romanian operations as described in "II. Analysis of Segment Results"; |
| | |
| · | 24% increase in the net revenues of our Slovenian operations as described in “II. Analysis of Segment Results"; and |
| | |
| · | 61% increase in the net revenues of our Ukrainian operations as described in "II. Analysis of Segment Results". |
IV (b) Station Operating Costs and Expenses for the first three months of 2004 compared to the first three months of 2003
| | | Consolidated Station Operating Costs and Expenses |
| | | For the Three Months Ended March 31, (US $000's) |
| | | | 2004 | | | 2003 | | | Movement | |
| | |
| |
| |
| |
| Romania | | $ | 9,100 | | $ | 7,289 | | $ | 1,811 | |
| Slovenia | | | 5,270 | | | 5,330 | | | (60 | ) |
| Ukraine | | | 6,776 | | | 5,517 | | | 1,259 | |
| | |
| |
| |
| |
Total Consolidated Station Operating Costs and Expenses | | $ | 21,146 | | $ | 18,136 | | $ | 3,010 | |
| | |
| |
| |
| |
Total station operating costs and expenses (including amortization of program rights and depreciation of fixed assets and other intangibles) increased by 17% in the first three months of 2004 compared to the first three months of 2003 primarily due to a:
| · | 25% increase in the station operating costs and expenses of our Romanian operations due to an increased investment in domestic production and increasing costs of acquired programming rights resulting in higher programming amortization. Staff costs also increased by US$ 0.5 million due to performance linked bonus provisions and salary increases; and |
| · | 23% increase in the station operating costs and expenses of our Ukrainian operations. The cost of programming increased by US$ 1.0 million due to increased investment in local programming, which accounts for a growing share of the schedule and higher program syndication charges as a result of the higher cost of acquired Russian programming. |
IV (c) Station Selling, General and Administrative Expenses for the first three months of 2004 compared to the first three months of 2003
| | | Consolidated Station Selling, General and Administrative Expenses |
| | | For the Three Months Ended March 31, (US $000's) |
| | | | 2004 | | | 2003 | | | Movement | |
| | |
| |
| |
| |
| Romania | | $ | 1,420 | | $ | 1,252 | | $ | 168 | |
| Slovenia | | | 885 | | | 778 | | | 107 | |
| Ukraine | | | 1,257 | | | 1,099 | | | 158 | |
| | |
| |
| |
| |
Total Consolidated Station Selling, General and Administrative Expenses | | $ | 3,562 | | $ | 3,129 | | $ | 433 | |
| | |
| |
| |
| |
Station selling, general and administrative expenses increased by 14% in the first three months of 2004 compared to the first three months of 2003 primarily due to a :
| · | 13% increase in the station selling, general and administrative expenses of our Romanian operations due to increases across all cost categories, most notably travel; |
| | |
| · | 14% increase in the station selling, general and administrative expenses of our Slovenian operations due to increases across all cost categories, most notably marketing; and |
| | |
| · | 14% increase in the station selling, general and administrative expenses of our Ukrainian operations due to increases across all cost categories, most notably consulting and travel. |
IV (d) Consolidated results below operating income/(loss) before corporate expenses for the first three months of 2004 compared to the first three months of 2003
| | | For the Three Months Ended March 31, (US $000's) |
| | | | 2004 | | | 2003 | | | Movement | |
| | |
| |
| |
| |
| Corporate operating costs (excluding stock-based compensation) | | | 3,233 | | | 2,715 | | | 518 | |
| Stock-based compensation | | | 1,885 | | | 647 | | | 1,238 | |
| Interest income | | | 1,454 | | | 375 | | | 1,079 | |
| Interest expense | | | (218 | ) | | (4,991 | ) | | 4,773 | |
| Equity in income/(loss) of unconsolidated affiliates | | | 895 | | | (569 | ) | | 1,464 | |
| Other income/(expense) | | | (771 | ) | | (511 | ) | | (260 | ) |
| Foreign currency exchange gain/(loss), net | | | (633 | ) | | (2,081 | ) | | 1,448 | |
| Provision for income taxes | | | (1,170 | ) | | (285 | ) | | (885 | ) |
| Minority interest in (income)/loss of consolidated subsidiaries | | | (78 | ) | | (84 | ) | | 6 | |
| Pre-tax income/(loss) from discontinued operations | | | (330 | ) | | (3,112 | ) | | 2,782 | |
Corporate operating costs for the first three months of 2004 increased by US$ 0.5 million compared to the first three months of 2003 primarily due to increased salary and related costs as a result of a higher number of corporate staff and the adverse effect of the US dollar weakening by 11% against the British Pound, the currency in which approximately 55% of corporate expenses are denominated.
Stock-based compensation for the first three months of 2004 increased by US$ 1.2 million compared to the first three months of 2003 principally as a result of the effect of the increase in the price of our stock as it relates to our stock-based compensation variable and fixed plans. (For further discussion, see Part I, Note 9, “Stock-based Compensation”).
Equity in income/(loss) of unconsolidated affiliates:As explained in Part I, Item 1, “Business” of our December 31, 2003 Form 10-K filed with the SEC on February 25, 2004 as amended by our Form 10-K/A filed with the SEC on March 12, 2004, some of our broadcasting licenses are held by unconsolidated affiliates over which we have minority blocking rights but not majority control. These affiliates are accounted for using the equity method.
Equity in income of unconsolidated affiliates for the first three months of 2004 increased by US$ 1.5 million compared to the first three months of 2003 as detailed below:
| | | For the Three Months Ended March 31, (US $000's) |
| | | | 2004 | | | 2003 | | | Movement | |
| | |
| |
| |
| |
| Slovak Republic operations | | $ | 731 | | $ | 88 | | $ | 643 | |
| Romanian operations | | | 164 | | | (29 | ) | | 193 | |
| Slovenian operations | | | - | | | (628 | ) | | 628 | |
| | |
| |
| |
| |
Equity in income/(loss) of unconsolidated affiliates | | $ | 895 | | $ | (569 | ) | $ | 1,464 | |
| | |
| |
| |
| |
Interest expense decreased by US$ 4.8 million for the first three months of 2004 compared to the first three months of 2003 primarily as a result of the repayment of all outstanding corporate debt between May and August 2003.
Interest income increased by US$ 1.1 million for the first three months of 2004 compared to the first three months of 2003 primarily as a result of the investment of our cash balance following the receipt of the UNCITRAL Award in May 2003.
Other income/(expense) for the first three months of 2004 increased by US$ 0.3 million compared to the first three months of 2003 primarily as a result of an increase in local tax related provisions.
Foreign currency gain/(loss):On March 23, 3004, we entered into forward exchange contracts to buy US$ 100 million worth of Euros at various exchange rates ranging from Euro 0.8102-0.8106 to the US dollar. As at March 31, 2004, we recognized a loss of US$ 0.3 million with respect to these forward exchange contracts. In addition to this, the translation of our Euro denominated cash balances was affected by the 2.5% weakening of the Euro against the US dollar in the first three months of 2004.
The foreign currency gain/(loss) charge for the first three months of 2003 was primarily as a result of the impact of the Euro strengthening by 2% against the US dollar in the period. This affected the Euro denominated portion of our Senior Notes which were retired in August 2003.
Provision for income taxes:Provision for income taxes was US$ 1.2 million for the first three months of 2004 compared to US$ 0.3 million for the first three months of 2003.
Minority interest in loss/(income) of consolidated subsidiaries:Minority interest in the income of consolidated subsidiaries was US$ 0.1 million for the first three months of both 2004 and 2003.
Pre-tax income/(loss) from discontinued operations:The amounts charged to the consolidated income statement in respect of discontinued operations are as follows:
| | | For the Three Months Ended March 31, (US $000's) |
| | | | 2004 | | | 2003 | | | Movement | |
| | |
| |
| |
| |
| Czech Republic: | | | | | | | | | | |
| Discontinued operations | | $ | (330 | ) | $ | (3,112 | ) | $ | 2,782 | |
| Tax on discontinued operations | | | - | | | - | | | - | |
| | |
| |
| |
| |
Discontinued operations | | $ | (330 | ) | $ | (3,112 | ) | $ | 2,782 | |
| | |
| |
| |
| |
Czech Republic
On June 19, 2003, our Board of Directors decided to withdraw from Czech operations. On October 23, 2003 we sold our 93.2% participation interest in CNTS, our Czech operating company, for US$ 53.2 million.
The revenues and expenses of the Czech operations and the award income and related legal expenses have therefore all been treated as discontinued operations for the three months ended March 31, 2004. Comparatives for the three months ended March 31, 2003 have been reclassified.
For additional information, see Part I, Note 12, "Discontinued Operations".
V. Liquidity and Capital Resources
Summary
As at March 31, 2004, we had US$ 167.1 million of cash and cash equivalents compared to US$ 192.2 million as at December 31, 2003. The principal reasons for the decrease of US$ 25.1 million are as follows:
| · | US$ 16.9 million payments in connection with the 14% increase in our holding of our Romanian operations (for further information, see Item 1, Note 4, "Acquisitions and Disposals") ; |
| | |
| · | A US$ 9.0 million payment to the Dutch Tax Authorities; partially off-set by |
| | |
| · | US$ 3.2 million received on the exercise of stock options and warrants. |
Contractual Cash Obligations
Our future contractual obligations as of March 31, 2004 are as follows:
| Contractual Obligations | Payments due by period (US$ 000’s) |
| | Total | Less than 1 year | 1-3 years | 3-5 years | More than 5 years |
| Long-Term Debt | $ 14,553 | $ 1,777 | $ 9,223 | $ 3,553 | $ - |
| Capital Lease Obligations | 984 | 246 | 265 | 244 | 229 |
| Operating Leases | 6,719 | 1,549 | 2,334 | 2,102 | 734 |
| Unconditional Purchase Obligations | 16,966 | 16,241 | 616 | 109 | - |
| Other Long-Term Obligations | 13,294 | 2,947 | 7,249 | 3,098 | - |
|
|
|
|
|
|
| Total Contractual Obligations | $ 52,516 | $ 22,760 | $ 19,687 | $ 9,106 | $ 963 |
|
|
|
|
|
|
| (1) | Euro 7.3 million (approximately US$ 8.9 million) (December 31, 2003: Euro 8.0 million, approximately US$ 10.0 million) was drawn down on the agreement our Slovenia operations have with Bank Austria Creditanstalt d.d. (“BACA”) and Nova Ljubljanska banka d.d. This loan bears a variable interest rate of the European Inter-Banking Official Rate (“EURIBOR”) 6 month rate plus 3.0% (EURIBOR – 6 month as at December 31, 2003 was 3.0%). As at March 31, 2004 a rate of 6.0% applied to this loan. |
| (2) | A loan of Sk187 million (approximately US$ 5.7 million) (December 31, 2003: Sk187 million, approximately US$ 5.7 million) from our non-consolidated affiliate, STS. This loan bears a variable interest rate of the Bratislava Inter Bank Official Rate (“BRIBOR”) 3 month rate plus 2.2% (BRIBOR – 3 month as at March 31, 2004 was 5.7%). |
| | |
| In addition to the above, STS, our non-consolidated affiliate had the following loan: |
| | |
| (1) | Sk 90 million (approximately US$ 2.7 million) (December 31, 2003: Sk 90 million, US$ 2.7 million) was outstanding on an agreement with Vseobecna uverova banka a.s. This loan bears a variable interest rate of the Bratislava Inter Bank Official Rate (“BRIBOR”) 3 month rate plus 1.7% (BRIBOR – 3 month as at March 31, 2004 was 5.7%). |
We had programming rights commitments (included within "Unconditional Purchase Obligations" in the chart above) of US$ 15.8 million in respect of future programming which includes contracts signed with license periods starting after March 31, 2004 (December 31, 2003: US$ 8.2 million).
Included in Other Long-Term Obligations are our commitments to the Romanian tax authorities and the Dutch tax authorities.
Sources and Uses of Cash
Our ongoing source of cash in the operating stations is primarily the receipt of payments from advertisers and advertising agencies. This may be augmented from time to time by local borrowing. Surplus cash generated in this manner, after funding the ongoing station operations, may be remitted to corporate, or to other shareholders where appropriate. Surplus cash is remitted to corporate in the form of debt interest payments and capital repayments, dividends, and other distributions and loans from our subsidiaries and equity accounted investments.
As at March 31, 2004 and December 31, 2003 the operations had the following unsecured balances owing to their respective holding companies:
| | | | As at March 31, 2004 | | | As at December 31, 2003 | |
| Country | | (US $000’s) | |
| Romania | | $ | 38,140 | | $ | 37,756 | |
| Slovak Republic | | | 88 | | | 350 | |
| Slovenia | | | 60 | | | 77 | |
| Ukraine | | | 14,942 | | | 16,243 | |
| | |
| |
| |
| Total | | $ | 53,230 | | $ | 54,426 | |
| | |
| |
| |
During the first three months of 2004 our continuing consolidated operating stations generated cash of US$ 6.4 million (2003: US$ 6.2 million) prior to making investments in associated companies, borrowing or repayment of third party overdraft or debt, or payments to corporate in excess of current year recharges. STS, our equity accounted affiliate, generated cash of US$ 3.7 million the first three months of 2004 compared to US$ 0.2 million for the first three months of 2003.
Cash Outlook
Our future cash needs, over and above working capital requirements, will depend on our overall financial performance and our future acquisition and development decisions.
During 2003 our Board, after extensive discussions with both management and outside advisors, agreed a strategic plan focusing on expansion through acquisition of additional shares in our existing stations and of appropriate additional businesses in new markets.
This strategy may result in the acquisition of a significant business in a major Central or Eastern European market. Such an acquisition would likely require funding beyond our current available resources. This could be achieved through funds raised in the form of debt or a public offering. We expect to be able to raise the necessary funding through a debt offering, but would consider partial funding through an equity offering if the share price rose to a level that would make this attractive.
Tax Inspections
Pro Plus has been the subject of an income tax inspection by the Republic of Slovenia tax authorities for the years 1995 to 1998. As a result of these inspections the Slovenian tax authorities had levied an assessment seeking unpaid income taxes, customs duties and interest charges of SIT 1,073,000,000 (approximately US$ 5.7 million). The Slovenian authorities have asserted that capital contributions and loans made by us in the years 1995 and 1996 to Pro Plus should be extraordinary revenue to Pro Plus. On this basis, the Slovenian authorities claim that Pro Plus made a profit in 1995 and 1996 for which it owes income taxes and interest. Additionally, the Slovenian tax authorities claim that the fixed assets imported as capital contributions were subject to customs duties which were not paid. On February 9, 2001, the Slovenian tax authorities approved the cash capital contributions for 1995 and 1996. This has reduced the assessment to SIT 636,800,000 (approximately US$ 3.4 million). The Administrative Court of Ljubljana has issued an injunction to prevent the tax authorities from demanding payment until a hearing on the matter has been concluded. There is currently no date set for this hearing. We do not hold a provision in our financial statements in relation to this legal action.
VI. Forward-looking Statements
This report contains forward-looking statements, including statements regarding the future economic climate in our markets, future investments in existing television broadcast operations, the growth potential of the advertising market, business strategies and commitments, anticipated corporate cash expenditures and the timing of the need for additional cash resources. For these statements and all other forward-looking statements, we claim the protection of the safe harbor for forward-looking statements contained in the Private Securities Litigation Reform Act of 1995. Forward-looking statements are inherently subject to risks and uncertainties, many of which cannot be predicted with accuracy and some of which might not even be anticipated. Future events and actual results, affecting the financial position, results of our operations and cash flows, could differ materially from those described in or contemplated by the forward-looking statements. Important factors that contribute to such risks include, but are not limited to, the renewals of broadcasting licenses, the regulatory environment and compliance, the ability to acquire programming, the ability to attract audiences, the rate of development of advertising markets in countries where we currently operate and general market and economic conditions in these countries, the US and Western Europe.
Item 3. Quantitative and Qualitative Disclosures About Market Risk
We engage in activities that expose us to various market risks, including the effects of changes in foreign currency exchange rates and interest rates. We do not regularly engage in speculative transactions, nor do we regularly hold or issue financial instruments for trading purposes.
Foreign Currency Exchange Risk Management
We conduct business in a number of foreign currencies. As a result, we are subject to foreign currency exchange rate risk due to the effects that foreign exchange rate movements of these currencies have on our costs and on the cash flows we receive from certain Subsidiaries. In limited instances we enter into forward foreign exchange contracts to hedge foreign currency exchange rate risk. On March 23, 2004, we entered into eight forward exchange contracts to buy US$ 100 million worth of Euros at various exchange rates ranging from Euro 0.8102-0.8106 to the US dollar. As at March 31, 2004 we held six of the eight short-term foreign exchange contracts for a total of US$ 78.1 million, all with maturity dates prior to May 5, 2004.
Interest Rate Risk Management
None of our debt was maintained with a fixed interest rate as at March 31, 2004 or December 31, 2003. We have two tranches of debt that provide for interest at a spread above a base rate (Euro Inter Bank Offered Rate andthe Bratislava Inter Bank Official Rate). A significant rise in the base rate of either would not have an adverse effect on our business and results of operations.
Interest Rate Table as at March 31, 2004
Expected Maturity Dates | | | 2004 | | | 2005 | | | 2006 | | | 2007 | | | Thereafter | |
| |
| |
| |
| |
| |
| |
| We have no fixed rate debt | | | | | | | | | | | | | | | | |
Total Debt in Euros 000's | | | | | | | | | | | | | | | | |
| Variable Rate | | | - | | | - | | | - | | | - | | | 7,273 | |
| Average Interest Rate | | | - | | | - | | | - | | | - | | | 6.00 | % |
Total Debt in Sk 000's | | | | | | | | | | | | | | | | |
| Variable Rate | | | - | | | 187,000 | | | - | | | - | | | - | |
| Average Interest Rate | | | - | | | 7.92 | % | | - | | | - | | | - | |
Variable Interest Rate Sensitivity as at March 31, 2004
| | | | | Yearly interest charge if interest rates increase by (US$000s): |
| | | | | | | | |
| |
Value of Debt as at March 31, 2004 (US$ 000's) | | | Interest Rate as at March 31, 2004 | | | Yearly Interest Charge (US$ 000’s) | | | 1% | | | 2% | | | 3% | | | 4% | | | 5% | |
| |
| |
| |
| |
| |
| |
| |
| |
8,883
(Euro 7.3 million) | | | 6.00% | | | 533 | | | 622 | | | 711 | | | 799 | | | 888 | | | 977 | |
5,670
(Sk 187 million) | | | 7.92% | | | 449 | | | 506 | | | 562 | | | 619 | | | 676 | | | 733 | |
| | | | | |
| |
| |
| |
| |
| |
| |
Total | | | | | $ | 982 | | $ | 1,128 | | $ | 1,273 | | $ | 1,418 | | $ | 1,564 | | $ | 1,710 | |
| | | | | |
| |
| |
| |
| |
| |
| |
Item 4. Controls and Procedures
Our Chief Executive Officer and Chief Financial Officer evaluated the effectiveness of the design and operation of our disclosure controls and procedures as of the end of the period covered by this report. Based upon this evaluation, the Chief Executive Officer and Chief Financial Officer concluded that the disclosure controls and procedures are effective in ensuring that information required to be disclosed by us in the reports that we file or submit under the Securities and Exchange Act of 1934, as amended, is recorded, processed, summarized and reported within the time period specified by theSecurities and Exchange Commission's rules and forms.
There were no changes in our internal controls over financial reporting that occurred in the first quarter of 2004 that have materially affected, or are reasonably likely to materially affect, our internal control over financial reporting.
PART II
OTHER INFORMATION
Item 1. Legal Proceedings
We present below a summary of our significant proceedings by country.
UKRAINE
In our Form 10-K filed with the SEC for the year ended December 31, 2003 as amended by our Form 10-K/A filed with the SEC on March 12, 2004, we reported that AITI, a television station in Ukraine, commenced a second court action in Ukraine against the Ukraine Media Council challenging certain aspects of the granting to Studio 1+1 its television broadcast license in Ukraine. Studio 1+1 was involved in this litigation as a third party acting together with the Ukraine Media Council. The claim was almost identical to one which was previously brought by AITI and was dismissed on April 5, 2001 by the Supreme Arbitration Court of Ukraine.
AITI’s allegations were that Studio 1+1 has, in effect, been granted two licenses by the Ukraine TV Council, entitling it to in excess of 32 hours of broadcast time a day on Ukraine's nationwide Channel N2 (UT-2). Further, AITI alleged that Studio 1+1 never paid the required license fee. After the more senior Court of Cassation had ruled on November 1, 2002 that the lower Economic Court of Kiev must re-hear the case, a court date of February 5, 2003 was set. On April 9, 2003 the Economic Court of Kiev dismissed the claim brought by AITI. This judgment was appealed by AITI to the Court of Appeal, which upheld the ruling by way of a decision handed down on June 19, 2003.
AITI subsequently appealed to the Court of Cassation, which initially rejected their request for an appeal on the grounds it was incorrectly filed. AITI requested that the Supreme Court of Ukraine rule that the appeal must be accepted for consideration by the Court of Cassation. The Supreme Court of Ukraine subsequently ordered that the Court of Cassation should accept the appeal and the hearing took place on April 6, 2004. The Court rejected AITI's appeal and it has 30 days in which to appeal to the Supreme Court, which is the final court of appeal in Ukraine. If no appeal is lodged by May 6, 2004 the court action will end in favor of the Ukraine Media Council and Studio 1+1.
We believe that the claim brought by AITI is groundless and will assist in the pursuit of the defense of this matter vigorously. The Economic Court of Kiev’s ruling dismissing AITI’s claim on April 9, 2003, the Court of Appeal's affirmation of that decision on June 19, 2003 and the Court of Cassation's affirmation on April 6, 2004 supports our belief that any appeal by AITI to the Supreme Court will be rejected. However, if the decision in the Ukraine court system is ultimately unfavorable, it could result in the loss of the broadcast license of Studio 1+1.
SLOVENIA
On November 20, 2002, we received notice of a claim filed by Mrs. Zdenka Meglic, the founder and a former shareholder of MMTV 1 d.o.o (MMTV), against MMTV, a subsidiary of CME Slovenia BV. In her claim against MMTV, Mrs. Meglic is seeking damages in the amount of SIT 190 million (approximately US$ 0.9 million) for repayment of monies advanced to MMTV from 1992 to 1994 (in the amount of approximately SIT 29 million (approximately US$ 0.1 million)) plus accrued interest. We believe Mrs. Meglic’s claim is without merit and will defend the claim vigorously.
GENERAL
We are, from time to time, a party to litigation that arises in the normal course of our business operations. Other than those claims discussed above, we are not presently a party to any such litigation which could reasonably be expected to have a material adverse effect on our business or operations.
Item 6. Exhibits and Reports on Form 8-K.
a) The following exhibits are attached:
| 10.48 * | Employment Agreement between CME Development Corporation and Michael Gain dated March 30, 2004 |
| 10.49 | Agreement between CME Media Enterprises BV and the Tax and Customs Administration of the Netherlands dated March 24, 2004 |
| 10.50 | CME Romania BV - Adrian Sarbu Funding and Share Sale Agreement, dated March 12, 2004 |
| | |
| 31.01 | s.302 Sarbanes-Oxley Certification - CEO, dated May 5, 2004 |
| 31.02 | s.302 Sarbanes-Oxley Certification - CFO, dated May 5, 2004 |
| 32.01 | s.906 Sarbanes-Oxley Certification - CEO and CFO, dated May 5, 2004 (furnished only) |
* Exhibit is a management contract or compensatory plan.
b) Reports on Form 8-K
A Form 8-K was filed on February 25, 2004 announcing the results for the year ended December 31, 2003.
SIGNATURES
Pursuant to the requirements of the Securities Exchange Act of 1934, the registrant has duly caused this report to be signed on its behalf by the undersigned thereunto duly authorized.
| Date: May 5, 2004 | /s/ Michael Garin |
|
|
| | Michael Garin Chief Executive Officer (Duly Authorized Officer) |
| | |
| Date: May 5, 2004 | /s/ Wallace Macmillan |
|
|
| | Wallace Macmillan Vice President – Finance (Principal Financial Officer and Duly Authorized Officer) |
EXHIBIT INDEX
| 10.48 * | Employment Agreement between CME Development Corporation and Michael Gain dated March 30, 2004 |
| 10.49 | Agreement between CME Media Enterprises BV and the Tax and Customs Administration of the Netherlands dated March 24, 2004 |
| 10.50 | CME Romania BV - Adrian Sarbu Funding and Share Sale Agreement, dated March 12, 2004 |
| | |
| 31.01 | s.302 Sarbanes-Oxley Certification - CEO, dated May 5, 2004 |
| 31.02 | s.302 Sarbanes-Oxley Certification - CFO, dated May 5, 2004 |
| 32.01 | s.906 Sarbanes-Oxley Certification - CEO and CFO, dated May 5, 2004 (furnished only) |
* Exhibit is a management contract or compensatory plan.