UNITED STATES
SECURITIES AND EXCHANGE COMMISSION
Washington, D.C. 20549
FORM 10-Q
| | x | QUARTERLY REPORT PURSUANT TO SECTION 13 OR 15(d) OF THE SECURITIES EXCHANGE ACT OF 1934 | |
| | | | |
| | | For the quarterly period ended June 30, 2005 | |
| | | | |
| | ¨ | TRANSITION REPORT PURSUANT TO SECTION 13 OR 15(d) OF THE SECURITIES EXCHANGE ACT OF 1934 | |
Commission File Number 0-24796
CENTRAL EUROPEAN MEDIA ENTERPRISES LTD.
(Exact name of registrant as specified in its charter)
BERMUDA | 98-0438382 |
| (State or other jurisdiction of incorporation and organization) | (IRS Employer Identification No.) |
Clarendon House, Church Street, Hamilton | HM CX Bermuda |
| (Address of principal executive offices) | (Zip Code) |
Registrant's telephone number, including area code: (441)-296-1431
Indicate by check mark whether registrant: (1) has filed all reports required to be filed by Section 13 or 15 (d) of the Securities Exchange Act of 1934 during the preceding 12 months (or for each shorter period that the registrant was required to file such reports), and (2) has been subject to such filing requirements for the past 90 days.
Yes x No ¨
Indicate by check mark whether the registrant is an accelerated filer (as defined by Rule 12b-2 of the Exchange Act)
Yes x No ¨
Indicate the number of shares outstanding of each of the issuer's classes of common stock, as of the latest practicable date.
| | Class | | Outstanding as of August 1, 2005 | |
| | Class A Common Stock, par value $0.08 | | 30,516,734 | |
| | Class B Common Stock, par value $0.08 | | 7,334,768 | |
CENTRAL EUROPEAN MEDIA ENTERPRISES LTD.
FORM 10-Q
For the quarterly period ended June 30, 2005
INDEX
| | | | Page |
Part I. Financial information | |
| | Item 1. Financial Statements | |
| | | | 3 |
| | | | 5 |
| | | | 7 |
| | | | 8 |
| | | | 9 |
| | | 36 |
| | | 62 |
| | | 63 |
Part II. Other Information | |
| | | 64 |
| | | 67 |
| | Item 5. Other Information | 68 |
| | | 68 |
| 68 |
| 69 |
Part I. Financial Information
Item 1. Financial Statements
CENTRAL EUROPEAN MEDIA ENTERPRISES LTD.
CONSOLIDATED BALANCE SHEETS
(US$000s, except share and per share data)
(Unaudited)
| | | June 30, 2005 | | December 31, 2004 | |
ASSETS | | | | | |
| | | | | | |
Current Assets | | | | | |
| | | | | | |
| Cash and cash equivalents | | $ | 113,797 | | $ | 152,568 | |
| | | | | | | | |
| Restricted cash (Note 4) | | | 33,177 | | | 15,574 | |
| | | | | | | | |
| Accounts receivable (net of allowances of $8,426, $6,140, respectively) | | | 104,073 | | | 45,170 | |
| | | | | | | | |
| Other receivable (Note 5) | | | - | | | 18,368 | |
| | | | | | | | |
| Program rights | | | 34,713 | | | 22,055 | |
| | | | | | | | |
| Loans to related parties | | | 300 | | | 300 | |
| | | | | | | | |
| Other short-term assets (Note 8) | | | 38,972 | | | 11,014 | |
| | | | | | | | |
Total Current Assets | | | 325,032 | | | 265,049 | |
| | | | | | | | |
Non-Current Assets | | | | | | | |
| | | | | | | | |
| Loans to related parties | | | 2,795 | | | 2,525 | |
| | | | | | | | |
| Investments in associated companies | | | 29,304 | | | 28,558 | |
| | | | | | | | |
| Acquisition costs (Note 18) | | | - | | | 10,770 | |
| | | | | | | | |
| Property, plant and equipment (net of depreciation of $104,494, $63,882, respectively) | | | 47,684 | | | 31,548 | |
| | | | | | | | |
| Program rights | | | 31,115 | | | 18,299 | |
| | | | | | | | |
| Goodwill (Note 7) | | | 774,504 | | | 59,092 | |
| | | | | | | | |
| Other intangibles (Note 7) | | | 162,838 | | | 27,331 | |
| | | | | | | | |
| Other assets (Note 8) | | | 16,417 | | | 1,467 | |
| | | | | | | | |
Total Non-Current Assets | | | 1,064,657 | | | 179,590 | |
| | | | | | | | |
Total Assets | | $ | 1,389,689 | | $ | 444,639 | |
The accompanying notes are an integral part of these consolidated financial statements.
CENTRAL EUROPEAN MEDIA ENTERPRISES LTD.
CONSOLIDATED BALANCE SHEETS (continued)
(US$000s, except share and per share data)
(Unaudited)
| | | June 30, 2005 | | December 31, 2004 | |
LIABILITIES AND SHAREHOLDERS’ EQUITY | | | | | | | |
| | | | | | | | |
Current Liabilities: | | | | | | | |
| | | | | | | | |
| Accounts payable and accrued liabilities (Note 9) | | $ | 107,171 | | $ | 67,042 | |
| | | | | | | | |
| Duties and other taxes payable | | | 26,267 | | | 20,243 | |
| | | | | | | | |
| Income taxes payable | | | 9,144 | | | 4,658 | |
| | | | | | | | |
| Credit facilities and obligations under capital leases | | | 24,880 | | | 10,472 | |
| | | | | | | | |
| Settlement liability (Note 10) | | | 1,047 | | | - | |
| | | | | | | | |
| Deferred consideration - Croatia (Note 5) | | | 3,686 | | | 6,384 | |
| | | | | | | | |
| Deferred consideration - Czech Republic (Note 5) | | | 24,159 | | | - | |
| | | | | | | | |
| Deferred tax | | | 1,346 | | | 946 | |
| | | | | | | | |
Total Current Liabilities | | | 197,700 | | | 109,745 | |
| | | | | | | | |
Non-Current Liabilities | | | | | | | |
| | | | | | | | |
| Accounts payable and accrued liabilities | | | 520 | | | 734 | |
| | | | | | | | |
| Credit facilities and obligations under capital leases | | | 5,049 | | | 8,898 | |
| | | | | | | | |
| Settlement liability (Note 10) | | | 48,971 | | | - | |
| | | | | | | | |
| Euro 245.0 million 8.25% Senior Notes due 2012 (Note 11) | | | 296,596 | | | - | |
| | | | | | | | |
| Euro 125.0 million floating rate Senior Notes due 2012 (Note 11) | | | 151,324 | | | - | |
| | | | | | | | |
| Income taxes payable | | | 3,251 | | | 3,120 | |
| | | | | | | | |
| Provision for losses in investments in associated companies | | | 26 | | | - | |
| | | | | | | | |
| Deferred tax | | | 36,670 | | | 6,213 | |
| | | | | | | | |
Total Non-Current Liabilities | | | 542,407 | | | 18,965 | |
| | | | | | | | |
| Minority interests in consolidated subsidiaries | | | 9,902 | | | 4,861 | |
| | | | | | | | |
SHAREHOLDERS' EQUITY: | | | | | | | |
| | | | | | | | |
| Class A Common Stock, $0.08 par value: | | | | | | | |
| | | | | | | | |
| Authorized: 100,000,000 shares at June 30, 2005 and December 31, 2004; issued and outstanding: 30,506,734 at June 30, 2005 and 21,049,400 at December 31, 2004 | | | 2,441 | | | 1,684 | |
| | | | | | | | |
| Class B Common Stock, $0.08 par value: | | | | | | | |
| | | | | | | | |
| Authorized: 15,000,000 shares at June 30, 2005 and December 31, 2004; issued and outstanding: 7,334,768 at June 30, 2005 and December 31, 2004 | | | 587 | | | 587 | |
| | | | | | | | |
| Preferred Stock, $0.08 par value: | | | | | | | |
| | | | | | | | |
| Authorized 5,000,000 shares at June 30, 2005 and December 31, 2004; issued and outstanding: none at June 30, 2005 and December 31, 2004 | | | | | | | |
| | | | | | | | |
| Additional paid-in capital | | | 742,668 | | | 387,305 | |
| | | | | | | | |
| Retained earnings/(accumulated deficit) | | | (69,958 | ) | | (87,468 | ) |
| | | | | | | | |
| Accumulated other comprehensive (loss)/income | | | (36,058 | ) | | 8,960 | |
| | | | | | | | |
Total shareholders' equity | | | 639,680 | | | 311,068 | |
| | | | | | | | |
Total liabilities and shareholders' equity | | $ | 1,389,689 | | $ | 444,639 | |
The accompanying notes are an integral part of these consolidated financial statements.
CENTRAL EUROPEAN MEDIA ENTERPRISES LTD. CONSOLIDATED STATEMENTS OF OPERATIONS
(US$000s, except share and per share data)
(Unaudited)
| | | For the Three Months Ended June 30, | | For the Six Months Ended June 30, | |
| | | 2005 | | 2004 | | 2005 | | 2004 | |
| | | | | | | | | | |
Net revenues | | $ | 113,109 | | $ | 44,886 | | $ | 161,413 | | $ | 80,734 | |
| | | | | | | | | | | | | | |
| Operating costs | | | 18,117 | | | 7,338 | | | 29,402 | | | 13,409 | |
| | | | | | | | | | | | | | |
| Cost of programming | | | 32,081 | | | 15,950 | | | 54,403 | | | 29,563 | |
| | | | | | | | | | | | | | |
| Depreciation of station fixed assets and other intangibles | | | 4,623 | | | 1,336 | | | 6,836 | | | 2,798 | |
| | | | | | | | | | | | | | |
Total station operating costs and expenses | | | 54,821 | | | 24,624 | | | 90,641 | | | 45,770 | |
| | | | | | | | | | | | | | |
| Station selling, general and administrative expenses | | | 12,562 | | | 4,322 | | | 19,490 | | | 7,884 | |
| | | | | | | | | | | | | | |
| Corporate operating costs (including non-cash stock based compensation (see Note 15) of $ (1.4) million and $ 2.4 million for the three months ended June 30, 2005 and 2004, respectively and $ 1.7 million and $ 4.3 million for the six months ended June 30, 2005 and 2004, respectively) | | | 3,451 | | | 7,107 | | | 11,182 | | | 12,225 | |
| | | | | | | | | | | | | | |
| Amortization of intangibles | | | 82 | | | 62 | | | 159 | | | 62 | |
| | | | | | | | | | | | | | |
| Impairment charge (Note 6) | | | 35,331 | | | - | | | 35,331 | | | - | |
| | | | | | | | | | | | | | |
Operating income | | | 6,862 | | | 8,771 | | | 4,610 | | | 14,793 | |
| | | | | | | | | | | | | | |
| Interest income | | | 559 | | | 786 | | | 1,638 | | | 2,240 | |
| | | | | | | | | | | | | | |
| Interest expense | | | (6,424 | ) | | (667 | ) | | (6,731 | ) | | (885 | ) |
| | | | | | | | | | | | | | |
| Foreign currency exchange gain/(loss), net | | | 30,159 | | | (1,289 | ) | | 29,430 | | | (1,922 | ) |
| | | | | | | | | | | | | | |
| Other income/(expense) | | | 312 | | | (10 | ) | | (3,689 | ) | | (781 | ) |
| | | | | | | | | | | | | | |
Income before provision for income taxes, minority interest, equity in income of unconsolidated affiliates and discontinued operations | | | 31,468 | | | 7,591 | | | 25,258 | | | 13,445 | |
| | | | | | | | | | | | | | |
| Provision for income taxes | | | (3,565 | ) | | (5,769 | ) | | (5,906 | ) | | (6,939 | ) |
| | | | | | | | | | | | | | |
Income before minority interest, equity in income of unconsolidated affiliates and discontinued operations | | | 27,903 | | | 1,822 | | | 19,352 | | | 6,506 | |
| | | | | | | | | | | | | | |
| Minority interest in income of consolidated subsidiaries | | | (4,104 | ) | | (379 | ) | | (4,681 | ) | | (457 | ) |
| | | | | | | | | | | | | | |
| Equity in income of unconsolidated affiliates | | | 4,049 | | | 4,304 | | | 4,883 | | | 5,199 | |
| | | | | | | | | | | | | | |
Net income from continuing operations | | | 27,848 | | | 5,747 | | | 19,554 | | | 11,248 | |
| | | | | | | | | | | | | | |
| Discontinued operations - Czech Republic: | | | | | | | | | | | | | |
| | | | | | | | | | | | | | |
| Pre-tax income from discontinued operations | | | 46 | | | 285 | | | 164 | | | - | |
| | | | | | | | | | | | | | |
| Tax on disposal of discontinued operations | | | (2,435 | ) | | - | | | (2,208 | ) | | (45 | ) |
| | | | | | | | | | | | | | |
Net income/(loss) from discontinued operations | | | (2,389 | ) | | 285 | | | (2,044 | ) | | (45 | ) |
| | | | | | | | | | | | | | |
Net income | | $ | 25,459 | | $ | 6,032 | | $ | 17,510 | | $ | 11,203 | |
The accompanying notes are an integral part of these consolidated financial statements.
CENTRAL EUROPEAN MEDIA ENTERPRISES LTD.
CONSOLIDATED STATEMENTS OF OPERATIONS (continued)
(US$ 000's, except share and per share data)
(Unaudited)
| | | For the Three Months Ended June 30, | | For the Six Months Ended June 30, | |
| | | 2005 | | 2004 | | 2005 | | 2004 | |
| | | | | | | | | | |
| PER SHARE DATA: | | | | | | | | | |
| | | | | | | | | | |
| Net income per share (Note 14) | | | | | | | | | |
| | | | | | | | | | |
| Continuing operations - Basic (1) | | $ | 0.81 | | $ | 0.21 | | $ | 0.62 | | $ | 0.41 | |
| | | | | | | | | | | | | | |
| Continuing operations - Diluted (1) | | $ | 0.79 | | $ | 0.20 | | $ | 0.61 | | $ | 0.39 | |
| | | | | | | | | | | | | | |
| Discontinued operations - Basic | | $ | (0.07 | ) | $ | 0.01 | | $ | (0.06 | ) | $ | - | |
| | | | | | | | | | | | | | |
| Discontinued operations - Diluted | | $ | (0.07 | ) | $ | 0.01 | | $ | (0.07 | ) | $ | - | |
| | | | | | | | | | | | | | |
| Net income - Basic (1) | | $ | 0.74 | | $ | 0.22 | | $ | 0.56 | | $ | 0.41 | |
| | | | | | | | | | | | | | |
| Net income - Diluted (1) | | $ | 0.72 | | $ | 0.21 | | $ | 0.54 | | $ | 0.39 | |
| | | | | | | | | | | | | | |
| | | | | | | | | | | | | | |
| Weighted average common shares used in computing per share amounts (000s): | | | | | | | | | | | | | |
| | | | | | | | | | | | | | |
| Continuing operations - Basic (as restated) (1) | | | 34,274 | | | 27,854 | | | 31,345 | | | 27,471 | |
| | | | | | | | | | | | | | |
| Continuing operations - Diluted (as restated) (1) | | | 35,145 | | | 29,033 | | | 32,288 | | | 28,956 | |
| | | | | | | | | | | | | | |
| Discontinued operations - Basic (as restated) (1) | | | 34,274 | | | 27,854 | | | 31,345 | | | 27,471 | |
| | | | | | | | | | | | | | |
| Discontinued operations - Diluted (as restated) (1) | | | 35,145 | | | 29,033 | | | 32,288 | | | 28,956 | |
| | | | | | | | | | | | | | |
| Net income - Basic (as restated) (1) | | | 34,274 | | | 27,854 | | | 31,345 | | | 27,471 | |
| | | | | | | | | | | | | | |
| Net income - Diluted (as restated) (1) | | | 35,145 | | | 29,033 | | | 32,288 | | | 28,956 | |
| | | | | | | | | | | | | | |
| (1) See Note 14, “Earnings Per Share”. | | | | | | | | | | | | | |
The accompanying notes are an integral part of these consolidated financial statements.
CENTRAL EUROPEAN MEDIA ENTERPRISES LTD.
CONSOLIDATED STATEMENT OF SHAREHOLDERS' EQUITY
(US$ 000’s)
(Unaudited)
| | | Comprehensive Income/(loss) | | Class A Common Stock | | Class B Common Stock | | Additional Paid-In Capital | | Accumulated Deficit | | Accumulated Other Comprehensive Income/(Loss) | | Total Shareholders' Equity | |
BALANCE, December 31, 2004 | | | | | $ | 1,684 | | $ | 587 | | $ | 387,305 | | $ | (87,468 | ) | $ | 8,960 | | $ | 311,068 | |
| | | | | | | | | | | | | | | | | | | | | | | |
| Stock-based compensation | | | | | | | | | | | | 1,682 | | | | | | | | | 1,682 | |
| | | | | | | | | | | | | | | | | | | | | | | |
| New stock issued | | | | | | 713 | | | | | | 351,334 | | | | | | | | | 352,047 | |
| | | | | | | | | | | | | | | | | | | | | | | |
| Stock options exercised | | | | | | 44 | | | | | | 2,347 | | | | | | | | | 2,391 | |
| | | | | | | | | | | | | | | | | | | | | | | |
| Comprehensive income/(loss): | | | | | | | | | | | | | | | | | | | | | | |
| | | | | | | | | | | | | | | | | | | | | | | |
| Net income | | $ | 17,510 | | | | | | | | | | | | 17,510 | | | | | | 17,510 | |
| | | | | | | | | | | | | | | | | | | | | | | |
| Other comprehensive income/(loss): | | | | | | | | | | | | | | | | | | | | | | |
| | | | | | | | | | | | | | | | | | | | | | | |
| Cumulative translation adjustments | | | (45,018 | ) | | | | | | | | | | | | | | (45,018 | ) | | (45,018 | ) |
| | | | | | | | | | | | | | | | | | | | | | | |
| Comprehensive loss | | $ | (27,508 | ) | | | | | | | | | | | | | | | | | | |
| | | | | | | | | | | | | | | | | | | | | | | |
BALANCE, June 30, 2005 | | | | | $ | 2,441 | | $ | 587 | | $ | 742,668 | | $ | (69,958 | ) | $ | (36,058 | ) | $ | 639,680 | |
The accompanying notes are an integral part of these consolidated financial statements.
CENTRAL EUROPEAN MEDIA ENTERPRISES LTD. CONSOLIDATED STATEMENTS OF CASH FLOWS
(US$ 000’s) - (Unaudited)
| | | For the Six Months Ended June 30, | |
| | | 2005 | | 2004 | |
CASH FLOWS FROM OPERATING ACTIVITIES: | | | | | |
Net income | | $ | 17,510 | | $ | 11,203 | |
| Adjustments to reconcile net income/(loss) to net cash used in operating activities: | | | | | | | |
| (Income)/loss from discontinued operations | | | 2,044 | | | 45 | |
| Equity in income, net of dividends received | | | (720 | ) | | (5,199 | ) |
| Depreciation and amortization | | | 38,363 | | | 20,431 | |
| Impairment charge | | | 35,331 | | | - | |
| Interest accrued on loans | | | (84 | ) | | (828 | ) |
| Loss on disposal of fixed assets | | | 389 | | | | |
| Stock based compensation | | | 1,682 | | | 4,254 | |
| Minority interest in income of consolidated subsidiaries | | | 4,681 | | | 457 | |
| Foreign currency exchange (gain)/loss, net | | | (29,430 | ) | | 1,922 | |
| Net change in (net of effects of acquisitions and disposals of businesses): | | | | | | | |
| Accounts receivable | | | (6,424 | ) | | (2,744 | ) |
| Program rights costs | | | (37,056 | ) | | (21,009 | ) |
| Other assets | | | (4,082 | ) | | (3,256 | ) |
| Accounts payable and accrued liabilities | | | (2,679 | ) | | (5,633 | ) |
| Change in fair value of derivatives | | | (643 | ) | | - | |
| Short term payables to bank | | | - | | | 1,016 | |
| Income and other taxes payable | | | 4,521 | | | - | |
Net cash generated from continuing operating activities | | | 23,403 | | | 659 | |
CASH FLOWS FROM INVESTING ACTIVITIES: | | | | | | | |
| Restricted cash | | | (18,677 | ) | | (24 | ) |
| Acquisition of fixed assets | | | (8,539 | ) | | (3,438 | ) |
| Proceeds from disposal of fixed assets | | | 124 | | | - | |
| Investments in subsidiaries and affiliates (1) | | | (12,884 | ) | | (17,084 | ) |
| Acquisition of TV Nova (Czech Republic) Group | | | (218,381 | ) | | - | |
| Loans and advances to related parties | | | - | | | 400 | |
| License costs, other assets and intangibles | | | - | | | 904 | |
Net cash used in investing activities | | | (258,357 | ) | | (19,242 | ) |
CASH FLOWS FROM FINANCING ACTIVITIES: | | | | | | | |
| Cash facilities and payments under capital leases | | | (9,942 | ) | | (622 | ) |
| Net proceeds from issuance of Senior Notes | | | 476,188 | | | - | |
Repayment of notes for acquisition of TV Nova (Czech Republic) Group | | | (491,703 | ) | | - | |
| Issuance of stock | | | 233,547 | | | 3,583 | |
| Dividends paid to minority shareholders | | | (77 | ) | | - | |
Net cash received from/(used in) financing activities | | | 208,013 | | | 2,961 | |
NET CASH USED IN DISCONTINUED OPERATIONS (OPERATING) | | | (2,000 | ) | | (9,274 | ) |
IMPACT OF EXCHANGE RATE FLUCTUATIONS ON CASH | | | (9,830 | ) | | (2,043 | ) |
| Net decrease in cash and cash equivalents | | | (38,771 | ) | | (26,939 | ) |
CASH AND CASH EQUIVALENTS, beginning of period | | | 152,568 | | | 192,246 | |
CASH AND CASH EQUIVALENTS, end of period | | $ | 113,797 | | $ | 165,307 | |
| SUPPLEMENTAL CASH FLOW INFORMATION: | | | | | | | |
| Cash paid for interest | | $ | 278 | | $ | 144 | |
| Cash paid for income taxes (net of refunds) | | $ | 11,965 | | $ | 14,089 | |
| Exchange of 3.5 million Class A Common Stock (Note 5) | | $ | 120,883 | | $ | - | |
| Notes taken out for acquisition of TV Nova (Czech Republic) Group (Note 5) | | $ | 491,703 | | $ | - | |
| Exchange of Other Receivable (Note 5) | | $ | 18,541 | | $ | - | |
| Purchase of Krsak interest financed with payable | | $ | 24,683 | | $ | - | |
(1) For the six months ended June 30, 2004, Investments in subsidiaries and affiliates excluded non-cash investing activities of US$ 3.4 million relating to our increased investment in our Romanian operations. For further information, see Note 5, "Acquisitions and Disposals".
The accompanying notes are an integral part of these consolidated financial statements.
CENTRAL EUROPEAN MEDIA ENTERPRISES LTD.
Notes to the Consolidated Financial Statements
June 30, 2005
Central European Media Enterprises Ltd. is a Bermuda company that, together with its subsidiaries and affiliates, invests in, develops and operates national commercial television channels and stations in Central and Eastern Europe. As at June 30, 2005, we have operations in Croatia, the Czech Republic, Romania, the Slovak Republic, Slovenia and Ukraine.
The interim statements for the six months ended June 30, 2005 should be read in conjunction with the Notes to the Consolidated Financial Statements contained in our December 31, 2004 Form 10-K filed with the Securities and Exchange Commission ("SEC") on March 15, 2005 as amended by our Form 10-K/A filed with the SEC on April 1, 2005. In the opinion of management, the interim unaudited financial statements included herein reflect all adjustments necessary, consisting of normal recurring adjustments, for a presentation in conformity with United States Generally Accepted Accounting Principles ("US GAAP"). The consolidated results of operations for interim periods are not necessarily indicative of the results to be expected for a full year.
The preparation of financial statements in conformity with US GAAP requires management to make estimates and assumptions that affect the reported amounts of assets and liabilities and disclosure of contingent assets and liabilities at the date of the financial statements and the reported amounts of revenues and expenses during the reporting year. Actual results could differ from those estimates. There have been no significant changes in our critical accounting policies since our disclosure in Part II, Item 8, “Financial Statements and Supplementary Data” of our December 31, 2004 Form 10-K filed with the SEC on March 15, 2005, as amended by our Form 10-K/A filed on April 1, 2005, other than the addition of a new critical accounting policy on reporting exchange differences on inter-company foreign currency transactions that have characteristics of a loan with a long term nature (for further information, see Part I, Item 16, VI. “Critical Accounting Policies and Estimates”).
The consolidated financial statements include the accounts of Central European Media Enterprises Ltd. and investments in entities over which we have control. We consolidate the financial statements of entities in which we hold more than a majority voting interest and also those entities which are deemed to be a Variable Interest Entity of which we are the primary beneficiary as defined by FASB Interpretation No. 46 (revised December 2003), “Consolidation of Variable Interest Entities” ("FIN 46 (R)"). Entities in which we hold less than a majority voting interest but over which we have the ability to exercise significant influence are accounted for using the equity method. Other investments are accounted for using the cost method.
We, like other television operators, experience seasonality, with advertising sales tending to be lower during the first and third quarters of each calendar year, particularly during the summer holiday period (typically July and August), and higher during the second and fourth quarters of each calendar year, particularly toward the end of the year.
Stock-based Compensation
Stock-based compensation costs are determined when options are issued and are measured under the fair value method as defined in SFAS 123, "Accounting for Stock-based Compensation" ("SFAS 123"). We adopted SFAS 123 prospectively for employee stock option awards granted, modified, or settled beginning January 1, 2003, as contemplated by SFAS 148, "Accounting for Stock-based Compensation - Transition & Disclosure" ("SFAS 148"). In prior periods, we used the intrinsic method of accounting as defined in APB 25, "Accounting for Stock Issued to Employees" ("APB 25").
Pro Forma Disclosures
Had compensation costs for employee stock option awards granted, modified or settled prior to January 1, 2003 been determined consistent with the fair value approach required by SFAS 123 for all periods presented, using the Black-Scholes option pricing model with the assumptions as estimated on the date of each grant, our net income and net income per common share would decrease to the following pro forma amounts:
| | | | | For the Three Months Ended June 30, | | For the Six Months Ended June 30, | |
| | | | | (US$ 000’s, except per share data) | |
| | | | | 2005 | | 2004 | | 2005 | | 2004 | |
| | | | | | | | | | | | |
| Net Income | | | As Reported | | $ | 25,459 | | $ | 6,032 | | $ | 17,510 | | $ | 11,203 | |
| Add/(deduct): Stock-based compensation expense/(income) included in reported net income, net of related tax effects | | | As Reported | | | (1,419 | ) | | 2,369 | | | 1,682 | | | 4,254 | |
| Add/(deduct): Total stock-based compensation expense determined under fair value based method for all awards, net of related tax effects | | | Pro Forma Expense | | | 1,384 | | | (2,422 | ) | | (1,727 | ) | | (4,361 | ) |
| Net Income | | | Pro Forma | | $ | 25,424 | | $ | 5,979 | | $ | 17,465 | | $ | 11,096 | |
| | | | | | | | | | | | | | | | | |
| Net Income Per Common Share - Basic: | | | As Reported | | $ | 0.74 | | $ | 0.22 | | $ | 0.56 | | $ | 0.41 (1 | ) |
| | | | Pro Forma | | $ | 0.74 | | $ | 0.21 | | $ | 0.56 | | $ | 0.40 | |
| | | | | | | | | | | | | | | | | |
| Net Income Per Common Share -Diluted: | | | As Reported | | $ | 0.72 | | $ | 0.21 (1 | ) | $ | 0.54 | | $ | 0.39 (1 | ) |
| | | | Pro Forma | | $ | 0.72 | | $ | 0.21 (1 | ) | $ | 0.54 | | $ | 0.38 (1 | ) |
(1) As restated, for further information, see Note 14, “Earnings Per Share”.
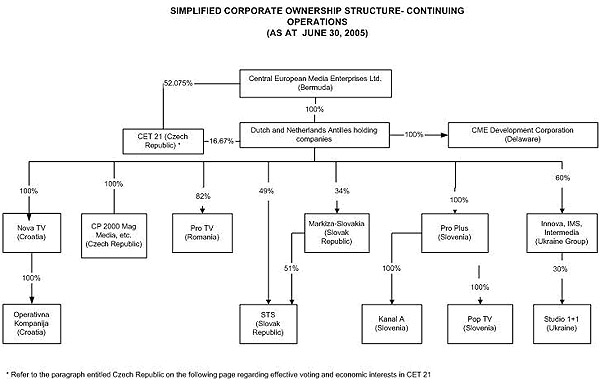
Central European Media Enterprises Ltd. was incorporated on June 15, 1994 under the laws of Bermuda. Our assets are held through a series of Dutch and Netherlands Antilles holding companies. In each market in which we operate, we have ownership interests both in license companies and in operating companies. License companies have been authorized by the relevant local regulatory authority to engage in television broadcasting in accordance with the terms of a particular license. We generate revenues primarily through our operating companies which acquire programming for broadcast by the corresponding license holding company and enter into agreements with advertisers and advertising agencies on behalf of the respective license company. In the Czech Republic, Romania and Ukraine, the license company also acts as an operating company. Our share of profits in the operating companies corresponds with our voting interest other than in the Slovak Republic and Ukraine, where we are entitled by contract to a share of profits that is in excess of our voting interest. Below is an overview of our operating structure, the accounting treatment for each entity and a chart entitled “Simplified Corporate Ownership Structure - Continuing Operations”.
Key Subsidiaries and Affiliates as at June 30, 2005 | | Voting Interest | | Share of Profits | | Accounting Treatment | | TV Channels | |
Continuing Operations | | | | | | | | | |
| | | | | | | | | | |
Croatia | | | | | | | | | |
Operating Company: | | | | | | | | | |
| Operativna Kompanija d.o.o. (OK) | | | 100 | % | | 100 | % | | Consolidated | | | | |
| | | | | | | | | | Subsidiary | | | | |
License Company: | | | | | | | | | | | | | |
| Nova TV d.d. (Nova TV Croatia) | | | 100 | % | | 100 | % | | Consolidated | | | NOVA TV (Croatia) | |
| | | | | | | | | | Subsidiary | | | | |
| | | | | | | | | | | | | | |
Czech Republic | | | | | | | | | | | | | |
Operating Companies: | | | | | | | | | | | | | |
| Ceska Produkcni 2000 a.s. (CP 2000) | | | 100 | % | | 100 | % | | Consolidated | | | | |
| | | | | | | | | | Subsidiary | | | | |
| MAG MEDIA 99 a.s. (Mag Media) | | | 100 | % | | 100 | % | | Consolidated | | | | |
| | | | | | | | | | Subsidiary | | | | |
License Company: | | | | | | | | | | | | | |
| CET 21 s.r.o. (CET 21) | | | 96.5 | % | | 96.5 | % | | Consolidated | | | TV NOVA | |
| | | | | | | | | | Subsidiary | | | (Czech Republic) | |
| | | | | | | | | | | | | | |
Romania | | | | | | | | | | | | | |
Operating Companies: | | | | | | | | | | | | | |
| Media Pro International | | | 82 | % | | 82 | % | | Consolidated | | | | |
| S.A. (MPI) | | | | | | | | | Subsidiary | | | | |
| | | | | | | | | | | | | | |
| Media Vision S.R.L. (Media Vision) | | | 70 | % | | 70 | % | | Consolidated | | | | |
| | | | | | | | | | Subsidiary | | | | |
License Companies: | | | | | | | | | | | | | |
| Pro TV S.A. - formerly Pro TV S.R.L. (Pro TV) | | | 82 | % | | 82 | % | | Consolidated | | | PRO TV, ACASA, | |
| | | | | | | | | | Subsidiary | | | PRO CINEMA and | |
| | | | | | | | | | | | | PRO TV | |
| | | | | | | | | | | | | INTERNATIONAL | |
| | | | | | | | | | | | | | |
| Radio Pro S.R.L. - Formerly Media Pro S.R.L | | | 20 | % | | 20 | % | | Equity Accounted | | | PRO FM (radio), | |
| (Radio Pro) | | | | | | | | | Affiliate | | | INFOPRO | |
| | | | | | | | | | | | | | |
Slovenia | | | | | | | | | | | | | |
Operating Company: | | | | | | | | | | | | | |
| Produkcija Plus d.o.o. (Pro Plus) | | | 100 | % | | 100 | % | | Consolidated | | | | |
| | | | | | | | | | Subsidiary | | | | |
License Companies: | | | | | | | | | | | | | |
| Pop TV d.o.o. (Pop TV) | | | 100 | % | | 100 | % | | Consolidated | | | POP TV | |
| | | | | | | | | | Subsidiary | | | | |
| | | | | | | | | | | | | | |
| Kanal A d.o.o. (Kanal A) | | | 100 | % | | 100 | % | | Consolidated | | | KANAL A | |
| | | | | | | | | | Subsidiary | | | | |
Key Subsidiaries and Affiliates as at June 30, 2005 | | Voting Interest | | Share of Profits | | Accounting Treatment | | TV Channels | |
Continuing Operations | | | | | | | | | |
| | | | | | | | | | |
Slovak Republic | | | | | | | | | |
Operating Company: | | | | | | | | | |
| Slovenska Televizna Spolocnost s.r.o. (STS) | | | 49 | % | | 70 | % | | Equity Accounted | | | | |
| | | | | | | | | | Affiliate | | | | |
License Company: | | | | | | | | | | | | | |
| Markiza-Slovakia s.r.o. (Markiza) | | | 34 | % | | 0.1 | % | | Equity Accounted | | | MARKIZA TV | |
| | | | | | | | | | Affiliate | | | | |
| | | | | | | | | | | | | | |
Ukraine | | | | | | | | | | | | | |
Operating Companies: | | | | | | | | | | | | | |
| Innova Film GmbH (Innova) | | | 60 | % | | 60 | % | | Consolidated | | | | |
| | | | | | | | | | Subsidiary | | | | |
| International Media Services Ltd. (IMS) | | | 60 | % | | 60 | % | | Consolidated | | | | |
| | | | | | | | | | Subsidiary | | | | |
| Enterprise "Inter-Media" (Inter-Media) | | | 60 | % | | 60 | % | | Consolidated | | | | |
| | | | | | | | | | Subsidiary | | | | |
License Company: | | | | | | | | | | | | | |
| Broadcasting Company "Studio 1+1" (Studio 1+1) | | | 18 | % | | 60 | % | | Consolidated | | | STUDIO 1+1 | |
| | | | | | | | | | Variable Interest | | | | |
| | | | | | | | | | Entity | | | | |
Croatia
We own 100% of Nova TV (Croatia), which holds a national terrestrial broadcast license for Croatia. Nova TV (Croatia) owns 100% of OK, which provides programming and advertising services for the NOVA TV (Croatia) channel.
Czech Republic
We own 68.745% of CET 21, which holds the national terrestrial broadcast license for TV NOVA (Czech Republic). Our voting and economic interest in CET 21 is effectively 96.50% because CET 21 itself holds an undistributed 28.755% interest that is not entitled to voting rights or dividends. We own 100% of CP 2000 and CP 2000 owns 100% of Mag Media. CP 2000 and its subsidiaries provide services related to programming, production and advertising to CET 21.
Romania
We have a voting and economic interest of 82% in Pro TV and MPI. Our voting and economic interest in both companies increased from 66% to 80% on March 29, 2004 when we acquired an additional 14% of MPI and Pro TV from our partner and General Director Adrian Sarbu. We acquired an additional 2% of MPI and Pro TV from Mr. Sarbu on February 28, 2005. Pro TV holds all 27 PRO TV licenses, including a recently awarded license for Constanta, Romania’s third biggest population center and main port. In addition, Pro TV holds the licenses for ACASA, PRO TV INTERNATIONAL and PRO CINEMA.
We have a 70% voting and economic interest in Media Vision, a production and subtitling company.
We have a 20% voting and economic interest in Radio Pro, which holds the licenses for the PRO FM and INFOPRO radio networks.
On July 29, 2005, we acquired from Mr. Sarbu an additional 3% voting and economic interest in MPI and Pro TV (for further information, see Note 19, “Subsequent Events”).
Slovenia
Following the exercise by Marijan Jurenec of his put option and sale of his 3.15% interest in Pro Plus to us on June 24, 2005, we own 100% of Pro Plus, the operating company for our Slovenian operations. Pro Plus has a 100% voting and economic interest in Pop TV , which holds the licenses for the POP TV network, and Kanal A, which holds the licenses for the KANAL A network.
Slovak Republic
We have a 49% voting interest and are entitled to a 70% share of profits in STS, the operating company for the MARKIZA TV network. We have a 34% voting interest in Markiza, the license holding company for the MARKIZA TV network, and are entitled to a 0.1% share of its profits.
Ukraine
The Studio 1+1 Group consists of several entities in which we hold direct or indirect interests. We hold a 60% ownership and economic interest in each of Innova and IMS. Innova owns 100% of Inter-Media, a Ukrainian company, which in turn holds a 30% voting and economic interest in Studio 1+1, which holds the license for the STUDIO 1+1 network.
Because of regulatory restrictions on direct foreign ownership of broadcasters, our indirect ownership interest in Studio 1+1 is 18%. We entered into an additional agreement on December 30, 2004 with Boris Fuchsmann, Alexander Rodnyansky and Studio 1+1 which re-affirms our entitlement to 60% of any distribution from Studio 1+1 to its shareholders until such time as Ukrainian legislation allows us to increase our direct interest in Studio 1+1 to 60%.
3. | Recent Accounting Pronouncements |
Stock Based Compensation
On December 16, 2004, the FASB issued SFAS 123 (revised 2004), "Share-Based Payment", which is a revision of SFAS 123, "Accounting for Stock-Based Compensation". SFAS 123(R) supersedes APB Opinion No. 25, "Accounting for Stock Issued to Employees", and amends SFAS 95, "Statement of Cash Flows". Generally, the approach in SFAS 123(R) is similar to the approach described in Statement 123. However, SFAS 123(R) requires all share-based payments to employees, including grants of employee stock options, to be recognized in the income statement based on their fair values. Pro forma disclosure is no longer an alternative. We will adopt SFAS 123(R) on January 1, 2006. We do not expect the adoption of SFAS 123(R) to have a material impact on our financial statements.
In connection with the acquisition of TV Nova (Czech Republic), we held CZK 600 million (approximately US$ 24.2 million) as at June 30, 2005 (December 31, 2004: nil) as restricted cash (for further information see Note 5, “Acquisitions and Disposals”).
In connection with the acquisition of Nova TV (Croatia), we held Euro 3.0 million (approximately US$ 3.7 million) as at June 30, 2005 (December 31, 2004: Euro 7.6 million, approximately US$ 10.3 million) as restricted cash (for further information see Note 5, “Acquisitions and Disposals”).
Additionally, we had US$ 5.2 million (December 31, 2004: US$ 5.1 million) classified as restricted cash in relation to our self insurance program for directors' and officers' liability insurance at both June 30, 2005 and December 31, 2004.
5. | Acquisitions and Disposals |
Czech Republic
Acquisition - TV Nova
On May 2, 2005, we acquired an 85% interest in the TV Nova (Czech Republic) Group from PPF (Cyprus) Ltd. The TV Nova (Czech Republic) Group is a group of companies that own and operate the TV NOVA channel in the Czech Republic, including Ceska Produkcni 2000 (''CP 2000''), Mag Media and CET 21. Consideration for this acquisition was approximately US$ 631 million, including the incurrence of $ 492 million of indebtedness to PPF (which was repaid in cash on May 5, 2005), 3,500,000 unregistered shares of our Class A common stock and forgiveness of a US$ 18.4 million receivable categorized as “Other Receivable” in our consolidated balance sheet as at December 31, 2004. The final purchase price is subject to adjustment based on a post-completion audit for changes in the level of working capital and indebtedness from the time we entered into a framework agreement with PPF on December 13, 2004 to the completion date.
On May 27, 2005, we acquired from Peter Krsak his 16.67% interest in CET 21, which holds the national terrestrial broadcast license for TV NOVA in the Czech Republic. Consideration for this transaction is CZK 1.2 billion (approximately US$ 49 million). The purchase price is payable in two installments; one half of the consideration was paid on May 27, 2005. The second installment of CZK 600 million (approximately US$ 24.2 million) will be paid on the earlier of July 15, 2006 or the date on which we are registered with the Czech commercial register as the owner of 52.075% of CET 21 and this installment is classified in our consolidated balance sheet as deferred consideration as at June 30, 2005.
Following the exercise of our call option, we acquired from PPF its remaining 15% interest in the TV Nova (Czech Republic) Group for consideration of approximately US$ 216.4 million on May 31, 2005.
As a result of these transactions, we have acquired a 100% interest in CP 2000, which provides services related to programming, production and advertising for TV NOVA (Czech Republic) and a 100% interest in Vilja a.s., which owns a 52.075% interest in CET 21. When aggregated with the purchase of the Krsak interest, we own 68.745% of CET 21. Our voting and economic interest in CET 21 is 96.50% because CET 21 itself holds an undistributed 28.755% interest that is not entitled to voting rights or dividends.
The remaining minority interests in CET 21 are currently held by Ceska Sporitelna a.s. (1.25%) and CEDC GmbH (1.25%). Subject to the consent of the Czech Media Council, the interests of Ceska Sporitelna and CEDC will also be transferred to the TV Nova (Czech Republic) Group for nominal consideration.
The following table summarizes the estimated fair values of the assets acquired and liabilities assumed at the date of acquisition. We are in the process of obtaining full third-party valuations of the fair values of the net assets acquired; thus, the allocation of the purchase price is subject to change.
| | | US$ 000’s | |
| | | | |
| Cash | | $ | 35,592 | |
| | | | | |
| Receivables | | | 56,832 | |
| | | | | |
| Property, plant and equipment | | | 12,977 | |
| | | | | |
| Program library | | | 23,141 | |
| | | | | |
| Intangible assets subject to amortization | | | 120,604 | |
| | | | | |
| Intangible assets not subject to amortization | | | 17,701 | |
| | | | | |
| Goodwill | | | 771,815 | |
| | | | | |
| Other assets | | | 25,933 | |
| | | | | |
| Liabilities | | | (120,817 | ) |
| | | | | |
| Deferred tax liability | | | (31,795 | ) |
| | | | | |
| Minority interest | | | (2,200 | ) |
| | | | | |
Total purchase price | | $ | 909,783 | |
Total purchase price includes US$ 12.9 million of capitalized acquisition costs.
The intangible assets subject to amortization are comprised of approximately US$ 5 million in customer relationships, which are being amortized over nine years, and approximately US$ 116 million relating to the acquired television broadcast license, which is being amortized over twelve years.
Intangible assets not subject to amortization relate to the ‘TV NOVA’ trade name.
Our consolidated statement of operations reflects the increased interest expense and amortization charges resulting from the acquisition of 85% of the TV Nova (Czech Republic) Group on May 2, 2005, the Krsak interest on May 27, 2005 and 15% of the TV Nova (Czech Republic) Group on May 31, 2005. On an unaudited pro-forma basis, assuming that these acquisitions had occurred at the beginning of each period presented, our consolidated statement of operations would have been as follows:
| | | For the Three Months Ended June 30, | | For the Six Months Ended June 30, | |
| | | 2005 | | 2004 | | 2005 | | 2004 | |
| | | | | | | | | | |
| Pro-forma | | (US$ 000's, except per share data) | |
| | | | |
| Net revenues | | $ | 139,552 | | $ | 103,582 | | $ | 243,537 | | $ | 184,971 | |
| | | | | | | | | | | | | | |
| Net income from continuing operations | | $ | 35,238 | | $ | 22,635 | | $ | 38,118 | | $ | 35,557 | |
| | | | | | | | | | | | | | |
| Net income | | $ | 32,849 | | $ | 22,920 | | $ | 36,074 | | $ | 35,512 | |
| | | | | | | | | | | | | | |
| | | | | | | | | | | | | | |
| Per Share Data: | | | | | | | | | | | | | |
| | | | | | | | | | | | | | |
| Net income - Basic | | $ | 0.88 | | $ | 0.62 | | $ | 0.96 | | $ | 0.97 | |
| | | | | | | | | | | | | | |
| Net income - Diluted | | $ | 0.86 | | $ | 0.60 | | $ | 0.94 | | $ | 0.94 | |
The pro-forma net income for each period presented reflects all costs relating to the Senior Notes issued to finance the acquisition of the TV Nova (Czech Republic) Group and the Krsak interest and increased amortization charges relating to the intangibles acquired at their preliminary fair value. The earnings per share calculation reflects the increase in the number of shares issued relating to these acquisitions.
The primary reason for the purchase of the TV Nova (Czech Republic) Group and the main factor that contributed to a purchase price that results in a recognition of goodwill is the opportunity for us to secure a significant broadcasting asset at a favorable valuation. Adding the leading broadcaster of one of the larger Central and East European markets to our portfolio of stations and channels has doubled our size and substantially enhanced our cash-flows, confirming our position as the dominant broadcaster in the region. Ownership of a significant asset such as the TV Nova (Czech Republic) Group creates a solid base for further expansion when opportunities arise.
Romania
Acquisition - MPI and Pro TV
On March 29, 2004, we acquired a 14% voting and economic interest in each of our consolidated subsidiaries MPI and Pro TV from Rootland Trading Limited for purchase consideration of US$ 20.3 million. Rootland Trading Limited is controlled by Mr. Adrian Sarbu. This acquisition brought our total voting and economic interest in both companies to 80%.
The consideration for the acquisition consisted of US$ 16.9 million cash and the settlement of loans receivable due from companies controlled by Mr. Sarbu that he had personally guaranteed (Inter-Media srl: US$ 1.8 million and Media Pro Pictures: US$ 1.6 million).
The purchase price was agreed by reference to an independent valuation report and was based on a multiple of MPI and Pro TV's future earnings. In accordance with the SFAS No. 141, "Business Combinations" ("FAS 141"), we have allocated US$ 3.7 million to broadcast licenses, US$ 5.5 million to trademarks and US$ 2.0 million to customer relationships, all of which were preliminarily allocated to goodwill. We have recognized a corresponding deferred tax liability on the tax basis difference arising from these assets. Both trademarks and broadcast licenses have been assigned an indefinite life, while customer relationships are deemed to have an economic useful life of, and are amortized on a straight-line basis over, eight years. An amount of US$ 8.8 million was recognized as goodwill.
On February 28, 2005, we acquired from Mr. Sarbu an additional 2% voting and economic interest in MPI and Pro TV for aggregate consideration of US$ 5 million. Following this transaction we own a voting and economic interest in MPI and Pro TV of 82%. The purchase price was agreed by reference to the valuation methodology in a 2003 independent valuation report and was based on a multiple of MPI and Pro TV’s earnings. In accordance with the FAS No. 141, we have allocated US$ 1.2 million to broadcast licenses, US$ 0.9 million to trademarks and US$ 0.2 million to customer relationships. We have recognized a corresponding deferred tax liability on the tax basis difference arising from these assets. Both trademarks and broadcast licenses have been assigned an indefinite life, while customer relationships are deemed to have a remaining economic useful life of, and are amortized on a straight-line basis over, seven years. An amount of US$ 2.9 million was recognized as goodwill.
On July 29, 2005, we acquired from Mr. Sarbu an additional 3% voting and economic interest in MPI and Pro TV for aggregate consideration of US$ 15 million. Following this transaction we own a voting and economic interest in MPI and Pro TV of 85%. The purchase price was determined by reference to an independent valuation report prepared in July 2005 and was based on a multiple of MPI and Pro TV's future earnings. We are initiating a fair value exercise to allocate the purchase price to the acquired assets and liabilities. Upon completion of the fair value exercise, the purchase price allocation will include the broadcast license intangible asset and other intangible assets to be identified (for further information see Part I, Note 19, “Subsequent Events”).
Croatia
Acquisition - Nova TV
We acquired 100% of Nova TV (Croatia) and OK in Croatia for Euro 20.3 million (approximately US$ 24.7 million at the time of acquisition) on July 16, 2004. The purchase price is payable in three installments. Euro 15.6 million (approximately US$ 19.0 million at the time of payment) was paid at closing on the basis of an estimated purchase price. Euro 1.7 million (approximately US$ 2.1 million at the time of payment) was paid on February 9, 2005 following the determination of the final purchase price. Approximately Euro 3.0 million (approximately US$ 3.7 million) of the total purchase price will be held in escrow and is classified at June 30, 2005 in our consolidated balance sheet as restricted cash until the date on which any claims by us in excess of such amount relating to breaches of representation and warranty or covenants provisions contained in the acquisition agreement are resolved or settled. As at August 1, 2005, the final Euro 3.0 million (approximately US$ 3.7 million) had not been paid.
In May 2005, we completed a fair value exercise and allocated the purchase price to the acquired assets and liabilities. This fair value exercise included identifying separately identifiable intangible assets. In accordance with FAS 141, we allocated US$ 18.7 million to broadcast licenses and US$ 7.4 million to trademarks, both of which were preliminarily allocated to goodwill net of taxes. We recognized a deferred tax liability arising from these assets. Both trademarks and broadcast licenses were assigned an indefinite life. After allocating the purchase price to all acquired assets, liabilities and intangible assets, US$ 10.4 million of goodwill remained.
Slovenia
Acquisition - Pro Plus
On June 24, 2005, we acquired from Marijan Jurenec an additional 3.15% interest in Pro Plus for Euro 4.7 million (approximately US$ 5.7 million). The purchase price was determined with reference to the put option agreement between Mr. Jurenec and us entered into in January 2003. Following this transaction we own a voting and economic interest in Pro Plus of 100%. In accordance with the FAS No. 141, we have allocated US$ 2.5 million to broadcast licenses and US$ 0.5 million to trademarks. We have recognized a corresponding deferred tax liability on the tax basis difference arising from these assets of US$ 0.7 million. Both trademarks and broadcast licenses have been assigned an indefinite life. An amount of US$ 2.3 million was recognized as goodwill.
In connection with our on-going review of our Croatian operations and following a strategic assessment of the performance of Nova TV (Croatia) undertaken during the quarter, we modified our strategy for Croatia in late June 2005. This new strategy requires higher current expenditures than had been planned prior to the strategic assessment in order to secure our audience and market share targets. As part of our second quarter close process we performed an analysis of our Croatian business to determine if it was impaired, given that the new strategy results in cash flows that differ significantly from those previously forecast. SFAS 142 “Goodwill and Other Intangible Assets” (“FAS 142”) requires that when such circumstances exist, the carrying value of the intangible assets with indefinite lives are compared to their fair value to determine whether an impairment exists. If an asset is determined to be impaired, the loss is measured as the excess of the carrying value over the fair value. As a result of our analysis, we have recognized an impairment charge of US$ 18.6 million relating to the broadcast license, US$ 7.0 million relating to trademarks and US$ 9.7 million relating to goodwill. Included in provision for income taxes is a US$ 5.1 million credit representing a release of deferred tax relating to the impairment charge on the license and trademark. A further impairment charge relating to other Long-Lived assets was not deemed necessary under the requirements of SFAS 144 “Accounting for the Impairment or Disposal of Long-Lived Assets” (“FAS 144”). For purposes of the impairment assessment, the fair value of the trademark was determined using the royalty relief method and the fair value of the broadcast license was determined using the build-out method. The royalty relief method measures the after-tax royalties saved by owning the intangible assets; the build-out method assumes that the business begins holding only the license and a plan must build up the assets and workforce needed to run the business.
7. | Goodwill and Intangible Assets |
The carrying amount of goodwill and other intangibles as at June 30, 2005 and December 31, 2004 is as follows:
Goodwill:
| | | Carrying | | Additions in | | Allocation | | Impairment | | Foreign | | Carrying | |
| | | amount as at | | the period | | | | | | Exchange | | amount as at | |
| | | December 31, | | | | | | | | movements | | June 30, 2005 | |
| | | 2004 | | | | | | | | | | | |
| | | (US$ 000’s) | |
| Slovenian operations | | $ | 14,724 | | | 2,300 | | | - | | | - | | | (1,626 | ) | $ | 15,398 | |
| | | | | | | | | | | | | | | | | | | | |
| Ukrainian operations | | $ | 4,096 | | | - | | | - | | | - | | | - | | $ | 4,096 | |
| | | | | | | | | | | | | | | | | | | | |
| Romanian operations | | $ | 8,826 | | | 2,919 | | | - | | | - | | | - | | $ | 11,745 | |
| | | | | | | | | | | | | | | | | | | | |
| Croatian operations | | $ | 31,446 | | | - | | | (18,817 | ) | | (9,706 | ) | | (2,193 | ) | $ | 730 | |
| | | | | | | | | | | | | | | | | | | | |
| Czech Republic operations | | $ | - | | | 771,815 | | | - | | | - | | | (29,280 | ) | $ | 742,535 | |
| | | | | | | | | | | | | | | | | | | | |
Total | | $ | 59,092 | | $ | 777,034 | | | (18,817 | ) | | (9,706 | ) | | (33,099 | ) | $ | 774,504 | |
Other intangibles:
| | | Carrying | | Additions / | | Impairment | | Amortization in | | Foreign | | Carrying | |
| | | amount as at | | Allocations in | | | | the period | | exchange | | amount as at | |
| | | December 31, | | the period | | | | | | movements | | June 30, 2005 | |
| | | 2004 | | | | | | | | | | | |
| | | | | | | | | | | | | | |
| | | (US$ 000’s) | |
| License acquisition cost | | $ | 1,506 | | | - | | | - | | | - | | | - | | $ | 1,506 | |
| | | | | | | | | | | | | | | | | | | | |
| Broadcast license | | $ | 13,069 | | | 137,853 | | | (18,604 | ) | | (1,492 | ) | | (5,508 | ) | $ | 125,318 | |
| | | | | | | | | | | | | | | | | | | | |
| Trademarks | | $ | 10,519 | | | 26,545 | | | (7,021 | ) | | - | | | (1,029 | ) | $ | 29,014 | |
| | | | | | | | | | | | | | | | | | | | |
| Customer relationships | | $ | 2,237 | | | 5,232 | | | - | | | (256 | ) | | (213 | ) | $ | 7,000 | |
| | | | | | | | | | | | | | | | | | | | |
Total | | $ | 27,331 | | $ | 169,630 | | $ | (25,625 | ) | $ | (1,748 | ) | $ | (6,750 | ) | $ | 162,838 | |
All license acquisition costs and trademarks are assets with indefinite useful lives and are subject to annual impairment reviews. Our broadcast licenses primarily have indefinite lives and are subject to annual impairment reviews, except for our broadcast licenses in the Czech Republic and Ukraine. The licenses in Ukraine have economic useful lives of, and are amortized on a straight-line basis over, seven and ten years. The license in the Czech Republic has an economic useful life of, and is amortized on a straight-line basis over, twelve years. Customer relationships are deemed to have an economic useful life of, and are amortized on a straight-line basis over, between seven and nine years. The estimated amortization expense is US$ 7.9 million for 2005 and US$ 12.3 million for each of the years 2006-2010.
Other assets consist of the following:
| | | As at June 30, 2005 | | December 31, 2004 | |
| | | US$ 000’s | | US$ 000’s | |
Current: | | | | | |
| | | | | | |
Prepaid expenses | | $ | 16,637 | | $ | 9,026 | |
| | | | | | | | |
| VAT recoverable | | | 2,210 | | | 664 | |
| | | | | | | | |
| Income taxes receivable | | | 12,326 | | | - | |
| | | | | | | | |
| Capitalized debt costs | | | 1,906 | | | - | |
| | | | | | | | |
| Other | | | 5,893 | | | 1,324 | |
| | | $ | 38,972 | | $ | 11,014 | |
| | | | | | | | |
Long term: | | | | | | | |
| | | | | | | | |
Capitalized debt costs | | $ | 11,166 | | $ | - | |
| | | | | | | | |
| Other | | | 5,251 | | | 1,467 | |
| | | $ | 16,417 | | $ | 1,467 | |
Income taxes receivable represent a receivable for income taxes due to TV Nova (Czech Republic) Group. Capitalized debt costs represent the costs incurred in connection with the issuance of our Senior Notes in May 2005 (for further information see Note 11, “Senior Notes”).
9. | Accounts Payable and Accrued Liabilities |
Accounts payable and accrued liabilities consist of the following:
| | | As at June 30, 2005 | | As at December 31, 2004 | |
| | | US$ 000’s | | US$ 000’s | |
| Accounts payable | | $ | 18,985 | | $ | 16,642 | |
| | | | | | | | |
| Programming liabilities | | | 44,024 | | | 22,156 | |
| | | | | | | | |
| Other accrued liabilities | | | 44,162 | | | 28,244 | |
| | | $ | 107,171 | | $ | 67,042 | |
The increase in the above accounts relate primarily to our acquisition of the TV Nova (Czech Republic) Group in May 2005.
The settlement liability consists of the following:
| | | As at June 30, 2005 | | December 31, 2004 | |
| | | US$ 000’s | | US$ 000’s | |
Current: | | | | | |
| Mediation liability | | $ | 1,047 | | $ | - | |
| | | | | | | | |
Long term: | | | | | | | |
Mediation liability | | $ | 48,971 | | $ | - | |
The settlement liability represents a settlement amount owed by CET 21 under a settlement agreement among CET 21, Ceska nezavisla televizni spolecnost, spol. s.r.o. ("CNTS") and the PPF Group dated December 19, 2003 following a mediation. This liability was assumed as part of the TV Nova (Czech Republic) Group acquisition (for further information, see Note 5, “Acquisitions and Disposals”).
In 1999, CET 21, then unrelated to PPF Group, withdrew from a cooperation agreement with CNTS, our former operating company in the Czech Republic, and began broadcasting a substitute signal for TV NOVA in direct competition with CNTS. As a result, we together with CNTS filed a claim for breach of the contract and in 2003, initiated arbitration proceedings against CET 21 for the loss in value of our investment in CNTS. In October 2003, PPF Media B.V. purchased our interest in CNTS and all claims relating thereto and continued the legal proceedings against CET 21. Any and all disputes between CNTS and CET 21 were finally settled pursuant to the settlement agreement of December 19, 2003.
Under the terms of the settlement agreement, CET 21 is obliged to pay US$ 101.3 million to PPF Media B.V. and US$ 3.1 million to CNTS in full and final settlement of all claims. The payment schedule provides for payments through 2007 and unpaid amounts bear interest at a rate of 8.5% per annum on the unpaid balance. As at June 30, 2005, the unpaid amount of this liability was US$ 50.0 million (US$ 1.0 million of which is classified in our consolidated balance sheet as current settlement liability).
On May 5, 2005, we issued Senior Notes in the aggregate principal amount of Euro 370 million (approximately US$ 447.9 million), consisting of Euro 245 million (approximately US$ 296.6 million) 8.25% Senior Notes due May 2012 and Euro 125 million (approximately US$ 151.3 million) floating rate Senior Notes due May 2012, which bear interest at six-month Euro Inter-Bank Offered Rate (“EURIBOR”) plus 5.5% (EURIBOR - 6 month as at June 30, 2005 was 2.1%). Interest is payable semi-annually in arrears on each May 15 and November 15, commencing November 15, 2005. The Senior Notes are secured senior obligations and rank pari passu with all existing and future senior indebtedness and are effectively subordinated to all existing and future indebtedness of our subsidiaries. The terms of our indebtedness restrict the manner in which our business is conducted, including the incurrence of additional indebtedness, the making of investments, the payment of dividends or the making of other distributions, entering into certain affiliate transactions and the sale of assets.
The Senior Notes are redeemable at our option, in whole or in part, at the redemption prices set forth below:
| | Euro 245 million 8.25% Senior Notes | | Euro 125 million floating rate Senior Notes |
| | | | |
| | Redemption Price | | Redemption Price |
| | | | |
| May 15, 2009 | 104.125% | May 15, 2007 | 102.000% |
| | | | |
| May 15, 2010 | 102.063% | May 15, 2008 | 101.000% |
| | | | |
| May 15, 2011 and thereafter | 100.00% | May 15, 2009 and thereafter | 100.000% |
The fair value of the Senior Notes as at June 30, 2005 was approximately Euro 265.8 million (approximately US$ 321.8 million) for the Euro 245 million 8.25% Senior Notes and approximately Euro 130.0 million (approximately US$ 157.4 million) for the Euro 125 million floating rate Senior Notes. These are approximate values as the market for these bonds is illiquid.
We manage our business on a country-by-country basis and review the performance of each business segment using data that reflects 100% of operating and license company results. Our business segments are comprised of Croatia, the Czech Republic, Romania, the Slovak Republic, Slovenia and Ukraine.
We evaluate the performance of our business segments based on Segment Net Revenues and Segment EBITDA. Segment Net Revenues and Segment EBITDA include STS and Markiza (our operating and license companies in the Slovak Republic) for the six and three months ended June 30, 2005 and STS, Markiza and Radio Pro in Romania for the six and three months ended June 30, 2004. These entities are not consolidated under US GAAP.
Our key performance measure of the efficiency of our business segments is EBITDA margin. We define Segment EBITDA margin as the ratio of Segment EBITDA to Segment Net Revenue.
Our assets and liabilities are managed centrally and are reported internally in the same manner as the consolidated financial statements, consequently no additional segment information is provided in respect of assets and liabilities.
Segment EBITDA is determined as segment net income/loss, which includes costs for program rights amortization, before interest, taxes, depreciation and amortization of intangible assets. Items that are not allocated to our business segments for purposes of evaluating their performance and therefore are not included in Segment EBITDA, include:
| · | expenses presented as corporate expenses in our consolidated statements of operations (i.e., corporate operating costs, stock-based compensation and amortization of intangibles); |
| · | changes in the fair value of derivatives; |
| · | foreign currency exchange gains and losses; |
| · | certain unusual or infrequent items (e.g., extraordinary gains and losses, impairments on assets or investments). |
Segment EBITDA is also used as a component in determining management bonuses.
Below is a table showing our Segment EBITDA by operation and reconciling these figures to our consolidated US GAAP results for the three and six months ended June 30, 2005 and 2004:
| | | SEGMENT FINANCIAL INFORMATION | |
| | | For the Three Months Ended June 30, | |
| | | (US $000's) | |
| | | Segment Net Revenues (1) | | Segment EBITDA | |
| | | 2005 | | 2004 | | 2005 | | 2004 | |
Country | | | | | | | | | |
| | | | | | | | | | |
| Croatia (NOVA TV) | | $ | 7,652 | | $ | - | | $ | (1,337 | ) | $ | - | |
| | | | | | | | | | | | | | |
| Czech Republic (TV NOVA) | | | 47,767 | | | - | | | 28,287 | | | - | |
| | | | | | | | | | | | | | |
| Romania (2) | | | 26,592 | | | 18,702 | | | 11,974 | | | 5,920 | |
| | | | | | | | | | | | | | |
| Slovak Republic (MARKIZA TV) | | | 19,627 | | | 17,448 | | | 7,956 | | | 8,393 | |
| | | | | | | | | | | | | | |
| Slovenia (POP TV and KANAL A) | | | 13,920 | | | 13,751 | | | 6,490 | | | 6,860 | |
| | | | | | | | | | | | | | |
| Ukraine (STUDIO 1+1) | | | 17,178 | | | 13,248 | | | 4,935 | | | 4,895 | |
| | | | | | | | | | | | | | |
Total Segment Data | | $ | 132,736 | | $ | 63,149 | | $ | 58,305 | | $ | 26,068 | |
| | | | | | | | | | | | | | |
| | | | | | | | | | | | | | |
Reconciliation to Consolidated Statement of Operations: | | | | | | | | | | | | | |
| | | | | | | | | | | | | | |
Consolidated Net Revenues / Income before provision for income taxes, minority interest, equity in income of unconsolidated affiliates and discontinued operations | | $ | 113,109 | | $ | 44,886 | | $ | 31,468 | | $ | 7,591 | |
| | | | | | | | | | | | | | |
| Corporate operating costs (including non-cash stock based compensation (see Note 15) of $ (1.9) million and $ 2.4 million for the three months ended June 30, 2005 and 2004, respectively)) | | | - | | | - | | | 3,451 | | | 7,107 | |
| | | | | | | | | | | | | | |
| Amortization of intangibles | | | - | | | - | | | 82 | | | 62 | |
| | | | | | | | | | | | | | |
| Impairment charge | | | - | | | - | | | 35,331 | | | - | |
| | | | | | | | | | | | | | |
| Unconsolidated equity affiliates (3) | | | 19,627 | | | 18,263 | | | 7,956 | | | 8,792 | |
| | | | | | | | | | | | | | |
| Station depreciation | | | - | | | - | | | 4,623 | | | 1,336 | |
| | | | | | | | | | | | | | |
| Interest income | | | - | | | - | | | (559 | ) | | (786 | ) |
| | | | | | | | | | | | | | |
| Interest expense | | | - | | | - | | | 6,424 | | | 667 | |
| | | | | | | | | | | | | | |
| Foreign currency exchange (gain)/loss, net | | | - | | | - | | | (30,159 | ) | | 1,289 | |
| | | | | | | | | | | | | | |
| Other (income)/expense | | | - | | | - | | | (312 | ) | | 10 | |
| | | | | | | | | | | | | | |
Total Segment Data | | $ | 132,736 | | $ | 63,149 | | $ | 58,305 | | $ | 26,068 | |
(1) All net revenues are derived from external customers. There are no inter-segmental revenues.
(2) Romanian networks are PRO TV, PRO CINEMA, ACASA and PRO TV INTERNATIONAL for the three months ended June 30, 2005 and PRO TV, PRO CINEMA, ACASA, PRO TV INTERNATIONAL, PRO FM and INFOPRO for the three months ended June 30, 2004.
(3) Unconsolidated equity affiliates are STS and Markiza in the Slovak Republic for the three months ended June 30, 2005 and STS, Markiza and Radio Pro in Romania for the three months ended June 30, 2004.
| | | SEGMENT FINANCIAL INFORMATION | |
| | | For the Six Months Ended June 30, | |
| | | (US $000's) | |
| | | Segment Net Revenues (1) | | Segment EBITDA | |
| | | 2005 | | 2004 | | 2005 | | 2004 | |
Country | | | | | | | | | |
| Croatia (NOVA TV) | | $ | 12,607 | | $ | - | | $ | (4,759 | ) | $ | - | |
| Czech Republic (TV NOVA) | | | 47,767 | | | - | | | 28,287 | | | - | |
| Romania (2) | | | 45,648 | | | 32,787 | | | 18,136 | | | 10,238 | |
| Slovak Republic (MARKIZA TV) | | | 32,270 | | | 29,343 | | | 10,126 | | | 9,724 | |
| Slovenia (POP TV and KANAL A) | | | 23,853 | | | 23,408 | | | 9,170 | | | 10,787 | |
| Ukraine (STUDIO 1+1) | | | 31,538 | | | 25,354 | | | 7,284 | | | 9,252 | |
Total Segment Data | | $ | 193,683 | | $ | 110,892 | | $ | 68,244 | | $ | 40,001 | |
| | | | | | | | | | | | | | |
Reconciliation to Consolidated Statement of Operations: | | | | | | | | | | | | | |
Consolidated Net Revenues / Income before provision for income taxes, minority interest, equity in income of unconsolidated affiliates and discontinued operations | | $ | 161,413 | | $ | 80,734 | | $ | 25,258 | | $ | 13,445 | |
| Corporate operating costs (including non-cash stock based compensation (see Note 15) of $ 1.7 million and $ 4.3 million for the six months ended June 30, 2005 and 2004, respectively)) | | | - | | | - | | | 11,182 | | | 12,225 | |
| Amortization of intangibles | | | - | | | - | | | 159 | | | 62 | |
| Impairment charge | | | - | | | - | | | 35,331 | | | - | |
| Unconsolidated equity affiliates (3) | | | 32,270 | | | 30,158 | | | 10,126 | | | 10,123 | |
| Station depreciation | | | - | | | - | | | 6,836 | | | 2,798 | |
| Interest income | | | - | | | - | | | (1,638 | ) | | (2,240 | ) |
| Interest expense | | | - | | | - | | | 6,731 | | | 885 | |
| Foreign currency exchange (gain)/loss, net | | | - | | | - | | | (29,430 | ) | | 1,922 | |
| Other expense | | | - | | | - | | | 3,689 | | | 781 | |
Total Segment Data | | $ | 193,683 | | $ | 110,892 | | $ | 68,244 | | $ | 40,001 | |
(1) All net revenues are derived from external customers. There are no inter-segmental revenues.
(2) Romanian networks are PRO TV, PRO CINEMA, ACASA and PRO TV INTERNATIONAL for the six months ended June 30, 2005 and PRO TV, PRO CINEMA, ACASA, PRO TV INTERNATIONAL, PRO FM and INFOPRO for the six months ended June 30, 2004.
(3) Unconsolidated equity affiliates are STS and Markiza in the Slovak Republic for the six months ended June 30, 2005 and STS, Markiza and Radio Pro in Romania for the six months ended June 30, 2004.
13. | Summary Financial Information for Significant Unconsolidated Affiliates |
| | | STS (MARKIZA TV) | |
| | | As at June 30, 2005 | | As at December 31, 2004 | |
| | | (US$ 000's) | | (US$ 000's) | |
| Current assets | | $ | 24,795 | | $ | 25,548 | |
| | | | | | | | |
| Non-current assets | | | 18,008 | | | 16,919 | |
| | | | | | | | |
| Current liabilities | | | (25,557 | ) | | (15,445 | ) |
| | | | | | | | |
| Non-current liabilities | | | (131 | ) | | (149 | ) |
| | | | | | | | |
| Net Assets | | $ | 17,115 | | $ | 26,873 | |
| | | STS (MARKIZA TV) | |
| | | For the Three Months Ended June 30, | | For the Six Months Ended June 30, | |
| | | 2005 | | 2004 | | 2005 | | 2004 | |
| | | (US$ 000's) | |
| Net revenues | | $ | 19,627 | | $ | 17,448 | | $ | 32,270 | | $ | 29,343 | |
| | | | | | | | | | | | | | |
| Operating costs | | | (12,213 | ) | | (9,551 | ) | | (23,253 | ) | | (20,736 | ) |
| | | | | | | | | | | | | | |
| Operating income | | | 7,414 | | | 7,897 | | | 9,017 | | | 8,607 | |
| | | | | | | | | | | | | | |
| Net income | | | 5,787 | | | 6,691 | | | 7,084 | | | 7,494 | |
| | | | | | | | | | | | | | |
| Movement in accumulated other comprehensive income/(loss) | | | (467 | ) | | (230 | ) | | 1,381 | | | (169 | ) |
Our share of income in Unconsolidated Affiliates for STS was US$ 5.0 million and US$ 4.8 million for the first six months of 2005 and 2004, respectively.
We account for earnings per share pursuant to FAS No. 128, “Earnings Per Share”. Basic net income per common share (“Basic EPS”) is computed by dividing net income by the weighted average number of common shares outstanding. Diluted net income per common share (“Diluted EPS”) is computed by dividing net income by the weighted average number of common shares and dilutive common share equivalents then outstanding. FAS No. 128 requires the presentation of both Basic EPS and Diluted EPS on the face of the consolidated statement of operations. A reconciliation between the numerator and denominator of Basic EPS and Diluted EPS is as follows:
| | | For the Three Months Ended June 30, | |
| | | Net Income/(Loss) (US$ 000's) | | Common Shares (000's) | | Net Income/(Loss) per Common Share | |
| | | 2005 | | 2004 | | 2005 | | 2004 (as restated) | | 2005 | | 2004 (as restated) | |
Basic EPS | | | | | | | | | | | | | | | | | | | |
| | | | | | | | | | | | | | | | | | | | |
| Net income attributable to common stock | | $ | 25,459 | | $ | 6,032 | | | 34,274 | | | 27,854 | | $ | 0.74 | | $ | 0.22 | |
| | | | | | | | | | | | | | | | | | | | |
| Effect of dilutive securities : stock options | | | - | | | - | | | 871 | | | 1,179 | | | (0.02 | ) | | (0.01 | ) |
| | | | | | | | | | | | | | | | | | | | |
Diluted EPS | | | | | | | | | | | | | | | | | | | |
| | | | | | | | | | | | | | | | | | | | |
| Net income attributable to common stock | | $ | 25,459 | | $ | 6,032 | | | 35,145 | | | 29,033 | | $ | 0.72 | | $ | 0.21 | |
| | | For the Six Months Ended June 30, | |
| | | Net Income/(Loss) (US$ 000's) | | Common Shares (000's) | | Net Income/(Loss) per Common Share | |
| | | 2005 | | 2004 | | 2005 | | 2004 (as restated) | | 2005 | | 2004 (as restated) | |
Basic EPS | | | | | | | | | | | | | |
| | | | | | | | | | | | | | |
| Net income attributable to common stock | | $ | 17,510 | | $ | 11,203 | | | 31,345 | | | 27,471 | | $ | 0.56 | | $ | 0.41 | |
| | | | | | | | | | | | | | | | | | | | |
| Effect of dilutive securities : stock options | | | - | | | - | | | 943 | | | 1,485 | | | (0.02 | ) | | (0.02 | ) |
| | | | | | | | | | | | | | | | | | | | |
Diluted EPS | | | | | | | | | | | | | | | | | | | |
| | | | | | | | | | | | | | | | | | | | |
| Net income attributable to common stock | | $ | 17,510 | | $ | 11,203 | | | 32,288 | | | 28,956 | | $ | 0.54 | | $ | 0.39 | |
Restatement of 2004 Earnings Per Share
FAS 128 requires the same number of potential common shares used in computing the diluted per share amount for income from continuing operations be used in computing the diluted per share amounts for discontinued operations and net income where there is a loss from continuing operations. Also, in determining the weighted average number of common shares used in the earnings per share computations, it is required to calculate a weighted average number of shares issued and outstanding during the period. In the three months ended June 30, 2004, we incorrectly computed the fully diluted earnings per share for continuing operations and the fully diluted earnings per share. In the six months ended June 30, 2004 we incorrectly computed the basic earnings per share for continuing operations, the fully diluted earnings per share for continuing operations, the basic earnings per share and the fully diluted earnings per share. We also incorrectly calculated basic and diluted weighted average number of shares outstanding in the three and six months ended June 30, 2004. The following table summarizes the restated weighted average common shares and earnings per share for the three and six months ended June 30, 2004.
| | | For the three months ended June 30, 2004 | | For the six months ended June 30, 2004 | |
| | | As previously reported | | As restated | | As previously reported | | As restated | |
| Continuing operations - Basic | | | | | | | | | |
| | | | | | | | | | |
| Income from continuing operations per share | | | - | | | - | | $ | 0.40 | | $ | 0.41 | |
| | | | | | | | | | | | | | |
| Weighted average common shares used in computing per share amounts (000s) | | | 28,034 | | | 27,854 | | | 28,034 | | | 27,471 | |
| | | | | | | | | | | | | | |
| Continuing operations - Diluted | | | | | | | | | | | | | |
| | | | | | | | | | | | | | |
| Income from continuing operations per share | | $ | 0.19 | | $ | 0.20 | | $ | 0.38 | | $ | 0.39 | |
| | | | | | | | | | | | | | |
| Weighted average common shares used in computing per share amounts (000s) | | | 29,977 | | | 29,033 | | | 29,977 | | | 28,956 | |
| | | | | | | | | | | | | | |
| Discontinued operations - Basic | | | | | | | | | | | | | |
| | | | | | | | | | | | | | |
| Weighted average common shares used in computing per share amounts (000s) | | | 28,034 | | | 27,854 | | | 28,034 | | | 27,471 | |
| | | | | | | | | | | | | | |
| Discontinued operations - Diluted | | | | | | | | | | | | | |
| | | | | | | | | | | | | | |
| Weighted average common shares used in computing per share amounts (000s) | | | 29,977 | | | 29,033 | | | 29,977 | | | 28,956 | |
| | | | | | | | | | | | | | |
| Net Income -Basic | | | | | | | | | | | | | |
| | | | | | | | | | | | | | |
| Net Income per share | | | - | | | - | | $ | 0.40 | | $ | 0.41 | |
| | | | | | | | | | | | | | |
| Weighted average common shares used in computing per share amounts (000s) | | | 28,034 | | | 27,854 | | | 28,034 | | | 27,471 | |
| | | | | | | | | | | | | | |
| Net Income - Diluted | | | | | | | | | | | | | |
| | | | | | | | | | | | | | |
| Net Income per share | | $ | 0.20 | | $ | 0.21 | | $ | 0.37 | | $ | 0.39 | |
| | | | | | | | | | | | | | |
| Weighted average common shares used in computing per share amounts (000s) | | | 29,977 | | | 29,033 | | | 29,977 | | | 28,956 | |
15. | Stock-based Compensation |
Stock-based compensation costs are determined when options are issued and are measured under the fair value method as defined in SFAS 123. We adopted SFAS 123 prospectively for employee stock option awards granted, modified, or settled beginning January 1, 2003, as contemplated by SFAS 148. In prior periods, we used the intrinsic method of accounting as defined in APB 25.
2005 Option Grants
Pursuant to the Amended and Restated 1995 Stock Incentive Plan, the Compensation Committee of our Board of Directors awarded a grant of options to non-executive directors and employees to purchase 122,000 shares of our common stock on June 2, 2005. These options vest in equal installments over 4 years. The exercise price of the granted options ranges from US$ 44.50 to US$ 46.73, with a weighted average exercise price of US$ 44.61. The fair value of the option grants was estimated on the date of the grant using the Black-Scholes option-pricing model, with the following assumptions used:
Date of Option Grant | Options granted | Risk Free Interest Rate | Expected life | Expected volatility |
| | | | | |
| June 2, 2005 | 122,000 | 3.74% | 6.25 years | 53.24% |
The expected stock price volatility was calculated as 53.24% based on an analysis of the historical stock price volatility of the Company and its peers for the preceding 6.25-year period. We consider this basis to represent the best indicator of expected volatility over the life of the option. The expected dividend yield for the above grant was assumed to be 0%.
The weighted average fair value of the above grant made in the six months ended June 30, 2005 is US$ 24.56 per option. In accordance with SFAS 123, the total fair value of these options of US$ 3.0 million will be recognized as expense in the Statement of Operations over the vesting period of the award.
2004 Option Grants
Pursuant to the 1995 Stock Option Plan, the Compensation Committee of our Board of Directors awarded employees options to purchase 160,000 shares of our Class A Common Stock, with a vesting period of 4 years, on February 2, 2004, 10,000 such options, with vesting periods of 3 years, on May 3, 2004 and 20,000 such options, with vesting periods of 3 years, on May 5, 2004. On June 2, 2004, an automatic grant of non-incentive options to purchase 112,000 shares of our common stock was made to non-executive directors, with a vesting period of 4 years pursuant to the 1995 Stock Option Plan. The fair value of the option grants was estimated on the date of the grant using the Black-Scholes option pricing model, with the following assumptions used:
Date of Option Grant | Options granted | Risk Free Interest Rate | Expected life | Expected volatility |
| | | | | |
| February 2, 2004 | 160,000 | 3.18% | 6 years | 51.5% |
| | | | | |
| May 3, 2004 | 10,000 | 3.63% | 6 years | 51.5% |
| | | | | |
| May 5, 2004 | 20,000 | 3.71% | 6 years | 51.5% |
| | | | | |
| June 2, 2004 | 112,000 | 3.91% | 6 years | 51.5% |
Expected dividend yields for these awards were assumed to be 0%, and the expected lives were estimated at 6 years. The expected stock price volatility was calculated on an average of the preceding six-year weekly closing prices of competitors specific to our markets, which we considered to be the best indicator of expected volatility over the life of the option. The weighted average fair value of the above grants made in the three months ended June 30, 2004 was US$ 11.32 per option. The weighted average fair value of all grants made in the six months ended June 30, 2004 was US$ 10.71 per option. The total fair value for the awards made in the six months ended June 30, 2004 of US$ 3.2 million is recognized in the Statement of Operations using straight-line amortization over the vesting period of the award.
In the three and six months to June 30, 2005, total charges (including charges made for awards in previous periods) of US$ 0.5 million and US$ 0.9 million, respectively, were recognized. In the three and six months to June 30, 2004, total charges of US$ 0.2 million and US$ 0.4 million, respectively, were recognized.
For certain options issued in 2000, our stock-based compensation charge is calculated according to FASB Interpretation 44, "Accounting for Certain Transactions involving Stock Compensation" ("FIN 44"). This requires that compensation costs for modified awards are adjusted for increases and decreases in the intrinsic value in subsequent periods until that award is exercised, forfeited or expires unexercised; subject to a minimum of the original intrinsic value at the original measurement date. The last of the options subject to FIN 44 accounting were exercised on May 11, 2005.
For the three months ending June 30, 2005, income from FIN 44 accounting of US$ 1.9 million was recognized, a result of a decrease in our stock price during the period from March 31, 2005 until the exercise of the remaining options on May 11, 2005. For the six months ending June 30, 2005, there were net charges of US$ 0.8 million in respect of variable plan accounting, a result of an increase in our stock price from US$ 38.92 per share on December 31, 2004 to US$ 41.88 on May 11, 2005. For the three and six months to June 30, 2004 there were charges of US$ 2.1 million and US$ 3.9 million, respectively.
The charge for stock-based compensation in our consolidated income statement can be summarized as follows:
| | | For the Three Months Ended June 30, | | For the Six Months Ended June 30, | |
| | | (US$ 000’s) | |
| | | 2005 | | 2004 | | 2005 | | 2004 | |
| Stock-based compensation charged under FIN 44 (Variable Plan Accounting) | | $ | (1,910 | ) | $ | 2,147 | | $ | 746 | | $ | 3,873 | |
| | | | | | | | | | | | | | |
| Stock-based compensation charged under SFAS 123 | | | 491 | | | 222 | | | 936 | | | 381 | |
| | | | | | | | | | | | | | |
| Total stock-based compensation | | $ | (1,419 | ) | $ | 2,369 | | $ | 1,682 | | $ | 4,254 | |
As a result of our 2002 transaction with GoldenTree Asset Management LLC, 696,000 shares of Class A Common Stock issuable on exercise of warrants with an exercise price of US$ 2.504 were registered for resale with the SEC on February 4, 2004 and exercised on February 19, 2004. We received US$ 1.7 million on exercise and the stock issued is included in our 30,516,734 of Class A Common Stock outstanding as at August 1, 2005.
17. | Commitments and Contingencies |
Litigation
General
We are, from time to time, a party to litigation that arises in the normal course of our business operations. Other than those claims discussed below, we are not presently a party to any such litigation which could reasonably be expected to have a material adverse effect on our business or operations.
We present below a summary of our more significant proceedings by country.
Croatia
On October 29, 2004, OK filed suit against Global Communications d.o.o. claiming approximately HRK 53 million (approximately US$ 8.7 million) in damages. Global Communications is a company controlled by Ivan Caleta, who had previously operated Nova TV (Croatia) through OK. Global Communications, together with GRP Media d.o.o., another company controlled by Mr. Caleta, had provided certain goods and services to OK and Nova TV (Croatia) in exchange for advertising time. Global Communications and GRP Media were functionally managing the advertising inventory of Nova TV (Croatia). On December 31, 2003, Global Communications entered into an agreement by which OK acknowledged that Global Communications was entitled to approximately 375,000 seconds of advertising time for goods and services previously provided. Following our acquisition of Nova TV (Croatia) and OK in July 2004, OK concluded that Global Communications had used all of its seconds by June 2004 based on a substantial discrepancy discovered between the utilization of advertising time recorded by Global Communications and that recorded by AGB Puls, an independent television audience measurement service operating in Croatia. In the course of its investigation of the usage of seconds by Global Communications, OK discovered that computer records of advertising seconds kept for OK may have been altered. OK brought suit in order to recover amounts for advertising time used by Global Communications in excess of the 375,000 seconds agreed. Global Communications filed a counterclaim in January 2005 for HRK 68 million (approximately US$ 11.2 million), claiming that AGB data is unreliable and that it is entitled to additional seconds under the previous agreement. We do not believe that these counterclaims will prevail.
Romania
There are no significant outstanding legal actions that relate to our business in Romania.
Slovenia
On November 20, 2002, we received notice of a claim filed by Mrs. Zdenka Meglic, the founder and a former shareholder of MMTV 1 d.o.o (MMTV), against MMTV, a subsidiary of CME Media Enterprises BV. In her claim against MMTV, Mrs. Meglic is seeking an amount equal to SIT 190 million (approximately US$ 1.0 million) for repayment of monies advanced to MMTV from 1992 to 1994 (in the amount of approximately SIT 29 million (approximately US$ 0.1 million)) plus accrued interest. On September 9, 2004, the court of first instance found against MMTV and issued a judgment requiring MMTV to pay SIT 190 million (approximately US$ 1.0 million) plus interest as well as costs. On September 24, 2004, MMTV filed an appeal against the judgment. On December 15, 2004, the appellate court vacated the judgment of the lower court and returned the case for further proceedings. We do not believe that Mrs. Meglic will prevail and will continue to defend the claim. Accordingly, we have made no provision for this claim in our consolidated balance sheets as at June 30, 2005.
Slovak Republic
There are no significant outstanding legal actions that relate to our business in the Slovak Republic.
Ukraine
There are no significant outstanding legal actions that relate to our business in Ukraine.
Czech Republic
Claims Relating to the Vilja Shareholding in CET 21
On May 20, 2002, Vilja acquired its ownership interest in CET 21 from Messrs. Alan, Huncik and Venclik. On July 19, 2002, Peter Krsak, a shareholder of CET 21, filed a claim with the City Court in Prague challenging a number of CET 21 shareholder resolutions adopted by written consent (the “Krsak 2002 Petition”). In relevant part, his complaint included challenges to (1) a decision of the CET 21 shareholders of April 22, 2002 to approve the transfer by Messrs. Alan and Venclik of their ownership interests in CET 21 to Vilja and (2) a written resolution of the CET 21 shareholders on the redistribution of a 60% interest in CET 21 then held by the company itself. (This 60% interest had previously been held by Vladimir Zelezny, who had been forced to relinquish it in an enforcement proceeding against him following his default on a judgment adverse to him in another proceeding). These claims, in effect, constituted a challenge to the ownership by Vilja of a 52.075% ownership interest in CET 21.
On June 18, 2003, before the City Court had issued a decision in the Krsak 2002 Petition, CET 21 petitioned the City Court to approve, among other things, the registration of Vilja in the commercial register maintained by the City Court (the “Commercial Register”) as the owner of 52.075% of CET 21 (the “CET 21 Petition”).
On November 20, 2003, the City Court found in favor of Mr. Krsak in respect of the Krsak 2002 Petition on the basis that he had had insufficient time to respond to the resolutions. In a hearing in respect of the CET 21 Petition on December 10, 2003, the City Court refused to register Vilja as requested in the CET 21 Petition and ordered the registration of a group of shareholders that had previously owned CET 21.
CET 21 filed an appeal on January 24, 2004 in respect of the CET 21 Petition to the High Court of Prague and a separate appeal on February 5, 2004 in respect of the Krsak 2002 Petition.
The High Court of Prague in a decision dated May 27, 2004 vacated the decision of the City Court in the CET 21 Petition. Furthermore, the decision of the High Court stated the legal position of the High Court on the following salient points: (1) the transfer agreements by which Vilja acquired a 52.075% interest in CET 21 are valid, (2) Zelezny held a 60% ownership interest in CET 21 pursuant to a shareholder resolution validly adopted in 1997, and (3) Zelezny ceased to hold a 60% interest in CET 21 following the successful completion of the enforcement proceeding. According to legal advice we have received from local counsel, the legal opinion expressed by the High Court in respect of the CET 21 Petition is binding on the City Court.
On October 18, 2004, the High Court of Prague, after concluding that the time limits to respond to the shareholder resolution were sufficient, vacated the decision of the City Court in the Krsak 2002 Petition and returned the case for further proceedings. The High Court instructed the City Court to give due regard in any further proceedings to other decisions taken in related matters, which, according to legal advice we have received from local counsel, includes the decision of the High Court dated May 27, 2004 in respect of the CET 21 Petition.
On February 24, 2005 we entered into the Agreement on the Settlement of Disputes and Transfer of Ownership Interest with Peter Krsak (the “Krsak Agreement”). The Krsak Agreement provides that Mr. Krsak will file petitions to withdraw all of his claims in respect of the TV Nova (Czech Republic) Group following the satisfaction of specified conditions precedent. Those conditions were satisfied in April 2005 and Mr. Krsak filed the necessary petitions in May 2005. The City Court in Prague accepted a petition to withdraw the Krsak 2002 Petition on May 24, 2005 and issued a resolution confirming that the proceedings in respect of the Krsak 2002 Petition have been terminated.
The ability of the City Court to conduct further proceedings on the registration of Vilja as the owner of 52.075% of CET 21 requires the Supreme Court of the Czech Republic to release the share register of CET 21. The share register was lodged with the Supreme Court in connection with an extraordinary appeal by Mr. Krsak in an action originally initiated by CET 21 in 2000. In that action, CET 21 sought to register a replacement for Mr. Krsak as an executive of CET 21 following his removal. The City Court of Prague dismissed the petition. After the High Court of Prague amended the decision of the City Court and approved the registration of the change in directors, Mr. Krsak filed his extraordinary appeal on August 8, 2003. In connection with the Krsak Agreement, Mr. Krsak filed a petition on May 23, 2005 to withdraw this claim. The Supreme Court has not yet acted on this petition. Until the Supreme Court has terminated these proceedings, there will not be a formal resolution of the CET 21 Petition and Vilja cannot be formally registered as a shareholder of CET 21.
Disposition of the CET 21 Interest Held by CET 21
Following an enforcement proceeding against Vladimir Zelezny in another matter, his 60% interest passed to CET 21. The CET 21 shareholder resolution of July 4, 2002 provided for the redistribution of this 60% interest among Vilja, Krsak, CEDC and CS, the four remaining shareholders of CET 21. Only Vilja elected to participate in the redistribution of that interest; it acquired its pro rata portion of the 60% interest and thereby increased its ownership in CET 21 to 52.075% (from a 20.83% interest of an aggregate 40% interest then held by the four remaining shareholders). None of Mr Krsak, who previously held a 16.67% interest in CET 21, or CS or CEDC, which each holds a 1.25% interest, participated in the redistribution. As a result, their pro rated portions of the 60% interest (equal to an aggregate 28.755% interest in CET 21) continue to be held by CET 21 itself. CET 21 cannot dispose of this 28.755% interest prior to the resolution of certain claims relating to the Vilja ownership interest described above.
Claims brought by Alan, Huncik, Venclik and Gal
On May 7, 2003, Alan, Huncik, Venclik and Gal, former shareholders of CET 21, filed a claim against Krsak, Zelezny, CET 21, CEDC and CS with the City Court in Prague. The substance of this challenge concerns the basis on which Zelezny purported to increase his ownership interest in CET 21 to 60% in 1997. On July 4, 2003, CET 21 filed a response refuting the challenges.
Until Alan, Huncik and Venclik entered into transfer agreements with Vilja on May 20, 2002, they each held an interest in CET 21 (with 8.42% held by Alan, 4.34% by Huncik and 8.71% by Venclik). Following the decision of the City Court in Prague in respect of the Krsak 2002 Petition (which challenged the transfers by Alan and Venclik on the grounds that the interests being transferred to Vilja were inaccurately described), each of Alan, Huncik and Venclik entered into a second set of transfer agreements with Vilja intended to remedy any defects in the earlier transfer agreements. In addition, they and Gal entered into another set of agreements regulating, among other things, consideration for the interests transferred by Alan, Huncik and Venclik as well as their conduct in respect of the claim filed on May 7, 2003. Specifically, they undertook to withdraw this claim prior to any hearing. No hearing on this claim has been scheduled and this claim has not been withdrawn to date.
Claims Relating to the Interests of CS and CEDC in CET 21
On April 2, 2003, CS entered into an agreement with Vilja to transfer its 1.25% interest in CET 21 to Vilja. This transfer was approved by a resolution of the CET 21 shareholders adopted by written consent on May 16, 2003. Mr. Krsak filed a petition against CET 21 in the City Court in Prague on August 8, 2003 to declare the shareholders resolution invalid. Pursuant to the Krsak Agreement, Mr. Krsak filed a petition in May 2005 with the High Court in Prague to withdraw this claim. The High Court in Prague has not yet acted on this petition.
CET 21 adopted a shareholder resolution by written consent on January 5, 2004 to approve the transfer of the 1.25% interest of CEDC in CET 21 to PPF. Mr. Krsak filed a petition against CET 21 in the City Court in Prague on February 3, 2004 to declare this shareholders resolution invalid. Pursuant to the Krsak Agreement, Mr. Krsak filed a petition in May 2005 with the High Court in Prague to withdraw this claim. The High Court in Prague has not yet acted on this petition.
The consent of the Czech Media Council to the transfer of each of these 1.25% interests has been requested but has not yet been issued.
Other Claims
On January 25, 2005, Mr. Krsak filed on his own behalf and on behalf of CET 21 an action in the City Court in Prague against twenty-five parties, including PPF and its affiliates, CP 2000, Vilja, and certain former and current members of management. In his filing, Mr. Krsak is claiming damages to himself in the amount of approximately CZK 1.25 billion (approximately US$ 50.3 million) and on behalf of CET 21 in the amount of approximately CZK 7.5 billion (approximately US$ 302.0 million). The substance of this claim is that various entities and persons controlling CET 21 caused CET 21 damage by entering into agreements on disadvantageous terms with service companies related to such controlling person (such as CP 2000 and Mag Media ).
Pursuant to the Krsak Agreement, Mr. Krsak filed a petition to withdraw this claim in May 2005 with the City Court in Prague. The City Court in Prague accepted this petition on May 31, 2005 and issued a resolution confirming that the proceedings have been terminated.
Financial Commitments — Existing Entities
Our existing operations, with the exception of Croatia, are expected to be self-supporting in terms of funding during 2005, with cash being available through local credit facilities and/or generated from operations.
Licenses
Regulatory bodies in each country in which we operate control access to available frequencies through licensing regimes. We believe that the licenses for our license holding companies will be renewed prior to expiry. In Romania, the Slovak Republic, Slovenia and Ukraine local regulations do contain a qualified presumption for extensions of broadcast licenses, according to which a broadcast license may be renewed if the licensee has operated substantially in compliance with the relevant licensing regime. To date, all expiring licenses have been renewed in the ordinary course of business; however, there can be no assurance that any of the licenses will be renewed upon expiration of their current terms. The failure of any such license to be renewed could adversely affect the results of our operations.
Station Programming Rights Agreements
As at June 30, 2005, we had program rights commitments of US$ 21.3 million compared with US$ 18.1 million at December 31, 2004, in respect of future programming, which includes contracts signed with license periods starting after the balance sheet date.
Operating Lease Commitments
For the periods ended June 30, 2005 and 2004 we incurred aggregate rent on all facilities of US$ 2.5 million and US$ 0.6 million, respectively. Future minimum operating lease payments at June 30, 2005 for non-cancelable operating leases with remaining terms in excess of one year (net of amounts to be recharged to third parties) are payable as follows:
| | | As at June 30, 2005 (US$ 000’s) | |
| 2005 | | $ | 6,663 | |
| | | | | |
| 2006 | | | 5,407 | |
| | | | | |
| 2007 | | | 1,616 | |
| | | | | |
| 2008 | | | 1,185 | |
| | | | | |
| 2009 | | | 729 | |
| | | | | |
| 2010 and thereafter | | | 516 | |
| | | | | |
Total | | $ | 16,116 | |
Dutch Tax
On February 9, 2004 we entered into an agreement with the Dutch tax authorities to settle all tax liabilities outstanding for the period through 2003, including receipts in respect of our 2003 award in the arbitration against the Czech Republic, for a payment of US$ 9.0 million. We expected to continue to pay tax in the Netherlands of between US$ 1.0 and US$ 2.5 million for the foreseeable future and therefore also agreed to a minimum tax payable of US$ 2.0 million per year for the years 2005-2008 and US$ 1.0 million for 2009. Should the Dutch Ministry of Finance later rule that arbitration awards such as the one we received are not taxable, we will be entitled to claim a tax loss, which can be offset against other taxable income but will not reduce our minimum payment commitments.
As at June 30, 2005 we provided US$ 3.7 million (US$ 3.0 million in non-current liabilities and US$ 0.7 million in current liabilities) (as at December 31, 2004: US$ 3.5 million (US$ 3.1 million in non-current liabilities and US$ 0.4 million in current liabilities)) of tax in the Netherlands as the difference between our obligation under this agreement and our estimate of tax in the Netherlands that may fall due over this period from business operations, based on current business structures and economic conditions and charged US$ 2.2 million through discontinued operations in our consolidated statement of operations for the six months ended June 30, 2005.
Romania - Put Options
In July 2004, we signed a put option agreement with Mr. Sarbu that granted him the right to sell us 5% of his interest in MPI and Pro TV between March 1, 2006 and February 28, 2009 and his remaining interest from March 1, 2009 and for a twenty-year period thereafter. The put price is to be determined in each instance by an independent valuation and is subject to a floor price. Following our purchase of a 5% interest in MPI and Pro TV from Mr. Sarbu (for further information, see Note 5, “Acquisitions and Disposals”), he will now be allowed under the put option agreement to put to us his remaining 15% interest from March 1, 2009 and for a twenty-year period thereafter (for further information see Note 19, “Subsequent Events”).
The minimum price to be paid by us is US$ 1.45 million per each one percent interest. As at June 30, 2005, we consider the likelihood of the put option being valued below US$ 1.45 million per each one percent interest to be remote. Therefore it is not valued and is not recorded in our consolidated balance sheet.
Czech Republic - Guarantee and Factoring of Trade Receivables
Mag Media, CP 2000 and CET 21 have two credit facilities allowing for borrowing in the aggregate amount of CZK 1,100 million (approximately US$ 44.3 million) with Ceska Sporitelna, a.s. (“CS”) and Factoring Ceska Sporitelna, a.s., a subsidiary of CS. One facility is a CZK 850 million (approximately US$ 34.2 million) facility for factoring trade receivables of Mag Media and the second is a working capital facility of up to CZK 700 million (approximately US$ 28.2 million); provided, that the aggregate borrowing under both facilities may not exceed CZK 1,100 million (approximately US$ 44.3 million). The working capital facility is secured by a guarantee from Mag Media and CP 2000 and a pledge of the bank accounts of CET 21 and Mag Media.
The sale of the receivables is accounted for as a secured borrowing under FASB Statement No. 140, ‘Accounting for Transfers and Servicing of Financial Assets and Extinguishments of Liabilities’, with the proceeds received recorded in the balance sheet as a liability and included in current credit facilities and obligations under capital leases. The corresponding receivables are a part of accounts receivable, as ownership of risk remains with Mag Media.
During the period May 2, 2005 to June 30, 2005, no trade receivables were sold by Mag Media. As at June 30, 2005, Mag Media had a 'nil' current credit facilities balance in relation to the sale of trade receivables and CZK 250 million (approximately US$ 10.1 million) has been withdrawn under the working capital facility. As at June 30, 2005, Mag Media and CP 2000 had a nil liability in relation to the guarantee and pledge.
| | | As at June 30, 2005 | | As at December 31, 2004 | |
| | | (US$ 000's) | | (US$ 000's) | |
| | | | | | |
| Acquisition costs | | $ | - | | $ | 10,770 | |
As at December 31, 2004 we recorded US$ 10.8 million of acquisition costs (principally fees relating to legal and accounting diligence and mergers and acquisitions advisory services) in relation to the acquisition of the TV Nova (Czech Republic) Group. Following the acquisition of the TV Nova (Czech Republic) Group in May 2005 all acquisition costs were charged to goodwill on acquisition as at June 30, 2005.
On July 29, 2005, we acquired from Mr. Sarbu an additional 3% voting and economic interest in MPI and Pro TV for aggregate consideration of US$ 15 million. Following this transaction we own a voting and economic interest in MPI and Pro TV of 85%. The purchase price was agreed by reference to an independent valuation report prepared in July 2005 and was based on a multiple of MPI and Pro TV's future earnings.
On July 29, 2005, Pro Plus signed a revolving facility agreement for up to Euro 37.5 million (approximately US$ 45.4 million) in aggregate principal amount ("Revolver") with ING Bank N.V., Nova Ljubljanska Banka d.d., Ljubljana and Bank Austria Creditanstalt d.d., Ljubljana to be used for general corporate purposes. CME Media Enterprises BV will guarantee the facility and pledge its 100% business interest in Pro Plus as part of the security. The lending banks will also take a security assignment over the bank accounts of Pro Plus and its two subsidiaries, Pop TV and Kanal A, and over any inter-company loans made by Pro Plus to its subsidiaries or to CME Media Enterprises. Following its first drawdown under the Revolver, Pro Plus will repay its existing bank loan to Nova Ljubljanska Banka and Bank Austria Creditanstalt (for further information, see Part II, Item 5, "Other Information").
Item 2. | Management's Discussion and Analysis of Financial Condition and Results of Operations |
Contents
I. | Forward-looking Statements |
| | |
II. | Executive Summary |
| | |
III. | Analysis of Segment Results |
| | |
IV. | Analysis of the Results of Consolidated Operations |
| | |
V. | Liquidity and Capital Resources |
| | |
VI. | Critical Accounting Policies and Estimates |
I. | Forward-looking Statements |
This report contains forward-looking statements, including statements regarding the effect of additional investment in Croatia, the growth of television advertising in our markets, the future economic conditions in our markets, future investments in television broadcast operations and the financing thereof, the growth potential of advertising spending in our markets, and business strategies and commitments. For these statements and all other forward-looking statements, we claim the protection of the safe harbor for forward-looking statements contained in the Private Securities Litigation Reform Act of 1995. Forward-looking statements are inherently subject to risks and uncertainties, many of which cannot be predicted with accuracy or are otherwise beyond our control and some of which might not even be anticipated. Future events and actual results, affecting our strategic plan as well as our financial position, results of operations and cash flows, could differ materially from those described in or contemplated by the forward-looking statements. Important factors that contribute to such risks include, but are not limited to, the rate of development of advertising markets in countries where we operate, general market and economic conditions in these countries as well as in the United States and Western Europe, the renewals of broadcasting licenses, our ability to acquire programming and the ability to attract audiences, the general regulatory environments where we operate and application of relevant laws and regulations.
The following discussion should be read in conjunction with the section entitled "Risk Factors" on pages 17 to 26 in Amendment No. 2 to Reg. No. 333-123822 on Form S-3 filed with the SEC on April 28, 2005 in addition to our interim financial statements and notes included elsewhere in this report.
Acquisition of TV NOVA in the Czech Republic
| · | On May 5, 2005, we raised almost US$ 700 million in debt and equity financing through the issuance of Euro 370 million (approximately US$ 480 million at the time of issuance) Senior Notes, consisting of Euro 245 million (approximately US$ 318 million) 8.25% Senior Notes and Euro 125 million (approximately US$ 162 million) floating rate Senior Notes, which bear interest at six-month EURIBOR plus 5.5% as well as 5.4 million shares of our Class A Common Stock in a publicly registered offering. A portion of the proceeds from these offerings were used to complete the acquisition of a controlling interest in the TV Nova (Czech Republic) Group PPF at the beginning of May. |
| · | On May 27, 2005, we completed the acquisition of the minority interest in CET 21 held by Peter Krsak and on May 31, 2005, we acquired the remaining 15% interest in the TV Nova (Czech Republic) Group from PPF following the exercise of our call option. |
| · | As a result of these transactions, we own 68.745% of CET 21, which holds the national terrestrial broadcast license for TV NOVA in the Czech Republic. Our voting and economic interest in CET 21 is 96.50% because CET 21 itself holds an undistributed 28.755% interest that is not entitled to voting rights or dividends. We also own 100% of Ceska Produkcni 2000 a.s. (“CP 2000”). CP 2000 provides programming, production and advertising related services to CET 21 directly, through its wholly owned subsidiary Mag Media and through certain other wholly-owned subsidiaries. |
| · | Our shares began trading on the Prague Stock Exchange on June 27, 2005. |
| · | Year on year revenue and operating income growth is attributable to the acquisition of a television station in the Czech Republic as well as strong television advertising market growth in the Ukrainian and Romanian markets. |
Continuing Operations
The following table provides a summary of our consolidated results for the three and six months ended June 30, 2005 and 2004:
| | | For the Three Months Ended June 30, (US$ 000's) | |
| | | 2005 | | 2004 | | Movement | |
| Net Revenues | | | 113,109 | | | 44,886 | | | 68,223 | |
| Operating income | | | 6,862 | | | 8,771 | | | (1,909) | |
| Net income from continuing operations | | | 27,848 | | | 5,747 | | | 22,101 | |
Net income | | | 25,459 | | | 6,032 | | | 19,427 | |
| | | For the Six Months Ended June 30, (US$ 000's) | |
| | | 2005 | | 2004 | | Movement | |
| Net Revenues | | | 161,413 | | | 80,734 | | | 80,679 | |
| Operating income | | | 4,610 | | | 14,793 | | | (10,183) | |
| Net income from continuing operations | | | 19,554 | | | 11,248 | | | 8,306 | |
Net income | | | 17,510 | | | 11,203 | | | 6,307 | |
Net cash generated from continuing operating activities | | | 23,403 | | | 659 | | | 22,744 | |
The principal events for the three months ended June 30, 2005 are as follows:
| · | In the three months ended June 30, 2005 our total operating Segments achieved a Segment EBITDA margin of 44% compared to 41% for the three months ended June 30, 2004 (Segment EBITDA is defined and reconciled to our consolidated US GAAP results in Part I, Note 12, "Segment Data"). |
| · | We increased our economic and voting interest in our Slovenian operations to 100%. |
| · | As part of our second quarter close process we performed an analysis of our Croatian intangible assets and goodwill to determine if they were impaired in light of our modified strategy. As a result of this analysis we determined that our Croatian investment was impaired by US$ 35.3 million (for further information see Part I, Note 6, “Croatian Impairment”). |
Future Developments
| · | For the remainder of 2005, we will continue to be focused on the integration of the TV Nova (Czech Republic) Group into our operations and intend to undertake a restructuring to simplify the operating structure of our Czech operations. |
| · | Following the successful implementation of the agreement with Mr. Krsak, we are in the process of terminating litigation surrounding the TV Nova (Czech Republic) Group that was initiated by him. This will facilitate a planned rationalization of the operating structure of the TV Nova (Czech Republic) Group in order to consolidate broadcasting operations into the license holding company. |
| · | In connection with our on-going review of our Croatian operations and following a strategic assessment of the performance of Nova TV (Croatia) undertaken during the quarter, we modified our strategy for Croatia in late June 2005. This new strategy requires higher current expenditures than had been planned prior to the strategic assessment in order to secure our audience and market share targets. In order to achieve these targets, we have increased our budget for the acquisition of higher quality foreign and domestic programming for 2005 and 2006, for marketing and promotion (including improvements to the on-air look of Nova TV (Croatia), and accelerated investment for the extension of our technical reach. We expect total investment to be in excess of US$ 27 million during 2005. We expect that our Croatian operations will approach EBITDA break-even in 2007. |
III. | Analysis of Segment Results |
OVERVIEW
We manage our business on a country-by-country basis and review the performance of each business segment using data that reflects 100% of operating and license company results. Our business segments are comprised of Croatia, the Czech Republic, Romania, the Slovak Republic, Slovenia and Ukraine.
For a full reconciliation of our Segment Net Revenues and Segment EBITDA by operation to our consolidated US GAAP results for the three and six months ended June 30, 2005 and 2004 see Part I, Note 12, "Segment Data".
A summary of our total Segment Net Revenues, Segment EBITDA and Segment EBITDA margin showing the relative contribution of each Segment, is as follows.
SEGMENT FINANCIAL INFORMATION For the Three Months Ended June 30, (US $000's) | |
| | | 2005 | | (1) | | 2004 | | (1) | |
Segment Net Revenue | | | | | | | | | |
| Croatia (NOVA TV) | | $ | 7,652 | | | 6 | % | $ | - | | | - | % |
| Czech Republic (TV NOVA) | | | 47,767 | | | 36 | % | | - | | | - | % |
| Romania (2) | | | 26,592 | | | 20 | % | | 18,702 | | | 30 | % |
| Slovak Republic (MARKIZA TV) | | | 19,627 | | | 15 | % | | 17,448 | | | 27 | % |
| Slovenia (POP TV and KANAL A) | | | 13,920 | | | 10 | % | | 13,751 | | | 22 | % |
| Ukraine (STUDIO 1+1) | | | 17,178 | | | 13 | % | | 13,248 | | | 21 | % |
Total Segment Net Revenue | | $ | 132,736 | | | 100 | % | $ | 63,149 | | | 100 | % |
| | | | | | | | | | | | | | |
Segment EBITDA | | | | | | | | | | | | | |
| Croatia (NOVA TV) | | $ | (1,337 | ) | | (2 | )% | $ | - | | | - | % |
| Czech Republic (TV NOVA) | | | 28,287 | | | 49 | % | | - | | | - | % |
| Romania (2) | | | 11,974 | | | 20 | % | | 5,920 | | | 23 | % |
| Slovak Republic (MARKIZA TV) | | | 7,956 | | | 14 | % | | 8,393 | | | 32 | % |
| Slovenia (POP TV and KANAL A) | | | 6,490 | | | 11 | % | | 6,860 | | | 26 | % |
| Ukraine (STUDIO 1+1) | | | 4,935 | | | 8 | % | | 4,895 | | | 19 | % |
Total Segment EBITDA | | $ | 58,305 | | | 100 | % | $ | 26,068 | | | 100 | % |
| | | | | | | | | | | | | | |
Segment EBITDA Margin (3) | | | 44 | % | | | | | 41 | % | | | |
(1) Percentage of Total Segment Net Revenue / Total Segment EBITDA
(2) Romanian networks are PRO TV, PRO CINEMA, ACASA and PRO TV INTERNATIONAL for the three months ended June 30, 2005 and PRO TV, PRO CINEMA, ACASA, PRO TV INTERNATIONAL, PRO FM and INFOPRO for the three months ended June 30, 2004.
(3) We define Segment EBITDA margin as the ratio of Segment EBITDA to Segment Net Revenue.
SEGMENT FINANCIAL INFORMATION For the Six Months Ended June 30, (US $000's) | |
| | | 2005 | | (1) | | 2004 | | (1) | |
Segment Net Revenue | | | | | | | | | |
| Croatia (NOVA TV) | | $ | 12,607 | | | 6 | % | $ | - | | | - | % |
| Czech Republic (TV NOVA) | | | 47,767 | | | 25 | % | | - | | | - | % |
| Romania (2) | | | 45,648 | | | 24 | % | | 32,787 | | | 30 | % |
| Slovak Republic (MARKIZA TV) | | | 32,270 | | | 17 | % | | 29,343 | | | 26 | % |
| Slovenia (POP TV and KANAL A) | | | 23,853 | | | 12 | % | | 23,408 | | | 21 | % |
| Ukraine (STUDIO 1+1) | | | 31,538 | | | 16 | % | | 25,354 | | | 23 | % |
Total Segment Net Revenue | | $ | 193,683 | | | 100 | % | $ | 110,892 | | | 100 | % |
| | | | | | | | | | | | | | |
Segment EBITDA | | | | | | | | | | | | | |
| Croatia (NOVA TV) | | $ | (4,759 | ) | | (7 | )% | $ | - | | | - | % |
| Czech Republic (TV NOVA) | | | 28,287 | | | 41 | % | | - | | | - | % |
| Romania (2) | | | 18,136 | | | 27 | % | | 10,238 | | | 26 | % |
| Slovak Republic (MARKIZA TV) | | | 10,126 | | | 15 | % | | 9,724 | | | 24 | % |
| Slovenia (POP TV and KANAL A) | | | 9,170 | | | 13 | % | | 10,787 | | | 27 | % |
| Ukraine (STUDIO 1+1) | | | 7,284 | | | 11 | % | | 9,252 | | | 23 | % |
Total Segment EBITDA | | $ | 68,244 | | | 100 | % | $ | 40,001 | | | 100 | % |
| | | | | | | | | | | | | | |
Segment EBITDA Margin (3) | | | 35 | % | | | | | 36 | % | | | |
(1) Percentage of Total Segment Net Revenue / Total Segment EBITDA
(2) Romanian networks are PRO TV, PRO CINEMA, ACASA and PRO TV INTERNATIONAL for the six months ended June 30, 2005 and PRO TV, PRO CINEMA, ACASA, PRO TV INTERNATIONAL, PRO FM and INFOPRO for the six months ended June 30, 2004.
(3) We define Segment EBITDA margin as the ratio of Segment EBITDA to Segment Net Revenue.
ANALYSIS BY GEOGRAPHIC SEGMENT
Market Background: We acquired our Croatian operations on July 16, 2004. During 2004 the television advertising market in Croatia grew by approximately 4%. It is expected to show single digit growth in 2005.
NOVA TV (Croatia) is ranked fourth (of four channels ranked) in the market based on its national all-day audience share of 14% for the first six months of 2005. The major competitors are the two state-owned channels HRT1 and HRT2, with national all-day audience shares for the first six months of 2005 of 40% and 15%, respectively, and RTL with 25%.
Three months ended June 30, 2005
| | | SEGMENT FINANCIAL INFORMATION | |
| | | For the Three Months Ended June 30, (US $000's) | |
| | | | | 2005 | |
| Croatian Net Revenues | | | | | | 7,652 | |
| Croatian Segment EBITDA | | | | | | (1,337 | ) |
| Croatian Segment EBITDA Margin | | | | | | (17 | )% |
| · | Net Revenues for the three months ended June 30, 2005 were US$ 7.7 million as a result of significant full year contracts having been secured with domestic and international advertisers. No comparative data is available as we acquired Nova TV (Croatia) in July of last year. |
| · | Croatian Segment EBITDA for the three months ended June 30, 2005 was a loss of US$ 1.3 million due to investment in higher quality programming required to generate greater audience share and increase Nova TV's (Croatia) advertising market share. |
Costs charged in arriving at Segment EBITDA for the three months ended June 30, 2005 included US$ 4.5 million of programming costs.
Six months ended June 30, 2005
| | | SEGMENT FINANCIAL INFORMATION | |
| | | For the Six Months Ended June 30, (US$ 000's) | |
| | | | | 2005 | |
| Croatian Net Revenues | | | | | | 12,607 | |
| Croatian Segment EBITDA | | | | | | (4,759 | ) |
| Croatian Segment EBITDA Margin | | | | | | (38 | )% |
| · | Net Revenues for the six months ended June 30, 2005 were US$ 12.6 million as a result of significant full year contracts having been secured with domestic and international advertisers. No comparative data is available as we acquired Nova TV (Croatia) in July of last year. |
| · | Croatian Segment EBITDA for the six months ended June 30, 2005 was a loss of US$ 4.8 million due to investment in higher quality programming required to generate greater audience share and increase Nova TV's (Croatia) advertising market share. |
Costs charged in arriving at Segment EBITDA for the six months ended June 30, 2005 included US$ 9.1 million of programming costs.
Market Background: We acquired our Czech Republic operations on May 2, 2005. During 2004 the television advertising market in the Czech Republic grew by approximately 5%. It is expected to show single digit growth in 2005.
TV NOVA (Czech Republic) is ranked first (of four channels ranked) in the market based on its national all-day audience share of 42% for the first six months of 2005. The major competitors are the two state-owned channels CT1 and CT2, with national all-day audience shares for the first six months of 2005 of 21% and 9%, respectively, and Prima TV with 22%.
Three months ended June 30, 2005
| | | SEGMENT FINANCIAL INFORMATION | |
| | | For the Three Months Ended June 30, (US $000's) | |
| | | | | 2005 | |
| Czech Republic Net Revenues | | | | | | 47,767 | |
| Czech Republic Segment EBITDA | | | | | | 28,287 | |
| Czech Republic Segment EBITDA Margin | | | | | | 59 | % |
| · | Net Revenues for the period from the acquisition date of May 2, 2005 to June 30, 2005 were US$ 47.8 million. Based on un-audited and non-US GAAP net revenue information from management accounts prepared for the months of May and June 2004, this represents approximately 5% revenue growth on a local currency basis. |
| · | Czech Republic Segment EBITDA for the period from May 2, 2005 to June 30, 2005 was US$ 28.3 million delivering an EBITDA margin of 59%. |
Costs charged in arriving at Segment EBITDA for the period from May 2, 2005 to June 30, 2005 included US$ 8.7 million of programming costs.
Market Background: Romania has one of the fastest growing economies in Central and Eastern Europe. During 2004, we estimate total television advertising expenditure, in which sales are denominated primarily in US dollars, grew by approximately 28%. It is expected to grow between 20% and 30% in 2005. We believe that Romania’s preparations to accede to the EU in 2007 will continue to support strong growth rates in television advertising expenditure in the period running up to accession, as has been the experience with earlier entrants.
PRO TV, our main channel, and ACASA, one of our cable channels, are ranked second and fourth in the market based on their national all day audience shares of 16% and 8%, respectively, for the first six months of 2005. The major competitors are the state owned channel TVR1 with a national all-day audience share of 19% and Antena 1, a privately owned channel, with 14%. TVR1’s higher all-day audience share is primarily due to it being the only significant broadcaster with coverage across almost the entire country. Advertisers, however, evaluate audience share within a channel's coverage area and by this measure PRO TV ranks first and ACASA fourth (of seven stations ranked) in all-day audience share. Both of our stations have almost 100% coverage of urban markets, which represents a key demographic area targeted by advertisers.
In April 2004 our Romanian operation launched a second cable channel PRO CINEMA. It had a national all day audience share of 1% during the first six months of 2005.
Three months ended June 30, 2005 compared to three months ended June 30, 2004
| | | SEGMENT FINANCIAL INFORMATION | |
| | | For the Three Months Ended June 30, (US$ 000's) | |
| | | 2005 | | 2004 | | Movement | |
| Romanian Net Revenues | | | 26,592 | | | 18,702 | | | 7,890 | |
| Romanian Segment EBITDA | | | 11,974 | | | 5,920 | | | 6,054 | |
| Romanian Segment EBITDA Margin | | | 45 | % | | 32 | % | | 13 | % |
| · | Net Revenues for the three months ended June 30, 2005 increased by 42% compared to the three months ended June 30, 2004. This was due to market growth, an increase in advertising prices on PRO TV and an increase in advertising market share. The increased advertising market share was due to higher ratings, additional inventory becoming available following the launch of Pro Cinema in April 2004 and increased sell out rates on Pro Cinema and ACASA TV as advertisers were migrated from Pro TV. |
| · | Romanian Segment EBITDA for the three months ended June 30, 2005 increased by 102% compared to the three months ended June 30, 2004 to deliver an EBITDA margin of 45%. |
Costs charged in arriving at Segment EBITDA for the three months ended June 30, 2005 increased by 14% compared to the three months ended June 30, 2004. The cost of programming increased by US$ 1.2 million or 15% as a result of increased acquisition costs per hour, the extra volume required for Pro Cinema and an additional daily news and sports broadcast on Pro TV. Salaries and related costs increased by US$ 1.0 million or 39% primarily due to the appreciation of the local currency compared to the US dollar. Selling, general and administrative expenses decreased by US$ 0.1 million or 5% due to the reversal of a provision for bad debts which resulted in a credit for the three months ended June 30, 2005.
Six months ended June 30, 2005 compared to six months ended June 30, 2004
| | | SEGMENT FINANCIAL INFORMATION | |
| | | For the Six Months Ended June 30, (US$ 000's) | |
| | | 2005 | | 2004 | | Movement | |
| Romanian Net Revenues | | | 45,648 | | | 32,787 | | | 12,861 | |
| Romanian Segment EBITDA | | | 18,136 | | | 10,238 | | | 7,898 | |
| Romanian Segment EBITDA Margin | | | 40 | % | | 31 | % | | 9 | % |
| · | Net Revenues for the six months ended June 30, 2005 increased by 39% compared to the six months ended June 30, 2004. This was due to market growth, an increase in advertising prices on PRO TV and an increase in advertising market share. The increased advertising market share was due to higher ratings, additional inventory becoming available following the launch of Pro Cinema in April 2004 and increased sell out rates on Pro Cinema and ACASA TV as advertisers were migrated from Pro TV. |
| · | Romanian Segment EBITDA for the six months ended June 30, 2005 increased by 77% compared to the six months ended June 30, 2004 to deliver an EBITDA margin of 40%. |
Costs charged in arriving at Segment EBITDA for the six months ended June 30, 2005 increased by 22% compared to the six months ended June 30, 2004. The cost of programming increased by US$ 2.6 million or 20% as a result of increased acquisition costs per hour, the extra volume required for Pro Cinema and an additional daily news and sports broadcast on Pro TV. Other operating costs increased by US$ 1.9 million or 33% due to the costs of broadcasting Pro Cinema and the appreciation of the Romanian leu compared to the US dollar that increased salary costs paid in local currency. Selling, general and administrative expenses increased by US$ 0.8 million or 27% primarily due to increased rent and office costs of US$ 0.4 million and bad debt provisions increasing by US$ 0.2 million. The increase in bad debt provisions is partially due to a reversal of a provision for bad debts which resulted in a credit for the first six months of 2004.
Market Background: During 2004, the television advertising market grew approximately 11% in local currency. Measured in US dollars, the 2004 advertising market grew approximately 20% with the difference to local currency growth being due to the weakening of the US dollar in the period. The market is expected to show local currency growth of between 3% and 7% in 2005.
MARKIZA TV is the leading channel in the Slovak Republic with a national all-day audience share for the six months of 2005 of 34%. The major competitor is the state-owned channel STV1, with a national all-day audience share of 20%. The national all-day audience share of TV JOJ, the only other significant privately owned channel was 12%.
Three months ended June 30, 2005 compared to three months ended June 30, 2004
| | | SEGMENT FINANCIAL INFORMATION | |
| | | For the Three Months Ended June 30, (US$ 000's) | |
| | | 2005 | | 2004 | | Movement | |
| Slovak Republic Net Revenues | | | 19,627 | | | 17,448 | | | 2,179 | |
| Slovak Republic Segment EBITDA | | | 7,956 | | | 8,393 | | | (437 | ) |
| Slovak Republic Segment EBITDA Margin | | | 41 | % | | 48 | % | | (7 | )% |
| · | Net Revenues for the three months ended June 30, 2005 increased by 12% compared to the three months ended June 30, 2004. This is due in large part to the weakening of the US dollar compared to the Slovak koruna. In local currency, net revenues were 5% greater than in the three months ended June 30, 2004 due to advertisers spending more of their annual budget in the second quarter of 2005. |
| · | Slovak Republic Segment EBITDA for the three months ended June 30, 2005 decreased by 5% compared to the three months ended June 30, 2004 to deliver a Segment EBITDA margin of 41%. In local currency Segment EBITDA decreased by 12%. |
Costs charged in arriving at Segment EBITDA for the three months ended June 30, 2005 increased by 29% compared to the three months ended June 30, 2004. The cost of programming increased by US$ 0.9 million or 18% primarily as a result of higher production costs of reality shows. Other operating costs increased by US$ 0.7 million or 20% due to increased salary costs. Selling, general and administrative costs increased by US$ 1.0 million or 167% primarily due to the write-back, in the three months ended June 30, 2004, of a US$ 1.1 million provision for a shareholder disagreement following its resolution. In local currency, costs charged in arriving at Segment EBITDA increased by 21%.
Six months ended June 30, 2005 compared to six months ended June 30, 2004
| | | SEGMENT FINANCIAL INFORMATION | |
| | | For the Six Months Ended June 30, (US$ 000's) | |
| | | 2005 | | 2004 | | Movement | |
| Slovak Republic Net Revenues | | | 32,270 | | | 29,343 | | | 2,927 | |
| Slovak Republic Segment EBITDA | | | 10,126 | | | 9,724 | | | 402 | |
| Slovak Republic Segment EBITDA Margin | | | 31 | % | | 33 | % | | (2 | )% |
| · | Net Revenues for the six months ended June 30, 2005 increased by 10% compared to the six months ended June 30, 2004. This is primarily due to the weakening of the US dollar compared to the Slovak koruna. In local currency, revenues were 1% greater than the six months ended June 30, 2004. |
| · | Slovak Republic Segment EBITDA for the six months ended June 30, 2005 increased by 4% compared to the six months ended June 30, 2004, to deliver a Segment EBITDA margin of 31%. In local currency, Segment EBITDA decreased by 5%. |
Costs charged in arriving at Segment EBITDA in the six months ended June 30, 2005 increased by 13% compared to the six months ended June 30, 2004. The cost of programming increased by US$ 0.1 million or 1% as a result of adverse exchange rate movements. Other operating costs increased by US$ 0.9 million or 13% due to increased salary and broadcasting costs primarily as a result of the weakening of the US dollar compared to the Slovak koruna. Selling, general and administrative costs increased by US$ 1.5 million or 62% due to an increase in marketing costs to promote reality shows and a reversal, in the six months ended June 30, 2004, of a US$ 1.1 million provision for a shareholder disagreement following its resolution. In local currency, costs charged in arriving at Segment EBITDA increased by 3%.
Market Background: During 2004 the television advertising market grew by approximately 9% in local currency and 21% in Euros. Slovenia acceded to the EU in May 2004 and the majority of sales are Euro-denominated. Measured in US dollars, the television advertising market grew by an estimated 10% in 2004, with the difference in growth due to the weakening of the US dollar in the period. The TV advertising market is expected to show single digit growth in 2005.
Our channels POP TV and KANAL A were ranked first and fourth (of four stations ranked) in the market, based on national all-day audience shares of 27% and 9%, respectively, during the first six months of 2005. The main competitors are state broadcasters SLO1 and SLO2, with national all-day audience shares of 26% and 10%, respectively, during the same period.
Three months ended June 30, 2005 compared to three months ended June 30, 2004
| | | SEGMENT FINANCIAL INFORMATION | |
| | | For the Three Months Ended June 30, (US$ 000's) | |
| | | 2005 | | 2004 | | Movement | |
| Slovenian Net Revenues | | | 13,920 | | | 13,751 | | | 169 | |
| Slovenian Segment EBITDA | | | 6,490 | | | 6,860 | | | (370 | ) |
| Slovenian Segment EBITDA Margin | | | 47 | % | | 50 | % | | (3 | )% |
| · | Net Revenues for the three months ended June 30, 2005 increased by 1% compared to the three months ended June 30, 2004. This is due to the weakening of the US dollar compared to the Slovenian tolar. In local currency, net revenue decreased by 3% due to reduced advertising expenditure by mobile telephone operators and increased price competition from state television. |
| · | Slovenian Segment EBITDA for the three months ended June 30, 2005 decreased by 5% compared to the three months ended June 30, 2004 to deliver a Segment EBITDA margin of 47%. In local currency, Segment EBITDA decreased by 10%. |
Costs charged in arriving at Segment EBITDA for the three months ended June 30, 2005 increased by 8% compared to the three months ended June 30, 2004. Programming and selling, general and administrative costs remained similar to the same period in the previous year. Other operating costs have increased by US$ 0.5 million or 19% primarily due to the introduction of a new employment law that has resulted in significantly higher social insurance costs for employers. In local currency, costs charged in arriving at Segment EBITDA increased by 4%.
Six months ended June 30, 2005 compared to six months ended June 30, 2004
| | | SEGMENT FINANCIAL INFORMATION | |
| | | For the Six Months Ended June 30, (US$ 000's) | |
| | | 2005 | | 2004 | | Movement | |
| Slovenian Net Revenues | | | 23,853 | | | 23,408 | | | 445 | |
| Slovenian Segment EBITDA | | | 9,170 | | | 10,787 | | | (1,617 | ) |
| Slovenian Segment EBITDA Margin | | | 38 | % | | 46 | % | | (8 | )% |
| · | Net Revenues for the six months ended June 30, 2005 increased by 2% compared to the six months ended June 30, 2004. This is due to the weakening of the US dollar compared to the Slovenian tolar. In local currency, net revenue decreased by 3% due to reduced advertising expenditure by mobile telephone operators and increased price competition from state television. |
| · | Slovenian Segment EBITDA for the six months ended June 30, 2005 decreased by 15% compared to the six months ended June 30, 2004 to deliver a Segment EBITDA margin of 38%. In local currency, Segment EBITDA decreased by 19%. |
Costs charged in arriving at Segment EBITDA for the six months ended June 30, 2005 increased by 16% compared to the six months ended June 30, 2004. Programming costs remained similar to the same period in the previous year. Other operating costs increased by US$ 1.6 million or 35%. The introduction of a new employment law has resulted in significantly higher social insurance costs for employers and increased staff costs by US$ 1.1 million. Transmission costs increased by US$ 0.5 million as a result of a US$ 0.4 million provision write back in the first three months of 2004. Selling, general and administrative costs increased by US$ 0.3 million or 18% primarily due to increased marketing costs. In local currency, costs charged in arriving at Segment EBITDA increased by 11%.
Market Background: During 2004 the television advertising market, where sales are denominated primarily in US dollars, showed growth of approximately 24% and it is expected that the television advertising market will continue to grow between 15% and 25% during 2005.
Following the award of a license for nine additional broadcasting hours in July 2004, Studio 1+1 increased its broadcasting time from 15 to 24 hours per day in September 2004. STUDIO 1+1 was ranked second based on a national all-day audience share of 20% for the first six months of 2005. The main competitors of Studio 1+1 are two privately owned channels: Inter, with a national all-day audience share of 26%, and Novi Kanal, with 9%.
Three months ended June 30, 2005 compared to three months ended June 30, 2004
| | | SEGMENT FINANCIAL INFORMATION | |
| | | For the Three Months Ended June 30, (US$ 000's) | |
| | | 2005 | | 2004 | | Movement | |
| Ukrainian Net Revenues | | | 17,178 | | | 13,248 | | | 3,930 | |
| Ukrainian Segment EBITDA | | | 4,935 | | | 4,895 | | | 40 | |
| Ukrainian Segment EBITDA Margin | | | 29 | % | | 37 | % | | (8 | )% |
| · | Net Revenues for the three months ended June 30, 2005 increased by 30% compared to the three months ended June 30, 2004. This is due to growth in the advertising market and increased advertising sales resulting from broadcasting a 24-hour schedule following the award of a nine-hour license in July 2004 as well as increased management focus on obtaining sponsorship revenue. Market growth and revenue generated from a full 24-hour schedule has offset a decrease in prime-time ratings for Studio 1+1 during the period. Most of the prime-time ratings loss has been to our main competitor Inter, who has been successful with locally produced prime-time series. This is a reversal of ratings trends in the first six months of 2004 where Studio 1+1 was particularly successful with the introduction of prime-time Russian produced series to the market. |
| · | Ukrainian Segment EBITDA for the three months ended June 30, 2005 increased by 1% compared to the three months ended June 30, 2004, to deliver a Segment EBITDA margin of 29%. |
Costs charged in arriving at Segment EBITDA for the three months ended June 30, 2005 increased by 47% compared to the three months ended June 30, 2004. The cost of programming increased by US$ 1.8 million or 35% due to volume requirements for the nine additional broadcast hours and increases in the cost of foreign acquired programming. Other operating costs increased by US$ 1.4 million or 88% partly due to US$ 0.7 million of broadcasting costs from broadcasting the extra nine hours in the schedule and increased transmission charges from the state transmission agency. Restructuring of independent contractor arrangements resulted in increased employee-related taxation costs adding a further US$ 0.7 million to other operating costs. Selling, general and administrative expenses increased by US$ 0.7 million primarily due to an increase in rent costs of US$ 0.2 million and a US$ 0.4 million provision for local sales tax payable on offshore payments which are no longer deductible following a change in the tax law.
Six months ended June 30, 2005 compared to six months ended June 30, 2004
| | | SEGMENT FINANCIAL INFORMATION | |
| | | For the Six Months Ended June 30, (US$ 000's) | |
| | | 2005 | | 2004 | | Movement | |
| Ukrainian Net Revenues | | | 31,538 | | | 25,354 | | | 6,184 | |
| Ukrainian Segment EBITDA | | | 7,284 | | | 9,252 | | | (1,968 | ) |
| Ukrainian Segment EBITDA Margin | | | 23 | % | | 36 | % | | (13 | )% |
| · | Net Revenues for the six months ended June 30, 2005 increased by 24% compared to the six months ended June 30, 2004. This is due to growth in the advertising market and increased advertising sales resulting from broadcasting a 24-hour schedule following the award of a nine-hour license in July 2004 as well as increased management focus on obtaining sponsorship revenue. Market growth and revenue generated from a full 24-hour schedule has offset a decrease in prime-time ratings for Studio 1+1 during the period. Most of the prime-time ratings loss has been to our main competitor Inter, who has been successful with locally produced prime-time series. This is a reversal of ratings trends in the first six months of 2004 where Studio 1+1 was particularly successful with the introduction of prime-time Russian produced series to the market. |
| · | Ukrainian Segment EBITDA for the six months ended June 30, 2005 decreased by 21% compared to the six months ended June 30, 2004 resulting in a Segment EBITDA margin of 23%. |
Costs charged in arriving at Segment EBITDA for the six months ended June 30, 2005 increased by 51% compared to the six months ended June 30, 2004. The cost of programming increased by US$ 4.3 million due to volume requirements for the nine additional broadcast hours and increases in the cost of foreign acquired programming. Other operating costs increased by US$ 2.5 million as a result of increased charges from the state transmission agency of US$ 1.5 million. The increases are partly due to price increases and partly due to the extra nine hours of transmission. Restructuring of independent contractor arrangements resulted in increased employee-related taxation costs, contributing a further US$ 1.1 million to other operating costs. Selling, general and administrative expenses increased by US$ 1.4 million due to an increase in rent costs of US$ 0.4 million and a US$ 0.5 million provision for local sales tax payable on offshore payments which are no longer deductible following a change in the tax law.
PROGRAMMING PAYMENTS AND PROGRAM AMORTIZATION
Our cost of programming for the three and six months ended June 30, 2005 and 2004 are as follows:
| | | For the Three Months Ended June 30, | | For the Six Months Ended June 30, | |
| | | (US$ 000's) | |
| | | 2005 | | 2004 | | 2005 | | 2004 | |
| Production expenses | | $ | 14,644 | | $ | 6,269 | | $ | 23,467 | | $ | 12,047 | |
| Program amortization | | | 17,437 | | | 9,681 | | | 30,936 | | | 17,516 | |
Cost of programming | | $ | 32,081 | | $ | 15,950 | | $ | 54,403 | | $ | 29,563 | |
The amortization of acquired programming for each of our consolidated operations and for the Slovak Republic (MARKIZA TV) for the three and six months ended June 30, 2005 and 2004 is set out in the table below. For comparison the table also shows the cash paid for programming by each of our operations in the respective periods. The cash paid for programming by our operations in Croatia, the Czech Republic, Romania, Slovenia and Ukraine is reflected within net cash generated from continuing operating activities in our consolidated statement of cash flows.
| | | For the Three Months Ended June 30, | | For the Six Months Ended June 30, | |
| | | (US$ 000's) | |
| | | 2005 | | 2004 | | 2005 | | 2004 | |
| Program amortization: | | | | | | | | | |
| Croatia (NOVA TV) | | $ | 3,849 | | $ | - | | $ | 7,700 | | $ | - | |
| Czech Republic (TV NOVA) | | | 2,949 | | | - | | | 2,949 | | | - | |
| Romania (PRO TV, ACASA and PRO TV INTERNATIONAL) | | | 5,273 | | | 5,239 | | | 9,145 | | | 8,395 | |
| Slovenia (POP TV and KANAL A) | | | 1,059 | | | 1,197 | | | 2,227 | | | 2,655 | |
| Ukraine (STUDIO 1+1) | | | 4,307 | | | 3,245 | | | 8,915 | | | 6,466 | |
| | | | 17,437 | | | 9,681 | | | 30,936 | | | 17,516 | |
| Slovak Republic (MARKIZA TV) | | | 1,851 | | | 2,117 | | | 3,232 | | | 4,511 | |
| | | $ | 19,288 | | $ | 11,798 | | $ | 34,168 | | $ | 22,027 | |
| | | | | | | | | | | | | | |
| Cash paid for programming: | | | | | | | | | | | | | |
| Croatia (NOVA TV) | | $ | 2,522 | | $ | - | | $ | 5,479 | | $ | - | |
| Czech Republic (TV NOVA) | | | 6,808 | | | - | | | 6,808 | | | - | |
| Romania (PRO TV, ACASA and PRO TV INTERNATIONAL) | | | 11,041 | | | 7,179 | | | 19,610 | | | 13,375 | |
| Slovenia (POP TV and KANAL A) | | | 1,609 | | | 1,382 | | | 2,880 | | | 2,607 | |
| Ukraine (STUDIO 1+1) | | | 7,550 | | | 3,605 | | | 10,776 | | | 8,426 | |
| | | | 29,530 | | | 12,166 | | | 45,553 | | | 24,408 | |
| Slovak Republic (MARKIZA TV) | | | 2,247 | | | 1,631 | | | 5,249 | | | 3,699 | |
| | | $ | 31,777 | | $ | 13,797 | | $ | 50,802 | | $ | 28,107 | |
IV. | Analysis of the Results of Consolidated Operations |
IV | (a) Net Revenues for the three months ended June 30, 2005 compared to three months ended June 30, 2004 |
| | | Consolidated Net Revenues | |
| | | For the Three Months Ended June 30, (US $000's) | |
| | | 2005 | | 2004 | | Movement | |
| Croatia | | $ | 7,652 | | $ | - | | $ | 7,652 | |
| Czech Republic | | | 47,767 | | | - | | | 47,767 | |
| Romania | | | 26,592 | | | 17,887 | | | 8,705 | |
| Slovenia | | | 13,920 | | | 13,751 | | | 169 | |
| Ukraine | | | 17,178 | | | 13,248 | | | 3,930 | |
Total Consolidated Net Revenues | | $ | 113,109 | | $ | 44,886 | | $ | 68,223 | |
Our consolidated net revenues increased by 152% for the three months ended June 30, 2005 compared to the three months ended June 30, 2004 due to the inclusion of:
| · | US$ 7.7 million of net revenues from our Croatian operations following the acquisition in July 2004 as described in "III. Analysis of Segment Results"; and |
| · | US$ 47.8 million of net revenues from our Czech Republic operations following the acquisition in May 2005 as described in "III. Analysis of Segment Results". |
The increase is also attributable to:
| · | A 49% increase in the net revenues of our Romanian operations as described in "III. Analysis of Segment Results"; |
| · | A 1% increase in the net revenues of our Slovenian operations as described in “III. Analysis of Segment Results"; and |
| · | A 30% increase in the net revenues of our Ukrainian operations as described in "III. Analysis of Segment Results". |
IV | (b) Net Revenues for the six months ended June 30, 2005 compared to six months ended June 30, 2004 |
| | | Consolidated Net Revenues | |
| | | For the Six Months Ended June 30, (US$ 000's) | |
| | | 2005 | | 2004 | | Movement | |
| Croatia | | $ | 12,607 | | $ | - | | $ | 12,607 | |
| Czech Republic | | | 47,767 | | | - | | | 47,767 | |
| Romania | | | 45,648 | | | 31,972 | | | 13,676 | |
| Slovenia | | | 23,853 | | | 23,408 | | | 445 | |
| Ukraine | | | 31,538 | | | 25,354 | | | 6,184 | |
Total Consolidated Net Revenues | | $ | 161,413 | | $ | 80,734 | | $ | 80,679 | |
Our consolidated net revenues increased by 100% for the six months ended June 30, 2005 compared to the six months ended June 30, 2004 due to the inclusion of:
| · | US$ 12.6 million of net revenues from our Croatian operations following the acquisition in July 2004 as described in "III. Analysis of Segment Results"; and |
| · | US$ 47.8 million of net revenues from our Czech Republic operations following the acquisition in May 2005 as described in "III. Analysis of Segment Results". |
The increase is also attributable to:
| · | A 43% increase in the net revenues of our Romanian operations as described in "III. Analysis of Segment Results"; |
| · | A 2% increase in the net revenues of our Slovenian operations as described in “III. Analysis of Segment Results"; and |
| · | A 24% increase in the net revenues of our Ukrainian operations as described in "III. Analysis of Segment Results". |
IV | (c) Station Operating Costs and Expenses for the three months ended June 30, 2005 compared to three months ended June 30, 2004 |
| | | Consolidated Station Operating Costs and Expenses | |
| | | For the Three Months Ended June 30, (US$ 000's) | |
| | | 2005 | | 2004 | | Movement | |
| Croatia | | $ | 7,330 | | $ | - | | $ | 7,330 | |
| Czech Republic | | | 16,556 | | | - | | | 16,556 | |
| Romania | | | 13,808 | | | 11,440 | | | 2,368 | |
| Slovenia | | | 6,978 | | | 6,323 | | | 655 | |
| Ukraine | | | 10,149 | | | 6,861 | | | 3,288 | |
Total Consolidated Station Operating Costs and Expenses | | $ | 54,821 | | $ | 24,624 | | $ | 30,197 | |
Total station operating costs and expenses (including amortization of program rights and depreciation of fixed assets and other intangibles) increased by 123% in the three months ended June 30, 2005 compared to the three months ended June 30, 2004 primarily due to the inclusion of:
| · | US$ 7.3 million of station operating costs from our Croatian operations, which were acquired in July 2004; and |
| · | US$ 16.6 million of station operating costs from our Czech Republic operations, which were acquired in May 2005. |
The increase is also attributable to:
| · | A 21% increase in the station operating costs and expenses of our Romanian operations due to the increased cost of acquired programming as well as the extra programming and other costs of broadcasting Pro Cinema. Salary costs also increased by 39% due to the appreciation of local currency against the US dollar; |
| · | A 10% increase in operating costs and expenses in our Slovenian operation primarily due to the introduction of new employment law that has resulted in significantly higher social insurance costs for employers. Salary costs are therefore 26% higher for the three months ended June 30, 2005; and |
| · | A 48% increase in the station operating costs and expenses of our Ukrainian operations. This is primarily due to increased programming acquisition and broadcasting costs associated with broadcasting a 24-hour schedule following the award of a nine-hour license in July 2004. Staff costs also increased by 92% primarily due to increased employee-related taxation costs from restructuring independent contractor arrangements. |
IV (d) Station Operating Costs and Expenses for the six months ended June 30, 2005 compared to six months ended June 30, 2004
| | | Consolidated Station Operating Costs and Expenses | |
| | | For the Six Months Ended June 30, (US$ 000's) | |
| | | 2005 | | 2004 | | Movement | |
| Croatia | | $ | 14,805 | | $ | - | | $ | 14,805 | |
| Czech Republic | | | 16,556 | | | - | | | 16,556 | |
| Romania | | | 25,157 | | | 20,540 | | | 4,617 | |
| Slovenia | | | 13,487 | | | 11,593 | | | 1,894 | |
| Ukraine | | | 20,636 | | | 13,637 | | | 6,999 | |
Total Consolidated Station Operating Costs and Expenses | | $ | 90,641 | | $ | 45,770 | | $ | 44,871 | |
Total station operating costs and expenses (including amortization of program rights and depreciation of fixed assets and other intangibles) increased by 98% in the six months ended June 30, 2005 compared to the six months ended June 30, 2004 primarily due to the inclusion of:
| · | US$ 14.8 million of station operating costs from our Croatian operations, which were acquired in July 2004; and |
| · | US$ 16.6 million of station operating costs from our Czech Republic operations, which were acquired in May 2005. |
The increase is also attributable to:
| · | A 22% increase in the station operating costs and expenses of our Romanian operations due to the increased cost of acquired programming as well as the extra programming and other costs of broadcasting Pro Cinema. Staff costs also increased by 30% due to the appreciation of local currency against the US dollar; |
| · | A 16% increase in the station operating costs and expenses of our Slovenian operations due to the introduction of a new employment law that has resulted in significantly higher social insurance costs for employers. Salary costs are therefore 27% higher for the six months ended June 30, 2005; and |
| · | A 51% increase in the station operating costs and expenses of our Ukrainian operations. This is primarily due to increased programming acquisition and broadcasting costs associated with broadcasting a 24-hour schedule following the award of a nine-hour license in July 2004. Staff costs also increased by 82% primarily due to increased employee-related taxation costs from restructuring independent contractor arrangements. |
IV (e) Station Selling, General and Administrative Expenses for the three months ended June 30, 2005 compared to three months ended June 30, 2004
| | | Consolidated Station Selling, General and Administrative Expenses | |
| | | For the Three Months Ended June 30, (US$ 000's) | |
| | | 2005 | | 2004 | | Movement | |
| Croatia | | $ | 2,257 | | $ | - | | $ | 2,257 | |
| Czech Republic | | | 5,306 | | | - | | | 5,306 | |
| Romania | | | 1,502 | | | 1,583 | | | (81 | ) |
| Slovenia | | | 975 | | | 963 | | | 12 | |
| Ukraine | | | 2,522 | | | 1,776 | | | 746 | |
Total Consolidated Station Selling, General and Administrative Expenses | | $ | 12,562 | | $ | 4,322 | | $ | 8,240 | |
Station selling, general and administrative expenses increased by 191% in the three months ended June 30, 2005 compared to the three months ended June 30, 2004 primarily due to the inclusion of:
| · | US$ 2.3 million of station selling, general and administrative expenses from our Croatian operations, which were acquired in July 2004; and |
| · | US$ 5.3 million of station selling, general and administrative expenses from our Czech Republic operations, which were acquired in May 2005. |
The increase is also attributable to:
| · | A 5% decrease in the station selling, general and administrative expenses of our Romanian operations primarily as a result of a US$ 0.3 million bad debt provision write back in the three months ended June 30, 2005; |
| · | A 1% increase in the station selling, general and administrative expenses of our Slovenian operations; and |
| · | A 42% increase in the station selling, general and administrative expenses of our Ukrainian operations primarily due to an increase in rent costs of US$ 0.2 million and a provision of US$ 0.4 million for local sales tax payable on offshore payments which are no longer deductible following a change in the taxation law. |
IV (f) Station Selling, General and Administrative Expenses for the six months ended June 30, 2005 compared to six months ended June 30, 2004
| | | Consolidated Station Selling, General and Administrative Expenses | |
| | | For the Six Months Ended June 30, (US$ 000's) | |
| | | 2005 | | 2004 | | Movement | |
| Croatia | | $ | 3,778 | | $ | - | | $ | 3,778 | |
| Czech Republic | | | 5,306 | | | - | | | 5,306 | |
| Romania | | | 3,809 | | | 3,003 | | | 806 | |
| Slovenia | | | 2,179 | | | 1,848 | | | 331 | |
| Ukraine | | | 4,418 | | | 3,033 | | | 1,385 | |
Total Consolidated Station Selling, General and Administrative Expenses | | $ | 19,490 | | $ | 7,884 | | $ | 11,606 | |
Station selling, general and administrative expenses increased by 147% in the six months ended June 30, 2005 compared to the six months ended June 30, 2004 primarily due to the inclusion of:
| · | US$ 3.8 million of station selling, general and administrative expenses from our Croatian operations, which were acquired in July 2004; and |
| · | US$ 5.3 million of station selling, general and administrative expenses from our Czech Republic operations, which were acquired in May 2005. |
The increase is also attributable to:
| · | A 27% increase in the station selling, general and administrative expenses of our Romanian operations primarily due to increased rent and office costs of US$ 0.4 million and bad debt provisions increasing by US$ 0.2 million. The increase in bad debt provisions is partially due to a reversal of bad debt provisions in the first six months of 2004 which resulted in a credit for that period; |
| · | An 18% increase in the station selling, general and administrative expenses of our Slovenian operations mainly due to increases in marketing costs; and |
| · | A 46% increase in the station selling, general and administrative expenses of our Ukrainian operations due to an increase in rent costs of US$ 0.4 million and a provision of US$ 0.5 million for local sales tax payable on offshore payments which are no longer deductible following a change in the taxation law. |
IV (g) Consolidated results excluding net revenues, station operating costs and expenses and station selling, general and administrative expenses for the three months ended June 30, 2005 compared to the three months ended June 30, 2004
| | | For the Three Months Ended June 30, (US$ 000's) | |
| | | 2005 | | 2004 | | Movement | |
| Corporate operating costs (including non-cash stock based compensation) | | | 3,451 | | | 7,107 | | | (3,656 | ) |
| Amortization of intangibles | | | 82 | | | 62 | | | 20 | |
| Impairment charge | | | 35,331 | | | - | | | 35,331 | |
| Interest income | | | 559 | | | 786 | | | (227 | ) |
| Interest expense | | | (6,424 | ) | | (667 | ) | | (5,757 | ) |
| Foreign currency exchange gain/(loss), net | | | 30,159 | | | (1,289 | ) | | 31,448 | |
| Other income/(expense) | | | 312 | | | (10 | ) | | 322 | |
| Provision for income taxes | | | (3,565 | ) | | (5,769 | ) | | 2,204 | |
| Minority interest in income of consolidated subsidiaries | | | (4,104 | ) | | (379 | ) | | (3,725 | ) |
| Equity in income of unconsolidated affiliates | | | 4,049 | | | 4,304 | | | (255 | ) |
| Post-tax income/(loss) from discontinued operations | | | (2,389 | ) | | 285 | | | (2,674 | ) |
Corporate operating costs for the three months ended June 30, 2005 decreased by US$ 3.7 million compared to the three months ended June 30, 2004 as detailed below:
| | | For the Three Months Ended June 30, (US $000's) | |
| | | 2005 | | 2004 | | Movement | |
| Corporate operating costs | | $ | 4,870 | | $ | 4,738 | | $ | 132 | |
| Non-cash stock based compensation | | | (1,419 | ) | | 2,369 | | | (3,788 | ) |
Corporate operating costs (including non-cash stock based compensation) | | $ | 3,451 | | $ | 7,107 | | $ | (3,656 | ) |
For the three months ended June 30, 2005, corporate operating costs (excluding stock-based compensation) increased by US$ 0.1 million compared to the three months ended June 30, 2004.
Stock-based compensation for the three months ended June 30, 2005 decreased by US$ 3.8 million compared to the three months ended June 30, 2004 principally as a result of the effect of the decrease in the price of our stock as it relates to our stock-based compensation variable and fixed plans (for further information, see Part I, Note 15, “Stock-based Compensation”).
Amortization of intangibles was US$ 0.1 million for the three months ended June 30, 2005 and 2004.
Impairment charge: In the three months ended June 30, 2005, we recognized an impairment charge of US$ 35.3 million with respect to our Croatian operations (for further information see Part I, Note 6, “Croatian Impairment”).
Interest income decreased by US$ 0.2 million for the three months ended June 30, 2005 compared to the three months ended June 30, 2004 primarily as a result of a reduction in our year on year cash balance.
Interest expense increased by US$ 5.8 million for the three months ended June 30, 2005 compared to the three months ended June 30, 2004 primarily as a result of the issuance of our Euro 245 million (approximately US$ 296.6 million) 8.25% Senior Notes and Euro 125 million (approximately US$ 151.3 million) floating rate Senior Notes on May 5, 2005.
Foreign currency exchange: For the three months ended June 30, 2005 we recognized a US$ 30.2 million gain compared to US$ 1.3 million loss for the three months ended June 30, 2004. This is primarily as a result of the strengthening of the US dollar as against the Euro currency during the three month period. Our fixed and floating rate Senior Notes are denominated in Euros.
Other income for the three months ended June 30, 2005 was US$ 0.3 million.
Provision for income taxes: Provision for income taxes was US$ 3.6 million for the three months ended June 30, 2005 compared to US$ 5.8 million for the three months ended June 30, 2004. The decrease is primarily as a result of a tax credit of US$ 5.1 million in relation to the Croatian impairment (for further information see Part I, Note 6, “Croatian Impairment”) and an income tax provision in respect of the Czech Republic of US$ 5.7 million.
Minority interest in income of consolidated subsidiaries: For the three months ended June 30, 2005, minority interest in the income of consolidated subsidiaries was US$ 4.1 million. This included US$ 2.1 million with regard to our Czech Republic operations which related primarily to the minority interests held by Mr. Krsak prior to our acquisition of his shares on May 27, 2005 and by PPF prior to our exercise of our call option to acquire its shares on May 31, 2005. For the three months ended June 30, 2004 minority interest in the income of consolidated subsidiaries was US$ 0.4 million.
Equity in income of unconsolidated affiliates: As explained in Part I, Item 1, “Business” of our December 31, 2004 Form 10-K filed with the SEC on March 15, 2005, as amended by our Form 10/K-A filed on April 1, 2005, some of our broadcasting licenses are held by unconsolidated affiliates over which we have minority blocking rights but not majority control. These affiliates are accounted for using the equity method.
Equity in income of unconsolidated affiliates for the three months ended June 30, 2005 decreased by US$ 0.3 million compared to the three months ended June 30, 2004 as detailed below:
| | | For the Three Months Ended June 30, (US $000's) | |
| | | 2005 | | 2004 | | Movement | |
| Slovak Republic operations | | $ | 4,050 | | $ | 4,082 | | $ | (32 | ) |
| Romanian operations | | | (1 | ) | | 222 | | | (223 | ) |
Equity in income of unconsolidated affiliates | | $ | 4,049 | | $ | 4,304 | | $ | (255 | ) |
Discontinued operations: The amounts charged to the consolidated income statement are in respect of our withdrawal from our Czech operations in 2003 (for further information, see the Dutch tax paragraph in Part I, Note 17, “Commitments and Contingencies”).
IV (h) Consolidated results excluding net revenues, station operating costs and expenses and station selling, general and administrative expenses for the six months ended June 30, 2005 compared to the six months ended June 30, 2004
| | | For the Six Months Ended June 30, (US$ 000's) | |
| | | 2005 | | 2004 | | Movement | |
| Corporate operating costs (including non-cash stock based compensation) | | | 11,182 | | | 12,225 | | | (1,043 | ) |
| Amortization of intangibles | | | 159 | | | 62 | | | 97 | |
| Impairment charge | | | 35,331 | | | - | | | 35,331 | |
| Interest income | | | 1,638 | | | 2,240 | | | (602 | ) |
| Interest expense | | | (6,731 | ) | | (885 | ) | | (5,846 | ) |
| Foreign currency exchange gain/(loss), net | | | 29,430 | | | (1,922 | ) | | 31,352 | |
| Other expense | | | (3,689 | ) | | (781 | ) | | (2,908 | ) |
| Provision for income taxes | | | (5,906 | ) | | (6,939 | ) | | 1,033 | |
| Minority interest in income of consolidated subsidiaries | | | (4,681 | ) | | (457 | ) | | (4,224 | ) |
| Equity in income of unconsolidated affiliates | | | 4,883 | | | 5,199 | | | (316 | ) |
| Post-tax loss from discontinued operations | | | (2,044 | ) | | (45 | ) | | (1,999 | ) |
Corporate operating costs for the six months ended June 30, 2005 decreased by US$ 1.0 million compared to the six months ended June 30, 2004 as detailed below:
| | | For the Six Months Ended June 30, (US $000's) | |
| | | 2005 | | 2004 | | Movement | |
| Corporate operating costs | | $ | 9,500 | | $ | 7,971 | | $ | 1,529 | |
| Non-cash stock based compensation | | | 1,682 | | | 4,254 | | | (2,572 | ) |
Corporate operating costs (including non-cash stock based compensation) | | $ | 11,182 | | $ | 12,225 | | $ | (1,043 | ) |
For the six months ended June 30, 2005, corporate operating costs (excluding stock-based compensation) increased by US$ 1.5 million compared to the six months ended June 30, 2004 primarily due to increases in salary and related costs as a result of a higher number of corporate staff; Sarbanes-Oxley and other professional fees and directors’ and officers’ liability insurance premiums.
Stock-based compensation for the six months ended June 30, 2005 decreased by US$ 2.6 million compared to the six months ended June 30, 2004 principally as a result of the effect of the decrease in the price of our stock as it relates to our stock-based compensation variable and fixed plans (for further information, see Part I, Note 15, “Stock-based Compensation”).
Amortization of intangibles for the six months ended June 30, 2005 was US$ 0.2 million compared to $ 0.1 million for the six months ended June 30, 2004.
Impairment charge: In the six months ended June 30, 2005, we recognized an impairment charge of US$ 35.3 million with respect to our Croatian operations (for further information see Part I, Note 6, “Croatian Impairment”).
Interest income decreased by US$ 0.6 million for the six months ended June 30, 2005 compared to the six months ended June 30, 2004 primarily as a result of a reduction in our year on year cash balance.
Interest expense increased by US$ 5.8 million for the six months ended June 30, 2005 compared to the six months ended June 30, 2004 primarily as a result of as a result of the issuance of our Euro 245 million (approximately US$ 296.6 million) 8.25% Senior Notes and Euro 125 million (approximately US$ 151.3 million) floating rate Senior Notes on May 5, 2005.
Foreign currency exchange: For the six months ended June 30, 2005 we recognized a US$ 29.4 million gain compared to US$ 1.9 million loss for the six months ended June 30, 2004. This is primarily as a result of the strengthening of the US dollar as against the Euro currency during the period. Our fixed and floating rate Senior Notes are denominated in Euros.
Other expense for the six months ended June 30, 2005 increased by US$ 2.9 million compared to the six months ended June 30, 2004 primarily as a result of the bridge financing commitment fees of US$ 3.4 million relating to the TV Nova (Czech Republic) Group acquisition.
Provision for income taxes: Provision for income taxes was US$ 5.9 million for the six months ended June 30, 2005 compared to US$ 6.9 million for the six months ended June 30, 2004. The decrease is primarily as a result of a tax credit of US$ 5.1 million in relation to the Croatian impairment (for further information see Part I, Note 6, “Croatian Impairment”) and an income tax provision in respect of the Czech Republic of US$ 5.7 million.
Minority interest in income of consolidated subsidiaries: For the six months ended June 30, 2005, minority interest in the income of consolidated subsidiaries was US$ 4.7 million. This includes US$ 2.1 million with regard to our Czech Republic operations which related primarily to the minority interests held by Mr. Krsak prior to our acquisition of his shares on May 27, 2005 and by PPF prior to our exercise of our call option to acquire its shares in the TV Nova (Czech Republic) Group on May 31, 2005. For the six months ended June 30, 2004 minority interest in the income of consolidated subsidiaries was US$ 0.5 million.
Equity in income of unconsolidated affiliates: As explained in Part I, Item 1, “Business” of our December 31, 2004 Form 10-K filed with the SEC on March 15, 2005, as amended by our Form 10/K-A filed on April 1, 2005, some of our broadcasting licenses are held by unconsolidated affiliates over which we have minority blocking rights but not majority control. These affiliates are accounted for using the equity method.
Equity in income of unconsolidated affiliates for the six months ended June 30, 2005 decreased by US$ 0.3 million compared to the six months ended June 30, 2004 as detailed below:
| | | For the Six Months Ended June 30, (US $000's) | |
| | | 2005 | | 2004 | | Movement | |
| Slovak Republic operations | | $ | 4,958 | | $ | 4,813 | | $ | 145 | |
| Romanian operations | | | (75 | ) | | 386 | | | (461 | ) |
Equity in income of unconsolidated affiliates | | $ | 4,883 | | $ | 5,199 | | $ | (316 | ) |
Discontinued operations: The amounts charged to the consolidated income statement in respect of our withdrawal from our Czech operations in 2003 (for further information, see the Dutch tax paragraph in Note 17, “Commitments and Contingencies”).
IV (i) | Consolidated balance sheet as at June 30, 2005 compared to December 31, 2004 |
Following the acquisition of TV Nova (Czech Republic) and with respect to our consolidated balance as at June 30, 2005, our consolidated current assets increased by US$ 60.0 million, our consolidated non-current assets increased by US$ 885.1 million, our consolidated current liabilities increased by US$ 88.0 million (US$ 40.1 million of which is included in accounts payable and accrued liabilities) and our consolidated non-current liabilities increased by US$ 523.4 million. In addition to this we have recorded US$ 774.5 million of goodwill and US$ 27.8 million of deferred consideration in our consolidated balance sheet as at June 30, 2005 (for further information, see Part 1, Note 5, "Acquisitions and Disposals").
V. | Liquidity and Capital Resources |
Summary
As at June 30, 2005, we had US$ 113.8 million of unrestricted cash and cash equivalents compared to US$ 152.6 million as at December 31, 2004. The principal reasons for the decrease of US$ 38.8 million are as follows:
| · | Receipt of approximately US$ 682 million (net of fees) from the issuance of Senior Notes and a public offering of 5.4 million shares of our Class A Common Stock; |
| · | Approximately US$ 733 million, including $ 492 million repayment of notes to PPF on May 5, 2005, was applied toward the purchase of the interests in TV Nova (Czech Republic) held by PPF and Mr. Krsak (for further information, see Item 1, Note 5, "Acquisitions and Disposals"); |
| · | The reclassification of US$ 24 million to restricted cash, representing money held in escrow as the second and final payment to Mr. Krsak (for further information, see Item 1, Note 5, "Acquisitions and Disposals"); |
| · | The addition of US$ 51 million held in our Czech Republic operations which were consolidated for the first time as at June 30, 2005; |
| · | A payment of US$ 5 million payment in connection with the 2% increase in our holding of our Romanian operations (for further information, see Item 1, Note 5, "Acquisitions and Disposals"); and |
| · | A further payment of Euro 4.7 million (approximately US$ 6 million) to acquire the remaining 3.15% interest in Pro Plus (for further information, see Item 1, Note 5, " Acquisitions and Disposals”). |
Contractual Cash Obligations
Our future contractual obligations as of June 30, 2005 are as follows:
| Contractual Obligations | | Payments due by period (US$ 000’s) | |
| | | Total | | Less than 1 year | | 1-3 years | | 3-5 years | | More than 5 years | |
| Long-Term Debt (1) | | $ | 728,320 | | $ | 49,483 | | $ | 72,636 | | $ | 72,465 | | $ | 533,736 | |
| Capital Lease Obligations | | | 7,211 | | | 1,588 | | | 979 | | | 938 | | | 3,706 | |
| Operating Leases | | | 16,116 | | | 6,663 | | | 7,023 | | | 1,914 | | | 516 | |
| Unconditional Purchase Obligations | | | 21,895 | | | 21,475 | | | 316 | | | 104 | | | - | |
| Other Long-Term Obligations (2) | | | 62,776 | | | 3,127 | | | 58,642 | | | 1,007 | | | - | |
| Total Contractual Obligations | | $ | 836,318 | | $ | 82,336 | | $ | 139,596 | | $ | 76,428 | | $ | 537,958 | |
(1) Long-term debt includes both principal and interest payments. Future interest payable on variable rate debt is calculated using the interest rates prevailing as at June 30, 2005.
(2) Other long-term obligations includes the settlement liability (for further information, see Part I, Note 10, “Settlement Liability”).
At June 30, 2005, we had the following debt:
| (1) | Senior notes in the aggregate principal amount of Euro 370 million (approximately US$ 447.9 million), consisting of Euro 245 million (approximately US$ 296.6 million) 8.25% Senior Notes due 2012 and Euro 125 million (approximately US$ 151.3 million) floating rate Senior Notes due 2012, which have been issued at a rate equal to six-month Euro Inter-Bank Offered Rate (“EURIBOR”) plus 5.5% (EURIBOR - 6 month as at June 30, 2005 was 2.1%) (for further information see Note 11, “Senior Notes”). |
| (2) | Mag Media, CP 2000 and CET 21 have two credit facilities of up to an aggregate of CZK 1,100 million (approximately US$ 44.3 million) with Ceska Sporitelna, a.s. (“CS”) and Factoring Ceska Sporitelna, a.s., a subsidiary of CS. One facility is a CZK 850 million (approximately US$ 34.2 million) facility for factoring trade receivables of Mag Media (US$ nil drawn as at June 30, 2005) and the second is a working capital facility of up to CZK 700 million (approximately US$ 28.2 million); provided that the aggregate borrowing under both facilities does not exceed CZK 1,100 million (approximately US$ 44.3 million). As at June 30, 2005, no trade receivables were sold by Mag Media and CZK 250 million (approximately US$ 10.1 million) has been drawn under the working capital facility and bears a variable interest rate of the three-month Prague Inter-Bank Offered Rate (“PRIBOR”) rate plus 1.8% (PRIBOR - 3 month rate as at June 30, 2005 was 1.74%). |
| (3) | A facility of up to Euro 8.0 million (approximately US$ 9.7 million) pursuant to a loan agreement among Pro Plus, Bank Austria Creditanstalt d.d. (“BACA”) and Nova Ljubljanska banka d.d. which matures in February 2009. As at June 30, 2005 Euro 5.8 million (approximately US$ 7.0 million) (December 31, 2004: Euro 6.5 million, approximately US$ 7.9 million) was drawn by our Slovenian operating company under these agreements. This loan bears a variable interest rate of the EURIBOR 6 month rate plus 3.0% (EURIBOR - 6 month as at June 30, 2005 was 1.9%). As at June 30, 2005 a rate of 4.9% applied to this loan. This loan facility is secured by the real property, fixed assets and receivables of Pro Plus, which as at June 30, 2005 have a carrying amount of approximately US$ 26.4 million. Principal payments of Euro 0.7 million (approximately US$ 0.8 million) were made on these loans in 2005. |
| (4) | A loan of Sk187 million (approximately US$ 5.9 million) (December 31, 2004: Sk187 million, approximately US$ 6.6 million) from our non-consolidated affiliate, STS. This loan bears a variable interest rate of the Bratislava Inter-Bank Offered Rate (“BRIBOR”) 3 month rate plus 2.2% (BRIBOR - 3 month as at June 30, 2005 was 2.6%). We expect this loan to be repaid in during the third quarter of 2005. |
| (5) | A total of Euro 0.9 million (approximately US$ 1.1 million) was drawn down on three loan agreements our Croatian operations have with Hypo Alpe-Adria-Bank d.d. These loans bear a variable interest rate of the EURIBOR 3 month rate plus 2.5%. As at June 30, 2005 a rate of 4.65% applied to these loans. These loan facilities are secured by the real property and fixed assets of OK, which as at June 30, 2005 have a carrying amount of approximately US$ 1.4 million. Principal payments of Euro 0.1 million (approximately US$ 0.1 million) were made on these loans in 2005. |
| (6) | An amount of Euro 0.01 million (approximately US$ 0.02 million) was drawn down on a fourth loan agreement our Croatian operations have with Hypo Alpe-Adria-Bank d.d. This loan bears a fixed interest rate of 7.25%. |
| (7) | Euro 0.2 million (approximately US$ 0.2 million) was drawn down by our Croatian operations under a loan agreement with BKS Bank fur Karnten and Steiermark AG. This loan bears a variable interest rate of the EURIBOR 3 month rate plus 3.0%. As at June 30, 2005 a rate of 5.15% applied to this loan. Principal payments of Euro 0.1 million (approximately US$ 0.1 million) were made on these loans in 2005. |
In addition to the above, our non-consolidated affiliate STS had the following loan:
| (1) | On July 24, 2002 STS, a 49% owned affiliate, obtained from Vseobecna uverova banka, a.s. ("VUB") a mid-term facility of SKK 100 million (approximately US$ 3.1 million). This facility matures in December 2005, and bears a variable interest rate of the BRIBOR 3 month rate plus 1.7% (BRIBOR - 3 month as at June 30, 2005 was 2.6%) and is secured by a pledge of certain fixed and current assets. The nominal value of receivables under pledge according to the contract is US$ 3.2 million. |
As at June 30, 2005, we had programming rights commitments (included within "Unconditional Purchase Obligations" in the chart above) of US$ 21.3 million in respect of future programming which includes contracts signed with license periods starting after June 30, 2005 (December 31, 2004: US$ 18.1 million).
Included in Other Long-Term Obligations are our commitments to the Dutch tax authorities (see Part I, Item 17, “Commitments and Contingencies”) and the settlement liability of US$ 50.0 million among the PPF Group, CET 21 and CNTS. The payment schedule provides for payments through 2007 and unpaid amounts bear interest at a rate of 8.5% per annum on the unpaid balance (see Part I, Note 10, “Settlement Liability”).
Sources and Uses of Cash
Our ongoing source of cash in the operating stations is primarily the receipt of payments from advertisers and advertising agencies. This may be augmented from time to time by local borrowing. Surplus cash generated in this manner, after funding the ongoing station operations, may be remitted to corporate, or to other shareholders where appropriate. Surplus cash is remitted to corporate in the form of debt interest payments and capital repayments, dividends, and other distributions and loans from our subsidiaries and equity accounted investments.
As at June 30, 2005 and December 31, 2004 the operations had the following unsecured balances owing to their respective holding companies:
| | | As at June 30, 2005 | | As at December 31, 2004 | |
Country | | (US $ 000’s) | |
| Croatia | | $ | 23,659 | | $ | 11,087 | |
| Czech Republic | | | 466,689 | | | - | |
| Romania | | | 34,539 | | | 37,109 | |
| Slovak Republic | | | 88 | | | - | |
| Slovenia | | | 41 | | | 1,590 | |
| Ukraine | | | 8,866 | | | 13,459 | |
| Total | | $ | 533,882 | | $ | 63,245 | |
Prior to making investments in associated companies, borrowing or repayment of third party overdraft or debt, or payments to corporate in excess of current year recharges, our continuing consolidated operating stations, excluding Croatia and the Czech Republic, generated cash of US$ 13.9 million during the first six months of 2005 compared to US$ 12.9 million in the first six months of 2004. Our Croatian operations utilized US$ 13.9 million of cash during the first six months of 2005 and our Czech Republic operations have generated cash of US$ 13.2 million since acquisition. STS, our equity accounted affiliate, generated cash of US$ 9.7 million the first six months of 2005 compared to US$ 5.5 million for the first six months of 2004.
Cash Outlook
The issuance of the Euro 370 million (approximately US$ 480 million at the time of issuance) Senior Notes for the acquisition of the TV Nova (Czech Republic) Group has increased our leverage and we have significant debt service obligations in respect of the Senior Notes. In addition, the terms of our indebtedness restrict the manner in which our business is conducted, including the incurrence of additional indebtedness, the making of investments, the payment of dividends or the making of other distributions, entering into certain affiliate transactions and the sale of assets.
Our future cash needs will depend on our overall financial performance, our ability to service the indebtedness incurred under the Senior Notes as well as any future investment and development decisions. Our ability to raise further funds through external debt facilities depends on our satisfaction of a leverage ratio under the Senior Notes. In the short term we are able to fund all planned investments from our current cash resources and forecast sufficient cash flow in the medium term. To give us further financial flexibility, on July 29, 2005, we entered into a revolving facility for Euro 37.5 million (approximately US$ 45.4 million) for general corporate purposes (see Part I, Note 19, “Subsequent Events”).
In connection with our on-going review of our Croatian operations and following a strategic assessment of the performance of Nova TV (Croatia) undertaken during the quarter, we modified our strategy for Croatia in late June 2005. This new strategy requires higher current expenditures than had been planned prior to the strategic assessment in order to secure our audience and market share targets. In order to achieve these targets, we have increased our budget for the acquisition of higher quality foreign and domestic programming for 2005 and 2006, for marketing and promotion (including improvements to the on-air look of Nova TV (Croatia)) and accelerated investment for the extension of our technical reach. We expect total investment to be in excess of US$ 27 million during 2005. We expect that our Croatian operations will approach EBITDA break-even in 2007.
We expect that cash balances, internally generated cash flow, the proceeds of our public equity offering and local financing of broadcast operations should result in us having adequate cash resources to meet our debt service and other financial obligations for the next 12 months.
Tax Inspections
Pro Plus has been the subject of an income tax inspection by the Republic of Slovenia tax authorities for the years 1995 to 1998. As a result of these inspections the Slovenian tax authorities had levied an assessment seeking unpaid income taxes, customs duties and interest charges of SIT 1,073,000,000 (approximately US$ 5.4 million). The Slovenian authorities have asserted that capital contributions and loans made by us to Pro Plus in 1995 and 1996 should be extraordinary revenue to Pro Plus. On this basis, the Slovenian authorities claim that Pro Plus made a profit in 1995 and 1996 for which it owes income taxes and interest. Additionally, the Slovenian tax authorities claim that the fixed assets imported as capital contributions were subject to customs duties which were not paid. On February 9, 2001, the Slovenian tax authorities concluded that the cash capital contributions for 1995 and 1996 were not extraordinary income. This has reduced the assessment to SIT 636,800,000 (approximately US$ 3.2 million) in aggregate principal amount. Pro Plus appealed this decision to the Administrative Court in Ljubljana and requested the tax authorities defer the demand for payment until a final judgment has been issued. The tax authorities agreed to defer its demand for payment until a final decision on the matter had been reached. On April 18, 2005, the Administrative Court issued a decision in favor of Pro Plus and dismissed the claims of the tax authorities. The tax authorities filed an appeal with the Slovenian Supreme Court in May, 2005. We do not have a provision in our financial statements in relation to this legal action.
Off-Balance Sheet Arrangements
None.
VI. | Critical Accounting Policies and Estimates |
Our accounting policies affecting our financial condition and results of operations are more fully described in Part II, Item 8 of our 10-K filed with the SEC on March 15, 2005 as amended by our Form 10-K/A filed with the SEC on April 1, 2005. The preparation of these financial statements requires us to make judgments in selecting appropriate assumptions for calculating financial estimates, which inherently contain some degree of uncertainty. We base our estimates on historical experience and on various other assumptions that we believe to be reasonable under the circumstances, the results of which form the basis of making judgments about the carrying values of assets and liabilities and the reported amounts of revenues and expenses that are not readily apparent from other sources. Actual results may differ from these estimates under different assumptions or conditions.
We believe our critical accounting policies are as follows: Program Rights Costs, Valuation of Intangible Assets, Bad Debt, and Provision for Deferred Tax. These critical accounting policies affect our more significant judgments and estimates used in the preparation of our consolidated financial statements. There have been no significant changes in our critical accounting policies since December 31, 2004, other than the addition of a new critical accounting policy on reporting exchange differences on inter-company foreign currency transactions that are long-term in nature.
On May 2, 2005, we made an inter-company loan of US$ 465.5 million to a 100% wholly-owned subsidiary holding our investment in the Czech Republic. This loan was converted to CZK 11,425 million during this quarter and has a balance of CZK 11,425 million (US$ 460.0 million) as of June 30, 2005. During the three months ended June 30, 2005, a foreign exchange adjustment of negative US$ 23.2 million arose on inter-company foreign currency transactions, primarily consisting of this intercompany loan. As these transactions are long-term in nature as contemplated by SFAS 52 “Foreign Currency Translation” (“SFAS 52”) paragraph 20 (b), the foreign exchange adjustments are reported in the same manner as translation adjustments in “Other Comprehensive Income”, a separate component of equity. Foreign exchange adjustments on inter-company transactions that are not long term in nature are generally included in our determination of net income.
| Quantitative and Qualitative Disclosures About Market Risk |
We engage in activities that expose us to various market risks, including the effects of changes in foreign currency exchange rates and interest rates. We do not regularly engage in speculative transactions, nor do we regularly hold or issue financial instruments for trading purposes.
Foreign Currency Exchange Risk Management
We conduct business in a number of foreign currencies. As a result, we are subject to foreign currency exchange rate risk due to the effects that foreign exchange rate movements of these currencies have on our costs and on the cash flows we receive from certain subsidiaries. In limited instances we enter into forward foreign exchange contracts to hedge foreign currency exchange rate risk. At June 30, 2005 we held no foreign exchange contracts.
Interest Rate Risk Management
As at June 30, 2005 we have eight tranches of debt that provide for interest at a spread above a base rate EURIBOR, BRIBOR and PRIBOR. A significant rise in the EURIBOR, BRIBOR or PRIBOR base rate would have an adverse effect on our business and results of operations. As at June 30, 2004 we had two tranches of debt which were maintained with a variable interest rate.
Interest Rate Table as at June 30, 2005
Expected Maturity Dates | | 2005 | | 2006 | | 2007 | | 2008 | | Thereafter | |
| | | | | | | | | | | | |
Total Debt in Euros 000's | | | | | | | | | | | | | | | | |
| | | | | | | | | | | | | | | | | |
| Fixed Rate | | | - | | | - | | | 13 | | | - | | | 245,000 | |
| | | | | | | | | | | | | | | | | |
| Average Interest Rate | | | - | | | - | | | 7.25 | % | | - | | | 8.25 | % |
| | | | | | | | | | | | | | | | | |
| Variable Rate | | | 5,818 | | | 235 | | | - | | | - | | | 125,824 | |
| | | | | | | | | | | | | | | | | |
| Average Interest Rate | | | 4.91 | % | | 5.01 | % | | - | | | - | | | 7.63 | % |
| | | | | | | | | | | | | | | | | |
| | | | | | | | | | | | | | | | | |
Total Debt in Sk 000's | | | | | | | | | | | | | | | | |
| | | | | | | | | | | | | | | | | |
| Fixed Rate | | | - | | | - | | | - | | | - | | | - | |
| | | | | | | | | | | | | | | | | |
| Average Interest Rate | | | - | | | - | | | - | | | - | | | - | |
| | | | | | | | | | | | | | | | | |
| Variable Rate | | | 187,000 | | | - | | | - | | | - | | | - | |
| | | | | | | | | | | | | | | | | |
| Average Interest Rate | | | 4.78 | % | | - | | | - | | | - | | | - | |
| | | | | | | | | | | | | | | | | |
| | | | | | | | | | | | | | | | | |
Total Debt in Czk 000's | | | | | | | | | | | | | | | | |
| | | | | | | | | | | | | | | | | |
| Fixed Rate | | | - | | | - | | | - | | | - | | | - | |
| | | | | | | | | | | | | | | | | |
| Average Interest Rate | | | - | | | - | | | - | | | - | | | - | |
| | | | | | | | | | | | | | | | | |
| Variable Rate | | | 250,000 | | | - | | | - | | | - | | | - | |
| | | | | | | | | | | | | | | | | |
| Average Interest Rate | | | 3.54 | % | | - | | | - | | | - | | | - | |
Variable Interest Rate Sensitivity as at June 30, 2004
| | | | | | | Yearly interest charge if interest rates increase by (US$000s): |
Value of Debt as at June 30, 2005 (US$ 000's) | | Interest Rate as at June 30, 2005 | | Yearly Interest Charge (US$ 000’s) | | 1% | | 2% | | 3% | | 4% | | 5% |
159,625 (Euro 131.9 million) | | 4.65%-7.65% | | $ 11,977 | | $ 13,573 | | $ 15,170 | | $ 16,766 | | $ 18,362 | | $ 19,958 |
5,876 (Sk 187 million) | | 4.78% | | 281 | | 340 | | 398 | | 457 | | 516 | | 575 |
10,066 (Czk 250 million) | | 3.54% | | 356 | | 457 | | 558 | | 658 | | 759 | | 860 |
Total | | | | $ 12,614 | | $ 14,370 | | $ 16,126 | | $ 17,881 | | $ 19,637 | | $ 21,393 |
Our Chief Executive Officer and Chief Financial Officer evaluated the effectiveness of the design and operation of our disclosure controls and procedures as of the end of the period covered by this report. Based upon this evaluation, the Chief Executive Officer and Chief Financial Officer concluded that the disclosure controls and procedures are effective.
In the first quarter of 2005 we have implemented a structured review process, which is ongoing, of the application of generally accepted accounting principles referred to in Item 9A, “Controls and Procedures” of our December 31, 2004 Form 10-K filed with the Securities and Exchange Commission ("SEC") on March 15, 2005 as amended by our Form 10-K/A filed with the SEC on April 1, 2005. In conjunction with this we have engaged an independent registered public accounting firm to provide technical assistance in regard to the application of generally accepted accounting principles. There were no other changes in our internal controls over financial reporting that occurred in the second quarter of 2005 that have materially affected, or are reasonably likely to materially affect, our internal control over financial reporting.
OTHER INFORMATION
General
We are, from time to time, a party to litigation that arises in the normal course of our business operations. Other than those claims discussed below, we are not presently a party to any such litigation which could reasonably be expected to have a material adverse effect on our business or operations.
We present below a summary of our more significant proceedings by country.
Croatia
On October 29, 2004, OK filed suit against Global Communications d.o.o. claiming approximately HRK 53 million (approximately US$ 8.7 million) in damages. Global Communications is a company controlled by Ivan Caleta, who had previously operated Nova TV (Croatia) through OK. Global Communications, together with GRP Media d.o.o., another company controlled by Mr. Caleta, had provided certain goods and services to OK and Nova TV (Croatia) in exchange for advertising time. Global Communications and GRP Media were functionally managing the advertising inventory of Nova TV (Croatia). On December 31, 2003, Global Communications entered into an agreement by which OK acknowledged that Global Communications was entitled to approximately 375,000 seconds of advertising time for goods and services previously provided. Following our acquisition of Nova TV (Croatia) and OK in July 2004, OK concluded that Global Communications had used all of its seconds by June 2004 based on a substantial discrepancy discovered between the utilization of advertising time recorded by Global Communications and that recorded by AGB Puls, an independent television audience measurement service operating in Croatia. In the course of its investigation of the usage of seconds by Global Communications, OK discovered that computer records of advertising seconds kept for OK may have been altered. OK brought suit in order to recover amounts for advertising time used by Global Communications in excess of the 375,000 seconds agreed. Global Communications filed a counterclaim in January 2005 for HRK 68 million (approximately US$ 11.2 million), claiming that AGB data is unreliable and that it is entitled to additional seconds under the previous agreement. We do not believe that these counterclaims will prevail.
Romania
There are no significant outstanding legal actions that relate to our business in Romania.
Slovenia
On November 20, 2002, we received notice of a claim filed by Mrs. Zdenka Meglic, the founder and a former shareholder of MMTV 1 d.o.o (MMTV), against MMTV, a subsidiary of CME Media Enterprises BV. In her claim against MMTV, Mrs. Meglic is seeking an amount equal to SIT 190 million (approximately US$ 1.0 million) for repayment of monies advanced to MMTV from 1992 to 1994 (in the amount of approximately SIT 29 million (approximately US$ 0.1 million)) plus accrued interest. On September 9, 2004, the court of first instance found against MMTV and issued a judgment requiring MMTV to pay SIT 190 million (approximately US$ 1.0 million) plus interest as well as costs. On September 24, 2004, MMTV filed an appeal against the judgment. On December 15, 2004, the appellate court vacated the judgment of the lower court and returned the case for further proceedings. We do not believe that Mrs. Meglic will prevail and will continue to defend the claim. Accordingly, we have made no provision for this claim in our consolidated balance sheets as at June 30, 2005.
Slovak Republic
There are no significant outstanding legal actions that relate to our business in the Slovak Republic.
Ukraine
There are no significant outstanding legal actions that relate to our business in Ukraine.
Czech Republic
Claims Relating to the Vilja Shareholding in CET 21
On May 20, 2002, Vilja acquired its ownership interest in CET 21 from Messrs. Alan, Huncik and Venclik. On July 19, 2002, Peter Krsak, a shareholder of CET 21, filed a claim with the City Court in Prague challenging a number of CET 21 shareholder resolutions adopted by written consent (the “Krsak 2002 Petition”). In relevant part, his complaint included challenges to (1) a decision of the CET 21 shareholders of April 22, 2002 to approve the transfer by Messrs. Alan and Venclik of their ownership interests in CET 21 to Vilja and (2) a written resolution of the CET 21 shareholders on the redistribution of a 60% interest in CET 21 then held by the company itself. (This 60% interest had previously been held by Vladimir Zelezny, who had been forced to relinquish it in an enforcement proceeding against him following his default on a judgment adverse to him in another proceeding). These claims, in effect, constituted a challenge to the ownership by Vilja of a 52.075% ownership interest in CET 21.
On June 18, 2003, before the City Court had issued a decision in the Krsak 2002 Petition, CET 21 petitioned the City Court to approve, among other things, the registration of Vilja in the commercial register maintained by the City Court (the “Commercial Register”) as the owner of 52.075% of CET 21 (the “CET 21 Petition”).
On November 20, 2003, the City Court found in favor of Mr. Krsak in respect of the Krsak 2002 Petition on the basis that he had had insufficient time to respond to the resolutions. In a hearing in respect of the CET 21 Petition on December 10, 2003, the City Court refused to register Vilja as requested in the CET 21 Petition and ordered the registration of a group of shareholders that had previously owned CET 21.
CET 21 filed an appeal on January 24, 2004 in respect of the CET 21 Petition to the High Court of Prague and a separate appeal on February 5, 2004 in respect of the Krsak 2002 Petition.
The High Court of Prague in a decision dated May 27, 2004 vacated the decision of the City Court in the CET 21 Petition. Furthermore, the decision of the High Court stated the legal position of the High Court on the following salient points: (1) the transfer agreements by which Vilja acquired a 52.075% interest in CET 21 are valid, (2) Zelezny held a 60% ownership interest in CET 21 pursuant to a shareholder resolution validly adopted in 1997, and (3) Zelezny ceased to hold a 60% interest in CET 21 following the successful completion of the enforcement proceeding. According to legal advice we have received from local counsel, the legal opinion expressed by the High Court in respect of the CET 21 Petition is binding on the City Court.
On October 18, 2004, the High Court of Prague, after concluding that the time limits to respond to the shareholder resolution were sufficient, vacated the decision of the City Court in the Krsak 2002 Petition and returned the case for further proceedings. The High Court instructed the City Court to give due regard in any further proceedings to other decisions taken in related matters, which, according to legal advice we have received from local counsel, includes the decision of the High Court dated May 27, 2004 in respect of the CET 21 Petition.
On February 24, 2005 we entered into the Agreement on the Settlement of Disputes and Transfer of Ownership Interest with Peter Krsak (the “Krsak Agreement”). The Krsak Agreement provides that Mr. Krsak will file petitions to withdraw all of his claims in respect of the TV Nova (Czech Republic) Group following the satisfaction of specified conditions precedent. Those conditions were satisfied in April 2005 and Mr. Krsak filed the necessary petitions in May 2005. The City Court in Prague accepted a petition to withdraw the Krsak 2002 Petition on May 24, 2005 and issued a resolution confirming that the proceedings in respect of the Krsak 2002 Petition have been terminated.
The ability of the City Court to conduct further proceedings on the registration of Vilja as the owner of 52.075% of CET 21 requires the Supreme Court of the Czech Republic to release the share register of CET 21. The share register was lodged with the Supreme Court in connection with an extraordinary appeal by Mr. Krsak in an action originally initiated by CET 21 in 2000. In that action, CET 21 sought to register a replacement for Mr. Krsak as an executive of CET 21 following his removal. The City Court of Prague dismissed the petition. After the High Court of Prague amended the decision of the City Court and approved the registration of the change in directors, Mr. Krsak filed his extraordinary appeal on August 8, 2003. In connection with the Krsak Agreement, Mr. Krsak filed a petition on May 23, 2005 to withdraw this claim. The Supreme Court has not yet acted on this petition. Until the Supreme Court has terminated these proceedings, there will not be a formal resolution of the CET 21 Petition and Vilja cannot be formally registered as a shareholder of CET 21.
Disposition of the CET 21 Interest Held by CET 21
Following an enforcement proceeding against Vladimir Zelezny in another matter, his 60% interest passed to CET 21. The CET 21 shareholder resolution of July 4, 2002 provided for the redistribution of this 60% interest among Vilja, Krsak, CEDC and CS, the four remaining shareholders of CET 21. Only Vilja elected to participate in the redistribution of that interest; it acquired its pro rata portion of the 60% interest and thereby increased its ownership in CET 21 to 52.075% (from a 20.83% interest of an aggregate 40% interest then held by the four remaining shareholders). None of Mr Krsak, who previously held a 16.67% interest in CET 21, or CS or CEDC, which each holds a 1.25% interest, participated in the redistribution. As a result, their pro rated portions of the 60% interest (equal to an aggregate 28.755% interest in CET 21) continue to be held by CET 21 itself. CET 21 cannot dispose of this 28.755% interest prior to the resolution of certain claims relating to the Vilja ownership interest described above.
Claims brought by Alan, Huncik, Venclik and Gal
On May 7, 2003, Alan, Huncik, Venclik and Gal, former shareholders of CET 21, filed a claim against Krsak, Zelezny, CET 21, CEDC and CS with the City Court in Prague. The substance of this challenge concerns the basis on which Zelezny purported to increase his ownership interest in CET 21 to 60% in 1997. On July 4, 2003, CET 21 filed a response refuting the challenges.
Until Alan, Huncik and Venclik entered into transfer agreements with Vilja on May 20, 2002, they each held an interest in CET 21 (with 8.42% held by Alan, 4.34% by Huncik and 8.71% by Venclik). Following the decision of the City Court in Prague in respect of the Krsak 2002 Petition (which challenged the transfers by Alan and Venclik on the grounds that the interests being transferred to Vilja were inaccurately described), each of Alan, Huncik and Venclik entered into a second set of transfer agreements with Vilja intended to remedy any defects in the earlier transfer agreements. In addition, they and Gal entered into another set of agreements regulating, among other things, consideration for the interests transferred by Alan, Huncik and Venclik as well as their conduct in respect of the claim filed on May 7, 2003. Specifically, they undertook to withdraw this claim prior to any hearing. No hearing on this claim has been scheduled and this claim has not been withdrawn to date.
Claims Relating to the Interests of CS and CEDC in CET 21
On April 2, 2003, CS entered into an agreement with Vilja to transfer its 1.25% interest in CET 21 to Vilja. This transfer was approved by a resolution of the CET 21 shareholders adopted by written consent on May 16, 2003. Mr. Krsak filed a petition against CET 21 in the City Court in Prague on August 8, 2003 to declare the shareholders resolution invalid. Pursuant to the Krsak Agreement, Mr. Krsak filed a petition in May 2005 with the High Court in Prague to withdraw this claim. The High Court in Prague has not yet acted on this petition.
CET 21 adopted a shareholder resolution by written consent on January 5, 2004 to approve the transfer of the 1.25% interest of CEDC in CET 21 to PPF. Mr. Krsak filed a petition against CET 21 in the City Court in Prague on February 3, 2004 to declare this shareholders resolution invalid. Pursuant to the Krsak Agreement, Mr. Krsak filed a petition in May 2005 with the High Court in Prague to withdraw this claim. The High Court in Prague has not yet acted on this petition.
The consent of the Czech Media Council to the transfer of each of these 1.25% interests has been requested but has not yet been issued.
Other Claims
On January 25, 2005, Mr. Krsak filed on his own behalf and on behalf of CET 21 an action in the City Court in Prague against twenty-five parties, including PPF and its affiliates, CP 2000, Vilja, and certain former and current members of management. In his filing, Mr. Krsak is claiming damages to himself in the amount of approximately CZK 1.25 billion (approximately US$ 50.3 million) and on behalf of CET 21 in the amount of approximately CZK 7.5 billion (approximately US$ 302.0 million). The substance of this claim is that various entities and persons controlling CET 21 caused CET 21 damage by entering into agreements on disadvantageous terms with service companies related to such controlling person (such as CP 2000 and Mag Media ).
Pursuant to the Krsak Agreement, Mr. Krsak filed a petition to withdraw this claim in May 2005 with the City Court in Prague. The City Court in Prague accepted this petition on May 31, 2005 and issued a resolution confirming that the proceedings have been terminated.
Item 4. Submission of Matters to a Vote of Security Holders
The following are the results of voting by shareholders present or represented at the Annual General Meeting of Shareholders on June 2, 2005.
a. Each of the nominees considered at the Annual General Meeting of Shareholders was elected to serve as a Director of the Company until the next Annual General Meeting of Shareholders or until their respective successors have been elected and qualified. The persons named below were elected to serve as Directors and received the number of votes set forth opposite their respective names:
| | For | Withheld |
| Ronald S. Lauder | 24,432,820 | 36,828 |
| | | |
| Michael Garin | 24,432,780 | 36,868 |
| | | |
| Charles R. Frank, Jr | 24,434,120 | 35,528 |
| | | |
| Herbert A. Granath | 24,434,780 | 34,868 |
| | | |
| Alfred W. Langer | 24,434,820 | 34,828 |
| | | |
| Bruce Maggin | 24,434,120 | 35,528 |
| | | |
| Ann Mather | 24,434,820 | 34,828 |
| | | |
| Eric Zinterhofer | 24,432,120 | 37,528 |
b. The Amended and Restated 1995 Stock Incentive Plan of the Company was approved, with 15,550,181 votes cast for approval, 279,996 votes cast against approval and 61,782 votes abstaining.
c. The financial statements of the Company for the fiscal year ended December 31, 2004 together with the auditor’s report thereon, were approved, with 24,412,588 votes cast for approval, 20,161 votes cast against approval and 36,889 votes abstaining.
d. The proposal to appoint Deloitte & Touche LLP as auditors of the Company and to authorize the directors, acting by the Audit Committee, to approve their fees was approved, with 24,411,704 votes cast for approval, 3,497 votes cast against approval and 54,447 votes abstaining.
On July 29, 2005, our Slovenian operating company Pro Plus entered into a revolving facility agreement for up to Euro 37.5 million (approximately US$ 45.4 million) in aggregate principal amount (the “Revolver”) with ING Bank N.V. (“ING”), Nova Ljubljanska Banka d.d., Ljubljana (“NLB”) and Bank Austria Creditanstalt d.d., Ljubljana (“BACA”). Our wholly-owned subsidiary of CME Media Enterprises BV (“CME BV”) is acting as guarantor and will pledge its 100% business interest in Pro Plus as part of the security. The lending banks will also take a security assignment over the bank accounts of Pro Plus and its two subsidiaries, Pop TV and Kanal A, and over any intercompany loans made by Pro Plus, Pop TV and/or Kanal A to each other or to CME BV. The aggregate principal amount of the commitment under the Revolver reduces annually by 10 percent. The Revolver matures in 2010.
Interest on loans under the Revolver shall be calculated at the rate of EURIBOR plus a margin. The margin is set initially at 3.6% per annum. The applicable margin may be reduced (by increments of 0.5% to a minimum of 2.1% per annum) if Pro Plus exceeds certain benchmarks for the ratio of net debt to broadcasting cash flow.
The Revolver contains customary representations, warranties, covenants and events of default. There are two financial covenants tests: maintenance of a ratio of net debt to broadcasting cash flow and a ratio of broadcasting cash flow to total interest expense (as such terms are defined in the Revolver). In addition, Pro Plus is required to repay amounts drawn under certain circumstances, including certain types of change of control, and to prepay amounts upon the occurrence of certain asset dispositions or receipt of insurance proceeds or if the ratio of net debt to broadcasting cash flow is lower than or equal to the ratio required under the financial covenants.
Pro Plus expects the first drawdown under the Revolver to occur during August 2005. Following the first drawdown, Pro Plus will repay its current facility with NLB and BACA (See Part I, Item 2, "V. Liquidity and Capital Resources").
a) The following exhibits are attached:
| | 10.46 | Agreement on Transfer of Ownership Interest, dated May 31, 2005, between PPF (Cyprus) Limited and Central European Media Enterprises Ltd. |
| | | |
| | 10.47 | Agreement on Transfer of Ownership Interest, dated May 31, 2005, between PPF (Cyprus) Limited and CME Media Enterprises B.V. |
| | | |
| | 10.48 | Euro 37.5 million facility agreement, dated July 29, 2005, between Produkcija Plus Storitveno Podjetje d.o.o. and ING Bank N.V., Nova Ljubljanska banka d.d., and Bank Austria Creditanstalt d.d. |
| | | |
| | 31.01 | Sarbanes-Oxley Certification s.302 CEO, dated August 4, 2005 |
| | | |
| | 31.02 | Sarbanes-Oxley Certification s.302 CFO, dated August 4, 2005 |
| | | |
| | 32.01 | Sarbanes-Oxley Certification - CEO and CFO, dated August 4, 2005 (furnished only) |
Pursuant to the requirements of the Securities Exchange Act of 1934, the registrant has duly caused this report to be signed on its behalf by the undersigned thereunto duly authorized.
| Date: August 4, 2005 | /s/ Michael Garin |
| | Michael Garin |
| | Chief Executive Officer |
| | (Duly Authorized Officer) |
| | |
| | |
| Date: August 4, 2005 | /s/ Wallace Macmillan |
| | Wallace Macmillan |
| | Vice President - Finance |
| | (Principal Financial Officer and Accounting Officer) |
Page 69