UNITED STATES
SECURITIES AND EXCHANGE COMMISSION
Washington, D.C. 20549
FORM N-CSRS
CERTIFIED SHAREHOLDER REPORT OF REGISTERED
MANAGEMENT INVESTMENT COMPANIES
Investment Company Act File Number 811-08572
Bishop Street Funds
(Exact name of registrant as specified in charter)
101 Federal Street
Boston, MA 02110
(Address of principal executive offices)
SEI Investments
One Freedom Valley Drive
Oaks, PA 19456
(Name and address of agent for service)
Registrant’s telephone number, including area code: 1-800-262-9565
Date of fiscal year end: December 31, 2012
Date of reporting period: June 30, 2012
| Item 1. | Reports to Stockholders. |
The Funds file their complete schedules of portfolio holdings with the Securities and Exchange Commission (the “Commission”) for the first and third quarters of each fiscal year on Form N-Q within sixty days after the end of the period. The Funds’ Forms N-Q are available on the Commission’s website at http://www.sec.gov, and may be reviewed and copied at the Commission’s Public Reference Room in Washington, DC. Information on the operation of the Public Reference Room may be obtained by calling 1-800-SEC-0330.
A description of the policies and procedures that the Funds use to determine how to vote proxies (if any) relating to portfolio securities is available without charge, by calling 1-800-262-9565 or by visiting the Commission’s website at http://www.sec.gov. Information regarding how the Funds voted proxies relating to portfolio securities during the most recent twelve-month period ended June 30 is available without charge, by calling 1-800-262-9565 or by visiting the Funds’ website at http://www.bishopstreetfunds.com or the website of the Securities and Exchange Commission.
BISHOP STREET
TABLE OF CONTENTS
FUNDS
1
BISHOP STREET
LETTER TO SHAREHOLDERS
FUNDS

Dear Shareholder:
Optimism for a strong U.S. economic recovery and renewed hope for a resolution in Europe helped fuel yet another impressive stock market rally during the first half of 2012; however, renewed crisis in the Euro Zone, a China slowdown, and political uncertainty both here and abroad served to keep optimism muted for the time being. Despite the many challenges facing investors, the S&P 500 produced an impressive 9.5 percent gain during the first six months of the year, proving its resilience once again. Against this back drop, interest rates fell sharply in the second quarter in response to a slowdown in global economic growth, lower oil, lower inflation, and a Fed on hold. Looking ahead, these factors will continue to weigh heavily on the markets. That said, we remain constructive on the U.S. stock market given the strength of corporate balance sheets, financial support pledged by the Central Banks, and steady investor confidence.
Déjà vu all over again
The first quarter of the year was marked by better than expected earnings and economic news. As a result, the S&P 500 Index advanced a surprising 12.6 percent – one of the strongest quarterly returns on record. Meanwhile, U.S. Treasury prices weakened considerably with yields on the 30-year bond rising nearly 45 basis points to 3.34 percent by quarter’s end. Bad news out of the Euro Zone continued to arrive in waves, further fueling fears of a Euro breakup. Banks took center stage once again as fears of another financial system collapse helped reverse the first quarter rally. U.S. economic data remained mixed with most indicating that a slow down was at hand. As a result, the S&P 500 lost 2.8 percent in the second quarter but this was not enough to dampen investor optimism and hope.
Politics and the Unknown
The U.S. now stands at a critical crossroad with the presidential election and leadership issues muddying an already cloudy picture. A sagging economy, growing fiscal deficits, ballooning debt, expiring tax cuts, and key regional political battles all will weigh in to shape our future. Across the Atlantic and Pacific, viable solutions available to the vast array of economic and geopolitical issues are few and far between, and while
2

discussions have been primarily focused on economics, the likely solutions will be politically driven with or without the consent of Germany and France.
A Look Ahead
The Federal Reserve has remained committed to holding interest rates near zero well into 2014, but given the problems in Europe, weakness in China, and a mixed economic picture in the U.S., it is likely that the Fed will be forced to keep interest rates low for even longer and will remain committed to kick-starting housing and reducing unemployment. We believe that this accommodative stance along with greater clarity in the political arena will ultimately provide a platform for holding risky assets during the second half of the year. While economic growth might slow further and unemployment remain high, support from the Fed and the ECB should be enough to avoid a catastrophic end. Accordingly, we continue to favor the U.S. equity market and spread sectors in the fixed income markets.
Benefits of a Balanced Portfolio
While the first six months did produce strong stock market gains, experience continues to support the diversification of your portfolio. Whether enjoying the benefits of growth and higher earnings, or collecting the stable cash flows found in the fixed income markets, a balanced portfolio helps cushion declines while allowing for growth of principal. Therefore, we believe the key to long-term investment success is to hold a well-diversified portfolio tailored to your risk appetite and long-term goals. In this regard we hope that the Bishop Street family of funds will continue to play an important role in your investment program.
Thank you for your continued trust and investment in the Bishop Street Funds.
Sincerely,

Michael K. Hirai, CFA, CPA
President and Chief Investment Officer
Bishop Street Capital Management
July 24, 2012
| | | | |
| June 30, 2012 | | | | www.bishopstreetfunds.com |
3
| | | | |
| Strategic Growth Fund | | | (unaudited) | |
Top Ten Equity Holdings†
| | | | | | |
| | | | | Percentage of
Investments | |
| |
| | | Express Scripts Holding | | | 2.3% | |
| |
| | | Alliance Data Systems | | | 2.2% | |
| |
| | | Herbalife | | | 2.2% | |
| |
| | | TIBCO Software | | | 2.2% | |
| |
| | | Intuit | | | 2.2% | |
| |
| | | Deere | | | 2.2% | |
| |
| | | PetSmart | | | 2.2% | |
| |
| | | Exxon Mobil | | | 2.2% | |
| |
| | | Oracle | | | 2.2% | |
| |
| | | EI du Pont de Nemours | | | 2.2% | |
| |
|
|
† Percentages are based on total investments. Top ten holdings do not include short-term investments. |
Schedule of Investments
| | | | | | | | |
Shares | | | | | Value
(000) | |
| | | | | | | | |
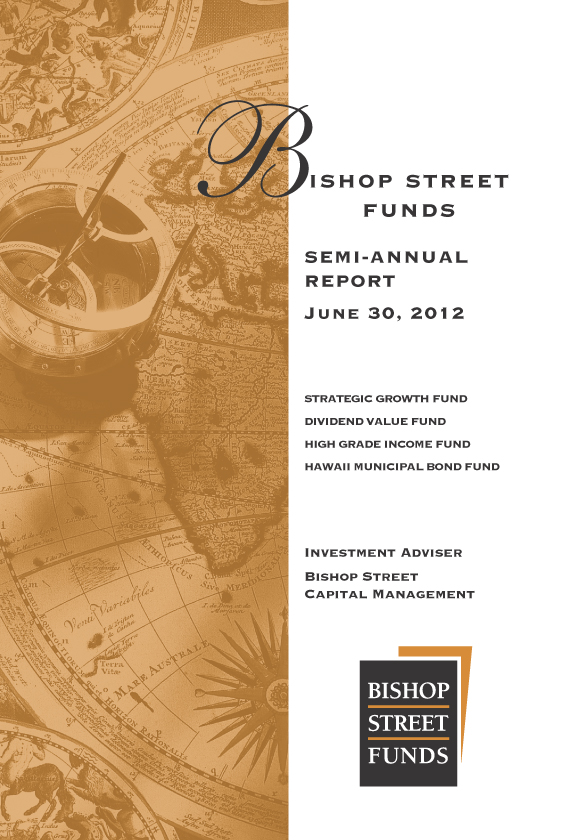
| | COMMON STOCK‡ — 100.1% | |
| Consumer Discretionary — 19.5% | | | | |
| | 2,600 | | | AutoZone* | | $ | 955 | |
| | 14,200 | | | Bed Bath & Beyond* | | | 878 | |
| | 29,900 | | | CBS | | | 980 | |
| | 13,800 | | | Coach | | | 807 | |
| | 16,900 | | | Dollar General* | | | 919 | |
| | 54,400 | | | GameStop | | | 999 | |
| | 15,300 | | | PetSmart | | | 1,043 | |
| | 1,400 | | | priceline.com* | | | 930 | |
| | 22,600 | | | TJX | | | 970 | |
| | 13,300 | | | Yum! Brands | | | 857 | |
| | | | | | | | |
| | | | | | | 9,338 | |
| | | | | | | | |
4
| | | | |
| Strategic Growth Fund | | | (unaudited) | |
Schedule of Investments
(continued)
| | | | | | | | |
Shares | | | | | Value
(000) | |
| | | | | | | | |
| Consumer Staples — 6.1% | | | | |
| | 10,000 | | | Costco Wholesale | | $ | 950 | |
| | 19,800 | | | CVS | | | 925 | |
| | 21,700 | | | Herbalife | | | 1,049 | |
| | | | | | | | |
| | | | | | | 2,924 | |
| | | | | | | | |
| Energy — 5.8% | | | | |
| | 12,100 | | | Exxon Mobil | | | 1,035 | |
| | 13,000 | | | National Oilwell Varco | | | 838 | |
| | 14,100 | | | Schlumberger | | | 915 | |
| | | | | | | | |
| | | | | | | 2,788 | |
| | | | | | | | |
| Financials — 6.1% | | | | |
| | 13,800 | | | ACE | | | 1,023 | |
| | 27,600 | | | Allstate | | | 968 | |
| | 15,800 | | | American Express | | | 920 | |
| | | | | | | | |
| | | | | | | 2,911 | |
| | | | | | | | |
| Health Care — 12.0% | | | | |
| | 23,700 | | | Agilent Technologies | | | 930 | |
| | 23,800 | | | AmerisourceBergen | | | 937 | |
| | 13,700 | | | Celgene* | | | 879 | |
| | 20,500 | | | Cigna | | | 902 | |
| | 19,300 | | | Express Scripts Holding* | | | 1,077 | |
| | 16,800 | | | UnitedHealth Group | | | 983 | |
| | | | | | | | |
| | | | | | | 5,708 | |
| | | | | | | | |
| Industrials — 20.1% | | | | |
| | 9,900 | | | Cummins | | | 960 | |
| | 12,900 | | | Deere | | | 1,043 | |
| | 16,400 | | | Dover | | | 879 | |
| | 20,000 | | | Equifax | | | 932 | |
| | 17,300 | | | Honeywell International | | | 966 | |
| | 17,400 | | | Joy Global | | | 987 | |
| | 13,400 | | | Norfolk Southern | | | 962 | |
| | 10,100 | | | Stericycle* | | | 926 | |
| | 8,300 | | | Union Pacific | | | 990 | |
| | 4,900 | | | W.W. Grainger | | | 937 | |
| | | | | | | | |
| | | | | | | 9,582 | |
| | | | | | | | |
| Information Technology — 26.4% | | | | |
| | 7,800 | | | Alliance Data Systems* | | | 1,053 | |
| | 1,750 | | | Apple* | | | 1,022 | |
| | 23,600 | | | eBay* | | | 991 | |
| | | | |
| June 30, 2012 | | | | www.bishopstreetfunds.com |
5
| | | | |
| Strategic Growth Fund | | | (unaudited) | |
Schedule of Investments
(concluded)
| | | | | | | | |
Shares | | | | | Value
(000) | |
| | | | | | | | |
| Information Technology — (continued) | | | | |
| | 9,700 | | | F5 Networks* | | $ | 966 | |
| | 4,800 | | | International Business Machines | | | 939 | |
| | 17,600 | | | Intuit | | | 1,045 | |
| | 2,150 | | | Mastercard | | | 925 | |
| | 31,100 | | | Microsoft | | | 951 | |
| | 34,800 | | | Oracle | | | 1,034 | |
| | 14,700 | | | Qualcomm | | | 818 | |
| | 35,000 | | | TIBCO Software* | | | 1,047 | |
| | 26,400 | | | VeriFone Systems* | | | 874 | |
| | 28,400 | | | Xilinx | | | 953 | |
| | | | | | | | |
| | | | | | | 12,618 | |
| | | | | | | | |
| Materials — 4.1% | | | | |
| | 4,700 | | | CF Industries Holdings | | | 910 | |
| | 20,400 | | | EI du Pont de Nemours | | | 1,032 | |
| | | | | | | | |
| | | | | | | 1,942 | |
| | | | | | | | |
| | TOTAL COMMON STOCK (Cost $40,606) | | | 47,811 | |
| | | | | | | | |
|
| | SHORT-TERM INVESTMENT (A) — 0% | |
| | 4,747 | | | Dreyfus Cash Management Fund, Institutional Shares, 0.083% | | | 5 | |
| | | | | | | | |
| | TOTAL SHORT-TERM INVESTMENT (Cost $5) | | | 5 | |
| | | | | | | | |
| | TOTAL INVESTMENTS (Cost $40,611) — 100.1% | | $ | 47,816 | |
| | | | | | | | |
Percentages are based on Net Assets of $47,784 ($ Thousands).
| ‡ | More narrow industries are utilized for compliance purposes, whereas broad sectors are utilized for reporting. |
| * | Non-income producing security. |
| (A) | The rate shown is the 7-day effective yield as of June 30, 2012. |
Cost figures are shown in thousands.
The accompanying notes are an integral part of the financial statements.
6
| | | | |
| Dividend Value Fund | | | (unaudited) | |
Top Ten Equity Holdings†
| | | | | | |
| | | | | Percentage of
Investments | |
| |
| | | Philip Morris International | | | 3.4% | |
| |
| | | Verizon Communications | | | 3.3% | |
| |
| | | International Business Machines | | | 3.2% | |
| |
| | | Exxon Mobil | | | 3.0% | |
| |
| | | Microsoft | | | 2.9% | |
| |
| | | AT&T | | | 2.9% | |
| |
| | | Intel | | | 2.8% | |
| |
| | | Merck | | | 2.7% | |
| |
| | | Pfizer | | | 2.7% | |
| |
| | | Bristol-Myers Squibb | | | 2.3% | |
| |
|
|
† Percentages are based on total investments. Top ten holdings do not include short-term investments. |
Schedule of Investments
| | | | | | | | |
Shares | | | | | Value
(000) | |
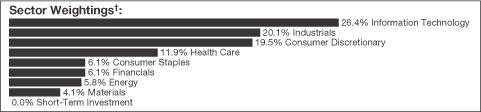
| | COMMON STOCK — 98.3% | |
| Consumer Discretionary — 9.0% | |
| | 21,070 | | | Home Depot | | $ | 1,116 | |
| | 7,495 | | | Limited Brands | | | 319 | |
| | 7,185 | | | Macy’s | | | 247 | |
| | 10,125 | | | Mattel | | | 329 | |
| | 12,090 | | | McDonald’s | | | 1,070 | |
| | 7,970 | | | McGraw-Hill | | | 359 | |
| | 10,320 | | | Meredith | | | 330 | |
| | 6,530 | | | Nordstrom | | | 324 | |
| | 17,360 | | | Time Warner | | | 668 | |
| | | | |
| June 30, 2012 | | | | www.bishopstreetfunds.com |
7
| | | | |
| Dividend Value Fund | | | (unaudited) | |
Schedule of Investments
(continued)
| | | | | | | | |
Shares | | | | | Value
(000) | |
| Consumer Discretionary — (continued) | |
| | 10,265 | | | TJX | | $ | 441 | |
| | | | | | | | |
| | | | | | | 5,203 | |
| | | | | | | | |
| Consumer Staples — 12.3% | |
| | 23,200 | | | Altria Group | | | 802 | |
| | 7,735 | | | Coca-Cola Co. | | | 605 | |
| | 6,995 | | | Diageo PLC | | | 721 | |
| | 9,650 | | | General Mills | | | 372 | |
| | 13,125 | | | HJ Heinz | | | 714 | |
| | 7,970 | | | Kimberly-Clark | | | 668 | |
| | 22,395 | | | Philip Morris International | | | 1,954 | |
| | 11,735 | | | Procter & Gamble | | | 719 | |
| | 8,450 | | | Wal-Mart Stores | | | 589 | |
| | | | | | | | |
| | | | | | | 7,144 | |
| | | | | | | | |
| Energy — 11.0% | |
| | 12,185 | | | Chevron | | | 1,286 | |
| | 6,975 | | | ConocoPhillips | | | 390 | |
| | 20,060 | | | Exxon Mobil | | | 1,717 | |
| | 18,615 | | | Kinder Morgan | | | 600 | |
| | 7,660 | | | Occidental Petroleum | | | 657 | |
| | 10,320 | | | Penn West Petroleum | | | 138 | |
| | 3,485 | | | Phillips 66* | | | 116 | |
| | 15,420 | | | Royal Dutch Shell PLC | | | 1,040 | |
| | 6,730 | | | Schlumberger | | | 437 | |
| | | | | | | | |
| | | | | | | 6,381 | |
| | | | | | | | |
| Financials — 14.0% | |
| | 13,125 | | | American Express | | | 764 | |
| | 13,125 | | | Arthur J Gallagher | | | 460 | |
| | 3,040 | | | BlackRock | | | 516 | |
| | 5,785 | | | Chubb | | | 421 | |
| | 1,460 | | | CME Group | | | 391 | |
| | 5,080 | | | Digital Realty Trust ‡ | | | 381 | |
| | 28,085 | | | JPMorgan Chase | | | 1,003 | |
| | 7,545 | | | MetLife | | | 233 | |
| | 9,840 | | | Northern Trust | | | 453 | |
| | 22,662 | | | People’s United Financial | | | 263 | |
| | 8,260 | | | PNC Financial Services Group | | | 505 | |
| | 5,785 | | | Progressive | | | 121 | |
| | 2,350 | | | Public Storage ‡ | | | 339 | |
| | 2,110 | | | RenaissanceRe Holdings | | | 160 | |
| | 5,245 | | | T Rowe Price Group | | | 330 | |
| | 16,250 | | | Unum Group | | | 311 | |
| | 19,370 | | | US Bancorp | | | 623 | |
8
| | | | |
| Dividend Value Fund | | | (unaudited) | |
Schedule of Investments
(continued)
| | | | | | | | |
Shares | | | | | Value
(000) | |
| Financials — (continued) | |
| | 25,575 | | | Wells Fargo | | $ | 855 | |
| | | | | | | | |
| | | | | | | 8,129 | |
| | | | | | | | |
| Health Care — 14.3% | | | | |
| | 15,755 | | | Abbott Laboratories | | | 1,016 | |
| | 8,225 | | | Amgen | | | 600 | |
| | 37,425 | | | Bristol-Myers Squibb | | | 1,345 | |
| | 25,555 | | | GlaxoSmithKline PLC | | | 1,165 | |
| | 15,005 | | | Johnson & Johnson | | | 1,014 | |
| | 37,515 | | | Merck | | | 1,566 | |
| | 67,160 | | | Pfizer | | | 1,545 | |
| | | | | | | | |
| | | | | | | 8,251 | |
| | | | | | | | |
| Industrials — 8.6% | | | | |
| | 3,880 | | | Boeing | | | 288 | |
| | 3,685 | | | Deere | | | 298 | |
| | 7,970 | | | Dover | | | 427 | |
| | 7,495 | | | Emerson Electric | | | 349 | |
| | 12,770 | | | Honeywell International | | | 713 | |
| | 4,695 | | | Illinois Tool Works | | | 248 | |
| | 5,820 | | | Norfolk Southern | | | 418 | |
| | 5,630 | | | Parker Hannifin | | | 433 | |
| | 10,125 | | | Raytheon | | | 573 | |
| | 10,645 | | | United Technologies | | | 804 | |
| | 12,090 | | | Waste Management | | | 404 | |
| | | | | | | | |
| | | | | | | 4,955 | |
| | | | | | | | |
| Information Technology — 12.4% | | | | |
| | 13,865 | | | Accenture PLC | | | 833 | |
| | 10,125 | | | Automatic Data Processing | | | 564 | |
| | 5,785 | | | Canon | | | 231 | |
| | 60,605 | | | Intel | | | 1,615 | |
| | 9,575 | | | International Business Machines | | | 1,873 | |
| | 55,000 | | | Microsoft | | | 1,682 | |
| | 14,080 | | | Texas Instruments | | | 404 | |
| | | | | | | | |
| | | | | | | 7,202 | |
| | | | | | | | |
| Materials — 5.3% | | | | |
| | 3,755 | | | BHP Billiton | | | 245 | |
| | 13,440 | | | EI du Pont de Nemours | | | 680 | |
| | 9,220 | | | Nucor | | | 349 | |
| | 9,815 | | | RPM International | | | 267 | |
| | 9,400 | | | Sherwin-Williams | | | 1,244 | |
| | 9,575 | | | Sonoco Products | | | 289 | |
| | | | | | | | |
| | | | | | | 3,074 | |
| | | | | | | | |
| | | | |
| June 30, 2012 | | | | www.bishopstreetfunds.com |
9
| | | | |
| Dividend Value Fund | | | (unaudited) | |
Schedule of Investments
(concluded)
| | | | | | | | |
Shares | | | | | Value
(000) | |
| Telecommunication Services — 6.3% | | | | |
| | 46,580 | | | AT&T | | $ | 1,661 | |
| | 42,615 | | | Verizon Communications | | | 1,894 | |
| | 10,805 | | | Windstream | | | 104 | |
| | | | | | | | |
| | | | | | | 3,659 | |
| | | | | | | | |
| Utilities — 5.1% | | | | |
| | 9,385 | | | American Electric Power | | | 375 | |
| | 12,640 | | | CMS Energy | | | 297 | |
| | 5,605 | | | Dominion Resources | | | 303 | |
| | 6,370 | | | National Fuel Gas | | | 299 | |
| | 4,045 | | | NextEra Energy | | | 278 | |
| | 8,028 | | | Northeast Utilities | | | 312 | |
| | 7,040 | | | Sempra Energy | | | 485 | |
| | 9,955 | | | Westar Energy | | | 298 | |
| | 8,145 | | | Wisconsin Energy | | | 322 | |
| | | | | | | | |
| | | | | | | 2,969 | |
| | | | | | | | |
| | TOTAL COMMON STOCK (Cost $46,340) | | | 56,967 | |
| | | | | | | | |
|
| | PREFERRED STOCK — 0.4% | |
| Financials — 0.4% | | | | |
| | 1,865 | | | Fifth Third Bancorp, 8.50% | | | 255 | |
| | | | | | | | |
| | TOTAL PREFERRED STOCK (Cost $276) | | | 255 | |
| | | | | | | | |
|
| | SHORT-TERM INVESTMENT (A) — 1.2% | |
| | 692,390 | | | Dreyfus Cash Management Fund, Institutional Shares, 0.083% | | | 692 | |
| | | | | | | | |
| | TOTAL SHORT-TERM INVESTMENT (Cost $692) | | | 692 | |
| | | | | | | | |
| | TOTAL INVESTMENTS (Cost $47,308) — 99.9% | | $ | 57,914 | |
| | | | | | | | |
Percentages are based on Net Assets of $57,979 ($ Thousands).
| ‡ | Real Estate Investment Trust |
| * | Non-income producing security. |
| (A) | The rate shown is the 7-day effective yield as of June 30, 2012. |
PLC — Public Limited Company
Cost figures are shown in thousands.
The accompanying notes are an integral part of the financial statements.
10
| | | | |
| High Grade Income Fund | | | (unaudited) | |
Top Ten Holdings†
| | | | | | | | | | | | | | |
| | | | | Coupon
Rate | | | Maturity
Date | | | Percentage
of
Investments | |
| |
| | | U.S. Treasury Note | | | 0.125% | | | | 08/31/13 | | | | 2.4% | |
| |
| | | U.S. Treasury Bond | | | 4.500% | | | | 08/15/39 | | | | 2.3% | |
| |
| | | U.S. Treasury Bond | | | 4.750% | | | | 02/15/37 | | | | 2.0% | |
| |
| | | U.S. Treasury Note | | | 0.250% | | | | 09/15/14 | | | | 1.9% | |
| |
| | | IBM | | | 8.375% | | | | 11/01/19 | | | | 1.6% | |
| |
| | | California State, Build America Bonds | | | 7.550% | | | | 04/01/39 | | | | 1.6% | |
| |
| | | Boston Properties | | | 5.625% | | | | 11/15/20 | | | | 1.6% | |
| |
| | | U.S. Treasury Bond | | | 4.375% | | | | 05/15/41 | | | | 1.5% | |
| |
| | | Rio Tinto Finance USA | | | 9.000% | | | | 05/01/19 | | | | 1.5% | |
| |
| | | Caterpillar | | | 7.900% | | | | 12/15/18 | | | | 1.5% | |
|
|
† Percentages are based on total investments. Top ten holdings do not include short-term investments. |
Schedule of Investments
| | | | | | | | |
Face
Amount
(000) | | | | | Value
(000) | |
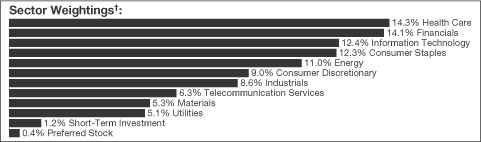
| | | | CORPORATE OBLIGATIONS — 49.5% | | | | |
| Consumer Discretionary — 2.6% | | | | |
| | | | AutoZone | | | | |
| $ | 525 | | | 4.000%, 11/15/20 | | $ | 561 | |
| | | | Home Depot | | | | |
| | 700 | | | 5.875%, 12/16/36 | | | 897 | |
| | | | Johnson Controls | | | | |
| | 500 | | | 4.250%, 03/01/21 | | | 537 | |
| | | | McDonald’s MTN | | | | |
| | 350 | | | 1.875%, 05/29/19 | | | 349 | |
| | | | | | | | |
| | | | | | | 2,344 | |
| | | | | | | | |
| | | | |
| June 30, 2012 | | | | www.bishopstreetfunds.com |
11
| | | | |
| High Grade Income Fund | | | (unaudited) | |
Schedule of Investments
(continued)
| | | | | | | | |
Face
Amount
(000) | | | | | Value
(000) | |
| Consumer Staples — 5.3% | | | | |
| | | | Bunge Finance | | | | |
| $ | 500 | | | 8.500%, 06/15/19 | | $ | 624 | |
| | | | Campbell Soup | | | | |
| | 500 | | | 4.250%, 04/15/21 | | | 566 | |
| | | | Genentech | | | | |
| | 1,000 | | | 4.750%, 07/15/15 | | | 1,105 | |
| | | | PepsiAmericas | | | | |
| | 650 | | | 4.875%, 01/15/15 | | | 714 | |
| | | | Teva Pharmaceutical Finance BV | | | | |
| | 500 | | | 2.400%, 11/10/16 | | | 517 | |
| | | | Wal-Mart Stores | | | | |
| | 1,000 | | | 5.375%, 04/05/17 | | | 1,188 | |
| | | | | | | | |
| | | | | | | 4,714 | |
| | | | | | | | |
| Energy — 5.2% | | | | |
| | | | Cameron International | | | | |
| | 375 | | | 4.500%, 06/01/21 | | | 401 | |
| | | | Devon Energy | | | | |
| | 1,000 | | | 6.300%, 01/15/19 | | | 1,229 | |
| | | | Halliburton | | | | |
| | 1,000 | | | 6.150%, 09/15/19 | | | 1,236 | |
| | | | Hess | | | | |
| | 400 | | | 8.125%, 02/15/19 | | | 515 | |
| | | | Kinder Morgan Energy Partners | | | | |
| | 710 | | | 9.000%, 02/01/19 | | | 917 | |
| | | | Occidental Petroleum | | | | |
| | 375 | | | 2.700%, 02/15/23 | | | 377 | |
| | | | | | | | |
| | | | | | | 4,675 | |
| | | | | | | | |
| Financials — 16.0% | | | | |
| | | | Aflac | | | | |
| | 1,000 | | | 8.500%, 05/15/19 | | | 1,305 | |
| | | | American Express Credit MTN | | | | |
| | 500 | | | 5.875%, 05/02/13 | | | 521 | |
| | 545 | | | 2.375%, 03/24/17 | | | 559 | |
| | | | Aon | | | | |
| | 500 | | | 3.125%, 05/27/16 | | | 521 | |
| | | | Bank of America MTN | | | | |
| | 1,050 | | | 4.900%, 05/01/13 | | | 1,074 | |
| | | | Bank of New York Mellon MTN | | | | |
| | 500 | | | 4.150%, 02/01/21 | | | 552 | |
| | | | Boston Properties | | | | |
| | 1,200 | | | 5.625%, 11/15/20 ‡ | | | 1,380 | |
12
| | | | |
| High Grade Income Fund | | | (unaudited) | |
Schedule of Investments
(continued)
| | | | | | | | |
Face
Amount
(000) | | | | | Value
(000) | |
| Financials — (continued) | | | | |
| | | | Capital One Financial | | | | |
| $ | 1,000 | | | 7.375%, 05/23/14 | | $ | 1,098 | |
| | | | Citigroup | | | | |
| | 1,100 | | | 6.500%, 08/19/13 | | | 1,153 | |
| | | | Daimler Finance North America LLC | | | | |
| | 840 | | | 6.500%, 11/15/13 | | | 900 | |
| | | | Eksportfinans ASA MTN | | | | |
| | 600 | | | 1.875%, 04/02/13 | | | 588 | |
| | | | General Electric Capital MTN | | | | |
| | 625 | | | 6.150%, 08/07/37 | | | 738 | |
| | | | Goldman Sachs Group MTN | | | | |
| | 500 | | | 7.500%, 02/15/19 | | | 570 | |
| | 550 | | | 0.866%, 07/22/15 (A) | | | 508 | |
| | | | JPMorgan Chase | | | | |
| | 450 | | | 3.150%, 07/05/16 | | | 463 | |
| | | | JPMorgan Chase Capital XXVII, Ser AA | | | | |
| | 1,000 | | | 7.000%, 11/01/39 | | | 1,000 | |
| | | | Svensk Exportkredit AB | | | | |
| | 1,000 | | | 2.125%, 07/13/16 | | | 1,029 | |
| | | | Toyota Motor Credit MTN | | | | |
| | 400 | | | 2.800%, 01/11/16 | | | 420 | |
| | | | | | | | |
| | | | | | | 14,379 | |
| | | | | | | | |
| Health Care — 4.3% | | | | |
| | | | Aristotle Holding | | | | |
| | 500 | | | 2.650%, 02/15/17 (B) | | | 509 | |
| | | | AstraZeneca PLC | | | | |
| | 1,000 | | | 5.900%, 09/15/17 | | | 1,201 | |
| | | | Gilead Sciences | | | | |
| | 875 | | | 3.050%, 12/01/16 | | | 924 | |
| | | | Merck | | | | |
| | 1,000 | | | 5.000%, 06/30/19 | | | 1,199 | |
| | | | | | | | |
| | | | | | | 3,833 | |
| | | | | | | | |
| Industrials — 1.5% | | | | |
| | | | Caterpillar | | | | |
| | 1,000 | | | 7.900%, 12/15/18 | | | 1,348 | |
| | | | | | | | |
| Information Technology — 6.8% | | | | |
| | | | BMC Software | | | | |
| | 760 | | | 7.250%, 06/01/18 | | | 915 | |
| | | | Dell | | | | |
| | 400 | | | 5.625%, 04/15/14 | | | 433 | |
| | | | |
| June 30, 2012 | | | | www.bishopstreetfunds.com |
13
| | | | |
| High Grade Income Fund | | | (unaudited) | |
Schedule of Investments
(continued)
| | | | | | | | |
Face
Amount
(000) | | | | | Value
(000) | |
| Information Technology — (continued) | | | | |
| | | | Hewlett-Packard | | | | |
| $ | 1,000 | | | 2.125%, 09/13/15 | | $ | 1,008 | |
| | | | IBM | | | | |
| | 1,000 | | | 8.375%, 11/01/19 | | | 1,425 | |
| | | | News America | | | | |
| | 500 | | | 6.650%, 11/15/37 | | | 584 | |
| | | | Symantec | | | | |
| | 1,100 | | | 2.750%, 09/15/15 | | | 1,130 | |
| | | | Xerox | | | | |
| | 500 | | | 8.250%, 05/15/14 | | | 558 | |
| | | | | | | | |
| | | | | | | 6,053 | |
| | | | | | | | |
| Materials — 4.7% | | | | |
| | | | BHP Billiton Finance | | | | |
| | 950 | | | 5.250%, 12/15/15 | | | 1,084 | |
| | | | Monsanto | | | | |
| | 700 | | | 7.375%, 08/15/12 | | | 705 | |
| | | | Nucor | | | | |
| | 1,000 | | | 4.875%, 10/01/12 | | | 1,009 | |
| | | | Rio Tinto Finance USA | | | | |
| | 1,000 | | | 9.000%, 05/01/19 | | | 1,367 | |
| | | | | | | | |
| | | | | | | 4,165 | |
| | | | | | | | |
| Telecommunication Services — 1.4% | | | | |
| | | | Alltel | | | | |
| | 250 | | | 7.000%, 03/15/16 | | | 299 | |
| | | | AT&T | | | | |
| | 305 | | | 5.500%, 02/01/18 | | | 362 | |
| | | | Cellco Partnership | | | | |
| | 450 | | | 8.500%, 11/15/18 | | | 616 | |
| | | | | | | | |
| | | | | | | 1,277 | |
| | | | | | | | |
| Transportation Services — 1.0% | | | | |
| | | | Continental Airlines | | | | |
| | 796 | | | 9.000%, 07/08/16 | | | 912 | |
| | | | | | | | |
| Utilities — 0.7% | | | | |
| | | | Potomac Edison | | | | |
| | 600 | | | 5.350%, 11/15/14 | | | 653 | |
| | | | | | | | |
| | TOTAL CORPORATE OBLIGATIONS (Cost $41,028) | | | 44,353 | |
| | | | | | | | |
14
| | | | |
| High Grade Income Fund | | | (unaudited) | |
Schedule of Investments
(continued)
| | | | | | | | |
Face
Amount
(000) | | | | | Value
(000) | |
| | U.S. TREASURY OBLIGATIONS — 26.6% | |
| | | | U.S. Treasury Bond | | | | |
| $ | 700 | | | 7.250%, 05/15/16 | | $ | 878 | |
| | 800 | | | 6.000%, 02/15/26 | | | 1,173 | |
| | 500 | | | 5.375%, 02/15/31 | | | 729 | |
| | 1,250 | | | 4.750%, 02/15/37 | | | 1,743 | |
| | 1,500 | | | 4.500%, 08/15/39 | | | 2,035 | |
| | 1,025 | | | 4.375%, 05/15/41 | | | 1,369 | |
| | 850 | | | 3.125%, 11/15/41 | | | 914 | |
| | | | U.S. Treasury Note | | | | |
| | 1,000 | | | 4.250%, 08/15/13 | | | 1,044 | |
| | 575 | | | 3.750%, 11/15/18 | | | 674 | |
| | 350 | | | 3.625%, 02/15/21 | | | 413 | |
| | 625 | | | 3.125%, 10/31/16 | | | 691 | |
| | 500 | | | 3.125%, 01/31/17 | | | 555 | |
| | 600 | | | 2.875%, 03/31/18 | | | 667 | |
| | 405 | | | 2.625%, 04/30/16 | | | 437 | |
| | 650 | | | 2.375%, 10/31/14 | | | 680 | |
| | 1,000 | | | 2.375%, 02/28/15 | | | 1,052 | |
| | 500 | | | 2.375%, 07/31/17 | | | 540 | |
| | 1,000 | | | 2.125%, 05/31/15 | | | 1,049 | |
| | 500 | | | 2.125%, 08/15/21 | | | 525 | |
| | 1,000 | | | 2.000%, 11/15/21 | | | 1,037 | |
| | 1,000 | | | 1.375%, 02/28/19 | | | 1,021 | |
| | 800 | | | 1.000%, 01/15/14 | | | 808 | |
| | 1,700 | | | 0.250%, 09/15/14 | | | 1,696 | |
| | 2,145 | | | 0.125%, 08/31/13 | | | 2,141 | |
| | | | | | | | |
| | TOTAL U.S. TREASURY OBLIGATIONS (Cost $22,059) | | | 23,871 | |
| | | | | | | | |
| | |
| | | | MUNICIPAL BONDS — 9.0% | | | | |
| | | | Arizona Public Service | | | | |
| | 500 | | | 6.250%, 08/01/16 | | | 586 | |
| | | | California State, Build America Bonds, GO | | | | |
| | 1,100 | | | 7.550%, 04/01/39 | | | 1,415 | |
| | | | City of Minneapolis Minnesota, GO | | | | |
| | 250 | | | 4.900%, 03/01/25 | | | 280 | |
| | 300 | | | 4.800%, 03/01/24 | | | 336 | |
| | | | City of New York New York, GO | | | | |
| | 300 | | | 5.817%, 10/01/31 | | | 337 | |
| | | | Connecticut State, GO | | | | |
| | 800 | | | 5.295%, 10/01/29 | | | 933 | |
| | | | |
| June 30, 2012 | | | | www.bishopstreetfunds.com |
15
| | | | |
| High Grade Income Fund | | | (unaudited) | |
Schedule of Investments
(continued)
| | | | | | | | |
Face
Amount
(000) | | | | | Value
(000) | |
| | | | MUNICIPAL BONDS (continued) | | | | |
| | | | Hawaii State, GO | | | | |
| $ | 700 | | | 5.480%, 02/01/28 | | $ | 846 | |
| | | | Honolulu Hawaii City & County, Build America Bonds, GO | | | | |
| | 435 | | | 6.300%, 09/01/34 | | | 492 | |
| | | | Houston Independent School District, GO | | | | |
| | 250 | | | 6.125%, 02/15/28 | | | 295 | |
| | | | St. Louis School District, Qualified School Construction Boards, GO | | | | |
| | 1,070 | | | 6.100%, 04/01/25 | | | 1,333 | |
| | | | Tennessee State, School Bond Authority, GO | | | | |
| | 500 | | | 4.848%, 09/15/27 | | | 565 | |
| | | | Utah State, Ser B, GO | | | | |
| | 575 | | | 3.369%, 07/01/21 | | | 623 | |
| | | | | | | | |
| | TOTAL MUNICIPAL BONDS (Cost $7,384) | | | 8,041 | |
| | | | | | | | |
|
| | U.S. GOVERNMENT AGENCY OBLIGATIONS — 7.7% | |
| | | | FHLB | | | | |
| | 1,100 | | | 5.125%, 03/10/17 | | | 1,307 | |
| | 1,000 | | | 4.125%, 03/13/20 | | | 1,181 | |
| | 1,100 | | | 3.750%, 12/14/18 | | | 1,262 | |
| | | | FHLMC | | | | |
| | 875 | | | 8.250%, 06/01/16 | | | 1,078 | |
| | | | FHLMC MTN | | | | |
| | 1,000 | | | 4.250%, 05/22/13 | | | 1,035 | |
| | | | FNMA | | | | |
| | 1,000 | | | 0.750%, 02/07/14 | | | 1,005 | |
| | | | | | | | |
| | TOTAL U.S. GOVERNMENT AGENCY OBLIGATIONS (Cost $6,481) | | | 6,868 | |
| | | | | | | | |
|
| | U.S. GOVERNMENT MORTGAGE-BACKED OBLIGATIONS — 2.0% | |
| | | | FNMA, Ser 2003-33, Cl AB | | | | |
| | 845 | | | 3.750%, 03/25/33 | | | 882 | |
| | | | FNMA, Ser 889958 | | | | |
| | 236 | | | 5.000%, 10/01/23 | | | 255 | |
| | | | FNMA REMIC, Ser 2007-B1, Cl BE | | | | |
| | 269 | | | 5.450%, 12/25/20 | | | 277 | |
| | | | GNMA, Ser 2003-7, Cl PE | | | | |
| | 340 | | | 5.500%, 11/16/31 | | | 351 | |
| | | | | | | | |
| | TOTAL U.S. GOVERNMENT MORTGAGE-BACKED OBLIGATIONS (Cost $1,694) | | | 1,765 | |
| | | | | | | | |
16
| | | | |
| High Grade Income Fund | | | (unaudited) | |
Schedule of Investments
(concluded)
| | | | | | | | |
Face
Amount
(000)/Shares | | | | | Value
(000) | |
| | ASSET-BACKED SECURITY — 1.3% | |
| | | | GSR Mortgage Loan Trust, Ser 2004-4, Cl 3A2 | | | | |
| $ | 1,209 | | | 2.050%, 04/25/32 (A) | | $ | 1,204 | |
| | | | | | | | |
| | TOTAL ASSET-BACKED SECURITY (Cost $1,077) | | | 1,204 | |
| | | | | | | | |
|
| | SHORT-TERM INVESTMENT (C) — 3.1% | |
| | 2,828,515 | | | Dreyfus Cash Management Fund, Institutional Shares, 0.083% | | | 2,829 | |
| | | | | | | | |
| | TOTAL SHORT-TERM INVESTMENT (Cost $2,829) | | | 2,829 | |
| | | | | | | | |
| | TOTAL INVESTMENTS (Cost $82,552) — 99.2% | | $ | 88,931 | |
| | | | | | | | |
Percentages are based on Net Assets of $89,616 ($ Thousands).
| ‡ | Real Estate Investment Trust |
| (A) | Floating Rate Security — The rate reflected on the Schedule of Investments is the rate in effect on June 30, 2012. The maturity date shown is the final maturity date. |
| (B) | Security exempt from registration under Rule 144A of the Securities Act of 1933. These securities may be resold in transactions exempt from registration, normally to qualified institutions. At June 30, 2012, these securities amounted to $509 ($ Thousands), representing 0.57% of net assets of the Fund. |
| (C) | The rate shown is the 7-day effective yield as of June 30, 2012. |
Cl — Class
FHLB — Federal Home Loan Bank
FHLMC — Federal Home Loan Mortgage Corporation
FNMA — Federal National Mortgage Corporation
GNMA — Government National Mortgage Corporation
GO — General Obligation
LLC — Limited Liability Corporation
MTN — Medium Term Note
PLC — Public Limited Company
REMIC — Real Estate Mortgage Investment Conduit
Ser — Series
Cost figures are shown in thousands.
The accompanying notes are an integral part of the financial statements.
| | | | |
| June 30, 2012 | | | | www.bishopstreetfunds.com |
17
| | | | |
| Hawaii Municipal Bond Fund | | | (unaudited) | |
Top Ten Holdings†
| | | | | | | | | | | | | | |
| | | | | Coupon
Rate | | | Maturity
Date | | | Percentage
of
Investments | |
| |
| | | Hawaii State, Housing Finance & Development, RB | | | 5.350% | | | | 07/01/18 | | | | 2.2% | |
| |
| | | Hawaii State, RB | | | 5.250% | | | | 07/01/27 | | | | 1.9% | |
| |
| | | Hawaii State, RB | | | 5.000% | | | | 07/01/16 | | | | 1.7% | |
| |
| | | Hawaii State, RB | | | 5.000% | | | | 01/01/25 | | | | 1.5% | |
| |
| | | Honolulu Hawaii City & County, Board of Water Supply, RB | | | 5.000% | | | | 07/01/26 | | | | 1.4% | |
| |
| | | Hawaii State, Housing Finance & Development, RB | | | 6.500% | | | | 07/01/33 | | | | 1.4% | |
| |
| | | Honolulu Hawaii City & County, GO | | | 5.000% | | | | 07/01/21 | | | | 1.4% | |
| |
| | | Honolulu Hawaii City & County, Board of Water Supply, RB | | | 5.000% | | | | 07/01/14 | | | | 1.4% | |
| |
| | | University of Hawaii, RB | | | 4.500% | | | | 07/15/23 | | | | 1.4% | |
| |
| | | Honolulu Hawaii City & County, GO | | | 5.000% | | | | 07/01/17 | | | | 1.4% | |
| |
|
|
† Percentages are based on total investments. Top ten holdings do not include short-term investments. |
Schedule of Investments
| | | | | | | | |
Face
Amount
(000) | | | | | Value
(000) | |
| | MUNICIPAL BONDS — 98.5% | |
| Alaska — 0.9% | | | | |
| | | | Alaska Municipal Bond Bank Authority, Ser 3, RB, Bond Bank Moral Obligation Insured | | | | |
| $ | 1,000 | | | 5.000%, 09/01/22 | | $ | 1,225 | |
18
| | | | |
| Hawaii Municipal Bond Fund | | | (unaudited) | |
Schedule of Investments
(continued)
| | | | | | | | |
Face
Amount
(000) | | | | | Value
(000) | |
| Alaska (continued) | |
| | | | City of Anchorage Alaska, Water Department, RB, NPFGC Insured | | | | |
| $ | 200 | | | 5.000%, 05/01/37 | | $ | 213 | |
| | | | | | | | |
| | | | | | | 1,438 | |
| | | | | | | | |
| Arizona — 1.5% | | | | |
| | | | City of Glendale Arizona, Water and Sewer, RB | | | | |
| | 1,000 | | | 5.000%, 07/01/23 | | | 1,202 | |
| | | | City of Mesa Arizona, GO | | | | |
| | 1,000 | | | 4.250%, 07/01/31 | | | 1,068 | |
| | | | | | | | |
| | | | | | | 2,270 | |
| | | | | | | | |
| California — 1.9% | | | | |
| | | | California Health Facilities Financing Authority, Stanford Hospital,
Ser B, RB | | | | |
| | 1,000 | | | 5.000%, 11/15/25 | | | 1,148 | |
| | | | California State, GO | | | | |
| | 1,000 | | | 5.000%, 04/01/38 | | | 1,049 | |
| | | | California State, GO, AGM Insured | | | | |
| | 800 | | | 4.500%, 12/01/32 | | | 810 | |
| | | | | | | | |
| | | | | | | 3,007 | |
| | | | | | | | |
| Colorado — 0.4% | | | | |
| | | | Denver City & County, School District No. 1, GO | | | | |
| | 500 | | | 5.000%, 12/01/24 | | | 605 | |
| | | | | | | | |
| Georgia — 0.7% | | | | |
| | | | Main Street, Natural Gas, Ser B, RB | | | | |
| | 1,000 | | | 5.000%, 03/15/18 | | | 1,084 | |
| | | | | | | | |
| Hawaii — 80.7% | | | | |
| | | | Hawaii County, Ser A, GO | | | | |
| | 500 | | | 4.000%, 03/01/22 | | | 560 | |
| | | | Hawaii County, Ser A, GO, AGM Insured | | | | |
| | 125 | | | 5.000%, 07/15/21 | | | 131 | |
| | 1,500 | | | 5.000%, 07/15/23 | | | 1,565 | |
| | | | Hawaii County, Ser A, GO, NPFGC Insured | | | | |
| | 1,055 | | | 5.250%, 07/15/18 | | | 1,150 | |
| | 1,000 | | | 5.000%, 07/15/24 | | | 1,074 | |
| | | | Hawaii County, Unlimited Public Improvements, Ser A, GO | | | | |
| | 1,000 | | | 5.000%, 07/15/22 | | | 1,162 | |
| | | | Hawaii County, Unlimited Public Improvements, Ser A, GO,
AMBAC Insured | | | | |
| | 1,000 | | | 5.000%, 07/15/15 | | | 1,126 | |
| | | | |
| June 30, 2012 | | | | www.bishopstreetfunds.com |
19
| | | | |
| Hawaii Municipal Bond Fund | | | (unaudited) | |
Schedule of Investments
(continued)
| | | | | | | | |
Face
Amount
(000) | | | | | Value
(000) | |
| Hawaii — (continued) | | | | |
| | | | Hawaii Pacific Health, Ser A, RB | | | | |
| $ | 1,000 | | | 4.625%, 07/01/21 | | $ | 1,106 | |
| | | | Hawaii State, Airport System, RB, AGM Insured | | | | |
| | 1,000 | | | 5.250%, 07/01/27 | | | 1,149 | |
| | | | Hawaii State, Airport System, Ser A, RB | | | | |
| | 2,500 | | | 5.250%, 07/01/27 | | | 2,901 | |
| | 200 | | | 5.250%, 07/01/30 | | | 229 | |
| | 1,250 | | | 5.000%, 07/01/22 | | | 1,474 | |
| | | | Hawaii State, Airport System, RB, AMT | | | | |
| | 15 | | | 6.900%, 07/01/12 | | | 15 | |
| | 1,500 | | | 4.125%, 07/01/24 | | | 1,578 | |
| | 1,000 | | | 3.000%, 07/01/17 | | | 1,049 | |
| | | | Hawaii State, Department of Budget & Finance, Chaminade University, RB, Radian Insured | | | | |
| | 1,000 | | | 4.750%, 01/01/36 | | | 1,020 | |
| | | | Hawaii State, Department of Budget & Finance, Electric Company Project, Ser A, RB, AMT, AMBAC Insured | | | | |
| | 445 | | | 5.100%, 09/01/32 | | | 445 | |
| | | | Hawaii State, Department of Budget & Finance, Electric Company Project, Ser A, RB, AMT, FGIC Insured | | | | |
| | 750 | | | 4.800%, 01/01/25 | | | 765 | |
| | 1,000 | | | 4.650%, 03/01/37 | | | 1,013 | |
| | | | Hawaii State, Department of Budget & Finance, Electric Company Project, Ser A, RB, AMT, NPFGC Insured | | | | |
| | 1,250 | | | 5.650%, 10/01/27 | | | 1,267 | |
| | | | Hawaii State, Department of Budget & Finance, Mid Pacific Institute, RB, Radian Insured | | | | |
| | 1,000 | | | 5.000%, 01/01/26 | | | 1,027 | |
| | | | Hawaii State, Department of Budget & Finance, RB | | | | |
| | 300 | | | 3.600%, 11/15/20 | | | 300 | |
| | 300 | | | 3.350%, 11/15/19 | | | 300 | |
| | | | Hawaii State, Department of Hawaiian Home Lands, Kapolei Office Facilities, Ser A, COP, AGM Insured | | | | |
| | 2,000 | | | 5.000%, 11/01/31 | | | 2,159 | |
| | | | Hawaii State, Harbor System, Ser A, RB | | | | |
| | 1,125 | | | 4.250%, 07/01/21 | | | 1,248 | |
| | | | Hawaii State, Harbor System, Ser A, RB, AMT, AGM Insured | | | | |
| | 370 | | | 5.750%, 07/01/29 | | | 371 | |
| | | | Hawaii State, Harbor System, Ser B, RB, AMT, AGM Insured | | | | |
| | 1,000 | | | 5.000%, 01/01/13 | | | 1,021 | |
| | 500 | | | 5.000%, 01/01/23 | | | 517 | |
| | | | Hawaii State, Harbor System, Ser B, RB, AMT, AMBAC Insured | | | | |
| | 200 | | | 5.500%, 07/01/19 | | | 200 | |
20
| | | | |
| Hawaii Municipal Bond Fund | | | (unaudited) | |
Schedule of Investments
(continued)
| | | | | | | | |
Face
Amount
(000) | | | | | Value
(000) | |
| Hawaii — (continued) | | | | |
| | | | Hawaii State, Highway, RB | | | | |
| $ | 500 | | | 5.750%, 01/01/28 | | $ | 587 | |
| | 605 | | | 5.500%, 07/01/18 | | | 749 | |
| | 1,000 | | | 5.500%, 01/01/25 | | | 1,171 | |
| | | | Hawaii State, Highway, RB, BHAC Insured | | | | |
| | 550 | | | 4.750%, 01/01/22 | | | 634 | |
| | | | Hawaii State, Highway, Ser A, RB | | | | |
| | 2,000 | | | 5.000%, 01/01/25 | | | 2,399 | |
| | 1,300 | | | 5.000%, 01/01/31 | | | 1,505 | |
| | | | Hawaii State, Highway, Ser A, RB, AGM Insured | | | | |
| | 500 | | | 5.000%, 07/01/19 | | | 555 | |
| | 1,000 | | | 5.000%, 07/01/21 | | | 1,103 | |
| | 1,565 | | | 5.000%, 07/01/22 | | | 1,721 | |
| | | | Hawaii State, Highway, Ser B, RB, AGM Insured | | | | |
| | 1,250 | | | 5.250%, 07/01/18 | | | 1,529 | |
| | 1,600 | | | 5.250%, 07/01/19 | | | 1,980 | |
| | 2,300 | | | 5.000%, 07/01/16 | | | 2,583 | |
| | | | Hawaii State, Housing Finance & Development, Kuhio Park Terrace Multi-Family Housing, Ser A, RB, FHLMC Insured | | | | |
| | 200 | | | 3.900%, 04/01/22 | | | 213 | |
| | 115 | | | 3.750%, 04/01/21 | | | 123 | |
| | 180 | | | 3.500%, 04/01/20 | | | 190 | |
| | 115 | | | 3.000%, 04/01/18 | | | 120 | |
| | | | Hawaii State, Housing Finance & Development, Rental Housing System, Ser B, RB, AGM Insured | | | | |
| | 2,000 | | | 6.500%, 07/01/33 | | | 2,219 | |
| | | | Hawaii State, Housing Finance & Development, Single-Family Housing, Ser A, RB, AMT, FNMA Collateral Insured | | | | |
| | 475 | | | 5.400%, 07/01/30 | | | 475 | |
| | 3,355 | | | 5.350%, 07/01/18 | | | 3,357 | |
| | | | Hawaii State, Housing Finance & Development, Single-Family Housing, Ser B, RB, GNMA/FNMA Insured | | | | |
| | 500 | | | 3.450%, 01/01/22 | | | 516 | |
| | | | Hawaii State, Improvements Authority, Ser DF, GO, AMBAC Insured | | | | |
| | 1,250 | | | 5.000%, 07/01/18 | | | 1,401 | |
| | 1,250 | | | 5.000%, 07/01/21 | | | 1,391 | |
| | | | Hawaii State, Ser CM, GO, AGM Insures FGIC Insured | | | | |
| | 1,000 | | | 6.500%, 12/01/14 | | | 1,143 | |
| | | | Hawaii State, Ser DA, GO, NPFGC Insured | | | | |
| | 425 | | | 5.250%, 09/01/13 , Pre-Refunded @ 100 (A) | | | 449 | |
| | 425 | | | 5.250%, 09/01/23 | | | 447 | |
| | | | |
| June 30, 2012 | | | | www.bishopstreetfunds.com |
21
| | | | |
| Hawaii Municipal Bond Fund | | | (unaudited) | |
Schedule of Investments
(continued)
| | | | | | | | |
Face
Amount
(000) | | | | | Value
(000) | |
| Hawaii — (continued) | | | | |
| | | | Hawaii State, Ser DB, GO, NPFGC Insured | | | | |
| $ | 230 | | | 5.250%, 09/01/13 , Pre-Refunded @ 100 (A) | | $ | 243 | |
| | 770 | | | 5.250%, 09/01/16 | | | 815 | |
| | | | Hawaii State, Ser DD, GO, NPFGC Insured | | | | |
| | 260 | | | 5.250%, 05/01/14 , Pre-Refunded @ 100 (A) | | | 283 | |
| | | | Hawaii State, Ser DF, GO, AMBAC Insured | | | | |
| | 30 | | | 5.000%, 07/01/15 , Pre-Refunded @ 100 (A) | | | 34 | |
| | 60 | | | 5.000%, 07/01/22 | | | 67 | |
| | | | Hawaii State, Ser DG, GO, AMBAC Insured | | | | |
| | 1,000 | | | 5.000%, 07/01/16 | | | 1,131 | |
| | | | Hawaii State, Ser DI, GO, AGM Insured | | | | |
| | 500 | | | 5.000%, 03/01/24 | | | 565 | |
| | 1,500 | | | 5.000%, 03/01/25 | | | 1,689 | |
| | | | Hawaii State, Ser DK, GO | | | | |
| | 475 | | | 5.000%, 05/01/25 | | | 546 | |
| | | | Hawaii State, Ser DN, GO | | | | |
| | 200 | | | 5.250%, 08/01/25 | | | 236 | |
| | | | Hawaii State, Ser DO, GO | | | | |
| | 850 | | | 5.000%, 08/01/17 | | | 1,016 | |
| | | | Hawaii State, Ser DR, GO | | | | |
| | 1,000 | | | 5.000%, 06/01/17 | | | 1,191 | |
| | | | Hawaii State, Ser DT, GO | | | | |
| | 250 | | | 5.000%, 11/01/19 | | | 309 | |
| | 175 | | | 4.500%, 11/01/19 | | | 210 | |
| | | | Hawaii State, Ser DY, GO | | | | |
| | 750 | | | 5.000%, 02/01/19 | | | 915 | |
| | 710 | | | 5.000%, 02/01/20 | | | 875 | |
| | | | Hawaii State, Ser DZ, GO | | | | |
| | 1,000 | | | 5.000%, 12/01/17 | | | 1,205 | |
| | 190 | | | 5.000%, 12/01/24 | | | 231 | |
| | 250 | | | 5.000%, 12/01/28 | | | 294 | |
| | 1,000 | | | 5.000%, 12/01/29 | | | 1,171 | |
| | 1,100 | | | 4.000%, 12/01/30 | | | 1,176 | |
| | | | Hawaii State, Ser EA, GO | | | | |
| | 1,000 | | | 5.000%, 12/01/22 | | | 1,238 | |
| | 500 | | | 3.000%, 12/01/20 | | | 545 | |
| | | | Hawaii State, Unlimited Public Improvements, Ser DD, GO, NPFGC Insured | | | | |
| | 1,000 | | | 5.000%, 05/01/16 | | | 1,085 | |
| | | | Honolulu Hawaii City & County, Ad Valorem Property Tax Project, Ser B, GO, NPFGC Insured | | | | |
| | 2,000 | | | 5.000%, 07/01/17 | | | 2,165 | |
22
| | | | |
| Hawaii Municipal Bond Fund | | | (unaudited) | |
Schedule of Investments
(continued)
| | | | | | | | |
Face
Amount
(000) | | | | | Value
(000) | |
| Hawaii — (continued) | | | | |
| | | | Honolulu Hawaii City & County, Board of Water Supply, Ser A, RB | | | | |
| $ | 1,050 | | | 5.000%, 07/01/19 | | $ | 1,290 | |
| | 670 | | | 3.000%, 07/01/17 | | | 733 | |
| | | | Honolulu Hawaii City & County, Board of Water Supply, Ser A, RB, FGIC Insured | | | | |
| | 1,000 | | | 4.750%, 07/01/14 , Pre-Refunded @ 100 (A) | | | 1,087 | |
| | | | Honolulu Hawaii City & County, Board of Water Supply, Ser A, RB, NPFGC Insured | | | | |
| | 2,000 | | | 5.000%, 07/01/26 | | | 2,237 | |
| | | | Honolulu Hawaii City & County, Board of Water Supply, Ser A, RB, NPFGC Re-insures FGIC Insured | | | | |
| | 2,000 | | | 5.000%, 07/01/14 , Pre-Refunded @ 100 (A) | | | 2,183 | |
| | | | Honolulu Hawaii City & County, Board of Water Supply, Ser B, RB, AMT, NPFGC Insured | | | | |
| | 1,000 | | | 5.250%, 07/01/20 | | | 1,117 | |
| | 1,000 | | | 5.250%, 07/01/21 | | | 1,111 | |
| | 325 | | | 5.000%, 07/01/15 | | | 361 | |
| | | | Honolulu Hawaii City & County, Ser A, GO | | | | |
| | 1,100 | | | 5.250%, 04/01/32 | | | 1,265 | |
| | 1,000 | | | 5.000%, 04/01/33 | | | 1,114 | |
| | 1,000 | | | 4.250%, 08/01/32 | | | 1,071 | |
| | | | Honolulu Hawaii City & County, Ser A, GO, AGM Insured | | | | |
| | 1,000 | | | 5.000%, 07/01/22 | | | 1,146 | |
| | | | Honolulu Hawaii City & County, Ser A, GO, NPFGC Insured | | | | |
| | 70 | | | 5.250%, 03/01/28 | | | 72 | |
| | 1,950 | | | 5.000%, 07/01/21 | | | 2,183 | |
| | 500 | | | 5.000%, 07/01/23 | | | 557 | |
| | | | Honolulu Hawaii City & County, Ser B, GO | | | | |
| | 250 | | | 5.000%, 12/01/18 | | | 305 | |
| | 395 | | | 5.000%, 08/01/21 | | | 492 | |
| | | | Honolulu Hawaii City & County, Ser B, GO, AGM Insured | | | | |
| | 290 | | | 5.250%, 07/01/15 | | | 330 | |
| | 1,000 | | | 5.250%, 07/01/16 | | | 1,175 | |
| | 345 | | | 5.250%, 07/01/18 | | | 423 | |
| | | | Honolulu Hawaii City & County, Ser B, GO, NPFGC Insured | | | | |
| | 1,000 | | | 5.000%, 07/01/15 | | | 1,086 | |
| | | | Honolulu Hawaii City & County, Ser C, GO | | | | |
| | 200 | | | 4.750%, 09/01/18 | | | 237 | |
| | | | Honolulu Hawaii City & County, Ser D, GO | | | | |
| | 1,000 | | | 5.250%, 09/01/22 | | | 1,225 | |
| | | | Honolulu Hawaii City & County, Ser D, GO, AGM Insures NPFGC Insured | | | | |
| | 1,000 | | | 5.000%, 07/01/22 | | | 1,118 | |
| | | | |
| June 30, 2012 | | | | www.bishopstreetfunds.com |
23
| | | | |
| Hawaii Municipal Bond Fund | | | (unaudited) | |
Schedule of Investments
(continued)
| | | | | | | | |
Face
Amount
(000) | | | | | Value
(000) | |
| Hawaii — (continued) | | | | |
| | | | Honolulu Hawaii City & County, Ser D, GO, NPFGC Insured | | | | |
| $ | 1,000 | | | 5.000%, 07/01/20 | | $ | 1,120 | |
| | 1,000 | | | 5.000%, 07/01/23 | | | 1,115 | |
| | | | Honolulu Hawaii City & County, Ser F, GO, NPFGC Re-insures FGIC Insured | | | | |
| | 1,000 | | | 5.000%, 07/01/29 | | | 1,095 | |
| | | | Honolulu Hawaii City & County, Sewer Improvements, 1st Board Resolution, Ser Senior A, RB, NPFGC Insured | | | | |
| | 1,000 | | | 5.000%, 07/01/31 | | | 1,080 | |
| | | | Honolulu Hawaii City & County, Sewer Improvements, 2nd Board Resolution, Ser A, RB | | | | |
| | 500 | | | 5.000%, 07/01/20 | | | 602 | |
| | | | Honolulu Hawaii City & County, Sewer Improvements, Ser A, RB | | | | |
| | 1,000 | | | 5.000%, 07/01/25 | | | 1,190 | |
| | 1,000 | | | 5.000%, 07/01/38 | | | 1,121 | |
| | 1,000 | | | 4.000%, 07/01/31 | | | 1,056 | |
| | | | Honolulu Hawaii City & County, Sewer Improvements, Ser Junior A-1, RB, NPFGC Insured | | | | |
| | 815 | | | 5.000%, 07/01/22 | | | 909 | |
| | | | Honolulu Hawaii City & County, Waipahu Towers Project, Ser A, RB, AMT, GNMA Collateral Insured | | | | |
| | 190 | | | 6.900%, 06/20/35 | | | 190 | |
| | | | Kauai County, Ser A, GO | | | | |
| | 250 | | | 4.000%, 08/01/24 | | | 281 | |
| | 250 | | | 3.250%, 08/01/23 | | | 267 | |
| | | | Kauai County, Ser A, GO, NPFGC Re-insures FGIC Insured | | | | |
| | 2,440 | | | 5.000%, 08/01/15, Pre-Refunded @ 100 (A) | | | 2,772 | |
| | 1,610 | | | 5.000%, 08/01/21 | | | 1,785 | |
| | | | Maui County, GO, NPFGC Insured | | | | |
| | 100 | | | 5.000%, 03/01/17 | | | 110 | |
| | 1,100 | | | 5.000%, 03/01/24 | | | 1,187 | |
| | | | Maui County, Ser A, GO | | | | |
| | 1,000 | | | 5.000%, 07/01/19 | | | 1,166 | |
| | | | Maui County, Ser A, GO, AGM Insured | | | | |
| | 1,000 | | | 3.500%, 07/01/16 | | | 1,100 | |
| | | | Maui County, Ser A, GO, NPFGC Insured | | | | |
| | 1,000 | | | 4.750%, 07/01/25 | | | 1,096 | |
| | | | Maui County, Ser B and C, GO, NPFGC Insured | | | | |
| | 500 | | | 5.000%, 07/01/16 | | | 580 | |
| | | | Maui County, Ser B, GO | | | | |
| | 500 | | | 4.000%, 06/01/21 | | | 564 | |
24
| | | | |
| Hawaii Municipal Bond Fund | | | (unaudited) | |
Schedule of Investments
(continued)
| | | | | | | | |
Face
Amount
(000) | | | | | Value
(000) | |
| Hawaii — (continued) | | | | |
| | | | Maui County, Ser B, GO, NPFGC Insured | | | | |
| $ | 500 | | | 5.000%, 09/01/17 | | $ | 543 | |
| | | | University of Hawaii, College Improvements Project, Ser A, RB, AGC Insured | | | | |
| | 1,400 | | | 5.000%, 10/01/23 | | | 1,565 | |
| | | | University of Hawaii, College Improvements Project, Ser A, RB, NPFGC Insured | | | | |
| | 200 | | | 5.000%, 07/15/19 | | | 227 | |
| | 150 | | | 5.000%, 07/15/22 | | | 168 | |
| | | | University of Hawaii, Ser A, RB | | | | |
| | 100 | | | 6.000%, 10/01/38 | | | 118 | |
| | | | University of Hawaii, Ser A, RB, NPFGC Insured | | | | |
| | 975 | | | 5.000%, 07/15/21 | | | 1,096 | |
| | 2,000 | | | 4.500%, 07/15/23 | | | 2,170 | |
| | | | University of Hawaii, Ser A-2, RB | | | | |
| | 1,000 | | | 4.000%, 10/01/18 | | | 1,138 | |
| | | | | | | | |
| | | | 127,046 | |
| | | | | | | | |
| Maine — 0.5% | | | | |
| | | | Maine Health & Higher Educational Facilities Authority, Ser A, RB | | | | |
| | 750 | | | 5.250%, 07/01/31 | | | 830 | |
| | | | | | | | |
| Massachusetts — 1.6% | | | | |
| | | | Commonwealth of Massachusetts, Ser B, GO, AGM Insured | | | | |
| | 1,300 | | | 5.250%, 08/01/28 | | | 1,688 | |
| | | | Massachusetts Bay Transportation Authority, Ser A, RB | | | | |
| | 600 | | | 5.250%, 07/01/29 | | | 771 | |
| | | | | | | | |
| | | | 2,459 | |
| | | | | | | | |
| Minnesota — 0.3% | | | | |
| | | | Minnesota Housing Finance Agency, RB, GNMA/FNMA Insured | | | | |
| | 500 | | | 4.875%, 07/01/26 | | | 540 | |
| | | | | | | | |
| Nevada — 0.2% | | | | |
| | | | Nevada State, Municipal Bond Bank Projects, Ser F, GO, AGM Insured | | | | |
| | 250 | | | 5.000%, 12/01/24 | | | 273 | |
| | | | | | | | |
| New York — 1.5% | | | | |
| | | | City of New York New York, Ser F, GO | | | | |
| | 500 | | | 3.000%, 08/01/16 | | | 541 | |
| | | | City of New York New York, Ser H-1, GO | | | | |
| | 600 | | | 5.000%, 03/01/18 | | | 716 | |
| | | | New York State, Dormitory Authority, New York University, Ser A, RB | | | | |
| | 1,000 | | | 3.100%, 07/01/17 | | | 1,084 | |
| | | | | | | | |
| | | | 2,341 | |
| | | | | | | | |
| | | | |
| June 30, 2012 | | | | www.bishopstreetfunds.com |
25
| | | | |
| Hawaii Municipal Bond Fund | | | (unaudited) | |
Schedule of Investments
(continued)
| | | | | | | | |
Face
Amount
(000) | | | | | Value
(000) | |
| Ohio — 0.4% | | | | |
| | | | City of Akron Ohio, GO | | | | |
| $ | 500 | | | 5.000%, 12/01/21 | | $ | 566 | |
| | | | | | | | |
| Oklahoma — 1.7% | | | | |
| | | | Oklahoma Water Resources Board, RB | | | | |
| | 500 | | | 4.000%, 10/01/40 | | | 518 | |
| | 1,000 | | | 3.000%, 10/01/18 | | | 1,088 | |
| | | | Tulsa Industrial Authority, University of Tulsa, RB | | | | |
| | 1,000 | | | 5.000%, 10/01/22 | | | 1,153 | |
| | | | | | | | |
| | | | 2,759 | |
| | | | | | | | |
| Puerto Rico — 2.2% | | | | |
| | | | Commonwealth of Puerto Rico, GO, NPFGC Insured | | | | |
| | 1,500 | | | 6.000%, 07/01/15 | | | 1,670 | |
| | | | Puerto Rico Electric Power Authority, Ser ZZ, RB | | | | |
| | 500 | | | 5.000%, 07/01/24 | | | 533 | |
| | | | Puerto Rico Highway & Transportation Authority, Ser N, RB, AGM Insured | | | | |
| | 1,000 | | | 5.500%, 07/01/26 | | | 1,177 | |
| | | | | | | | |
| | | | 3,380 | |
| | | | | | | | |
| South Carolina — 0.4% | | | | |
| | | | Sumter South Carolina, Waterworks & Sewer Improvement Systems, RB, XLCA Insured | | | | |
| | 500 | | | 5.000%, 12/01/21 | | | 555 | |
| | | | | | | | |
| Texas — 0.7% | | | | |
| | | | Port of Houston Authority, Ser D-1, GO | | | | |
| | 1,000 | | | 5.000%, 10/01/35 | | | 1,160 | |
| | | | | | | | |
| Washington — 2.2% | | | | |
| | | | King County Washington, GO | | | | |
| | 1,000 | | | 4.750%, 01/01/34 | | | 1,069 | |
| | | | Washington Economic Development Finance Authority, RB | | | | |
| | 1,000 | | | 4.125%, 06/01/30 | | | 1,047 | |
| | | | Washington State, Motor Vehicle Tax, Ser C, GO | | | | |
| | 1,000 | | | 5.000%, 06/01/22 | | | 1,228 | |
| | | | | | | | |
| | | | | | | 3,344 | |
| | | | | | | | |
| Wisconsin — 0.7% | | | | |
| | | | Wisconsin State, Ser D, GO, AGM Insured | | | | |
| | 1,000 | | | 5.000%, 05/01/21 | | | 1,143 | |
| | | | | | | | |
| | TOTAL MUNICIPAL BONDS (Cost $146,231) | | | 154,800 | |
| | | | | | | | |
26
| | | | |
| Hawaii Municipal Bond Fund | | | (unaudited) | |
Schedule of Investments
(concluded)
| | | | | | | | |
Shares | | | | | Value
(000) | |
| | SHORT-TERM INVESTMENT (B) — 0.5% | |
| | 780,841 | | | Dreyfus Tax-Exempt Cash Management Fund, Institutional Shares, 0.000% | | $ | 781 | |
| | | | | | | | |
| | TOTAL SHORT-TERM INVESTMENT (Cost $781) | | | 781 | |
| | | | | | | | |
| | TOTAL INVESTMENTS (Cost $147,012) — 99.0% | | $ | 155,581 | |
| | | | | | | | |
Percentages are based on Net Assets of $157,092 ($ Thousands).
| (A) | Pre-Refunded Security — The maturity date shown is the pre-refunded date. |
| (B) | The rate shown is the 7-day effective yield as of June 30, 2012. |
AGC — American Guarantee Corporation
AGM — Assured Guaranty Municipal Corp.
AMBAC — American Municipal Bond Assurance Company
AMT — Alternative Minimum Tax
BHAC — Berkshire Hathaway Assurance Corporation
COP — Certificate of Participation
FGIC — Financial Guarantee Insurance Corporation
FHLMC — Federal Home Loan Mortgage Corporation
FNMA — Federal National Mortgage Corporation
GNMA — Government National Mortgage Corporation
GO — General Obligation
NPFGC — National Public Finance Guarantee Corporation
RB — Revenue Bond
Ser — Series
XLCA — XL Capital
Cost figures are shown in thousands.
The accompanying notes are an integral part of the financial statements.
| | | | |
| June 30, 2012 | | | | www.bishopstreetfunds.com |
27
| | | | |
| Bishop Street Funds | | | (unaudited) | |
Statements of Assets and Liabilities (000)
June 30, 2012
| | | | | | | | | | | | |
| | | Strategic
Growth
Fund | | | Dividend
Value
Fund | | | High
Grade
Income
Fund | |
Assets: | | | | | | | | | | | | |
Investments, at Cost | | $ | 40,611 | | | $ | 47,308 | | | $ | 82,552 | |
| |
Investments, at Value | | $ | 47,816 | | | $ | 57,914 | | | $ | 88,931 | |
Cash | | | — | | | | — | | | | 25 | |
Receivable for Investment Securities Sold | | | 127 | | | | — | | | | — | |
Dividends and Interest Receivable | | | 26 | | | | 124 | | | | 832 | |
Due from Shareholder Servicing Agent | | | 6 | | | | 7 | | | | 11 | |
Prepaid Expenses | | | 5 | | | | 1 | | | | 7 | |
Due from Administrator | | | 3 | | | | 3 | | | | 6 | |
Reclaim Receivable | | | 1 | | | | 4 | | | | — | |
Receivable for Fund Shares Sold | | | — | | | | — | | | | 1 | |
Due from Adviser | | | — | | | | 5 | | | | 16 | |
| |
Total Assets | | | 47,984 | | | | 58,058 | | | | 89,829 | |
| |
Liabilities: | | | | | | | | | | | | |
Payable for Investment Securities Purchased | | | 119 | | | | — | | | | — | |
Payable for Fund Shares Redeemed | | | 12 | | | | 4 | | | | 35 | |
Line of Credit Payable | | | 5 | | | | — | | | | — | |
Income Distribution Payable | | | — | | | | — | | | | 66 | |
Investment Adviser Fees Payable | | | 28 | | | | 34 | | | | 41 | |
Shareholder Servicing Fees Payable | | | 10 | | | | 12 | | | | 18 | |
Administrative Fees Payable | | | 8 | | | | 9 | | | | 15 | |
Chief Compliance Officer Fees Payable | | | 1 | | | | 1 | | | | 1 | |
Other Accrued Expenses Payable | | | 17 | | | | 19 | | | | 37 | |
| |
Total Liabilities | | | 200 | | | | 79 | | | | 213 | |
| |
Net Assets | | $ | 47,784 | | | $ | 57,979 | | | $ | 89,616 | |
| |
Paid-in Capital | | $ | 45,474 | | | $ | 68,793 | | | $ | 81,804 | |
Undistributed Net Investment Income
(Distributions in Excess of Net Investment Income) | | | 13 | | | | (4 | ) | | | 2 | |
Accumulated Net Realized Gain (Loss) on Investments | | | (4,908 | ) | | | (21,416 | ) | | | 1,431 | |
Net Unrealized Appreciation on Investments | | | 7,205 | | | | 10,606 | | | | 6,379 | |
| |
Net Assets | | $ | 47,784 | | | $ | 57,979 | | | $ | 89,616 | |
| |
Class I Shares: | | | | | | | | | | | | |
Net Assets | | $ | 47,784 | | | $ | 57,979 | | | $ | 89,616 | |
Outstanding Shares of Beneficial Interest
(unlimited authorization — no par value) | | | 3,633 | | | | 6,023 | | | | 8,452 | |
Net Asset Value, Offering and Redemption Price Per Share — Class I (Net Assets / Shares Outstanding) | | $ | 13.15 | | | $ | 9.63 | | | $ | 10.60 | |
| |
Amounts designated as “—” are either $0 or have been rounded to $0.
The accompanying notes are an integral part of the financial statements.
28
| | | | |
| Bishop Street Funds | | | (unaudited) | |
Statements of Assets and Liabilities (000)
June 30, 2012
| | | | |
| | | Hawaii
Municipal
Bond
Fund | |
Assets: | | | | |
Investments, at Cost | | $ | 147,012 | |
| |
Investments, at Value | | $ | 155,581 | |
Dividends and Interest Receivable | | | 2,771 | |
Due from Adviser | | | 20 | |
Due from Shareholder Servicing Agent | | | 20 | |
Due from Administrator | | | 17 | |
Receivable for Fund Shares Sold | | | 15 | |
Prepaid Expenses | | | 7 | |
Reclaim Receivable | | | — | |
| |
Total Assets | | | 158,431 | |
| |
Liabilities: | | | | |
Payable for Investment Securities Purchased | | | 881 | |
Income Distribution Payable | | | 272 | |
Payable for Fund Shares Redeemed | | | 8 | |
Investment Adviser Fees Payable | | | 45 | |
Shareholder Servicing Fees Payable | | | 33 | |
Administrative Fees Payable | | | 26 | |
Distribution Fees Payable | | | 5 | |
Chief Compliance Officer Fees Payable | | | 2 | |
Other Accrued Expenses Payable | | | 67 | |
| |
Total Liabilities | | | 1,339 | |
| |
Net Assets | | $ | 157,092 | |
| |
Paid-in Capital | | $ | 148,124 | |
Undistributed Net Investment Income | | | 54 | |
Accumulated Net Realized Gain on Investments | | | 345 | |
Net Unrealized Appreciation on Investments | | | 8,569 | |
| |
Net Assets | | $ | 157,092 | |
| |
Class I Shares: | | | | |
Net Assets | | $ | 133,244 | |
Outstanding Shares of Beneficial Interest
(unlimited authorization — no par value) | | | 12,025 | |
Net Asset Value, Offering and Redemption Price Per Share — Class I
(Net Assets / Shares Outstanding) | | $ | 11.08 | |
| |
Class A Shares: | | | | |
Net Assets | | $ | 23,848 | |
Outstanding Shares of Beneficial Interest
(unlimited authorization — no par value) | | | 2,152 | |
Net Asset Value and Redemption Price Per Share — Class A
(Net Assets / Shares Outstanding) | | $ | 11.08 | |
| |
Maximum Offering Price Per Shares — Class A ($11.08 ÷ 97.00%) | | $ | 11.42 | |
| |
Amounts designated as “—” are either $0 or have been rounded to $0.
The accompanying notes are an integral part of the financial statements.
| | | | |
| June 30, 2012 | | | | www.bishopstreetfunds.com |
29
| | | | |
| Bishop Street Funds | | | (unaudited) | |
Statements of Operations (000)
For the six-month period ended June 30, 2012
| | | | | | | | | | | | |
| | | Strategic
Growth
Fund | | | Dividend
Value
Fund | | | High
Grade
Income
Fund | |
Investment Income: | | | | | | | | | | | | |
Dividend Income | | $ | 306 | | | $ | 945 | | | $ | 3 | |
Interest Income | | | — | | | | — | | | | 1,536 | |
Less: Foreign Taxes Withheld | | | (1 | ) | | | (6 | ) | | | — | |
| |
Total Investment Income | | | 305 | | | | 939 | | | | 1,539 | |
| |
Expenses: | | | | | | | | | | | | |
Investment Adviser Fees | | | 188 | | | | 215 | | | | 253 | |
Shareholder Servicing Fees | | | 64 | | | | 73 | | | | 115 | |
Administrative Fees | | | 51 | | | | 58 | | | | 92 | |
Chief Compliance Officer Fees | | | 1 | | | | 1 | | | | 2 | |
Transfer Agent Fees | | | 19 | | | | 19 | | | | 24 | |
Audit Fees | | | 7 | | | | 8 | | | | 11 | |
Printing Fees | | | 6 | | | | 7 | | | | 12 | |
Legal Fees | | | 4 | | | | 5 | | | | 8 | |
Trustees’ Fees | | | 3 | | | | 4 | | | | 6 | |
Custody Fees | | | 2 | | | | 2 | | | | 2 | |
Registration Fees | | | 1 | | | | 1 | | | | 8 | |
Line of Credit | | | 1 | | | | — | | | | — | |
Miscellaneous Expenses | | | 3 | | | | 4 | | | | 14 | |
| |
Total Expenses | | | 350 | | | | 397 | | | | 547 | |
| |
Less Waivers: | | | | | | | | | | | | |
Shareholder Servicing Fees | | | (38 | ) | | | (44 | ) | | | (69 | ) |
Administrative Fees | | | (20 | ) | | | (23 | ) | | | (37 | ) |
Investment Adviser Fees | | | — | | | | (25 | ) | | | (91 | ) |
| |
Total Waivers | | | (58 | ) | | | (92 | ) | | | (197 | ) |
| |
Total Net Expenses | | | 292 | | | | 305 | | | | 350 | |
| |
Net Investment Income | | | 13 | | | | 634 | | | | 1,189 | |
| |
Net Realized Gain on Investments | | | 4,380 | | | | 1,213 | | | | 1,150 | |
Net Change in Unrealized Appreciation (Depreciation) on Investments | | | (492 | ) | | | 2,527 | | | | 332 | |
| |
Net Realized and Unrealized Gain on Investments | | | 3,888 | | | | 3,740 | | | | 1,482 | |
| |
Increase in Net Assets Resulting from Operations | | $ | 3,901 | | | $ | 4,374 | | | $ | 2,671 | |
| |
Amounts designated as “—” are either $0 or have been rounded to $0.
The accompanying notes are an integral part of the financial statements.
30
| | | | |
| Bishop Street Funds | | | (unaudited) | |
Statements of Operations (000)
For the six-month period ended June 30, 2012
| | | | |
| | | Hawaii
Municipal
Bond
Fund | |
Investment Income: | | | | |
Interest Income | | $ | 2,785 | |
| |
Total Investment Income | | | 2,785 | |
| |
Expenses: | | | | |
Investment Adviser Fees | | | 276 | |
Shareholder Servicing Fees | | | 197 | |
Administrative Fees | | | 157 | |
Distribution Fees, Class A | | | 31 | |
Chief Compliance Officer Fees | | | 3 | |
Transfer Agent Fees | | | 42 | |
Printing Fees | | | 20 | |
Audit Fees | | | 16 | |
Legal Fees | | | 14 | |
Trustees’ Fees | | | 10 | |
Custody Fees | | | 4 | |
Registration Fees | | | 4 | |
Miscellaneous Expenses | | | 23 | |
| |
Total Expenses | | | 797 | |
| |
Less Waivers: | | | | |
Shareholder Servicing Fees | | | (118 | ) |
Investment Adviser Fees | | | (113 | ) |
Administrative Fees | | | (102 | ) |
| |
Total Waivers | | | (333 | ) |
| |
Total Net Expenses | | | 464 | |
| |
Net Investment Income | | | 2,321 | |
| |
Net Realized Gain on Investments | | | 879 | |
Net Change in Unrealized Appreciation on Investments | | | 1,084 | |
| |
Net Realized and Unrealized Gain on Investments | | | 1,963 | |
| |
Increase in Net Assets Resulting from Operations | | $ | 4,284 | |
| |
The accompanying notes are an integral part of the financial statements.
| | | | |
| June 30, 2012 | | | | www.bishopstreetfunds.com |
31
Statements of Changes in Net Assets (000)
For the six-month period ended June 30, 2012 (unaudited) and the year ended December 31, 2011
| | | | | | | | | | | | | | | | |
| | | Strategic
Growth Fund | | | Dividend
Value Fund | |
| | | 2012 | | | 2011 | | | 2012 | | | 2011 | |
Investment Activities from Operations: | | | | | | | | | | | | | | | | |
Net Investment Income (Loss) | | $ | 13 | | | $ | (61 | ) | | $ | 634 | | | $ | 1,198 | |
Net Realized Gain on Investments | | | 4,380 | | | | 1,795 | | | | 1,213 | | | | 38 | |
Net Change in Unrealized Appreciation (Depreciation) on Investments | | | (492 | ) | | | (3,372 | ) | | | 2,527 | | | | 2,219 | |
| |
Increase (Decrease) in Net Assets Resulting from Operations | | | 3,901 | | | | (1,638 | ) | | | 4,374 | | | | 3,455 | |
| |
Dividends and Distributions to Shareholders: | | | | | | | | | | | | | | | | |
Net Investment Income: | | | | | | | | | | | | | | | | |
Class I Shares | | | — | | | | — | | | | (640 | ) | | | (1,202 | ) |
Return of Capital: | | | | | | | | | | | | | | | | |
Class I Shares | | | — | | | | — | | | | — | | | | (2 | ) |
| |
Total Dividends and Distributions to Shareholders | | | — | | | | — | | | | (640 | ) | | | (1,204 | ) |
| |
Capital Share Transactions: | | | | | | | | | | | | | | | | |
Proceeds from Shares Issued | | | 13,621 | | | | 9,273 | | | | 1,525 | | | | 6,943 | |
Reinvestments of Cash Distributions | | | — | | | | — | | | | 433 | | | | 820 | |
Cost of Shares Redeemed | | | (20,151 | ) | | | (7,276 | ) | | | (6,399 | ) | | | (5,192 | ) |
| |
Net Increase (Decrease) in Net Assets from Capital Share Transactions | | | (6,530 | ) | | | 1,997 | | | | (4,441 | ) | | | 2,571 | |
| |
Total Increase (Decrease) in Net Assets | | | (2,629 | ) | | | 359 | | | | (707 | ) | | | 4,822 | |
| |
Net Assets: | | | | | | | | | | | | | | | | |
Beginning of Period | | | 50,413 | | | | 50,054 | | | | 58,686 | | | | 53,864 | |
| |
End of Period | | $ | 47,784 | | | $ | 50,413 | | | $ | 57,979 | | | $ | 58,686 | |
| |
Undistributed Net Investment Income (Distributions in Excess of Net Investment Income) | | $ | 13 | | | $ | — | | | $ | (4 | ) | | $ | 2 | |
| |
Share Transactions: | | | | | | | | | | | | | | | | |
Shares Issued | | | 976 | | | | 737 | | | | 162 | | | | 782 | |
Shares Issued in Lieu of Cash Distributions | | | — | | | | — | | | | 45 | | | | 93 | |
Shares Redeemed | | | (1,463 | ) | | | (573 | ) | | | (671 | ) | | | (594 | ) |
| |
Net Increase (Decrease) in Shares Outstanding from Share Transactions | | | (487 | ) | | | 164 | | | | (464 | ) | | | 281 | |
| |
Amounts designated as “—” are either $0 or zero shares, or have been rounded to $0 or zero shares.
The accompanying notes are an integral part of the financial statements.
32
Statements of Changes in Net Assets (000)
For the six-month period ended June 30, 2012 (unaudited) and the year ended December 31, 2011
| | | | | | | | | | | | | | | | |
| | | High Grade
Income Fund | | | Hawaii Municipal
Bond Fund | |
| | | 2012 | | | 2011 | | | 2012 | | | 2011 | |
Investment Activities from Operations: | | | | | | | | | | | | | | | | |
Net Investment Income | | $ | 1,189 | | | $ | 3,291 | | | $ | 2,321 | | | $ | 5,178 | |
Net Realized Gain (Loss) on Investments | | | 1,150 | | | | 3,085 | | | | 879 | | | | (489 | ) |
Net Change in Unrealized Appreciation on Investments | | | 332 | | | | 272 | | | | 1,084 | | | | 8,018 | |
| |
Increase in Net Assets Resulting from Operations | | | 2,671 | | | | 6,648 | | | | 4,284 | | | | 12,707 | |
| |
Dividends and Distributions to Shareholders: | | | | | | | | | | | | | | | | |
Net Investment Income: | | | | | | | | | | | | | | | | |
Class I Shares | | | (1,189 | ) | | | (3,214 | ) | | | (1,946 | ) | | | (4,439 | ) |
Class A Shares | | | — | | | | — | | | | (328 | ) | | | (738 | ) |
Capital Gains: | | | | | | | | | | | | | | | | |
Class I Shares | | | — | | | | (3,062 | ) | | | — | | | | — | |
| |
Total Dividends and Distributions to Shareholders | | | (1,189 | ) | | | (6,276 | ) | | | (2,274 | ) | | | (5,177 | ) |
| |
Capital Share Transactions: | | | | | | | | | | | | | | | | |
Class I Shares: | | | | | | | | | | | | | | | | |
Proceeds from Shares Issued | | | 5,974 | | | | 11,128 | | | | 7,615 | | | | 14,976 | |
Reinvestments of Cash Distributions | | | 751 | | | | 3,912 | | | | 245 | | | | 476 | |
Cost of Shares Redeemed | | | (11,697 | ) | | | (26,191 | ) | | | (6,659 | ) | | | (23,943 | ) |
| |
Total Class I Capital Share Transactions | | | (4,972 | ) | | | (11,151 | ) | | | 1,201 | | | | (8,491 | ) |
| |
Class A Shares: | | | | | | | | | | | | | | | | |
Proceeds from Shares Issued | | | — | | | | — | | | | 2,522 | | | | 2,303 | |
Reinvestments of Cash Distributions | | | — | | | | — | | | | 234 | | | | 487 | |
Cost of Shares Redeemed | | | — | | | | — | | | | (2,601 | ) | | | (8,655 | ) |
| |
Total Class A Capital Share Transactions | | | — | | | | — | | | | 155 | | | | (5,865 | ) |
| |
Net Increase (Decrease) in Net Assets from Capital Share Transactions | | | (4,972 | ) | | | (11,151 | ) | | | 1,356 | | | | (14,356 | ) |
| |
Total Increase (Decrease) in Net Assets | | | (3,490 | ) | | | (10,779 | ) | | | 3,366 | | | | (6,826 | ) |
| |
Net Assets: | | | | | | | | | | | | | | | | |
Beginning of Period | | | 93,106 | | | | 103,885 | | | | 153,726 | | | | 160,552 | |
| |
End of Period | | $ | 89,616 | | | $ | 93,106 | | | $ | 157,092 | | | $ | 153,726 | |
| |
Undistributed Net Investment Income | | $ | 2 | | | $ | 2 | | | $ | 54 | | | $ | 7 | |
| |
Share Transactions: | | | | | | | | | | | | | | | | |
Class I Shares: | | | | | | | | | | | | | | | | |
Shares Issued | | | 570 | | | | 1,055 | | | | 689 | | | | 1,422 | |
Shares Issued in Lieu of Cash Distributions | | | 71 | | | | 373 | | | | 22 | | | | 45 | |
Shares Redeemed | | | (1,110 | ) | | | (2,473 | ) | | | (603 | ) | | | (2,270 | ) |
| |
Total Class I Transactions | | | (469 | ) | | | (1,045 | ) | | | 108 | | | | (803 | ) |
| |
Class A Shares: | | | | | | | | | | | | | | | | |
Shares Issued | | | — | | | | — | | | | 228 | | | | 218 | |
Shares Issued in Lieu of Cash Distributions | | | — | | | | — | | | | 21 | | | | 46 | |
Shares Redeemed | | | — | | | | — | | | | (235 | ) | | | (832 | ) |
| |
Total Class A Transactions | | | — | | | | — | | | | 14 | | | | (568 | ) |
| |
Net Increase (Decrease) in Shares Outstanding from Share Transactions | | | (469 | ) | | | (1,045 | ) | | | 122 | | | | (1,371 | ) |
| |
Amounts designated as “—” are either $0 or zero shares, or have been rounded to $0 or zero shares.
The accompanying notes are an integral part of the financial statements.
| | | | |
| June 30, 2012 | | | | www.bishopstreetfunds.com |
33
Financial Highlights
For a share outstanding throughout the six-month period ended June 30, 2012 (unaudited) and the years ended
December 31,
| | | | | | | | | | | | | | | | | | | | | | | | | | | | | | | | | | | |
| | | | | Investment Activities | | Total
Investment
Activities
from
Operations | | Dividends and
Distributions from | | |
| | | Net Asset
Value,
Beginning
of Period | | Net
Investment
Income
(Loss)(1) | | Net Realized
and Unrealized
Gain (Loss) on
Investments | | | Net
Investment
Income | | Capital
Gains | | Total
Dividends
and
Distributions |
STRATEGIC GROWTH FUND |
Class I Shares: | | | | | | | | | | | | | | | | | | | | | | | | | | | | | | | | | | | |
2012 | | | $ | 12.24 | | | | $ | — | ** | | | $ | 0.91 | | | | $ | 0.91 | | | | $ | — | | | | $ | — | | | | $ | — | |
2011 | | | | 12.65 | | | | | (0.01 | ) | | | | (0.40 | ) | | | | (0.41 | ) | | | | — | | | | | — | | | | | — | |
2010 | | | | 10.64 | | | | | (0.01 | ) | | | | 2.02 | | | | | 2.01 | | | | | — | | | | | — | | | | | — | |
2009 | | | | 8.08 | | | | | — | ** | | | | 2.56 | | | | | 2.56 | | | | | — | | | | | — | | | | | — | |
2008 | | | | 14.05 | | | | | (0.02 | ) | | | | (5.73 | ) | | | | (5.75 | ) | | | | — | | | | | (0.22 | ) | | | | (0.22 | ) |
2007 | | | | 14.84 | | | | | (0.03 | ) | | | | 1.53 | | | | | 1.50 | | | | | — | | | | | (2.29 | ) | | | | (2.29 | ) |
DIVIDEND VALUE FUND |
Class I Shares: | | | | | | | | | | | | | | | | | | | | | | | | | | | | | | | | | | | |
2012 | | | $ | 9.05 | | | | $ | 0.10 | | | | $ | 0.59 | | | | $ | 0.69 | | | | $ | (0.11 | ) | | | $ | — | | | | $ | (0.11 | ) |
2011 | | | | 8.68 | | | | | 0.19 | | | | | 0.37 | | | | | 0.56 | | | | | (0.19 | ) | | | | — | ‡ | | | | (0.19 | ) |
2010 | | | | 7.83 | | | | | 0.16 | | | | | 0.85 | | | | | 1.01 | | | | | (0.16 | ) | | | | — | ‡ | | | | (0.16 | ) |
2009 | | | | 6.02 | | | | | 0.06 | | | | | 1.81 | | | | | 1.87 | | | | | (0.06 | ) | | | | — | | | | | (0.06 | ) |
2008 | | | | 10.54 | | | | | 0.07 | | | | | (4.47 | ) | | | | (4.40 | ) | | | | (0.07 | ) | | | | (0.05 | ) | | | | (0.12 | ) |
2007 | | | | 10.62 | | | | | 0.04 | | | | | 0.52 | | | | | 0.56 | | | | | (0.04 | ) | | | | (0.60 | ) | | | | (0.64 | ) |
HIGH GRADE INCOME FUND |
Class I Shares: | | | | | | | | | | | | | | | | | | | | | | | | | | | | | | | | | | | |
2012 | | | $ | 10.44 | | | | $ | 0.13 | | | | $ | 0.16 | | | | $ | 0.29 | | | | $ | (0.13 | ) | | | $ | — | | | | $ | (0.13 | ) |
2011 | | | | 10.42 | | | | | 0.35 | | | | | 0.36 | | | | | 0.71 | | | | | (0.34 | ) | | | | (0.35 | ) | | | | (0.69 | ) |
2010 | | | | 10.65 | | | | | 0.41 | | | | | 0.18 | | | | | 0.59 | | | | | (0.40 | ) | | | | (0.42 | ) | | | | (0.82 | ) |
2009 | | | | 10.56 | | | | | 0.43 | | | | | 0.44 | | | | | 0.87 | | | | | (0.43 | ) | | | | (0.35 | ) | | | | (0.78 | ) |
2008 | | | | 10.15 | | | | | 0.43 | | | | | 0.41 | | | | | 0.84 | | | | | (0.43 | ) | | | | — | | | | | (0.43 | ) |
2007 | | | | 9.94 | | | | | 0.44 | | | | | 0.21 | | | | | 0.65 | | | | | (0.44 | ) | | | | — | | | | | (0.44 | ) |
| (1) | Per share net investment income calculated using average shares. |
| ** | Amount represents less than $0.01. |
| † | Total return is for the period indicated and has not been annualized. Returns shown do not reflect the deduction of taxes that a shareholder would pay on Fund distributions or the redemption of Fund shares. Fee waivers are in effect; if they had not been in effect, performance would have been lower. |
| ‡ | Includes return of capital of less than $0.01 |
Amounts designated as “—” are either $0 or have been rounded to $0.
34
| | | | | | | | | | | | | | | | | | | | | | | | | | | | | | | | | |
| | | | | | |
Net Asset
Value,
End of
Period | | Total
Return† | | Net Assets
End of
Period
(000) | | Ratio of
Expenses to
Average
Net
Assets | | Ratio of Expenses
to Average
Net Assets
(Excluding
Waivers) | | Ratio of Net
Investment
Income (Loss)
to Average
Net Assets | | Portfolio
Turnover
Rate |
| | | | | | |
| | | | | | | | | | | | | | | | | | | | | | | | | | | | | | | | | | |
| | | | | | | | | | | | | | | | | | | | | | | | | | | | | | | | | | |
| | $ | 13.15 | | | | | 7.43 | % | | | $ | 47,784 | | | | | 1.15 | %* | | | | 1.38 | %* | | | | 0.05 | %* | | | | 44 | % |
| | | 12.24 | | | | | (3.24 | ) | | | | 50,413 | | | | | 1.16 | | | | | 1.39 | | | | | (0.12 | ) | | | | 53 | |
| | | 12.65 | | | | | 18.89 | | | | | 50,054 | | | | | 1.14 | | | | | 1.37 | | | | | (0.12 | ) | | | | 53 | |
| | | 10.64 | | | | | 31.68 | | | | | 60,929 | | | | | 1.11 | | | | | 1.34 | | | | | 0.00 | | | | | 54 | |
| | | 8.08 | | | | | (41.46 | ) | | | | 62,237 | | | | | 1.06 | | | | | 1.29 | | | | | (0.19 | ) | | | | 73 | |
| | | 14.05 | | | | | 10.10 | | | | | 126,384 | | | | | 1.07 | | | | | 1.30 | | | | | (0.22 | ) | | | | 61 | |
| | | | | | | | | | | | | | | | | | | | | | | | | | | | | | | | | | |
| | | | | | | | | | | | | | | | | | | | | | | | | | | | | | | | | | |
| | $ | 9.63 | | | | | 7.59 | % | | | $ | 57,979 | | | | | 1.05 | %* | | | | 1.37 | %* | | | | 2.18 | %* | | | | 8 | % |
| | | 9.05 | | | | | 6.53 | | | | | 58,686 | | | | | 1.05 | | | | | 1.38 | | | | | 2.16 | | | | | 11 | |
| | | 8.68 | | | | | 13.07 | | | | | 53,864 | | | | | 1.05 | | | | | 1.47 | | | | | 1.98 | | | | | 84 | |
| | | 7.83 | | | | | 31.28 | | | | | 50,259 | | | | | 1.05 | | | | | 1.36 | | | | | 0.89 | | | | | 82 | |
| | | 6.02 | | | | | (42.02 | ) | | | | 51,859 | | | | | 1.05 | | | | | 1.30 | | | | | 0.84 | | | | | 75 | |
| | | 10.54 | | | | | 5.24 | | | | | 101,342 | | | | | 1.05 | | | | | 1.31 | | | | | 0.38 | | | | | 65 | |
| | | | | | | | | | | | | | | | | | | | | | | | | | | | | | | | | | |
| | | | | | | | | | | | | | | | | | | | | | | | | | | | | | | | | | |
| | $ | 10.60 | | | | | 2.84 | % | | | $ | 89,616 | | | | | 0.76 | %* | | | | 1.19 | %* | | | | 2.58 | %* | | | | 27 | % |
| | | 10.44 | | | | | 6.94 | | | | | 93,106 | | | | | 0.76 | | | | | 1.17 | | | | | 3.31 | | | | | 52 | |
| | | 10.42 | | | | | 5.63 | | | | | 103,885 | | | | | 0.76 | | | | | 1.16 | | | | | 3.79 | | | | | 39 | |
| | | 10.65 | | | | | 8.41 | | | | | 126,334 | | | | | 0.76 | | | | | 1.13 | | | | | 4.08 | | | | | 82 | |
| | | 10.56 | | | | | 8.53 | | | | | 121,976 | | | | | 0.76 | | | | | 1.10 | | | | | 4.22 | | | | | 28 | |
| | | 10.15 | | | | | 6.67 | | | | | 136,223 | | | | | 0.76 | | | | | 1.11 | | | | | 4.38 | | | | | 26 | |
The accompanying notes are an integral part of the financial statements.
| | | | |
| June 30, 2012 | | | | www.bishopstreetfunds.com |
35
Financial Highlights
For a share outstanding throughout the six-month period ended June 30, 2012 (unaudited) and the years ended December 31,
| | | | | | | | | | | | | | | | | | | | | | | | | | | | | | | | | | | |
| | | | | Investment Activities | | Total
Investment
Activities
from
Operations | | Dividends and
Distributions from | | |
| | | Net Asset
Value,
Beginning
of Period | | Net
Investment
Income(1) | | Net Realized
and Unrealized
Gain (Loss) on
Investments | | | Net
Investment
Income | | Capital
Gains | | Total
Dividends
and
Distributions |
HAWAII MUNICIPAL BOND FUND |
Class I Shares: | | | | | | | | | | | | | | | | | | | | | | | | | | | | | | | | | | | |
2012 | | | $ | 10.94 | | | | $ | 0.16 | | | | $ | 0.14 | | | | $ | 0.30 | | | | $ | (0.16 | ) | | | $ | — | | | | $ | (0.16 | ) |
2011 | | | | 10.41 | | | | | 0.36 | | | | | 0.53 | | | | | 0.89 | | | | | (0.36 | ) | | | | — | | | | | (0.36 | ) |
2010 | | | | 10.62 | | | | | 0.38 | | | | | (0.20 | ) | | | | 0.18 | | | | | (0.38 | ) | | | | (0.01 | ) | | | | (0.39 | ) |
2009 | | | | 10.05 | | | | | 0.38 | | | | | 0.57 | | | | | 0.95 | | | | | (0.38 | ) | | | | — | | | | | (0.38 | ) |
2008 | | | | 10.56 | | | | | 0.40 | | | | | (0.51 | ) | | | | (0.11 | ) | | | | (0.40 | ) | | | | — | | | | | (0.40 | ) |
2007 | | | | 10.77 | | | | | 0.42 | | | | | (0.16 | ) | | | | 0.26 | | | | | (0.42 | ) | | | | (0.05 | ) | | | | (0.47 | ) |
Class A Shares: | | | | | | | | | | | | | | | | | | | | | |
2012 | | | $ | 10.94 | | | | $ | 0.15 | | | | $ | 0.14 | | | | $ | 0.29 | | | | $ | (0.15 | ) | | | $ | — | | | | $ | (0.15 | ) |
2011 | | | | 10.41 | | | | | 0.33 | | | | | 0.53 | | | | | 0.86 | | | | | (0.33 | ) | | | | — | | | | | (0.33 | ) |
2010 | | | | 10.62 | | | | | 0.35 | | | | | (0.20 | ) | | | | 0.15 | | | | | (0.35 | ) | | | | (0.01 | ) | | | | (0.36 | ) |
2009 | | | | 10.05 | | | | | 0.36 | | | | | 0.57 | | | | | 0.93 | | | | | (0.36 | ) | | | | — | | | | | (0.36 | ) |
2008 | | | | 10.56 | | | | | 0.38 | | | | | (0.51 | ) | | | | (0.13 | ) | | | | (0.38 | ) | | | | — | | | | | (0.38 | ) |
2007 | | | | 10.77 | | | | | 0.39 | | | | | (0.16 | ) | | | | 0.23 | | | | | (0.39 | ) | | | | (0.05 | ) | | | | (0.44 | ) |
| (1) | Per share net investment income calculated using average shares. |
| † | Total return is for the period indicated and has not been annualized. Returns shown do not reflect the deduction of taxes that a shareholder would pay on Fund distributions or the redemption of Fund shares. Fee waivers are in effect; if they had not been in effect, performance would have been lower. |
Amounts designated as “—” are either $0 or have been rounded to $0.
36
| | | | | | | | | | | | | | | | | | | | | | | | | | | | | | | | | |
Net Asset
Value,
End of
Period | | Total
Return† | | Net Assets
End of
Period
(000) | |
Ratio of
Expenses to
Average
Net
Assets | | Ratio of Expenses
to Average
Net Assets
(Excluding
Waivers) | | Ratio of Net
Investment
Income
to Average
Net Assets | | Portfolio
Turnover
Rate |
| | | | | | | | | | | | | | | | | | | | | | | | | | | | | | | | | | |
| | | | | | | | | | | | | | | | | | | | | | | | | | | | | | | | | | |
| | $ | 11.08 | | | | | 2.76 | % | | | $ | 133,244 | | | | | 0.55 | %* | | | | 0.97 | %* | | | | 2.99 | %* | | | | 14 | % |
| | | 10.94 | | | | | 8.72 | | | | | 130,345 | | | | | 0.55 | | | | | 0.97 | | | | | 3.41 | | | | | 32 | |
| | | 10.41 | | | | | 1.70 | | | | | 132,392 | | | | | 0.55 | | | | | 0.97 | | | | | 3.54 | | | | | 35 | |
| | | 10.62 | | | | | 9.63 | | | | | 139,872 | | | | | 0.55 | | | | | 0.95 | | | | | 3.68 | | | | | 27 | |
| | | 10.05 | | | | | (1.02 | ) | | | | 130,807 | | | | | 0.55 | | | | | 0.93 | | | | | 3.91 | | | | | 36 | |
| | | 10.56 | | | | | 2.47 | | | | | 144,828 | | | | | 0.55 | | | | | 0.93 | | | | | 3.92 | | | | | 25 | |
| | | | | | | | | | | | | | | | | | | | | | | | | | | | | | | | | | |
| | $ | 11.08 | | | | | 2.63 | % | | | $ | 23,848 | | | | | 0.80 | %* | | | | 1.22 | %* | | | | 2.73 | %* | | | | 14 | % |
| | | 10.94 | | | | | 8.45 | | | | | 23,381 | | | | | 0.80 | | | | | 1.22 | | | | | 3.16 | | | | | 32 | |
| | | 10.41 | | | | | 1.44 | | | | | 28,160 | | | | | 0.80 | | | | | 1.22 | | | | | 3.29 | | | | | 35 | |
| | | 10.62 | | | | | 9.35 | | | | | 26,105 | | | | | 0.80 | | | | | 1.20 | | | | | 3.43 | | | | | 27 | |
| | | 10.05 | | | | | (1.27 | ) | | | | 23,707 | | | | | 0.80 | | | | | 1.17 | | | | | 3.66 | | | | | 36 | |
| | | 10.56 | | | | | 2.21 | | | | | 29,115 | | | | | 0.80 | | | | | 1.18 | | | | | 3.67 | | | | | 25 | |
The accompanying notes are an integral part of the financial statements.
| | | | |
| June 30, 2012 | | | | www.bishopstreetfunds.com |
37
| | | | |
| Bishop Street Funds | | | (unaudited) | |
Notes to Financial Statements
June 30, 2012
The amounts included in the Notes to Financial Statements are in thousands unless otherwise noted.
The Bishop Street Funds (the “Trust”) are registered under the Investment Company Act of 1940, as amended, as an open-end, management investment company. The Bishop Street Funds consist of a series of four funds (each a Fund, collectively the “Funds”) which includes the Strategic Growth Fund, Dividend Value Fund, High Grade Income Fund, and the Hawaii Municipal Bond Fund. Each Fund is diversified, with the exception of Hawaii Municipal Bond Fund, which is non-diversified. Class A Shares of the Hawaii Municipal Bond Fund are subject to a sales load as disclosed in the prospectus. The assets of each Fund are segregated, and a shareholder’s interest is limited to the Fund in which shares are held. The Funds’ prospectus provides a description of each Fund’s investment objectives, policies and strategies. On June 29, 2012 the Bishop Street Government Money Market Fund ceased operations and liquidated all remaining assets on a pro rata basis to the shareholders.
| 2. | SIGNIFICANT ACCOUNTING POLICIES |
The following is a summary of significant accounting policies followed by the Trust.
Use of Estimates in the Preparation of Financial Statements
The preparation of financial statements in conformity with U.S. generally accepted accounting principles (“U.S. GAAP”) requires management to make estimates and assumptions that affect the fair value of assets, the reported amount of assets and liabilities and disclosure of contingent assets and liabilities at the date of the financial statements and the reported amounts of increases and decreases in net assets from operations during the reporting period. Actual results could differ from those estimates and such differences could be material.
Security Valuation
The Funds’ investments in equity securities listed on a securities exchange, market or automated quotation system for which quotations are readily available (except for securities traded on NASDAQ) including securities traded over the counter, are valued at the last quoted sale price on the primary exchange or market (foreign or domestic) on which they are traded, or, if there is no such reported sale, at the most recent quoted bid price. For securities traded on NASDAQ, the NASDAQ Official Closing Price will be used. Debt securities are priced based upon valuations provided by independent, third-party pricing agents, if available. Such values generally reflect the last reported sales price in the most advantageous market, if the security is actively traded. The third-party pricing agents may also value debt securities at an evaluated bid price by employing methodologies that utilize actual market transactions, broker-supplied valuations, or other methodologies designed to identify the fair value for such securities. Debt
38
obligations with remaining maturities of sixty days or less may be valued at their amortized cost, which approximates market value. Prices for most securities held in the Funds are provided daily by recognized independent pricing agents.
If a security price cannot be obtained from an independent, third-party pricing agent, the Funds seek to obtain a bid price from at least one independent broker.
Securities for which market prices are not “readily available” are valued in accordance with Fair Value Procedures established by the Funds’ Board of Trustees (the “Board”). The Funds’ Fair Value Procedures are implemented through a Fair Value Pricing Committee (the “Committee”) designated by the Funds’ Board. Some of the more common reasons that may necessitate that a security be valued using Fair Value Procedures include: the security’s trading has been halted or suspended; the security has been delisted from a national exchange; the security’s primary trading market is temporarily closed at a time when under normal conditions it would be open; or the security’s primary pricing source is not able or willing to provide a price. When a security is valued in accordance with the Fair Value Procedures, the Committee will determine the value after taking into consideration relevant information reasonably available to the Committee.
In accordance with the authoritative guidance on fair value measurements and disclosure under U.S. GAAP, the Funds disclose fair value of their investments in a hierarchy that prioritizes the inputs to valuation techniques used to measure the fair value. The objective of a fair value measurement is to determine the price that would be received to sell an asset or paid to transfer a liability in an orderly transaction between market participants at the measurement date (an exit price). Accordingly, the fair value hierarchy gives the highest priority to quoted prices (unadjusted) in active markets for identical assets or liabilities (Level 1) and the lowest priority to unobservable inputs (Level 3). The three levels of the fair value hierarchy are described below:
| | • | | Level 1 — Unadjusted quoted prices in active markets for identical, unrestricted assets or liabilities that the Funds have the ability to access at the measurement date; |
| | • | | Level 2 — Other significant observable inputs (including quoted prices for similar securities, interest rates, prepayment speeds, credit risk, referenced indices, quoted prices in inactive markets, adjusted quoted prices in active markets, etc.); and |
| | • | | Level 3 — Prices, inputs or exotic modeling techniques which are both significant to the fair value measurement and unobservable (supported by little or no market activity). |
Investments are classified within the level of the lowest significant input considered in determining fair value. Investments classified within Level 3 whose fair value measurement considers several inputs may include Level 1 or Level 2 inputs as
| | | | |
| June 30, 2012 | | | | www.bishopstreetfunds.com |
39
| | | | |
| Bishop Street Funds | | | (unaudited) | |
components of the overall fair value measurement. For the six-month period ended June 30, 2012 there were no Level 3 investments.
As of June 30, 2012, all of the investments in the Strategic Growth Fund and the Dividend Value Fund were considered Level 1. There were no transfers between Level 1 and Level 2 assets and liabilities. For details of the investment classifications, refer to the Schedule of Investments.
The following is a summary of the inputs used as of June 30, 2012 in valuing the following Fund’s investments carried at value:
| | | | | | | | | | | | | | | | |
| High Grade Income Fund | |
| Investments in Securities | | Level 1 | | | Level 2 | | | Level 3 | | | Total | |
Corporate Obligations | | $ | — | | | $ | 44,353 | | | $ | — | | | $ | 44,353 | |
U.S. Treasury Obligations | | | — | | | | 23,871 | | | | — | | | | 23,871 | |
Municipal Bonds | | | — | | | | 8,041 | | | | — | | | | 8,041 | |
U.S. Government Agency | | | | | | | | | | | | | | | | |
Obligations | | | — | | | | 6,868 | | | | — | | | | 6,868 | |
U.S. Government Mortgage-Backed | | | | | | | | | | | | | | | | |
Obligations | | | — | | | | 1,765 | | | | — | | | | 1,765 | |
Asset-Backed Security | | | — | | | | 1,204 | | | | — | | | | 1,204 | |
Short-Term Investment | | | 2,829 | | | | — | | | | — | | | | 2,829 | |
| | | | |
Total Investments in Securities | | $ | 2,829 | | | $ | 86,102 | | | $ | — | | | $ | 88,931 | |
| | | | |
|
| Hawaii Municipal Bond Fund | |
| Investments in Securities | | Level 1 | | | Level 2 | | | Level 3 | | | Total | |
Municipal Bonds | | $ | — | | | $ | 154,800 | | | $ | — | | | $ | 154,800 | |
Short-Term Investment | | | 781 | | | | — | | | | — | | | | 781 | |
| | | | |
Total Investments in Securities | | $ | 781 | | | $ | 154,800 | | | $ | — | | | $ | 155,581 | |
| | | | |
For the six-month period ended June 30, 2012, there were no transfers between Level 1 and Level 2 assets and liabilities. For the six-month period ended June 30, 2012, there have been no significant changes to the Funds’ fair value methodologies.
In May 2011, the Financial Accounting Standards Board issued Accounting Standards Update (“ASU”) No. 2011-04 “Amendments to Achieve Common Fair Value Measurement and Disclosure Requirements in U.S. GAAP and International Financial Reporting Standards (“IFRS”)”. ASU 2011-04 includes common requirements for measurement of and disclosure about fair value between U.S. GAAP and IFRS. ASU 2011-04 will require reporting entities to disclose the following information for fair value measurements categorized
40
within Level 3 of the fair value hierarchy: quantitative information about the unobservable inputs used in the fair value measurement, the valuation processes used by the reporting entity, and a narrative description of the sensitivity of the fair value measurement to changes in unobservable inputs and the interrelationships between those unobservable inputs. In addition, ASU 2011-04 will require reporting entities to make disclosures about amounts and reasons for all transfers in and out of Level 1 and Level 2 fair value measurements. The new and revised disclosures are effective for interim and annual reporting periods beginning after December 15, 2011. The Funds adopted ASU 2011-04 during the six-month period ended June 30, 2012. The adoption of ASU 2011-04 did not have any impact on the Funds’ financial statements.
Federal Income Taxes
It is each Fund’s intention to continue to qualify as a regulated investment company for federal income tax purposes under Subchapter M of the Internal Revenue Code, as amended, and to distribute substantially all of its taxable income and net capital gains. Accordingly, no provision for federal income taxes is required.
The Funds evaluate tax positions taken or expected to be taken in the course of preparing the Funds’ tax returns to determine whether it is “more-likely-than- not” (i.e., greater than 50-percent) that each tax position will be sustained upon examination by a taxing authority based on the technical merits of the position. Tax positions not deemed to meet the more-likely-than-not threshold are recorded as a tax benefit or expense in the current year. The Funds did not record any tax provision in the current period. However, management’s conclusions regarding tax positions taken may be subject to review and adjustment at a later date based on factors including, but not limited to, examination by tax authorities (i.e., the last 3 open tax year ends, as applicable), on-going analysis of and changes to tax laws, regulations and interpretations thereof.
Security Transactions and Investment Income
Security transactions are accounted for on trade date. Costs used in determining net realized capital gains and losses on the sale of securities are on the basis of specific identification. Interest income is recorded on the accrual basis from settlement date and dividend income is recorded on ex-dividend date.
Discounts and premiums are accreted or amortized over the life of each security and are recorded as interest income. The High Grade Income and Hawaii Municipal Bond Funds use the effective interest method.
Classes
Class-specific expenses are borne by the applicable class of shares. Income, realized and unrealized gains/losses and non class-specific expenses are allocated to the respective class on the basis of relative daily net assets. Distribution fees are the only class-specific expense.
| | | | |
| June 30, 2012 | | | | www.bishopstreetfunds.com |
41
| | | | |
| Bishop Street Funds | | | (unaudited) | |
Expenses
Expenses that are directly related to one of the Funds are charged directly to that Fund. Other operating expenses of the Trust are prorated to each of the Funds on the basis of relative net assets.
Dividends and Distributions to Shareholders
The Strategic Growth and Dividend Value Funds declare and pay dividends from any net investment income, if available, on a quarterly basis. Dividends from net investment income are declared daily and paid on a monthly basis for the High Grade Income and Hawaii Municipal Bond. Any net realized capital gains will be distributed at least annually for all Funds. Distributions to shareholders are recorded on the ex-dividend date.
Front-End Sales Commission
Front-end sales commissions (the “sales charges”) are not recorded as expenses of the Hawaii Municipal Bond Fund. Sales charges are deducted from proceeds from the sales of Hawaii Municipal Bond Fund shares prior to investment in Class A shares.
Cash Overdraft Charges
Per the terms of an informal agreement with Union Bank, N.A., the custodian of the Funds, if a Fund has a cash overdraft on a given day, it will be assessed an overdraft charge of the Prime Rate plus 4.00%. Cash overdraft charges are included in miscellaneous expenses on the Statements of Operations. For the six-month period ended June 30, 2012, there were no cash overdraft charges.
| 3. | INVESTMENT ADVISORY AGREEMENT |
Investment advisory services are provided to the Funds by Bishop Street Capital Management (the “Adviser”), a registered adviser and wholly owned subsidiary of First Hawaiian Bank. First Hawaiian Bank is a subsidiary of BancWest Corporation, itself a subsidiary of BNP Paribas. The Adviser is entitled to receive an annual fee of 0.74% of the average daily net assets of the Strategic Growth and the Dividend Value Funds, 0.55% of the average daily net assets of the High Grade Income Fund, and 0.35% of the average daily net assets of the Hawaii Municipal Bond Fund. The Adviser has contractually agreed to waive a portion of its advisory fee to the extent necessary to keep operating expenses at or below certain percentages of the respective average daily net assets. The contractual expense limitations are as follows:
| | | | |
Strategic Growth Fund, Class I Shares | | | 1.25% | |
Dividend Value Fund, Class I Shares | | | 1.05% | |
High Grade Income Fund, Class I Shares | | | 0.76% | |
Hawaii Municipal Bond Fund, Class I Shares | | | 0.55% | |
Hawaii Municipal Bond Fund, Class A Shares | | | 0.80% | |
42
These fees and waivers are labeled on the Statement of Operations as “Investment Adviser Fees.”
If at any point it becomes unnecessary for the Adviser to reduce fees and make expense reimbursements, the Board may permit the Adviser to retain the difference between the Total Annual Fund Operating Expenses and contractual expense limitations to recapture all or a portion of its prior expense reductions or reimbursements made during the preceding three year period during which this agreement was in place. During the six-month period ended June 30, 2012, the Adviser did not recapture any previously waived fees.
As of June 30, 2012, fees which were previously waived by the Investment Manager which may be subject to possible future reimbursement to the Adviser were as follows:
| | | | | | | | | | | | | | | | | | |
Dividend
Value
Fund | | | High
Grade Income
Fund | | | Hawaii
Municipal
Bond Fund | | | Total | | | Expires | |
| $ | 61,436 | | | $ | 204,556 | | | $ | 220,024 | | | $ | 486,016 | | | | 06/30/13 | |
| | 80,054 | | | | 187,748 | | | | 235,082 | | | | 502,884 | | | | 06/30/14 | |
| | 54,271 | | | | 178,390 | | | | 216,273 | | | | 448,934 | | | | 06/30/15 | |
BNP Paribas Asset Management, Inc. (“BNPP AM”) serves as the investment sub-adviser for the Strategic Growth Fund, pursuant to a sub-adviser agreement. BNPP AM is entitled to receive from the Adviser a fee, computed daily and paid monthly, at the annual rate of 0.37% of the average daily net assets of the Strategic Growth Fund.
Columbia Management Investment Advisers, LLC (“Columbia”) serves as the investment sub-adviser for the Dividend Value Fund, pursuant to a sub-adviser agreement. Columbia is entitled to receive from the Adviser a fee, computed daily and paid monthly, at the annual rate based on the average daily net assets of the Dividend Value Fund, under the following fee schedule: 0.360% on the first $75 million; 0.350% on the next $75 million; 0.325% on the next $100 million; 0.300% on the next $250 million; and 0.250% on assets over $500 million.
| 4. | ADMINISTRATIVE, CUSTODIAN, TRANSFER AGENT AND DISTRIBUTION SERVICES |
Pursuant to an administration agreement (the “Agreement”), SEI Investments Global Funds Services (“GFS”), a wholly owned subsidiary of SEI Investments Company, acts as the Trust’s Administrator. Under the terms of the Agreement, GFS is entitled to receive an annual fee of 0.20% of the average daily net assets of the Funds, and has voluntarily agreed to waive its administrative fee to 0.12% of each of the Funds’ average daily net assets excluding the Hawaii Municipal Bond Fund which is waived to 0.07% of its average daily net assets. These fees and waivers are labeled as “Administrative Fees” on the Statement of Operations.
| | | | |
| June 30, 2012 | | | | www.bishopstreetfunds.com |
43
| | | | |
| Bishop Street Funds | | | (unaudited) | |
Union Bank, N.A. acts as custodian (the “Custodian”) for the Funds. The Custodian plays no role in determining the investment policies of the Funds or which securities are to be purchased or sold by the Funds. These fees are labeled on the Statement of Operations as “Custodian Fees.”
DST Systems, Inc. (“DST”) acts as the Transfer Agent of the Trust. As such, DST provides transfer agency, dividend disbursing and shareholder services to the Trust. These fees are disclosed on the Statement of Operations as “Transfer Agent Fees.”
SEI Investments Distribution Co. (“SIDCO”), the “Distributer” a wholly owned subsidiary of SEI Investments Company, acts as the Trust’s Distributor pursuant to the distribution agreement. The Funds have adopted a Distribution Plan (the “Plan”) on behalf of Class A Shares pursuant to Rule 12b-1 under the Investment Company Act of 1940. The Plan provides that Class A Shares will bear the cost of their distribution expenses. SIDCO, as compensation for its services under the Plan, receives a distribution fee, computed daily and payable monthly, of 0.25% of the average daily net assets attributable to each Fund’s Class A Shares. This fee is disclosed as “Distribution Fees, Class A” on the Statement of Operations.
The Trust has adopted and entered into a shareholder service plan and agreement with SIDCO. Each Fund pays to SIDCO a shareholder servicing fee not to exceed an annual rate of 0.25% of the average daily net asset value of all shares of each fund, which is computed daily and paid monthly. Under the shareholder service plan, SIDCO may perform, or may compensate other service providers for performing various shareholder and administrative services. SIDCO may also retain as profit any difference between the fee it receives and amount it pays to third parties. For the period, SIDCO paid the entire amount of fees received under the shareholder service plan to First Hawaiian Bank, the Parent Company of Bishop Street Capital Management, for shareholder services performed for the Funds. SIDCO has voluntarily agreed to waive 0.15% of its shareholder servicing fee to the extent necessary to keep operating expenses at or below certain percentages of the respective average daily net assets. These fees and waivers are represented as “Shareholder Servicing Fees” on the Statement of Operations.
| 5. | TRANSACTIONS WITH AFFILIATES |
Certain officers of the Trust are also officers of SEI Investments Global Funds Services (the “Administrator”), a wholly owned subsidiary of SEI Investments Company, and/or SIDCO. Such officers are paid no fees by the Trust other than the Chief Compliance Officer (“CCO”) as described below, for serving as officers of the Trust.
A portion of the services provided by the CCO and his staff, who are employees of the Administrator, are paid for by the Trust as incurred. The services include regulatory oversight of the Trust’s Advisers and service providers as required by SEC regulations.
44
The CCO’s services and expenses have been approved by and are reviewed by the Board. These fees are disclosed on the Statement of Operations as “Chief Compliance Officer Fees.”
The Funds may lend securities having a market value up to one-third of each Fund’s total assets. Such loans are secured by collateral equal to no less than the market value of the loaned securities determined daily. Such collateral will be cash or debt securities issued or guaranteed by the U.S. Government or any agencies. Cash collateral received in connection with these loans is invested in short-term money market instruments. It is the Fund’s policy to obtain additional collateral from or return excess collateral to the borrower by the end of the next business day, following the valuation date of the securities loaned. Therefore, the value of the collateral held may be temporarily less than the value of the securities on loan. Lending securities entails a risk of loss to the Fund if and to the extent that the market value of the securities loans were to increase and the borrower did not increase the collateral accordingly, and the borrower fails to return the securities. The Fund could also experience delays and costs in gaining access to the collateral. The Fund bears the risk of any deficiency in the amount of the collateral available for return to the borrower due to any loss on the collateral invested. At June 30, 2012, there were no securities on loan.
| 7. | INVESTMENT TRANSACTIONS |
The cost of security purchases and the proceeds from the sale and maturities of securities, other than short-term investments, for the six-month period ended June 30, 2012 are presented below for the Funds.
| | | | | | | | | | | | | | | | |
| | | Strategic
Growth
Fund | | | Dividend
Value
Fund | | | High Grade
Income
Fund | | | Hawaii
Municipal
Bond Fund | |
Purchases | | | | | | | | | | | | | | | | |
U.S. Government Securities | | $ | — | | | $ | — | | | $ | 9,917 | | | $ | — | |
Other | | | 22,209 | | | | 4,621 | | | | 11,633 | | | | 23,208 | |
Sales and Maturities | | | | | | | | | | | | | | | | |
U.S. Government Securities | | $ | — | | | $ | — | | | $ | 11,381 | | | $ | — | |
Other | | | 28,456 | | | | 8,567 | | | | 12,486 | | | | 21,262 | |
| 8. | FEDERAL TAX INFORMATION |
The timing and characterization of certain income and capital gains distributions are determined annually in accordance with Federal tax regulations which may differ from accounting principles generally accepted in the United States of America.
| | | | |
| June 30, 2012 | | | | www.bishopstreetfunds.com |
45
| | | | |
| Bishop Street Funds | | | (unaudited) | |
As a result, net investment income (loss) and net realized gain (loss) on investment transactions for the reporting period may differ from distributions during such period. These book/tax differences may be temporary or permanent in nature. To the extent these differences are permanent, they are charged or credited to undistributed net investment income/(loss), paid-in capital or accumulated net realized gain/(loss), as appropriate, in the period that the differences arise.
The tax character of dividends and distributions declared during the years ended December 31, 2011 and 2010 were as follows:
| | | | | | | | | | | | | | | | | | | | |
| | | Ordinary
Income | | | Tax Exempt
Income | | | Long Term
Capital Gain | | | Return of
Capital | | | Total | |
Dividend Value Fund | | | | | | | | | | | | | | | | | | | | |
2011 | | $ | 1,202 | | | $ | — | | | $ | — | | | $ | 2 | | | $ | 1,204 | |
2010 | | | 1,009 | | | | — | | | | — | | | | 1 | | | | 1,010 | |
High Grade Income Fund | | | | | | | | | | | | | | | | | | | | |
2011 | | $ | 3,339 | | | $ | — | | | $ | 2,937 | | | $ | — | | | $ | 6,276 | |
2010 | | | 6,023 | | | | — | | | | 2,617 | | | | — | | | | 8,640 | |
Hawaii Municipal Bond Fund | | | | | | | | | | | | | | | | | | | | |
2011 | | $ | — | | | $ | 5,177 | | | $ | — | | | $ | — | | | $ | 5,177 | |
2010 | | | — | | | | 5,865 | | | | 230 | | | | — | | | | 6,095 | |
As of December 31, 2011, the components of Distributable Earnings (Accumulated Losses) on a tax basis were as follows:
| | | | | | | | | | | | | | | | |
| | | Strategic
Growth
Fund | | | Dividend
Value
Fund | | | High Grade
Income
Fund | | | Hawaii
Municipal
Bond Fund | |
Undistributed Ordinary Income | | $ | — | | | $ | — | | | $ | — | | | $ | 2 | |
Undistributed Long-Term Capital Gain Income | | | — | | | | — | | | | 310 | | | | — | |
Capital Loss Carryforwards | | | (8,500 | ) | | | (22,080 | ) | | | — | | | | (532 | ) |
Post October Losses | | | (708 | ) | | | (58 | ) | | | (19 | ) | | | — | |
Unrealized Appreciation | | | 7,617 | | | | 7,590 | | | | 6,039 | | | | 7,486 | |
Other Temporary Differences | | | — | | | | — | | | | — | | | | 2 | |
| | | | | | | | | | | | | | | | |
Total Distributable Earnings (Accumulated Losses) | | $ | (1,591 | ) | | $ | (14,548 | ) | | $ | 6,330 | | | $ | 6,958 | |
| | | | | | | | | | | | | | | | |
Post-October losses represent losses realized on investment transactions from November 1, 2010 through December 31, 2011 that, in accordance with Federal income tax regulations, the Funds have elected to defer and treat as having arisen in the following fiscal year.
46
For Federal income tax purposes, capital loss carryforwards represent realized losses of the Funds that may be carried forward for a maximum period of eight years and applied against future capital gains as follows:
| | | | | | | | |
| | | Strategic
Growth
Fund | | | Dividend
Value
Fund | |
Dec. 2019 | | $ | — | | | $ | — | |
Dec. 2018 | | | — | | | | 1,838 | |
Dec. 2017 | | | 8,500 | | | | 14,624 | |
Dec. 2016 | | | — | | | | 5,568 | |
| | | | | | | | |
Total | | $ | 8,500 | | | $ | 22,030 | |
| | | | | | | | |
During the year ended December 31, 2011 the Strategic Growth Fund utilized capital loss carryforwards of $2,256 to offset realized capital gains.
Under the recently enacted Regulated Investment Company Modernization Act of 2010, Funds will be permitted to carry forward capital losses incurred in taxable years beginning after December 22, 2010 for an unlimited period. However, any losses incurred during those future taxable years will be required to be utilized prior to the losses incurred in pre-enactment taxable years. As a result of this ordering rule, pre-enactment capital loss carryforwards may be more likely to expire unused. Additionally, post-enactment capital losses that are carried forward will retain their character as either short-term or long-term capital losses rather than being considered all short-term as under previous law. Losses carried forward under these new provisions are as follows:
| | | | | | | | | | | | |
| | | Short-Term
Loss | | | Long-Term
Loss | | | Total* | |
Dividend Value Fund | | $ | — | | | $ | 50 | | | $ | 50 | |
Hawaii Municipal Bond Fund | | | 532 | | | | — | | | | 532 | |
| * | | This table should be used in conjunction with the capital loss carryforwards table. |
| | | | |
| June 30, 2012 | | | | www.bishopstreetfunds.com |
47
| | | | |
| Bishop Street Funds | | | (unaudited) | |
The aggregate gross unrealized appreciation and depreciation of securities held by the Strategic Growth, Dividend Value, High Grade Income, and Hawaii Municipal Bond Funds for Federal income tax purposes at June 30, 2012 were as follows:
| | | | | | | | | | | | | | | | |
| | | Strategic
Growth
Fund | | | Dividend
Value
Fund | | | High Grade
Income
Fund | | | Hawaii
Municipal
Bond Fund | |
Federal Tax Cost | | $ | 40,818 | | | $ | 47,518 | | | $ | 82,552 | | | $ | 147,010 | |
| | | | | | | | | | | | | | | | |
Gross Unrealized Appreciation | | | 8,852 | | | | 11,437 | | | | 6,452 | | | | 8,655 | |
Gross Unrealized Depreciation | | | (1,854 | ) | | | (1,041 | ) | | | (73 | ) | | | (84 | ) |
| | | | | | | | | | | | | | | | |
Net Unrealized Appreciation | | $ | 6,998 | | | $ | 10,396 | | | $ | 6,379 | | | $ | 8,571 | |
| | | | | | | | | | | | | | | | |
The Hawaii Municipal Bond Fund invests primarily in debt instruments in the state of Hawaii. The issuers’ ability to meet their obligations may be affected by economic developments in that state. In addition, each Fund’s investments in debt securities are subject to “credit risk,” which is the risk that an issuer will be unable, or will be perceived to be unable, to repay its obligations at maturity. Funds that invest primarily in high quality debt securities generally are subject to less credit risk than funds that invest in lower quality debt securities.
Certain debt securities are backed by credit enhancements from various financial institutions and financial guarantee assurance agencies. These credit enhancements reinforce the credit quality of the individual securities; however, if any of the financial institutions or financial guarantee assurance agencies’ credit quality should deteriorate, it could cause the individual security’s credit quality to change. Additionally, if any of the Funds concentrate their credit enhancements in any one financial institution, the risk of credit quality deterioration increases.
The value of asset-backed securities may be affected by the credit risk of the servicing agent for the pool, the originator of the loans or receivables, or the financial institution(s) providing the credit support. In addition to credit risk, asset-backed securities and other securities with early redemption features are subject to pre-payment risk. During periods of declining interest rates, prepayment of loans underlying asset-backed securities can be expected to accelerate or an issuer may retire an outstanding bond early to reduce interest costs. A Fund’s ability to maintain positions in such securities will be affected by reductions in the principal amount of such securities resulting from prepayments, and its ability to reinvest the returns of principal at comparable yields is subject to the general prevailing interest rates at that time.
48
In the normal course of business, the Funds enter into contracts that provide general indemnifications. The Funds’ maximum exposure under these arrangements is dependent on future claims that may be made against the Funds and, therefore, cannot be established; however, based on experience, the risk of loss from such claims is considered remote.
The Funds entered into an agreement which enables them to participate in a $5 million unsecured committed revolving line of credit on a first come, first served basis, with Union Bank, N.A. (the “Bank”) which expires June 09, 2013. The proceeds from the borrowings shall be used to finance the Funds’ short term general working capital requirements, including the funding of shareholder redemptions. Interest is charged to the Funds based on their borrowings during the period at the Bank current reference rate minus 1%. As of June 30, 2012 the Funds had borrowings of $5 outstanding. For the six-month period ended June 30, 2012, the Funds had the following borrowings under the line of credit:
| | | | | | | | | | | | | | | | |
| | | Average
Borrowings
(000) | | | Borrowing
Costs (000) | | | Number
of Days
outstanding | | | Weighted
Average
Interest Rate | |
Strategic Growth Fund | | $ | 36 | | | Less than $ | 1 | | | | 14 | | | | 2.25 | % |
Dividend Value Fund | | | 6 | | | Less than $ | 1 | | | | 3 | | | | 2.25 | % |
Hawaii Municipal Bond Fund | | | 2 | | | Less than $ | 1 | | | | 2 | | | | 2.25 | % |
At June 30, 2012, the percentage of total shares outstanding held by shareholders for each Fund, which comprised omnibus accounts that were held on behalf of several individual shareholders, was as follows:
| | | | | | | | |
| | | Number of
Shareholders | | | % of Outstanding
Shares | |
Strategic Growth Fund, Class I Shares | | | 2 | | | | 97.43 | % |
Dividend Value Fund, Class I Shares | | | 1 | | | | 99.13 | |
High Grade Income Fund, Class I Shares | | | 2 | | | | 92.33 | |
Hawaii Municipal Bond Fund, Class I Shares | | | 1 | | | | 78.47 | |
Hawaii Municipal Bond Fund, Class A Shares | | | 1 | | | | 7.87 | |
The Funds have evaluated the need for disclosures and/or adjustments resulting from subsequent events through the date the financial statements were available to be issued. Based on this evaluation, no additional disclosures or adjustments were required to the financial statements.
| | | | |
| June 30, 2012 | | | | www.bishopstreetfunds.com |
49
| | | | |
| Bishop Street Funds | | | (unaudited) | |
Disclosure of Fund Expenses
All mutual funds have operating expenses. As a shareholder of a mutual fund you incur two types of costs: (1) transaction costs, including applicable sales charges (loads); and (2) ongoing costs, which include (among others) costs for portfolio management, administrative services, distribution and service (12b-1), shareholder service fees, and shareholder reports like this one. It is important for you to understand the impact of these costs on your investment returns.
Operating expenses such as these are deducted from a mutual fund’s gross income and directly reduce its final investment return. These expenses are expressed as a percentage of the mutual fund’s average net assets; this percentage is known as the mutual fund’s expense ratio.
The following examples use the expense ratio and are intended to help you understand the ongoing costs (in dollars) of investing in your Fund and to compare these costs with those of other mutual funds. The examples are based on an investment of $1,000 made at the beginning of the period shown and held for the entire period.
The table on the next page illustrates your Fund’s costs in two ways:
| • | | Actual Fund Return. This section helps you to estimate the actual expenses after fee waivers that your Fund incurred over the period. The “Expenses Paid During Period” column shows the actual dollar expense cost incurred by a $1,000 investment in the Fund, and the “Ending Account Value” number is derived from deducting that expense cost from the Fund’s gross investment return. |
You can use this information, together with the actual amount you invested in the Fund, to estimate the expenses you paid over that period. Simply divide your actual account value by $1,000 to arrive at a ratio (for example, an $8,600 account value divided by $1,000 = 8.6), then multiply that ratio by the number shown for your Fund under “Expenses Paid During Period.”
| • | | Hypothetical 5% Return. This section helps you compare your Fund’s costs with those of other mutual funds. It assumes that the Fund had an annual 5% return before expenses during the year, but that the expense ratio (Column 3) for the period is unchanged. This example is useful in making comparisons because the Securities and Exchange Commission requires all mutual funds to make this 5% calculation. You can assess your Fund’s comparative cost by comparing the hypothetical result for your Fund in the “Expenses Paid During Period” column with those that appear in the same charts in the shareholder reports for other funds. |
Note: Because the return is set at 5% for comparison purposes — NOT your Fund’s actual return — the account values shown may not apply to your specific investment.
50
| | | | | | | | | | | | | | | | |
| | | Beginning
Account
Value
1/1/12 | | | Ending
Account
Value
6/30/12 | | | Annualized
Expense
Ratios | | | Expenses
Paid During
Period* | |
Strategic Growth Fund — Class I | | | | | | | | | | | | | | | | |
| |
Actual Fund Return | | $ | 1,000.00 | | | $ | 1,074.30 | | | | 1.15 | % | | $ | 5.93 | |
Hypothetical 5% Return | | | 1,000.00 | | | | 1,019.14 | | | | 1.15 | | | | 5.77 | |
| |
Dividend Value Fund — Class I | | | | | | | | | | | | | | | | |
| |
Actual Fund Return | | $ | 1,000.00 | | | $ | 1,075.90 | | | | 1.05 | % | | $ | 5.42 | |
Hypothetical 5% Return | | | 1,000.00 | | | | 1,019.64 | | | | 1.05 | | | | 5.27 | |
| |
High Grade Income Fund — Class I | | | | | | | | | | | | | | | | |
| |
Actual Fund Return | | $ | 1,000.00 | | | $ | 1,028.40 | | | | 0.76 | % | | $ | 3.83 | |
Hypothetical 5% Return | | | 1,000.00 | | | | 1,021.08 | | | | 0.76 | | | | 3.82 | |
| |
Hawaii Municipal Bond Fund — Class I | | | | | | | | | | | | | | | | |
| |
Actual Fund Return | | $ | 1,000.00 | | | $ | 1,027.60 | | | | 0.55 | % | | $ | 2.77 | |
Hypothetical 5% Return | | | 1,000.00 | | | | 1,022.13 | | | | 0.55 | | | | 2.77 | |
| |
Hawaii Municipal Bond Fund — Class A | | | | | | | | | | | | | | | | |
| |
Actual Fund Return | | $ | 1,000.00 | | | $ | 1,026.30 | | | | 0.80 | % | | $ | 4.03 | |
Hypothetical 5% Return | | | 1,000.00 | | | | 1,020.89 | | | | 0.80 | | | | 4.02 | |
| |
| * | | Expenses are equal to the Fund’s annualized expense ratio multiplied by the average account value over the period, multiplied by 182/366 (to reflect the one-half year period). |
| | | | |
| June 30, 2012 | | | | www.bishopstreetfunds.com |
51
| | | | |
| Bishop Street Funds | | | (unaudited) | |
Approval of Investment Advisory Agreements
Pursuant to Section 15(c) of the Investment Company Act of 1940 (the “1940 Act”), the Board of Trustees (the “Board”) of Bishop Street Funds (the “Trust”) must annually review and re-approve the following agreements (collectively, the “Agreements”):
| | • | | the Advisory Agreement between Bishop Street Capital Management (the “Adviser”) and the Trust, on behalf of the Dividend Value Fund, the Government Money Market Fund, the Hawaii Municipal Bond Fund, the High Grade Income Fund and the Strategic Growth Fund (collectively, the “Funds”); |
| | • | | the Sub-Advisory Agreement between the Adviser and Fischer Francis Tree & Watts, Inc. (“FFT&W”), on behalf of the Government Money Market Fund; |
| | • | | the Sub-Advisory Agreement between the Adviser and Columbia Management Investment Advisers, LLC (“Columbia”), on behalf of the Dividend Value Fund; |
| | • | | and the Sub-Advisory Agreement between the Adviser and BNP Paribas Asset Management, Inc. (“BNP Paribas”), on behalf of the Strategic Growth Fund (FFT&W, Columbia and BNP Paribas collectively referred to as the “Sub-Advisers”). |
After their initial two-year terms, the Agreements must be re-approved: (i) by the vote of the Trustees or by a vote of the shareholders of each Fund; and (ii) by the vote of a majority of the Trustees who are not parties to the Agreements or “interested persons” of any party thereto, as defined in the 1940 Act (the “Independent Trustees”), cast in person at a meeting called for the purpose of voting on such approval. Each year, the Board calls and holds a meeting to decide whether to renew the Agreements for additional one-year terms. In preparation for the meeting, the Board requests and reviews a wide variety of information from the Advisers and the Sub-Advisers. The Trustees use this information, as well as other information that the Adviser, the Sub-Advisers and other service providers of the Funds may submit to the Board, to help them decide whether to renew the Agreements for an additional year.
Prior to this year’s meeting held on February 14-15, 2012, the Board, including the Independent Trustees advised by their independent legal counsel, reviewed written materials from the Adviser and the Sub-Advisers regarding, among other things: (i) the nature, extent and quality of the services to be provided by the Adviser and the Sub-Advisers; (ii) the investment performance of the Funds, the Adviser and the Sub-Advisers; (iii) the costs of the services to be provided and profits to be realized by the Adviser, the Sub-Advisers, and their affiliates from their relationship with the Funds; (iv) the extent to which economies of scale would be realized as the Funds grow; and (v) whether fee levels reflect these economies of scale for the benefit of Fund investors, as discussed in further detail below.
52
At the meeting, representatives from the Adviser and the Sub-Advisers, along with other Fund service providers, presented additional oral and written information to help the Board evaluate the Adviser and the Sub-Advisers’ fees and other aspects of the Agreements. Among other things, representatives from the Adviser and each Sub-Adviser presented overviews of their advisory businesses, including the Adviser and each Sub-Adviser’s investment personnel, assets under management, investment process and trading practices, and approach to risk management. A representative from the Adviser also discussed the Adviser’s history, ownership structure, business plan and oversight of sub-advisers. The representatives from FFT&W also discussed FFT&W’s history, client base and experience in managing fixed income portfolios. The representatives from Columbia also discussed Columbia’s compliance program, as well as the Dividend Value Fund’s portfolio characteristics with respect to sector weightings and top ten holdings. The representatives from BNP Paribas also discussed BNP Paribas’ client base, as well as the Strategic Growth Fund’s portfolio characteristics with respect to sector weightings. The Trustees then discussed the written materials that the Board received before the meeting and the Adviser and the Sub-Advisers’ oral presentations and any other information that the Board received at the meeting, and deliberated on the renewal of the Agreements in light of this information. In its deliberations, the Board considered the factors and reached the conclusions described below relating to the selection of the Adviser and each of the Sub-Advisers and the re-approval of the Agreements, and did not identify any single piece of information discussed below that was all-important, controlling or determinative of its decision.
Nature, Extent, and Quality of Services Provided by the Adviser and the Sub-Advisers
In considering the nature, extent and quality of the services provided by the Adviser and the Sub-Advisers, the Board reviewed the portfolio management services provided by the Adviser and each of the Sub-Advisers to the Fund(s) they managed, including the quality and continuity of the Adviser and the Sub-Advisers’ portfolio management personnel. The most recent investment adviser registration form (“Form ADV”) for the Adviser and each of the Sub-Advisers was provided to the Board, as was the response of the Adviser and each Sub-Adviser to a detailed series of questions which included, among other things, information about the background and experience of the portfolio managers primarily responsible for the day-to-day management of each respective Fund.
The Trustees also considered other services to be provided by the Adviser and the Sub-Advisers to the Fund(s) they manage, such as selecting broker-dealers for executing portfolio transactions, monitoring adherence to the Funds’ investment restrictions, and monitoring compliance with various Fund policies and procedures and with applicable securities
| | | | |
| June 30, 2012 | | | | www.bishopstreetfunds.com |
53
| | | | |
| Bishop Street Funds | | | (unaudited) | |
regulations. Based on the factors above, as well as those discussed below, the Board concluded that it was satisfied with the nature, extent and quality of the services provided to the Funds by the Adviser and the Sub-Advisers.
Investment Performance of the Funds, the Adviser and the Sub-Advisers
The Board was provided with information regarding each Fund’s performance since the Agreements were last renewed, as well as information regarding each Fund’s performance since its inception. The Board also compared each Fund’s performance to its benchmark index and other similar mutual funds over various periods of time. At the meeting, representatives from the Adviser and the Sub-Advisers provided information regarding and led a discussion of factors impacting the performance of their respective Fund(s) over the past year, outlining current market conditions and explaining their expectations and strategies for the future. The Board noted that the Dividend Value Fund had generally outperformed its benchmark, particularly since the time that Columbia became sub-adviser to the Fund. With respect to the Government Money Market Fund, the Board noted that the Fund’s performance was comparable to that of its benchmark index. With respect to the High Grade Income Fund, the Board noted that although the Fund underperformed its benchmark over recent periods of time, the Fund’s long-term performance was generally favorable to that of its benchmark. With respect to the Hawaii Municipal Bond and Strategic Growth Funds, the Board noted that although the Funds underperformed their respective benchmarks over various periods of time, the Funds’ performance was not substantially below that of their respective benchmarks and did not necessitate any significant additional review. The Board also noted and took into consideration that the Hawaii Municipal Bond Fund’s benchmark index covers the broader municipal bond market and that the Fund had outperformed, over various periods of time, a peer group index comprised solely of Hawaii municipal bond funds. Based on this information, the Board concluded that it was satisfied with the investment results that the Adviser and each Sub-Adviser had been able to achieve for their respective Fund(s).
Costs of Advisory Services, Profitability and Economies of Scale
In concluding that the advisory fees payable to the Adviser and each of the Sub-Advisers were reasonable, the Trustees reviewed a report of the fees paid to the Adviser and each Sub-Adviser as well as the costs of services provided by and the profits realized by the Adviser and each of the Sub-Advisers from their relationship with the Funds, and concluded that such profits were not excessive. The Trustees also reviewed reports comparing the expense ratio and advisory fee paid by each Fund to those paid by other comparable mutual funds and noted that each Fund’s total fees and expenses, after waivers, were within the range of the average fees and expenses incurred by other peer funds. The Board concluded that the advisory fees
54
were the result of arm’s length negotiations and appeared reasonable in light of the services rendered. The Board also considered the Adviser and the Sub-Advisers’ commitment to managing the Funds and the Adviser’s willingness to continue its expense limitation and fee waiver arrangement with the Funds. In addition, the Board considered whether economies of scale were realized during the current contract period, but did not conclude that such economies of scale had yet been achieved with respect to the Funds.
Based on the Board’s deliberations and its evaluation of the information described above, the Board, including all of the Independent Trustees, unanimously: (a) concluded that terms of each Agreement are fair and reasonable; (b) concluded that the Adviser and each of the Sub-Adviser’s fees are reasonable in light of the services that the Adviser and each of the Sub-Advisers provide to the respective Fund(s); and (c) agreed to renew each Agreement for another year.
| | | | |
| June 30, 2012 | | | | www.bishopstreetfunds.com |
55
INVESTMENT ADVISER
BISHOP STREET CAPITAL MANAGEMENT
HONOLULU, HI 96813
ADMINISTRATOR
SEI INVESTMENTS GLOBAL FUNDS SERVICES
OAKS, PA 19456
DISTRIBUTOR
SEI INVESTMENTS DISTRIBUTION CO.
OAKS, PA 19456
TRANSFER AGENT
DST SYSTEMS, INC.
KANSAS CITY, MO 64121
CUSTODIAN
UNION BANK, N.A.
SAN FRANCISCO, CA 94101
LEGAL COUNSEL
MORGAN, LEWIS & BOCKIUS LLP
PHILADELPHIA, PA 19103
INDEPENDENT REGISTERED PUBLIC ACCOUNTING FIRM
PRICEWATERHOUSECOOPERS LLP
PHILADELPHIA, PA 19103

FORMOREINFORMATIONABOUT BISHOP STREET FUNDS,CALL 1-800-262-9565
ORYOUR INVESTMENT SPECIALIST
VISITUSONLINEATWWW.BISHOPSTREETFUNDS.COM
| | |
 | | BISHOP STREET FUNDS P.O. BOX 219721 KANSAS CITY, MO 64121-9721 |
THISREPORTANDTHEFINANCIALSTATEMENTSCONTAINEDHEREINARESUBMITTEDFORTHEGENERALINFORMATIONOF BISHOP STREET FUNDS’SHAREHOLDERS. THISREPORTISNOTAUTHORIZEDFORDISTRIBUTIONTOPROSPECTIVEINVESTORSUNLESSPRECEDEDORACCOMPANIEDBYANEFFECTIVEPROSPECTUS.
SHARESOF BISHOP STREET FUNDSARE NOTDEPOSITSOROBLIGATIONSOF,ORGUARANTEEDBY FIRST HAWAIIAN BANKORANYOFITSAFFILIATES. SUCHSHARESAREALSO NOTFEDERALLYINSUREDBYTHE FEDERAL DEPOSIT INSURANCE CORPORATION, THE FEDERAL RESERVE BOARD,ORANYOTHERAGENCY. INVESTMENTINSHARESOFMUTUALFUNDSINVOLVESRISK,INCLUDINGTHEPOSSIBLELOSSOFPRINCIPAL. THE BISHOP STREET FUNDSAREDISTRIBUTEDBY SEI INVESTMENTS DISTRIBUTION CO.,WHICHIS NOTAFFILIATEDWITH FIRST HAWAIIAN BANK, BANKOFTHE WESTOR BANCWEST CORPORATION. BANCWEST CORPORATIONISAWHOLLY-OWNEDSUBSIDIARYOF BNP PARIBAS.
BSF-SA-004-1800
Not applicable for semi-annual report.
| Item 3. | Audit Committee Financial Expert. |
Not applicable for semi-annual report.
| Item 4. | Principal Accountant Fees and Services. |
Not applicable for semi-annual report.
| Item 5. | Audit Committee of Listed Registrants. |
Not applicable to open-end management investment companies.
| Item 6. | Schedule of Investments. |
Schedule of Investments is included as part of the Report to Shareholders filed under Item 1 of this form.
| Item 7. | Disclosure of Proxy Voting Policies and Procedures for Closed-End Management Investment Companies. |
Not applicable to open-end management investment companies.
| Item 8. | Portfolio Managers of Closed-End Management Investment Companies. |
Not applicable. Effective for closed-end management investment companies for fiscal years ending on or after December 31, 2005.
| Item 9. | Purchases of Equity Securities by Closed-End Management Company and Affiliated Purchasers. |
Not applicable to open-end management investment companies.
| Item 10. | Submission of Matters to a Vote of Security Holders. |
There have been no changes to the procedures by which shareholders may recommend nominees to the Registrant’s Board of Trustees during the period covered by this report.
| Item 11. | Controls and Procedures. |
(a) The Registrant’s principal executive and principal financial officers, or persons performing similar functions, have concluded that the Registrant’s disclosure controls and procedures (as defined in Rule 30a-3(c) under the Act (17 CFR 270.30a-3(c))) as of a date within 90 days of the filing date of the report, are effective based on the evaluation of these controls and procedures required by Rule 30a-3(b) under the Act (17 CFR 270.30a-3(b)) and Rules 13a-15(b) or 15d-15(b) under the Exchange Act (17 CFR 240.30a-15(b)) or 240.15d-15(b)).
(b) There has been no change in the Registrant’s internal control over financial reporting (as defined in Rule 30a-3(d) under the Act (17 CFR 270.30a-3(d)) that occurred during the second fiscal quarter of the period covered by this report that has materially affected, or is reasonably likely to materially affect, the Registrant’s internal control over financial reporting.
(a)(1) Not applicable for semi-annual report.
(a)(2) A separate certification for the principal executive officer and the principal financial officer of the Registrant as required by Rule 30a-2(a) under the Investment Company Act of 1940, as amended (17 CFR 270.30a-2(a)), is filed herewith.
(b) Officer certifications as required by Rule 30a-2(b) under the Investment Company Act of 1940, as amended (17 CFR 270.30a-2(b)) also accompany this filing as an exhibit.
SIGNATURES
Pursuant to the requirements of the Securities Exchange Act of 1934 and the Investment Company Act of 1940, the registrant has duly caused this report to be signed on its behalf by the undersigned, thereunto duly authorized.
| | | | | | |
| (Registrant) | | | | | | Bishop Street Funds |
| | | |
| By (Signature and Title)* | | | | | | /s/ Michael Beattie |
| | | | | | Michael Beattie |
| | | | | | President |
| | | |
| Date: September 6, 2012 | | | | | | |
Pursuant to the requirements of the Securities Exchange Act of 1934 and the Investment Company Act of 1940, this report has been signed below by the following persons on behalf of the registrant and in the capacities and on the dates indicated.
| | | | | | |
| By (Signature and Title)* | | | | | | /s/ Michael Beattie |
| | | | | | Michael Beattie |
| | | | | | President |
| | | |
| Date: September 6, 2012 | | | | | | |
| | | |
| By (Signature and Title)* | | | | | | /s/ Michael Lawson |
| | | | | | Michael Lawson |
| | | | | | Treasurer, Controller & CFO |
| | | |
| Date: September 6, 2012 | | | | | | |
| * | Print the name and title of each signing officer under his or her signature. |