Table of Contents
SECURITIES AND EXCHANGE COMMISSION
Washington, D.C. 20549
FORM 6-K
Report of Foreign Issuer
Pursuant to Rule 13a-16 or 15d-16
of the Securities Exchange Act of 1934
For the Month of January 2023
Commission File Number: 001-32294

TATA MOTORS LIMITED
(Translation of registrant’s name into English)
BOMBAY HOUSE
24, HOMI MODY STREET,
MUMBAI 400 001, MAHARASHTRA, INDIA
Telephone # 91 22 6665 8282 Fax # 91 22 6665 7799
(Address of principal executive office)
Indicate by check mark whether the registrant files or will file annual reports under cover Form 20-F or Form 40-F.
Form 20-F ☒ Form 40-F ☐
Indicate by check mark if the registrant is submitting the Form 6-K in paper as permitted by Regulation S-T Rule 101(b)(1):
Yes ☐ No ☒
Indicate by check mark if the registrant is submitting the Form 6-K in paper as permitted by Regulation S-T Rule 101(b)(7):
Yes ☐ No ☒
Indicate by check mark whether by furnishing the information contained in this Form, the Registrant is also thereby furnishing the information to the Commission pursuant to Rule 12g3-2(b) under the Securities Exchange Act of 1934:
Yes ☐ No ☒
If “Yes” is marked, indicate below the file number assigned to the registrant in connection with Rule 12g 3-2(b): Not Applicable
Table of Contents
Table of Contents
SIGNATURE
Pursuant to the requirements of the Securities Exchange Act of 1934, the registrant has duly caused this report to be signed on its behalf by the undersigned, thereunto duly authorised.
| Tata Motors Limited | ||
| By: | /s/ Mr Maloy Kumar Gupta | |
| Name: | Mr Maloy Kumar Gupta | |
| Title: | Company Secretary | |
Dated: January 26, 2023
Table of Contents

Table of Contents
| 3 | ||||
| 3 | ||||
| 4 | ||||
| 5 | ||||
| 6 | ||||
| 7 | ||||
| 7 | ||||
| 7 | ||||
| 7 | ||||
| 7 | ||||
| 8 |
Table of Contents
Group, Company, Jaguar Land Rover, JLR plc and JLR refers to Jaguar Land Rover Automotive plc and its subsidiaries. Note 2 to the accounts defines a series of alternative performance measures some of which are stated below, along with certain abbreviations.
| Adjusted EBITDA margin | measured as adjusted EBITDA as a percentage of revenue. | |
| Adjusted EBIT margin | measured as adjusted EBIT as a percentage of revenue. | |
| Net debt/cash | defined by the Company as cash and cash equivalents plus short-term deposits and other investments less total balance sheet borrowings. | |
| Q3 FY23 | 3 months ended 31 December 2022 | |
| Q2 FY23 | 3 months ended 30 September 2022 | |
| Q3 FY22 | 3 months ended 31 December 2021 | |
| FY23 YTD | 9-months ending 31 December 2022 | |
| FY22 YTD | 9-months ending 31 December 2021 | |
| China Joint Venture | Chery Jaguar Land Rover Automotive Co., Ltd. | |
2
Table of Contents
Management’s discussion and analysis of financial condition and results of operations
Revenue was £6.0 billion in Q3 FY23, up 28% year-on-year from Q3 FY22 reflecting favourable volume, model mix, pricing and FX, offset partially by planned marketing and product development costs. Wholesale volumes (excluding China Joint Venture) of 79,591 up 15.0% year-on-year and 5.7% on the prior quarter. Wholesale volumes are at their highest level since Q1 FY22, reflecting a gradual improvement in chip supplies while we are continuing to see strong customer demand with a new record order book of 215,000 units.
Market environment and business developments
| • | The supply of semiconductors saw gradual improvement in the quarter, resulting in the highest level of wholesales since Q1 FY22 when we began to see the effects of the semiconductor shortages on our business. |
| • | The production ramp up of New Range Rover and New Range Rover Sport continued with 27,456 units wholesaled in the quarter, up from 13,537 in Q2. |
| • | Strong demand continues with client order book now at 215,000 units; our three most profitable models, the Range Rover, Range Rover Sport and Defender account for over 70% of the order book. |
| • | Although constraints continue, chip supply is expected to continue to gradually improve, and partnership agreements put in place with key chip suppliers are providing greater visibility over near-term supply. |
| • | Inflation continues to remain at elevated levels, exacerbated by the Ukraine conflict, higher energy prices and post Covid supply disruption. We are working to offset this through Refocus profitability improvement actions. |
| • | China was impacted by localised Covid-19 lockdowns during the first half of the quarter while the relaxation of Covid-19 policies from December led a surge in infection rates. |
| • | Increasing interest rates in 2022 (including the UK, USA and Europe) will flow through into financing costs for consumers and could impact future demand. |
Revenue and profits, quarter ending 31 December 2022
| • | Revenue was £6.0 billion in Q3 FY23, up 28.1% from Q3 FY22 reflecting favourable volumes, model mix, pricing and FX |
| • | Adjusted EBITDA1 was £716 million (EBITDA margin: 11.9%) in Q3 FY23, up from £565 million (EBITDA margin: 12.0%) in Q3 FY22 |
| • | Adjusted EBIT1 was £225 million (3.7%) in Q3 FY23, up from £68 million (1.4%) in Q3 FY22 |
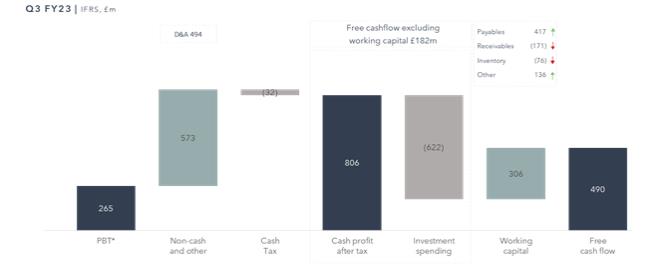
| • | The profit before tax was £265 million in Q3 FY23 compared to a loss of £(9) million in Q3 FY22. The year-on-year improvement primarily reflects the following factors: |
| • | £276 million favourable volume and mix |
| • | £224 million favourable pricing and lower variable marketing costs |
| • | £(332) million increase in material and manufacturing costs as a result of inflationary pressures, offset slightly by a £70 million improvement in warranty costs |
| • | £(66) million increase in structural costs, reflecting SG&A (up £85m primarily for planned marketing), product development engineering £(20) million offset by £29 million favourable Labour & Overhead (L&OH) costs |
| • | £173 million for FX and commodities, including £259 million impact of a generally weaker pound on revenue and costs partially offset by £(230) million of realised hedges, and £139 million of FX revaluation |
| • | Profit after tax was £261 million (after a tax charge of £(4) million) for Q3 FY23, an improvement from £(67) million in Q3 FY22 (including a tax charge of £(58) million) |
Revenue and profits, fiscal year to date
| • | Revenue was £15.7 billion FY23 YTD, up from £13.6 billion FY22 YTD reflecting the increased volumes, strong model mix and pricing |
| • | Adjusted EBITDA1 was £1,536 million (EBITDA margin: 9.8%) FY23 YTD, up from £1,297 million FY22 YTD (EBITDA margin: 9.6%) |
| • | Adjusted EBIT1 was £83 million (Adjusted EBIT margin: 0.5%) FY23 YTD, up from £(159) million (Adjusted EBIT margin: -1.2%) FY22 YTD |
| • | PBT was a loss before tax of £(432) million (before £155m favourable pension related exceptional item) for FY23 YTD compared to a loss of £(421) million for FY22 YTD. |
| • | After the exceptional item, the FY23 YTD loss before tax was £(277) million . The £144 million year-on-year improvement primarily reflects the following factors: |
| • | The £155 million exceptional item related to changes to the defined benefit pension scheme |
| • | £347 million favourable volume and mix |
| • | £491 million favourable pricing and lower variable marketing costs |
| 1 | Please see note 2 of the financial statements for alternative performance measures |
3
Table of Contents
| • | £(746) million increase in material and manufacturing costs as a result of inflationary pressures, offset by £91 million of favourable warranty to make overall contribution costs £(655) million higher |
| • | £(195) million increase in structural costs, including £(127) million increase in engineering costs expensed, £(95)m higher SG&A costs and £27m due to other costs including the non-recurrence of favourable changes to battery end of life reserves in Q2 FY22 and £29m lower labour and overhead costs. |
| • | FX and commodities are flat FY23 YTD (£1m favourable) as the £721 million impact of a generally weaker pound on revenue and costs is offset by £(535) million of realised hedges and £(185) million of revaluation (including commodity revaluation) |
| • | Profit after tax after exceptional items was a loss of £(319) million (including tax charge of £(42) million) for FY23 YTD, an improvement from £(734) million in FY22 YTD (including a tax charge of £(313) million) |
| • | Free cashflow2 was £490 million in Q3 FY23 compared to £164 million in Q3 FY22 |
| • | Working capital movements in the quarter were £306 million after increases in payables of £417 million offset by lower receivables and higher inventory since 30 September 2022 |
| • | Investment spending of £622 million in the quarter includes £446 million of engineering spend, of which 48% was capitalised, and £176 million of capital investments |
| • | FY23 YTD free cash flow1 was £(294) million in FY23 YTD compared to £(1,496) million for FY22 YTD |
| 2 | Please see note 2 of the financial statements for alternative performance measures |
4
Table of Contents
Retail sales for the third quarter were 84,827 units, up 5.9% compared to the same quarter a year ago and 3.7% lower than from the prior quarter ending 30 September 2022.
Wholesale volumes3 in Q3 FY23 were 79,591 units in the period (excluding our China Joint Venture), up 15% compared to the same quarter a year ago ending 31 December 2021 and 5.7% compared to the quarter ending 30 September 2022. The production ramp up of new Range Rover and Range Rover Sport continued with 27,456 units wholesaled in the quarter, up from 13,537 in Q2.
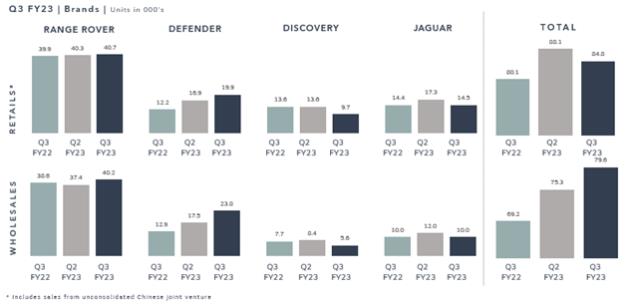
Range Rover brand includes the models Range Rover, Range Rover Sport, Range Rover Velar and Range Rover Evoque. Discovery brand includes the models Discovery and Discovery Sport. Jaguar brand includes the Jaguar XE, XF, F-Type, E-Pace, F-Pace and I-Pace models.
5
Table of Contents
Total cash and cash equivalents, deposits and investments at 31 December 2022 were £3.9 billion (comprising £3.7 billion of cash and cash equivalents and £149 million of short-term deposits and other investments). The cash and financial deposits include an amount of £512 million held in subsidiaries of Jaguar Land Rover outside of the United Kingdom. The cash in some of these jurisdictions may be subject to impediments to remitting cash to the UK other than through annual dividends.
In December 2022, the Company completed a renewal of its undrawn revolving credit facility at £1.45 billion with the maturity date extended from March 2024 to April 2026. This was increased to £1.52 billion in January 2023.
An extension to the RMB 5 billion (c. £600 million equivalent) loan facility was signed in January 2023. The extension is for 3-years with an annual confirmatory review, the first being in January 2024.
The following table shows details of the Company’s financing arrangements at 31 December 2022:
£ millions | Facility amount | Amount outstanding | Undrawn amount | |||||||||
£400m 3.875% Senior Notes due Mar 2023 | 400 | 400 | — | |||||||||
$500m 5.625% Senior Notes due Feb 2023 | 415 | 415 | — | |||||||||
$700m 7.750% Senior Notes due Oct 2025 | 581 | 581 | — | |||||||||
$500m 4.500% Senior Notes due Oct 2027 | 415 | 415 | — | |||||||||
$650m 5.875% Senior Notes due Jan 2028 | 539 | 539 | — | |||||||||
€650m 2.200% Senior Notes due Jan 2024 | 574 | 574 | — | |||||||||
€500m 5.875% Senior Notes due Nov 2024 | 442 | 442 | — | |||||||||
€500m 6.875% Senior Notes due Nov 2026 | 442 | 442 | — | |||||||||
€500m 4.500% Senior Notes due Jul 2028 | 442 | 442 | — | |||||||||
$500m 5.500% Senior Notes due Jul 2029 | 415 | 415 | — | |||||||||
€500m 4.500% Senior Notes due Jan 2026 | 442 | 442 | — | |||||||||
$800m Syndicated Loan due Jan 2025 | 662 | 662 | — | |||||||||
China RMB 5,000m revolving facility due Jun 20231 | 596 | 596 | — | |||||||||
UKEF amortising loan due Oct 2024 | 229 | 229 | — | |||||||||
UKEF amortising loan due Dec 2026 | 500 | 500 | — | |||||||||
|
|
|
|
|
| |||||||
Subtotal | 7,094 | 7,094 | — | |||||||||
|
|
|
|
|
| |||||||
Finance lease obligations2 | 714 | 714 | — | |||||||||
Other3 | 35 | 35 | — | |||||||||
Prepaid costs | (27 | ) | (27 | ) | — | |||||||
Fair value adjustments4 | (130 | ) | (130 | ) | — | |||||||
|
|
|
|
|
| |||||||
Total | 7,686 | 7,686 | — | |||||||||
|
|
|
|
|
| |||||||
Undrawn RCF | 1,450 | — | 1,450 | |||||||||
|
|
|
|
|
| |||||||
Total including RCF | 9,136 | 7,686 | 1,450 | |||||||||
|
|
|
|
|
| |||||||
| 1 | The China RMB 5 billion 3-year syndicated revolving loan facility is subject to an annual confirmatory review in June each year |
| 2 | Lease obligations accounted for as debt under IFRS 16 |
| 3 | Primarily an advance as part of a sale and leaseback transaction |
| 4 | Fair value adjustments relate to hedging arrangements for the $500m 2027 Notes and €500m 2026 Notes |
6
Table of Contents
There are a number of potential risks which could have a material impact on the Group’s performance and could cause actual results to differ materially from expected and/or historical results, particularly those risks relating to continuing supply shortages of semiconductors, and those discussed on pages 36-39 of the Annual Report 2021/22 of the Group (available at www.jaguarlandrover.com/annual-report-2022) along with mitigating factors. The principal risks discussed in the Group’s Annual Report FY22 are competitive business efficiency, environmental regulations and compliance, supply chain disruptions, global economic and geopolitical environment, distribution channels/retailer performance, IT systems and security, manufacturing operations, brand positioning, rapid technology change and human capital.
There were no material acquisitions or disposals in Q3 FY23.
Off-balance sheet financial arrangements
At 31 December 2022, Jaguar Land Rover Limited (a subsidiary of the Company) had sold £317 million equivalent of receivables under a $499.975 million invoice discounting facility signed in March 2021.
At 31 December 2022, Jaguar Land Rover employed 39,526 people worldwide, including agency personnel, compared to 34,900 at 31 December 2021.
The following table provides information with respect to the members of the Board of Directors of Jaguar Land Rover Automotive plc as at 31 December 2022:
| Name | Position | Year appointed | ||
Natarajan Chandrasekaran | Chairman and Director | 2017 | ||
| Adrian Mardell | Interim Chief Executive Officer and Director | 2022 | ||
| Prof Sir Ralf D Speth* | Vice Chairman and Director | 2020 | ||
| Mr P B Balaji | Director | 2017 | ||
| Hanne Sorensen | Director | 2018 | ||
| Charles Nichols | Director | 2022 | ||
| Al-Noor Ramji | Director | 2022 | ||
| * | Previously appointed as CEO and Director in 2010 and subsequently Vice Chairman and Director in 2020 |
7
Table of Contents
Condensed Consolidated Income Statement
£ millions | Note | Three months ended | Nine months ended | |||||||||||||||||
| 31 December 2022 | 31 December 2021 | 31 December 2022 | 31 December 2021 | |||||||||||||||||
Revenue | 3 | 6,041 | 4,716 | 15,707 | 13,553 | |||||||||||||||
Material and other cost of sales | (3,707 | ) | (2,783 | ) | (9,681 | ) | (8,432 | ) | ||||||||||||
Employee costs | 4 | (654 | ) | (561 | ) | (1,828 | ) | (1,666 | ) | |||||||||||
Other expenses | 9 | (1,180 | ) | (981 | ) | (3,369 | ) | (2,760 | ) | |||||||||||
Exceptional items | 4 | — | — | 155 | — | |||||||||||||||
Engineering costs capitalised | 5 | 212 | 106 | 457 | 357 | |||||||||||||||
Other income | 6 | 58 | 49 | 172 | 157 | |||||||||||||||
Depreciation and amortisation | (494 | ) | (483 | ) | (1,464 | ) | (1,435 | ) | ||||||||||||
Foreign exchange and fair value adjustments | 7 | 103 | 37 | (101 | ) | 90 | ||||||||||||||
Finance income | 8 | 22 | 2 | 40 | 5 | |||||||||||||||
Finance expense (net) | 8 | (139 | ) | (97 | ) | (376 | ) | (269 | ) | |||||||||||
Share of profit/(loss) of equity accounted investments | 3 | (14 | ) | 11 | (21 | ) | ||||||||||||||
|
|
|
|
|
|
|
| |||||||||||||
Profit/(loss) before tax | 265 | (9 | ) | (277 | ) | (421 | ) | |||||||||||||
|
|
|
|
|
|
|
| |||||||||||||
Income tax expense | 14 | (4 | ) | (58 | ) | (42 | ) | (313 | ) | |||||||||||
|
|
|
|
|
|
|
| |||||||||||||
Profit/(loss) for the period | 261 | (67 | ) | (319 | ) | (734 | ) | |||||||||||||
|
|
|
|
|
|
|
| |||||||||||||
Attributable to: | ||||||||||||||||||||
Owners of the Company | 261 | (67 | ) | (319 | ) | (731 | ) | |||||||||||||
Non-controlling interests | — | — | — | (3 | ) | |||||||||||||||
|
|
|
|
|
|
|
| |||||||||||||
The notes on pages 13 to 33 are an integral part of these condensed consolidated financial statements.
8
Table of Contents
Condensed Consolidated Statement of Comprehensive Income and Expense
| Three months ended | Nine months ended | |||||||||||||||
£ millions | 31 December 2022 | 31 December 2021 | 31 December 2022 | 31 December 2021 | ||||||||||||
Profit/(loss) for the period | 261 | (67 | ) | (319 | ) | (734 | ) | |||||||||
Items that will not be reclassified subsequently to profit or loss: | ||||||||||||||||
Remeasurement of net defined benefit obligation | (361 | ) | 157 | 76 | 95 | |||||||||||
Income tax related to items that will not be reclassified | 90 | (39 | ) | (19 | ) | 61 | ||||||||||
|
|
|
|
|
|
|
| |||||||||
| (271 | ) | 118 | 57 | 156 | ||||||||||||
|
|
|
|
|
|
|
| |||||||||
Items that may be reclassified subsequently to profit or loss: | ||||||||||||||||
Gain/(loss) on cash flow hedges (net) | 1,047 | (122 | ) | (445 | ) | (467 | ) | |||||||||
Currency translation differences | (23 | ) | (13 | ) | 21 | 6 | ||||||||||
Income tax related to items that may be reclassified | (131 | ) | 28 | (110 | ) | 100 | ||||||||||
|
|
|
|
|
|
|
| |||||||||
| 893 | (107 | ) | (534 | ) | (361 | ) | ||||||||||
|
|
|
|
|
|
|
| |||||||||
Other comprehensive income/(expense) net of tax | 622 | 11 | (477 | ) | (205 | ) | ||||||||||
|
|
|
|
|
|
|
| |||||||||
Total comprehensive income/(expense) attributable to shareholder | 883 | (56 | ) | (796 | ) | (939 | ) | |||||||||
|
|
|
|
|
|
|
| |||||||||
Attributable to: | ||||||||||||||||
Owners of the Company | 883 | (56 | ) | (796 | ) | (936 | ) | |||||||||
Non-controlling interests | — | — | — | (3 | ) | |||||||||||
|
|
|
|
|
|
|
| |||||||||
The notes on pages 13 to 33 are an integral part of these condensed consolidated financial statements.
9
Table of Contents
Condensed Consolidated Balance Sheet
As at (£ millions) | Note | 31 December 2022 | 31 March 2022 | 31 December 2021 | ||||||||||||
Non-current assets | ||||||||||||||||
Investments in equity accounted investees | 330 | 321 | 308 | |||||||||||||
Other non-current investments | 41 | 30 | 29 | |||||||||||||
Other financial assets | 11 | 201 | 185 | 188 | ||||||||||||
Property, plant and equipment | 15 | 5,976 | 6,253 | 6,381 | ||||||||||||
Intangible assets | 15 | 4,604 | 4,866 | 5,024 | ||||||||||||
Right-of-use assets | 637 | 568 | 592 | |||||||||||||
Pension asset | 23 | 719 | 434 | — | ||||||||||||
Other non-current assets | 13 | 107 | 35 | 77 | ||||||||||||
Deferred tax assets | 360 | 336 | 376 | |||||||||||||
|
|
|
|
|
| |||||||||||
Total non-current assets | 12,975 | 13,028 | 12,975 | |||||||||||||
|
|
|
|
|
| |||||||||||
Current assets | ||||||||||||||||
Cash and cash equivalents | 3,712 | 4,223 | 4,273 | |||||||||||||
Short-term deposits and other investments | 149 | 175 | 207 | |||||||||||||
Trade receivables | 929 | 722 | 682 | |||||||||||||
Other financial assets | 11 | 377 | 394 | 435 | ||||||||||||
Inventories | 12 | 3,290 | 2,781 | 2,484 | ||||||||||||
Other current assets | 13 | 600 | 493 | 556 | ||||||||||||
Current tax assets | 9 | 20 | 28 | |||||||||||||
Assets classified as held for sale | 28 | 4 | 26 | |||||||||||||
|
|
|
|
|
| |||||||||||
Total current assets | 9,094 | 8,812 | 8,691 | |||||||||||||
|
|
|
|
|
| |||||||||||
Total assets | 22,069 | 21,840 | 21,666 | |||||||||||||
|
|
|
|
|
| |||||||||||
Current liabilities | ||||||||||||||||
Accounts payable | 5,355 | 5,144 | 4,524 | |||||||||||||
Short-term borrowings | 19 | 1,659 | 1,779 | 1,403 | ||||||||||||
Other financial liabilities | 16 | 948 | 870 | 839 | ||||||||||||
Provisions | 17 | 1,042 | 989 | 1,080 | ||||||||||||
Other current liabilities | 18 | 891 | 674 | 641 | ||||||||||||
Current tax liabilities | 119 | 116 | 113 | |||||||||||||
Liabilities directly associated with assets classified as held for sale | — | — | 12 | |||||||||||||
|
|
|
|
|
| |||||||||||
Total current liabilities | 10,014 | 9,572 | 8,612 | |||||||||||||
|
|
|
|
|
| |||||||||||
Non-current liabilities | ||||||||||||||||
Long-term borrowings | 19 | 5,313 | 5,248 | 6,023 | ||||||||||||
Other financial liabilities | 16 | 1,337 | 871 | 717 | ||||||||||||
Provisions | 17 | 1,092 | 1,112 | 1,113 | ||||||||||||
Retirement benefit obligation | 23 | 27 | 25 | 257 | ||||||||||||
Other non-current liabilities | 18 | 419 | 404 | 414 | ||||||||||||
Deferred tax liabilities | 118 | 105 | 123 | |||||||||||||
|
|
|
|
|
| |||||||||||
Total non-current liabilities | 8,306 | 7,765 | 8,647 | |||||||||||||
|
|
|
|
|
| |||||||||||
Total liabilities | 18,320 | 17,337 | 17,259 | |||||||||||||
|
|
|
|
|
| |||||||||||
Equity attributable to shareholders | ||||||||||||||||
Ordinary shares | 1,501 | 1,501 | 1,501 | |||||||||||||
Capital redemption reserve | 167 | 167 | 167 | |||||||||||||
Other reserves | 21 | 2,081 | 2,835 | 2,733 | ||||||||||||
|
|
|
|
|
| |||||||||||
Equity attributable to shareholders | 3,749 | 4,503 | 4,401 | |||||||||||||
|
|
|
|
|
| |||||||||||
Non-controlling interests | — | — | 6 | |||||||||||||
|
|
|
|
|
| |||||||||||
Total equity | 3,749 | 4,503 | 4,407 | |||||||||||||
|
|
|
|
|
| |||||||||||
Total liabilities and equity | 22,069 | 21,840 | 21,666 | |||||||||||||
|
|
|
|
|
| |||||||||||
The notes on pages 13 to 33 are an integral part of these condensed consolidated financial statements.
These condensed consolidated interim financial statements were approved by the JLR plc Board and authorised for issue on 25 January 2023.
Company registered number: 06477691
10
Table of Contents
Condensed Consolidated Statement of Changes in Equity
£ millions | Ordinary shares | Capital redemption reserve | Other reserves | Total equity | ||||||||||||
Balance at 1 April 2022 | 1,501 | 167 | 2,835 | 4,503 | ||||||||||||
Loss for the period | — | — | (319 | ) | (319 | ) | ||||||||||
Other comprehensive expense for the period | — | — | (477 | ) | (477 | ) | ||||||||||
|
|
|
|
|
|
|
| |||||||||
Total comprehensive expense | — | — | (796 | ) | (796 | ) | ||||||||||
|
|
|
|
|
|
|
| |||||||||
Amounts removed from hedge reserve and recognised in inventory | — | — | 53 | 53 | ||||||||||||
Income tax related to amounts removed from hedge reserve and recognised in inventory | — | — | (11 | ) | (11 | ) | ||||||||||
|
|
|
|
|
|
|
| |||||||||
Balance at 31 December 2022 | 1,501 | 167 | 2,081 | 3,749 | ||||||||||||
|
|
|
|
|
|
|
| |||||||||
£ millions | Ordinary shares | Capital redemption reserve | Other reserves | Equity attributable to shareholder | Non- controlling interests | Total equity | ||||||||||||||||||
Balance at 1 April 2021 | 1,501 | 167 | 3,586 | 5,254 | 9 | 5,263 | ||||||||||||||||||
Loss for the period | — | — | (731 | ) | (731 | ) | (3 | ) | (734 | ) | ||||||||||||||
Other comprehensive expense for the period | — | — | (205 | ) | (205 | ) | — | (205 | ) | |||||||||||||||
|
|
|
|
|
|
|
|
|
|
|
| |||||||||||||
Total comprehensive expense | — | — | (936 | ) | (936 | ) | (3 | ) | (939 | ) | ||||||||||||||
|
|
|
|
|
|
|
|
|
|
|
| |||||||||||||
Amounts removed from hedge reserve and recognised in inventory | — | — | 103 | 103 | — | 103 | ||||||||||||||||||
Income tax related to amounts removed from hedge reserve and recognised in inventory | — | — | (20 | ) | (20 | ) | — | (20 | ) | |||||||||||||||
|
|
|
|
|
|
|
|
|
|
|
| |||||||||||||
Balance at 31 December 2021 | 1,501 | 167 | 2,733 | 4,401 | 6 | 4,407 | ||||||||||||||||||
|
|
|
|
|
|
|
|
|
|
|
| |||||||||||||
The notes on pages 13 to 33 are an integral part of these condensed consolidated financial statements.
11
Table of Contents
Condensed Consolidated Cash Flow Statement
£ millions | Three months ended | Nine months ended | ||||||||||||||||||
| Note | 31 December 2022 | 31 December 2021 | 31 December 2022 | 31 December 2021 | ||||||||||||||||
Cash flows from operating activities | ||||||||||||||||||||
Cash generated from/(used in) operations | 26 | 1,026 | 503 | 1,108 | (176 | ) | ||||||||||||||
Income tax (paid)/refunded | (32 | ) | 53 | (159 | ) | (74 | ) | |||||||||||||
|
|
|
|
|
|
|
| |||||||||||||
Net cash generated from/(used in) operating activities | 994 | 556 | 949 | (250 | ) | |||||||||||||||
|
|
|
|
|
|
|
| |||||||||||||
Cash flows from investing activities | ||||||||||||||||||||
Purchases of other investments | — | (2 | ) | (3 | ) | (4 | ) | |||||||||||||
Investment in other restricted deposits | (4 | ) | (4 | ) | (21 | ) | (26 | ) | ||||||||||||
Redemption of other restricted deposits | 17 | 16 | 31 | 34 | ||||||||||||||||
Movements in other restricted deposits | 13 | 12 | 10 | 8 | ||||||||||||||||
Investment in short-term deposits and other investments | (541 | ) | (205 | ) | (849 | ) | (931 | ) | ||||||||||||
Redemption of short-term deposits and other investments | 541 | 255 | 893 | 1,727 | ||||||||||||||||
Movements in short-term deposits and other investments | — | 50 | 44 | 796 | ||||||||||||||||
Purchases of property, plant and equipment | (160 | ) | (137 | ) | (412 | ) | (545 | ) | ||||||||||||
Purchases of other assets acquired with view to resale | — | — | (24 | ) | — | |||||||||||||||
Proceeds from sale of property, plant and equipment | — | — | — | 4 | ||||||||||||||||
Net cash outflow relating to intangible asset expenditure | (228 | ) | (162 | ) | (492 | ) | (420 | ) | ||||||||||||
Finance income received | 20 | 2 | 35 | 6 | ||||||||||||||||
Disposal of subsidiaries (net of cash disposed) | — | — | 2 | — | ||||||||||||||||
|
|
|
|
|
|
|
| |||||||||||||
Net cash (used in)/generated from investing activities | (355 | ) | (237 | ) | (840 | ) | (155 | ) | ||||||||||||
|
|
|
|
|
|
|
| |||||||||||||
Cash flows from financing activities | ||||||||||||||||||||
Finance expenses and fees paid | (136 | ) | (95 | ) | (352 | ) | (291 | ) | ||||||||||||
Proceeds from issuance of borrowings | — | 660 | 594 | 2,096 | ||||||||||||||||
Repayment of borrowings | (240 | ) | (94 | ) | (959 | ) | (857 | ) | ||||||||||||
Payments of lease obligations | (19 | ) | (18 | ) | (54 | ) | (54 | ) | ||||||||||||
|
|
|
|
|
|
|
| |||||||||||||
Net cash (used in)/generated from financing activities | (395 | ) | 453 | (771 | ) | 894 | ||||||||||||||
|
|
|
|
|
|
|
| |||||||||||||
Net increase/(decrease) in cash and cash equivalents | 244 | 772 | (662 | ) | 489 | |||||||||||||||
Cash and cash equivalents at beginning of period | 3,555 | 3,537 | 4,223 | 3,778 | ||||||||||||||||
Cash reclassified as held for sale | — | — | — | (16 | ) | |||||||||||||||
Effect of foreign exchange on cash and cash equivalents | (87 | ) | (36 | ) | 151 | 22 | ||||||||||||||
|
|
|
|
|
|
|
| |||||||||||||
Cash and cash equivalents at end of period | 3,712 | 4,273 | 3,712 | 4,273 | ||||||||||||||||
|
|
|
|
|
|
|
| |||||||||||||
The notes on pages 13 to 33 are an integral part of these condensed consolidated financial statements.
12
Table of Contents
Notes (forming part of the condensed consolidated interim financial statements)
| 1 | Accounting policies |
Basis of preparation
The financial information in these interim financial statements is unaudited. The information for the year ended 31 March 2022 does not constitute statutory accounts as defined in section 434 of the Companies Act 2006. A copy of the statutory accounts for the year has been delivered to the Registrar of Companies. The auditors reported on those accounts: their report was unqualified, did not draw attention to any matters by way of emphasis and did not contain a statement from section 498 (2) or (3) of the Companies Act 2006. The condensed consolidated interim financial statements of Jaguar Land Rover Automotive plc have been prepared in accordance with International Accounting Standard 34, ‘Interim Financial Reporting’ under International Financial Reporting Standards (‘IFRS’) and UK-adopted international accounting standards. The balance sheet and accompanying notes as at 31 December 2021 have been disclosed solely for the information of the users.
The condensed consolidated interim financial statements have been prepared on a historical cost basis except for certain financial instruments held at fair value as highlighted in note 20.
The condensed consolidated interim financial statements have been prepared on the going concern basis as set out within the directors’ report of the Group’s Annual Report for the year ended 31 March 2022.
The accounting policies applied are consistent with those of the annual consolidated financial statements for the year ended 31 March 2022, as described in those financial statements.
Estimates and judgements
The preparation of interim financial statements requires management to make judgements, estimates and assumptions that affect the application of accounting policies and the reported amounts of assets and liabilities, income and expense. Actual results may differ from these estimates.
In preparing these condensed interim financial statements, the significant judgements made by management in applying the Group’s accounting policies and the key sources of estimate uncertainty were the same as those applied to the consolidated financial statements for the year ended 31 March 2022.
Going concern
The condensed consolidated interim financial statements have been prepared on a going concern basis, which the Directors consider appropriate for the reasons set out below.
The Directors have assessed the financial position of the Group as at 31 December 2022, and the projected cash flows of the Group for the twelve-month period from the date of authorisation of the condensed consolidated interim financial statements (the ‘going concern assessment period’).
The Group had available liquidity of £5.3 billion at 31 December 2022, £3.8 billion of which is cash with the remainder being the £1.45 billion undrawn RCF facility, which was renewed on 16 December 2022 with a maturity date of April 2026. Within the going concern assessment period there is a £1 billion minimum quarter-end liquidity covenant attached to the Group’s UKEF loans and forward start RCF facility. There is £2.2 billion of maturing debt in the going concern assessment period, and no new funding is assumed.
The Group has assessed its projected cash flows over the going concern assessment period. The base case uses assumptions consistent with the latest business plan and which are based on the Group’s most recent actual trading results which were in line with the forecasts from the previous quarter.
The base case assumes a gradual increase in wholesale volumes in each quarter of the going concern assessment period as a result of a production ramp up of the New Range Rover and New Range Rover Sport. New agreements with semiconductor suppliers are also expected to enable sales improvements in the second half of the fiscal year 2024.
The base case assumes optimisation of supply to prioritise production to the highest margin products and the Group’s expectations relating to prevailing financial conditions, including inflationary pressures on material costs.
13
Table of Contents
Notes (forming part of the condensed consolidated interim financial statements)
| 1 | Accounting policies (continued) |
Going concern (continued)
The Group has also carried out a reverse stress test against the base case to determine the decline in wholesale volumes over a twelve-month period that would result in a liquidity level that breaches financing covenants. The Group’s order book remains very strong and so the reverse stress test assumes continued supply constraints resulting in demand that exceeds supply over the twelve-month period and assumes optimisation of supply to maximise production of higher margin products.
In order to reach a liquidity level that breaches covenants, it would require a sustained decline in wholesale volumes of more than 60% compared to the base case over a twelve-month period. The reverse stress test reflects the variable profit impact of the wholesale volume decline, and assumes all other assumptions are held in line with the base case. It does not reflect other potential upside measures that could be taken in such a reduced volume scenario; nor any new funding.
The Group does not consider this scenario to be plausible given that the stress test volumes are significantly lower than the volumes achieved during both the peak of the COVID-19 pandemic and the worst quarter of semiconductor shortages. The Group has a strong order bank and is confident that it can significantly exceed reverse stress test volumes.
The Group has considered the impact of severe but plausible downside scenarios, including scenarios that reflect a decrease in variable profit per unit compared with the base case to include additional increases in material and other related production costs. The expected wholesale volumes under all of these scenarios is higher than under the reverse stress test.
The Directors, after making appropriate enquiries and taking into consideration the risks and uncertainties facing the Group, consider that the Group has adequate financial resources to continue operating throughout the going concern assessment period, meeting its liabilities as they fall due. Accordingly, the Directors continue to adopt the going concern basis in preparing these condensed consolidated interim financial statements.
14
Table of Contents
Notes (forming part of the condensed consolidated interim financial statements)
| 2 | Alternative Performance Measures |
In reporting financial information, the Group presents alternative performance measures (‘APMs’) which are not defined or specified under the requirements of IFRS. The Group believes that these APMs, which are not considered to be a substitute for or superior to IFRS measures, provide stakeholders with additional helpful information on the performance of the business.
The APMs used by the Group are defined below.
Alternative Performance | Definition | |
| Adjusted EBITDA | Adjusted EBITDA is defined as profit before: income tax expense; exceptional items; finance expense (net of capitalised interest) and finance income; gains/losses on debt and unrealised derivatives, realised derivatives entered into for the purpose of hedging debt, and equity or debt investments held at fair value; foreign exchange gains/losses on other assets and liabilities, including short-term deposits and cash and cash equivalents; share of profit/loss from equity accounted investments; depreciation and amortisation. | |
| Adjusted EBIT | Adjusted EBIT is defined as for adjusted EBITDA but including share of profit/loss from equity accounted investments, depreciation and amortisation. | |
| Profit/(loss) before tax and exceptional items | Profit/(loss) before tax excluding exceptional items. | |
| Free cash flow | Net cash generated from operating activities less net cash used in automotive investing activities, excluding investments in consolidated entities and movements in financial investments, and after finance expenses and fees paid. Financial investments are those reported as cash and cash equivalents, short-term deposits and other investments, and equity or debt investments held at fair value. | |
| Total product and other investment | Cash used in the purchase of property, plant and equipment, intangible assets, investments in equity accounted investments and other trading investments, acquisition of subsidiaries and expensed research and development costs. | |
| Working capital | Changes in assets and liabilities as presented in note 26. This comprises movements in assets and liabilities excluding movements relating to financing or investing cash flows or non-cash items that are not included in adjusted EBIT or adjusted EBITDA. | |
| Total cash and cash equivalents, deposits and investments | Defined as cash and cash equivalents, short-term deposits and other investments, marketable securities and any other items defined as cash and cash equivalents in accordance with IFRS. | |
| Available liquidity | Defined as total cash and cash equivalents, deposits and investments plus committed undrawn credit facilities. | |
| Net debt | Total cash and cash equivalents, deposits and investments less total interest-bearing loans and borrowings. | |
| Retail sales | Jaguar Land Rover retail sales represent vehicle sales (units) made by dealers to end customers and include the sale of vehicles produced by our Chinese joint venture, Chery Jaguar Land Rover Automotive Company Ltd. | |
| Wholesales | Wholesales represent vehicle sales (units) made to dealers. The Group recognises revenue on wholesales. | |
The Group uses adjusted EBITDA as an APM to review and measure the underlying profitability of the Group on an ongoing basis for comparability as it recognises that increased capital expenditure year-on-year will lead to a corresponding increase in depreciation and amortisation expense recognised within the consolidated income statement.
The Group uses adjusted EBIT as an APM to review and measure the underlying profitability of the Group on an ongoing basis as this excludes volatility on unrealised foreign exchange transactions. Due to the significant level of debt and currency derivatives, unrealised foreign exchange distorts the financial performance of the Group from one period to another.
15
Table of Contents
Notes (forming part of the condensed consolidated interim financial statements)
| 2 | Alternative Performance Measures (continued) |
Free cash flow is considered by the Group to be a key measure in assessing and understanding the total operating performance of the Group and to identify underlying trends.
Total product and other investment is considered by the Group to be a key measure in assessing cash invested in the development of future new models and infrastructure supporting the growth of the Group.
Working capital is considered by the Group to be a key measure in assessing short-term assets and liabilities that are expected to be converted into cash within the next 12-month period.
Total cash and cash equivalents, deposits and investments and available liquidity are measures used by the Group to assess liquidity and the availability of funds for future spend and investment.
Exceptional items are defined in note 4.
Reconciliations between these alternative performance measures and statutory reported measures are shown below and on the next two pages.
Adjusted EBIT and Adjusted EBITDA
£ millions | Three months ended | Nine months ended | ||||||||||||||||||
| Note | 31 December 2022 | 31 December 2021 | 31 December 2022 | 31 December 2021 | ||||||||||||||||
Adjusted EBITDA | 716 | 565 | 1,536 | 1,297 | ||||||||||||||||
Depreciation and amortisation | (494 | ) | (483 | ) | (1,464 | ) | (1,435 | ) | ||||||||||||
Share of profit/(loss) of equity accounted investments | 3 | (14 | ) | 11 | (21 | ) | ||||||||||||||
|
|
|
|
|
|
|
| |||||||||||||
Adjusted EBIT | 225 | 68 | 83 | (159 | ) | |||||||||||||||
|
|
|
|
|
|
|
| |||||||||||||
Foreign exchange on debt, derivatives and balance sheet revaluation* | 26 | 169 | 34 | (61 | ) | 16 | ||||||||||||||
Unrealised loss on commodities | 26 | (12 | ) | (17 | ) | (129 | ) | (18 | ) | |||||||||||
Finance income | 8 | 22 | 2 | 40 | 5 | |||||||||||||||
Finance expense (net) | 8 | (139 | ) | (97 | ) | (376 | ) | (269 | ) | |||||||||||
Fair value gain on equity investments | 26 | — | 1 | 11 | 4 | |||||||||||||||
|
|
|
|
|
|
|
| |||||||||||||
Profit/(loss) before tax and exceptional items | 265 | (9 | ) | (432 | ) | (421 | ) | |||||||||||||
|
|
|
|
|
|
|
| |||||||||||||
Exceptional items | 4 | — | — | 155 | — | |||||||||||||||
|
|
|
|
|
|
|
| |||||||||||||
Profit/(loss) before tax | 265 | (9 | ) | (277 | ) | (421 | ) | |||||||||||||
|
|
|
|
|
|
|
| |||||||||||||
| * | FY22 comparatives have been represented to align with the FY23 presentation change to combine foreign exchange on debt, derivatives and balance sheet revaluation into a single line. This has not resulted in any change to reported ‘Profit/(loss) before tax and exceptional items’ or ‘Profit/(loss) before tax’. |
Free cash flow
| Three months ended | Nine months ended | |||||||||||||||||||
£ millions | 31 December 2022 | 31 December 2021 | 31 December 2022 | 31 December 2021 | ||||||||||||||||
Net cash generated from/(used in) operating activities | 994 | 556 | 949 | (250 | ) | |||||||||||||||
Purchases of property, plant and equipment | (160 | ) | (137 | ) | (412 | ) | (545 | ) | ||||||||||||
Net cash outflow relating to intangible asset expenditure | (228 | ) | (162 | ) | (492 | ) | (420 | ) | ||||||||||||
Proceeds from sale of property, plant and equipment | — | — | — | 4 | ||||||||||||||||
Purchases of other assets acquired with view to resale | — | — | (24 | ) | — | |||||||||||||||
Disposal of subsidiaries (net of cash disposed) | — | — | 2 | — | ||||||||||||||||
Finance expenses and fees paid | (136 | ) | (95 | ) | (352 | ) | (291 | ) | ||||||||||||
Finance income received | 20 | 2 | 35 | 6 | ||||||||||||||||
|
|
|
|
|
|
|
| |||||||||||||
Free cash flow | 490 | 164 | (294 | ) | (1,496 | ) | ||||||||||||||
|
|
|
|
|
|
|
| |||||||||||||
16
Table of Contents
Notes (forming part of the condensed consolidated interim financial statements)
| 2 | Alternative Performance Measures (continued) |
Total product and other investment
| Three months ended | Nine months ended | |||||||||||||||||||
£ millions | Note | 31 December 2022 | 31 December 2021 | 31 December 2022 | 31 December 2021 | |||||||||||||||
Purchases of property, plant and equipment | 160 | 137 | 412 | 545 | ||||||||||||||||
Net cash outflow relating to intangible asset expenditure | 228 | 162 | 492 | 420 | ||||||||||||||||
Engineering costs expensed | 5 | 234 | 211 | 730 | 598 | |||||||||||||||
Purchases of other investments | — | 2 | 3 | 4 | ||||||||||||||||
|
|
|
|
|
|
|
| |||||||||||||
Total product and other investment | 622 | 512 | 1,637 | 1,567 | ||||||||||||||||
|
|
|
|
|
|
|
| |||||||||||||
Total cash and cash equivalents, deposits and investments
As at (£ millions) | 31 December 2022 | 31 March 2022 | 31 December 2021 | |||||||||||||
Cash and cash equivalents | 3,712 | 4,223 | 4,273 | |||||||||||||
Short-term deposits and other investments | 149 | 175 | 207 | |||||||||||||
|
|
|
|
|
| |||||||||||
Total cash and cash equivalents, deposits and investments | 3,861 | 4,398 | 4,480 | |||||||||||||
|
|
|
|
|
| |||||||||||
Available liquidity
As at (£ millions) | Note | 31 December 2022 | 31 March 2022 | 31 December 2021 | ||||||||||||
Cash and cash equivalents | 3,712 | 4,223 | 4,273 | |||||||||||||
Short-term deposits and other investments | 149 | 175 | 207 | |||||||||||||
Committed undrawn credit facilities | 19 | 1,450 | 2,015 | 2,015 | ||||||||||||
|
|
|
|
|
| |||||||||||
Available liquidity | 5,311 | 6,413 | 6,495 | |||||||||||||
|
|
|
|
|
| |||||||||||
17
Table of Contents
Notes (forming part of the condensed consolidated interim financial statements)
| 2 | Alternative Performance Measures (continued) |
Net debt
As at (£ millions) | Note | 31 December 2022 | 31 March 2022 | 31 December 2021 | ||||||||||||
Cash and cash equivalents | 3,712 | 4,223 | 4,273 | |||||||||||||
Short-term deposits and other investments | 149 | 175 | 207 | |||||||||||||
Interest-bearing loans and borrowings | 19 | (7,686 | ) | (7,597 | ) | (8,010 | ) | |||||||||
|
|
|
|
|
| |||||||||||
Net debt | (3,825 | ) | (3,199 | ) | (3,530 | ) | ||||||||||
|
|
|
|
|
| |||||||||||
Retails and wholesales
| Three months ended | Nine months ended | |||||||||||||||
Units | 31 December 2022 | 31 December 2021 | 31 December 2022 | 31 December 2021 | ||||||||||||
Retail sales | 84,827 | 80,126 | 251,773 | 297,373 | ||||||||||||
|
|
|
|
|
|
|
| |||||||||
Wholesales* | 79,591 | 69,182 | 226,713 | 217,656 | ||||||||||||
|
|
|
|
|
|
|
| |||||||||
| * | Wholesale volumes exclude sales from Chery Jaguar Land Rover – Q3 FY23: 12,754 units, Q3 FY22: 13,928 units, Q3 FY23 YTD: 38,115 units, Q3 FY22 YTD: 40,846 units. |
| 3 | Disaggregation of revenue |
| Three months ended | Nine months ended | |||||||||||||||
£ millions | 31 December 2022 | 31 December 2021 | 31 December 2022 | 31 December 2021 | ||||||||||||
Revenue recognised for sales of vehicles, parts and accessories | 5,946 | 4,430 | 15,281 | 12,685 | ||||||||||||
Revenue recognised for services transferred | 79 | 76 | 235 | 229 | ||||||||||||
Revenue - other | 232 | 194 | 647 | 568 | ||||||||||||
|
|
|
|
|
|
|
| |||||||||
Total revenue excluding realised revenue hedges | 6,257 | 4,700 | 16,163 | 13,482 | ||||||||||||
|
|
|
|
|
|
|
| |||||||||
Realised revenue hedges | (216 | ) | 16 | (456 | ) | 71 | ||||||||||
|
|
|
|
|
|
|
| |||||||||
Total revenue | 6,041 | 4,716 | 15,707 | 13,553 | ||||||||||||
|
|
|
|
|
|
|
| |||||||||
| 4 | Exceptional items |
| Three months ended | Nine months ended | |||||||||||||||
£ millions | 31 December 2022 | 31 December 2021 | 31 December 2022 | 31 December 2021 | ||||||||||||
Employee costs excluding exceptional items | 654 | 561 | 1,828 | 1,666 | ||||||||||||
Impact of: | ||||||||||||||||
Exceptional items: past service credit | — | — | (155 | ) | — | |||||||||||
|
|
|
|
|
|
|
| |||||||||
Employee costs including exceptional items | 654 | 561 | 1,673 | 1,666 | ||||||||||||
|
|
|
|
|
|
|
| |||||||||
The exceptional item recognised in the nine months ended 31 December 2022 is comprised of a pension past service credit of £155 million due to a change in inflation index from RPI to CPI. There was no exceptional item recognised in the nine months ended 31 December 2021.
18
Table of Contents
Notes (forming part of the condensed consolidated interim financial statements)
| 5 | Engineering costs capitalised |
| Three months ended | Nine months ended | |||||||||||||||
£ millions | 31 December 2022 | 31 December 2021 | 31 December 2022 | 31 December 2021 | ||||||||||||
Total engineering costs incurred | 446 | 317 | 1,187 | 955 | ||||||||||||
Engineering costs expensed | (234 | ) | (211 | ) | (730 | ) | (598 | ) | ||||||||
|
|
|
|
|
|
|
| |||||||||
Engineering costs capitalised | 212 | 106 | 457 | 357 | ||||||||||||
|
|
|
|
|
|
|
| |||||||||
Interest capitalised in engineering costs capitalised | 3 | 9 | 10 | 36 | ||||||||||||
Research and development grants capitalised | (10 | ) | (51 | ) | (22 | ) | (70 | ) | ||||||||
|
|
|
|
|
|
|
| |||||||||
Total internally developed intangible additions | 205 | 64 | 445 | 323 | ||||||||||||
|
|
|
|
|
|
|
| |||||||||
| 6 | Other income |
| Three months ended | Nine months ended | |||||||||||||||
£ millions | 31 December 2022 | 31 December 2021 | 31 December 2022 | 31 December 2021 | ||||||||||||
Grant income | 31 | 19 | 90 | 34 | ||||||||||||
Commissions | 6 | 4 | 19 | 10 | ||||||||||||
Other | 21 | 26 | 63 | 113 | ||||||||||||
|
|
|
|
|
|
|
| |||||||||
Total other income | 58 | 49 | 172 | 157 | ||||||||||||
|
|
|
|
|
|
|
| |||||||||
| 7 | Foreign exchange and fair value adjustments |
| Three months ended | Nine months ended | |||||||||||||||
£ millions | 31 December 2022 | 31 December 2021 | 31 December 2022 | 31 December 2021 | ||||||||||||
Foreign exchange and fair value adjustments on loans | 230 | 70 | (303 | ) | (24 | ) | ||||||||||
Foreign exchange (loss)/gain on economic hedges of loans | (87 | ) | (36 | ) | 247 | 43 | ||||||||||
Foreign exchange gain/(loss) on derivatives | 25 | (7 | ) | (11 | ) | (10 | ) | |||||||||
Other foreign exchange (loss)/gain | (57 | ) | 4 | 50 | 35 | |||||||||||
Realised gain on commodities | 4 | 22 | 34 | 60 | ||||||||||||
Unrealised loss on commodities | (12 | ) | (17 | ) | (129 | ) | (18 | ) | ||||||||
Fair value gain on equity investments | — | 1 | 11 | 4 | ||||||||||||
|
|
|
|
|
|
|
| |||||||||
Foreign exchange and fair value adjustments | 103 | 37 | (101 | ) | 90 | |||||||||||
|
|
|
|
|
|
|
| |||||||||
19
Table of Contents
Notes (forming part of the condensed consolidated interim financial statements)
| 8 | Finance income and expense |
| Three months ended | Nine months ended | |||||||||||||||
£ millions | 31 December 2022 | 31 December 2021 | 31 December 2022 | 31 December 2021 | ||||||||||||
Finance income | 22 | 2 | 40 | 5 | ||||||||||||
|
|
|
|
|
|
|
| |||||||||
Total finance income | 22 | 2 | 40 | 5 | ||||||||||||
|
|
|
|
|
|
|
| |||||||||
Interest expense on lease liabilities | (14 | ) | (11 | ) | (40 | ) | (34 | ) | ||||||||
Interest expense on financial liabilities measured at amortised cost other than lease liabilities | (118 | ) | (96 | ) | (323 | ) | (273 | ) | ||||||||
Interest (expense)/income on derivatives designated as a fair value hedge of financial liabilities | (3 | ) | 2 | (7 | ) | 6 | ||||||||||
Unwind of discount on provisions | (7 | ) | (2 | ) | (18 | ) | (7 | ) | ||||||||
Interest capitalised | 3 | 10 | 12 | 39 | ||||||||||||
|
|
|
|
|
|
|
| |||||||||
Total finance expense (net) | (139 | ) | (97 | ) | (376 | ) | (269 | ) | ||||||||
|
|
|
|
|
|
|
| |||||||||
The capitalisation rate used to calculate borrowing costs eligible for capitalisation during the nine month period ended 31 December 2022 was 5.3% (nine month period ended 31 December 2021: 4.6%).
| 9 | Other expenses |
| Three months ended | Nine months ended | |||||||||||||||
£ millions | 31 December 2022 | 31 December 2021 | 31 December 2022 | 31 December 2021 | ||||||||||||
Stores, spare parts and tools | 25 | 22 | 73 | 63 | ||||||||||||
Freight cost | 160 | 125 | 456 | 350 | ||||||||||||
Works, operations and other costs | 641 | 463 | 1,747 | 1,377 | ||||||||||||
Power and fuel | 42 | 50 | 138 | 100 | ||||||||||||
Write-down of intangible assets | — | — | — | 9 | ||||||||||||
Product warranty | 184 | 217 | 587 | 562 | ||||||||||||
Publicity | 128 | 104 | 368 | 299 | ||||||||||||
|
|
|
|
|
|
|
| |||||||||
Total other expenses | 1,180 | 981 | 3,369 | 2,760 | ||||||||||||
|
|
|
|
|
|
|
| |||||||||
| 10 | Allowances for trade and other receivables |
| Nine months ended | ||||||||
£ millions | 31 December 2022 | 31 December 2021 | ||||||
At beginning of period | 4 | 6 | ||||||
Charged during the period | 3 | 4 | ||||||
Receivables written off as uncollectable | (1 | ) | (1 | ) | ||||
Unused amounts reversed | (1 | ) | (1 | ) | ||||
|
|
|
| |||||
At end of period | 5 | 8 | ||||||
|
|
|
| |||||
20
Table of Contents
Notes (forming part of the condensed consolidated interim financial statements)
| 11 | Other financial assets |
As at (£ millions) | 31 December 2022 | 31 March 2022 | 31 December 2021 | |||||||||
Non-current | ||||||||||||
Restricted cash | 10 | 10 | 9 | |||||||||
Derivative financial instruments | 119 | 98 | 100 | |||||||||
Warranty reimbursement and other receivables | 56 | �� | 63 | 66 | ||||||||
Other | 16 | 14 | 13 | |||||||||
|
|
|
|
|
| |||||||
Total non-current other financial assets | 201 | 185 | 188 | |||||||||
|
|
|
|
|
| |||||||
Current | ||||||||||||
Restricted cash | 4 | 13 | 4 | |||||||||
Derivative financial instruments | 112 | 185 | 216 | |||||||||
Warranty reimbursement and other receivables | 67 | 72 | 84 | |||||||||
Accrued income | 68 | 39 | 56 | |||||||||
Other | 126 | 85 | 75 | |||||||||
|
|
|
|
|
| |||||||
Total current other financial assets | 377 | 394 | 435 | |||||||||
|
|
|
|
|
| |||||||
| 12 | Inventories |
As at (£ millions) | 31 December 2022 | 31 March 2022 | 31 December 2021 | |||||||||
Raw materials and consumables | 118 | 135 | 91 | |||||||||
Work-in-progress | 666 | 488 | 442 | |||||||||
Finished goods | 2,511 | 2,129 | 1,928 | |||||||||
Inventory basis adjustment | (5 | ) | 29 | 23 | ||||||||
|
|
|
|
|
| |||||||
Total inventories | 3,290 | 2,781 | 2,484 | |||||||||
|
|
|
|
|
| |||||||
| 13 | Other assets |
As at (£ millions) | 31 December 2022 | 31 March 2022 | 31 December 2021 | |||||||||
Non-current | ||||||||||||
Prepaid expenses | 45 | 24 | 26 | |||||||||
Research and development credit | 55 | 2 | 40 | |||||||||
Other | 7 | 9 | 11 | |||||||||
|
|
|
|
|
| |||||||
Total non-current other assets | 107 | 35 | 77 | |||||||||
|
|
|
|
|
| |||||||
Current | ||||||||||||
Recoverable VAT | 281 | 204 | 285 | |||||||||
Prepaid expenses | 224 | 208 | 189 | |||||||||
Research and development credit | 60 | 63 | 64 | |||||||||
Other | 35 | 18 | 18 | |||||||||
|
|
|
|
|
| |||||||
Total current other assets | 600 | 493 | 556 | |||||||||
|
|
|
|
|
| |||||||
| 14 | Taxation |
Recognised in the income statement
Income tax for the nine month periods ended 31 December 2022 and 31 December 2021 is charged at the estimated effective tax rate expected to apply for the applicable financial year ends and adjusted for relevant deferred tax amounts where applicable.
Despite a loss in the nine month period ended 31 December 2022, a tax charge of £42 million was incurred, £8 million of which was as a result of the Group’s inability to recognise UK deferred tax assets arising in the period due to the Group’s current UK loss profile and non-recognition of UK deferred tax assets.
21
Table of Contents
Notes (forming part of the condensed consolidated interim financial statements)
| 15 | Capital expenditure |
Capital expenditure on property, plant and equipment in the nine month period ended 31 December 2022 was £368 million (nine month period ended 31 December 2021: £582 million) and on intangible assets (excluding research and development credits) was £479 million (nine month period ended 31 December 2021: £384 million). There were no material disposals or changes in the use of assets.
| 16 | Other financial liabilities |
As at (£ millions) | 31 December 2022 | 31 March 2022 | 31 December 2021 | |||||||||
Current | ||||||||||||
Lease obligations | 64 | 62 | 60 | |||||||||
Interest accrued | 110 | 95 | 103 | |||||||||
Derivative financial instruments | 534 | 445 | 351 | |||||||||
Liability for vehicles sold under a repurchase arrangement | 227 | 267 | 325 | |||||||||
Other | 13 | 1 | — | |||||||||
|
|
|
|
|
| |||||||
Total current other financial liabilities | 948 | 870 | 839 | |||||||||
|
|
|
|
|
| |||||||
Non-current | ||||||||||||
Lease obligations | 650 | 508 | 524 | |||||||||
Derivative financial instruments | 662 | 338 | 191 | |||||||||
Other | 25 | 25 | 2 | |||||||||
|
|
|
|
|
| |||||||
Total non-current other financial liabilities | 1,337 | 871 | 717 | |||||||||
|
|
|
|
|
| |||||||
| 17 | Provisions |
As at (£ millions) | 31 December 2022 | 31 March 2022 | 31 December 2021 | |||||||||
Current | ||||||||||||
Product warranty | 619 | 604 | 620 | |||||||||
Legal, product liability and third party | 400 | 252 | 233 | |||||||||
Provision for residual risk | 7 | 12 | 22 | |||||||||
Provision for environmental liability | 3 | 3 | 2 | |||||||||
Restructuring | 13 | 118 | 203 | |||||||||
|
|
|
|
|
| |||||||
Total current provisions | 1,042 | 989 | 1,080 | |||||||||
|
|
|
|
|
| |||||||
Non-current | ||||||||||||
Product warranty | 980 | 1,026 | 1,007 | |||||||||
Legal, product liability and third party | 70 | 40 | 53 | |||||||||
Provision for residual risk | 11 | 19 | 27 | |||||||||
Provision for environmental liability | 26 | 23 | 23 | |||||||||
Other employee benefits obligations | 5 | 4 | 3 | |||||||||
|
|
|
|
|
| |||||||
Total non-current provisions | 1,092 | 1,112 | 1,113 | |||||||||
|
|
|
|
|
| |||||||
22
Table of Contents
Notes (forming part of the condensed consolidated interim financial statements)
| 17 | Provisions (continued) |
£ millions | Product warranty | Legal, product liability and third party | Residual risk | Environmental liability | Other employee benefits obligations | Restructuring | Total | |||||||||||||||||||||
Balance at 1 April 2022 | 1,630 | 292 | 31 | 26 | 4 | 118 | 2,101 | |||||||||||||||||||||
Provisions made during the period | 631 | 481 | 1 | 14 | 3 | 21 | 1,151 | |||||||||||||||||||||
Provisions used during the period | (566 | ) | (291 | ) | — | (1 | ) | (2 | ) | (110 | ) | (970 | ) | |||||||||||||||
Unused amounts reversed in the period | (114 | ) | (35 | ) | (14 | ) | (10 | ) | — | (16 | ) | (189 | ) | |||||||||||||||
Impact of unwind of discounting | 18 | — | — | — | — | — | 18 | |||||||||||||||||||||
Foreign currency translation | — | 23 | — | — | — | — | 23 | |||||||||||||||||||||
|
|
|
|
|
|
|
|
|
|
|
|
|
| |||||||||||||||
Balance at 31 December 2022 | 1,599 | 470 | 18 | 29 | 5 | 13 | 2,134 | |||||||||||||||||||||
|
|
|
|
|
|
|
|
|
|
|
|
|
| |||||||||||||||
Product warranty provision
The Group offers warranty cover in respect of manufacturing defects, which become apparent one to five years after purchase, dependent on the market in which the purchase occurred and the vehicle purchased. The Group offers warranties of up to eight years on batteries in electric vehicles. The estimated liability for product warranty is recognised when products are sold or when new warranty programmes are initiated. These estimates are established using historical information on the nature, frequency and average cost of warranty claims and management estimates regarding possible future warranty claims, customer goodwill and recall complaints. The discount on the warranty provision is calculated using a risk-free discount rate as the risks specific to the liability, such as inflation, are included in the base calculation. The timing of outflows will vary as and when a warranty claim will arise, being typically up to eight years.
Legal and product liability provision
A legal and product liability provision is maintained in respect of compliance with regulations and known litigations that impact the Group. The provision includes legal and constructive obligations to third parties and suppliers. The provision also comprises motor accident claims, consumer complaints, retailer terminations, supplier claims, employment cases, personal injury claims and compliance with emission regulations. The timing of outflows will vary as and when claims are received and settled, which is not known with certainty.
Residual risk provision
In certain markets, the Group is responsible for the residual risk arising on vehicles sold by retailers on leasing arrangements. The provision is based on the latest available market expectations of future residual value trends. The timing of the outflows will be at the end of the lease arrangements, being typically up to three years.
Environmental liability provision
This provision relates to various environmental remediation costs such as asbestos removal and land clean-up. The timing of when these costs will be incurred is not known with certainty.
Other employee benefits obligations
This provision relates to the LTIP scheme for certain employees and other amounts payable to employees.
23
Table of Contents
Notes (forming part of the condensed consolidated interim financial statements)
| 17 | Provisions (continued) |
Restructuring provision
The restructuring provision includes amounts for third party obligations arising from Group restructuring programmes. This includes amounts payable to employees following the announcement of the Group’s Reimagine strategy in the year ended 31 March 2021 as well as other Group restructuring programmes. Amounts are also included in relation to legal and constructive obligations made to third parties in connection with cancellations under the group’s Reimagine strategy.
The estimated liability for restructuring activities is recognised when the group has reason to believe there is a legal or constructive obligation arising from restructuring actions taken. The amount provided at the reporting date is calculated based on currently available facts and certain estimates for third party obligations. These estimates are established using historical experience based on the settlement costs for similar liabilities, with proxies being used where no direct comparison exists.
The amounts and timing of outflows will vary as and when restructuring obligations are progressed with third parties, with the likely range of outcomes not being materially different to the amount recorded.
| 18 | Other liabilities |
As at (£ millions) | 31 December 2022 | 31 March 2022 | 31 December 2021 | |||||||||
Current | ||||||||||||
Liabilities for advances received | 137 | 122 | 67 | |||||||||
Ongoing service obligations | 300 | 286 | 283 | |||||||||
VAT | 140 | 95 | 98 | |||||||||
Other taxes payable | 310 | 161 | 182 | |||||||||
Other | 4 | 10 | 11 | |||||||||
|
|
|
|
|
| |||||||
Total current other liabilities | 891 | 674 | 641 | |||||||||
|
|
|
|
|
| |||||||
Non-current | ||||||||||||
Ongoing service obligations | 411 | 395 | 405 | |||||||||
Other | 8 | 9 | 9 | |||||||||
|
|
|
|
|
| |||||||
Total non-current other liabilities | 419 | 404 | 414 | |||||||||
|
|
|
|
|
| |||||||
24
Table of Contents
Notes (forming part of the condensed consolidated interim financial statements)
| 19 | Interest bearing loans and borrowings |
As at (£ millions) | 31 December 2022 | 31 March 2022 | 31 December 2021 | |||||||||
Short-term borrowings | ||||||||||||
Bank loans | 595 | 599 | 606 | |||||||||
Current portion of long-term EURO MTF listed debt | 815 | 779 | 400 | |||||||||
Current portion of long-term loans | 249 | 401 | 397 | |||||||||
|
|
|
|
|
| |||||||
Short-term borrowings | 1,659 | 1,779 | 1,403 | |||||||||
|
|
|
|
|
| |||||||
Long-term borrowings | ||||||||||||
EURO MTF listed debt | 4,146 | 3,953 | 4,683 | |||||||||
Bank loans | 1,132 | 1,260 | 1,306 | |||||||||
Other unsecured | 35 | 35 | 34 | |||||||||
|
|
|
|
|
| |||||||
Long-term borrowings | 5,313 | 5,248 | 6,023 | |||||||||
|
|
|
|
|
| |||||||
Lease obligations | 714 | 570 | 584 | |||||||||
|
|
|
|
|
| |||||||
Total debt | 7,686 | 7,597 | 8,010 | |||||||||
|
|
|
|
|
| |||||||
Undrawn facilities
As at 31 December 2022, the Group has a fully undrawn revolving credit facility of £1,450 million (31 March 2022: £2,015 million, 31 December 2021: £2,015 million), which was renewed on 16 December 2022 with a new maturity date of April 2026.
| 20 | Financial instruments |
The condensed consolidated interim financial statements have been prepared on a historical cost basis except for certain financial instruments held at fair value. These financial instruments are classified as either level 2 fair value measurements, as defined by IFRS 13, being those derived from inputs other than quoted prices which are observable, or level 3 fair value measurements, being those derived from significant unobservable inputs. There have been no changes in the valuation techniques used or transfers between fair value levels from those set out in note 35 to the annual consolidated financial statements for the year ended 31 March 2022.
The tables below show the carrying amounts and fair value of each category of financial assets and liabilities, other than those with carrying amounts that are reasonable approximations of fair values.
| 31 December 2022 | 31 March 2022 | 31 December 2021 | ||||||||||||||||||||||
As at (£ millions) | Carrying value | Fair value | Carrying value | Fair value | Carrying value | Fair value | ||||||||||||||||||
Cash and cash equivalents | 3,712 | 3,712 | 4,223 | 4,223 | 4,273 | 4,273 | ||||||||||||||||||
Short-term deposits and other investments | 149 | 149 | 175 | 175 | 207 | 207 | ||||||||||||||||||
Trade receivables | 929 | 929 | 722 | 722 | 682 | 682 | ||||||||||||||||||
Other non-current investments | 41 | 41 | 30 | 30 | 29 | 29 | ||||||||||||||||||
Other financial assets - current | 377 | 377 | 394 | 394 | 435 | 435 | ||||||||||||||||||
Other financial assets - non-current | 201 | 201 | 185 | 185 | 188 | 188 | ||||||||||||||||||
|
|
|
|
|
|
|
|
|
|
|
| |||||||||||||
Total financial assets | 5,409 | 5,409 | 5,729 | 5,729 | 5,814 | 5,814 | ||||||||||||||||||
|
|
|
|
|
|
|
|
|
|
|
| |||||||||||||
Accounts payable | 5,355 | 5,355 | 5,144 | 5,144 | 4,524 | 4,524 | ||||||||||||||||||
Short-term borrowings | 1,659 | 1,657 | 1,779 | 1,778 | 1,403 | 1,407 | ||||||||||||||||||
Long-term borrowings | 5,313 | 4,823 | 5,248 | 5,216 | 6,023 | 6,239 | ||||||||||||||||||
Other financial liabilities - current | 948 | 948 | 870 | 870 | 839 | 839 | ||||||||||||||||||
Other financial liabilities - non-current | 1,337 | 1,207 | 871 | 901 | 717 | 795 | ||||||||||||||||||
|
|
|
|
|
|
|
|
|
|
|
| |||||||||||||
Total financial liabilities | 14,612 | 13,990 | 13,912 | 13,909 | 13,506 | 13,804 | ||||||||||||||||||
|
|
|
|
|
|
|
|
|
|
|
| |||||||||||||
25
Table of Contents
Notes (forming part of the condensed consolidated interim financial statements)
| 21 | Other reserves |
The movement in reserves is as follows:
£ millions | Translation reserve | Hedging reserve | Cost of hedging reserve | Retained earnings | Total other reserves | |||||||||||||||
Balance at 1 April 2022 | (333 | ) | (454 | ) | 19 | 3,603 | 2,835 | |||||||||||||
Loss for the period | — | — | — | (319 | ) | (319 | ) | |||||||||||||
Remeasurement of defined benefit obligation | — | — | — | 76 | 76 | |||||||||||||||
Loss on effective cash flow hedges | — | (888 | ) | (27 | ) | — | (915 | ) | ||||||||||||
Income tax related to items recognised in other comprehensive income | — | (27 | ) | 5 | (19 | ) | (41 | ) | ||||||||||||
Cash flow hedges reclassified to profit and loss | — | 481 | (11 | ) | — | 470 | ||||||||||||||
Income tax related to items reclassified to profit or loss | — | (90 | ) | 2 | — | (88 | ) | |||||||||||||
Amounts removed from hedge reserve and recognised in inventory | — | 47 | 6 | — | 53 | |||||||||||||||
Income tax related to amounts removed from hedge reserve and recognised in inventory | — | (10 | ) | (1 | ) | — | (11 | ) | ||||||||||||
Currency translation differences | 21 | — | — | — | 21 | |||||||||||||||
|
|
|
|
|
|
|
|
|
| |||||||||||
Balance at 31 December 2022 | (312 | ) | (941 | ) | (7 | ) | 3,341 | 2,081 | ||||||||||||
|
|
|
|
|
|
|
|
|
| |||||||||||
£ millions | Translation reserve | Hedging reserve | Cost of hedging reserve | Retained earnings | Total other reserves | |||||||||||||||
Balance at 1 April 2021 | (357 | ) | 136 | 1 | 3,806 | 3,586 | ||||||||||||||
Loss for the period | — | — | — | (731 | ) | (731 | ) | |||||||||||||
Remeasurement of defined benefit obligation | — | — | — | 95 | 95 | |||||||||||||||
Loss on effective cash flow hedges | — | (382 | ) | (6 | ) | — | (388 | ) | ||||||||||||
Income tax related to items recognised in other comprehensive income | — | 83 | 2 | 61 | 146 | |||||||||||||||
Cash flow hedges reclassified to profit and loss | — | (65 | ) | (14 | ) | — | (79 | ) | ||||||||||||
Income tax related to items reclassified to profit or loss | — | 12 | 3 | — | 15 | |||||||||||||||
Amounts removed from hedge reserve and recognised in inventory | — | 93 | 10 | — | 103 | |||||||||||||||
Income tax related to amounts removed from hedge reserve and recognised in inventory | — | (18 | ) | (2 | ) | — | (20 | ) | ||||||||||||
Currency translation differences | 6 | — | — | — | 6 | |||||||||||||||
|
|
|
|
|
|
|
|
|
| |||||||||||
Balance at 31 December 2021 | (351 | ) | (141 | ) | (6 | ) | 3,231 | 2,733 | ||||||||||||
|
|
|
|
|
|
|
|
|
| |||||||||||
| 22 | Dividends |
During the three and nine month periods ended 31 December 2022 and 31 December 2021, no ordinary share dividends were proposed or paid.
26
Table of Contents
Notes (forming part of the condensed consolidated interim financial statements)
| 23 | Employee benefits |
The Group has pension arrangements providing employees with defined benefits related to pay and service as set out in the rules of each scheme. The following tables set out disclosures pertaining to the retirement benefit amounts recognised in the consolidated financial statements.
| Nine months ended | ||||||||
| £ millions | 31 December 2022 | 31 December 2021 | ||||||
Change in present value of defined benefit obligation | ||||||||
Defined benefit obligation at beginning of period | 7,522 | 8,432 | ||||||
Current service cost | 63 | 89 | ||||||
Past service credit | (155 | ) | — | |||||
Interest expense | 158 | 132 | ||||||
Actuarial (gains)/losses arising from: | ||||||||
Changes in demographic assumptions | — | 26 | ||||||
Changes in financial assumptions | (2,469 | ) | 600 | |||||
Experience adjustments | 156 | (19 | ) | |||||
Exchange differences on foreign schemes | 1 | (1 | ) | |||||
Member contributions | 1 | 2 | ||||||
Benefits paid | (323 | ) | (378 | ) | ||||
|
|
|
| |||||
Defined benefit obligation at end of period | 4,954 | 8,883 | ||||||
|
|
|
| |||||
Change in fair value of scheme assets | ||||||||
Fair value of schemes’ assets at beginning of period | 7,931 | 8,045 | ||||||
Interest income | 181 | 128 | ||||||
Remeasurement (loss)/gain on the return of plan assets, excluding amounts included in interest income | (2,237 | ) | 702 | |||||
Administrative expenses | (19 | ) | (26 | ) | ||||
Exchange differences on foreign schemes | 1 | — | ||||||
Employer contributions | 111 | 153 | ||||||
Member contributions | 1 | 2 | ||||||
Benefits paid | (323 | ) | (378 | ) | ||||
|
|
|
| |||||
Fair value of schemes’ assets at end of period | 5,646 | 8,626 | ||||||
|
|
|
| |||||
The assumptions used in accounting for the pension plans in the periods are set out below:
Nine months ended | 31 December 2022 | 31 December 2021 | ||||||
Discount rate | 5.0 | % | 1.8 | % | ||||
Expected rate of increase in benefit revaluation of covered employees | 1.9 | % | 2.2 | % | ||||
RPI inflation rate | 3.0 | % | 3.2 | % | ||||
CPI inflation rate (capped at 5% p.a.) | 2.4 | % | n/a | |||||
CPI inflation rate (capped at 2.5% p.a.) | 1.7 | % | 1.8 | % | ||||
Amounts recognised in the condensed consolidated balance sheet consist of:
As at (£ millions) | 31 December 2022 | 31 March 2022 | 31 December 2021 | |||||||||
Present value of defined benefit obligations | (4,954 | ) | (7,522 | ) | (8,883 | ) | ||||||
Fair value of schemes’ assets | 5,646 | 7,931 | 8,626 | |||||||||
|
|
|
|
|
| |||||||
Net asset/(liability) | 692 | 409 | (257 | ) | ||||||||
|
|
|
|
|
| |||||||
Non-current assets | 719 | 434 | — | |||||||||
Non-current liabilities | (27 | ) | (25 | ) | (257 | ) | ||||||
27
Table of Contents
Notes (forming part of the condensed consolidated interim financial statements)
| 23 | Employee benefits (continued) |
For each of the valuations at 31 December 2022, 31 March 2022 and 31 December 2021 the mortality assumptions used are the SAPS base table, in particular S3 tables and the Light table for members of the Jaguar Executive Pension Plan. For the Jaguar Pension Plan, scaling factors of 101 per cent to 115 per cent have been used for male members and scaling factors of 103 per cent to 118 per cent have been used for female members. For the Land Rover Pension Scheme, scaling factors of 105 per cent to 117 per cent have been used for male members and scaling factors of 100 per cent to 116 per cent have been used for female members. For the Jaguar Executive Pension Plan, scaling factors of 93 per cent to 97 per cent have been used for male members and scaling factors of 91 per cent to 96 per cent have been used for female members.
At 31 December 2022 and 31 March 2022 there is an allowance for future improvements in line with the CMI (2021) projections and an allowance for long-term improvements of 1.25 per cent per annum and a smoothing parameter of 7.5.
At 31 December 2021 there was an allowance for future improvements in line with the CMI (2020) projections and an allowance for long-term improvements of 1.25 per cent per annum and a smoothing parameter of 7.5.
| 24 | Commitments and contingencies |
In the normal course of business, the Group faces claims and assertions by various parties. The Group assesses such claims and assertions and monitors the legal environment on an ongoing basis, with the assistance of external legal counsel wherever necessary. The Group records a liability for any claims where a potential loss is probable and capable of being estimated and discloses such matters in its financial statements, if material. For potential losses that are considered possible, but not probable, the Group provides disclosure in the consolidated financial statements but does not record a liability unless the loss becomes probable. Such potential losses may be of an uncertain timing and/or amount.
The following is a description of claims and contingencies where a potential loss is possible, but not probable. Management believes that none of the contingencies described below, either individually or in aggregate, would have a material adverse effect on the Group’s financial condition, results of operations or cash flows.
As at (£ millions) | 31 December 2022 | 31 March 2022 | 31 December 2021 | |||||||||
Contingencies: | ||||||||||||
Litigation and product related matters | 26 | 25 | 22 | |||||||||
Taxes and duties | 64 | 75 | 60 | |||||||||
Other | 498 | 470 | 495 | |||||||||
Commitments: | ||||||||||||
- Plant and equipment | 788 | 735 | 665 | |||||||||
- Intangible assets | 19 | 15 | 15 | |||||||||
Pledged as collateral/security against the borrowings and commitments: | ||||||||||||
- Trade receivables | — | — | 25 | |||||||||
- Other financial assets | 8 | 13 | 13 | |||||||||
28
Table of Contents
Notes (forming part of the condensed consolidated interim financial statements)
| 24 | Commitments and contingencies (continued) |
Litigation and product related matters
The Group is involved in legal proceedings, both as plaintiff and as defendant. There are claims and potential claims against the Group which management has not recognised, as settlement is not considered probable. These claims and potential claims pertain to motor accident claims, consumer complaints, employment and dealership arrangements, replacement of parts of vehicles and/or compensation for deficiency in the services by the Group or its dealers.
The Group has provided for the estimated cost of repair following the passenger safety airbag issue in the United States, China, Canada, Korea, Taiwan, Australia and Japan. The Group recognises that there is a potential risk of further recalls in the future and considers such events on a case-by-case basis as the relevant facts and circumstances materialise, provided it can reliably estimate the amount and timing of any potential future costs associated with this warranty issue.
Other taxes and duties
Contingencies and commitments include tax contingent liabilities which mainly relate to tax audits and tax litigation claims.
Other
Contingencies also include other contingent liabilities, such as possible claims from suppliers, retailers and other third parties. The timing of any outflow will vary as and when claims are received and settled, which is not known with certainty.
Commitments
The Group has entered into various contracts with vendors and contractors for the acquisition of plant and equipment and various civil contracts of capital nature and the acquisition of intangible assets.
The remaining financial commitments, in particular the purchase commitments and guarantees, are of a magnitude typical for the industry.
Joint venture
Stipulated within the joint venture agreement for Chery Jaguar Land Rover Automotive Co. Ltd, and subsequently amended by a change to the Articles of Association of Chery Jaguar Land Rover Automotive Co. Ltd. is a commitment for the Group to contribute a total of CNY 5,000 million of capital. Of this amount, CNY 3,475 million has been contributed as at 31 December 2022. The outstanding commitment of CNY 1,525 million translates to £181 million at the 31 December 2022 exchange rate.
At 31 December 2021, the outstanding commitment was CNY 1,525 million (£177 million at the 31 December 2021 exchange rate).
The Group’s share of capital commitments of its joint venture at 31 December 2022 is £16 million (31 March 2021: £16 million, 31 December 2021: £15 million) and contingent liabilities of its joint venture 31 December 2022 is £nil (31 March 2021: £nil, 31 December 2021: £nil).
29
Table of Contents
Notes (forming part of the condensed consolidated interim financial statements)
| 25 | Capital Management |
The Group’s objectives when managing capital are to ensure the going concern operation of all subsidiary companies within the Group and to maintain an efficient capital structure to support ongoing and future operations of the Group and to meet shareholder expectations.
The Group issues debt, primarily in the form of bonds, to meet anticipated funding requirements and maintain sufficient liquidity. The Group also maintains certain undrawn committed credit facilities to provide additional liquidity. These borrowings, together with cash generated from operations, are loaned internally or contributed as equity to certain subsidiaries as required. Surplus cash in subsidiaries is pooled (where practicable) and invested to satisfy security, liquidity and yield requirements.
The capital structure and funding requirements are regularly monitored by the JLR plc Board to ensure sufficient liquidity is maintained by the Group. All debt issuances and capital distributions are approved by the JLR plc Board.
The following table summarises the capital of the Group:
As at (£ millions) | 31 December 2022 | 31 March 2022 | 31 December 2021 | |||||||||
Short-term debt | 1,723 | 1,841 | 1,463 | |||||||||
Long-term debt | 5,963 | 5,756 | 6,547 | |||||||||
|
|
|
|
|
| |||||||
Total debt* | 7,686 | 7,597 | 8,010 | |||||||||
|
|
|
|
|
| |||||||
Equity attributable to shareholders | 3,749 | 4,503 | 4,401 | |||||||||
|
|
|
|
|
| |||||||
Total capital | 11,435 | 12,100 | 12,411 | |||||||||
|
|
|
|
|
| |||||||
| * | Total debt includes lease obligations of £714 million (31 March 2022: £570 million, 31 December 2021: £584 million). |
30
Table of Contents
Notes (forming part of the condensed consolidated interim financial statements)
| 26 | Notes to the consolidated cash flow statement |
Reconciliation of profit/(loss) for the period to cash generated from/(used in) operations
£ millions | Three months ended | Nine months ended | ||||||||||||||
| 31 December 2022 | 31 December 2021 | 31 December 2022 | 31 December 2021 | |||||||||||||
Cash flows from operating activities | ||||||||||||||||
Profit/(loss) for the period | 261 | (67 | ) | (319 | ) | (734 | ) | |||||||||
Adjustments for: | ||||||||||||||||
Depreciation and amortisation | 494 | 483 | 1,464 | 1,435 | ||||||||||||
Write-down of tangible assets | — | 3 | — | 3 | ||||||||||||
Write-down of intangible assets | — | — | — | 9 | ||||||||||||
Loss on disposal of assets | 5 | — | 7 | 4 | ||||||||||||
Income tax expense | 4 | 58 | 42 | 313 | ||||||||||||
Finance expense (net) | 139 | 97 | 376 | 269 | ||||||||||||
Finance income | (22 | ) | (2 | ) | (40 | ) | (5 | ) | ||||||||
Foreign exchange on debt, derivatives and balance sheet revaluation* | (169 | ) | (34 | ) | 61 | (16 | ) | |||||||||
Foreign exchange loss on other restricted deposits | — | 2 | — | — | ||||||||||||
Unrealised loss on commodities | 12 | 17 | 129 | 18 | ||||||||||||
Share of (profit)/loss of equity accounted investments | (3 | ) | 14 | (11 | ) | 21 | ||||||||||
Fair value gain on equity investments | — | (1 | ) | (11 | ) | (4 | ) | |||||||||
Exceptional items | — | — | (155 | ) | — | |||||||||||
Other non-cash adjustments | (1 | ) | — | (1 | ) | 1 | ||||||||||
|
|
|
|
|
|
|
| |||||||||
Cash flows from operating activities before changes in assets and liabilities | 720 | 570 | 1,542 | 1,314 | ||||||||||||
|
|
|
|
|
|
|
| |||||||||
Trade receivables and other assets* | 70 | (282 | ) | (459 | ) | 101 | ||||||||||
Other financial assets | 151 | (27 | ) | 152 | (25 | ) | ||||||||||
Inventories | (76 | ) | (28 | ) | (544 | ) | 545 | |||||||||
Accounts payable, other liabilities and retirement benefit obligations* | 284 | 381 | 396 | (1,845 | ) | |||||||||||
Other financial liabilities | (20 | ) | (25 | ) | 47 | (50 | ) | |||||||||
Provisions | (103 | ) | (86 | ) | (26 | ) | (216 | ) | ||||||||
|
|
|
|
|
|
|
| |||||||||
Cash generated from/(used in) operations | 1,026 | 503 | 1,108 | (176 | ) | |||||||||||
|
|
|
|
|
|
|
| |||||||||
| * | FY22 comparatives have been represented to align with the FY23 presentation changes to combine foreign exchange on debt, derivatives and balance sheet revaluation into a single line; and to group certain working capital movements. This has not resulted in any change to reported ‘cash flows from operating activities before changes in assets and liabilities’ or ‘cash generated from/(used in) operations”. |
31
Table of Contents
Notes (forming part of the condensed consolidated interim financial statements)
| 26 | Notes to the consolidated cash flow statement (continued) |
Reconciliation of movements of liabilities to cash flows arising from financing activities
£ millions | Borrowings | Lease obligations | Interest accrued | Total | ||||||||||||
Balance at 1 April 2021 | 6,178 | 519 | 84 | 6,781 | ||||||||||||
Cash flows | ||||||||||||||||
Proceeds from issue of financing | 2,096 | — | — | 2,096 | ||||||||||||
Repayment of financing | (857 | ) | (54 | ) | — | (911 | ) | |||||||||
Arrangement fees paid | (13 | ) | — | — | (13 | ) | ||||||||||
Interest paid | — | (34 | ) | (215 | ) | (249 | ) | |||||||||
Non-cash movements | ||||||||||||||||
Issue of new leases | — | 115 | — | 115 | ||||||||||||
Interest accrued | — | 34 | 233 | 267 | ||||||||||||
Foreign exchange | 37 | 4 | 1 | 42 | ||||||||||||
Fee amortisation | 8 | — | — | 8 | ||||||||||||
Fair value adjustment on loans | (23 | ) | — | — | (23 | ) | ||||||||||
|
|
|
|
|
|
|
| |||||||||
Balance at 31 December 2021 | 7,426 | 584 | 103 | 8,113 | ||||||||||||
|
|
|
|
|
|
|
| |||||||||
Balance at 1 April 2022 | 7,027 | 570 | 95 | 7,692 | ||||||||||||
Cash flows | ||||||||||||||||
Proceeds from issue of financing | 594 | — | — | 594 | ||||||||||||
Repayment of financing | (959 | ) | (54 | ) | — | (1,013 | ) | |||||||||
Interest paid | — | (40 | ) | (257 | ) | (353 | ) | |||||||||
Non-cash movements | ||||||||||||||||
Issue of new leases | — | 189 | — | 189 | ||||||||||||
Interest accrued | — | 40 | 263 | 303 | ||||||||||||
Foreign exchange | 417 | 10 | 9 | 436 | ||||||||||||
Lease terminations | — | (1 | ) | — | (1 | ) | ||||||||||
Fee amortisation | 9 | — | — | 9 | ||||||||||||
Bond revaluation in hedge reserve | (52 | ) | — | — | (52 | ) | ||||||||||
Fair value adjustment on loans | (64 | ) | — | — | (64 | ) | ||||||||||
|
|
|
|
|
|
|
| |||||||||
Balance at 31 December 2022 | 6,972 | 714 | 110 | 7,796 | ||||||||||||
|
|
|
|
|
|
|
| |||||||||
Included within ‘finance expenses and fees paid’ in the condensed consolidated cash flow statement is £40 million in the nine months ended 31 December 2022 (nine months ended 31 December 2021: £29 million) of cash interest paid relating to other assets and liabilities not included in the reconciliation above.
32
Table of Contents
Notes (forming part of the condensed consolidated interim financial statements)
| 27 | Related party transactions |
Tata Sons Limited is a company with significant influence over the Group’s ultimate parent company Tata Motors Limited. The Group’s related parties therefore include Tata Sons Limited, subsidiaries and joint ventures of Tata Sons Private Limited and subsidiaries, joint ventures and associates of Tata Motors Limited. The Group routinely enters into transactions with its related parties in the ordinary course of business, including transactions for the sale and purchase of products with its joint ventures and associates.
All transactions with related parties are conducted under normal terms of business and all amounts outstanding are unsecured and will be settled in cash. Transactions and balances with the Group’s own subsidiaries are eliminated on consolidation.
The following table summarises related party transactions and balances not eliminated in the consolidated condensed interim financial statements.
Nine months ended 31 December 2022 (£ millions) | With joint ventures of the Group | With associates of the Group and their subsidiaries | With Tata Sons Private Limited and its subsidiaries and joint ventures | With immediate or ultimate parent and its subsidiaries, joint ventures and associates | ||||||||||||
Sale of products | 211 | — | 1 | 23 | ||||||||||||
Purchase of goods | 58 | 58 | — | 64 | ||||||||||||
Services received | — | — | 144 | 69 | ||||||||||||
Services rendered | 50 | — | — | 3 | ||||||||||||
Trade and other receivables | 43 | — | — | 28 | ||||||||||||
Accounts payable | 1 | 1 | 23 | 30 | ||||||||||||
Nine months ended 31 December 2021 (£ millions) | With joint ventures of the Group | With associates of the Group and their subsidiaries | With Tata Sons Private Limited and its subsidiaries and joint ventures | With immediate or ultimate parent and its subsidiaries, joint ventures and associates | ||||||||||||
Sale of products | 212 | — | 1 | 19 | ||||||||||||
Purchase of goods | — | — | — | 61 | ||||||||||||
Services received | — | — | 112 | 54 | ||||||||||||
Services rendered | 46 | — | — | 1 | ||||||||||||
Trade and other receivables | 36 | — | — | 19 | ||||||||||||
Accounts payable | — | — | 16 | 27 | ||||||||||||
Compensation of key management personnel
| Nine months ended | ||||||||
| £ millions | 31 December 2022 | 31 December 2021 | ||||||
Key management personnel remuneration | 17 | 16 | ||||||
33