UNITED STATES
SECURITIES AND EXCHANGE COMMISSION
Washington, D.C. 20549
FORM N-CSR
CERTIFIED SHAREHOLDER REPORT OF REGISTERED MANAGEMENT
INVESTMENT COMPANIES
Investment Company Act file number 811-8598
The Commerce Funds
(Exact name of registrant as specified in charter)
|
| 922 Walnut Fourth Floor Kansas City, Missouri 64106 |
| (Address of principal executive offices) (Zip code) |
Diana E. McCarthy, Esq.,
Drinker Biddle & Reath LLP
One Logan Square
18th & Cherry Streets
Philadelphia, PA 19103
(Name and address of agent for service)
Registrant’s telephone number, including area code:1-800-995-6365
Date of fiscal year end 10/31/04
Date of reporting period: 4/30/04
| ITEM 1. | | REPORTS TO SHAREHOLDERS |
The following is a copy of the Semi-Annual Report to Shareholders pursuant to Rule 30e-1 under the Investment Company Act of 1940 (17 CFR 270.30e-1).

The Commerce Funds
Semi-Annual Report
April 30, 2004
commerce funds
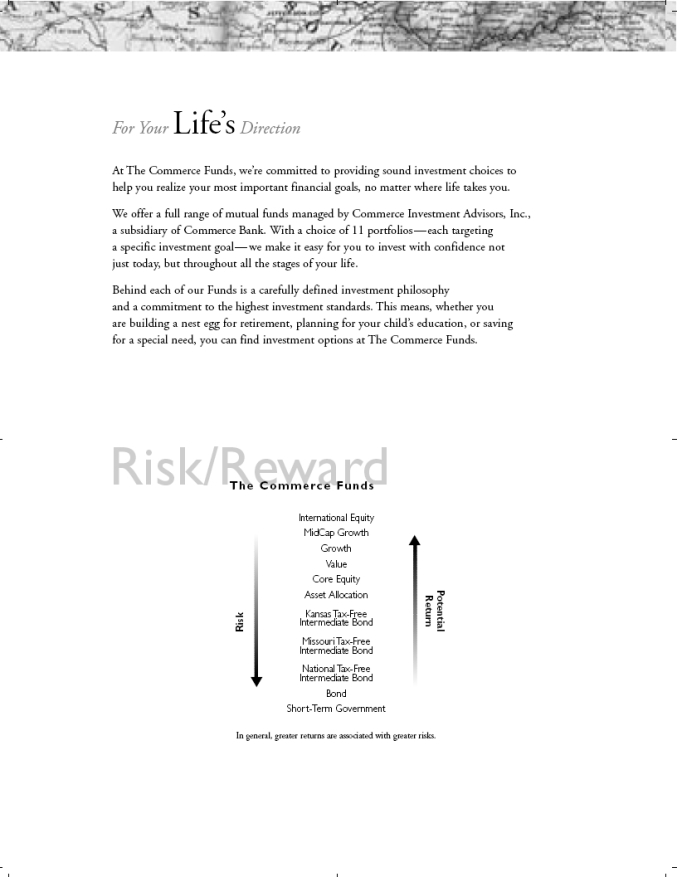
For Your Life’s Direction
At The Commerce Funds, we’re committed to providing sound investment choices to help you realize your most important financial goals, no matter where life takes you.
We offer a full range of mutual funds managed by Commerce Investment Advisors, Inc., a subsidiary of Commerce Bank. With a choice of 11 portfolios—each targeting a specific investment goal—we make it easy for you to invest with confidence not just today, but throughout all the stages of your life.
Behind each of our Funds is a carefully defined investment philosophy and a commitment to the highest investment standards. This means, whether you are building a nest egg for retirement, planning for your child’s education, or saving for a special need, you can find investment options at The Commerce Funds.
Risk/Reward
The Commerce Funds
International Equity
MidCap Growth
Growth
Value
Core Equity
Asset Allocation
Kansas Tax-Free
Intermediate Bond
Missouri Tax-Free
Intermediate Bond
National Tax-Free
Intermediate Bond
Bond
Short-Term Government
Risk Potential Return
In general, greater returns are associated with greater risks.
COMMERCE FUNDS
Table of Contents
| | |
Performance Reviews and Statements of Investments | | |
| |
Core Equity | | 2 |
| |
Growth | | 4 |
| |
Value | | 6 |
| |
MidCap Growth | | 8 |
| |
International Equity | | 10 |
| |
Asset Allocation | | 14 |
| |
Bond | | 15 |
| |
Short-Term Government | | 20 |
| |
National Tax-Free Intermediate Bond | | 23 |
| |
Missouri Tax-Free Intermediate Bond | | 30 |
| |
Kansas Tax-Free Intermediate Bond | | 36 |
| |
Statements of Assets and Liabilities | | 40 |
| |
Statements of Operations | | 42 |
| |
Statements of Changes in Net Assets | | 44 |
| |
Notes to Financial Statements | | 48 |
| |
Financial Highlights | | 60 |
Please note:
The information in this semi-annual report is as of April 30, 2004 and is unaudited. To view more recent information about each Commerce Fund’s performance and portfolio or to get a prospectus, please visit our website at www.commercefunds.com.
You may also receive Commerce Funds information by calling toll free 1-800-995-6365 or by writing to P.O. Box 219525, Kansas City, Missouri, 64121-9525, or you may contact your investment professional. The Commerce Funds publish performance and portfolio information for each Commerce Fund at the end of every calendar quarter. Investors should read the prospectus carefully before investing or sending money.
COMMERCE CORE EQUITY FUND
Core Equity Fund
Performance Review(a) (Unaudited)
For the six months ended April 30, 2004, the Institutional Shares of the Fund had a total return of 6.65%, based on Net Asset Value (NAV). The Service Shares had a total return, without sales charge, of 6.55% for the same period based on NAV. This compares to the Lipper Large Cap Core Funds Index(b) six-month return of 5.09% and the S&P 500 Index(c) six-month return of 6.27%. Past performance is no guarantee of future results.
Statement of Investments
April 30, 2004 (Unaudited)
| | | | |
| | |
| Shares | | Description | | Value |
| Common Stocks – 97.8% |
| Commercial Services – 1.0% |
| 32,525 | | Omnicom Group, Inc. | | $ 2,586,063 |
|
| Communications – 1.6% |
| 108,935 | | Verizon Communications, Inc. | | 4,111,207 |
|
| Consumer Durables – 5.1% |
| 66,960 | | Fortune Brands, Inc. | | 5,105,700 |
| 83,395 | | Harley-Davidson, Inc. | | 4,696,806 |
| 135,940 | | Leggett & Platt, Inc. | | 3,072,244 |
| | | | |
|
| | | | | 12,874,750 |
|
| Consumer Non-Durables – 4.2% |
| 38,090 | | Anheuser-Busch Companies, Inc. | | 1,951,732 |
| 70,275 | | Jones Apparel Group, Inc. | | 2,572,065 |
| 57,335 | | The Procter & Gamble Co. | | 6,063,176 |
| | | | |
|
| | | | | 10,586,973 |
|
| Consumer Services – 6.7% |
| 65,385 | | eBay, Inc.* | | 5,219,031 |
| 112,095 | | Fox Entertainment Group, Inc.* | | 3,121,846 |
| 82,465 | | International Game Technology | | 3,112,229 |
| 163,875 | | McDonald’s Corp. | | 4,462,316 |
| 31,710 | | Viacom, Inc. Class B* | | 1,225,591 |
| | | | |
|
| | | | | 17,141,013 |
|
| Distribution Services – 3.0% |
| 26,435 | | Cardinal Health, Inc. | | 1,936,364 |
| 150,215 | | SYSCO Corp. | | 5,745,723 |
| | | | |
|
| | | | | 7,682,087 |
|
| Electronic Technology – 9.9% |
| 240,590 | | Cisco Systems, Inc.* | | 5,021,113 |
| 123,120 | | Dell, Inc.* | | 4,273,495 |
| 153,105 | | Intel Corp. | | 3,939,392 |
| 83,660 | | National Semiconductor Corp.* | | 3,412,491 |
| 41,580 | | QUALCOMM, Inc. | | 2,597,087 |
| 76,910 | | Tektronix, Inc. | | 2,276,536 |
|
| | | | |
| | |
| Shares | | Description | | Value |
| Common Stocks – (continued) |
| Electronic Technology – (continued) |
| 94,350 | | Texas Instruments, Inc. | | $ 2,368,185 |
| 52,300 | | UTStarcom, Inc.* | | 1,378,105 |
| | | | |
|
| | | | | 25,266,404 |
|
| Energy Minerals – 5.7% |
| 58,680 | | ConocoPhillips | | 4,183,884 |
| 44,355 | | EOG Resources, Inc. | | 2,184,484 |
| 190,960 | | Exxon Mobil Corp. | | 8,125,348 |
| | | | |
|
| | | | | 14,493,716 |
|
| Finance – 20.7% |
| 86,180 | | AFLAC, Inc. | | 3,639,381 |
| 42,000 | | Bank of America Corp. | | 3,380,580 |
| 67,325 | | Charter One Financial, Inc. | | 2,246,635 |
| 169,295 | | Citigroup, Inc. | | 8,141,397 |
| 67,880 | | Freddie Mac | | 3,964,192 |
| 68,685 | | J. P. Morgan Chase & Co. | | 2,582,556 |
| 33,610 | | Legg Mason, Inc. | | 3,094,137 |
| 49,995 | | Lehman Brothers Holdings, Inc. | | 3,669,633 |
| 53,510 | | Lincoln National Corp. | | 2,401,529 |
| 67,330 | | Merrill Lynch & Co., Inc. | | 3,651,306 |
| 199,180 | | Principal Financial Group, Inc. | | 7,031,054 |
| 81,620 | | Wachovia Corp. | | 3,734,115 |
| 61,455 | | Washington Mutual, Inc. | | 2,420,712 |
| 51,640 | | Wells Fargo & Co. | | 2,915,594 |
| | | | |
|
| | | | | 52,872,821 |
|
| Health Services – 2.5% |
| 58,940 | | Aetna, Inc. | | 4,877,285 |
| 40,920 | | Lincare Holdings, Inc.* | | 1,421,152 |
| | | | |
|
| | | | | 6,298,437 |
|
| Health Technology – 9.8% |
| 66,755 | | Amgen, Inc.* | | 3,756,304 |
| 86,150 | | Boston Scientific Corp.* | | 3,548,519 |
|
| (a) | | Fund returns assume fee waivers and expense reductions and are not annualized. Returns do not reflect the deduction of taxes that a shareholder would pay on fund distributions or the redemption of fund shares. |
| (b) | | The Lipper Large Cap Core Funds Index is an unmanaged index consisting of funds that, by portfolio practice, invest at least 75% of their equity assets in companies that have an average price-to-earnings ratio, price-to-book ratio, and three-year sales-per-share growth value, compared to the S&P 500 Index. The Index figures do not reflect any fees, expenses or taxes. |
| (c) | | The S&P 500 Index is an unmanaged index that emphasizes large capitalization companies. The Index figures do not reflect any fees, expenses or taxes. |
| | |
| 2 | | The accompanying notes are an integral part of these financial statements. |
COMMERCE CORE EQUITY FUND
| | | | | |
| | |
| Shares | | Description | | Value |
| Common Stocks – (continued) |
Health Technology – (continued) |
| 16,715 | | Genentech, Inc.* | | $ | 2,052,602 |
| 66,605 | | Johnson & Johnson | | | 3,598,668 |
| 55,780 | | Medtronic, Inc. | | | 2,814,659 |
| 133,240 | | Pfizer, Inc. | | | 4,764,662 |
| 18,165 | | Stryker Corp. | | | 1,797,063 |
| 34,460 | | Zimmer Holdings, Inc.* | | | 2,751,631 |
| | | | |
|
|
| | | | | | 25,084,108 |
|
Producer Manufacturing – 9.8% |
| 65,640 | | 3M Co. | | | 5,676,547 |
| 43,390 | | Caterpillar, Inc. | | | 3,372,705 |
| 67,600 | | Danaher Corp. | | | 6,254,352 |
| 193,435 | | General Electric Co. | | | 5,793,378 |
| 59,300 | | Ingersoll-Rand Co. | | | 3,827,815 |
| | | | |
|
|
| | | | | | 24,924,797 |
|
Retail Trade – 6.1% |
| 28,000 | | AutoZone, Inc.* | | | 2,451,960 |
| 68,825 | | Best Buy Co., Inc. | | | 3,733,756 |
| 161,715 | | Office Depot, Inc.* | | | 2,831,630 |
| 38,685 | | The Gap, Inc. | | | 851,457 |
| 64,825 | | Wal-Mart Stores, Inc. | | | 3,695,025 |
| 61,550 | | Williams-Sonoma, Inc.* | | | 1,999,144 |
| | | | |
|
|
| | | | | | 15,562,972 |
|
Technology Services – 8.1% |
| 50,215 | | International Business
Machines Corp. | | | 4,427,456 |
| 346,835 | | Microsoft Corp. | | | 9,007,305 |
| 186,515 | | Oracle Corp.* | | | 2,092,698 |
| 81,755 | | Symantec Corp.* | | | 3,683,063 |
| 28,230 | | Yahoo!, Inc.* | | | 1,424,486 |
| | | | |
|
|
| | | | | | 20,635,008 |
|
Transportation – 1.1% |
| 39,015 | | FedEx Corp. | | | 2,805,569 |
|
Utilities – 2.5% |
| 37,430 | | Entergy Corp. | | | 2,043,678 |
| 65,440 | | Exelon Corp. | | | 4,380,554 |
| | | | |
|
|
| | | | | | 6,424,232 |
|
| TOTAL COMMON STOCKS | | | |
(Cost $217,128,846) | | $ | 249,350,157 |
|
| | | | | | | |
Principal Amount | | Interest
Rate | | Maturity
Date | | Value |
| Repurchase Agreement – 1.2% |
| State Street Bank & Trust Co.^ | | | |
| $2,962,000 | | 0.75% | | 05/03/2004 | | $ | 2,962,000 |
| Maturity Value: $2,962,185 | | | | | |
|
| TOTAL REPURCHASE AGREEMENT | | | |
(Cost $2,962,000) | | | | $ | 2,962,000 |
|
| TOTAL INVESTMENTS – 99.0% | | | |
(Cost $220,090,846) | | | | | 252,312,157 |
| Other assets in excess of liabilities – 1.0% | | | 2,490,785 |
|
| Net Assets – 100.0% | | $ | 254,802,942 |
|
| | |
| * | | Non-income producing security. |
| ^ | | Repurchase agreement was entered into on April 30, 2004. At April 30, 2004, this agreement was fully collateralized by U.S. Treasury Notes. |
| | |
| The accompanying notes are an integral part of these financial statements. | | 3 |
COMMERCE GROWTH FUND
Growth Fund
Performance Review(a) (Unaudited)
For the six months ended April 30, 2004, the Institutional Shares of the Fund had a total return of 2.59%, based on Net Asset Value (NAV). The Service Shares had a total return, without sales charge, of 2.48% for the same period based on NAV. This compares to the Lipper Large-Cap Growth Funds Index(b) six-month return of 2.70% and the Russell 1000 Growth Index(c) six-month return of 4.14%. Past performance is no guarantee of future results.
Statement of Investments
April 30, 2004 (Unaudited)
| | | | |
| | |
| Shares | | Description | | Value |
| Common Stocks – 99.8% |
| Communications – 1.3% | | |
| 105,600 | | Nextel Communications, Inc.* | | $ 2,519,616 |
|
| Consumer Durables – 1.0% | | |
| 39,000 | | Electronic Arts, Inc.* | | 1,974,180 |
|
| Consumer Non-Durables – 6.8% | | |
| 40,400 | | Anheuser-Busch Companies, Inc. | | 2,070,096 |
| 29,000 | | Colgate-Palmolive Co. | | 1,678,520 |
| 63,100 | | PepsiCo, Inc. | | 3,438,319 |
| 58,900 | | The Procter & Gamble Co. | | 6,228,675 |
| | | | |
|
| | | | | 13,415,610 |
|
| Consumer Services – 3.9% | | |
| 32,600 | | eBay, Inc.* | | 2,602,132 |
| 51,100 | | Harrah’s Entertainment, Inc. | | 2,717,498 |
| 60,900 | | International Game Technology | | 2,298,366 |
| | | | |
|
| | | | | 7,617,996 |
|
| Distribution Services – 1.6% | | |
| 26,700 | | CDW Corp. | | 1,668,483 |
| 39,500 | | SYSCO Corp. | | 1,510,875 |
| | | | |
|
| | | | | 3,179,358 |
|
| Electronic Technology – 20.2% | | |
| 86,600 | | Advanced Fibre Communications, Inc.* | | 1,446,220 |
| 406,700 | | Cisco Systems, Inc.* | | 8,487,829 |
| 153,700 | | Dell, Inc.* | | 5,334,927 |
| 76,500 | | Fairchild Semiconductor International, Inc.* | | 1,489,455 |
| 262,300 | | Intel Corp. | | 6,748,979 |
| 74,600 | | Jabil Circuit, Inc.* | | 1,968,694 |
| 60,200 | | L-3 Communications Holdings, Inc. | | 3,716,748 |
| 75,500 | | Lam Research Corp.* | | 1,671,570 |
| 26,700 | | Lexmark International, Inc.* | | 2,415,282 |
| 74,300 | | Microchip Technology, Inc. | | 2,081,886 |
| 143,900 | | Texas Instruments, Inc. | | 3,611,890 |
|
| | | | |
| | |
| Shares | | Description | | Value |
| Common Stocks – (continued) |
| Electronic Technology – (continued) | | |
| 35,000 | | UTStarcom, Inc.* | | $ 922,250 |
| | | | |
|
| | | | | 39,895,730 |
|
| Energy Minerals – 1.7% | | |
| 69,300 | | EOG Resources, Inc. | | 3,413,025 |
|
| Finance – 10.6% | | |
| 77,500 | | American Express Co. | | 3,793,625 |
| 43,200 | | American International Group, Inc. | | 3,095,280 |
| 43,600 | | Citigroup, Inc. | | 2,096,724 |
| 66,800 | | Morgan Stanley & Co., Inc. | | 3,432,852 |
| 36,200 | | The Progressive Corp. | | 3,168,224 |
| 95,100 | | Wells Fargo & Co. | | 5,369,346 |
| | | | |
|
| | | | | 20,956,051 |
|
| Health Services – 4.6% | | |
| 20,800 | | Quest Diagnostics, Inc. | | 1,754,480 |
| 80,300 | | UnitedHealth Group, Inc. | | 4,936,844 |
| 22,100 | | WellPoint Health Networks, Inc.* | | 2,468,349 |
| | | | |
|
| | | | | 9,159,673 |
|
| Health Technology – 12.6% | | |
| 24,300 | | Allergan, Inc. | | 2,139,615 |
| 49,400 | | Becton, Dickinson & Co. | | 2,497,170 |
| 46,700 | | Forest Laboratories, Inc.* | | 3,011,216 |
| 41,500 | | Medtronic, Inc. | | 2,094,090 |
| 309,300 | | Pfizer, Inc. | | 11,060,568 |
| 41,900 | | Stryker Corp. | | 4,145,167 |
| | | | |
|
| | | | | 24,947,826 |
|
| Industrial Services – 1.0% | | |
| 46,000 | | BJ Services Co.* | | 2,047,000 |
|
| Miscellaneous – 4.5% | | |
| 59,500 | | Biotech HOLDRs Trust* | | 8,920,835 |
|
| (a) | | Fund returns assume fee waivers and expense reductions and are not annualized. Returns do not reflect the deduction of taxes that a shareholder would pay on fund distributions or the redemption of fund shares. |
| (b) | | The Lipper Large-Cap Growth Funds Index is an unmanaged index consisting of funds that, by portfolio practice, invest at least 75% of their equity assets in companies that have an above-average price-to-earnings ratio, price-to-book ratio, and three-year sales-per-share growth value, compared to the S&P 500 Index. The Index figures do not reflect any fees, expenses or taxes. |
| (c) | | The Russell 1000 Growth Index measures the performance of those Russell 1000 companies with higher price-to-book ratios and higher forecasted growth values. The Index figures do not reflect any fees, expenses or taxes. |
| | |
| 4 | | The accompanying notes are an integral part of these financial statements. |
COMMERCE GROWTH FUND
| | | | |
| | |
| Shares | | Description | | Value |
| Common Stocks – (continued) |
| Non-Energy Minerals – 2.6% | | |
| 69,700 | | Freeport-McMoRan Copper & Gold, Inc. Class B | | $ 2,125,850 |
| 79,000 | | Newmont Mining Corp. | | 2,954,600 |
| | | | |
|
| | | | | 5,080,450 |
|
| Producer Manufacturing – 8.9% | | |
| 66,800 | | 3M Co. | | 5,776,864 |
| 33,200 | | Danaher Corp. | | 3,071,664 |
| 294,400 | | General Electric Co. | | 8,817,280 |
| | | | |
|
| | | | | 17,665,808 |
|
| Retail Trade – 9.4% | | |
| 73,900 | | Bed Bath & Beyond, Inc.* | | 2,743,168 |
| 38,600 | | Lowe’s Companies, Inc. | | 2,009,516 |
| 147,800 | | The Gap, Inc. | | 3,253,078 |
| 87,800 | | The Home Depot, Inc. | | 3,089,682 |
| 100,900 | | The TJX Cos., Inc. | | 2,479,113 |
| 89,500 | | Wal-Mart Stores, Inc. | | 5,101,500 |
| | | | |
|
| | | | | 18,676,057 |
|
| Technology Services – 9.1% | | |
| 43,000 | | Affiliated Computer Services, Inc.* | | 2,085,500 |
| 44,600 | | International Business Machines Corp. | | 3,932,382 |
| 21,700 | | Mercury Interactive Corp.* | | 923,335 |
| 347,800 | | Microsoft Corp. | | 9,032,366 |
| 42,800 | | Symantec Corp.* | | 1,928,140 |
| | | | |
|
| | | | | 17,901,723 |
|
| TOTAL COMMON STOCKS | | |
| (Cost $169,727,712) | | $197,370,938 |
|
| | | | | | | | |
Principal Amount | | Interest Rate | | | Maturity Date | | Value | |
| Repurchase Agreement – 0.7% | |
| State Street Bank & Trust Co.^ | | | |
| $1,483,000 | | 0.75 | % | | 05/03/2004 | | $ 1,483,000 | |
| Maturity Value: $1,483,093 | | | |
|
|
| TOTAL REPURCHASE AGREEMENT | | | |
(Cost $1,483,000) | | $ 1,483,000 | |
|
|
| TOTAL INVESTMENTS – 100.5% | | | |
(Cost $171,210,712) | | 198,853,938 | |
| Liabilities in excess of other assets – (0.5)% | | (1,074,491 | ) |
|
|
| Net Assets – 100.0% | | $197,779,447 | |
|
|
| | |
| * | | Non-income producing security. |
| ^ | | Repurchase agreement was entered into on April 30, 2004. At April 30, 2004, this agreement was fully collateralized by U.S. Treasury Notes. |
| | |
|
|
| Investment Abbreviations: |
| HOLDRs | | —Holding Company Depositary Receipts. |
|
| | |
| The accompanying notes are an integral part of these financial statements. | | 5 |
COMMERCE VALUE FUND
Value Fund
Performance Review(a) (Unaudited)
For the six months ended April 30, 2004, the Institutional Shares of the Fund had a total return of 4.10%, based on Net Asset Value (NAV). The Service Shares had a total return, without sales charge, of 3.97% for the same period based on NAV. This compares to the Lipper Large Cap Value Funds Index(b) six-month return of 8.00% and the Russell 1000 Value Index(c) six-month return of 8.15%. Past performance is no guarantee of future results.
Statement of Investments
April 30, 2004 (Unaudited)
| | | | |
| | |
| Shares | | Description | | Value |
| Common Stocks – 97.8% |
| Commercial Services – 0.2% | | |
| 18,600 | | The Interpublic Group of Cos., Inc.* | | $ 291,834 |
|
| Communications – 1.7% | | |
| 52,800 | | Verizon Communications, Inc. | | 1,992,672 |
|
| Consumer Durables – 2.5% | | |
| 47,600 | | Ethan Allen Interiors, Inc. | | 1,978,732 |
| 38,800 | | Furniture Brands International, Inc. | | 1,091,832 |
| | | | |
|
| | | | | 3,070,564 |
|
| Consumer Non-Durables – 4.5% | | |
| 17,400 | | Anheuser-Busch Companies, Inc. | | 891,576 |
| 15,500 | | Colgate-Palmolive Co. | | 897,140 |
| 11,100 | | Kellogg Co. | | 476,190 |
| 14,900 | | Kimberly-Clark Corp. | | 975,205 |
| 18,000 | | Reebok International Ltd. | | 654,840 |
| 14,500 | | The Procter & Gamble Co. | | 1,533,375 |
| | | | |
|
| | | | | 5,428,326 |
|
| Consumer Services – 13.8% | | |
| 134,100 | | Cendant Corp. | | 3,175,488 |
| 6,400 | | Clear Channel Communications, Inc. | | 265,536 |
| 18,700 | | Cox Communications, Inc.* | | 611,303 |
| 36,700 | | Fox Entertainment Group, Inc.* | | 1,022,095 |
| 17,100 | | Gannett Co., Inc. | | 1,482,228 |
| 26,700 | | Mandalay Resort Group | | 1,533,915 |
| 47,700 | | Marriott International, Inc. | | 2,249,532 |
| 11,300 | | Starwood Hotels & Resorts Worldwide, Inc. | | 449,627 |
| 30,306 | | The DIRECTV Group, Inc.* | | 542,478 |
| 31,800 | | The Walt Disney Co. | | 732,354 |
| 96,300 | | Time Warner, Inc.* | | 1,619,766 |
| 24,200 | | Tribune Co. | | 1,158,696 |
| 46,100 | | Viacom, Inc. Class B | | 1,781,765 |
| | | | |
|
| | | | | 16,624,783 |
|
| | | | |
| | |
| Shares | | Description | | Value |
| Common Stocks – (continued) |
| Electronic Technology – 5.5% | | |
| 41,300 | | Avaya, Inc.* | | $ 564,984 |
| 3,300 | | General Dynamics Corp. | | 308,946 |
| 15,500 | | Harris Corp. | | 698,275 |
| 81,500 | | Hewlett-Packard Co. | | 1,605,550 |
| 15,500 | | National Semiconductor Corp.* | | 632,245 |
| 46,100 | | Polycom, Inc.* | | 879,588 |
| 20,800 | | Rockwell Automation, Inc. | | 679,952 |
| 90,700 | | Xerox Corp.* | | 1,218,101 |
| | | | |
|
| | | | | 6,587,641 |
|
| Energy Minerals – 9.4% | | |
| 28,700 | | ChevronTexaco Corp. | | 2,626,050 |
| 13,200 | | ConocoPhillips | | 941,160 |
| 21,400 | | Devon Energy Corp. | | 1,309,680 |
| 144,300 | | Exxon Mobil Corp. | | 6,139,965 |
| 9,000 | | Marathon Oil Corp. | | 302,040 |
| | | | |
|
| | | | | 11,318,895 |
|
| Finance – 31.1% | | |
| 32,900 | | American International Group, Inc. | | 2,357,285 |
| 48,487 | | Bank of America Corp. | | 3,902,718 |
| 12,100 | | Charter One Financial, Inc. | | 403,777 |
| 120,966 | | Citigroup, Inc. | | 5,817,255 |
| 12,900 | | First Horizon National Corp. | | 567,084 |
| 32,800 | | Franklin Resources, Inc. | | 1,798,424 |
| 69,300 | | J. P. Morgan Chase & Co. | | 2,605,680 |
| 5,700 | | Jefferson-Pilot Corp. | | 282,663 |
| 7,700 | | Lehman Brothers Holdings, Inc. | | 565,180 |
| 52,300 | | Lincoln National Corp. | | 2,347,224 |
| 33,500 | | MBNA Corp. | | 816,730 |
| 46,400 | | Merrill Lynch & Co., Inc. | | 2,516,272 |
| 49,000 | | MetLife, Inc. | | 1,690,500 |
| 60,100 | | Morgan Stanley & Co., Inc. | | 3,088,539 |
| 36,700 | | Principal Financial Group, Inc. | | 1,295,510 |
| 16,800 | | The Allstate Corp. | | 771,120 |
|
| (a) | | Fund returns assume fee waivers and expense reductions and are not annualized. Returns do not reflect the deduction of taxes that a shareholder would pay on fund distributions or the redemption of fund shares. |
| (b) | | The Lipper Large Cap Value Funds Index is an unmanaged index consisting of funds that, by portfolio practice, invest at least 75% of their equity assets in companies that have a below-average price-to-earnings ratio, price-to-book ratio, and three-year sales-per-share growth value, compared to the S&P 500 Index. The Index figures do not reflect any fees, expenses or taxes. |
| (c) | | The Russell 1000 Value Index measures the performance of those 1,000 Russell companies with lower price-to-book ratios and lower forecasted growth values. The Index figures do not reflect any fees, expenses or taxes. |
| | |
| 6 | | The accompanying notes are an integral part of these financial statements. |
COMMERCE VALUE FUND
| | | | |
| | |
| Shares | | Description | | Value |
| Common Stocks – (continued) |
| Finance – (continued) | | |
| 20,700 | | The Bank of New York Co., Inc. | | $ 603,198 |
| 9,200 | | The Progressive Corp. | | 805,184 |
| 16,500 | | Trustmark Corp. | | 439,230 |
| 63,045 | | U.S. Bancorp | | 1,616,474 |
| 19,200 | | Wachovia Corp. | | 878,400 |
| 40,700 | | Wells Fargo & Co. | | 2,297,922 |
| | | | |
|
| | | | | 37,466,369 |
|
| Health Services – 2.3% | | |
| 13,100 | | Aetna, Inc. | | 1,084,025 |
| 6,800 | | Anthem, Inc.* | | 602,344 |
| 15,000 | | Pediatrix Medical Group, Inc.* | | 1,072,500 |
| | | | |
|
| | | | | 2,758,869 |
|
| Health Technology – 1.5% | | |
| 24,800 | | Becton, Dickinson & Co. | | 1,253,640 |
| 20,600 | | Bristol-Myers Squibb Co. | | 517,060 |
| | | | |
|
| | | | | 1,770,700 |
|
| Industrial Services – 0.2% | | |
| 10,100 | | Waste Management, Inc. | | 286,840 |
|
| Process Industries – 3.8% | | |
| 12,000 | | Air Products & Chemicals, Inc. | | 597,720 |
| 26,900 | | Donaldson Co., Inc. | | 737,867 |
| 14,600 | | International Paper Co. | | 588,672 |
| 24,300 | | Rohm and Haas Co. | | 942,354 |
| 33,400 | | Smurfit-Stone Container Corp.* | | 574,146 |
| 30,000 | | The Dow Chemical Co. | | 1,190,700 |
| | | | |
|
| | | | | 4,631,459 |
|
| Producer Manufacturing – 8.1% | | |
| 38,800 | | 3M Co. | | 3,355,424 |
| 15,500 | | Caterpillar, Inc. | | 1,204,815 |
| 26,600 | | Deere & Co. | | 1,809,864 |
| 26,600 | | Dover Corp. | | 1,064,798 |
| 12,600 | | Energizer Holdings, Inc.* | | 545,580 |
| 17,400 | | Masco Corp. | | 487,374 |
| 22,950 | | PACCAR, Inc. | | 1,295,757 |
| | | | |
|
| | | | | 9,763,612 |
|
| Retail Trade – 3.6% | | |
| 32,000 | | CVS Corp. | | 1,236,160 |
| 12,600 | | InterActiveCorp* | | 401,562 |
| 32,100 | | Limited Brands | | 662,544 |
| 11,200 | | The Neiman Marcus Group, Inc. | | 544,768 |
| 19,900 | | The Talbots, Inc. | | 695,505 |
| 15,100 | | Zale Corp.* | | 844,392 |
| | | | |
|
| | | | | 4,384,931 |
|
| Technology Services – 3.8% | | |
| 14,700 | | Automatic Data Processing, Inc. | | 644,007 |
| 20,100 | | Computer Sciences Corp.* | | 822,291 |
| 19,200 | | International Business Machines Corp. | | 1,692,864 |
| 40,700 | | Network Associates, Inc.* | | 638,176 |
| 55,800 | | Unisys Corp.* | | 727,074 |
| | | | |
|
| | | | | 4,524,412 |
|
| | | | |
| | |
| Shares | | Description | | Value |
| Common Stocks – (continued) |
| Transportation – 0.5% | | |
| 42,700 | | Southwest Airlines Co. | | $ 609,756 |
|
| Utilities – 5.3% | | |
| 24,800 | | Dominion Resources, Inc. | | 1,582,488 |
| 32,000 | | Entergy Corp. | | 1,747,200 |
| 4,700 | | Exelon Corp. | | 314,618 |
| 4,900 | | Kinder Morgan, Inc. | | 295,029 |
| 21,800 | | Progress Energy, Inc. | | 932,386 |
| 24,300 | | Public Service Enterprise Group, Inc. | | 1,042,470 |
| 18,400 | | The Southern Co. | | 529,184 |
| | | | |
|
| | | | | 6,443,375 |
|
| TOTAL COMMON STOCKS | | |
| (Cost $106,658,411) | | $117,955,038 |
|
| | | | | | |
| | | |
Principal Amount | | Interest Rate | | Maturity Date | | Value |
| Repurchase Agreement – 0.1% |
| State Street Bank & Trust Co.^ | | |
| $143,000 | | 0.75% | | 05/03/2004 | | $ 143,000 |
| Maturity Value: $143,009 | | |
|
| TOTAL REPURCHASE AGREEMENT | | |
| (Cost $143,000) | | $ 143,000 |
|
| TOTAL INVESTMENTS – 97.9% | | |
| (Cost $106,801,411) | | 118,098,038 |
| Other assets in excess of liabilities – 2.1% | | 2,508,274 |
|
| Net Assets – 100.0% | | $120,606,312 |
|
| | |
| * | | Non-income producing security. |
| ^ | | Repurchase agreement was entered into on April 30, 2004. At April 30, 2004, this agreement was fully collateralized by U.S. Treasury Notes. |
| | |
| The accompanying notes are an integral part of these financial statements. | | 7 |
COMMERCE MIDCAP GROWTH FUND
MidCap Growth Fund
Performance Review(a) (Unaudited)
For the six months ended April 30, 2004, the Institutional Shares of the Fund had a total return of 6.31%, based on Net Asset Value (NAV). The Service Shares had a total return, without sales charge, of 6.19% for the same period based on NAV. This compares to the Lipper MidCap Growth Funds Index(b) six-month return of 3.55% and the Russell Midcap Growth Index(c) six-month return of 5.74%. Past performance is no guarantee of future results.
Statement of Investments
April 30, 2004 (Unaudited)
| | | | |
| | |
| Shares | | Description | | Value |
| Common Stocks – 99.7% |
| Commercial Services – 4.2% | | |
| 40,820 | | Equifax, Inc. | | $ 1,000,498 |
| 38,155 | | Harte-Hanks, Inc. | | 914,194 |
| 12,234 | | Moody’s Corp. | | 789,215 |
| 50,822 | | The Interpublic Group of Cos., Inc.* | | 797,397 |
| | | | |
|
| | | | | 3,501,304 |
|
| Communications – 2.1% | | |
| 30,594 | | Nextel Communications, Inc.* | | 729,973 |
| 15,375 | | Telephone & Data Systems, Inc. | | 1,014,135 |
| | | | |
|
| | | | | 1,744,108 |
|
| Consumer Durables – 2.0% | | |
| 31,726 | | Electronic Arts, Inc.* | | 1,605,970 |
|
| Consumer Non-Durables – 2.5% | | |
| 78,565 | | Del Monte Foods Co.* | | 868,929 |
| 5,705 | | Hershey Foods Corp. | | 507,117 |
| 11,358 | | The Timberland Co.* | | 712,374 |
| | | | |
|
| | | | | 2,088,420 |
|
| Consumer Services – 7.9% | | |
| 24,434 | | Brinker International, Inc.* | | 939,732 |
| 21,463 | | Dow Jones & Co., Inc. | | 989,230 |
| 29,671 | | Harrah’s Entertainment, Inc. | | 1,577,904 |
| 29,170 | | International Game Technology | | 1,100,876 |
| 9,933 | | International Speedway Corp. | | 418,477 |
| 8,488 | | The E.W. Scripps Co. | | 895,908 |
| 14,005 | | The New York Times Co. | | 641,569 |
| | | | |
|
| | | | | 6,563,696 |
|
| Distribution Services – 2.3% | | |
| 16,740 | | CDW Corp. | | 1,046,083 |
| 25,279 | | Performance Food Group Co.* | | 888,051 |
| | | | |
|
| | | | | 1,934,134 |
|
| Electronic Technology – 17.0% | | |
| 38,784 | | Advanced Fibre Communications, Inc.* | | 647,693 |
|
| | | | |
| | |
| Shares | | Description | | Value |
| Common Stocks – (continued) |
| Electronic Technology – (continued) | | |
| 14,050 | | Alliant Techsystems, Inc.* | | $ 833,025 |
| 40,405 | | Cadence Design Systems, Inc.* | | 517,992 |
| 12,940 | | Harris Corp. | | 582,947 |
| 17,432 | | KLA-Tencor Corp.* | | 726,392 |
| 17,791 | | L-3 Communications Holdings, Inc. | | 1,098,416 |
| 16,618 | | Lexmark International, Inc.* | | 1,503,264 |
| 23,100 | | Microchip Technology, Inc. | | 647,262 |
| 30,842 | | National Semiconductor Corp.* | | 1,258,045 |
| 41,830 | | Polycom, Inc.* | | 798,116 |
| 33,040 | | Rockwell Collins, Inc. | | 1,065,540 |
| 33,010 | | Synopsys, Inc.* | | 882,357 |
| 52,542 | | Teradyne, Inc.* | | 1,070,806 |
| 22,877 | | Thermo Electron Corp.* | | 668,008 |
| 22,658 | | Waters Corp.* | | 977,693 |
| 96,225 | | Western Digital Corp.* | | 777,498 |
| | | | |
|
| | | | | 14,055,054 |
|
| Energy Minerals – 4.4% | | |
| 33,550 | | CONSOL Energy, Inc. | | 960,537 |
| 23,210 | | EOG Resources, Inc. | | 1,143,092 |
| 17,472 | | Newfield Exploration Co.* | | 920,425 |
| 19,118 | | Pioneer Natural Resources Co. | | 625,350 |
| | | | |
|
| | | | | 3,649,404 |
|
| Finance – 6.5% | | |
| 33,378 | | Federated Investors, Inc., Class B | | 981,313 |
| 17,355 | | Fidelity National Financial, Inc. | | 635,193 |
| 18,890 | | First Horizon National Corp. | | 830,404 |
| 13,778 | | IndyMac Bancorp, Inc. | | 443,101 |
| 11,033 | | Legg Mason, Inc. | | 1,015,698 |
| 17,685 | | SouthTrust Corp. | | 549,650 |
| 42,465 | | Waddell & Reed Financial, Inc. | | 943,997 |
| | | | |
|
| | | | | 5,399,356 |
|
| Health Services – 7.2% | | |
| 12,752 | | Anthem, Inc.* | | 1,129,572 |
| 35,192 | | Caremark Rx, Inc.* | | 1,191,249 |
|
| (a) | | Fund returns assume fee waivers and expense reductions and are not annualized. Returns do not reflect the deduction of taxes that a shareholder would pay on fund distributions or the redemption of fund shares. |
| (b) | | The Lipper MidCap Growth Funds Index is an unmanaged index consisting of funds that, by portfolio practice, invest at least 75% of their equity assets in companies with market capitalization (on a three-year weighted basis) of less than 300% of the dollar-weighted median market capitalization of the middle 1,000 securities of the S&P SuperComposite 1500 Index. The Index figures do not reflect any fees, expenses or taxes. |
| (c) | | The Russell Midcap Growth Index measures the performance of those Russell Midcap companies with higher price-to-book ratios and higher forecasted growth values. The Index figures do not reflect any fees, expenses or taxes. |
| | |
| 8 | | The accompanying notes are an integral part of these financial statements. |
COMMERCE MIDCAP GROWTH FUND
| | | | |
| | |
| Shares | | Description | | Value |
| Common Stocks – (continued) |
| Health Services – (continued) | | |
| 12,524 | | Express Scripts, Inc.* | | $ 968,606 |
| 25,445 | | IMS Health, Inc. | | 642,486 |
| 14,281 | | Quest Diagnostics, Inc. | | 1,204,603 |
| 17,886 | | Stericycle, Inc.* | | 855,309 |
| | | | |
|
| | | | | 5,991,825 |
|
| Health Technology – 8.9% | | |
| 26,635 | | Biomet, Inc. | | 1,052,083 |
| 17,158 | | Hillenbrand Industries, Inc. | | 1,158,165 |
| 6,658 | | Invitrogen Corp.* | | 480,907 |
| 40,737 | | King Pharmaceuticals, Inc.* | | 702,713 |
| 13,972 | | Pharmaceutical Resources, Inc.* | | 563,072 |
| 7,336 | | St. Jude Medical, Inc.* | | 559,443 |
| 10,062 | | Varian Medical Systems, Inc.* | | 863,722 |
| 25,080 | | Zimmer Holdings, Inc.* | | 2,002,638 |
| | | | |
|
| | | | | 7,382,743 |
|
| Industrial Services – 2.9% | | |
| 14,635 | | BJ Services Co.* | | 651,258 |
| 18,173 | | Jacobs Engineering Group, Inc.* | | 757,996 |
| 17,694 | | Smith International, Inc.* | | 968,746 |
| | | | |
|
| | | | | 2,378,000 |
|
| Process Industries – 3.8% | | |
| 29,952 | | Ecolab, Inc. | | 892,570 |
| 16,940 | | Praxair, Inc. | | 619,157 |
| 18,738 | | Sigma-Aldrich Corp. | | 1,061,320 |
| 12,145 | | The Valspar Corp. | | 602,999 |
| | | | |
|
| | | | | 3,176,046 |
|
| Producer Manufacturing – 7.0% | | |
| 17,898 | | Avery Dennison Corp. | | 1,149,588 |
| 14,462 | | Dover Corp. | | 578,914 |
| 23,270 | | Energizer Holdings, Inc.* | | 1,007,591 |
| 15,544 | | ITT Industries, Inc. | | 1,232,484 |
| 11,735 | | Molex, Inc. | | 349,468 |
| 32,949 | | Pitney Bowes, Inc. | | 1,441,519 |
| | | | |
|
| | | | | 5,759,564 |
|
| | | | |
| | |
| Shares | | Description | | Value |
| Common Stocks – (continued) |
| Retail Trade – 7.7% | | |
| 16,840 | | Chico’s FAS, Inc.* | | $ 685,893 |
| 55,708 | | Dollar General Corp. | | 1,045,082 |
| 40,864 | | Ross Stores, Inc. | | 1,246,352 |
| 48,428 | | Staples, Inc. | | 1,247,505 |
| 71,687 | | The TJX Cos., Inc. | | 1,761,350 |
| 12,695 | | Williams-Sonoma, Inc.* | | 413,716 |
| | | | |
|
| | | | | 6,399,898 |
|
| Technology Services – 11.8% | | |
| 31,775 | | Adobe Systems, Inc. | | 1,313,578 |
| 16,975 | | Affiliated Computer Services, Inc.* | | 823,288 |
| 35,240 | | BEA Systems, Inc.* | | 402,088 |
| 37,230 | | Ceridian Corp.* | | 795,977 |
| 41,539 | | Citrix Systems, Inc.* | | 791,318 |
| 39,005 | | Fiserv, Inc.* | | 1,426,023 |
| 32,960 | | Intuit, Inc.* | | 1,399,811 |
| 57,567 | | SunGard Data Systems, Inc.* | | 1,500,772 |
| 29,097 | | Symantec Corp.* | | 1,310,820 |
| | | | |
|
| | | | | 9,763,675 |
|
| Utilities – 1.5% | | |
| 19,946 | | Kinder Morgan, Inc. | | 1,200,949 |
|
| TOTAL COMMON STOCKS | | |
| (Cost $74,177,712) | | $82,594,146 |
|
| | | | | | | | |
| | | |
Principal
Amount | | Interest
Rate | | | Maturity
Date | | Value | |
| Repurchase Agreement – 0.3% | |
| State Street Bank & Trust Co.^ | | | |
| $243,000 | | 0.75 | % | | 05/03/2004 | | $ 243,000 | |
Maturity Value: $243,015 | | | |
|
|
| TOTAL REPURCHASE AGREEMENT | | | |
(Cost $243,000) | | | | | $ 243,000 | |
|
|
| TOTAL INVESTMENTS – 100.0% | | | |
(Cost $74,420,712) | | 82,837,146 | |
| Liabilities in excess of other assets – 0.0% | | (5,005 | ) |
|
|
| Net Assets – 100.0% | | $82,832,141 | |
|
|
| | |
| * | | Non-income producing security. |
| ^ | | Repurchase agreement was entered into on April 30, 2004. At April 30, 2004, this agreement was fully collateralized by U.S. Treasury Notes. |
| | |
| The accompanying notes are an integral part of these financial statements. | | 9 |
COMMERCE INTERNATIONAL EQUITY FUND
International Equity Fund
Performance Review(a) (Unaudited)
For the six months ended April 30, 2004, the Institutional Shares of the Fund had a total return of 11.86%, based on Net Asset Value (NAV). The Service Shares had a total return, without sales charge, of 11.71% for the same period based on NAV. This compares to the Lipper International Equity Funds Index(b) six-month return of 11.00% and the Morgan Stanley Capital International Europe, Australasia and Far East Index(c) (“MSCI EAFE”) six-month return of 12.58%. Past performance is no guarantee of future results.
Statement of Investments
April 30, 2004 (Unaudited)
| | | | |
| | |
| Shares | | Description | | Value |
| Common Stocks – 98.8% |
| Australian Dollar – 2.4% |
| 42,577 | | National Australia Bank Ltd. (Commercial Banks) | | $ 905,109 |
| 111,216 | | The News Corp. Ltd. (Media) | | 1,024,481 |
| 77,917 | | Westpac Banking Corp. (Commercial Banks) | | 981,909 |
| 69,720 | | James Hardie Industries NV (Construction Materials) | | 336,960 |
| | | | |
|
| | | | | 3,248,459 |
|
| British Pound Sterling – 23.3% |
| 309,080 | | Barclays PLC (Commercial Banks) | | 2,788,462 |
| 82,701 | | British American Tobacco PLC (Tobacco) | | 1,254,526 |
| 183,143 | | BT Group PLC (Diversified Telecommunication Services) | | 580,004 |
| 142,415 | | Cadbury Schweppes PLC (Food Products) | | 1,133,238 |
| 215,586 | | Centrica PLC (Gas Utilities) | | 835,747 |
| 181,586 | | Compass Group PLC (Hotels Restaurant & Leisure) | | 1,143,704 |
| 121,897 | | Diageo PLC (Beverages) | | 1,636,081 |
| 26,953 | | Enterprise Inns PLC (Hotels Restaurant & Leisure) | | 291,702 |
| 95,638 | | GlaxoSmithKline PLC (Pharmaceuticals) | | 1,980,178 |
| 20,155 | | GUS PLC (Internet & Catalog Retail) | | 279,278 |
| 207,697 | | HSBC Holdings PLC (Commercial Banks) | | 2,977,449 |
| 179,993 | | Kingfisher PLC (Specialty Retail) | | 904,541 |
| 74,021 | | Lloyds TSB Group PLC (Commercial Banks) | | 553,548 |
| 69,423 | | Marks & Spencer Group PLC (Multiline Retail) | | 340,258 |
| 121,686 | | Prudential PLC (Insurance) | | 956,417 |
| 64,259 | | Reed Elsevier PLC (Media) | | 598,544 |
|
| | | | |
| | |
| Shares | | Description | | Value |
| Common Stocks – (continued) |
| British Pound Sterling – (continued) |
| 21,714 | | Royal Bank of Scotland Group PLC (Commercial Banks) | | $ 652,228 |
| 127,853 | | Smith & Nephew PLC (HealthCare Equipment & Supplies) | | 1,298,641 |
| 37,579 | | Smiths Group PLC (Industrial Conglomerates) | | 465,709 |
| 476,852 | | Tesco PLC (Food & Staples Retailing) | | 2,104,503 |
| 44,531 | | Tomkins PLC (Industrial Conglomerates) | | 213,714 |
| 13,827 | | Travis Perkins PLC (Specialty Retail) | | 352,032 |
| 214,655 | | Unilever PLC (Food Products) | | 2,026,075 |
| 1,286,901 | | Vodafone Group PLC (Wireless Telecommunication Services) | | 3,128,013 |
| 18,409 | | Whitbread PLC (Hotels Restaurant & Leisure) | | 243,326 |
| 101,248 | | Wolseley PLC (Trading Company & Distribution) | | 1,484,678 |
| 78,518 | | WPP Group PLC (Media) | | 774,545 |
| | | | |
|
| | | | | 30,997,141 |
|
| Canadian Dollar – 0.4% |
| 12,946 | | Royal Bank of Canada (Commercial Banks) | | 575,535 |
|
| Euro – 33.2% |
| Finland – 1.0% |
| 97,336 | | Nokia Oyj (Communications Equipment) | | 1,368,585 |
|
| France – 9.8% |
| 39,173 | | Aventis SA (Pharmaceuticals) | | 2,981,485 |
| 67,833 | | AXA (Insurance) | | 1,427,391 |
| 27,865 | | BNP Paribas SA (Commercial Banks) | | 1,671,964 |
| 45,933 | | France Telecom SA* (Diversified Telecommunication Services) | | 1,107,385 |
|
| (a) | | Fund returns assume fee waivers and expense reductions and are not annualized. Returns do not reflect the deduction of taxes that a shareholder would pay on fund distributions or the redemption of fund shares. |
| (b) | | The Lipper International Equity Funds Index is an unmanaged index consisting of funds that invest their assets in securities with primary trading markets outside of the United States. The Index figures do not reflect any fees, expenses or taxes. |
| (c) | | The Morgan Stanley Capital International Europe, Australasia and Far East (“MSCI EAFE”) Index is an unmanaged index of securities in 21 developed markets outside of North America, in Europe, Australia and the Far East. The Index figures do not reflect any fees, expenses or taxes. |
| | |
| 10 | | The accompanying notes are an integral part of these financial statements. |
COMMERCE INTERNATIONAL EQUITY FUND
| | | | |
| | |
| Shares | | Description | | Value |
| Common Stocks – (continued) |
| France – (continued) |
| 15,409 | | Lafarge SA (Construction Materials) | | $ 1,282,595 |
| 24,661 | | Total SA (Oil & Gas) | | 4,557,291 |
| | | | |
|
| | | | | 13,028,111 |
|
| Germany – 6.0% |
| 38,155 | | Bayer AG (Chemicals) | | 1,038,678 |
| 52,446 | | Bayerische Motoren Werke (BMW) AG (Automobiles) | | 2,259,347 |
| 18,204 | | Deutsche Bank AG (Capital Markets) | | 1,498,890 |
| 48,327 | | E.ON AG (Electric Utilities) | | 3,200,701 |
| | | | |
|
| | | | | 7,997,616 |
|
| Ireland – 1.0% |
| 58,307 | | CRH PLC (Construction Materials) | | 1,237,413 |
|
| Italy – 3.8% |
| 145,281 | | ENI SPA (Oil & Gas) | | 2,950,970 |
| 660,172 | | Telecom Italia SPA* (Diversified Telecommunication Services) | | 2,115,004 |
| | | | |
|
| | | | | 5,065,974 |
|
| Netherlands – 8.4% |
| 123,090 | | ABN AMRO Holding NV (Commercial Banks) | | 2,674,177 |
| 12,028 | | Heineken NV (Beverages) | | 507,068 |
| 144,071 | | ING Groep NV (Diversified Financial Services) | | 3,085,136 |
| 26,270 | | Koninklijke Ahold NV* (Food & Staples Retailing) | | 203,247 |
| 80,391 | | Koninklijke (Royal) Philips Electronics NV (Household Durables) | | 2,187,489 |
| 91,842 | | Reed Elsevier NV (Media) | | 1,289,137 |
| 33,257 | | TPG NV (Air Freight & Logistics) | | 716,547 |
| 18,955 | | VNU NV (Media) | | 529,852 |
| | | | |
|
| | | | | 11,192,653 |
|
| Spain – 3.2% |
| 208,927 | | Banco Santander Central Hispano SA (Commercial Banks) | | 2,241,985 |
| 132,828 | | Telefonica SA* (Diversified Telecommunication Services) | | 1,974,202 |
| | | | |
|
| | | | | 4,216,187 |
|
| Total Euro | | 44,106,539 |
|
| Hong Kong Dollar – 3.9% |
| 115,000 | | Esprit Holdings Ltd. (Specialty Retail) | | 474,762 |
| 363,500 | | Johnson Electric Holdings Ltd. (Electrical Equipment) | | 321,570 |
| 143,000 | | Cheung Kong Holdings Ltd. (Real Estate) | | 1,100,042 |
| 72,523 | | Hang Seng Bank Ltd. (Commercial Banks) | | 920,520 |
| 328,000 | | Li & Fung Ltd. (Distributors) | | 510,943 |
|
| | | | |
| | |
| Shares | | Description | | Value |
| Common Stocks – (continued) |
| Hong Kong Dollar – (continued) |
| 124,000 | | Sun Hung Kai Properties Ltd. (Real Estate) | | $ 1,065,169 |
| 117,500 | | Swire Pacific Ltd. Series ‘A’ (Real Estate) | | 768,299 |
| | | | |
|
| | | | | 5,161,305 |
|
| Japanese Yen – 17.6% |
| 10,510 | | Acom Co. Ltd. (Consumer Finance) | | 748,504 |
| 94,000 | | Canon, Inc. (Office Electronics) | | 4,931,455 |
| 16,100 | | Fanuc Ltd. (Machinery) | | 986,146 |
| 54,700 | | Honda Motor Co. Ltd. (Automobiles) | | 2,195,633 |
| 18,500 | | Hoya Corp. (Electronic Equipment & Instruments) | | 2,001,450 |
| 52 | | Millea Holdings, Inc. (Insurance) | | 739,727 |
| 132 | | Mitsubishi Tokyo Financial Group, Inc. (Commercial Banks) | | 1,174,503 |
| 68,000 | | Mitsui Sumitomo Insurance Co. Ltd. (Insurance) | | 640,167 |
| 575 | | Nippon Telegraph & Telephone Corp. (Diversified Telecommunication Services) | | 3,021,791 |
| 490 | | NTT DoCoMo, Inc. (Wireless Telecommunication Services) | | 972,319 |
| 38,000 | | Ricoh Co. Ltd. (Office Electronics) | | 757,486 |
| 7,900 | | Rohm Co. Ltd. (Semiconductor & Semiconductor Equipment) | | 985,666 |
| 34,900 | | Shin-Etsu Chemical Co. Ltd. (Chemicals) | | 1,410,356 |
| 31,000 | | Shionogi & Co. Ltd. (Pharmaceuticals) | | 487,899 |
| 174 | | Sumitomo Mitsui Financial Group (Commercial Banks) | | 1,314,873 |
| 23,900 | | Takeda Chemical Industries Ltd. (Pharmaceuticals) | | 963,666 |
| | | | |
|
| | | | | 23,331,641 |
|
| Korean Won – 4.8% |
| 14,010 | | Hyundai Motor Co. (Automobiles) | | 534,323 |
| 42,420 | | Korea Electric Power Corp. (Electric Utilities) | | 694,135 |
| 20,330 | | KT Corp. (Diversified Telecommunication Services) | | 708,652 |
| 8,089 | | POSCO (Metals & Mining) | | 989,280 |
| 7,265 | | Samsung Electronics Co. Ltd. (Semiconductor & Semiconductor Equipment) | | 3,448,762 |
| | | | |
|
| | | | | 6,375,152 |
|
| Singapore Dollar – 0.6% |
| 106,000 | | United Overseas Bank Ltd. (Commercial Banks) | | 853,507 |
|
| Swiss Franc – 12.4% |
| 18,805 | | Nestle AG (Food Products) | | 4,751,408 |
| 64,543 | | Novartis AG (Pharmaceuticals) | | 2,873,771 |
| 26,126 | | Roche Holding AG (Pharmaceuticals) | | 2,737,076 |
|
| | |
| The accompanying notes are an integral part of these financial statements. | | 11 |
COMMERCE INTERNATIONAL EQUITY FUND
Statement of Investments (continued)
April 30, 2004 (Unaudited)
| | | | |
| | |
| Shares | | Description | | Value |
| Common Stocks – (continued) |
| Swiss Franc – (continued) |
| 33,133 | | Swiss Re (Insurance) | | $ 2,177,133 |
| 56,591 | | UBS AG (Capital Markets) | | 4,017,148 |
| | | | |
|
| | | | | 16,556,536 |
|
| United States Dollar – 0.2% |
| 27,969 | | Taiwan Semiconductor Manufacturing Co. Ltd. ADR* (Semiconductor & Semiconductor Equipment) | | 266,545 |
|
| TOTAL COMMON STOCKS | | |
| (Cost $110,895,890) | | $131,472,360 |
|
| | | | | |
| | | | | | | |
| | | |
Principal Amount | | Interest Rate | | | Maturity Date | | Value |
| Convertible Bonds – 0.1% |
Euro | | | | | |
France | | | | | |
| AXA SA (Insurance) @ | | |
| $5,490 | | 0.00 | % | | 12/21/2004 | | $ 109,935 |
|
| TOTAL CONVERTIBLE BONDS |
(Cost $81,183) | | | | | $ 109,935 |
|
| TOTAL INVESTMENTS – 98.9% | | |
(Cost $110,977,073) | | | | | 131,582,295 |
| Other assets in excess of liabilities – 1.1% | | 1,467,475 |
|
| Net Assets – 100.0% | | | | | $133,049,770 |
|
| | |
| * | | Non-income producing security. |
| @ | | Security issued with a zero coupon. |
| | |
|
|
| Investment Abbreviations: |
| ADR | | —AmericanDepositary Receipt |
|
| | |
| 12 | | The accompanying notes are an integral part of these financial statements. |
COMMERCE INTERNATIONAL EQUITY FUND
| | | |
| | | As a % of
Net Assets | |
| Common Stock Industry Classifications† | |
Air Freight & Logistics | | 0.5 | % |
Automobiles | | 3.8 | |
Beverages | | 1.6 | |
Capital Markets | | 4.2 | |
Chemicals | | 1.8 | |
Commercial Banks | | 15.3 | |
Communications Equipment | | 1.0 | |
Constructions Materials | | 2.2 | |
Consumer Finance | | 0.6 | |
Distributors | | 0.4 | |
Diversified Financial Services | | 2.3 | |
Diversified Telecommunication Services | | 7.2 | |
Electric Utilities | | 2.9 | |
Electrical Equipment | | 0.2 | |
Electrical Equipment & Instruments | | 1.5 | |
Food & Staples Retailing | | 1.7 | |
Food Products | | 6.0 | |
Gas Utilities | | 0.6 | |
HealthCare Equipment & Supplies | | 1.0 | |
Hotels Restaurant & Leisure | | 1.3 | |
Household Durables | | 1.6 | |
Industrial Conglomerates | | 0.5 | |
Insurance | | 4.5 | |
Internet & Catalog Retail | | 0.2 | |
Machinery | | 0.7 | |
Media | | 3.2 | |
Metals & Mining | | 0.7 | |
Multiline Retail | | 0.3 | |
Office Electronics | | 4.3 | |
Oil & Gas | | 5.7 | |
Pharmaceuticals | | 8.9 | |
Real Estate | | 2.2 | |
Semiconductor & Semiconductor Equipment | | 3.5 | |
Specialty Retail | | 1.3 | |
Tobacco | | 0.9 | |
Trading Company & Distribution | | 1.1 | |
Wireless Telecommunication Services | | 3.1 | |
|
|
| TOTAL COMMON STOCK | | 98.8 | % |
|
|
| | |
| † | | Industry concentrations greater than one-tenth of one percent are disclosed. |
| | |
| The accompanying notes are an integral part of these financial statements. | | 13 |
COMMERCE ASSET ALLOCATION FUND
Asset Allocation Fund
Performance Review(a) (Unaudited)
For the six months ended April 30, 2004, the Institutional Shares of the Fund had a total return of 3.93%, based on Net Asset Value (NAV). The Service Shares had a total return, without sales charge, of 3.81% for the same period based on NAV. This compares to the Russell 1000 Index(b) six-month return of 6.11% and the Asset Allocation Composite Index(c) six-month return of 4.92%. Past performance is no guarantee of future results.
Statement of Investments
April 30, 2004 (Unaudited)
| | | | | |
| | |
| Shares | | Description | | Value | |
| Mutual Funds (Institutional Shares) – 101.3% | |
| Equity – 60.5% | | | |
| 183,740 | | Commerce Value Fund – 19.3% | | $ 3,981,645 | |
| 186,298 | | Commerce Growth Fund – 18.9% | | 3,917,851 | |
| 134,935 | | Commerce International Equity
Fund – 12.1% | | 2,509,787 | |
| 53,055 | | PIMCO PEA Renaissance Fund – 6.1% | | 1,256,340 | |
| 34,093 | | Commerce MidCap Growth
Fund – 4.1% | | 855,746 | |
| | | | |
|
|
| | | | | 12,521,369 | |
|
|
| Fixed Income – 40.8% | | | |
| 456,726 | | Commerce Bond Fund – 40.8% | | 8,449,438 | |
|
|
TOTAL MUTUAL FUNDS (INSTITUTIONAL
SHARES) – 101.3% |
|
| (Cost $19,107,318) | | 20,970,807 | |
| Liabilities in excess of other assets – (1.3)% | | (277,208 | ) |
|
|
| Net Assets – 100.0% | | $20,693,599 | |
|
|
| | |
|
For information on the underlying Commerce mutual funds, please call our toll free Shareholder Services Line at
1-800-995-6365 or visit us on the web at www.commercefunds.com. |
| (a) | | Fund returns assume fee waivers and expense reductions and are not annualized. Returns do not reflect the deduction of taxes that a shareholder would pay on fund distributions or the redemption of fund shares. |
| (b) | | The Russell 1000 Index is an unmanaged market-weighted index comprised of the 1000 largest U.S. companies. The Index figures do not reflect any fees, expenses or taxes. |
| (c) | | The Asset Allocation Composite Index (“Composite Index”) is a hypothetical representation prepared by Commerce Investment Advisors, Inc. of the performance of the Fund’s asset classes weighted according to their respective weightings in the Fund’s target range. The Composite Index is comprised of the Russell 1000 Index (48%), the Lehman Brothers Aggregate Bond Index (40%) and Morgan Stanley Capital International Europe Australasia and Far East Index (“MSCI EAFE”) (12%). The Composite Index figures do not reflect any deduction for fees, taxes or expenses. |
| | |
| 14 | | The accompanying notes are an integral part of these financial statements. |
COMMERCE BOND FUND
Bond Fund
Performance Review(a) (Unaudited)
For the six months ended April 30, 2004, the Institutional Shares of the Fund had a total return of 1.13%, based on Net Asset Value (NAV). The Service Shares had a total return, without sales charge, of 1.06% for the same period based on NAV. This compares to the Lipper Intermediate Investment Grade Funds Index(b) six-month return of 1.33% and the Lehman Brothers Aggregate Bond Index(c) six-month return of 1.25%. Past performance is no guarantee of future results.
Statement of Investments
April 30, 2004 (Unaudited)
| | | | | | | |
Principal Amount | | Interest
Rate | | | Maturity Date | | Value |
| Asset-Backed Securities – 17.9% |
Auto – 0.8% | | | | | |
| Distribution Financial Services Trust Series 1999-3, Class A6 |
| $ 5,000,000 | | 6.88 | % | | 11/15/2016 | | $ 5,279,807 |
|
Commercial – 3.2% | | | | | |
| Asset Securitization Corp. Series 1995-MD4, Class A1 |
| 2,573,335 | | 7.10 | | | 08/13/2029 | | 2,724,841 |
| Asset Securitization Corp. Series 1997-D4, Class 4IE |
| 4,100,000 | | 7.53 | | | 04/14/2029 | | 4,587,039 |
LB Commercial Conduit Mortgage Trust Series 1998-C4,
Class A1B |
| 6,600,000 | | 6.21 | | | 10/15/2035 | | 7,149,684 |
| LB-UBS Commercial Mortgage Trust Series 2002-C1, Class A4 |
| 5,500,000 | | 6.46 | | | 03/15/2031 | | 6,023,398 |
| | | | | | | |
|
| | | | | | | | 20,484,962 |
|
Credit Card – 3.4% | | | | | |
| Citibank Credit Card Master Trust I Series 1997-6, Class B@ |
| 5,000,000 | | 0.00 | | | 08/15/2006 | | 4,980,469 |
| Citibank Credit Card Master Trust I Series 1999-2, Class B |
| 3,570,000 | | 6.15 | | | 03/10/2011 | | 3,875,448 |
| MBNA Master Credit Card Trust Series 1999-B, Class B |
| 5,000,000 | | 6.20 | | | 08/15/2011 | | 5,436,810 |
| Standard Credit Card Master Trust Series 1995-1, Class B |
| 7,000,000 | | 8.45 | | | 01/07/2007 | | 7,322,910 |
| | | | | | | |
|
| | | | | | | | 21,615,637 |
|
Home Equity – 5.3% | | | | | |
American Business Financial Services, Inc. Series 1996-1,
Class A † |
| 151,854 | | 7.95 | | | 09/15/2026 | | 151,854 |
| Cityscape Home Loan Trust Series 1997-4, Class A5 |
| 2,521,957 | | 7.01 | | | 10/25/2018 | | 2,520,199 |
Contimortgage Home Equity Loan Trust Series 1999-3,
Class A6 |
| 2,293,735 | | 7.68 | | | 12/25/2029 | | 2,409,855 |
|
| | | | | | | |
Principal Amount | | Interest
Rate | | | Maturity Date | | Value |
| Asset-Backed Securities – (continued) |
Home Equity – (continued) | | |
| Green Tree Home Improvement Loan Trust Series 1997-E, Class HEM1 |
| $ 4,023,726 | | 7.28 | % | | 01/15/2029 | | $ 4,066,894 |
Merrill Lynch Mortgage Investors, Inc. Series 1991-H1,
Class M1 |
| 874,918 | | 7.36 | | | 07/15/2011 | | 874,463 |
| Residential Asset Securities Corp. Series 1999-KS1, Class AI8 |
| 2,414,809 | | 6.32 | | | 04/25/2030 | | 2,505,181 |
Residential Funding Mortgage Securities I, Inc. Series 2000-HI2,
Class AI5 |
| 11,029,000 | | 8.35 | | | 03/25/2025 | | 11,597,762 |
Residential Funding Mortgage Securities I, Inc. Series 2000-HI4,
Class AI7 |
| 8,849,000 | | 7.98 | | | 09/25/2030 | | 9,391,474 |
| | | | | | | |
|
| | | | | | | | 33,517,682 |
|
Manufactured Housing – 5.2% | | |
| Associates Manufactured Housing Pass-Through Series 1996-1, Class A5 |
| 4,266,161 | | 7.60 | | | 03/15/2027 | | 4,477,635 |
| Green Tree Financial Corp. Series 1993-4, Class A5 |
| 10,744,414 | | 7.05 | | | 01/15/2019 | | 11,196,733 |
| Green Tree Financial Corp. Series 1995-5, Class M1 |
| 2,000,000 | | 7.65 | | | 09/15/2026 | | 2,096,502 |
| Green Tree Financial Corp. Series 1996-4, Class A7 |
| 4,714,211 | | 7.90 | | | 06/15/2027 | | 5,108,277 |
| Green Tree Financial Corp. Series 1998-3, Class A5 |
| 896,389 | | 6.22 | | | 03/01/2030 | | 886,468 |
| Green Tree Financial Corp. Series 1998-3, Class A6 |
| 1,060,823 | | 6.76 | | | 03/01/2030 | | 1,073,022 |
| Green Tree Financial Corp. Series 1999-1, Class M1 |
| 3,750,000 | | 6.56 | | | 03/01/2020 | | 1,321,875 |
| Green Tree Financial Corp. Series 1999-1, Class M2 |
| 1,500,000 | | 7.34 | | | 11/01/2028 | | 322,500 |
|
| (a) | | Fund returns assume fee waivers and expense reductions and are not annualized. Returns do not reflect the deduction of taxes that a shareholder would pay on fund distributions or the redemption of funds shares. |
| (b) | | The Lipper Intermediate Investment Grade Funds Index is an unmanaged index consisting of funds that invest at least 65% of their assets in investment grade debt issues with dollar-weighted average maturities of five to ten years. The Index figures do not reflect any fees, expenses or taxes. |
| (c) | | The Lehman Brothers Aggregate Bond Index is an unmanaged index comprised of the Lehman Brothers Government Corporate Bond Index, Mortgage-Backed Securities Index and Asset-Backed Securities Index. The Index figures do not reflect any fees, expenses or taxes. |
| | |
| The accompanying notes are an integral part of these financial statements. | | 15 |
COMMERCE BOND FUND
Statement of Investments (continued)
April 30, 2004 (Unaudited)
| | | | | | | |
Principal Amount | | Interest
Rate | | | Maturity Date | | Value |
| Asset-Backed Securities – (continued) |
Manufactured Housing – (continued) | | |
Indymac Manufactured Housing Contract Series 1997-1,
Class A3 |
| $ 1,524,751 | | 6.61 | % | | 02/25/2028 | | $ 1,442,032 |
Indymac Manufactured Housing Contract Series 1997-1,
Class A4 |
| 1,089,108 | | 6.75 | | | 02/25/2028 | | 1,036,608 |
Indymac Manufactured Housing Contract Series 1998-1,
Class A5 |
| 1,921,907 | | 6.96 | | | 09/25/2028 | | 1,755,031 |
| Oakwood Mortgage Investors, Inc. Series 1997-A, Class A5 |
| 2,158,588 | | 7.13 | | | 05/15/2027 | | 2,227,951 |
| | | | | | | |
|
| | | | | | | | 32,944,634 |
|
| TOTAL ASSET-BACKED SECURITIES |
(Cost $113,038,165) | | $113,842,722 |
|
| |
| Municipal – 0.2% |
| New Jersey Economic Development Authority Revenue Bonds Taxable Designated Industry Series A |
| $ 1,000,000 | | 5.20 | % | | 03/01/2014 | | $ 1,003,740 |
|
| TOTAL MUNICIPAL |
(Cost $1,000,000) | | $ 1,003,740 |
|
| |
| Collateralized Mortgage Obligations – 12.9% |
| Federal Home Loan Mortgage Corp. FGIC PAC Series 2430, Class UD |
| $10,579,800 | | 6.00 | % | | 03/15/2017 | | $ 11,119,714 |
Federal Home Loan Mortgage Corp. PAC Series 2110,
Class PG |
| 4,500,000 | | 6.00 | | | 01/15/2029 | | 4,689,623 |
Federal Home Loan Mortgage Corp. PAC Series 2633,
Class PC |
| 6,000,000 | | 4.50 | | | 07/15/2015 | | 5,982,828 |
| Federal Home Loan Mortgage Corp. REMIC PAC Series 1579, Class PM |
| 2,824,706 | | 6.70 | | | 09/15/2023 | | 2,987,521 |
| Federal Home Loan Mortgage Corp. Series 2524, Class WC |
| 1,950,000 | | 6.00 | | | 11/15/2028 | | 1,974,967 |
| Federal Home Loan Mortgage Corp. Series 2677, Class BC |
| 800,000 | | 4.00 | | | 09/15/2018 | | 694,906 |
Federal National Mortgage Association FNIC PAC Series
2001-45, Class WG |
| 3,600,000 | | 6.50 | | | 09/25/2031 | | 3,741,722 |
Federal National Mortgage Association FNIC PAC Series
2001-76, Class UC |
| 10,000,000 | | 5.50 | | | 11/25/2015 | | 10,420,315 |
| Federal National Mortgage Association PAC Series 2003-14, Class AP |
| 2,545,064 | | 4.00 | | | 03/25/2033 | | 2,541,630 |
|
| | | | | | | |
Principal Amount | | Interest
Rate | | | Maturity Date | | Value |
| Collateralized Mortgage Obligations – (continued) |
| Federal National Mortgage Association REMIC Series 1992-1, Class E |
| $ 274,164 | | 7.50 | % | | 01/25/2007 | | $ 286,531 |
Federal National Mortgage Association Series 2000-M2,
Class C |
| 4,600,000 | | 7.02 | # | | 07/17/2022 | | 5,140,289 |
Federal National Mortgage Association Series 2003-86,
Class OC |
| 5,270,000 | | 5.00 | | | 09/25/2026 | | 5,343,532 |
| Government National Mortgage Association REMIC Series 1998-12, Class EB |
| 4,053,033 | | 6.50 | | | 05/20/2028 | | 4,188,313 |
| Government National Mortgage Association Series 2004-9, Class A |
| 4,221,458 | | 3.36 | | | 08/16/2022 | | 4,159,518 |
Residential Funding Mortgage Securities Corp. Series
1999-S14, Class IIA1 |
| 1,603,112 | | 6.50 | | | 06/25/2029 | | 1,599,766 |
Residential Funding Mortgage Securities Corp. Series
2003-RM2, Class AIII |
| 8,097,985 | | 6.00 | | | 05/25/2033 | | 8,359,298 |
Residential Funding Mortgage Securities I, Inc. Series
1999-S20, Class A1 |
| 290,748 | | 6.50 | | | 09/25/2014 | | 290,297 |
| Residential Funding Mortgage Securities I, Inc. Series 2003-S8, Class A1 |
| 3,128,870 | | 5.00 | | | 05/25/2018 | | 3,193,507 |
| Wells Fargo Mortgage Backed Securities Trust Series 2003-6, Class 1A1 |
| 4,465,229 | | 5.00 | | | 06/25/2018 | | 4,496,147 |
|
| TOTAL COLLATERALIZED MORTGAGE OBLIGATIONS |
(Cost $79,333,131) | | $81,210,424 |
|
| |
| Corporate Obligations – 27.9% |
Agency – 0.1% | | | | | |
| Farmer Mac MTN |
| $ 542,000 | | 6.68 | % | | 06/10/2014 | | $ 611,155 |
|
Cable TV – 0.3% | | |
| Comcast Corp. |
| 1,600,000 | | 6.50 | | | 01/15/2015 | | 1,686,720 |
|
Financial – 15.5% | | |
| Allstate Financial Global Funding † |
| 2,400,000 | | 6.15 | | | 02/01/2006 | | 2,560,171 |
| American General Finance Corp. MTN Series H |
| 3,000,000 | | 4.50 | | | 11/15/2007 | | 3,089,937 |
| Apache Finance Property Ltd. |
| 4,500,000 | | 7.00 | | | 03/15/2009 | | 5,123,853 |
| Bear Stearns Companies, Inc. |
| 4,500,000 | | 4.00 | | | 01/31/2008 | | 4,537,589 |
| BHP Billiton Finance USA Ltd. |
| 2,044,000 | | 4.80 | | | 04/15/2013 | | 2,016,559 |
|
| | |
| 16 | | The accompanying notes are an integral part of these financial statements. |
COMMERCE BOND FUND
| | | | | | | |
Principal Amount | | Interest
Rate | | | Maturity Date | | Value |
| Corporate Obligations – (continued) |
Financial – (continued) | | |
| Caterpillar Financial Services Corp. MTN Series F |
| $ 1,500,000 | | 2.65 | % | | 01/30/2006 | | $ 1,505,246 |
| Deluxe Corp. |
| 1,300,000 | | 5.00 | | | 12/15/2012 | | 1,302,636 |
| Equitable Life Assurance Society of the United States † |
| 11,775,000 | | 7.70 | | | 12/01/2015 | | 13,694,219 |
| Ford Motor Credit Co. |
| 3,250,000 | | 5.80 | | | 01/12/2009 | | 3,310,174 |
| General Electric Capital Corp. MTN Series A |
| 3,000,000 | | 5.00 | | | 06/15/2007 | | 3,145,734 |
| 4,325,000 | | 5.88 | | | 02/15/2012 | | 4,590,373 |
| General Motors Acceptance Corp. |
| 1,750,000 | | 6.63 | | | 10/15/2005 | | 1,839,691 |
| 1,900,000 | | 6.15 | | | 04/05/2007 | | 2,010,375 |
| 1,900,000 | | 8.00 | | | 11/01/2031 | | 2,005,306 |
| Metropolitan Life Insurance Co. † |
| 8,000,000 | | 7.70 | | | 11/01/2015 | | 9,334,496 |
| Morgan Stanley |
| 900,000 | | 6.75 | | | 04/15/2011 | | 994,231 |
| 1,720,000 | | 5.30 | | | 03/01/2013 | | 1,719,047 |
| Morgan Stanley Traded Custody Receipts † |
| 16,380,000 | | 7.68 | # | | 03/01/2032 | | 18,798,343 |
| PNC Bank, N.A. |
| 8,250,000 | | 7.88 | | | 04/15/2005 | | 8,705,491 |
| Reed Elsevier Capital, Inc. |
| 1,800,000 | | 6.75 | | | 08/01/2011 | | 2,041,578 |
| SLM Corp. MTN |
| 2,443,000 | | 4.00 | | | 01/15/2009 | | 2,427,277 |
| Wells Fargo & Co. |
| 3,480,000 | | 3.13 | | | 04/01/2009 | | 3,324,635 |
| | | | | | | |
|
| | | | | | | | 98,076,961 |
|
Forestry – 0.1% | | |
| Weyerhaeuser Co. |
| 457,000 | | 6.75 | | | 03/15/2012 | | 500,989 |
|
Industrial – 3.2% | | |
| Campbell Soup Co. |
| 2,600,000 | | 8.88 | | | 05/01/2021 | | 3,416,085 |
| Receipts on Corporate Securities Trust CHR-1998-1 |
| 5,874,734 | | 6.50 | | | 08/01/2018 | | 5,803,591 |
| Receipts on Corporate Securities Trust NSC-1998-1 |
| 3,440,281 | | 6.38 | | | 05/15/2017 | | 3,594,887 |
| Ryder System, Inc. |
| 4,000,000 | | 6.60 | | | 11/15/2005 | | 4,217,056 |
| Service Master Co. |
| 2,661,000 | | 7.10 | | | 03/01/2018 | | 2,865,950 |
| Waste Managemet, Inc. |
| 560,000 | | 7.65 | | | 03/15/2011 | | 644,878 |
| | | | | | | |
|
| | | | | | | | 20,542,447 |
|
| | | | | | | |
Principal Amount | | Interest
Rate | | | Maturity Date | | Value |
| Corporate Obligations – (continued) |
Multimedia – 0.4% | | |
| AOL Time Warner |
| $ 495,000 | | 6.13 | % | | 04/15/2006 | | $ 524,960 |
| 1,600,000 | | 6.75 | | | 04/15/2011 | | 1,740,911 |
| | | | | | | |
|
| | | | | | | | 2,265,871 |
|
Oil & Gas – 0.7% | | |
| Occidental Petroleum Corp. |
| 2,925,000 | | 7.38 | | | 11/15/2008 | | 3,308,353 |
| Tosco Corp. |
| 1,258,000 | | 7.25 | | | 01/01/2007 | | 1,385,324 |
| | | | | | | |
|
| | | | | | | | 4,693,677 |
|
Oil-Field Services – 0.1% | | |
| Halliburton Co. |
| 620,000 | | 5.50 | | | 10/15/2010 | | 633,610 |
|
Real Estate – 2.4% | | |
| Archstone Communities Trust |
| 3,000,000 | | 8.20 | | | 07/03/2005 | | 3,186,000 |
| EOP Operating LP |
| 3,300,000 | | 7.75 | | | 11/15/2007 | | 3,735,471 |
| Merry Land & Investment, Inc. |
| 1,000,000 | | 6.88 | | | 11/01/2004 | | 1,024,748 |
| Simon Debartolo Group LP |
| 5,000,000 | | 6.75 | | | 06/15/2005 | | 5,225,350 |
| Speiker Properties LP |
| 1,600,000 | | 7.35 | | | 12/01/2017 | | 1,789,754 |
| | | | | | | |
|
| | | | | | | | 14,961,323 |
|
Sovereign Agency – 0.3% | | |
| Resolution Funding Corp. |
| 1,500,000 | | 8.13 | | | 10/15/2019 | | 1,911,574 |
|
Utilities – 2.0% | | |
| GTE Corp. |
| 12,000,000 | | 6.84 | | | 04/15/2018 | | 12,824,184 |
|
Yankee – 2.8% | | | | | |
| Deutsche Telekom International Finance BV |
| 1,335,000 | | 8.00 | # | | 06/15/2010 | | 1,577,404 |
| France Telecom SA |
| 1,286,000 | | 8.75 | # | | 03/01/2011 | | 1,520,307 |
| Hanson Overseas BV |
| 5,000,000 | | 6.75 | | | 09/15/2005 | | 5,285,610 |
| Swiss Bank Corp. |
| 8,000,000 | | 7.38 | | | 06/15/2017 | | 9,407,112 |
| | | | | | | |
|
| | | | | | | | 17,790,433 |
|
| TOTAL CORPORATE OBLIGATIONS |
(Cost $169,155,765) | | $176,498,944 |
|
| | |
| The accompanying notes are an integral part of these financial statements. | | 17 |
COMMERCE BOND FUND
Statement of Investments (continued)
April 30, 2004 (Unaudited)
| | | | | | | |
Principal Amount | | Interest
Rate | | | Maturity Date | | Value |
| Foreign Debt Obligations – 0.1% |
Sovereign – 0.1% | | | | | |
| Republic of Poland |
| $ 592,000 | | 5.25 | % | | 01/15/2014 | | $ 587,560 |
|
| TOTAL FOREIGN DEBT OBLIGATIONS |
(Cost $584,222) | | | | | $ 587,560 |
|
| |
| Mortgage-Backed Pass-Through Obligations – 16.0% |
| Federal Home Loan Mortgage Corp. |
| $ 375,364 | | 6.00 | % | | 12/01/2013 | | $ 388,662 |
| 588,871 | | 8.50 | | | 02/01/2019 | | 647,963 |
| 753,461 | | 8.50 | | | 03/01/2021 | | 829,576 |
| 3,731,310 | | 7.00 | | | 05/01/2026 | | 3,950,871 |
| 552,766 | | 7.00 | | | 10/01/2030 | | 583,752 |
| 593,995 | | 7.50 | | | 12/01/2030 | | 638,063 |
| 1,176,805 | | 7.50 | | | 01/01/2031 | | 1,264,112 |
| 2,473,361 | | 7.00 | | | 08/01/2031 | | 2,611,897 |
| 9,878,210 | | 5.00 | | | 05/01/2033 | | 9,584,508 |
| 8,832,612 | | 5.50 | | | 06/01/2033 | | 8,826,839 |
| Federal National Mortgage Association |
| 1,334,606 | | 5.50 | | | 01/01/2009 | | 1,382,305 |
| 1,013,450 | | 7.00 | | | 07/01/2009 | | 1,083,285 |
| 198,089 | | 6.50 | | | 02/01/2012 | | 211,637 |
| 446,397 | | 6.00 | | | 12/01/2013 | | 457,124 |
| 306,674 | | 6.50 | | | 07/01/2014 | | 321,867 |
| 635,548 | | 9.00 | | | 11/01/2021 | | 708,357 |
| 3,173 | | 6.50 | | | 05/01/2024 | | 3,316 |
| 93,856 | | 6.50 | | | 08/01/2024 | | 98,085 |
| 224,335 | | 6.50 | | | 09/01/2024 | | 234,443 |
| 53,104 | | 6.50 | | | 09/01/2024 | | 55,497 |
| 161,673 | | 9.00 | | | 02/01/2025 | | 181,030 |
| 159,274 | | 6.50 | | | 03/01/2026 | | 166,207 |
| 521,191 | | 8.00 | | | 07/01/2028 | | 569,336 |
| 860,918 | | 6.50 | | | 10/01/2028 | | 897,211 |
| 194,180 | | 7.00 | | | 10/01/2028 | | 205,496 |
| 742,335 | | 5.76 | # | | 12/01/2028 | | 763,748 |
| 348,251 | | 6.50 | | | 01/01/2029 | | 362,932 |
| 356,049 | | 6.00 | | | 07/01/2029 | | 364,540 |
| 834,644 | | 7.50 | | | 09/01/2029 | | 893,554 |
| 657,078 | | 7.00 | | | 03/01/2031 | | 694,604 |
| 408,844 | | 7.50 | | | 03/01/2031 | | 437,332 |
| 1,282,477 | | 7.00 | | | 11/01/2031 | | 1,355,725 |
| 3,133,357 | | 7.00 | | | 01/01/2032 | | 3,312,317 |
| 6,994,495 | | 5.00 | | | 02/01/2033 | | 6,781,727 |
| 6,538,364 | | 5.50 | | | 03/01/2033 | | 6,528,213 |
| 6,765,586 | | 5.50 | | | 03/01/2033 | | 6,755,082 |
| 4,464,424 | | 5.00 | | | 07/01/2033 | | 4,328,619 |
| 14,345,311 | | 4.50 | | | 08/01/2033 | | 13,478,908 |
| 4,945,946 | | 5.00 | | | 02/01/2034 | | 4,795,635 |
| Government National Mortgage Association |
| 1,190,726 | | 8.00 | | | 02/15/2022 | | 1,310,029 |
| 499,249 | | 7.50 | | | 08/20/2025 | | 537,399 |
| 1,773,223 | | 7.50 | | | 07/20/2026 | | 1,904,975 |
| 3,320,001 | | 6.50 | | | 04/15/2031 | | 3,468,741 |
|
| | | | | | | |
Principal Amount | | Interest
Rate | | | Maturity Date | | Value |
| Mortgage-Backed Pass-Through Obligations – (continued) |
| Government National Mortgage Association – (continued) |
| $3,897,617 | | 6.50 | % | | 05/15/2031 | | $ 4,072,235 |
| 2,806,783 | | 5.50 | | | 10/15/2033 | | 2,810,409 |
|
| TOTAL MORTGAGE-BACKED PASS-THROUGH OBLIGATIONS |
(Cost $100,169,232) | | $100,858,163 |
|
| |
| U.S. Government Agency Obligations – 22.4% |
| Federal Home Loan Bank |
| $10,000,000 | | 5.13 | % | | 03/06/2006 | | $ 10,492,280 |
| 23,755,000 | | 2.75 | | | 11/15/2006 | | 23,696,420 |
| 8,210,000 | | 4.88 | | | 11/15/2006 | | 8,613,210 |
| 7,000,000 | | 5.59 | | | 02/03/2009 | | 7,519,512 |
| 2,270,000 | | 5.58 | | | 02/17/2009 | | 2,437,058 |
| 3,025,000 | | 7.13 | | | 02/15/2030 | | 3,536,582 |
| Federal Home Loan Mortgage Corp. |
| 15,000,000 | | 2.75 | | | 08/15/2006 | | 15,027,750 |
| 12,000,000 | | 4.50 | | | 07/15/2013 | | 11,613,444 |
| Federal National Mortgage Association |
| 22,000,000 | | 3.38 | | | 12/15/2008 | | 21,520,796 |
| 6,150,000 | | 6.00 | | | 05/15/2011 | | 6,678,494 |
| 1,300,000 | | 5.08 | | | 06/24/2018 | | 1,245,594 |
| 8,900,000 | | 7.13 | | | 01/15/2030 | | 10,477,694 |
| 10,000,000 | | 6.63 | | | 11/15/2030 | | 11,110,100 |
| Tennessee Valley Authority |
| 5,765,000 | | 6.00 | | | 03/15/2013 | | 6,254,397 |
| 1,000,000 | | 7.13 | | | 05/01/2030 | | 1,176,439 |
|
| TOTAL U.S. GOVERNMENT AGENCY OBLIGATIONS |
(Cost $143,384,713) | | $141,399,770 |
|
| |
| U.S. Treasury Obligations – 0.5% |
| United States Treasury Bonds |
| $ 400,000 | | 8.00 | % | | 11/15/2021 | | $ 526,937 |
| United States Treasury Notes |
| 1,750,000 | | 3.63 | | | 05/15/2013 | | 1,651,290 |
| 1,200,000 | | 4.25 | | | 11/15/2013 | | 1,177,219 |
|
| TOTAL U.S. TREASURY OBLIGATIONS |
(Cost $3,498,857) | | $ 3,355,446 |
|
| |
| Repurchase Agreement – 1.3% |
| State Street Bank & Trust Co.^ |
| $8,155,000 | | 0.75 | % | | 05/03/2004 | | $ 8,155,000 |
Maturity Value: $8,155,510 | | |
|
| TOTAL REPURCHASE AGREEMENT |
(Cost $8,155,000) | | $ 8,155,000 |
|
| TOTAL INVESTMENTS – 99.2% |
(Cost $618,319,085) | | 626,911,769 |
| Other assets in excess of liabilities – 0.8% | | 5,018,276 |
|
| Net Assets – 100.0% | | $631,930,045 |
|
| | |
| 18 | | The accompanying notes are an integral part of these financial statements. |
COMMERCE BOND FUND
| | |
| † | | Securities are exempt from registration under Rule 144A of the Securities Act of 1933. Under procedures approved by the Board of Trustees, such securities have been determined to be liquid by the Investment Adviser and may be resold, normally to qualified institutional buyers in transactions exempt from registration. Total market value of Rule 144A securities amounted to $44,539,083 which represents 7.0% of net assets as of April 30, 2004. |
| # | | Variable rate security. Coupon rate disclosed is that which is in effect at April 30, 2004. |
| ^ | | Repurchase agreement was entered into on April 30, 2004. At April 30, 2004, this agreement was fully collateralized by U.S. Treasury Notes. |
| @ | | Security issued with a zero coupon. The actual effective yield of this security is different than the stated coupon due to the accretion of discount. |
| | |
|
|
| Investment Abbreviations: |
| FGIC | | —Insured by Financial Guaranty Insurance Co. |
| FNIC | | —Financial Network Investment Corporation |
| MTN | | —Medium-Term Note |
| PAC | | —Planned Amortization Class |
| REMIC | | —Real Estate Mortgage Investment Conduit |
|
| | |
| The accompanying notes are an integral part of these financial statements. | | 19 |
COMMERCE SHORT-TERM GOVERNMENT FUND
Short-Term Government Fund
Performance Review(a) (Unaudited)
For the six months ended April 30, 2004, the Institutional Shares of the Fund had a total return of 0.55%, based on Net Asset Value (NAV). The Service Shares had a total return, without sales charge, of 0.42% for the same period based on NAV. This compares to the Lipper Short U.S. Government Funds Index(b) six-month return of 0.41% and the Citigroup 1-5 Yr. Treasury/Government Sponsored Index(c) six-month return of 0.65%. Past performance is no guarantee of future results.
Statement of Investments
April 30, 2004 (Unaudited)
| | | | | | | |
Principal Amount | | Interest Rate | | | Maturity Date | | Value |
| Collateralized Mortgage Obligations – 23.2% |
| ABN Amro Mortgage Corp. Series 2002-7, Class 2A1 |
| $ 1,583 | | 5.75 | % | | 09/25/2017 | | $ 1,582 |
| Countrywide Home Loans, Inc. Series 1997-4, Class A |
| 54,828 | | 8.00 | | | 08/25/2027 | | 55,269 |
| Countrywide Home Loans, Inc. Series 2002-21, Class A2 |
| 461,173 | | 5.75 | | | 11/25/2017 | | 465,461 |
| Federal Home Loan Mortgage Corp. PAC Series 159, Class H |
| 140,553 | | 4.50 | | | 09/15/2021 | | 140,536 |
Federal Home Loan Mortgage Corp. PAC Series 1614,
Class MB |
| 658,028 | | 6.50 | | | 12/15/2009 | | 696,177 |
| Federal Home Loan Mortgage Corp. PAC Series 1650, Class K |
| 880,000 | | 6.50 | | | 01/15/2024 | | 936,326 |
Federal Home Loan Mortgage Corp. PAC Series 2103,
Class TE |
| 1,333,000 | | 6.00 | | | 12/15/2028 | | 1,366,438 |
| Federal Home Loan Mortgage Corp. PAC Series 2109, Class PE |
| 995,000 | | 6.00 | | | 12/15/2028 | | 1,041,823 |
| Federal Home Loan Mortgage Corp. PAC Series 2131, Class PE |
| 1,191,444 | | 6.00 | | | 04/15/2026 | | 1,217,341 |
Federal Home Loan Mortgage Corp. PAC Series 2178,
Class PB |
| 5,450,000 | | 7.00 | | | 08/15/2029 | | 5,819,992 |
| Federal Home Loan Mortgage Corp. PAC Series 23, Class PK |
| 1,366,000 | | 6.00 | | | 11/25/2023 | | 1,437,547 |
Federal Home Loan Mortgage Corp. PAC Series 2389,
Class CD |
| 450,000 | | 6.00 | | | 03/15/2016 | | 471,938 |
Federal Home Loan Mortgage Corp. PAC Series 2520,
Class NL |
| 1,000,000 | | 4.50 | | | 09/15/2022 | | 1,022,845 |
| Federal Home Loan Mortgage Corp. REMIC PAC Series 1351, Class TE |
| 1,801,923 | | 7.00 | | | 08/15/2022 | | 1,887,250 |
| Federal Home Loan Mortgage Corp. REMIC PAC Series 1607, Class G |
| 1,677,175 | | 6.00 | | | 08/15/2013 | | 1,748,591 |
| Federal Home Loan Mortgage Corp. REMIC PAC Series 1611, Class IA |
| 663,544 | | 6.50 | | | 02/15/2023 | | 674,188 |
|
| | | | | | | |
Principal Amount | | Interest Rate | | | Maturity Date | | Value |
| Collateralized Mortgage Obligations – (continued) |
| Federal Home Loan Mortgage Corp. REMIC PAC Series 1673, Class H |
| $ 150,000 | | 6.00 | % | | 11/15/2022 | | $ 156,676 |
| Federal Home Loan Mortgage Corp. REMIC PAC Series 2022, Class PE |
| 505,670 | | 6.50 | | | 01/15/2028 | | 534,167 |
| Federal Home Loan Mortgage Corp. REMIC PAC Series 2061, Class TA |
| 5,308,100 | | 5.25 | | | 10/15/2027 | | 5,421,884 |
| Federal Home Loan Mortgage Corp. REMIC PAC Series 2161, Class PG |
| 1,278,353 | | 6.00 | | | 04/15/2028 | | 1,330,806 |
| Federal Home Loan Mortgage Corp. REMIC PAC Series 2345, Class PQ |
| 220,000 | | 6.50 | | | 08/15/2016 | | 234,285 |
| Federal Home Loan Mortgage Corp. REMIC PAC Series 2377, Class EC |
| 29,598 | | 5.50 | | | 08/15/2026 | | 29,584 |
| Federal Home Loan Mortgage Corp. REMIC PAC Series 2439, Class LG |
| 2,375,000 | | 6.00 | | | 09/15/2030 | | 2,499,430 |
| Federal Home Loan Mortgage Corp. REMIC PAC Series 2498, Class NE |
| 452,546 | | 6.00 | | | 11/15/2028 | | 465,821 |
| Federal Home Loan Mortgage Corp. REMIC PAC Series 41, Class F |
| 403,546 | | 10.00 | | | 05/15/2020 | | 404,339 |
Federal Home Loan Mortgage Corp. REMIC Series 1163,
Class JA |
| 179,890 | | 7.00 | | | 11/15/2021 | | 180,565 |
Federal Home Loan Mortgage Corp. REMIC Series 1632,
Class B |
| 13,440 | | 6.00 | | | 11/15/2023 | | 13,488 |
Federal Home Loan Mortgage Corp. REMIC Series 2591,
Class QY |
| 716,506 | | 5.00 | | | 05/15/2014 | | 735,620 |
| Federal Home Loan Mortgage Corp. Series 31, Class EA@ |
| 1,537,440 | | 0.00 | | | 04/25/2024 | | 1,352,888 |
|
| (a) | | Fund returns assume fee waivers and expense reductions and are not annualized. Returns do not reflect the deduction of taxes that a shareholder would pay on fund distributions or the redemption of fund shares. |
| (b) | | The Lipper Short U.S. Government Funds Index is an unmanaged index consisting of funds that invest at least 65% of their assets in securities issued or guaranteed by the U.S. Government with dollar-weighted average maturities of less than three years. The Index figures do not reflect any fees, expenses or taxes. |
| (c) | | The Citigroup 1-5 Year Treasury/Government Sponsored Index is an unmanaged index comprised of Treasury Securities with a minimum principal amount of $1 billion and U.S. Government Securities with a minimum principal amount of $100 million. The securities range in maturity from one to five years. The Index figures do not reflect any fees, expenses or taxes. |
| | |
| 20 | | The accompanying notes are an integral part of these financial statements. |
COMMERCE SHORT-TERM GOVERNMENT FUND
| | | | | | | |
Principal Amount | | Interest Rate | | | Maturity Date | | Value |
| Collateralized Mortgage Obligations – (continued) |
| Federal National Mortgage Association PAC Series 1992-129, Class L |
| $ 1,017,612 | | 6.00 | % | | 07/25/2022 | | $ 1,069,062 |
| Federal National Mortgage Association PAC Series 2001-76, Class UC |
| 1,000,000 | | 5.50 | | | 11/25/2015 | | 1,042,032 |
| Federal National Mortgage Association REMIC PAC Series 1991-94, Class E@ |
| 424,046 | | 0.00 | | | 07/25/2021 | | 404,018 |
| Federal National Mortgage Association REMIC PAC Series 1993-132, Class A@ |
| 437,005 | | 0.00 | | | 10/25/2022 | | 404,878 |
| Federal National Mortgage Association REMIC PAC Series 1995-4, Class PB |
| 61,136 | | 8.00 | | | 11/25/2024 | | 61,086 |
| Federal National Mortgage Association REMIC PAC Series 1998-36, Class J |
| 528,391 | | 6.00 | | | 07/18/2028 | | 549,214 |
| Federal National Mortgage Association REMIC PAC Series 2001-71, Class MB |
| 891,000 | | 6.00 | | | 12/25/2016 | | 936,614 |
| Federal National Mortgage Association REMIC PAC Series 2003-14, Class AP |
| 3,421,935 | | 4.00 | | | 03/25/2033 | | 3,417,317 |
| Federal National Mortgage Association REMIC Series 1991-137, Class H |
| 520,805 | | 7.00 | | | 10/25/2021 | | 556,263 |
| Federal National Mortgage Association REMIC Series 1992, Class 89@ |
| 192,132 | | 0.00 | | | 06/25/2022 | | 167,190 |
| Federal National Mortgage Association REMIC Series 1992-1, Class E |
| 39,166 | | 7.50 | | | 01/25/2007 | | 40,933 |
| Federal National Mortgage Association REMIC Series 1993-140, Class J |
| 1,100,000 | | 6.65 | | | 06/25/2013 | | 1,181,507 |
| Federal National Mortgage Association REMIC Series 1993-182, Class FA |
| 124,089 | | 3.71 | # | | 09/25/2023 | | 127,528 |
| Federal National Mortgage Association REMIC Series 1993-183, Class K |
| 500,000 | | 6.50 | | | 07/25/2023 | | 530,326 |
| Federal National Mortgage Association REMIC Series 1999-9, Class PD |
| 494,281 | | 6.00 | | | 05/25/2017 | | 502,263 |
| Federal National Mortgage Association REMIC Series 2001-20, Class VB |
| 575,000 | | 6.00 | | | 09/25/2017 | | 592,894 |
| Federal National Mortgage Association REMIC Series 2001-4, Class D |
| 1,039,390 | | 6.50 | | | 04/25/2028 | | 1,053,322 |
| Federal National Mortgage Association REMIC Series 2002-71, Class PC |
| 1,000,000 | | 5.50 | | | 12/25/2026 | | 1,039,841 |
Federal National Mortgage Association Series 2000-M2,
Class C |
| 1,600,000 | | 7.02 | # | | 07/17/2022 | | 1,787,927 |
| First Nationwide Trust Series 1998-3, Class 1PPA |
| 105,658 | | 6.50 | | | 09/19/2028 | | 105,958 |
|
| | | | | | | |
Principal Amount | | Interest Rate | | | Maturity Date | | Value |
| Collateralized Mortgage Obligations – (continued) |
| Government National Mortgage Association REMIC PAC Series 2001-19, Class ON |
| $ 85,718 | | 6.50 | % | | 06/16/2028 | | $ 85,674 |
| Government National Mortgage Association REMIC PAC Series 2001-6, Class PM |
| 1,000,000 | | 6.50 | | | 06/16/2030 | | 1,046,554 |
| Government National Mortgage Association REMIC Series 2001-60, Class AC |
| 295,000 | | 6.00 | | | 05/20/2029 | | 306,993 |
| Government National Mortgage Association Series 1998-12, Class EB |
| 1,013,258 | | 6.50 | | | 05/20/2028 | | 1,047,078 |
| Government National Mortgage Association Series 2001-53, Class F |
| 417,342 | | 1.45 | # | | 10/20/2031 | | 417,405 |
| Government National Mortgage Association Series 2002-28, Class A |
| 2,121,467 | | 4.78 | | | 02/16/2018 | | 2,202,220 |
| Government National Mortgage Association Series 2004-9, Class A |
| 1,889,908 | | 3.36 | | | 08/16/2022 | | 1,862,179 |
| Residential Funding Mortgage Securities I, Inc. Series 1999-S20, Class A1 |
| 218,061 | | 6.50 | | | 09/25/2014 | | 217,723 |
| Residential Funding Mortgage Securities I, Inc. Series 2003-S8, Class A1 |
| 1,215,432 | | 5.00 | | | 05/25/2018 | | 1,240,541 |
| Securitized Asset Sales, Inc. Series 1993-7, Class TA6 |
| 265,334 | | 6.25 | | | 12/25/2023 | | 265,074 |
| Vendee Mortgage Trust Series 1996-2, Class 1Z |
| 481,181 | | 6.75 | | | 06/15/2026 | | 502,333 |
| Washington Mutual MSC Mortgage Pass-Through Series 2002-MS8, Class 4A5 |
| 1,000,000 | | 5.75 | | | 12/25/2032 | | 1,008,988 |
| Wells Fargo Mortgage Backed Securities Trust Series 2003-6, Class 1A1 |
| 803,741 | | 5.00 | | | 06/25/2018 | | 809,306 |
|
| TOTAL COLLATERALIZED MORTGAGE OBLIGATIONS |
(Cost $58,424,696) | | $ 58,925,098 |
|
| |
| Mortgage-Backed Pass-Through Obligations – 4.3% |
| Federal Home Loan Mortgage Corp. |
| $ 6,482 | | 7.75 | % | | 09/01/2007 | | $ 6,556 |
| 802,660 | | 5.50 | | | 08/01/2017 | | 824,192 |
| 406,933 | | 6.00 | | | 10/01/2023 | | 418,737 |
| Federal National Mortgage Association |
| 41,089 | | 8.00 | | | 12/01/2007 | | 43,427 |
| 1,069,136 | | 7.00 | | | 03/01/2009 | | 1,143,768 |
| 1,655,367 | | 4.50 | | | 11/01/2009 | | 1,669,768 |
| 28,083 | | 6.50 | | | 02/01/2012 | | 30,004 |
| 1,343,201 | | 6.50 | | | 09/01/2013 | | 1,424,056 |
| 634,972 | | 10.50 | | | 11/01/2015 | | 705,443 |
| 815,170 | | 6.00 | | | 07/01/2016 | | 850,740 |
| 46,218 | | 5.08 | # | | 08/01/2023 | | 47,650 |
| 16,833 | | 9.00 | | | 07/01/2024 | | 18,961 |
| 87,850 | | 5.76 | # | | 12/01/2028 | | 90,384 |
|
| | |
| The accompanying notes are an integral part of these financial statements. | | 21 |
COMMERCE SHORT-TERM GOVERNMENT FUND
Statement of Investments (continued)
April 30, 2004 (Unaudited)
| | | | | | | |
Principal Amount | | Interest Rate | | | Maturity Date | | Value |
| Mortgage-Backed Pass-Through Obligations – (continued) |
| Federal National Mortgage Association – (continued) |
| $ 388,629 | | 7.00 | % | | 11/01/2031 | | $ 410,826 |
| 1,400,067 | | 5.24 | # | | 02/01/2033 | | 1,415,094 |
| Government National Mortgage Association |
| 27,354 | | 8.00 | | | 10/15/2016 | | 30,021 |
| 55,021 | | 8.00 | | | 07/15/2017 | | 60,518 |
| 1,678 | | 4.63 | # | | 11/20/2024 | | 1,721 |
| 2,752 | | 4.63 | # | | 12/20/2024 | | 2,814 |
| 88,703 | | 4.38 | # | | 04/20/2026 | | 89,581 |
| 51,588 | | 4.75 | # | | 08/20/2026 | | 52,785 |
| 85,869 | | 3.38 | # | | 01/20/2028 | | 86,695 |
| 1,403,391 | | 5.50 | | | 10/15/2033 | | 1,405,204 |
| | | | | | | |
|
| | | | | | | | 10,828,945 |
|
| TOTAL MORTGAGE-BACKED PASS-THROUGH OBLIGATIONS |
(Cost $10,983,748) | | $ 10,828,945 |
|
| |
| U.S. Government Agency Obligations – 62.6% |
| Federal Farm Credit Bank |
| $ 470,000 | | 5.40 | % | | 05/10/2006 | | $ 496,789 |
| 4,500,000 | | 3.00 | | | 04/15/2008 | | 4,402,399 |
| 237,000 | | 6.89 | | | 09/13/2010 | | 269,170 |
| 250,000 | | 7.00 | | | 09/01/2015 | | 291,564 |
| 500,000 | | 6.13 | | | 12/29/2015 | | 547,030 |
| Federal Home Loan Bank |
| 4,800,000 | | 3.00 | | | 08/15/2005 | | 4,866,312 |
| 1,240,000 | | 4.96 | | | 10/07/2005 | | 1,292,467 |
| 5,000,000 | | 5.13 | | | 03/06/2006 | | 5,246,140 |
| 10,000,000 | | 2.25 | | | 05/15/2006 | | 9,951,130 |
| 260,000 | | 7.01 | | | 06/14/2006 | | 284,071 |
| 1,815,000 | | 1.88 | | | 06/15/2006 | | 1,789,626 |
| 7,000,000 | | 5.25 | | | 08/15/2006 | | 7,383,775 |
| 425,000 | | 2.88 | | | 02/15/2007 | | 423,213 |
| 735,000 | | 5.38 | | | 02/15/2007 | | 780,585 |
| 525,000 | | 3.50 | | | 09/12/2007 | | 527,848 |
| 125,000 | | 5.88 | | | 11/15/2007 | | 135,229 |
| 115,000 | | 6.02 | | | 01/09/2008 | | 125,104 |
| 50,000 | | 5.97 | | | 03/25/2008 | | 54,381 |
| 1,000,000 | | 6.00 | | | 06/11/2008 | | 1,091,217 |
| 5,000,000 | | 2.63 | | | 07/15/2008 | | 4,794,520 |
| 250,000 | | 5.37 | | | 12/11/2008 | | 266,325 |
| 3,000,000 | | 5.59 | | | 02/03/2009 | | 3,222,648 |
| 125,000 | | 5.90 | | | 03/26/2009 | | 135,992 |
| 35,000 | | 5.99 | | | 04/09/2009 | | 38,220 |
| Federal Home Loan Mortgage Corp. |
| 5,000,000 | | 6.88 | | | 01/15/2005 | | 5,190,480 |
| 220,000 | | 5.95 | | | 01/19/2006 | | 233,478 |
| 12,000,000 | | 5.50 | | | 07/15/2006 | | 12,735,228 |
| 12,750,000 | | 2.75 | | | 08/15/2006 | | 12,773,587 |
| 6,500,000 | | 2.88 | | | 12/15/2006 | | 6,501,398 |
| 5,000,000 | | 2.75 | | | 03/15/2008 | | 4,857,070 |
| 200,000 | | 5.75 | | | 04/15/2008 | | 215,854 |
| 5,000,000 | | 3.63 | | | 09/15/2008 | | 4,965,945 |
| Federal National Mortgage Association |
| 625,000 | | 7.40 | | | 07/01/2004 | | 631,222 |
| 215,000 | | 7.88 | | | 02/24/2005 | | 226,198 |
| 500,000 | | 7.65 | | | 03/10/2005 | | 526,376 |
| | | | | | | |
Principal Amount | | Interest Rate | | | Maturity Date | | Value |
| U.S. Government Agency Obligations – (continued) |
| Federal National Mortgage Association – (continued) |
| $5,975,000 | | 3.88 | % | | 03/15/2005 | | $ 6,096,460 |
| 10,750,000 | | 6.00 | | | 12/15/2005 | | 11,392,592 |
| 5,000,000 | | 5.25 | | | 06/15/2006 | | 5,268,925 |
| 19,000,000 | | 4.38 | | | 10/15/2006 | | 19,700,454 |
| 4,000,000 | | 7.13 | | | 03/15/2007 | | 4,447,964 |
| 6,000,000 | | 4.25 | | | 07/15/2007 | | 6,179,400 |
| 490,000 | | 3.88 | | | 12/01/2008 | | 490,164 |
| 7,500,000 | | 5.25 | | | 01/15/2009 | | 7,927,012 |
| Tennessee Valley Authority 1995 Series A |
| 436,000 | | 6.38 | | | 06/15/2005 | | 457,291 |
|
| TOTAL U.S. GOVERNMENT AGENCY OBLIGATIONS |
(Cost $158,921,590) | | | | | $159,232,853 |
|
| |
| U.S. Treasury Obligations – 1.6% |
| United States Treasury Notes |
| $ 3,800,000 | | 6.13 | % | | 08/15/2007 | | $ 4,169,163 |
|
| TOTAL U.S. TREASURY OBLIGATIONS |
(Cost $4,202,866) | | | | | $ 4,169,163 |
|
| |
| Repurchase Agreement – 9.2% |
| State Street Bank & Trust Co.^ |
| $23,558,000 | | 0.75 | % | | 05/03/2004 | | $ 23,558,000 |
Maturity Value: $23,559,472 | | |
|
| TOTAL REPURCHASE AGREEMENT |
(Cost $23,558,000) | | $ 23,558,000 |
|
| TOTAL INVESTMENTS – 100.9% |
(Cost $256,090,900) | | $256,714,059 |
| Liabilities in excess of other assets – (0.9)% | | (2,319,965) |
|
| Net Assets – 100.0% | | $254,394,094 |
|
| | |
| # | | Variable rate security. Coupon rate disclosed is that which is in effect at April 30, 2004. |
| ^ | | Repurchase agreement was entered into on April 30, 2004. At April 30, 2004 this agreement was fully collateralized by U.S. Treasury Notes. |
| @ | | Security issued with a zero coupon. The actual effective yield of this security is different than the stated coupon due to the accretion of discount. |
| | |
|
|
| Investment Abbreviations: |
| MSC | | —MortgageSecurities Corp. |
| PAC | | —PlannedAmortization Class |
| REMIC | | —RealEstate Mortgage Investment Conduit |
|
| | |
| 22 | | The accompanying notes are an integral part of these financial statements. |
COMMERCE NATIONAL TAX-FREE INTERMEDIATE BOND FUND
National Tax-Free Intermediate Bond Fund
Performance Review(a) (Unaudited)
For the six months ended April 30, 2004, the Institutional Shares of the Fund had a total return of 0.47%, based on Net Asset Value (NAV). The Service Shares had a total return, without sales charge, of 0.42% for the same period based on NAV. This compares to the Lipper Intermediate Municipal Funds Index(b) six-month return of 0.42% and the Lehman 3-15 Year Blend Index(c) six-month return of 0.76%. Past performance is no guarantee of future results.
Statement of Investments
April 30, 2004 (Unaudited)
| | | | | | | |
Principal
Amount | | Interest
Rate | | | Maturity
Date | | Value |
| Municipal Bond Obligations – 98.8% |
Alabama – 0.6% |
| Birmingham AL GO Bonds (Refunding Warrants Series B) (FSA) (AAA/Aaa) |
| $ 930,000 | | 5.50 | % | | 07/01/2012 | | $ 1,040,623 |
|
Arizona – 1.0% |
| Arizona Water Infrastructure Finance Authority Revenue Bonds Water Quality Series A (NR/Aaa) |
| 500,000 | | 5.38 | | | 10/01/2012 | | 560,330 |
Pinal County AZ Unified School District No. 43 Apache Junction GO Bonds (Refunding) (FGIC) (AAA/Aaa) |
| 500,000 | | 5.75 | | | 07/01/2015 | | 570,350 |
| Tempe AZ GO Bonds (AA+/Aa1) |
| 500,000 | | 6.60 | | | 07/01/2006 | | 549,275 |
| | | | | | | |
|
| | | | | | | | 1,679,955 |
|
Arkansas – 1.0% |
| Arkansas State Development Finance Authority Revenue Bonds (Single Family Mortgage Backed Securities Program) Series A (GNMA/FNMA) (AAA/NR) |
| 115,000 | | 5.65 | | | 07/01/2011 | | 120,119 |
Arkansas State Development Finance Authority State Park Facilities Revenue Bonds (Mt. Magazine Project) (FSA)
(AAA/NR) |
| 1,500,000 | | 5.00 | | | 01/01/2017 | | 1,574,910 |
| | | | | | | |
|
| | | | | | | | 1,695,029 |
|
California – 4.7% |
| California State GO Bonds (MBIA-IBC) (AAA/NR) |
| 1,235,000 | | 5.50 | | | 02/01/2012 | | 1,370,183 |
| Oxnard CA Union High School District GO Bonds (Refunding Series A) (MBIA) (AAA/Aaa) |
| 1,000,000 | | 5.90 | | | 02/01/2019 | | 1,157,280 |
| Redding CA Joint Powers Financing Authority Water Revenue Bonds (Refunding Series A) (AMBAC) (AAA/Aaa) |
| 1,450,000 | | 5.00 | | | 06/01/2021 | | 1,484,757 |
|
| | | | | | | |
Principal
Amount | | Interest
Rate | | | Maturity
Date | | Value |
| Municipal Bond Obligations – (continued) |
California – (continued) |
| San Diego CA Unified School District GO Bonds Series C (FSA) (AAA/Aaa) |
| $ 550,000 | | 5.00 | % | | 07/01/2017 | | $ 577,577 |
| Sequoia CA Union High School District GO Bonds (Election of 2001) (MBIA) (NR/Aaa) |
| 1,330,000 | | 5.00 | | | 07/01/2020 | | 1,373,318 |
| West Contra Costa CA Unified School District GO Bonds (Refunding Series A) (MBIA) (AAA/Aaa) |
| 1,810,000 | | 5.70 | | | 02/01/2022 | | 2,044,775 |
| | | | | | | |
|
| | | | | | | | 8,007,890 |
|
Colorado – 3.4% |
| Colorado Educational & Cultural Facilities Authority Revenue Bonds (Charter School-Littleton Academy) (BBB/NR) |
| 630,000 | | 5.38 | | | 01/15/2012 | | 634,485 |
| 615,000 | | 6.00 | | | 01/15/2022 | | 601,827 |
| Colorado Educational & Cultural Facilities Authority Revenue Bonds (Charter School-University Laboratory School Project) (NR/Baa2) |
| 960,000 | | 5.25 | | | 06/01/2011 | | 971,827 |
| Colorado Educational & Cultural Facilities Authority Revenue Bonds (Nashville Public Radio) (BBB+/NR) |
| 365,000 | | 5.50 | | | 04/01/2009 | | 390,999 |
| 390,000 | | 5.50 | | | 04/01/2010 | | 418,154 |
| 410,000 | | 5.50 | | | 04/01/2011 | | 436,839 |
| 215,000 | | 5.75 | | | 04/01/2014 | | 230,192 |
| 1,300,000 | | 5.88 | | | 04/01/2022 | | 1,340,079 |
Colorado Health Facilities Authority Revenue Bonds
(Refunding Parkview Medical Center Project) (NR/Baa1) |
| 300,000 | | 5.50 | | | 09/01/2006 | | 318,285 |
| Colorado Health Facilities Authority Revenue Bonds (Parkview Medical Center Project) (NR/Baa1) |
| 500,000 | | 5.75 | | | 09/01/2008 | | 538,290 |
| | | | | | | |
|
| | | | | | | | 5,880,977 |
|
| (a) | | Fund returns assume fee waivers and expense reductions and are not annualized. Returns do not reflect the deduction of taxes that a shareholder would pay on fund distributions or the redemption of fund shares. |
| (b) | | The Lipper Intermediate Municipal Funds Index is an unmanaged index consisting of funds that invest in municipal debt issues with dollar-weighted average maturities of five to ten years. The Index figures do not reflect any fees, expenses or taxes. |
| (c) | | The Lehman 3-15 Year Blend Index is an unmanaged index composed of investment grade municipal securities ranging from 2 to 17 years in maturity. The Index returns do not reflect any fees, expenses or taxes. |
| | |
| The accompanying notes are an integral part of these financial statements. | | 23 |
COMMERCE NATIONAL TAX-FREE INTERMEDIATE BOND FUND
Statement of Investments (continued)
April 30, 2004 (Unaudited)
| | | | | | | |
Principal
Amount | | Interest
Rate | | | Maturity
Date | | Value |
| Municipal Bond Obligations – (continued) |
District of Columbia – 0.4% |
| District of Columbia Revenue Bonds (World Wildlife Fund) Series A (AMBAC) (AAA/Aaa) |
| $ 555,000 | | 5.75 | % | | 07/01/2011 | | $ 623,476 |
|
Florida – 1.4% |
| Florida State Board of Education Capital Outlay GO Bonds (Refunding Public Education) Series D (AA+/Aa2) |
| 895,000 | | 5.50 | | | 06/01/2009 | | 999,974 |
| Florida State Community Services Corp. Walton County Water & Sewer Revenue Bonds (Refunding) (AMBAC) (NR/Aaa) |
| 1,330,000 | | 5.50 | | | 03/01/2014 | | 1,473,494 |
| | | | | | | |
|
| | | | | | | | 2,473,468 |
|
Georgia – 2.5% |
| George L Smith II GA World Congress Control Revenue Bonds (Refunding Domed Stadium Project) (MBIA) (AAA/Aaa) |
| 2,000,000 | | 6.00 | | | 07/01/2011 | | 2,227,260 |
| Georgia Private Colleges & University Revenue Bonds Series A (NR/Baa1) |
| 1,000,000 | | 5.25 | | | 10/01/2020 | | 994,510 |
| Georgia State GO Bonds Series D (AAA/Aaa) |
| 1,000,000 | | 5.50 | | | 08/01/2005 | | 1,050,540 |
| | | | | | | |
|
| | | | | | | | 4,272,310 |
|
Hawaii – 1.3% |
| Honolulu City & County GO Bonds (Unrefunded Balance Series A) (AA-/Aa2) |
| 2,000,000 | | 5.75 | | | 04/01/2012 | | 2,258,260 |
|
Illinois – 4.5% |
| Chicago IL Board of Education Certificates of Participation (Lease) Series A (MBIA) (AAA/Aaa) |
| 500,000 | | 6.25 | | | 01/01/2010 | | 574,395 |
| Chicago IL GO Bonds Series A (FGIC) (AAA/Aaa) |
| 765,000 | | 5.75 | | | 01/01/2008 | | 845,386 |
| 1,000,000 | | 6.13 | | | 01/01/2017 | | 1,148,660 |
| 1,000,000 | | 6.00 | | | 01/01/2018 | | 1,139,430 |
| 1,000,000 | | 6.00 | | | 01/01/2019 | | 1,135,870 |
| Elgin IL GO Bonds (Refunding Series B) (NR/Aa2) |
| 25,000 | | 4.80 | | | 01/01/2010 | | 26,228 |
| Illinois Educational Facilities Authority Student Housing Revenue Bonds (Educational Advancement Fund University Center Project) (NR/Baa2) |
| 670,000 | | 5.50 | | | 05/01/2012 | | 686,080 |
| Kane County IL School District No. 101 GO Bonds (Batavia Building) (FSA) (NR/Aaa) |
| 1,075,000 | | 7.88 | | | 12/30/2007 | | 1,279,605 |
| Metropolitan Pier & Exposition Authority IL Dedicated State Tax Revenue Bonds (Prerefunded Series A) (NR/Aaa) |
| 415,000 | | 7.25 | | | 06/15/2005 | | 442,382 |
| Metropolitan Pier & Exposition Authority IL Dedicated State Tax Revenue Bonds (Prerefunded A 2002) (AAA/Aaa) |
| 425,000 | | 7.25 | | | 06/15/2005 | | 452,795 |
| Metropolitan Pier & Exposition Authority IL Dedicated State Tax Revenue Bonds (Unrefunded Balance A 2002) (AAA/Aaa) |
| 20,000 | | 7.25 | | | 06/15/2005 | | 21,241 |
| | | | | | | |
|
| | | | | | | | 7,752,072 |
|
| | | | | | | |
Principal
Amount | | Interest
Rate | | | Maturity
Date | | Value |
| Municipal Bond Obligations – (continued) |
Indiana – 4.2% |
| Elkhart County IN Hospital Authority Revenue Bonds (NR/A1) |
| $ 390,000 | | 4.75 | % | | 08/15/2011 | | $ 404,258 |
| 500,000 | | 5.25 | | | 08/15/2018 | | 503,640 |
| Evansville-Vanderburgh County IN Building Authority Lease Rent Revenue Bonds (Jail PJ) (AMBAC) (AAA/Aaa) |
| 1,000,000 | | 5.00 | | | 07/15/2015 | | 1,054,970 |
| Kokomo Center IN School Building Corp. Revenue Bonds (First Mortgage) (AMBAC) (AAA/Aaa) |
| 1,110,000 | | 6.75 | | | 07/15/2005 | | 1,178,976 |
| Merrillville IN Multi. School Building Revenue Bonds (MBIA) (AAA/Aaa) |
| 2,500,000 | | 6.65 | | | 07/01/2006 | | 2,749,000 |
| Plymouth IN Multi. School Building Revenue Bonds (MBIA) (AAA/Aaa) |
| 1,200,000 | | 5.75 | | | 07/01/2006 | | 1,266,120 |
| | | | | | | |
|
| | | | | | | | 7,156,964 |
|
Iowa – 1.7% |
| Iowa Finance Authority Hospital Facilities Revenue Bonds (Mercy Medical Center Project) (FSA) (AAA/Aaa) |
| 760,000 | | 5.25 | | | 08/15/2007 | | 826,105 |
| Iowa Student Loan Liquidity Corp. Revenue Bonds Series E (AMT) (NR/Aaa) |
| 2,000,000 | | 5.70 | | | 06/01/2009 | | 2,171,820 |
| | | | | | | |
|
| | | | | | | | 2,997,925 |
|
Kansas – 2.9% |
Kansas Independent College Finance Authority Educational Facilities Revenue Bonds (Benedictine College Project)
(NR/NR) |
| 640,000 | | 6.25 | | | 10/01/2010 | | 692,877 |
| Lawrence KS Hospital Revenue Bonds (Refunding Lawrence Memorial Hospital) (NR/Baa1) |
| 1,015,000 | | 5.25 | | | 07/01/2011 | | 1,064,237 |
| 1,000,000 | | 5.25 | | | 07/01/2012 | | 1,041,650 |
| 1,000,000 | | 5.25 | | | 07/01/2013 | | 1,041,230 |
| Topeka KS Utilities Revenue Bonds (Refunding & Improvement Series A) (MBIA) (NR/Aaa) |
| 1,005,000 | | 6.00 | | | 08/01/2009 | | 1,143,841 |
| | | | | | | |
|
| | | | | | | | 4,983,835 |
|
Kentucky – 0.6% |
Jefferson County KY GO Bonds ( Refunding Series C)
(AA/Aa2) |
| 465,000 | | 5.38 | | | 05/15/2007 | | 502,051 |
| Jefferson County KY GO Bonds Series C (AA/Aa2) |
| 460,000 | | 5.45 | | | 05/15/2008 | | 500,816 |
| | | | | | | |
|
| | | | | | | | 1,002,867 |
|
Louisiana – 5.0% |
| Caddo Parish LA Parishwide School District GO Bonds (MBIA) (AAA/Aaa) |
| 100,000 | | 6.25 | | | 03/01/2005 | | 104,067 |
|
| | |
| 24 | | The accompanying notes are an integral part of these financial statements. |
COMMERCE NATIONAL TAX-FREE INTERMEDIATE BOND FUND
| | | | | | | |
Principal
Amount | | Interest
Rate | | | Maturity
Date | | Value |
| Municipal Bond Obligations – (continued) |
Louisiana – (continued) |
| Louisiana Local Government Environmental Facilities Community Development Authority Revenue Bonds (Capital Projects & Equipment Acquisition) (AMBAC) (AAA/Aaa) |
| $2,555,000 | | 5.25 | % | | 12/01/2018 | | $2,710,293 |
| Tangipahoa Parish LA Hospital Service District No. 1 Hospital Revenue Bonds (Refunding North Oaks Medical Center PJ-A) (A/NR) |
| 2,035,000 | | 5.00 | | | 02/01/2011 | | 2,141,756 |
| 2,275,000 | | 5.38 | | | 02/01/2015 | | 2,412,433 |
| 1,100,000 | | 5.38 | | | 02/01/2018 | | 1,154,307 |
| | | | | | | |
|
| | | | | | | | 8,522,856 |
|
Maryland – 1.7% |
| Maryland State Health & Higher Education Facilities Authority Revenue Bonds (Board of Child Care) (A/NR) |
| 450,000 | | 4.00 | | | 07/01/2006 | | 468,499 |
| 1,000,000 | | 4.50 | | | 07/01/2006 | | 1,051,600 |
| 1,250,000 | | 5.50 | | | 07/01/2013 | | 1,362,063 |
| | | | | | | |
|
| | | | | | | | 2,882,162 |
|
Massachusetts – 0.6% |
| Massachusetts Bay Transportation Authority Sales Tax Revenue Bonds Series C (AAA/Aa2) |
| 500,000 | | 5.25 | | | 07/01/2021 | | 537,620 |
| Massachusetts State Health & Educational Facilities Authority Revenue Bonds (Boston College) Series L (AA-/Aa3) |
| 10,000 | | 5.25 | | | 06/01/2013 | | 10,706 |
| Massachusetts State Health & Educational Facilities Authority Revenue Bonds (Stonehill College) Series H (NR/A3) |
| 400,000 | | 5.00 | | | 07/01/2004 | | 402,316 |
| | | | | | | |
|
| | | | | | | | 950,642 |
|
Michigan – 11.5% |
| Detroit MI Sewage Disposal Revenue Bonds Series A (MBIA) (AAA/Aaa) |
| 300,000 | | 6.00 | | | 07/01/2004 | | 302,268 |
| Genesee County MI Sewage Disposal Systems Revenue Bonds (Interceptors & Treatment Facilities) (FGIC) (AAA/Aaa) |
| 550,000 | | 4.00 | | | 05/01/2014 | | 546,865 |
| Greenville MI Public Schools GO Bonds (Q-SBLF) (MBIA) (AAA/Aaa) |
| 200,000 | | 5.75 | | | 05/01/2007 | | 202,000 |
| Lake Orion MI Community School District GO Bonds Series A (Q-SBLF) (FGIC) (AAA/Aaa) |
| 2,000,000 | | 6.00 | | | 05/01/2017 | | 2,304,180 |
| Michigan Higher Education Facilities Authority Limited Obligation Revenue Bonds (Calvin College Project) (NR/NR) |
| 500,000 | | 5.40 | | | 12/01/2011 | | 533,540 |
| 1,125,000 | | 5.55 | | | 12/01/2013 | | 1,191,521 |
| 2,720,000 | | 5.65 | | | 12/01/2014 | | 2,875,557 |
| Michigan State Hospital Finance Authority Revenue Bonds (Ascension Health Credit) Series A (MBIA) (AAA/Aaa) |
| 2,500,000 | | 5.50 | | | 11/15/2010 | | 2,760,650 |
| Michigan State Hospital Finance Authority Revenue Bonds Series A (AAA/Aa2) |
| 1,650,000 | | 6.13 | | | 11/15/2026 | | 1,917,498 |
|
| | | | | | | |
Principal
Amount | | Interest
Rate | | | Maturity
Date | | Value |
| Municipal Bond Obligations – (continued) |
Michigan – (continued) |
| Michigan State Housing Development Authority Revenue Bonds Series B (AMT) (AMBAC) (AAA/NR) |
| $1,500,000 | | 4.80 | % | | 12/01/2010 | | $ 1,549,530 |
| Newaygo MI Public Schools GO Bonds (Q-SBLF) (AA+/Aa1) |
| 750,000 | | 5.00 | | | 05/01/2011 | | 810,600 |
| 250,000 | | 5.13 | | | 05/01/2012 | | 268,520 |
| Paw Paw MI Public School District GO Bonds (School Building & Site) (Q-SBLF) (AA+/Aa1) |
| 475,000 | | 5.30 | | | 05/01/2013 | | 529,245 |
South Lyon MI Community Schools GO Bonds Series A
(Q-SBLF) (AA+/Aa1) |
| 875,000 | | 5.50 | | | 05/01/2014 | | 961,371 |
| Stockbridge MI Community Schools GO Bonds (Q-SBLF) (AA+/Aa1) |
| 665,000 | | 5.10 | | | 05/01/2012 | | 713,379 |
| Thornapple Kellogg MI School District GO Bonds (Refunding) (FSA) (Q-SBLF) (AAA/Aaa) |
| 1,130,000 | | 5.00 | | | 05/01/2021 | | 1,160,646 |
Wayne Charter County MI Airport Revenue Bonds (Detroit Metropolitan Wayne County) Series A (AMT) (MBIA)
(AAA/Aaa) |
| 1,000,000 | | 5.25 | | | 12/01/2004 | | 1,021,620 |
| | | | | | | |
|
| | | | | | | | 19,648,990 |
|
Minnesota – 1.0% | | |
| Chaska MN Electric Revenue Bonds Series A (NR/A3) |
| 1,000,000 | | 6.00 | | | 10/01/2020 | | 1,074,570 |
Minneapolis MN Revenue Bonds (Blake School Project)
(NR/A2) |
| 240,000 | | 4.40 | | | 09/01/2008 | | 253,716 |
| 320,000 | | 4.50 | | | 09/01/2009 | | 338,429 |
| Minnesota State Housing & Finance Agency Revenue Bonds Series D (AA+/Aa1) |
| 110,000 | | 5.35 | | | 01/01/2005 | | 112,072 |
| | | | | | | |
|
| | | | | | | | 1,778,787 |
|
Mississippi – 1.3% |
| Mississippi Development Bank Special Obligation Revenue Bonds (Jackson Mississippi Water & Sewer System Project) (FGIC) (AAA/Aaa) |
| 1,045,000 | | 5.25 | | | 09/01/2013 | | 1,143,606 |
| Mississippi Medical Center Educational Building Corp. Revenue Bonds (University of Mississippi Medical Center Project) (MBIA-IBC) (AAA/Aaa) |
| 1,000,000 | | 5.65 | | | 12/01/2009 | | 1,118,690 |
| | | | | | | |
|
| | | | | | | | 2,262,296 |
|
Missouri – 11.9% |
| Cape Girardeau County MO Industrial Development Authority Health Care Facilities Revenue Bonds (St. Francis Medical Center) Series A (A/NR) |
| 745,000 | | 5.25 | | | 06/01/2012 | | 790,728 |
| Howard Bend MO Levee District Special Tax Revenue Bonds (NR/NR) |
| 670,000 | | 5.30 | | | 03/01/2008 | | 713,751 |
| 600,000 | | 5.65 | | | 03/01/2013 | | 634,410 |
|
| | |
| The accompanying notes are an integral part of these financial statements. | | 25 |
COMMERCE NATIONAL TAX-FREE INTERMEDIATE BOND FUND
Statement of Investments (continued)
April 30, 2004 (Unaudited)
| | | | | | | |
Principal
Amount | | Interest
Rate | | | Maturity
Date | | Value |
| Municipal Bond Obligations – (continued) |
Missouri – (continued) |
| Jackson County MO Public Building Corp. Leasehold Revenue Bonds (Capital Improvements Project) (NR/Aa3) |
| $ 865,000 | | 5.00 | % | | 12/01/2013 | | $ 935,351 |
| 855,000 | | 5.00 | | | 12/01/2014 | | 918,894 |
Jefferson City MO School District GO Bonds Series A
(NR/Aa2) |
| 300,000 | | 6.70 | | | 03/01/2011 | | 348,192 |
| Missouri State Development Finance Board Infrastructure Facilities Revenue Bonds (Branson) Series A (BBB+/Baa1) |
| 1,000,000 | | 5.00 | | | 12/01/2005 | | 1,039,710 |
| Missouri State Development Finance Board Infrastructure Facilities Revenue Bonds (Hartman Heritage Center Phase II) (AMBAC) (AAA/Aaa) |
| 1,070,000 | | 5.00 | | | 04/01/2019 | | 1,108,820 |
| Missouri State Development Finance Board Infrastructure Facilities Revenue Bonds (Riverside-Quindaro-L-385 Project) (NR/NR) |
| 1,000,000 | | 5.60 | | | 03/01/2016 | | 1,020,290 |
| Missouri State Environmental Improvement & Energy Resources Authority Water Pollution Revenue Bonds (Refunding State Revolving Funds Program, Series A) (FSA) (NR/Aaa) |
| 940,000 | | 5.00 | | | 01/01/2017 | | 1,010,312 |
Missouri State Health & Educational Facility Authority Revenue Bonds (SSM Health Care) Series A (MBIA)
(AAA/Aaa) |
| 400,000 | | 5.00 | | | 06/01/2012 | | 426,836 |
| Missouri State Health & Educational Facility Authority Revenue Bonds (St. Lukes Health System Series A) (AAA/Aaa) |
| 1,000,000 | | 5.00 | | | 11/15/2014 | | 1,065,740 |
| Missouri State Health & Educational Facility Revenue Bonds (BJC Health Systems) Series A (NR/NR) |
| 500,000 | | 6.75 | | | 05/15/2012 | | 601,995 |
| Missouri State Health & Educational Facility Revenue Bonds (Freeman Health Systems Project) (BBB+/NR) |
| 500,000 | | 4.75 | | | 02/15/2005 | | 510,660 |
| Missouri State Health & Educational Facility Revenue Bonds (St. Anthony’s Medical Center) (A/A2) |
| 1,220,000 | | 6.25 | | | 12/01/2012 | | 1,352,297 |
| Missouri State Housing Development Commission Revenue Bonds (Multifamily Housing) Series II (FHA) (AA/NR) |
| 1,665,000 | | 4.75 | | | 12/01/2010 | | 1,742,372 |
| North Kansas City MO Hospital Revenue Bonds (North Kansas City Hospital) Series A (FSA) (AAA/Aaa) |
| 1,000,000 | | 5.00 | | | 11/15/2019 | | 1,034,460 |
| Osage Beach MO Waterworks & Sewer System Revenue Bonds (NR/NR) |
| 195,000 | | 4.85 | | | 12/01/2006 | | 208,863 |
| 225,000 | | 5.50 | | | 12/01/2014 | | 253,460 |
| 290,000 | | 5.60 | | | 12/01/2015 | | 328,381 |
| St. Charles County MO Certificates of Participation Series B (NR/A2) |
| 1,000,000 | | 5.50 | | | 05/01/2018 | | 1,040,250 |
| St. Charles County MO Industrial Development Revenue Bonds (Housing Vanderbilt Apartments) (A-/NR)~ |
| 1,400,000 | | 5.00 | | | 02/01/2009 | | 1,417,500 |
|
| | | | | | | |
Principal
Amount | | Interest
Rate | | | Maturity
Date | | Value |
| Municipal Bond Obligations – (continued) |
Missouri – (continued) |
| St. Louis MO Parking Facilities Revenue Bonds (Downtown Parking Facilities Subordinated A) (NR/NR) |
| $ 675,000 | | 5.88 | % | | 02/01/2020 | | $ 687,730 |
| St. Peters MO GO Bonds (FGIC) (NR/Aaa) |
| 650,000 | | 7.20 | | | 01/01/2008 | | 749,912 |
| 290,000 | | 7.20 | | | 01/01/2009 | | 341,988 |
| | | | | | | |
|
| | | | | | | | 20,282,902 |
|
Nevada – 0.7% |
| Nevada Housing Division Single Family Revenue Bonds Series A-2 (AMT) (FHA) (NR/Aaa) |
| 125,000 | | 4.10 | | | 10/01/2004 | | 125,895 |
| Nevada State Natural Resources GO Bonds Series C (AA/Aa2) |
| 460,000 | | 5.00 | | | 04/01/2016 | | 484,486 |
| 505,000 | | 5.00 | | | 04/01/2018 | | 526,078 |
| | | | | | | |
|
| | | | | | | | 1,136,459 |
|
New Mexico – 0.0% |
New Mexico Mortgage Finance Authority Revenue Bonds (Single Family Mortgage Program) Series A-3
(GNMA/FNMA/FHLMC) (AAA/NR) |
| 20,000 | | 6.15 | | | 09/01/2017 | | 20,991 |
|
New York – 6.1% |
| Metropolitan Transportation Authority NY Service Contract Revenue Bonds (Refunding Series A) (AA-/A3) |
| 2,000,000 | | 5.10 | | | 01/01/2021 | | 2,044,040 |
| New York GO Bonds Series J (A/A2) |
| 3,230,000 | | 5.25 | | | 08/01/2011 | | 3,457,457 |
| New York NY City Municipal Water Finance Authority Water and Sewer System Revenue Bonds Series A (AA/Aa2) |
| 700,000 | | 4.00 | | | 06/15/2011 | | 718,732 |
| New York NY City Transitional Finance Authority Revenue Bonds (Prerefunded Future Tax Series B) (AA+/Aa2) |
| 375,000 | | 6.00 | | | 11/15/2013 | | 436,586 |
| New York NY City Transitional Finance Authority Revenue Bonds (Unrefunded Future Tax Series B) (AA+/Aa2) |
| 125,000 | | 6.00 | | | 11/15/2013 | | 143,524 |
| New York NY GO Bonds Series G (A/A2) |
| 1,000,000 | | 5.63 | | | 08/01/2013 | | 1,087,420 |
| New York State Dormitory Authority Revenue Bonds (Unrefunded Balance) Series C (AA-/A3) |
| 240,000 | | 7.38 | | | 05/15/2010 | | 279,722 |
| New York State Dormitory Authority Revenue Bonds Series B (AA-/A3) |
| 540,000 | | 5.00 | | | 05/15/2008 | | 583,238 |
| New York State Urban Development Corp. Revenue Bonds (AA-/A3) |
| 1,000,000 | | 6.25 | | | 01/01/2007 | | 1,094,380 |
| North Hempstead NY (Refunding Series B) (FGIC) (AAA/Aaa) |
| 500,000 | | 6.30 | | | 04/01/2008 | | 566,480 |
| | | | | | | |
|
| | | | | | | | 10,411,579 |
|
| | |
| 26 | | The accompanying notes are an integral part of these financial statements. |
COMMERCE NATIONAL TAX-FREE INTERMEDIATE BOND FUND
| | | | | | | |
Principal
Amount | | Interest
Rate | | | Maturity
Date | | Value |
| Municipal Bond Obligations – (continued) |
North Carolina – 0.3% |
| North Carolina Housing Finance Agency Revenue Bonds (Single Family) Series TT (AMT) (AA/Aa2) |
| $ 245,000 | | 5.00 | % | | 03/01/2007 | | $ 252,188 |
| 260,000 | | 5.00 | | | 09/01/2007 | | 268,900 |
| | | | | | | |
|
| | | | | | | | 521,088 |
|
North Dakota – 0.3% |
| North Dakota State Municipal Bond Bank Revenue Bonds (State Revolving Funding Program) Series A (NR/Aaa) |
| 400,000 | | 6.00 | | | 10/01/2020 | | 455,204 |
|
Ohio – 3.3% |
| Cleveland OH GO Bonds (MBIA) (AAA/Aaa) |
| 500,000 | | 5.50 | | | 08/01/2008 | | 554,600 |
| Cuyahoga County OH GO Bonds (AA+/Aa1) |
| 165,000 | | 5.55 | | | 12/01/2020 | | 179,746 |
| Fremont OH GO Bonds (Variable Purpose) (AMBAC) (NR/Aaa) |
| 1,305,000 | | 5.00 | | | 12/15/2022 | | 1,335,185 |
| Kettering OH City School District GO Bonds (School Improvement) (FSA) (NR/Aaa) |
| 1,065,000 | | 5.00 | | | 12/01/2020 | | 1,105,960 |
| Lakota OH Local School District GO Bonds (Refunding & Improvement) (FGIC) (NR/Aaa) |
| 1,245,000 | | 5.50 | | | 12/01/2015 | | 1,400,612 |
Olentangy OH Local School District GO Bonds Series A
(AA/Aa2) |
| 1,000,000 | | 6.00 | | | 12/01/2008 | | 1,048,630 |
| | | | | | | |
|
| | | | | | | | 5,624,733 |
|
Oklahoma – 2.0% |
| Edmond OK Public Works Authority Utility Revenue Bonds (Refunding) (AMBAC) (AAA/Aaa) |
| 500,000 | | 5.60 | | | 07/01/2019 | | 542,970 |
| Tulsa County OK Public Facilities Authority Capital Improvement Revenue Bonds (AA/NR) |
| 2,530,000 | | 6.20 | | | 11/01/2014 | | 2,870,766 |
| | | | | | | |
|
| | | | | | | | 3,413,736 |
|
Oregon – 0.1% |
| Oregon State Housing & Community Services Department Revenue Bonds Series D (NR/Aa2) |
| 110,000 | | 5.55 | | | 07/01/2006 | | 113,735 |
|
Rhode Island – 0.4% |
| Rhode Island State Student Loan Revenue Bonds Series 3 (AMBAC) (NR/Aaa) |
| 180,000 | | 5.70 | | | 12/01/2012 | | 195,145 |
| 190,000 | | 5.75 | | | 12/01/2013 | | 204,159 |
| 205,000 | | 5.80 | | | 12/01/2014 | | 218,331 |
| 125,000 | | 5.90 | | | 12/01/2015 | | 132,956 |
| | | | | | | |
|
| | | | | | | | 750,591 |
|
South Carolina – 0.3% |
| Berkeley County SC GO Bonds (Refunding & Improvement) (FSA) (AAA/Aaa) |
| 445,000 | | 5.00 | | | 09/01/2014 | | 478,602 |
|
| | | | | | | |
Principal
Amount | | Interest
Rate | | | Maturity
Date | | Value |
| Municipal Bond Obligations – (continued) |
South Dakota – 3.1% |
| Hot Springs SD School District No. 023-2 GO Bonds (FSA) (AAA/Aaa) |
| $ 120,000 | | 4.80 | % | | 07/01/2009 | | $ 129,240 |
| South Dakota Housing Development Authority Revenue Bonds (AAA/Aa1) |
| 300,000 | | 4.65 | | | 05/01/2006 | | 307,851 |
| South Dakota Housing Development Authority Revenue Bonds (Homeowner Mortgage-E-1) (AAA/Aa1) |
| 600,000 | | 4.50 | | | 05/01/2004 | | 600,000 |
| 660,000 | | 4.60 | | | 05/01/2005 | | 674,302 |
| South Dakota Housing Development Authority Revenue Bonds (Homeowner Mortgage-E-1-RMKT-8/6/1998) (AAA/Aa1) |
| 780,000 | | 4.70 | | | 05/01/2006 | | 797,527 |
| 250,000 | | 5.15 | | | 05/01/2011 | | 258,977 |
| South Dakota Housing Development Authority Revenue Bonds (Homeownership Mortgage) Series D (AAA/Aa1) |
| 885,000 | | 4.70 | | | 05/01/2006 | | 908,833 |
| South Dakota Housing Development Authority Revenue Bonds (Homeownership Mortgage) Series F (Morgan Stanley Dean Witter GIC) (AAA/Aa1) |
| 200,000 | | 5.10 | | | 05/01/2006 | | 205,592 |
South Dakota State Health & Educational Facilities Authority Revenue Bonds (Rapid City Regional Hospital) (MBIA)
(AAA/Aaa) |
| 800,000 | | 5.00 | | | 09/01/2008 | | 865,728 |
| South Dakota State Health & Educational Revenue Bonds (MBIA) (AAA/Aaa) |
| 500,000 | | 5.00 | | | 09/01/2004 | | 506,145 |
| | | | | | | |
|
| | | | | | | | 5,254,195 |
|
Tennessee – 1.1% |
| Memphis TN Water Refunding Revenue Bonds (AAA/Aaa) |
| 1,000,000 | | 6.00 | | | 01/01/2006 | | 1,068,860 |
Memphis-Shelby County TN Sports Authority, Inc. Revenue Bonds (Memphis Arena Project Series A) (AMBAC)
(AAA/Aaa) |
| 700,000 | | 5.50 | | | 11/01/2011 | | 785,162 |
| | | | | | | |
|
| | | | | | | | 1,854,022 |
|
Texas – 3.9% |
| Keller TX Certificate Obligation (FGIC) (AAA/Aaa) |
| 535,000 | | 5.25 | | | 08/15/2009 | | 590,303 |
| 530,000 | | 5.25 | | | 08/15/2010 | | 585,926 |
| Mesquite TX Independent School District GO Bonds (Refunding Series A) (PSF-GTD) (AAA/NR) |
| 1,000,000 | | 5.13 | | | 08/15/2024 | | 1,011,480 |
| Midlothian TX Independent School District GO Bonds (Refunding) (PSF-GTD) (NR/Aaa) |
| 1,045,000 | | 5.13 | | | 02/15/2022 | | 1,071,522 |
| North Harris Montgomery Community College District Revenue Bonds (FGIC) (AAA/Aaa) |
| 420,000 | | 5.75 | | | 02/15/2018 | | 464,625 |
| North TX Municipal Water District Texas Regional Solid Waste Disposal System Revenue Bonds (AMBAC) (AAA/Aaa) |
| 1,690,000 | | 5.00 | | | 09/01/2020 | | 1,735,985 |
|
| | |
| The accompanying notes are an integral part of these financial statements. | | 27 |
COMMERCE NATIONAL TAX-FREE INTERMEDIATE BOND FUND
Statement of Investments (continued)
April 30, 2004 (Unaudited)
| | | | | | | |
Principal
Amount | | Interest
Rate | | | Maturity
Date | | Value |
| Municipal Bond Obligations – (continued) |
Texas – (continued) |
| San Antonio TX GO Bonds (General Improvement) (AA+/Aa2) |
| $ 10,000 | | 6.00 | % | | 02/01/2020 | | $ 11,250 |
| Texas State GO Bonds Series A (AA/Aa1) |
| 200,000 | | 5.65 | | | 10/01/2008 | | 207,896 |
| West University Place TX GO Bonds (Permanent Improvement) (FGIC) (AAA/Aaa) |
| 990,000 | | 5.25 | | | 02/01/2013 | | 1,067,042 |
| | | | | | | |
|
| | | | | | | | 6,746,029 |
|
Virginia – 3.7% |
| James City Service Authority VA Water & Sewer Revenue Bonds (FSA) (AAA/Aaa) |
| 1,135,000 | | 5.00 | | | 01/15/2015 | | 1,219,603 |
| Lynchburg VA Industrial Development Authority Educational Facilities Revenue Bonds (Lynchburg College) (BBB/NR) |
| 1,400,000 | | 5.75 | | | 09/01/2023 | | 1,415,974 |
| Metropolitan Washington DC Airports Authority Revenue Bonds (Refunding Series B) (AMT) (MBIA) (AAA/Aaa) |
| 500,000 | | 5.25 | | | 10/01/2009 | | 539,710 |
| 2,000,000 | | 5.25 | | | 10/01/2012 | | 2,124,280 |
| Richmond VA Metropolitan Authority Expressway Revenue Bonds (Refunding) (FGIC) (AAA/Aaa) |
| 1,000,000 | | 5.25 | | | 07/15/2017 | | 1,096,950 |
| | | | | | | |
|
| | | | | | | | 6,396,517 |
|
Washington – 3.6% |
| Clark County WA Public Utility District No. 001 Generating System Revenue Bonds (FGIC) (AAA/Aaa) |
| 2,250,000 | | 6.00 | | | 01/01/2005 | | 2,318,017 |
| Port Seattle WA GO Bonds Series B (AMT) (AA+/Aa1) |
| 1,890,000 | | 6.00 | | | 12/01/2015 | | 2,082,402 |
Spokane County WA School District No. 354 GO Bonds
(A+/A2) |
| 120,000 | | 5.20 | | | 12/01/2006 | | 124,061 |
| Washington Higher Educational Facility University of Puget Sound Revenue Bonds (A+/A1) |
| 500,000 | | 5.00 | | | 10/01/2006 | | 533,590 |
| Washington State Higher Education Facilities Authority Revenue Bonds (Refunding University of Puget Sound Project) (A+/A1) |
| 1,000,000 | | 4.75 | | | 10/01/2008 | | 1,067,430 |
| | | | | | | |
|
| | | | | | | | 6,125,500 |
|
Wisconsin – 3.2% |
| Grafton WI School District GO Bonds (MBIA) (NR/Aaa) |
| 615,000 | | 5.75 | | | 04/01/2015 | | 685,239 |
Oshkosh WI Area School District GO Bonds (Refunding
Series B) (NR/A1) |
| 1,200,000 | | 4.80 | | | 03/01/2005 | | 1,233,216 |
Wisconsin Housing & Economic Development Authority Housing Revenue Bonds Series B (AMT) (AMBAC)
(AAA/Aaa) |
| 575,000 | | 5.00 | | | 11/01/2004 | | 585,678 |
|
| | | | | | | | |
Principal
Amount | | Interest
Rate | | | Maturity
Date | | Value | |
| Municipal Bond Obligations – (continued) | |
Wisconsin – (continued) | |
| Wisconsin State Certificates of Participation (Master Lease) Series D (MBIA) (AAA/Aaa) | |
| $1,395,000 | | 5.00 | % | | 03/01/2006 | | $ 1,472,060 | |
| 1,465,000 | | 4.00 | | | 03/01/2007 | | 1,530,602 | |
| | | | | | | |
|
|
| | | | | | | | 5,506,795 | |
|
|
Wyoming – 0.9% | |
| Wyoming Community Development Authority Housing Revenue Bonds Series 5 (AA/Aa2) | |
| 785,000 | | 4.80 | | | 06/01/2009 | | 812,821 | |
| Wyoming Community Development Authority Housing Revenue Bonds Series 7 (AA/Aa2) | |
| 30,000 | | 5.15 | | | 12/01/2010 | | 32,029 | |
| 660,000 | | 5.20 | | | 12/01/2011 | | 702,220 | |
| | | | | | | |
|
|
| | | | | | | | 1,547,070 | |
|
|
Puerto Rico – 2.6% | |
| Puerto Rico Commonwealth GO Bonds (Public Improvement) Series A (A-/Baa1) | |
| 1,000,000 | | 5.25 | | | 07/01/2014 | | 1,075,130 | |
| Puerto Rico Commonwealth Highway & Transportation Authority Highway Revenue Bonds Series AA (A/Baa1) | |
| 1,150,000 | | 5.00 | | | 07/01/2006 | | 1,217,896 | |
| 2,000,000 | | 5.00 | | | 07/01/2007 | | 2,149,480 | |
| | | | | | | |
|
|
| | | | | | | | 4,442,506 | |
|
|
| TOTAL MUNICIPAL BOND OBLIGATIONS | |
(Cost $162,971,129) | | $168,953,638 | |
|
|
| | |
| Short-Term Obligations# – 0.1% | |
Missouri – 0.1% | |
| Missouri State Health & Educational Facilities Authority Health Facilities Revenue Bonds (St. Francis Medical Center) Series A (Bank of America LOC) (A-1+/NR) | |
| $ 155,000 | | 1.10 | % | | 05/03/2004 | | $ 155,000 | |
|
|
| TOTAL SHORT-TERM OBLIGATIONS | |
(Cost $155,000) | | $ 155,000 | |
|
|
| | |
| Repurchase Agreement – 1.1% | |
| State Street Bank & Trust Co.^ | | | |
| $1,893,000 | | 0.75 | % | | 05/03/2004 | | $ 1,893,000 | |
Maturity Value: $1,893,118 | | | |
|
|
| TOTAL REPURCHASE AGREEMENT | |
(Cost $1,893,000) | | $ 1,893,000 | |
|
|
| TOTAL INVESTMENTS – 100.0% | | | |
(Cost $165,019,129) | | $171,001,638 | |
| Liabilities in excess of other assets | | (40,829 | ) |
|
|
| Net Assets – 100.0% | | $170,960,809 | |
|
|
| | |
| 28 | | The accompanying notes are an integral part of these financial statements. |
COMMERCE NATIONAL TAX-FREE INTERMEDIATE BOND FUND
| | |
| # | | Variable rate security. Coupon rate disclosed is that which is in effect at April 30, 2004. |
| ^ | | Repurchase agreement was entered into on April 30, 2004. At April 30, 2004, this agreement was fully collateralized by U.S. Treasury Notes. |
| ~ | | Securities with “Put” features with resetting interest rates. Maturity dates disclosed are the next interest reset date. |
| | |
| Security ratings disclosed are issued by Standard & Poor’s/Moody’s Investor Service. A description of the ratings is available in the Funds’ Statement of Additional Information. |
|
|
| | |
| Investment Abbreviations: |
| AMBAC | | —Insuredby American Municipal Bond Assurance Corp. |
| AMT | | —AlternativeMinimum Tax |
| FGIC | | —Insuredby Financial Guaranty Insurance Co. |
| FHA | | —Insuredby Federal Housing Administration |
| FHLMC | | —Insuredby Federal Home Loan Mortgage Corp. |
| FNMA | | —Insuredby Federal National Mortgage Association |
| FSA | | —Insuredby Financial Security Assurance Co. |
| GIC | | —GuarantyInsurance Co. |
| GNMA | | —Insuredby Government National Mortgage Association |
| GO | | —GeneralObligation |
| IBC | | —InsuredBond Certificates |
| LOC | | —Letterof Credit |
| MBIA | | —Insuredby Municipal Bond Investors Assurance |
| NR | | —NotRated |
| PSF-GTD | | —PermanentSchool Fund Guaranteed |
| Q-SBLF | | —QualifiedSchool Bond Loan Fund |
|
| | |
| The accompanying notes are an integral part of these financial statements. | | 29 |
COMMERCE MISSOURI TAX-FREE INTERMEDIATE BOND FUND
Missouri Tax-Free Intermediate Bond Fund
Performance Review(a) (Unaudited)
For the six months ended April 30, 2004, the Institutional Shares of the Fund had a total return of 0.51%, based on Net Asset Value (NAV). The Service Shares had a total return, without sales charge, of 0.33% for the same period based on NAV. This compares to the Lipper Intermediate Municipal Funds Index(b) six-month return of 0.42% and the Lehman 3-15 Year Blend Index(c) six-month return of 0.76%. Past performance is no guarantee of future results.
Statement of Investments
April 30, 2004 (Unaudited)
| | | | | | | |
Principal Amount | | Interest Rate | | | Maturity Date | | Value |
| Municipal Bond Obligations – 94.8% |
Michigan – 0.6% | | |
| Michigan State Hospital Finance Authority Revenue Bonds Series A (AAA/Aa2) |
| $ 500,000 | | 6.13 | % | | 11/15/2026 | | $ 581,060 |
| Michigan State Hospital Finance Authority Revenue Bonds Series A (MBIA) (AAA/Aaa) |
| 500,000 | | 5.50 | | | 11/15/2010 | | 552,130 |
| | | | | | | |
|
| | | | | | | | 1,133,190 |
|
Missouri – 90.9% | | |
| Belton MO Capital Improvement Sales Tax Revenue Bonds (MBIA) (NR/Aaa) |
| 200,000 | | 5.00 | | | 03/01/2005 | | 206,130 |
| 200,000 | | 5.00 | | | 03/01/2006 | | 211,492 |
Belton MO Certificates of Participation Series B (MBIA)
(NR/Aaa) |
| 535,000 | | 4.65 | | | 03/01/2011 | | 558,369 |
| Branson MO Reorganized School District Revenue Bonds (AMBAC) (AAA/Aaa) |
| 300,000 | | 5.50 | | | 03/01/2014 | | 335,721 |
| Cape Girardeau County MO Industrial Development Authority Health Care Facilities Revenue Bonds (St. Francis Medical Center) Series A (A/NR) |
| 1,070,000 | | 5.25 | | | 06/01/2010 | | 1,133,751 |
| 1,030,000 | | 5.25 | | | 06/01/2011 | | 1,089,091 |
| 1,000,000 | | 5.25 | | | 06/01/2013 | | 1,056,090 |
| Cape Girardeau MO Special Obligation Revenue Bonds (Refunding & Improvement) (NR/NR) |
| 490,000 | | 4.50 | | | 10/01/2005 | | 503,578 |
| 335,000 | | 4.50 | | | 10/01/2006 | | 347,438 |
| 125,000 | | 4.50 | | | 10/01/2008 | | 128,720 |
Cass County MO Certificates of Participation (FGIC)
(AAA/Aaa) |
| 1,000,000 | | 5.00 | | | 04/01/2018 | | 1,034,750 |
|
| | | | | | | |
Principal Amount | | Interest Rate | | | Maturity Date | | Value |
| Municipal Bond Obligations – (continued) |
Missouri – (continued) | | | | | |
| Citizens Memorial Hospital District Revenue Bonds (Polk County Hospital) (Refunding Series B) (NR/Aaa) |
| $ 140,000 | | 5.00 | % | | 08/01/2007 | | $ 152,139 |
| 145,000 | | 5.00 | | | 08/01/2008 | | 157,573 |
| 155,000 | | 5.00 | | | 08/01/2009 | | 168,440 |
| 160,000 | | 5.00 | | | 08/01/2010 | | 173,873 |
| 170,000 | | 5.00 | | | 08/01/2011 | | 184,741 |
| 180,000 | | 5.00 | | | 08/01/2012 | | 195,608 |
| Clay County MO Public Building Authority Leasehold Revenue Bonds Series C (FSA) (AAA/NR) |
| 40,000 | | 5.00 | | | 05/15/2009 | | 43,187 |
| Clay County MO Public School District No. 53 Direct Deposit Program GO Bonds (AA+/NR) |
| 875,000 | | 5.60 | | | 03/01/2013 | | 964,206 |
| Clay County MO Public School District No. 53 Direct Deposit Program Series B (FSA) (AAA/Aaa) |
| 1,000,000 | | 5.00 | | | 03/01/2018 | | 1,038,610 |
Clay County MO Public School District No. 53 Liberty Direct Deposit Program GO Bonds Series A (Refunding) (FSA)
(AAA/Aaa) |
| 1,000,000 | | 5.00 | | | 03/01/2018 | | 1,038,610 |
| Clay County MO Reorganized School District No. R1 Kearney Direct Deposit Program GO Bonds (AA+/Aa1) |
| 740,000 | | 5.00 | | | 03/01/2013 | | 786,028 |
| 850,000 | | 5.00 | | | 03/01/2014 | | 896,631 |
| 900,000 | | 5.00 | | | 03/01/2015 | | 945,000 |
| Clinton MO Certificates of Participation (Refunding & Improvement) (NR/NR) |
| 500,000 | | 5.00 | | | 12/01/2012 | | 508,350 |
| Columbia MO Certificates of Participation (Stephens Lake Property) (AA-/NR) |
| 1,000,000 | | 5.98 | | | 01/01/2007 | | 1,056,140 |
| Columbia MO Water & Electricity Revenue Bonds (Refunding and Improvement Series A) (AA-/A1) |
| 550,000 | | 4.70 | | | 10/01/2010 | | 579,931 |
|
| (a) | | Fund returns assume fee waivers and expense reductions and are not annualized. Returns do not reflect the deduction of taxes that a shareholder would pay on fund distributions or the redemption of fund shares. |
| (b) | | The Lipper Intermediate Municipal Funds Index is an unmanaged index consisting of funds that invest in municipal debt issues with dollar-weighted average maturities of five to ten years. The Index figures do not reflect any fees, expenses or taxes. |
| (c) | | The Lehman 3-15 Year Blend Index is an unmanaged index comprised of investment-grade municipal securities ranging from 2 to 17 years in maturity. The Index figures do not reflect any fees, expenses or taxes. |
| | |
| 30 | | The accompanying notes are an integral part of these financial statements. |
COMMERCE MISSOURI TAX-FREE INTERMEDIATE BOND FUND
| | | | | | | |
Principal Amount | | Interest Rate | | | Maturity Date | | Value |
| Municipal Bond Obligations – (continued) |
Missouri – (continued) | | | | | |
| Florissant MO Certificates of Participation (FGIC) (NR/Aaa) |
| $ 485,000 | | 5.00 | % | | 08/01/2015 | | $ 514,182 |
| 500,000 | | 5.00 | | | 08/01/2016 | | 526,515 |
| 450,000 | | 5.00 | | | 08/01/2017 | | 469,409 |
Franklin County MO Public Water Supply District No. 3 Certificates of Participation (Refunding Series C) (FGIC)
(NR/Aaa) |
| 395,000 | | 5.00 | | | 12/01/2015 | | 419,585 |
| Fulton MO 54 Transportation Corp. Highway Revenue Bonds (AMBAC) (AAA/NR) |
| 1,580,000 | | 5.00 | | | 09/01/2006 | | 1,687,740 |
| Grandview MO Certificates of Participation (FGIC) (NR/Aaa) |
| 1,050,000 | | 5.25 | | | 01/01/2018 | | 1,112,832 |
| Greene County MO Reorganized School District No. R8 Direct Deposit Program GO Bonds (FSA) (AAA/Aaa) |
| 520,000 | | 5.25 | | | 03/01/2016 | | 562,172 |
| 1,050,000 | | 5.25 | | | 03/01/2019 | | 1,112,023 |
| Hickman Mills MO C-1 School District Direct Deposit Program GO Bonds (FSA) (AAA/Aaa) |
| 2,300,000 | | 5.00 | | | 03/01/2019 | | 2,391,333 |
| Howard Bend MO Levee District Revenue Bonds (Refunding & Improvement) (NR/NR) |
| 575,000 | | 5.00 | | | 03/01/2020 | | 558,434 |
| Howard Bend MO Levee District Special Tax Revenue Bonds (NR/NR) |
| 635,000 | | 5.25 | | | 03/01/2007 | | 671,062 |
| 850,000 | | 5.85 | | | 03/01/2019 | | 887,349 |
| Independence MO School District Refunding Direct Deposit Program GO Bonds (FSA) (AAA/Aaa) |
| 600,000 | | 5.00 | | | 03/01/2013 | | 650,232 |
| Independence MO School District GO Bonds (AA+/Aa1) |
| 1,230,000 | | 5.25 | | | 03/01/2013 | | 1,333,775 |
| Jackson County MO Consolidated School District No. 002 Direct Deposit Program GO Bonds (AA+/NR) |
| 1,275,000 | | 5.00 | | | 03/01/2018 | | 1,320,352 |
| Jackson County MO Public Building Corp. Leasehold Revenue Bonds Series A (NR/Aa3) |
| 325,000 | | 5.25 | | | 11/01/2014 | | 350,512 |
| 340,000 | | 5.35 | | | 11/01/2015 | | 366,330 |
| Jackson County MO Reorganized School District No. 007 Lee’s Summit Direct Deposit GO Bonds (Refunding & Improvement) (FSA) (AAA/Aaa) |
| 1,070,000 | | 5.25 | | | 03/01/2015 | | 1,160,511 |
| Jackson County MO Reorganized School District No. 007 Lee’s Summit School District Certificates of Participation (Refunding) (NR/NR) |
| 200,000 | | 5.00 | | | 10/01/2006 | | 210,688 |
| 325,000 | | 5.00 | | | 10/01/2007 | | 343,294 |
| 345,000 | | 5.00 | | | 10/01/2008 | | 362,485 |
Jackson County MO Special Obligation Revenue Bonds
Series A (MBIA) (NR/Aaa) |
| 2,000,000 | | 5.50 | | | 12/01/2012 | | 2,254,500 |
| 1,000,000 | | 5.00 | | | 12/01/2016 | | 1,051,180 |
| Jefferson County MO Consolidated Public Water Supply District No. C-1 (AMBAC) (NR/Aaa) |
| 1,000,000 | | 5.25 | | | 12/01/2015 | | 1,091,450 |
|
| | | | | | | |
Principal Amount | | Interest Rate | | | Maturity Date | | Value |
| Municipal Bond Obligations – (continued) |
Missouri – (continued) | | | | | |
| Jefferson County MO Consolidated School District No. 006 Direct Deposit Program (MBIA) (AAA/Aaa) |
| $1,000,000 | | 5.00 | % | | 03/01/2018 | | $ 1,038,610 |
| 2,000,000 | | 5.00 | | | 03/01/2019 | | 2,071,880 |
| Jefferson County MO Reorganized School District No. R6 GO Bonds (Refunding Insured) (FGIC) (AAA/Aaa) |
| 530,000 | | 5.00 | | | 03/01/2011 | | 569,501 |
| Johnson County MO Hospital Revenue Bonds (Western MO Medical Center Project) (Radian) (AA/NR) |
| 330,000 | | 5.35 | | | 06/01/2009 | | 360,703 |
| 425,000 | | 5.70 | | | 06/01/2013 | | 459,786 |
| 380,000 | | 5.75 | | | 06/01/2014 | | 415,523 |
| 400,000 | | 5.80 | | | 06/01/2015 | | 436,660 |
| Kansas City MO Municipal Assistance Corp. Revenue Bonds (Refunding & Improvement Series B) (AA-/A2) |
| 300,000 | | 6.20 | | | 10/01/2007 | | 335,076 |
| Kansas City MO Water Revenue Bonds Series A (AA/Aa3) |
| 1,640,000 | | 5.75 | | | 12/01/2017 | | 1,836,538 |
| 1,735,000 | | 5.80 | | | 12/01/2018 | | 1,945,785 |
Kansas City MO Water Revenue Bonds Series C (FGIC)
(AAA/Aaa) |
| 850,000 | | 5.00 | | | 12/01/2016 | | 894,820 |
| 1,035,000 | | 5.00 | | | 12/01/2019 | | 1,071,225 |
| Lake of the Ozarks Community Board Corp. MO Bridge System Revenue Bonds (NR/Aaa) |
| 215,000 | | 6.25 | | | 12/01/2016 | | 242,462 |
| Lebanon MO Reorganized School District No. R-3 Direct Deposit Program GO Bonds (AA+/NR) |
| 270,000 | | 5.45 | | | 03/01/2014 | | 289,705 |
| Lee’s Summit MO Certificates of Participation (Park Project) (NR/Aa3) |
| 500,000 | | 4.00 | | | 07/01/2006 | | 519,480 |
| Lee’s Summit MO Water & Sewer Revenue Bonds (Refunding) (AMBAC) (NR/Aaa) |
| 1,335,000 | | 5.25 | | | 07/01/2011 | | 1,488,846 |
| 500,000 | | 5.25 | | | 07/01/2012 | | 549,955 |
| 1,135,000 | | 5.25 | | | 07/01/2015 | | 1,223,927 |
| Lee’s Summit MO Water & Sewer Revenue Bonds Combination Series A (AMBAC) (NR/Aaa) |
| 480,000 | | 5.00 | | | 07/01/2020 | | 497,198 |
| Mehlville MO School District No. R-9 Certificates of Participation (Capital Improvement Projects) (FSA) (AAA/Aaa) |
| 1,000,000 | | 5.25 | | | 09/01/2012 | | 1,105,580 |
| Missouri 210 Highway Transportation Development District Revenue Bonds Series A (Firstar Bank NA LOC) (AA-/A1) |
| 2,125,000 | | 4.80 | | | 07/15/2006 | | 2,230,995 |
| Missouri Development Finance Board Cultural Facilities Revenue Bonds (Nelson Gallery Foundation) Series A (MBIA) (AAA/Aaa) |
| 1,410,000 | | 5.25 | | | 12/01/2015 | | 1,526,043 |
Missouri Higher Education Student Loan Revenue Bonds
Series EE (NR/Aaa) |
| 500,000 | | 4.50 | | | 02/15/2010 | | 516,405 |
Missouri Higher Education Student Loan Revenue Bonds
Series RR (NR/A2) |
| 1,500,000 | | 5.85 | | | 07/15/2010 | | 1,639,635 |
|
| | |
| The accompanying notes are an integral part of these financial statements. | | 31 |
COMMERCE MISSOURI TAX-FREE INTERMEDIATE BOND FUND
Statement of Investments (continued)
April 30, 2004 (Unaudited)
| | | | | | | |
Principal Amount | | Interest Rate | | | Maturity Date | | Value |
| Municipal Bond Obligations – (continued) |
Missouri – (continued) | | | | | |
| Missouri State Certificates of Participation (Bonne Terre Prison Project) Series A (AMBAC) (AAA/Aaa) |
| $ 400,000 | | 5.05 | % | | 06/01/2016 | | $ 418,536 |
| 500,000 | | 5.13 | | | 06/01/2017 | | 521,380 |
| Missouri State Development Finance Board Infrastructure Facilities (Eastland Centre PJ-A) (A+/NR) |
| 700,000 | | 5.75 | | | 04/01/2012 | | 758,583 |
| Missouri State Development Finance Board Infrastructure Facilities (Hartman Heritage Centre PJ-A) (AMBAC) (NR/Aaa) |
| 1,430,000 | | 5.55 | | | 04/01/2012 | | 1,564,406 |
| Missouri State Development Finance Board Infrastructure Facilities Riverside Quindaro L-385 Project (NR/NR) |
| 630,000 | | 5.20 | | | 03/01/2011 | | 649,398 |
| 1,035,000 | | 5.30 | | | 03/01/2012 | | 1,060,409 |
| 680,000 | | 5.60 | | | 03/01/2016 | | 693,797 |
| Missouri State Development Finance Board Infrastructure Facilities Revenue Bonds (Branson) Series A (BBB+/Baa1) |
| 700,000 | | 5.00 | | | 12/01/2005 | | 727,797 |
| Missouri State Development Finance Board Infrastructure Facilities Revenue (Hartman Heritage Center Phase II) (AMBAC) (AAA/Aaa) |
| 300,000 | | 5.00 | | | 04/01/2013 | | 322,887 |
| 1,240,000 | | 5.00 | | | 04/01/2021 | | 1,273,331 |
| Missouri State Environmental Improvement & Energy Resources Authority Pollution Control Revenue Bonds (Electric Coop Thomas Hill) (AA/A1) |
| 100,000 | | 5.50 | | | 12/01/2004 | | 102,374 |
| 1,500,000 | | 5.50 | | | 12/01/2006 | | 1,628,595 |
| Missouri State Environmental Improvement & Energy Resources Authority Pollution Control Revenue Bonds (Tri-County Water Authority Project) (Radian) (AA/NR) |
| 445,000 | | 5.60 | | | 04/01/2011 | | 491,204 |
| 1,500,000 | | 6.00 | | | 04/01/2022 | | 1,636,545 |
| Missouri State Environmental Improvement & Energy Resources Authority Water Facilities (Refunding) (Tri-County Water Authority Project) (Radian) (AA/NR) |
| 425,000 | | 5.50 | | | 04/01/2009 | | 465,804 |
| 500,000 | | 5.55 | | | 04/01/2010 | | 543,000 |
| Missouri State Environmental Improvement & Energy Resources Authority Water Facilities Refunding (Tri-County Water Authority Project) (Radian) (AA/NR) |
| 280,000 | | 5.75 | | | 04/01/2019 | | 302,266 |
| Missouri State Environmental Improvement & Energy Resources Authority Water Pollution Control Revenue Bonds Series A (State Revolving Funds Program) (NR/Aaa) |
| 1,020,000 | | 4.90 | | | 07/01/2004 | | 1,024,641 |
| 630,000 | | 5.13 | | | 07/01/2011 | | 686,586 |
| 1,700,000 | | 5.20 | | | 07/01/2012 | | 1,843,038 |
| Missouri State Environmental Improvement & Energy Resources Authority Water Pollution Control Revenue Bonds Series B (State Revolving Funds Program) (NR/Aaa) |
| 1,790,000 | | 5.25 | | | 01/01/2011 | | 1,963,737 |
| 2,130,000 | | 5.13 | | | 01/01/2018 | | 2,257,353 |
| 725,000 | | 5.00 | | | 01/01/2022 | | 745,474 |
| Missouri State Environmental Improvement & Energy Resources Authority Water Pollution Control Revenue Bonds Series D (State Revolving Funds Program) (NR/Aaa) |
| 340,000 | | 5.13 | | | 01/01/2010 | | 366,765 |
|
| | | | | | | |
Principal Amount | | Interest Rate | | | Maturity Date | | Value |
| Municipal Bond Obligations – (continued) |
Missouri – (continued) | | | | | |
| Missouri State Environmental Improvement & Energy Resources Authority Water Pollution Control Revenue Bonds Series E (State Revolving Funds Program) (NR/Aaa) |
| $ 735,000 | | 5.75 | % | | 01/01/2009 | | $ 824,222 |
Missouri State Environmental Improvement & Energy Resources Authority Pollution Control Revenue Bonds (Refunding Associated Electric Coop) (AMBAC-TCRS)
(AAA/Aaa) |
| 300,000 | | 5.50 | | | 12/01/2005 | | 317,127 |
| Missouri State GO Bonds (Fourth State Building) Series A (AAA/Aaa) |
| 1,000,000 | | 6.00 | | | 08/01/2005 | | 1,056,660 |
| Missouri State Health & Educational Facility Authority Educational Facilities Revenue Bonds (Central Institute for the Deaf) (Radian) (AA/NR) |
| 1,000,000 | | 5.85 | | | 01/01/2022 | | 1,072,350 |
Missouri State Health & Educational Facility Authority Revenue Bonds (Lake Regional Health System Project)
(BBB+/NR) |
| 490,000 | | 5.00 | | | 02/15/2009 | | 513,696 |
| 510,000 | | 5.00 | | | 02/15/2014 | | 512,703 |
| Missouri State Health & Educational Facility Authority Revenue Bonds (St. Lukes Health System) Series A (AAA/Aaa) |
| 2,000,000 | | 5.00 | | | 11/15/2014 | | 2,131,480 |
| Missouri State Health & Educational Facility Revenue Bonds (Barnes-Jewish, Inc.) (AA/Aa2) |
| 150,000 | | 6.00 | | | 05/15/2011 | | 172,176 |
| Missouri State Health & Educational Facility Revenue Bonds (Barnes-Jewish, Inc.) Series A (AMBAC-TCRS) (AAA/Aaa) |
| 1,735,000 | | 5.15 | | | 05/15/2010 | | 1,904,162 |
| Missouri State Health & Educational Facility Revenue Bonds (BJC Health Systems) Series A (NR/NR) |
| 2,000,000 | | 6.75 | | | 05/15/2012 | | 2,407,980 |
| Missouri State Health & Educational Facility Revenue Bonds (Children’s Mercy Hospital) (A+/NR) |
| 280,000 | | 5.00 | | | 05/15/2012 | | 293,345 |
| Missouri State Health & Educational Facility Revenue Bonds (Children’s Mercy Hospital) (A+/NR) |
| 750,000 | | 5.25 | | | 05/15/2018 | | 761,985 |
| Missouri State Health & Educational Facility Revenue Bonds (Freeman Health Systems Project) (BBB+/NR) |
| 500,000 | | 4.75 | | | 02/15/2005 | | 510,660 |
| Missouri State Health & Educational Facility Revenue Bonds (SSM Health Care) Series A (AA-/NR) |
| 300,000 | | 5.00 | | | 06/01/2005 | | 310,830 |
| Missouri State Health & Educational Facility Revenue Bonds (SSM Health Care) Series A (MBIA) (AAA/Aaa) |
| 1,000,000 | | 5.50 | | | 06/01/2006 | | 1,070,890 |
| Missouri State Health & Educational Facility Revenue Bonds (St. Anthony’s Medical Center) (A/A2) |
| 550,000 | | 6.25 | | | 12/01/2008 | | 610,434 |
| 1,050,000 | | 6.25 | | | 12/01/2011 | | 1,170,855 |
| 700,000 | | 6.25 | | | 12/01/2012 | | 775,908 |
| Missouri State Health & Educational Facility Revenue Bonds (St. Louis University) (AA-/A1) |
| 1,000,000 | | 5.50 | | | 10/01/2012 | | 1,116,730 |
|
| | |
| 32 | | The accompanying notes are an integral part of these financial statements. |
COMMERCE MISSOURI TAX-FREE INTERMEDIATE BOND FUND
| | | | | | | |
Principal Amount | | Interest Rate | | | Maturity Date | | Value |
| Municipal Bond Obligations – (continued) |
Missouri – (continued) | | | | | |
| Missouri State Health & Educational Facility Revenue Bonds (St. Luke’s Episcopal-Presbyterian Hospital) (FSA) (AAA/Aaa) |
| $1,650,000 | | 4.75 | % | | 12/01/2010 | | $ 1,773,123 |
| Missouri State Health & Educational Facility Revenue Bonds (The Washington University Refunding Series A) (NR/Aa1) |
| 1,750,000 | | 4.75 | | | 08/15/2005 | | 1,822,590 |
| Missouri State Health & Educational Facility Revenue Bonds (University of Missouri-Columbia Arena Project) (AA+/Aa1) |
| 500,000 | | 5.00 | | | 11/01/2017 | | 524,490 |
| Missouri State Health & Educational Facility Revenue Bonds (St. Louis University) (AA-/A1) |
| 1,200,000 | | 5.25 | | | 10/01/2010 | | 1,304,928 |
| Missouri State Health & Educational Facility Revenue Bonds (St. Louis University) (AMBAC) (AAA/Aaa) |
| 1,000,000 | | 5.00 | | | 10/01/2010 | | 1,069,520 |
Missouri State Highways & Transportation Commission Redevelopment Revenue Bonds (Refunding Series A)
(AA/Aa2) |
| 450,000 | | 5.00 | | | 02/01/2015 | | 474,691 |
| Missouri State Highways & Transportation Commission Redevelopment Revenue Bonds Series A (AA/Aa2) |
| 875,000 | | 5.50 | | | 02/01/2009 | | 971,329 |
Missouri State Housing Development Community Mortgage Revenue Bonds (Multifamily Housing) Series II (FHA)
(AA/NR) |
| 905,000 | | 4.50 | | | 12/01/2008 | | 944,078 |
| 1,135,000 | | 4.65 | | | 12/01/2009 | | 1,183,589 |
| Missouri State Housing Development Community Mortgage Revenue Bonds (Single Family Homeowner Loan A-1) (AMT) (GNMA/FNMA) (AAA/NR) |
| 185,000 | | 5.80 | | | 09/01/2011 | | 191,129 |
| 165,000 | | 5.90 | | | 09/01/2012 | | 172,950 |
| 180,000 | | 6.00 | | | 09/01/2013 | | 185,845 |
| Missouri State Housing Development Community Mortgage Revenue Bonds (Single Family Homeowner Loan A-2) (AMT) (GNMA/FNMA) (AAA/NR) |
| 90,000 | | 5.40 | | | 03/01/2006 | | 92,635 |
| 75,000 | | 5.50 | | | 03/01/2007 | | 77,949 |
| Missouri State Housing Development Community Mortgage Revenue Bonds (Single Family Homeowner Loan B-2) (AMT) (GNMA/FNMA) (AAA/NR) |
| 115,000 | | 4.75 | | | 03/01/2007 | | 118,234 |
| 105,000 | | 5.20 | | | 03/01/2008 | | 109,207 |
| Missouri State Housing Development Community Mortgage Revenue Bonds (Single Family Homeowner Series C-2) (AMT) (GNMA/FNMA) (AAA/NR) |
| 100,000 | | 4.90 | | | 09/01/2007 | | 103,556 |
| 100,000 | | 5.00 | | | 03/01/2008 | | 103,902 |
| Missouri State Housing Development Community Mortgage Revenue Bonds (Single Family Homeowner Series E-1) (AMT) (GNMA/FNMA) (AAA/NR) |
| 145,000 | | 5.00 | | | 03/01/2012 | | 149,774 |
| 145,000 | | 5.00 | | | 09/01/2012 | | 149,773 |
| Missouri State Housing Development Community Mortgage Revenue Bonds (Single Family Homeownership-B) (GNMA/FNMA) (AAA/NR) |
| 20,000 | | 5.50 | | | 03/01/2006 | | 20,617 |
|
| | | | | | | |
Principal Amount | | Interest Rate | | | Maturity Date | | Value |
| Municipal Bond Obligations – (continued) |
Missouri – (continued) | | | | | |
| Missouri State Housing Development Community Mortgage Revenue Bonds Series C-2 (AMT) (GNMA/FNMA) (AAA/NR) |
| $ 70,000 | | 4.90 | % | | 03/01/2007 | | $ 71,390 |
Missouri State Stormwater Control GO Bonds Series A
(AAA/Aaa) |
| 300,000 | | 5.25 | | | 08/01/2016 | | 328,506 |
| Missouri State Water Pollution Control GO Bonds Series A (AAA/Aaa) |
| 475,000 | | 7.00 | | | 06/01/2010 | | 571,848 |
| Monarch-Chesterfield MO Levee District Revenue Bonds (MBIA) (AAA/Aaa) |
| 1,000,000 | | 5.45 | | | 03/01/2014 | | 1,092,340 |
New Liberty Hospital District Revenue Bonds (MBIA)
(NR/Aaa) |
| 515,000 | | 5.00 | | | 12/01/2010 | | 557,544 |
| 1,180,000 | | 5.13 | | | 12/01/2012 | | 1,262,907 |
| North Kansas City MO Hospital Revenue Bonds (North Kansas City Hospital) Series A (FSA) (AAA/Aaa) |
| 1,000,000 | | 5.00 | | | 11/15/2018 | | 1,037,600 |
| Northwest Missouri State University Revenue Bonds (Housing System) (MBIA) (NR/Aaa) |
| 2,875,000 | | 5.00 | | | 06/01/2020 | | 2,976,689 |
O’ Fallon MO Certificates of Participation (AMBAC)
(AAA/Aaa) |
| 1,000,000 | | 5.75 | | | 12/01/2004 | | 1,027,320 |
| O’ Fallon MO Certificates of Participation (MBIA) (NR/Aaa) |
| 1,000,000 | | 5.00 | | | 02/01/2022 | | 1,024,420 |
| Osage Beach MO Waterworks and Sewer System Revenue Bonds (NR/NR) |
| 220,000 | | 4.75 | | | 12/01/2011 | | 238,779 |
| 250,000 | | 5.30 | | | 12/01/2012 | | 278,695 |
| 575,000 | | 4.95 | | | 12/01/2013 | | 628,993 |
| OTC Public Building Corp. MO Leasehold Revenue Bonds (Refunding & Improvement-Ozarks College Project) (FSA) (AAA/Aaa) |
| 600,000 | | 4.80 | | | 03/01/2015 | | 623,658 |
| 740,000 | | 4.90 | | | 03/01/2016 | | 769,075 |
| Palmyra MO Certificates of Participation (Capital Improvements Project) (NR/NR) |
| 325,000 | | 3.75 | | | 08/01/2007 | | 327,057 |
| 350,000 | | 4.30 | | | 08/01/2009 | | 354,239 |
| 205,000 | | 4.70 | | | 08/01/2012 | | 206,238 |
| Pike County MO Certificates of Participation (NR/NR) |
| 720,000 | | 5.63 | | | 12/01/2019 | | 728,734 |
| 450,000 | | 5.38 | | | 12/01/2023 | | 431,325 |
| Richmond Heights MO Certificates of Partnership Capital Improvement Projects Series A Certificates of Participation (MBIA) (AAA/Aaa) |
| 540,000 | | 4.60 | | | 08/15/2005 | | 561,168 |
| 575,000 | | 4.70 | | | 02/15/2006 | | 603,411 |
| 430,000 | | 4.70 | | | 08/15/2006 | | 455,912 |
Ritenour MO Consolidated School District ( Refunding
Series A) (FGIC) (AAA/Aaa) |
| 950,000 | | 9.50 | | | 02/01/2008 | | 1,170,571 |
| Rolling Hills MO Consolidated Library District Certificates of Participation (XLCA) (AAA/NR) |
| 355,000 | | 5.00 | | | 03/01/2019 | | 365,306 |
| 745,000 | | 5.00 | | | 03/01/2020 | | 765,748 |
|
| | |
| The accompanying notes are an integral part of these financial statements. | | 33 |
COMMERCE MISSOURI TAX-FREE INTERMEDIATE BOND FUND
Statement of Investments (continued)
April 30, 2004 (Unaudited)
| | | | | | | |
Principal Amount | | Interest Rate | | | Maturity Date | | Value |
| Municipal Bond Obligations – (continued) |
Missouri – (continued) | | | | | |
| Scott County MO Public Facilities Authority Leasehold Revenue Bonds (AMBAC) (NR/Aaa) |
| $ 500,000 | | 4.85 | % | | 12/01/2008 | | $ 534,605 |
| Springfield MO Certificates of Participation (Law Enforcement Communication) (NR/Aa3) |
| 400,000 | | 5.35 | | | 06/01/2008 | | 438,020 |
| Springfield MO School District No. 12 Revenue Bonds (Refunding Series B) (FGIC) (AAA/Aaa) |
| 620,000 | | 9.50 | | | 03/01/2007 | | 738,451 |
| Springfield MO School District No. R12 GO Bonds (Refunding Direct Deposit Program Series A) (AA+/NR) |
| 500,000 | | 4.65 | | | 03/01/2006 | | 524,130 |
| St. Charles County MO Community College GO Bonds (FGIC) (NR/Aaa) |
| 890,000 | | 5.00 | | | 02/15/2016 | | 927,549 |
| St. Charles County MO Industrial Development Revenue Bonds (Housing Vanderbilt Apartments) (A-/NR)~ |
| 1,050,000 | | 5.00 | | | 02/01/2009 | | 1,063,125 |
| St. Charles MO Certificates of Participation Series B (NR/A2) |
| 500,000 | | 5.00 | | | 05/01/2009 | | 529,595 |
| 875,000 | | 5.00 | | | 05/01/2010 | | 925,479 |
| 500,000 | | 5.00 | | | 05/01/2011 | | 525,860 |
| 500,000 | | 5.50 | | | 05/01/2018 | | 520,125 |
| St. Charles MO Public Facilities Authority Leasehold Revenue Bonds (MBIA) (NR/Aaa) |
| 1,000,000 | | 4.80 | | | 02/01/2007 | | 1,067,330 |
| St. Louis County MO Certificates of Partnership (AA+/Aa2) |
| 300,000 | | 4.40 | | | 05/15/2011 | | 311,085 |
St. Louis County MO GO Bonds (Unrefunded Series A)
(AAA/Aaa) |
| 105,000 | | 5.10 | | | 02/01/2006 | | 105,319 |
| St. Louis County MO Industrial Development Authority Revenue Bonds (Eden Theological Seminary Project) (NR/NR) |
| 355,000 | | 5.45 | | | 10/15/2014 | | 361,844 |
| 500,000 | | 5.50 | | | 10/15/2018 | | 506,780 |
| St. Louis County MO Mortgage Revenue Bonds (Certificates Receipts-GNMA Collateral) Series F (AAA/NR) |
| 500,000 | | 5.20 | | | 07/01/2007 | | 542,920 |
| St. Louis County MO Regional Convention & Sports Complex Authority Revenue Bonds (Refunding Convention & Sport Facilities Project B-1) (AA+/Aa2) |
| 2,000,000 | | 5.00 | | | 08/15/2006 | | 2,133,360 |
| St. Louis County MO Rockwood School District No. R6 GO Bonds Series A (AA+/NR) |
| 1,865,000 | | 5.00 | | | 02/01/2014 | | 1,988,538 |
| St. Louis County MO School District GO Bonds Lindbergh (NR/Aa2) |
| 595,000 | | 5.30 | | | 02/15/2009 | | 613,582 |
| 200,000 | | 5.40 | | | 02/15/2010 | | 206,320 |
| St. Louis County MO School District No. 2 Direct Deposit Program GO Bonds Parkway (AA+/NR) |
| 440,000 | | 6.50 | | | 03/01/2008 | | 499,800 |
| St. Louis MO Airport Revenue Bonds (Lambert St. Louis International) Series B (AMT) (FGIC) (AAA/Aaa) |
| 1,395,000 | | 6.00 | | | 07/01/2009 | | 1,550,487 |
|
| | | | | | | |
Principal Amount | | Interest Rate | | | Maturity Date | | Value |
| Municipal Bond Obligations –��(continued) |
Missouri – (continued) | | | | | |
| St. Louis MO Board of Education GO Bonds Series B (State Aid Direct Deposit) (FGIC) (AAA/Aaa) |
| $1,500,000 | | 5.50 | % | | 04/01/2010 | | $ 1,660,515 |
| St. Louis MO GO Bonds (Public Safety) (FGIC) (AAA/Aaa) |
| 3,000,000 | | 5.13 | | | 02/15/2012 | | 3,225,420 |
| St. Louis MO Municipal Finance Corporation Leasehold Revenue Bonds (Improvement City Justice Center Series A) (AMBAC) (AAA/Aaa) |
| 600,000 | | 5.75 | | | 02/15/2011 | | 652,890 |
| St. Louis MO Municipal Finance Corporation Leasehold Revenue Bonds (Refunding City Justice Center) Series A (AMBAC) (NR/Aaa) |
| 700,000 | | 5.25 | | | 02/15/2015 | | 758,926 |
| St. Louis MO Municipal Finance Corporation Leasehold Revenue Bonds (Refunding Civil Centers Building Project Series A) (FSA) (AAA/Aaa) |
| 400,000 | | 5.00 | | | 08/01/2012 | | 434,840 |
| St. Louis MO Parking Facility Revenue Bonds (Downtown Parking Facilities Subordinated A) (NR/NR) |
| 1,200,000 | | 5.50 | | | 02/01/2015 | | 1,231,044 |
| St. Peters MO GO Bonds (Refunding) (FGIC) (NR/Aaa) |
| 995,000 | | 7.20 | | | 01/01/2008 | | 1,147,942 |
| 1,330,000 | | 7.20 | | | 01/01/2009 | | 1,568,429 |
| Sullivan MO Consolidated School District No. 2 Direct Deposit Program GO Bonds Franklin County (AA+/NR) |
| 800,000 | | 6.05 | | | 03/01/2020 | | 920,656 |
| Sullivan MO School District Building Corporation Leasehold Revenue Bonds (Radian) (AA/NR) |
| 275,000 | | 5.25 | | | 03/01/2014 | | 294,635 |
| 300,000 | | 5.25 | | | 03/01/2015 | | 319,152 |
| Taney County MO Reorganized School District No R-V GO Bonds (Hollister SD-Refunding & Improvement-MO Direct Deposit Program) (FSA) (AAA/Aaa) |
| 1,100,000 | | 5.00 | | | 03/01/2018 | | 1,142,867 |
| 1,050,000 | | 5.00 | | | 03/01/2021 | | 1,080,880 |
| Troy MO Reorganized School District No. 3 Lincoln County (Direct Deposit Program) (AA+/NR) |
| 1,000,000 | | 5.00 | | | 03/01/2017 | | 1,045,350 |
| University of Missouri Revenue Bonds (Refunding System Facilities Series B) (AA/Aa2) |
| 375,000 | | 5.38 | | | 11/01/2014 | | 413,179 |
University of Missouri Revenue Bonds (System Facilities
Series A) (AA/Aa2) |
| 250,000 | | 4.25 | | | 11/01/2005 | | 259,782 |
| Washington MO School District Direct Deposit GO Bonds (Refunding) (FSA) (AAA/Aaa) |
| 1,000,000 | | 5.25 | | | 03/01/2013 | | 1,103,040 |
| | | | | | | |
|
| | | | | | | | 163,627,812 |
|
Puerto Rico – 3.3% | | |
| Puerto Rico Commonwealth GO Bonds (Public Improvement) Series A (A-/Baa1) |
| 1,000,000 | | 5.25 | | | 07/01/2014 | | 1,075,130 |
|
| | |
| 34 | | The accompanying notes are an integral part of these financial statements. |
COMMERCE MISSOURI TAX-FREE INTERMEDIATE BOND FUND
| | | | | | | |
Principal Amount | | Interest Rate | | | Maturity Date | | Value |
| Municipal Bond Obligations – (continued) |
Puerto Rico – (continued) | | |
| Puerto Rico Commonwealth Highway & Transportation Authority Highway Revenue Bonds Series AA (A/Baa1) |
| $1,895,000 | | 5.00 | % | | 07/01/2007 | | $ 2,036,633 |
| Puerto Rico Municipal Finance Agency (Refunding Series B) (FSA) (AAA/Aaa) |
| 2,455,000 | | 5.50 | | | 08/01/2018 | | 2,707,251 |
| | | | | | | |
|
| | | | | | | | 5,819,014 |
|
| TOTAL MUNICIPAL BOND OBLIGATIONS |
(Cost $163,859,862) | | | | | $170,580,016 |
|
| |
| Short-Term Obligation# – 4.1% |
Missouri – 4.1% | | |
| Missouri State Health & Educational Facility Revenue Bonds (St. Louis University) (U.S. Bank NA SPA) (NR/VMIG1) |
| $ 90,000 | | 1.15 | % | | 05/03/2004 | | $ 90,000 |
| Missouri State Health & Educational Facility Authority Educational Facilities Revenue Bonds (Washington University) Series C (JP Morgan Chase SPA) (A-1+/VMIG1) |
| 3,600,000 | | 1.10 | | | 05/03/2004 | | 3,600,000 |
| Missouri State Health & Educational Facility Authority Health Facilities Revenue Bonds (Refunding Cox Health System) (MBIA) (Chase Manhattan Bank SPA) (A-1+/VMIG1) |
| 3,600,000 | | 1.10 | | | 05/03/2004 | | 3,600,000 |
|
| TOTAL SHORT-TERM OBLIGATIONS |
(Cost $7,290,000) | | | | | $ 7,290,000 |
|
| |
| Repurchase Agreement – 0.4% |
| State Street Bank & Trust Co.^ |
| $ 769,000 | | 0.75 | % | | 05/03/2004 | | $ 769,000 |
Maturity Value: $769,048 | | |
|
| TOTAL REPURCHASE AGREEMENT |
(Cost $769,000) | | | | | $ 769,000 |
|
| TOTAL INVESTMENTS – 99.3% |
(Cost $171,918,862) | | | | | $178,639,016 |
| Other assets in excess of liabilities – 0.7% | | 1,345,808 |
|
| Net Assets – 100.0% | | $179,984,824 |
|
| | |
| # | | Variable rate security. Coupon rate disclosed is that which is in effect at April 30, 2004. |
| ^ | | Repurchase agreement was entered into on April 30, 2004. At April 30, 2004, this agreement was fully collateralized by U.S. Treasury Notes. |
| ~ | | Securities with “Put” features with resetting interest rates. Maturity dates disclosed are the next interest reset date. |
| | |
| Security ratings disclosed are issued by Standard & Poor’s/Moody’s Investors Service. A description of the ratings is available in the Funds’ Statement of Additional Information. |
| | |
|
|
| Investment Abbreviations: |
| AMBAC | | —Insuredby American Municipal Bond Assurance Corp. |
| AMT | | —AlternativeMinimum Tax |
| FGIC | | —Insuredby Financial Guaranty Insurance Co. |
| FHA | | —Insuredby Federal Housing Administration |
| FNMA | | —Insuredby Federal National Mortgage Association |
| FSA | | —Insuredby Financial Security Assurance Co. |
| GNMA | | —Insuredby Government National Mortgage Association |
| GO | | —GeneralObligation |
| LOC | | —Letterof Credit |
| MBIA | | —Insuredby Municipal Bond Investors Assurance |
| NR | | —NotRated |
| Radian | | —Insuredby Radian Asset Assurance |
| SD | | —SchoolDistrict |
| SPA | | —Stand-byPurchase Agreement |
| TCRS | | —TransferableCustodial Receipts |
| XLCA | | —Insuredby XL Capital Assurance, Inc. |
|
| | |
| The accompanying notes are an integral part of these financial statements. | | 35 |
COMMERCE KANSAS TAX-FREE INTERMEDIATE BOND FUND
Kansas Tax-Free Intermediate Bond Fund
Performance Review(a) (Unaudited)
For the six months ended April 30, 2004, the Institutional Shares of the Fund had a total of 0.51%, based on Net Asset Value (NAV). The Service Shares had a total return, without sales charge, of 0.39% for the same period based on NAV. This compares to the Lipper Intermediate Municipal Funds Index(b) six-month return of 0.42% and the Lehman 3-15 Year Blend Index(c) six-month return of 0.76%. Past performance is no guarantee of future results.
Statement of Investments
April 30, 2004 (Unaudited)
| | | | | | | |
Principal
Amount | | Interest
Rate | | | Maturity
Date | | Value |
| Municipal Bond Obligations – 96.8% |
Kansas – 90.2% | | |
| Atchison County KS Unified School District No. 409 GO Bonds (FSA) (AAA/Aaa) |
| $ 250,000 | | 5.30 | % | | 09/01/2007 | | $ 253,528 |
| Augusta KS Electric Systems Revenue Bonds (AMBAC) (AAA/Aaa) |
| 1,000,000 | | 4.75 | | | 08/01/2017 | | 1,025,300 |
| Butler County KS Unified School District No. 402 GO Bonds (Refunding) (FSA) (AAA/NR) |
| 630,000 | | 3.00 | | | 10/01/2009 | | 618,143 |
| Crawford County KS Unified School District GO Bonds (FSA) (NR/Aaa) |
| 545,000 | | 4.60 | | | 09/01/2013 | | 563,149 |
Derby KS GO Bonds (Refunding Series B) (AMBAC)
(NR/Aaa) |
| 440,000 | | 5.00 | | | 12/01/2013 | | 471,456 |
| Derby KS GO Bonds Series A (AMBAC) (NR/Aaa) |
| 310,000 | | 4.90 | | | 12/01/2014 | | 325,996 |
| Derby KS Water Systems Revenue Bonds (Refunding & Improvement Series 2) (AMBAC) (AAA/Aaa) |
| 500,000 | | 5.60 | | | 10/01/2019 | | 563,615 |
| Dodge KS Unified School District No. 443 GO Bonds (FSA) (AAA/Aaa) |
| 210,000 | | 7.00 | | | 09/01/2004 | | 213,963 |
| 535,000 | | 7.00 | | | 09/01/2006 | | 596,808 |
| Dodge KS Unified School District No. 443 GO Bonds (Refunding) (FGIC) (NR/Aaa) |
| 1,450,000 | | 5.00 | | | 03/01/2012 | | 1,571,815 |
| Douglas County KS GO Bonds (Refunding Sales Tax Series A) (AMBAC) (NR/Aaa) |
| 1,000,000 | | 5.00 | | | 08/01/2012 | | 1,084,150 |
| Douglas County KS Unified School District No. 497 GO Bonds Series A (NR/Aa3) |
| 400,000 | | 5.00 | | | 09/01/2006 | | 425,584 |
|
| | | | | | | |
Principal
Amount | | Interest
Rate | | | Maturity
Date | | Value |
| Municipal Bond Obligations – (continued) |
Kansas – (continued) | | |
| Harvey County KS School District No. 373 GO Bonds (Refunding & Improvement) (FSA) (AAA/Aaa) |
| $ 495,000 | | 5.00 | % | | 09/01/2015 | | $ 530,363 |
| Johnson County KS Community College Revenue Bonds (Student Commons & Parking) (MBIA) (AAA/Aaa) |
| 410,000 | | 4.35 | | | 11/15/2007 | | 437,318 |
| Johnson County KS Unified School District No. 229 GO Bonds Series A (AA/Aa1) |
| 480,000 | | 4.50 | | | 10/01/2004 | | 486,600 |
| Johnson County KS Unified School District No. 231 GO Bonds (Refunding & Improvement Series A) (FGIC) (AAA/Aaa) |
| 500,000 | | 6.00 | | | 10/01/2016 | | 582,090 |
| Johnson County KS Unified School District No. 231 GO Bonds (Refunding & Improvement Series A) (FSA) (AAA/Aaa) |
| 485,000 | | 5.00 | | | 10/01/2006 | | 520,298 |
| 415,000 | | 4.50 | | | 10/01/2012 | | 432,488 |
| 1,000,000 | | 5.13 | | | 10/01/2016 | | 1,050,630 |
| Johnson County KS Unified School District No. 233 GO Bonds (Refunding Series B) (FGIC) (AAA/Aaa) |
| 500,000 | | 5.50 | | | 09/01/2017 | | 558,180 |
| Johnson County KS Unified School District No. 512 GO Bonds (Shawnee Mission) Series A (NR/Aa1) |
| 325,000 | | 6.00 | | | 10/01/2007 | | 361,341 |
| 400,000 | | 4.40 | | | 10/01/2012 | | 411,604 |
| Johnson County KS Water District No. 001 Revenue Bonds (AAA/Aaa) |
| 735,000 | | 5.00 | | | 12/01/2010 | | 807,809 |
| Johnson County KS Water District No. 001 Revenue Bonds (Refunding) (AAA/Aaa) |
| 545,000 | | 4.60 | | | 12/01/2009 | | 586,818 |
| Johnson County KS Water District No. 001 Revenue Bonds (Refunding) (ADFA GTD) (AAA/Aaa) |
| 275,000 | | 5.00 | | | 12/01/2019 | | 287,067 |
|
| (a) | | Fund returns assume fee waivers and expense reductions and are not annualized. (Returns do not reflect the deduction of taxes that a shareholder would pay on fund distributions or the redemption of fund shares. |
| (b) | | The Lipper Intermediate Municipal Funds Index is an unmanaged index consisting of funds that invest in municipal debt issues with dollar-weighted average maturities of five to ten years. The Index figures do not reflect any fees, expenses or taxes. |
| (c) | | The Lehman 3-15 Year Blend Index is an unmanaged index composed of investment-grade municipal securities ranging from 2 to 17 years in maturity. The Index figures do not reflect any fees, expenses or taxes. |
| | |
| 36 | | The accompanying notes are an integral part of these financial statements. |
COMMERCE KANSAS TAX-FREE INTERMEDIATE BOND FUND
| | | | | | | |
Principal
Amount | | Interest
Rate | | | Maturity
Date | | Value |
| Municipal Bond Obligations – (continued) |
Kansas – (continued) | | |
| Kansas Independent College Finance Authority Revenue Bonds (Benedictine College Project) (NR/NR) |
| $ 645,000 | | 6.50 | % | | 10/01/2015 | | $ 731,869 |
| Kansas State Department of Transportation Highway Revenue Bonds (AA+/Aa2) |
| 760,000 | | 6.13 | | | 09/01/2009 | | 878,818 |
| Kansas State Department of Transportation Highway Revenue Bonds (AA+/Aa2) |
| 800,000 | | 5.25 | | | 09/01/2019 | | 890,816 |
| Kansas State Department of Transportation Highway Revenue Bonds (Refunding) (AA+/Aa2) |
| 300,000 | | 5.50 | | | 09/01/2012 | | 338,820 |
| Kansas State Department of Transportation Highway Revenue Bonds Series A (AA+/Aa2) |
| 340,000 | | 5.00 | | | 09/01/2014 | | 374,969 |
Kansas State Development Finance Authority Lease Revenue Bonds (Juvenile Justice Authority) Series D (MBIA)
(AAA/Aaa) |
| 1,270,000 | | 5.25 | | | 05/01/2013 | | 1,378,039 |
| Kansas State Development Finance Authority Lease Revenue Bonds (State Capitol Project V-I-A) (FSA) (AAA/Aaa) |
| 500,000 | | 5.00 | | | 10/01/2011 | | 542,090 |
| Kansas State Development Finance Authority Revenue Bonds (Athletic Facilities) Series R (A-/NR) |
| 500,000 | | 5.00 | | | 07/01/2014 | | 520,690 |
| Kansas State Development Finance Authority Revenue Bonds (Board of Regents Rehab) Series G-2 (AMBAC) (AAA/Aaa) |
| 1,000,000 | | 5.50 | | | 10/01/2007 | | 1,101,800 |
| Kansas State Development Finance Authority Revenue Bonds (El Dorado Department of Corrections Refunding Project A1) (MBIA) (NR/Aaa) |
| 200,000 | | 5.00 | | | 08/01/2010 | | 216,526 |
| Kansas State Development Finance Authority Revenue Bonds (El Dorado Department of Corrections Refunding Project A1) (MBIA) (AAA/Aaa) |
| 400,000 | | 5.00 | | | 02/01/2012 | | 428,472 |
| Kansas State Development Finance Authority Revenue Bonds (Juvenile Justice Authority) Series D (MBIA) (AAA/Aaa) |
| 400,000 | | 5.00 | | | 05/01/2012 | | 429,216 |
| Kansas State Development Finance Authority Revenue Bonds (Kansas State Projects) Series J (AMBAC) (AAA/Aaa) |
| 2,050,000 | | 5.00 | | | 08/01/2017 | | 2,150,347 |
| Kansas State Development Finance Authority Revenue Bonds (Limited Tax Impact Program) Series V (AA/A2) |
| 1,065,000 | | 5.00 | | | 06/01/2006 | | 1,129,294 |
| Kansas State Development Finance Authority Revenue Bonds (Public Water Supply Loan-2) (MBIA-IBC) (AAA/Aaa) |
| 575,000 | | 5.25 | | | 04/01/2010 | | 627,871 |
| Kansas State Development Finance Authority Revenue Bonds (Public Water Supply Revolving Loan-2) (NR/Aa3) |
| 990,000 | | 5.25 | | | 04/01/2013 | | 1,059,043 |
| 600,000 | | 5.00 | | | 04/01/2016 | | 623,676 |
|
| | | | | | | |
Principal
Amount | | Interest
Rate | | | Maturity
Date | | Value |
| Municipal Bond Obligations – (continued) |
Kansas – (continued) | | |
Kansas State Development Finance Authority Revenue Bonds (Public Water Supply Revolving Loan-2) (AMBAC)
(AAA/Aaa) |
| $ 705,000 | | 5.50 | % | | 04/01/2014 | | $ 783,608 |
| Kansas State Development Finance Authority Revenue Bonds (Refunding-Wichita State University Housing System-P) (AMBAC) (AAA/Aaa) |
| 600,000 | | 5.00 | | | 06/01/2013 | | 645,312 |
| 630,000 | | 5.00 | | | 06/01/2014 | | 670,843 |
| 300,000 | | 5.00 | | | 06/01/2016 | | 314,811 |
| Kansas State Development Finance Authority Revenue Bonds (Skill Program) Series K-1 (AA/A2) |
| 500,000 | | 4.65 | | | 12/01/2005 | | 522,620 |
| Kansas State Development Finance Authority Revenue Bonds (State Projects Series W) (MBIA) (AAA/Aaa) |
| 320,000 | | 4.00 | | | 10/01/2011 | | 328,877 |
| Kansas State Development Finance Authority Revenue Bonds (Water Pollution Control Revolving Fund I) (AAA/Aaa) |
| 955,000 | | 5.00 | | | 11/01/2009 | | 1,046,441 |
| Kansas State Development Finance Authority Revenue Bonds (Water Pollution Control Revolving Fund II) (AAA/Aaa) |
| 1,100,000 | | 6.00 | | | 11/01/2015 | | 1,276,385 |
| 280,000 | | 5.50 | | | 05/01/2017 | | 315,554 |
| Kansas State Development Finance Authority Revenue Bonds (Water Pollution Control Revolving Loan II) (AAA/Aaa) |
| 500,000 | | 5.25 | | | 05/01/2007 | | 542,065 |
| 500,000 | | 5.40 | | | 05/01/2012 | | 545,885 |
| Lawrence KS Hospital Revenue Bonds (Lawrence Memorial Hospital) (Radian) (AA/Baa1) |
| 350,000 | | 5.75 | | | 07/01/2014 | | 386,834 |
| Lawrence KS Hospital Revenue Bonds (Refunding Lawrence Memorial Hospital) (NR/Baa1) |
| 550,000 | | 5.25 | | | 07/01/2010 | | 581,619 |
| 1,000,000 | | 5.38 | | | 07/01/2014 | | 1,048,930 |
| 700,000 | | 5.38 | | | 07/01/2015 | | 732,662 |
Leavenworth County KS GO Bonds Series A (AMBAC)
(AAA/NR) |
| 500,000 | | 5.00 | | | 12/01/2005 | | 514,390 |
| Leawood KS GO Bonds Series A (NR/Aa1) |
| 385,000 | | 4.00 | | | 09/01/2008 | | 402,552 |
| McPherson County KS Unified School District No. 400 Lindsborg GO Bonds (Refunding) (FGIC) (AAA/Aaa) |
| 775,000 | | 5.00 | | | 09/01/2011 | | 845,820 |
| 830,000 | | 5.00 | | | 09/01/2012 | | 900,450 |
| McPherson KS GO Bonds (Refunding & Improvement Series 125) (AMBAC) (AAA/Aaa) |
| 790,000 | | 5.00 | | | 08/01/2008 | | 859,970 |
| Merriam KS GO Bonds (Refunding Internal Improvement Series C) (FGIC) (NR/Aaa) |
| 485,000 | | 4.10 | | | 10/01/2007 | | 503,920 |
| Newton KS GO Bonds (Refunding & Improvement) (MBIA) (NR/Aaa) |
| 335,000 | | 4.00 | | | 09/01/2009 | | 349,342 |
| 305,000 | | 4.20 | | | 09/01/2011 | | 317,273 |
|
| | |
| The accompanying notes are an integral part of these financial statements. | | 37 |
COMMERCE KANSAS TAX-FREE INTERMEDIATE BOND FUND
Statement of Investments (continued)
April 30, 2004 (Unaudited)
| | | | | | | |
Principal
Amount | | Interest
Rate | | | Maturity
Date | | Value |
| Municipal Bond Obligations – (continued) |
Kansas – (continued) | | |
| Olathe KS Educational Facilities Revenue Bonds (Kansas Independent Series C) (NR/NR) |
| $ 500,000 | | 5.40 | % | | 10/01/2013 | | $ 516,165 |
| Osage City KS Electric Utility Systems Revenue Bonds (Refunding & Improvement) (NR/NR) |
| 1,000,000 | | 6.15 | | | 12/01/2020 | | 1,061,270 |
| Pittsburg KS GO Bonds (Refunding) (FSA) (NR/Aaa) |
| 600,000 | | 5.50 | | | 09/01/2011 | | 674,004 |
| Pratt KS Electric Utility Systems Revenue Bonds Series 2001-1 (AMBAC) (AAA/Aaa) |
| 725,000 | | 4.85 | | | 05/01/2013 | | 759,496 |
| Riley County KS GO Bonds (Refunding Series A) (AMBAC) (AAA/Aaa) |
| 645,000 | | 4.20 | | | 09/01/2004 | | 651,488 |
| 470,000 | | 4.50 | | | 09/01/2009 | | 491,813 |
| Saline County KS Unified School District No. 305 GO Bonds (Refunding & Improvement) (FSA) (NR/Aaa) |
| 300,000 | | 5.50 | | | 09/01/2016 | | 327,903 |
| Scott County KS Unified School District No. 466 GO Bonds (Refunding) (FGIC) (AAA/NR) |
| 680,000 | | 5.25 | | | 09/01/2014 | | 739,629 |
| 670,000 | | 5.25 | | | 09/01/2015 | | 726,280 |
| Sedgwick & Shawnee County KS Single Family Revenue Bonds (Mortgage Backed Securities Program Series A-1) (AMT) (GNMA) (NR/Aaa) |
| 30,000 | | 5.00 | | | 06/01/2013 | | 30,195 |
| Sedgwick & Shawnee County KS Single Family Revenue Bonds (Mortgage Backed Securities Program Series A-2) (AMT) (GNMA) (NR/Aaa) |
| 445,000 | | 5.80 | | | 06/01/2017 | | 454,812 |
| Sedgwick County KS GO Bonds Series A (AA+/Aa1) |
| 1,000,000 | | 5.50 | | | 08/01/2004 | | 1,010,540 |
| 455,000 | | 4.15 | | | 08/01/2010 | | 474,019 |
| Sedgwick County KS Public Building Revenue Bonds (Exploration Place Project) Series A (AA+/Aa1) |
| 300,000 | | 6.00 | | | 08/01/2004 | | 303,636 |
| Sedgwick County KS Unified School District No. 261 GO Bonds (FSA) (AAA/NR) |
| 490,000 | | 6.75 | | | 11/01/2005 | | 527,358 |
| Sedgwick County KS Unified School District No. 265 GO Bonds (FGIC) (NR/Aaa) |
| 00,000 | | 5.50 | | | 10/01/2009 | | 558,760 |
| Sedgwick County KS Unified School District No. 265 GO Bonds (FSA) (AAA/Aaa) |
| 250,000 | | 5.75 | | | 10/01/2008 | | 254,842 |
| Seward County KS GO Bonds (Refunding Series A) (AMBAC) (AAA/Aaa) |
| 725,000 | | 4.00 | | | 08/01/2010 | | 746,359 |
| Seward County KS Unified School District No. 480 GO Bonds (FSA) (NR/Aaa) |
| 100,000 | | 6.25 | | | 09/01/2005 | | 106,234 |
|
| | | | | | | | |
Principal
Amount | | Interest
Rate | | | Maturity
Date | | Value |
| Municipal Bond Obligations – (continued) |
Kansas – (continued) | | | |
| Shawnee County KS GO Bonds (Refunding & Improvement Series A) (NR/A1) |
| $ 500,000 | | 4.25 | % | | 09/01/2004 | | $ | 504,880 |
| 490,000 | | 5.00 | | | 09/01/2008 | | | 531,292 |
| 250,000 | | 5.25 | | | 09/01/2009 | | | 275,143 |
| 520,000 | | 4.90 | | | 09/01/2013 | | | 542,786 |
| Shawnee County KS School District No. 437 GO Bonds (AMBAC) (AAA/Aaa) |
| 500,000 | | 5.00 | | | 09/01/2004 | | | 506,310 |
| 250,000 | | 5.20 | | | 09/01/2007 | | | 253,448 |
| Shawnee County KS Unified School District No. 501 GO Bonds (NR/Aa3) |
| 1,000,000 | | 5.00 | | | 02/01/2014 | | | 1,048,290 |
| 500,000 | | 5.00 | | | 02/01/2018 | | | 519,465 |
| Topeka KS Water & Water Pollution Control Utility Revenue Bonds Series A (FGIC) (NR/Aaa) |
| 565,000 | | 5.50 | | | 08/01/2010 | | | 631,772 |
| University of Kansas Hospital Authority Health Facilites Revenue Bonds (Kansas University Health System) (A-/NR) |
| 200,000 | | 5.50 | | | 09/01/2011 | | | 213,116 |
| 1,000,000 | | 6.00 | | | 09/01/2014 | | | 1,093,650 |
| Wichita KS GO Bonds (Sales Tax) (AA/Aa2) |
| 1,000,000 | | 5.00 | | | 04/01/2014 | | | 1,062,450 |
| Wichita KS GO Bonds Series 735 (AA/Aa2) |
| 250,000 | | 4.00 | | | 09/01/2009 | | | 250,900 |
| Wichita KS GO Bonds Series 766 (AA/Aa2) |
| 455,000 | | 4.30 | | | 09/01/2010 | | | 475,247 |
| Wichita KS GO Bonds Series 774 (MBIA) (AAA/Aaa) |
| 530,000 | | 4.00 | | | 09/01/2006 | | | 555,281 |
| Wichita KS Hospital Revenue Bonds (Refunding Facilities Improvement Series XI) (A+/NR) |
| 1,500,000 | | 6.75 | | | 11/15/2014 | | | 1,684,635 |
| Wyandotte County KS Revenue Bonds (Refunding & Improvement) (MBIA) (AAA/Aaa) |
| 600,000 | | 4.40 | | | 09/01/2011 | | | 627,552 |
| Wyandotte County KS School District No. 204 GO Bonds (Refunding & Improvement Series A) (FSA) (NR/Aaa) |
| 300,000 | | 6.38 | | | 09/01/2011 | | | 353,784 |
| 785,000 | | 5.38 | | | 09/01/2015 | | | 844,723 |
| | | | | | | |
|
|
| | | | | | | | | 65,014,159 |
|
Puerto Rico – 6.6% | | | |
| Puerto Rico Commonwealth GO Bonds (MBIA) (AAA/Aaa) |
| 500,000 | | 5.38 | | | 07/01/2021 | | | 555,775 |
| Puerto Rico Commonwealth GO Bonds (Refunding & Public Improvement Series A) (MBIA) (AAA/Aaa) |
| 475,000 | | 5.50 | | | 07/01/2016 | | | 533,767 |
| Puerto Rico Commonwealth Highway & Transportation Authority Highway Revenue Bonds (Refunding Series X) (FSA-CR) (AAA/Aaa) |
| 425,000 | | 5.50 | | | 07/01/2015 | | | 478,223 |
|
| | |
| 38 | | The accompanying notes are an integral part of these financial statements. |
COMMERCE KANSAS TAX-FREE INTERMEDIATE BOND FUND
| | | | | | | | |
Principal
Amount | | Interest
Rate | | | Maturity
Date | | Value |
| Municipal Bond Obligations – (continued) |
Puerto Rico – (continued) | | | |
| Puerto Rico Commonwealth Highway & Transportation Authority Revenue Bonds Series AA (A/Baa1) |
| $1,000,000 | | 5.00 | % | | 07/01/2007 | | $ | 1,074,740 |
| Puerto Rico Commonwealth Highway & Transportation Authority Transportation Revenue Bonds Series G (FGIC) (AAA/Aaa) |
| 1,000,000 | | 5.25 | | | 07/01/2021 | | | 1,060,330 |
| Puerto Rico Municipal Finance Agency GO Bonds (Refunding Series B) (FSA) (AAA/Aaa) |
| 500,000 | | 5.50 | | | 08/01/2018 | | | 551,375 |
| Puerto Rico Municipal Finance Agency GO Bonds Series A (FSA) (AAA/Aaa) |
| 500,000 | | 5.50 | | | 08/01/2019 | | | 548,605 |
| | | | | | | |
|
|
| | | | | | | | | 4,802,815 |
|
| TOTAL MUNICIPAL BOND OBLIGATIONS |
(Cost $67,534,974) | | $ | 69,816,974 |
|
| |
| Short-Term Obligations# – 1.4% |
Kansas – 1.4% |
| Kansas State Department of Transportation Highway Revenue Bonds Series B-1 (A-1+/VMIG1) |
| $1,000,000 | | 1.05 | % | | 05/03/2004 | | $ | 1,000,000 |
|
| TOTAL SHORT-TERM OBLIGATIONS |
(Cost $1,000,000) | | $ | 1,000,000 |
|
| |
| Repurchase Agreement – 1.0% |
| State Street Bank & Trust Co.^ |
| $ 722,000 | | 0.75 | % | | 05/03/2004 | | $ | 722,000 |
Maturity Value: $722,045 |
|
| TOTAL REPURCHASE AGREEMENT |
(Cost $722,000) | | | | | $ | 722,000 |
|
| TOTAL INVESTMENTS – 99.2% |
(Cost $69,256,974) | | | | | $ | 71,538,974 |
| Other assets in excess of liabilities – 0.8% | | | 567,054 |
|
| Net Assets – 100.0% | | $ | 72,106,028 |
|
| | |
| # | | Variable rate security. Coupon rate disclosed is that which is in effect at April 30, 2004. |
| ^ | | Repurchase agreement was entered into on April 30, 2004. At April 30, 2004, this agreement was fully collateralized by U.S. Treasury Notes. |
| | |
| Security ratings disclosed are issued by Standard & Poor’s/Moody’s Investors Service. A description of the ratings is available in the Funds’ Statement of Additional Information. |
| | |
|
|
| Investment Abbreviations: |
| ADFA | | —ArkansasDevelopment Finance Authority |
| AMBAC | | —Insuredby American Municipal Bond Assurance Corp. |
| AMT | | —AlternativeMinimum Tax |
| CR | | —CustodialReceipts |
| FGIC | | —Insuredby Financial Guaranty Insurance Co. |
| FSA | | —Insuredby Financial Security Assurance Co. |
| GNMA | | —Insuredby Government National Mortgage Association |
| GO | | —GeneralObligation |
| GTD | | —Guaranteed |
| IBC | | —InsuredBond Certificates |
| MBIA | | —Insuredby Municipal Bond Investors Assurance |
| NR | | —NotRated |
|
| | |
| The accompanying notes are an integral part of these financial statements. | | 39 |
COMMERCE FUNDS
Statements of Assets and Liabilities
April 30, 2004 (Unaudited)
| | | | | | | | | | | | |
| | | |
| | | Core Equity
Fund | | | Growth Fund | | | Value Fund | |
| Assets: | |
Investments in unaffiliated securities, at value (identified cost $220,090,846, $171,210,712, $106,801,411, $74,420,712, $110,977,073, $973,037, $618,319,085, $256,090,900, $165,019,129, $171,918,862 and $69,256,974, respectively) | | $ | 252,312,157 | | | $ | 198,853,938 | | | $ | 118,098,038 | |
Investments in affiliated securities, at value (identified cost $18,134,281 for Asset Allocation Fund) | | | — | | | | — | | | | — | |
Cash | | | 876 | | | | 312 | | | | 424 | |
Foreign currencies, at value (identified cost $579,374 for International Equity Fund) | | | — | | | | — | | | | — | |
Receivables: | | | | | | | | | | | | |
Investment securities sold, at value | | | 3,879,028 | | | | — | | | | 2,454,218 | |
Dividends and interest, at value | | | 201,236 | | | | 79,018 | | | | 163,363 | |
Fund shares sold | | | 34,438 | | | | 456,240 | | | | 286,310 | |
Reimbursement from adviser | | | — | | | | — | | | | — | |
Other | | | 13,815 | | | | 5,240 | | | | 11,143 | |
|
|
Total assets | | | 256,441,550 | | | | 199,394,748 | | | | 121,013,496 | |
|
|
| | | |
| | | | | | | | | | | | | |
| Liabilities: | |
Due to custodian | | | — | | | | — | | | | — | |
Payables: | | | | | | | | | | | | |
Investment securities purchased, at value | | | 733,027 | | | | — | | | | — | |
Fund shares redeemed | | | 644,733 | | | | 1,381,115 | | | | 266,248 | |
Dividends and distributions | | | — | | | | — | | | | — | |
Advisory fees | | | 161,604 | | | | 128,864 | | | | 77,218 | |
Administrative fees | | | 28,011 | | | | 22,337 | | | | 13,387 | |
Accrued expenses | | | 71,233 | | | | 82,985 | | | | 50,331 | |
|
|
Total liabilities | | | 1,638,608 | | | | 1,615,301 | | | | 407,184 | |
|
|
| | | |
| | | | | | | | | | | | | |
| Net Assets: | |
Paid-in capital | | | 226,628,936 | | | | 217,384,849 | | | | 122,808,278 | |
Accumulated undistributed (distribution in excess of) net investment income (loss) | | | 41,569 | | | | (382,131 | ) | | | 70,077 | |
Accumulated net realized gain (loss) on investment and foreign currency related transactions | | | (4,088,874 | ) | | | (46,866,497 | ) | | | (13,568,670 | ) |
Net unrealized gain on investments and translation of assets and liabilities denominated in foreign currencies | | | 32,221,311 | | | | 27,643,226 | | | | 11,296,627 | |
|
|
NET ASSETS | | $ | 254,802,942 | | | $ | 197,779,447 | | | $ | 120,606,312 | |
|
|
| | | |
| | | | | | | | | | | | | |
| Shares Outstanding/Net Asset Value/Offering Price: | |
Total shares outstanding, no par value (unlimited number of shares authorized): | | | | | | | | | | | | |
Institutional Shares | | | 16,547,308 | | | | 9,143,330 | | | | 5,536,121 | |
Service Shares | | | 5,306 | | | | 265,003 | | | | 28,645 | |
Institutional Shares: Net asset value and maximum public offering price per share (net assets/shares outstanding) | | $ | 15.39 | | | $ | 21.03 | | | $ | 21.67 | |
Service Shares: Net asset value per share (net assets/shares outstanding) | | $ | 15.39 | | | $ | 20.65 | | | $ | 21.68 | |
Maximum public offering price per share(a) | | $ | 15.95 | | | $ | 21.40 | | | $ | 22.47 | |
|
|
| | (a) | | For the Short-Term Government, National Tax-Free Intermediate Bond, Missouri Tax-Free Intermediate Bond and Kansas Tax-Free Intermediate Bond Funds, the maximum public offering price per share is calculated as (NAV per share x 1.0204). For all other Funds, the maximum public offering price per share is calculated as (NAV per share x 1.0363). |
| | |
| 40 | | The accompanying notes are an integral part of these financial statements. |
COMMERCE FUNDS
| | | | | | | | | | | | | | | | | | | | | | | | | | | |
MidCap
Growth Fund | | | International
Equity Fund | | | Asset Allocation
Fund | | Bond Fund | | | Short-Term
Government Fund | | | National Tax-Free
Intermediate
Bond Fund | | Missouri
Tax-Free
Intermediate
Bond Fund | | Kansas
Tax-Free
Intermediate
Bond Fund | |
| | | |
| $ | 82,837,146 | | | $ | 131,582,295 | | | $ | 1,256,340 | | $ | 626,911,769 | | | $ | 256,714,059 | | | $ | 171,001,638 | | $ | 178,639,016 | | $ | 71,538,974 | |
| | | | | | | |
| | — | | | | — | | | | 19,714,467 | | | — | | | | — | | | | — | | | — | | | — | |
| | 458 | | | | 31,612 | | | | — | | | 177 | | | | 617 | | | | 859 | | | 194 | | | 450 | |
| | — | | | | 584,318 | | | | — | | | — | | | | — | | | | — | | | — | | | — | |
| | | | | | | | | | | | | | | | | | | | | | | | | | | | |
| | 991,879 | | | | 1,186,283 | | | | 22,830 | | | 895,973 | | | | — | | | | 1,136,645 | | | — | | | — | |
| | 36,981 | | | | 681,022 | | | | 34,398 | | | 6,718,210 | | | | 2,136,528 | | | | 2,666,959 | | | 2,348,715 | | | 858,683 | |
| | 218,838 | | | | 55,491 | | | | 9,766 | | | 1,158,711 | | | | 340,759 | | | | 11,154 | | | 11,000 | | | 600 | |
| | — | | | | — | | | | 9,386 | | | — | | | | 23,520 | | | | 20,984 | | | 30,819 | | | 17,622 | |
| | 3,389 | | | | 2,832 | | | | 320 | | | 9,549 | | | | 3,825 | | | | 4,242 | | | 4,360 | | | 11,028 | |
|
|
|
| | 84,088,691 | | | | 134,123,853 | | | | 21,047,507 | | | 635,694,389 | | | | 259,219,308 | | | | 174,842,481 | | | 181,034,104 | | | 72,427,357 | |
|
|
|
| | | | | | | |
| | | | | | | | | | | | | | | | | | | | | | | | | | | | |
| | | |
| | — | | | | — | | | | 22,831 | | | — | | | | — | | | | — | | | — | | | — | |
| | | | | | | | | | | | | | | | | | | | | | | | | | | | |
| | 1,007,809 | | | | 737,628 | | | | 34,434 | | | 163,452 | | | | — | | | | 3,252,010 | | | — | | | — | |
| | 144,029 | | | | 161,618 | | | | 267,045 | | | 1,242,948 | | | | 4,075,426 | | | | — | | | 406,753 | | | 55,339 | |
| | — | | | | — | | | | — | | | 1,831,633 | | | | 559,447 | | | | 490,442 | | | 502,404 | | | 201,784 | |
| | 53,622 | | | | 87,743 | | | | — | | | 262,325 | | | | 108,048 | | | | 71,741 | | | 75,247 | | | 29,910 | |
| | 9,264 | | | | 14,601 | | | | 1,461 | | | 68,205 | | | | 28,093 | | | | 18,653 | | | 19,564 | | | 7,777 | |
| | 41,826 | | | | 72,493 | | | | 28,137 | | | 195,781 | | | | 54,200 | | | | 48,826 | | | 45,312 | | | 26,519 | |
|
|
|
| | 1,256,550 | | | | 1,074,083 | | | | 353,908 | | | 3,764,344 | | | | 4,825,214 | | | | 3,881,672 | | | 1,049,280 | | | 321,329 | |
|
|
|
| | | | | | | |
| | | | | | | | | | | | | | | | | | | | | | | | | | | | |
| | | |
| | 93,955,299 | | | | 150,015,655 | | | | 18,341,685 | | | 642,300,061 | | | | 261,942,424 | | | | 164,697,537 | | | 172,984,369 | | | 69,784,395 | |
| | (243,862 | ) | | | 559,235 | | | | 27,958 | | | (3,365,511 | ) | | | (3,996,643 | ) | | | 122,570 | | | 100,561 | | | 39,971 | |
| | (19,295,730 | ) | | | (38,137,850 | ) | | | 460,467 | | | (15,597,189 | ) | | | (4,174,846 | ) | | | 158,193 | | | 179,740 | | | (338 | ) |
| | 8,416,434 | | | | 20,612,730 | | | | 1,863,489 | | | 8,592,684 | | | | 623,159 | | | | 5,982,509 | | | 6,720,154 | | | 2,282,000 | |
|
|
|
| $ | 82,832,141 | | | $ | 133,049,770 | | | $ | 20,693,599 | | $ | 631,930,045 | | | $ | 254,394,094 | | | $ | 170,960,809 | | $ | 179,984,824 | | $ | 72,106,028 | |
|
|
|
| | | | | | | |
| | | | | | | | | | | | | | | | | | | | | | | | | | | | |
| | | |
| | 3,236,469 | | | | 7,122,655 | | | | 980,671 | | | 34,097,043 | | | | 13,832,124 | | | | 8,911,075 | | | 9,196,420 | | | 3,698,125 | |
| | 65,609 | | | | 25,636 | | | | 21,661 | | | 53,391 | | | | 114,785 | | | | 260 | | | 62,965 | | | 112,058 | |
| $ | 25.10 | | | $ | 18.61 | | | $ | 20.65 | | $ | 18.50 | | | $ | 18.24 | | | $ | 19.18 | | $ | 19.44 | | $ | 18.92 | |
| $ | 24.55 | | | $ | 18.44 | | | $ | 20.64 | | $ | 18.52 | | | $ | 18.25 | | | $ | 19.19 | | $ | 19.45 | | $ | 18.92 | |
| $ | 25.44 | | | $ | 19.11 | | | $ | 21.39 | | $ | 19.19 | | | $ | 18.62 | | | $ | 19.58 | | $ | 19.85 | | $ | 19.31 | |
|
|
|
41
COMMERCE FUNDS
Statements of Operations
For the Six Months Ended April 30, 2004 (Unaudited)
| | | | | | | | | | | | |
| | | |
| | | Core Equity
Fund | | | Growth Fund | | | Value Fund | |
| Investment Income: | |
Interest | | $ | 5,263 | | | $ | 9,427 | | | $ | 5,161 | |
Dividends(a) | | | 1,763,144 | | | | 782,193 | | | | 1,235,195 | |
|
|
Total income | | | 1,768,407 | | | | 791,620 | | | | 1,240,356 | |
|
|
| | | |
| | | | | | | | | | | | | |
| Expenses: | |
Advisory fees | | | 982,490 | | | | 794,445 | | | | 471,686 | |
Administration fees | | | 196,497 | | | | 158,890 | | | | 94,337 | |
Shareowner servicing fees | | | 52,040 | | | | 79,023 | | | | 49,435 | |
Custody and accounting fees | | | 33,983 | | | | 30,982 | | | | 38,982 | |
Transfer Agent fees | | | 34,753 | | | | 61,516 | | | | 24,851 | |
Professional fees | | | 32,243 | | | | 28,136 | | | | 18,980 | |
Registration fees | | | 13,398 | | | | 13,779 | | | | 13,665 | |
Printing fees | | | 10,990 | | | | 9,782 | | | | 6,235 | |
Trustee fees | | | 3,864 | | | | 3,449 | | | | 2,207 | |
Distribution fees — Service Shares | | | 91 | | | | 7,044 | | | | 777 | |
Other | | | 8,882 | | | | 7,898 | | | | 5,885 | |
|
|
Total expenses | | | 1,369,231 | | | | 1,194,944 | | | | 727,040 | |
|
|
Less — expense reductions(b) | | | (26,216 | ) | | | (21,193 | ) | | | (12,582 | ) |
|
|
Net expenses | | | 1,343,015 | | | | 1,173,751 | | | | 714,458 | |
|
|
| NET INVESTMENT INCOME (LOSS) | | | 425,392 | | | | (382,131 | ) | | | 525,898 | |
|
|
| | | |
| | | | | | | | | | | | | |
| Realized and Unrealized Gain (Loss) on Investment and Foreign Currency Transactions: | |
Net realized gain (loss) from: | | | | | | | | | | | | |
Investment transactions | | | 17,821,577 | | | | 9,320,246 | | | | 2,387,349 | |
Foreign currency related transactions | | | — | | | | — | | | | — | |
Net change in unrealized gain (loss) on: | | | | | | | | | | | | |
Investments | | | (1,211,989 | ) | | | (3,047,506 | ) | | | 2,285,383 | |
Translation of assets and liabilities denominated in foreign currencies | | | — | | | | — | | | | — | |
|
|
Net realized and unrealized gain (loss) on investment and foreign currency transactions | | | 16,609,588 | | | | 6,272,740 | | | | 4,672,732 | |
|
|
| NET INCREASE IN NET ASSETS RESULTING FROM OPERATIONS | | $ | 17,034,980 | | | $ | 5,890,609 | | | $ | 5,198,630 | |
|
|
| | (a) | | Amount is net of $205,948 for the International Equity Fund in foreign withholding taxes. |
| | (b) | | Expense reductions include waiver, custody credits and reimbursements. |
| | |
| 42 | | The accompanying notes are an integral part of these financial statements. |
COMMERCE FUNDS
| | | | | | | | | | | | | | | | | | | | | | | | | | | | | | |
MidCap
Growth Fund | | | International
Equity Fund | | | Asset Allocation
Fund | | | Bond Fund | | | Short-Term
Government
Fund | | | National
Tax-Free
Intermediate
Bond Fund | | | Missouri
Tax-Free
Intermediate
Bond Fund | | | Kansas
Tax-Free
Intermediate
Bond Fund | |
| | | |
| $ | 3,669 | | | $ | 273 | | | $ | — | | | $ | 16,234,207 | | | $ | 4,419,949 | | | $ | 3,773,033 | | | $ | 3,930,850 | | | $ | 1,516,141 | |
| | 269,955 | | | | 1,595,159 | | | | 260,170 | | | | — | | | | — | | | | — | | | | — | | | | — | |
|
|
|
| | 273,624 | | | | 1,595,432 | | | | 260,170 | | | | 16,234,207 | | | | 4,419,949 | | | | 3,773,033 | | | | 3,930,850 | | | | 1,516,141 | |
|
|
|
| | | | | | | |
| | | | | | | | | | | | | | | | | | | | | | | | | | | | | | | |
| | | |
| | 318,098 | | | | 1,106,563 | | | | 22,160 | | | | 1,618,480 | | | | 658,508 | | | | 438,768 | | | | 463,765 | | | | 181,032 | |
| | 63,619 | | | | 110,656 | | | | 16,620 | | | | 485,544 | | | | 197,552 | | | | 131,631 | | | | 139,130 | | | | 54,310 | |
| | 39,259 | | | | 38,159 | | | | 15,997 | | | | 279,535 | | | | 107,116 | | | | 57,783 | | | | 54,815 | | | | 18,740 | |
| | 35,895 | | | | 171,133 | | | | 21,509 | | | | 66,891 | | | | 42,401 | | | | 46,638 | | | | 48,945 | | | | 37,253 | |
| | 29,093 | | | | 27,150 | | | | 9,187 | | | | 100,335 | | | | 32,446 | | | | 22,604 | | | | 22,358 | | | | 9,731 | |
| | 14,960 | | | | 23,816 | | | | 11,259 | | | | 69,871 | | | | 23,093 | | | | 21,330 | | | | 20,796 | | | | 12,459 | |
| | 12,856 | | | | 14,695 | | | | 23,179 | | | | 13,375 | | | | 16,306 | | | | 4,314 | | | | 4,855 | | | | 13,905 | |
| | 3,914 | | | | 7,503 | | | | 1,073 | | | | 36,694 | | | | 10,310 | | | | 8,965 | | | | 8,353 | | | | 3,312 | |
| | 1,380 | | | | 2,689 | | | | 286 | | | | 8,936 | | | | 2,980 | | | | 2,290 | | | | 2,199 | | | | 858 | |
| | 1,979 | | | | 575 | | | | 566 | | | | 1,340 | | | | 3,024 | | | | 6 | | | | 1,588 | | | | 2,708 | |
| | 5,064 | | | | 6,210 | | | | 1,834 | | | | 15,393 | | | | 6,341 | | | | 4,859 | | | | 4,860 | | | | 3,285 | |
|
|
|
| | 526,117 | | | | 1,509,149 | | | | 123,670 | | | | 2,696,394 | | | | 1,100,077 | | | | 739,188 | | | | 771,664 | | | | 337,593 | |
|
|
|
| | (8,631 | ) | | | (550,182 | ) | | | (84,325 | ) | | | (67,575 | ) | | | (201,727 | ) | | | (124,983 | ) | | | (167,312 | ) | | | (99,547 | ) |
|
|
|
| | 517,486 | | | | 958,967 | | | | 39,345 | | | | 2,628,819 | | | | 898,350 | | | | 614,205 | | | | 604,352 | | | | 238,046 | |
|
|
|
| | (243,862 | ) | | | 636,465 | | | | 220,825 | | | | 13,605,388 | | | | 3,521,599 | | | | 3,158,828 | | | | 3,326,498 | | | | 1,278,095 | |
|
|
|
| | | | | | | |
| | | | | | | | | | | | | | | | | | | | | | | | | | | | | | | |
| | | |
| | | | | | | | | | | | | | | | | | | | | | | | | | | | | | | |
| | 9,806,277 | | | | 459,001 | | | | 501,021 | | | | (4,958,850 | ) | | | (259,759 | ) | | | 158,804 | | | | 180,714 | | | | (39 | ) |
| | — | | | | (12,340 | ) | | | — | | | | — | | | | — | | | | — | | | | — | | | | — | |
| | | | | | | | | | | | | | | | | | | | | | | | | | | | | | | |
| | (4,445,060 | ) | | | 15,511,591 | | | | 134,801 | | | | (902,685 | ) | | | (1,729,547 | ) | | | (2,424,851 | ) | | | (2,545,519 | ) | | | (935,265 | ) |
| | — | | | | (6,521 | ) | | | — | | | | — | | | | — | | | | — | | | | — | | | | — | |
|
|
|
| | 5,361,217 | | | | 15,951,731 | | | | 635,822 | | | | (5,861,535 | ) | | | (1,989,306 | ) | | | (2,266,047 | ) | | | (2,364,805 | ) | | | (935,304 | ) |
|
|
|
| $ | 5,117,355 | | | $ | 16,588,196 | | | $ | 856,647 | | | $ | 7,743,853 | | | $ | 1,532,293 | | | $ | 892,781 | | | $ | 961,693 | | | $ | 342,791 | |
|
|
|
43
COMMERCE FUNDS
Statements of Changes in Net Assets
For the Six Months Ended April 30, 2004 (Unaudited)
| | | | | | | | | | | | |
| | | |
| | | Core Equity
Fund | | | Growth Fund | | | Value Fund | |
| From Operations: | |
Net investment income (loss) | | $ | 425,392 | | | $ | (382,131 | ) | | $ | 525,898 | |
Net realized gain (loss) from investment and foreign currency related transactions | | | 17,821,577 | | | | 9,320,246 | | | | 2,387,349 | |
Net change in unrealized gain (loss) on investments and translation of assets and liabilities denominated in foreign currencies | | | (1,211,989 | ) | | | (3,047,506 | ) | | | 2,285,383 | |
|
|
Net increase in net assets resulting from operations | | | 17,034,980 | | | | 5,890,609 | | | | 5,198,630 | |
|
|
| | | |
| | | | | | | | | | | | | |
| Distributions to Shareholders: | |
From net investment income | | | | | | | | | | | | |
Institutional Shares | | | (539,113 | ) | | | — | | | | (620,043 | ) |
Service Shares | | | (80 | ) | | | — | | | | (2,303 | ) |
From net realized gains on investment transactions | | | | | | | | | | | | |
Institutional Shares | | | — | | | | — | | | | — | |
Service Shares | | | — | | | | — | | | | — | |
|
|
Total distributions to shareholders | | | (539,193 | ) | | | — | | | | (622,346 | ) |
|
|
| | | |
| | | | | | | | | | | | | |
| From Share Transactions: | |
Proceeds from sales of shares | | | 7,587,978 | | | | 15,406,506 | | | | 12,346,457 | |
Reinvestment of dividends and distributions | | | 14,725 | | | | — | | | | 315,982 | |
Cost of shares redeemed(a) | | | (32,295,927 | ) | | | (33,570,047 | ) | | | (20,097,175 | ) |
|
|
Net increase (decrease) in net assets resulting from share transactions | | | (24,693,224 | ) | | | (18,163,541 | ) | | | (7,434,736 | ) |
|
|
| TOTAL INCREASE (DECREASE) | | | (8,197,437 | ) | | | (12,272,932 | ) | | | (2,858,452 | ) |
|
|
| | | |
| | | | | | | | | | | | | |
| Net Assets: | |
Beginning of period | | | 263,000,379 | | | | 210,052,379 | | | | 123,464,764 | |
|
|
End of period | | $ | 254,802,942 | | | $ | 197,779,447 | | | $ | 120,606,312 | |
|
|
Accumulated undistributed (distribution in excess of) net investment income (loss) | | $ | 41,569 | | | $ | (382,131 | ) | | $ | 70,077 | |
|
|
| (a) | | Net of $260 of redemption fees remitted to the International Equity Fund. |
| | |
| 44 | | The accompanying notes are an integral part of these financial statements. |
COMMERCE FUNDS
| | | | | | | | | | | | | | | | | | | | | | | | | | | | | | |
MidCap
Growth Fund | | | International
Equity Fund | | | Asset Allocation
Fund | | | Bond Fund | | | Short-Term
Government
Fund | | | National
Tax-Free
Intermediate
Bond Fund | | | Missouri
Tax-Free
Intermediate
Bond Fund | | | Kansas
Tax-Free
Intermediate
Bond Fund | |
| | | |
| $ | (243,862 | ) | | $ | 636,465 | | | $ | 220,825 | | | $ | 13,605,388 | | | $ | 3,521,599 | | | $ | 3,158,828 | | | $ | 3,326,498 | | | $ | 1,278,095 | |
| | 9,806,277 | | | | 446,661 | | | | 501,021 | | | | (4,958,850 | ) | | | (259,759 | ) | | | 158,804 | | | | 180,714 | | | | (39 | ) |
| | (4,445,060 | ) | | | 15,505,070 | | | | 134,801 | | | | (902,685 | ) | | | (1,729,547 | ) | | | (2,424,851 | ) | | | (2,545,519 | ) | | | (935,265 | ) |
|
|
|
| | 5,117,355 | | | | 16,588,196 | | | | 856,647 | | | | 7,743,853 | | | | 1,532,293 | | | | 892,781 | | | | 961,693 | | | | 342,791 | |
|
|
|
| | | | | | | |
| | | | | | | | | | | | | | | | | | | | | | | | | | | | | | | |
| | | |
| | | | | | | | | | | | | | | | | | | | | | | | | | | | | | | |
| | — | | | | (2,065,677 | ) | | | (248,297 | ) | | | (15,297,945 | ) | | | (5,549,355 | ) | | | (3,165,170 | ) | | | (3,297,749 | ) | | | (1,236,457 | ) |
| | — | | | | (5,068 | ) | | | (4,575 | ) | | | (24,090 | ) | | | (49,212 | ) | | | (85 | ) | | | (21,130 | ) | | | (35,388 | ) |
| | | | | | | | | | | | | | | | | | | | | | | | | | | | | | | |
| | — | | | | — | | | | (331,743 | ) | | | — | | | | — | | | | (2,697,784 | ) | | | (375,629 | ) | | | (119,961 | ) |
| | — | | | | — | | | | (6,969 | ) | | | — | | | | — | | | | (77 | ) | | | (2,559 | ) | | | (3,747 | ) |
|
|
|
| | — | | | | (2,070,745 | ) | | | (591,584 | ) | | | (15,322,035 | ) | | | (5,598,567 | ) | | | (5,863,116 | ) | | | (3,697,067 | ) | | | (1,395,553 | ) |
|
|
|
| | | | | | | |
| | | | | | | | | | | | | | | | | | | | | | | | | | | | | | | |
| | | |
| | 10,644,253 | | | | 14,598,611 | | | | 1,981,722 | | | | 52,743,877 | | | | 52,318,102 | | | | 18,737,064 | | | | 15,120,494 | | | | 9,132,481 | |
| | — | | | | 1,008,392 | | | | 575,425 | | | | 3,942,949 | | | | 1,565,355 | | | | 392,534 | | | | 333,191 | | | | 72,016 | |
| | (13,147,246 | ) | | | (45,437,628 | ) | | | (3,366,498 | ) | | | (69,246,987 | ) | | | (58,226,549 | ) | | | (18,630,172 | ) | | | (17,225,848 | ) | | | (7,372,157 | ) |
|
|
|
| | (2,502,993 | ) | | | (29,830,625 | ) | | | (809,351 | ) | | | (12,560,161 | ) | | | (4,343,092 | ) | | | 499,426 | | | | (1,772,163 | ) | | | 1,832,340 | |
|
|
|
| | 2,614,362 | | | | (15,313,174 | ) | | | (544,288 | ) | | | (20,138,343 | ) | | | (8,409,366 | ) | | | (4,470,909 | ) | | | (4,507,537 | ) | | | 779,578 | |
|
|
|
| | | | | | | |
| | | | | | | | | | | | | | | | | | | | | | | | | | | | | | | |
| | | |
| | 80,217,779 | | | | 148,362,944 | | | | 21,237,887 | | | | 652,068,388 | | | | 262,803,460 | | | | 175,431,718 | | | | 184,492,361 | | | | 71,326,450 | |
|
|
|
| $ | 82,832,141 | | | $ | 133,049,770 | | | $ | 20,693,599 | | | $ | 631,930,045 | | | $ | 254,394,094 | | | $ | 170,960,809 | | | $ | 179,984,824 | | | $ | 72,106,028 | |
|
|
|
| $ | (243,862 | ) | | $ | 559,235 | | | $ | 27,958 | | | $ | (3,365,511 | ) | | $ | (3,996,643 | ) | | $ | 122,570 | | | $ | 100,561 | | | $ | 39,971 | |
|
|
|
45
COMMERCE FUNDS
Statements of Changes in Net Assets
For the Year Ended October 31, 2003
| | | | | | | | | | | | |
| | | |
| | | Core Equity
Fund | | | Growth Fund | | | Value Fund | |
| From Operations: | |
Net investment income (loss) | | $ | 1,734,368 | | | $ | (467,964 | ) | | $ | 1,445,476 | |
Net realized gain (loss) from investment and foreign currency related transactions | | | (1,294,787 | ) | | | 2,013,489 | | | | (2,024,026 | ) |
Net change in unrealized gain (loss) on investments and translation of assets and liabilities denominated in foreign currencies | | | 36,474,356 | | | | 29,243,434 | | | | 18,692,770 | |
|
|
Net increase in net assets resulting from operations | | | 36,913,937 | | | | 30,788,959 | | | | 18,114,220 | |
|
|
| | | |
| | | | | | | | | | | | | |
| Distributions to Shareholders: | |
From net investment income | | | | | | | | | | | | |
Institutional Shares | | | (1,693,873 | ) | | | — | | | | (1,424,217 | ) |
Service Shares | | | (223 | ) | | | — | | | | (5,737 | ) |
From net realized gains on investment transactions | | | | | | | | | | | | |
Institutional Shares | | | — | | | | — | | | | — | |
Service Shares | | | — | | | | — | | | | — | |
|
|
Total distributions to shareholders | | | (1,694,096 | ) | | | — | | | | (1,429,954 | ) |
|
|
| | | |
| | | | | | | | | | | | | |
| From share transactions: | |
Proceeds from sales of shares | | | 29,862,194 | | | | 46,867,623 | | | | 29,603,642 | |
Reinvestment of dividends and distributions | | | 43,757 | | | | — | | | | 777,508 | |
Cost of shares redeemed(a) | | | (45,734,693 | ) | | | (45,696,561 | ) | | | (26,216,899 | ) |
|
|
Net increase (decrease) in net assets resulting from share transactions | | | (15,828,742 | ) | | | 1,171,062 | | | | 4,164,251 | |
|
|
| TOTAL INCREASE (DECREASE) | | | 19,391,099 | | | | 31,960,021 | | | | 20,848,517 | |
|
|
| | | |
| | | | | | | | | | | | | |
| Net Assets: | |
Beginning of year | | | 243,609,280 | | | | 178,092,358 | | | | 102,616,247 | |
|
|
End of year | | $ | 263,000,379 | | | $ | 210,052,379 | | | $ | 123,464,764 | |
|
|
Accumulated undistributed (distribution in excess of) net investment income | | $ | 155,370 | | | $ | — | | | $ | 166,525 | |
|
|
| | (a) | | Net of $130,038 of redemption fees remitted to the International Equity Fund. |
| | |
| 46 | | The accompanying notes are an integral part of these financial statements. |
COMMERCE FUNDS
| | | | | | | | | | | | | | | | | | | | | | | | | | | | | | |
MidCap
Growth Fund | | | International
Equity Fund | | | Asset Allocation
Fund | | | Bond Fund | | | Short-Term
Government
Fund | | | National
Tax-Free
Intermediate
Bond Fund | | | Missouri
Tax-Free
Intermediate
Bond Fund | | | Kansas
Tax-Free
Intermediate
Bond Fund | |
| | | |
| $ | (478,618 | ) | | $ | 1,982,913 | | | $ | 405,795 | | | $ | 34,116,459 | | | $ | 6,358,518 | | | $ | 6,367,398 | | | $ | 6,513,753 | | | $ | 2,373,320 | |
| | 4,608,809 | | | | (9,048,448 | ) | | | 314,332 | | | | 4,700,076 | | | | (650,800 | ) | | | 2,702,255 | | | | 361,512 | | | | 122,215 | |
| | | | | | | |
| | 13,730,532 | | | | 28,962,463 | | | | 1,718,150 | | | | (12,653,799 | ) | | | (2,866,422 | ) | | | (930,444 | ) | | | 795,924 | | | | 387,378 | |
|
|
|
| | 17,860,723 | | | | 21,896,928 | | | | 2,438,277 | | | | 26,162,736 | | | | 2,841,296 | | | | 8,139,209 | | | | 7,671,189 | | | | 2,882,913 | |
|
|
|
| | | | | | | |
| | | | | | | | | | | | | | | | | | | | | | | | | | | | | | | |
| | | |
| | | | | | | | | | | | | | | | | | | | | | | | | | | | | | | |
| | — | | | | (478,887 | ) | | | (371,372 | ) | | | (38,191,269 | ) | | | (9,660,308 | ) | | | (6,343,327 | ) | | | (6,450,414 | ) | | | (2,288,743 | ) |
| | — | | | | (401 | ) | | | (7,230 | ) | | | (67,044 | ) | | | (104,196 | ) | | | (345 | ) | | | (37,164 | ) | | | (72,228 | ) |
| | | | | | | | | | | | | | | | | | | | | | | | | | | | | | | |
| | — | | | | — | | | | (15,604 | ) | | | — | | | | — | | | | (1,365,671 | ) | | | (854,052 | ) | | | (85,826 | ) |
| | — | | | | — | | | | (357 | ) | | | — | | | | — | | | | (179 | ) | | | (5,130 | ) | | | (3,061 | ) |
|
|
|
| | — | | | | (479,288 | ) | | | (394,563 | ) | | | (38,258,313 | ) | | | (9,764,504 | ) | | | (7,709,522 | ) | | | (7,346,760 | ) | | | (2,449,858 | ) |
|
|
|
| | | | | | | |
| | | | | | | | | | | | | | | | | | | | | | | | | | | | | | | |
| | | |
| | 22,858,519 | | | | 62,827,309 | | | | 5,491,127 | | | | 98,712,974 | | | | 152,657,375 | | | | 30,544,504 | | | | 46,824,296 | | | | 18,396,100 | |
| | — | | | | 268,113 | | | | 382,575 | | | | 10,230,449 | | | | 3,092,173 | | | | 493,491 | | | | 652,264 | | | | 106,080 | |
| | (26,709,569 | ) | | | (48,878,808 | ) | | | (5,341,460 | ) | | | (174,170,993 | ) | | | (72,427,392 | ) | | | (30,117,713 | ) | | | (28,566,752 | ) | | | (12,808,332 | ) |
|
|
|
| | (3,851,050 | ) | | | 14,216,614 | | | | 532,242 | | | | (65,227,570 | ) | | | 83,322,156 | | | | 920,282 | | | | 18,909,808 | | | | 5,693,848 | |
|
|
|
| | 14,009,673 | | | | 35,634,254 | | | | 2,575,956 | | | | (77,323,147 | ) | | | 76,398,948 | | | | 1,349,969 | | | | 19,234,237 | | | | 6,126,903 | |
|
|
|
| | | | | | | |
| | | | | | | | | | | | | | | | | | | | | | | | | | | | | | | |
| | | |
| | 66,208,106 | | | | 112,728,690 | | | | 18,661,931 | | | | 729,391,535 | | | | 186,404,512 | | | | 174,081,749 | | | | 165,258,124 | | | | 65,199,547 | |
|
|
|
| $ | 80,217,779 | | | $ | 148,362,944 | | | $ | 21,237,887 | | | $ | 652,068,388 | | | $ | 262,803,460 | | | $ | 175,431,718 | | | $ | 184,492,361 | | | $ | 71,326,450 | |
|
|
|
| $ | — | | | $ | 1,993,515 | | | $ | 60,005 | | | $ | (1,648,864 | ) | | $ | (1,919,675 | ) | | $ | 128,997 | | | $ | 92,942 | | | $ | 33,721 | |
|
|
|
47
COMMERCE FUNDS
Notes to Financial Statements
April 30, 2004 (Unaudited)
1. ORGANIZATION
The Commerce Funds (the “Trust”) is a Delaware statutory trust registered under the Investment Company Act of 1940, as amended, as an open-end, management investment company. The Trust consists of eleven portfolios (individually, a “Fund” and collectively, the “Funds”): Core Equity Fund, Growth Fund, Value Fund, MidCap Growth Fund, International Equity Fund, Asset Allocation Fund, Bond Fund, Short-Term Government Fund, National Tax-Free Intermediate Bond Fund, Missouri Tax-Free Intermediate Bond Fund and Kansas Tax-Free Intermediate Bond Fund. Each of the Funds offers two classes of shares, Institutional Shares and Service Shares. Each Fund is registered as a diversified management investment company, other than the Missouri Tax-Free Intermediate Bond Fund and the Kansas Tax-Free Intermediate Bond Fund, which are registered as non-diversified under the 1940 Act.
2. SIGNIFICANT ACCOUNTING POLICIES
The following is a summary of significant accounting policies consistently followed by the Funds. The preparation of financial statements in conformity with accounting principles generally accepted in the United States of America requires management to make estimates and assumptions that may affect the reported amounts. Actual results could differ from those estimates.
A. Investment Valuation — Investments in securities traded on a U.S. or foreign securities exchange or the Nasdaq system are valued daily at their last sale price or official closing price on the principal exchange or system on which they are traded. If no sale occurs, securities are valued at the last bid price. Debt securities are valued at prices supplied by independent pricing services, broker/dealer-supplied valuations or matrix pricing systems. Unlisted equity and debt securities for which market quotations are available are valued at the last sale price on valuation date, or if no sale occurs, at the last bid price. Short-term debt obligations maturing in sixty days or less are valued at amortized cost, which approximates market value. In addition, the impact of events that occur after the publication of market quotations used by a Fund to price its securities but before the close of regular trading on the New York Stock Exchange will be reflected in a Fund’s next determined NAV if the Trust, in its discretion, determines to make an adjustment in light of the nature and significance of the event, consistent with applicable regulatory guidelines. Upon such determination the Fund utilizes a price from an independent service, if available. The independent service takes into account multiple factors including, but not limited to, movements in the U.S. securities markets, certain depository receipts, futures contracts and foreign currency exchange rates. Securities for which quotations are not readily available or deemed to be inaccurate by the Adviser are valued at fair value using methods approved by the Trust’s Board of Trustees.
Investing in foreign markets may involve special risks and considerations not typically associated with investing in the United States. These risks include revaluation of currencies, high rates of inflation, repatriation restrictions on income and capital, and adverse political and economic developments. Moreover, securities issued in these markets may be less liquid, may be subject to government ownership controls and delayed settlements, and their prices may be more volatile than those of comparable securities in the United States.
The Asset Allocation Fund invests in a combination of underlying funds (the “Underlying Funds”) advised by the Adviser. Investments in the Underlying Funds are valued at the closing net asset value per share of each Underlying Fund on the day of valuation. Because the Asset Allocation Fund invests primarily in other mutual funds, which fluctuate in value, the Fund’s shares will correspondingly fluctuate in value.
B. Security Transactions and Dividend Income — Security transactions and purchases and sales of the Underlying Funds by the Asset Allocation Fund are recorded as of the trade date. Realized gains and losses on sales of portfolio securities and the Underlying Funds are calculated using the identified-cost basis. Dividend income and capital gains distributions from the Underlying Funds are recorded on the ex-dividend date, net of foreign withholding taxes which are reduced by any amounts reclaimable by the Fund, where applicable. Interest income is recorded on the basis of interest accrued, premium amortized and discount earned.
48
COMMERCE FUNDS
2. SIGNIFICANT ACCOUNTING POLICIES (continued)
Net investment income (other than class specific expenses) and unrealized and realized gains or losses are allocated daily to each class of shares of the Funds based upon the relative proportion of net assets of each class.
C. Premiums and Discounts on Debt Securities — The Bond and Short-Term Government Funds invest in mortgage-backed securities. Certain mortgage security paydown gains and losses are taxable as ordinary income (loss). Such paydown gains and losses increase or decrease taxable ordinary income available for distribution and are classified as interest income in the accompanying Statements of Operations. For all Funds, original issue discounts (“OID”) on debt securities are amortized to interest income over the life of the security with a corresponding increase in the cost basis of that security. OID amortization on mortgage backed REMIC securities is initially recorded based on estimates of principal paydowns using the most recent OID factors available from the issuer.
D. Foreign Currency Translations — The books and records of the Funds are maintained in U.S. dollars. Amounts denominated in foreign currencies are translated into U.S. dollars on the following basis: (i) investment valuations, foreign currency and other assets and liabilities initially expressed in foreign currencies are converted each business day into U.S. dollars based on current exchange rates; and (ii) purchases and sales of foreign investments, income and expenses are converted into U.S. dollars based upon currency exchange rates prevailing on the respective dates of such transactions.
Net realized and unrealized gain (loss) on foreign currency transactions will represent: (i) foreign exchange gains and losses from the sale and holdings of foreign currencies; (ii) currency gains and losses between trade date and settlement date on investment securities transactions and foreign exchange contracts; and (iii) gains and losses from the difference between amounts of dividends, interest and foreign withholding taxes recorded and the amounts actually received. Net unrealized gain (loss) on translation of assets and liabilities denominated in foreign currencies arises from changes in the value of assets and liabilities.
E. Forward Foreign Currency Exchange Contracts — The International Equity Fund may enter into forward foreign currency exchange contracts for the purchase of a specific foreign currency at a fixed price on a future date as a hedge or cross-hedge against either specific transactions or portfolio positions. The Fund may also purchase and sell forward contracts to seek to increase total return. All commitments are “marked-to-market” daily at the applicable translation rates and any resulting unrealized gains or losses are recorded in the Fund’s financial statements. The Fund realizes gains or losses at the time a forward contract is offset by entry into a closing transaction or extinguished by delivery of the currency. Risks may arise upon entering into these contracts from the potential inability of counterparties to meet the terms of their contracts and from unanticipated movements in the value of a foreign currency relative to the U.S. dollar. At April 30, 2004, the Fund had no outstanding forward foreign currency exchange contracts.
F. Segregation Transactions — Some of the Funds may enter into certain derivative transactions; some of these transactions may be for the purpose of increasing total return. Forward foreign currency exchange contracts, written options, mortgage dollar rolls, when-issued securities and forward commitments represent examples of derivative transactions. As a result of entering into these transactions, the Funds are required to segregate liquid assets on the accounting records equal to or greater than the market value of the corresponding transactions.
G. Repurchase Agreements — Repurchase agreements involve the purchase of securities subject to the seller’s agreement to repurchase them at a mutually agreed upon date and price. During the term of a repurchase agreement, the value of the underlying securities held as collateral on behalf of the Funds, including accrued interest, is required to equal or exceed the value of the repurchase agreement, including accrued interest. The underlying securities for all repurchase agreements are held in safekeeping in the customer-only account, at the Funds’ custodian.
49
COMMERCE FUNDS
Notes to Financial Statements (continued)
April 30, 2004 (Unaudited)
2. SIGNIFICANT ACCOUNTING POLICIES (continued)
H. Dividend Distributions to Shareholders — Distributions to shareholders are recorded on the ex-dividend date. Income and capital gains distributions, if any, are declared and paid according to the following schedule:
| | | | | | | | |
| | | Income Distribution
| | Capital Gains Distribution
|
| Fund | | Declared | | Paid | | Declared | | Paid |
Core Equity, Value and Asset Allocation | | Quarterly | | Quarterly | | Annually | | Annually |
Growth, MidCap Growth and International Equity | | Annually | | Annually | | Annually | | Annually |
Bond, Short-Term Government, National Tax-Free Intermediate Bond, Missouri Tax-Free Intermediate Bond and Kansas Tax-Free Intermediate Bond | | Daily | | Monthly | | Annually | | Annually |
I. Expenses — Expenses incurred by the Trust that do not specifically relate to an individual Fund of the Trust are allocated to the Funds based on each Fund’s relative average daily net assets. Service Class shareholders bear all expenses and fees relating to the Distribution Plan.
J. Federal Taxes — It is each Fund’s policy to comply with the requirements of the Internal Revenue Code applicable to regulated investment companies and to distribute each year substantially all of its investment company tax-exempt and taxable income and capital gains to its shareholders. Accordingly, no federal tax provisions are required. Dividends and distributions to shareholders are recorded on the ex-dividend date.
The characterization of distributions to shareholders for financial reporting purposes is determined in accordance with Federal income tax rules. Therefore, the source of a portfolio’s distributions may be shown in the accompanying financial statements as either from net investment income or net realized gain on investment transactions or from paid-in capital, depending on the type of book/tax differences that may exist.
3. AGREEMENTS
The Funds have entered into an Advisory Agreement with Commerce Investment Advisors, Inc., a subsidiary of Commerce Bank, N.A. (the “Adviser”). Pursuant to the terms of the Advisory Agreement, the Adviser is responsible for managing the investments and making investment decisions for each of the Funds. For these services and for assuming related expenses, the Adviser is entitled to a fee, computed daily and payable monthly, at the contractual annual rate of the corresponding Fund’s average daily net assets. For the six months ended April 30, 2004, the Adviser had contractually agreed to waive a portion of its advisory fee for certain Funds. The contractual annual rate, effective annual rate, and waiver rates are listed on the following pages.
As authorized by the Advisory Agreement, the Adviser has entered into a Sub-Advisory Agreement with Bank of Ireland Asset Management (U.S.) Limited (the “Sub-Adviser”) whereby the Sub-Adviser manages the investment assets of the International Equity Fund.
50
COMMERCE FUNDS
3. AGREEMENTS (continued)
As compensation for services rendered under the Sub-Advisory Agreement, the Sub-Adviser is entitled to a fee from the Adviser at the following annual rate:
| | |
| Average Daily Net Assets | | Annual Rate |
First $50 million | | 0.45% |
Next $50 million | | 0.40% |
Over $100 million | | 0.30% |
For the six months ended April 30, 2004, the Adviser agreed to waive fees and/or reimburse expenses (excluding interest, taxes, service share distribution expenses and extraordinary expenses) to the extent that such expenses exceeded, on an annualized basis, 1.13%, 1.13%, 1.20%, 1.72%, 0.35%, 0.88%, 0.68%, 0.70%, 0.65% and 0.65% of the average net assets of the Institutional Shares of the Core Equity, Growth, Value, International Equity, Asset Allocation, Bond, Short-Term Government, National Tax-Free Intermediate Bond, Missouri Tax-Free Intermediate Bond and Kansas Tax-Free Intermediate Bond Funds, respectively. Such amounts are 0.25% higher for the Service Shares of the above Funds. In addition, the Funds are not obligated to reimburse the Adviser for prior fiscal year expense reimbursements, if any.
Goldman Sachs Asset Management (“GSAM”), a business unit of the Investment Management Division of Goldman, Sachs & Co. (“Goldman Sachs”), serves as the Trust’s administrator, pursuant to an Administration Agreement. Under the Administration Agreement, GSAM administers the Trust’s business affairs. As compensation for the services rendered under the Administration Agreement and its assumption of related expenses, GSAM is entitled to a fee, computed daily and payable monthly, at the contractual annual rate of the corresponding Fund’s average daily net assets. For the six months ended April 30, 2004, the Administrator had contractually agreed to waive a portion of its Administration fee for certain Funds. The contractual annual rate, effective annual rate, and waiver rates are listed on the following page.
In addition, the Funds have entered into certain offset arrangements with the custodian resulting in a reduction in the Funds’ expenses. Such expense reimbursements, if any, are computed daily and paid monthly.
51
COMMERCE FUNDS
Notes to Financial Statements (continued)
April 30, 2004 (Unaudited)
3. AGREEMENTS (continued)
For the six months ended April 30, 2004, a summary of the Advisory fees, Administration fees, associated waivers, expense reimbursements and custody credits are as follows:
| | | | | | | | | | | | | | | | | | | | | | | | | | | | | | | | | |
| | | Advisory Fees
| | Administration Fees
| | Expense Reimbursements | | Custody Credits | | Total Expense Reduction |
| | | Contractual
Annual Rate | | | Effective
Annual Rate | | | Waiver
| | Contractual
Annual Rate | | | Effective
Annual Rate | | | Waiver
| | | |
| Fund | | | | Rate | | | Amount | | | | Rate | | | Amount | | | |
Core Equity | | 0.75 | % | | 0.75 | % | | — | % | | $ | — | | 0.15 | % | | 0.13 | % | | 0.02 | % | | $ | 26,199 | | $ | — | | $ | 17 | | $ | 26,216 |
Growth | | 0.75 | | | 0.75 | | | — | | | | — | | 0.15 | | | 0.13 | | | 0.02 | | | | 21,186 | | | — | | | 7 | | | 21,193 |
Value | | 0.75 | | | 0.75 | | | — | | | | — | | 0.15 | | | 0.13 | | | 0.02 | | | | 12,578 | | | — | | | 4 | | | 12,582 |
MidCap Growth | | 0.75 | | | 0.75 | | | — | | | | — | | 0.15 | | | 0.13 | | | 0.02 | | | | 8,482 | | | — | | | 149 | | | 8,631 |
International Equity | | 1.50 | | | 0.77 | | | 0.73 | | | | 535,386 | | 0.15 | | | 0.13 | | | 0.02 | | | | 14,754 | | | — | | | 42 | | | 550,182 |
Asset Allocation | | 0.20 | | | — | | | 0.20 | | | | 22,160 | | 0.15 | | | 0.08 | | | 0.07 | | | | 7,756 | | | 54,409 | | | — | | | 84,325 |
Bond | | 0.50 | | | 0.50 | | | — | | | | — | | 0.15 | | | 0.13 | | | 0.02 | | | | 64,739 | | | — | | | 2,836 | | | 67,575 |
Short-Term
Government | | 0.50 | | | 0.50 | | | — | | | | — | | 0.15 | | | 0.13 | | | 0.02 | | | | 26,340 | | | 175,142 | | | 245 | | | 201,727 |
National Tax-Free
Intermediate Bond | | 0.50 | | | 0.50 | | | — | | | | — | | 0.15 | | | 0.13 | | | 0.02 | | | | 17,551 | | | 107,355 | | | 77 | | | 124,983 |
Missouri Tax-Free
Intermediate Bond | | 0.50 | | | 0.50 | | | — | | | | — | | 0.15 | | | 0.13 | | | 0.02 | | | | 18,551 | | | 148,631 | | | 130 | | | 167,312 |
Kansas Tax-Free
Intermediate Bond | | 0.50 | | | 0.50 | | | — | | | | — | | 0.15 | | | 0.13 | | | 0.02 | | | | 7,242 | | | 92,302 | | | 3 | | | 99,547 |
Goldman Sachs serves as Distributor of shares of the Funds pursuant to a Distribution Agreement and may receive a portion of the sales charge imposed on the sale of Service Shares of the Funds. The maximum sales charge imposed on the sale of Service Shares of the Short-Term Government Fund, the National Tax-Free Intermediate Bond Fund, the Missouri Tax-Free Intermediate Bond Fund and the Kansas Tax-Free Intermediate Bond Fund is 2.00%; for all other Funds’ Service Shares, the maximum sales charge is 3.50%. Goldman Sachs has advised the Trust that it has retained approximately $1,700 on the sale of Service Shares of the Funds for the six months ended April 30, 2004.
The Trust, on behalf of each Fund, has adopted a Distribution Plan for Service Shares pursuant to Rule 12b-1 under the 1940 Act. Under the Distribution Plan, payments by each Fund for distribution expenses may not exceed 0.25% (annualized) of the average daily net assets of each Fund’s Service Shares.
Pursuant to a Shareholder Administrative Services Plan adopted by its Board of Trustees, the Funds may enter into agreements with service organizations, such as banks and financial institutions, which may include the Adviser and its affiliates (“Service Organizations”), under which they will render shareholder administration support services. For these services, the Service Organizations are entitled to receive fees from a Fund at an annual rate of up to 0.25% of the average daily net asset value of Fund shares beneficially owned by clients of such Service Organizations. For the six months ended April 30, 2004, Commerce Bank has retained approximately $592,900 in shareholder servicing fees.
52
COMMERCE FUNDS
4. INVESTMENT TRANSACTIONS
The cost of purchases and proceeds of sales and maturities of long-term securities and of the Underlying Funds (for the Asset Allocation Fund) for the six months ended April 30, 2004, were as follows:
| | | | | | | | | | | | |
| Fund | | Purchase of
U.S. Government
and agency
obligations | | Purchases
(excluding
U.S. Government
and agency
obligations) | | Sales and
maturities of
U.S. Government
and agency
obligations | | Sales
and maturities
(excluding
U.S. Government
and agency
obligations) |
Core Equity | | $ | — | | $ | 50,012,523 | | $ | — | | $ | 78,799,640 |
Growth | | | — | | | 44,243,613 | | | — | | | 60,637,641 |
Value | | | — | | | 44,468,180 | | | — | | | 52,770,009 |
MidCap Growth | | | — | | | 56,647,696 | | | — | | | 58,897,059 |
International Equity | | | — | | | 15,731,137 | | | — | | | 46,549,497 |
Asset Allocation | | | — | | | 2,733,553 | | | — | | | 3,597,342 |
Bond | | | 164,881,101 | | | 43,735,003 | | | 81,244,202 | | | 63,546,672 |
Short-Term Government | | | 100,764,787 | | | 1,367,274 | | | 108,531,859 | | | 1,246,975 |
National Tax-Free Intermediate Bond | | | — | | | 29,660,991 | | | — | | | 25,003,086 |
Missouri Tax-Free Intermediate Bond | | | — | | | 16,717,323 | | | — | | | 16,213,611 |
Kansas Tax-Free Intermediate Bond | | | — | | | 2,298,316 | | | — | | | 1,025,000 |
For the six months ended April 30, 2004, Goldman Sachs earned approximately $8,200 of brokerage commissions from portfolio transactions executed on behalf of the International Equity Fund.
53
COMMERCE FUNDS
Notes to Financial Statements (continued)
April 30, 2004 (Unaudited)
5. CONCENTRATION OF RISK
Under normal market conditions, the National Tax-Free Intermediate Bond Fund invests at least 80% of its assets plus any borrowings for investment purposes (measured at the time of purchase) in municipal securities issued by or on behalf of the states, the District of Columbia or the U.S. government, and their respective authorities, agencies, instrumentalities and political sub-divisions, the income from which is exempt from regular federal income and federal alternative minimum taxes. The Missouri Tax-Free Intermediate Bond Fund and the Kansas Tax-Free Intermediate Bond Fund invest at least 80% of their assets plus any borrowings for investment purposes (measured at the time of purchase) in Missouri and Kansas municipal securities, respectively, the income from which is exempt from regular federal income tax, federal alternative minimum taxes and Missouri and Kansas taxes, respectively. Alternatively, at least 80% of the Tax-Free Funds’ distributed income must be exempt from such taxes.
For each of the Missouri and Kansas Tax-Free Funds, the actual payment of principal and interest on Missouri and Kansas municipal securities is dependent on the Missouri General Assembly and the Kansas legislature, respectively, allotting money each fiscal year for these payments.
The International Equity Fund may invest a portion of its assets in emerging markets. Emerging markets securities may be more volatile than securities from more developed countries. At times, the securities held by the International Equity Fund may be subject to abrupt and severe price declines.
The investments of the Asset Allocation Fund are concentrated in underlying funds and the Fund’s investment performance is directly related to the investment performance of the underlying funds held by it.
6. ADDITIONAL TAX INFORMATION
As of the most recent fiscal year ended October 31, 2003, the Funds’ capital loss carryforwards on a tax basis were as follows:
| | | | | | | | | | | | | | | | | | | | | | | | |
| | | Core Equity
| | | Growth
| | | Value
| | | MidCap Growth
| | | International Equity
| | | Asset
Allocation
| |
Capital loss carryforward: | | | | | | | | | | | | | | | | | | | | | | | | |
Expiring 2009 | | $ | — | | | $ | (20,809,926 | ) | | $ | (1,882,159 | ) | | $ | (11,212,250 | ) | | $ | (2,833,407 | ) | | $ | — | |
Expiring 2010 | | | (20,614,865 | ) | | | (34,969,870 | ) | | | (10,428,577 | ) | | | (17,808,286 | ) | | | (24,449,100 | ) | | | — | |
Expiring 2011 | | | (1,294,140 | ) | | | — | | | | (2,362,466 | ) | | | — | | | | (8,902,946 | ) | | | — | |
| | |
|
|
|
Total capital loss carryforward: | | $ | (21,909,005 | ) | | $ | (55,779,796 | ) | | $ | (14,673,202 | ) | | $ | (29,020,536 | ) | | $ | (36,185,453 | ) | | $ | — | |
|
|
As of April 30, 2004, the Funds’ aggregate security unrealized gains and losses based on a cost for U.S. federal income tax purposes were as follows: | |
| | | Core Equity
| | | Growth
| | | Value
| | | MidCap Growth
| | | International Equity
| | | Asset
Allocation
| |
Tax Cost | | $ | 220,092,292 | | | $ | 171,617,659 | | | $ | 108,084,226 | | | $ | 74,502,183 | | | $ | 113,452,810 | | | $ | 19,147,821 | |
| | |
|
|
|
Gross unrealized gain | | | 45,078,802 | | | | 34,263,459 | | | | 11,519,595 | | | | 11,333,991 | | | | 20,409,849 | | | | 2,009,042 | |
Gross unrealized loss | | | (12,858,937 | ) | | | (7,027,180 | ) | | | (1,505,783 | ) | | | (2,999,028 | ) | | | (2,280,364 | ) | | | (186,056 | ) |
| | |
|
|
|
Net unrealized security gain | | $ | 32,219,865 | | | $ | 27,236,279 | | | $ | 10,013,812 | | | $ | 8,334,963 | | | $ | 18,129,485 | | | $ | 1,822,986 | |
|
|
The difference between book-basis and tax-basis unrealized gains is primarily attributable to wash sales.
54
COMMERCE FUNDS
6. ADDITIONAL TAX INFORMATION (continued)
As of the most recent fiscal year ended October 31, 2003, the Funds’ capital loss carryforwards and certain timing differences on a tax basis were as follows:
| | | | | | | | | | | | | | | | | | | | |
| | | Bond
| | | Short-Term Government
| | | National Tax-Free
Intermediate Bond
| | | Missouri Tax-Free Intermediate Bond
| | | Kansas Tax-Free
Intermediate Bond
| |
Timing differences
(i.e., dividends payable) | | $ | (2,003,548 | ) | | $ | (702,639 | ) | | $ | (485,342 | ) | | $ | (500,907 | ) | | $ | (196,866 | ) |
Capital loss carryforward: | | | | | | | | | | | | | | | | | | | | |
Expiring 2008 | | | (2,326,968 | ) | | | (1,045,396 | ) | | | — | | | | — | | | | — | |
Expiring 2009 | | | — | | | | — | | | | — | | | | — | | | | — | |
Expiring 2010 | | | (8,311,371 | ) | | | (679,994 | ) | | | — | | | | — | | | | — | |
Expiring 2011 | | | — | | | | (2,174,462 | ) | | | — | | | | — | | | | — | |
| | |
|
|
|
Total capital loss carryforward: | | $ | (10,638,339 | ) | | $ | (3,899,852 | ) | | $ | — | | | $ | — | | | $ | — | |
|
|
As of April 30, 2004, the Funds’ aggregate security unrealized gains and losses based on a cost for U.S. federal income tax purposes were as follows:
| | | | | | | | | | | | | | | | | | | | |
| | | Bond
| | | Short-Term
Government
| | | National Tax-Free Intermediate Bond
| | | Missouri Tax-Free
Intermediate Bond
| | | Kansas Tax-Free
Intermediate Bond
| |
Tax Cost | | $ | 619,796,170 | | | $ | 258,287,382 | | | $ | 164,967,711 | | | $ | 171,859,094 | | | $ | 69,219,420 | |
| | |
|
|
|
Gross unrealized gain | | | 18,023,787 | | | | 1,497,299 | | | | 6,590,791 | | | | 7,095,174 | | | | 2,531,064 | |
Gross unrealized loss | | | (10,908,188 | ) | | | (3,070,622 | ) | | | (556,864 | ) | | | (315,252 | ) | | | (211,510 | ) |
| | |
|
|
|
Net unrealized security gain (loss) | | $ | 7,115,599 | | | $ | (1,573,323 | ) | | $ | 6,033,927 | | | $ | 6,779,922 | | | $ | 2,319,554 | |
|
|
The difference between book-basis and tax-basis unrealized gains (losses) is primarily attributable to wash sales and the differing treatment of accretion of market discount.
55
COMMERCE FUNDS
Notes to Financial Statements (continued)
April 30, 2004 (Unaudited)
7. SUMMARY OF SHARE TRANSACTIONS
Share activity is as follows:
| | | | | | | | | | | | | | |
| | | Core Equity Fund
| | | Growth Fund
| |
| | | Shares | | | Dollars | | | Shares | | | Dollars | |
For the Six Months Ended April 30, 2004
(Unaudited) | | | | | | | | |
Institutional Shares | | | | | | | | | | | | | | |
Shares sold | | 497,740 | | | $ | 7,565,035 | | | 707,804 | | | $ | 15,116,206 | |
Reinvestment of dividends and distributions | | 970 | | | | 14,646 | | | — | | | | — | |
Shares repurchased | | (2,131,071 | ) | | | (32,284,962 | ) | | (1,544,077 | ) | | | (33,099,051 | ) |
| | |
|
|
| | | (1,632,361 | ) | | | (24,705,281 | ) | | (836,273 | ) | | | (17,982,845 | ) |
Service Shares | | | | | | | | | | | | | | |
Shares sold | | 1,467 | | | | 22,943 | | | 13,772 | | | | 290,300 | |
Reinvestment of dividends and distributions | | 5 | | | | 79 | | | — | | | | — | |
Shares repurchased | | (688 | ) | | | (10,965 | ) | | (22,416 | ) | | | (470,996 | ) |
| | |
|
|
| | | 784 | | | | 12,057 | | | (8,644 | ) | | | (180,696 | ) |
| NET DECREASE | | (1,631,577 | ) | | $ | (24,693,224 | ) | | (844,917 | ) | | $ | (18,163,541 | ) |
| | | | |
| | | | | | | | | | | | | | | |
| | |
| For the Year Ended October 31, 2003 | | | | | | | | |
Institutional Shares | | | | | | | | | | | | | | |
Shares sold | | 2,328,029 | | | $ | 29,842,565 | | | 2,575,915 | | | $ | 46,461,109 | |
Reinvestment of dividends and distributions | | 3,353 | | | | 43,535 | | | — | | | | — | |
Shares repurchased | | (3,527,810 | ) | | | (45,732,901 | ) | | (2,474,317 | ) | | | (45,002,661 | ) |
| | |
|
|
| | | (1,196,428 | ) | | | (15,846,801 | ) | | 101,598 | | | | 1,458,448 | |
Service Shares | | | | | | | | | | | | | | |
Shares sold | | 1,451 | | | | 19,629 | | | 23,059 | | | | 406,514 | |
Reinvestment of dividends and distributions | | 17 | | | | 222 | | | — | | | | — | |
Shares repurchased | | (150 | ) | | | (1,792 | ) | | (39,773 | ) | | | (693,900 | ) |
| | |
|
|
| | | 1,318 | | | | 18,059 | | | (16,714 | ) | | | (287,386 | ) |
| NET INCREASE (DECREASE) | | (1,195,110 | ) | | $ | (15,828,742 | ) | | 84,884 | | | $ | 1,171,062 | |
56
COMMERCE FUNDS
| | | | | | | | | | | | | | | | | | | |
| Value Fund | | | MidCap Growth Fund | | | International Equity Fund | |
| Shares | | | Dollars | | | Shares | | | Dollars | | | Shares | | | Dollars | |
| |
| | | | | | |
| | | | | | |
| 563,343 | | | $ | 12,308,888 | | | 420,706 | | | $ | 10,519,813 | | | 778,557 | | | $ | 14,543,789 | |
| 14,363 | | | | 313,880 | | | — | | | | — | | | 55,131 | | | | 1,003,382 | |
| (915,188 | ) | | | (20,074,254 | ) | | (518,902 | ) | | | (13,068,988 | ) | | (2,487,009 | ) | | | (45,401,503 | ) |
| (337,482 | ) | | | (7,451,486 | ) | | (98,196 | ) | | | (2,549,175 | ) | | (1,653,321 | ) | | | (29,854,332 | ) |
| | | | | | |
| 1,688 | | | | 37,569 | | | 5,027 | | | | 124,440 | | | 2,937 | | | | 54,822 | |
| 96 | | | | 2,102 | | | — | | | | — | | | 277 | | | | 5,010 | |
| (1,028 | ) | | | (22,921 | ) | | (3,159 | ) | | | (78,258 | ) | | (1,951 | ) | | | (36,125 | ) |
| 756 | | | | 16,750 | | | 1,868 | | | | 46,182 | | | 1,263 | | | | 23,707 | |
| (336,726 | ) | | $ | (7,434,736 | ) | | (96,328 | ) | | $ | (2,502,993 | ) | | (1,652,058 | ) | | $ | (29,830,625 | ) |
| | | | | |
| | | | | | | | | | | | | | | | | | | | |
| | | | | | |
| | | | | | |
| | | | | | |
| 1,575,670 | | | $ | 29,574,427 | | | 1,181,784 | | | $ | 22,690,299 | | | 4,373,331 | | | $ | 62,784,283 | |
| 41,342 | | | | 772,322 | | | — | | | | — | | | 18,567 | | | | 267,722 | |
| (1,389,765 | ) | | | (26,118,570 | ) | | (1,372,665 | ) | | | (26,495,611 | ) | | (3,305,921 | ) | | | (48,806,566 | ) |
| 227,247 | | | | 4,228,179 | | | (190,881 | ) | | | (3,805,312 | ) | | 1,085,977 | | | | 14,245,439 | |
| | | | | | |
| 1,551 | | | | 29,215 | | | 8,846 | | | | 168,220 | | | 3,005 | | | | 43,026 | |
| 277 | | | | 5,186 | | | — | | | | — | | | 27 | | | | 391 | |
| (5,332 | ) | | | (98,329 | ) | | (11,571 | ) | | | (213,958 | ) | | (5,071 | ) | | | (72,242 | ) |
| (3,504 | ) | | | (63,928 | ) | | (2,725 | ) | | | (45,738 | ) | | (2,039 | ) | | | (28,825 | ) |
| 223,743 | | | $ | 4,164,251 | | | (193,606 | ) | | $ | (3,851,050 | ) | | 1,083,938 | | | $ | 14,216,614 | |
57
COMMERCE FUNDS
Notes to Financial Statements (continued)
April 30, 2004 (Unaudited)
7. SUMMARY OF SHARE TRANSACTIONS (continued)
| | | | | | | | | | | | | | |
| | | Asset Allocation Fund
| | | Bond Fund
| |
| | | Shares | | | Dollars | | | Shares | | | Dollars | |
For the Six Months Ended April 30, 2004
(Unaudited) | | | | | | | | |
Institutional Shares | | | | | | | | | | | | | | |
Shares sold | | 93,948 | | | $ | 1,968,343 | | | 2,796,553 | | | $ | 52,731,584 | |
Reinvestment of dividends and distributions | | 27,370 | | | | 563,983 | | | 208,636 | | | | 3,923,252 | |
Shares repurchased | | (159,558 | ) | | | (3,346,845 | ) | | (3,661,940 | ) | | | (69,049,931 | ) |
| | |
|
|
| | | (38,240 | ) | | | (814,519 | ) | | (656,751 | ) | | | (12,395,095 | ) |
Service Shares | | | | | | | | | | | | | | |
Shares sold | | 644 | | | | 13,379 | | | 652 | | | | 12,293 | |
Reinvestment of dividends and distributions | | 556 | | | | 11,442 | | | 1,047 | | | | 19,697 | |
Shares repurchased | | (935 | ) | | | (19,653 | ) | | (10,480 | ) | | | (197,056 | ) |
| | |
|
|
| | | 265 | | | | 5,168 | | | (8,781 | ) | | | (165,066 | ) |
| NET INCREASE (DECREASE) | | (37,975 | ) | | $ | (809,351 | ) | | (665,532 | ) | | $ | (12,560,161 | ) |
| | | | |
| | | | | | | | | | | | | | | |
| | | | | | |
| For the Year Ended October 31, 2003 | | | | | | | | |
Institutional Shares | | | | | | | | | | | | | | |
Shares sold | | 290,842 | | | $ | 5,406,070 | | | 5,204,676 | | | $ | 98,608,072 | |
Reinvestment of dividends and distributions | | 19,961 | | | | 375,126 | | | 535,591 | | | | 10,178,277 | |
Shares repurchased | | (278,422 | ) | | | (5,214,144 | ) | | (9,123,647 | ) | | | (173,832,903 | ) |
| | |
|
|
| | | 32,381 | | | | 567,052 | | | (3,383,380 | ) | | | (65,046,554 | ) |
Service Shares | | | | | | | | | | | | | | |
Shares sold | | 4,599 | | | | 85,057 | | | 5,511 | | | | 104,902 | |
Reinvestment of dividends and distributions | | 397 | | | | 7,449 | | | 2,744 | | | | 52,172 | |
Shares repurchased | | (6,739 | ) | | | (127,316 | ) | | (17,848 | ) | | | (338,090 | ) |
| | |
|
|
| | | (1,743 | ) | | | (34,810 | ) | | (9,593 | ) | | | (181,016 | ) |
| NET INCREASE (DECREASE) | | 30,638 | | | $ | 532,242 | | | (3,392,973 | ) | | $ | (65,227,570 | ) |
58
COMMERCE FUNDS
| | | | | | | | | | | | | | | | | | | | | | | | | | |
| Short-Term Government Fund | | | National Tax-Free Intermediate Bond Fund | | | Missouri Tax-Free Intermediate Bond Fund | | | Kansas Tax-Free Intermediate Bond Fund | |
| Shares | | | Dollars | | | Shares | | | Dollars | | | Shares | | | Dollars | | | Shares | | | Dollars | |
| | | |
| | | | | | | | | | | | | |
| | | | | | | | | | | | | |
| 2,820,941 | | | $ | 52,162,715 | | | 951,571 | | | $ | 18,737,064 | | | 754,021 | | | $ | 14,994,153 | | | 453,245 | | | $ | 8,782,751 | |
| 83,135 | | | | 1,534,498 | | | 20,091 | | | | 392,372 | | | 16,208 | | | | 321,202 | | | 2,730 | | | | 52,657 | |
| (3,103,510 | ) | | | (57,302,909 | ) | | (949,063 | ) | | | (18,630,172 | ) | | (860,633 | ) | | | (17,079,130 | ) | | (360,467 | ) | | | (6,977,342 | ) |
| (199,434 | ) | | | (3,605,696 | ) | | 22,599 | | | | 499,264 | | | (90,404 | ) | | | (1,763,775 | ) | | 95,508 | | | | 1,858,066 | |
| | | | | | | | | | | | | |
| 8,389 | | | | 155,387 | | | — | | | | — | | | 6,288 | | | | 126,341 | | | 18,079 | | | | 349,730 | |
| 1,670 | | | | 30,857 | | | 9 | | | | 162 | | | 604 | | | | 11,989 | | | 1,004 | | | | 19,359 | |
| (49,943 | ) | | | (923,640 | ) | | — | | | | — | | | (7,341 | ) | | | (146,718 | ) | | (20,398 | ) | | | (394,815 | ) |
| (39,884 | ) | | | (737,396 | ) | | 9 | | | | 162 | | | (449 | ) | | | (8,388 | ) | | (1,315 | ) | | | (25,726 | ) |
| (239,318 | ) | | $ | (4,343,092 | ) | | 22,608 | | | $ | 499,426 | | | (90,853 | ) | | $ | (1,772,163 | ) | | 94,193 | | | $ | 1,832,340 | |
| | | | | | | |
| | | | | | | | | | | | | | | | | | | | | | | | | | | |
| | |
| | | | | | | | | | | | | |
| | | | | | | | | | | | | |
| 8,018,369 | | | $ | 151,493,591 | | | 1,546,534 | | | $ | 30,544,474 | | | 2,347,780 | | | $ | 46,376,220 | | | 902,920 | | | $ | 17,467,853 | |
| 160,457 | | | | 3,022,215 | | | 25,099 | | | | 493,288 | | | 31,920 | | | | 628,364 | | | 4,258 | | | | 81,627 | |
| (3,822,952 | ) | | | (71,977,117 | ) | | (1,527,636 | ) | | | (30,100,134 | ) | | (1,446,752 | ) | | | (28,451,001 | ) | | (619,286 | ) | | | (11,898,068 | ) |
| 4,355,874 | | | | 82,538,689 | | | 43,997 | | | | 937,628 | | | 932,948 | | | | 18,553,583 | | | 287,892 | | | | 5,651,412 | |
| | | | | | | | | | | | | |
| 61,602 | | | | 1,163,784 | | | 1 | | | | 30 | | | 22,694 | | | | 448,076 | | | 48,263 | | | | 928,247 | |
| 3,715 | | | | 69,958 | | | 10 | | | | 203 | | | 1,213 | | | | 23,900 | | | 1,273 | | | | 24,453 | |
| (23,927 | ) | | | (450,275 | ) | | (897 | ) | | | (17,579 | ) | | (5,847 | ) | | | (115,751 | ) | | (47,596 | ) | | | (910,264 | ) |
| 41,390 | | | | 783,467 | | | (886 | ) | | | (17,346 | ) | | 18,060 | | | | 356,225 | | | 1,940 | | | | 42,436 | |
| 4,397,264 | | | $ | 83,322,156 | | | 43,111 | | | $ | 920,282 | | | 951,008 | | | $ | 18,909,808 | | | 289,832 | | | $ | 5,693,848 | |
59
COMMERCE FUNDS
Financial Highlights
Selected Data for a Share Outstanding Throughout Each Period
| | | | | | | | | | | | | | | | | | | | | | | | | | | | | | | |
| | | | | Income (loss) from investment operations
| | | Distributions to shareholders
| |
| | | Net asset
value,
beginning
of period | | Net
investment
income (loss) | | | Net realized
and unrealized
gain (loss) | | | Total from
investment
operations | | | From net
investment
income | | | In excess
of net
investment
income | | | From net
realized
gains | | | Total
distributions | |
CORE EQUITY FUND | |
For the Six Months Ended April 30, 2004 (Unaudited) | | | | | | | | | | | | | | | | | | | | | | | | | | | | | | | |
Institutional Shares | | $ | 14.46 | | $ | 0.02 | (b) | | $ | 0.94 | | | $ | 0.96 | | | $ | (0.03 | ) | | $ | — | | | $ | — | | | $ | (0.03 | ) |
Service Shares | | | 14.46 | | | — | (b)(c) | | | 0.95 | | | | 0.95 | | | | (0.02 | ) | | | — | | | | — | | | | (0.02 | ) |
For the Year Ended October 31, 2003 | | | | | | | | | | | | | | | | | | | | | | | | | | | | | | | |
Institutional Shares | | | 12.57 | | | 0.09 | (b) | | | 1.89 | | | | 1.98 | | | | (0.09 | ) | | | — | | | | — | | | | (0.09 | ) |
Service Shares | | | 12.57 | | | 0.06 | (b) | | | 1.89 | | | | 1.95 | | | | (0.06 | ) | | | — | | | | — | | | | (0.06 | ) |
For the Year Ended October 31, 2002 | | | | | | | | | | | | | | | | | | | | | | | | | | | | | | | |
Institutional Shares | | | 14.70 | | | 0.10 | (b) | | | (2.14 | ) | | | (2.04 | ) | | | (0.09 | ) | | | — | | | | — | (c) | | | (0.09 | ) |
Service Shares | | | 14.70 | | | 0.06 | (b) | | | (2.13 | ) | | | (2.07 | ) | | | (0.06 | ) | | | — | | | | — | (c) | | | (0.06 | ) |
For the Period Ended October 31, 2001 | | | | | | | | | | | | | | | | | | | | | | | | | | | | | | | |
Institutional Shares (commenced December 26, 2000) | | | 18.00 | | | 0.04 | (b) | | | (3.29 | ) | | | (3.25 | ) | | | (0.04 | ) | | | (0.01 | ) | | | — | | | | (0.05 | ) |
Service Shares (commenced December 26, 2000) | | | 18.00 | | | — | (b) | | | (3.30 | ) | | | (3.30 | ) | | | — | | | | — | | | | — | | | | — | |
| | | | | | | | | | | | | | | | | | | | | | | | | | | | | | | | |
GROWTH FUND | |
For the Six Months Ended April 30, 2004 (Unaudited) | | | | | | | | | | | | | | | | | | | | | | | | | | | | | | | |
Institutional Shares | | $ | 20.50 | | $ | (0.04 | )(b) | | $ | 0.57 | | | $ | 0.53 | | | $ | — | | | $ | — | | | $ | — | | | $ | — | |
Service Shares | | | 20.15 | | | (0.06 | )(b) | | | 0.56 | | | | 0.50 | | | | — | | | | — | | | | — | | | | — | |
For the Year Ended October 31, 2003 | | | | | | | | | | | | | | | | | | | | | | | | | | | | | | | |
Institutional Shares | | | 17.52 | | | (0.04 | )(b) | | | 3.02 | | | | 2.98 | | | | — | | | | — | | | | — | | | | — | |
Service Shares | | | 17.27 | | | (0.09 | )(b) | | | 2.97 | | | | 2.88 | | | | — | | | | — | | | | — | | | | — | |
For the Year Ended October 31, 2002 | | | | | | | | | | | | | | | | | | | | | | | | | | | | | | | |
Institutional Shares | | | 20.03 | | | (0.07 | )(b) | | | (2.44 | ) | | | (2.51 | ) | | | — | | | | — | | | | — | | | | — | |
Service Shares | | | 19.80 | | | (0.11 | )(b) | | | (2.42 | ) | | | (2.53 | ) | | | — | | | | — | | | | — | | | | — | |
For the Year Ended October 31, 2001 | | | | | | | | | | | | | | | | | | | | | | | | | | | | | | | |
Institutional Shares | | | 38.33 | | | (0.10 | )(b) | | | (10.93 | ) | | | (11.03 | ) | | | — | | | | — | | | | (7.27 | ) | | | (7.27 | ) |
Service Shares | | | 38.04 | | | (0.15 | )(b) | | | (10.82 | ) | | | (10.97 | ) | | | — | | | | — | | | | (7.27 | ) | | | (7.27 | ) |
For the Year Ended October 31, 2000 | | | | | | | | | | | | | | | | | | | | | | | | | | | | | | | |
Institutional Shares | | | 38.24 | | | (0.14 | )(b) | | | 4.17 | | | | 4.03 | | | | — | | | | — | | | | (3.94 | ) | | | (3.94 | ) |
Service Shares | | | 38.07 | | | (0.24 | )(b) | | | 4.15 | | | | 3.91 | | | | — | | | | — | | | | (3.94 | ) | | | (3.94 | ) |
For the Year Ended October 31, 1999 | | | | | | | | | | | | | | | | | | | | | | | | | | | | | | | |
Institutional Shares | | | 37.37 | | | (0.05 | ) | | | 6.40 | | | | 6.35 | | | | (0.01 | ) | | | — | | | | (5.47 | ) | | | (5.48 | ) |
Service Shares | | | 37.29 | | | (0.12 | ) | | | 6.37 | | | | 6.25 | | | | — | | | | — | | | | (5.47 | ) | | | (5.47 | ) |
| (a) | | Assumes investment at the net asset value at the beginning of the period, reinvestment of all dividends and distributions, a complete redemption of the investment at the net asset value at the end of the period and no sales charges. Total return would be reduced if sales or redemption charges were taken into account. Total returns for periods less than one full year are not annualized. Returns do not reflect the deduction of taxes that a shareholder would pay on fund distributions or the redemption of fund shares. |
| (b) | | Calculated based on average shares outstanding methodology. |
| (c) | | Amount is less than $0.005 per share. |
| | |
| 60 | | The accompanying notes are an integral part of these financial statements. |
COMMERCE FUNDS
| | | | | | | | | | | | | | | | | | | | | |
| | | | | | | | | | | | | | Ratios assuming no expense reductions
| | | | |
Net asset
value, end
of period | | Total
return(a) | | | Net assets
at end of
period (in 000s) | | Ratio of
net expenses to
average net assets | | | Ratio of
net investment
income (loss) to
average net assets | | | Ratio of
total expenses to
average net assets | | | Ratio of
net investment
income (loss) to
average net assets | | | Portfolio
turnover
rate | |
| | |
| | | | | | | | | | | | | | | | | | | | | | |
| $15.39 | | 6.65 | % | | $ | 254,721 | | 1.03 | %(d) | | 0.32 | %(d) | | 1.05 | %(d) | | 0.30 | %(d) | | 19 | % |
| 15.39 | | 6.55 | | | | 82 | | 1.28 | (d) | | 0.04 | (d) | | 1.30 | (d) | | 0.02 | (d) | | 19 | |
| | | | | | | | | | | | | | | | | | | | | | |
| 14.46 | | 15.83 | | | | 262,935 | | 1.04 | | | 0.71 | | | 1.06 | | | 0.69 | | | 43 | |
| 14.46 | | 15.55 | | | | 65 | | 1.29 | | | 0.45 | | | 1.31 | | | 0.44 | | | 43 | |
| | | | | | | | | | | | | | | | | | | | | | |
| 12.57 | | (13.90 | ) | | | 243,569 | | 0.98 | | | 0.68 | | | 1.00 | | | 0.66 | | | 23 | |
| 12.57 | | (14.11 | ) | | | 40 | | 1.23 | | | 0.44 | | | 1.25 | | | 0.42 | | | 23 | |
| | | | | | | | | | | | | | | | | | | | | | |
| 14.70 | | (18.13 | ) | | | 295,532 | | 1.01 | (d) | | 0.31 | (d) | | 1.03 | (d) | | 0.29 | (d) | | 32 | |
| 14.70 | | (18.25 | ) | | | 34 | | 1.23 | (d) | | (0.02 | )(d) | | 1.25 | (d) | | (0.04 | )(d) | | 32 | |
| | | | | | | | | | | | | | | | | | | | | | |
| | |
| | | | | | | | | | | | | | | | | | | | | | |
| $21.03 | | 2.59 | % | | $ | 192,307 | | 1.10 | %(d) | | (0.35 | )%(d) | | 1.12 | %(d) | | (0.37 | )%(d) | | 21 | % |
| 20.65 | | 2.48 | | | | 5,472 | | 1.35 | (d) | | (0.61 | )(d) | | 1.37 | (d) | | (0.63 | )(d) | | 21 | |
| | | | | | | | | | | | | | | | | | | | | | |
| 20.50 | | 17.01 | | | | 204,539 | | 1.12 | | | (0.24 | ) | | 1.14 | | | (0.26 | ) | | 60 | |
| 20.15 | | 16.68 | | | | 5,513 | | 1.37 | | | (0.49 | ) | | 1.39 | | | (0.51 | ) | | 60 | |
| | | | | | | | | | | | | | | | | | | | | | |
| 17.52 | | (12.53 | ) | | | 173,077 | | 1.12 | | | (0.33 | ) | | 1.14 | | | (0.35 | ) | | 53 | |
| 17.27 | | (12.73 | ) | | | 5,015 | | 1.37 | | | (0.58 | ) | | 1.39 | | | (0.60 | ) | | 53 | |
| | | | | | | | | | | | | | | | | | | | | | |
| 20.03 | | (33.85 | ) | | | 219,622 | | 1.11 | | | (0.39 | ) | | 1.13 | | | (0.41 | ) | | 47 | |
| 19.80 | | (34.00 | ) | | | 7,711 | | 1.36 | | | (0.60 | ) | | 1.38 | | | (0.62 | ) | | 47 | |
| | | | | | | | | | | | | | | | | | | | | | |
| 38.33 | | 10.88 | | | | 385,676 | | 1.06 | | | (0.37 | ) | | 1.07 | | | (0.36 | ) | | 50 | |
| 38.04 | | 10.59 | | | | 13,747 | | 1.31 | | | (0.62 | ) | | 1.32 | | | (0.61 | ) | | 50 | |
| | | | | | | | | | | | | | | | | | | | | | |
| 38.24 | | 18.24 | | | | 445,923 | | 1.08 | | | (0.12 | ) | | 1.08 | | | (0.12 | ) | | 35 | |
| 38.07 | | 17.97 | | | | 14,468 | | 1.33 | | | (0.36 | ) | | 1.33 | | | (0.36 | ) | | 35 | |
61
COMMERCE FUNDS
Financial Highlights
Selected Data for a Share Outstanding Throughout Each Period
| | | | | | | | | | | | | | | | | | | | | | | | | | | |
| | | | | Income (loss) from
investment operations
| | | Distributions
to shareholders
| |
| | | Net asset
value,
beginning
of period | | Net
investment
income (loss) | | | Net realized
and unrealized
gain (loss) | | | Total from
investment
operations | | | From net
investment
income | | | From net
realized
gains | | | Total
distributions | |
VALUE FUND | |
For the Six Months Ended April 30, 2004 (Unaudited) | | | | | | | | | | | | | | | | | | | | | | | | | | | |
Institutional Shares | | $ | 20.92 | | $ | 0.09 | (b) | | $ | 0.77 | | | $ | 0.86 | | | $ | (0.11 | ) | | $ | — | | | $ | (0.11 | ) |
Service Shares | | | 20.93 | | | 0.06 | (b) | | | 0.77 | | | | 0.83 | | | | (0.08 | ) | | | — | | | | (0.08 | ) |
For the Year Ended October 31, 2003 | | | | | | | | | | | | | | | | | | | | | | | | | | | |
Institutional Shares | | | 18.07 | | | 0.25 | (b) | | | 2.84 | | | | 3.09 | | | | (0.24 | ) | | | — | | | | (0.24 | ) |
Service Shares | | | 18.08 | | | 0.20 | (b) | | | 2.85 | | | | 3.05 | | | | (0.20 | ) | | | — | | | | (0.20 | ) |
For the Year Ended October 31, 2002 | | | | | | | | | | | | | | | | | | | | | | | | | | | |
Institutional Shares | | | 21.05 | | | 0.24 | (b) | | | (2.99 | ) | | | (2.75 | ) | | | (0.23 | ) | | | — | | | | (0.23 | ) |
Service Shares | | | 21.05 | | | 0.19 | (b) | | | (2.99 | ) | | | (2.80 | ) | | | (0.17 | ) | | | — | | | | (0.17 | ) |
For the Year Ended October 31, 2001 | | | | | | | | | | | | | | | | | | | | | | | | | | | |
Institutional Shares | | | 24.88 | | | 0.21 | (b) | | | (2.91 | ) | | | (2.70 | ) | | | (0.21 | ) | | | (0.92 | ) | | | (1.13 | ) |
Service Shares | | | 24.88 | | | 0.16 | (b) | | | (2.92 | ) | | | (2.76 | ) | | | (0.15 | ) | | | (0.92 | ) | | | (1.07 | ) |
For the Year Ended October 31, 2000 | | | | | | | | | | | | | | | | | | | | | | | | | | | |
Institutional Shares | | | 21.40 | | | 0.18 | (b) | | | 3.45 | | | | 3.63 | | | | (0.15 | ) | | | — | | | | (0.15 | ) |
Service Shares | | | 21.41 | | | 0.12 | (b) | | | 3.45 | | | | 3.57 | | | | (0.10 | ) | | | — | | | | (0.10 | ) |
For the Year Ended October 31, 1999 | | | | | | | | | | | | | | | | | | | | | | | | | | | |
Institutional Shares | | | 21.72 | | | 0.15 | | | | (0.09 | ) | | | 0.06 | | | | (0.15 | ) | | | (0.23 | ) | | | (0.38 | ) |
Service Shares | | | 21.73 | | | 0.11 | | | | (0.11 | ) | | | — | | | | (0.09 | ) | | | (0.23 | ) | | | (0.32 | ) |
| | | | | | | | | | | | | | | | | | | | | | | | | | | | |
MIDCAP GROWTH FUND | |
For the Six Months Ended April 30, 2004 (Unaudited) | | | | | | | | | | | | | | | | | | | | | | | | | | | |
Institutional Shares | | $ | 23.61 | | $ | (0.07 | )(b) | | $ | 1.56 | | | $ | 1.49 | | | $ | — | | | $ | — | | | $ | — | |
Service Shares | | | 23.12 | | | (0.10 | )(b) | | | 1.53 | | | | 1.43 | | | | — | | | | — | | | | — | |
For the Year Ended October 31, 2003 | | | | | | | | | | | | | | | | | | | | | | | | | | | |
Institutional Shares | | | 18.44 | | | (0.14 | )(b) | | | 5.31 | | | | 5.17 | | | | — | | | | — | | | | — | |
Service Shares | | | 18.10 | | | (0.18 | )(b) | | | 5.20 | | | | 5.02 | | | | — | | | | — | | | | — | |
For the Year Ended October 31, 2002 | | | | | | | | | | | | | | | | | | | | | | | | | | | |
Institutional Shares | | | 21.37 | | | (0.20 | )(b) | | | (2.73 | ) | | | (2.93 | ) | | | — | | | | — | | | | — | |
Service Shares | | | 21.04 | | | (0.24 | )(b) | | | (2.70 | ) | | | (2.94 | ) | | | — | | | | — | | | | — | |
For the Year Ended October 31, 2001 | | | | | | | | | | | | | | | | | | | | | | | | | | | |
Institutional Shares | | | 43.62 | | | (0.25 | )(b) | | | (17.57 | ) | | | (17.82 | ) | | | — | | | | (4.43 | ) | | | (4.43 | ) |
Service Shares | | | 43.11 | | | (0.32 | )(b) | | | (17.32 | ) | | | (17.64 | ) | | | — | | | | (4.43 | ) | | | (4.43 | ) |
For the Year Ended October 31, 2000 | | | | | | | | | | | | | | | | | | | | | | | | | | | |
Institutional Shares | | | 40.07 | | | (0.34 | )(b) | | | 9.91 | | | | 9.57 | | | | — | | | | (6.02 | ) | | | (6.02 | ) |
Service Shares | | | 39.75 | | | (0.44 | )(b) | | | 9.82 | | | | 9.38 | | | | — | | | | (6.02 | ) | | | (6.02 | ) |
For the Year Ended October 31, 1999 | | | | | | | | | | | | | | | | | | | | | | | | | | | |
Institutional Shares | | | 32.57 | | | (0.23 | )(b) | | | 9.34 | | | | 9.11 | | | | — | | | | (1.61 | ) | | | (1.61 | ) |
Service Shares | | | 32.40 | | | (0.31 | )(b) | | | 9.27 | | | | 8.96 | | | | — | | | | (1.61 | ) | | | (1.61 | ) |
| (a) | Assumes investment at the net asset value at the beginning of the period, reinvestment of all dividends and distributions, a complete redemption of the investment at the net asset value at the end of the period and no sales charges. Total return would be reduced if sales or redemption charges were taken into account. Total returns for periods less than one full year are not annualized. Returns do not reflect the deduction of taxes that the shareholder would pay on fund distributions or the redemption of fund shares. |
| (b) | Calculated based on average shares outstanding methodology. |
| | |
| 62 | | The accompanying notes are an integral part of these financial statements. |
COMMERCE FUNDS
| | | | | | | | | | | | | | | | | | | | | |
| | | | | | | | | | | | | | Ratios assuming no
expense reductions
| | | | |
Net asset
value, end
of period | | Total
return(a) | | | Net assets
at end of
period
(in 000s) | | Ratio of net expenses to
average net assets | | | Ratio of net investment
income (loss) to
average net assets | | | Ratio of total expenses to
average net assets | | | Ratio of
net investment
income (loss) to
average net assets | | | Portfolio
turnover
rate | |
| | |
| | | | | | | | | | | | | | | | | | | | | | |
| $21.67 | | 4.10 | % | | $ | 119,985 | | 1.13 | %(c) | | 0.84 | %(c) | | 1.15 | %(c) | | 0.82 | %(c) | | 36 | % |
| 21.68 | | 3.97 | | | | 621 | | 1.38 | (c) | | 0.58 | (c) | | 1.40 | (c) | | 0.56 | (c) | | 36 | |
| | | | | | | | | | | | | | | | | | | | | | |
| | | | | | | | | | | | | | | | | | | | | | |
| 20.92 | | 17.29 | | | | 122,881 | | 1.12 | | | 1.31 | | | 1.14 | | | 1.29 | | | 76 | |
| 20.93 | | 16.99 | | | | 584 | | 1.37 | | | 1.07 | | | 1.39 | | | 1.05 | | | 76 | |
| | | | | | | | | | | | | | | | | | | | | | |
| | | | | | | | | | | | | | | | | | | | | | |
| 18.07 | | (13.18 | ) | | | 102,049 | | 1.06 | | | 1.15 | | | 1.08 | | | 1.13 | | | 72 | |
| 18.08 | | (13.37 | ) | | | 567 | | 1.31 | | | 0.89 | | | 1.33 | | | 0.87 | | | 72 | |
| | | | | | | | | | | | | | | | | | | | | | |
| | | | | | | | | | | | | | | | | | | | | | |
| 21.05 | | (11.16 | ) | | | 110,155 | | 1.08 | | | 0.91 | | | 1.10 | | | 0.89 | | | 65 | |
| 21.05 | | (11.39 | ) | | | 878 | | 1.33 | | | 0.67 | | | 1.35 | | | 0.65 | | | 65 | |
| | | | | | | | | | | | | | | | | | | | | | |
| | | | | | | | | | | | | | | | | | | | | | |
| 24.88 | | 17.06 | | | | 95,765 | | 1.13 | | | 0.78 | | | 1.14 | | | 0.77 | | | 88 | |
| 24.88 | | 16.72 | | | | 1,067 | | 1.38 | | | 0.52 | | | 1.40 | | | 0.51 | | | 88 | |
| | | | | | | | | | | | | | | | | | | | | | |
| | | | | | | | | | | | | | | | | | | | | | |
| 21.40 | | 0.29 | | | | 74,591 | | 1.15 | | | 0.67 | | | 1.15 | | | 0.67 | | | 64 | |
| 21.41 | | 0.02 | | | | 989 | | 1.40 | | | 0.42 | | | 1.40 | | | 0.42 | | | 64 | |
| | | | | | | | | | | | | | | | | | | | | | |
| | |
| | | | | | | | | | | | | | | | | | | | | | |
| $25.10 | | 6.31 | % | | $ | 81,222 | | 1.22 | %(c) | | (0.57 | )%(c) | | 1.24 | %(c) | | (0.59 | )%(c) | | 68 | % |
| 24.55 | | 6.19 | | | | 1,610 | | 1.47 | (c) | | (0.82 | )(c) | | 1.49 | (c) | | (0.84 | )(c) | | 68 | |
| | | | | | | | | | | | | | | | | | | | | | |
| | | | | | | | | | | | | | | | | | | | | | |
| 23.61 | | 28.04 | | | | 78,744 | | 1.22 | | | (0.70 | ) | | 1.24 | | | (0.72 | ) | | 89 | |
| 23.12 | | 27.73 | | | | 1,474 | | 1.47 | | | (0.95 | ) | | 1.49 | | | (0.97 | ) | | 89 | |
| | | | | | | | | | | | | | | | | | | | | | |
| | | | | | | | | | | | | | | | | | | | | | |
| 18.44 | | (13.71 | ) | | | 65,005 | | 1.21 | | | (0.91 | ) | | 1.23 | | | (0.93 | ) | | 93 | |
| 18.10 | | (13.97 | ) | | | 1,203 | | 1.45 | | | (1.15 | ) | | 1.47 | | | (1.17 | ) | | 93 | |
| | | | | | | | | | | | | | | | | | | | | | |
| | | | | | | | | | | | | | | | | | | | | | |
| 21.37 | | (44.12 | ) | | | 91,567 | | 1.14 | | | (0.88 | ) | | 1.16 | | | (0.90 | ) | | 124 | |
| 21.04 | | (44.24 | ) | | | 2,228 | | 1.39 | | | (1.13 | ) | | 1.41 | | | (1.15 | ) | | 124 | |
| | | | | | | | | | | | | | | | | | | | | | |
| | | | | | | | | | | | | | | | | | | | | | |
| 43.62 | | 26.19 | | | | 187,070 | | 1.14 | | | (0.80 | ) | | 1.15 | | | (0.79 | ) | | 112 | |
| 43.11 | | 25.88 | | | | 4,340 | | 1.39 | | | (1.05 | ) | | 1.40 | | | (1.04 | ) | | 112 | |
| | | | | | | | | | | | | | | | | | | | | | |
| | | | | | | | | | | | | | | | | | | | | | |
| 40.07 | | 28.96 | | | | 143,892 | | 1.14 | | | (0.63 | ) | | 1.14 | | | (0.63 | ) | | 98 | |
| 39.75 | | 28.63 | | | | 3,384 | | 1.39 | | | (0.86 | ) | | 1.39 | | | (0.86 | ) | | 98 | |
| | | | | | | | | | | | | | | | | | | | | | |
63
COMMERCE FUNDS
Financial Highlights
Selected Data for a Share Outstanding Throughout Each Period
| | | | | | | | | | | | | | | | | | | | | | | | | | | |
| | | | | Income (loss) from
investment operations
| | | Distributions
to shareholders
| |
| | | Net asset
value,
beginning
of period | | Net
investment
income (loss) | | | Net realized
and unrealized
gain (loss) | | | Total from
investment
operations | | | From net
investment
income | | | From net
realized
gains | | | Total
distributions | |
INTERNATIONAL EQUITY FUND | |
For the Six Months Ended April 30, 2004 (Unaudited) | | | | | | | | | | | | | | | | | | | | | | | | | | | |
Institutional Shares | | $ | 16.86 | | $ | 0.08 | (b) | | $ | 1.92 | | | $ | 2.00 | | | $ | (0.25 | ) | | $ | — | | | $ | (0.25 | ) |
Service Shares | | | 16.69 | | | 0.07 | (b) | | | 1.89 | | | | 1.96 | | | | (0.21 | ) | | | — | | | | (0.21 | ) |
For the Year Ended October 31, 2003 | | | | | | | | | | | | | | | | | | | | | | | | | | | |
Institutional Shares | | | 14.61 | | | 0.23 | (b) | | | 2.08 | | | | 2.31 | | | | (0.06 | ) | | | — | | | | (0.06 | ) |
Service Shares | | | 14.47 | | | 0.18 | (b) | | | 2.06 | | | | 2.24 | | | | (0.02 | ) | | | — | | | | (0.02 | ) |
For the Year Ended October 31, 2002 | | | | | | | | | | | | | | | | | | | | | | | | | | | |
Institutional Shares | | | 16.99 | | | 0.06 | (b) | | | (2.44 | ) | | | (2.38 | ) | | | — | | | | — | | | | — | |
Service Shares | | | 16.87 | | | 0.02 | (b) | | | (2.42 | ) | | | (2.40 | ) | | | — | | | | — | | | | — | |
For the Year Ended October 31, 2001 | | | | | | | | | | | | | | | | | | | | | | | | | | | |
Institutional Shares | | | 26.46 | | | — | (b) | | | (6.84 | ) | | | (6.84 | ) | | | — | | | | (2.63 | ) | | | (2.63 | ) |
Service Shares | | | 26.37 | | | (0.06 | )(b) | | | (6.81 | ) | | | (6.87 | ) | | | — | | | | (2.63 | ) | | | (2.63 | ) |
For the Year Ended October 31, 2000 | | | | | | | | | | | | | | | | | | | | | | | | | | | |
Institutional Shares | | | 27.39 | | | (0.01 | )(b) | | | 0.43 | | | | 0.42 | | | | (0.06 | ) | | | (1.29 | ) | | | (1.35 | ) |
Service Shares | | | 27.30 | | | (0.08 | )(b) | | | 0.44 | | | | 0.36 | | | | — | | | | (1.29 | ) | | | (1.29 | ) |
For the Year Ended October 31, 1999 | | | | | | | | | | | | | | | | | | | | | | | | | | | |
Institutional Shares | | | 23.00 | | | 0.09 | | | | 4.40 | | | | 4.49 | | | | (0.10 | ) | | | — | | | | (0.10 | ) |
Service Shares | | | 22.92 | | | 0.10 | | | | 4.34 | | | | 4.44 | | | | (0.06 | ) | | | — | | | | (0.06 | ) |
ASSET ALLOCATION FUND | |
For the Six Months Ended April 30, 2004 (Unaudited) | | | | | | | | | | | | | | | | | | | | | | | | | | | |
Institutional Shares | | $ | 20.42 | | $ | 0.21 | (b) | | $ | 0.58 | | | $ | 0.79 | | | $ | (0.24 | ) | | $ | (0.32 | ) | | $ | (0.56 | ) |
Service Shares | | | 20.41 | | | 0.18 | (b) | | | 0.58 | | | | 0.76 | | | | (0.21 | ) | | | (0.32 | ) | | | (0.53 | ) |
For the Year Ended October 31, 2003 | | | | | | | | | | | | | | | | | | | | | | | | | | | |
Institutional Shares | | | 18.48 | | | 0.39 | (b) | | | 1.94 | | | | 2.33 | | | | (0.37 | ) | | | (0.02 | ) | | | (0.39 | ) |
Service Shares | | | 18.48 | | | 0.34 | (b) | | | 1.93 | | | | 2.27 | | | | (0.32 | ) | | | (0.02 | ) | | | (0.34 | ) |
For the Period Ended October 31, 2002 | | | | | | | | | | | | | | | | | | | | | | | | | | | |
Institutional Shares (commenced September 27, 2002) | | | 18.00 | | | 0.03 | (b) | | | 0.45 | | | | 0.48 | | | | — | | | | — | | | | — | |
Service Shares (commenced September 27, 2002) | | | 18.00 | | | 0.03 | (b) | | | 0.45 | | | | 0.48 | | | | — | | | | — | | | | — | |
| (a) | Assumes investment at the net asset value at the beginning of the period, reinvestment of all dividends and distributions, a complete redemption of the investment at the net asset value at the end of the period and no sales charges. Total return would be reduced if sales or redemption charges were taken into account. Total returns for periods less than one full year are not annualized. Returns do not reflect the deduction of taxes that the shareholder would pay on fund distributions or the redemption of fund shares. |
| (b) | Calculated based on average shares outstanding methodology. |
| (d) | Expense ratios exclude expenses of the Underlying Funds. |
| | |
| 64 | | The accompanying notes are an integral part of these financial statements. |
COMMERCE FUNDS
| | | | | | | | | | | | | | | | | | | | | |
| | | | | | | | | | | | | | Ratios assuming no
expense reductions
| | | | |
Net asset
value, end
of period | | Total
return(a) | | | Net assets
at end of
period
(in 000s) | | Ratio of
net expenses to
average net assets | | | Ratio of
net investment
income (loss) to
average net assets | | | Ratio of total
expenses to
average net assets | | | Ratio of
net investment
income (loss) to
average net assets | | | Portfolio
turnover
rate | |
| | |
| | | | | | | | | | | | | | | | | | | | | | |
| $18.61 | | 11.86 | % | | $ | 132,577 | | 1.30 | %(c) | | 0.86 | %(c) | | 2.05 | %(c) | | 0.11 | %(c) | | 11 | % |
18.44 | | 11.71 | | | | 473 | | 1.55 | (c) | | 0.73 | (c) | | 2.30 | (c) | | (0.02 | )(c) | | 11 | |
| | | | | | | | | | | | | | | | | | | | | | |
| 16.86 | | 15.87 | | | | 147,956 | | 1.25 | | | 1.52 | | | 1.98 | | | 0.79 | | | 24 | |
16.69 | | 15.47 | | | | 407 | | 1.50 | | | 1.19 | | | 2.23 | | | 0.46 | | | 24 | |
| | | | | | | | | | | | | | | | | | | | | | |
| 14.61 | | (14.01 | ) | | | 112,347 | | 1.55 | | | 0.38 | | | 2.18 | | | (0.25 | ) | | 98 | |
14.47 | | (14.23 | ) | | | 382 | | 1.80 | | | 0.12 | | | 2.43 | | | (0.51 | ) | | 98 | |
| | | | | | | | | | | | | | | | | | | | | | |
| 16.99 | | (28.40 | ) | | | 108,206 | | 1.47 | | | (0.01 | ) | | 2.05 | | | (0.59 | ) | | 33 | |
16.87 | | (28.63 | ) | | | 516 | | 1.72 | | | (0.30 | ) | | 2.30 | | | (0.88 | ) | | 33 | |
| | | | | | | | | | | | | | | | | | | | | | |
| 26.46 | | 1.24 | | | | 166,063 | | 1.35 | | | (0.05 | ) | | 1.92 | | | (0.60 | ) | | 47 | |
26.37 | | 1.03 | | | | 768 | | 1.60 | | | (0.29 | ) | | 2.17 | | | (0.84 | ) | | 47 | |
| | | | | | | | | | | | | | | | | | | | | | |
| 27.39 | | 19.58 | | | | 128,018 | | 1.53 | | | 0.40 | | | 2.08 | | | (0.13 | ) | | 32 | |
27.30 | | 19.39 | | | | 499 | | 1.78 | | | 0.33 | | | 2.33 | | | (0.20 | ) | | 32 | |
| | |
| | | | | | | | | | | | | | | | | | | | | | |
| $20.65 | | 3.93 | % | | $ | 20,247 | | 0.35 | %(c)(d) | | 2.00 | %(c) | | 1.11 | %(c)(d) | | 1.24 | %(c) | | 12 | % |
20.64 | | 3.81 | | | | 447 | | 0.60 | (c)(d) | | 1.75 | (c) | | 1.36 | (c)(d) | | 0.99 | (c) | | 12 | |
| | | | | | | | | | | | | | | | | | | | | | |
| 20.42 | | 12.72 | | | | 20,801 | | 0.35 | (c)(d) | | 2.07 | | | 2.29 | (c)(d) | | 0.13 | | | 47 | |
20.41 | | 12.40 | | | | 437 | | 0.60 | (c)(d) | | 1.82 | | | 2.54 | (c)(d) | | (0.12 | ) | | 47 | |
| | | | | | | | | | | | | | | | | | | | | | |
| 18.48 | | 2.67 | | | | 18,234 | | 0.35 | (c)(d) | | 2.80 | (c) | | 81.34 | (c)(d) | | (78.19 | )(c) | | 0 | |
18.48 | | 2.67 | | | | 428 | | 0.60 | (c)(d) | | 1.93 | (c) | | 81.59 | (c)(d) | | (79.06 | )(c) | | 0 | |
65
COMMERCE FUNDS
Financial Highlights
Selected Data for a Share Outstanding Throughout Each Period
| | | | | | | | | | | | | | | | | | | | | | | | | | | | | | |
| | | | | Income (loss) from
investment operations
| | Distributions
to shareholders
| |
| | | Net asset
value,
beginning
of period | | Net
investment
income | | | Net realized
and unrealized
gain (loss) | | | Total from
investment
operations | | From net
investment
income | | | In excess
of net
investment
income | | | From net
realized
gains | | | Total
distributions | |
BOND FUND | |
For the Six Months Ended April 30, 2004 (Unaudited) | | | | | | | | | | | | | | | | | | | | | | | | | | | |
Institutional Shares | | $ | 18.73 | | $ | 0.39 | (b) | | $ | (0.18 | ) | | $ | 0.21 | | $ | (0.44 | ) | | $ | — | | | $ | — | | | $ | (0.44 | ) |
Service Shares | | | 18.74 | | | 0.37 | (b) | | | (0.17 | ) | | | 0.20 | | | (0.42 | ) | | | — | | | | — | | | | (0.42 | ) |
For the Year Ended October 31, 2003 | | | | | | | | | | | | | | | | | | | | | | | | | | | | | | |
Institutional Shares | | | 19.09 | | | 0.94 | (b) | | | (0.24 | ) | | | 0.70 | | | (1.06 | ) | | | — | | | | — | | | | (1.06 | ) |
Service Shares | | | 19.10 | | | 0.90 | (b) | | | (0.25 | ) | | | 0.65 | | | (1.01 | ) | | | — | | | | — | | | | (1.01 | ) |
For the Year Ended October 31, 2002 | | | | | | | | | | | | | | | | | | | | | | | | | | | | | | |
Institutional Shares | | | 19.71 | | | 1.07 | (b)(c) | | | (0.57 | )(c) | | | 0.50 | | | (1.12 | ) | | | — | | | | — | | | | (1.12 | ) |
Service Shares | | | 19.73 | | | 1.03 | (b)(c) | | | (0.58 | )(c) | | | 0.45 | | | (1.08 | ) | | | — | | | | — | | | | (1.08 | ) |
For the Year Ended October 31, 2001 | | | | | | | | | | | | | | | | | | | | | | | | | | | | | | |
Institutional Shares | | | 18.33 | | | 1.17 | (b) | | | 1.44 | | | | 2.61 | | | (1.21 | ) | | | (0.02 | ) | | | — | | | | (1.23 | ) |
Service Shares | | | 18.35 | | | 1.11 | (b) | | | 1.46 | | | | 2.57 | | | (1.17 | ) | | | (0.02 | ) | | | — | | | | (1.19 | ) |
For the Year Ended October 31, 2000 | | | | | | | | | | | | | | | | | | | | | | | | | | | | | | |
Institutional Shares | | | 18.57 | | | 1.16 | (b) | | | (0.17 | ) | | | 0.99 | | | (1.19 | ) | | | — | | | | (0.04 | ) | | | (1.23 | ) |
Service Shares | | | 18.57 | | | 1.11 | (b) | | | (0.15 | ) | | | 0.96 | | | (1.14 | ) | | | — | | | | (0.04 | ) | | | (1.18 | ) |
For the Year Ended October 31, 1999 | | | | | | | | | | | | | | | | | | | | | | | | | | | | | | |
Institutional Shares | | | 19.84 | | | 1.16 | | | | (1.04 | ) | | | 0.12 | | | (1.16 | ) | | | — | | | | (0.23 | ) | | | (1.39 | ) |
Service Shares | | | 19.85 | | | 1.11 | | | | (1.05 | ) | | | 0.06 | | | (1.11 | ) | | | — | | | | (0.23 | ) | | | (1.34 | ) |
SHORT-TERM GOVERNMENT FUND | |
For the Six Months Ended April 30, 2004 (Unaudited) | | | | | | | | | | | | | | | | | | | | | | | | | | | |
Institutional Shares | | $ | 18.53 | | $ | 0.25 | (b) | | $ | (0.15 | ) | | $ | 0.10 | | $ | (0.39 | ) | | $ | — | | | $ | — | | | $ | (0.39 | ) |
Service Shares | | | 18.54 | | | 0.22 | (b) | | | (0.14 | ) | | | 0.08 | | | (0.37 | ) | | | — | | | | — | | | | (0.37 | ) |
For the Year Ended October 31, 2003 | | | | | | | | | | | | | | | | | | | | | | | | | | | | | | |
Institutional Shares | | | 19.04 | | | 0.51 | (b) | | | (0.22 | ) | | | 0.29 | | | (0.80 | ) | | | — | | | | — | | | | (0.80 | ) |
Service Shares | | | 19.06 | | | 0.47 | (b) | | | (0.24 | ) | | | 0.23 | | | (0.75 | ) | | | — | | | | — | | | | (0.75 | ) |
For the Year Ended October 31, 2002 | | | | | | | | | | | | | | | | | | | | | | | | | | | | | | |
Institutional Shares | | | 19.20 | | | 0.83 | (b)(d) | | | (0.05 | )(d) | | | 0.78 | | | (0.94 | ) | | | — | | | | — | | | | (0.94 | ) |
Service Shares | | | 19.21 | | | 0.78 | (b)(d) | | | (0.04 | )(d) | | | 0.74 | | | (0.89 | ) | | | — | | | | — | | | | (0.89 | ) |
For the Year Ended October 31, 2001 | | | | | | | | | | | | | | | | | | | | | | | | | | | | | | |
Institutional Shares | | | 18.10 | | | 1.03 | (b) | | | 1.10 | | | | 2.13 | | | (1.03 | ) | | | — | | | | — | | | | (1.03 | ) |
Service Shares | | | 18.11 | | | 0.98 | (b) | | | 1.10 | | | | 2.08 | | | (0.98 | ) | | | — | | | | — | | | | (0.98 | ) |
For the Year Ended October 31, 2000 | | | | | | | | | | | | | | | | | | | | | | | | | | | | | | |
Institutional Shares | | | 18.06 | | | 1.03 | (b) | | | 0.04 | | | | 1.07 | | | (1.03 | ) | | | — | | | | — | | | | (1.03 | ) |
Service Shares | | | 18.07 | | | 0.98 | (b) | | | 0.05 | | | | 1.03 | | | (0.99 | ) | | | — | | | | — | | | | (0.99 | ) |
For the Year Ended October 31, 1999 | | | | | | | | | | | | | | | | | | | | | | | | | | | | | | |
Institutional Shares | | | 18.78 | | | 1.04 | | | | (0.71 | ) | | | 0.33 | | | (1.04 | ) | | | — | | | | (0.01 | ) | | | (1.05 | ) |
Service Shares | | | 18.79 | | | 1.00 | | | | (0.72 | ) | | | 0.28 | | | (0.99 | ) | | | — | | | | (0.01 | ) | | | (1.00 | ) |
| (a) | | Assumes investment at the net asset value at the beginning of the period, reinvestment of all dividends and distributions, a complete redemption of the investment at the net asset value at the end of the period and no sales charges. Total return would be reduced if sales or redemption charges were taken into account. Total returns for periods less than one full year are not annualized. Returns do not reflect the deduction of taxes that a shareholder would pay on fund distributions or the redemption of fund shares. |
| (b) | Calculated based on average shares outstanding methodology. |
| (c) | As required, effective November 1, 2001, the Fund has adopted the provisions of the AICPA Audit and Accounting Guide for Investment Companies and began amortizing/accreting premiums and discounts on debt securities. The effect of this change for the year ended October 31, 2002 was to decrease net investment income per share by $0.05, increase net realized and unrealized gains and losses per share by $0.05, and decrease the ratio of net investment income to average net assets with and without expense reductions by 0.26% for each class. Per share ratios and supplemental data for years prior to November 1, 2001 have not been restated to reflect this change in presentation. |
| (d) | As required, effective November 1, 2001, the Fund has adopted the provisions of the AICPA Audit and Accounting Guide for Investment Companies and began amortizing/accreting premiums and discounts on debt securities. The effect of this change for the year ended October 31, 2002 was to decrease net investment income per share by $0.09, increase net realized and unrealized gains and losses per share by $0.09, and decrease the ratio of net investment income to average net assets with and without expense reductions by 0.46% for each class. Per share ratios and supplemental data for years prior to November 1, 2001 have not been restated to reflect this change in presentation. |
| | |
| 66 | | The accompanying notes are an integral part of these financial statements. |
COMMERCE FUNDS
| | | | | | | | | | | | | | | | | | | | | |
| | | | | | | | | | | | | | Ratios assuming no
expense reductions
| | | | |
Net asset
value, end
of period | | Total
return(a) | | | Net assets
at end of
period
(in 000s) | | Ratio of
net expenses to
average net assets | | | Ratio of
net investment
income to
average net assets | | | Ratio of total
expenses to
average net assets | | | Ratio of
net investment
income to
average net assets | | | Portfolio
turnover
rate | |
| | |
| | | | | | | | | | | | | | | | | | | | | | |
| $18.50 | | 1.13 | % | | $ | 630,941 | | 0.81 | %(e) | | 4.20 | %(e) | | 0.83 | %(e) | | 4.18 | %(e) | | 23 | % |
| 18.52 | | 1.06 | | | | 989 | | 1.06 | (e) | | 3.96 | (e) | | 1.08 | (e) | | 3.94 | (e) | | 23 | |
| | | | | | | | | | | | | | | | | | | | | | |
| 18.73 | | 3.71 | | | | 650,903 | | 0.79 | | | 4.97 | | | 0.81 | | | 4.95 | | | 26 | |
| 18.74 | | 3.45 | | | | 1,165 | | 1.04 | | | 4.72 | | | 1.06 | | | 4.70 | | | 26 | |
| | | | | | | | | | | | | | | | | | | | | | |
| 19.09 | | 2.69 | | | | 728,021 | | 0.72 | | | 5.59 | (c) | | 0.74 | | | 5.57 | (c) | | 34 | |
| 19.10 | | 2.38 | | | | 1,371 | | 0.97 | | | 5.34 | (c) | | 0.99 | | | 5.32 | (c) | | 34 | |
| | | | | | | | | | | | | | | | | | | | | | |
| 19.71 | | 14.70 | | | | 744,329 | | 0.73 | | | 6.12 | | | 0.75 | | | 6.10 | | | 30 | |
| 19.73 | | 14.41 | | | | 1,299 | | 0.98 | | | 5.86 | | | 1.00 | | | 5.84 | | | 30 | |
| | | | | | | | | | | | | | | | | | | | | | |
| 18.33 | | 5.59 | | | | 325,732 | | 0.81 | | | 6.38 | | | 0.81 | | | 6.38 | | | 26 | |
| 18.35 | | 5.44 | | | | 1,181 | | 1.06 | | | 6.10 | | | 1.06 | | | 6.10 | | | 26 | |
| | | | | | | | | | | | | | | | | | | | | | |
| 18.57 | | 0.59 | | | | 374,121 | | 0.81 | | | 6.05 | | | 0.81 | | | 6.05 | | | 16 | |
| 18.57 | | 0.29 | | | | 1,180 | | 1.06 | | | 5.80 | | | 1.06 | | | 5.80 | | | 16 | |
| | |
| | | | | | | | | | | | | | | | | | | | | | |
| $18.24 | | 0.55 | % | | $ | 252,299 | | 0.68 | %(e) | | 2.68 | %(e) | | 0.83 | %(e) | | 2.53 | %(e) | | 40 | % |
| 18.25 | | 0.42 | | | | 2,095 | | 0.93 | (e) | | 2.44 | (e) | | 1.08 | (e) | | 2.29 | (e) | | 40 | |
| | | | | | | | | | | | | | | | | | | | | | |
| 18.53 | | 1.52 | | | | 259,936 | | 0.68 | | | 2.73 | | | 0.81 | | | 2.60 | | | 34 | |
| 18.54 | | 1.22 | | | | 2,867 | | 0.93 | | | 2.49 | | | 1.06 | | | 2.36 | | | 34 | |
| | | | | | | | | | | | | | | | | | | | | | |
| 19.04 | | 4.21 | | | | 184,246 | | 0.68 | | | 4.41 | (d) | | 0.82 | | | 4.27 | (d) | | 15 | |
| 19.06 | | 4.00 | | | | 2,159 | | 0.93 | | | 4.16 | (d) | | 1.07 | | | 4.02 | (d) | | 15 | |
| | | | | | | | | | | | | | | | | | | | | | |
| 19.20 | | 12.07 | | | | 117,813 | | 0.68 | | | 5.54 | | | 0.89 | | | 5.33 | | | 40 | |
| 19.21 | | 11.79 | | | | 1,931 | | 0.93 | | | 5.26 | | | 1.14 | | | 5.05 | | | 40 | |
| | | | | | | | | | | | | | | | | | | | | | |
| 18.10 | | 6.15 | | | | 81,484 | | 0.68 | | | 5.72 | | | 0.92 | | | 5.48 | | | 39 | |
| 18.11 | | 5.89 | | | | 1,043 | | 0.93 | | | 5.47 | | | 1.17 | | | 5.23 | | | 39 | |
| | | | | | | | | | | | | | | | | | | | | | |
| 18.06 | | 1.83 | | | | 116,163 | | 0.68 | | | 5.65 | | | 0.92 | | | 5.41 | | | 10 | |
| 18.07 | | 1.57 | | | | 1,022 | | 0.93 | | | 5.46 | | | 1.17 | | | 5.22 | | | 10 | |
67
COMMERCE FUNDS
Financial Highlights
Selected Data for a Share Outstanding Throughout Each Period
| | | | | | | | | | | | | | | | | | | | | | | | | | | |
| | | | | Income (loss) from investment operations
| | | Distributions to shareholders
| |
| | | Net asset value, beginning of period | | Net investment income | | | Net realized and unrealized gain (loss) | | | Total from investment operations | | | From net investment income | | | From net realized gains | | | Total distributions | |
NATIONAL TAX-FREE INTERMEDIATE BOND FUND | |
For the Six Months Ended April 30, 2004 (Unaudited) | | | | | | | | | | | | | | | | | | | | | | | | | | | |
Institutional Shares | | $ | 19.74 | | $ | 0.35 | (b) | | $ | (0.25 | ) | | $ | 0.10 | | | $ | (0.35 | ) | | $ | (0.31 | ) | | $ | (0.66 | ) |
Service Shares | | | 19.74 | | | 0.33 | (b) | | | (0.24 | ) | | | 0.09 | | | | (0.33 | ) | | | (0.31 | ) | | | (0.64 | ) |
For the Year Ended October 31, 2003 | | | | | | | | | | | | | | | | | | | | | | | | | | | |
Institutional Shares | | | 19.68 | | | 0.73 | (b) | | | 0.22 | | | | 0.95 | | | | (0.73 | ) | | | (0.16 | ) | | | (0.89 | ) |
Service Shares | | | 16.68 | | | 0.70 | (b) | | | 0.20 | | | | 0.90 | | | | (0.68 | ) | | | (0.16 | ) | | | (0.84 | ) |
For the Year Ended October 31, 2002 | | | | | | | | | | | | | | | | | | | | | | | | | | | |
Institutional Shares | | | 19.69 | | | 0.76 | (b)(d) | | | 0.24 | (d) | | | 1.00 | | | | (0.76 | ) | | | (0.25 | ) | | | (1.01 | ) |
Service Shares | | | 19.69 | | | 0.71 | (b)(d) | | | 0.24 | (d) | | | 0.95 | | | | (0.71 | ) | | | (0.25 | ) | | | (0.96 | ) |
For the Year Ended October 31, 2001 | | | | | | | | | | | | | | | | | | | | | | | | | | | |
Institutional Shares | | | 18.73 | | | 0.81 | (b) | | | 0.96 | | | | 1.77 | | | | (0.81 | ) | | | — | | | | (0.81 | ) |
Service Shares (commenced December 26, 2000) | | | 19.08 | | | 0.66 | (b) | | | 0.61 | | | | 1.27 | | | | (0.66 | ) | | | — | | | | (0.66 | ) |
For the Year Ended October 31, 2000 | | | | | | | | | | | | | | | | | | | | | | | | | | | |
Institutional Shares | | | 18.24 | | | 0.78 | (b) | | | 0.51 | | | | 1.29 | | | | (0.79 | ) | | | (0.01 | ) | | | (0.80 | ) |
For the Year Ended October 31, 1999 | | | | | | | | | | | | | | | | | | | | | | | | | | | |
Institutional Shares | | | 19.33 | | | 0.74 | | | | (0.93 | ) | | | (0.19 | ) | | | (0.74 | ) | | | (0.16 | ) | | | (0.90 | ) |
| | | | | | | | | | | | | | | | | | | | | | | | | | | | |
MISSOURI TAX-FREE INTERMEDIATE BOND FUND | |
For the Six Months Ended April 30, 2004 (Unaudited) | | | | | | | | | | | | | | | | | | | | | | | | | | | |
Institutional Shares | | $ | 19.73 | | $ | 0.35 | (b) | | $ | (0.25 | ) | | $ | 0.10 | | | $ | (0.35 | ) | | $ | (0.04 | ) | | $ | (0.39 | ) |
Service Shares | | | 19.75 | | | 0.33 | (b) | | | (0.26 | ) | | | 0.07 | | | | (0.33 | ) | | | (0.04 | ) | | | (0.37 | ) |
For the Year Ended October 31, 2003 | | | | | | | | | | | | | | | | | | | | | | | | | | | |
Institutional Shares | | | 19.68 | | | 0.72 | (b) | | | 0.15 | | | | 0.87 | | | | (0.72 | ) | | | (0.10 | ) | | | (0.82 | ) |
Service Shares | | | 19.69 | | | 0.67 | (b) | | | 0.16 | | | | 0.83 | | | | (0.67 | ) | | | (0.10 | ) | | | (0.77 | ) |
For the Year Ended October 31, 2002 | | | | | | | | | | | | | | | | | | | | | | | | | | | |
Institutional Shares | | | 19.45 | | | 0.75 | (b)(d) | | | 0.26 | (d) | | | 1.01 | | | | (0.75 | ) | | | (0.03 | ) | | | (0.78 | ) |
Service Shares | | | 19.45 | | | 0.69 | (b)(d) | | | 0.28 | (d) | | | 0.97 | | | | (0.70 | ) | | | (0.03 | ) | | | (0.73 | ) |
For the Year Ended October 31, 2001 | | | | | | | | | | | | | | | | | | | | | | | | | | | |
Institutional Shares | | | 18.53 | | | 0.80 | (b) | | | 0.92 | | | | 1.72 | | | | (0.80 | ) | | | — | | | | (0.80 | ) |
Service Shares (commenced December 26, 2000) | | | 18.87 | | | 0.65 | (b) | | | 0.58 | | | | 1.23 | | | | (0.65 | ) | | | — | | | | (0.65 | ) |
For the Year Ended October 31, 2000 | | | | | | | | | | | | | | | | | | | | | | | | | | | |
Institutional Shares | | | 18.07 | | | 0.78 | (b) | | | 0.46 | | | | 1.24 | | | | (0.78 | ) | | | — | | | | (0.78 | ) |
For the Year Ended October 31, 1999 | | | | | | | | | | | | | | | | | | | | | | | | | | | |
Institutional Shares | | | 19.07 | | | 0.73 | | | | (0.90 | ) | | | (0.17 | ) | | | (0.73 | ) | | | (0.10 | ) | | | (0.83 | ) |
| (a) | | Assumes investment at the net asset value at the beginning of the period, reinvestment of all dividends and distributions, a complete redemption of the investment at the net asset value at the end of the period and no sales charges. Total return would be reduced if sales or redemption charges were taken into account. Total returns for periods less than one full year are not annualized. Returns do not reflect the deduction of taxes that the shareholder would pay on capital gains or other taxable distributions or the redemption of fund shares. |
| (b) | | Calculated based on average shares outstanding methodology. |
| (d) | | As required, effective November 1, 2001, the Fund has adopted the provisions of the AICPA Audit and Accounting Guide for Investment Companies and began amortizing/accreting premiums and discounts on debt securities. The effect of this change for the year ended October 31, 2002 was an impact of less than $0.01 to net investment income, net realized and unrealized gains and losses, and an increase to the ratio of net investment income to average net assets with and without expense reductions by 0.02%. Per share ratios and supplemental data for periods prior to November 1, 2001 have not been restated to reflect this change in presentation. |
| | |
| 68 | | The accompanying notes are an integral part of these financial statements. |
COMMERCE FUNDS
| | | | | | | | | | | | | | | | | | | | | |
| | | | | | | | | | | | | | Ratios assuming no expense reductions
| | | | |
Net asset value, end of period | | Total return(a) | | | Net assets at end of period (in 000s) | | Ratio of net expenses to average net assets | | | Ratio of net investment income to average net assets | | | Ratio of total expenses to average net assets | | | Ratio of net investment income to average net assets | | | Portfolio turnover rate | |
| | |
| | | | | | | | | | | | | | | | | | | | | | |
| $19.18 | | 0.47 | % | | $ | 170,956 | | 0.70 | %(c) | | 3.60 | %(c) | | 0.84 | %(c) | | 3.46 | %(c) | | 15 | % |
| 19.19 | | 0.42 | | | | 5 | | 0.95 | (c) | | 3.39 | (c) | | 1.09 | (c) | | 3.25 | (c) | | 15 | |
| | | | | | | | | | | | | | | | | | | | | | |
| 19.74 | | 4.88 | | | | 175,427 | | 0.70 | | | 3.69 | | | 0.82 | | | 3.57 | | | 57 | |
| 19.74 | | 4.64 | | | | 5 | | 0.95 | | | 3.52 | | | 1.07 | | | 3.40 | | | 57 | |
| | | | | | | | | | | | | | | | | | | | | | |
| 19.68 | | 5.30 | | | | 174,059 | | 0.70 | | | 3.93 | (d) | | 0.77 | | | 3.86 | (d) | | 42 | |
| 19.68 | | 5.05 | | | | 23 | | 0.95 | | | 3.70 | (d) | | 1.02 | | | 3.63 | (d) | | 42 | |
| | | | | | | | | | | | | | | | | | | | | | |
| 19.69 | | 9.62 | | | | 180,437 | | 0.70 | | | 4.25 | | | 0.81 | | | 4.14 | | | 55 | |
| 19.69 | | 6.78 | | | | 19 | | 0.95 | (c) | | 3.26 | (c) | | 1.06 | (c) | | 3.15 | (c) | | 55 | |
| | | | | | | | | | | | | | | | | | | | | | |
| 18.73 | | 7.17 | | | | 40,753 | | 0.70 | | | 4.23 | | | 0.94 | | | 3.99 | | | 56 | |
| | | | | | | | | | | | | | | | | | | | | | |
| 18.24 | | (1.08 | ) | | | 40,243 | | 0.70 | | | 3.90 | | | 0.93 | | | 3.67 | | | 35 | |
| | | | | | | | | | | | | | | | | | | | | | |
| | |
| | | | | | | | | | | | | | | | | | | | | | |
| $19.44 | | 0.51 | % | | $ | 178,760 | | 0.65 | %(c) | | 3.59 | %(c) | | 0.83 | %(c) | | 3.41 | %(c) | | 9 | % |
| 19.45 | | 0.33 | | | | 1,225 | | 0.90 | (c) | | 3.34 | (c) | | 1.08 | (c) | | 3.16 | (c) | | 9 | |
| | | | | | | | | | | | | | | | | | | | | | |
| 19.73 | | 4.50 | | | | 183,240 | | 0.65 | | | 3.64 | | | 0.81 | | | 3.48 | | | 16 | |
| 19.75 | | 4.29 | | | | 1,252 | | 0.90 | | | 3.39 | | | 1.06 | | | 3.23 | | | 16 | |
| | | | | | | | | | | | | | | | | | | | | | |
| 19.68 | | 5.31 | | | | 164,365 | | 0.65 | | | 3.88 | (d) | | 0.78 | | | 3.75 | (d) | | 20 | |
| 19.69 | | 5.10 | | | | 893 | | 0.90 | | | 3.58 | (d) | | 1.03 | | | 3.45 | (d) | | 20 | |
| | | | | | | | | | | | | | | | | | | | | | |
| 19.45 | | 9.43 | | | | 141,608 | | 0.65 | | | 4.20 | | | 0.82 | | | 4.03 | | | 21 | |
| 19.45 | | 6.60 | | | | 184 | | 0.90 | (c) | | 3.27 | (c) | | 1.07 | (c) | | 3.10 | (c) | | 21 | |
| | | | | | | | | | | | | | | | | | | | | | |
| 18.53 | | 7.05 | | | | 38,448 | | 0.65 | | | 4.29 | | | 0.95 | | | 4.09 | | | 29 | |
| | | | | | | | | | | | | | | | | | | | | | |
| 18.07 | | (0.95 | ) | | | 42,641 | | 0.65 | | | 3.91 | | | 0.92 | | | 3.64 | | | 21 | |
69
COMMERCE FUNDS
Financial Highlights
Selected Data for a Share Outstanding Throughout Each Period
| | | | | | | | | | | | | | | | | | | | | | | | | | |
| | | | | Income (loss) from investment operations
| | Distributions to shareholders
| |
| | | Net asset value, beginning of period | | Net investment income(b) | | | Net realized and unrealized gain (loss) | | | Total from investment operations | | From net investment income | | | From net realized gains | | | Total distributions | |
KANSAS TAX-FREE INTERMEDIATE BOND FUND | |
For the Six Months Ended April 30, 2004 (Unaudited) | | | | | | | | | | | | | | | | | | | | | | | | | | |
Institutional Shares | | $ | 19.19 | | $ | 0.34 | | | $ | (0.24 | ) | | $ | 0.10 | | $ | (0.34 | ) | | $ | (0.03 | ) | | $ | (0.37 | ) |
Service Shares | | | 19.19 | | | 0.32 | | | | (0.24 | ) | | | 0.08 | | | (0.32 | ) | | | (0.03 | ) | | | (0.35 | ) |
For the Year Ended October 31, 2003 | | | | | | | | | | | | | | | | | | | | | | | | | | |
Institutional Shares | | | 19.03 | | | 0.67 | | | | 0.18 | | | | 0.85 | | | (0.66 | ) | | | (0.03 | ) | | | (0.69 | ) |
Service Shares | | | 19.03 | | | 0.62 | | | | 0.18 | | | | 0.80 | | | (0.61 | ) | | | (0.03 | ) | | | (0.64 | ) |
For the Year Ended October 31, 2002 | | | | | | | | | | | | | | | | | | | | | | | | | | |
Institutional Shares | | | 18.75 | | | 0.67 | (d) | | | 0.28 | (d) | | | 0.95 | | | (0.67 | ) | | | — | (e) | | | (0.67 | ) |
Service Shares | | | 18.75 | | | 0.62 | (d) | | | 0.29 | (d) | | | 0.91 | | | (0.63 | ) | | | — | (e) | | | (0.63 | ) |
For the Period Ended October 31, 2001 | | | | | | | | | | | | | | | | | | | | | | | | | | |
Institutional Shares (commenced December 26, 2000) | | | 18.00 | | | 0.62 | | | | 0.75 | | | | 1.37 | | | (0.62 | ) | | | — | | | | (0.62 | ) |
Service Shares (commenced December 26, 2000) | | | 18.00 | | | 0.58 | | | | 0.75 | | | | 1.33 | | | (0.58 | ) | | | — | | | | (0.58 | ) |
| (a) | | Assumes investment at the net asset value at the beginning of the period, reinvestment of all dividends and distributions, a complete redemption of the investment at the net asset value at the end of the period and no sales charges. Total return would be reduced if sales or redemption charges were taken into account. Total returns for periods less than one full year are not annualized. Returns do not reflect the deduction of taxes that the shareholder would pay on capital gains or other taxable distributions or the redemption of fund shares. |
| (b) | | Calculated based on average shares outstanding methodology. |
| (d) | | As required, effective November 1, 2001, the Fund has adopted the provisions of the AICPA Audit and Accounting Guide for Investment Companies and began amortizing/accreting premiums and discounts on debt securities. The effect of this change for the year ended October 31, 2002 was an impact of less than $0.01 to net investment income, net realized and unrealized gains and losses, and an increase to the ratio of net investment income to average net assets with and without expense reductions by 0.02%. Per share ratios and supplemental data for periods prior to November 1, 2001 have not been restated to reflect this change in presentation. |
| (e) | | Amount is less than $0.005 per share. |
| | |
| 70 | | The accompanying notes are an integral part of these financial statements. |
COMMERCE FUNDS
| | | | | | | | | | | | | | | | | | | | | |
| | | | | | | | | | | | | | Ratios assuming no expense reductions
| | | | |
Net asset value, end of period | | Total return(a) | | | Net assets at end of period (in 000s) | | Ratio of net expenses to average net assets | | | Ratio of net investment income to average net assets | | | Ratio of total expenses to average net assets | | | Ratio of net investment income to average net assets | | | Portfolio turnover rate | |
| | |
| | | | | | | |
| | | | | | | | | | | | | | | | | | | | | | |
| $18.92 | | 0.51 | % | | $ | 69,986 | | 0.65 | %(c) | | 3.54 | %(c) | | 0.92 | %(c) | | 3.27 | %(c) | | 1 | % |
| 18.92 | | 0.39 | | | | 2,120 | | 0.90 | (c) | | 3.28 | (c) | | 1.17 | (c) | | 3.01 | (c) | | 1 | |
| | | | | | | |
| | | | | | | | | | | | | | | | | | | | | | |
| 19.19 | | 4.52 | | | | 69,150 | | 0.65 | | | 3.47 | | | 0.90 | | | 3.22 | | | 10 | |
| 19.19 | | 4.26 | | | | 2,176 | | 0.90 | | | 3.21 | | | 1.15 | | | 3.96 | | | 10 | |
| | | | | | | |
| | | | | | | | | | | | | | | | | | | | | | |
| 19.03 | | 5.23 | | | | 63,079 | | 0.65 | | | 3.61 | (d) | | 0.90 | | | 3.36 | (d) | | 8 | |
| 19.03 | | 4.97 | | | | 2,121 | | 0.90 | | | 3.35 | (d) | | 1.15 | | | 3.10 | (d) | | 8 | |
| | | | | | | |
| | | | | | | | | | | | | | | | | | | | | | |
| 18.75 | | 7.72 | | | | 44,432 | | 0.65 | (c) | | 4.01 | (c) | | 1.11 | (c) | | 3.55 | (c) | | 10 | |
| 18.75 | | 7.50 | | | | 1,487 | | 0.90 | (c) | | 3.22 | (c) | | 1.36 | (c) | | 2.76 | (c) | | 10 | |
71
INVESTMENT ADVISER
Commerce Investment Advisors, Inc.
INVESTMENT SUB-ADVISER,
INTERNATIONAL EQUITY FUND
Bank of Ireland Asset Management (U.S.) Ltd.
75 Holly Hill Lane
Greenwich, Connecticut 06830
CUSTODIAN
State Street Bank & Trust Company
225 Franklin Street
Boston, Massachusetts 02110
TRANSFER AGENT
Boston Financial Data Services, Inc.
330 W. 9th
3rd Floor
Kansas City, Missouri 64105
DISTRIBUTOR
Goldman, Sachs & Co.
32 Old Slip
New York, New York 10005
ADMINISTRATOR
Goldman Sachs Asset Management
32 Old Slip
New York, New York 10005
INDEPENDENT AUDITORS
KPMG LLP
99 High Street
Boston, Massachusetts 02110
LEGAL COUNSEL
Drinker Biddle & Reath LLP
One Logan Square
18th and Cherry Streets
Philadelphia, Pennsylvania 19103-6996
This Semi-Annual Report contains facts concerning The Commerce Funds’ objectives and policies, management, expenses, and other information. For more complete information about The Commerce Funds, a prospectus may be obtained by calling 1-800-995-6365. An investor should read the prospectus carefully before investing or sending money.
A description of the policies and procedures that the Commerce Funds use to determine how to vote proxies relating to portfolio securities is available (i) without charge, upon request by calling 1-800-995-6365 and (ii) on the Securities and Exchange Commission website at http://www.sec.gov.
The Commerce Funds are advised by Commerce Investment Advisors, Inc., a subsidiary of Commerce Bank, N.A., which receives a fee for its services. The Commerce Funds are distributed by Goldman, Sachs & Co.
NOT FDIC INSURED MAY LOSE VALUE NO BANK GUARANTEE

The Commerce Funds
Trustees
J. Eric Helsing, Chairman
Randall D. Barron
David L. Bodde
Martin E. Galt III
Charles W. Peffer
Warren W. Weaver
Officers
Warren W. Weaver, President
Larry Franklin, Chief Executive Officer
William Schuetter, Vice President
Joseph Reece, Vice President
Peter W. Fortner, Treasurer
Philip V. Giuca Jr., Assistant Treasurer
Diana E. McCarthy, Secretary
Howard B. Surloff, Assistant Secretary
922 Walnut
Fourth Floor
Kansas City, Missouri 64106
www.commercefunds.com
1-800-995-6365
CB 5026
6/04
commerce funds
Not applicable.
| ITEM 3. | | AUDIT COMMITTEE FINANCIAL EXPERT. |
Not applicable.
| ITEM 4. | | PRINCIPAL ACCOUNTANT FEES AND SERVICES. |
Not applicable.
| ITEM 5. | | AUDIT COMMITTEE OF LISTED REGISTRANTS. |
Not applicable.
| ITEM 6. | | SCHEDULE OF INVESTMENTS |
Not applicable.
| ITEM 7. | | DISCLOSURE OF PROXY VOTING POLICIES AND PROCEDURES FOR CLOSED-END MANAGEMENT |
Not applicable.
| ITEM 8. | | PURCHASES OF EQUITY SECURITIES BY CLOSED-END MANAGEMENT INVESTMENT COMPANY AND |
Not Applicable.
| ITEM 9. | | SUBMISSION OF MATTERS TO A VOTE OF SECURITY HOLDERS. |
There has been no material changes to the procedures by which shareholders may recommend nominees to the registrant’s board of trustees.
| ITEM 10. | | CONTROLS AND PROCEDURES. |
| | (a) | The registrant’s principal executive and principal financial officers or persons performing similar functions have concluded that the registrant’s disclosure controls and procedures (as defined in Rule 30a-3(c) under the Investment Company Act of 1940, as amended (the “1940 Act”)) are effective as of a date within 90 days of the filing of this report that includes the disclosure required by this paragraph, based on the evaluation of these controls and procedures required by Rule 30a-3(b) under the 1940 Act and 15d-15(b) under the Securities Exchange Act of 1934, as amended. |
| | (b) | There were no changes in the registrant’s internal control over financial reporting (as defined in Rule 30a-3(d) under the 1940 Act) that occurred during the registrant’s last fiscal half-year (the registrant’s second fiscal half year in the case of an annual report) that has materially affected, or is reasonably likely to materially affect, the registrant’s internal control over financial reporting. |
| | | | |
| | |
| (a)(1) | | Exhibit 99. CODE | | Not applicable. |
| | |
| (a)(2) | | Exhibit 99.CERT | | Certifications pursuant to Section 302 of the Sarbanes-Oxley Act of 2002 is filed herewith. |
| | |
| (b)(1) | | Exhibit 99.906CERT | | Certifications pursuant to Section 906 of the Sarbanes-Oxley Act of 2002 is filed herewith. |
SIGNATURES
Pursuant to the requirements of the Securities Exchange Act of 1934 and the Investment Company Act of 1940, the registrant has duly caused this report to be signed on its behalf by the undersigned, thereunto duly authorized.
|
THE COMMERCE FUNDS |
|
| /s/ Larry E. Franklin |
| Larry E. Franklin |
| Chief Executive Officer |
|
July 9, 2004 |
Pursuant to the requirements of the Securities Exchange Act of 1934 and the Investment Company Act of 1940, this report has been signed below by the following persons on behalf of the registrant and in the capacities and on the dates indicated.
|
|
| /s/ Larry E. Franklin |
| Larry E. Franklin |
| Chief Executive Officer of |
| The Commerce Funds |
|
July 9, 2004 |
|
|
| /s/ Peter W. Fortner |
| Peter W. Fortner |
| Treasurer of |
| The Commerce Funds |
|
July 9, 2004 |