UNITED STATES
SECURITIES AND EXCHANGE COMMISSION
Washington, D.C. 20549
FORM N-CSR
CERTIFIED SHAREHOLDER REPORT OF REGISTERED MANAGEMENT
INVESTMENT COMPANIES
Investment Company Act file number 811-8598
The Commerce Funds
(Exact name of registrant as specified in charter)
|
| 922 Walnut St., Fourth Floor, Mail Code = TB4-1, Kansas City, Missouri 64106 |
| (Address of principal executive offices) (Zip code) |
Diana E. McCarthy, Esq.,
Drinker Biddle & Reath LLP
One Logan Square
18th & Cherry Streets
Philadelphia, PA 19103
(Name and address of agent for service)
Registrant’s telephone number, including area code:1-800-995-6365
Date of fiscal year end 10/31
Date of reporting period: 4/30/07
| ITEM 1. | | REPORTS TO SHAREHOLDERS |
The Semi-Annual Report to Shareholders pursuant to Rule 30e-1 under the Investment Company Act of 1940 (17 CFR 270.30e-1) is filed herewith.
| | | | |
| | The Commerce Funds | | 
The Commerce Funds Semi-Annual Report April 30, 2007 |
For Your Life’s Direction
At The Commerce Funds, we’re committed to providing sound investment choices to help you realize your most important financial goals, no matter where life takes you.
We offer a full range of mutual funds managed by Commerce Investment Advisors, Inc., a subsidiary of Commerce Bank. With a choice of 11 portfolios—each targeting a specific investment goal—we make it easy for you to invest with confidence not just today, but throughout all the stages of your life.
Behind each of our Funds is a carefully defined investment philosophy and a commitment to the highest investment standards. This means, whether you are building a nest egg for retirement, planning for your child’s education, or saving for a special need, you can find investment options at The Commerce Funds.
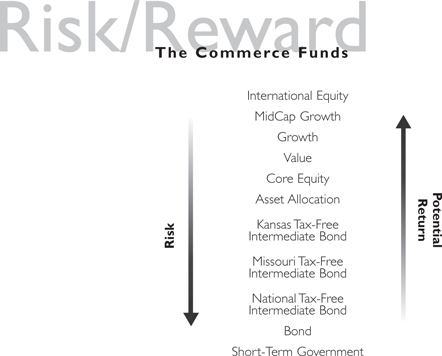
In general, greater returns are associated with greater risks and increased risks create the potential for greater losses.
COMMERCE FUNDS
Table of Contents
Please note:
The information in this semi-annual report is as of April 30, 2007 and is unaudited. To view more recent information about each Commerce Fund’s performance and portfolio or to obtain a prospectus, please visit our website at www.commercefunds.com.
You may also receive Commerce Funds information by calling toll free 1-800-995-6365 or by writing to P.O. Box 219525, Kansas City, Missouri, 64121-9525, or you may contact your investment professional. The Commerce Funds publish performance and portfolio information for each Commerce Fund at the end of every calendar quarter. Investors should read the prospectus carefully before investing or sending money.
COMMERCE CORE EQUITY FUND
Core Equity Fund
Performance Review(1) (Unaudited)
For the six months ended April 30, 2007, the Institutional Shares of the Fund had a total return of 6.74%, based on Net Asset Value (NAV). This compares to the S&P 500 Index(2) six-month return of 8.60%. Past performance is no guarantee of future results.
Schedule of Investments
April 30, 2007 (Unaudited)
| | | | |
| | |
| Shares | | Description | | Value |
| Common Stocks – 98.3% | | |
| Commercial Services – 5.6% | | |
| 25,335 | | Dun & Bradstreet Corp. | | $ 2,287,751 |
| 12,875 | | Omnicom Group, Inc. | | 1,348,141 |
| 26,015 | | R.R. Donnelley & Sons Co. | | 1,045,803 |
| 34,225 | | SEI Investments Co. | | 2,088,752 |
| | | | |
| | | | 6,770,447 |
| |
| Communications – 4.9% | | |
| 52,780 | | American Tower Corp.* | | 2,005,640 |
| 39,595 | | Crown Castle International Corp.* | | 1,359,692 |
| 107,435 | | Qwest Communications International, Inc.* | | 954,023 |
| 44,890 | | Verizon Communications, Inc. | | 1,713,900 |
| | | | |
| | | | 6,033,255 |
| |
| Consumer Durables – 1.1% | | |
| 55,710 | | Leggett & Platt, Inc. | | 1,310,299 |
| |
| Consumer Non-Durables – 8.9% | | |
| 13,725 | | Altria Group, Inc. | | 945,927 |
| 14,370 | | Kimberly-Clark Corp. | | 1,022,713 |
| 9,493 | | Kraft Foods, Inc. | | 317,731 |
| 53,930 | | Procter & Gamble Co. | | 3,468,238 |
| 38,590 | | Reynolds American, Inc. | | 2,479,793 |
| 38,945 | | The Clorox Co. | | 2,612,431 |
| | | | |
| | | | 10,846,833 |
| |
| Consumer Services – 5.5% | | |
| 31,325 | | CBS Corp. Class B | | 995,195 |
| 67,150 | | McDonald’s Corp. | | 3,242,002 |
| 39,371 | | News Corp. | | 881,517 |
| 44,425 | | The Walt Disney Co. | | 1,553,986 |
| | | | |
| | | | 6,672,700 |
| |
| Electronic Technology – 8.6% | | |
| 135,775 | | Applied Materials, Inc. | | 2,609,595 |
| 118,105 | | Cisco Systems, Inc.* | | 3,158,128 |
| |
| | | | |
| | |
| Shares | | Description | | Value |
| Common Stocks – (continued) | | |
| Electronic Technology – (continued) | | |
| 32,365 | | EMC Corp.* | | $ 491,301 |
| 13,980 | | General Dynamics Corp. | | 1,097,431 |
| 55,050 | | Network Appliance, Inc.* | | 2,048,410 |
| 23,155 | | QUALCOMM, Inc. | | 1,014,189 |
| | | | |
| | | | 10,419,054 |
| |
| Energy Minerals – 6.7% | | |
| 17,700 | | ChevronTexaco Corp. | | 1,376,883 |
| 86,210 | | Exxon Mobil Corp. | | 6,843,350 |
| | | | |
| | | | 8,220,233 |
| |
| Finance – 18.9% | | |
| 18,055 | | Assurant, Inc. | | 1,038,704 |
| 74,125 | | Bank of America Corp. | | 3,772,962 |
| 27,075 | | CIT Group, Inc. | | 1,615,024 |
| 21,755 | | Citigroup, Inc. | | 1,166,503 |
| 5,730 | | Franklin Resources, Inc. | | 752,406 |
| 25,955 | | JPMorgan Chase & Co. | | 1,352,256 |
| 34,260 | | Lehman Brothers Holdings, Inc. | | 2,579,093 |
| 11,090 | | Lincoln National Corp. | | 789,054 |
| 27,065 | | Merrill Lynch & Co., Inc. | | 2,442,075 |
| 19,965 | | Principal Financial Group, Inc. | | 1,267,578 |
| 55,805 | | U.S. Bancorp. | | 1,916,902 |
| 33,395 | | Wachovia Corp. | | 1,854,758 |
| 42,005 | | Wells Fargo & Co. | | 1,507,559 |
| 11,935 | | Zions Bancorp. | | 976,283 |
| | | | |
| | | | 23,031,157 |
| |
| Health Services – 1.4% | | |
| 40,095 | | IMS Health, Inc. | | 1,175,987 |
| 11,480 | | Quest Diagnostics, Inc. | | 561,257 |
| | | | |
| | | | 1,737,244 |
| |
| Health Technology – 13.2% | | |
| 12,785 | | Abbott Laboratories | | 723,886 |
| 16,290 | | DENTSPLY International, Inc. | | 544,249 |
| |
(1) | | Returns assume fee waivers and expense reductions and are not annualized. Returns do not reflect the deduction of taxes that a shareholder would pay on Fund distributions or the redemption of Fund shares. |
(2) | | The S&P 500 Index is the Standard & Poor’s 500 Composite Stock Index of 500 stocks, an unmanaged index of common stock prices and is a widely recognized common measure of the overall U.S. stock market. The Index figures do not reflect the deduction of any fees, expenses or taxes. |
| | |
| 2 | | The accompanying notes are an integral part of these financial statements. |
COMMERCE CORE EQUITY FUND
| | | | |
| | |
| Shares | | Description | | Value |
| Common Stocks – (continued) | | |
| Health Technology – (continued) | | |
| 56,430 | | Eli Lilly & Co. | | $ 3,336,706 |
| 34,495 | | Johnson & Johnson | | 2,215,269 |
| 34,850 | | Merck & Co., Inc. | | 1,792,684 |
| 54,565 | | Pfizer, Inc. | | 1,443,790 |
| 104,955 | | Schering-Plough Corp. | | 3,330,222 |
| 23,885 | | Sepracor, Inc.* | | 1,282,147 |
| 21,535 | | Stryker Corp. | | 1,398,483 |
| | | | |
| | | | 16,067,436 |
| |
| Non-Energy Minerals – 0.7% | | |
| 12,915 | | Nucor Corp. | | 819,586 |
| |
| Process Industries – 2.2% | | |
| 54,425 | | E. I. du Pont de Nemours and Co. | | 2,676,077 |
| |
| Producer Manufacturing – 6.8% | | |
| 34,935 | | Danaher Corp. | | 2,487,023 |
| 109,675 | | General Electric Co. | | 4,042,620 |
| 24,340 | | Ingersoll-Rand Co. | | 1,086,781 |
| 9,130 | | United Technologies Corp. | | 612,897 |
| | | | |
| | | | 8,229,321 |
| |
| Retail Trade – 4.7% | | |
| 46,805 | | CVS Corp. | | 1,696,213 |
| 25,640 | | Kohl’s Corp.* | | 1,898,385 |
| 25,225 | | Liberty Media Corp. Interactive* | | 631,382 |
| 30,240 | | Wal-Mart Stores, Inc. | | 1,449,101 |
| | | | |
| | | | 5,675,081 |
| |
| Technology Services – 8.1% | | |
| 41,260 | | BEA Systems, Inc.* | | 486,455 |
| 1,800 | | Google, Inc.* | | 848,484 |
| 46,230 | | Intuit, Inc.* | | 1,315,244 |
| 140,235 | | Microsoft Corp. | | 4,198,635 |
| 162,315 | | Oracle Corp.* | | 3,051,522 |
| | | | |
| | | | 9,900,340 |
| |
| Transportation – 1.0% | | |
| 12,125 | | FedEx Corp. | | 1,278,460 |
| |
| TOTAL COMMON STOCKS | | |
| (Cost $96,764,132) | | $119,687,523 |
| |
|
| Exchange Traded Fund – 1.2% |
| 10,000 | | SPDR Trust Series 1 | | $ 1,482,900 |
| (Cost $1,440,162) | | |
| |
| TOTAL INVESTMENTS – 99.5% | | |
| (Cost $98,204,294) | | $121,170,423 |
| Other assets in excess of liabilities – 0.5% | | 603,263 |
| |
| Net Assets – 100.0% | | $121,773,686 |
| |
| | |
| The percentage shown for each investment category reflects the value of investments in that category as a percentage of net assets. |
| * | | Non-income producing security. |
PORTFOLIO COMPOSITION
| | | | | | |
| Industry Allocation | | AS OF
04/30/07 | | | AS OF
10/31/06 | |
| | |
Finance | | 18.9 | % | | 21.9 | % |
Health Technology | | 13.2 | | | 5.6 | |
Consumer Non-Durables | | 8.9 | | | 5.1 | |
Electronic Technology | | 8.6 | | | 8.3 | |
Technology Services | | 8.1 | | | 9.9 | |
Producer Manufacturing | | 6.8 | | | 8.3 | |
Energy Minerals | | 6.7 | | | 8.5 | |
Commercial Services | | 5.6 | | | 5.5 | |
Consumer Services | | 5.5 | | | 3.9 | |
Communications | | 4.9 | | | 4.2 | |
Retail Trade | | 4.7 | | | 7.5 | |
Process Industries | | 2.2 | | | 0.0 | |
Health Services | | 1.4 | | | 4.3 | |
Exchange Traded Fund | | 1.2 | | | 2.6 | |
Consumer Durables | | 1.1 | | | 1.1 | |
Transportation | | 1.0 | | | 1.2 | |
Non-Energy Minerals | | 0.7 | | | 0.7 | |
Distribution Services | | 0.0 | | | 1.1 | |
| | |
The percentage shown for each investment category reflects the value of investments in that category as a percentage of net assets.
The Fund is actively managed and, as such, its composition may differ over time.
| | |
| The accompanying notes are an integral part of these financial statements. | | 3 |
COMMERCE GROWTH FUND
Growth Fund
Performance Review(1) (Unaudited)
For the six months ended April 30, 2007, the Institutional Shares of the Fund had a total return of 6.44%, based on Net Asset Value (NAV). This compares to the Russell 1000 Growth Index(2) six-month return of 8.42%. Past performance is no guarantee of future results.
Schedule of Investments
April 30, 2007 (Unaudited)
| | | | |
| | |
| Shares | | Description | | Value |
| Common Stocks – 96.7% | | |
| Commercial Services – 4.5% | | |
| 34,600 | | Dun & Bradstreet Corp. | | $ 3,124,380 |
| 12,700 | | Moody’s Corp. | | 839,724 |
| 25,500 | | SEI Investments Co. | | 1,556,265 |
| 57,300 | | The McGraw-Hill Cos., Inc. | | 3,754,869 |
| | | | |
| | | | 9,275,238 |
| |
| Communications – 1.4% | | |
| 62,200 | | American Tower Corp.* | | 2,363,600 |
| 16,000 | | Crown Castle International Corp.* | | 549,440 |
| | | | |
| | | | 2,913,040 |
| |
| Consumer Durables – 0.9% | | |
| 19,800 | | Black & Decker Corp. | | 1,796,256 |
| |
| Consumer Non-Durables – 6.8% | | |
| 79,900 | | Altria Group, Inc. | | 5,506,708 |
| 30,725 | | Kraft Foods, Inc. | | 1,028,366 |
| 66,500 | | Procter & Gamble Co. | | 4,276,615 |
| 97,300 | | The Pepsi Bottling Group, Inc. | | 3,192,413 |
| | | | |
| | | | 14,004,102 |
| |
| Consumer Services – 3.9% | | |
| 49,600 | | Choice Hotels International, Inc. | | 1,866,944 |
| 77,100 | | EchoStar Communications Corp.* | | 3,587,463 |
| 72,700 | | The Walt Disney Co. | | 2,543,046 |
| | | | |
| | | | 7,997,453 |
| |
| Distribution Services – 1.7% | | |
| 42,600 | | W.W. Grainger, Inc. | | 3,519,612 |
| |
| Electronic Technology – 19.0% | | |
| 9,400 | | Apple Computer, Inc.* | | 938,120 |
| 191,700 | | Applied Materials, Inc. | | 3,684,474 |
| 56,100 | | Boeing Co. | | 5,217,300 |
| 278,300 | | Cisco Systems, Inc.* | | 7,441,742 |
| 44,200 | | Intel Corp. | | 950,300 |
| 60,500 | | KLA-Tencor Corp. | | 3,360,775 |
| |
| | | | |
| | |
| Shares | | Description | | Value |
| Common Stocks – (continued) |
| Electronic Technology – (continued) |
| 39,800 | | L-3 Communications Holdings, Inc. | | $ 3,579,214 |
| 50,800 | | Lam Research Corp.* | | 2,732,024 |
| 58,300 | | Microchip Technology, Inc. | | 2,351,822 |
| 95,200 | | Network Appliance, Inc.* | | 3,542,392 |
| 46,000 | | NVIDIA Corp.* | | 1,512,940 |
| 45,100 | | QUALCOMM, Inc. | | 1,975,380 |
| 26,600 | | Rockwell Collins, Inc. | | 1,746,822 |
| | | | |
| | | | 39,033,305 |
| |
| Finance – 7.3% | | |
| 35,000 | | American Express Co. | | 2,123,450 |
| 30,600 | | Franklin Resources, Inc. | | 4,018,086 |
| 38,600 | | Mellon Financial Corp. | | 1,657,098 |
| 36,400 | | Merrill Lynch & Co., Inc. | | 3,284,372 |
| 39,200 | | U.S. Bancorp. | | 1,346,520 |
| 71,100 | | Wells Fargo & Co. | | 2,551,779 |
| | | | |
| | | | 14,981,305 |
| |
| Health Services – 2.6% | | |
| 51,500 | | IMS Health, Inc. | | 1,510,495 |
| 50,200 | | WellPoint, Inc.* | | 3,964,294 |
| | | | |
| | | | 5,474,789 |
| |
| Health Technology – 18.8% | | |
| 7,300 | | Allergan, Inc. | | 884,760 |
| 29,000 | | Applera Corp - Applied Biosystems Group | | 905,960 |
| 52,000 | | Becton, Dickinson & Co. | | 4,091,880 |
| 19,600 | | Biotech HOLDRs Trust | | 3,668,140 |
| 77,200 | | Eli Lilly & Co. | | 4,564,836 |
| 65,900 | | Forest Laboratories, Inc.* | | 3,506,539 |
| 49,500 | | Gilead Sciences, Inc.* | | 4,045,140 |
| 118,700 | | Johnson & Johnson | | 7,622,914 |
| 39,300 | | Merck & Co., Inc. | | 2,021,592 |
| 137,100 | | Schering-Plough Corp. | | 4,350,183 |
| 13,300 | | Stryker Corp. | | 863,702 |
| |
(1) | | Returns assume fee waivers and expense reductions and are not annualized. Returns do not reflect the deduction of taxes that a shareholder would pay on Fund distributions or the redemption of Fund shares. |
(2) | | The Russell 1000 Growth Index, an unmanaged index, is a market capitalization weighted index of the 1,000 largest U.S. companies with higher price-to-book ratios and higher forecasted growth values. The Index figures do not reflect the deduction of any fees, expenses or taxes. |
| | |
| 4 | | The accompanying notes are an integral part of these financial statements. |
COMMERCE GROWTH FUND
| | | | |
| | |
| Shares | | Description | | Value |
| Common Stocks – (continued) |
| Health Technology – (continued) |
| 19,000 | | Wyeth | | $ 1,054,500 |
| 12,100 | | Zimmer Holdings, Inc.* | | 1,094,808 |
| | | | |
| | | | 38,674,954 |
| |
| Industrial Services – 1.9% | | |
| 102,700 | | Waste Management, Inc. | | 3,842,007 |
| |
| Process Industries – 1.9% | | |
| 78,000 | | E. I. du Pont de Nemours and Co. | | 3,835,260 |
| |
| Producer Manufacturing – 5.7% | | |
| 25,900 | | Danaher Corp. | | 1,843,821 |
| 143,800 | | General Electric Co. | | 5,300,468 |
| 70,100 | | United Technologies Corp. | | 4,705,813 |
| | | | |
| | | | 11,850,102 |
| |
| Retail Trade – 5.2% | | |
| 37,800 | | J.C. Penney Co., Inc. | | 2,989,602 |
| 46,600 | | Kohl’s Corp.* | | 3,450,264 |
| 62,200 | | Nordstrom, Inc. | | 3,416,024 |
| 18,300 | | Wal-Mart Stores, Inc. | | 876,936 |
| | | | |
| | | | 10,732,826 |
| |
| Technology Services – 15.1% | | |
| 40,700 | | Akamai Technologies, Inc.* | | 1,794,056 |
| 68,900 | | Fair Isaac Corp. | | 2,460,419 |
| 6,700 | | Google, Inc.* | | 3,158,246 |
| 32,700 | | International Business Machines Corp. | | 3,342,267 |
| 16,500 | | Intuit, Inc.* | | 469,425 |
| 345,500 | | Microsoft Corp. | | 10,344,270 |
| 292,800 | | Oracle Corp.* | | 5,504,640 |
| 15,500 | | Salesforce.com, Inc.* | | 651,000 |
| 122,500 | | VeriSign, Inc.* | | 3,350,375 |
| | | | |
| | | | 31,074,698 |
| |
| TOTAL COMMON STOCKS | | |
| (Cost $171,827,321) | | $199,004,947 |
| |
|
| Exchange Traded Fund – 2.8% | | |
| 97,500 | | iShares Russell 1000 Growth Index Fund | | $ 5,677,425 |
| (Cost $5,575,463) | | |
| |
| | | | | | | | |
Principal Amount | | Interest
Rate | | | Maturity
Date | | Value | |
| Repurchase Agreement(a) – 1.3% | | | |
| State Street Bank & Trust Co. | | | |
| $2,736,000 | | 4.690 | % | | 05/01/07 | | $ 2,736,000 | |
Maturity Value: $2,736,356 | | | |
(Cost $2,736,000) | | | | | | |
| | |
| TOTAL INVESTMENTS – 100.8% | | | |
(Cost $180,138,784) | | | | | $207,418,372 | |
| Liabilities in excess of other assets – (0.8)% | | (1,643,728 | ) |
| | |
| Net Assets – 100.0% | | $205,774,644 | |
| | |
| | |
| The percentage shown for each investment category reflects the value of investments in that category as a percentage of net assets. |
| * | | Non-income producing security. |
| (a) | | Repurchase agreement was entered into on April 30, 2007. This agreement was fully collateralized by $2,055,000 U.S. Treasury Bond, 8.000%, due 11/15/21 with a market value of $2,794,800. |
| | |
| |
| Investment Abbreviation: |
| HOLDRs | | —HoldingCompany Depositary Receipts |
| |
PORTFOLIO COMPOSITION
| | | | | | |
| Industry Allocation | | AS OF
04/30/07 | | | AS OF
10/31/06 | |
| | |
Electronic Technology | | 19.0 | % | | 15.5 | % |
Health Technology | | 18.8 | | | 10.3 | |
Technology Services | | 15.1 | | | 15.7 | |
Finance | | 7.3 | | | 9.2 | |
Consumer Non-Durables | | 6.8 | | | 2.7 | |
Producer Manufacturing | | 5.7 | | | 7.0 | |
Retail Trade | | 5.2 | | | 7.5 | |
Commercial Services | | 4.5 | | | 5.2 | |
Consumer Services | | 3.9 | | | 5.1 | |
Exchange Traded Fund | | 2.8 | | | 3.1 | |
Health Services | | 2.6 | | | 7.9 | |
Industrial Services | | 1.9 | | | 0.0 | |
Process Industries | | 1.9 | | | 1.8 | |
Distrubution Services | | 1.7 | | | 3.2 | |
Communications | | 1.4 | | | 3.0 | |
Repurchase Agreement | | 1.3 | | | 1.4 | |
Consumer Durables | | 0.9 | | | 0.9 | |
Non-Energy Minerals | | 0.0 | | | 0.6 | |
| | |
The percentage shown for each investment category reflects the value of investments in that category as a percentage of net assets.
The Fund is actively managed and, as such, its composition may differ over time.
| | |
| The accompanying notes are an integral part of these financial statements. | | 5 |
COMMERCE VALUE FUND
Value Fund
Performance Review(1) (Unaudited)
For the six months ended April 30, 2007, the Institutional Shares of the Fund had a total return of 7.43%, based on Net Asset Value (NAV). This compares to the Russell 1000 Value Index(2) six-month return of 9.79%. Past performance is no guarantee of future results.
Schedule of Investments
April 30, 2007 (Unaudited)
| | | | |
| | |
| Shares | | Description | | Value |
| Common Stocks – 97.1% | | |
| Commercial Services – 0.3% | | |
| 10,000 | | R.R. Donnelley & Sons Co. | | $ 402,000 |
| |
| Communications – 7.0% | | |
| 103,000 | | AT&T, Inc. | | 3,988,175 |
| 13,900 | | CenturyTel, Inc. | | 640,095 |
| 260,000 | | Qwest Communications International, Inc.* | | 2,308,800 |
| 65,500 | | Verizon Communications, Inc. | | 2,500,790 |
| | | | |
| | | | 9,437,860 |
| |
| Consumer Durables – 0.6% | | |
| 12,500 | | Eastman Kodak Co. | | 311,375 |
| 17,600 | | Mattel, Inc. | | 498,080 |
| | | | |
| | | | 809,455 |
| |
| Consumer Non-Durables – 8.7% | | |
| 34,000 | | Altria Group, Inc. | | 2,343,280 |
| 13,500 | | ConAgra Foods, Inc. | | 331,830 |
| 24,250 | | General Mills, Inc. | | 1,452,575 |
| 62,500 | | Procter & Gamble Co. | | 4,019,375 |
| 19,250 | | Reynolds American, Inc. | | 1,237,005 |
| 34,000 | | The Clorox Co. | | 2,280,720 |
| | | | |
| | | | 11,664,785 |
| |
| Consumer Services – 4.1% | | |
| 73,650 | | CBS Corp. Class B | | 2,339,861 |
| 9,000 | | Clear Channel Communications, Inc. | | 318,870 |
| 27,450 | | Comcast Corp.* | | 731,817 |
| 9,500 | | Liberty Global, Inc.* | | 340,955 |
| 35,000 | | The Walt Disney Co. | | 1,224,300 |
| 25,500 | | Time Warner, Inc. | | 526,065 |
| | | | |
| | | | 5,481,868 |
| |
| Electronic Technology – 6.3% | | |
| 165,000 | | Avaya, Inc.* | | 2,131,800 |
| 15,000 | | General Dynamics Corp. | | 1,177,500 |
| |
| | | | |
| | |
| Shares | | Description | | Value |
| Common Stocks – (continued) |
| Electronic Technology – (continued) |
| 61,450 | | Hewlett-Packard Co. | | $ 2,589,503 |
| 23,500 | | Juniper Networks, Inc.* | | 525,460 |
| 8,000 | | Lockheed Martin Corp. | | 769,120 |
| 19,000 | | Motorola, Inc. | | 329,270 |
| 12,500 | | Novellus Systems, Inc.* | | 404,625 |
| 12,500 | | Synopsys, Inc.* | | 345,750 |
| 17,600 | | Tellabs, Inc.* | | 186,912 |
| | | | |
| | | | 8,459,940 |
| |
| Energy Minerals – 12.8% | | |
| 59,750 | | ChevronTexaco Corp. | | 4,647,952 |
| 8,000 | | ConocoPhillips | | 554,800 |
| 126,000 | | Exxon Mobil Corp. | | 10,001,880 |
| 5,150 | | Marathon Oil Corp. | | 522,983 |
| 16,950 | | Occidental Petroleum Corp. | | 859,365 |
| 7,900 | | Valero Energy Corp. | | 554,817 |
| | | | |
| | | | 17,141,797 |
| |
| Finance – 32.6% | | |
| 5,500 | | AMB Property Corp. | | 335,005 |
| 16,150 | | AMBAC Financial Group, Inc. | | 1,482,570 |
| 7,600 | | American International Group, Inc. | | 531,316 |
| 25,050 | | Assurant, Inc. | | 1,441,127 |
| 123,950 | | Bank of America Corp. | | 6,309,055 |
| 59,500 | | Citigroup, Inc. | | 3,190,390 |
| 8,000 | | CNA Financial Corp.* | | 373,360 |
| 4,250 | | Franklin Resources, Inc. | | 558,068 |
| 45,400 | | JPMorgan Chase & Co. | | 2,365,340 |
| 15,500 | | Lehman Brothers Holdings, Inc. | | 1,166,840 |
| 16,200 | | Lincoln National Corp. | | 1,152,630 |
| 7,950 | | Loews Corp. | | 376,194 |
| 19,400 | | Marshall & Ilsley Corp. | | 931,588 |
| 53,900 | | Mellon Financial Corp. | | 2,313,927 |
| 18,000 | | Merrill Lynch & Co., Inc. | | 1,624,140 |
| 36,700 | | Morgan Stanley & Co., Inc. | | 3,083,167 |
| 17,800 | | PNC Financial Services Group, Inc. | | 1,318,980 |
| |
(1) | | Returns assume fee waivers and expense reductions and are not annualized. Returns do not reflect the deduction of taxes that a shareholder would pay on Fund distributions or the redemption of Fund shares. |
(2) | | The Russell 1000 Value Index, an unmanaged market capitalization weighted index of the 1,000 largest U.S. companies with lower price-to-book ratios and lower forecasted growth values. The Index figures do not reflect the deduction of any fees, expenses or taxes. |
| | |
| 6 | | The accompanying notes are an integral part of these financial statements. |
COMMERCE VALUE FUND
| | | | |
| | |
| Shares | | Description | | Value |
| Common Stocks – (continued) |
| Finance – (continued) |
| 16,150 | | Principal Financial Group, Inc. | | $ 1,025,364 |
| 4,800 | | ProLogis | | 311,040 |
| 4,550 | | Prudential Financial, Inc. | | 432,250 |
| 25,850 | | Radian Group, Inc. | | 1,502,143 |
| 3,190 | | Regency Centers Corp. | | 262,856 |
| 70,550 | | Regions Financial Corp. | | 2,475,599 |
| 5,000 | | Safeco Corp. | | 333,700 |
| 6,050 | | The Bear Stearns Cos., Inc. | | 941,985 |
| 10,500 | | The Chubb Corp. | | 565,215 |
| 11,000 | | The Progressive Corp. | | 253,770 |
| 6,450 | | The Travelers Cos., Inc. | | 348,945 |
| 15,900 | | Trustmark Corp. | | 423,099 |
| 36,000 | | U.S. Bancorp. | | 1,236,600 |
| 84,650 | | Wells Fargo & Co. | | 3,038,088 |
| 24,400 | | Zions Bancorp. | | 1,995,920 |
| | | | |
| | | | 43,700,271 |
| |
| Health Services – 2.0% | | |
| 44,850 | | IMS Health, Inc. | | 1,315,451 |
| 18,000 | | WellPoint, Inc.* | | 1,421,460 |
| | | | |
| | | | 2,736,911 |
| |
| Health Technology – 7.4% | | |
| 6,350 | | Abbott Laboratories | | 359,537 |
| 12,550 | | Biogen Idec, Inc.* | | 592,485 |
| 8,000 | | Eli Lilly & Co. | | 473,040 |
| 30,000 | | Johnson & Johnson | | 1,926,600 |
| 36,450 | | Merck & Co., Inc. | | 1,874,988 |
| 176,500 | | Pfizer, Inc. | | 4,670,190 |
| | | | |
| | | | 9,896,840 |
| |
| Industrial Services – 0.8% | | |
| 29,250 | | Waste Management, Inc. | | 1,094,243 |
| |
| Non-Energy Minerals – 0.6% | | |
| 11,900 | | Nucor Corp. | | 755,174 |
| |
| Process Industries – 3.0% | | |
| 16,500 | | E. I. du Pont de Nemours and Co. | | 811,305 |
| 18,000 | | International Paper Co. | | 678,960 |
| 12,500 | | Lyondell Chemical Co. | | 389,000 |
| 3,600 | | Praxair, Inc. | | 232,380 |
| 18,000 | | Sigma-Aldrich Corp. | | 757,440 |
| 14,250 | | Sonoco Products Co. | | 607,620 |
| 11,900 | | The Dow Chemical Co. | | 530,859 |
| | | | |
| | | | 4,007,564 |
| |
| Producer Manufacturing – 4.4% | | |
| 7,150 | | Eaton Corp. | | 637,851 |
| 102,800 | | General Electric Co. | | 3,789,208 |
| 7,250 | | Honeywell International, Inc. | | 392,805 |
| 7,500 | | Parker Hannifin Corp. | | 691,050 |
| 5,600 | | Terex Corp.* | | 435,960 |
| | | | |
| | | | 5,946,874 |
| |
| | | | |
| | |
| Shares | | Description | | Value |
| Common Stocks – (continued) |
| Retail Trade – 0.5% | | |
| 8,900 | | AutoNation, Inc.* | | $ 181,916 |
| 12,650 | | Claire’s Stores, Inc. | | 412,011 |
| | | | |
| | | | 593,927 |
| |
| Technology Services – 1.7% | | |
| 42,700 | | BEA Systems, Inc.* | | 503,433 |
| 29,500 | | BMC Software, Inc.* | | 954,915 |
| 12,300 | | Electronic Data Systems Corp. | | 359,652 |
| 12,000 | | Fair Isaac Corp. | | 428,520 |
| | | | |
| | | | 2,246,520 |
| |
| Utilities – 4.3% | | |
| 18,000 | | CenterPoint Energy, Inc. | | 338,940 |
| 35,200 | | Duke Energy Corp. | | 722,304 |
| 38,800 | | Edison International | | 2,031,180 |
| 17,000 | | FirstEnergy Corp. | | 1,163,480 |
| 9,000 | | PG&E Corp. | | 455,400 |
| 18,250 | | The Southern Co. | | 689,667 |
| 13,500 | | Xcel Energy, Inc. | | 325,215 |
| | | | |
| | | | 5,726,186 |
| |
| TOTAL COMMON STOCKS | | |
| (Cost $105,285,444) | | $130,102,215 |
| |
|
| Exchange Traded Fund – 2.6% |
| 40,000 | | iShares Russell 1000 Value Index Fund | | $ 3,447,200 |
| (Cost $3,312,712) | | |
| |
| | | | | | | |
Principal
Amount | | Interest
Rate | | | Maturity
Date | | Value |
| Repurchase Agreement(a) – 0.3% | | |
| State Street Bank & Trust Co. | | |
| $444,000 | | 4.690 | % | | 05/01/07 | | $ 444,000 |
Maturity Value: $444,058 | | |
(Cost $444,000) | | | | | |
| |
| TOTAL INVESTMENTS – 100.0% | | |
(Cost $109,042,156) | | | | | $133,993,415 |
| Other assets in excess of liabilities – 0.0% | | 44,653 |
| |
| Net Assets – 100.0% | | $134,038,068 |
| |
| | |
| The percentage shown for each investment category reflects the value of investments in that category as a percentage of net assets. |
| * | | Non-income producing security. |
| (a) | | Repurchase agreement was entered into on April 30, 2007. This agreement was fully collateralized by $335,000 U.S. Treasury Bond, 8.000%, due 11/15/21 with a market value of $455,600. |
| | |
| The accompanying notes are an integral part of these financial statements. | | 7 |
COMMERCE VALUE FUND
Schedule of Investments (continued)
April 30, 2007 (Unaudited)
PORTFOLIO COMPOSITION
| | | | | | |
| Industry Allocation | | AS OF
04/30/07 | | | AS OF
10/31/06 | |
| | |
Finance | | 32.6 | % | | 35.6 | % |
Energy Minerals | | 12.8 | | | 13.6 | |
Consumer Non-Durables | | 8.7 | | | 6.7 | |
Health Technology | | 7.4 | | | 5.8 | |
Communications | | 7.0 | | | 6.3 | |
Electronic Technology | | 6.3 | | | 4.9 | |
Producer Manufacturing | | 4.4 | | | 5.3 | |
Utilities | | 4.3 | | | 3.6 | |
Consumer Services | | 4.1 | | | 2.7 | |
Process Industries | | 3.0 | | | 1.4 | |
Exchange Traded Fund | | 2.6 | | | 2.6 | |
Health Services | | 2.0 | | | 2.7 | |
Technology Services | | 1.7 | | | 2.5 | |
Industrial Services | | 0.8 | | | 0.0 | |
Consumer Durables | | 0.6 | | | 0.5 | |
Non-Energy Minerals | | 0.6 | | | 1.0 | |
Retail Trade | | 0.5 | | | 2.9 | |
Commercial Services | | 0.3 | | | 0.0 | |
Repurchase Agreement | | 0.3 | | | 0.9 | |
Distribution Services | | 0.0 | | | 0.6 | |
| | |
The percentage shown for each investment category reflects the value of investments in that category as a percentage of net assets.
The Fund is actively managed and, as such, its composition may differ over time.
| | |
| 8 | | The accompanying notes are an integral part of these financial statements. |
COMMERCE MIDCAP GROWTH FUND
MidCap Growth Fund
Performance Review(1) (Unaudited)
For the six months ended April 30, 2007, the Institutional Shares of the Fund had a total return of 8.52%, based on Net Asset Value (NAV). This compares to the Russell MidCap Growth Index(2) six-month return of 11.77%. Past performance is no guarantee of future results.
Schedule of Investments
April 30, 2007 (Unaudited)
| | | | |
| | |
| Shares | | Description | | Value |
| Common Stocks – 96.3% |
| Commercial Services – 6.6% | | |
| 8,870 | | Corporate Executive Board Co. | | $ 564,487 |
| 30,540 | | Equifax, Inc. | | 1,215,492 |
| 33,685 | | Harte-Hanks, Inc. | | 879,178 |
| 15,420 | | Robert Half International, Inc. | | 513,486 |
| 19,900 | | SEI Investments Co. | | 1,214,497 |
| 28,800 | | Dun & Bradstreet Corp. | | 2,600,640 |
| | | | |
| | | | 6,987,780 |
| |
| Communications – 4.4% | | |
| 65,300 | | American Tower Corp.* | | 2,481,400 |
| 64,400 | | Crown Castle International Corp.* | | 2,211,496 |
| | | | |
| | | | 4,692,896 |
| |
| Consumer Durables – 0.8% | | |
| 30,700 | | Mattel, Inc. | | 868,810 |
| |
| Consumer Non-Durables – 2.6% | | |
| 12,080 | | Church & Dwight Co., Inc. | | 612,819 |
| 37,300 | | UST, Inc. | | 2,114,164 |
| | | | |
| | | | 2,726,983 |
| |
| Consumer Services – 4.1% | | |
| 39,510 | | Choice Hotels International, Inc. | | 1,487,157 |
| 60,000 | | EchoStar Communications Corp.* | | 2,791,800 |
| | | | |
| | | | 4,278,957 |
| |
| Electronic Technology – 17.2% | | |
| 9,615 | | Alliant Techsystems, Inc.* | | 895,445 |
| 35,200 | | Avaya, Inc.* | | 454,784 |
| 15,090 | | Harris Corp. | | 774,871 |
| 41,300 | | KLA-Tencor Corp. | | 2,294,215 |
| 14,646 | | L-3 Communications Holdings, Inc. | | 1,317,115 |
| 53,700 | | Lam Research Corp.* | | 2,887,986 |
| 16,500 | | MEMC Electronic Materials, Inc.* | | 905,520 |
| 59,790 | | Microchip Technology, Inc. | | 2,411,929 |
| 69,300 | | Network Appliance, Inc.* | | 2,578,653 |
| |
| | | | |
| | |
| Shares | | Description | | Value |
| Common Stocks – (continued) |
| Electronic Technology – (continued) |
| 27,365 | | Rockwell Collins, Inc. | | $ 1,797,059 |
| 64,800 | | Xilinx, Inc. | | 1,910,304 |
| | | | |
| | | | 18,227,881 |
| |
| Finance – 9.4% | | |
| 25,000 | | AMBAC Financial Group, Inc. | | 2,295,000 |
| 38,000 | | CB Richard Ellis Group, Inc.* | | 1,286,300 |
| 38,395 | | Eaton Vance Corp. | | 1,467,457 |
| 24,628 | | Federated Investors, Inc., Class B | | 939,804 |
| 61,330 | | Mellon Financial Corp. | | 2,632,897 |
| 26,200 | | T. Rowe Price Group, Inc. | | 1,301,616 |
| | | | |
| | | | 9,923,074 |
| |
| Health Services – 8.4% | | |
| 10,780 | | Cerner Corp.* | | 573,927 |
| 9,465 | | Coventry Health Care, Inc.* | | 547,361 |
| 5,980 | | Humana, Inc.* | | 378,175 |
| 79,440 | | IMS Health, Inc. | | 2,329,975 |
| 6,200 | | Laboratory Corporation of America Holdings* | | 489,428 |
| 7,620 | | Quest Diagnostics, Inc. | | 372,542 |
| 28,046 | | Stericycle, Inc.* | | 2,443,929 |
| 15,600 | | WellCare Health Plans, Inc.* | | 1,257,204 |
| 5,789 | | WellPoint, Inc.* | | 457,157 |
| | | | |
| | | | 8,849,698 |
| |
| Health Technology – 10.4% | | |
| 8,070 | | Allergan, Inc. | | 978,084 |
| 16,000 | | Applera Corp - Applied Biosystems Group | | 499,840 |
| 8,980 | | C. R. Bard, Inc. | | 746,507 |
| 12,800 | | Cephalon, Inc.* | | 1,019,008 |
| 39,000 | | DENTSPLY International, Inc. | | 1,302,990 |
| 43,700 | | Forest Laboratories, Inc.* | | 2,325,277 |
| 13,520 | | IDEXX Laboratories, Inc.* | | 1,219,098 |
| 6,768 | | Invitrogen Corp.* | | 443,101 |
| |
(1) | | Returns assume fee waivers and expense reductions and are not annualized. Returns do not reflect the deduction of taxes that a shareholder would pay on Fund distributions or the redemption of Fund shares. |
(2) | | The Russell MidCap Growth Index, an unmanaged index, measures the performance of those Russell midcap companies with higher price-to-book ratios and higher forecasted growth values. The Index figures do not reflect the deduction of any fees, expenses or taxes. |
| | |
| The accompanying notes are an integral part of these financial statements. | | 9 |
COMMERCE MIDCAP GROWTH FUND
Schedule of Investments (continued)
April 30, 2007 (Unaudited)
| | | | |
| | |
| Shares | | Description | | Value |
| Common Stocks – (continued) |
| Health Technology – (continued) |
| 10,060 | | ResMed, Inc.* | | $ 425,136 |
| 10,700 | | Respironics, Inc.* | | 436,132 |
| 29,400 | | Sepracor, Inc.* | | 1,578,192 |
| | | | |
| | | | 10,973,365 |
| |
| Industrial Services – 2.1% | | |
| 20,586 | | Jacobs Engineering Group, Inc.* | | 1,038,152 |
| 44,500 | | Quanta Services, Inc.* | | 1,223,305 |
| | | | |
| | | | 2,261,457 |
| |
| Process Industries – 7.0% | | |
| 62,200 | | Crown Holdings, Inc.* | | 1,503,374 |
| 59,592 | | Ecolab, Inc. | | 2,561,860 |
| 14,515 | | Pactiv Corp.* | | 501,929 |
| 27,000 | | PPG Industries, Inc. | | 1,986,660 |
| 21,236 | | Sigma-Aldrich Corp. | | 893,611 |
| | | | |
| | | | 7,447,434 |
| |
| Producer Manufacturing – 5.0% | | |
| 7,400 | | Cummins, Inc. | | 681,984 |
| 43,670 | | Graco, Inc. | | 1,724,965 |
| 7,178 | | ITT Industries, Inc. | | 458,028 |
| 19,600 | | Parker Hannifin Corp. | | 1,805,944 |
| 8,500 | | Terex Corp.* | | 661,725 |
| | | | |
| | | | 5,332,646 |
| |
| Retail Trade – 6.8% | | |
| 23,250 | | American Eagle Outfitters, Inc. | | 685,178 |
| 32,000 | | J.C. Penney Co., Inc. | | 2,530,880 |
| 83,800 | | Liberty Media Corp. Interactive* | | 2,097,514 |
| 28,160 | | Nordstrom, Inc. | | 1,546,547 |
| 8,585 | | Williams-Sonoma, Inc. | | 302,364 |
| | | | |
| | | | 7,162,483 |
| |
| Technology Services – 11.5% | | |
| 45,975 | | Adobe Systems, Inc.* | | 1,910,721 |
| 16,115 | | Akamai Technologies, Inc.* | | 710,349 |
| 45,500 | | Autodesk, Inc.* | | 1,877,785 |
| 91,840 | | BEA Systems, Inc.* | | 1,082,794 |
| 16,690 | | Fair Isaac Corp. | | 596,000 |
| 50,500 | | Intuit, Inc.* | | 1,436,725 |
| 50,560 | | Paychex, Inc. | | 1,875,776 |
| 95,855 | | VeriSign, Inc.* | | 2,621,634 |
| | | | |
| | | | 12,111,784 |
| |
| TOTAL COMMON STOCKS |
| (Cost $85,384,370) | | $101,845,248 |
| |
|
| Exchange Traded Fund – 3.1% |
| 28,760 | | iShares Russell Midcap Growth Index Fund | | $ 3,214,505 |
| (Cost $2,956,810) | | |
| |
| | | | | | | | |
Principal
Amount | | Interest
Rate | | | Maturity
Date | | Value | |
| Repurchase Agreement(a) – 0.7% | |
| State Street Bank & Trust Co. | |
| $763,000 | | 4.690 | % | | 05/01/07 | | $ 763,000 | |
Maturity Value: $763,099 | |
(Cost $763,000) | |
| | |
| TOTAL INVESTMENTS – 100.1% | |
(Cost $89,104,180) | | $105,822,753 | |
| Liabilities in excess of other assets – (0.1)% | | (105,900 | ) |
| | |
| Net Assets – 100.0% | | $105,716,853 | |
| | |
| | |
| The percentage shown for each investment category reflects the value of investments in that category as a percentage of net assets. |
| * | | Non-income producing security. |
| (a) | | Repurchase agreement was entered into on April 30, 2007. This agreement was fully collateralized by $595,000 U.S Treasury Bond, 8.130%, due 08/15/19 with a market value of $784,650. |
PORTFOLIO COMPOSITION
| | | | | | |
| Industry Allocation | | AS OF
04/30/07 | | | AS OF
10/31/06 | |
| | |
Electronic Technology | | 17.2 | % | | 12.5 | % |
Technology Services | | 11.5 | | | 13.7 | |
Health Technology | | 10.4 | | | 9.7 | |
Finance | | 9.4 | | | 6.9 | |
Health Services | | 8.4 | | | 8.7 | |
Process Industries | | 7.0 | | | 3.9 | |
Retail Trade | | 6.8 | | | 7.6 | |
Commercial Services | | 6.6 | | | 10.2 | |
Producer Manufacturing | | 5.0 | | | 4.1 | |
Communications | | 4.4 | | | 5.2 | |
Consumer Services | | 4.1 | | | 6.3 | |
Exchange Traded Fund | | 3.1 | | | 4.5 | |
Consumer Non-Durables | | 2.6 | | | 0.5 | |
Industrial Services | | 2.1 | | | 1.2 | |
Consumer Durables | | 0.8 | | | 1.0 | |
Repurchase Agreement | | 0.7 | | | 2.0 | |
Distribution Services | | 0.0 | | | 1.9 | |
Energy Minerals | | 0.0 | | | 0.4 | |
| | |
The percentage shown for each investment category reflects the value of investments in that category as a percentage of net assets.
The Fund is actively managed and, as such, its composition may differ over time.
| | |
| 10 | | The accompanying notes are an integral part of these financial statements. |
COMMERCE INTERNATIONAL EQUITY FUND
International Equity Fund
Performance Review(1) (Unaudited)
For the six months ended April 30, 2007, the Institutional Shares of the Fund had a total return of 14.48%, based on Net Asset Value (NAV). This compares to the Morgan Stanley Capital International Europe, Australasia and Far East (net) Index(2) (“MSCI® EAFE®”) six-month return of 15.46% and MSCI® EAFE® (gross) Index six-month return of 15.68%. Past performance is no guarantee of future results.
Schedule of Investments
April 30, 2007 (Unaudited)
| | | | |
| | |
| Shares | | Description | | Value |
| Common Stocks – 98.0% |
| Australian Dollar – 4.0% | | |
| 7,174 | | Aristocrat Leisure Ltd. (Hotels Restaurant & Leisure) | | $ 98,909 |
| 28,000 | | Coles Myer Ltd. (Food & Staples Retailing) | | 401,156 |
| 93,729 | | Macquarie Airports (Transportation Infrastructure) | | 309,829 |
| 14,181 | | Macquarie Bank Ltd. (Capital Markets) | | 1,024,689 |
| 79,811 | | Macquarie Infrastructure Group (Transportation Infrastructure) | | 251,228 |
| 11,400 | | National Australia Bank Ltd. (Commercial Banks) | | 407,136 |
| 36,402 | | QBE Insurance Group Ltd. (Insurance) | | 933,012 |
| 24,300 | | Zinifex Ltd. (Metals & Mining) | | 334,018 |
| | | | |
| | | | 3,759,977 |
| |
| Brazilian Real – 1.7% | | |
| 4,800 | | Cia de Bebidas das Americas ADR, Preference (Beverages) | | 280,416 |
| 20,200 | | Cia Vale do Rio Doce ADR (Metals & Mining) | | 820,322 |
| 10,200 | | Gerdau SA (Metals & Mining) | | 204,306 |
| 1,300 | | Petroleo Brasileiro SA ADR (Oil, Gas & Consumable Fuels) | | 131,599 |
| 2,000 | | Unibanco-Uniao de Bancos Brasileiros SA ADR* (Commercial Banks) | | 194,120 |
| | | | |
| | | | 1,630,763 |
| |
| British Pound Sterling – 18.6% | | |
| 37,820 | | 3i Group PLC (Capital Markets) | | 875,780 |
| 13,200 | | AstraZeneca PLC (Pharmaceuticals) | | 723,251 |
| 51,124 | | Aviva PLC (Insurance) | | 808,149 |
| 76,700 | | BAE Systems PLC (Aerospace & Defense) | | 700,933 |
| 62,861 | | Barclays PLC (Commercial Banks) | | 914,490 |
| 16,200 | | BP PLC (Oil, Gas & Consumable Fuels) | | 183,195 |
| |
| | | | |
| | |
| Shares | | Description | | Value |
| Common Stocks – (continued) |
| British Pound Sterling – (continued) |
| 22,900 | | British Energy Group PLC* (Electric Utilities) | | $ 238,124 |
| 35,878 | | Capita Group PLC (Commercial Services & Supplies) | | 507,956 |
| 42,900 | | Centrica Ordinary (Multi-Utilities) | | 332,854 |
| 16,817 | | easyJet PLC* (Airlines) | | 239,270 |
| 20,000 | | Enterprise Inns PLC (Hotels Restaurants & Leisure) | | 256,362 |
| 65,455 | | Friends Provident PLC (Insurance) | | 248,037 |
| 40,100 | | HBOS PLC (Commercial Banks) | | 868,436 |
| 43,000 | | Home Retail Group (Internet & Catalog Retail) | | 393,176 |
| 61,385 | | International Power PLC (Independent Power Producers) | | 540,414 |
| 121,108 | | Man Group PLC (Capital Markets) | | 1,368,315 |
| 26,800 | | Marston’s PLC (Beverages) | | 231,249 |
| 24,180 | | Pearson PLC (Media) | | 416,559 |
| 10,580 | | Punch Taverns PLC (Hotels Restaurant & Leisure) | | 275,885 |
| 12,448 | | Reckitt Benckiser PLC (Household Products) | | 684,786 |
| 6,226 | | Rio Tinto PLC (Metals & Mining) | | 382,593 |
| 39,054 | | Royal Bank of Scotland Group PLC (Commercial Banks) | | 1,507,258 |
| 26,324 | | Royal Dutch Shell PLC (Oil, Gas & Consumable Fuels) | | 920,873 |
| 12,700 | | SABMiller PLC (Beverages) | | 302,215 |
| 42,742 | | Tesco PLC (Food & Staples Retailing) | | 395,304 |
| 353,100 | | Vodafone Group PLC (Wireless Telecommunication Services) | | 1,013,245 |
| 40,167 | | Xstrata PLC (Metals & Mining) | | 2,121,303 |
| | | | |
| | | | 17,450,012 |
| |
(1) | | Returns assume fee waivers and expense reductions and are not annualized. Returns do not reflect the deduction of taxes that a shareholder would pay on Fund distributions or the redemption of Fund shares. |
(2) | | Effective March 1, 2006, the Fund changed its benchmark from the MSCI® EAFE® (gross) Index to the MSCI® EAFE® (net) Index (unhedged). The Fund made this change because the Fund’s investment adviser believes that the MSCI® EAFE® (net) Index is the most commonly used of the two indexes by funds with similar investment objectives and strategies. The unmanaged MSCI® EAFE® (net) Index is a market capitalization-weighted composite of securities in 21 developed markets outside of North America, in Europe, Australasia, and the Far East. The Index includes the minimum possible dividend reinvestment. The Index figures do not reflect the deduction of any fees, expenses or taxes. The MSCI® EAFE® (gross) Index is a market capitalization-weighted composite of securities in 21 developed markets outside of North America, in Europe, Australasia, and the Far East. The Index includes the maximum dividend reinvestment. The Index figures do not reflect the deduction of any fees, expenses or taxes. |
| | |
| The accompanying notes are an integral part of these financial statements. | | 11 |
COMMERCE INTERNATIONAL EQUITY FUND
Schedule of Investments (continued)
April 30, 2007 (Unaudited)
| | | | |
| | |
| Shares | | Description | | Value |
| Common Stocks – (continued) |
| Canadian Dollar – 1.3% | | |
| 6,014 | | Nexen, Inc. (Oil, Gas & Consumable Fuels) | | $ 357,892 |
| 6,600 | | Teck Cominco Ltd. (Metals & Mining) | | 500,040 |
| 7,430 | | Telus Corp. (Diversified Telecommunication) | | 396,972 |
| | | | |
| | | | 1,254,904 |
| |
| Danish Krone – 0.3% | | |
| 2,150 | | Carlsberg A/S Class B (Beverages) | | 242,170 |
| |
| Euro – 35.0% | | |
| Austria – 0.6% | | |
| 3,300 | | OMV AG (Oil, Gas & Consumable Fuels) | | 210,757 |
| 5,600 | | Voestalpine AG (Metals & Mining) | | 380,191 |
| | | | |
| | | | 590,948 |
| |
| Belgium – 0.7% | | |
| 14,300 | | Fortis (Diversified Financial Services) | | 647,100 |
| |
| Finland – 0.9% | | |
| 31,890 | | Nokia Oyj* (Communications Equipment) | | 812,058 |
| |
| France – 12.5% | | |
| 7,666 | | Accor SA (Hotels Restaurants & Leisure) | | 726,858 |
| 8,900 | | Air France-KLM (Airlines) | | 456,423 |
| 6,100 | | BNP Paribas SA (Commercial Banks) | | 712,981 |
| 12,493 | | Cap Gemini SA (IT Services) | | 951,992 |
| 5,000 | | Compagnie Generale des Etablissements Michelin Class B (Auto Components) | | 640,157 |
| 17,237 | | Credit Agricole SA (Commercial Banks) | | 731,078 |
| 5,894 | | Essilor International SA (Heatlh Care Equipment & Supplies) | | 712,631 |
| 12,140 | | European Aeronautic Defence and Space Co. (Aerospace & Defense) | | 392,966 |
| 1,993 | | Groupe Danone (Food Products) | | 329,497 |
| 2,075 | | L’Oreal SA (Personal Products) | | 249,525 |
| 9,200 | | Renault SA (Automobiles) | | 1,201,743 |
| 8,900 | | Sanofi-Aventis (Pharmaceuticals) | | 819,570 |
| 4,515 | | Societe Generale (Commercial Banks) | | 964,258 |
| 20,720 | | Total SA (Oil, Gas & Consumable Fuels) | | 1,539,886 |
| 7,913 | | Vinci SA (Construction & Engineering) | | 1,280,159 |
| | | | |
| | | | 11,709,724 |
| |
| Germany – 7.2% | | |
| 4,200 | | Allianz AG (Insurance) | | 955,445 |
| 6,800 | | BASF AG (Chemicals) | | 811,317 |
| 14,982 | | Bayer AG (Chemicals) | | 1,030,641 |
| 22,400 | | Deutsche Lufthansa AG (Airlines) | | 674,333 |
| 8,200 | | Deutsche Telekom AG (Diversified Telecommunication) | | 149,724 |
| 6,506 | | E.ON AG (Electric Utilities) | | 979,466 |
| 4,999 | | Merck KGaA (Pharmaceuticals) | | 667,385 |
| |
| | | | |
| | |
| Shares | | Description | | Value |
| Common Stocks – (continued) |
| Germany – (continued) |
| 4,600 | | MunichRe AG (Insurance) | | $ 822,903 |
| 6,120 | | RWE AG (Multi-Utilities) | | 648,172 |
| | | | |
| | | | 6,739,386 |
| |
| Ireland – 2.1% | | |
| 58,644 | | Anglo Irish Bank Corp. PLC (Commercial Banks) | | 1,324,881 |
| 14,660 | | CRH PLC (Construction Materials) | | 645,186 |
| | | | |
| | | | 1,970,067 |
| |
| Italy – 5.1% | | |
| 12,000 | | Buzzi Unicem SPA (Construction Materials) | | 387,615 |
| 39,352 | | ENI SPA (Oil, Gas & Consumable Fuels) | | 1,311,932 |
| 44,902 | | Fiat SPA* (Automobiles) | | 1,332,742 |
| 5,500 | | Fondiaria-Sai SpA (Insurance) | | 293,318 |
| 138,142 | | UniCredito Italiano SpA (Commercial Banks) | | 1,428,946 |
| | | | |
| | | | 4,754,553 |
| |
| Netherlands – 3.1% | | |
| 6,868 | | ABN AMRO Holding NV (Commercial Banks) | | 336,751 |
| 13,200 | | Buhrmann NV (Commercial Services & Supplies) | | 178,693 |
| 29,323 | | ING Groep NV (Diversified Financial Services) | | 1,346,125 |
| 13,871 | | Mittal Steel Co. NV (Metals & Mining) | | 751,187 |
| 11,256 | | Wolters Kluwer NV (Media) | | 334,551 |
| | | | |
| | | | 2,947,307 |
| |
| Spain – 1.7% | | |
| 8,942 | | Industria de Diseno Textil SA (Specialty Retail) | | 553,758 |
| 18,000 | | Repsol YPF SA (Oil, Gas & Consumable Fuels) | | 595,424 |
| 20,185 | | Telefonica SA (Diversified Telecommunication Services) | | 454,775 |
| | | | |
| | | | 1,603,957 |
| |
| Sweden – 1.1% | | |
| 14,956 | | Atlas Copco AB (Machinery) | | 575,913 |
| 51,605 | | TeliaSonera AB (Diversified Telecommunication) | | 421,695 |
| | | | |
| | | | 997,608 |
| |
| Total Euro | | $32,772,708 |
| |
| | |
| 12 | | The accompanying notes are an integral part of these financial statements. |
COMMERCE INTERNATIONAL EQUITY FUND
| | | | |
| | |
| Shares | | Description | | Value |
| Common Stocks – (continued) |
| Hong Kong Dollar – 2.0% | | |
| 352,000 | | China Construction Bank Class H (Commercial Banks) | | $ 215,095 |
| 60,000 | | China Netcom Group Corp. Ltd. (Diversified Telecommunication) | | 148,497 |
| 192,000 | | China Petroleum & Chemical Corp. (Oil, Gas & Consumable Fuels) | | 168,624 |
| 193,500 | | China Shenhua Energy Co. Ltd. (Oil, Gas & Consumable Fuels) | | 484,838 |
| 49,000 | | Esprit Holdings Ltd. (Specialty Retail) | | 598,218 |
| 121,900 | | Sino Land Co. Ltd. (Real Estate Management & Development) | | 258,062 |
| | | | |
| | | | 1,873,334 |
| |
| Indian Rupee – 0.6% | | |
| 7,484 | | Infosys Technologies Ltd. (IT Services) | | 372,456 |
| 2,330 | | State Bank of India Ltd. GDR (Commercial Banks) | | 159,605 |
| | | | |
| | | | 532,061 |
| |
| Indonesian Rupiah – 0.1% | | |
| 101,000 | | PT Telekomunikasi Indonesia (Diversified Telecommunication) | | 116,757 |
| |
| Japanese Yen – 18.2% | | |
| 9,000 | | Aisin Seiki Co. Ltd. (Auto Components) | | 298,280 |
| 28,600 | | Canon, Inc. (Office Electronics) | | 1,615,684 |
| 20,000 | | Cosmo Oil Co. Ltd. (Oil, Gas & Consumable Fuels) | | 83,860 |
| 17,100 | | DAIICHI SANKYO Co. Ltd. (Pharmaceuticals) | | 512,349 |
| 17,000 | | Daiwa House Industry Co. Ltd. (Household Durables) | | 268,620 |
| 15,000 | | Denso Corp. (Auto Components) | | 533,540 |
| 11 | | East Japan Railway Co. (Road & Rail) | | 89,576 |
| 14,300 | | Edion Corp. (Specialty Retail) | | 199,148 |
| 8,200 | | Honda Motor Co. Ltd. (Automobiles) | | 283,433 |
| 69,000 | | Isuzu Motors Ltd. (Automobiles) | | 366,699 |
| 18,900 | | JFE Holdings, Inc. (Metals & Mining) | | 1,047,144 |
| 5,000 | | Mitsubishi Chemical Holdings Corp. (Chemicals) | | 40,424 |
| 17,200 | | Mitsubishi Corp. (Trading Companies & Distribution) | | 369,235 |
| 74,000 | | Mitsui & Co. Ltd. (Trading Companies & Distribution) | | 1,334,645 |
| 58,000 | | Mitsui Chemicals, Inc. (Chemicals) | | 484,446 |
| 39,000 | | Mitsui OSK Lines Ltd. (Marine) | | 495,803 |
| 45,000 | | NGK Insulators Ltd. (Machinery) | | 990,501 |
| 42,000 | | Nippon Mining Holdings, Inc. (Oil, Gas & Consumable Fuels) | | 340,260 |
| 98 | | Nippon Telegraph & Telephone Corp. (Diversified Telecommunication) | | 488,831 |
| 12,000 | | Nippon Yusen Kasushiki Kaisa (Marine) | | 103,745 |
| 18,900 | | Nissan Motor Co. Ltd. (Automobiles) | | 192,187 |
| |
| | | | |
| | |
| Shares | | Description | | Value |
| Common Stocks – (continued) |
| Japanese Yen – (continued) |
| 18,600 | | Nitto Denko Corp. (Chemicals) | | $ 828,154 |
| 58,300 | | Nomura Holdings, Inc. (Capital Markets) | | 1,129,552 |
| 2,750 | | ORIX Corp. (Consumer Finance) | | 739,946 |
| 27,000 | | Sharp Corp. (Household Durables) | | 499,393 |
| 2,200 | | Sony Corp. (Household Durables) | | 118,207 |
| 44,000 | | Sumitomo Heavy Industries Ltd. (Machinery) | | 458,099 |
| 72 | | Sumitomo Mitsui Financial Group (Commercial Banks) | | 632,715 |
| 4,900 | | Suzuki Motor Corp. (Automobiles) | | 140,252 |
| 15,600 | | Tokyo Electric Power Co. Inc. (Electric Utilities) | | 519,630 |
| 61,000 | | Toshiba Corp. (Computers & Peripherals) | | 457,940 |
| 22,700 | | Toyota Motor Corp. (Automobiles) | | 1,390,668 |
| | | | |
| | | | 17,052,966 |
| |
| Korean Won – 0.9% | | |
| 2,000 | | Honam Petrochemical Corp. (Chemicals) | | 166,506 |
| 1,150 | | Hyundai Mobis (Auto Components) | | 92,776 |
| 6,380 | | Industrial Bank of Korea (Commercial Banks) | | 128,847 |
| 1,900 | | Kookmin Bank (Commercial Banks) | | 170,426 |
| 211 | | POSCO (Metals & Mining) | | 89,192 |
| 245 | | Samsung Electronics Co. Ltd. (Semiconductors & Semiconductor) | | 151,069 |
| | | | |
| | | | 798,816 |
| |
| Mexican Peso – 1.3% | | |
| 16,900 | | America Movil SA de CV (Wireless Telecommunication Services) | | 887,757 |
| 13,400 | | Grupo Televisa SA (Media) | | 375,870 |
| | | | |
| | | | 1,263,627 |
| |
| Philippine Peso – 0.2% | | |
| 3,000 | | Philippine Long Distance Telephone Co. (Wireless Telecommunication Services) | | 160,050 |
| |
| Russian Rouble – 0.3% | | |
| 1,634 | | Mining and Metallurgical Co. Norilsk Nickel ADR (Metals & Mining) | | 318,630 |
| |
| South African Rand – 0.3% | | |
| 55,980 | | Sanlam Ltd. (Insurance) | | 188,795 |
| 5,900 | | Standard Bank Group Ltd. (Commercial Banks) | | 92,634 |
| | | | |
| | | | 281,429 |
| |
| Swiss Franc – 12.3% | | |
| 55,060 | | ABB Ltd. (Electrical Equipment) | | 1,116,928 |
| 3,300 | | Alcon, Inc. (Heatlh Care Equipment & Supplies) | | 445,269 |
| 42,851 | | Credit Suisse Group (Capital Markets) | | 3,386,568 |
| 3,772 | | Nestle AG (Food Products) | | 1,498,338 |
| 2,125 | | Nobel Biocare Holding AG (Heatlh Care Equipment & Supplies) | | 769,768 |
| |
| | |
| The accompanying notes are an integral part of these financial statements. | | 13 |
COMMERCE INTERNATIONAL EQUITY FUND
Schedule of Investments (continued)
April 30, 2007 (Unaudited)
| | | | |
| | |
| Shares | | Description | | Value |
| Common Stocks – (continued) |
| Swiss Franc – (continued) | | |
| 2,280 | | Novartis AG (Pharmaceuticals) | | $ 132,996 |
| 8,112 | | Roche Holding AG (Pharmaceuticals) | | 1,532,733 |
| 9,449 | | Swiss Re (Insurance) | | 893,460 |
| 26,104 | | UBS AG (Capital Markets) | | 1,710,728 |
| | | | |
| | | | 11,486,788 |
| |
| Taiwan Dollar – 0.9% | | |
| 94,000 | | AU Optronics Corp. (Electronic Equipment & Instruments) | | 148,694 |
| 129,000 | | China Steel Corp. (Metals & Mining) | | 146,364 |
| 28,800 | | Hon Hai Precision Industry Co. Ltd. (Electronic Equipment & Instruments) | | 191,479 |
| 107,118 | | Taiwan Semiconductor Manufacturing Co. Ltd. (Semiconductors & Semiconductor) | | 220,888 |
| 200,000 | | United Microelectronics Corp. (Semiconductors & Semiconductor) | | 114,661 |
| | | | |
| | | | 822,086 |
| |
| TOTAL COMMON STOCKS | | |
| (Cost $72,642,748) | | $91,536,662 |
| |
| | | | | | |
| Units | | Description | | Expiration
Date | | Value |
| Warrant(a)* – 0.1% |
| Taiwan Dollar – 0.1% | | | | |
| 9,079 | | Foxconn Technology Co. Ltd. (Computers & Peripherals) | | 08/22/08 | | $85,615 |
| (Cost $48,461) | | | | |
| |
| | | | | | |
Principal
Amount | | Interest
Rate | | Maturity
Date | | Value |
| Repurchase Agreement(b) – 0.8% | | |
| State Street Bank & Trust Co. |
| $782,000 | | 4.690 | | 05/01/07 | | $782,000 |
Maturity Value: $ 782,102 | | |
(Cost $782,000) | | |
| |
| TOTAL INVESTMENTS—98.9% | | |
(Cost $73,473,209) | | $92,684,693 |
| Other assets in excess of liabilities – 1.1% | | 1,058,817 |
| |
| Net Assets – 100.0% | | $93,743,510 |
| |
| | |
| The percentage shown for each investment category reflects the value of investments in that category as a percentage of net assets. |
| * | | Non-income producing security. |
| (a) | | Securities are exempt from registration under rule 144A of the Securities Act of 1933. Under procedures approved by the Board of Trustees, such securities have been determined to be liquid by the Investment Adviser and may be resold, normally to qualified institutional buyers in transactions exempt from registration. Total market value of Rule 144A securities amounted to $85,615, which represents approximately 0.1% of net assets as of April 30, 2007. |
| (b) | | Repurchase agreement was entered into on April 30, 2007. This agreement was fully collateralized by $590,000 U.S. Treasury Bond, 8.000%, due 11/15/21 with a market value of $802,400. |
| | |
| |
| Investment Abbreviations: |
| ADR | | —AmericanDepositary Receipt |
| GDR | | —GlobalDepositary Receipt |
| |
| | |
| 14 | | The accompanying notes are an integral part of these financial statements. |
COMMERCE INTERNATIONAL EQUITY FUND
ADDITIONAL INVESTMENT INFORMATION
FORWARD FOREIGN CURRENCY CONTRACTS — At April 30, 2007, the Fund had outstanding forward foreign currency exchange contracts, both to purchase and sell foreign currencies:
| | | | | | | | | | | | | |
| Open Forward Foreign Currency Contracts with Unrealized Gain | | Purchase/ Sale Contract | | Expiration Date | | Value on Settlement Date | | Current Value | | Unrealized Gain |
Euro | | Purchase | | 05/02/07 | | $ | 245,448 | | $ | 245,658 | | $ | 210 |
Euro | | Sale | | 05/03/07 | | | 157,274 | | | 156,955 | | | 319 |
Japanese Yen | | Sale | | 05/07/07 | | | 427,386 | | | 427,256 | | | 130 |
TOTAL OPEN FORWARD FOREIGN CURRENCY CONTRACTS WITH UNREALIZED GAIN | | | | | | | | | | | | $ | 659 |
| | | | | | | | | | | | | | |
| Open Forward Foreign Currency Contracts with Unrealized Loss | | Purchase/ Sale Contract | | Expiration Date | | Value on Settlement Date | | Current Value | | Unrealized Loss | |
Hong Kong Dollar | | Sale | | 05/03/07 | | $ | 243,528 | | $ | 243,555 | | $ | (27 | ) |
Japanese Yen | | Sale | | 05/02/07 | | | 468,110 | | | 468,811 | | | (701 | ) |
Swiss Franc | | Purchase | | 05/02/07 | | | 251,843 | | | 251,754 | | | (89 | ) |
Swiss Franc | | Purchase | | 05/03/07 | | | 161,049 | | | 160,673 | | | (376 | ) |
TOTAL OPEN FORWARD FOREIGN CURRENCY CONTRACTS WITH UNREALIZED LOSS | | | | | | | | | | | | $ | (1,193 | ) |
FUTURES CONTRACTS — At April 30, 2007, the following futures contract was open:
| | | | | | | | | |
| Type | | Number of Contracts
Long | | Settlement Month | | Market
Value | | Unrealized Gain |
Dow Jones Euro Stoxx 50 Index | | 5 | | June 2007 | | 217,050 EUR | | $ | 7,930 |
| | |
| The accompanying notes are an integral part of these financial statements. | | 15 |
COMMERCE INTERNATIONAL EQUITY FUND
Schedule of Investments (continued)
April 30, 2007 (Unaudited)
PORTFOLIO COMPOSITION
| | | | | | |
| Industry Allocation | | AS OF
04/30/07 | | | AS OF
10/31/06 | |
| | |
Commercial Banks | | 11.5 | % | | 16.7 | % |
Capital Markets | | 10.1 | | | 6.3 | |
Metals & Mining | | 7.5 | | | 7.0 | |
Oil, Gas & Consumable Fuels | | 6.8 | | | 7.5 | |
Insurance | | 5.5 | | | 5.1 | |
Automobiles | | 5.2 | | | 4.6 | |
Pharmaceuticals | | 4.7 | | | 5.4 | |
Chemicals | | 3.6 | | | 2.9 | |
Wireless Telecommunication Services | | 2.2 | | | 2.4 | |
Machinery | | 2.2 | | | 1.0 | |
Diversified Financial Services | | 2.1 | | | 3.6 | |
Health Care Equipment & Supplies | | 2.1 | | | 1.2 | |
Food Products | | 1.9 | | | 1.9 | |
Electric Utilities | | 1.9 | | | 1.5 | |
Diversified Telecommunication | | 1.9 | | | 1.2 | |
Trading Companies & Distribution | | 1.8 | | | 1.8 | |
Office Electronics | | 1.7 | | | 1.2 | |
Auto Components | | 1.7 | | | 1.8 | |
Airlines | | 1.5 | | | 0.7 | |
Specialty Retail | | 1.5 | | | 0.8 | |
IT Services | | 1.4 | | | 1.4 | |
Hotels Restaurant & Leisure | | 1.4 | | | 0.7 | |
Construction & Engineering | | 1.4 | | | 1.1 | |
Media | | 1.2 | | | 1.7 | |
Electrical Equipment | | 1.2 | | | 1.2 | |
Aerospace & Defense | | 1.2 | | | 1.1 | |
Beverages | | 1.1 | | | 0.3 | |
Construction Materials | | 1.1 | | | 1.0 | |
Multi-Utilities | | 1.0 | | | 0.8 | |
Household Durables | | 0.9 | | | 1.3 | |
Communications Equipment | | 0.9 | | | 0.0 | |
Food & Staples Retailing | | 0.8 | | | 1.1 | |
Repurchase Agreement | | 0.8 | | | 1.0 | |
Consumer Finance | | 0.8 | | | 1.9 | |
Commercial Services & Supplies | | 0.7 | | | 0.2 | |
Household Products | | 0.7 | | | 0.0 | |
Marine | | 0.6 | | | 0.6 | |
Transportation Infrastructure | | 0.6 | | | 0.3 | |
Computers & Peripherals | | 0.6 | | | 0.8 | |
Independent Power Producers | | 0.6 | | | 0.0 | |
Semiconductors & Semiconductor | | 0.5 | | | 0.4 | |
Diversified Telecommunication Services | | 0.5 | | | 0.0 | |
Internet & Catalog Retail | | 0.4 | | | 0.0 | |
Electronic Equipment & Instruments | | 0.4 | | | 1.6 | |
Real Estate Management & Development | | 0.3 | | | 0.7 | |
Personal Products | | 0.3 | | | 0.2 | |
Road & Rail | | 0.1 | | | 0.1 | |
Tobacco | | 0.0 | | | 2.2 | |
Multiline Retail | | 0.0 | | | 0.7 | |
Distributors | | 0.0 | | | 0.6 | |
Software | | 0.0 | | | 0.4 | |
Gas Utilities | | 0.0 | | | 0.3 | |
| | |
The percentage shown for each investment category reflects the value of investments in that category as a percentage of net assets.
The Fund is actively managed and, as such, its composition may differ over time.
| | |
| 16 | | The accompanying notes are an integral part of these financial statements. |
COMMERCE ASSET ALLOCATION FUND
Asset Allocation Fund
Performance Review(1) (Unaudited)
For the six months ended April 30, 2007, the Institutional Shares of the Fund had a total return of 6.60%, based on Net Asset Value (NAV). This compares to the Russell 1000 Index(2) six-month return of 9.10% and the Asset Allocation Composite Index(3) six-month return of 7.12%. Past performance is no guarantee of future results.
Schedule of Investments
April 30, 2007 (Unaudited)
| | | | |
| | |
| Shares | | Description | | Value |
| Mutual Funds (Institutional Shares) – 84.5% |
| Equity – 50.7% | | |
| 132,796 | | Commerce Growth Fund – 20.1%(a) | | $ 3,608,068 |
| 99,387 | | Commerce Value Fund – 16.0%(a) | | 2,884,199 |
| 56,484 | | Commerce International Equity Fund – 9.4%(a) | | 1,686,034 |
| 24,595 | | Commerce MidCap Growth Fund – 5.0%(a) | | 896,007 |
| 1,664 | | T. Rowe Price Mid-Cap Value Fund – 0.2% | | 45,174 |
| | | | |
| | | | 9,119,482 |
| |
| Fixed Income(a) – 33.8% |
| 332,090 | | Commerce Bond Fund – 33.8% | | 6,077,242 |
| |
| TOTAL MUTUAL FUNDS (INSTITUTIONAL SHARES) |
| (Cost $13,805,795) | | $15,196,724 |
| |
|
| Exchange Traded Funds – 15.7% |
| 1,660 | | iShares Dow Jones US Real Estate Index Fund – 0.8% | | $ 141,913 |
| 8,670 | | iShares Lehman US Treasury Inflation Protected Securities Fund – 4.9% | | 878,618 |
| 1,608 | | iShares MSCI Emerging Markets Index Fund – 1.1% | | 194,311 |
| 5,610 | | iShares Russell 2000 Growth Index Fund – 2.5% | | 463,610 |
| 3,575 | | iShares Russell 2000 Value Index Fund – 1.6% | | 292,006 |
| 5,461 | | iShares Russell Midcap Value Index Fund – 4.8% | | 862,128 |
| |
| TOTAL EXCHANGE TRADED FUNDS |
| (Cost $2,583,245) | | $ 2,832,586 |
| |
| | | | |
| | |
| | | | | Value |
| |
| TOTAL INVESTMENTS – 100.2% |
| (Cost $16,389,040) | | $18,029,310 |
| Liabilities in excess of other assets – (0.2)% | | (38,018) |
| |
| Net Assets – 100.0% | | $17,991,292 |
| |
| | |
| The percentage shown for each investment category reflects the value of investments in that category as a percentage of net assets. |
| (a) | | Represents an affiliated issuer. |
PORTFOLIO COMPOSITION
| | | | | | |
| Underlying Funds Allocation | | AS OF 04/30/07 | | | AS OF 10/31/06 | |
| | |
Commerce Bond Fund | | 33.8 | % | | 36.8 | % |
Commerce Growth Fund | | 20.1 | | | 17.7 | |
Commerce Value Fund | | 16.0 | | | 17.2 | |
Commerce International Equity Fund | | 9.4 | | | 9.0 | |
Commerce MidCap Growth Fund | | 5.0 | | | 4.5 | |
iShares Lehman US Treasury Inflation Protected Securities Fund | | 4.9 | | | 3.0 | |
iShares Russell Midcap Value Index Fund | | 4.8 | | | 0.0 | |
iShares Russell 2000 Growth Index Fund | | 2.5 | | | 2.3 | |
iShares Russell 2000 Value Index Fund | | 1.6 | | | 1.8 | |
iShares MSCI Emerging Markets Index Fund | | 1.1 | | | 1.0 | |
iShares Dow Jones US Real Estate Index Fund | | 0.8 | | | 0.9 | |
T. Rowe Price Mid-Cap Value Fund | | 0.2 | | | 5.6 | |
| | |
The percentage shown for each investment category reflects the value of investments in that category as a percentage of net assets.
The Fund is actively managed and, as such, its composition may differ over time.
(1) | | Returns assume fee waivers and expense reductions and are not annualized. Returns do not reflect the deduction of taxes that a shareholder would pay on Fund distributions or the redemption of Fund shares. |
(2) | | The Russell 1000 Index is an unmanaged market-weighted index comprised of the 1000 largest U.S. companies. The Index figures do not reflect any fees, expenses or taxes. |
(3) | | The Asset Allocation Composite Index (“Composite Index”) is a hypothetical representation prepared by the Adviser of the performance of the Fund’s asset classes weighted according to their respective weightings in the Fund’s target range. The Composite Index is comprised of the Russell 1000 Index (50%), the Lehman Brothers Aggregate Bond Index (40%) and Morgan Stanley Capital International Europe Australasia and Far East Index (“MSCI EAFE”) (10%). The Lehman Brothers Aggregate Bond Index is an unmanaged index comprised of the Lehman Brothers Government/Corporate Bond Index, Mortgage-Backed Securities Index and Asset-Backed Securities Index. The MSCI® EAFE® (gross) Index (unhedged) is an unmanaged market capitalization weighted composite of securities in 21 developed markets outside of North America, in Europe, Australia and the Far East. The MSCI® EAFE® (gross) Index includes the maximum dividend reinvestment. The Composite Index figures do not reflect any deduction of any fees, expenses or taxes. |
| | |
| The accompanying notes are an integral part of these financial statements. | | 17 |
COMMERCE BOND FUND
Bond Fund
Performance Review(1) (Unaudited)
For the six months ended April 30, 2007, the Institutional Shares of the Fund had a total return of 3.40%, based on Net Asset Value (NAV). This compares to the Lehman Brothers Aggregate Bond Index(2) six-month return of 2.64%. Past performance is no guarantee of future results.
Schedule of Investments
April 30, 2007 (Unaudited)
| | | | | | | |
Principal
Amount | | Interest
Rate | | | Maturity
Date | | Value |
| Asset-Backed Securities – 11.4% |
Auto(a) – 0.9% | | | | | |
| Hertz Vehicle Financing LLC Series 2005-1A, Class A5 |
| $ 4,770,000 | | 5.080 | % | | 11/25/11 | | $ 4,762,806 |
| |
Commercial – 2.4% | | |
| Asset Securitization Corp. Series 1995-MD4, Class A1 |
| 72,600 | | 7.100 | | | 08/13/29 | | 72,757 |
| Asset Securitization Corp. Series 1997-D4, Class AIE |
| 990,704 | | 7.525 | | | 04/14/29 | | 993,269 |
| LB Commercial Conduit Mortgage Trust Series 1998-C4, Class A1B |
| 6,330,002 | | 6.210 | | | 10/15/35 | | 6,377,563 |
| LB-UBS Commercial Mortgage Trust Series 2002-C1, Class A4 |
| 5,500,000 | | 6.462 | | | 03/15/31 | | 5,779,836 |
| | | | | | | |
| | | | | | | 13,223,425 |
| |
Credit Card – 1.6% | | |
| Cabela’s Master Credit Card Trust Series 2005-1A, Class A1(a) |
| 5,000,000 | | 4.970 | | | 10/15/13 | | 5,007,799 |
| Citibank Credit Card Issuance Trust Series 2004, Class A8 |
| 3,600,000 | | 4.900 | | | 12/12/16 | | 3,546,105 |
| | | | | | | |
| | | | | | | 8,553,904 |
| |
Equipment – 0.6% | | |
| CIT Equipment Collateral, Series 2005-VT1, Class A4 |
| 3,150,000 | | 4.360 | | | 11/20/12 | | 3,123,932 |
| |
Home Equity – 1.5% | | |
| Contimortgage Home Equity Loan Trust Series 1999-3, Class A6 |
| 454,100 | | 8.180 | | | 12/25/29 | | 452,770 |
| Equifirst Mortgage Loan Trust Series 2003-2, Class 2A2 |
| 2,158,546 | | 3.750 | | | 09/25/33 | | 2,044,569 |
| Residential Funding Mortgage Securities I, Inc. Series 2000-HI2, Class AI5 |
| 3,020,438 | | 8.350 | | | 03/25/25 | | 3,008,892 |
| | | | | | | |
Principal
Amount | | Interest
Rate | | | Maturity
Date | | Value |
| Asset-Backed Securities – (continued) |
Home Equity – (continued) | | |
| Residential Funding Mortgage Securities I, Inc. Series 2000-HI4, Class AI7(b) |
| $ 2,859,063 | | 8.480 | % | | 09/25/30 | | $ 2,848,922 |
| | | | | | | |
| | | | | | | 8,355,153 |
| |
Manufactured Housing – 3.2% | | |
| Green Tree Financial Corp. Series 1993-4, Class A5 |
| 4,966,579 | | 7.050 | | | 01/15/19 | | 5,057,929 |
| Green Tree Financial Corp. Series 1995-5, Class M1 |
| 2,000,000 | | 7.650 | | | 09/15/26 | | 2,075,209 |
| Green Tree Financial Corp. Series 1996-4, Class A7 |
| 2,594,045 | | 7.900 | | | 06/15/27 | | 2,735,965 |
| Green Tree Financial Corp. Series 1997-3, Class A6 |
| 155,526 | | 7.320 | | | 03/15/28 | | 164,568 |
| Green Tree Financial Corp. Series 1998-3, Class A5 |
| 1,246,528 | | 6.220 | | | 03/01/30 | | 1,261,592 |
| Green Tree Financial Corp. Series 1998-3, Class A6 |
| 858,110 | | 6.760 | | | 03/01/30 | | 887,585 |
| Green Tree Financial Corp. Series 1999-1, Class M2 |
| 1,500,000 | | 7.340 | | | 11/01/28 | | 242,531 |
| Oakwood Mortgage Investors, Inc. Series 1996-C, Class A6 |
| 4,205,000 | | 7.650 | | | 04/15/27 | | 4,243,739 |
| Oakwood Mortgage Investors, Inc. Series 1997-A, Class A5 |
| 441,859 | | 7.125 | | | 05/15/27 | | 442,697 |
| | | | | | | |
| | | | | | | 17,111,815 |
| |
Student Loans – 1.2% | | |
| Brazos Higher Education Authority, Inc. Student Loan RB Taxable Series 2005 Class A-5 (Guaranted Student Loans)(c) |
| 3,570,000 | | 4.910 | | | 12/01/40 | | 3,568,715 |
| Northstar Education Finance, Inc. Series 2005-1, Class A5 |
| 3,000,000 | | 4.740 | | | 10/30/45 | | 2,981,760 |
| | | | | | | |
| | | | | | | 6,550,475 |
| |
| TOTAL ASSET-BACKED SECURITIES |
(Cost $62,899,190) | | | | | $ 61,681,510 |
| |
|
(1) | | Returns assume fee waivers and expense reductions and are not annualized. Returns do not reflect the deduction of taxes that a shareholder would pay on Fund distributions or the redemption of Fund shares. |
(2) | | The Lehman Brothers Aggregate Bond Index is an unmanaged index comprised of the Lehman Brothers Government Corporate Bond Index, Mortgage-Backed Securities Index and Asset-Backed Securities Index. The Index figures do not reflect the deduction of any fees, expenses or taxes. |
| | |
| 18 | | The accompanying notes are an integral part of these financial statements. |
COMMERCE BOND FUND
| | | | | | | |
Principal
Amount | | Interest
Rate | | | Maturity
Date | | Value |
| Taxable Municipal Bond Obligations – 7.1% |
Alabama – 0.2% | | |
| Montgomery Alabama Taxable GO Warrants Series 2005 (FSA) |
| $1,295,000 | | 4.790 | % | | 04/01/15 | | $ 1,253,521 |
| |
Alaska – 0.2% | | |
| Providence Alaska Health System Direct Obligation Series 2005 |
| 755,000 | | 4.680 | | | 10/01/10 | | 744,687 |
| 500,000 | | 4.790 | | | 10/01/11 | | 493,340 |
| | | | | | | |
| | | | | | | 1,238,027 |
| |
California – 0.6% | | |
| Industry California Sales Tax RB Taxable Series 2005 (MBIA) |
| 3,045,000 | | 5.000 | | | 01/01/13 | | 3,024,081 |
| |
Indiana – 1.1% | | |
| Indiana Bond Bank RB Taxable School Severance Funding Series 2006-11 (XLCA) |
| 2,715,000 | | 5.500 | | | 07/15/11 | | 2,756,404 |
| 2,805,000 | | 5.650 | | | 07/15/13 | | 2,872,432 |
| | | | | | | |
| | | | | | | 5,628,836 |
| |
Massachusetts – 0.6% | | |
| University of Massachusetts Building Authority RB Refunding Taxable Series 2006-2 (AMBAC) |
| 655,000 | | 5.360 | | | 05/01/11 | | 663,515 |
| 2,485,000 | | 5.430 | | | 05/01/12 | | 2,521,852 |
| | | | | | | |
| | | | | | | 3,185,367 |
| |
Missouri – 0.3% | | |
| St. Louis Package RB Series 2006 B (MBIA) |
| 1,560,000 | | 5.020 | | | 12/15/12 | | 1,554,634 |
| |
New Jersey – 0.2% | | |
| New Jersey Economic Development Authority RB Taxable Designated Industry Series 2004-A |
| 1,000,000 | | 5.200 | | | 03/01/14 | | 998,220 |
| |
New York – 0.7% | | |
| New York State Housing Finance Agency Personal Income Tax RB Taxable Economic Development & Housing Series 2006 B |
| 3,925,000 | | 5.220 | | | 09/15/15 | | 3,935,283 |
| |
Ohio – 0.9% | | |
| Energy Acquisition Corp. II Ohio Electricity Energy Acquisition RB Taxable Series 2005 (MBIA) |
| 1,555,000 | | 4.380 | | | 08/15/07 | | 1,551,097 |
| 3,140,000 | | 4.600 | | | 02/15/09 | | 3,119,653 |
| | | | | | | |
| | | | | | | 4,670,750 |
| |
Oklahoma – 0.4% | | |
| Oklahoma State Capital Improvement Authority RB Taxable Oklahoma State Regents Series 2006 (MBIA) |
| 2,000,000 | | 5.160 | | | 07/01/13 | | 2,008,240 |
| |
Oregon – 1.0% | | |
| Multnomah County Oregon School District 1J Portland GO Bonds Refunding Taxable Series 2004 |
| 785,000 | | 5.165 | | | 06/15/11 | | 772,267 |
| |
| | | | | | | |
Principal
Amount | | Interest
Rate | | | Maturity
Date | | Value |
| Taxable Municipal Bond Obligations – (continued) |
Oregon – (continued) | | |
| Oregon School Boards Association GO Bonds Taxable Pension Series 2005 (AMBAC) |
| $5,000,000 | | 4.358 | % | | 06/30/13 | | $ 4,810,850 |
| | | | | | | |
| | | | | | | 5,583,117 |
| |
Rhode Island – 0.5% | | |
| Providence Rhode Island GO Bonds Refunding Taxable Series 2004-B (FSA) |
| 710,000 | | 4.960 | | | 07/15/14 | | 698,150 |
| Rhode Island Convention Center Authority RB Taxable Civic Center Series 2006 A (FSA) |
| 2,155,000 | | 5.810 | | | 05/15/16 | | 2,231,050 |
| | | | | | | |
| | | | | | | 2,929,200 |
| |
Washington – 0.4% | | |
| Energy Northwest Washington RB Taxable Columbia Station Series 2005-C (AMBAC) |
| 2,335,000 | | 4.490 | | | 07/01/11 | | 2,283,770 |
| |
| TOTAL TAXABLE MUNICIPAL BOND OBLIGATIONS |
(Cost $38,528,140) | | | | | $ 38,293,046 |
| |
|
| CMBS – 0.9% |
| Small Business Administration Series 2006-P10B, Class 1 |
| $4,983,083 | | 5.681 | % | | 08/10/16 | | $ 5,045,583 |
(Cost $4,995,541) | | | | | |
| |
|
| CMO – 17.1% |
| Banc of America Mortgage Securities Series 2004-E, Class 2A5(b) |
| $5,000,000 | | 4.107 | % | | 06/25/34 | | $ 4,931,908 |
| Countrywide Alternative Loan Trust Series 2004-18CB, Class 3A1 |
| 2,575,480 | | 5.250 | | | 09/25/19 | | 2,521,506 |
| Countrywide Alternative Loan Trust Series 2005-5R, Class A2 |
| 2,738,041 | | 4.750 | | | 12/25/18 | | 2,705,944 |
| FHLMC PAC Series 2110, Class PG |
| 4,500,000 | | 6.000 | | | 01/15/29 | | 4,594,838 |
| FHLMC PAC Series 2633, Class PC |
| 6,000,000 | | 4.500 | | | 07/15/15 | | 5,921,243 |
| FHLMC PAC Series 2760, Class EC |
| 4,050,000 | | 4.500 | | | 04/15/17 | | 3,937,978 |
| FHLMC PAC Series 2836, Class XQ |
| 680,000 | | 4.500 | | | 09/15/27 | | 666,665 |
| FHLMC PAC Series 2907, Class HC |
| 2,600,000 | | 5.000 | | | 06/15/27 | | 2,584,137 |
| FHLMC PAC Series 3259, Class EA |
| 1,266,735 | | 5.000 | | | 05/15/27 | | 1,261,285 |
| FHLMC REMIC PAC Series 1579, Class PM |
| 1,018,951 | | 6.700 | | | 09/15/23 | | 1,039,390 |
| FHLMC REMIC Series 2890, Class KB |
| 3,115,000 | | 4.500 | | | 02/15/19 | | 2,960,933 |
| |
| | |
| The accompanying notes are an integral part of these financial statements. | | 19 |
COMMERCE BOND FUND
Schedule of Investments (continued)
April 30, 2007 (Unaudited)
| | | | | | | |
Principal
Amount | | Interest
Rate | | | Maturity
Date | | Value |
| CMO – (continued) |
| FHLMC REMIC TAC Series 2658, Class A |
| $2,370,492 | | 4.500 | % | | 08/15/18 | | $ 2,288,831 |
| FHLMC Series 2391, Class Z |
| 5,504,121 | | 6.000 | | | 12/15/31 | | 5,534,424 |
| FHLMC Series 2508, Class OY |
| 1,485,000 | | 4.500 | | | 10/15/17 | | 1,432,810 |
| FHLMC Series 2524, Class WC |
| 1,950,000 | | 6.000 | | | 11/15/28 | | 1,966,612 |
| FHLMC Series 2603, Class C |
| 2,620,000 | | 5.500 | | | 04/15/23 | | 2,623,935 |
| FHLMC Series 2672, Class NH |
| 3,400,000 | | 4.000 | | | 09/15/18 | | 3,132,309 |
| FHLMC Series 2677, Class BC |
| 800,000 | | 4.000 | | | 09/15/18 | | 734,480 |
| FHLMC Series 2742, Class K |
| 4,915,000 | | 4.000 | | | 01/15/19 | | 4,524,095 |
| FHLMC Series T-58, Class 1A3 |
| 1,497,145 | | 4.391 | | | 11/25/38 | | 1,482,720 |
| FNMA FNIC PAC Series 2001-45, Class WG |
| 2,022,533 | | 6.500 | | | 09/25/31 | | 2,083,297 |
| FNMA PAC Series 2003-1, Class PG |
| 3,300,000 | | 5.500 | | | 09/25/31 | | 3,307,081 |
| FNMA PAC Series 2003-117, Class KB |
| 3,000,000 | | 6.000 | | | 12/25/33 | | 3,052,435 |
| FNMA PAC Series 2004-53, Class NC |
| 3,360,000 | | 5.500 | | | 07/25/24 | | 3,375,575 |
| FNMA REMIC PAC Series 2003-14, Class AP |
| 699,461 | | 4.000 | | | 03/25/33 | | 670,867 |
| FNMA REMIC PAC Series 2003-16, Class PN |
| 5,235,000 | | 4.500 | | | 10/25/15 | | 5,163,639 |
| FNMA Series 2002-73, Class OE |
| 3,404,000 | | 5.000 | | | 11/25/17 | | 3,345,364 |
| FNMA Series 2002-82, Class XE |
| 2,660,000 | | 5.000 | | | 12/25/17 | | 2,611,314 |
| GNMA Series 1998-12, Class EB |
| 1,366,755 | | 6.500 | | | 05/20/28 | | 1,371,429 |
| Impac Secured Assets Corp. Series 2004-2, Class A6 |
| 2,000,000 | | 5.740 | | | 08/25/34 | | 2,006,304 |
| Master Asset Securitization Trust Series 2004-3, Class 5A1 |
| 602,650 | | 6.250 | | | 01/25/32 | | 604,724 |
| Residential Funding Mortgage Securities Corp. Series 2003-RM2, Class AIII |
| 3,865,877 | | 6.000 | | | 05/25/33 | | 3,878,267 |
| Residential Funding Mortgage Securities I, Inc. Series 2003-S8, Class A1 |
| 1,700,160 | | 5.000 | | | 05/25/18 | | 1,673,627 |
| Wells Fargo Mortgage Backed Securities Trust Series 2003-6, Class 1A1 |
| 2,366,957 | | 5.000 | | | 06/25/18 | | 2,316,659 |
| |
| TOTAL CMO | | |
(Cost $91,873,028) | | | | | $ 92,306,625 |
| |
|
| | | | | | | |
Principal
Amount | | Interest
Rate | | | Maturity
Date | | Value |
| Commercial Mortgages – 3.8% | | |
| FNMA Series 2000-M2, Class C(b) |
| $3,968,977 | | 7.178 | % | | 07/17/22 | | $ 4,037,052 |
| GNMA Series 2001-12, Class B(b) |
| 269,630 | | 6.228 | | | 06/16/21 | | 271,407 |
| GNMA Series 2002-62, Class B |
| 1,704,936 | | 4.763 | | | 01/16/25 | | 1,701,136 |
| GNMA Series 2003-16, Class B |
| 3,500,000 | | 4.490 | | | 08/16/25 | | 3,437,126 |
| GNMA Series 2003-38, Class JC(b) |
| 1,037,092 | | 7.061 | | | 08/16/42 | | 1,118,969 |
| GNMA Series 2004-09, Class A |
| 2,664,047 | | 3.360 | | | 08/16/22 | | 2,579,954 |
| GNMA Series 2004-45, Class A |
| 2,439,223 | | 4.020 | | | 12/16/21 | | 2,389,659 |
| GNMA Series 2004-60, Class C(b) |
| 5,000,000 | | 5.240 | | | 03/16/28 | | 5,004,281 |
| |
| TOTAL COMMERCIAL MORTGAGES | | |
(Cost $21,169,787) | | | | | $ 20,539,584 |
| |
|
| Corporate Obligations – 21.1% | | |
Aerospace/Defense – 0.3% | | |
| Lockheed Martin Corp. |
| $1,366,000 | | 6.150 | % | | 09/01/36 | | $ 1,423,003 |
| |
Beverages �� 0.3% | | |
| Anheuser-Busch Cos., Inc. |
| 1,500,000 | | 5.600 | | | 03/01/17 | | 1,514,456 |
| |
Computers – 0.2% | | |
| Intuit, Inc. |
| 1,000,000 | | 5.400 | | | 03/15/12 | | 997,808 |
| |
Consumer Non-Durables – 0.2% | | |
| Clorox Co. |
| 965,000 | | 4.200 | | | 01/15/10 | | 944,099 |
| |
Electric – 1.6% | | |
| Columbus Southern Power Co. |
| 2,870,000 | | 5.850 | | | 10/01/35 | | 2,817,588 |
| Duke Energy Corp. |
| 1,525,000 | | 5.300 | | | 10/01/15 | | 1,523,899 |
| Exelon Generation Co. LLC |
| 1,470,000 | | 5.350 | | | 01/15/14 | | 1,440,744 |
| PSE&G Power LLC |
| 1,485,000 | | 5.000 | | | 04/01/14 | | 1,431,969 |
| San Diego Gas & Electric Co. |
| 1,585,000 | | 5.300 | | | 11/15/15 | | 1,584,965 |
| | | | | | | |
| | | | | | | 8,799,165 |
| |
Financial – 9.3% | | |
| American General Finance Corp. |
| 2,870,000 | | 3.875 | | | 10/01/09 | | 2,788,010 |
| Bank One Corp.(b) |
| 1,000,000 | | 9.875 | | | 03/01/19 | | 1,227,267 |
| | |
| 20 | | The accompanying notes are an integral part of these financial statements. |
COMMERCE BOND FUND
| | | | | | | |
Principal
Amount | | Interest
Rate | | | Maturity
Date | | Value |
| Corporate Obligations – (continued) |
Financial – (continued) | | |
| Bear Stearns Companies, Inc. |
| $3,000,000 | | 4.500 | % | | 10/28/10 | | $ 2,941,263 |
| Equitable Life Assurance Society of the United States(a) |
| 5,900,000 | | 7.700 | | | 12/01/15 | | 6,764,757 |
| General Electric Capital Corp. MTN Series A |
| 4,325,000 | | 5.875 | | | 02/15/12 | | 4,461,380 |
| 3,000,000 | | 6.000 | | | 06/15/12 | | 3,116,271 |
| John Deere Capital Corp. |
| 3,000,000 | | 3.625 | | | 05/25/07 | | 2,996,655 |
| Merrill Lynch & Co., Inc. |
| 1,780,000 | | 5.770 | | | 07/25/11 | | 1,823,916 |
| Merrill Lynch & Co., Inc. MTN |
| 3,065,000 | | 4.831 | | | 10/27/08 | | 3,048,357 |
| Metropolitan Life Insurance Co.(a) |
| 6,000,000 | | 7.700 | | | 11/01/15 | | 6,851,232 |
| Morgan Stanley |
| 900,000 | | 6.750 | | | 04/15/11 | | 951,539 |
| 1,720,000 | | 4.750 | | | 04/01/14 | | 1,646,922 |
| National Rural Utilities Cooperative Finance Corp. |
| 1,550,000 | | 5.450 | | | 04/10/17 | | 1,553,474 |
| Reed Elsevier Capital, Inc. |
| 1,800,000 | | 6.750 | | | 08/01/11 | | 1,893,982 |
| SLM Corp. |
| 4,886,000 | | 4.500 | | | 07/26/10 | | 4,660,189 |
| Wells Fargo & Co. |
| 3,480,000 | | 3.125 | | | 04/01/09 | | 3,360,646 |
| | | | | | | |
| | | | | | | 50,085,860 |
| |
Hotels Restaurant & Leisure – 0.2% | | |
| McDonald’s Corp. |
| 1,225,000 | | 5.300 | | | 03/15/17 | | 1,211,034 |
| |
Industrial – 1.5% | | |
| Receipts on Corporate Securities Trust CHR-1998-1 |
| 5,061,501 | | 6.500 | | | 08/01/18 | | 5,058,327 |
| Receipts on Corporate Securities Trust NSC-1998-1 |
| 2,905,683 | | 6.375 | | | 05/15/17 | | 2,967,429 |
| | | | | | | |
| | | | | | | 8,025,756 |
| |
Multimedia – 0.6% | | |
| AOL Time Warner |
| 3,170,000 | | 6.750 | | | 04/15/11 | | 3,336,840 |
| |
Oil & Gas – 1.3% | | |
| Apache Finance Property Ltd. |
| 4,500,000 | | 7.000 | | | 03/15/09 | | 4,644,986 |
| Tosco Corp. |
| 2,095,000 | | 8.125 | | | 02/15/30 | | 2,671,588 |
| | | | | | | |
| | | | | | | 7,316,574 |
| |
| | | | | | | |
Principal
Amount | | Interest
Rate | | | Maturity
Date | | Value |
| Corporate Obligations – (continued) |
Real Estate – 1.2% | | |
| Archstone-Smith Trust |
| $2,550,000 | | 5.750 | % | | 03/15/16 | | $ 2,591,126 |
| ProLogis |
| 2,030,000 | | 5.250 | | | 11/15/10 | | 2,040,991 |
| Simon Property Group LP |
| 2,000,000 | | 5.375 | | | 06/01/11 | | 2,013,550 |
| | | | | | | |
| | | | | | | 6,645,667 |
| |
Sovereign Agency – 0.3% | | |
| Resolution Funding Corp. |
| 1,500,000 | | 8.125 | | | 10/15/19 | | 1,917,972 |
| |
Utilities – 1.1% | | |
| GTE Corp. |
| 5,310,000 | | 6.840 | | | 04/15/18 | | 5,761,780 |
| |
Yankee – 3.0% | | |
| BHP Billiton Finance USA Ltd. |
| 2,044,000 | | 4.800 | | | 04/15/13 | | 1,996,477 |
| 750,000 | | 6.750 | | | 11/01/13 | | 808,671 |
| 955,000 | | 5.250 | | | 12/15/15 | | 949,706 |
| Canadian National Railway Co. |
| 890,000 | | 6.200 | | | 06/01/36 | | 920,041 |
| Deutsche Telekom International Finance BV |
| 1,335,000 | | 8.000 | | | 06/15/10 | | 1,444,589 |
| France Telecom SA |
| 1,286,000 | | 7.750 | | | 03/01/11 | | 1,400,872 |
| Swiss Bank Corp. |
| 7,335,000 | | 7.375 | | | 06/15/17 | | 8,466,094 |
| | | | | | | |
| | | | | | | 15,986,450 |
| |
| TOTAL CORPORATE OBLIGATIONS | | |
(Cost $111,603,486) | | | | | $113,966,464 |
| |
|
| Foreign Debt Obligation – 1.0% |
Sovereign – 1.0% | | |
| Egypt Agency for International Development |
| $5,700,000 | | 4.450 | % | | 09/15/15 | | $ 5,513,952 |
(Cost $5,435,050) | | | | | |
| |
|
| Mortgage-Backed Pass-Through Obligations – 13.7% |
| FHLMC |
| $ 140,811 | | 6.000 | % | | 12/01/13 | | $ 143,092 |
| 212,566 | | 8.500 | | | 02/01/19 | | 224,872 |
| 2,778,450 | | 4.500 | | | 12/01/19 | | 2,695,533 |
| 253,707 | | 8.500 | | | 03/01/21 | | 270,167 |
| 1,339,001 | | 7.000 | | | 05/01/26 | | 1,394,907 |
| 134,178 | | 7.000 | | | 10/01/30 | | 139,855 |
| 178,068 | | 7.500 | | | 12/01/30 | | 186,539 |
| 330,626 | | 7.500 | | | 01/01/31 | | 346,354 |
| 715,711 | | 7.000 | | | 08/01/31 | | 744,735 |
| 6,545,840 | | 5.000 | | | 05/01/33 | | 6,342,720 |
| 5,293,881 | | 5.500 | | | 06/01/33 | | 5,248,855 |
| 2,436,890 | | 2.719 | (b) | | 05/01/34 | | 2,446,916 |
| 4,889,194 | | 5.285 | (b) | | 01/01/36 | | 4,858,278 |
| |
| | |
| The accompanying notes are an integral part of these financial statements. | | 21 |
COMMERCE BOND FUND
Schedule of Investments (continued)
April 30, 2007 (Unaudited)
| | | | | | | |
Principal
Amount | | Interest
Rate | | | Maturity
Date | | Value |
| Mortgage-Backed Pass-Through Obligations – (continued) |
| FNMA |
| $ 252,490 | | 5.500 | % | | 01/01/09 | | $ 251,676 |
| 218,156 | | 7.000 | | | 07/01/09 | | 221,297 |
| 66,611 | | 6.500 | | | 02/01/12 | | 68,548 |
| 199,798 | | 6.000 | | | 12/01/13 | | 200,830 |
| 108,525 | | 6.500 | | | 07/01/14 | | 111,879 |
| 205,647 | | 9.000 | | | 11/01/21 | | 219,280 |
| 85,079 | | 6.500 | | | 08/01/24 | | 87,405 |
| 46,519 | | 6.500 | | | 09/01/24 | | 47,791 |
| 74,965 | | 6.500 | | | 09/01/24 | | 77,015 |
| 127,519 | | 9.000 | | | 02/01/25 | | 137,685 |
| 42,158 | | 6.500 | | | 03/01/26 | | 43,377 |
| 92,210 | | 8.000 | | | 07/01/28 | | 97,633 |
| 288,043 | | 6.500 | | | 10/01/28 | | 297,372 |
| 195,213 | | 7.205 | (b) | | 12/01/28 | | 198,505 |
| 61,494 | | 6.500 | | | 01/01/29 | | 63,486 |
| 167,358 | | 6.000 | | | 07/01/29 | | 169,924 |
| 222,179 | | 7.500 | | | 09/01/29 | | 232,960 |
| 227,144 | | 7.000 | | | 03/01/31 | | 237,644 |
| 71,723 | | 7.500 | | | 03/01/31 | | 75,089 |
| 381,374 | | 7.000 | | | 11/01/31 | | 398,744 |
| 1,037,593 | | 7.000 | | | 01/01/32 | | 1,084,851 |
| 2,396,689 | | 6.000 | | | 12/01/32 | | 2,428,797 |
| 4,426,771 | | 5.000 | | | 02/01/33 | | 4,287,462 |
| 3,881,201 | | 5.500 | | | 03/01/33 | | 3,848,340 |
| 4,294,969 | | 5.500 | | | 03/01/33 | | 4,258,604 |
| 2,920,842 | | 5.000 | | | 07/01/33 | | 2,828,924 |
| 10,261,318 | | 4.500 | | | 08/01/33 | | 9,667,256 |
| 3,325,952 | | 5.000 | | | 02/01/34 | | 3,219,396 |
| 1,754,986 | | 5.082 | (b) | | 10/01/34 | | 1,753,598 |
| 3,484,274 | | 5.105 | (b) | | 02/01/35 | | 3,447,504 |
| GNMA |
| 328,989 | | 8.000 | | | 02/15/22 | | 349,471 |
| 164,246 | | 7.500 | | | 08/20/25 | | 171,557 |
| 681,864 | | 7.500 | | | 07/20/26 | | 712,273 |
| 1,144,911 | | 6.500 | | | 04/15/31 | | 1,182,037 |
| 1,215,860 | | 6.500 | | | 05/15/31 | | 1,255,286 |
| 3,327,488 | | 5.500 | | | 04/15/33 | | 3,314,164 |
| 1,489,179 | | 5.500 | | | 10/15/33 | | 1,483,216 |
| |
| TOTAL MORTGAGE-BACKED PASS-THROUGH OBLIGATIONS |
(Cost $74,145,257) | | | | | $ 73,573,699 |
| |
|
| U.S. Government Agency Obligations – 13.5% |
| FFCB | | | | | | | |
| $11,135,000 | | 4.500 | % | | 05/06/14 | | $ 10,872,893 |
| 2,860,000 | | 5.190 | | | 04/22/21 | | 2,871,486 |
| FHLB | | | | | | | |
| 7,000,000 | | 5.585 | | | 02/03/09 | | 7,086,485 |
| 2,270,000 | | 5.575 | | | 02/17/09 | | 2,295,780 |
| 2,915,000 | | 5.375 | | | 08/15/24 | | 2,965,797 |
| 3,025,000 | | 7.125 | | | 02/15/30 | | 3,782,756 |
| | | | | | | |
Principal
Amount | | Interest
Rate | | | Maturity
Date | | Value |
| U.S. Government Agency Obligations – (continued) |
| FHLMC | | | | | | | |
| $10,000,000 | | 4.125 | % | | 07/12/10 | | $ 9,803,860 |
| 7,380,000 | | 4.875 | | | 08/16/10 | | 7,398,790 |
| 11,000,000 | | 5.500 | (a) | | 07/15/11 | | 11,237,974 |
| FNMA | | | | | | | |
| 3,500,000 | | 4.250 | | | 08/15/10 | | 3,443,083 |
| 4,000,000 | | 4.600 | | | 06/05/18 | | 3,853,624 |
| 1,300,000 | | 5.080 | | | 06/24/18 | | 1,258,842 |
| 1,635,000 | | 7.125 | | | 01/15/30 | | 2,039,442 |
| Tennessee Valley Authority |
| 1,981,000 | | 6.750 | | | 11/01/25 | | 2,337,750 |
| 1,000,000 | | 7.125 | | | 05/01/30 | | 1,251,159 |
| |
| TOTAL U.S. GOVERNMENT AGENCY OBLIGATIONS |
(Cost $71,751,340) | | | | | $ 72,499,721 |
| |
|
| U.S. Treasury Obligations – 7.0% | | |
| United States Treasury Bonds | | |
| $ 400,000 | | 8.000 | % | | 11/15/21 | | $ 530,594 |
| 3,750,000 | | 5.500 | | | 08/15/28 | | 4,050,877 |
| 7,765,000 | | 6.250 | | | 05/15/30 | | 9,240,350 |
| United States Treasury Notes |
| 10,000,000 | | 4.875 | | | 04/30/11 | | 10,130,860 |
| 4,500,000 | | 4.250 | | | 11/15/14 | | 4,404,375 |
| 9,965,000 | | 4.000 | | | 02/15/15 | | 9,578,856 |
| |
| TOTAL U.S. TREASURY OBLIGATIONS |
(Cost $37,309,371) | | | | | $ 37,935,912 |
| |
|
| Repurchase Agreement(d) – 2.8% |
| State Street Bank & Trust Co. |
| $15,145,000 | | 4.690 | % | | 05/01/07 | | $ 15,145,000 |
Maturity Value: $15,146,973 |
(Cost $15,145,000) | | | | | |
| |
| TOTAL INVESTMENTS – 99.4% | | |
(Cost $534,855,190) | | $536,501,096 |
| Other assets in excess of liabilities – 0.6% | | 3,013,047 |
| |
| Net Assets – 100.0% | | $539,514,143 |
| |
| | |
| The percentage shown for each investment category reflects the value of investments in that category as a percentage of net assets. |
| (a) | | Securities are exempt from registration under rule 144A of the Securities Act of 1933. Under procedures approved by the Board of Trustees, such securities have been determined to be liquid by the Investment Adviser and may be resold, normally to qualified institutional buyers in transactions exempt from registration. Total market value of Rule 144A securities amounted to $34,624,568, which represents approximately 6.4% of net assets as of April 30, 2007. |
| (b) | | Variable rate security. Coupon rate disclosed is that which is in effect at April 30, 2007. |
| (c) | | Securities with “Put” features with resetting interest rates. Maturity dates disclosed are the next interest reset dates. |
| | |
| 22 | | The accompanying notes are an integral part of these financial statements. |
COMMERCE BOND FUND
| | |
| (d) | | Repurchase agreement was entered into on April 30, 2007. This agreement was fully collateralized by $15,735,000 U.S. Treasury Note, 4.250% due 08/15/15 with a market value of $15,448,828. |
| | |
| |
| Investment Abbreviations: |
| AMBAC | | —Insuredby American Municipal Bond Assurance Corp. |
| CMBS | | —CommercialMortgage Backed Securities |
| CMO | | —CollateralizedMortgage Obligations |
| FFCB | | —FederalFarm Credit Bank |
| FHLB | | —FederalHome Loan Bank |
| FHLMC | | —FederalHome Loan Mortgage Corp. |
| FNIC | | —FinancialNetwork Investment Corporation |
| FNMA | | —FederalNational Mortgage Association |
| FSA | | —Insuredby Financial Security Assurance Co. |
| GNMA | | —GovernmentNational Mortgage Association |
| GO | | —GeneralObligation |
| MBIA | | —Insuredby Municipal Bond Investors Assurance |
| MTN | | —Medium-TermNote |
| PAC | | —PlannedAmortization Class |
| RB | | —RevenueBond |
| REMIC | | —RealEstate Mortgage Investment Conduit |
| TAC | | —TargetedAmortization Class |
| XLCA | | —Insuredby XL Capital Assurance, Inc. |
| |
PORTFOLIO COMPOSITION
| | | | | | |
| Sector Allocation | | AS OF
04/30/07 | | | AS OF
10/31/06 | |
| | |
Corporate Obligations | | 21.1 | % | | 21.8 | % |
Collateralized Mortgage Obligations | | 17.1 | | | 15.7 | |
Mortgage-Backed Pass-Through Obligations | | 13.7 | | | 14.3 | |
U.S. Government Agency Obligations | | 13.5 | | | 13.8 | |
Asset-Backed Securities | | 11.4 | | | 13.5 | |
Municipal | | 7.1 | | | 6.7 | |
U.S. Treasury Obligations | | 7.0 | | | 7.3 | |
Commercial Mortgages | | 3.8 | | | 4.0 | |
Repurchase Agreement | | 2.8 | | | 1.4 | |
Collateralized Mortgage-Backed Securities | | 0.9 | | | 0.0 | |
Foreign Debt Obligations | | 1.0 | | | 1.0 | |
| | |
The percentage shown for each investment category reflects the value of investments in that category as a percentage of net assets.
The Fund is actively managed and, as such, its composition may differ over time.
| | |
| The accompanying notes are an integral part of these financial statements. | | 23 |
COMMERCE SHORT-TERM GOVERNMENT FUND
Short-Term Government Fund
Performance Review(1) (Unaudited)
For the six months ended April 30, 2007, the Institutional Shares of the Fund had a total return of 2.29%, based on Net Asset Value (NAV). This compares to the Citigroup 1-5 Yr. Treasury/Government Sponsored Index(2) six-month return of 2.40%. Past performance is no guarantee of future results.
Schedule of Investments
April 30, 2007 (Unaudited)
| | | | | | | |
Principal
Amount | | Interest
Rate | | | Maturity
Date | | Value |
| CMBS – 1.8% |
| Small Business Administration Series 2006-P10B, Class 1 |
| $1,993,233 | | 5.681 | % | | 08/10/16 | | $ 2,018,233 |
(Cost $2,007,500) | | | | | |
| |
|
| CMO – 27.5% |
| American Home Mortgage Investment Trust Series 2004-3, Class 6A4 |
| $1,337,000 | | 5.010 | % | | 10/25/34 | | $ 1,321,406 |
| Citigroup Mortgage Loan Trust, Inc. Series 2004-HYB3, Class 1A(a) |
| 987,017 | | 3.895 | | | 09/25/34 | | 1,001,393 |
| Countrywide Alternative Loan Trust Series 2005-5R, Class A2 |
| 1,073,001 | | 4.750 | | | 12/25/18 | | 1,060,423 |
| Countrywide Home Loans, Inc. Series 2003-HYB3, Class 7A1(a) |
| 1,329,901 | | 3.789 | | | 11/19/33 | | 1,289,383 |
| FHLMC PAC Series 023, Class PK |
| 767,864 | | 6.000 | | | 11/25/23 | | 779,441 |
| FHLMC PAC Series 159, Class H |
| 55,233 | | 4.500 | | | 09/15/21 | | 54,545 |
| FHLMC PAC Series 1614, Class MB |
| 335,984 | | 6.500 | | | 12/15/09 | | 338,492 |
| FHLMC PAC Series 1650, Class K |
| 880,000 | | 6.500 | | | 01/15/24 | | 912,498 |
| FHLMC PAC Series 2103, Class TE |
| 956,787 | | 6.000 | | | 12/15/28 | | 973,495 |
| FHLMC PAC Series 2109, Class PE |
| 670,179 | | 6.000 | | | 12/15/28 | | 683,931 |
| FHLMC PAC Series 2131, Class PE |
| 52,075 | | 6.000 | | | 04/15/26 | | 51,963 |
| FHLMC PAC Series 2389, Class CD |
| 171,265 | | 6.000 | | | 03/15/16 | | 172,197 |
| FHLMC PAC Series 2594, Class OR |
| 441,796 | | 4.250 | | | 06/15/32 | | 430,077 |
| FHLMC PAC Series 2626, Class KA |
| 997,157 | | 3.000 | | | 03/15/30 | | 933,675 |
| |
| | | | | | | |
Principal
Amount | | Interest
Rate | | | Maturity
Date | | Value |
| CMO – (continued) |
| FHLMC REMIC PAC Series 041, Class F |
| $ 164,038 | | 10.000 | % | | 05/15/20 | | $ 163,637 |
| FHLMC REMIC PAC Series 1351, Class TE |
| 713,132 | | 7.000 | | | 08/15/22 | | 711,739 |
| FHLMC REMIC PAC Series 1607, Class G |
| 61,057 | | 6.000 | | | 08/15/13 | | 60,976 |
| FHLMC REMIC PAC Series 1673, Class H |
| 21,677 | | 6.000 | | | 11/15/22 | | 21,682 |
| FHLMC REMIC PAC Series 2022, Class PE |
| 193,257 | | 6.500 | | | 01/15/28 | | 198,086 |
| FHLMC REMIC PAC Series 2161, Class PG |
| 101,840 | | 6.000 | | | 04/15/28 | | 101,832 |
| FHLMC REMIC PAC Series 2345, Class PQ |
| 116,321 | | 6.500 | | | 08/15/16 | | 119,410 |
| FHLMC REMIC PAC Series 2439, Class LG |
| 942,101 | | 6.000 | | | 09/15/30 | | 946,484 |
| FHLMC Series 031, Class EA Principal-Only Stripped Security(b) |
| 472,632 | | 0.000 | | | 04/25/24 | | 453,854 |
| FHLMC Series 2515, Class KA |
| 137,677 | | 5.000 | | | 02/15/16 | | 137,264 |
| FHLMC Series 2584, Class LX |
| 307,529 | | 5.500 | | | 12/15/13 | | 310,492 |
| FHLMC Series 2644, Class BM |
| 1,795,000 | | 4.500 | | | 01/15/26 | | 1,769,084 |
| FHLMC Series 2644, Class ED |
| 1,423,986 | | 4.000 | | | 02/15/18 | | 1,374,540 |
| FHLMC Series 2782, Class MC |
| 673,394 | | 4.500 | | | 01/15/11 | | 670,610 |
| FHLMC Series T-58, Class 1A3 |
| 998,097 | | 4.391 | | | 11/25/38 | | 988,480 |
| FNMA PAC Series 1992-129, Class L |
| 445,929 | | 6.000 | | | 07/25/22 | | 453,724 |
| FNMA PAC Series 2001-76, Class UC |
| 554,496 | | 5.500 | | | 11/25/15 | | 554,024 |
| FNMA PAC Series 2002-56, Class UC |
| 1,200,000 | | 5.500 | | | 09/25/17 | | 1,209,905 |
| |
(1) | | Returns assume fee waivers and expense reductions and are not annualized. Returns do not reflect the deduction of taxes that a shareholder would pay on Fund distributions or the redemption of Fund shares. |
(2) | | The Citigroup 1-5 Year Treasury/Government Sponsored Index, is an unmanaged index comprised of Treasury securities with a minimum principal amount of $1 billion and U.S. Government securities with a minimum principal amount of $100 million. The securities range in maturity from one to five years. The Index figures do not reflect the deduction of any fees, expenses or taxes. |
| | |
| 24 | | The accompanying notes are an integral part of these financial statements. |
COMMERCE SHORT-TERM GOVERNMENT FUND
| | | | | | | |
Principal
Amount | | Interest
Rate | | | Maturity
Date | | Value |
| CMO – (continued) |
| FNMA PAC Series 2003-117, Class KB |
| $ 556,000 | | 6.000 | % | | 12/25/33 | | $ 565,718 |
| FNMA REMIC PAC Series 1991-94, Class E Principal-Only Stripped Security(b) |
| 12,066 | | 0.000 | | | 07/25/21 | | 11,919 |
| FNMA REMIC PAC Series 1993-132, Class A Principal-Only Stripped Security(b) |
| 114,094 | | 0.000 | | | 10/25/22 | | 105,089 |
| FNMA REMIC PAC Series 1998-36, Class J |
| 295,726 | | 6.000 | | | 07/18/28 | | 295,771 |
| FNMA REMIC PAC Series 2001-71, Class MB |
| 690,119 | | 6.000 | | | 12/25/16 | | 702,400 |
| FNMA REMIC PAC Series 2003-14, Class AP |
| 940,452 | | 4.000 | | | 03/25/33 | | 902,006 |
| FNMA REMIC Series 1991-137, Class H |
| 238,058 | | 7.000 | | | 10/25/21 | | 248,180 |
| FNMA REMIC Series 1992, Class 89 Principal-Only Stripped Security(b) |
| 69,106 | | 0.000 | | | 06/25/22 | | 59,599 |
| FNMA REMIC Series 1993-140, Class J |
| 834,628 | | 6.650 | | | 06/25/13 | | 839,866 |
| FNMA REMIC Series 1993-182, Class FA(a) |
| 59,087 | | 4.040 | | | 09/25/23 | | 57,574 |
| FNMA REMIC Series 1993-183, Class K |
| 234,537 | | 6.500 | | | 07/25/23 | | 237,103 |
| FNMA REMIC Series 2002-71, Class PC |
| 28,371 | | 5.500 | | | 12/25/26 | | 28,277 |
| FNMA Series 2003-W6, Class 3A |
| 724,939 | | 6.500 | | | 09/25/42 | | 741,328 |
| GNMA REMIC PAC Series 2001-6, Class PM |
| 102,168 | | 6.500 | | | 06/16/30 | | 102,436 |
| GNMA Series 1998-12, Class EB |
| 341,689 | | 6.500 | | | 05/20/28 | | 342,857 |
| GNMA Series 2001-53, Class F(a) |
| 97,024 | | 5.670 | | | 10/20/31 | | 97,634 |
| Master Adjustable Rate Mortgages Trust Series 2004-13, Class 2A1(a) |
| 1,251,146 | | 3.817 | | | 04/21/34 | | 1,230,209 |
| Master Asset Securitization Trust Series 2003-6, Class 9A1 |
| 824,597 | | 4.250 | | | 07/25/33 | | 797,495 |
| Master Asset Securitization Trust Series 2004-3, Class 5A1 |
| 286,586 | | 6.250 | | | 01/25/32 | | 287,572 |
| Residential Funding Mortgage Securities I, Inc. Series 2003-S8, Class A1 |
| 660,439 | | 5.000 | | | 05/25/18 | | 650,132 |
| Securitized Asset Sales, Inc. Series 1993-7, Class TA6 |
| 88,052 | | 6.250 | | | 12/25/23 | | 87,809 |
| Vendee Mortgage Trust Series 1996-2, Class 1Z |
| 359,702 | | 6.750 | | | 06/15/26 | | 373,062 |
| Washington Mutual MSC Mortgage Pass-Through Series 2002-MS8, Class 4A5 |
| 865,358 | | 5.750 | | | 12/25/32 | | 866,889 |
| |
| | | | | | | |
Principal
Amount | | Interest
Rate | | | Maturity
Date | | Value |
| CMO – (continued) |
| Washington Mutual, Inc. Series 2003-AR4, Class A6(a) |
| $1,404,725 | | 3.423 | % | | 05/25/33 | | $ 1,383,880 |
| Wells Fargo Mortgage Backed Securities Trust Series 2003-6, Class 1A1 |
| 426,052 | | 5.000 | | | 06/25/18 | | 416,999 |
| |
| TOTAL CMO |
(Cost $31,912,867) | | $ 31,680,546 |
| |
|
| Commercial Mortgages – 7.2% |
| FNMA Series 2000-M2, Class C(a) |
| $1,380,514 | | 7.178 | % | | 07/17/22 | | $ 1,404,192 |
| GNMA REMIC Series 2004-51, Class A |
| 222,540 | | 4.145 | | | 02/16/18 | | 218,657 |
| GNMA Series 2002-28, Class A |
| 153,844 | | 4.776 | | | 02/16/18 | | 154,582 |
| GNMA Series 2003-88, Class AC |
| 1,952,007 | | 2.914 | | | 06/16/18 | | 1,896,933 |
| GNMA Series 2004-09, Class A |
| 1,192,670 | | 3.360 | | | 08/16/22 | | 1,155,022 |
| GNMA Series 2004-20, Class C |
| 1,700,000 | | 4.430 | | | 04/16/34 | | 1,656,839 |
| GNMA Series 2004-45, Class A |
| 1,219,612 | | 4.020 | | | 12/16/21 | | 1,194,830 |
| GNMA Series 2004-60, Class C(a) |
| 650,000 | | 5.240 | | | 03/16/28 | | 650,556 |
| |
| TOTAL COMMERCIAL MORTGAGES |
(Cost $8,550,521) | | $ 8,331,611 |
| |
|
| Mortgage-Backed Pass-Through Obligations – 8.3% |
| FHLMC |
| $ 303,244 | | 5.500 | % | �� | 08/01/17 | | $ 304,452 |
| 677,556 | | 6.000 | | | 01/01/19 | | 685,085 |
| 541,036 | | 6.000 | | | 05/01/19 | | 547,048 |
| 182,351 | | 6.000 | | | 10/01/23 | | 184,689 |
| 1,332,062 | | 5.684 | (a) | | 05/01/36 | | 1,343,272 |
| FNMA |
| 1,117 | | 8.000 | | | 12/01/07 | | 1,118 |
| 127,988 | | 7.000 | | | 03/01/09 | | 128,964 |
| 611,022 | | 4.500 | | | 11/01/09 | | 601,735 |
| 9,444 | | 6.500 | | | 02/01/12 | | 9,718 |
| 319,287 | | 6.500 | | | 09/01/13 | | 327,193 |
| 394,460 | | 10.500 | | | 11/01/15 | | 426,826 |
| 343,198 | | 6.000 | | | 07/01/16 | | 349,199 |
| 12,015 | | 6.320 | (a) | | 08/01/23 | | 12,191 |
| 4,980 | | 9.000 | | | 07/01/24 | | 5,368 |
| 23,102 | | 7.205 | (a) | | 12/01/28 | | 23,492 |
| 115,568 | | 7.000 | | | 11/01/31 | | 120,832 |
| 872,288 | | 5.251 | (a) | | 02/01/33 | | 865,293 |
| 844,009 | | 6.000 | | | 07/01/33 | | 855,316 |
| 1,183,422 | | 4.010 | (a) | | 02/01/34 | | 1,167,238 |
| 818,339 | | 5.082 | (a) | | 10/01/34 | | 817,691 |
| |
| | |
| The accompanying notes are an integral part of these financial statements. | | 25 |
COMMERCE SHORT-TERM GOVERNMENT FUND
Schedule of Investments (continued)
April 30, 2007 (Unaudited)
| | | | | | | |
Principal
Amount | | Interest
Rate | | | Maturity
Date | | Value |
| Mortgage-Backed Pass-Through Obligations – (continued) |
| GNMA |
| $ 18,402 | | 8.000 | % | | 07/15/17 | | $ 19,420 |
| 705 | | 6.125 | (a) | | 11/20/24 | | 715 |
| 1,376 | | 6.125 | (a) | | 12/20/24 | | 1,397 |
| 27,772 | | 5.375 | (a) | | 04/20/26 | | 28,083 |
| 21,937 | | 5.750 | (a) | | 08/20/26 | | 22,168 |
| 32,700 | | 5.375 | (a) | | 01/20/28 | | 33,110 |
| 744,589 | | 5.500 | | | 10/15/33 | | 741,608 |
| |
| TOTAL MORTGAGE-BACKED PASS-THROUGH OBLIGATIONS |
(Cost $9,807,581) | | $ 9,623,221 |
| |
|
| U.S. Government Agency Obligations – 39.5% |
| FFCB |
| $2,000,000 | | 3.000 | % | | 04/15/08 | | $ 1,961,120 |
| 3,000,000 | | 5.200 | | | 05/02/08 | | 3,003,246 |
| 237,000 | | 6.890 | | | 09/13/10 | | 252,628 |
| 250,000 | | 7.000 | | | 09/01/15 | | 284,807 |
| 500,000 | | 6.125 | | | 12/29/15 | | 540,938 |
| FHLB |
| 525,000 | | 3.500 | | | 09/12/07 | | 521,841 |
| 125,000 | | 5.875 | | | 11/15/07 | | 125,388 |
| 115,000 | | 6.020 | | | 01/09/08 | | 115,615 |
| 50,000 | | 5.970 | | | 03/25/08 | | 50,372 |
| 1,000,000 | | 6.000 | | | 06/11/08 | | 1,010,296 |
| 3,400,000 | | 2.625 | | | 07/15/08 | | 3,307,472 |
| 2,000,000 | | 3.875 | | | 08/22/08 | | 1,972,268 |
| 250,000 | | 5.365 | | | 12/11/08 | | 251,877 |
| 3,000,000 | | 5.585 | | | 02/03/09 | | 3,037,065 |
| 125,000 | | 5.900 | | | 03/26/09 | | 127,317 |
| 35,000 | | 5.985 | | | 04/09/09 | | 35,720 |
| 3,500,000 | | 5.250 | | | 06/19/09 | | 3,528,420 |
| 1,250,000 | | 4.750 | | | 12/09/11 | | 1,246,223 |
| FHLMC |
| 4,000,000 | | 3.625 | | | 02/15/08 | | 3,951,896 |
| 1,000,000 | | 4.625 | | | 08/15/08 | | 995,287 |
| 4,600,000 | | 3.625 | | | 09/15/08 | | 4,518,345 |
| 3,000,000 | | 5.500 | (c) | | 07/15/11 | | 3,064,902 |
| FNMA |
| 5,500,000 | | 7.250 | | | 01/15/10 | | 5,836,715 |
| 2,500,000 | | 6.000 | | | 05/15/11 | | 2,606,070 |
| 3,000,000 | | 6.125 | | | 03/15/12 | | 3,165,507 |
| |
| TOTAL U.S. GOVERNMENT AGENCY OBLIGATIONS |
(Cost $46,054,116) | | $ 45,511,335 |
| |
|
| U.S. Treasury Obligations – 13.3% |
| United States Treasury Notes |
| $3,000,000 | | 4.875 | % | | 08/31/08 | | $ 3,001,641 |
| 5,000,000 | | 4.000 | | | 06/15/09 | | 4,942,970 |
| 2,400,000 | | 4.125 | | | 08/15/10 | | 2,372,813 |
| 3,000,000 | | 4.500 | | | 11/15/10 | | 3,000,819 |
| 2,000,000 | | 5.125 | | | 06/30/11 | | 2,046,172 |
| |
| TOTAL U.S. TREASURY OBLIGATIONS |
(Cost $15,324,648) | | $ 15,364,415 |
| |
| | | | | | | |
Principal
Amount | | Interest
Rate | | | Maturity
Date | | Value |
| Repurchase Agreement(d) – 2.0% |
| State Street Bank & Trust Co. |
| $2,262,000 | | 4.690 | % | | 05/01/07 | | $ 2,262,000 |
Maturity Value: $2,262,295 |
(Cost $2,262,000) |
| |
| TOTAL INVESTMENTS – 99.6% |
(Cost $115,919,233) | | $114,791,361 |
| Other assets in excess of liabilities – 0.4% | | 454,326 |
| |
| Net Assets – 100.0% | | $115,245,687 |
| |
| | |
| The percentage shown for each investment category reflects the value of investments in that category as a percentage of net assets. |
| (a) | | Variable rate security. The interest rate shown reflects the rate as of April 30, 2007. |
| (b) | | Security issued with a zero coupon. Income is recognized through the accretion of discount. |
| (c) | | Securities are exempt from registration under rule 144A of the Securities Act of 1933. Under procedures approved by the Board of Trustees, such securities have been determined to be liquid by the Investment Adviser and may be resold, normally to qualified institutional buyers in transactions exempt from registration. Total market value of Rule 144A securities amounted to $3,064,902, which represents approximately 2.7% of net assets as of April 30, 2007. |
| (d) | | Repurchase agreement was entered into on April 30, 2007. This agreement was fully collateralized by $1,750,000 U.S. Treasury Bond, 8.130%, due 08/15/19 with a market value of $2,307,795. |
| | |
| Investment Abbreviations: |
| CMBS | | —CommercialMortgage Backed Securities |
| CMO | | —CollateralizedMortgage Obligations |
| FFCB | | —FederalFarm Credit Bank |
| FHLB | | —FederalHome Loan Bank |
| FHLMC | | —FederalHome Loan Mortgage Corp. |
| FNMA | | —FederalNational Mortgage Association |
| GNMA | | —GovernmentNational Mortgage Association |
| MSC | | —MortgageSecurities Corp. |
| PAC | | —PlannedAmortization Class |
| REMIC | | —RealEstate Mortgage Investment Conduit |
PORTFOLIO COMPOSITION
| | | | | | |
| Sector Allocation | | AS OF
04/30/07 | | | AS OF
10/31/06 | |
| | |
U.S. Government Agency Obligations | | 39.5 | % | | 33.7 | % |
Collateralized Mortgage Obligations | | 27.5 | | | 28.5 | |
U.S. Treasury Obligations | | 13.3 | | | 13.0 | |
Mortgage-Backed Pass-Through Obligations | | 8.3 | | | 8.3 | |
Commercial Mortgages | | 7.2 | | | 8.4 | |
Collateralized Mortgage-Backed Securities | | 1.8 | | | 0.0 | |
Repurchase Agreement | | 2.0 | | | 8.0 | |
| | |
The percentage shown for each investment category reflects the value of investments in that category as a percentage of net assets.
The Fund is actively managed and, as such, its composition may differ over time.
| | |
| 26 | | The accompanying notes are an integral part of these financial statements. |
COMMERCE NATIONAL TAX-FREE INTERMEDIATE BOND FUND
National Tax-Free Intermediate Bond Fund
Performance Review(1) (Unaudited)
For the six months ended April 30, 2007, the Institutional Shares of the Fund had a total return of 1.24%, based on Net Asset Value (NAV). This compares to the Lehman 3-15 Year Blend Index(2) six-month return of 1.43%. Past performance is no guarantee of future results.
Schedule of Investments
April 30, 2007 (Unaudited)
| | | | | | | |
Principal Amount | | Interest
Rate | | | Maturity
Date | | Value |
| Municipal Bond Obligations – 99.2% |
Alabama – 2.5% | | | | | |
| Alabama Drinking Water Finance Authority Revenue Bonds (Revolving Funding Program) Series A (AMBAC) (AAA/Aaa) |
| $ 760,000 | | 4.700 | % | | 08/15/11 | | $ 769,819 |
| Birmingham AL GO Bonds (Refunding Warrants) Series B (FSA) (AAA/Aaa) |
| 650,000 | | 5.500 | | | 07/01/12 | | 704,476 |
| Birmingham AL Special Care Facilities Financing Authority Revenue Bonds (Childrens Hospital) Series B (AMBAC) (AAA/Aaa) |
| 1,005,000 | | 5.000 | | | 06/01/16 | | 1,069,431 |
| Madison AL GO Bonds (Refunding Warrants) (FSA) (AAA/Aaa) |
| 1,160,000 | | 5.000 | | | 04/01/19 | | 1,257,069 |
| | | | | | | |
| | | | | | | 3,800,795 |
| |
Alaska(a) – 0.4% | | | | | |
| North Slope Boro AK GO Bonds (Capital Appreciation) Series B (MBIA) (AAA/Aaa) |
| 540,000 | | 0.000 | | | 06/30/07 | | 536,722 |
| |
Arizona – 2.1% | | | | | |
| Glendale AZ Industrial Development Authority Revenue Bonds (Refunding Midwestern University) (A-/NR) |
| 1,000,000 | | 5.250 | | | 05/15/19 | | 1,092,440 |
| Maricopa County AZ School District No. 3 Tempe Elementary GO Bonds (School Improvement Project 2005) Series B (FSA) (NR/Aaa) |
| 1,000,000 | | 4.500 | | | 07/01/21 | | 1,017,920 |
| Maricopa County AZ School District No. 6 Washington Elementary GO Bonds (School Improvement Project 2001) Series B (FSA) (AAA/Aaa) |
| 400,000 | | 5.000 | | | 07/01/17 | | 438,712 |
| Pinal County AZ Unified School District No. 43 Apache Junction GO Bonds (Refunding) (FGIC) (AAA/Aaa) |
| 500,000 | | 5.750 | | | 07/01/15 | | 568,590 |
| | | | | | | |
| | | | | | | 3,117,662 |
| |
| | | | | | | |
Principal Amount | | Interest
Rate | | | Maturity
Date | | Value |
| Municipal Bond Obligations – (continued) |
Arkansas – 1.0% | | | | | |
| Arkansas State Development Finance Authority State Park Facilities Revenue Bonds (Mt. Magazine Project) (FSA) (AAA/Aaa) |
| $1,000,000 | | 5.000 | % | | 01/01/17 | | $ 1,069,980 |
| Arkansas State GO Bonds Capital Appreciation College Savings Series C (AA/Aa2)(a) |
| 540,000 | | 0.000 | | | 06/01/12 | | 441,628 |
| | | | | | | |
| | | | | | | 1,511,608 |
| |
California – 1.5% | | | | | |
| Orinda CA Certificates of Participation (City Offices) (AMBAC) (AAA/NR) |
| 100,000 | | 4.500 | | | 07/01/35 | | 99,995 |
| West Contra Costa CA Unified School District GO Bonds (Refunding) Series A (MBIA) (AAA/Aaa) |
| 1,810,000 | | 5.700 | | | 02/01/22 | | 2,150,117 |
| | | | | | | |
| | | | | | | 2,250,112 |
| |
Colorado – 2.1% | | | | | |
| Colorado Educational & Cultural Facilities Authority Revenue Bonds (Charter School-Littleton Academy) (ETM) (NR/NR) |
| 425,000 | | 5.375 | | | 01/15/12 | | 438,791 |
| Colorado Educational & Cultural Facilities Authority Revenue Bonds (Charter School-University Laboratory School Project) (ETM) (NR/Baa2) |
| 645,000 | | 5.250 | | | 06/01/11 | | 659,300 |
| Colorado Educational & Cultural Facilities Authority Revenue Bonds (Nashville Public Radio) (ETM) (BBB+/NR) |
| 365,000 | | 5.500 | | | 04/01/09 | | 376,797 |
| 390,000 | | 5.500 | | | 04/01/10 | | 408,751 |
| Colorado State Department of Corrections Certificates of Participation (AMBAC) (AAA/Aaa)(a) |
| 100,000 | | 0.000 | | | 03/01/10 | | 89,554 |
Douglas County School District No. 1 (Douglas & Elbert Counties) GO Bonds (Capital Appreciation) Series B
(NR/Aa2)(a) |
| 550,000 | | 0.000 | | | 12/15/13 | | 422,933 |
| |
(1) | | Returns assume fee waivers and expense reductions and are not annualized. Returns do not reflect the deduction of taxes that a shareholder would pay on Fund distributions or the redemption of Fund shares. |
(2) | | The Lehman 3-15 Year Blend Index is an unmanaged index composed of investment grade municipal securities ranging from 2 to 17 years in maturity. The Index figures do not reflect the deduction of any fees, expenses or taxes. |
| | |
| The accompanying notes are an integral part of these financial statements. | | 27 |
COMMERCE NATIONAL TAX-FREE INTERMEDIATE BOND FUND
Schedule of Investments (continued)
April 30, 2007 (Unaudited)
| | | | | | | |
Principal Amount | | Interest
Rate | | | Maturity
Date | | Value |
| Municipal Bond Obligations – (continued) |
Colorado – (continued) | | | | | |
| El Paso County School District No. 11 GO Bonds (Capital Appreciation) (MBIA) (AAA/Aaa)(a) |
| $1,000,000 | | 0.000 | % | | 12/01/12 | | $ 803,550 |
| | | | | | | |
| | | | | | | 3,199,676 |
| |
District Of Columbia – 1.3% | | |
| District of Columbia GO Bonds (Multimodal) Series A (FSA) (AAA/Aaa)(b) |
| 200,000 | | 3.960 | | | 06/01/15 | | 200,000 |
| District of Columbia Revenue Bonds (World Wildlife Fund) Series A (AMBAC) (AAA/Aaa) |
| 555,000 | | 5.750 | | | 07/01/11 | | 593,045 |
| District of Columbia Water & Sewer Authority Public Utility Revenue Bonds (FSA) (AAA/Aaa) |
| 500,000 | | 5.500 | | | 10/01/17 | | 564,700 |
| Metropolitan Washington DC Airports Authority Revenue Bonds (Refunding) Series B (AMT) (MBIA) (AAA/Aaa) |
| 500,000 | | 5.250 | | | 10/01/09 | | 514,665 |
| | | | | | | |
| | | | | | | 1,872,410 |
| |
Florida – 1.0% | | | | | |
| Florida State Community Services Corp. Walton County Water & Sewer Revenue Bonds (Refunding) (AMBAC) (NR/Aaa) |
| 1,330,000 | | 5.500 | | | 03/01/14 | | 1,444,180 |
| |
Illinois – 7.8% | | | | | |
| Chicago IL Board of Education Certificates of Participation (Lease) Series A (MBIA) (AAA/Aaa) |
| 500,000 | | 6.250 | | | 01/01/10 | | 532,000 |
| Chicago IL GO Bonds Series A (FGIC) (AAA/Aaa)(c) |
| 2,000,000 | | 6.000 | | | 07/01/10 | | 2,154,980 |
| 1,000,000 | | 6.125 | | | 07/01/10 | | 1,081,190 |
| Chicago IL Wastewater Transmission Revenue Bonds (Second Lien) Series A (MBIA) (AAA/Aaa)(b) |
| 100,000 | | 3.960 | | | 01/01/39 | | 100,000 |
| Cook County IL School District No. 039 Wilmette GO Bonds (Refunding) (NR/Aa1) |
| 1,025,000 | | 5.750 | | | 12/01/13 | | 1,110,915 |
| Elgin IL GO Bonds (Refunding) Series B (NR/Aa2) |
| 25,000 | | 4.800 | | | 01/01/10 | | 25,165 |
| Illinois Educational Facilities Authority Student Housing Revenue Bonds (Educational Advancement Fund University Center Project) (ETM) (NR/Aaa) |
| 670,000 | | 5.500 | | | 05/01/12 | | 723,587 |
| Illinois Finance Authority Revenue Bonds (Refunding Shedd Aquarium Society) (AMBAC) (AAA/Aaa) |
| 1,750,000 | | 5.000 | | | 07/01/20 | | 1,868,230 |
| 1,685,000 | | 5.000 | | | 07/01/21 | | 1,795,216 |
| Illinois Housing Development Authority Revenue Bonds (Refunding Homeowner Mortgage) Series A-1 (AA/Aa2) |
| 1,000,000 | | 4.150 | | | 02/01/16 | | 1,010,930 |
| 500,000 | | 4.250 | | | 08/01/17 | | 505,440 |
| Illinois Housing Development Authority Revenue Bonds (Refunding Single Family Housing) Series C-1 (AA/Aa2) |
| 255,000 | | 3.700 | | | 02/01/13 | | 254,204 |
| |
| | | | | | | |
Principal Amount | | Interest
Rate | | | Maturity
Date | | Value |
| Municipal Bond Obligations – (continued) |
Illinois – (continued) | | |
| Will County IL Community Unit School District No. 365 Valley View GO Bonds (Capital Appreciation) Series B (FSA) (AAA/Aaa)(a) |
| $ 635,000 | | 0.000 | % | | 11/01/13 | | $ 491,300 |
| | | | | | | |
| | | | | | | 11,653,157 |
| |
Indiana – 8.1% | | |
| Allen County IN War Memorial Revenue Bonds (Refunding Coliseum Additions Building Corp.) Series A (NR/Aa3) |
| 600,000 | | 5.000 | | | 05/01/16 | | 648,246 |
| 615,000 | | 5.000 | | | 11/01/16 | | 666,217 |
| Anderson IN School Building Corp. GO Bonds (First Mortgage) (FSA) (AAA/Aaa)(c) |
| 420,000 | | 5.000 | | | 07/15/14 | | 452,836 |
| Elkhart County IN Complex Building Corp. Revenue Bonds (First Mortgage) (AA-/NR) |
| 880,000 | | 4.000 | | | 06/01/12 | | 888,439 |
| Elkhart County IN Hospital Authority Revenue Bonds (NR/A1) |
| 390,000 | | 4.750 | | | 08/15/11 | | 396,045 |
| Evansville Vanderburgh IN Public Leasing Corp. Revenue Bonds (Refunding First Mortgage) (AMBAC) (AAA/NR) |
| 1,740,000 | | 5.250 | | | 07/15/16 | | 1,913,652 |
| Frankfort IN High School Elementary School Building Corp. Revenue Bonds (First Mortgage) (FSA) (AAA/NR) |
| 1,635,000 | | 4.500 | | | 07/15/17 | | 1,697,326 |
| Indiana University Revenue Bonds (Student Residence Systems) Series B (AMBAC) (AAA/Aaa) |
| 500,000 | | 5.250 | | | 11/01/18 | | 544,855 |
| Indianapolis Local Public Improvement Revenue Bonds (Refunding) Series B (AA/Aa2) |
| 1,300,000 | | 6.000 | | | 01/10/20 | | 1,499,667 |
| Monroe-Gregg Industrial Grade School Building Corp. Revenue Bonds (First Mortgage) (FSA) (AAA/Aaa) |
| 375,000 | | 4.250 | | | 07/15/17 | | 380,948 |
| South Harrison IN 2000 School Building Corp. Revenue Bonds (Refunding First Mortgage) (FSA) (AAA/Aaa) |
| 2,000,000 | | 4.500 | | | 07/15/20 | | 2,029,340 |
| Wawasee IN Community School Corp. Revenue Bonds (New Elementary & Remodeling Building Corp.) (Refunding First Mortgage) (FSA) (AAA/NR) |
| 1,000,000 | | 5.000 | | | 07/15/18 | | 1,095,050 |
| | | | | | | |
| | | | | | | 12,212,621 |
| |
Iowa – 2.4% | | |
| Iowa Finance Authority Revenue Bonds (Refunding Child Services) (NR/NR) |
| 160,000 | | 5.100 | | | 06/01/17 | | 163,038 |
| 480,000 | | 5.125 | | | 06/01/18 | | 488,098 |
| 405,000 | | 5.125 | | | 06/01/19 | | 409,897 |
| 200,000 | | 5.125 | | | 06/01/20 | | 202,060 |
| Iowa Finance Authority Revenue Bonds (Single Family Mortgage) Series A (GNMA/FNMA) (AAA/Aaa) |
| 255,000 | | 4.300 | | | 07/01/16 | | 258,126 |
| |
| | |
| 28 | | The accompanying notes are an integral part of these financial statements. |
COMMERCE NATIONAL TAX-FREE INTERMEDIATE BOND FUND
| | | | | | | |
Principal Amount | | Interest
Rate | | | Maturity
Date | | Value |
| Municipal Bond Obligations – (continued) |
Iowa – (continued) | | |
| Iowa Student Loan Liquidity Corp. Revenue Bonds Series E (AMT) (NR/Aaa) |
| $2,000,000 | | 5.700 | % | | 06/01/09 | | $ 2,049,820 |
| | | | | | | |
| | | | | | | 3,571,039 |
| |
Kansas – 1.1% | | |
| Junction City KS GO Bonds Series C (NR/NR) |
| 500,000 | | 5.000 | | | 08/01/07 | | 501,495 |
| Kansas Independent College Finance Authority Educational Facilities Revenue Bonds (Benedictine College Project) (NR/NR)(c) |
| 100,000 | | 6.250 | | | 10/01/07 | | 101,037 |
| Kansas State Development Finance Authority Revenue Bonds (Refunding Athletic Facilities University of Kansas) Series K (A/A1) |
| 65,000 | | 5.000 | | | 06/01/18 | | 68,642 |
| Lawrence KS Hospital Revenue Bonds (Refunding Lawrence Memorial Hospital) (NR/A3) |
| 750,000 | | 5.250 | | | 07/01/12 | | 791,857 |
| Neosho County KS Sales Tax Revenue Bonds (MBIA) (ETM) (AAA/Aaa) |
| 150,000 | | 5.500 | | | 08/15/11 | | 157,847 |
| | | | | | | |
| | | | | | | 1,620,878 |
| |
Kentucky – 1.0% | | |
| Butler County KY School District Finance Corp. School Building Revenue Bonds (Refunding) Series B (NR/Aa3) |
| 560,000 | | 3.250 | | | 08/01/13 | | 535,864 |
| Jefferson County KY GO Bonds (Refunding) Series C (AMT) (AA+/Aa2) |
| 465,000 | | 5.375 | | | 05/15/07 | | 465,219 |
| 460,000 | | 5.450 | | | 05/15/08 | | 467,705 |
| | | | | | | |
| | | | | | | 1,468,788 |
| |
Louisiana – 2.8% | | |
| Louisiana Local Government Environmental Facilities Community Development Authority Revenue Bonds (Capital Projects & Equipment Acquisition) (AMBAC) (AAA/Aaa) |
| 2,755,000 | | 5.250 | | | 12/01/18 | | 3,015,347 |
| Tangipahoa Parish LA Hospital Service District No. 1 Revenue Bonds (Refunding North Oaks Medical Center Project) Series A (A/NR) |
| 1,100,000 | | 5.375 | | | 02/01/18 | | 1,169,894 |
| | | | | | | |
| | | | | | | 4,185,241 |
| |
Massachusetts – 0.0% | | |
| Massachusetts State Health & Educational Facilities Authority Revenue Bonds (Boston College) Series L (AA-/Aa3) |
| 10,000 | | 5.250 | | | 06/01/13 | | 10,256 |
| |
Michigan – 10.0% | | |
| Galesburg-Augusta MI Community Schools GO Bonds (Refunding) (Q-SBLF/FGIC) (AAA/Aaa) |
| 150,000 | | 4.500 | | | 05/01/30 | | 150,701 |
| |
| | | | | | | |
Principal Amount | | Interest
Rate | | | Maturity
Date | | Value |
| Municipal Bond Obligations – (continued) |
Michigan – (continued) | | | | | |
| Genesee County MI Sewage Disposal Systems Revenue Bonds (Interceptors & Treatment Facilities) (FGIC) (AAA/Aaa) |
| $ 550,000 | | 4.000 | % | | 05/01/14 | | $ 555,957 |
| Lake Orion MI Community School District GO Bonds Series A (Q-SBLF/FGIC) (AAA/Aaa)(c) |
| 2,000,000 | | 6.000 | | | 05/01/10 | | 2,126,340 |
| Michigan Higher Education Facilities Authority Limited Obligation Revenue Bonds (Calvin College Project) (NR/NR) |
| 500,000 | | 5.400 | | | 12/01/11 | | 520,735 |
| 1,125,000 | | 5.550 | | | 12/01/13 | | 1,174,545 |
| 1,625,000 | | 5.650 | | | 12/01/14 | | 1,699,165 |
| Michigan State Hospital Finance Authority Revenue Bonds (Ascension Health Credit) Series A (MBIA) (AAA/Aaa) |
| 2,500,000 | | 5.500 | | | 11/15/10 | | 2,626,900 |
| Michigan State Hospital Finance Authority Revenue Bonds Series A (AAA/Aa2)(c) |
| 1,650,000 | | 6.125 | | | 11/15/09 | | 1,761,342 |
| Newaygo MI Public Schools GO Bonds (Q-SBLF) (AA/Aa3)(c) |
| 750,000 | | 5.000 | | | 05/01/10 | | 777,397 |
| 250,000 | | 5.125 | | | 05/01/10 | | 260,010 |
| Paw Paw MI Public School District GO Bonds (School Building & Site) (Q-SBLF) (AA/Aa3)(c) |
| 475,000 | | 5.300 | | | 05/01/10 | | 496,356 |
| South Lyon MI Community Schools GO Bonds Series A (Q-SBLF) (AA/Aa3)(c) |
| 875,000 | | 5.500 | | | 05/01/10 | | 919,765 |
| Stockbridge MI Community Schools GO Bonds (Q-SBLF) (AA/Aa3)(c) |
| 665,000 | | 5.100 | | | 05/01/10 | | 691,540 |
| Thornapple Kellogg MI School District GO Bonds (Refunding) (FSA/Q-SBLF) (AAA/Aaa) |
| 1,130,000 | | 5.000 | | | 05/01/21 | | 1,199,540 |
| | | | | | | |
| | | | | | | 14,960,293 |
| |
Minnesota – 4.5% | | | | | |
| Chaska MN Electric Revenue Bonds Series A (NR/A3)(c) |
| 1,000,000 | | 6.000 | | | 10/01/10 | | 1,074,030 |
| Dakota County MN Community Development Agency GO Bonds (Governmental Housing Development) (Refunding Senior Housing Facilities) Series A (AA+/Aaa) |
| 900,000 | | 5.000 | | | 01/01/15 | | 966,204 |
| 875,000 | | 5.000 | | | 01/01/16 | | 937,571 |
| Minneapolis St. Paul MN Housing Finance Board Single Family Mortgage Revenue Bonds (Mortgage Backed Securities City Living Project) Series A-3 (GNMA/FNMA) (AAA/NR) |
| 995,745 | | 5.700 | | | 04/01/27 | | 1,059,861 |
| Shakopee MN Independent School District No. 720 GO Bonds (School Building Improvements) Series A (MBIA) (NR/Aaa) |
| 1,175,000 | | 4.750 | | | 02/01/15 | | 1,250,024 |
| 1,350,000 | | 4.750 | | | 02/01/16 | | 1,433,403 |
| | | | | | | |
| | | | | | | 6,721,093 |
| |
| | |
| The accompanying notes are an integral part of these financial statements. | | 29 |
COMMERCE NATIONAL TAX-FREE INTERMEDIATE BOND FUND
Schedule of Investments (continued)
April 30, 2007 (Unaudited)
| | | | | | | |
Principal Amount | | Interest
Rate | | | Maturity
Date | | Value |
| Municipal Bond Obligations – (continued) |
Mississippi – 0.5% | | | | | |
| Mississippi Medical Center Educational Building Corp. Revenue Bonds (University of Mississippi Medical Center Project) (MBIA-IBC) (ETM) (AAA/Aaa) |
| $ 770,000 | | 5.650 | % | | 12/01/09 | | $ 788,511 |
| |
Missouri – 12.0% | | | | | |
| Cape Girardeau County MO Industrial Development Authority Health Care Facilities Revenue Bonds (St. Francis Medical Center) Series A (A+/NR) |
| 400,000 | | 5.250 | | | 06/01/12 | | 422,568 |
| Howard Bend MO Levee District Special Tax Revenue Bonds (NR/NR)(c) |
| 600,000 | | 5.650 | | | 03/01/09 | | 625,962 |
| Howard Bend MO Levee District Special Tax Revenue Bonds (ETM) (NR/NR) |
| 600,000 | | 5.300 | | | 03/01/08 | | 607,824 |
| Jackson County MO Public Building Corp. Leasehold Revenue Bonds (Capital Improvements Project) (NR/Aa3) |
| 865,000 | | 5.000 | | | 12/01/13 | | 926,969 |
| Jefferson City MO School District GO Bonds Series A (NR/Aa2) |
| 300,000 | | 6.700 | | | 03/01/11 | | 316,686 |
| Joplin MO Industrial Development Authority Health Care Facilities Revenue Bonds (Freeman Health Systems Project) (BBB+/NR) |
| 290,000 | | 4.000 | | | 02/15/08 | | 289,643 |
| 555,000 | | 5.500 | | | 02/15/14 | | 596,148 |
| Missouri State Development Finance Board Cultural Facilities Revenue Bonds (Nelson Gallery Foundation) Series A (MBIA) (AAA/Aaa) |
| 1,000,000 | | 5.250 | | | 12/01/13 | | 1,065,990 |
| Missouri State Development Finance Board Infrastructure Facilities Revenue Bonds (Hartman Heritage Center Phase II) (AMBAC) (AAA/Aaa) |
| 1,070,000 | | 5.000 | | | 04/01/19 | | 1,122,109 |
| Missouri State Development Finance Board Infrastructure Facilities Revenue Bonds (Riverside-Quindaro L-385 Project) (NR/NR)(c) |
| 725,000 | | 5.600 | | | 03/01/10 | | 761,221 |
| Missouri State Health & Educational Facility Authority Revenue Bonds (SSM Health Care) Series A (MBIA) (AAA/Aaa) |
| 200,000 | | 5.000 | | | 06/01/12 | | 204,404 |
| Missouri State Health & Educational Facility Authority Revenue Bonds (St. Anthony’s Medical Center) (ETM) (NR/A2) |
| 500,000 | | 6.250 | | | 12/01/08 | | 519,895 |
| Missouri State Housing Development Commission Revenue Bonds (Multifamily Housing) Series II (FHA) (AA/NR) |
| 1,010,000 | | 4.750 | | | 12/01/10 | | 1,031,614 |
| Osage Beach MO Waterworks & Sewer System Revenue Bonds (NR/NR)(c) |
| 225,000 | | 5.500 | | | 12/01/10 | | 238,293 |
| 290,000 | | 5.600 | | | 12/01/10 | | 308,096 |
| |
| | | | | | | |
Principal Amount | | Interest
Rate | | | Maturity
Date | | Value |
| Municipal Bond Obligations – (continued) |
Missouri – (continued) | | | | | |
| Raytown MO Sewer Revenue Bonds (NR/NR) |
| $ 275,000 | | 4.625 | % | | 07/01/24 | | $ 271,934 |
| Springfield MO Special Obligations Series A (NR/A1) |
| 540,000 | | 4.500 | | | 11/01/18 | | 550,417 |
| 575,000 | | 4.500 | | | 11/01/19 | | 584,142 |
| St. Charles MO Certificates of Participation Series B (NR/A2) |
| 1,000,000 | | 5.500 | | | 05/01/18 | | 1,067,170 |
| St. Louis County MO Industrial Development Authority Health Facilities Revenue Bonds (Refunding Ranken Jordan Project) (NR/NR) |
| 500,000 | | 5.000 | | | 11/15/17 | | 511,795 |
| St. Louis County MO Rockwood School District No. R-6 GO Bonds (AA+/NR) |
| 3,200,000 | | 5.250 | | | 02/01/11 | | 3,368,320 |
| St. Louis MO Parking Facilities Revenue Bonds (Downtown Parking Facilities) Series A (NR/NR)(c) |
| 200,000 | | 5.875 | | | 02/01/12 | | 218,302 |
| St. Peters MO GO Bonds (Refunding) (FGIC) (NR/Aaa) |
| 650,000 | | 7.200 | | | 01/01/08 | | 664,976 |
| 1,620,000 | | 7.200 | | | 01/01/09 | | 1,712,307 |
| | | | | | | |
| | | | | | | 17,986,785 |
| |
Montana – 0.5% | | | | | |
| Montana State Board Housing Revenue Bonds (Single Family Mortgage) Series A-2 (AMT) (AA+/Aa1) |
| 405,000 | | 4.350 | | | 06/01/16 | | 405,320 |
| 415,000 | | 4.350 | | | 12/01/16 | | 415,328 |
| | | | | | | |
| | | | | | | 820,648 |
| |
Nebraska – 0.3% | | | | | |
| Nebraska Investment Finance Authority Revenue Bonds (Single Family Housing) Series F (GNMA/FNMA/FHLMC) (AAA/NR) |
| 125,000 | | 4.300 | | | 09/01/14 | | 125,079 |
| 180,000 | | 4.350 | | | 03/01/15 | | 180,358 |
| 100,000 | | 4.350 | | | 09/01/15 | | 100,203 |
| 105,000 | | 4.400 | | | 09/01/16 | | 105,219 |
| | | | | | | |
| | | | | | | 510,859 |
| |
New Mexico – 0.0% | | | | | |
New Mexico Mortgage Finance Authority Revenue Bonds (Single Family Mortgage Program) Series A-3
(GNMA/FNMA/FHLMC) (AAA/NR) |
| 10,000 | | 6.150 | | | 09/01/17 | | 10,381 |
| |
New York – 4.4% | | | | | |
| Metropolitan Transportation Authority NY Service Contract Revenue Bonds (Refunding) Series A (AA-/A1) |
| 2,000,000 | | 5.100 | | | 01/01/21 | | 2,101,560 |
| New York NY City Transitional Finance Authority Revenue Bonds (Prerefunded Future Tax) Series B (AAA/Aa1)(c) |
| 375,000 | | 6.000 | | | 05/15/10 | | 404,002 |
| New York NY City Transitional Finance Authority Revenue Bonds (Unrefunded Future Tax) Series B (AAA/Aa1)(c) |
| 125,000 | | 6.000 | | | 05/15/10 | | 134,668 |
| New York NY GO Bonds (Prerefunded) Series J (AAA/A1)(c) |
| 90,000 | | 5.250 | | | 08/01/08 | | 92,669 |
| |
| | |
| 30 | | The accompanying notes are an integral part of these financial statements. |
COMMERCE NATIONAL TAX-FREE INTERMEDIATE BOND FUND
| | | | | | | |
Principal Amount | | Interest
Rate | | | Maturity
Date | | Value |
| Municipal Bond Obligations – (continued) |
New York – (continued) | | | | | |
| New York NY GO Bonds (Unrefunded Balance) Series J (AA-/A1) |
| $2,495,000 | | 5.250 | % | | 08/01/11 | | $ 2,564,985 |
| New York NY GO Bonds Series G (AA-/A1) |
| 1,000,000 | | 5.625 | | | 08/01/13 | | 1,085,970 |
| New York State Dormitory Authority Revenue Bonds (Unrefunded Balance) Series C (AA-/A1) |
| 190,000 | | 7.375 | | | 05/15/10 | | 199,749 |
| | | | | | | |
| | | | | | | 6,583,603 |
| |
North Carolina – 0.6% | | | | | |
| Durham NC Certificates of Participation Series B (AA+/Aa2) |
| 445,000 | | 4.250 | | | 06/01/15 | | 458,181 |
| Durham Water & Sewer Utility System Revenue Bonds (Wachovia Bank N.A.) (AAA/Aa3)(b) |
| 300,000 | | 3.960 | | | 12/01/15 | | 300,000 |
| North Carolina Housing Finance Agency Mortgage Revenue Bonds (Single Family) Series TT (AMT) (AA/Aa2) |
| 155,000 | | 5.000 | | | 09/01/07 | | 155,019 |
| | | | | | | |
| | | | | | | 913,200 |
| |
North Dakota – 1.6% | | | | | |
| North Dakota State Building Authority Revenue Bonds (Refunding) Series B (AMBAC) (AAA/Aaa) |
| 725,000 | | 4.250 | | | 12/01/16 | | 739,087 |
| North Dakota State Housing Finance Agency Mortgage Revenue Bonds (Housing Finance Project) Series B (AMT) (AAA/Aa1) |
| 550,000 | | 4.400 | | | 07/01/16 | | 552,332 |
| North Dakota State Housing Finance Agency Revenue Bonds (Housing Finance Project) Series B (AAA/Aa1) |
| 635,000 | | 4.450 | | | 07/01/17 | | 638,143 |
| North Dakota State Municipal Bond Bank Revenue Bonds (State Revolving Funding Program) Series A (NR/Aaa)(c) |
| 400,000 | | 6.000 | | | 10/01/10 | | 429,876 |
| | | | | | | |
| | | | | | | 2,359,438 |
| |
Ohio – 4.3% | | | | | |
| Akron OH Certificates of Participation (Parking Facilities Project) Series A (AMBAC) (AAA/NR) |
| 1,250,000 | | 5.000 | | | 12/01/16 | | 1,351,288 |
| Cleveland OH GO Bonds (MBIA) (AAA/Aaa) |
| 500,000 | | 5.500 | | | 08/01/08 | | 510,755 |
| Cleveland OH Municipal School District GO Bonds (FSA) (AAA/Aaa) |
| 1,695,000 | | 5.000 | | | 12/01/22 | | 1,793,174 |
| Cuyahoga County OH GO Bonds (AA+/Aa1) |
| 165,000 | | 5.550 | | | 12/01/20 | | 174,568 |
| Indian Lake OH Local School District GO Bonds (Refunding & Improvement School Facilities Construction) (MBIA) (AAA/Aaa) |
| 830,000 | | 4.500 | | | 12/01/21 | | 846,841 |
| |
| | | | | | | |
Principal Amount | | Interest
Rate | | | Maturity
Date | | Value |
| Municipal Bond Obligations – (continued) |
Ohio – (continued) | | | | | |
| Ohio State Higher Educational Facilities Revenue Bonds (College of Wooster Project) (NR/A1) |
| $ 520,000 | | 5.000 | % | | 09/01/14 | | $ 553,056 |
| Ohio State Transportation Project Revenue Bonds (Street Transportation Board Fund) Series 2006-2 (NR/NR) |
| 640,000 | | 4.250 | | | 11/15/10 | | 646,266 |
| Olentangy Local School District GO Bonds (Capital Appreciation Refunding) Series A (FSA) (AAA/Aaa)(a) |
| 500,000 | | 0.000 | | | 12/01/16 | | 337,375 |
| Westlake OH GO Bonds (Street Improvement) (AAA/Aaa) |
| 260,000 | | 5.250 | | | 12/01/25 | | 297,508 |
| | | | | | | |
| | | | | | | 6,510,831 |
| |
Oklahoma(c) – 1.8% | | | | | |
| Tulsa County OK Public Facilities Authority Capital Improvement Revenue Bonds (AA-/NR) |
| 2,530,000 | | 6.200 | | | 11/01/19 | | 2,729,364 |
| |
Oregon – 3.7% | | | | | |
| Oregon State Department of Administrative Services Lottery Revenue Bonds (Taxable Lottery Administration) (FSA) (AAA/Aaa) |
| 250,000 | | 5.389 | | | 04/01/08 | | 250,887 |
| Oregon State Housing & Community Services Department Mortgage Revenue Bonds (Single-Family Mortgage) Series D (NR/Aa2) |
| 1,280,000 | | 4.350 | | | 07/01/18 | | 1,310,874 |
| 1,480,000 | | 4.400 | | | 07/01/19 | | 1,514,588 |
| 995,000 | | 4.450 | | | 07/01/20 | | 1,018,203 |
| Oregon State Housing & Community Services Department Mortgage Revenue Bonds Series E (NR/Aa2) |
| 435,000 | | 4.600 | | | 07/01/30 | | 439,955 |
| Portland OR Sewer System Revenue Bonds (Refunding) Series A (FGIC) (AAA/Aaa)(c) |
| 1,025,000 | | 5.000 | | | 06/01/07 | | 1,026,025 |
| | | | | | | |
| | | | | | | 5,560,532 |
| |
Pennsylvania – 0.5% | | | | | |
| Oxford PA Area Sewer Authority Revenue Bond (FSA) (NR/Aaa) |
| 765,000 | | 4.500 | | | 03/01/13 | | 775,549 |
| |
Puerto Rico – 0.0% | | | | | |
| Puerto Rico Electric Power Authority Revenue Bonds (Refunding) (MBIA) (AAA/Aaa) |
| 10,000 | | 5.000 | | | 07/01/20 | | 11,091 |
| |
Rhode Island – 0.5% | | | | | |
| Rhode Island State Student Loan Revenue Bonds Series 3 (AMBAC) (AMT) (NR/Aaa) |
| 180,000 | | 5.700 | | | 12/01/12 | | 185,976 |
| 190,000 | | 5.750 | | | 12/01/13 | | 196,745 |
| 205,000 | | 5.800 | | | 12/01/14 | | 213,089 |
| 125,000 | | 5.900 | | | 12/01/15 | | 130,299 |
| | | | | | | |
| | | | | | | 726,109 |
| |
| | |
| The accompanying notes are an integral part of these financial statements. | | 31 |
COMMERCE NATIONAL TAX-FREE INTERMEDIATE BOND FUND
Schedule of Investments (continued)
April 30, 2007 (Unaudited)
| | | | | | | |
Principal Amount | | Interest
Rate | | | Maturity
Date | | Value |
| Municipal Bond Obligations – (continued) |
South Carolina – 1.1% | | | | | |
| Berkeley County SC GO Bonds (Refunding & Improvement) (FSA) (AAA/Aaa) |
| $ 445,000 | | 5.000 | % | | 09/01/14 | | $ 477,089 |
| Florence SC Water & Sewer Revenue Bonds (AMBAC) (AAA/Aaa) |
| 390,000 | | 7.500 | | | 03/01/11 | | 433,263 |
| Greenville County SC Public Facilities Corp. Certificates of Participation (Refunding University Center Project) (AMBAC) (AAA/Aaa) |
| 700,000 | | 5.000 | | | 04/01/16 | | 754,922 |
| | | | | | | |
| | | | | | | 1,665,274 |
| |
South Dakota – 1.3% | | | | | |
| Hot Springs SD School District No. 023-2 GO Bonds (FSA) (AAA/Aaa) |
| 120,000 | | 4.800 | | | 07/01/09 | | 122,686 |
| South Dakota Housing Development Authority Revenue Bonds (Homeowner Mortgage-E-1) (AMT) (AAA/Aa1) |
| 250,000 | | 5.150 | | | 05/01/11 | | 254,995 |
| South Dakota Housing Development Authority Revenue Bonds (Multiple Purpose) Series A (FSA) (NR/Aaa) |
| 125,000 | | 4.300 | | | 11/01/10 | | 126,741 |
| South Dakota State Health & Educational Facilities Authority Revenue Bonds (Rapid City Regional Hospital) (MBIA) (AAA/Aaa) |
| 800,000 | | 5.000 | | | 09/01/08 | | 812,688 |
| 660,000 | | 5.000 | | | 09/01/10 | | 684,506 |
| | | | | | | |
| | | | | | | 2,001,616 |
| |
Tennessee – 1.4% | | | | | |
| Memphis TN GO Bonds (Refunding & General Improvement) (A/A1) |
| 1,040,000 | | 5.000 | | | 10/01/17 | | 1,125,977 |
| Memphis-Shelby County TN Sports Authority, Inc. Revenue Bonds (Memphis Arena Project) Series A (AMBAC) (AAA/Aaa) |
| 700,000 | | 5.500 | | | 11/01/11 | | 752,633 |
| Tennessee Housing Development Agency Revenue Bonds (Homeownership Program) (AMT) (AA/Aa2) |
| 220,000 | | 4.250 | | | 01/01/14 | | 219,131 |
| | | | | | | |
| | | | | | | 2,097,741 |
| |
Texas – 7.4% | | | | | |
| Brownwood TX Independent School District GO Bonds (Refunding School Building) (FGIC) (NR/Aaa) |
| 1,245,000 | | 5.250 | | | 02/15/16 | | 1,362,067 |
| Channelview TX Independent School District GO Bonds (Building) Series B (PSF-GTD) (AAA/Aaa) |
| 250,000 | | 5.000 | | | 08/15/20 | | 264,998 |
| 625,000 | | 5.000 | | | 08/15/21 | | 661,281 |
| Comal TX Independent School District GO Bonds (Capital Appreciation) (Refunding) (PSF-GTD) (NR/Aaa)(a) |
| 1,700,000 | | 0.000 | | | 02/01/15 | | 1,236,801 |
| |
| | | | | | | |
Principal Amount | | Interest
Rate | | | Maturity
Date | | Value |
| Municipal Bond Obligations – (continued) |
Texas – (continued) | | | | | |
| Corpus Christi TX Utility System Revenue Bonds (Refunding) (FSA) (AAA/Aaa) |
| $ 375,000 | | 5.000 | % | | 07/15/12 | | $ 397,121 |
| Dallas Civic Center Revenue Bonds (Refunding & General Improvement) (MBIA) (AAA/Aaa) |
| 1,000,000 | | 4.875 | | | 08/15/23 | | 1,017,260 |
| Dickinson TX Independent School District GO Bonds (Refunding School Building) (PSF-GTD) (AAA/Aaa) |
| 500,000 | | 5.000 | | | 02/15/14 | | 535,245 |
El Campo TX Independent School District GO Bonds
(PSF-GTD) (AAA/NR) |
| 655,000 | | 4.500 | | | 08/15/19 | | 673,209 |
| Harris County TX Revenue Bonds Toll Roads Subordinated Lien (Refunding) (AA+/Aa1) |
| 365,000 | | 5.000 | | | 08/01/33 | | 369,190 |
| Houston TX Community College Systems Revenue Bonds (Unrefunded Balance) (Refunding) (MBIA) (AAA/Aaa) |
| 1,000,000 | | 5.375 | | | 04/15/13 | | 1,059,500 |
| Lake Worth Independent School District GO Bonds (Capital Appreciation) Series B (PSF-GTD) (AAA/NR)(a) |
| 1,000,000 | | 0.000 | | | 02/15/15 | | 729,140 |
| Lewisville Independent School District GO Bonds (Capital Appreciation Refunding) (PSF-GTD) (AAA/NR)(a) |
| 400,000 | | 0.000 | | | 08/15/11 | | 339,152 |
| North Harris Montgomery Community College District Revenue Bonds (FGIC) (AAA/Aaa) |
| 420,000 | | 5.750 | | | 02/15/18 | | 440,958 |
| North TX Municipal Water District Texas Regional Solid Waste Disposal System Revenue Bonds (AMBAC) (AAA/Aaa) |
| 1,690,000 | | 5.000 | | | 09/01/20 | | 1,773,402 |
| San Antonio TX GO Bonds (General Improvement) (AA+/Aa2)(c) |
| 10,000 | | 6.000 | | | 02/01/10 | | 10,594 |
| Texas State Department of Housing & Community Affairs Single Family Revenue Bonds (Refunding) (AMT) (FHA/VA Mortgages) (AAA/Aa1) |
| 150,000 | | 4.600 | | | 09/01/19 | | 151,184 |
| | | | | | | |
| | | | | | | 11,021,102 |
| |
Utah – 3.2% | | | | | |
| Utah State Board Regents Auxiliary Systems & Student Fee Revenue Bonds for Salt Lake Community College (FSA) (AAA/Aaa) |
| 1,000,000 | | 5.500 | | | 06/01/16 | | 1,064,790 |
| Utah State Building Ownership Authority Revenue Bonds (State Facilities Master Lease Program) Series A (AA+/Aa1) |
| 3,550,000 | | 5.000 | | | 05/15/12 | | 3,733,357 |
| | | | | | | |
| | | | | | | 4,798,147 |
| |
Virginia – 0.7% | | | | | |
| Richmond VA Metropolitan Authority Expressway Revenue Bonds (Refunding) (FGIC) (AAA/Aaa) |
| 1,000,000 | | 5.250 | | | 07/15/17 | | 1,099,230 |
| |
| | |
| 32 | | The accompanying notes are an integral part of these financial statements. |
COMMERCE NATIONAL TAX-FREE INTERMEDIATE BOND FUND
| | | | | | | |
Principal Amount | | Interest
Rate | | | Maturity
Date | | Value |
| Municipal Bond Obligations – (continued) |
Washington – 1.3% | | | | | |
| CDP-King County III WA Lease Revenue Bonds (Refunding King Street Center Project) (MBIA) (AAA/Aaa) |
| $1,000,000 | | 4.500 | % | | 06/01/22 | | $ 1,003,190 |
| Washington State Higher Education Facilities Authority Revenue Bonds (Prerefunded University Puget Sound) (A+/A1)(c) |
| 375,000 | | 4.750 | | | 04/01/08 | | 382,245 |
| Washington State Higher Education Facilities Authority Revenue Bonds (Unrefunded Balance University Puget Sound) (A+/A1) |
| 625,000 | | 4.750 | | | 10/01/08 | | 632,631 |
| | | | | | | |
| | | | | | | 2,018,066 |
| |
Wisconsin – 1.3% | | | | | |
| Grafton WI School District GO Bonds (MBIA) (NR/Aaa)(c) |
| 615,000 | | 5.750 | | | 04/01/11 | | 660,492 |
| Monona WI Revenue Bonds Taxable Anticipation Notes (NR/A1) |
| 755,000 | | 5.650 | | | 09/01/11 | | 766,808 |
| Plymouth WI Combined Utility Revenue Bonds (XLCA) (NR/Aaa) |
| 205,000 | | 4.375 | | | 05/01/09 | | 207,479 |
| 230,000 | | 4.375 | | | 05/01/12 | | 236,596 |
| | | | | | | |
| | | | | | | 1,871,375 |
| |
Wyoming – 1.2% | | | | | |
| Wyoming Community Development Authority Housing Revenue Bonds Series 5 (AMT) (AA+/Aa1) |
| 785,000 | | 4.800 | | | 06/01/09 | | 792,387 |
| Wyoming Community Development Authority Housing Revenue Bonds Series 7 (AA+/Aa1) |
| 30,000 | | 5.150 | | | 12/01/10 | | 30,957 |
| 85,000 | | 5.200 | | | 12/01/11 | | 88,366 |
| Wyoming Community Development Authority Housing Revenue Bonds Series 8 (AMT) (AA+/Aa1) |
| 165,000 | | 4.250 | | | 06/01/14 | | 165,095 |
| 280,000 | | 4.250 | | | 12/01/14 | | 280,171 |
| 385,000 | | 4.300 | | | 12/01/15 | | 385,812 |
| | | | | | | |
| | | | | | | 1,742,788 |
| |
| TOTAL MUNICIPAL BOND OBLIGATIONS |
(Cost $145,355,930) | | | | | $148,738,771 |
| |
|
| Repurchase Agreement(d) – 0.5% |
| State Street Bank & Trust Co. |
| $ 778,000 | | 4.690 | % | | 05/01/07 | | $ 778,000 |
Maturity Value: $778,101 | | |
(Cost $778,000) | | | | | |
| |
| TOTAL INVESTMENTS – 99.7% | | |
(Cost $146,133,930) | | | | | $149,516,771 |
| Other assets in excess of liabilities – 0.3% | | 428,936 |
| |
| Net Assets — 100.0% | | $149,945,707 |
| |
| | | | | | |
| The percentage shown for each investment category reflects the value of investments in that category as a percentage of net assets. |
| | |
| (a) | | Security issued with a zero coupon. Income is recognized through the accretion of discount. |
| (b) | | Variable rate security. Interest rate disclosed is that which is in effect at April 30, 2007. |
| (c) | | Prerefunded security. Maturity date disclosed is prerefunding date. |
| (d) | | Repurchase agreement was entered into on April 30, 2007. This agreement was fully collateralized by $585,000 U.S. Treasury Bond, 8.000%, due 11/15/21 with a market value of $795,600. |
| Security ratings disclosed are issued by Standard & Poor’s Ratings Services/Moody’s Investors Service. A description of the ratings is available in the Fund’s Statement of Additional Information. |
| | |
| |
| Investment Abbreviations: |
| AMBAC | | — Insured by American Municipal Bond Assurance Corp. |
| AMT | | — Alternative Minimum Tax |
| ETM | | — Escrow to Maturity |
| FGIC | | — Insured by Financial Guaranty Insurance Co. |
| FHA | | — Insured by Federal Housing Administration |
| FHLMC | | — Insured by Federal Home Loan Mortgage Corp. |
| FNMA | | — Insured by Federal National Mortgage Association |
| FSA | | — Insured by Financial Security Assurance Co. |
| GNMA | | — Insured by Government National Mortgage Association |
| GO | | — General Obligation |
| MBIA | | — Insured by Municipal Bond Investors Assurance |
| MBIA-IBC | | — Insured by Municipal Bond Investors Assurance- Insured Bond Certificates |
| NR | | — Not Rated |
| PSF-GTD | | — Guaranteed by Permanent School Fund |
| Q-SBLF | | — Qualified School Bond Loan Fund |
| XLCA | | — Insured by XL Capital Assurance, Inc. |
| VA | | — Veterans Administration |
| |
PORTFOLIO COMPOSITION
| | | | | | |
| Sector Allocation | | AS OF
04/30/07 | | | AS OF
10/31/06 | |
| | |
General Obligations | | 25.8 | % | | 28.3 | % |
Prerefunded Escrow to Maturity | | 15.5 | | | 17.4 | |
Lease | | 13.6 | | | 14.2 | |
General | | 10.4 | | | 8.6 | |
Single Family Housing | | 8.4 | | | 6.9 | |
Education | | 8.0 | | | 6.4 | |
Hospital | | 6.1 | | | 6.4 | |
Water/Sewer | | 5.7 | | | 5.1 | |
Transportation | | 3.0 | | | 3.5 | |
Student | | 1.9 | | | 1.9 | |
Multi Family Housing | | 0.8 | | | 0.8 | |
Repurchase Agreement | | 0.5 | | | 0.8 | |
Crossover | | 0.0 | | | 0.7 | |
| | |
The percentage shown for each investment category reflects the value of investments in that category as a percentage of net assets.
The Fund is actively managed and, as such, its composition may differ over time.
| | |
| The accompanying notes are an integral part of these financial statements. | | 33 |
COMMERCE MISSOURI TAX-FREE INTERMEDIATE BOND FUND
Missouri Tax-Free Intermediate Bond Fund
Performance Review(1) (Unaudited)
For the six months ended April 30, 2007, the Institutional Shares of the Fund had a total return of 1.18%, based on Net Asset Value (NAV). This compares to the Lehman 3-15 Year Blend Index(2) six-month return of 1.43%. Past performance is no guarantee of future results.
Schedule of Investments
April 30, 2007 (Unaudited)
| | | | | | | |
Principal
Amount | | Interest
Rate | | | Maturity
Date | | Value |
| Municipal Bond Obligations – 100.0% |
Michigan – 0.7% | | | | | |
| Michigan State Hospital Finance Authority Revenue Bonds (Ascension Health Credit) Series A (MBIA) (AAA/Aaa) |
| $ 500,000 | | 5.500 | % | | 11/15/10 | | $ 525,380 |
| Michigan State Hospital Finance Authority Revenue Bonds Series A (AAA/Aa2)(a) |
| 500,000 | | 6.125 | | | 11/15/09 | | 533,740 |
| | | | | | | |
| | | | | | | 1,059,120 |
| |
Missouri – 98.2% | | | | | |
| Belton MO Certificates of Participation Series B (MBIA) (NR/Aaa) |
| 535,000 | | 4.650 | | | 03/01/11 | | 539,430 |
| Belton MO School District No. 124 Direct Deposit Program GO Bonds Series A (Refunding) (AA+/Aa1) |
| 150,000 | | 4.000 | | | 03/01/17 | | 150,260 |
| Bi-State Development Agency MO Metro District Revenue Bonds (Refunding-St. Clair County Metrolink Project) (FSA) (AAA/Aaa) |
| 2,000,000 | | 5.250 | | | 07/01/20 | | 2,253,780 |
| Bonne Terre MO Certificates of Participation (AMBAC) (NR/NR) |
| 250,000 | | 5.250 | | | 11/01/15 | | 272,598 |
| Branson MO Reorganized School District No. R-4 GO Bonds (FSA) (AAA/NR) |
| 1,000,000 | | 5.000 | | | 03/01/18 | | 1,077,030 |
| 1,250,000 | | 5.000 | | | 03/01/19 | | 1,341,925 |
| Branson MO Reorganized School District No. R-4 GO Bonds School District Direct Deposit Program (AMBAC) (AAA/Aaa) |
| 300,000 | | 5.500 | | | 03/01/14 | | 331,731 |
| Camdenton MO Reorganized School District No. RIII GO Bonds (Refunding & Improvement) (FSA) (AAA/Aaa) |
| 500,000 | | 5.250 | | | 03/01/17 | | 556,800 |
| 1,000,000 | | 4.000 | | | 03/01/20 | | 991,040 |
| 1,000,000 | | 5.250 | | | 03/01/21 | | 1,088,150 |
| Cape Girardeau County MO Industrial Development Authority Health Care Facilities Revenue Bonds (St. Francis Medical Center) Series A (A+/NR) |
| 930,000 | | 5.250 | | | 06/01/11 | | 974,733 |
| 1,000,000 | | 5.250 | | | 06/01/13 | | 1,064,600 |
| |
| | | | | | | |
Principal
Amount | | Interest
Rate | | | Maturity
Date | | Value |
| Municipal Bond Obligations – (continued) |
Missouri – (continued) | | | | | |
| Citizens Memorial Hospital District Revenue Bonds (Polk County Hospital) (Refunding Series B) (NR/Aaa)(a) |
| $ 810,000 | | 5.000 | % | | 08/01/07 | | $ 812,657 |
| Citizens Memorial Hospital District Revenue Bonds (Polk County Hospital) (Refunding Series B) (ETM) (NR/Aaa) |
| 140,000 | | 5.000 | | | 08/01/07 | | 140,459 |
| Clay County MO Public Building Authority Leasehold Revenue Bonds Series C (General Improvement) (FSA) (AAA/Aaa) |
| 40,000 | | 5.000 | | | 05/15/09 | | 40,562 |
| Clay County MO Public School District No. 53 Direct Deposit Program GO Bonds (AA+/NR) |
| 825,000 | | 5.600 | | | 03/01/13 | | 865,771 |
| Clay County MO Public School District No. 53 Liberty Direct Deposit Program GO Bonds Series A (Refunding) (FSA) (AAA/Aaa) |
| 1,000,000 | | 5.000 | | | 03/01/18 | | 1,048,820 |
| Clay County MO Public School District No. 53 Liberty Direct Deposit Program GO Bonds Series B (FSA) (AAA/Aaa) |
| 1,000,000 | | 5.000 | | | 03/01/18 | | 1,048,820 |
| Clay County MO Reorganized School District No. R1 Kearney Direct Deposit Program GO Bonds (AA+/Aa1) |
| 740,000 | | 5.000 | | | 03/01/13 | | 772,123 |
| 900,000 | | 5.000 | | | 03/01/15 | | 939,069 |
| Clay County MO Reorganized School District No. R1 Kearney School Building Direct Deposit Program GO Bonds Series B (AA+/Aa1) |
| 695,000 | | 5.000 | | | 03/01/21 | | 737,437 |
| 650,000 | | 5.000 | | | 03/01/22 | | 688,798 |
| Clinton MO Certificates of Participation (Refunding & Improvement) (NR/NR) |
| 400,000 | | 5.000 | | | 12/01/12 | | 411,940 |
| Columbia MO Water & Electricity Revenue Bonds (Prerefunded-Refunding and Improvement Series A) (AA-/A1)(a) |
| 320,000 | | 4.700 | | | 10/01/08 | | 324,746 |
| Columbia MO Water & Electricity Revenue Bonds (Unrefunded Balance-Refunding and Improvement Series A) (AA-/A1) |
| 230,000 | | 4.700 | | | 10/01/10 | | 232,937 |
| |
(1) | | Returns assume fee waivers and expense reductions and are not annualized. Returns do not reflect the deduction of taxes that a shareholder would pay on Fund distributions or the redemption of Fund shares. |
(2) | | The Lehman 3-15 Year Blend Index is an unmanaged index composed of investment grade municipal securities ranging from 2 to 17 years in maturity. The Index figures do not reflect the deduction of any fees, expenses or taxes. |
| | |
| 34 | | The accompanying notes are an integral part of these financial statements. |
COMMERCE MISSOURI TAX-FREE INTERMEDIATE BOND FUND
| | | | | | | |
Principal
Amount | | Interest
Rate | | | Maturity
Date | | Value |
| Municipal Bond Obligations – (continued) |
Missouri – (continued) | | | | | |
| Florissant MO Certificates of Participation (FGIC) (NR/Aaa) |
| $ 330,000 | | 5.000 | % | | 08/01/11 | | $ 347,087 |
| 560,000 | | 5.000 | | | 08/01/12 | | 594,658 |
| 485,000 | | 5.000 | | | 08/01/15 | | 513,591 |
| 500,000 | | 5.000 | | | 08/01/16 | | 528,260 |
| 450,000 | | 5.000 | | | 08/01/17 | | 474,120 |
| Fort Zumwalt MO School District Direct Deposit Program GO Bonds Series A (AA+/Aa1) |
| 1,080,000 | | 5.000 | | | 03/01/19 | | 1,162,102 |
| Fort Zumwalt MO School District GO Bonds (Refunding Direct Deposit Program Series A) (AA+/Aa1) |
| 700,000 | | 5.000 | | | 03/01/17 | | 752,941 |
| 935,000 | | 5.000 | | | 03/01/18 | | 1,004,414 |
| 945,000 | | 5.000 | | | 03/01/19 | | 1,011,859 |
| Franklin County MO Public Water Supply District No. 3 Certificates of Participation (Refunding Series C) (FGIC) (NR/Aaa) |
| 395,000 | | 5.000 | | | 12/01/15 | | 419,632 |
| Grain Valley MO Certificates of Participation (Refunding) (NR/NR) |
| 250,000 | | 5.000 | | | 09/01/20 | | 257,500 |
| Greene County MO Reorganized School District No. R8 Direct Deposit Program GO Bonds (FSA) (AAA/Aaa) |
| 520,000 | | 5.250 | | | 03/01/16 | | 553,654 |
| Hickman Mills MO C-1 School District Direct Deposit Program GO Bonds (FSA) (AAA/Aaa) |
| 2,300,000 | | 5.000 | | | 03/01/19 | | 2,423,280 |
| Howard Bend MO Levee District Special Tax Special Tax Bonds (NR/NR)(a) |
| 850,000 | | 5.850 | | | 03/01/09 | | 889,754 |
| Jackson County MO Consolidated School District No. 002 Direct Deposit Program GO Bonds (AA+/NR) |
| 1,275,000 | | 5.000 | | | 03/01/18 | | 1,328,040 |
| Jackson County MO Consolidated School District No. 002 GO Bonds (Direct Deposit Program) (MBIA) (AAA/Aaa) |
| 1,250,000 | | 5.000 | | | 03/01/22 | | 1,336,375 |
| Jackson County MO Public Building Corp. Leasehold Revenue Bonds (Capital Improvements Project Series B) (NR/Aa3) |
| 530,000 | | 4.500 | | | 12/01/19 | | 545,789 |
| 555,000 | | 4.500 | | | 12/01/20 | | 570,207 |
| Jackson County MO Public Building Corp. Leasehold Revenue Bonds Series A (NR/Aa3)(a) |
| 325,000 | | 5.250 | | | 11/01/08 | | 335,767 |
| 340,000 | | 5.350 | | | 11/01/08 | | 351,754 |
| Jackson County MO Public Building Corp. Leasehold Revenue Bonds Series A (MBIA) (NR/Aaa) |
| 500,000 | | 5.000 | | | 12/01/20 | | 535,740 |
| Jackson County MO Reorganized School District No. 007 Lee’s Summit Direct Deposit GO Bonds (Refunding & Improvement) (FSA) (AAA/Aaa) |
| 1,070,000 | | 5.250 | | | 03/01/15 | | 1,143,627 |
| |
| | | | | | | |
Principal
Amount | | Interest
Rate | | | Maturity
Date | | Value |
| Municipal Bond Obligations – (continued) |
Missouri – (continued) | | | | | |
| Jackson County MO Reorganized School District No. 007 Lee’s Summit School District Certificates of Participation (Refunding) (NR/NR) |
| $ 300,000 | | 5.000 | % | | 10/01/08 | | $ 300,801 |
| Jackson County MO Special Obligation Revenue Bonds Series A (MBIA) (NR/Aaa) |
| 2,000,000 | | 5.500 | | | 12/01/12 | | 2,169,380 |
| Jefferson County MO Consolidated Public Water Supply District No. C-1 Revenue Bonds (AMBAC) (NR/Aaa) |
| 1,000,000 | | 5.250 | | | 12/01/15 | | 1,080,060 |
| Jefferson County MO Consolidated School District No. 006 Direct Deposit Program GO Bonds (MBIA) (AAA/Aaa) |
| 1,000,000 | | 5.000 | | | 03/01/18 | | 1,048,820 |
| 2,000,000 | | 5.000 | | | 03/01/19 | | 2,090,480 |
| Jefferson County MO Reorganized School District No. R6 GO Bonds (Refunding Insured) (FGIC) (AAA/Aaa) |
| 530,000 | | 5.000 | | | 03/01/11 | | 547,305 |
| Johnson County MO Hospital Revenue Bonds (Western MO Medical Center Project) (Radian) (NR/NR)(a) |
| 300,000 | | 5.700 | | | 06/01/10 | | 317,742 |
| Johnson County MO Hospital Revenue Bonds (Western MO Medical Center Project) (Radian) (AA/NR)(a) |
| 380,000 | | 5.750 | | | 06/01/10 | | 403,020 |
| 400,000 | | 5.800 | | | 06/01/10 | | 424,808 |
| Johnson County MO Hospital Revenue Bonds (Western MO Medical Center Project) (Radian) (ETM) (AA/NR) |
| 330,000 | | 5.350 | | | 06/01/10 | | 341,184 |
| Joplin MO Industrial Development Authority Health Facilities Revenue Bonds (Freeman Health System Project) (BBB+/NR) |
| 600,000 | | 5.500 | | | 02/15/12 | | 634,506 |
| Kansas City MO Land Clearance Revenue Bonds (Refunding & Improvement) Series E (XLCA) (AAA/Aaa) |
| 1,000,000 | | 5.000 | | | 12/01/15 | | 1,084,060 |
| Kansas City MO Metropolitan Community Colleges Building Corp. Leasehold Revenue Bonds (Refunding & Improvement) (FGIC) (NR/Aaa) |
| 1,000,000 | | 5.500 | | | 07/01/11 | | 1,069,970 |
| Kansas City MO Metropolitan Community Leasehold Jr College Revenue Bonds (Refunding & Improvements) (FGIC) (NR/Aaa) |
| 1,075,000 | | 5.000 | | | 07/01/17 | | 1,164,440 |
| Kansas City MO Municipal Assistance Corp. Revenue Bonds (Refunding & Improvement Series B) (AA-/A1) |
| 300,000 | | 6.200 | | | 10/01/07 | | 303,036 |
| Kansas City MO Water Revenue Bonds Series A (AA/A1) |
| 1,640,000 | | 5.750 | | | 12/01/17 | | 1,746,551 |
| 1,735,000 | | 5.800 | | | 12/01/18 | | 1,849,996 |
| Kansas City MO Water Revenue Bonds Series C (FGIC) (AAA/Aaa) |
| 850,000 | | 5.000 | | | 12/01/16 | | 894,285 |
| 1,035,000 | | 5.000 | | | 12/01/19 | | 1,084,049 |
| Lebanon MO Reorganized School District No. R-3 Direct Deposit Program GO Bonds (AA+/NR) |
| 270,000 | | 5.450 | | | 03/01/14 | | 282,266 |
| |
| | |
| The accompanying notes are an integral part of these financial statements. | | 35 |
COMMERCE MISSOURI TAX-FREE INTERMEDIATE BOND FUND
Schedule of Investments (continued)
April 30, 2007 (Unaudited)
| | | | | | | |
Principal
Amount | | Interest
Rate | | | Maturity
Date | | Value |
| Municipal Bond Obligations – (continued) |
Missouri – (continued) | | | | | |
| Lee’s Summit MO Water & Sewer Revenue Bonds (Refunding) (AMBAC) (NR/Aaa) |
| $1,335,000 | | 5.250 | % | | 07/01/11 | | $ 1,415,647 |
| 1,000,000 | | 5.250 | | | 07/01/12 | | 1,059,620 |
| 1,135,000 | | 5.250 | | | 07/01/15 | | 1,204,462 |
| Lee’s Summit MO Water & Sewer Revenue Bonds Combination Series A (AMBAC) (NR/Aaa) |
| 480,000 | | 5.000 | | | 07/01/20 | | 504,442 |
| Mehlville MO School District No. R-9 Certificates of Participation (Capital Improvement Projects) (FSA) (AAA/Aaa) |
| 1,000,000 | | 5.250 | | | 09/01/12 | | 1,074,780 |
| Missouri Development Finance Board Cultural Facilities Revenue Bonds (Nelson Gallery Foundation) Series A (MBIA) (AAA/Aaa) |
| 1,410,000 | | 5.250 | | | 12/01/15 | | 1,504,273 |
| Missouri Higher Education Student Loan Revenue Bonds Series EE (AMT) (NR/Aaa) |
| 500,000 | | 4.500 | | | 02/15/10 | | 503,740 |
| Missouri Higher Education Student Loan Revenue Bonds Series RR (AMT) (NR/A2) |
| 1,500,000 | | 5.850 | | | 07/15/10 | | 1,560,525 |
| Missouri State Certificates of Participation (Bonne Terre Prison Project) Series A (AMBAC) (AAA/Aaa)(a) |
| 400,000 | | 5.050 | | | 06/01/09 | | 411,176 |
| Missouri State Development Finance Board Infrastructure Facilities (Eastland Centre Project) Series A (A+/NR) |
| 700,000 | | 5.750 | | | 04/01/12 | | 725,165 |
| Missouri State Development Finance Board Infrastructure Facilities (Hartman Heritage Center Phase II) (AMBAC) (AAA/Aaa) |
| 300,000 | | 5.000 | | | 04/01/13 | | 317,220 |
| 1,240,000 | | 5.000 | | | 04/01/21 | | 1,295,874 |
| Missouri State Development Finance Board Infrastructure Facilities Revenue Bonds (Hartman Heritage Centre Project) Series A (AMBAC) (NR/Aaa) |
| 1,430,000 | | 5.550 | | | 04/01/12 | | 1,478,062 |
| Missouri State Development Finance Board Infrastructure Facilities Revenue Bonds (Riverside-Quindaro L-385 Project) (NR/NR)(a) |
| 530,000 | | 5.200 | | | 03/01/10 | | 550,840 |
| 1,035,000 | | 5.300 | | | 03/01/10 | | 1,078,449 |
| 680,000 | | 5.600 | | | 03/01/10 | | 713,973 |
| Missouri State Environmental Improvement & Energy Resources Authority Pollution Control Revenue Bonds (Tri-County Water Authority Project) (Radian) (AA/NR) |
| 445,000 | | 5.600 | | | 04/01/11 | | 460,944 |
| 1,500,000 | | 6.000 | | | 04/01/22 | | 1,556,850 |
| Missouri State Environmental Improvement & Energy Resources Authority Water Facilities Revenue Bonds (Refunding) (Tri-County Water Authority Project) (Radian) (AA/NR) |
| 425,000 | | 5.500 | | | 04/01/09 | | 437,312 |
| 450,000 | | 5.550 | | | 04/01/10 | | 462,024 |
| 80,000 | | 5.750 | | | 04/01/19 | | 82,667 |
| |
| | | | | | | |
Principal
Amount | | Interest
Rate | | | Maturity
Date | | Value |
| Municipal Bond Obligations – (continued) |
Missouri – (continued) | | | | | |
| Missouri State Environmental Improvement & Energy Resources Authority Water Pollution Control Revenue Bonds (Unrefunded Balance State Revolving Series D) (NR/Aaa) |
| $ 170,000 | | 5.125 | % | | 01/01/10 | | $ 173,776 |
| Missouri State Environmental Improvement & Energy Resources Authority Water Pollution Control Revenue Bonds Series A (Unrefunded Balance State Revolving Funds Program) (NR/Aaa) |
| 210,000 | | 5.125 | | | 07/01/11 | | 219,095 |
| 535,000 | | 5.200 | | | 07/01/12 | | 559,032 |
| Missouri State Environmental Improvement & Energy Resources Authority Water Pollution Control Revenue Bonds Series B (State Revolving Funds Program) (NR/Aaa) |
| 1,150,000 | | 5.250 | | | 01/01/11 | | 1,189,974 |
| 1,115,000 | | 5.000 | | | 07/01/17 | | 1,214,937 |
| 2,130,000 | | 5.125 | | | 01/01/18 | | 2,271,304 |
| 725,000 | | 5.000 | | | 01/01/22 | | 762,867 |
| Missouri State Health & Educational Facility Authority Revenue Bonds (St. Anthony’s Medical Center) (ETM) (NR/A2) |
| 270,000 | | 6.250 | | | 12/01/08 | | 280,743 |
| Missouri State Health & Educational Facility Revenue Bonds (Barnes-Jewish, Inc.) (AA/Aa2) |
| 150,000 | | 6.000 | | | 05/15/11 | | 161,591 |
| Missouri State Health & Educational Facility Revenue Bonds (Barnes-Jewish, Inc.) Series A (AMBAC-TCRS) (AAA/Aaa) |
| 1,735,000 | | 5.150 | | | 05/15/10 | | 1,804,001 |
| Missouri State Health & Educational Facility Revenue Bonds (BJC Health Systems) Series A (ETM) (NR/Aaa) |
| 2,000,000 | | 6.750 | | | 05/15/12 | | 2,277,760 |
| Missouri State Health & Educational Facility Revenue Bonds (Central Institute for the Deaf) (Radian) (AA/NR)(a) |
| 1,000,000 | | 5.850 | | | 01/01/10 | | 1,055,250 |
| Missouri State Health & Educational Facility Revenue Bonds (Children’s Mercy Hospital) (A+/NR) |
| 280,000 | | 5.000 | | | 05/15/12 | | 285,832 |
| 35,000 | | 5.250 | | | 05/15/18 | | 35,642 |
| Missouri State Health & Educational Facility Revenue Bonds (Lake Regional Health System Project) (BBB+/NR) |
| 510,000 | | 5.000 | | | 02/15/14 | | 528,957 |
| Missouri State Health & Educational Facility Revenue Bonds (Refunding and Improvement-Jefferson Memorial Hospital) (NR/Baa2) |
| 925,000 | | 5.000 | | | 08/15/08 | | 930,180 |
| Missouri State Health & Educational Facility Revenue Bonds (St. Anthony’s Medical Center) (NR/A2)(a) |
| 700,000 | | 6.250 | | | 12/01/10 | | 766,157 |
| Missouri State Health & Educational Facility Revenue Bonds (St. Louis University) (AA-/A1) |
| 1,700,000 | | 5.250 | | | 10/01/10 | | 1,734,442 |
| 1,000,000 | | 5.500 | | | 10/01/12 | | 1,080,880 |
| Missouri State Health & Educational Facility Revenue Bonds (St. Luke’s Episcopal-Presbyterian Hospital) (FSA) (AAA/Aaa) |
| 815,000 | | 4.750 | | | 12/01/10 | | 842,025 |
| |
| | |
| 36 | | The accompanying notes are an integral part of these financial statements. |
COMMERCE MISSOURI TAX-FREE INTERMEDIATE BOND FUND
| | | | | | | |
Principal
Amount | | Interest
Rate | | | Maturity
Date | | Value |
| Municipal Bond Obligations – (continued) |
Missouri – (continued) | | | | | |
| Missouri State Health & Educational Facility Revenue Bonds (St. Lukes Health System) Series A (FSA) (AAA/Aaa) |
| $ 250,000 | | 5.000 | % | | 11/15/10 | | $ 260,248 |
| 2,000,000 | | 5.000 | | | 11/15/14 | | 2,149,140 |
| Missouri State Health & Educational Facility Revenue Bonds (University of Missouri-Columbia Arena Project) (AA+/Aa1) |
| 500,000 | | 5.000 | | | 11/01/17 | | 525,840 |
| Missouri State Health & Educational Facility Revenue Bonds (Washington University) Series A (AAA/Aaa) |
| 1,000,000 | | 5.500 | | | 06/15/11 | | 1,069,680 |
| 1,000,000 | | 5.000 | | | 02/15/17 | | 1,078,050 |
| 1,545,000 | | 5.000 | | | 02/15/20 | | 1,652,702 |
| 120,000 | | 4.750 | | | 11/15/37 | | 121,241 |
| Missouri State Highways & Transportation Commission Redevelopment Revenue Bonds Series A (AAA/Aaa)(a) |
| 450,000 | | 5.000 | | | 02/01/11 | | 470,736 |
| Missouri State Housing Development Community Mortgage Revenue Bonds (Multifamily Housing) Series II (FHA) (AA/NR) |
| 560,000 | | 4.500 | | | 12/01/08 | | 564,138 |
| 690,000 | | 4.650 | | | 12/01/09 | | 699,846 |
| Missouri State Housing Development Community Mortgage Revenue Bonds (Single Family Homeowner Loan A-1) (AMT) (GNMA/FNMA) (AAA/NR) |
| 60,000 | | 5.800 | | | 09/01/11 | | 60,365 |
| 55,000 | | 5.900 | | | 09/01/12 | | 55,328 |
| 60,000 | | 6.000 | | | 09/01/13 | | 60,208 |
| Missouri State Housing Development Community Mortgage Revenue Bonds (Single Family Homeowner Loan B-2) (AMT) (GNMA/FNMA) (AAA/NR) |
| 40,000 | | 5.200 | | | 03/01/08 | | 40,000 |
| Missouri State Housing Development Community Mortgage Revenue Bonds (Single Family Homeowner Series C-2) (AMT) (GNMA/FNMA) (AAA/NR) |
| 40,000 | | 4.900 | | | 09/01/07 | | 40,010 |
| 40,000 | | 5.000 | | | 03/01/08 | | 40,062 |
| Missouri State Housing Development Community Mortgage Revenue Bonds (Single Family Homeowner Series E-1) (AMT) (GNMA/FNMA) (AAA/NR) |
| 50,000 | | 5.000 | | | 03/01/12 | | 50,931 |
| 50,000 | | 5.000 | | | 09/01/12 | | 50,931 |
| Missouri State Regional Convention & Sports Complex Authority Revenue Bonds (Refunding Convention & Sports Facilities Project) Series A-1 (AMBAC) (AAA/Aaa) |
| 2,000,000 | | 5.250 | | | 08/15/12 | | 2,148,420 |
| Missouri State Stormwater Control GO Bonds Series A (AAA/Aaa) |
| 300,000 | | 5.250 | | | 08/01/16 | | 321,966 |
| Missouri State Water Pollution Control GO Bonds Series A (AAA/Aaa) |
| 475,000 | | 7.000 | | | 06/01/10 | | 520,766 |
| Monarch-Chesterfield MO Levee District Revenue Bonds (MBIA) (AAA/Aaa) |
| 1,000,000 | | 5.450 | | | 03/01/14 | | 1,054,980 |
| |
| | | | | | | |
Principal
Amount | | Interest
Rate | | | Maturity
Date | | Value |
| Municipal Bond Obligations – (continued) |
Missouri – (continued) | | | | | |
| New Liberty Hospital District Revenue Bonds (MBIA) (NR/Aaa) |
| $ 515,000 | | 5.000 | % | | 12/01/10 | | $ 525,867 |
| 850,000 | | 5.125 | | | 12/01/12 | | 866,932 |
| Nixa MO Electric System Revenue Bonds (XLCA) (AAA/Aaa) |
| 1,000,000 | | 4.750 | | | 04/01/15 | | 1,047,680 |
| North Kansas City MO Hospital Revenue Bonds (North Kansas City Hospital) Series A (FSA) (AAA/Aaa) |
| 1,000,000 | | 5.000 | | | 11/15/18 | | 1,058,160 |
| 1,000,000 | | 5.000 | | | 11/15/19 | | 1,053,460 |
| North Kansas City MO School District No. 74 Direct Deposit Program GO Bonds (Refunding & Improvements) (AA+/Aa1) |
| 625,000 | | 4.500 | | | 03/01/15 | | 653,062 |
| North Kansas City MO School District No. 74 GO Bonds (Refunding and Improvement-State Aid Direct Deposit) (AA+/Aa1) |
| 500,000 | | 5.000 | | | 03/01/25 | | 529,500 |
| Northwest Missouri State University Revenue Bonds (Housing System) (MBIA) (NR/Aaa) |
| 2,875,000 | | 5.000 | | | 06/01/20 | | 3,028,669 |
| O’ Fallon MO Certificates of Participation (MBIA) (NR/Aaa) |
| 1,000,000 | | 5.000 | | | 02/01/22 | | 1,044,520 |
| OTC Public Building Corp. MO Leasehold Revenue Bonds (Refunding & Improvement-Ozarks College Project) (FSA) (AAA/Aaa) |
| 740,000 | | 4.900 | | | 03/01/16 | | 768,705 |
| Pike County MO Certificates of Participation (NR/NR) |
| 720,000 | | 5.625 | | | 12/01/19 | | 758,527 |
| Platte County MO GO Bonds for Parkville Neighborhood Improvement Series B (MBIA) (NR/Aaa) |
| 2,720,000 | | 5.000 | | | 02/01/22 | | 2,886,437 |
| Raytown MO Sewer Revenue Bonds (NR/NR) |
| 200,000 | | 4.700 | | | 07/01/27 | | 198,700 |
| Ritenour MO Consolidated School District GO Bonds (Refunding Series A) (FGIC) (AAA/Aaa) |
| 495,000 | | 9.500 | | | 02/01/08 | | 516,102 |
| Ritenour School District Direct Deposit Program GO Bonds (AA+/NR) |
| 1,260,000 | | 4.500 | | | 03/01/16 | | 1,320,745 |
| 1,740,000 | | 4.500 | | | 03/01/17 | | 1,809,339 |
| Riverside-Quindaro MO Bend Levee District Project Revenue Bonds Series L (Radian) (AA/NR) |
| 450,000 | | 5.500 | | | 03/01/14 | | 489,114 |
| 350,000 | | 5.500 | | | 03/01/15 | | 383,243 |
| Scott County MO Public Facilities Authority Leasehold Revenue Bonds (AMBAC) (NR/Aaa) |
| 500,000 | | 4.850 | | | 12/01/08 | | 502,530 |
| Springfield MO Public Utility Revenue Certificates of Participation (Lease Purchase for Various Projects) Series A (MBIA) (AAA/Aaa) |
| 1,000,000 | | 5.000 | | | 12/01/18 | | 1,079,510 |
| |
| | |
| The accompanying notes are an integral part of these financial statements. | | 37 |
COMMERCE MISSOURI TAX-FREE INTERMEDIATE BOND FUND
Schedule of Investments (continued)
April 30, 2007 (Unaudited)
| | | | | | | |
Principal
Amount | | Interest
Rate | | | Maturity
Date | | Value |
| Municipal Bond Obligations – (continued) |
Missouri – (continued) | | | | | |
| Springfield MO Special Obligation Revenue Bonds (College Station Garage Project) Series A (A1/NR) |
| $ 610,000 | | 4.500 | % | | 11/01/20 | | $ 615,581 |
| 645,000 | | 4.750 | | | 11/01/21 | | 660,512 |
| 685,000 | | 4.750 | | | 11/01/22 | | 699,173 |
| Springfield MO Special Obligation Revenue Bonds (Heers Garage Project) Series B (A1/NR) |
| 385,000 | | 4.750 | | | 11/01/21 | | 394,259 |
| 405,000 | | 4.750 | | | 11/01/22 | | 413,379 |
| St. Charles County MO Community College GO Bonds (Refunding) (MBIA) (NR/Aaa) |
| 2,585,000 | | 5.000 | | | 02/15/17 | | 2,825,276 |
| St. Charles MO Certificates of Participation Series B (NR/A2) |
| 200,000 | | 5.000 | | | 05/01/09 | | 202,686 |
| St. Charles MO Community College Educational Facilities Authority Leasehold Revenue Bonds (NR/Aa3) |
| 350,000 | | 5.250 | | | 06/01/19 | | 373,170 |
| 735,000 | | 5.200 | | | 06/01/24 | | 776,351 |
| St. Louis County MO Certificates of Participation Capital Improvement Projects (AA+/Aa2) |
| 300,000 | | 4.400 | | | 05/15/11 | | 303,720 |
| St. Louis County MO Industrial Development Authority Health Facilities Revenue Bonds (Refunding-Ranken Jordan Project) (NR/NR) |
| 490,000 | | 5.000 | | | 11/15/15 | | 505,685 |
| 515,000 | | 5.000 | | | 11/15/16 | | 529,786 |
| St. Louis County MO Mortgage Revenue Bonds (Certificates Receipts-GNMA Collateral) Series F (AMT) (ETM) (AAA/NR) |
| 500,000 | | 5.200 | | | 07/01/07 | | 501,110 |
| St. Louis County MO Rockwood School District No. R-6 GO Bonds (AA+/NR) |
| 2,500,000 | | 5.250 | | | 02/01/11 | | 2,631,500 |
| St. Louis County MO Rockwood School District No. R6 GO Bonds Series A (AA+/NR) |
| 1,865,000 | | 5.000 | | | 02/01/14 | | 1,980,406 |
| St. Louis County MO School District No. R6 Direct Deposit Program GO Bonds (AA+/NR) |
| 1,000,000 | | 5.000 | | | 02/01/13 | | 1,045,370 |
| St. Louis MO Airport Revenue Bonds (Airport Development Program) Series A (MBIA) (AAA/Aaa)(a) |
| 525,000 | | 5.625 | | | 07/01/11 | | 564,244 |
| St. Louis MO Airport Revenue Bonds (Prerefunded) Airport Development Program Series A (ETM) (MBIA) (AAA/Aaa) |
| 615,000 | | 5.000 | | | 07/01/11 | | 646,267 |
| St. Louis MO Board of Education GO Bonds Series B (State Aid Direct Deposit) (FGIC) (AAA/Aaa)(a) |
| 300,000 | | 5.500 | | | 04/01/08 | | 305,028 |
| St. Louis MO GO Bonds (Public Safety) (FGIC) (AAA/Aaa)(a) |
| 3,000,000 | | 5.125 | | | 08/15/09 | | 3,096,600 |
| St. Louis MO Municipal Finance Corp. Leasehold Revenue Bonds (Refunding City Justice Center) Series A (AMBAC) (NR/Aaa) |
| 700,000 | | 5.250 | | | 02/15/15 | | 743,344 |
| |
| | | | | | | |
Principal
Amount | | Interest
Rate | | | Maturity
Date | | Value |
| Municipal Bond Obligations – (continued) |
Missouri – (continued) | | | | | |
| St. Louis MO Municipal Finance Corp. Leasehold Revenue Bonds (Refunding Civil Centers Building Project Series A) (FSA) (AAA/Aaa) |
| $ 400,000 | | 5.000 | % | | 08/01/12 | | $ 423,776 |
| St. Louis MO Parking Facility Revenue Bonds (Downtown Parking Facilities Subordinated A) (NR/NR)(a) |
| 900,000 | | 5.500 | | | 02/01/12 | | 955,719 |
| Sullivan MO School District Building Corp. Leasehold Revenue Bonds (Radian) (AA/NR)(a) |
| 275,000 | | 5.250 | | | 03/01/12 | | 293,923 |
| Taney County MO Certificates of Participation (MBIA) (NR/Aaa) |
| 1,095,000 | | 4.500 | | | 04/01/17 | | 1,136,500 |
| Taney County MO Reorganized School District No. R-V GO Bonds (Hollister School District-Refunding & Improvement-MO Direct Deposit Program) (FSA) (AAA/Aaa) |
| 1,100,000 | | 5.000 | | | 03/01/18 | | 1,160,720 |
| 1,050,000 | | 5.000 | | | 03/01/21 | | 1,101,817 |
| Troy MO Reorganized School District No. 3 Lincoln County (Direct Deposit Program) (AA+/NR) |
| 1,000,000 | | 5.000 | | | 03/01/17 | | 1,057,850 |
| University of Missouri Revenue Bonds (Refunding System Facilities Series B) (AA/Aa2) |
| 375,000 | | 5.375 | | | 11/01/14 | | 400,950 |
| Washington MO School District Direct Deposit GO Bonds (Refunding) (FSA) (AAA/Aaa) |
| 1,000,000 | | 5.250 | | | 03/01/13 | | 1,080,540 |
| | | | | | | |
| | | | | | | 152,177,248 |
| |
Puerto Rico – 1.1% | | | | | |
| Puerto Rico Commonwealth GO Bonds (Public Improvement) Series A (BBB/Baa3) |
| 1,000,000 | | 5.250 | | | 07/01/14 | | 1,068,171 |
| Puerto Rico Electric Power Authority Revenue Bonds (Refunding) (MBIA) (AAA/Aaa) |
| 555,000 | | 5.000 | | | 07/01/22 | | 617,609 |
| | | | | | | |
| | | | | | | 1,685,780 |
| |
| TOTAL MUNICIPAL BOND OBLIGATIONS |
(Cost $151,489,723) | | $154,922,148 |
| |
| | | | | | | | |
| |
| Repurchase Agreement(b) – 0.8% | |
| State Street Bank & Trust Co. | |
| $ 1,291,000 | | 4.690 | % | | 05/01/07 | | $ 1,291,000 | |
Maturity Value: $1,291,168 | | | |
(Cost $1,291,000) | | | |
| | |
| TOTAL INVESTMENTS – 100.8% | |
(Cost $152,780,723) | | | | | | | $156,213,148 | |
| Liabilities in excess of other assets – (0.8)% | | (1,252,635 | ) |
| | |
| Net Assets – 100.0% | | $154,960,513 | |
| | |
| | | | | | |
| The percentage shown for each investment category reflects the value of investments in that category as a percentage of net assets. |
| | |
| 38 | | The accompanying notes are an integral part of these financial statements. |
COMMERCE MISSOURI TAX-FREE INTERMEDIATE BOND FUND
| | | | | | |
| (a) | | Prerefunded security. Maturity date disclosed is prerefunding date. |
| (b) | | Repurchase agreement was entered into on April 30, 2007. This agreement was fully collateralized by $970,000 U.S. Treasury Bond, 8.00% due 11/15/21 with a market value of $1,319,200. |
| | | | | | |
| Security ratings disclosed are issued by Standard & Poor’s Ratings Services/Moody’s Investors Service. A description of the ratings is available in the Fund’s Statement of Additional Information. |
| | | | |
| |
| Investment Abbreviations: |
| AMBAC | | — | | Insuredby American Municipal Bond Assurance Corp. |
| AMT | | — | | AlternativeMinimum Tax |
| ETM | | — | | Escrowto Maturity |
| FGIC | | — | | Insuredby Financial Guaranty Insurance Co. |
| FHA | | — | | Insuredby Federal Housing Administration |
| FNMA | | — | | Insuredby Federal National Mortgage Association |
| FSA | | — | | Insuredby Financial Security Assurance Co. |
| GNMA | | — | | Insuredby Government National Mortgage Association |
| GO | | — | | GeneralObligation |
| MBIA | | — | | Insuredby Municipal Bond Investors Assurance |
| NR | | — | | NotRated |
| Radian | | — | | Insuredby Radian Asset Assurance |
| TCRS | | — | | TransferableCustodial Receipts |
| XLCA | | — | | Insuredby XL Capital Assurance, Inc. |
| |
PORTFOLIO COMPOSITION
| | | | | | |
| Sector Allocation | | AS OF
04/30/07 | | | AS OF
10/31/06 | |
| | |
General Obligations | | 29.3 | % | | 30.4 | % |
Lease | | 18.3 | | | 17.4 | |
Prerefunded Escrow to Maturity | | 15.3 | | | 12.2 | |
Water/Sewer | | 12.6 | | | 12.5 | |
Hospital | | 9.0 | | | 10.4 | |
Education | | 8.2 | | | 8.0 | |
General | | 3.5 | | | 3.4 | |
Student | | 1.4 | | | 1.3 | |
Power | | 1.2 | | | 1.2 | |
Multi Family Housing | | 0.8 | | | 0.8 | |
Repurchase Agreement | | 0.8 | | | 0.2 | |
Single Family Housing | | 0.3 | | | 0.3 | |
Higher Education | | 0.1 | | | 0.1 | |
Transportation | | 0.0 | | | 1.2 | |
Crossover | | 0.0 | | | 0.4 | |
| | |
The percentage shown for each investment category reflects the value of investments in that category as a percentage of net assets.
The Fund is actively managed and, as such, its composition may differ over time.
| | |
| The accompanying notes are an integral part of these financial statements. | | 39 |
COMMERCE KANSAS TAX-FREE INTERMEDIATE BOND FUND
Kansas Tax-Free Intermediate Bond Fund
Performance Review(1) (Unaudited)
For the six months ended April 30, 2007, the Institutional Shares of the Fund had a total return of 1.23%, based on Net Asset Value (NAV). This compares to the Lehman 3-15 Year Blend Index(2) six-month return of 1.43%. Past performance is no guarantee of future results.
Schedule of Investments
April 30, 2007 (Unaudited)
| | | | | | | |
Principal
Amount | | Interest
Rate | | | Maturity
Date | | Value |
| Municipal Bond Obligations – 97.0% |
Illinois – 5.4% | | |
| Lake County IL School District No. 79-Fremont Series B (FSA) (NR/Aaa) |
| $1,380,000 | | 5.000 | % | | 12/01/21 | | $ 1,483,183 |
| 1,000,000 | | 5.000 | | | 12/01/22 | | 1,072,300 |
| Rosemont IL GO Bonds (Refunding Series A) (FGIC) (AAA/Aaa) |
| 1,070,000 | | 5.000 | | | 12/01/19 | | 1,132,584 |
| | | | | | | |
| | | | | | | 3,688,067 |
| |
Kansas – 86.6% | | |
| Augusta KS Electric Systems Revenue Bonds (AMBAC) (AAA/Aaa) |
| 1,000,000 | | 4.750 | | | 08/01/17 | | 1,040,390 |
| Cowley County KS Community College Dormitory Revenue Bonds (Refunding) (NR/NR) |
| 410,000 | | 5.000 | | | 03/01/12 | | 422,731 |
| Crawford County KS Unified School District GO Bonds (FSA) (NR/Aaa)(a) |
| 545,000 | | 4.600 | | | 09/01/09 | | 556,549 |
| Derby KS GO Bonds (Refunding Series B) (AMBAC) (NR/Aaa) |
| 440,000 | | 5.000 | | | 12/01/13 | | 462,924 |
| Derby KS GO Bonds Series A (AMBAC) (NR/Aaa)(a) |
| 310,000 | | 4.900 | | | 12/01/11 | | 325,925 |
| Derby KS Water Systems Revenue Bonds (Refunding & Improvement Series 2) (AMBAC) (AAA/Aaa)(a) |
| 500,000 | | 5.600 | | | 10/01/09 | | 522,175 |
| Dodge City KS Unified School District No. 443 GO Bonds (Refunding) (FGIC) (NR/Aaa) |
| 1,450,000 | | 5.000 | | | 03/01/12 | | 1,533,230 |
| Douglas County KS GO Bonds (Refunding Sales Tax Series A) (AMBAC) (NR/Aaa) |
| 1,000,000 | | 5.000 | | | 08/01/12 | | 1,061,890 |
| Harvey County KS School District No. 373 GO Bonds (Refunding & Improvement) (FSA) (AAA/Aaa) |
| 495,000 | | 5.000 | | | 09/01/15 | | 537,040 |
| |
| | | | | | | |
Principal
Amount | | Interest
Rate | | | Maturity
Date | | Value |
| Municipal Bond Obligations – (continued) |
Kansas – (continued) | | |
| Johnson County KS Community College Certificate of Participation (Improvement) (NR/Aaa) |
| $ 765,000 | | 4.000 | % | | 04/01/13 | | $ 775,197 |
| Johnson County KS GO Bonds (Internal Improvement Series A) (AAA/Aaa) |
| 1,000,000 | | 5.000 | | | 09/01/21 | | 1,053,880 |
| Johnson County KS Unified School District No. 231 GO Bonds (Refunding & Improvement Series A) (FGIC) (AAA/Aaa) |
| 500,000 | | 6.000 | | | 10/01/16 | | 584,605 |
| 1,770,000 | | 5.000 | | | 10/01/18 | | 1,890,679 |
| Johnson County KS Unified School District No. 231 GO Bonds (Refunding & Improvement Series A) (FSA) (AAA/Aaa) |
| 155,000 | | 4.500 | | | 04/01/11 | | 159,644 |
| 375,000 | | 5.125 | (a) | | 04/01/11 | | 394,699 |
| 260,000 | | 4.500 | | | 10/01/12 | | 267,693 |
| 625,000 | | 5.125 | | | 10/01/16 | | 655,737 |
| Johnson County KS Unified School District No. 231 GO Bonds (Refunding & Improvement Series B) (AMBAC) (AAA/NR) |
| 925,000 | | 5.000 | | | 10/01/22 | | 990,925 |
| 975,000 | | 5.000 | | | 10/01/23 | | 1,042,909 |
| Johnson County KS Unified School District No. 233 GO Bonds (Refunding Series B) (FGIC) (AAA/Aaa) |
| 500,000 | | 5.500 | | | 09/01/17 | | 569,270 |
| Johnson County KS Unified School District No. 512 GO Bonds (Shawnee Mission Series A) (NR/Aa1) |
| 400,000 | | 4.400 | | | 10/01/12 | | 403,804 |
| Johnson County KS Water District No. 001 Revenue Bonds (AAA/Aaa) |
| 735,000 | | 5.000 | | | 12/01/10 | | 767,730 |
| Johnson County KS Water District No. 001 Revenue Bonds (Refunding) (ADFA GTD) (AAA/Aaa) |
| 275,000 | | 5.000 | | | 12/01/19 | | 289,743 |
| Junction City KS GO Bonds Series C (NR/NR) |
| 500,000 | | 5.000 | | | 08/01/07 | | 501,495 |
| |
(1) | | Returns assume fee waivers and expense reductions and are not annualized. Returns do not reflect the deduction of taxes that a shareholder would pay on Fund distributions or the redemption of Fund shares. |
(2) | | The Lehman 3-15 Year Blend Index is an unmanaged index composed of investment grade municipal securities ranging from 2 to 17 years in maturity. The Index figures do not reflect the deduction of any fees, expenses or taxes. |
| | |
| 40 | | The accompanying notes are an integral part of these financial statements. |
COMMERCE KANSAS TAX-FREE INTERMEDIATE BOND FUND
| | | | | | | |
Principal
Amount | | Interest
Rate | | | Maturity
Date | | Value |
| Municipal Bond Obligations – (continued) |
Kansas – (continued) | | |
| Kansas State Department of Transportation Highway Revenue Bonds (AAA/Aa2)(a) |
| $ 800,000 | | 5.250 | % | | 09/01/09 | | $ 828,456 |
| Kansas State Department of Transportation Highway Revenue Bonds (ETM) (AAA/Aa2) |
| 760,000 | | 6.125 | | | 09/01/09 | | 801,739 |
| Kansas State Department of Transportation Highway Revenue Bonds (Refunding) (ETM) (AAA/Aa2) |
| 300,000 | | 5.500 | | | 09/01/12 | | 326,181 |
| Kansas State Department of Transportation Highway Revenue Bonds Series A (AAA/Aa2)(a) |
| 340,000 | | 5.000 | | | 09/01/10 | | 354,243 |
| Kansas State Development Finance Authority Lease Revenue Bonds (Juvenile Justice Authority Series D) (MBIA) (AAA/Aaa) |
| 1,270,000 | | 5.250 | | | 05/01/13 | | 1,344,892 |
| Kansas State Development Finance Authority Lease Revenue Bonds (State Capitol Project V-I-A) (FSA) (AAA/Aaa)(a) |
| 500,000 | | 5.000 | | | 10/01/10 | | 521,450 |
| Kansas State Development Finance Authority Revenue Bonds (Athletic Facilities Series R) (A/NR) |
| 350,000 | | 5.000 | | | 07/01/14 | | 355,187 |
| Kansas State Development Finance Authority Revenue Bonds (Board of Regents University Housing Series A) (MBIA) (AAA/Aaa) |
| 1,150,000 | | 5.000 | | | 04/01/24 | | 1,216,895 |
| Kansas State Development Finance Authority Revenue Bonds (El Dorado Department of Corrections Refunding Project A1) (MBIA) (AAA/Aaa) |
| 200,000 | | 5.000 | | | 08/01/10 | | 205,496 |
| Kansas State Development Finance Authority Revenue Bonds (El Dorado Department of Corrections Refunding Project A1) (MBIA) (AAA/Aaa) |
| 400,000 | | 5.000 | | | 02/01/12 | | 410,816 |
| Kansas State Development Finance Authority Revenue Bonds (Juvenile Justice Authority Series D) (MBIA) (AAA/Aaa) |
| 400,000 | | 5.000 | | | 05/01/12 | | 417,936 |
| Kansas State Development Finance Authority Revenue Bonds (Kansas State Projects Series J) (AMBAC) (AAA/Aaa)(a) |
| 450,000 | | 5.000 | | | 08/01/13 | | 482,328 |
| Kansas State Development Finance Authority Revenue Bonds (Kansas State Projects Series J) (Unrefunded Balance) (AMBAC) (AAA/Aaa) |
| 1,600,000 | | 5.000 | | | 08/01/17 | | 1,702,096 |
| Kansas State Development Finance Authority Revenue Bonds (Kansas State Projects Series W) (ETM) (MBIA) (AAA/Aaa) |
| 20,000 | | 4.000 | | | 10/01/11 | | 20,266 |
| Kansas State Development Finance Authority Revenue Bonds (Public Water Supply Loan-2) (MBIA-IBC) (AAA/Aaa)(a) |
| 575,000 | | 5.250 | | | 04/01/08 | | 583,360 |
| Kansas State Development Finance Authority Revenue Bonds (Public Water Supply Revolving Loan-2) (NR/Aa1)(a) |
| 600,000 | | 5.000 | | | 04/01/08 | | 607,392 |
| |
| | | | | | | |
Principal
Amount | | Interest
Rate | | | Maturity
Date | | Value |
| Municipal Bond Obligations – (continued) |
Kansas – (continued) | | |
| Kansas State Development Finance Authority Revenue Bonds (Public Water Supply Revolving Loan-2) (AMBAC) (AAA/Aaa)(a) |
| $ 705,000 | | 5.500 | % | | 04/01/12 | | $ 762,147 |
| Kansas State Development Finance Authority Revenue Bonds (Refunding-Wichita State University Housing System-P) (AMBAC) (AAA/Aaa) |
| 600,000 | | 5.000 | | | 06/01/13 | | 634,368 |
| 630,000 | | 5.000 | | | 06/01/14 | | 664,896 |
| 300,000 | | 5.000 | | | 06/01/16 | | 316,191 |
| Kansas State Development Finance Authority Revenue Bonds (Transportation Revolving Fund Trust) (AA/Aa1) |
| 1,105,000 | | 5.000 | | | 10/01/21 | | 1,184,041 |
| Kansas State Development Finance Authority Revenue Bonds (University of Kansas Athletic Facilities Refunding Series K) (A/A1) |
| 1,015,000 | | 5.000 | | | 06/01/17 | | 1,074,428 |
| Kansas State Development Finance Authority Revenue Bonds (Water Pollution Control Revolving Fund II) (AAA/Aaa) |
| 280,000 | | 5.500 | | | 05/01/17 | | 318,279 |
| Lawrence KS Hospital Revenue Bonds (Lawrence Memorial Hospital) (Radian) (AA/Aa3)(a) |
| 350,000 | | 5.750 | | | 07/01/09 | | 365,197 |
| Lawrence KS Hospital Revenue Bonds (Refunding Lawrence Memorial Hospital) (NR/A3) |
| 550,000 | | 5.250 | | | 07/01/10 | | 570,031 |
| 1,000,000 | | 5.375 | | | 07/01/14 | | 1,069,300 |
| 700,000 | | 5.375 | | | 07/01/15 | | 746,942 |
| Leavenworth County KS Unified School District No. 464 Tonganoxie GO Bonds (Improvement Series A) (MBIA) (AAA/Aaa) |
| 150,000 | | 5.000 | | | 09/01/20 | | 160,857 |
| McPherson KS GO Bonds (Refunding & Improvement Series 125) (AMBAC) (AAA/Aaa) |
| 790,000 | | 5.000 | | | 08/01/08 | | 802,719 |
| Olathe KS Educational Facilities Revenue Bonds (Kansas Independent Series C) (NR/NR) |
| 500,000 | | 5.400 | | | 10/01/13 | | 506,340 |
| Olathe KS Health Facilities Revenue Bonds (Medical Center Project Series A) (AMBAC) (AAA/Aaa) |
| 500,000 | | 5.500 | | | 09/01/10 | | 526,625 |
| Osage City KS Electric Utility Systems Revenue Bonds (Refunding & Improvement) (NR/NR)(a) |
| 1,000,000 | | 6.150 | | | 12/01/09 | | 1,059,420 |
| Overland Park KS GO Bonds (Refunding for Internal Improvement Series B) (AAA/Aaa) |
| 995,000 | | 4.000 | | | 09/01/17 | | 1,005,000 |
| Pittsburg KS GO Bonds (Refunding) (FSA) (NR/Aaa) |
| 600,000 | | 5.500 | | | 09/01/11 | | 645,774 |
| Pratt KS Electric Utility Systems Revenue Bonds Series 2001-1 (AMBAC) (AAA/Aaa)(a) |
| 725,000 | | 4.850 | | | 05/01/10 | | 749,469 |
| |
| | |
| The accompanying notes are an integral part of these financial statements. | | 41 |
COMMERCE KANSAS TAX-FREE INTERMEDIATE BOND FUND
Schedule of Investments (continued)
April 30, 2007 (Unaudited)
| | | | | | | |
Principal
Amount | | Interest
Rate | | | Maturity
Date | | Value |
| Municipal Bond Obligations – (continued) |
Kansas – (continued) | | |
| Reno County KS Unified School District No. 308 Hutchinson GO Bonds Series A (MBIA) (NR/Aaa) |
| $ 500,000 | | 4.500 | % | | 09/01/22 | | $ 505,330 |
| Saline County KS Unified School District No. 305 Salina GO Bonds (FSA) (NR/Aaa) |
| 230,000 | | 5.500 | | | 09/01/16 | | 245,171 |
| Saline County KS Unified School District No. 305 Salina GO Bonds (Unrefunded Balance) (FSA) (NR/Aaa) |
| 70,000 | | 5.500 | | | 09/01/16 | | 74,848 |
| Scott County KS Unified School District No. 466 GO Bonds (Refunding) (FGIC) (AAA/Aaa) |
| 670,000 | | 5.250 | | | 09/01/12 | | 720,438 |
| 680,000 | | 5.250 | (a) | | 09/01/14 | | 729,150 |
| Sedgwick & Shawnee County KS Single Family Revenue Bonds (Mortgage Backed Securities Program Series A-2) (AMT) (GNMA) (NR/Aaa) |
| 110,000 | | 5.800 | | | 06/01/17 | | 111,113 |
| Sedgwick County KS GO Bonds Series A (AA+/Aa1) |
| 205,000 | | 4.150 | | | 08/01/10 | | 207,911 |
| Sedgwick County KS Unified School District No. 259 GO Bonds (AA/Aa3) |
| 500,000 | | 5.250 | | | 09/01/10 | | 523,550 |
| Sedgwick County KS Unified School District No. 265 GO Bonds (FGIC) (NR/Aaa) |
| 500,000 | | 5.500 | | | 10/01/09 | | 520,795 |
| Shawnee County KS GO Bonds (Refunding & Improvement Series A) (NR/A1) |
| 300,000 | | 4.900 | (a) | | 09/01/08 | | 304,881 |
| 490,000 | | 5.000 | | | 09/01/08 | | 498,090 |
| 250,000 | | 5.250 | | | 09/01/09 | | 257,765 |
| Shawnee County KS Unified School District No. 501 GO Bonds (NR/Aa3) |
| 1,500,000 | | 5.000 | | | 02/01/12 | | 1,585,395 |
| Topeka KS GO Bonds Series A (XLCA) (NR/Aaa) |
| 100,000 | | 4.000 | | | 08/15/16 | | 100,611 |
| Topeka KS Water & Water Pollution Control Utility Revenue Bonds Series A (FGIC) (NR/Aaa)(a) |
| 565,000 | | 5.500 | | | 08/01/08 | | 583,249 |
| University of Kansas Hospital Authority Health Facilities Revenue Bonds (Kansas University Health System) (ETM) (AAA/NR) |
| 200,000 | | 5.500 | | | 09/01/11 | | 214,346 |
| University of Kansas Hospital Authority Health Facilities Revenue Bonds (Kansas University Health System) (ETM) (AAA/NR) |
| 1,000,000 | | 6.000 | (a) | | 09/01/12 | | 1,110,230 |
| Wichita KS GO Bonds (Sales Tax) (AA/Aa2) |
| 1,285,000 | | 5.000 | | | 04/01/11 | | 1,347,181 |
| 1,000,000 | | 5.000 | | | 04/01/14 | | 1,032,130 |
| Wichita KS GO Bonds Series 766 (AA/Aa2) |
| 455,000 | | 4.300 | | | 09/01/10 | | 462,821 |
| Wichita KS Hospital Revenue Bonds (Refunding Facilities Improvement Series XI) (A+/NR) |
| 1,500,000 | | 6.750 | | | 11/15/14 | | 1,624,455 |
| |
| | | | | | | |
Principal
Amount | | Interest
Rate | | | Maturity
Date | | Value |
| Municipal Bond Obligations – (continued) |
Kansas – (continued) | | |
| Wyandotte County Kansas City KS Unified Government GO Bonds (Refunding Series A) (FSA) (AAA/Aaa)(a) |
| $1,000,000 | | 5.000 | % | | 09/01/11 | | $ 1,052,320 |
| Wyandotte County KS Revenue Bonds (Refunding & Improvement) (MBIA) (AAA/Aaa) |
| 600,000 | | 4.400 | | | 09/01/11 | | 611,472 |
| Wyandotte County KS School District No. 204 GO Bonds Bonner Springs (Prerefunded Series 2000 A) (ETM) (FSA) (NR/Aaa) |
| 215,000 | | 6.375 | | | 09/01/11 | | 238,063 |
| Wyandotte County KS School District No. 204 GO Bonds Bonner Springs (Prerefunded Series 2000 A) (FSA) (NR/Aaa)(a) |
| 565,000 | | 5.375 | | | 09/01/10 | | 595,250 |
| Wyandotte County KS School District No. 204 GO Bonds Bonner Springs (Refunding & Improvement Series A) (FGIC) (NR/Aaa) |
| 1,595,000 | | 5.000 | | | 09/01/21 | | 1,706,937 |
| Wyandotte County KS School District No. 204 GO Bonds Bonner Springs (Unrefunded Balance Series 2000 A) (FSA) (NR/Aaa) |
| 85,000 | | 6.375 | | | 09/01/11 | | 94,082 |
| Wyandotte County KS Unified School District No. 500 GO Bonds (Refunding) (FSA) (AAA/Aaa) |
| 160,000 | | 5.000 | | | 09/01/12 | | 169,648 |
| Wyandotte County KS Unified School District No. 500 GO Bonds (Refunding) (FSA) (NR/Aaa) |
| 625,000 | | 5.250 | | | 09/01/16 | | 690,931 |
| 1,000,000 | | 5.250 | | | 09/01/20 | | 1,124,800 |
| | | | | | | |
| | | | | | | 59,194,584 |
| |
Missouri – 1.1% | | | | | |
| Kirkwood MO School District Educational Facilities Authority (Leasehold RB for Kirkwood School District R-7 Project Series B) (MBIA) (NR/Aaa) |
| 750,000 | | 5.000 | | | 02/15/19 | | 800,213 |
| |
Puerto Rico – 3.9% | | | | | |
| Puerto Rico Commonwealth GO Bonds (Refunding & Public Improvement Series A) (MBIA) (AAA/Aaa) |
| 475,000 | | 5.500 | | | 07/01/16 | | 536,954 |
| Puerto Rico Commonwealth Highway & Transportation Authority Highway Revenue Bonds (Refunding Series X) (FSA) (AAA/Aaa) |
| 425,000 | | 5.500 | | | 07/01/15 | | 475,269 |
| Puerto Rico Commonwealth Highway & Transportation Authority Highway Revenue Bonds Series Y (A-/Baa2) |
| 500,000 | | 6.250 | | | 07/01/13 | | 562,315 |
| Puerto Rico Commonwealth Highway & Transportation Authority Revenue Bonds Series G (FGIC) (AAA/Aaa) |
| 345,000 | | 5.250 | | | 07/01/13 | | 370,075 |
| 655,000 | | 5.250 | | | 07/01/21 | | 711,572 |
| | | | | | | |
| | | | | | | 2,656,185 |
| |
| TOTAL MUNICIPAL BOND OBLIGATIONS |
(Cost $65,138,647) | | | | | $66,339,049 |
| |
|
| | |
| 42 | | The accompanying notes are an integral part of these financial statements. |
COMMERCE KANSAS TAX-FREE INTERMEDIATE BOND FUND
| | | | | | | |
Principal
Amount | | Interest
Rate | | | Maturity
Date | | Value |
| Repurchase Agreement(b) – 2.4% |
| State Street Bank & Trust Co. |
| $1,623,000 | | 4.690 | % | | 05/01/07 | | $ 1,623,000 |
Maturity Value: $1,623,211 |
(Cost $1,623,000) | | | | | |
| |
| TOTAL INVESTMENTS – 99.4% | | |
(Cost $66,761,647) | | | | | $67,962,049 |
| Other assets in excess of liabilities – 0.6% | | 379,248 |
| |
| Net Assets – 100.0% | | $68,341,297 |
| |
| | | | | | |
| The percentage shown for each investment category reflects the value of investments in that category as a percentage of net assets. |
| | | | | | |
| (a) | | Prerefunded security. Maturity date disclosed is prerefunding date. |
| (b) | | Repurchase agreement was entered into on April 30, 2007. This agreement was fully collateralized by $1,220,000 U.S. Treasury Bond, 8.000% due 11/15/21 with a market value of $1,659,200. |
| Security ratings disclosed are issued by Standard & Poor’s Ratings Services/Moody’s Investors Service. A description of the ratings is available in the Fund’s Statement of Additional Information. |
| | |
| |
| Investment Abbreviations: |
| AMBAC | | —Insuredby American Municipal Bond Assurance Corp. |
| AMT | | —AlternativeMinimum Tax |
| ETM | | —Escrowto Maturity |
| FGIC | | —Insuredby Financial Guaranty Insurance Co. |
| FSA | | —Insuredby Financial Security Assurance Co. |
| GNMA | | —Insuredby Government National Mortgage Association |
| GO | | —GeneralObligation |
| GTD | | —Guaranteed |
| MBIA | | —Insuredby Municipal Bond Investors Assurance |
| MBIA-IBC | | —Insuredby Municipal Bond Investors Assurance - Insured Bond Certificates |
| NR | | —NotRated |
| Radian | | —Insuredby Radian Asset Assurance |
| XLCA | | —Insuredby XL Capital Assurance, Inc. |
| |
PORTFOLIO COMPOSITION
| | | | | | |
| Sector Allocation | | AS OF
04/30/07 | | | AS OF
10/31/06 | |
| | |
General Obligations | | 48.1 | % | | 49.7 | % |
Prerefunded Escrow to Maturity | | 20.8 | | | 12.6 | |
Hospital | | 6.8 | | | 9.3 | |
Lease | | 6.6 | | | 6.6 | |
Education | | 5.9 | | | 5.9 | |
Transportation | | 4.9 | | | 7.1 | |
Power | | 2.4 | | | 3.5 | |
Repurchase Agreement | | 2.4 | | | 2.1 | |
Water/Sewer | | 0.9 | | | 6.0 | |
Municipals | | 0.4 | | | 0.0 | |
Single Family Housing | | 0.2 | | | 0.2 | |
| | |
The percentage shown for each investment category reflects the value of investments in that category as a percentage of net assets.
The Fund is actively managed and, as such, its composition may differ over time.
| | |
| The accompanying notes are an integral part of these financial statements. | | 43 |
COMMERCE FUNDS
Statements of Assets and Liabilities
April 30, 2007 (Unaudited)
| | | | | | | | | | | |
| | | Core Equity Fund | | | Growth Fund | | | Value Fund |
Assets: |
Investments in unaffiliated securities, at value (identified cost $98,204,294, $180,138,784, $109,042,156, $89,104,180, $73,473,209, $2,625,681, $534,855,190, $115,919,233, $146,133,930, $152,780,723 and $66,761,647, respectively) | | $ | 121,170,423 | | | $ | 207,418,372 | | | $ | 133,993,415 |
Investments in affiliated securities, at value (identified cost $13,763,359 for Asset Allocation Fund) | | | — | | | | — | | | | — |
Foreign currencies, at value (cost — $2,112,121 for International Equity Fund)(a) | | | — | | | | — | | | | — |
Cash | | | 635,991 | | | | 499 | | | | 448 |
Receivables: | | | | | | | | | | | |
Interest and dividend, at value | | | 75,541 | | | | 66,938 | | | | 140,243 |
Investment securities sold, at value | | | 179,532 | | | | 6,213,001 | | | | — |
Fund shares sold | | | 237 | | | | 153,336 | | | | 112,763 |
Reimbursement from adviser | | | — | | | | 1,977 | | | | — |
Forward foreign currency exchange contracts, at value | | | — | | | | — | | | | — |
Variation margin | | | — | | | | — | | | | — |
Total Assets | | | 122,061,724 | | | | 213,854,123 | | | | 134,246,869 |
| | | |
| | | | | | | | | | | |
Liabilities: | | | | | | | | | | | |
Payables: | | | | | | | | | | | |
Investment securities purchased, at value | | | — | | | | 7,732,320 | | | | — |
Dividends and distributions | | | — | | | | — | | | | — |
Fund shares redeemed | | | 98,672 | | | | 36,607 | | | | 13,692 |
Advisory fees | | | 75,813 | | | | 125,672 | | | | 82,102 |
Deferred trustee fees | | | 30,970 | | | | 25,761 | | | | 16,423 |
Administrative fees | | | 15,163 | | | | 25,135 | | | | 16,423 |
Forward foreign currency exchange contracts, at value | | | — | | | | — | | | | — |
Accrued expenses | | | 67,420 | | | | 133,984 | | | | 80,161 |
Total Liabilities | | | 288,038 | | | | 8,079,479 | | | | 208,801 |
| | | |
| | | | | | | | | | | |
Net Assets: | | | | | | | | | | | |
Paid-in capital | | | 75,566,114 | | | | 181,519,436 | | | | 102,424,462 |
Accumulated undistributed (distributions in excess of) net investment income (loss) | | | (12,275 | ) | | | 59,508 | | | | 72,804 |
Accumulated net realized gain (loss) on investment, futures and foreign currency related transactions | | | 23,253,718 | | | | (3,083,888 | ) | | | 6,589,543 |
Net unrealized gain (loss) on investments, futures and translation of assets and liabilities denominated in foreign currencies | | | 22,966,129 | | | | 27,279,588 | | | | 24,951,259 |
Net Assets | | $ | 121,773,686 | | | $ | 205,774,644 | | | $ | 134,038,068 |
| | | |
| | | | | | | | | | | |
Shares Outstanding/Net Asset Value: | | | | | | | | | | | |
Total shares outstanding, no par value (unlimited number of shares authorized) | | | 7,412,512 | | | | 7,572,454 | | | | 4,618,518 |
Net asset value (net assets/shares outstanding) | | $ | 16.43 | | | $ | 27.17 | | | $ | 29.02 |
(a) | | Includes $20,471 for the International Equity Fund relating to initial margin requirements for futures transactions. |
| | |
| 44 | | The accompanying notes are an integral part of these financial statements. |
COMMERCE FUNDS
| | | | | | | | | | | | | | | | | | | | | | | | | | | |
MidCap
Growth Fund | | | International
Equity Fund | | | Asset Allocation
Fund | | Bond Fund | | | Short-Term
Government
Fund | | | National
Tax-Free
Intermediate
Bond Fund | | Missouri
Tax-Free
Intermediate
Bond Fund | | Kansas
Tax-Free
Intermediate
Bond Fund | |
| | | | | | | | | | | | | | | | | | | | | | | | | | | |
| $ | 105,822,753 | | | $ | 92,684,693 | | | $ | 2,877,760 | | $ | 536,501,096 | | | $ | 114,791,361 | | | $ | 149,516,771 | | $ | 156,213,148 | | $ | 67,962,049 | |
| | — | | | | — | | | | 15,151,550 | | | — | | | | — | | | | — | | | — | | | — | |
| | — | | | | 2,110,979 | | | | — | | | — | | | | — | | | | — | | | — | | | — | |
| | 813 | | | | 2,525 | | | | 7,985 | | | 248,379 | | | | 126 | | | | 144 | | | 714 | | | 549 | |
| | | | | | | | | | | | | | | | | | | | | | | | | | | |
| | 47,050 | | | | 419,764 | | | | 22,875 | | | 4,984,781 | | | | 1,086,486 | | | | 2,164,678 | | | 2,070,508 | | | 787,252 | |
| | — | | | | 1,949,680 | | | | — | | | — | | | | — | | | | — | | | — | | | — | |
| | 39,513 | | | | 77,290 | | | | 78,405 | | | 258,226 | | | | 28,477 | | | | 9,750 | | | 80,024 | | | — | |
| | — | | | | 1,245 | | | | 6,695 | | | — | | | | 21,545 | | | | 17,976 | | | 17,887 | | | 12,407 | |
| | — | | | | 659 | | | | — | | | — | | | | — | | | | — | | | — | | | — | |
| | — | | | | 66,841 | | | | — | | | — | | | | — | | | | — | | | — | | | — | |
| | 105,910,129 | | | | 97,313,676 | | | | 18,145,270 | | | 541,992,482 | | | | 115,927,995 | | | | 151,709,319 | | | 158,382,281 | | | 68,762,257 | |
| | | | | | | |
| | | | | | | | | | | | | | | | | | | | | | | | | | | |
| | | | | | | | | | | | | | | | | | | | | | | | | | | |
| | | | | | | | | | | | | | | | | | | | | | | | | | | |
| | — | | | | 3,291,135 | | | | 30,270 | | | — | | | | — | | | | 1,132,705 | | | 2,785,397 | | | — | |
| | — | | | | — | | | | — | | | 1,612,675 | | | | 325,428 | | | | 441,620 | | | 457,780 | | | 184,393 | |
| | 13,481 | | | | 34,347 | | | | 75,645 | | | 261,023 | | | | 184,416 | | | | 13,500 | | | — | | | 140,000 | |
| | 64,964 | | | | 73,802 | | | | — | | | 221,150 | | | | 47,690 | | | | 61,800 | | | 63,928 | | | 27,993 | |
| | 11,166 | | | | 15,586 | | | | 2,628 | | | 78,524 | | | | 27,651 | | | | 22,397 | | | 22,872 | | | 9,256 | |
| | 12,993 | | | | 11,413 | | | | 1,176 | | | 66,345 | | | | 14,307 | | | | 18,540 | | | 19,179 | | | 8,398 | |
| | — | | | | 1,193 | | | | — | | | — | | | | — | | | | — | | | — | | | — | |
| | 90,672 | | | | 142,690 | | | | 44,259 | | | 238,622 | | | | 82,816 | | | | 73,050 | | | 72,612 | | | 50,920 | |
| | 193,276 | | | | 3,570,166 | | | | 153,978 | | | 2,478,339 | | | | 682,308 | | | | 1,763,612 | | | 3,421,768 | | | 420,960 | |
| | | | | | | |
| | | | | | | | | | | | | | | | | | | | | | | | | | | |
| | | | | | | | | | | | | | | | | | | | | | | | | | | |
| | 84,600,191 | | | | 68,403,439 | | | | 15,752,906 | | | 557,457,133 | | | | 130,326,663 | | | | 146,076,935 | | | 150,973,566 | | | 67,022,185 | |
| | (174,460 | ) | | | (116,531 | ) | | | 21,534 | | | (3,886,582 | ) | | | (1,058,405 | ) | | | 12,272 | | | 48,829 | | | (17,814 | ) |
| | 4,572,549 | | | | 6,242,286 | | | | 576,582 | | | (15,702,314 | ) | | | (12,894,699 | ) | | | 473,659 | | | 505,693 | | | 136,524 | |
| | 16,718,573 | | | | 19,214,316 | | | | 1,640,270 | | | 1,645,906 | | | | (1,127,872 | ) | | | 3,382,841 | | | 3,432,425 | | | 1,200,402 | |
| $ | 105,716,853 | | | $ | 93,743,510 | | | $ | 17,991,292 | | $ | 539,514,143 | | | $ | 115,245,687 | | | $ | 149,945,707 | | $ | 154,960,513 | | $ | 68,341,297 | |
| | | | | | | |
| | | | | | | | | | | | | | | | | | | | | | | | | | | |
| | | | | | | | | | | | | | | | | | | | | | | | | | | |
| | 2,902,097 | | | | 3,140,919 | | | | 888,737 | | | 29,484,841 | | | | 6,556,081 | | | | 7,935,199 | | | 8,125,637 | | | 3,670,812 | |
| $ | 36.43 | | | $ | 29.85 | | | $ | 20.24 | | $ | 18.30 | | | $ | 17.58 | | | $ | 18.90 | | $ | 19.07 | | $ | 18.62 | |
45
COMMERCE FUNDS
Statements of Operations
For the Six Months Ended April 30, 2007 (Unaudited)
| | | | | | | | | | | | |
| | | Core Equity Fund | | | Growth Fund | | | Value Fund | |
Investment Income: | |
Interest | | $ | 1,535 | | | $ | 83,947 | | | $ | 34,207 | |
Dividends — unaffiliated(a) | | | 1,316,082 | | | | 1,069,631 | | | | 1,466,019 | |
Dividends — affiliated | | | — | | | | — | | | | — | |
Total Income | | | 1,317,617 | | | | 1,153,578 | | | | 1,500,226 | |
| | | |
| | | | | | | | | | | | |
Expenses: | |
Advisory fees | | | 556,927 | | | | 721,604 | | | | 471,448 | |
Administration fees | | | 111,385 | | | | 144,321 | | | | 94,290 | |
Shareowner servicing fees | | | 55,015 | | | | 117,314 | | | | 56,852 | |
Custody and accounting fees | | | 27,287 | | | | 25,540 | | | | 27,709 | |
Transfer Agent fees | | | 26,157 | | | | 43,046 | | | | 22,745 | |
Professional fees | | | 14,208 | | | | 24,074 | | | | 16,053 | |
Registration fees | | | 15,391 | | | | 11,871 | | | | 14,705 | |
Printing fees | | | 568 | | | | 5,681 | | | | 3,364 | |
Trustee fees | | | 2,539 | | | | 4,063 | | | | 2,651 | |
Other | | | 16,661 | | | | 13,087 | | | | 9,522 | |
Total Expenses | | | 826,138 | | | | 1,110,601 | | | | 719,339 | |
Less — expense reductions(b) | | | (3 | ) | | | (21,378 | ) | | | (471 | ) |
Net Expenses | | | 826,135 | | | | 1,089,223 | | | | 718,868 | |
| Net Investment Income (Loss) | | | 491,482 | | | | 64,355 | | | | 781,358 | |
| | | |
| | | | | | | | | | | | |
Realized and Unrealized Gain (Loss) on Investment, Futures and Foreign Currency Related Transactions: | |
Capital gain distributions from Underlying Funds | | | — | | | | — | | | | — | |
Net realized gain (loss) from: | | | | | | | | | | | | |
Investment transactions — unaffiliated | | | 23,284,952 | | | | 15,655,607 | | | | 7,089,701 | |
Investment transactions — affiliated | | | — | | | | — | | | | — | |
Futures transactions | | | — | | | | — | | | | — | |
Foreign currency related transactions | | | — | | | | — | | | | — | |
Net change in unrealized gain (loss) on: | | | | | | | | | | | | |
Investments | | | (13,755,176 | ) | | | (3,722,931 | ) | | | 1,162,000 | |
Futures | | | — | | | | — | | | | — | |
Translation of assets and liabilities denominated in foreign currencies | | | — | | | | — | | | | — | |
Net Realized and Unrealized Gain (Loss) on Investment, Futures and Foreign Currency Related Transactions | | | 9,529,776 | | | | 11,932,676 | | | | 8,251,701 | |
| Net Increase in Net Assets Resulting From Operations | | $ | 10,021,258 | | | $ | 11,997,031 | | | $ | 9,033,059 | |
(a) | | Amount is net of $88,969 for the International Equity Fund in foreign withholding taxes. |
(b) | | Expense reductions include waivers, custody credits and expense reimbursements. |
| | |
| 46 | | The accompanying notes are an integral part of these financial statements. |
COMMERCE FUNDS
| | | | | | | | | | | | | | | | | | | | | | | | | | | | | | |
MidCap
Growth Fund | | | International
Equity Fund | | | Asset Allocation
Fund | | | Bond Fund | | | Short-Term
Government
Fund | | | National
Tax-Free
Intermediate
Bond Fund | | | Missouri
Tax-Free
Intermediate
Bond Fund | | | Kansas
Tax-Free
Intermediate
Bond Fund | |
| | | | | | | | | | | | | | | | | | | | | | | | | | | | | | |
| $ | 48,114 | | | $ | 23,405 | | | $ | — | | | $ | 14,260,551 | | | $ | 2,727,409 | | | $ | 3,354,161 | | | $ | 3,525,758 | | | $ | 1,428,955 | |
| | 373,126 | | | | 916,068 | | | | 13,658 | | | | — | | | | — | | | | — | | | | — | | | | — | |
| | — | | | | — | | | | 198,812 | | | | — | | | | — | | | | — | | | | — | | | | — | |
| | 421,240 | | | | 939,473 | | | | 212,470 | | | | 14,260,551 | | | | 2,727,409 | | | | 3,354,161 | | | | 3,525,758 | | | | 1,428,955 | |
| | | | | | | |
| | | | | | | | | | | | | | | | | | | | | | | | | | | | | | |
| | | | | | | | | | | | | | | | | | | | | | | | | | | | | | |
| | 372,607 | | | | 653,234 | | | | 17,500 | | | | 1,343,286 | | | | 302,776 | | | | 378,932 | | | | 395,046 | | | | 169,303 | |
| | 74,521 | | | | 65,324 | | | | 13,125 | | | | 402,986 | | | | 90,833 | | | | 113,680 | | | | 118,514 | | | | 50,791 | |
| | 57,046 | | | | 35,462 | | | | 12,804 | | | | 205,309 | | | | 50,898 | | | | 48,575 | | | | 49,715 | | | | 21,399 | |
| | 25,260 | | | | 137,471 | | | | 25,487 | | | | 65,327 | | | | 32,656 | | | | 23,678 | | | | 23,068 | | | | 20,404 | |
| | 24,894 | | | | 18,082 | | | | 5,588 | | | | 78,856 | | | | 20,806 | | | | 21,996 | | | | 23,053 | | | | 10,432 | |
| | 15,389 | | | | 12,443 | | | | 5,478 | | | | 60,611 | | | | 14,516 | | | | 18,522 | | | | 14,464 | | | | 11,852 | |
| | 10,762 | | | | 12,269 | | | | 6,034 | | | | 11,341 | | | | 12,300 | | | | 4,302 | | | | 5,325 | | | | 14,302 | |
| | 2,974 | | | | 2,332 | | | | 422 | | | | 11,809 | | | | 1,170 | | | | 3,192 | | | | 3,160 | | | | 1,586 | |
| | 2,078 | | | | 1,809 | | | | 354 | | | | 11,402 | | | | 2,326 | | | | 3,121 | | | | 3,149 | | | | 1,400 | |
| | 7,231 | | | | 6,713 | | | | 2,360 | | | | 40,683 | | | | 11,116 | | | | 12,656 | | | | 13,040 | | | | 6,107 | |
| | 592,762 | | | | 945,139 | | | | 89,152 | | | | 2,231,610 | | | | 539,397 | | | | 628,654 | | | | 648,534 | | | | 307,576 | |
| | (11 | ) | | | (230,972 | ) | | | (58,260 | ) | | | (4,320 | ) | | | (126,168 | ) | | | (96,038 | ) | | | (119,680 | ) | | | (80,760 | ) |
| | 592,751 | | | | 714,167 | | | | 30,892 | | | | 2,227,290 | | | | 413,229 | | | | 532,616 | | | | 528,854 | | | | 226,816 | |
| | (171,511 | ) | | | 225,306 | | | | 181,578 | | | | 12,033,261 | | | | 2,314,180 | | | | 2,821,545 | | | | 2,996,904 | | | | 1,202,139 | |
| | | | | | | |
| | | | | | | | | | | | | | | | | | | | | | | | | | | | | | |
| | | | | | | | | | | | | | | | | | | | | | | | | | | | | | |
| | — | | | | — | | | | 354,769 | | | | — | | | | — | | | | — | | | | — | | | | — | |
| | | | | | | | | | | | | | | | | | | | | | | | | | | | | | |
| | 4,580,083 | | | | 6,264,225 | | | | 127,656 | | | | 5,365,174 | | | | (24,702 | ) | | | 473,658 | | | | 505,916 | | | | 136,612 | |
| | — | | | | — | | | | 204,565 | | | | — | | | | — | | | | — | | | | — | | | | — | |
| | — | | | | (3,311 | ) | | | — | | | | — | | | | — | | | | — | | | | — | | | | — | |
| | — | | | | 22,923 | | | | — | | | | — | | | | — | | | | — | | | | — | | | | — | |
| | | | | | | | | | | | | | | | | | | | | | | | | | | | | | |
| | 3,673,346 | | | | 5,386,737 | | | | 261,686 | | | | 801,018 | | | | 489,618 | | | | (1,425,130 | ) | | | (1,300,970 | ) | | | (377,118 | ) |
| | — | | | | 2,269 | | | | — | | | | — | | | | — | | | | — | | | | — | | | | — | |
| | — | | | | (13,166 | ) | | | — | | | | — | | | | — | | | | — | | | | — | | | | — | |
| | 8,253,429 | | | | 11,659,677 | | | | 948,676 | | | | 6,166,192 | | | | 464,916 | | | | (951,472 | ) | | | (795,054 | ) | | | (240,506 | ) |
| $ | 8,081,918 | | | $ | 11,884,983 | | | $ | 1,130,254 | | | $ | 18,199,453 | | | $ | 2,779,096 | | | $ | 1,870,073 | | | $ | 2,201,850 | | | $ | 961,633 | |
47
COMMERCE FUNDS
Statements of Changes in Net Assets
| | | | | | | | | | | | | | | | |
| | | Core Equity Fund | | | Growth Fund | |
| | | For the Six Months
Ended April 30,
2007 (Unaudited) | | | For the
Year Ended
October 31, 2006 | | | For the Six Months
Ended April 30,
2007 (Unaudited) | | | For the
Year Ended
October 31, 2006 | |
From Operations: | |
Net investment income (loss) | | $ | 491,482 | | | $ | 1,274,960 | | | $ | 64,355 | | | $ | 246,435 | |
Net realized gain from investment, futures and foreign currency related transactions | | | 23,284,952 | | | | 27,150,717 | | | | 15,655,607 | | | | 13,126,565 | |
Net change in unrealized gain (loss) on investments, futures, and translation of assets and liabilities denominated in foreign currencies | | | (13,755,176 | ) | | | (3,665,053 | ) | | | (3,722,931 | ) | | | 7,240,225 | |
Net increase in net assets resulting from operations | | | 10,021,258 | | | | 24,760,624 | | | | 11,997,031 | | | | 20,613,225 | |
| | | | |
| | | | | | | | | | | | | | | | |
Distributions to Shareholders:(a) | |
From net investment income | | | | | | | | | | | | | | | | |
Institutional Shares | | | (503,046 | ) | | | (1,329,769 | ) | | | (253,032 | ) | | | (771,267 | ) |
Service Shares | | | — | | | | (180 | ) | | | — | | | | (9,420 | ) |
From net realized gains | | | | | | | | | | | | | | | | |
Institutional Shares | | | (27,172,497 | ) | | | (11,951,580 | ) | | | — | | | | — | |
Service Shares | | | — | | | | (5,992 | ) | | | — | | | | — | |
Total distributions to shareholders | | | (27,675,543 | ) | | | (13,287,521 | ) | | | (253,032 | ) | | | (780,687 | ) |
| | | | |
| | | | | | | | | | | | | | | | |
From Share Transactions: | |
Proceeds from sales of shares | | | 6,254,524 | | | | 11,855,512 | | | | 41,158,846 | | | | 39,532,801 | |
Reinvestment of dividends and distributions | | | 6,289,773 | | | | 577,821 | | | | 141,399 | | | | 539,132 | |
Cost of shares repurchased | | | (70,673,172 | ) | | | (64,819,579 | ) | | | (21,082,701 | ) | | | (40,477,258 | ) |
Net Increase (Decrease) in Net Assets Resulting From Share Transactions | | | (58,128,875 | ) | | | (52,386,246 | ) | | | 20,217,544 | | | | (405,325 | ) |
| TOTAL INCREASE (DECREASE) | | | (75,783,160 | ) | | | (40,913,143 | ) | | | 31,961,543 | | | | 19,427,213 | |
| | | | |
| | | | | | | | | | | | | | | | |
Net Assets: | |
Beginning of period | | | 197,556,846 | | | | 238,469,989 | | | | 173,813,101 | | | | 154,385,888 | |
End of period | | $ | 121,773,686 | | | $ | 197,556,846 | | | $ | 205,774,644 | | | $ | 173,813,101 | |
Accumulated undistributed (distributions in excess of) net investment income (loss) | | $ | (12,275 | ) | | $ | (711 | ) | | $ | 59,508 | | | $ | 248,185 | |
(a) | | On February 3, 2006, all outstanding Service Shares were converted into Institutional Shares. |
(b) | | Net of $1,369 of redemption fees remitted to the International Equity Fund. |
(c) | | Net of $6,012 of redemption fees remitted to the International Equity Fund. |
| | |
| 48 | | The accompanying notes are an integral part of these financial statements. |
COMMERCE FUNDS
| | | | | | | | | | | | | | | | | | | | | | |
| Value Fund | | | MidCap Growth Fund | | | International Equity Fund | |
For the Six Months
Ended April 30,
2007 (Unaudited) | | | For the
Year Ended
October 31, 2006 | | | For the Six Months
Ended April 30,
2007 (Unaudited) | | | For the
Year Ended
October 31, 2006 | | | For the Six Months
Ended April 30,
2007 (Unaudited) | | | For the
Year Ended
October 31, 2006 | |
| | | | | | | | | | | | | | | | | | | | | | |
| $ | 781,358 | | | $ | 1,468,767 | | | $ | (171,511 | ) | | $ | (297,322 | ) | | $ | 225,306 | | | $ | 413,698 | |
| | 7,089,701 | | | | 9,512,327 | | | | 4,580,083 | | | | 8,117,998 | | | | 6,283,837 | | | | 7,959,903 | |
| | 1,162,000 | | | | 10,339,959 | | | | 3,673,346 | | | | 5,711,072 | | | | 5,375,840 | | | | 9,556,671 | |
| | 9,033,059 | | | | 21,321,053 | | | | 8,081,918 | | | | 13,531,748 | | | | 11,884,983 | | | | 17,930,272 | |
| | | | | |
| | | | | | | | | | | | | | | | | | | | | | |
| | | | | | | | | | | | | | | | | | | | | | |
| | | | | | | | | | | | | | | | | | | | | | |
| | (789,399 | ) | | | (1,451,986 | ) | | | — | | | | — | | | | (800,536 | ) | | | (669,350 | ) |
| | — | | | | (1,332 | ) | | | — | | | | — | | | | — | | | | (2,443 | ) |
| | | | | | | | | | | | | | | | | | | | | | |
| | (9,771,395 | ) | | | (431,606 | ) | | | (118,142 | ) | | | — | | | | (2,972,277 | ) | | | — | |
| | — | | | | (1,917 | ) | | | — | | | | — | | | | — | | | | — | |
| | (10,560,794 | ) | | | (1,886,841 | ) | | | (118,142 | ) | | | — | | | | (3,772,813 | ) | | | (671,793 | ) |
| | | | | |
| | | | | | | | | | | | | | | | | | | | | | |
| | | | | | | | | | | | | | | | | | | | | | |
| | 22,396,290 | | | | 17,835,547 | | | | 13,303,959 | | | | 22,542,986 | | | | 10,071,359 | | | | 13,603,606 | |
| | 7,253,416 | | | | 847,684 | | | | 78,038 | | | | — | | | | 1,823,992 | | | | 162,037 | |
| | (14,768,642 | ) | | | (29,672,631 | ) | | | (7,503,129 | ) | | | (20,687,098 | ) | | | (9,065,930 | )(b) | | | (21,671,396 | )(c) |
| | 14,881,064 | | | | (10,989,400 | ) | | | 5,878,868 | | | | 1,855,888 | | | | 2,829,421 | | | | (7,905,753 | ) |
| | 13,353,329 | | | | 8,444,812 | | | | 13,842,644 | | | | 15,387,636 | | | | 10,941,591 | | | | 9,352,726 | |
| | | | | |
| | | | | | | | | | | | | | | | | | | | | | |
| | | | | | | | | | | | | | | | | | | | | | |
| | 120,684,739 | | | | 112,239,927 | | | | 91,874,209 | | | | 76,486,573 | | | | 82,801,919 | | | | 73,449,193 | |
| $ | 134,038,068 | | | $ | 120,684,739 | | | $ | 105,716,853 | | | $ | 91,874,209 | | | $ | 93,743,510 | | | $ | 82,801,919 | |
| $ | 72,804 | | | $ | 80,845 | | | $ | (174,460 | ) | | $ | (2,949 | ) | | $ | (116,531 | ) | | $ | 458,699 | |
49
COMMERCE FUNDS
Statements of Changes in Net Assets (continued)
| | | | | | | | | | | | | | | | |
| | | Asset Allocation Fund | | | Bond Fund | |
| | | For the Six Months
Ended April 30,
2007 (Unaudited) | | | For the
Year Ended
October 31, 2006 | | | For the Six Months
Ended April 30,
2007 (Unaudited) | | | For the
Year Ended
October 31, 2006 | |
From Operations: | |
Net investment income | | $ | 181,578 | | | $ | 400,946 | | | $ | 12,033,261 | | | $ | 24,420,595 | |
Net realized gain (loss) from investment transactions, including capital gain distributions from Underlying Funds | | | 686,990 | | | | 1,368,252 | | | | 5,365,174 | | | | (1,426,153 | ) |
Net change in unrealized gain (loss) on investments | | | 261,686 | | | | 299,466 | | | | 801,018 | | | | 2,645,815 | |
Net increase in net assets resulting from operations | | | 1,130,254 | | | | 2,068,664 | | | | 18,199,453 | | | | 25,640,257 | |
| | | | |
| | | | | | | | | | | | | | | | |
Distributions to Shareholders:(a) | |
From net investment income | | | | | | | | | | | | | | | | |
Institutional Shares | | | (159,372 | ) | | | (394,608 | ) | | | (12,794,438 | ) | | | (26,168,096 | ) |
Service Shares | | | — | | | | (2,839 | ) | | | — | | | | (9,376 | ) |
From net realized gains | | | | | | | | | | | | | | | | |
Institutional Shares | | | (1,429,175 | ) | | | (1,909,803 | ) | | | — | | | | — | |
Service Shares | | | — | | | | (44,523 | ) | | | — | | | | — | |
Total distributions to shareholders | | | (1,588,547 | ) | | | (2,351,773 | ) | | | (12,794,438 | ) | | | (26,177,472 | ) |
| | | | |
| | | | | | | | | | | | | | | | |
From Share Transactions: | |
Proceeds from sales of shares | | | 1,366,040 | | | | 3,167,204 | | | | 33,976,622 | | | | 100,503,343 | |
Reinvestment of dividends and distributions | | | 1,566,861 | | | | 2,278,241 | | | | 2,905,704 | | | | 5,853,164 | |
Cost of shares repurchased | | | (1,441,628 | ) | | | (5,315,481 | ) | | | (51,485,917 | ) | | | (127,390,300 | ) |
Net Increase (Decrease) in Net Assets Resulting From Share Transactions | | | 1,491,273 | | | | 129,964 | | | | (14,603,591 | ) | | | (21,033,793 | ) |
| TOTAL INCREASE (DECREASE) | | | 1,032,980 | | | | (153,145 | ) | | | (9,198,576 | ) | | | (21,571,008 | ) |
| | | | |
| | | | | | | | | | | | | | | | |
Net Assets: | |
Beginning of period | | | 16,958,312 | | | | 17,111,457 | | | | 548,712,719 | | | | 570,283,727 | |
End of period | | $ | 17,991,292 | | | $ | 16,958,312 | | | $ | 539,514,143 | | | $ | 548,712,719 | |
Accumulated undistributed (distributions in excess of) net investment income | | $ | 21,534 | | | $ | (672 | ) | | $ | (3,886,582 | ) | | $ | (3,125,405 | ) |
(a) | | On February 3, 2006, all outstanding Service Shares were converted into Institutional Shares. |
| | |
| 50 | | The accompanying notes are an integral part of these financial statements. |
COMMERCE FUNDS
| | | | | | | | | | | | | | | | | | | | | | |
Short-Term
Government Fund | | | National Tax-Free Intermediate Bond Fund | | | Missouri Tax-Free Intermediate Bond Fund | |
For the Six Months
Ended April 30,
2007 (Unaudited) | | | For the
Year Ended
October 31, 2006 | | | For the Six Months
Ended April 30,
2007 (Unaudited) | | | For the
Year Ended
October 31, 2006 | | | For the Six Months
Ended April 30,
2007 (Unaudited) | | | For the
Year Ended
October 31, 2006 | |
| | | | | | | | | | |
| $ | 2,314,180 | | | $ | 5,038,099 | | | $ | 2,821,545 | | | $ | 6,067,000 | | | $ | 2,996,904 | | | $ | 6,537,316 | |
| | (24,702 | ) | | | (541,436 | ) | | | 473,658 | | | | 321,341 | | | | 505,916 | | | | 134,115 | |
| | 489,618 | | | | 1,269,524 | | | | (1,425,130 | ) | | | 739,534 | | | | (1,300,970 | ) | | | 629,454 | |
| | 2,779,096 | | | | 5,766,187 | | | | 1,870,073 | | | | 7,127,875 | | | | 2,201,850 | | | | 7,300,885 | |
| | | | | |
| | | | | | | | | | | | | | | | | | | | | | |
| | | | | | | | | | |
| | | | | | | | | | | | | | | | | | | | | | |
| | (2,633,746 | ) | | | (6,027,740 | ) | | | (2,875,825 | ) | | | (6,149,391 | ) | | | (2,992,928 | ) | | | (6,607,484 | ) |
| | — | | | | (8,809 | ) | | | — | | | | (12 | ) | | | — | | | | (7,248 | ) |
| | | | | | | | | | | | | | | | | | | | | | |
| | — | | | | — | | | | (380,139 | ) | | | (864,498 | ) | | | (134,397 | ) | | | (537,910 | ) |
| | — | | | | — | | | | — | | | | (7 | ) | | | — | | | | (2,441 | ) |
| | (2,633,746 | ) | | | (6,036,549 | ) | | | (3,255,964 | ) | | | (7,013,908 | ) | | | (3,127,325 | ) | | | (7,155,083 | ) |
| | | | | |
| | | | | | | | | | | | | | | | | | | | | | |
| | | | | | | | | | |
| | 5,390,842 | | | | 24,437,660 | | | | 11,874,338 | | | | 27,158,319 | | | | 13,502,644 | | | | 32,321,736 | |
| | 557,350 | | | | 1,378,914 | | | | 301,522 | | | | 423,033 | | | | 207,154 | | | | 588,241 | |
| | (20,787,433 | ) | | | (53,927,991 | ) | | | (15,148,637 | ) | | | (36,183,976 | ) | | | (17,451,859 | ) | | | (46,321,226 | ) |
| | (14,839,241 | ) | | | (28,111,417 | ) | | | (2,972,777 | ) | | | (8,602,624 | ) | | | (3,742,061 | ) | | | (13,411,249 | ) |
| | (14,693,891 | ) | | | (28,381,779 | ) | | | (4,358,668 | ) | | | (8,488,657 | ) | | | (4,667,536 | ) | | | (13,265,447 | ) |
| | | | | |
| | | | | | | | | | | | | | | | | | | | | | |
| | | | | | | | | | |
| | 129,939,578 | | | | 158,321,357 | | | | 154,304,375 | | | | 162,793,032 | | | | 159,628,049 | | | | 172,893,496 | |
| $ | 115,245,687 | | | $ | 129,939,578 | | | $ | 149,945,707 | | | $ | 154,304,375 | | | $ | 154,960,513 | | | $ | 159,628,049 | |
| $ | (1,058,405 | ) | | $ | (738,839 | ) | | $ | 12,272 | | | $ | 66,552 | | | $ | 48,829 | | | $ | 44,853 | |
51
COMMERCE FUNDS
Statements of Changes in Net Assets (continued)
| | | | | | | | |
| | | Kansas Tax-Free Intermediate Bond Fund | |
| | | For the Six Months
Ended April 30,
2007 (Unaudited) | | | For the
Year Ended
October 31, 2006 | |
From Operations: | | | | | | | | |
Net investment income | | $ | 1,202,139 | | | $ | 2,548,373 | |
Net realized gain (loss) from investment transactions | | | 136,612 | | | | 161,837 | |
Net change in unrealized gain (loss) on investments | | | (377,118 | ) | | | 157,362 | |
Net increase in net assets resulting from operations | | | 961,633 | | | | 2,867,572 | |
| | |
| | | | | | | | |
Distributions to Shareholders:(a) | | | | | | | | |
From net investment income | | | | | | | | |
Institutional Shares | | | (1,223,222 | ) | | | (2,559,662 | ) |
Service Shares | | | — | | | | (19,624 | ) |
From net realized gains | | | | | | | | |
Institutional Shares | | | (207,135 | ) | | | (162,433 | ) |
Service Shares | | | — | | | | (5,539 | ) |
Total distributions to shareholders | | | (1,430,357 | ) | | | (2,747,258 | ) |
| | |
| | | | | | | | |
From Share Transactions: | | | | | | | | |
Proceeds from sales of shares | | | 8,428,011 | | | | 14,297,601 | |
Reinvestment of dividends and distributions | | | 175,342 | | | | 168,169 | |
Cost of shares repurchased | | | (8,868,784 | ) | | | (15,932,599 | ) |
Net Decrease in Net Assets Resulting From Share Transactions | | | (265,431 | ) | | | (1,466,829 | ) |
| TOTAL DECREASE | | | (734,155 | ) | | | (1,346,515 | ) |
| | |
| | | | | | | | |
Net Assets: | | | | | | | | |
Beginning of period | | | 69,075,452 | | | | 70,421,967 | |
End of period | | $ | 68,341,297 | | | $ | 69,075,452 | |
Accumulated undistributed (distributions in excess of) net investment income | | $ | (17,814 | ) | | $ | 3,269 | |
(a) | | On February 3, 2006, all outstanding Service Shares were converted into Institutional Shares. |
| | |
| 52 | | The accompanying notes are an integral part of these financial statements. |
COMMERCE FUNDS
Notes to Financial Statements
April 30, 2007 (Unaudited)
The Commerce Funds (the “Trust”) is a Delaware statutory trust registered under the Investment Company Act of 1940, as amended (the “1940 Act”), as an open-end, management investment company. The Trust consists of eleven portfolios (individually, a “Fund” and collectively, the “Funds”): Core Equity Fund, Growth Fund, Value Fund, MidCap Growth Fund, International Equity Fund, Asset Allocation Fund, Bond Fund, Short-Term Government Fund, National Tax-Free Intermediate Bond Fund, Missouri Tax-Free Intermediate Bond Fund and Kansas Tax-Free Intermediate Bond Fund. Each of the Funds offers one class of shares, Institutional Shares. Each Fund is registered as a diversified management investment company, other than the Missouri Tax-Free Intermediate Bond Fund and the Kansas Tax-Free Intermediate Bond Fund, which are registered as non-diversified under the 1940 Act.
Prior to February 3, 2006, each Fund offered two classes of shares, Institutional Shares and Service Shares. On February 3, 2006, all outstanding Service Shares were converted into Institutional Shares. Immediately after and as a result of the conversion, each holder of Service Shares of a Fund was an owner of Institutional Shares of the same Fund with an aggregate net asset value equal to the aggregate net asset value of the Service Shares of such holder that converted.
|
| 2. SIGNIFICANT ACCOUNTING POLICIES |
The following is a summary of the significant accounting policies consistently followed by the Funds. The preparation of financial statements in conformity with U.S. generally accepted accounting principles requires management to make estimates and assumptions that may affect the reported amounts. Actual results could differ from those estimates.
A. Investment Valuation — Investments in equity securities and exchange traded funds traded on a U.S. or foreign securities exchange or the NASDAQ National Market System or for investments in securities traded on a foreign securities exchange for which an independent service is not available are valued daily at their last sale price or official closing price on the principal exchange or system on which they are traded. If no sale occurs, such securities and exchange traded funds are valued at the last bid price. Debt securities are valued at prices supplied by independent pricing services, broker/dealer-supplied valuations or matrix pricing systems. Unlisted equity securities for which market quotations are available are valued at the last sale price on valuation date, or if no sale occurs, at the last bid price. Short-term debt obligations maturing in sixty days or less are valued at amortized cost, which approximates market value. In addition, the impact of events that occur after the publication of market quotations used by a Fund to price its securities but before the close of regular trading on the New York Stock Exchange will be reflected in a Fund’s next determined NAV if the Trust, in its discretion, determines to make an adjustment in light of the nature and significance of the event, consistent with applicable regulatory guidelines. Upon such determination the Fund utilizes a price from an independent service, if available. The independent service takes into account multiple factors including, but not limited to, movements in the U.S. securities markets, certain depositary receipts, futures contracts and foreign currency exchange rates. Securities for which quotations are not readily available or are deemed not to reflect market value by the Adviser are valued at fair value using methods approved by the Trust’s Board of Trustees.
The Asset Allocation Fund invests in a combination of underlying funds (the “Underlying Funds”), including Funds advised by the Adviser. Investments in the Underlying Funds (other than those that are exchange traded) are valued at the closing net asset value per share of each Underlying Fund on the day of valuation. Because the Asset Allocation Fund invests primarily in other mutual funds, which fluctuate in value, the Fund’s shares will correspondingly fluctuate in value.
53
COMMERCE FUNDS
Notes to Financial Statements (continued)
April 30, 2007 (Unaudited)
| | |
| 2. SIGNIFICANT ACCOUNTING POLICIES (continued) | | |
Investing in foreign markets may involve special risks and considerations not typically associated with investing in the United States. These risks include revaluation of currencies, high rates of inflation, repatriation restrictions on income and capital, and adverse political and economic developments. Moreover, securities issued in these markets may be less liquid, subject to government ownership controls and delayed settlements, and their prices may be more volatile than those of comparable securities in the United States.
B. Security Transactions and Investment Income — Security transactions and purchases and sales of the Funds and of the Underlying Funds by the Asset Allocation Fund are reflected as of the trade date. Realized gains and losses on sales of portfolio securities of the Funds and on sales of the Underlying Funds are calculated using the identified-cost basis. Dividend income and capital gains distributions of the Funds and from the Underlying Funds are recorded on the ex-dividend date, net of foreign withholding taxes, if any, which are reduced by any amounts reclaimable by the Funds, where applicable. In addition, it is the Funds’ policy to accrue for estimated capital gains taxes on foreign securities held by the Funds, which are subject to taxes. Interest income is recorded on the basis of interest accrued, premium amortized and discount accreted.
The Bond and Short-Term Government Funds invest in mortgage-backed securities. Certain mortgage security paydown gains and losses are taxable as ordinary income (loss). Such paydown gains and losses increase or decrease taxable ordinary income available for distribution and are classified as interest income in the accompanying Statements of Operations. For all Funds, market discounts, original issue discounts (“OID”) and market premiums on debt securities are amortized to interest income over the life of the security with a corresponding adjustment in the cost basis of that security. OID amortization on mortgage-backed REMIC (“Real Estate Mortgage Investment Conduit”) securities is initially recorded based on estimates of principal paydowns using the most recent OID factors available from the issuer.
C. Foreign Currency Translations — The books and records of the Funds are maintained in U.S. dollars. Amounts denominated in foreign currencies are translated into U.S. dollars on the following basis: (i) investment valuations, foreign currency and other assets and liabilities initially expressed in foreign currencies are converted each business day into U.S. dollars based upon current exchange rates; and (ii) purchases and sales of foreign investments, income and expenses are converted into U.S. dollars based upon currency exchange rates prevailing on the respective dates of such transactions.
Net realized and unrealized gain (loss) on foreign currency transactions will represent: (i) foreign exchange gains and losses from the sale and holdings of foreign currencies; (ii) currency gains and losses between trade date and settlement date on investment securities transactions and forward exchange contracts; and (iii) gains and losses from the difference between amounts of interest, dividends and foreign withholding taxes recorded and the amounts actually received. The effect of changes in foreign currency exchange rates on securities and derivative instruments are not segregated in the Statements of Operations from the effects of changes in market prices of those securities and derivative instruments, but are included with the net realized and unrealized gain (loss) on securities and derivative instruments. Net unrealized foreign exchange gains and losses arising from changes in the value of other assets and liabilities as a result of changes in foreign exchange rates are included as increases and decreases in unrealized gain (loss) on foreign currency related transactions.
54
COMMERCE FUNDS
| | |
| 2. SIGNIFICANT ACCOUNTING POLICIES (continued) | | |
D. Segregation Transactions — As set forth in the prospectus, certain Funds may enter into certain derivative transactions; some of these transactions may be for the purpose of increasing total return. Forward foreign currency exchange contracts, futures contracts, written options, when-issued securities and forward commitments represent examples of such transactions. As a result of entering into these transactions, the Funds are required to segregate liquid assets with a current value equal to or greater than the market value of the corresponding transactions.
E. Repurchase Agreements — Repurchase agreements involve the purchase of securities subject to the seller’s agreement to repurchase the securities at a mutually agreed upon date and price. During the term of a repurchase agreement, the value of the underlying securities held as collateral on behalf of the Funds, including accrued interest, is required to exceed the value of the repurchase agreement, including accrued interest. If the seller defaults or becomes insolvent, realization of the collateral by the Funds may be delayed or limited and there may be a decline in the value of the collateral during the period while the Funds seek to assert their rights. The underlying securities for all repurchase agreements are held in safekeeping at the Funds’ custodian.
F. Futures Contracts — Certain Funds may enter into futures transactions to hedge against changes in interest rates, securities prices, currency exchange rates or to seek to increase total return. Futures contracts are valued at the last settlement price, or in the absence of a sale, the last bid price, at the end of each day on the board of trade or exchange upon which they are traded. Upon entering into a futures contract, the Funds are required to segregate cash or securities equal to the minimum “initial margin” requirement of the associated futures exchange. Subsequent payments for futures contracts (“variation margin”) are paid or received by the Funds, dependent on the fluctuations in the value of the contracts, and are recorded for financial reporting purposes as unrealized gains or losses. When contracts are closed, the Funds realize a gain or loss which is reported in the Statement of Operations.
The use of futures contracts involves, to varying degrees, elements of market and counterparty risk which may exceed the amounts recognized in the Statement of Assets and Liabilities. Changes in the value of a futures contract may not directly correlate with changes in the value of the underlying securities. These risks may decrease the effectiveness of the Funds’ strategies and potentially result in a loss.
G. Dividend Distributions to Shareholders — Distributions to shareholders are recorded on the ex-dividend date. Income and capital gains distributions, if any, are declared and paid according to the following schedule:
| | | | | | | | |
| | | Income Distribution | | Capital Gains Distribution |
| Fund | | Declared | | Paid | | Declared | | Paid |
Core Equity, Value and Asset Allocation | | Quarterly | | Quarterly | | Annually | | Annually |
Growth, MidCap Growth and International Equity | | Annually | | Annually | | Annually | | Annually |
Bond, Short-Term Government, National Tax-Free Intermediate Bond, Missouri Tax-Free Intermediate Bond and Kansas Tax-Free Intermediate Bond | | Daily | | Monthly | | Annually | | Annually |
H. Expenses — Expenses incurred by the Trust that do not specifically relate to an individual Fund of the Trust are allocated to the Funds based on each Fund’s relative average daily net assets.
55
COMMERCE FUNDS
Notes to Financial Statements (continued)
April 30, 2007 (Unaudited)
| | |
2. SIGNIFICANT ACCOUNTING POLICIES (continued) | | |
I. Federal Taxes — It is each Fund’s policy to comply with the requirements of the Internal Revenue Code of 1986, as amended (the “Code”) applicable to regulated investment companies and to distribute each year substantially all of its investment company tax-exempt and taxable income and capital gains to its shareholders. Accordingly, no federal tax provisions are required. The amount of these income distributions to shareholders, which are calculated in accordance with relevant tax requirements, can often differ from the amounts of the Funds’ net investment income for financial reporting purposes, which is calculated in accordance with U.S. generally accepted accounting principles.
The characterization of distributions to shareholders for financial reporting purposes is determined in accordance with Federal income tax rules, which may differ from U.S. generally accepted accounting principles. Therefore, the source of each Fund’s distributions may be shown in the accompanying financial statements as either from net investment income, net realized gains, or as a tax return of capital.
In addition, distributions paid by the Funds’ investments in real estate investment trusts (“REITs”) often include a “return of capital” which is recorded by the Funds as a reduction of the cost basis of the securities held. The Code requires a REIT to distribute at least 95% of its taxable income to investors. In many cases, however, because of “non-cash” expenses such as property depreciation, a REIT’s cash flow will exceed its taxable income. The REIT may distribute this excess cash to offer a more competitive yield. This portion of the Fund’s distributions are deemed a return of capital and is generally not taxable to shareholders.
J. Redemption Fees — If Institutional shares of the International Equity Fund are redeemed or exchanged within 30 days of purchase, a redemption fee of 2% may be assessed on the proceeds of the transaction. For this purpose, the Fund uses a first-in first-out method so that shares held longest will be treated as being redeemed first and shares held shortest will be treated as being redeemed last. The redemption fee may be collected by deduction from the redemption proceeds or, if assessed after the redemption transaction, through a separate billing. The redemption fee will be paid to the International Equity Fund and is intended to limit short-term trading in the Fund or, to the extent that short-term trading persists, to impose the costs of that type of activity on the shareholders who engage in it. Redemption fees are reimbursed to the Fund and are reflected on the Statement of Changes in Net Assets as a reduction in share redemptions.
The Funds have entered into an Advisory Agreement with Commerce Investment Advisors, Inc. (the “Adviser” or “Commerce”), a subsidiary of Commerce Bank, N.A. (“Commerce Bank.”). Pursuant to the terms of the Advisory Agreement, the Adviser is responsible for managing the investments and making investment decisions for each of the Funds. For these services and for assuming related expenses, the Adviser is entitled to a fee, computed daily and payable monthly, at the contractual annual rate of the corresponding Fund’s average daily net assets. For the six months ended April 30, 2007, the Adviser had contractually agreed to waive a portion of its advisory fee for certain Funds. The contractual annual rate, effective annual rate and waiver rates, and amounts are listed on the following pages.
As authorized by the Advisory Agreement, the Adviser has entered into a Sub-Advisory Agreement with AllianceBernstein L.P. (the “Sub-Adviser”) whereby the Sub-Adviser manages the investment assets of the International Equity Fund.
56
COMMERCE FUNDS
| | |
| 3. AGREEMENTS (continued) | | |
As compensation for services rendered under the Sub-Advisory Agreement, the Sub-Adviser is entitled to a fee from the Adviser at the following annual rates:
| | |
| Average Daily Net Assets | | Annual Rate |
First $25 million | | 0.80% |
Next $25 million | | 0.65% |
Next $50 million | | 0.55% |
Next $100 million | | 0.45% |
Over $200 million | | 0.40% |
The Sub-Adviser has entered into a Waiver Agreement with the Adviser under which it will agree to waive its sub-advisory fee to 0.58% of the average daily net assets of the Fund until the earlier of (1) the Fund’s assets are in excess of $150 million; and (2) the eighteen-month anniversary of the new Sub-Advisory Agreement. On the last day of the calendar month following whichever of these events occurs first, the sub-advisory fee will adjust to the schedule set forth above. The Adviser has contractually agreed to waive a portion of its management fees under a waiver agreement, at least until October 31, 2007, such that Management Fees would not exceed 0.97% of the average daily net assets.
For the six months ended April 30, 2007, the Adviser agreed to waive fees and/or reimburse expenses (excluding interest, taxes and extraordinary expenses exclusive of any custody expense reductions) to the extent that such expenses exceeded, on an annualized basis, 1.13%, 1.13%, 1.20%, 1.72%, 0.35%, 0.88%, 0.68%, 0.70%, 0.70% and 0.70% of the average net assets of the Institutional Shares of the Core Equity, Growth, Value, International Equity, Asset Allocation, Bond, Short-Term Government, National Tax-Free Intermediate Bond, Missouri Tax-Free Intermediate Bond and Kansas Tax-Free Intermediate Bond Funds, respectively. Prior to March 1, 2007, the Missouri Tax-Free Intermediate Bond and Kansas Tax-Free Intermediate Bond Funds expense limitations were 0.65% and 0.65%, respectively. In addition, the Funds are not obligated to reimburse the Adviser for prior fiscal year expense reimbursements, if any. Such expense reimbursements, if any, are computed daily and paid monthly.
Goldman Sachs Asset Management (“GSAM”), a business unit of the Investment Management Division of Goldman, Sachs & Co. (“Goldman Sachs”), and Commerce, serve as Co-Administrators of the Trust pursuant to a Co-Administration Agreement dated March 1, 2005, as amended. Under the Co-Administration Agreement, GSAM and Commerce administer the Trust’s business affairs. As compensation for the services rendered under the Co-Administration Agreement, GSAM and Commerce are entitled to a fee, computed daily and payable monthly, at the contractual annual rate of the corresponding Fund’s average daily net assets. Pursuant to the Co-Administration Agreement, the Funds will pay an aggregate administrative fee at the annual rate of 0.15%, allocated as follows: (1) for each Fund, GSAM is entitled to receive 0.03% of each Fund’s average daily net assets; and (2) for each Fund, Commerce is entitled to receive 0.12% of each Fund’s average daily net assets other than for the Asset Allocation fund for which it waives 0.07% and receives 0.05%.
57
COMMERCE FUNDS
Notes to Financial Statements (continued)
April 30, 2007 (Unaudited)
| | |
| 3. AGREEMENTS (continued) | | |
In addition, the Funds have entered into certain offset arrangements with the custodian resulting in a reduction in the Funds’ expenses. For the six months ended April 30, 2007, a summary of the Advisory fees, Administration fees, associated waivers, expense reimbursements and custody credits are as follows:
| | | | | | | | | | | | | | | | | | | | | | | | | | | | | | | | | |
| | | Advisory Fees | | Administration Fees | | | | | | |
| | | Contractual
Annual
Rate | | | Effective
Annual
Rate | | | Waiver | | Contractual
Annual
Rate | | | Effective
Annual
Rate | | | Waiver | | Expense
Reimbursements | | Custody
Credits | | Total
Expense
Reduction |
| Fund | | | | Rate | | | Amount | | | | Rate | | | Amount | | | |
Core Equity | | 0.75 | % | | 0.75 | % | | — | % | | $ | — | | 0.15 | % | | 0.15 | % | | — | % | | $ | — | | $ | — | | $ | 3 | | $ | 3 |
Growth | | 0.75 | | | 0.75 | | | — | | | | — | | 0.15 | | | 0.15 | | | — | | | | — | | | 20,513 | | | 865 | | | 21,378 |
Value | | 0.75 | | | 0.75 | | | — | | | | — | | 0.15 | | | 0.15 | | | — | | | | — | | | — | | | 471 | | | 471 |
MidCap Growth | | 0.75 | | | 0.75 | | | — | | | | — | | 0.15 | | | 0.15 | | | — | | | | — | | | — | | | 11 | | | 11 |
International Equity | | 1.50 | | | 0.97 | | | 0.53 | | | | 230,809 | | 0.15 | | | 0.15 | | | — | | | | — | | | — | | | 163 | | | 230,972 |
Asset Allocation | | 0.20 | | | — | | | 0.20 | | | | 17,500 | | 0.15 | | | 0.08 | | | 0.07 | | | | 6,125 | | | 34,635 | | | — | | | 58,260 |
Bond | | 0.50 | | | 0.50 | | | — | | | | — | | 0.15 | | | 0.15 | | | — | | | | — | | | — | | | 4,320 | | | 4,320 |
Short-Term Government | | 0.50 | | | 0.50 | | | — | | | | — | | 0.15 | | | 0.15 | | | — | | | | — | | | 125,587 | | | 581 | | | 126,168 |
National Tax-Free Intermediate Bond | | 0.50 | | | 0.50 | | | — | | | | — | | 0.15 | | | 0.15 | | | — | | | | — | | | 95,747 | | | 291 | | | 96,038 |
Missouri Tax-Free Intermediate Bond | | 0.50 | | | 0.50 | | | — | | | | — | | 0.15 | | | 0.15 | | | — | | | | — | | | 119,425 | | | 255 | | | 119,680 |
Kansas Tax-Free Intermediate Bond | | 0.50 | | | 0.50 | | | — | | | | — | | 0.15 | | | 0.15 | | | — | | | | — | | | 80,736 | | | 24 | | | 80,760 |
Pursuant to a Shareholder Administrative Services Plan adopted by its Board of Trustees, the Funds may enter into agreements with service organizations, such as banks and financial institutions, which may include the Adviser and its affiliates (“Service Organizations”), under which they will render shareholder administration support services. For these services, the Service Organizations are entitled to receive fees from a Fund at an annual rate of up to 0.25% of the average daily net asset value of Fund shares beneficially owned by clients of such Service Organizations. For the six months ended April 30, 2007, Commerce Bank has retained approximately $390,700 in shareowner servicing fees.
| | |
| 4. OTHER TRANSACTIONS WITH RELATED PARTIES | | |
Certain Trustees participate in a Deferred Compensation Plan, as amended and restated (the “Plan”), which allows eligible non-affiliated Trustees as described in the Plan to defer the receipt of all or a portion of the Trustees’ fees payable. Under the Plan, such Trustees have deferred fees treated as if they had been invested by The Commerce Funds in the shares of one or more Funds of the Trust. All amounts payable to the Trustees under the Plan are accrued at least quarterly and determined based on the performance of such investments.
58
COMMERCE FUNDS
|
| 5. INVESTMENT TRANSACTIONS |
The cost of purchases and proceeds from sales and maturities of long-term securities and of the Underlying Funds (for the Asset Allocation Fund) for the six months ended April 30, 2007, were as follows:
| | | | | | | | | | | | |
| Fund | | Purchase of
U.S. Government
and agency
obligations | | Purchases
(excluding
U.S. Government
and agency
obligations) | | Sales and
maturities of
U.S. Government
and agency
obligations | | Sales
and maturities
(excluding
U.S. Government
and agency
obligations) |
Core Equity | | $ | — | | $ | 81,659,595 | | $ | — | | $ | 167,012,957 |
Growth | | | — | | | 104,303,676 | | | — | | | 83,127,474 |
Value | | | — | | | 42,129,965 | | | — | | | 35,954,554 |
MidCap Growth | | | — | | | 36,048,045 | | | — | | | 29,594,757 |
International Equity | | | — | | | 29,993,001 | | | — | | | 30,298,537 |
Asset Allocation | | | — | | | 3,371,477 | | | — | | | 2,835,494 |
Bond | | | 16,348,496 | | | 9,096,680 | | | 9,116,513 | | | 16,609,076 |
Short-Term Government | | | 12,327,842 | | | 806,987 | | | 12,465,241 | | | — |
National Tax-Free Intermediate Bond | | | — | | | 28,322,874 | | | — | | | 32,813,185 |
Missouri Tax-Free Intermediate Bond | | | — | | | 18,941,689 | | | — | | | 21,576,616 |
Kansas Tax-Free Intermediate Bond | | | — | | | 4,121,492 | | | — | | | 6,448,654 |
For the six months ended April 30, 2007, Goldman Sachs received approximately $4,600 of brokerage commissions earned from portfolio transactions, including futures transactions, executed on behalf of the International Equity Fund.
As a result of the National Tax-Free Intermediate Bond, Missouri Tax-Free Intermediate Bond and Kansas Tax-Free Intermediate Bond Funds’ (each a “Tax-Free Fund” and collectively the “Tax-Free Funds”) ability to invest a large percentage of their assets in obligations of issuers within certain states, they are subject to possible concentration risks associated with economic, political or legal developments or industrial or regional matters specifically affecting such states.
Under normal market conditions, the National Tax-Free Intermediate Bond Fund invests at least 80% of its assets plus any borrowings for investment purposes (measured at the time of purchase) in municipal securities issued by or on behalf of the states, the District of Columbia or the U.S. Government, and their respective authorities, agencies, instrumentalities and political sub-divisions, the income from which is exempt from regular federal income and federal alternative minimum taxes. The Missouri Tax-Free Intermediate Bond Fund and the Kansas Tax-Free Intermediate Bond Fund invest at least 80% of their assets plus any borrowings for investment purposes (measured at the time of purchase) in Missouri and Kansas municipal
59
COMMERCE FUNDS
Notes to Financial Statements (continued)
April 30, 2007 (Unaudited)
|
| 6. CONCENTRATION OF RISK (continued) |
securities, respectively, the income from which is exempt from regular federal income tax, federal alternative minimum taxes and Missouri and Kansas state taxes, respectively. Alternatively, at least 80% of the Tax-Free Funds’ distributed income must be exempt from such taxes.
For each of the Missouri and Kansas Tax-Free Funds, the actual payment of principal and interest on Missouri and Kansas municipal securities is dependent on the Missouri General Assembly and the Kansas legislature, respectively, allotting money each fiscal year for these payments.
The International Equity Fund may invest a portion of its assets in emerging markets. Emerging markets securities may be more volatile than securities from more developed countries. At times, the securities held by the International Equity Fund may be subject to abrupt and severe price declines.
The investments of the Asset Allocation Fund are concentrated in Underlying Funds and the Fund’s investment performance is directly related to the investment performance of the Underlying Funds held by it.
As of the Funds’ most recent fiscal year end, October 31, 2006, the Funds’ capital loss carryforwards and certain timing differences on a tax basis were as follows. Expiration occurs on October 31 of the year indicated:
| | | | | | | | | | | | | | | | | | | | | | | | |
| | | Core Equity | | | Growth | | | Value | | | MidCap
Growth | | | International
Equity | | | Asset
Allocation | |
Capital loss carryforward: | | | | | | | | | | | | | | | | | | | | | | | | |
Expiring 2010 | | $ | — | | | $ | (18,454,089 | ) | | $ | — | | | $ | — | | | $ | — | | | $ | — | |
| | | | |
Timing differences (dividends payable, deferred compensation) | | $ | (8,208 | ) | | $ | (6,308 | ) | | $ | (4,293 | ) | | $ | (2,949 | ) | | $ | (2,949 | ) | | $ | (672 | ) |
|
At April 30, 2007, the Funds’ aggregate security unrealized gains and losses based on cost for U.S. federal income tax purposes were as follows: | |
| | | Core Equity | | | Growth | | | Value | | | MidCap
Growth | | | International
Equity | | | Asset
Allocation | |
Tax Cost | | $ | 98,228,132 | | | $ | 180,422,440 | | | $ | 109,542,311 | | | $ | 89,111,539 | | | $ | 73,853,444 | | | $ | 16,499,563 | |
| | | | |
Gross unrealized gain | | | 23,998,407 | | | | 29,168,804 | | | | 25,392,425 | | | | 17,632,809 | | | | 20,279,375 | | | | 1,640,270 | |
Gross unrealized loss | | | (1,056,116 | ) | | | (2,172,872 | ) | | | (941,321 | ) | | | (921,595 | ) | | | (1,448,126 | ) | | | (110,523 | ) |
| | | | |
Net unrealized security gain | | $ | 22,942,291 | | | $ | 26,995,932 | | | $ | 24,451,104 | | | $ | 16,711,214 | | | $ | 18,831,249 | | | $ | 1,529,747 | |
The difference between book-basis and tax-basis unrealized gains (losses) is primarily attributable to wash sales and return of capital distributions from underlying fund investments.
60
COMMERCE FUNDS
|
| 7. TAX INFORMATION (continued) |
As of the Funds’ most recent fiscal year ended, October 31, 2006, the Funds’ capital loss carryforwards and certain timing differences on a tax basis were as follows. Expiration occurs on October 31 of the year indicated:
| | | | | | | | | | | | | | | | | | | | |
| | | Bond | | | Short-Term
Government | | | National Tax-Free
Intermediate Bond | | | Missouri Tax-Free
Intermediate Bond | | | Kansas Tax-Free
Intermediate Bond | |
Capital loss carryforward: | | | | | | | | | | | | | | | | | | | | |
Expiring 2008 | | $ | (2,326,968 | ) | | $ | (1,045,396 | ) | | $ | — | | | $ | — | | | $ | — | |
Expiring 2010 | | | (8,311,371 | ) | | | (679,994 | ) | | | — | | | | — | | | | — | |
Expiring 2011 | | | — | | | | (2,174,462 | ) | | | — | | | | — | | | | — | |
Expiring 2012 | | | (6,311,963 | ) | | | (3,771,248 | ) | | | — | | | | — | | | | — | |
Expiring 2013 | | | (540,238 | ) | | | (2,538,488 | ) | | | — | | | | — | | | | — | |
Expiring 2014 | | | (3,576,948 | ) | | | (2,660,408 | ) | | | — | | | | — | | | | — | |
| | | | |
Total capital loss carryforward | | $ | (21,067,488 | ) | | $ | (12,869,996 | ) | | $ | — | | | $ | — | | | $ | — | |
Timing differences (dividends payable, deferred compensation) | | $ | (1,681,309 | ) | | $ | (378,209 | ) | | $ | (464,240 | ) | | $ | (491,003 | ) | | $ | (200,867 | ) |
|
At April 30, 2007, the Funds’ aggregate security unrealized gains and losses based on cost for U.S. federal income tax purposes were as follows: | |
| | | Bond | | | Short-Term
Government | | | National Tax-Free
Intermediate Bond | | | Missouri Tax-Free
Intermediate Bond | | | Kansas Tax-Free Intermediate Bond | |
Tax Cost | | $ | 536,634,533 | | | $ | 116,763,351 | | | $ | 146,084,175 | | | $ | 152,625,331 | | | $ | 66,697,461 | |
| | | | |
Gross unrealized gain | | | 7,942,452 | | | | 578,296 | | | | 3,608,145 | | | | 3,676,190 | | | | 1,340,016 | |
Gross unrealized loss | | | (8,075,899 | ) | | | (2,550,286 | ) | | | (175,549 | ) | | | (88,373 | ) | | | (75,428 | ) |
| | | | |
Net unrealized security gain (loss) | | $ | (133,437 | ) | | $ | (1,971,990 | ) | | $ | 3,432,596 | | | $ | 3,587,817 | | | $ | 1,264,588 | |
The difference between book-basis and tax-basis unrealized gains (losses) is primarily attributable to wash sales and differing treatment of accretion of market discount and premium amortization.
Approval of Advisory and Sub-Advisory Agreements — The Trustees oversee the management of the Trust, and review the investment performance and expenses of the Funds at regularly scheduled meetings held during the Funds’ fiscal year. In addition, the Trustees determine annually whether to reapprove and continue the Trust’s investment advisory agreement (“Advisory Agreement”) with Commerce Investment Advisors, Inc. (the “Adviser”) for the Funds and the investment sub-advisory agreement (“Sub-Advisory Agreement,” and together with the Advisory Agreement, the “Agreements”) with AllianceBernstein L.P. (the “Sub-Adviser”) for the International Equity Fund.
The Advisory Agreement and Sub-Advisory Agreement for the Funds were most recently approved by the Trustees, including all of the Trustees who are not parties to the Advisory Agreement or “interested persons” (as such term is defined in the 1940 Act) of any party thereto (the “non-interested Trustees”), on November 14-15, 2006 (“Annual Contract Meeting”).
61
COMMERCE FUNDS
Notes to Financial Statements (continued)
April 30, 2007 (Unaudited)
| | |
| 8. OTHER MATTERS (continued) | | |
In preparation for the Trustees’ consideration of the Sub-Advisory Agreement at the Annual Contract Meeting, the Trustees reviewed information regarding the following topics at a meeting held on August 8, 2006 (the “August Meeting”): the qualifications of the sub-Adviser to provide investment advisory services to the Funds, its policies regarding brokerage, trade allocations and similar matters and the investment performance of the International Equity Fund.
Prior to the August and Annual Contract Meetings, the Board of Trustees received written materials provided by the Adviser and Sub-Adviser relating to the Trustees’ consideration of these Agreements, and at these meetings, the Trustees also considered the Adviser’s and Sub-Adviser’s oral presentations and discussed the information that had been provided. In connection with their deliberations, the Trustees were advised by their independent legal counsel regarding their responsibilities under applicable law and met separately in executive sessions with independent counsel without members of management present.
In evaluating the Advisory and Sub-Advisory Agreements at the August and the Annual Contract Meetings, the Trustees relied upon their knowledge, resulting from their meetings and other interactions throughout the year, of the Adviser and Sub-Adviser, their services and the Funds. Both in meetings specifically dedicated to the review of the Advisory and Sub-Advisory Agreements and meetings held during the year, the Trustees reviewed materials relating to the Adviser’s and Sub-Adviser’s investment management services. These materials included: (i) information on the investment performance of the Funds in comparison to other similar mutual funds and benchmark performance indices; (ii) general investment outlooks in the markets in which the Funds invest; (iii) compliance reports; and (iv) expenses borne by the Funds.
Specifically in connection with the Trustees’ approval of the Advisory and Sub-Advisory Agreements, the Trustees reviewed, among other things, information relating to: (i) the terms of the Agreements; (ii) the Funds’ investment performance over different time periods in comparison to the investment performance of mutual fund peer groups and categories selected by Lipper Inc. (“Lipper”), a third-party provider of mutual fund data; (iii) the contractual investment advisory fees, the actual investment advisory fees (after voluntary waiver and expense reimbursements) and the total expenses borne by the Funds in comparison to those borne by mutual fund peer groups and categories selected by Lipper; (iv) the investment advisory fees charged by the Sub-Adviser to its institutional accounts; (v) the scope and depth of the Adviser’s and Sub-Adviser’s resources; (vi) the Adviser’s and Sub-Adviser’s staffing for the Funds and the experience of the portfolio managers; (vii) the Adviser’s and Sub-Adviser’s financial resources and their ability to attract and retain portfolio management talent; (viii) the fees paid by the Funds to the Adviser and its affiliates for services, and the expenses incurred by them in connection with the provision of those services; (ix) the benefits received by the Adviser and its affiliates from their relationships with the Funds; (x) potential economies of scale; and (xi) the fees paid by the Adviser to the Sub-Adviser for services to the International Equity Fund, and the expenses incurred by the Sub-Adviser for those services. In addition, the Trustees considered the Adviser’s and Sub-Adviser’s willingness to meet with representatives of the Board of Trustees outside of the Board meetings in preparation for the Annual Contract Meeting and to provide information requested by the Trustees.
62
COMMERCE FUNDS
| | |
| 8. OTHER MATTERS (continued) | | |
In connection with their approval of the Advisory Agreement for each of the Funds and the Sub-Advisory Agreement for the International Equity Fund, the Trustees gave weight to various factors, but did not identify any single factor as controlling their decision. As part of their review, the Trustees considered the nature, extent and quality of the services provided by the Adviser and Sub-Adviser. In this regard, the Trustees considered both the investment advisory services, and the other non-advisory services, that are provided to the Funds by the Adviser. These services include services as the Funds’ Co-Administrator. The Trustees also considered that many of the Funds’ shareholders had other client relationships with affiliates of the Adviser. The Trustees concluded that the Adviser and Sub-Adviser was able to commit, and had committed, substantial financial and other resources to the operations of the Funds and were able to provide quality services to the Funds. In addition, the Trustees concluded that the Adviser had committed substantial resources to monitor the Sub-Adviser’s investment performance and compliance program. The Trustees also believed that the Adviser and Sub-Adviser had made significant commitments to address regulatory compliance requirements applicable to the Funds, and, with regard to the Asset Allocation Fund, the Trustees determined that the advisory services provided to that Fund were not duplicative of any advisory services provided at the underlying fund level.
The Trustees also considered the investment performance of the Funds. In this regard, the Trustees considered whether the Funds had operated within their respective investment objectives, as well as their compliance with their investment restrictions. They also compared the investment performance of the Funds to the performance of other SEC-registered funds and to rankings and ratings issued by third parties. For Funds that had been in existence for the applicable periods, this information on the Funds’ investment performance was provided for one, three, five and ten years. In addition, the Trustees considered the Funds’ investment performance relative to their respective performance benchmarks and in light of the objectives and credit parameters applicable to the Funds, as well as the investor base the Funds are intended to serve. In addition, the Trustees reviewed the consistency of the Adviser’s and Sub-Adviser’s investment approach for the Funds.
In particular, they considered the Adviser’s efforts to improve its quantitative investment model during the year, which had resulted in improved performance of most of the Equity Funds and the Asset Allocation Fund. They also considered the recent improvement in the Bond and Short-Term Government Funds and the continued strong performance of the Tax-Free Funds over the ten-year period.
Based on the information provided, the Trustees believed that the investment performance of the Funds was, in general, competitive in light of the factors mentioned above, including the Funds’ investment policies and the nature of their shareholder base. In reaching this conclusion, the Trustees also reviewed, among other things, the relative performance of the Funds as compared to the mutual fund categories established by third parties, and their benchmarks for different time periods. They also noted again the potential impact of the relative risk parameters of the different Funds. For example, the Short-Term Government Fund did not invest in any corporate debt. The Trustees concluded that Commerce was devoting appropriate resources in its efforts to provide favorable investment results for the Funds.
63
COMMERCE FUNDS
Notes to Financial Statements (continued)
April 30, 2007 (Unaudited)
| | |
| 8. OTHER MATTERS (continued) | | |
The Trustees also considered the Funds’ contractual advisory fee rates; the Funds’ total operating expense ratios; the Adviser’s and Sub-Adviser’s voluntary fee waivers and expense reimbursements with respect to the Funds; and whether a consistent methodology was in place in determining the fees and expenses of the respective Funds. In addition, the Trustees considered the fees paid by the Funds to the Adviser and its affiliates for shareholder servicing and Co-Administration services, and reviewed information as to whether the Adviser and Sub-Adviser had passed, and were likely to continue to pass, benefits from their economies of scale to shareholders. In this regard, the Trustees considered the Adviser’s view that the Funds may be sharing in economies of scale through the Adviser’s voluntary expense caps for certain of the Funds and the fact that the Adviser was not charging any advisory fees to the Asset Allocation Fund. In addition, the Trustees considered the level of assets in the Funds, which had been declining over the past 18 months; the information provided by the Adviser and Sub-Adviser relating to their costs of the services provided by them and the profits realized by them as well as their profits in comparison to published profitability rates of other investment advisers; and information comparing the fee rates charged by the Adviser (which does not include fee breakpoints) and the Sub-Adviser (which does include breakpoints) with the fee rates charged by other, unaffiliated investment managers to their clients. The Trustees also considered the Adviser’s efforts to reduce Fund expenses, including reductions negotiated in custodian, fund accounting and transfer agent fees as well as other cost reductions implemented by the Adviser. Moreover, the Trustees also considered the Adviser’s profitability in the past year in light of Fund asset levels.
The Trustees also considered information provided by the Adviser on its use of and benefits from soft dollars in connection with the Funds’ brokerage, noting that the Sub-Adviser did not use soft dollars with respect to the International Equity Fund’s trades. The Trustees also considered the Adviser’s and Sub-Adviser’s efforts to achieve best execution on behalf of the Funds and their review policies.
Information on the services rendered by the Adviser and Sub-Adviser to the Funds, the fee rates paid by the Funds under the Advisory and Sub-Advisory Agreements and the Funds’ total operating expense ratios were compared to similar information for other mutual funds advised by the Adviser and Sub-Adviser and other, unaffiliated investment management firms. Many of the comparisons of the Funds’ fee rates and total operating expense ratios were prepared by Lipper. These comparisons assisted the Trustees in evaluating the reasonableness of the investment advisory fees paid by the Funds. Information was also provided on the fee rates charged by the Sub-Adviser to institutional accounts it manages. In addition, the Trustees noted the Adviser’s voluntary and contractual undertakings to limit certain Funds’ total expenses ratios to specified levels and the Sub-Adviser’s contractual fee waiver.
After deliberation, the Trustees concluded at the Annual Contract Meeting with respect to all of the funds, that the fees paid by funds were reasonable in light of the services provided by the Adviser and Sub-Adviser, their costs and the Funds’ current and reasonably foreseeable asset levels, and that the Advisory and Sub-Advisory Agreements should be approved and continued.
64
COMMERCE FUNDS
| | |
| 8. OTHER MATTERS (continued) | | |
New Accounting Pronouncements — On July 13, 2006, the Financial Accounting Standards Board (“FASB”) released FASB Interpretation No. 48 “Accounting for Uncertainty in Income Taxes” (“FIN 48”). FIN 48 provides guidance for how uncertain tax positions should be recognized, measured, presented and disclosed in the financial statements. FIN 48 requires the evaluation of tax positions taken or expected to be taken in the course of preparing the Funds’ tax returns to determine whether the tax positions are “more-likely-than-not” of being sustained by the applicable tax authority. Tax positions not deemed to meet the more-likely-than-not threshold would be recorded as a tax benefit or expense in the current year. Adoption of FIN 48 is required for fiscal years beginning after December 15, 2006 and is to be applied to all open tax years as of the effective date. Recent SEC guidance allows implementing FIN 48 in Fund net asset value calculations as late as the Fund’s last net asset value calculation in the first required financial statement reporting period. As a result, the Funds will incorporate FIN 48 in their April 30, 2008 semiannual report. At this time, the investment adviser is evaluating the implications of FIN 48 and its impact in the financial statements has not yet been determined.
On September 15, 2006, the FASB released Statement Financial Accounting Standard No. 157 “Fair Value Measurement” (“FAS 157”) which provides enhanced guidance for using fair value to measure assets and liabilities. The standard requires companies to provide expanded information about the assets and liabilities measured at fair value and the potential effect of these fair valuations on an entity’s financial performance. The standard does not expand the use of fair value in any new circumstances, but provides clarification on acceptable fair valuation methods and applications. FAS 157 is effective for financial statements issued for fiscal years beginning after November 15, 2007. The investment adviser does not believe the adoption of FAS 157 will impact the amounts reported in the financial statements, however, additional disclosures will be required.
Fund Liquidation — At a meeting held on May 9, 2007, the Board of Trustees of the Trust approved a proposal to liquidate the Commerce Core Equity Fund pursuant to a board-approved Plan of Liquidation. It is expected that the Fund will be liquidated in July 2007.
65
COMMERCE FUNDS
Notes to Financial Statements (continued)
April 30, 2007 (Unaudited)
| | |
| 10. SUMMARY OF SHARE TRANSACTIONS | | |
Share activity is as follows:
| | | | | | | | | | | | | | |
| | | Core Equity Fund | | | Growth Fund | |
| | | Shares | | | Dollars | | | Shares | | | Dollars | |
| For the Six Months Ended April 30, 2007 | | | | | | | | |
Institutional Shares | | | | | | | | | | | | | | |
Shares sold | | 393,970 | | | $ | 6,254,524 | | | 1,571,496 | | | $ | 41,158,846 | |
Reinvestment of dividends and distributions | | 398,595 | | | | 6,289,773 | | | 5,455 | | | | 141,399 | |
Shares repurchased | | (4,374,524 | ) | | | (70,673,172 | ) | | (803,698 | ) | | | (21,082,701 | ) |
| NET INCREASE (DECREASE) | | (3,581,959 | ) | | $ | (58,128,875 | ) | | 773,253 | | | $ | 20,217,544 | |
| | | | |
| | | | | | | | | | | | | | |
| | | | | |
| For the Year Ended October 31, 2006 | | | | | | | | |
Institutional Shares | | | | | | | | | | | | | | |
Shares sold | | 695,285 | | | $ | 11,850,744 | | | 1,623,689 | | | $ | 39,506,771 | |
Reinvestment of dividends and distributions | | 33,591 | | | | 571,651 | | | 22,225 | | | | 530,079 | |
Shares repurchased | | (3,790,245 | ) | | | (64,810,760 | ) | | (1,666,117 | ) | | | (39,822,524 | ) |
Shares converted from Service to Institutional | | 6,818 | | | | 107,392 | | | 141,359 | | | | 8,402,420 | |
| | | |
| | | (3,054,551 | ) | | | (52,280,973 | ) | | 121,156 | | | | 8,616,746 | |
Service Shares(a) | | | | | | | | | | | | | | |
Shares sold | | 267 | | | | 4,768 | | | 1,122 | | | | 26,030 | |
Reinvestment of dividends and distributions | | 363 | | | | 6,170 | | | 387 | | | | 9,053 | |
Shares repurchased | | (523 | ) | | | (8,819 | ) | | (27,973 | ) | | | (654,734 | ) |
Shares converted from Service to Institutional | | (6,818 | ) | | | (107,392 | ) | | (141,359 | ) | | | (8,402,420 | ) |
| | | |
| | | (6,711 | ) | | | (105,273 | ) | | (167,823 | ) | | | (9,022,071 | ) |
| NET INCREASE (DECREASE) | | (3,061,262 | ) | | $ | (52,386,246 | ) | | (46,667 | ) | | $ | (405,325 | ) |
(a) | | On February 3, 2006, all outstanding Service Shares were converted into Institutional Shares. |
66
COMMERCE FUNDS
| | | | | | | | | | | | | | | | | | | |
| Value Fund | | | MidCap Growth Fund | | | International Equity Fund | |
| Shares | | | Dollars | | | Shares | | | Dollars | | | Shares | | | Dollars | |
| | | | | |
| | | | | |
| 786,734 | | | $ | 22,396,290 | | | 379,797 | | | $ | 13,303,959 | | | 359,806 | | | $ | 10,071,359 | |
| 259,746 | | | | 7,253,416 | | | 2,240 | | | | 78,038 | | | 66,715 | | | | 1,823,992 | |
| (514,644 | ) | | | (14,768,642 | ) | | (213,728 | ) | | | (7,503,129 | ) | | (322,564 | ) | | | (9,065,930 | ) |
| 531,836 | | | $ | 14,881,064 | | | 168,309 | | | $ | 5,878,868 | | | 103,957 | | | $ | 2,829,421 | |
| | | | | |
| | | | | | | | | | | | | | | | | | | |
| | | | | | | | |
| | | | | |
| | | | | |
| 651,466 | | | $ | 17,831,642 | | | 700,340 | | | $ | 22,534,967 | | | 538,257 | | | $ | 13,600,490 | |
| 31,696 | | | | 844,739 | | | — | | | | — | | | 6,779 | | | | 159,594 | |
| (1,093,637 | ) | | | (29,654,384 | ) | | (649,500 | ) | | | (20,466,609 | ) | | (870,640 | ) | | | (21,503,148 | ) |
| 18,744 | | | | 418,318 | | | 36,705 | | | | 2,072,920 | | | 11,217 | | | | 293,822 | |
| (391,731 | ) | | | (10,559,685 | ) | | 87,545 | | | | 4,141,278 | | | (314,387 | ) | | | (7,449,242 | ) |
| | | | | |
| 151 | | | | 3,905 | | | 275 | | | | 8,019 | | | 139 | | | | 3,116 | |
| 113 | | | | 2,945 | | | — | | | | — | | | 105 | | | | 2,443 | |
| (701 | ) | | | (18,247 | ) | | (7,334 | ) | | | (220,489 | ) | | (7,158 | ) | | | (168,248 | ) |
| (18,744 | ) | | | (418,318 | ) | | (36,705 | ) | | | (2,072,920 | ) | | (11,217 | ) | | | (293,822 | ) |
| (19,181 | ) | | | (429,715 | ) | | (43,764 | ) | | | (2,285,390 | ) | | (18,131 | ) | | | (456,511 | ) |
| (410,912 | ) | | $ | (10,989,400 | ) | | 43,781 | | | $ | 1,855,888 | | | (332,518 | ) | | $ | (7,905,753 | ) |
67
COMMERCE FUNDS
Notes to Financial Statements (continued)
April 30, 2007 (Unaudited)
| | |
| 10. SUMMARY OF SHARE TRANSACTIONS (continued) | | |
Share activity is as follows:
| | | | | | | | | | | | | | |
| | | Asset Allocation Fund | | | Bond Fund | |
| | | Shares | | | Dollars | | | Shares | | | Dollars | |
| For the Six Months Ended April 30, 2007 | |
Institutional Shares | | | | | | | | | | | | | | |
Shares sold | | 67,715 | | | $ | 1,366,040 | | | 1,865,992 | | | $ | 33,976,622 | |
Reinvestment of dividends and distributions | | 79,862 | | | | 1,566,861 | | | 159,413 | | | | 2,905,704 | |
Shares repurchased | | (72,230 | ) | | | (1,441,628 | ) | | (2,830,583 | ) | | | (51,485,917 | ) |
| NET INCREASE (DECREASE) | | 75,347 | | | $ | 1,491,273 | | | (805,178 | ) | | $ | (14,603,591 | ) |
| | | | |
| | | | | | | | | | | | | | |
| | | | | |
| For the Year Ended October 31, 2006 | |
Institutional Shares | | | | | | | | | | | | | | |
Shares sold | | 157,262 | | | $ | 3,166,146 | | | 5,585,436 | | | $ | 100,424,470 | |
Reinvestment of dividends and distributions | | 113,584 | | | | 2,230,887 | | | 325,870 | | | | 5,846,986 | |
Shares repurchased | | (258,959 | ) | | | (5,291,871 | ) | | (7,055,653 | ) | | | (126,589,263 | ) |
Shares converted from Service to Institutional | | 18,315 | | | | 322,490 | | | 20,429 | | | | 434,076 | |
| | | |
| | | 30,202 | | | | 427,652 | | | (1,123,918 | ) | | | (19,883,731 | ) |
Service Shares(a) | | | | | | | | | | | | | | |
Shares sold | | 49 | | | | 1,058 | | | 4,339 | | | | 78,873 | |
Reinvestment of dividends and distributions | | 2,417 | | | | 47,354 | | | 340 | | | | 6,178 | |
Shares repurchased | | (1,194 | ) | | | (23,610 | ) | | (43,946 | ) | | | (801,037 | ) |
Shares converted from Service to Institutional | | (18,315 | ) | | | (322,490 | ) | | (20,429 | ) | | | (434,076 | ) |
| | | |
| | | (17,043 | ) | | | (297,688 | ) | | (59,696 | ) | | | (1,150,062 | ) |
| NET INCREASE (DECREASE) | | 13,159 | | | $ | 129,964 | | | (1,183,614 | ) | | $ | (21,033,793 | ) |
(a) | | On February 3, 2006, all outstanding Service Shares were converted into Institutional Shares. |
68
COMMERCE FUNDS
| | | | | | | | | | | | | | | | | | | | | | | | | | |
| Short-Term Government Fund | | | National Tax-Free
Intermediate Bond Fund | | | Missouri Tax-Free
Intermediate Bond Fund | | | Kansas Tax-Free
Intermediate Bond Fund | |
| Shares | | | Dollars | | | Shares | | | Dollars | | | Shares | | | Dollars | | | Shares | | | Dollars | |
| | | | | | | | | | | | |
| | | | | | | | | | | | |
| 307,223 | | | $ | 5,390,842 | | | 628,636 | | | $ | 11,874,338 | | | 721,448 | | | $ | 13,502,644 | | | 458,258 | | | $ | 8,428,011 | |
| 31,740 | | | | 557,350 | | | 15,857 | | | | 301,522 | | | 10,808 | | | | 207,154 | | | 9,351 | | | | 175,342 | |
| (1,184,458 | ) | | | (20,787,433 | ) | | (798,761 | ) | | | (15,148,637 | ) | | (911,914 | ) | | | (17,451,859 | ) | | (474,135 | ) | | | (8,868,784 | ) |
| (845,495 | ) | | $ | (14,839,241 | ) | | (154,268 | ) | | $ | (2,972,777 | ) | | (179,658 | ) | | $ | (3,742,061 | ) | | (6,526 | ) | | $ | (265,431 | ) |
| | | |
| | | | | | | | | | | | |
| | | | | | | | | | | | | | | |
| | | | | | | | | | | | |
| | | | | | | | | | | | |
| 1,394,405 | | | $ | 24,409,595 | | | 1,433,749 | | | $ | 27,158,319 | | | 1,689,507 | | | $ | 32,321,736 | | | 766,511 | | | $ | 14,297,601 | |
| 78,619 | | | | 1,374,476 | | | 22,329 | | | | 423,014 | | | 30,658 | | | | 585,726 | | | 8,296 | | | | 154,849 | |
| (3,041,620 | ) | | | (53,206,221 | ) | | (1,910,585 | ) | | | (36,183,894 | ) | | (2,426,189 | ) | | | (46,321,144 | ) | | (829,566 | ) | | | (15,490,619 | ) |
| 25,581 | | | | 572,448 | | | 66 | | | | 1,199 | | | 40,205 | | | | 784,262 | | | 99,517 | | | | 1,860,924 | |
| (1,543,015 | ) | | | (26,849,702 | ) | | (454,441 | ) | | | (8,601,362 | ) | | (665,819 | ) | | | (12,629,420 | ) | | 44,758 | | | | 822,755 | |
| | | | | | | | | | | | |
| 1,596 | | | | 28,065 | | | — | | | | — | | | — | | | | — | | | — | | | | — | |
| 253 | | | | 4,438 | | | 1 | | | | 19 | | | 131 | | | | 2,515 | | | 710 | | | | 13,320 | |
| (41,053 | ) | | | (721,770 | ) | | (4 | ) | | | (82 | ) | | (4 | ) | | | (82 | ) | | (23,544 | ) | | | (441,980 | ) |
| (25,581 | ) | | | (572,448 | ) | | (66 | ) | | | (1,199 | ) | | (40,205 | ) | | | (784,262 | ) | | (99,517 | ) | | | (1,860,924 | ) |
| (64,785 | ) | | | (1,261,715 | ) | | (69 | ) | | | (1,262 | ) | | (40,078 | ) | | | (781,829 | ) | | (122,351 | ) | | | (2,289,584 | ) |
| (1,607,800 | ) | | $ | (28,111,417 | ) | | (454,510 | ) | | $ | (8,062,624 | ) | | (705,897 | ) | | $ | (13,411,249 | ) | | (77,593 | ) | | $ | (1,466,829 | ) |
69
COMMERCE FUNDS
Financial Highlights
Selected Data for a Share Outstanding Throughout Each Period
| | | | | | | | | | | | | | | | | | | | | | | | | | | |
| | | | | Income (loss) from
investment operations | | | Distributions
to shareholders | |
| Year—Share Class | | Net asset
value,
beginning
of period | | Net
investment
income
(loss)(a) | | | Net realized
and unrealized
gain (loss) | | | Total from
investment
operations | | | From net
investment
income | | | From net
realized
gains | | | Total
distributions | |
CORE EQUITY FUND | | | | | | | | | | | | | | | | | | | | | | | | | | | |
For the Six Months Ended April 30, (Unaudited) | | | | | | | | | | | | | | | | | | | | | | | | | | | |
2007—Institutional | | $ | 17.97 | | $ | 0.05 | | | $ | 1.04 | | | $ | 1.09 | | | $ | (0.05 | ) | | $ | (2.58 | ) | | $ | (2.63 | ) |
For the Years Ended October 31, | | | | | | | | | | | | | | | | | | | | | | | | | | | |
2006—Institutional(f) | | | 16.97 | | | 0.10 | | | | 1.86 | | | | 1.96 | | | | (0.10 | ) | | | (0.86 | ) | | | (0.96 | ) |
2005—Institutional | | | 15.90 | | | 0.14 | (e) | | | 1.07 | | | | 1.21 | | | | (0.14 | ) | | | — | | | | (0.14 | ) |
2005—Service | | | 15.89 | | | 0.08 | (e) | | | 1.09 | | | | 1.17 | | | | (0.10 | ) | | | — | | | | (0.10 | ) |
2004—Institutional | | | 14.46 | | | 0.05 | | | | 1.44 | | | | 1.49 | | | | (0.05 | ) | | | — | | | | (0.05 | ) |
2004—Service | | | 14.46 | | | — | | | | 1.45 | | | | 1.45 | | | | (0.02 | ) | | | — | | | | (0.02 | ) |
2003—Institutional | | | 12.57 | | | 0.09 | | | | 1.89 | | | | 1.98 | | | | (0.09 | ) | | | — | | | | (0.09 | ) |
2003—Service | | | 12.57 | | | 0.06 | | | | 1.89 | | | | 1.95 | | | | (0.06 | ) | | | — | | | | (0.06 | ) |
2002—Institutional | | | 14.70 | | | 0.10 | | | | (2.14 | ) | | | (2.04 | ) | | | (0.09 | ) | | | — | (c) | | | (0.09 | ) |
2002—Service | | | 14.70 | | | 0.06 | | | | (2.13 | ) | | | (2.07 | ) | | | (0.06 | ) | | | — | (c) | | | (0.06 | ) |
| | | | | | | | | | | | | | | | | | | | | | | | | | | |
GROWTH FUND | | | | | | | | | | | | | | | | | | | | | | | | | | | |
For the Six Months Ended April 30, (Unaudited) | | | | | | | | | | | | | | | | | | | | | | | | | | | |
2007—Institutional | | $ | 25.56 | | $ | 0.01 | | | $ | 1.64 | | | $ | 1.65 | | | $ | (0.04 | ) | | $ | — | | | $ | (0.04 | ) |
For the Years Ended October 31, | | | | | | | | | | | | | | | | | | | | | | | | | | | |
2006—Institutional(f) | | | 22.56 | | | 0.04 | | | | 3.08 | | | | 3.12 | | | | (0.12 | ) | | | — | | | | (0.12 | ) |
2005—Institutional | | | 20.82 | | | 0.14 | (e) | | | 1.63 | | | | 1.77 | | | | (0.03 | ) | | | — | | | | (0.03 | ) |
2005—Service | | | 20.42 | | | 0.09 | (e) | | | 1.59 | | | | 1.68 | | | | — | | | | — | | | | — | |
2004—Institutional | | | 20.50 | | | (0.07 | ) | | | 0.39 | | | | 0.32 | | | | — | | | | — | | | | — | |
2004—Service | | | 20.15 | | | (0.12 | ) | | | 0.39 | | | | 0.27 | | | | — | | | | — | | | | — | |
2003—Institutional | | | 17.52 | | | (0.04 | ) | | | 3.02 | | | | 2.98 | | | | — | | | | — | | | | — | |
2003—Service | | | 17.27 | | | (0.09 | ) | | | 2.97 | | | | 2.88 | | | | — | | | | — | | | | — | |
2002—Institutional | | | 20.03 | | | (0.07 | ) | | | (2.44 | ) | | | (2.51 | ) | | | — | | | | — | | | | — | |
2002—Service | | | 19.80 | | | (0.11 | ) | | | (2.42 | ) | | | (2.53 | ) | | | — | | | | — | | | | — | |
(a) | | Calculated based on average shares outstanding methodology. |
(b) | | Assumes investment at the net asset value at the beginning of the period, reinvestment of all dividends and distributions, a complete redemption of the investment at the net asset value at the end of the period and no sales charges. Total return would be reduced if sales or redemption charges were taken into account. Total returns for periods less than one full year are not annualized. Returns do not reflect the deduction of taxes that a shareholder would pay on fund distributions or the redemption of fund shares. |
(c) | | Amount is less than $0.005 per share. |
(e) | | Reflects income recognized from a special dividend which amount to $0.07 and $0.14, per share and 0.41% and 0.62% of average net assets for the Core Equity and Growth Funds, respectively. |
(f) | | On February 3, 2006, all outstanding Service Shares were converted into Institutional Shares. |
| | |
| 70 | | The accompanying notes are an integral part of these financial statements. |
COMMERCE FUNDS
| | | | | | | | | | | | | | | | | | | | | |
| | | | | | | | | | | | | | Ratios assuming no
expense reductions | | | | |
Net asset
value, end
of period | | Total
return(b) | | | Net assets
at end of
period
(in 000s) | | Ratio of net expenses to average net assets | | | Ratio of net investment income (loss) to average net assets | | | Ratio of total expenses to average net assets | | | Ratio of net investment income (loss) to
average net assets | | | Portfolio
turnover
rate | |
| | | | | | | | | | | | | | | | | | | | | |
| | | | | | | | | | | | | | | | | | | | | |
| $16.43 | | 6.74 | % | | $ | 121,774 | | 1.11 | %(d) | | 0.66 | %(d) | | 1.11 | %(d) | | 0.66 | %(d) | | 54 | % |
| | | | | | | | | | | | | | | | | | | | | |
| 17.97 | | 11.91 | | | | 197,557 | | 1.10 | | | 0.58 | | | 1.10 | | | 0.58 | | | 53 | |
| 16.97 | | 7.61 | | | | 238,356 | | 1.08 | | | 0.81 | (e) | | 1.09 | | | 0.80 | (e) | | 19 | |
| 16.96 | | 7.35 | | | | 114 | | 1.33 | | | 0.50 | (e) | | 1.34 | | | 0.49 | (e) | | 19 | |
| 15.90 | | 10.30 | | | | 245,509 | | 1.03 | | | 0.30 | | | 1.05 | | | 0.28 | | | 31 | |
| 15.89 | | 10.02 | | | | 93 | | 1.28 | | | 0.03 | | | 1.30 | | | 0.01 | | | 31 | |
| 14.46 | | 15.83 | | | | 262,935 | | 1.04 | | | 0.71 | | | 1.06 | | | 0.69 | | | 43 | |
| 14.46 | | 15.55 | | | | 65 | | 1.29 | | | 0.46 | | | 1.31 | | | 0.44 | | | 43 | |
| 12.57 | | (13.90 | ) | | | 243,569 | | 0.98 | | | 0.68 | | | 1.00 | | | 0.66 | | | 23 | |
| 12.57 | | (14.11 | ) | | | 40 | | 1.23 | | | 0.44 | | | 1.25 | | | 0.42 | | | 23 | |
| | | | | | | | | | | | | | | | | | | | | |
| | | | | | | | | | | | | | | | | | | | | |
| | | | | | | | | | | | | | | | | | | | | |
| $27.17 | | 6.44 | % | | $ | 205,775 | | 1.13 | %(d) | | 0.07 | %(d) | | 1.15 | %(d) | | 0.05 | %(d) | | 44 | % |
| | | | | | | | | | | | | | | | | | | | | |
| 25.56 | | 13.86 | | | | 173,813 | | 1.13 | | | 0.16 | | | 1.18 | | | 0.11 | | | 47 | |
| 22.56 | | 8.52 | | | | 150,676 | | 1.13 | | | 0.64 | (e) | | 1.23 | | | 0.54 | (e) | | 40 | |
| 22.10 | | 8.23 | | | | 3,710 | | 1.38 | | | 0.44 | (e) | | 1.48 | | | 0.34 | (e) | | 40 | |
| 20.82 | | 1.56 | | | | 170,513 | | 1.13 | | | (0.35 | ) | | 1.15 | | | (0.37 | ) | | 41 | |
| 20.42 | | 1.34 | | | | 5,261 | | 1.38 | | | (0.60 | ) | | 1.40 | | | (0.62 | ) | | 41 | |
| 20.50 | | 17.01 | | | | 204,539 | | 1.12 | | | (0.24 | ) | | 1.14 | | | (0.26 | ) | | 60 | |
| 20.15 | | 16.68 | | | | 5,513 | | 1.37 | | | (0.49 | ) | | 1.39 | | | (0.51 | ) | | 60 | |
| 17.52 | | (12.53 | ) | | | 173,077 | | 1.12 | | | (0.33 | ) | | 1.14 | | | (0.35 | ) | | 53 | |
| 17.27 | | (12.73 | ) | | | 5,015 | | 1.37 | | | (0.58 | ) | | 1.39 | | | (0.60 | ) | | 53 | |
71
COMMERCE FUNDS
Financial Highlights
Selected Data for a Share Outstanding Throughout Each Period
| | | | | | | | | | | | | | | | | | | | | | | | | | | |
| | | | | Income (loss) from investment operations | | | Distributions to shareholders | |
| Year—Share Class | | Net asset value, beginning of period | | Net investment income
(loss)(a) | | | Net realized and unrealized gain (loss) | | | Total from investment operations | | | From net investment income | | | From net realized gains | | | Total distributions | |
VALUE FUND | | | | | | | | | | | | | | | | | | | | | | | | | | | |
For the Six Months Ended April 30, (Unaudited) | | | | | | | | | | | | | | | | | | | | | | | | | | | |
2007—Institutional | | $ | 29.53 | | $ | 0.18 | | | $ | 1.90 | | | $ | 2.08 | | | $ | (0.18 | ) | | $ | (2.41 | ) | | $ | (2.59 | ) |
For the Years Ended October 31, | | | | | | | | | | | | | | | | | | | | | | | | | | | |
2006—Institutional(c) | | | 24.96 | | | 0.35 | | | | 4.66 | | | | 5.01 | | | | (0.34 | ) | | | (0.10 | ) | | | (0.44 | ) |
2005—Institutional | | | 22.70 | | | 0.27 | | | | 2.28 | | | | 2.55 | | | | (0.29 | ) | | | — | | | | (0.29 | ) |
2005—Service | | | 22.71 | | | 0.21 | | | | 2.28 | | | | 2.49 | | | | (0.23 | ) | | | — | | | | (0.23 | ) |
2004—Institutional | | | 20.92 | | | 0.22 | | | | 1.78 | | | | 2.00 | | | | (0.22 | ) | | | — | | | | (0.22 | ) |
2004—Service | | | 20.93 | | | 0.16 | | | | 1.79 | | | | 1.95 | | | | (0.17 | ) | | | — | | | | (0.17 | ) |
2003—Institutional | | | 18.07 | | | 0.25 | | | | 2.84 | | | | 3.09 | | | | (0.24 | ) | | | — | | | | (0.24 | ) |
2003—Service | | | 18.08 | | | 0.20 | | | | 2.85 | | | | 3.05 | | | | (0.20 | ) | | | — | | | | (0.20 | ) |
2002—Institutional | | | 21.05 | | | 0.24 | | | | (2.99 | ) | | | (2.75 | ) | | | (0.23 | ) | | | — | | | | (0.23 | ) |
2002—Service | | | 21.05 | | | 0.19 | | | | (2.99 | ) | | | (2.80 | ) | | | (0.17 | ) | | | — | | | | (0.17 | ) |
| | | | | | | | | | | | | | | | | | | | | | | | | | | |
MIDCAP GROWTH FUND | | | | | | | | | | | | | | | | | | | | | | | | | | | |
For the Six Months Ended April 30, (Unaudited) | | | | | | | | | | | | | | | | | | | | | | | | | | | |
2007—Institutional | | $ | 33.61 | | $ | (0.06 | ) | | $ | 2.92 | | | $ | 2.86 | | | $ | — | | | $ | (0.04 | ) | | $ | (0.04 | ) |
For the Years Ended October 31, | | | | | | | | | | | | | | | | | | | | | | | | | | | |
2006—Institutional(c) | | | 28.45 | | | (0.11 | ) | | | 5.27 | | | | 5.16 | | | | — | | | | — | | | | — | |
2005—Institutional | | | 24.72 | | | (0.14 | ) | | | 3.87 | | | | 3.73 | | | | — | | | | — | | | | — | |
2005—Service | | | 24.15 | | | (0.20 | ) | | | 3.77 | | | | 3.57 | | | | — | | | | — | | | | — | |
2004—Institutional | | | 23.61 | | | (0.14 | ) | | | 1.25 | | | | 1.11 | | | | — | | | | — | | | | — | |
2004—Service | | | 23.12 | | | (0.20 | ) | | | 1.23 | | | | 1.03 | | | | — | | | | — | | | | — | |
2003—Institutional | | | 18.44 | | | (0.14 | ) | | | 5.31 | | | | 5.17 | | | | — | | | | — | | | | — | |
2003—Service | | | 18.10 | | | (0.18 | ) | | | 5.20 | | | | 5.02 | | | | — | | | | — | | | | — | |
2002—Institutional | | | 21.37 | | | (0.20 | ) | | | (2.73 | ) | | | (2.93 | ) | | | — | | | | — | | | | — | |
2002—Service | | | 21.04 | | | (0.24 | ) | | | (2.70 | ) | | | (2.94 | ) | | | — | | | | — | | | | — | |
(a) | | Calculated based on average shares outstanding methodology. |
(b) | | Assumes investment at the net asset value at the beginning of the period, reinvestment of all dividends and distributions, a complete redemption of the investment at the net asset value at the end of the period and no sales charges. Total return would be reduced if sales or redemption charges were taken into account. Total returns for periods less than one full year are not annualized. Returns do not reflect the deduction of taxes that the shareholder would pay on fund distributions or the redemption of fund shares. |
(c) | | On February 3, 2006, all outstanding Service Shares were converted into Institutional Shares. |
| | |
| 72 | | The accompanying notes are an integral part of these financial statements. |
COMMERCE FUNDS
| | | | | | | | | | | | | | | | | | | | | |
| | | | | | | | | | | | | | Ratios assuming
no expense reductions | | | | |
Net asset value, end of period | | Total return(b) | | | Net assets at end of period (in 000s) | | Ratio of net expenses to average net assets | | | Ratio of net investment income (loss) to average net assets | | | Ratio of
total expenses to average net assets | | | Ratio of net investment income (loss) to average net assets | | | Portfolio turnover rate | |
| | | | | | | | | | | | | | | | | | | | | |
| | | | | | | | | | | | | | | | | | | | | |
| $29.02 | | 7.43 | % | | $ | 134,038 | | 1.14 | %(d) | | 1.24 | %(d) | | 1.14 | %(d) | | 1.24 | %(d) | | 29 | % |
| | | | | | | | | | | | | | | | | | | | | |
| 29.53 | | 20.29 | | | | 120,685 | | 1.18 | | | 1.28 | | | 1.18 | | | 1.28 | | | 49 | |
| 24.96 | | 11.26 | | | | 111,761 | | 1.18 | (c) | | 1.12 | | | 1.19 | | | 1.11 | | | 37 | |
| 24.97 | | 10.97 | | | | 479 | | 1.43 | (c) | | 0.89 | | | 1.44 | | | 0.88 | | | 37 | |
| 22.70 | | 9.61 | | | | 108,775 | | 1.14 | | | 1.00 | | | 1.16 | | | 0.98 | | | 81 | |
| 22.71 | | 9.33 | | | | 614 | | 1.39 | | | 0.75 | | | 1.41 | | | 0.73 | | | 81 | |
| 20.92 | | 17.29 | | | | 122,881 | | 1.12 | | | 1.31 | | | 1.14 | | | 1.29 | | | 76 | |
| 20.93 | | 16.99 | | | | 584 | | 1.37 | | | 1.07 | | | 1.39 | | | 1.05 | | | 76 | |
| 18.07 | | (13.18 | ) | | | 102,049 | | 1.06 | | | 1.15 | | | 1.08 | | | 1.13 | | | 72 | |
| 18.08 | | (13.37 | ) | | | 567 | | 1.31 | | | 0.89 | | | 1.33 | | | 0.87 | | | 72 | |
| | | | | | | | | | | | | | | | | | | | | |
| | | | | | | | | | | | | | | | | | | | | |
| | | | | | | | | | | | | | | | | | | | | |
| $36.43 | | 8.52 | % | | $ | 105,717 | | 1.19 | %(d) | | (0.35 | )%(d) | | 1.19 | %(d) | | (0.35 | )%(d) | | 30 | % |
| | | | | | | | | | | | | | | | | | | | | |
| 33.61 | | 0.18 | | | | 91,874 | | 1.22 | | | (0.35 | ) | | 1.22 | | | (0.35 | ) | | 64 | |
| 28.45 | | 15.09 | | | | 75,274 | | 1.28 | | | (0.54 | ) | | 1.29 | | | (0.55 | ) | | 87 | |
| 27.72 | | 14.78 | | | | 1,213 | | 1.53 | | | (0.79 | ) | | 1.54 | | | (0.80 | ) | | 87 | |
| 24.72 | | 4.70 | | | | 76,917 | | 1.23 | | | (0.57 | ) | | 1.25 | | | (0.59 | ) | | 123 | |
| 24.15 | | 4.46 | | | | 1,526 | | 1.48 | | | (0.82 | ) | | 1.50 | | | (0.84 | ) | | 123 | |
| 23.61 | | 28.04 | | | | 78,744 | | 1.22 | | | (0.70 | ) | | 1.24 | | | (0.72 | ) | | 89 | |
| 23.12 | | 27.73 | | | | 1,474 | | 1.47 | | | (0.95 | ) | | 1.49 | | | (0.97 | ) | | 89 | |
| 18.44 | | (13.71 | ) | | | 65,005 | | 1.21 | | | (0.91 | ) | | 1.23 | | | (0.93 | ) | | 93 | |
| 18.10 | | (13.97 | ) | | | 1,203 | | 1.45 | | | (1.15 | ) | | 1.47 | | | (1.17 | ) | | 93 | |
73
COMMERCE FUNDS
Financial Highlights
Selected Data for a Share Outstanding Throughout Each Period
| | | | | | | | | | | | | | | | | | | | | | | | | | |
| | | | | Income (loss) from investment operations | | | Distributions to shareholders | |
| Year—Share Class | | Net asset
value,
beginning
of period | | Net
investment
income(a) | | Net realized
and unrealized
gain (loss) | | | Total from
investment
operations | | | From net
investment
income | | | From net
realized
gains | | | Total
distributions | |
INTERNATIONAL EQUITY FUND | |
For the Six Months Ended April 30, (Unaudited) | | | | | | | | | | | | | | | | | | | | | | | | | | |
2007—Institutional | | $ | 27.26 | | $ | 0.07 | | $ | 3.76 | | | $ | 3.83 | | | $ | (0.26 | ) | | $ | (0.98 | ) | | $ | (1.24 | ) |
For the Years Ended October 31, | | | | | | | | | | | | | | | | | | | | | | | | | | |
2006—Institutional(d) | | | 21.80 | | | 0.13 | | | 5.54 | | | | 5.67 | | | | (0.21 | ) | | | — | | | | (0.21 | ) |
2005—Institutional | | | 19.18 | | | 0.19 | | | 2.72 | | | | 2.91 | | | | (0.29 | ) | | | — | | | | (0.29 | ) |
2005—Service | | | 18.98 | | | 0.17 | | | 2.66 | | | | 2.83 | | | | (0.24 | ) | | | — | | | | (0.24 | ) |
2004—Institutional | | | 16.86 | | | 0.21 | | | 2.36 | | | | 2.57 | | | | (0.25 | ) | | | — | | | | (0.25 | ) |
2004—Service | | | 16.69 | | | 0.17 | | | 2.33 | | | | 2.50 | | | | (0.21 | ) | | | — | | | | (0.21 | ) |
2003—Institutional | | | 14.61 | | | 0.23 | | | 2.08 | | | | 2.31 | | | | (0.06 | ) | | | — | | | | (0.06 | ) |
2003—Service | | | 14.47 | | | 0.18 | | | 2.06 | | | | 2.24 | | | | (0.02 | ) | | | — | | | | (0.02 | ) |
2002—Institutional | | | 16.99 | | | 0.06 | | | (2.44 | ) | | | (2.38 | ) | | | — | | | | — | | | | — | |
2002—Service | | | 16.87 | | | 0.02 | | | (2.42 | ) | | | (2.40 | ) | | | — | | | | — | | | | — | |
| | | | | | | | | | | | | | | | | | | | | | | | | | |
ASSET ALLOCATION FUND | | | | | | | | | | | | | | | | | | | | | | | | | | |
For the Six Months Ended April 30, (Unaudited) | | | | | | | | | | | | | | | | | | | | | | | | | | |
2007—Institutional | | $ | 20.85 | | $ | 0.21 | | $ | 1.09 | | | $ | 1.30 | | | $ | (0.18 | ) | | $ | (1.73 | ) | | $ | (1.91 | ) |
For the Years Ended October 31, | | | | | | | | | | | | | | | | | | | | | | | | | | |
2006—Institutional(d) | | | 21.38 | | | 0.49 | | | 2.07 | | | | 2.56 | | | | (0.48 | ) | | | (2.61 | ) | | | (3.09 | ) |
2005—Institutional | | | 21.01 | | | 0.34 | | | 1.41 | | | | 1.75 | | | | (0.33 | ) | | | (1.05 | ) | | | (1.38 | ) |
2005—Service | | | 21.01 | | | 0.28 | | | 1.41 | | | | 1.69 | | | | (0.28 | ) | | | (1.05 | ) | | | (1.33 | ) |
2004—Institutional | | | 20.42 | | | 0.36 | | | 0.95 | | | | 1.31 | | | | (0.40 | ) | | | (0.32 | ) | | | (0.72 | ) |
2004—Service | | | 20.41 | | | 0.31 | | | 0.95 | | | | 1.26 | | | | (0.34 | ) | | | (0.32 | ) | | | (0.66 | ) |
2003—Institutional | | | 18.48 | | | 0.39 | | | 1.94 | | | | 2.33 | | | | (0.37 | ) | | | (0.02 | ) | | | (0.39 | ) |
2003—Service | | | 18.48 | | | 0.34 | | | 1.93 | | | | 2.27 | | | | (0.32 | ) | | | (0.02 | ) | | | (0.34 | ) |
For the Period Ended October 31, | | | | | | | | | | | | | | | | | | | | | | | | | | |
2002—Institutional (commenced September 27, 2002) | | | 18.00 | | | 0.03 | | | 0.45 | | | | 0.48 | | | | — | | | | — | | | | — | |
2002—Service (commenced September 27, 2002) | | | 18.00 | | | 0.03 | | | 0.45 | | | | 0.48 | | | | — | | | | — | | | | — | |
(a) | | Calculated based on average shares outstanding methodology. |
(b) | | Assumes investment at the net asset value at the beginning of the period, reinvestment of all dividends and distributions, a complete redemption of the investment at the net asset value at the end of the period and no sales charges. Total return would be reduced if sales or redemption charges were taken into account. Total returns for periods less than one full year are not annualized. Returns do not reflect the deduction of taxes that the shareholder would pay on fund distributions or the redemption of fund shares. |
(d) | | On February 3, 2006, all outstanding Service Shares were converted into Institutional Shares. |
(e) | | Expense ratios exclude expenses of the Underlying Funds. |
| | |
| 74 | | The accompanying notes are an integral part of these financial statements. |
COMMERCE FUNDS
| | | | | | | | | | | | | | | | | | | | | |
| | | | | | | | | | | | | | Ratios assuming no expense reductions | | | | |
Net asset
value, end
of period | | Total
return(b) | | | Net assets
at end of
period (in 000s) | | Ratio of net expenses to average net assets | | | Ratio of net investment income to average net assets | | | Ratio of total expenses to average net assets | | | Ratio of net investment
income (loss) to
average net assets | | | Portfolio
turnover
rate | |
| | | | | | | | | | | | | | | | | | | | | |
| | | | | | | | | | | | | | | | | | | | | |
| $29.85 | | 14.48 | % | | $ | 93,744 | | 1.64 | %(c) | | 0.52 | %(c) | | 2.17 | %(c) | | (0.01 | )%(c) | | 35 | % |
| | | | | | | | | | | | | | | | | | | | | |
| 27.26 | | 26.16 | | | | 82,802 | | 1.72 | | | 0.53 | | | 2.29 | | | (0.04 | ) | | 68 | |
| 21.80 | | 15.26 | | | | 73,058 | | 1.57 | | | 0.94 | | | 2.27 | | | 0.24 | | | 103 | |
| 21.57 | | 14.98 | | | | 391 | | 1.82 | | | 0.82 | | | 2.52 | | | 0.12 | | | 103 | |
| 19.18 | | 15.35 | | | | 108,231 | | 1.32 | | | 1.11 | | | 2.06 | | | 0.37 | | | 23 | |
| 18.98 | | 15.04 | | | | 481 | | 1.57 | | | 0.93 | | | 2.31 | | | 0.19 | | | 23 | |
| 16.86 | | 15.87 | | | | 147,956 | | 1.25 | | | 1.52 | | | 1.98 | | | 0.79 | | | 24 | |
| 16.69 | | 15.47 | | | | 407 | | 1.50 | | | 1.19 | | | 2.23 | | | 0.46 | | | 24 | |
| 14.61 | | (14.01 | ) | | | 112,347 | | 1.55 | | | 0.38 | | | 2.18 | | | (0.25 | ) | | 98 | |
| 14.47 | | (14.23 | ) | | | 382 | | 1.80 | | | 0.12 | | | 2.43 | | | (0.51 | ) | | 98 | |
| | | | | | | | | | | | | | | | | | | | | |
| | | | | | | | | | | | | | | | | | | | | |
| | | | | | | | | | | | | | | | | | | | | |
| $20.24 | | 6.60 | % | | $ | 17,991 | | 0.35 | %(c)(e) | | 2.08 | %(c) | | 1.02 | %(c)(e) | | 1.41 | %(c) | | 16 | % |
| | | | | | | | | | | | | | | | | | | | | |
| 20.85 | | 13.19 | | | | 16,958 | | 0.35 | (e) | | 2.42 | | | 0.98 | (e) | | 1.79 | | | 55 | |
| 21.38 | | 8.56 | | | | 16,747 | | 0.35 | (e) | | 1.62 | | | 1.15 | (e) | | 0.82 | | | 39 | |
| 21.37 | | 8.23 | | | | 364 | | 0.60 | (e) | | 1.36 | | | 1.40 | (e) | | 0.56 | | | 39 | |
| 21.01 | | 6.57 | | | | 18,726 | | 0.35 | (e) | | 1.75 | | | 1.07 | (e) | | 1.03 | | | 34 | |
| 21.01 | | 6.36 | | | | 449 | | 0.60 | (e) | | 1.48 | | | 1.32 | (e) | | 0.76 | | | 34 | |
| 20.42 | | 12.72 | | | | 20,801 | | 0.35 | (e) | | 2.07 | | | 2.29 | (e) | | 0.13 | | | 47 | |
| 20.41 | | 12.40 | | | | 437 | | 0.60 | (e) | | 1.82 | | | 2.54 | (e) | | (0.12 | ) | | 47 | |
| | | | | | | | | | | | | | | | | | | | | |
| 18.48 | | 2.67 | | | | 18,234 | | 0.35 | (c)(e) | | 2.80 | (c) | | 81.34 | (c)(e) | | (78.19 | )(c) | | — | |
| 18.48 | | 2.67 | | | | 428 | | 0.60 | (c)(e) | | 1.93 | (c) | | 81.59 | (c)(e) | | (79.06 | )(c) | | — | |
75
COMMERCE FUNDS
Financial Highlights
Selected Data for a Share Outstanding Throughout Each Period
| | | | | | | | | | | | | | | | | | |
| | | | | Income (loss) from investment operations | | Distributions to shareholders from net investment income | |
| Year—Share Class | | Net asset value, beginning of period | | Net investment income(a) | | | Net realized and unrealized gain (loss) | | | Total from investment operations | |
BOND FUND | | | | | | | | | | | | | | | | | | |
For the Six Months Ended April 30, (Unaudited) | | | | | | | | | | | | | | | | | | |
2007—Institutional | | $ | 18.12 | | $ | 0.40 | | | $ | 0.21 | | | $ | 0.61 | | $ | (0.43 | ) |
For the Years Ended October 31, | | | | | | | | | | | | | | | | | | |
2006—Institutional(g) | | | 18.12 | | | 0.78 | | | | 0.06 | | | | 0.84 | | | (0.84 | ) |
2005—Institutional | | | 18.71 | | | 0.76 | | | | (0.49 | ) | | | 0.27 | | | (0.86 | ) |
2005—Service | | | 18.72 | | | 0.71 | | | | (0.47 | ) | | | 0.24 | | | (0.82 | ) |
2004—Institutional | | | 18.73 | | | 0.85 | | | | 0.03 | | | | 0.88 | | | (0.90 | ) |
2004—Service | | | 18.74 | | | 0.80 | | | | 0.03 | | | | 0.83 | | | (0.85 | ) |
2003—Institutional | | | 19.09 | | | 0.94 | | | | (0.24 | ) | | | 0.70 | | | (1.06 | ) |
2003—Service | | | 19.10 | | | 0.90 | | | | (0.25 | ) | | | 0.65 | | | (1.01 | ) |
2002—Institutional | | | 19.71 | | | 1.07 | (c) | | | (0.57 | )(c) | | | 0.50 | | | (1.12 | ) |
2002—Service | | | 19.73 | | | 1.03 | (c) | | | (0.58 | )(c) | | | 0.45 | | | (1.08 | ) |
| | | | | | | | | | | | | | | | | | |
SHORT-TERM GOVERNMENT FUND | | | | | | | | | | | | | | | | | | |
For the Six Months Ended April 30, (Unaudited) | | | | | | | | | | | | | | | | | | |
2007—Institutional | | $ | 17.56 | | $ | 0.33 | | | $ | 0.07 | | | $ | 0.40 | | $ | (0.38 | ) |
For the Years Ended October 31, | | | | | | | | | | | | | | | | | | |
2006—Institutional(g) | | | 17.57 | | | 0.61 | | | | 0.11 | | | | 0.72 | | | (0.73 | ) |
2005—Institutional | | | 18.16 | | | 0.53 | | | | (0.42 | ) | | | 0.11 | | | (0.70 | ) |
2005—Service | | | 18.17 | | | 0.48 | | | | (0.42 | ) | | | 0.06 | | | (0.66 | ) |
2004—Institutional | | | 18.53 | | | 0.54 | | | | (0.18 | ) | | | 0.36 | | | (0.73 | ) |
2004—Service | | | 18.54 | | | 0.50 | | | | (0.19 | ) | | | 0.31 | | | (0.68 | ) |
2003—Institutional | | | 19.04 | | | 0.51 | | | | (0.22 | ) | | | 0.29 | | | (0.80 | ) |
2003—Service | | | 19.06 | | | 0.47 | | | | (0.24 | ) | | | 0.23 | | | (0.75 | ) |
2002—Institutional | | | 19.20 | | | 0.83 | (d) | | | (0.05 | )(d) | | | 0.78 | | | (0.94 | ) |
2002—Service | | | 19.21 | | | 0.78 | (d) | | | (0.04 | )(d) | | | 0.74 | | | (0.89 | ) |
(a) | | Calculated based on average shares outstanding methodology. |
(b) | | Assumes investment at the net asset value at the beginning of the period, reinvestment of all dividends and distributions, a complete redemption of the investment at the net asset value at the end of the period and no sales charges. Total return would be reduced if sales or redemption charges were taken into account. Total returns for periods less than one full year are not annualized. Returns do not reflect the deduction of taxes that a shareholder would pay on fund distributions or the redemption of fund shares. |
(c) | | As required, effective November 1, 2001, the Fund has adopted the provisions of the AICPA Audit and Accounting Guide for Investment Companies and began amortizing/accreting premiums and discounts on debt securities. The effect of this change for the year ended October 31, 2002 was to decrease net investment income per share by $0.05, increase net realized and unrealized gains and losses per share by $0.05, and decrease the ratio of net investment income to average net assets with and without expense reductions by 0.26% for each class. Per share ratios and supplemental data for years prior to November 1, 2001 have not been restated to reflect this change in presentation. |
(d) | | As required, effective November 1, 2001, the Fund has adopted the provisions of the AICPA Audit and Accounting Guide for Investment Companies and began amortizing/accreting premiums and discounts on debt securities. The effect of this change for the year ended October 31, 2002 was to decrease net investment income per share by $0.09, increase net realized and unrealized gains and losses per share by $0.09, and decrease the ratio of net investment income to average net assets with and without expense reductions by 0.46% for each class. Per share ratios and supplemental data for years prior to November 1, 2001 have not been restated to reflect this change in presentation. |
(f) | | Reflects an increase of 0.06% to total return and 0.04% of average net assets per share due to a payment made by the Trust’s Accounting Agent relating to a distribution in excess of net investment income. |
(g) | | On February 3, 2006, all outstanding Service Shares were converted into Institutional Shares. |
| | |
| 76 | | The accompanying notes are an integral part of these financial statements. |
COMMERCE FUNDS
| | | | | | | | | | | | | | | | | | | | | |
| | | | | | | | | | | | | | Ratios assuming no expense reductions | | | | |
Net asset value, end of period | | Total return(b) | | | Net assets at end of period (in 000s) | | Ratio of net expenses to average net assets | | | Ratio of net investment income to
average net assets | | | Ratio of total expenses to average net assets | | | Ratio of net investment income to average net assets | | | Portfolio turnover rate | |
| | | | | | | | | | | | | | | | | | | | | |
| | | | | | | | | | | | | | | | | | | | | |
| $18.30 | | 3.40 | % | | $ | 539,514 | | 0.83 | %(e) | | 4.48 | %(e) | | 0.83 | %(e) | | 4.48 | %(e) | | 5 | % |
| | | | | | | | | | | | | | | | | | | | | |
| 18.12 | | 4.76 | | | | 548,713 | | 0.85 | | | 4.35 | | | 0.85 | | | 4.35 | | | 38 | |
| 18.12 | | 1.46 | (f) | | | 569,200 | | 0.83 | | | 4.11 | (f) | | 0.84 | | | 4.10 | (f) | | 23 | |
| 18.14 | | 1.26 | (f) | | | 1,083 | | 1.08 | | | 3.83 | (f) | | 1.09 | | | 3.82 | (f) | | 23 | |
| 18.71 | | 4.80 | | | | 608,773 | | 0.79 | | | 4.54 | | | 0.81 | | | 4.52 | | | 37 | |
| 18.72 | | 4.54 | | | | 949 | | 1.04 | | | 4.29 | | | 1.06 | | | 4.27 | | | 37 | |
| 18.73 | | 3.71 | | | | 650,903 | | 0.79 | | | 4.97 | | | 0.81 | | | 4.95 | | | 26 | |
| 18.74 | | 3.45 | | | | 1,165 | | 1.04 | | | 4.72 | | | 1.06 | | | 4.70 | | | 26 | |
| 19.09 | | 2.69 | | | | 728,021 | | 0.72 | | | 5.59 | (c) | | 0.74 | | | 5.57 | (c) | | 34 | |
| 19.10 | | 2.38 | | | | 1,371 | | 0.97 | | | 5.34 | (c) | | 0.99 | | | 5.32 | (c) | | 34 | |
| | | | | | | | | | | | | | | | | | | | | |
| | | | | | | | | | | | | | | | | | | | | |
| | | | | | | | | | | | | | | | | | | | | |
| $17.58 | | 2.29 | % | | $ | 115,246 | | 0.68 | %(e) | | 3.82 | %(e) | | 0.89 | %(e) | | 3.61 | %(e) | | 11 | % |
| | | | | | | | | | | | | | | | | | | | | |
| 17.56 | | 4.21 | | | | 129,940 | | 0.68 | | | 3.49 | | | 0.89 | | | 3.28 | | | 28 | |
| 17.57 | | 0.63 | | | | 157,183 | | 0.68 | | | 3.00 | | | 0.91 | | | 2.77 | | | 32 | |
| 17.57 | | 0.33 | | | | 1,139 | | 0.93 | | | 2.77 | | | 1.16 | | | 2.54 | | | 32 | |
| 18.16 | | 1.96 | | | | 219,533 | | 0.68 | | | 2.96 | | | 0.85 | | | 2.79 | | | 78 | |
| 18.17 | | 1.70 | | | | 2,032 | | 0.93 | | | 2.72 | | | 1.10 | | | 2.55 | | | 78 | |
| 18.53 | | 1.52 | | | | 259,936 | | 0.68 | | | 2.73 | | | 0.81 | | | 2.60 | | | 34 | |
| 18.54 | | 1.22 | | | | 2,867 | | 0.93 | | | 2.49 | | | 1.06 | | | 2.36 | | | 34 | |
| 19.04 | | 4.21 | | | | 184,246 | | 0.68 | | | 4.41 | (d) | | 0.82 | | | 4.27 | (d) | | 15 | |
| 19.06 | | 4.00 | | | | 2,159 | | 0.93 | | | 4.16 | (d) | | 1.07 | | | 4.02 | (d) | | 15 | |
77
COMMERCE FUNDS
Financial Highlights
Selected Data for a Share Outstanding Throughout Each Period
| | | | | | | | | | | | | | | | | | | | | | | | | | |
| | | | | Income (loss) from
investment operations | | Distributions
to shareholders | |
| Year—Share Class | | Net asset
value,
beginning
of period | | Net
investment
income(a) | | | Net realized
and unrealized
gain (loss) | | | Total from
investment
operations | | From net
investment
income | | | From net
realized
gains | | | Total
distributions | |
NATIONAL TAX-FREE INTERMEDIATE BOND FUND | |
For the Six Months Ended April 30, (Unaudited) | | | | | | | | | | | | | | | | | | | | | | | | | | |
2007—Institutional | | $ | 19.07 | | $ | 0.35 | | | $ | (0.12 | ) | | $ | 0.23 | | $ | (0.35 | ) | | $ | (0.05 | ) | | $ | (0.40 | ) |
For the Years Ended October 31, | | | | | | | | | | | | | | | | | | | | | | | | | | |
2006—Institutional(e) | | | 19.05 | | | 0.72 | | | | 0.13 | | | | 0.85 | | | (0.73 | ) | | | (0.10 | ) | | | (0.83 | ) |
2005—Institutional | | | 19.59 | | | 0.72 | | | | (0.51 | ) | | | 0.21 | | | (0.71 | ) | | | (0.04 | ) | | | (0.75 | ) |
2005—Service | | | 19.58 | | | 0.69 | | | | (0.49 | ) | | | 0.20 | | | (0.69 | ) | | | (0.04 | ) | | | (0.73 | ) |
2004—Institutional | | | 19.74 | | | 0.71 | | | | 0.17 | | | | 0.88 | | | (0.72 | ) | | | (0.31 | ) | | | (1.03 | ) |
2004—Service | | | 19.74 | | | 0.67 | | | | 0.15 | | | | 0.82 | | | (0.67 | ) | | | (0.31 | ) | | | (0.98 | ) |
2003—Institutional | | | 19.68 | | | 0.73 | | | | 0.22 | | | | 0.95 | | | (0.73 | ) | | | (0.16 | ) | | | (0.89 | ) |
2003—Service | | | 16.68 | | | 0.70 | | | | 0.20 | | | | 0.90 | | | (0.68 | ) | | | (0.16 | ) | | | (0.84 | ) |
2002—Institutional | | | 19.69 | | | 0.76 | (c) | | | 0.24 | (c) | | | 1.00 | | | (0.76 | ) | | | (0.25 | ) | | | (1.01 | ) |
2002—Service | | | 19.69 | | | 0.71 | (c) | | | 0.24 | (c) | | | 0.95 | | | (0.71 | ) | | | (0.25 | ) | | | (0.96 | ) |
| | | | | | | | | | | | | | | | | | | | | | | | | | |
MISSOURI TAX-FREE INTERMEDIATE BOND FUND | | | | | | | | | | | | | | | | | | | | |
For the Six Months Ended April 30, (Unaudited) | | | | | | | | | | | | | | | | | | | | | | | | | | |
2007—Institutional | | $ | 19.22 | | $ | 0.36 | | | $ | (0.13 | ) | | $ | 0.23 | | $ | (0.36 | ) | | $ | (0.02 | ) | | $ | (0.38 | ) |
For the Years Ended October 31, | | | | | | | | | | | | | | | | | | | | | | | | | | |
2006—Institutional(e) | | | 19.19 | | | 0.74 | | | | 0.10 | | | | 0.84 | | | (0.75 | ) | | | (0.06 | ) | | | (0.81 | ) |
2005—Institutional | | | 19.83 | | | 0.74 | | | | (0.62 | ) | | | 0.12 | | | (0.74 | ) | | | (0.02 | ) | | | (0.76 | ) |
2005—Service | | | 19.84 | | | 0.68 | | | | (0.61 | ) | | | 0.07 | | | (0.69 | ) | | | (0.02 | ) | | | (0.71 | ) |
2004—Institutional | | | 19.73 | | | 0.72 | | | | 0.14 | | | | 0.86 | | | (0.72 | ) | | | (0.04 | ) | | | (0.76 | ) |
2004—Service | | | 19.75 | | | 0.67 | | | | 0.13 | | | | 0.80 | | | (0.67 | ) | | | (0.04 | ) | | | (0.71 | ) |
2003—Institutional | | | 19.68 | | | 0.72 | | | | 0.15 | | | | 0.87 | | | (0.72 | ) | | | (0.10 | ) | | | (0.82 | ) |
2003—Service | | | 19.69 | | | 0.67 | | | | 0.16 | | | | 0.83 | | | (0.67 | ) | | | (0.10 | ) | | | (0.77 | ) |
2002—Institutional | | | 19.45 | | | 0.75 | (c) | | | 0.26 | (c) | | | 1.01 | | | (0.75 | ) | | | (0.03 | ) | | | (0.78 | ) |
2002—Service | | | 19.45 | | | 0.69 | (c) | | | 0.28 | (c) | | | 0.97 | | | (0.70 | ) | | | (0.03 | ) | | | (0.73 | ) |
(a) | | Calculated based on average shares outstanding methodology. |
(b) | | Assumes investment at the net asset value at the beginning of the period, reinvestment of all dividends and distributions, a complete redemption of the investment at the net asset value at the end of the period and no sales charges. Total return would be reduced if sales or redemption charges were taken into account. Total returns for periods less than one full year are not annualized. Returns do not reflect the deduction of taxes that a shareholder would pay on capital gains or other taxable distributions or the redemption of fund shares. |
(c) | | As required, effective November 1, 2001, the Fund has adopted the provisions of the AICPA Audit and Accounting Guide for Investment Companies and began amortizing/accreting premiums and discounts on debt securities. The effect of this change for the year ended October 31, 2002 was an impact of less than $0.01 to net investment income, net realized and unrealized gains and losses, and an increase to the ratio of net investment income to average net assets with and without expense reductions by 0.02%. Per share ratios and supplemental data for periods prior to November 1, 2001 have not been restated to reflect this change in presentation. |
(e) | | On February 3, 2006, all outstanding Service Shares were converted into Institutional Shares. |
| | |
| 78 | | The accompanying notes are an integral part of these financial statements. |
COMMERCE FUNDS
| | | | | | | | | | | | | | | | | | | | | |
| | | | | | | | | | | | | | Ratios assuming no
expense reductions | |
Net asset
value, end
of period | | Total
return(b) | | | Net assets
at end of
period
(in 000s) | | Ratio of
net expenses to
average net assets | | | Ratio of
net investment
income to
average net assets | | | Ratio of
total expenses to
average net assets | | | Ratio of
net investment
income to
average net assets | | | Portfolio
turnover
rate | |
| | | | | | | | | | | | | | | | | | | | | |
| | | | | | | | | | | | | | | | | | | | | |
| $18.90 | | 1.24 | % | | $ | 149,946 | | 0.70 | %(d) | | 3.72 | %(d) | | 0.83 | %(d) | | 3.59 | %(d) | | 19 | % |
| | | | | | | | | | | | | | | | | | | | | |
| 19.07 | | 0.05 | | | | 154,304 | | 0.70 | | | 3.80 | | | 0.88 | | | 3.62 | | | 42 | |
| 19.05 | | 1.09 | | | | 162,792 | | 0.70 | | | 3.71 | | | 0.87 | | | 3.54 | | | 48 | |
| 19.05 | | 1.01 | | | | 1 | | 0.95 | | | 3.51 | | | 1.12 | | | 3.34 | | | 48 | |
| 19.59 | | 4.56 | | | | 169,217 | | 0.70 | | | 3.67 | | | 0.84 | | | 3.53 | | | 33 | |
| 19.58 | | 4.25 | | | | 2 | | 0.95 | | | 3.47 | | | 1.09 | | | 3.33 | | | 33 | |
| 19.74 | | 4.88 | | | | 175,427 | | 0.70 | | | 3.69 | | | 0.82 | | | 3.57 | | | 57 | |
| 19.74 | | 4.64 | | | | 5 | | 0.95 | | | 3.52 | | | 1.07 | | | 3.40 | | | 57 | |
| 19.68 | | 5.30 | | | | 174,059 | | 0.70 | | | 3.93 | (c) | | 0.77 | | | 3.86 | (c) | | 42 | |
| 19.68 | | 5.05 | | | | 23 | | 0.95 | | | 3.70 | (c) | | 1.02 | | | 3.63 | (c) | | 42 | |
| | | | | | | | | | | | | | | | | | | | | |
| | | | | | | | | | | | | | | | | | | | | |
| | | | | | | | | | | | | | | | | | | | | |
| $19.07 | | 1.18 | % | | $ | 154,961 | | 0.67 | %(d) | | 3.79 | %(d) | | 0.82 | %(d) | | 3.64 | %(d) | | 12 | % |
| | | | | | | | | | | | | | | | | | | | | |
| 19.22 | | 4.48 | | | | 159,628 | | 0.65 | | | 3.87 | | | 0.88 | | | 3.64 | | | 15 | |
| 19.19 | | 0.61 | | | | 172,124 | | 0.65 | | | 3.77 | | | 0.87 | | | 3.55 | | | 19 | |
| 19.20 | | 0.36 | | | | 769 | | 0.90 | | | 3.52 | | | 1.12 | | | 3.30 | | | 19 | |
| 19.83 | | 4.44 | | | | 179,089 | | 0.65 | | | 3.65 | | | 0.83 | | | 3.47 | | | 13 | |
| 19.84 | | 4.13 | | | | 1,066 | | 0.90 | | | 3.39 | | | 1.08 | | | 3.21 | | | 13 | |
| 19.73 | | 4.50 | | | | 183,240 | | 0.65 | | | 3.64 | | | 0.81 | | | 3.48 | | | 16 | |
| 19.75 | | 4.29 | | | | 1,252 | | 0.90 | | | 3.39 | | | 1.06 | | | 3.23 | | | 16 | |
| 19.68 | | 5.31 | | | | 164,365 | | 0.65 | | | 3.88 | (c) | | 0.78 | | | 3.75 | (c) | | 20 | |
| 19.69 | | 5.10 | | | | 893 | | 0.90 | | | 3.58 | (c) | | 1.03 | | | 3.45 | (c) | | 20 | |
79
COMMERCE FUNDS
Financial Highlights
Selected Data for a Share Outstanding Throughout Each Period
| | | | | | | | | | | | | | | | | | | | | | | | | | |
| | | | | Income (loss) from
investment operations | | Distributions
to shareholders | |
| Year—Share Class | | Net asset
value,
beginning
of period | | Net
investment
income(a) | | | Net realized
and unrealized
gain (loss) | | | Total from
investment
operations | | From net
investment
income | | | From net
realized
gains | | | Total
distributions | |
KANSAS TAX-FREE INTERMEDIATE BOND FUND | |
For the Six Months Ended April 30, (Unaudited) | | | | | | | | | | | | | | | | | | | | | | | | | | |
2007—Institutional | | $ | 18.78 | | $ | 0.33 | | | $ | (0.10 | ) | | $ | 0.23 | | $ | (0.33 | ) | | $ | (0.06 | ) | | $ | (0.39 | ) |
For the Years Ended October 31, | | | | | | | | | | | | | | | | | | | | | | | | | | |
2006—Institutional(f) | | | 18.75 | | | 0.70 | | | | 0.08 | | | | 0.78 | | | (0.70 | ) | | | (0.05 | ) | | | (0.75 | ) |
2005—Institutional | | | 19.33 | | | 0.69 | | | | (0.56 | ) | | | 0.13 | | | (0.69 | ) | | | (0.02 | ) | | | (0.71 | ) |
2005—Service | | | 19.33 | | | 0.65 | | | | (0.57 | ) | | | 0.08 | | | (0.64 | ) | | | (0.02 | ) | | | (0.66 | ) |
2004—Institutional | | | 19.19 | | | 0.68 | | | | 0.17 | | | | 0.85 | | | (0.68 | ) | | | (0.03 | ) | | | (0.71 | ) |
2004—Service | | | 19.19 | | | 0.63 | | | | 0.17 | | | | 0.80 | | | (0.63 | ) | | | (0.03 | ) | | | (0.66 | ) |
2003—Institutional | | | 19.03 | | | 0.67 | | | | 0.18 | | | | 0.85 | | | (0.66 | ) | | | (0.03 | ) | | | (0.69 | ) |
2003—Service | | | 19.03 | | | 0.62 | | | | 0.18 | | | | 0.80 | | | (0.61 | ) | | | (0.03 | ) | | | (0.64 | ) |
2002—Institutional | | | 18.75 | | | 0.67 | (c) | | | 0.28 | (c) | | | 0.95 | | | (0.67 | ) | | | — | (e) | | | (0.67 | ) |
2002—Service | | | 18.75 | | | 0.62 | (c) | | | 0.29 | (c) | | | 0.91 | | | (0.63 | ) | | | — | (e) | | | (0.63 | ) |
(a) | | Calculated based on average shares outstanding methodology. |
(b) | | Assumes investment at the net asset value at the beginning of the period, reinvestment of all dividends and distributions, a complete redemption of the investment at the net asset value at the end of the period and no sales charges. Total return would be reduced if sales or redemption charges were taken into account. Total returns for periods less than one full year are not annualized. Returns do not reflect the deduction of taxes that a shareholder would pay on capital gains or other taxable distributions or the redemption of fund shares. |
(c) | | As required, effective November 1, 2001, the Fund has adopted the provisions of the AICPA Audit and Accounting Guide for Investment Companies and began amortizing/accreting premiums and discounts on debt securities. The effect of this change for year ended October 31, 2002 was an impact of less than $0.01 to net investment income, net realized and unrealized gains and losses, and an increase to the ratio of net investment income to average net assets with and without expense reductions by 0.02%. Per share ratios and supplemental data for periods prior to November 1, 2001 have not been restated to reflect this change in presentation. |
(e) | | Amount is less than $0.005 per share. |
(f) | | On February 3, 2006, all outstanding Service Shares were converted into Institutional Shares. |
| | |
| 80 | | The accompanying notes are an integral part of these financial statements. |
COMMERCE FUNDS
| | | | | | | | | | | | | | | | | | | | | | |
| | | | | | | | | | | | | | Ratios assuming no
expense reductions | | | | |
Net asset
value, end
of period | | Total
return(b) | | | Net assets
at end of
period
(in 000s) | | Ratio of
net expenses to
average net assets | | | Ratio of
net investment
income to
average net assets | | | Ratio of total
expenses to
average net assets | | | Ratio of
net investment
income to
average net assets | | | Portfolio
turnover
rate | |
| | | | | | | | | | | | | | | | | | | | | | |
| | | | | | | | | | | | | | | | | | | | | | |
| $ | 18.62 | | 1.23 | % | | $ | 68,341 | | 0.67 | %(d) | | 3.55 | %(d) | | 0.91 | %(d) | | 3.31 | %(d) | | 6 | % |
| | | | | | | | | | | | | | | | | | | | | | |
| | 18.78 | | 4.28 | | | | 69,075 | | 0.65 | | | 3.75 | | | 0.98 | | | 3.42 | | | 33 | |
| | 18.75 | | 0.68 | | | | 68,128 | | 0.65 | | | 3.64 | | | 1.00 | | | 3.29 | | | 13 | |
| | 18.75 | | 0.43 | | | | 2,294 | | 0.90 | | | 3.39 | | | 1.25 | | | 3.04 | | | 13 | |
| | 19.33 | | 4.54 | | | | 68,940 | | 0.65 | | | 3.56 | | | 0.93 | | | 3.28 | | | 8 | |
| | 19.33 | | 4.27 | | | | 2,189 | | 0.90 | | | 3.31 | | | 1.18 | | | 3.03 | | | 8 | |
| | 19.19 | | 4.52 | | | | 69,150 | | 0.65 | | | 3.47 | | | 0.90 | | | 3.22 | | | 10 | |
| | 19.19 | | 4.26 | | | | 2,176 | | 0.90 | | | 3.21 | | | 1.15 | | | 3.96 | | | 10 | |
| | 19.03 | | 5.23 | | | | 63,079 | | 0.65 | | | 3.61 | (c) | | 0.90 | | | 3.36 | (c) | | 8 | |
| | 19.03 | | 4.97 | | | | 2,121 | | 0.90 | | | 3.35 | (c) | | 1.15 | | | 3.10 | (c) | | 8 | |
81
Fund Expenses (Unaudited) – Six Months Ended April 30, 2007
As a shareholder of the Funds you incur two types of costs: (1) transaction costs, redemption fees (with respect to the International Equity Fund); and (2) ongoing costs, including management fees; shareholder servicing fees and other Fund expenses. This Example is intended to help you understand your ongoing costs (in dollars) of investing in the Fund and to compare these costs with the ongoing costs of investing in other mutual funds.
The Example is based on an investment of $1,000 invested at the beginning of the period and held for the entire period from November 1, 2006 through April 30, 2007.
Actual Expenses — The first line in the table below provides information about actual account values and actual expenses. You may use the information in this line, together with the amount you invested, to estimate the expenses that you paid over the period. Simply divide your account value by $1,000 (for example, an $8,600 account value divided by $1,000=8.6), then multiply the result by the number in the first line under the heading entitled “Expenses Paid” to estimate the expenses you paid on your account during this period.
Hypothetical Example for Comparison Purposes — The second line in the table below provides information about hypothetical account values and hypothetical expenses based on the Funds’ actual expense ratios and an assumed rate of return of 5% per year before expenses, which is not the Funds’ actual return. The hypothetical account values and expenses may not be used to estimate the actual ending account balance or expenses you paid for the period. You may use this information to compare the ongoing costs of investing in the Funds and other funds. To do so, compare this 5% hypothetical example with the 5% hypothetical examples that appear in the shareholder reports of the other funds.
Please note that the expenses shown in the table are meant to highlight your ongoing costs only and do not reflect any transactional costs, such as redemption fees, or exchange fees, but shareholders of other funds may incur such costs. For example, the information does not reflect redemption fees in Institutional Shares of the International Equity Fund. Therefore, the second line of the table is useful in comparing ongoing costs only, and will not help you determine the relative total costs of owning different funds. In addition, if these transactional costs were included, your costs would have been higher.
| | | | | | | | | | | | | | | | | | | | | | | | | | | | | | | | | | | | | | | | |
| Share Class | | Beginning Account Value 11/1/06 | | Ending Account Value 4/30/07 | | | Expenses Paid for the 6 months ended 4/30/07* | | Beginning Account Value 11/1/06 | | Ending Account Value 4/30/07 | | | Expenses Paid for the 6 months ended 4/30/07* | | Beginning Account Value 11/1/06 | | Ending Account Value 4/30/07 | | | Expenses Paid for the 6 months ended 4/30/07* | | Beginning Account
Value 11/1/06 | | Ending Account Value 4/30/07 | | | Expenses Paid for the 6 months ended 4/30/07* |
| | | Core Equity Fund | | Growth Fund | | Value Fund | | MidCap Growth Fund |
| Actual | | $ | 1,000.00 | | $ | 1,067.40 | | | $ | 5.70 | | $ | 1,000.00 | | $ | 1,064.40 | | | $ | 5.79 | | $ | 1,000.00 | | $ | 1,074.30 | | | $ | 5.88 | | $ | 1,000.00 | | $ | 1,088.20 | | | $ | 6.18 |
| Hypothetical 5% return | | | 1,000.00 | | | 1,019.28 | + | | | 5.57 | | | 1,000.00 | | | 1,019.18 | + | | | 5.67 | | | 1,000.00 | | | 1,019.12 | + | | | 5.73 | | | 1,000.00 | | | 1,018.88 | + | | | 5.97 |
| | | International Equity Fund | | Asset Allocation Fund | | Bond Fund | | Short-Term Government Fund |
| Actual | | $ | 1,000.00 | | $ | 1,144.80 | | | | 8.72 | | $ | 1,000.00 | | $ | 1,066.00 | | | | 2.34 | | $ | 1,000.00 | | $ | 1,034.00 | | | | 4.18 | | $ | 1,000.00 | | | 1,022.90 | | | | 3.42 |
| Hypothetical 5% return | | | 1,000.00 | | | 1.016.66 | + | | | 8.20 | | | 1,000.00 | | | 1,030.81 | + | | | 2.38 | | | 1,000.00 | | | 1,020.68 | + | | | 4.15 | | | 1,000.00 | | | 1,021.41 | + | | | 3.42 |
| | | National Tax-Free Intermediate Bond Fund | | Missouri Tax-Free Intermediate Bond Fund | | Kansas Tax-Free Intermediate Bond Fund | | |
| Actual | | $ | 1,000.00 | | $ | 1,012.40 | | | | 3.51 | | $ | 1,000.00 | | $ | 1,011.80 | | | | 3.34 | | $ | 1,000.00 | | $ | 1,012.30 | | | | 3.34 | | | | | | | | | | |
| Hypothetical 5% return | | | 1,000.00 | | | 1,021.31 | + | | | 3.52 | | | 1,000.00 | | | 1,021.48 | + | | | 3.35 | | | 1,000.00 | | | 1,021.48 | + | | | 3.35 | | | | | | | | | | |
* | | Expenses are calculated using each Fund’s annualized net expense ratio, which represents the ongoing expenses as a percentage of net assets for the six months ended 4/30/07. Expenses are calculated by multiplying the expense ratio by the average account value for the period; then multiplying the result by the number of days in the most recent fiscal half year; and then dividing that result by the number of days in the year. The annualized net expense ratios for the period were as follows: |
| | | | | | | | | | |
Fund | | | | | | | Fund | | | |
| Core Equity | | 1.11 | % | | | | Bond | | 0.83 | % |
| Growth | | 1.13 | | | | | Short-Term Government | | 0.68 | |
| Value | | 1.14 | | | | | National Tax-Free Intermediate Bond | | 0.70 | |
| MidCap Growth | | 1.19 | | | | | Missouri Tax-Free Intermediate Bond | | 0.67 | |
| International Equity | | 1.64 | | | | | Kansas Tax-Free Intermediate Bond | | 0.67 | |
| Asset Allocation | | 0.35 | | | | | | | | |
+ | | Hypothetical expenses are based on the Fund’s actual expense ratios and an assumed rate of return of 5% per year before expenses. |
82
COMMERCE FUNDS
The Commerce Funds
Core Equity Fund:
The Fund is subject to market risk so that the value of the securities in which it invests may go up or down in response to the prospectus of individual companies, particular industry sectors and/or general economic conditions.
Growth Fund:
The Fund is subject to market risk so that the value of the securities in which it invests may go up or down in response to the prospects of individual companies, particular industry sectors and/or general economic conditions. Investments in technology companies, who may produce or use products or services that prove commercially unsuccessful or become obsolete, may be subject to greater price volatility than securities of companies in other sectors.
Value Fund:
The Fund is subject to market risk so that the value of the securities in which it invests may go up or down in response to the prospects of individual companies, particular industry sectors and/or general economic conditions. Investments in technology companies, who may produce or use products or services that prove commercially unsuccessful or become obsolete, may be subject to greater price volatility than securities of companies in other sectors.
MidCap Growth Fund:
The Fund invests in small- and mid-capitalization securities. Generally, smaller and mid-sized companies are more vulnerable to adverse developments because of more limited product lines, markets or financial resources. As a result, the securities of smaller and mid-sized companies involve greater risks than those associated with larger, more established companies and may be subject to more abrupt or erratic trading and price movements.
International Equity Fund:
The Fund’s foreign investments may be more volatile than an investment in U.S. securities and are subject to the risks of currency fluctuation and political development.
Asset Allocation Fund:
The ability of the Asset Allocation Fund to meet is objective is directly related to the ability of the Underlying Funds to meet their objectives as well as the allocation among those funds by the manager of the Asset Allocation Fund. An investment in the Asset Allocation Fund will involve not only the expenses of the Fund itself but a proportionate share of the expenses of the Underlying Funds (including operating costs and investment management fees). The cost of this type of investment may be higher than a mutual fund that only invests in stocks and bonds. The particular underlying funds in which the Fund may invest, the equity/fixed income targets and ranges, and the investments in each underlying Fund may be changed from time to time without shareholder approval. An investment in the Commerce Asset Allocation Fund will be subject to the same risks as the underlying equity and fixed income funds in which the Fund invests. In particular, the Fund will be subject to the risk of declining stock prices, fluctuations in interest rates, and the potentially greater volatility of non-U.S. investments.
83
COMMERCE FUNDS
The Commerce Funds
Bond Fund:
Investments in fixed income securities are subject to the risks associated with debt securities including credit and interest rate risk. The guarantee on U.S. government securities applies only to the underlying securities of the Fund if held to maturity and not to the value of the Fund’s shares. Mortgage-backed securities are subject to prepayment risks, which may result in greater share price volatility. Asset-backed securities may be less liquid than other securities and therefore more difficult to value and liquidate, if necessary.
Short-Term Government Fund:
Investments in fixed income securities are subject to the risks associated with debt securities including credit and interest rate risk. The guarantee on U.S. government securities applies only to the underlying securities of the Fund if held to maturity and not to the value of the Fund’s shares. Mortgage-backed securities are subject to prepayment risks. These risks may result in greater share price volatility.
National Tax-Free Intermediate Bond Fund
Investments in fixed income securities are subject to the risks associated with debt securities including credit and interest rate risk. Investments in municipal securities can be significantly affected by political changes as well as uncertainties in the municipal market related to taxation or legislative changes. The Fund’s investments may subject shareholder to the federal alternative minimum tax and state income taxes.
Missouri Tax-Free Intermediate Bond Fund:
Investments in fixed income securities are subject to the risks associated with debt securities including credit and interest rate risk. The Fund invests its assets predominately in Missouri bonds. The actual payment of principal and interest on these bonds is dependent on the Missouri General Assembly allotting money each fiscal year for these payments. The Fund is non-diversified. Due to the small number of bonds generally held in the portfolio, the Fund may be subject to greater risks than a more diversified fund. A change in the value of any single holding may affect the overall value more than it would affect a diversified fund that holds more investments. Investments in municipal securities can be significantly affected by political changes as well as uncertainties in the municipal market related to taxation or legislative changes. In addition, the Fund’s investments may subject shareholders to federal alternative minimum tax. The investment income from this Fund may be subject to state income taxes.
Kansas Tax-Free Intermediate Bond Fund:
Investments in fixed income securities are subject to the risks associated with debt securities including credit and interest rate risk. The Fund invests its assets predominately in Kansas bonds. The actual payment of principal and interest on these bonds is dependent on the Kansas legislature allotting money each fiscal year for these payments. The Fund is non-diversified. Due to the smaller number of bonds generally held in the portfolio, the Fund may be subject to greater risks than a more diversified fund. A change in the value of any single holding may affect the overall value more than it would affect a diversified fund that holds more investments. Investments in municipal securities can be significantly affected by political changes as well as uncertainties in the municipal market related to taxation or legislative changes. In addition, the Fund’s investments may subject shareholders to federal alternative minimum tax. The investment income from this Fund may be subject to state income taxes.
84
| | |
| INVESTMENT ADVISER | | DISTRIBUTOR |
| AND CO-ADMINISTRATOR | | Goldman, Sachs & Co. |
| Commerce Investment Advisors, Inc. | | 32 Old Slip |
| 922 Walnut Street | | New York, New York 10005 |
| 4th Floor | | |
| Kansas City, Missouri 64106 | | CO-ADMINISTRATOR |
| | Goldman Sachs Asset Management |
| INVESTMENT SUB-ADVISER, | | 32 Old Slip |
| INTERNATIONAL EQUITY FUND | | New York, New York 10005 |
| AllianceBernstein, L.P. | | |
| 1345 Avenue of the Americas | | INDEPENDENT REGISTERED |
| New York, New York 10105 | | PUBLIC ACCOUNTING FIRM |
| | KPMG LLP |
| CUSTODIAN/ACCOUNTING AGENT | | 99 High Street |
| State Street Bank & Trust Company | | Boston, Massachusetts 02110 |
| 225 Franklin Street | | |
| Boston, Massachusetts 02110 | | LEGAL COUNSEL |
| | Drinker Biddle & Reath LLP |
| TRANSFER AGENT | | One Logan Square |
| Boston Financial Data Services, Inc. | | 18th and Cherry Streets |
| 330 W. 9th | | Philadelphia, Pennsylvania 19103-6996 |
| 3rd Floor | | |
| Kansas City, Missouri 64105 | | |
This Semi-Annual Report contains facts concerning The Commerce Funds’ objectives and policies, management, expenses, and other information. For more complete information about The Commerce Funds, a prospectus may be obtained by calling 1-800-995-6365. An investor should read the prospectus carefully before investing or sending money.
The Commerce Funds are advised by Commerce Investment Advisors, Inc., a subsidiary of Commerce Bank, N.A., which receives a fee for its services. The Commerce Funds are distributed by Goldman, Sachs & Co.
The Commerce Funds file their complete schedule of portfolio holdings with the Securities and Exchange Commission (the “SEC”) for the first and third quarters of each fiscal year on Form N-Q.The Funds’ Form N-Q is available on the SEC’s website at http://www.sec.gov. You may also review and obtain copies at the SEC’s Public Reference Room in Washington, D.C. Information about the Public Reference Room may be obtained by calling 1-800-SEC-0330.
A description of the policies and procedures that The Commerce Funds use to determine how to vote proxies relating to portfolio securities and information regarding how the Funds voted proxies relating to portfolio securities during the most recent 12-month period ended June 30 is available (i) without change, upon request by calling 1-800-995-6365 and (ii) on the SEC’s website at http://www.sec.gov.
This report is not authorized for distribution to prospective investors unless preceeded or accompanied by a current prospectus, which contains, more complete information about the Commerce Funds’ investment policies, fees and expenses. Investors should read the prospectus carefully before investing.
| | | | |
NOT FDIC INSURED | | MAY LOSE VALUE | | NO BANK GUARANTEE |
TRUSTEES
J. Eric Helsing, Chairman
David L. Bodde
Martin E. Galt III
Charles W. Peffer
OFFICERS
Larry Franklin, President
William Schuetter, Vice President
Angela Dew, Assistant Vice President and Chief Compliance Officer
Philip V. Giuca Jr., Assistant Treasurer
Diana E. McCarthy, Secretary
George Djurasovic, Assistant Secretary

922 Walnut
Fourth Floor
Kansas City, Missouri 64106
www.commercefunds.com
1-800-995-6365
07-938/CB 5026
6/07
Not applicable for the reporting period.
| ITEM 3. | | AUDIT COMMITTEE FINANCIAL EXPERT. |
Not applicable for the reporting period.
| ITEM 4. | | PRINCIPAL ACCOUNTANT FEES AND SERVICES. |
Not applicable for the reporting period.
| ITEM 5. | | AUDIT COMMITTEE OF LISTED REGISTRANTS. |
Not applicable.
| ITEM 6. | | SCHEDULE OF INVESTMENTS |
The Schedule of Investments is included as part of the Report to Shareholders filed under Item 1.
| ITEM 7. | | DISCLOSURE OF PROXY VOTING POLICIES AND PROCEDURES FOR CLOSED-END MANAGEMENT |
Not applicable.
| ITEM 8. | | PORTFOLIO MANAGERS OF CLOSED-END MANAGEMENT INVESTMENT COMPANIES. |
Not applicable.
| ITEM 9. | | PURCHASES OF EQUITY SECURITIES BY CLOSED-END MANAGEMENT INVESTMENT COMPANY AND |
Not applicable.
| ITEM 10. | | SUBMISSION OF MATTERS TO A VOTE OF SECURITY HOLDERS. |
There has been no material changes to the procedures by which shareholders may recommend nominees to the registrant’s Board of Trustees.
| ITEM 11. | | CONTROLS AND PROCEDURES. |
| | (a) | The registrant’s principal executive and principal financial officers or persons performing similar functions have concluded that the registrant’s disclosure controls and procedures (as defined in Rule 30a-3(c) under the Investment Company Act of 1940, as amended (the “1940 Act”)) are effective as of a date within 90 days of the filing of this report that includes the disclosure required by this paragraph, based on the evaluation of these controls and procedures required by Rule 30a-3(b) under the 1940 Act and 15d-15(b) under the Securities Exchange Act of 1934, as amended. |
| | (b) | There were no changes in the registrant’s internal control over financial reporting (as defined in Rule 30a-3(d) under the 1940 Act) that occurred during the registrant’s second fiscal quarter that has materially affected, or is reasonably likely to materially affect, the registrant’s internal control over financial reporting. |
| | | | |
| |
| (a)(1) | | Not applicable for the reporting period. |
| | |
| (a)(2) | | Exhibit 99.CERT | | Certifications pursuant to Section 302 of the Sarbanes-Oxley Act of 2002 is filed herewith. |
| | |
| (b)(1) | | Exhibit 99.906CERT | | Certifications pursuant to Section 906 of the Sarbanes-Oxley Act of 2002 is filed herewith. |
SIGNATURES
Pursuant to the requirements of the Securities Exchange Act of 1934 and the Investment Company Act of 1940, the registrant has duly caused this report to be signed on its behalf by the undersigned, thereunto duly authorized.
|
THE COMMERCE FUNDS |
|
| /s/ Larry E. Franklin |
| Larry E. Franklin |
| President |
July 6, 2007 |
Pursuant to the requirements of the Securities Exchange Act of 1934 and the Investment Company Act of 1940, this report has been signed below by the following persons on behalf of the registrant and in the capacities and on the dates indicated.
|
|
| /s/ Larry E. Franklin |
| Larry E. Franklin |
| President |
| The Commerce Funds |
July 6, 2007 |
|
|
| /s/ Peter Fortner |
| Peter Fortner |
| Principal Accounting and Financial Officer |
| The Commerce Funds |
July 6, 2007 |