UNITED STATES
SECURITIES AND EXCHANGE COMMISSION
Washington, D.C. 20549
FORM N-CSR
CERTIFIED SHAREHOLDER REPORT OF REGISTERED MANAGEMENT
INVESTMENT COMPANIES
Investment Company Act file number 811-8598
The Commerce Funds
(Exact name of registrant as specified in charter)
|
| 922 Walnut St., Fourth Floor, Mail Code = TB4-1, Kansas City, Missouri 64106 |
| (Address of principal executive offices) (Zip code) |
Diana E. McCarthy, Esq.,
Drinker Biddle & Reath LLP
One Logan Square
18th & Cherry Streets
Philadelphia, PA 19103
(Name and address of agent for service)
Registrant’s telephone number, including area code:1-800-995-6365
Date of fiscal year end 10/31
Date of reporting period: 4/30/09
| ITEM 1. | | REPORTS TO SHAREHOLDERS |
The Semi-Annual Report to Shareholders pursuant to Rule 30e-1 under the Investment Company Act of 1940 (17 CFR 270.30e-1) is filed herewith.
| | | | |
| | | | 
|
| | The Commerce Funds | | The Commerce Funds Semi-Annual Report April 30, 2009 |
For Your Life’s Direction
At The Commerce Funds, we’re committed to providing sound investment choices to help you realize your most important financial goals, no matter where life takes you.
We offer a full range of mutual funds managed by Commerce Investment Advisors, Inc., a subsidiary of Commerce Bank. With a choice of 8 portfolios—each targeting a specific investment goal—we make it easy for you to invest with confidence not just today, but throughout all the stages of your life.
Behind each of our Funds is a carefully defined investment philosophy and a commitment to the highest investment standards. This means, whether you are building a nest egg for retirement, planning for your child’s education, or saving for a special need, you can find investment options at The Commerce Funds.
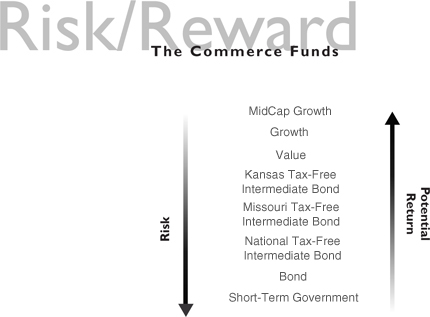
In general, greater returns are associated with greater risks and increased risks create the potential for greater losses.
COMMERCE FUND
Table of Contents
Please note:
The information in this semi-annual report is as of April 30, 2009 and is unaudited. To view more recent information about each Commerce Fund’s performance and portfolio or to obtain a prospectus, please visit our website at www.commercefunds.com. This report is not authorized for distribution to prospective shareholders unless accompanied or preceded by a prospectus, which contains more complete information about the Commerce Fund’s investment policies, management and expenses. Investors should read the prospectus carefully before investing.
You may also receive Commerce Funds information by calling toll free 1-800-995-6365 or by writing to P.O. Box 219525, Kansas City, Missouri, 64121-9525, or you may contact your investment professional. The Commerce Funds publish performance and portfolio information for each Commerce Fund at the end of every calendar quarter. Investors should read the prospectus carefully before investing or sending money.
COMMERCE GROWTH FUND
Growth Fund
Performance Information(1) (Unaudited)
For the six months ended April 30, 2009, the Fund had a total return of (2.19)%, based on its Net Asset Value (NAV). This compares to the Russell 1000 Growth Index(2) six-month return of (1.52)%. Past performance is no guarantee of future results.
Schedule of Investments
April 30, 2009 (Unaudited)
| | | | |
| | |
| Shares | | Description | | Value |
Common Stocks – 99.0% |
Commercial Services – 1.3% |
| 16,300 | | Dun & Bradstreet Corp. | | $ 1,326,820 |
| |
Consumer Non-Durables – 6.9% |
| 8,200 | | Church & Dwight Co., Inc. | | 446,162 |
| 17,000 | | Colgate-Palmolive Co. | | 1,003,000 |
| 9,700 | | Kimberly-Clark Corp. | | 476,658 |
| 23,100 | | PepsiCo, Inc. | | 1,149,456 |
| 12,700 | | Philip Morris International, Inc. | | 459,740 |
| 19,400 | | Polo Ralph Lauren Corp. | | 1,044,496 |
| 38,100 | | Procter & Gamble Co. | | 1,883,664 |
| 11,600 | | The Coca-Cola Co. | | 499,380 |
| | | | |
| | | | 6,962,556 |
| |
Consumer Services – 6.0% |
| 18,500 | | Chipotle Mexican Grill, Inc.* | | 1,500,165 |
| 26,300 | | Darden Restaurants, Inc. | | 972,311 |
| 8,600 | | ITT Educational Services, Inc.* | | 866,622 |
| 17,600 | | Panera Bread Co.* | | 985,776 |
| 47,100 | | The Walt Disney Co. | | 1,031,490 |
| 27,000 | | Weight Watchers International, Inc. | | 671,760 |
| | | | |
| | | | 6,028,124 |
| |
Distribution Services – 2.9% |
| 40,700 | | Herbalife Ltd. | | 806,674 |
| 24,500 | | W.W. Grainger, Inc. | | 2,055,060 |
| | | | |
| | | | 2,861,734 |
| |
Electronic Technology – 17.2% |
| 10,600 | | Apple Computer, Inc.* | | 1,333,798 |
| 176,300 | | Cisco Systems, Inc.* | | 3,406,116 |
| 43,000 | | CommScope, Inc.* | | 1,079,300 |
| 83,200 | | Corning, Inc. | | 1,216,384 |
| 45,800 | | Hewlett-Packard Co. | | 1,647,884 |
| 53,600 | | Intel Corp. | | 845,808 |
| 54,800 | | Juniper Networks, Inc.* | | 1,186,420 |
| 20,500 | | L-3 Communications Holdings, Inc. | | 1,561,075 |
| 53,500 | | Linear Technology Corp. | | 1,165,230 |
| 17,400 | | Lockheed Martin Corp. | | 1,366,422 |
| 17,700 | | Rockwell Collins, Inc. | | 678,795 |
| 101,400 | | Texas Instruments, Inc. | | 1,831,284 |
| | | | |
| | | | 17,318,516 |
| |
| | | | |
| | |
| Shares | | Description | | Value |
Common Stocks – (continued) |
Energy Minerals – 5.9% |
| 30,100 | | CONSOL Energy, Inc. | | $ 941,528 |
| 40,700 | | Exxon Mobil Corp. | | 2,713,469 |
| 41,000 | | Occidental Petroleum Corp. | | 2,307,890 |
| | | | |
| | | | 5,962,887 |
| |
Finance – 5.0% |
| 8,100 | | BlackRock, Inc. | | 1,186,812 |
| 24,600 | | Franklin Resources, Inc. | | 1,487,808 |
| 23,700 | | Northern Trust Corp. | | 1,288,332 |
| 54,300 | | The Charles Schwab Corp. | | 1,003,464 |
| | | | |
| | | | 4,966,416 |
| |
Health Services – 3.1% |
| 41,500 | | IMS Health, Inc. | | 521,240 |
| 37,000 | | Medco Health Solutions, Inc.* | | 1,611,350 |
| 21,400 | | Stericycle, Inc.* | | 1,007,512 |
| | | | |
| | | | 3,140,102 |
| |
Health Technology – 13.4% |
| 29,200 | | Abbott Laboratories | | 1,222,020 |
| 12,600 | | Allergan, Inc. | | 587,916 |
| 28,600 | | Becton, Dickinson & Co. | | 1,729,728 |
| 20,700 | | C. R. Bard, Inc. | | 1,482,741 |
| 51,400 | | Eli Lilly & Co. | | 1,692,088 |
| 55,800 | | Gilead Sciences, Inc.* | | 2,555,640 |
| 41,400 | | Johnson & Johnson | | 2,167,704 |
| 37,800 | | Stryker Corp. | | 1,463,238 |
| 10,700 | | Techne Corp. | | 612,254 |
| | | | |
| | | | 13,513,329 |
| |
Industrial Services – 2.8% |
| 27,600 | | Schlumberger Ltd. | | 1,352,124 |
| 54,700 | | Waste Management, Inc. | | 1,458,849 |
| | | | |
| | | | 2,810,973 |
| |
Non-Energy Minerals – 0.4% |
| 14,600 | | United States Steel Corp. | | 387,630 |
| |
Process Industries – 1.3% |
| 15,800 | | Monsanto Co. | | 1,341,262 |
| |
| (1) | | Returns assume expense reimbursements and are not annualized. Returns do not reflect the deduction of taxes that a shareholder would pay on Fund distributions or the redemption of Fund shares. |
| (2) | | The Russell 1000 Growth Index, an unmanaged index, is a market capitalization weighted index of those 1,000 Russell companies with higher price-to-book ratios and higher forecasted growth values. The Index figure does not reflect the deduction of any fees, expenses or taxes. |
| | |
| 2 | | The accompanying notes are an integral part of these financial statements. |
COMMERCE GROWTH FUND
| | | | |
| | |
| Shares | | Description | | Value |
Common Stocks – (continued) |
Producer Manufacturing – 6.9% |
| 30,600 | | AMETEK, Inc. | | $ 985,626 |
| 29,100 | | Emerson Electric Co. | | 990,564 |
| 32,000 | | Honeywell International, Inc. | | 998,720 |
| 54,000 | | Illinois Tool Works, Inc. | | 1,771,200 |
| 45,400 | | United Technologies Corp. | | 2,217,336 |
| | | | |
| | | | 6,963,446 |
| |
Retail Trade – 7.8% |
| 23,400 | | Amazon.com, Inc.* | | 1,884,168 |
| 21,900 | | Best Buy Co., Inc. | | 840,522 |
| 33,200 | | Big Lots, Inc.* | | 917,648 |
| 26,800 | | Dollar Tree, Inc.* | | 1,134,712 |
| 58,700 | | Staples, Inc. | | 1,210,394 |
| 40,600 | | The TJX Cos., Inc. | | 1,135,582 |
| 14,500 | | Wal-Mart Stores, Inc. | | 730,800 |
| | | | |
| | | | 7,853,826 |
| |
Technology Services – 17.4% |
| 32,400 | | Adobe Systems, Inc.* | | 886,140 |
| 24,300 | | BMC Software, Inc.* | | 842,481 |
| 5,300 | | Google, Inc.* | | 2,098,641 |
| 54,200 | | Hewitt Associates, Inc.* | | 1,699,712 |
| 39,300 | | International Business Machines Corp. | | 4,056,153 |
| 197,800 | | Microsoft Corp. | | 4,007,428 |
| 152,000 | | Oracle Corp. | | 2,939,680 |
| 18,700 | | Sohu.com, Inc.* | | 975,205 |
| | | | |
| | | | 17,505,440 |
| |
Transportation – 0.7% |
| 22,900 | | CSX Corp. | | 677,611 |
| |
TOTAL COMMON STOCKS | | |
(Cost $120,783,653) | | $ 99,620,672 |
| |
| | | | |
Exchange Traded Fund – 1.0% |
| 27,000 | | iShares Russell 1000 Growth Index Fund |
(Cost $961,311) | | $ 1,043,280 |
| |
| | | | | | |
Principal
Amount | | Interest
Rate | | Maturity
Date | | Value |
| Repurchase Agreement(a) – 1.6% |
| State Street Bank & Trust Co. |
| $ 1,614,000 | | 0.010% | | 05/01/09 | | $ 1,614,000 |
Maturity Value: $1,614,000 | | | | |
(Cost $1,614,000) | | | | |
| |
| TOTAL INVESTMENTS – 101.6% | | |
(Cost $123,358,964) | | | | $102,277,952 |
| |
LIABILITIES IN EXCESS OF
OTHER ASSETS – (1.6)% | | (1,632,985) |
| |
| NET ASSETS – 100.0% | | $100,644,967 |
| |
| | |
|
| The percentage shown for each investment category reflects the value of investments in that category as a percentage of net assets. |
| * | | Non-income producing security. |
| (a) | | Repurchase agreement was entered into on April 30, 2009. This agreement was fully collateralized by $1,560,000 U.S. Treasury Notes, 3.125%, due 09/30/13 with a market value of $1,647,048. |
PORTFOLIO COMPOSITION
| | | | | | |
| Industry Allocation | | AS OF
4/30/09 | | | AS OF
10/31/08 | |
| | |
Technology Services | | 17.4 | % | | 14.9 | % |
Electronic Technology | | 17.2 | | | 17.0 | |
Health Technology | | 13.4 | | | 13.9 | |
Retail Trade | | 7.8 | | | 5.6 | |
Producer Manufacturing | | 6.9 | | | 7.1 | |
Consumer Non-Durables | | 6.9 | | | 6.4 | |
Consumer Services | | 6.0 | | | 2.7 | |
Energy Minerals | | 5.9 | | | 7.9 | |
Finance | | 5.0 | | | 4.9 | |
Health Services | | 3.1 | | | 3.6 | |
Distribution Services | | 2.9 | | | 2.4 | |
Industrial Services | | 2.8 | | | 5.7 | |
Process Industries | | 1.3 | | | 4.0 | |
Commercial Services | | 1.3 | | | 2.4 | |
Exchange Traded Fund | | 1.0 | | | 0.3 | |
Transportation | | 0.7 | | | 1.0 | |
Non-Energy Minerals | | 0.4 | | | — | |
Short-Term Obligation | | 1.6 | | | 0.4 | |
| | |
| TOTAL INVESTMENTS | | 101.6 | % | | 100.2 | % |
| | |
The percentage shown for each Industry Allocation reflects the value of investments in that category as a percentage of net assets.
The Fund is actively managed and, as such, its composition may differ over time.
| | |
| The accompanying notes are an integral part of these financial statements. | | 3 |
COMMERCE VALUE FUND
Value Fund
Performance Information(1) (Unaudited)
For the six months ended April 30, 2009, the Fund had a total return of (12.96)%, based on its Net Asset Value (NAV). This compares to the Russell 1000 Value Index(2) six-month return of (13.27)%. Past performance is no guarantee of future results.
Schedule of Investments
April 30, 2009 (Unaudited)
| | | | |
| | |
| Shares | | Description | | Value |
Common Stocks – 98.1% |
Commercial Services – 1.2% |
| 7,000 | | Cintas Corp. | | $ 179,620 |
| 5,000 | | Lender Processing Services, Inc. | | 143,300 |
| 8,000 | | Moody’s Corp. | | 236,160 |
| 17,000 | | R.R. Donnelley & Sons Co. | | 198,050 |
| | | | |
| | | | 757,130 |
| |
Communications – 7.4% |
| 91,500 | | AT&T, Inc. | | 2,344,230 |
| 54,500 | | Frontier Communications Corp. | | 387,495 |
| 51,500 | | Verizon Communications, Inc. | | 1,562,510 |
| 47,000 | | Windstream Corp. | | 390,100 |
| | | | |
| | | | 4,684,335 |
| |
Consumer Non-Durables – 6.9% |
| 17,000 | | Coca-Cola Enterprises, Inc. | | 290,020 |
| 15,500 | | Constellation Brands, Inc.* | | 179,645 |
| 9,000 | | General Mills, Inc. | | 456,210 |
| 37,000 | | Procter & Gamble Co. | | 1,829,280 |
| 13,000 | | Reynolds American, Inc. | | 493,740 |
| 17,000 | | Sara Lee Corp. | | 141,440 |
| 8,000 | | The Coca-Cola Co. | | 344,400 |
| 20,000 | | The Pepsi Bottling Group, Inc. | | 625,400 |
| | | | |
| | | | 4,360,135 |
| |
Consumer Services – 4.1% |
| 20,000 | | Cablevision Systems Corp. | | 343,200 |
| 22,000 | | Comcast Corp. | | 340,120 |
| 15,000 | | Expedia, Inc.* | | 204,150 |
| 6,000 | | International Speedway Corp. | | 142,080 |
| 17,500 | | Liberty Global, Inc.* | | 288,575 |
| 3,500 | | McDonald’s Corp. | | 186,515 |
| 20,000 | | News Corp. | | 165,200 |
| 16,500 | | The Walt Disney Co. | | 361,350 |
| 4,601 | | Time Warner Cable, Inc. | | 148,290 |
| 18,333 | | Time Warner, Inc. | | 400,210 |
| | | | |
| | | | 2,579,690 |
| |
Distribution Services* – 0.4% |
| 18,000 | | Ingram Micro, Inc. | | 261,360 |
| |
Electronic Technology – 4.4% |
| 12,500 | | EMC Corp.* | | 156,625 |
| |
| | | | |
| | |
| Shares | | Description | | Value |
Common Stocks – (continued) |
Electronic Technology – (continued) |
| 13,000 | | General Dynamics Corp. | | $ 671,710 |
| 10,000 | | Hewlett-Packard Co. | | 359,800 |
| 22,500 | | Integrated Device Technology, Inc.* | | 122,175 |
| 12,000 | | Intel Corp. | | 189,360 |
| 14,500 | | Juniper Networks, Inc.* | | 313,925 |
| 3,500 | | Lockheed Martin Corp. | | 274,855 |
| 4,500 | | Northrop Grumman Corp. | | 217,575 |
| 13,000 | | QLogic Corp.* | | 184,340 |
| 3,500 | | Raytheon Co. | | 158,305 |
| 21,500 | | Xerox Corp. | | 131,365 |
| | | | |
| | | | 2,780,035 |
| |
Energy Minerals – 15.4% |
| 6,500 | | Anadarko Petroleum Corp. | | 279,890 |
| 4,250 | | Apache Corp. | | 309,655 |
| 12,000 | | Chesapeake Energy Corp. | | 236,520 |
| 38,000 | | ChevronTexaco Corp. | | 2,511,800 |
| 22,000 | | ConocoPhillips | | 902,000 |
| 9,500 | | Devon Energy Corp. | | 492,575 |
| 2,750 | | EOG Resources, Inc. | | 174,570 |
| 58,500 | | Exxon Mobil Corp. | | 3,900,195 |
| 13,000 | | Marathon Oil Corp. | | 386,100 |
| 2,500 | | Occidental Petroleum Corp. | | 140,725 |
| 10,000 | | Valero Energy Corp. | | 198,400 |
| 4,750 | | XTO Energy, Inc. | | 164,635 |
| | | | |
| | | | 9,697,065 |
| |
Finance – 20.3% |
| 5,500 | | Ameriprise Financial, Inc. | | 144,925 |
| 20,500 | | Annaly Capital Management, Inc. | | 288,435 |
| 4,000 | | Aon Corp. | | 168,800 |
| 7,250 | | Arthur J. Gallagher & Co. | | 162,980 |
| 6,000 | | Assurant, Inc. | | 146,640 |
| 90,000 | | Bank of America Corp. | | 803,700 |
| 5,500 | | Bank of Hawaii Corp. | | 193,270 |
| 17,750 | | Bank of New York Mellon Corp. | | 452,270 |
| 1,250 | | BlackRock, Inc. | | 183,150 |
| 14,000 | | Capital One Financial Corp. | | 234,360 |
| 1,000 | | CME Group, Inc. | | 221,350 |
| 22,000 | | Discover Financial Services | | 178,860 |
| 6,000 | | Equity Residential | | 137,340 |
| 12,500 | | Fidelity National Financial, Inc. | | 226,625 |
| |
| (1) | | Returns assume expense reimbursements and are not annualized. Returns do not reflect the deduction of taxes that a shareholder would pay on Fund distributions or the redemption of Fund shares. |
| (2) | | The Russell 1000 Value Index, an unmanaged market capitalization weighted index of those 1,000 Russell companies with lower price-to-book ratios and lower forecasted growth values. The Index figure does not reflect the deduction of any fees, expenses or taxes. |
| | |
| 4 | | The accompanying notes are an integral part of these financial statements. |
COMMERCE VALUE FUND
| | | | |
| | |
| Shares | | Description | | Value |
| Common Stocks – (continued) |
| Finance – (continued) |
| 4,250 | | Franklin Resources, Inc. | | $ 257,040 |
| 6,000 | | GATX Corp. | | 180,660 |
| 8,750 | | HCP, Inc. | | 192,063 |
| 58,000 | | JPMorgan Chase & Co. | | 1,914,000 |
| 15,000 | | KeyCorp | | 92,250 |
| 7,500 | | Loews Corp. | | 186,675 |
| 7,750 | | MetLife, Inc. | | 230,563 |
| 22,000 | | Morgan Stanley & Co. | | 520,080 |
| 8,500 | | NYSE Euronext | | 196,945 |
| 5,000 | | PNC Financial Services Group, Inc. | | 198,500 |
| 4,000 | | Prudential Financial, Inc. | | 115,520 |
| 8,500 | | Raymond James Financial, Inc. | | 133,365 |
| 6,500 | | Reinsurance Group of America, Inc. | | 206,635 |
| 3,059 | | Simon Property Group, Inc. | | 157,844 |
| 9,000 | | State Street Corp. | | 307,170 |
| 4,250 | | SunTrust Banks, Inc. | | 61,370 |
| 6,000 | | The Allstate Corp. | | 139,980 |
| 9,250 | | The Chubb Corp. | | 360,287 |
| 13,000 | | The Progressive Corp.* | | 198,640 |
| 13,000 | | The Travelers Cos., Inc. | | 534,820 |
| 5,500 | | Torchmark Corp. | | 161,315 |
| 4,500 | | Transatlantic Holdings, Inc. | | 170,685 |
| 17,500 | | Trustmark Corp. | | 380,450 |
| 32,000 | | U.S. Bancorp. | | 583,040 |
| 16,000 | | Unum Group | | 261,440 |
| 8,750 | | Valley National Bancorp | | 126,613 |
| 3,043 | | Vornado Realty Trust | | 148,772 |
| 57,000 | | Wells Fargo & Co. | | 1,140,570 |
| 7,000 | | Zions Bancorp. | | 76,510 |
| | | | |
| | | | 12,776,507 |
| |
| Health Services – 1.4% |
| 22,000 | | IMS Health, Inc. | | 276,320 |
| 8,000 | | UnitedHealth Group, Inc. | | 188,160 |
| 10,000 | | WellPoint, Inc.* | | 427,600 |
| | | | |
| | | | 892,080 |
| |
| Health Technology – 12.1% |
| 15,000 | | Amgen, Inc.* | | 727,050 |
| 7,000 | | Biogen Idec, Inc.* | | 338,380 |
| 25,000 | | Boston Scientific Corp.* | | 210,250 |
| 19,000 | | Eli Lilly & Co. | | 625,480 |
| 12,000 | | Hill-Rom Holdings, Inc. | | 155,760 |
| 11,000 | | Hospira, Inc.* | | 361,570 |
| 35,000 | | Johnson & Johnson | | 1,832,600 |
| 35,500 | | King Pharmaceuticals, Inc.* | | 279,740 |
| 30,500 | | Merck & Co., Inc. | | 739,320 |
| 114,000 | | Pfizer, Inc. | | 1,523,040 |
| 19,000 | | Wyeth | | 805,600 |
| | | | |
| | | | 7,598,790 |
| |
| Industrial Services – 0.7% | | |
| 16,000 | | Waste Management, Inc. | | 426,720 |
| |
| | | | |
| | |
| Shares | | Description | | Value |
| Common Stocks – (continued) |
| Non-Energy Minerals – 1.2% | | |
| 8,000 | | Freeport-McMoRan Copper & Gold, Inc. | | $ 341,200 |
| 5,500 | | Nucor Corp. | | 223,795 |
| 5,500 | | Reliance Steel & Aluminum Co. | | 193,765 |
| | | | |
| | | | 758,760 |
| |
| Process Industries – 3.3% | | |
| 9,000 | | Archer-Daniels-Midland Co. | | 221,580 |
| 14,000 | | E. I. du Pont de Nemours and Co. | | 390,600 |
| 6,500 | | Lubrizol Corp. | | 280,930 |
| 4,000 | | Sigma-Aldrich Corp. | | 175,360 |
| 11,500 | | Sonoco Products Co. | | 280,715 |
| 24,000 | | The Dow Chemical Co. | | 384,000 |
| 9,500 | | The Scotts Miracle-Gro Co. | | 320,815 |
| | | | |
| | | | 2,054,000 |
| |
| Producer Manufacturing – 6.6% | | |
| 11,000 | | Armstrong World Industries, Inc.* | | 199,980 |
| 11,000 | | Crane Co. | | 253,990 |
| 3,500 | | Eaton Corp. | | 153,300 |
| 6,000 | | Emerson Electric Co. | | 204,240 |
| 166,000 | | General Electric Co. | | 2,099,900 |
| 5,000 | | Honeywell International, Inc. | | 156,050 |
| 6,000 | | Hubbell, Inc. Class B | | 199,200 |
| 14,000 | | Illinois Tool Works, Inc. | | 459,200 |
| 18,000 | | Masco Corp. | | 159,480 |
| 6,000 | | Parker Hannifin Corp. | | 272,100 |
| | | | |
| | | | 4,157,440 |
| |
| Retail Trade – 4.0% | | |
| 9,500 | | BJ’s Wholesale Club, Inc.* | | 316,730 |
| 3,000 | | Costco Wholesale Corp. | | 145,800 |
| 8,500 | | CVS Caremark Corp. | | 270,130 |
| 5,250 | | Kohl’s Corp.* | | 238,087 |
| 8,500 | | Lowe’s Cos., Inc. | | 182,750 |
| 20,000 | | Macy’s, Inc. | | 273,600 |
| 19,000 | | RadioShack Corp. | | 267,520 |
| 12,500 | | The Gap, Inc. | | 194,250 |
| 17,000 | | The Home Depot, Inc. | | 447,440 |
| 4,000 | | Wal-Mart Stores, Inc. | | 201,600 |
| | | | |
| | | | 2,537,907 |
| |
| Technology Services – 2.7% | | |
| 9,500 | | Affiliated Computer Services, Inc.* | | 459,610 |
| 9,500 | | BMC Software, Inc.* | | 329,365 |
| 12,000 | | CA, Inc. | | 207,000 |
| 12,000 | | Computer Sciences Corp.* | | 443,520 |
| 15,000 | | Symantec Corp.* | | 258,750 |
| | | | |
| | | | 1,698,245 |
| |
| Transportation – 0.7% | | |
| 4,500 | | FedEx Corp. | | 251,820 |
| 5,500 | | Norfolk Southern Corp. | | 196,240 |
| | | | |
| | | | 448,060 |
| |
| | |
| The accompanying notes are an integral part of these financial statements. | | 5 |
COMMERCE VALUE FUND
Schedule of Investments (continued)
April 30, 2009 (Unaudited)
| | | | |
| | |
| Shares | | Description | | Value |
Common Stocks – (continued) |
Utilities – 5.3% | | |
| 9,500 | | Alliant Energy Corp. | | $ 212,420 |
| 20,500 | | CenterPoint Energy, Inc. | | 218,120 |
| 9,000 | | DTE Energy Co. | | 266,130 |
| 32,000 | | Duke Energy Corp. | | 441,920 |
| 12,000 | | Edison International | | 342,120 |
| 3,000 | | Exelon Corp. | | 138,390 |
| 4,250 | | FPL Group, Inc. | | 228,607 |
| 8,000 | | PG&E Corp. | | 296,960 |
| 7,500 | | Progress Energy, Inc. | | 255,900 |
| 5,500 | | Questar Corp. | | 163,460 |
| 15,500 | | The Southern Co. | | 447,640 |
| 16,000 | | Xcel Energy, Inc. | | 295,040 |
| | | | |
| | | | 3,306,707 |
| |
TOTAL COMMON STOCKS | | |
(Cost $81,331,267) | | $61,774,966 |
| |
| | | | |
Exchange Traded Fund – 1.1% |
| 15,000 | | iShares Russell 1000 Value Index Fund | | |
(Cost $656,268) | | $ 675,150 |
| |
| | | | | | | |
Principal
Amount | | Interest
Rate | | | Maturity
Date | | Value |
| Repurchase Agreement(a) – 0.7% |
| State Street Bank & Trust Co. | | |
| $479,000 | | 0.010 | % | | 05/01/09 | | $ 479,000 |
Maturity Value: $479,000 | | |
(Cost $479,000) | | | | | |
| |
| TOTAL INVESTMENTS – 99.9% | | |
(Cost $82,466,535) | | | | | $62,929,116 |
| |
OTHER ASSETS IN EXCESS OF
LIABILITIES – 0.1% | | 38,172 |
| |
| NET ASSETS – 100.0% | | $62,967,288 |
| |
| | |
| The percentage shown for each investment category reflects the value of investments in that category as a percentage of net assets. |
| * | | Non-income producing security. |
| (a) | | Repurchase agreement was entered into on April 30, 2009. This agreement was fully collateralized by $465,000 U.S. Treasury Notes, 3.125%, due 09/30/13 with a market value of $490,947. |
| |
PORTFOLIO COMPOSITION
| | | | | | |
| Industry Allocation | | AS OF
4/30/09 | | | AS OF
10/31/08 | |
| | |
Finance | | 20.3 | % | | 23.0 | % |
Energy Minerals | | 15.4 | | | 16.8 | |
Health Technology | | 12.1 | | | 13.0 | |
Communications | | 7.4 | | | 6.8 | |
Consumer Non-Durables | | 6.9 | | | 7.9 | |
Producer Manufacturing | | 6.6 | | | 6.6 | |
Utilities | | 5.3 | | | 4.7 | |
Electronic Technology | | 4.4 | | | 4.2 | |
Consumer Services | | 4.1 | | | 1.8 | |
Retail Trade | | 4.0 | | | 2.5 | |
Process Industries | | 3.3 | | | 3.1 | |
Technology Services | | 2.7 | | | 2.5 | |
Health Services | | 1.4 | | | 0.9 | |
Non-Energy Minerals | | 1.2 | | | 1.0 | |
Commercial Services | | 1.2 | | | 0.8 | |
Exchange Traded Fund | | 1.1 | | | 1.2 | |
Industrial Services | | 0.7 | | | 1.3 | |
Transportation | | 0.7 | | | — | |
Distribution Services | | 0.4 | | | — | |
Consumer Durables | | — | | | 0.2 | |
Short-Term Obligation | | 0.7 | | | 0.5 | |
| | |
| TOTAL INVESTMENTS | | 99.9 | % | | 98.8 | % |
| | |
The percentage shown for each Industry Allocation reflects the value of investments in that category as a percentage of net assets.
The Fund is actively managed and, as such, its composition may differ over time.
| | |
| 6 | | The accompanying notes are an integral part of these financial statements. |
COMMERCE MIDCAP GROWTH FUND
MidCap Growth Fund
Performance Information(1) (Unaudited)
For the six months ended April 30, 2009, the Fund had a total return of 2.48%, based on its Net Asset Value (NAV). This compares to the Russell MidCap Growth Index(2) six-month return of 2.71%. Past performance is no guarantee of future results.
Schedule of Investments
April 30, 2009 (Unaudited)
| | | | |
| | |
| Shares | | Description | | Value |
Common Stocks – 94.2% |
Commercial Services – 3.8% |
| 8,100 | | Copart, Inc.* | | $ 254,259 |
| 7,700 | | Dun & Bradstreet Corp. | | 626,780 |
| 11,500 | | Manpower, Inc. | | 495,535 |
| 8,800 | | The Brink’s Co. | | 249,480 |
| | | | |
| | | | 1,626,054 |
| |
Communications – 4.1% |
| 26,800 | | American Tower Corp.* | | 851,168 |
| 15,800 | | Embarq Corp. | | 577,648 |
| 47,200 | | Frontier Communications Corp. | | 335,592 |
| | | | |
| | | | 1,764,408 |
| |
Consumer Durables – 0.9% |
| 10,500 | | The Stanley Works | | 399,315 |
| |
Consumer Non-Durables – 3.1% |
| 10,200 | | Central European Distribution Corp.* | | 228,480 |
| 7,780 | | Church & Dwight Co., Inc. | | 423,310 |
| 9,000 | | Coach, Inc.* | | 220,500 |
| 4,100 | | Polo Ralph Lauren Corp. | | 220,744 |
| 3,800 | | The Clorox Co. | | 212,990 |
| | | | |
| | | | 1,306,024 |
| |
Consumer Services – 6.3% |
| 8,800 | | Brink’s Home Security Holdings, Inc.* | | 233,904 |
| 11,300 | | Brinker International, Inc. | | 200,236 |
| 8,400 | | Chipotle Mexican Grill, Inc. Class A* | | 681,156 |
| 15,200 | | DISH Network Corp.* | | 201,400 |
| 8,900 | | Panera Bread Co.* | | 498,489 |
| 14,500 | | Weight Watchers International, Inc. | | 360,760 |
| 15,500 | | Yum! Brands, Inc. | | 516,925 |
| | | | |
| | | | 2,692,870 |
| |
Electronic Technology – 14.1% |
| 21,400 | | Altera Corp. | | 349,034 |
| 10,800 | | CommScope, Inc.* | | 271,080 |
| 9,690 | | Harris Corp. | | 296,320 |
| 9,578 | | ITT Corp. | | 392,794 |
| 43,200 | | Juniper Networks, Inc.* | | 935,280 |
| 5,646 | | L-3 Communications Holdings, Inc. | | 429,943 |
| 28,400 | | Linear Technology Corp. | | 618,552 |
| 10,700 | | MEMC Electronic Materials, Inc.* | | 173,340 |
| 17,490 | | Microchip Technology, Inc. | | 402,270 |
| |
| | | | |
| | |
| Shares | | Description | | Value |
Common Stocks – (continued) |
Electronic Technology – (continued) |
| 5,100 | | Precision Castparts Corp. | | $ 381,786 |
| 17,765 | | Rockwell Collins, Inc. | | 681,288 |
| 10,000 | | Western Digital Corp.* | | 235,200 |
| 42,200 | | Xilinx, Inc. | | 862,568 |
| | | | |
| | | | 6,029,455 |
| |
Energy Minerals – 5.2% |
| 16,200 | | CONSOL Energy, Inc. | | 506,736 |
| 24,700 | | Denbury Resources, Inc.* | | 402,116 |
| 11,800 | | Murphy Oil Corp. | | 562,978 |
| 9,900 | | Noble Energy, Inc. | | 561,825 |
| 9,800 | | St. Mary Land & Exploration Co. | | 175,126 |
| | | | |
| | | | 2,208,781 |
| |
Finance – 5.7% |
| 9,495 | | Eaton Vance Corp. | | 259,878 |
| 6,400 | | Health Care REIT, Inc. | | 218,048 |
| 3,500 | | IntercontinentalExchange, Inc.* | | 306,600 |
| 9,100 | | Investment Technology Group, Inc.* | | 207,298 |
| 14,700 | | Northern Trust Corp. | | 799,092 |
| 17,000 | | T. Rowe Price Group, Inc. | | 654,840 |
| | | | |
| | | | 2,445,756 |
| |
Health Services – 4.7% |
| 13,780 | | Cerner Corp.* | | 741,364 |
| 3,400 | | Express Scripts, Inc.* | | 217,498 |
| 43,240 | | IMS Health, Inc. | | 543,095 |
| 4,100 | | Laboratory Corporation of America Holdings* | | 263,015 |
| 5,592 | | Stericycle, Inc.* | | 263,271 |
| | | | |
| | | | 2,028,243 |
| |
Health Technology – 9.1% |
| 10,540 | | Allergan, Inc. | | 491,796 |
| 11,080 | | C. R. Bard, Inc. | | 793,661 |
| 8,300 | | Cephalon, Inc.* | | 544,563 |
| 23,300 | | DENTSPLY International, Inc. | | 666,846 |
| 18,500 | | Forest Laboratories, Inc.* | | 401,265 |
| 12,140 | | IDEXX Laboratories, Inc.* | | 477,102 |
| 9,900 | | Varian Medical Systems, Inc.* | | 330,363 |
| 6,200 | | Watson Pharmaceuticals, Inc.* | | 191,828 |
| | | | |
| | | | 3,897,424 |
| |
| (1) | | Returns are not annualized and do not reflect the deduction of taxes that a shareholder would pay on Fund distributions or the redemption of Fund shares. |
| (2) | | The Russell MidCap Growth Index, an unmanaged index, measures the performance of those Russell Midcap companies with higher price-to-book ratios and higher forecasted growth values. The Index figure does not reflect the deduction of any fees, expenses or taxes. |
| | |
| The accompanying notes are an integral part of these financial statements. | | 7 |
COMMERCE MIDCAP GROWTH FUND
Schedule of Investments (continued)
April 30, 2009 (Unaudited)
| | | | |
| | |
| Shares | | Description | | Value |
Common Stocks – (continued) |
Industrial Services – 3.8% |
| 22,800 | | Dresser-Rand Group, Inc.* | | $ 561,564 |
| 7,100 | | ENSCO International, Inc. | | 200,788 |
| 7,886 | | Jacobs Engineering Group, Inc.* | | 299,983 |
| 6,600 | | National-Oilwell Varco, Inc.* | | 199,848 |
| 10,600 | | Oil States International, Inc.* | | 200,340 |
| 5,000 | | The Shaw Group, Inc.* | | 167,650 |
| | | | |
| | | | 1,630,173 |
| |
Non-Energy Minerals – 0.8% |
| 27,600 | | Steel Dynamics, Inc. | | 343,620 |
| |
Process Industries – 5.6% |
| 37,000 | | Crown Holdings, Inc.* | | 815,850 |
| 17,500 | | PPG Industries, Inc. | | 770,875 |
| 13,736 | | Sigma-Aldrich Corp. | | 602,186 |
| 6,300 | | The Scotts Miracle-Gro Co. | | 212,751 |
| | | | |
| | | | 2,401,662 |
| |
Producer Manufacturing – 6.9% |
| 13,800 | | AGCO Corp.* | | 335,340 |
| 6,500 | | AMETEK, Inc. | | 209,365 |
| 9,500 | | Cummins, Inc. | | 323,000 |
| 5,700 | | Dover Corp. | | 175,446 |
| 9,700 | | Energizer Holdings, Inc.* | | 555,810 |
| 8,400 | | Joy Global, Inc. | | 214,200 |
| 5,800 | | Lincoln Electric Holdings, Inc. | | 258,274 |
| 15,950 | | Parker Hannifin Corp. | | 723,332 |
| 16,800 | | Textron, Inc. | | 180,264 |
| | | | |
| | | | 2,975,031 |
| |
Retail Trade – 6.1% |
| 14,000 | | Dollar Tree, Inc.* | | 592,760 |
| 11,400 | | GameStop Corp.* | | 343,824 |
| 20,260 | | Nordstrom, Inc. | | 458,484 |
| 28,500 | | The TJX Cos., Inc. | | 797,145 |
| 14,400 | | Tiffany & Co. | | 416,736 |
| | | | |
| | | | 2,608,949 |
| |
Technology Services – 11.3% |
| 27,775 | | Adobe Systems, Inc.* | | 759,646 |
| 10,200 | | Akamai Technologies, Inc.* | | 224,604 |
| 9,100 | | Autodesk, Inc.* | | 181,454 |
| 12,300 | | BMC Software, Inc.* | | 426,441 |
| 20,200 | | CA, Inc. | | 348,450 |
| 10,400 | | Cognizant Technology Solutions Corp.* | | 257,816 |
| 14,600 | | Hewitt Associates, Inc.* | | 457,856 |
| 13,800 | | McAfee, Inc.* | | 518,052 |
| 12,000 | | Metavante Technologies, Inc.* | | 283,080 |
| 32,860 | | Paychex, Inc. | | 887,549 |
| 9,500 | | Sohu.com, Inc.* | | 495,425 |
| | | | |
| | | | 4,840,373 |
| |
Transportation – 0.5% |
| 5,600 | | Expeditors International of Washington, Inc. | | 194,376 |
| |
| | | | |
| | |
| Shares | | Description | | Value |
Common Stocks – (continued) |
Utilities – 2.2% |
| 32,200 | | CenterPoint Energy, Inc. | | $ 342,608 |
| 13,000 | | DPL, Inc. | | 291,590 |
| 9,900 | | Mirant Corp.* | | 126,027 |
| 22,700 | | The AES Corp.* | | 160,489 |
| | | | |
| | | | 920,714 |
| |
TOTAL COMMON STOCKS | | |
(Cost $49,669,180) | | $40,313,228 |
| |
| | | | |
Exchange Traded Fund – 3.8% |
| 47,600 | | iShares Russell Midcap Growth Index Fund | | |
(Cost $2,655,633) | | $ 1,639,820 |
| |
| | | | | | | |
Principal
Amount | | Interest
Rate | | | Maturity
Date | | Value |
| Repurchase Agreement(a) – 2.6% |
| State Street Bank & Trust Co. | | |
| $1,126,000 | | 0.010 | % | | 05/01/09 | | $ 1,126,000 |
Maturity Value: $1,126,000 | | |
(Cost $1,126,000) |
| |
| TOTAL INVESTMENTS – 100.6% | | |
(Cost $53,450,813) | | | | | $43,079,048 |
| |
LIABILITIES IN EXCESS OF OTHER ASSETS – (0.6)% | | (260,017) |
| |
| NET ASSETS – 100.0% | | $42,819,031 |
| |
| | |
| The percentage shown for each investment category reflects the value of investments in that category as a percentage of net assets. |
| * | | Non-income producing security. |
| (a) | | Repurchase agreement was entered into on April 30, 2009. This agreement was fully collateralized by $1,090,000 U.S Treasury Notes, 3.125%, due 9/30/13 with a market value of $1,150,822. |
| | |
| |
| Investment Abbreviation: |
| REIT | | —RealEstate Investment Trust |
| |
| | |
| 8 | | The accompanying notes are an integral part of these financial statements. |
COMMERCE MIDCAP GROWTH FUND
PORTFOLIO COMPOSITION
| | | | | | |
| Industry Allocation | | AS OF
4/30/09 | | | AS OF
10/31/08 | |
| | |
Electronic Technology | | 14.1 | % | | 12.1 | % |
Technology Services | | 11.3 | | | 7.6 | |
Health Technology | | 9.1 | | | 12.8 | |
Producer Manufacturing | | 6.9 | | | 6.8 | |
Consumer Services | | 6.3 | | | 3.6 | |
Retail Trade | | 6.1 | | | 6.3 | |
Finance | | 5.7 | | | 5.9 | |
Process Industries | | 5.6 | | | 6.0 | |
Energy Minerals | | 5.2 | | | 5.8 | |
Health Services | | 4.7 | | | 4.5 | |
Communications | | 4.1 | | | 5.0 | |
Exchange Traded Fund | | 3.8 | | | 4.4 | |
Industrial Services | | 3.8 | | | 7.0 | |
Commercial Services | | 3.8 | | | 5.2 | |
Consumer Non-Durables | | 3.1 | | | 2.5 | |
Utilities | | 2.2 | | | 1.6 | |
Consumer Durables | | 0.9 | | | 0.8 | |
Non-Energy Minerals | | 0.8 | | | — | |
Transportation | | 0.5 | | | — | |
Distribution Services | | — | | | 1.0 | |
Short-Term Obligation | | 2.6 | | | 1.3 | |
| | |
| TOTAL INVESTMENTS | | 100.6 | % | | 100.2 | % |
| | |
The percentage shown for each Industry Allocation reflects the value of investments in that category as a percentage of net assets.
The Fund is actively managed and, as such, its composition may differ over time.
| | |
| The accompanying notes are an integral part of these financial statements. | | 9 |
COMMERCE BOND FUND
Bond Fund
Performance Information(1) (Unaudited)
For the six months ended April 30, 2009, the Fund had a total return of 7.23%, based on its Net Asset Value (NAV). This compares to the Barclays Capital U.S. Aggregate Bond Index(2) six-month return of 7.74%. Past performance is no guarantee of future results.
Schedule of Investments
April 30, 2009 (Unaudited)
| | | | | | | |
Principal
Amount | | Interest
Rate | | | Maturity
Date | | Value |
| Asset-Backed Securities – 10.4% |
Auto(a) – 0.7% | | | | | |
| Hertz Vehicle Financing LLC Series 2005-1A, Class A5 |
| $ 4,770,000 | | 5.080 | % | | 11/25/11 | | $ 3,674,109 |
| |
Commercial – 1.4% | | | | | |
| ACLC Business Loan Receivables Trust Series 2002-1A, Class A2(a) |
| 1,025,464 | | 7.462 | | | 12/15/22 | | 840,881 |
| LB-UBS Commercial Mortgage Trust Series 2002-C1, Class A4 |
| 6,500,000 | | 6.462 | | | 03/15/31 | | 6,604,208 |
| | | | | | | |
| | | | | | | 7,445,089 |
| |
Credit Card – 1.9% | | | | | |
| Cabela’s Master Credit Card Trust Series 2005-1A, Class A1(a) |
| 5,000,000 | | 4.970 | | | 10/15/13 | | 4,796,271 |
| Citibank Credit Card Issuance Trust Series 2004, Class A8 |
| 3,600,000 | | 4.900 | | | 12/12/16 | | 3,409,947 |
| Target Credit Card Master Trust Series 2005-1, Class A(b) |
| 2,250,000 | | 0.498 | | | 10/27/14 | | 1,906,946 |
| | | | | | | |
| | | | | | | 10,113,164 |
| |
Home Equity – 3.4% | | | | | |
| Chase Funding Mortgage Loan Asset-Backed Certificates Series 2002-3, Class 1A5 |
| 3,490,438 | | 5.407 | | | 06/25/32 | | 2,321,884 |
| Contimortgage Home Equity Loan Trust Series 1999-3, Class A6 |
| 74,433 | | 8.180 | | | 12/25/29 | | 73,953 |
| Countrywide Asset-Backed Certificates Series 2007-QH1, Class A1(a)(b) |
| 1,720,980 | | 0.638 | | | 02/25/37 | | 1,018,336 |
| Equifirst Mortgage Loan Trust Series 2003-2, Class 2A2 |
| 1,551,647 | | 3.750 | | | 09/25/33 | | 1,043,103 |
| Lehman XS Trust Series 2005-1, Class 1A4(b) |
| 1,509,021 | | 0.778 | | | 07/25/35 | | 1,148,088 |
| Residential Asset Mortgage Products, Inc. Series 2003-RZ3, Class A6 |
| 3,511,621 | | 3.400 | | | 03/25/33 | | 2,536,437 |
| Residential Funding Mortgage Securities I, Inc. Series 2000-HI2, Class AI5 |
| 1,465,710 | | 8.350 | | | 03/25/25 | | 1,405,603 |
| |
| | | | | | | |
Principal
Amount | | Interest
Rate | | | Maturity
Date | | Value |
| Asset-Backed Securities – (continued) |
Home Equity – (continued) | | | | | |
| Residential Funding Mortgage Securities I, Inc. Series 2000-HI4, Class AI7 |
| $ 1,421,219 | | 8.480 | % | | 09/25/30 | | $ 1,128,183 |
| Residential Funding Mortgage Securities II, Inc. Series 2003-HS3, Class AI3 |
| 1,937,624 | | 4.470 | | | 07/25/18 | | 1,801,748 |
| Soundview Home Equity Loan Trust Series 2006-EQ1, Class A2(b) |
| 770,211 | | 0.548 | | | 10/25/36 | | 604,182 |
| Southern Pacific Secured Asset Corp. Series 1998-2, Class A7 |
| 5,005,508 | | 6.740 | | | 07/25/29 | | 2,313,309 |
| Structured Asset Securities Corp. Series 2005-9XS, Class 1A3A |
| 3,000,000 | | 5.250 | | | 06/25/35 | | 2,006,974 |
| Wells Fargo Home Equity Trust Series 2004-2, Class AI5(b) |
| 700,000 | | 4.890 | | | 05/25/34 | | 506,129 |
| | | | | | | |
| | | | | | | 17,907,929 |
| |
Manufactured Housing – 1.9% | | |
| Green Tree Financial Corp. Series 1993-4, Class A5 |
| 2,864,821 | | 7.050 | | | 01/15/19 | | 2,500,947 |
| Green Tree Financial Corp. Series 1995-5, Class M1(b) |
| 1,365,661 | | 7.650 | | | 09/15/26 | | 1,212,214 |
| Green Tree Financial Corp. Series 1996-4, Class A7(b) |
| 1,643,742 | | 7.900 | | | 06/15/27 | | 1,431,328 |
| Green Tree Financial Corp. Series 1996-6, Class A6 |
| 462,156 | | 7.950 | | | 09/15/27 | | 425,399 |
| Green Tree Financial Corp. Series 1997-3, Class A6 |
| 109,982 | | 7.320 | | | 03/15/28 | | 83,677 |
| Green Tree Financial Corp. Series 1998-3, Class A5 |
| 919,602 | | 6.220 | | | 03/01/30 | | 667,313 |
| Green Tree Financial Corp. Series 1998-3, Class A6(b) |
| 633,054 | | 6.760 | | | 03/01/30 | | 453,953 |
| Green Tree Financial Corp. Series 1999-1, Class M2(b) |
| 1,500,000 | | 7.340 | | | 11/01/28 | | 141,238 |
| Lehman Manufactured Housing Contract Series 2001-B, Class A3 |
| 571,431 | | 4.350 | | | 05/15/14 | | 346,637 |
| Oakwood Mortgage Investors, Inc. Series 1996-C, Class A6 |
| 3,013,596 | | 7.650 | | | 04/15/27 | | 2,596,566 |
| | | | | | | |
| | | | | | | 9,859,272 |
| |
| (1) | | Returns are not annualized and do not reflect the deduction of taxes that a shareholder would pay on Fund distributions or the redemption of Fund shares. |
| (2) | | The Barclays Capital U.S. Aggregate Bond Index is an unmanaged index comprised of the Barclays Capital Government Corporate Bond Index, Mortgage-Backed Securities Index and Asset-Backed Securities Index. The Index figure does not reflect the deduction of any fees, expenses or taxes. |
| | |
| 10 | | The accompanying notes are an integral part of these financial statements. |
COMMERCE BOND FUND
| | | | | | | |
Principal
Amount | | Interest
Rate | | | Maturity
Date | | Value |
| Asset-Backed Securities – (continued) |
Student Loans – 1.1% | | |
| Brazos Higher Education Authority, Inc. Student Loan RB Taxable Series 2005, Class A-5 (Guaranteed Student Loans)(c) |
| $ 2,857,827 | | 4.910 | % | | 12/01/40 | | $ 2,857,827 |
| Northstar Education Finance, Inc. Series 2005-1, Class A5(b) |
| 2,618,400 | | 1.823 | | | 10/30/45 | | 2,618,400 |
| | | | | | | |
| | | | | | | 5,476,227 |
| |
| TOTAL ASSET-BACKED SECURITIES |
(Cost $63,874,547) | | | | | $ 54,475,790 |
| |
| | | | | | | |
| Taxable Municipal Bond Obligations – 5.2% |
Alabama – 0.2% | | |
| Montgomery Alabama Taxable GO Warrants Series 2005 (FSA) |
| $ 1,295,000 | | 4.790 | % | | 04/01/15 | | $ 1,327,051 |
| |
Alaska – 0.2% | | |
| Providence Alaska Health System Direct Obligation Series 2005 |
| 755,000 | | 4.680 | | | 10/01/10 | | 776,729 |
| 500,000 | | 4.790 | | | 10/01/11 | | 519,780 |
| | | | | | | |
| | | | | | | 1,296,509 |
| |
California – 0.6% | | |
| Industry California Sales Tax RB Taxable Series 2005 (MBIA) |
| 3,045,000 | | 5.000 | | | 01/01/13 | | 2,994,971 |
| |
Illinois – 0.2% | | |
| Will County Community Consolidated School District No. 30-C Troy Township Taxable GO Series 2007 (FSA) |
| 1,100,000 | | 5.650 | | | 10/01/18 | | 1,083,412 |
| |
Indiana – 1.0% | | |
| Indiana Bond Bank RB Taxable School Severance Funding Series 2006-11 (XLCA) |
| 2,715,000 | | 5.500 | | | 07/15/11 | | 2,823,926 |
| 2,190,000 | | 5.650 | | | 07/15/13 | | 2,297,923 |
| | | | | | | |
| | | | | | | 5,121,849 |
| |
Massachusetts – 0.5% |
| University of Massachusetts Building Authority RB Refunding Taxable Series 2006-2 (AMBAC) |
| 255,000 | | 5.360 | | | 05/01/11 | | 267,189 |
| 2,485,000 | | 5.430 | | | 05/01/12 | | 2,635,193 |
| | | | | | | |
| | | | | | | 2,902,382 |
| |
Missouri – 0.3% |
| St. Louis Package RB Series 2006 B (MBIA) |
| 1,560,000 | | 5.020 | | | 12/15/12 | | 1,584,601 |
| |
New Jersey – 0.2% |
| New Jersey Economic Development Authority RB Taxable Designated Industry Series 2004-A |
| 1,000,000 | | 5.200 | | | 03/01/14 | | 1,035,240 |
| |
New York – 0.8% |
| New York State Housing Finance Agency Personal Income Tax RB Taxable Economic Development & Housing Series 2006 B |
| 3,925,000 | | 5.220 | | | 09/15/15 | | 4,066,418 |
| |
| | | | | | | |
Principal
Amount | | Interest
Rate | | | Maturity
Date | | Value |
| Taxable Municipal Bond Obligations – (continued) |
Oklahoma – 0.4% |
| Oklahoma State Capital Improvement Authority RB Taxable Oklahoma State Regents Series 2006 (MBIA) |
| $ 2,000,000 | | 5.160 | % | | 07/01/13 | | $ 2,099,620 |
| |
Oregon – 0.2% |
| Multnomah County Oregon School District 1J Portland GO Bonds Refunding Taxable Series 2004 |
| 785,000 | | 5.165 | | | 06/15/11 | | 818,347 |
| |
Rhode Island – 0.6% |
| Providence Rhode Island GO Bonds Refunding Taxable Series 2004-B (FSA) |
| 710,000 | | 4.960 | | | 07/15/14 | | 714,146 |
| Rhode Island Convention Center Authority RB Taxable Civic Center Series 2006 A (FSA) |
| 2,155,000 | | 5.810 | | | 05/15/16 | | 2,212,388 |
| | | | | | | |
| | | | | | | 2,926,534 |
| |
| TOTAL TAXABLE MUNICIPAL BOND OBLIGATIONS |
(Cost $26,508,978) | | | | | $ 27,256,934 |
| |
| | | | | | | |
| Commercial Mortgage Backed Security – 0.9% |
| Small Business Administration Series 2006-P10B, Class 1 |
| $ 4,513,624 | | 5.681 | % | | 08/10/16 | | $ 4,759,793 |
(Cost $4,524,908) | | | | | |
| |
| | | | | | | |
| Collaterized Mortgage Obligations – 37.0% |
| ABN Amro Mortgage Corp. Series 2003-13, Class A2 |
| $ 3,348,492 | | 5.500 | % | | 02/25/18 | | $ 3,205,547 |
| Banc of America Alternative Loan Trust Series 2004-1, Class 1A1 |
| 5,512,741 | | 6.000 | | | 02/25/34 | | 4,549,736 |
| Banc of America Alternative Loan Trust Series 2005-10, Class 6A1 |
| 4,287,979 | | 5.500 | | | 11/25/20 | | 3,690,342 |
| Banc of America Alternative Loan Trust Series 2006-3, Class 6A1 |
| 929,035 | | 6.000 | | | 04/25/36 | | 683,712 |
Banc of America Mortgage Securities Series 2004-E,
Class 2A5(b) |
| 5,000,000 | | 4.112 | | | 06/25/34 | | 4,474,915 |
| Bear Stearns Alt-A Trust Series 2005-9, Class 25A1(b) |
| 4,390,841 | | 5.668 | | | 11/25/35 | | 2,652,929 |
| Bear Stearns Asset Backed Securities Trust Series 2003-AC7, Class A2 |
| 1,518,083 | | 5.250 | | | 01/25/34 | | 1,229,661 |
| Chase Mortgage Finance Corp. Series 2003-S13, Class A1 |
| 2,429,105 | | 5.500 | | | 11/25/33 | | 2,041,677 |
| Citicorp Mortgage Securities, Inc. Series 2006-4, Class 3A1 |
| 1,373,283 | | 5.500 | | | 08/25/21 | | 1,195,614 |
| Citigroup Mortgage Loan Trust, Inc. Series 2005-10, Class 1A5A(b) |
| 2,339,481 | | 5.830 | | | 12/25/35 | | 1,413,938 |
| |
| | |
| The accompanying notes are an integral part of these financial statements. | | 11 |
COMMERCE BOND FUND
Schedule of Investments (continued)
April 30, 2009 (Unaudited)
| | | | | | | |
Principal
Amount | | Interest
Rate | | | Maturity
Date | | Value |
| Collaterized Mortgage Obligations – (continued) |
| Citigroup Mortgage Loan Trust, Inc. Series 2007-AR5, Class 1A3A(b) |
| $ 1,198,364 | | 5.665 | % | | 04/25/37 | | $ 606,177 |
| Citigroup Mortgage Loan Trust, Inc. Series 2009-3, Class 2A1(a) |
| 6,000,000 | | 5.750 | | | 09/25/21 | | 5,670,000 |
| Citimortgage Alternative Loan Trust Series 2006-A3, Class 2A1 |
| 909,144 | | 5.500 | | | 07/25/36 | | 673,335 |
| Countrywide Alternative Loan Trust Series 2004-18CB, Class 3A1 |
| 1,751,505 | | 5.250 | | | 09/25/19 | | 1,599,984 |
| Countrywide Alternative Loan Trust Series 2005-5R, Class A2 |
| 1,673,877 | | 4.750 | | | 12/25/18 | | 1,531,322 |
| Countrywide Alternative Loan Trust Series 2007-J2, Class 2A1 |
| 1,159,927 | | 6.000 | | | 07/25/37 | | 632,523 |
| Countrywide Home Loans Trust Series 2005-27, Class 2A1 |
| 4,782,387 | | 5.500 | | | 12/25/35 | | 3,519,541 |
| Countrywide Home Loans Trust Series 2005-6, Class 2A1 |
| 1,274,578 | | 5.500 | | | 04/25/35 | | 963,502 |
| CS First Boston Mortgage Securities Corp. Series 2003-19, Class 1A4 |
| 1,628,093 | | 5.250 | | | 07/25/33 | | 1,565,861 |
CS First Boston Mortgage Securities Corp. Series 2005-5,
Class 2A9 |
| 9,000,000 | | 5.500 | | | 07/25/35 | | 6,252,101 |
| FHLMC REMIC PAC Series 1579, Class PM |
| 728,300 | | 6.700 | | | 09/15/23 | | 762,049 |
| FHLMC REMIC PAC Series 2103, Class TE |
| 698,322 | | 6.000 | | | 12/15/28 | | 743,810 |
| FHLMC REMIC PAC Series 2110, Class PG |
| 3,374,718 | | 6.000 | | | 01/15/29 | | 3,598,647 |
| FHLMC REMIC PAC Series 2633, Class PC |
| 3,341,957 | | 4.500 | | | 07/15/15 | | 3,391,702 |
| FHLMC REMIC PAC Series 2640, Class DR |
| 2,000,000 | | 4.000 | | | 08/15/17 | | 2,076,734 |
| FHLMC REMIC PAC Series 2644, Class BM |
| 1,173,978 | | 4.500 | | | 01/15/26 | | 1,188,399 |
| FHLMC REMIC PAC Series 2716, Class DT |
| 1,680,959 | | 5.000 | | | 02/15/30 | | 1,721,460 |
| FHLMC REMIC PAC Series 2760, Class EC |
| 4,050,000 | | 4.500 | | | 04/15/17 | | 4,241,526 |
| FHLMC REMIC PAC Series 2791, Class KE |
| 2,400,000 | | 5.500 | | | 05/15/29 | | 2,462,058 |
| FHLMC REMIC PAC Series 2836, Class XQ |
| 830,000 | | 4.500 | | | 09/15/27 | | 851,019 |
| FHLMC REMIC PAC Series 2907, Class HC |
| 2,600,000 | | 5.000 | | | 06/15/27 | | 2,693,260 |
| FHLMC REMIC PAC Series 3259, Class EA |
| 790,746 | | 5.000 | | | 05/15/27 | | 805,474 |
| FHLMC REMIC Series 2391, Class Z |
| 6,204,023 | | 6.000 | | | 12/15/31 | | 6,622,953 |
| |
| | | | | | | |
Principal
Amount | | Interest
Rate | | | Maturity
Date | | Value |
| Collaterized Mortgage Obligations – (continued) |
| FHLMC REMIC Series 2508, Class OY |
| $ 1,485,000 | | 4.500 | % | | 10/15/17 | | $ 1,560,441 |
| FHLMC REMIC Series 2524, Class WC |
| 850,390 | | 6.000 | | | 11/15/28 | | 857,783 |
| FHLMC REMIC Series 2603, Class C |
| 2,620,000 | | 5.500 | | | 04/15/23 | | 2,775,715 |
| FHLMC REMIC Series 2672, Class NH |
| 4,400,000 | | 4.000 | | | 09/15/18 | | 4,466,258 |
| FHLMC REMIC Series 2677, Class BC |
| 800,000 | | 4.000 | | | 09/15/18 | | 809,899 |
| FHLMC REMIC Series 2742, Class K |
| 4,915,000 | | 4.000 | | | 01/15/19 | | 5,058,548 |
| FHLMC REMIC Series 2840, Class JL |
| 2,619,319 | | 4.500 | | | 06/15/23 | | 2,710,271 |
| FHLMC REMIC Series 2890, Class KB |
| 3,115,000 | | 4.500 | | | 02/15/19 | | 3,247,500 |
| FHLMC REMIC TAC Series 2658, Class A |
| 2,361,179 | | 4.500 | | | 08/15/18 | | 2,428,293 |
| FHLMC Series T-58, Class 1A3 |
| 33,059 | | 4.391 | | | 11/25/38 | | 32,984 |
| First Horizon Alternative Mortgage Securities Series 2004-FA2, Class 1A1 |
| 1,978,884 | | 6.000 | | | 01/25/35 | | 1,633,199 |
| First Horizon Alternative Mortgage Securities Series 2006-RE1, Class A1 |
| 6,605,262 | | 5.500 | | | 05/25/35 | | 3,870,274 |
| FNMA REMIC FNIC PAC Series 2001-45, Class WG |
| 1,424,020 | | 6.500 | | | 09/25/31 | | 1,535,988 |
| FNMA REMIC PAC Series 2003-1, Class PG |
| 3,300,000 | | 5.500 | | | 09/25/31 | | 3,415,066 |
| FNMA REMIC PAC Series 2003-117, Class KB |
| 3,000,000 | | 6.000 | | | 12/25/33 | | 3,156,547 |
| FNMA REMIC PAC Series 2003-14, Class AP |
| 496,646 | | 4.000 | | | 03/25/33 | | 509,222 |
| FNMA REMIC PAC Series 2004-53, Class NC |
| 3,360,000 | | 5.500 | | | 07/25/24 | | 3,520,061 |
| FNMA REMIC Series 2002-73, Class OE |
| 4,019,000 | | 5.000 | | | 11/25/17 | | 4,256,823 |
| FNMA REMIC Series 2002-82, Class XE |
| 3,205,000 | | 5.000 | | | 12/25/17 | | 3,394,775 |
| FNMA REMIC Series 2003-83, Class PG |
| 700,000 | | 5.000 | | | 06/25/23 | | 736,799 |
| FNMA REMIC Series 2003-84, Class PG |
| 540,000 | | 5.000 | | | 03/25/32 | | 565,887 |
| FNMA Series 2003-W6, Class 2A32 |
| 547,034 | | 6.500 | | | 09/25/42 | | 571,309 |
| GNMA Series 1998-12, Class EB |
| 959,774 | | 6.500 | | | 05/20/28 | | 988,135 |
| Impac CMB Trust Series 2004-4, Class 2A2(b) |
| 6,789,966 | | 5.282 | | | 09/25/34 | | 5,630,346 |
| |
| | |
| 12 | | The accompanying notes are an integral part of these financial statements. |
COMMERCE BOND FUND
| | | | | | | |
Principal
Amount | | Interest
Rate | | | Maturity
Date | | Value |
| Collaterized Mortgage Obligations – (continued) |
| Impac Secured Assets Corp. Series 2004-2, Class A6 |
| $ 1,831,746 | | 5.740 | % | | 08/25/34 | | $ 1,620,517 |
| JPMorgan Alternative Loan Trust Series 2006-S1, Class 1A16 |
| 5,948,317 | | 6.000 | | | 03/25/36 | | 5,413,097 |
| JPMorgan Mortgage Trust Series 2005-S3, Class 1A20 |
| 5,000,000 | | 5.500 | | | 01/25/36 | | 2,126,507 |
| JPMorgan Mortgage Trust Series 2007-A2, Class 4A2(b) |
| 1,000,000 | | 6.039 | | | 04/25/37 | | 556,746 |
| Master Alternative Loans Trust Series 2004-4, Class 8A1 |
| 2,785,930 | | 6.500 | | | 05/25/34 | | 2,394,158 |
| Master Asset Securitization Trust Series 2004-3, Class 5A1 |
| 400,519 | | 6.250 | | | 01/25/32 | | 384,248 |
| Morgan Stanley Mortgage Loan Trust Series 2007-12, Class 3A22 |
| 5,288,705 | | 6.000 | | | 08/25/37 | | 3,115,738 |
| RBSGC Mortgage Pass-Through Certificates Series 2007-B, Class 2A1(b) |
| 7,309,090 | | 6.084 | | | 11/25/21 | | 6,208,159 |
| RBSGC Mortgage Pass-Through Certificates Series 2007-B, Class 3A1(b) |
| 551,009 | | 5.453 | | | 07/25/35 | | 471,630 |
| Residential Accredit Loans, Inc. Series 2003-QS7, Class A2 |
| 3,841,364 | | 4.750 | | | 04/25/33 | | 3,506,913 |
| Residential Accredit Loans, Inc. Series 2004-QS2, Class CB |
| 4,953,514 | | 5.750 | | | 02/25/34 | | 3,939,594 |
| Residential Asset Securitization Trust Series 2004-A6, Class A1 |
| 5,966,678 | | 5.000 | | | 08/25/19 | | 5,157,448 |
| Residential Funding Mortgage Securities Corp. Series 2003-RM2, Class AIII |
| 2,452,331 | | 6.000 | | | 05/25/33 | | 2,245,485 |
| Residential Funding Mortgage Securities I, Inc. Series 2003-S8, Class A1 |
| 1,186,561 | | 5.000 | | | 05/25/18 | | 1,179,887 |
| Residential Funding Mortgage Securities I, Inc. Series 2005-S7, Class A5 |
| 3,028,533 | | 5.500 | | | 11/25/35 | | 2,660,279 |
| Residential Funding Mortgage Securities I, Inc. Series 2005-S9, Class A5 |
| 4,868,751 | | 5.750 | | | 12/25/35 | | 3,200,363 |
| Residential Funding Mortgage Securities I, Inc. Series 2006-S12, Class 1A1 |
| 6,690,383 | | 5.500 | | | 12/25/21 | | 6,359,212 |
| Washington Mutual Alternative Mortgage Pass-Through Certificates Series 2005-4, Class 4A1 |
| 4,180,685 | | 5.500 | | | 06/25/20 | | 3,582,506 |
| Wells Fargo Mortgage Backed Securities Trust Series 2003-6, Class 1A1 |
| 1,621,090 | | 5.000 | | | 06/25/18 | | 1,611,971 |
| Wells Fargo Mortgage Backed Securities Trust Series 2005-1, Class 3A1 |
| 946,216 | | 5.250 | | | 01/25/20 | | 927,883 |
| |
| | | | | | | |
Principal
Amount | | Interest
Rate | | | Maturity
Date | | Value |
| Collaterized Mortgage Obligations – (continued) |
| Wells Fargo Mortgage Backed Securities Trust Series 2006-12, Class A5 |
| $ 500,000 | | 6.000 | % | | 10/25/36 | | $ 156,941 |
| |
TOTAL COLLATERIZED MORTGAGE
OBLIGATIONS |
(Cost $194,749,030) | | $193,862,913 |
| |
| | | | | | | |
| Commercial Mortgages – 2.9% |
| FNMA Series 2000-M2, Class C(b) |
| $ 533,961 | | 7.117 | % | | 07/17/22 | | $ 536,087 |
| GNMA Series 2002-62, Class B |
| 572,492 | | 4.763 | | | 01/16/25 | | 583,006 |
| GNMA Series 2003-16, Class B |
| 3,580,000 | | 4.490 | | | 08/16/25 | | 3,710,113 |
| GNMA Series 2003-38, Class JC(b) |
| 600,302 | | 7.003 | | | 08/16/42 | | 668,230 |
| GNMA Series 2003-88, Class AC |
| 584,311 | | 2.914 | | | 06/16/18 | | 589,730 |
| GNMA Series 2004-09, Class A |
| 1,132,997 | | 3.360 | | | 08/16/22 | | 1,136,950 |
| GNMA Series 2004-45, Class A |
| 2,581,914 | | 4.020 | | | 12/16/21 | | 2,621,767 |
| GNMA Series 2004-60, Class C(b) |
| 5,000,000 | | 5.240 | | | 03/16/28 | | 5,252,843 |
| |
| TOTAL COMMERCIAL MORTGAGES |
(Cost $14,693,731) | | | | | $ 15,098,726 |
| |
| | | | | | | |
| Corporate Obligations – 23.2% |
Aerospace/Defense – 0.2% |
| Lockheed Martin Corp. |
| $ 972,000 | | 6.150 | % | | 09/01/36 | | $ 971,896 |
| |
Beverages – 1.3% |
| Anheuser-Busch Cos., Inc. |
| 1,500,000 | | 5.600 | | | 03/01/17 | | 1,409,100 |
| Diageo Capital PLC |
| 1,565,000 | | 7.375 | | | 01/15/14 | | 1,743,620 |
| The Coca-Cola Co. |
| 3,400,000 | | 3.625 | | | 03/15/14 | | 3,473,674 |
| | | | | | | |
| | | | | | | 6,626,394 |
| |
Cable TV – 1.1% |
| Comcast Corp. |
| 1,000,000 | | 5.850 | | | 01/15/10 | | 1,017,830 |
| 1,805,000 | | 4.950 | | | 06/15/16 | | 1,709,064 |
| 1,250,000 | | 6.400 | | | 05/15/38 | | 1,171,725 |
| Time Warner Cable, Inc. |
| 2,000,000 | | 6.200 | | | 07/01/13 | | 2,089,580 |
| | | | | | | |
| | | | | | | 5,988,199 |
| |
Commercial Banks – 1.0% |
| Credit Suisse New York |
| 1,500,000 | | 5.000 | | | 05/15/13 | | 1,481,292 |
| |
| | |
| The accompanying notes are an integral part of these financial statements. | | 13 |
COMMERCE BOND FUND
Schedule of Investments (continued)
April 30, 2009 (Unaudited)
| | | | | | | |
Principal
Amount | | Interest
Rate | | | Maturity
Date | | Value |
| Corporate Obligations – (continued) |
Commercial Banks – (continued) |
| Wachovia Corp. |
| $ 3,125,000 | | 5.300 | % | | 10/15/11 | | $ 3,144,781 |
| | | | | | | |
| | | | | | | 4,626,073 |
| |
Computers – 0.8% |
| International Business Machines Corp. |
| 3,000,000 | | 6.500 | | | 10/15/13 | | 3,362,151 |
| Intuit, Inc. |
| 1,000,000 | | 5.400 | | | 03/15/12 | | 1,011,606 |
| | | | | | | |
| | | | | | | 4,373,757 |
| |
Electric – 2.1% |
| Columbus Southern Power Co. |
| 2,870,000 | | 5.850 | | | 10/01/35 | | 2,207,885 |
| Connecticut Light & Power Co. |
| 415,000 | | 5.650 | | | 05/01/18 | | 424,562 |
| Duke Energy Corp. |
| 1,525,000 | | 5.300 | | | 10/01/15 | | 1,560,304 |
| Exelon Generation Co. LLC |
| 1,470,000 | | 5.350 | | | 01/15/14 | | 1,394,370 |
| PacifiCorp |
| 2,400,000 | | 5.650 | | | 07/15/18 | | 2,509,349 |
| PSE&G Power LLC |
| 1,485,000 | | 5.000 | | | 04/01/14 | | 1,429,252 |
| San Diego Gas & Electric Co. |
| 1,585,000 | | 5.300 | | | 11/15/15 | | 1,600,284 |
| | | | | | | |
| | | | | | | 11,126,006 |
| |
Financial – 6.5% |
| Bank of America Corp. |
| 2,700,000 | | 6.000 | | | 09/01/17 | | 2,258,096 |
| 1,270,000 | | 5.650 | | | 05/01/18 | | 1,033,869 |
| Bank One Corp.(b) |
| 1,000,000 | | 8.530 | | | 03/01/19 | | 969,306 |
| Bear Stearns Companies, Inc. |
| 1,250,000 | | 4.500 | | | 10/28/10 | | 1,261,528 |
| 1,000,000 | | 7.250 | | | 02/01/18 | | 1,021,218 |
| Citigroup, Inc. |
| 1,355,000 | | 6.000 | | | 02/21/12 | | 1,245,265 |
| Equitable Life Assurance Society of the United States(a) |
| 5,900,000 | | 7.700 | | | 12/01/15 | | 5,616,057 |
| General Electric Capital Corp.(b) |
| 2,725,000 | | 6.375 | | | 11/15/67 | | 1,564,131 |
| JPMorgan Chase & Co. |
| 1,250,000 | | 6.000 | | | 01/15/18 | | 1,215,291 |
| Merrill Lynch & Co., Inc. |
| 3,500,000 | | 5.450 | | | 02/05/13 | | 3,064,400 |
| Metropolitan Life Insurance Co.(a) |
| 6,000,000 | | 7.700 | | | 11/01/15 | | 5,728,722 |
| Morgan Stanley & Co. |
| 2,600,000 | | 6.625 | | | 04/01/18 | | 2,474,313 |
| |
| | | | | | | |
Principal
Amount | | Interest
Rate | | | Maturity
Date | | Value |
| Corporate Obligations – (continued) |
Financial – (continued) |
| National Rural Utilities Cooperative Finance Corp. |
| $ 1,550,000 | | 5.450 | % | | 04/10/17 | | $ 1,499,213 |
| Reed Elsevier Capital, Inc. |
| 1,800,000 | | 6.750 | | | 08/01/11 | | 1,827,040 |
| SunTrust Capital VIII(b) |
| 2,670,000 | | 6.100 | | | 12/15/36 | | 1,561,069 |
| Wells Fargo & Co. |
| 2,000,000 | | 5.625 | | | 12/11/17 | | 1,864,632 |
| | | | | | | |
| | | | | | | 34,204,150 |
| |
Food – 0.9% |
| General Mills, Inc. |
| 1,000,000 | | 5.250 | | | 08/15/13 | | 1,045,038 |
| H.J. Heinz Co. |
| 2,475,000 | | 5.350 | | | 07/15/13 | | 2,560,162 |
| Kraft Foods, Inc. |
| 1,000,000 | | 6.875 | | | 02/01/38 | | 982,040 |
| | | | | | | |
| | | | | | | 4,587,240 |
| |
Health Care Equipment & Supplies – 0.5% |
| Baxter International, Inc. |
| 2,650,000 | | 5.375 | | | 06/01/18 | | 2,698,439 |
| |
Hotels, Restaurants & Leisure – 0.3% |
| McDonald’s Corp. |
| 1,425,000 | | 5.300 | | | 03/15/17 | | 1,474,096 |
| |
Industrial – 0.5% |
| Receipts on Corporate Securities Trust NSC-1998-1 |
| 2,489,087 | | 6.375 | | | 05/15/17 | | 2,796,265 |
| |
Multimedia – 0.9% |
| AOL Time Warner |
| 3,170,000 | | 6.750 | | | 04/15/11 | | 3,308,783 |
| The McGraw-Hill Companies, Inc. |
| 1,500,000 | | 5.375 | | | 11/15/12 | | 1,461,543 |
| | | | | | | |
| | | | | | | 4,770,326 |
| |
Oil & Gas – 1.1% |
| Apache Corp. |
| 1,250,000 | | 7.375 | | | 08/15/47 | | 1,301,657 |
| Tosco Corp. |
| 2,095,000 | | 8.125 | | | 02/15/30 | | 2,301,875 |
| Valero Energy Corp. |
| 2,000,000 | | 6.875 | | | 04/15/12 | | 2,045,968 |
| | | | | | | |
| | | | | | | 5,649,500 |
| |
Real Estate – 1.0% |
| Hospitality Properties Trust |
| 1,240,000 | | 6.300 | | | 06/15/16 | | 868,103 |
| ProLogis |
| 2,280,000 | | 5.250 | | | 11/15/10 | | 2,110,486 |
| Simon Property Group LP |
| 2,235,000 | | 5.375 | | | 06/01/11 | | 2,112,692 |
| | | | | | | |
| | | | | | | 5,091,281 |
| |
| | |
| 14 | | The accompanying notes are an integral part of these financial statements. |
COMMERCE BOND FUND
| | | | | | | |
Principal
Amount | | Interest
Rate | | | Maturity
Date | | Value |
| Corporate Obligations – (continued) |
Retail – 0.4% |
| Target Corp. |
| $ 1,000,000 | | 5.125 | % | | 01/15/13 | | $ 1,037,918 |
| Wal-Mart Stores, Inc. |
| 1,250,000 | | 6.200 | | | 04/15/38 | | 1,301,694 |
| | | | | | | |
| | | | | | | 2,339,612 |
| |
Sovereign Agency – 0.4% |
| Resolution Funding Corp. |
| 1,500,000 | | 8.125 | | | 10/15/19 | | 2,066,408 |
| |
Telecommunications – 0.5% |
| AT&T, Inc. |
| 2,380,000 | | 4.950 | | | 01/15/13 | | 2,465,823 |
| |
Utilities – 1.4% |
| GTE Corp. |
| 5,310,000 | | 6.840 | | | 04/15/18 | | 5,332,929 |
| Pacific Gas & Electric Co. |
| 2,000,000 | | 6.350 | | | 02/15/38 | | 2,080,538 |
| | | | | | | |
| | | | | | | 7,413,467 |
| |
Yankee – 2.3% |
| BHP Billiton Finance USA Ltd. |
| 750,000 | | 6.750 | | | 11/01/13 | | 811,852 |
| 955,000 | | 5.250 | | | 12/15/15 | | 954,138 |
| Canadian National Railway Co. |
| 1,190,000 | | 6.200 | | | 06/01/36 | | 1,174,259 |
| Deutsche Telekom International Finance BV |
| 1,335,000 | | 8.500 | | | 06/15/10 | | 1,403,353 |
| France Telecom SA |
| 1,286,000 | | 7.750 | | | 03/01/11 | | 1,392,858 |
| Swiss Bank Corp. |
| 7,335,000 | | 7.375 | | | 06/15/17 | | 6,348,171 |
| | | | | | | |
| | | | | | | 12,084,631 |
| |
| TOTAL CORPORATE OBLIGATIONS | | |
(Cost $128,787,242) | | | | | $121,353,563 |
| |
| | | | | | | |
| Foreign Debt Obligation – 1.2% |
Sovereign – 1.2% |
| Egypt Agency for International Development |
| $ 5,700,000 | | 4.450 | % | | 09/15/15 | | $ 6,063,033 |
(Cost $5,435,050) | | | | | |
| |
| | | | | | | |
| Mortgage-Backed Pass-Through Obligations – 5.6% |
| FHLMC | | | | | | | |
| $ 69,247 | | 6.000 | % | | 12/01/13 | | $ 73,198 |
| 128,090 | | 8.500 | | | 02/01/19 | | 138,354 |
| 159,349 | | 8.500 | | | 03/01/21 | | 172,219 |
| 1,000,669 | | 7.000 | | | 05/01/26 | | 1,083,749 |
| 92,670 | | 7.000 | | | 10/01/30 | | 99,577 |
| 128,104 | | 7.500 | | | 12/01/30 | | 139,588 |
| 236,256 | | 7.500 | | | 01/01/31 | | 257,435 |
| 509,323 | | 7.000 | | | 08/01/31 | | 546,319 |
| |
| | | | | | | |
Principal
Amount | | Interest
Rate | | | Maturity
Date | | Value |
| Mortgage-Backed Pass-Through Obligations – (continued) |
| FHLMC – (continued) | | |
| $ 5,267,980 | | 5.000 | % | | 05/01/33 | | $ 5,433,116 |
| 976,588 | | 4.260 | (b) | | 05/01/34 | | 969,630 |
| 3,357,250 | | 5.269 | (b) | | 01/01/36 | | 3,459,153 |
| FNMA | | | | | | | |
| 8,317 | | 7.000 | | | 07/01/09 | | 8,441 |
| 18,627 | | 6.500 | | | 02/01/12 | | 19,497 |
| 124,299 | | 6.000 | | | 12/01/13 | | 127,810 |
| 63,690 | | 6.500 | | | 07/01/14 | | 68,200 |
| 106,987 | | 9.000 | | | 11/01/21 | | 116,896 |
| 78,136 | | 6.500 | | | 08/01/24 | | 84,010 |
| 97,096 | | 6.500 | | | 09/01/24 | | 104,395 |
| 106,458 | | 9.000 | | | 02/01/25 | | 117,493 |
| 18,468 | | 6.500 | | | 03/01/26 | | 19,856 |
| 46,401 | | 8.000 | | | 07/01/28 | | 50,713 |
| 208,972 | | 6.500 | | | 10/01/28 | | 224,681 |
| 149,540 | | 3.841 | (b) | | 12/01/28 | | 150,383 |
| 58,861 | | 6.500 | | | 01/01/29 | | 63,286 |
| 129,103 | | 6.000 | | | 07/01/29 | | 136,377 |
| 127,361 | | 7.500 | | | 09/01/29 | | 138,856 |
| 97,866 | | 7.000 | | | 03/01/31 | | 105,620 |
| 56,106 | | 7.500 | | | 03/01/31 | | 61,090 |
| 305,824 | | 7.000 | | | 11/01/31 | | 329,995 |
| 633,102 | | 7.000 | | | 01/01/32 | | 683,141 |
| 1,785,543 | | 6.000 | | | 12/01/32 | | 1,883,921 |
| 657,685 | | 5.262 | (b) | | 02/01/33 | | 678,347 |
| 2,397,242 | | 5.000 | | | 07/01/33 | | 2,475,759 |
| 1,084,008 | | 5.085 | (b) | | 10/01/34 | | 1,122,068 |
| 2,713,256 | | 5.105 | (b) | | 02/01/35 | | 2,821,529 |
| GNMA | | | | | | | |
| 241,430 | | 8.000 | | | 02/15/22 | | 260,642 |
| 118,602 | | 7.500 | | | 08/20/25 | | 127,596 |
| 519,923 | | 7.500 | | | 07/20/26 | | 559,624 |
| 693,770 | | 6.500 | | | 04/15/31 | | 740,367 |
| 721,514 | | 6.500 | | | 05/15/31 | | 769,975 |
| 2,600,759 | | 5.500 | | | 04/15/33 | | 2,714,486 |
| |
| TOTAL MORTGAGE-BACKED PASS-THROUGH OBLIGATIONS |
(Cost $25,921,518) | | $ 29,137,392 |
| |
| | | | | | | |
| U.S. Government Agency Obligations – 6.1% |
| Farmer Mac Gtd.(a) | | |
| $11,000,000 | | 5.500 | % | | 07/15/11 | | $ 11,762,806 |
| FFCB | | |
| 6,135,000 | | 4.500 | | | 05/06/14 | | 6,597,051 |
| 2,860,000 | | 5.190 | | | 04/22/21 | | 2,961,582 |
| FHLB | | |
| 1,915,000 | | 5.375 | | | 08/15/24 | | 2,014,172 |
| 2,650,000 | | 7.125 | | | 02/15/30 | | 3,243,926 |
| FHLMC | | |
| 2,500,000 | | 6.750 | | | 03/15/31 | | 3,196,015 |
| Tennessee Valley Authority | | |
| 2,300,000 | | 5.500 | | | 06/15/38 | | 2,369,455 |
| |
| TOTAL U.S. GOVERNMENT AGENCY OBLIGATIONS |
(Cost $30,167,880) | | $ 32,145,007 |
| |
| | |
| The accompanying notes are an integral part of these financial statements. | | 15 |
COMMERCE BOND FUND
Schedule of Investments (continued)
April 30, 2009 (Unaudited)
| | | | | | | |
Principal
Amount | | Interest
Rate | | | Maturity
Date | | Value |
| U.S. Government Guarantee Corporate Obligations* – 1.5% |
| Morgan Stanley & Co. |
| $ 2,800,000 | | 2.250 | % | | 03/13/12 | | $ 2,815,028 |
| Oriental Bank & Trust |
| 3,000,000 | | 2.750 | | | 03/16/12 | | 2,999,244 |
| U.S. Bancorp |
| 2,000,000 | | 2.250 | | | 03/13/12 | | 2,007,968 |
| |
| TOTAL U.S. GOVERNMENT GUARANTEE CORPORATE OBLIGATIONS |
(Cost $7,795,812) | | $ 7,822,240 |
| |
| | | | | | | |
| U.S. Treasury Obligations – 2.3% |
| United States Treasury Notes | | |
| $ 4,000,000 | | 4.250 | % | | 11/15/14 | | $ 4,441,564 |
| 6,965,000 | | 4.000 | | | 02/15/15 | | 7,619,599 |
| |
| TOTAL U.S. TREASURY OBLIGATIONS |
(Cost $10,745,072) | | $ 12,061,163 |
| |
| | | | | | | |
| | | | | | |
| Shares | | Description | | Rate | | Value |
Exchange Traded Funds – 2.8% |
| 538,877 | | Vanguard Intermediate-Term Investment Grade Fund | | 5.63% | | $ 4,666,672 |
| 1,270,699 | | Vanguard Long-Term Investment Grade Fund | | 6.44 | | 9,987,697 |
| |
TOTAL EXCHANGE TRADED FUNDS |
(Cost $14,500,000) | | | | $ 14,654,369 |
| |
| | | | | | | |
Principal
Amount | | Interest
Rate | | | Maturity
Date | | Value |
| Repurchase Agreement(d) – 0.4% |
| State Street Bank & Trust Co. |
| $ 1,902,000 | | 0.010 | % | | 05/01/09 | | $ 1,902,000 |
Maturity Value: $1,902,001 | | | | | |
(Cost $1,902,000) | | |
| |
| TOTAL INVESTMENTS – 99.5% |
(Cost $529,605,768) | | $520,592,923 |
| |
OTHER ASSETS IN EXCESS OF LIABILITIES – 0.5% | | 2,837,167 |
| |
| NET ASSETS – 100.0% | | $523,430,090 |
| |
| | | | | | |
| The percentage shown for each investment category reflects the value of investments in that category as a percentage of net assets. |
| * | | Securities issued under the Federal Deposit Insurance Corporation Temporary Liquidity Guarantee Program. |
| (a) | | Securities are exempt from registration under Rule 144A of the Securities Act of 1933. Under procedures approved by the Board of Trustees, such securities have been determined to be liquid by the Investment Adviser and may be resold, normally to qualified institutional buyers in transactions exempt from registration. Total market value of Rule 144A securities amounted to $39,107,182, which represents approximately 7.5% of net assets as of April 30, 2009. |
| | | | | | |
| | | | | | | |
| (b) | | Variable rate security. The interest rate shown reflects the rate as of April 30, 2009. |
| (c) | | Securities with “Put” features with resetting interest rates. Maturity dates disclosed are the next interest reset dates. |
| (d) | | Repurchase agreement was entered into on April 30, 2009. This agreement was fully collateralized by $1,840,000 U.S. Treasury Notes, 3.125%, due 09/30/13 with a market value of $1,942,672. |
| | | | | | |
|
| |
| Investment Abbreviations: |
| AMBAC | | —Insured by American Municipal Bond Assurance Corp. |
| FFCB | | —Federal Farm Credit Bank |
| FHLB | | —Federal Home Loan Bank |
| FHLMC | | —Federal Home Loan Mortgage Corp. |
| FNIC | | —Financial Network Investment Corporation |
| FNMA | | —Federal National Mortgage Association |
| FSA | | —Insured by Financial Security Assurance Co. |
| GNMA | | —Government National Mortgage Association |
| GO | | —General Obligation |
| MBIA | | —Insured by Municipal Bond Investors Assurance |
| PAC | | —Planned Amortization Class |
| RB | | —Revenue Bond |
| REMIC | | —Real Estate Mortgage Investment Conduit |
| TAC | | —Targeted Amortization Class |
| XLCA | | —Insured by XL Capital Assurance, Inc. |
| |
PORTFOLIO COMPOSITION
| | | | | | |
| Sector Allocations | | AS OF
4/30/09 | | | AS OF
10/31/08 | |
| | |
Collateralized Mortgage Obligations | | 37.0 | % | | 28.7 | % |
Corporate Obligations | | 23.2 | | | 22.5 | |
Asset-Backed Securities | | 10.4 | | | 11.6 | |
U.S. Government Agency Obligations | | 6.1 | | | 7.6 | |
Mortgage-Backed Pass-Through Obligations | | 5.6 | | | 11.8 | |
Taxable Municipal Bond Obligations | | 5.2 | | | 6.5 | |
Commercial Mortgages | | 2.9 | | | 3.2 | |
Exchange Traded Funds | | 2.8 | | | 0.5 | |
U.S. Treasury Obligations | | 2.3 | | | 4.3 | |
U.S. Government Guarantee Corporate Obligations | | 1.5 | | | — | |
Foreign Debt Obligation | | 1.2 | | | 1.1 | |
Commercial Mortgage Backed Security | | 0.9 | | | 0.9 | |
Short-Term Obligation | | 0.4 | | | 0.7 | |
| | |
| TOTAL INVESTMENTS | | 99.5 | % | | 99.4 | % |
| | |
The percentage shown for each Sector Allocation reflects the value of investments in that category as a percentage of net assets.
The Fund is actively managed and, as such its composition may differ over time.
| | |
| 16 | | The accompanying notes are an integral part of these financial statements. |
COMMERCE SHORT-TERM GOVERNMENT FUND
Short-Term Government Fund
Performance Information(1) (Unaudited)
For the six months ended April 30, 2009, the Fund had a total return of 4.24%, based on its Net Asset Value (NAV). This compares to the Citigroup 1-5 Year Treasury/Government Sponsored Index(2) six-month return of 3.38%. Past performance is no guarantee of future results.
Schedule of Investments
April 30, 2009 (Unaudited)
| | | | | | | |
Principal
Amount | | Interest
Rate | | | Maturity
Date | | Value |
| Asset-Backed Securities(a) – 0.6% |
Home Equity – 0.6% |
| Argent Securities, Inc. Series 2004-W5, Class AV3B |
| $ 778,639 | | 0.888 | % | | 04/25/34 | | $ 306,621 |
| Lehman XS Trust Series 2005-7N, Class 1A1A |
| 461,140 | | 0.708 | | | 12/25/35 | | 186,258 |
| | | | | | | |
| | | | | | | 492,879 |
| |
| TOTAL ASSET-BACKED SECURITIES |
(Cost $730,223) | | | | | $ 492,879 |
| |
| | | | | | | |
| Commercial Mortgage-Backed Security – 2.4% |
| Small Business Administration Series 2006-P10B, Class 1 |
| $1,805,450 | | 5.681 | % | | 08/10/16 | | $ 1,903,918 |
(Cost $1,818,426) | | | | | |
| |
| | | | | | | |
| Collaterized Mortgage Obligations – 22.1% |
| American Home Mortgage Investment Trust Series 2004-3, Class 6A4 |
| $ 862,261 | | 5.010 | % | | 10/25/34 | | $ 776,019 |
| Bank of America Funding Corp. Series 2004-A, Class 1A3(a) |
| 202,572 | | 5.004 | | | 09/20/34 | | 178,510 |
| Citigroup Mortgage Loan Trust, Inc. Series 2004-HYB3, Class 1A(a) |
| 333,500 | | 4.414 | | | 09/25/34 | | 215,395 |
| Countrywide Alternative Loan Trust Series 2005-5R, Class A2 |
| 655,970 | | 4.750 | | | 12/25/18 | | 600,105 |
| Countrywide Home Loans, Inc. Series 2002-35, Class 3A1 |
| 121,889 | | 5.000 | | | 02/25/18 | | 121,203 |
| Countrywide Home Loans, Inc. Series 2003-HYB3, Class 7A1(a) |
| 870,410 | | 3.776 | | | 11/19/33 | | 737,766 |
| FHLMC PAC Series 023, Class PK |
| 553,342 | | 6.000 | | | 11/25/23 | | 592,375 |
| FHLMC REMIC PAC Series 041, Class F |
| 103,251 | | 10.000 | | | 05/15/20 | | 110,542 |
| FHLMC REMIC PAC Series 159, Class H |
| 38,126 | | 4.500 | | | 09/15/21 | | 38,136 |
| FHLMC REMIC PAC Series 1614, Class MB |
| 61,640 | | 6.500 | | | 12/15/09 | | 62,095 |
| |
| | | | | | | |
Principal
Amount | | Interest
Rate | | | Maturity
Date | | Value |
| Collaterized Mortgage Obligations – (continued) |
| FHLMC REMIC PAC Series 2022, Class PE |
| $ 135,251 | | 6.500 | % | | 01/15/28 | | $ 143,283 |
| FHLMC REMIC PAC Series 2109, Class PE |
| 478,615 | | 6.000 | | | 12/15/28 | | 510,309 |
| FHLMC REMIC PAC Series 2345, Class PQ |
| 71,218 | | 6.500 | | | 08/15/16 | | 75,902 |
| FHLMC REMIC PAC Series 2389, Class CD |
| 48,434 | | 6.000 | | | 03/15/16 | | 48,953 |
| FHLMC REMIC PAC Series 2439, Class LG |
| 212,323 | | 6.000 | | | 09/15/30 | | 213,771 |
| FHLMC REMIC PAC Series 2594, Class OR |
| 281,153 | | 4.250 | | | 06/15/32 | | 284,864 |
| FHLMC REMIC PAC Series 2760, Class EC |
| 600,000 | | 4.500 | | | 04/15/17 | | 628,374 |
| FHLMC REMIC PAC Series 2763, Class PC |
| 1,248,454 | | 4.500 | | | 08/15/16 | | 1,276,762 |
| FHLMC REMIC PAC Series 3117, Class PC |
| 800,000 | | 5.000 | | | 06/15/31 | | 827,797 |
| FHLMC REMIC Series 2584, Class LX |
| 306,245 | | 5.500 | | | 12/15/13 | | 316,449 |
| FHLMC Series T-58, Class 1A3 |
| 22,039 | | 4.391 | | | 11/25/38 | | 21,989 |
| FNMA REMIC PAC Series 1992, Class 89 Principal-Only Stripped Security(b) |
| 44,455 | | 0.000 | | | 06/25/22 | | 38,868 |
| FNMA REMIC PAC Series 1992-129, Class L |
| 308,464 | | 6.000 | | | 07/25/22 | | 320,128 |
| FNMA REMIC PAC Series 1993-132, Class A Principal-Only Stripped Security(b) |
| 40,753 | | 0.000 | | | 10/25/22 | | 38,354 |
| FNMA REMIC PAC Series 1998-36, Class J |
| 195,549 | | 6.000 | | | 07/18/28 | | 200,623 |
| FNMA REMIC PAC Series 2001-71, Class MB |
| 439,318 | | 6.000 | | | 12/25/16 | | 467,352 |
| FNMA REMIC PAC Series 2001-76, Class UC |
| 73,471 | | 5.500 | | | 11/25/15 | | 73,628 |
| FNMA REMIC PAC Series 2003-117, Class KB |
| 556,000 | | 6.000 | | | 12/25/33 | | 585,013 |
| FNMA REMIC PAC Series 2003-14, Class AP |
| 667,759 | | 4.000 | | | 03/25/33 | | 684,668 |
| |
| (1) | | Returns assume expense reimbursements and are not annualized. Returns do not reflect the deduction of taxes that a shareholder would pay on Fund distributions or the redemption of Fund shares. |
| (2) | | The Citigroup 1-5 Year Treasury/Government Sponsored Index, is an unmanaged index comprised of Treasury securities with a minimum principal amount of $1 billion and U.S. Government securities with a minimum principal amount of $100 million. The securities range in maturity from one to five years. The Index figure does not reflect the deduction of any fees, expenses or taxes. |
| | |
| The accompanying notes are an integral part of these financial statements. | | 17 |
COMMERCE SHORT-TERM GOVERNMENT FUND
Schedule of Investments (continued)
April 30, 2009 (Unaudited)
| | | | | | | |
Principal
Amount | | Interest
Rate | | | Maturity
Date | | Value |
| Collaterized Mortgage Obligations – (continued) |
| FNMA REMIC PAC Series 2003-74, Class PR |
| $ 763,871 | | 4.000 | % | | 11/25/25 | | $ 767,847 |
| FNMA REMIC Series 1991-137, Class H |
| 145,603 | | 7.000 | | | 10/25/21 | | 159,294 |
| FNMA REMIC Series 1993-140, Class J |
| 93,625 | | 6.650 | | | 06/25/13 | | 93,918 |
| FNMA REMIC Series 1993-182, Class FA(a) |
| 42,808 | | 2.220 | | | 09/25/23 | | 41,739 |
| FNMA REMIC Series 1993-183, Class K |
| 94,426 | | 6.500 | | | 07/25/23 | | 96,455 |
| FNMA Series 2003-W17, Class 1A6 |
| 100,000 | | 5.310 | | | 08/25/33 | | 102,094 |
| GNMA Series 1998-12, Class EB |
| 239,944 | | 6.500 | | | 05/20/28 | | 247,034 |
| GNMA Series 2001-53, Class F(a) |
| 57,865 | | 0.797 | | | 10/20/31 | | 57,445 |
| GSR Mortgage Loan Trust Series 2006-AR1, Class 2A4(a) |
| 1,070,000 | | 5.176 | | | 01/25/36 | | 278,128 |
| Indymac Index Mortgage Loan Trust Series 2004-AR6, Class 6A1(a) |
| 583,912 | | 5.487 | | | 10/25/34 | | 480,445 |
| Master Adjustable Rate Mortgages Trust Series 2004-13, Class 2A1(a) |
| 775,591 | | 4.374 | | | 04/21/34 | | 631,731 |
| Master Asset Securitization Trust Series 2003-6, Class 9A1 |
| 551,771 | | 4.250 | | | 07/25/33 | | 521,750 |
| Master Asset Securitization Trust Series 2004-3, Class 5A1 |
| 190,464 | | 6.250 | | | 01/25/32 | | 182,727 |
| Residential Accredit Loans, Inc. Series 2004-QS5, Class A5 |
| 591,354 | | 4.750 | | | 04/25/34 | | 533,700 |
| Residential Funding Mortgage Securities I, Inc. Series 2003-S8, Class A1 |
| 460,928 | | 5.000 | | | 05/25/18 | | 458,336 |
| Securitized Asset Sales, Inc. Series 1993-7, Class TA6 |
| 60,878 | | 6.250 | | | 12/25/23 | | 60,775 |
| Sequoia Mortgage Trust Series 10, Class 1A(a) |
| 216,580 | | 0.847 | | | 10/20/27 | | 181,880 |
| Sequoia Mortgage Trust Series 2003-2, Class A1(a) |
| 386,756 | | 1.107 | | | 06/20/33 | | 282,200 |
| Structured Asset Securities Corp. Series 2003-31A, Class 2A7(a) |
| 1,417,771 | | 4.113 | | | 10/25/33 | | 1,068,645 |
| Vendee Mortgage Trust Series 1996-2, Class 1Z |
| 273,926 | | 6.750 | | | 06/15/26 | | 287,024 |
| Washington Mutual MSC Mortgage Pass-Through Series 2002-MS8, Class 4A5 |
| 468,677 | | 5.750 | | | 12/25/32 | | 472,047 |
| Wells Fargo Mortgage Backed Securities Trust Series 2003-6, Class 1A1 |
| 291,796 | | 5.000 | | | 06/25/18 | | 290,155 |
| |
| TOTAL COLLATERIZED MORTGAGE OBLIGATIONS |
(Cost $18,014,921) | | | | | $17,484,602 |
| |
| | | | | | | |
Principal
Amount | | Interest
Rate | | | Maturity
Date | | Value |
| Commercial Mortgages – 6.1% | | |
| FNMA Series 2000-M2, Class C(a) |
| $ 185,725 | | 7.117 | % | | 07/17/22 | | $ 186,465 |
| GNMA REMIC Series 2004-51, Class A |
| 164,185 | | 4.145 | | | 02/16/18 | | 165,809 |
| GNMA Series 2004-09, Class A |
| 507,232 | | 3.360 | | | 08/16/22 | | 509,002 |
| GNMA Series 2004-20, Class C |
| 1,700,000 | | 4.430 | | | 04/16/34 | | 1,757,640 |
| GNMA Series 2004-45, Class A |
| 968,218 | | 4.020 | | | 12/16/21 | | 983,163 |
| GNMA Series 2004-60, Class C(a) |
| 1,150,000 | | 5.240 | | | 03/16/28 | | 1,208,154 |
| |
| TOTAL COMMERCIAL MORTGAGES |
(Cost $4,682,345) | | | | | $ 4,810,233 |
| |
| | | | | | | |
| Mortgage-Backed Pass-Through Obligations – 5.3% |
| FHLMC | | | | | | | |
| $ 201,157 | | 5.500 | % | | 08/01/17 | | $ 210,422 |
| 623,685 | | 5.500 | | | 09/01/21 | | 649,485 |
| 133,048 | | 6.000 | | | 10/01/23 | | 140,130 |
| FNMA | | | | | | | |
| 300,366 | | 4.500 | | | 11/01/09 | | 303,530 |
| 2,641 | | 6.500 | | | 02/01/12 | | 2,764 |
| 160,738 | | 6.500 | | | 09/01/13 | | 170,156 |
| 203,964 | | 10.500 | | | 11/01/15 | | 221,467 |
| 215,554 | | 6.000 | | | 07/01/16 | | 227,540 |
| 9,179 | | 6.195 | (a) | | 08/01/23 | | 9,382 |
| 4,277 | | 9.000 | | | 07/01/24 | | 4,631 |
| 17,697 | | 3.841 | (a) | | 12/01/28 | | 17,797 |
| 92,674 | | 7.000 | | | 11/01/31 | | 99,998 |
| 708,909 | | 6.000 | | | 07/01/33 | | 747,968 |
| 814,118 | | 4.759 | (a) | | 02/01/34 | | 827,615 |
| 505,466 | | 5.085 | (a) | | 10/01/34 | | 523,213 |
| GNMA | | | | | | | |
| 15,886 | | 8.000 | | | 07/15/17 | | 17,155 |
| 517 | | 4.125 | (a) | | 11/20/24 | | 524 |
| 1,090 | | 4.125 | (a) | | 12/20/24 | | 1,122 |
| 17,956 | | 5.375 | (a) | | 04/20/26 | | 18,444 |
| 17,830 | | 4.625 | (a) | | 08/20/26 | | 17,948 |
| 20,699 | | 5.375 | (a) | | 01/20/28 | | 21,255 |
| |
| TOTAL MORTGAGE-BACKED PASS-THROUGH OBLIGATIONS |
(Cost $4,002,925) | | | | | $ 4,232,546 |
| |
| | | | | | | |
| U.S. Government Agency Obligations – 40.6% |
| Farmer Mac Gtd.(c) |
| $3,000,000 | | 5.500 | % | | 07/15/11 | | $ 3,208,038 |
| FFCB | | | | | | | |
| 3,500,000 | | 5.250 | | | 06/19/09 | | 3,523,397 |
| 237,000 | | 6.890 | | | 09/13/10 | | 255,607 |
| 250,000 | | 7.000 | | | 09/01/15 | | 299,727 |
| 500,000 | | 6.125 | | | 12/29/15 | | 571,664 |
| |
| | |
| 18 | | The accompanying notes are an integral part of these financial statements. |
COMMERCE SHORT-TERM GOVERNMENT FUND
| | | | | | | |
Principal
Amount | | Interest
Rate | | | Maturity
Date | | Value |
| U.S. Government Agency Obligations – (continued) |
| FHLB | | | | | | | |
| $ 750,000 | | 5.000 | % | | 03/11/11 | | $ 797,595 |
| 1,640,000 | | 3.375 | | | 06/24/11 | | 1,702,325 |
| 1,250,000 | | 4.750 | | | 12/09/11 | | 1,345,484 |
| 1,000,000 | | 3.500 | | | 03/08/13 | | 1,033,499 |
| 1,000,000 | | 3.625 | | | 10/18/13 | | 1,046,826 |
| 1,560,000 | | 5.250 | | | 06/18/14 | | 1,746,540 |
| FHLMC | | | | | | | |
| 2,000,000 | | 4.875 | | | 02/09/10 | | 2,064,562 |
| 3,700,000 | | 5.000 | | | 10/18/10 | | 3,899,756 |
| 1,500,000 | | 4.625 | | | 10/25/12 | | 1,639,462 |
| 800,000 | | 4.000 | | | 06/12/13 | | 845,503 |
| 1,560,000 | | 2.500 | | | 01/07/14 | | 1,566,006 |
| 790,000 | | 5.000 | | | 07/15/14 | | 882,718 |
| FNMA | | | | | | | |
| 1,000,000 | | 6.000 | | | 05/15/11 | | 1,096,570 |
| 1,000,000 | | 6.125 | | | 03/15/12 | | 1,123,135 |
| 850,000 | | 3.625 | | | 02/12/13 | | 899,067 |
| 1,500,000 | | 4.375 | | | 03/15/13 | | 1,629,477 |
| Tennessee Valley Authority | | |
| 900,000 | | 6.790 | | | 05/23/12 | | 1,024,232 |
| |
| TOTAL U.S. GOVERNMENT AGENCY OBLIGATIONS |
(Cost $31,255,886) | | | | | $32,201,190 |
| |
| | | | | | | |
| U.S. Government Guarantee Corporate Obligations* – 6.8% |
Financial – 6.8% | | | | | |
| JPMorgan Chase & Co. |
| $ 800,000 | | 3.125 | % | | 12/01/11 | | $ 824,753 |
| Keybank National Association |
| 400,000 | | 3.200 | | | 06/15/12 | | 412,380 |
| Morgan Stanley & Co. | | | |
| 800,000 | | 2.900 | | | 12/01/10 | | 820,098 |
| 750,000 | | 2.250 | | | 03/13/12 | | 754,025 |
| Regions Bank | | | | | |
| 1,000,000 | | 3.250 | | | 12/09/11 | | 1,034,114 |
| U.S. Bancorp | | | | | |
| 750,000 | | 2.250 | | | 03/13/12 | | 752,988 |
| Wells Fargo & Co. |
| 800,000 | | 3.000 | | | 12/09/11 | | 824,305 |
| | | | | | | |
| | | | | | | 5,422,663 |
| |
| TOTAL CORPORATE OBLIGATIONS |
(Cost $5,295,631) | | | | | $ 5,422,663 |
| |
| | | | | | | |
| U.S. Treasury Obligations – 11.8% |
| United States Treasury Inflation Protected Securities |
| $1,179,970 | | 3.000 | % | | 07/15/12 | | $ 1,245,606 |
| 1,148,200 | | 2.000 | | | 01/15/14 | | 1,169,729 |
| 1,125,530 | | 2.000 | | | 07/15/14 | | 1,149,096 |
| |
| | | | | | | |
Principal
Amount | | Interest
Rate | | | Maturity
Date | | Value |
| U.S. Treasury Obligations – (continued) |
| United States Treasury Notes |
| $1,000,000 | | 4.125 | % | | 08/15/10 | | $ 1,045,234 |
| 2,000,000 | | 4.500 | | | 11/15/10 | | 2,115,234 |
| 2,000,000 | | 5.125 | | | 06/30/11 | | 2,176,250 |
| 435,000 | | 4.500 | | | 04/30/12 | | 474,898 |
| |
| TOTAL U.S. TREASURY OBLIGATIONS |
(Cost $8,824,415) | | | | | $ 9,376,047 |
| |
| | | | | | | |
| Repurchase Agreement(d) – 4.8% |
| State Street Bank & Trust Co. |
| $3,796,000 | | 0.010 | % | | 05/01/09 | | $3,796,000 |
Maturity Value: $3,796,001 | | |
(Cost $3,796,000) | | |
| |
| TOTAL INVESTMENTS – 100.5% |
(Cost $78,420,772) | | $79,720,078 |
| |
LIABILITIES IN EXCESS OF OTHER ASSETS – (0.5)% | | (379,102) |
| |
| NET ASSETS – 100.0% | | $79,340,976 |
| |
| | |
| The percentage shown for each investment category reflects the value of investments in that category as a percentage of net assets. |
| * | | Securities issued under the Federal Deposit Insurance Corporation Temporary Liquidity Guarantee Program. |
| (a) | | Variable rate security. The interest rate shown reflects the rate as of April 30, 2009. |
| (b) | | Security issued with a zero coupon. Income is recognized through the accretion of discount. |
| (c) | | Securities are exempt from registration under Rule 144A of the Securities Act of 1933. Under procedures approved by the Board of Trustees, such securities have been determined to be liquid by the Investment Adviser and may be resold, normally to qualified institutional buyers in transactions exempt from registration. Total market value of Rule 144A securities amounted to $3,208,038, which represents approximately 4.0% of net assets as of April 30, 2009. |
| (d) | | Repurchase agreement was entered into on April 30, 2009. This agreement was fully collateralized by $3,670,000 U.S. Treasury Notes, 3.125%, due 09/30/13 with a market value of $3,874,786. |
| | |
| |
| Investment Abbreviations: |
| FFCB | | —Federal Farm Credit Bank |
| FHLB | | —Federal Home Loan Bank |
| FHLMC | | —Federal Home Loan Mortgage Corp. |
| FNMA | | —Federal National Mortgage Association |
| GNMA | | —Government National Mortgage Association |
| MSC | | —Mortgage Securities Corp. |
| PAC | | —Planned Amortization Class |
| REMIC | | —Real Estate Mortgage Investment Conduit |
| |
| | |
| The accompanying notes are an integral part of these financial statements. | | 19 |
COMMERCE SHORT-TERM GOVERNMENT FUND
Schedule of Investments (continued)
April 30, 2009 (Unaudited)
PORTFOLIO COMPOSITION
| | | | | | |
| Sector Allocation | | AS OF
4/30/09 | | | AS OF
10/31/08 | |
| | |
U.S. Government Agency Obligations | | 40.6 | % | | 42.7 | % |
Collaterized Mortgage Obligations | | 22.1 | | | 20.7 | |
U.S. Treasury Obligations | | 11.8 | | | 17.6 | |
U.S. Government Guarantee Corporate Obligations | | 6.8 | | | — | |
Commercial Mortgages | | 6.1 | | | 6.7 | |
Mortgage-Backed Pass-Through Obligations | | 5.3 | | | 7.9 | |
Commercial Mortgage-Backed Security | | 2.4 | | | 2.3 | |
Asset-Backed Securities | | 0.6 | | | 0.4 | |
Short-Term Obligation | | 4.8 | | | 0.9 | |
| | |
| TOTAL INVESTMENTS | | 100.5 | % | | 99.2 | % |
| | |
The percentage shown for each Sector Allocation reflects the value of investments in that category as a percentage of net assets.
The Fund is actively managed and, as such, its composition may differ over time.
| | |
| 20 | | The accompanying notes are an integral part of these financial statements. |
COMMERCE NATIONAL TAX-FREE INTERMEDIATE BOND FUND
National Tax-Free Intermediate Bond Fund
Performance Information(1) (Unaudited)
For the six months ended April 30, 2009, the Fund had a total return of 8.08%, based on its Net Asset Value (NAV). This compares to the Barclays Capital 3-15 Year Blend Index(2) six-month return of 8.01%. Past performance is no guarantee of future results.
Schedule of Investments
April 30, 2009 (Unaudited)
| | | | | | | |
Principal
Amount | | Interest
Rate | | | Maturity
Date | | Value |
| Municipal Bond Obligations – 99.2% |
Alabama – 1.6% | | | | | |
| Alabama Drinking Water Finance Authority Revenue Bonds (Revolving Funding Program) Series A (AMBAC) (A/NR) |
| $ 760,000 | | 4.700 | % | | 08/15/11 | | $ 760,365 |
| Birmingham AL GO Bonds (Refunding Warrants) Series B (FSA) (AAA/Aa3) |
| 650,000 | | 5.500 | | | 07/01/12 | | 715,312 |
| Birmingham AL Special Care Facilities Financing Authority Revenue Bonds (Childrens Hospital) Series B (AMBAC) (A/A2) |
| 1,005,000 | | 5.000 | | | 06/01/16 | | 1,076,455 |
| Cullman AL GO Bonds (Warrants) Series 2007 (FSA) (AAA/Aa3) |
| 65,000 | | 4.500 | | | 07/01/23 | | 64,862 |
| | | | | | | |
| | | | | | | 2,616,994 |
| |
Alaska – 0.6% | | | | | |
| Alaska Municipal Bond Bank Authority Revenue Bonds Series 1 (A+/A1) |
| 400,000 | | 5.500 | | | 09/01/28 | | 407,560 |
| North Slope Boro AK GO Bonds (Capital Appreciation) Series B (MBIA) (AA-/A2)(a) |
| 500,000 | | 0.000 | | | 06/30/10 | | 489,610 |
| | | | | | | |
| | | | | | | 897,170 |
| |
Arizona – 7.4% | | | | | |
| Arizona School Facilities Board Certificates of Participation (AA-/A1) |
| 2,810,000 | | 5.125 | | | 09/01/21 | | 2,877,805 |
| Glendale AZ Industrial Development Authority Revenue Bonds (Refunding Midwestern University) (A-/NR) |
| 1,000,000 | | 5.250 | | | 05/15/19 | | 1,078,400 |
| 500,000 | | 5.250 | | | 05/15/22 | | 522,090 |
| Pinal County AZ Unified School District No.1 Florence GO Bonds (School Improvement Project of 2006) Series C (A-/NR) |
| 860,000 | | 5.000 | | | 07/01/17 | | 933,006 |
| 335,000 | | 5.000 | | | 07/01/18 | | 358,862 |
| 350,000 | | 5.000 | | | 07/01/19 | | 368,904 |
| 1,100,000 | | 5.125 | | | 07/01/22 | | 1,134,386 |
| Queen Creek AZ Excise Tax & State Shared Revenue Bonds (MBIA) (AA-/Baa1) |
| 1,070,000 | | 5.000 | | | 08/01/27 | | 1,088,714 |
| |
| | | | | | | |
Principal
Amount | | Interest
Rate | | | Maturity
Date | | Value |
| Municipal Bond Obligations – (continued) |
Arizona – (continued) | | | | | |
| Tucson AZ GO Bonds (Refunding) (FGIC) (AA/Aa3) |
| $ 535,000 | | 4.000 | % | | 07/01/15 | | $ 572,616 |
| Yuma County AZ Library District GO Bonds Series 2007 (XLCA) (A-/A2) |
| 1,000,000 | | 5.000 | | | 07/01/19 | | 1,035,830 |
| 745,000 | | 5.000 | | | 07/01/20 | | 763,498 |
| 1,000,000 | | 5.000 | | | 07/01/21 | | 1,020,070 |
| | | | | | | |
| | | | | | | 11,754,181 |
| |
Arkansas – 0.3% | | | | | |
| Arkansas State Development Finance Authority Economic Development Revenue Bonds (Taxable) (A/NR) |
| 535,000 | | 5.480 | | | 09/01/17 | | 530,030 |
| |
California – 1.8% | | | | | |
| Port Oakland CA Revenue Bonds Series C (AA-/A2) |
| 600,000 | | 5.000 | | | 11/01/16 | | 628,212 |
| San Mateo CA Unified High School District GO Bonds (Capital Appreciation) Series C (MBIA) (AA-/Aa3)(a) |
| 880,000 | | 0.000 | | | 09/01/23 | | 438,082 |
| West Contra Costa CA Unified School District GO Bonds (Refunding) Series A (MBIA) (AA-/Baa1) |
| 1,810,000 | | 5.700 | | | 02/01/22 | | 1,850,996 |
| | | | | | | |
| | | | | | | 2,917,290 |
| |
Colorado – 1.6% | | | | | |
| Colorado Educational & Cultural Facilities Authority Revenue Bonds (Charter School-University Laboratory School Project) (ETM) (NR/NR) |
| 175,000 | | 5.250 | | | 06/01/11 | | 178,546 |
| Colorado Housing & Finance Authority Revenue Bonds (Single Family Mortgage) Series A (FHA) (AAA/Aaa) |
| 600,000 | | 4.200 | | | 11/01/18 | | 607,500 |
| 430,000 | | 4.350 | | | 11/01/19 | | 436,622 |
| 450,000 | | 4.600 | | | 11/01/20 | | 456,844 |
| Colorado State Department of Corrections Certificates of Participation (Capital Appreciation) (AMBAC) (AA-/Aa3)(a) |
| 100,000 | | 0.000 | | | 03/01/10 | | 98,795 |
| Mesa State College CO Auxiliary Facilities Enterprise Revenue Bonds (AA-/Aa3) |
| 485,000 | | 5.400 | | | 05/15/23 | | 530,347 |
| |
| (1) | | Returns assume expense reimbursements and are not annualized. Returns do not reflect the deduction of taxes that a shareholder would pay on Fund distributions or the redemption of Fund shares. |
| (2) | | The Barclays Capital 3-15 Year Blend Index is an unmanaged index composed of investment grade municipal securities ranging from 2 to 17 years in maturity. The Index figure does not reflect the deduction of any fees, expenses or taxes. |
| | |
| The accompanying notes are an integral part of these financial statements. | | 21 |
COMMERCE NATIONAL TAX-FREE INTERMEDIATE BOND FUND
Schedule of Investments (continued)
April 30, 2009 (Unaudited)
| | | | | | | |
Principal
Amount | | Interest
Rate | | | Maturity
Date | | Value |
| Municipal Bond Obligations – (continued) |
Colorado – (continued) | | | | | |
| Westminster CO Certificates of Participation (Refunding) (MBIA) (AA-/Baa1) |
| $ 250,000 | | 4.500 | % | | 12/01/23 | | $ 254,165 |
| | | | | | | |
| | | | | | | 2,562,819 |
| |
District Of Columbia – 1.1% | | | | | |
| District of Columbia Revenue Bonds (World Wildlife Fund) Series A (AMBAC) (A/Aa3) |
| 555,000 | | 5.750 | | | 07/01/11 | | 583,866 |
| District of Columbia Water & Sewer Authority Public Utility Revenue Bonds (FSA) (AAA/Aa3) |
| 500,000 | | 5.500 | | | 10/01/17 | | 593,065 |
| Metropolitan Washington DC Airports Authority Revenue Bonds (Refunding) Series B (AMT) (MBIA) (AA-/Aa3) |
| 500,000 | | 5.250 | | | 10/01/09 | | 503,040 |
| | | | | | | |
| | | | | | | 1,679,971 |
| |
Florida – 8.8% | | | | | |
| Brevard County FL Health Facilities Authority Revenue Bonds (Health First, Inc. Project) Series 2005 (A-/A3) |
| 875,000 | | 5.000 | | | 04/01/18 | | 808,911 |
| Florida Municipal Loan Council Revenue Bonds Series A (MBIA) (AA-/Baa1) |
| 1,000,000 | | 5.000 | | | 10/01/20 | | 1,015,730 |
| Florida State Board of Governors University System Improvement Revenue Bonds (AA/Aa2) |
| 1,000,000 | | 5.750 | | | 07/01/21 | | 1,094,020 |
| Florida State Community Services Corp.Walton County Water & Sewer Revenue Bonds (Refunding) (AMBAC) (NR/NR) |
| 1,330,000 | | 5.500 | | | 03/01/14 | | 1,377,946 |
| Jupiter County FL (Community Center Project) GO Bonds Series 2001 (AA+/Aa2) |
| 50,000 | | 5.500 | | | 07/01/21 | | 57,266 |
| Miami-Dade County FL Expressway Authority Toll Systems Revenue Bonds Series B (FGIC) (AA-/A3) |
| 1,000,000 | | 5.250 | | | 07/01/14 | | 1,099,170 |
| Miami-Dade County FL GO Bonds (Building Better Communities Project) Series B (AA-/Aa3) |
| 1,000,000 | | 6.250 | | | 07/01/26 | | 1,097,790 |
| Miami-Dade County FL Water & Sewer Revenue Bonds (Refunding) (XLCA) (A+/A1) |
| 2,000,000 | | 5.000 | | | 10/01/21 | | 2,038,400 |
| Orange County FL School Board Certificates of Participation Series A (FGIC) (AA-/A1) |
| 1,000,000 | | 5.000 | | | 08/01/16 | | 1,067,440 |
| Palm Beach County FL School Board Certificates of Participation (FGIC) (AA-/A1) |
| 1,000,000 | | 5.500 | | | 08/01/15 | | 1,089,520 |
| St. Johns County FL School Board (Certificates of Participation) Series 2006 (St. Johns Master Lease Program) (AA-/A3) |
| 1,980,000 | | 5.000 | | | 07/01/19 | | 1,965,863 |
| Tallahassee FL Construction Utilities Systems Revenue Bonds (Refunding) (AMBAC) (AA/Aa2) |
| 1,350,000 | | 5.000 | | | 10/01/29 | | 1,370,628 |
| | | | | | | |
| | | | | | | 14,082,684 |
| |
| | | | | | | |
Principal
Amount | | Interest
Rate | | | Maturity
Date | | Value |
| Municipal Bond Obligations – (continued) |
Georgia – 0.1% |
| Brunswick GA Water & Sewer Revenue Bonds (Refunding and Improvement) Series 1992 (MBIA) (AA-/Baa1) |
| $ 90,000 | | 6.100 | % | | 10/01/19 | | $ 100,102 |
| Cherokee County GA Water & Sewer Authority Revenue Bonds (Refunding and Improvement) Series 1993 (MBIA) (AA-/Baa1) |
| 55,000 | | 5.500 | | | 08/01/23 | | 62,445 |
| | | | | | | |
| | | | | | | 162,547 |
| |
Illinois – 7.0% |
| Chicago IL Board of Education Certificates of Participation (Lease) Series A (MBIA) (AA-/A1) |
| 1,500,000 | | 6.250 | | | 01/01/10 | | 1,547,670 |
| Chicago IL Public Building Commission Revenue Bonds (Refunding Chicago School Reform) Series B (FGIC) (AA-/A1) |
| 1,000,000 | | 5.250 | | | 12/01/18 | | 1,092,750 |
| Elgin IL GO Bonds (Refunding) Series B (NR/Aa2) |
| 25,000 | | 4.800 | | | 01/01/10 | | 25,004 |
| Hoffman Estates IL Park District Revenue Bonds (Debt Certificates) Series 2004 (AA-/A2) |
| 1,000,000 | | 5.250 | | | 12/01/23 | | 1,064,940 |
| Illinois Finance Authority Revenue Bonds (Columbia College) (MBIA) (AA-/Baa1) |
| 2,000,000 | | 5.250 | | | 12/01/22 | | 1,969,420 |
| Illinois Finance Authority Revenue Bonds (Refunding Shedd Aquarium Society) (AMBAC) (A+/A1) |
| 1,685,000 | | 5.000 | | | 07/01/21 | | 1,703,569 |
| Illinois Finance Authority Revenue Bonds (Roosevelt University) (NR/Baa1) |
| 100,000 | | 5.250 | | | 04/01/22 | | 90,730 |
| Illinois Finance Authority Revenue Bonds (Roosevelt University) Series 2007 (NR/Baa1) |
| 650,000 | | 5.125 | | | 04/01/19 | | 601,081 |
| Illinois Housing Development Authority Revenue Bonds (Refunding Single Family Housing) Series C-1 (AA/Aa2) |
| 255,000 | | 3.700 | | | 02/01/13 | | 258,289 |
| Metropolitan Pier & Exposition Authority IL Revenue Bonds (Dedicated State Tax) (AMBAC) (AAA/A2) |
| 600,000 | | 5.125 | | | 06/01/11 | | 601,416 |
| University of Illinois Revenue Bonds (Auxiliary Facilities Systems) Series A (AA-/Aa3) |
| 1,000,000 | | 5.125 | | | 04/01/29 | | 1,020,590 |
| Will County IL Community Unit School District No. 365 Valley View GO Bonds (Capital Appreciation) Series B (FSA) (AAA/Aa3)(a) |
| 635,000 | | 0.000 | | | 11/01/13 | | 560,737 |
| Will Grundy Counties IL Community College District No. 525 GO Bonds (Joliet Junior College) (AA/NR) |
| 505,000 | | 5.750 | | | 06/01/28 | | 539,163 |
| | | | | | | |
| | | | | | | 11,075,359 |
| |
| | |
| 22 | | The accompanying notes are an integral part of these financial statements. |
COMMERCE NATIONAL TAX-FREE INTERMEDIATE BOND FUND
| | | | | | | |
Principal
Amount | | Interest
Rate | | | Maturity
Date | | Value |
| Municipal Bond Obligations – (continued) |
Indiana – 11.2% |
| Allen County IN War Memorial Revenue Bonds (Refunding Coliseum Additions Building Corp.) Series A (NR/Aa3) |
| $ 600,000 | | 5.000 | % | | 05/01/16 | | $ 686,946 |
| 615,000 | | 5.000 | | | 11/01/16 | | 707,176 |
| Clark Pleasant IN Middle School Building Corp. Revenue Bonds (First Mortgage) (AA+/NR) |
| 975,000 | | 4.250 | | | 01/15/17 | | 1,007,936 |
| 1,000,000 | | 4.250 | | | 07/15/17 | | 1,032,100 |
| 1,015,000 | | 4.500 | | | 01/15/18 | | 1,054,930 |
| Elkhart County IN Complex Building Corp. Revenue Bonds (First Mortgage) (AA-/NR) |
| 880,000 | | 4.000 | | | 06/01/12 | | 943,334 |
| Elkhart County IN Hospital Authority Revenue Bonds (NR/A1) |
| 390,000 | | 4.750 | | | 08/15/11 | | 394,481 |
| Evansville Vanderburgh IN Public Leasing Corp. Revenue Bonds (Refunding First Mortgage) (AMBAC) (A+/NR) |
| 1,740,000 | | 5.250 | | | 07/15/16 | | 1,871,039 |
| Evansville-Vanderburgh IN Independent School Building Corp. Revenue Bonds (First Mortgage) (AA+/NR) |
| 1,000,000 | | 5.250 | | | 01/15/29 | | 1,016,640 |
| Fort Wayne IN Redevelopment Authority Lease Rental Revenue Bonds (Taxable) Series 2007 (Assured Guaranty) (NR/Aa2) |
| 1,100,000 | | 5.800 | | | 02/01/20 | | 1,053,294 |
| Franklin IN Community Multi-School Building Corp. Revenue Bonds (First Management) (MBIA) (AA-/NR) |
| 500,000 | | 5.000 | | | 07/15/21 | | 540,320 |
| Indiana Bond Bank Revenue Bonds (Special Project-Hendricks Regional Health) Series A (AA/NR) |
| 390,000 | | 5.000 | | | 02/01/13 | | 413,969 |
| 120,000 | | 5.000 | | | 08/01/14 | | 128,779 |
| Indiana Health & Educational Facilities Financing Authority Revenue Bonds (Refunding University of Indianapolis Educational Facilities) (A-/NR) |
| 1,090,000 | | 5.000 | | | 10/01/15 | | 1,198,815 |
| Indianapolis Local Public Improvement Revenue Bonds (Refunding) Series B (AA/Aa2) |
| 1,300,000 | | 6.000 | | | 01/10/20 | | 1,532,089 |
| Indianpolis Multi-School Building Corp. Revenue Bonds (Refunding First Mortgage) (AA/Baa1) |
| 1,020,000 | | 3.000 | | | 01/15/26 | | 796,753 |
| Monroe-Gregg Industrial Grade School Building Corp. Revenue Bonds (Refunding - First Mortgage) (FSA) (AAA/Aa3) |
| 375,000 | | 4.250 | | | 07/15/17 | | 400,069 |
| SouthWest Allen IN Multi School Building Corp. Revenue Bonds (First Mortgage) Series A (MBIA) (NR/A1) |
| 2,890,000 | | 5.000 | | | 01/15/20 | | 2,992,508 |
| | | | | | | |
| | | | | | | 17,771,178 |
| |
Iowa – 1.8% |
| Iowa Finance Authority Revenue Bonds (Refunding Child Services) (NR/NR) |
| 160,000 | | 5.100 | | | 06/01/17 | | 124,955 |
| |
| | | | | | | |
Principal
Amount | | Interest
Rate | | | Maturity
Date | | Value |
| Municipal Bond Obligations – (continued) |
Iowa – (continued) |
| Iowa Finance Authority Revenue Bonds (Refunding Child Services) (NR/NR) - (continued) |
| $ 480,000 | | 5.125 | % | | 06/01/18 | | $ 360,884 |
| 200,000 | | 5.125 | | | 06/01/20 | | 143,790 |
| Iowa Finance Authority Revenue Bonds (Single Family Mortgage) Series A (GNMA/FNMA) (AAA/Aaa) |
| 195,000 | | 4.300 | | | 07/01/16 | | 197,646 |
| Iowa Student Loan Liquidity Corp. Revenue Bonds Series E (AMT) (NR/Aaa) |
| 2,000,000 | | 5.700 | | | 06/01/09 | | 2,001,720 |
| | | | | | | |
| | | | | | | 2,828,995 |
| |
Kansas – 3.2% |
| Junction City KS GO Notes Series B (NR/NR) |
| 1,200,000 | | 4.000 | | | 06/01/09 | | 1,201,116 |
| Kansas State Development Finance Authority Health Facilities Revenue Bonds Series 2005 (Hays Medical Center) (MBIA) (NR/A2)(b) |
| 1,960,000 | | 3.750 | | | 05/15/26 | | 1,983,540 |
| Lawrence KS Hospital Revenue Bonds (Refunding Lawrence Memorial Hospital) (NR/A3) |
| 750,000 | | 5.250 | | | 07/01/12 | | 772,110 |
| Neosho County KS Sales Tax Revenue Bonds (MBIA) (ETM) (AA/NR) |
| 150,000 | | 5.500 | | | 08/15/11 | | 156,940 |
| Olathe KS Health Facilities Revenue Bonds (Refunding) (Olathe Medical Center) Series 2008 (A+/NR) |
| 1,000,000 | | 4.000 | | | 09/01/14 | | 994,740 |
| | | | | | | |
| | | | | | | 5,108,446 |
| |
Kentucky – 1.1% |
| Kentucky Economic Development Finance Authority Medical Center Revenue Bonds (Ashland Hospital Corp. Kings) Series C (A+/A1) |
| 1,900,000 | | 6.000 | | | 02/01/33 | | 1,830,612 |
| |
Louisiana – 3.1% |
| Louisiana Local Government Environmental Facilities Community Development Authority Revenue Bonds (Capital Projects & Equipment Acquisition) (AMBAC) (A/NR) |
| 2,755,000 | | 5.250 | | | 12/01/18 | | 3,094,140 |
| Tangipahoa Parish LA Hospital Service District No. 1 Revenue Bonds (Refunding North Oaks Medical Center Project) Series A (BBB+/NR) |
| 1,100,000 | | 5.375 | | | 02/01/18 | | 1,006,005 |
| 1,245,000 | | 5.000 | | | 02/01/30 | | 912,710 |
| | | | | | | |
| | | | | | | 5,012,855 |
| |
Maine – 0.2% |
| Maine State Housing Authority Mortgage Purpose Revenue Bonds (Non AMT) Series J (AA+/Aa1) |
| 300,000 | | 6.500 | | | 11/15/28 | | 318,153 |
| |
Massachusetts – 0.1% |
| Massachusetts State Health & Educational Facilities Authority Revenue Bonds (Boston College) Series L (AA-/Aa3) |
| 10,000 | | 5.250 | | | 06/01/13 | | 10,022 |
| |
| | |
| The accompanying notes are an integral part of these financial statements. | | 23 |
COMMERCE NATIONAL TAX-FREE INTERMEDIATE BOND FUND
Schedule of Investments (continued)
April 30, 2009 (Unaudited)
| | | | | | | |
Principal
Amount | | Interest
Rate | | | Maturity
Date | | Value |
| Municipal Bond Obligations – (continued) |
Massachusetts – (continued) |
| Massachusetts State Water Resources Authority Revenue Bonds Series A (ETM) (AA+/Aa2) |
| $ 60,000 | | 6.500 | % | | 07/15/19 | | $ 74,468 |
| | | | | | | |
| | | | | | | 84,490 |
| |
Michigan – 6.0% |
| Genesee County MI Sewage Disposal Systems Revenue Bonds (Interceptors & Treatment Facilities) (FGIC) (AA-/A2) |
| 550,000 | | 4.000 | | | 05/01/14 | | 563,156 |
| Grand Valley MI State University Revenue Bonds (FGIC) (A+/NR) |
| 1,500,000 | | 5.300 | | | 12/01/24 | | 1,527,075 |
| Grand Valley MI State University Revenue Bonds Series 1998 (FGIC) (AA-/NR) |
| 1,080,000 | | 5.500 | | | 02/01/18 | | 1,196,230 |
| Ingham County MI GO Bonds Series 1998 (FSA) (AAA/Aa3) |
| 500,000 | | 5.125 | | | 11/01/12 | | 541,540 |
| Jenison MI Public Schools GO Bonds (Refunding) (MBIA) (AA-/A1) |
| 1,000,000 | | 5.250 | | | 05/01/14 | | 1,109,400 |
| Lake Superior University of Michigan Revenue Bonds (Unrefunded) Series 1997 (MBIA) (AA/Baa1) |
| 675,000 | | 5.000 | | | 11/15/12 | | 685,571 |
| Michigan State GO Bonds (Refunding Environmental Program) Series A (AA-/Aa3) |
| 1,295,000 | | 5.000 | | | 11/01/19 | | 1,357,043 |
| Michigan State Hospital Finance Authority Revenue Bonds (Ascension Health Credit) Series A (MBIA) (AA/Aa1) |
| 2,500,000 | | 5.500 | | | 11/15/10 | | 2,562,925 |
| | | | | | | |
| | | | | | | 9,542,940 |
| |
Minnesota – 1.0% |
| Minneapolis St. Paul MN Housing Finance Board Single Family Mortgage Revenue Bonds (Mortgage Backed Securities City Living Project) Series A-3 (GNMA/FNMA) (AAA/NR) |
| 836,014 | | 5.700 | | | 04/01/27 | | 845,352 |
| Minnesota State Housing Finance Agency Revenue Bonds (Residential) Series A (AA+/Aa1) |
| 670,000 | | 3.800 | | | 07/01/17 | | 670,020 |
| | | | | | | |
| | | | | | | 1,515,372 |
| |
Mississippi – 0.4% |
| Mississippi Development Bank Special Obligation Revenue Bonds (Lowndes County Individual Development Project) Series 2007 (FSA) (AAA/Aa3) |
| 605,000 | | 5.000 | | | 07/01/17 | | 704,305 |
| |
Missouri – 1.8% |
| Missouri State Development Finance Board Infrastructure Facilities Revenue Bonds (Hartman Heritage Center Phase II) (AMBAC) (A+/NR) |
| 1,070,000 | | 5.000 | | | 04/01/19 | | 1,113,945 |
| Raytown MO Sewer Revenue Bonds (NR/NR) |
| 275,000 | | 4.625 | | | 07/01/24 | | 266,673 |
| |
| | | | | | | |
Principal
Amount | | Interest
Rate | | | Maturity
Date | | Value |
| Municipal Bond Obligations – (continued) |
Missouri – (continued) |
| St. Charles MO Certificates of Participation Series B (NR/A2) |
| $1,000,000 | | 5.500 | % | | 05/01/18 | | $ 1,039,840 |
| St. Louis County MO Industrial Development Authority Health Facilities Revenue Bonds (Refunding Ranken Jordan Project) (NR/NR) |
| 500,000 | | 5.000 | | | 11/15/17 | | 385,405 |
| | | | | | | |
| | | | | | | 2,805,863 |
| |
Montana – 0.4% |
| Montana State Board Housing Revenue Bonds (Single Family Mortgage) Series A-2 (AMT) (AA+/Aa1) |
| 350,000 | | 4.350 | | | 06/01/16 | | 344,138 |
| Montana State Board Housing Revenue Bonds (Single Family Mortgage) Series A-2 (AMT) (GO) (AA+/Aa1) |
| 360,000 | | 4.350 | | | 12/01/16 | | 351,511 |
| | | | | | | |
| | | | | | | 695,649 |
| |
Nebraska – 0.7% |
| Douglas County NE Hospital Authority No. 002 Revenue Bonds (Refunding) (Health Facilities-Childrens Hospital) (NR/A2) |
| 500,000 | | 6.000 | | | 08/15/22 | | 518,415 |
| Nebraska Investment Finance Authority Revenue Bonds (Single Family Housing) Series F (GNMA/FNMA/FHLMC) (AAA/NR) |
| 115,000 | | 4.300 | | | 09/01/14 | | 114,130 |
| 175,000 | | 4.350 | | | 03/01/15 | | 173,042 |
| 100,000 | | 4.350 | | | 09/01/15 | | 98,798 |
| 105,000 | | 4.400 | | | 09/01/16 | | 103,637 |
| University of Nebraska Revenue Bonds (Lincoln-Student Fees & Facilities) Series A (AA-/Aa2) |
| 160,000 | | 5.250 | | | 07/01/34 | | 166,253 |
| | | | | | | |
| | | | | | | 1,174,275 |
| |
Nevada – 0.1% |
| Nye County NV School District GO Bonds (Refunding) Series A (PSF-GTD) (NR/Aaa) |
| 100,000 | | 4.375 | | | 05/01/25 | | 101,235 |
| |
New Hampshire – 0.5% |
| New Hampshire State Housing Finance Authority Revenue Bonds (Single Family Mortagage) (Non AMT) (NR/Aa2) |
| 750,000 | | 5.300 | | | 07/01/28 | | 764,018 |
| |
New Jersey – 0.1% |
| Passaic County NJ GO Bonds (Refunding Taxable Pension) Series 2003 (FSA) (NR/Aa3) |
| 100,000 | | 5.750 | | | 02/15/21 | | 92,781 |
| |
New Mexico – 0.3% |
| Albuquerque NM Apartment Revenue Bonds (Refunding) (AMT) (AMBAC) (A+/Aa3) |
| 500,000 | | 5.375 | | | 07/01/13 | | 512,790 |
| |
| | |
| 24 | | The accompanying notes are an integral part of these financial statements. |
COMMERCE NATIONAL TAX-FREE INTERMEDIATE BOND FUND
| | | | | | | |
Principal
Amount | | Interest
Rate | | | Maturity
Date | | Value |
| Municipal Bond Obligations – (continued) |
New Mexico – (continued) |
| New Mexico Mortgage Finance Authority Revenue Bonds (Single Family Mortgage Program) Series A-3 (GNMA/FNMA/FHLMC) (AAA/NR) |
| $ 10,000 | | 6.150 | % | | 09/01/17 | | $ 10,049 |
| | | | | | | |
| | | | | | | 522,839 |
| |
New York – 1.5% |
| Metropolitan Transportation Authority NY Service Contract Revenue Bonds (Refunding) Series A (AA-/A1) |
| 2,000,000 | | 5.100 | | | 01/01/21 | | 2,026,600 |
| New York State Dormitory Authority Revenue Bonds (Consolidated City University System) Series A (AA-/A1) |
| 325,000 | | 5.750 | | | 07/01/13 | | 349,834 |
| New York State Dormitory Authority Revenue Bonds (Unrefunded Balance) Series C (AA-/A1) |
| 75,000 | | 7.375 | | | 05/15/10 | | 77,321 |
| | | | | | | |
| | | | | | | 2,453,755 |
| |
North Dakota – 1.4% |
| Fargo ND Public School District No. 1 GO Bonds Series 2008 (Limited Tax - School Building) (NR/A1) |
| 1,000,000 | | 5.000 | | | 05/01/23 | | 1,046,170 |
| North Dakota State Housing Finance Agency Mortgage Revenue Bonds (Housing Finance Project) Series B (AMT) (NR/Aa1) |
| 550,000 | | 4.400 | | | 07/01/16 | | 542,338 |
| North Dakota State Housing Finance Agency Revenue Bonds (Housing Finance Project) Series B (NR/Aa1) |
| 635,000 | | 4.450 | | | 07/01/17 | | 617,106 |
| | | | | | | |
| | | | | | | 2,205,614 |
| |
Ohio – 6.6% |
| Akron OH Certificates of Participation (Parking Facilities Project) Series A (AMBAC) (A+/NR) |
| 1,250,000 | | 5.000 | | | 12/01/16 | | 1,397,300 |
| Cuyahoga County OH GO Bonds (Sewer District Improvement) (AA+/Aa1) |
| 165,000 | | 5.550 | | | 12/01/20 | | 171,539 |
| Huron County OH Hospital Facilities Revenue Bonds (Refunding & Improvement Fisher-Titus Medical) Series 2007 (A/NR) |
| 1,000,000 | | 5.000 | | | 12/01/22 | | 889,880 |
| Indian Lake OH Local School District GO Bonds (Refunding & Improvement School Facilities Construction) (MBIA) (AA-/A2) |
| 830,000 | | 4.500 | | | 12/01/21 | | 850,302 |
| Knox County OH Hospital Facilities Revenue Bonds (Refunding Knox Community Hospital) (Radian) (BBB-/NR) |
| 3,235,000 | | 5.000 | | | 06/01/12 | | 3,202,391 |
| Ohio State Higher Educational Facilities Revenue Bonds (College of Wooster Project) (NR/A1) |
| 520,000 | | 5.000 | | | 09/01/14 | | 576,451 |
| |
| | | | | | | |
Principal
Amount | | Interest
Rate | | | Maturity
Date | | Value |
| Municipal Bond Obligations – (continued) |
Ohio – (continued) |
| Ohio State Higher Educational Facility Commission Revenue Bonds (Xavier University) Series C (A-/A3) |
| $ 430,000 | | 4.250 | % | | 05/01/14 | | $ 453,710 |
| 1,000,000 | | 5.000 | | | 05/01/18 | | 1,077,230 |
| Sidney OH City School District GO Bonds (Capital Appreciation Refunding) (FGIC) (AA-/A2)(a) |
| 1,025,000 | | 0.000 | | | 12/01/16 | | 796,425 |
| 1,035,000 | | 0.000 | | | 12/01/17 | | 762,267 |
| Westlake OH GO Bonds (Street Improvement) (AAA/Aaa) |
| 260,000 | | 5.250 | | | 12/01/25 | | 298,753 |
| | | | | | | |
| | | | | | | 10,476,248 |
| |
Oklahoma – 5.0% |
| McClain County OK Economic Development Authority Educational Facilities Lease Revenue Bonds (Blanchard Public Schools Project) (A-/NR) |
| 1,000,000 | | 4.000 | | | 09/01/13 | | 1,039,810 |
| 1,000,000 | | 4.850 | | | 09/01/18 | | 1,030,190 |
| 1,000,000 | | 5.000 | | | 09/01/19 | | 1,028,370 |
| Oklahoma County OK Finance Authority Educational Facilities Lease Revenue Bonds (Jones Public School Project) (A-/NR) |
| 2,000,000 | | 5.000 | | | 09/01/18 | | 2,146,200 |
| Tulsa County OK Public Facilities Authority Capital Improvement Revenue Bonds (AA-/NR)(c) |
| 2,530,000 | | 6.200 | | | 11/01/09 | | 2,652,756 |
| | | | | | | |
| | | | | | | 7,897,326 |
| |
Oregon – 2.4% |
| Oregon State Housing & Community Services Department Mortgage Revenue Bonds (Single-Family Mortgage) Series D (NR/Aa2) |
| 1,135,000 | | 4.350 | | | 07/01/18 | | 1,158,915 |
| 1,310,000 | | 4.400 | | | 07/01/19 | | 1,324,449 |
| Oregon State Housing & Community Services Department Mortgage Revenue Bonds (Single-Family Mortgage) Series E (AMT) (NR/Aa2) |
| 375,000 | | 5.050 | | | 07/01/17 | | 382,001 |
| Salem OR Hospital Facility Authority Revenue Bonds Series A (A+/NR) |
| 900,000 | | 5.250 | | | 08/15/12 | | 936,711 |
| | | | | | | |
| | | | | | | 3,802,076 |
| |
Pennsylvania – 1.9% |
| Oxford PA Area Sewer Authority Revenue Bonds (FSA) (NR/Aa3) |
| 765,000 | | 4.500 | | | 03/01/13 | | 765,069 |
| Pennsylvania Housing Finance Agency Revenue Bonds (Single Family Mortgage) (Non AMT) Series 103C (AA+/Aa2) |
| 1,050,000 | | 5.000 | | | 10/01/23 | | 1,068,700 |
| Pennsylvania State Higher Education Facilities Authority Revenue Bonds (University of Scranton) Series 2008 (A/NR) |
| 1,140,000 | | 4.500 | | | 05/01/14 | | 1,224,155 |
| | | | | | | |
| | | | | | | 3,057,924 |
| |
| | |
| The accompanying notes are an integral part of these financial statements. | | 25 |
COMMERCE NATIONAL TAX-FREE INTERMEDIATE BOND FUND
Schedule of Investments (continued)
April 30, 2009 (Unaudited)
| | | | | | | |
Principal
Amount | | Interest
Rate | | | Maturity
Date | | Value |
| Municipal Bond Obligations – (continued) |
Puerto Rico – 0.0% |
| Puerto Rico Electric Power Authority Revenue Bonds (Refunding) (MBIA) (AA-/A3) |
| $ 10,000 | | 5.000 | % | | 07/01/20 | | $ 9,790 |
| |
Rhode Island – 0.4% |
| Rhode Island State Student Loan Revenue Bonds Series 3 (AMBAC) (AMT) (NR/A3) |
| 180,000 | | 5.700 | | | 12/01/12 | | 173,750 |
| 205,000 | | 5.800 | | | 12/01/14 | | 194,523 |
| 125,000 | | 5.900 | | | 12/01/15 | | 118,221 |
| Rhode Island State Student Loan Revenue Bonds Series 3 (AMBAC) (AMT) (NR/NR) |
| 190,000 | | 5.750 | | | 12/01/13 | | 181,528 |
| | | | | | | |
| | | | | | | 668,022 |
| |
South Carolina – 1.1% |
| Florence SC Water & Sewer Revenue Bonds (AMBAC) (A+/A1) |
| 390,000 | | 7.500 | | | 03/01/11 | | 414,332 |
| Fort Mill SC School Facilities Corp. Revenue Bonds (Installment Purchase Revenue) Series 2006 (NR/A2) |
| 500,000 | | 5.250 | | | 12/01/22 | | 514,765 |
| Greenville County SC Public Facilities Corp. Certificates of Participation (Refunding University Center Project) (AMBAC) (AA+/Aa1) |
| 700,000 | | 5.000 | | | 04/01/16 | | 782,460 |
| | | | | | | |
| | | | | | | 1,711,557 |
| |
South Dakota – 0.6% |
| South Dakota Housing Development Authority Revenue Bonds (Homeowner Mortgage-E-1) (AMT) (AAA/Aa1) |
| 205,000 | | 5.150 | | | 05/01/11 | | 207,163 |
| South Dakota Housing Development Authority Revenue Bonds (Multiple Purpose) Series A (FSA) (NR/Aa3) |
| 125,000 | | 4.300 | | | 11/01/10 | | 125,951 |
| South Dakota State Health & Educational Facilities Authority Revenue Bonds (Rapid City Regional Hospital) (MBIA) (AA-/A1) |
| 660,000 | | 5.000 | | | 09/01/10 | | 679,298 |
| | | | | | | |
| | | | | | | 1,012,412 |
| |
Tennessee – 0.6% |
| Memphis-Shelby County TN Sports Authority, Inc. Revenue Bonds (Memphis Arena Project) Series A (AMBAC) (AA-/A1) |
| 700,000 | | 5.500 | | | 11/01/11 | | 753,529 |
| Tennessee Housing Development Agency Revenue Bonds (Homeownership Program) (AMT) (GO) (AA/Aa2) |
| 220,000 | | 4.250 | | | 01/01/14 | | 219,254 |
| | | | | | | |
| | | | | | | 972,783 |
| |
Texas – 7.2% |
| Brownsville TX GO Bonds (Refunding) Series 2005 (AA-/A2) |
| 1,000,000 | | 5.000 | | | 02/15/21 | | 1,051,070 |
| 710,000 | | 5.000 | | | 02/15/22 | | 740,679 |
| |
| | | | | | | |
Principal
Amount | | Interest
Rate | | | Maturity
Date | | Value |
| Municipal Bond Obligations – (continued) |
Texas – (continued) |
| Clint TX Independent School District GO Bonds (Refunding) (A/NR) |
| $ 945,000 | | 3.000 | % | | 02/15/13 | | $ 970,855 |
| Corpus Christi TX Utility System Revenue Bonds (Refunding) (FSA) (AAA/Aa3) |
| 375,000 | | 5.000 | | | 07/15/12 | | 416,400 |
| Dallas Fort Worth TX International Airport Revenue Bonds (Refunding & Improvement) Series A (FGIC) (AA-/A1) |
| 130,000 | | 5.750 | | | 11/01/15 | | 132,558 |
| El Paso TX Certificates Obligation GO Bonds (AA/NR) |
| 260,000 | | 4.000 | | | 08/15/16 | | 281,653 |
| Houston County TX Certificate Obligation GO Bonds (A/NR) |
| 235,000 | | 5.000 | | | 02/15/20 | | 253,683 |
| 590,000 | | 5.000 | | | 02/15/24 | | 609,859 |
| 620,000 | | 5.000 | | | 02/15/25 | | 634,105 |
| Houston TX Community College Systems Revenue Bonds (Unrefunded Balance) (Refunding) (MBIA) (AA-/A1) |
| 1,000,000 | | 5.375 | | | 04/15/13 | | 1,070,380 |
| Houston TX Utility System Revenue Bonds (Refunding Combined First Lien) Series B (FGIC) (AA/A1) |
| 500,000 | | 5.000 | | | 11/15/18 | | 556,830 |
| Mansfield TX Certificates Obligations GO Bonds (AA/Aa3) |
| 355,000 | | 6.125 | | | 02/15/26 | | 386,748 |
| 310,000 | | 6.250 | | | 02/15/29 | | 336,087 |
| North Harris Montgomery Community College District Revenue Bonds (Refunding) (FGIC) (AA/Aa3) |
| 420,000 | | 5.750 | | | 02/15/18 | | 428,954 |
| Pearland TX Certificates Obligations GO Bonds (AMBAC) (AA-/A1) |
| 660,000 | | 5.250 | | | 03/01/21 | | 714,905 |
| San Antonio TX GO Bonds (General Improvement) (AAA/Aa1)(c) |
| 10,000 | | 6.000 | | | 02/01/10 | | 10,407 |
| San Jacinto TX River Authority Special Project Revenue Bonds (The Woodlands Water Supply Systems) Series 2007 (AMBAC) (A/NR) |
| 455,000 | | 5.250 | | | 10/01/18 | | 470,206 |
| 330,000 | | 5.250 | | | 10/01/21 | | 332,660 |
| 500,000 | | 5.250 | | | 10/01/33 | | 436,750 |
| Texas State Department of Housing & Community Affairs Single Family Revenue Bonds (Refunding) (AMT) (FHA/VA Mortgages) (AAA/Aa1) |
| 150,000 | | 4.600 | | | 09/01/19 | | 144,807 |
| Texas Woman’s University Financing Systems Revenue Bonds Series 2008 (A/A1) |
| 675,000 | | 5.500 | | | 07/01/24 | | 724,626 |
| Trinity TX River Authority Revenue Bonds Tarrant County Water Project (Improvement) (AA/A1) |
| 450,000 | | 5.750 | | | 02/01/26 | | 479,524 |
| Weslaco TX Independent School District GO Bonds (Maintenance Tax Notes) Series A (NR/A3) |
| 300,000 | | 4.500 | | | 02/15/16 | | 323,013 |
| | | | | | | |
| | | | | | | 11,506,759 |
| |
| | |
| 26 | | The accompanying notes are an integral part of these financial statements. |
COMMERCE NATIONAL TAX-FREE INTERMEDIATE BOND FUND
| | | | | | | |
Principal
Amount | | Interest
Rate | | | Maturity
Date | | Value |
| Municipal Bond Obligations – (continued) |
Utah – 1.5% | | | | | | | |
| Grand County UT School District GO Bonds (School Building) (NR/Aaa) |
| $ 300,000 | | 5.000 | % | | 07/01/22 | | $ 328,818 |
| Utah State Board Regents Auxiliary Systems & Student Fee Revenue Bonds for Salt Lake Community College (FSA) (AAA/Aa3) |
| 1,000,000 | | 5.500 | | | 06/01/16 | | 1,056,450 |
| Utah State Building Ownership Authority Lease Revenue Bonds (Refunding-State Facilities Master Lease Program) Series A (AA+/Aa1) |
| 1,000,000 | | 5.250 | | | 05/15/21 | | 1,058,280 |
| | | | | | | |
| | | | | | | 2,443,548 |
| |
Virginia – 0.7% | | | | | | | |
| Richmond VA Metropolitan Authority Expressway Revenue Bonds (Refunding) (FGIC) (AA-/NR) |
| 1,000,000 | | 5.250 | | | 07/15/17 | | 1,096,510 |
| |
Washington – 3.7% |
| CDP-King County III WA Lease Revenue Bonds (Refunding King Street Center Project) (MBIA) (AA+/Baa1) |
| 750,000 | | 4.500 | | | 06/01/22 | | 763,703 |
| Clark County WA School District No. 114 Evergreen GO Bonds (FSA) (NR/Aa1) |
| 330,000 | | 5.375 | | | 12/01/14 | | 363,333 |
| Clark County WA School District No. 37 Vancouver GO Bonds (FGIC) (NR/Aa1)(a) |
| 1,065,000 | | 0.000 | | | 12/01/20 | | 653,889 |
| Everett WA Public Facilities District Ltd. Sales Tax & Interlocal Revenue Bonds Series A (A/NR) |
| 1,000,000 | | 5.000 | | | 12/01/24 | | 1,020,220 |
| King County WA School District No. 407 Riverview GO Bonds (NR/Aa1) |
| 500,000 | | 5.250 | | | 12/01/19 | | 575,025 |
| Ocean Shores WA Local Improvement District Bond Anticipation Notes Series 2007-01 (NR/NR) |
| 1,550,000 | | 4.750 | | | 08/01/11 | | 1,510,614 |
| Puyallup WA Combined Utility Revenue Bonds Series A (AA/NR) |
| 160,000 | | 4.000 | | | 11/01/15 | | 169,176 |
| Snohomish County WA School District No. 15 Edmonds GO Bonds (FGIC) (AA+/Aa1) |
| 700,000 | | 5.000 | | | 12/01/17 | | 790,503 |
| | | | | | | |
| | | | | | | 5,846,463 |
| |
Wisconsin – 1.2% |
| Milwaukee County WI Airport Revenue Bonds (Refunding) Series B (MBIA) (NR/A1) |
| 115,000 | | 5.000 | | | 12/01/14 | | 116,557 |
| 350,000 | | 5.000 | | | 12/01/15 | | 350,959 |
| Monona WI Revenue Bonds Taxable Anticipation Notes (NR/A1) |
| 755,000 | | 5.650 | | | 09/01/11 | | 778,028 |
| |
| | | | | | | |
Principal
Amount | | Interest
Rate | | | Maturity
Date | | Value |
| Municipal Bond Obligations – (continued) |
Wisconsin – (continued) |
| Pleasant Prairie Wisconsin GO Bonds (Promissory Notes) Series F (AA/A1) |
| $ 400,000 | | 4.500 | % | | 09/01/17 | | $ 446,692 |
| Plymouth WI Combined Utility Revenue Bonds (XLCA) (NR/A2) |
| 230,000 | | 4.375 | | | 05/01/12 | | 249,327 |
| | | | | | | |
| | | | | | | 1,941,563 |
| |
Wyoming – 1.1% |
| Wyoming Community Development Authority Housing Revenue Bonds Series 5 (AMT) (AA+/Aa1) |
| 785,000 | | 4.800 | | | 06/01/09 | | 786,915 |
| Wyoming Community Development Authority Housing Revenue Bonds Series 7 (AA+/Aa1) |
| 30,000 | | 5.150 | | | 12/01/10 | | 30,485 |
| 85,000 | | 5.200 | | | 12/01/11 | | 86,359 |
| Wyoming Community Development Authority Housing Revenue Bonds Series 8 (AMT) (AA+/Aa1) |
| 165,000 | | 4.250 | | | 06/01/14 | | 164,399 |
| 280,000 | | 4.250 | | | 12/01/14 | | 278,894 |
| 385,000 | | 4.300 | | | 12/01/15 | | 381,947 |
| | | | | | | |
| | | | | | | 1,728,999 |
| |
| TOTAL MUNICIPAL BOND OBLIGATIONS |
(Cost $155,768,847) | | | | | $157,984,400 |
| |
| | | | | | | |
| Repurchase Agreement(d) – 1.3% |
| State Street Bank & Trust Co. |
| $2,070,000 | | 0.010 | % | | 05/01/09 | | $ 2,070,000 |
Maturity Value: $2,070,001 | | |
(Cost $2,070,000) | | | | | |
| |
| TOTAL INVESTMENTS – 100.5% | | |
(Cost $157,838,847) | | | | | $160,054,400 |
| |
LIABILITIES IN EXCESS OF OTHER ASSETS – (0.5)% | | (811,345) |
| |
| NET ASSETS – 100.0% | | $159,243,055 |
| |
| | |
| The percentage shown for each investment category reflects the value of investments in that category as a percentage of net assets. |
| (a) | | Security issued with a zero coupon. Income is recognized through the accretion of discount. |
| (b) | | Variable rate security. Interest rate disclosed is that which is in effect at April 30, 2009. |
| (c) | | Prerefunded security. Maturity date disclosed is prerefunding date. |
| (d) | | Repurchase agreement was entered into on April 30, 2009. This agreement was fully collateralized by $2,000,000 U.S. Treasury Notes, 3.125%, due 09/30/13 with a market value of $2,111,600. |
| Security ratings disclosed are issued by Standard & Poor’s Ratings Services/Moody’s Investors Service. A description of the ratings is available in the Fund’s Statement of Additional Information. |
| |
| | |
| The accompanying notes are an integral part of these financial statements. | | 27 |
COMMERCE NATIONAL TAX-FREE INTERMEDIATE BOND FUND
Schedule of Investments (continued)
April 30, 2009 (Unaudited)
| | |
|
| |
| Investment Abbreviations: |
| AMBAC | | —Insured by American Municipal Bond Assurance Corp. |
| AMT | | —Alternative Minimum Tax |
| ETM | | —Escrow to Maturity |
| FGIC | | —Insured by Financial Guaranty Insurance Co. |
| FHA | | —Insured by Federal Housing Administration |
| FHLMC | | —Insured by Federal Home Loan Mortgage Corp. |
| FNMA | | —Insured by Federal National Mortgage Association |
| FSA | | —Insured by Financial Security Assurance Co. |
| GNMA | | —Insured by Government National Mortgage Association |
| GO | | —General Obligation |
| MBIA | | —Insured by Municipal Bond Investors Assurance |
| NR | | —Not Rated |
| PSF-GTD | | —Guaranteed by Permanent School Fund |
| Radian | | —Insured by Radian Asset Assurance |
| VA | | —Veterans Administration |
| XLCA | | —Insured by XL Capital Assurance, Inc. |
| |
PORTFOLIO COMPOSITION
| | | | | | |
| Sector Allocation | | AS OF
4/30/09 | | | AS OF
10/31/08 | |
| | |
Lease | | 21.5 | % | | 18.1 | % |
General Obligations | | 20.1 | | | 20.3 | |
Education | | 13.3 | | | 9.6 | |
Hospital | | 11.7 | | | 13.8 | |
General | | 9.1 | | | 10.3 | |
Single Family Housing | | 8.2 | | | 8.8 | |
Water/Sewer | | 6.9 | | | 7.4 | |
Transportation | | 4.1 | | | 4.3 | |
Prerefunded/Escrow to Maturity | | 2.0 | | | 3.4 | |
Student | | 1.7 | | | 1.8 | |
Power | | 0.5 | | | — | |
Multi Family Housing | | 0.1 | | | 1.1 | |
Short-Term Obligation | | 1.3 | | | 0.7 | |
| | |
| TOTAL INVESTMENTS | | 100.5 | % | | 99.6 | % |
| | |
The percentage shown for each Sector Allocation reflects the value of investments in that category as a percentage of net assets.
The Fund is actively managed and, as such its composition may differ over time.
| | |
| 28 | | The accompanying notes are an integral part of these financial statements. |
COMMERCE MISSOURI TAX-FREE INTERMEDIATE BOND FUND
Missouri Tax-Free Intermediate Bond Fund
Performance Information(1) (Unaudited)
For the six months ended April 30, 2009, the Fund had a total return of 7.25%, based on its Net Asset Value (NAV). This compares to the Barclays Capital 3-15 Year Blend Index(2) six-month return of 8.01%. Past performance is no guarantee of future results.
Schedule of Investments
April 30, 2009 (Unaudited)
| | | | | | | |
Principal
Amount | | Interest
Rate | | | Maturity
Date | | Value |
| Municipal Bond Obligations – 93.9% |
Arizona – 1.2% | | | | | |
| Pinal City Arizona Unified School District No.1 Florence School Improvement Project of 2006 GO Bonds Series C (A-/NR) |
| $ 1,155,000 | | 5.125 | % | | 07/01/23 | | $ 1,180,756 |
| 1,215,000 | | 5.150 | | | 07/01/24 | | 1,233,529 |
| | | | | | | |
| | | | | | | 2,414,285 |
| |
Colorado – 0.3% | | | | | |
| Colorado Housing & Finance Authority Revenue Bonds (Single Family Mortgage) Series A (FHA) (AAA/Aaa) |
| 650,000 | | 4.350 | | | 11/01/19 | | 660,010 |
| |
Indiana – 0.2% | | | | | |
| Indiana Bond Bank Revenue Bonds (Special Program-Hendricks Regional Health) Series A (AA/NR) |
| 500,000 | | 5.500 | | | 02/01/29 | | 504,550 |
| |
Iowa – 0.7% | | | | | |
| Iowa Finance Authority Revenue Bonds (Single Family Mortgage) Series E (GNMA/FNMA) (Go of Auth) (AAA/Aaa) |
| 1,350,000 | | 5.000 | | | 07/01/23 | | 1,377,486 |
| |
Kentucky – 0.2% | | | | | |
| Kentucky Housing Corp. Revenue Bonds Series A (FHA) (AAA/Aaa) |
| 500,000 | | 5.750 | | | 07/01/39 | | 508,815 |
| |
Louisiana – 0.8% | | | | | |
| Louisiana Local Government Environmental Facilities & Community Development Authority Revenue Bonds (Refunding-Independence Stadium Project) (A/NR) |
| 1,525,000 | | 5.000 | | | 03/01/21 | | 1,582,172 |
| |
Michigan – 0.7% | | | | | |
| Michigan State Hospital Finance Authority Revenue Bonds (Ascension Health Credit) Series A (MBIA) (AA/Aa1) |
| 500,000 | | 5.500 | | | 11/15/10 | | 512,585 |
| River Rouge MI School District GO Bonds (Refunding) (MBIA) (FGIC) (AA-/Aa3) |
| 1,000,000 | | 5.000 | | | 05/01/19 | | 1,042,510 |
| | | | | | | |
| | | | | | | 1,555,095 |
| |
| | | | | | | |
Principal
Amount | | Interest
Rate | | | Maturity
Date | | Value |
| Municipal Bond Obligations – (continued) |
Missouri – 87.5% | | | | | |
| Belton MO School District No. 124 Direct Deposit Program GO Bonds (Refunding) Series A (AA+/A1) |
| $ 150,000 | | 4.000 | % | | 03/01/17 | | $ 158,688 |
| Bi-State Development Agency MO Metro District Revenue Bonds (Refunding-St. Clair County Metrolink Project) (FSA) (AAA/Aa3) |
| 2,000,000 | | 5.250 | | | 07/01/20 | | 2,106,960 |
| 1,000,000 | | 5.250 | | | 07/01/28 | | 1,008,370 |
| Bonne Terre MO Certificates of Participation (AMBAC) (NR/NR) |
| 250,000 | | 5.250 | | | 11/01/15 | | 281,505 |
| Boone County MO Hospital Revenue Bonds (NR/A3) |
| 1,600,000 | | 5.750 | | | 08/01/28 | | 1,490,912 |
| Branson MO Reorganized School District No. R-4 GO Bonds (FSA) (AAA/Aa3) |
| 1,000,000 | | 5.000 | | | 03/01/18 | | 1,095,440 |
| 1,250,000 | | 5.000 | | | 03/01/19 | | 1,354,775 |
| Branson MO Reorganized School District No. R-4 GO Bonds School District Direct Deposit Program (AMBAC) (A+/NR) |
| 300,000 | | 5.500 | | | 03/01/14 | | 346,389 |
| Camdenton MO Reorganized School District No. RIII GO Bonds (Refunding & Improvement) (FSA) (AAA/Aa3) |
| 500,000 | | 5.250 | | | 03/01/17 | | 588,575 |
| 1,000,000 | | 5.250 | | | 03/01/21 | | 1,090,310 |
| Cape Girardeau County MO Industrial Development Authority Health Care Facilities Revenue Bonds (St. Francis Medical Center) Series A (A+/NR) |
| 930,000 | | 5.250 | | | 06/01/11 | | 957,165 |
| 400,000 | | 5.250 | | | 06/01/12 | | 414,776 |
| 1,000,000 | | 5.250 | | | 06/01/13 | | 1,042,700 |
| Carroll County MO Public Water Suppy District No. I Water System Revenue Bonds Series B (Refunding) (SP-1+/NR) |
| 1,700,000 | | 4.625 | | | 03/01/12 | | 1,700,187 |
| Cass County MO Reorganized School District No. R-2 Raymore-Peculiar Direct Deposit Program GO Bonds (AA+/NR) |
| 1,000,000 | | 5.000 | | | 03/01/18 | | 1,130,420 |
| Clay County MO Public Building Authority Leasehold Revenue Bonds (General Improvement) Series C (FSA) (AAA/Aa3) |
| 40,000 | | 5.000 | | | 05/15/09 | | 40,005 |
| |
| (1) | | Returns assume expense reimbursements and are not annualized. Returns do not reflect the deduction of taxes that a shareholder would pay on Fund distributions or the redemption of Fund shares. |
| (2) | | The Barclays Capital 3-15 Year Blend Index is an unmanaged index composed of investment grade municipal securities ranging from 2 to 17 years in maturity. The Index figure does not reflect the deduction of any fees, expenses or taxes. |
| | |
| The accompanying notes are an integral part of these financial statements. | | 29 |
COMMERCE MISSOURI TAX-FREE INTERMEDIATE BOND FUND
Schedule of Investments (continued)
April 30, 2009 (Unaudited)
| | | | | | | |
Principal
Amount | | Interest
Rate | | | Maturity
Date | | Value |
| Municipal Bond Obligations – (continued) |
Missouri – (continued) | | | | | |
| Clay County MO Public School District No. 53 Liberty Direct Deposit Program GO Bonds (Refunding) Series A (FSA) (AAA/Aa3) |
| $ 1,000,000 | | 5.000 | % | | 03/01/18 | | $ 1,047,610 |
| Clay County MO Public School District No. 53 Liberty Direct Deposit Program GO Bonds Series B (FSA) (AAA/Aa3) |
| 1,000,000 | | 5.000 | | | 03/01/18 | | 1,047,610 |
| Clay County MO Public School District No. 53 Liberty School Building Direct Deposit Program GO Bonds (AA+/NR) |
| 1,280,000 | | 5.000 | | | 03/01/25 | | 1,368,397 |
| 2,435,000 | | 5.000 | | | 03/01/28 | | 2,549,786 |
| Clay County MO Reorganized School District No. R-1 Kearney Direct Deposit Program GO Bonds (AA+/Aa1) |
| 740,000 | | 5.000 | | | 03/01/13 | | 785,125 |
| 900,000 | | 5.000 | | | 03/01/15 | | 954,882 |
| Clay County MO Reorganized School District No. R-1 Kearney School Building Direct Deposit Program GO Bonds Series B (AA+/Aa1) |
| 695,000 | | 5.000 | | | 03/01/21 | | 749,446 |
| 650,000 | | 5.000 | | | 03/01/22 | | 695,266 |
| Clinton MO Certificates of Participation (Refunding & Improvement) (NR/NR) |
| 400,000 | | 5.000 | | | 12/01/12 | | 433,536 |
| Cole County MO Certificates of Participation (Jail Project) (NR/A1) |
| 660,000 | | 4.300 | | | 12/01/19 | | 667,141 |
| 1,000,000 | | 4.500 | | | 12/01/20 | | 1,013,030 |
| Columbia MO Water & Electricity Revenue Bonds (Unrefunded Balance-Refunding and Improvement) Series A (AA-/A1) |
| 230,000 | | 4.700 | | | 10/01/10 | | 230,044 |
| Des Peres MO Certificates of Participation (Refunding) (AA+/NR) |
| 390,000 | | 3.000 | | | 08/01/14 | | 400,089 |
| Florissant MO Certificates of Participation (FGIC) (NR/A2) |
| 330,000 | | 5.000 | | | 08/01/11 | | 357,383 |
| 560,000 | | 5.000 | | | 08/01/12 | | 621,348 |
| 485,000 | | 5.000 | | | 08/01/15 | | 515,938 |
| 500,000 | | 5.000 | | | 08/01/16 | | 528,565 |
| 450,000 | | 5.000 | | | 08/01/17 | | 473,297 |
| Fort Zumwalt MO School District Direct Deposit Program GO Bonds Series A (AA+/Aa1) |
| 1,080,000 | | 5.000 | | | 03/01/19 | | 1,205,258 |
| Fort Zumwalt MO School District GO Bonds Direct Deposit Program (Refunding) Series A (AA+/Aa1) |
| 700,000 | | 5.000 | | | 03/01/17 | | 786,982 |
| 935,000 | | 5.000 | | | 03/01/18 | | 1,042,104 |
| 945,000 | | 5.000 | | | 03/01/19 | | 1,041,522 |
| Franklin County MO Public Water Supply District No. 3 Certificates of Participation (Refunding) Series C (FGIC) (NR/NR) |
| 395,000 | | 5.000 | | | 12/01/15 | | 421,979 |
| |
| | | | | | | |
Principal
Amount | | Interest
Rate | | | Maturity
Date | | Value |
| Municipal Bond Obligations – (continued) |
Missouri – (continued) | | | | | |
| Gladstone MO Certificates of Participation Series A XLCA (NR/A2) |
| $ 475,000 | | 5.000 | % | | 06/01/23 | | $ 482,899 |
| Greene County MO Reorganized School District No. R-8 Direct Deposit Program GO Bonds (FSA) (AAA/Aa3) |
| 520,000 | | 5.250 | | | 03/01/16 | | 568,688 |
| Hickman Mills MO School District No. C-1 Direct Deposit Program GO Bonds (FSA) (AAA/Aa3) |
| 2,300,000 | | 5.000 | | | 03/01/19 | | 2,434,136 |
| Jackson County MO Consolidated School District Direct Deposit Program GO Bonds (AA+/NR) |
| 2,365,000 | | 5.000 | | | 03/01/25 | | 2,533,766 |
| Jackson County MO Consolidated School District No. 2 Direct Deposit Program GO Bonds (AA+/NR) |
| 1,275,000 | | 5.000 | | | 03/01/18 | | 1,324,903 |
| Jackson County MO Consolidated School District No. 2 Direct Deposit Program GO Bonds (MBIA) (AA+/Baa1) |
| 1,250,000 | | 5.000 | | | 03/01/22 | | 1,337,012 |
| Jackson County MO Public Building Corp. Leasehold Revenue Bonds (Capital Improvements Project) Series B (NR/Aa3) |
| 530,000 | | 4.500 | | | 12/01/19 | | 557,406 |
| 555,000 | | 4.500 | | | 12/01/20 | | 578,116 |
| Jackson County MO Public Building Corp. Leasehold Revenue Bonds Series A (MBIA) (NR/Aa3) |
| 500,000 | | 5.000 | | | 12/01/20 | | 541,885 |
| Jackson County MO Reorganized School District No. 4 Blue Springs GO Bonds (Refunding & Improvement) Series A (AA/NR) |
| 2,000,000 | | 5.000 | | | 03/01/29 | | 2,045,060 |
| Jackson County MO School District No. C-1 Hickman School Building Direct Deposit Program GO Bonds (AA+/NR) |
| 500,000 | | 5.000 | | | 03/01/24 | | 541,085 |
| Jackson County MO Special Obligation Revenue Bonds (Harry S. Truman Sports Complex) (AMBAC) (AA-/Aa3) |
| 1,360,000 | | 5.000 | | | 12/01/22 | | 1,398,787 |
| Jackson County MO Special Obligation Revenue Bonds Series A (MBIA) (NR/Aa3) |
| 2,000,000 | | 5.500 | | | 12/01/12 | | 2,179,460 |
| Jefferson County MO Consolidated Public Water Supply District No. C-1 Revenue Bonds (AMBAC) (NR/NR) |
| 1,000,000 | | 5.250 | | | 12/01/15 | | 1,092,680 |
| Jefferson County MO Consolidated School District No. 6 Direct Deposit Program GO Bonds (MBIA) (AA+/Baa1) |
| 1,000,000 | | 5.000 | | | 03/01/18 | | 1,040,750 |
| 2,000,000 | | 5.000 | | | 03/01/19 | | 2,068,420 |
| Jefferson County MO Reorganized School District No. R-6 GO Bonds (Refunding Insured) (FGIC) (AA-/A2) |
| 530,000 | | 5.000 | | | 03/01/11 | | 544,474 |
| Johnson County MO Hospital Revenue Bonds (Western MO Medical Center Project) (Radian) (BBB-/NR)(a) |
| 300,000 | | 5.700 | | | 06/01/10 | | 316,560 |
| 380,000 | | 5.750 | | | 06/01/10 | | 401,177 |
| 400,000 | | 5.800 | | | 06/01/10 | | 422,508 |
| |
| | |
| 30 | | The accompanying notes are an integral part of these financial statements. |
COMMERCE MISSOURI TAX-FREE INTERMEDIATE BOND FUND
| | | | | | | |
Principal
Amount | | Interest
Rate | | | Maturity
Date | | Value |
| Municipal Bond Obligations – (continued) |
Missouri – (continued) | | | | | |
| Johnson County MO Hospital Revenue Bonds (Western MO Medical Center Project) (Radian) (ETM) (BBB-/NR) |
| $ 330,000 | | 5.350 | % | | 06/01/09 | | $ 331,165 |
| Joplin MO Industrial Development Authority Health Facilities Revenue Bonds (Freeman Health System Project) (BBB+/NR) |
| 820,000 | | 5.500 | | | 02/15/12 | | 820,344 |
| 555,000 | | 5.500 | | | 02/15/14 | | 544,017 |
| Kansas City MO Land Clearance Revenue Bonds (Refunding & Improvement) Series E (XCLA) (AA-/A2) |
| 1,000,000 | | 5.000 | | | 12/01/15 | | 1,144,770 |
| Kansas City MO Metropolitan Community Colleges Building Corp. Leasehold Revenue Bonds (Refunding & Improvement) (FGIC) (NR/Aa3) |
| 1,000,000 | | 5.500 | | | 07/01/11 | | 1,092,110 |
| Kansas City MO Metropolitan Community Leasehold Jr. College Revenue Bonds (Refunding & Improvements) (FGIC) (NR/Aa3) |
| 1,075,000 | | 5.000 | | | 07/01/17 | | 1,194,207 |
| Kansas City MO Special Obligation Revenue Bonds (Arena Project) (Refunding & Improvements) Series C (AA-/A2) |
| 1,575,000 | | 5.500 | | | 04/01/23 | | 1,681,108 |
| Kansas City MO Special Obligation Revenue Bonds (Arena Project) (Refunding & Improvements) Series D (AA-/A2) |
| 340,000 | | 6.431 | | | 04/01/18 | | 341,435 |
| Kansas City MO Water Revenue Bonds Series A (AA+/A1)(a) |
| 1,640,000 | | 5.750 | | | 12/01/10 | | 1,767,116 |
| 1,735,000 | | 5.800 | | | 12/01/10 | | 1,870,816 |
| Kansas City MO Water Revenue Bonds Series C (FGIC) (AA+/A1)(a) |
| 1,885,000 | | 5.000 | | | 12/01/11 | | 2,074,462 |
| Kirkwood MO School District Educational Facilities Authority Leasehold Revenue Bonds for Kirkwood School District R-7 Project Series B (MBIA) (NR/Aa3) |
| 750,000 | | 5.000 | | | 02/15/19 | | 808,755 |
| Ladue MO School District GO Bonds (Refunding and Improvement) (AAA/NR) |
| 500,000 | | 5.000 | | | 03/01/20 | | 557,065 |
| 545,000 | | 5.000 | | | 03/01/22 | | 596,590 |
| 500,000 | | 5.000 | | | 03/01/23 | | 542,360 |
| Lebanon MO Reorganized School District No. R-3 Direct Deposit Program GO Bonds (AA+/NR) |
| 270,000 | | 5.450 | | | 03/01/14 | | 279,469 |
| Lee’s Summit MO Water & Sewer Revenue Bonds (Refunding) (AMBAC) (NR/A1) |
| 335,000 | | 5.250 | | | 07/01/11 | | 364,078 |
| 1,000,000 | | 5.250 | | | 07/01/12 | | 1,073,260 |
| 1,135,000 | | 5.250 | | | 07/01/15 | | 1,195,904 |
| Lee’s Summit MO Water & Sewer Revenue Bonds Combination Series A (AMBAC) (NR/A1) |
| 480,000 | | 5.000 | | | 07/01/20 | | 499,416 |
| Maryville MO Waterworks & Sewage System Revenue Bonds (Combined) Series A (NR/NR) |
| 2,000,000 | | 5.450 | | | 07/01/15 | | 1,997,780 |
| |
| | | | | | | |
Principal
Amount | | Interest
Rate | | | Maturity
Date | | Value |
| Municipal Bond Obligations – (continued) |
Missouri – (continued) | | | | | |
| Missouri Development Finance Board Cultural Facilities Revenue Bonds (Nelson Gallery Foundation) Series A (MBIA) (AA-/Aa3) |
| $ 1,000,000 | | 5.250 | % | | 12/01/13 | | $ 1,086,060 |
| 1,410,000 | | 5.250 | | | 12/01/15 | | 1,505,260 |
| Missouri Higher Education Student Loan Revenue Bonds Series EE (AMT) (NR/Aaa) |
| 500,000 | | 4.500 | | | 02/15/10 | | 500,350 |
| Missouri Higher Education Student Loan Revenue Bonds Series RR (AMT) (NR/A2) |
| 1,500,000 | | 5.850 | | | 07/15/10 | | 1,524,060 |
| Missouri School Board Association Lease Certificates of Participation for Liberty Public School District No. 53 (FSA) (AAA/Aa3) |
| 830,000 | | 5.250 | | | 03/01/21 | | 915,457 |
| 700,000 | | 5.250 | | | 03/01/22 | | 764,127 |
| Missouri State Board of Public Buildings Special Obligation Revenue Bonds Series A (AA+/Aa1) |
| 1,000,000 | | 5.000 | | | 10/15/20 | | 1,069,300 |
| Missouri State Development Finance Board Infrastructure Facilities (Eastland Center Project) Series A (A+/NR) |
| 150,000 | | 4.500 | | | 04/01/22 | | 143,889 |
| Missouri State Development Finance Board Infrastructure Facilities (Hartman Heritage Center Phase II) (AMBAC) (A+/NR) |
| 300,000 | | 5.000 | | | 04/01/13 | | 325,719 |
| 1,240,000 | | 5.000 | | | 04/01/21 | | 1,283,288 |
| Missouri State Development Finance Board Infrastructure Facilities (Independence-Centerpoint Project) (A+/NR) |
| 935,000 | | 4.750 | | | 04/01/28 | | 828,410 |
| Missouri State Development Finance Board Infrastructure Facilities Revenue Bonds (Independence- Events Center) Series F (A+/NR) |
| 1,000,000 | | 6.125 | | | 04/01/29 | | 1,000,560 |
| Missouri State Development Finance Board Infrastructure Facilities Revenue Bonds (Riverside-Quindaro L-385 Project) (NR/NR)(a) |
| 430,000 | | 5.200 | | | 03/01/10 | | 444,998 |
| 1,035,000 | | 5.300 | | | 03/01/10 | | 1,071,950 |
| 680,000 | | 5.600 | | | 03/01/10 | | 705,942 |
| Missouri State Environmental Improvement & Energy Resources Authority Pollution Control Revenue Bonds (Tri-County Water Authority Project) (Radian) (BBB-/NR) |
| 445,000 | | 5.600 | | | 04/01/11 | | 447,750 |
| 1,500,000 | | 6.000 | | | 04/01/22 | | 1,500,990 |
| Missouri State Environmental Improvement & Energy Resources Authority Water Facilities Revenue Bonds (Tri-County Water Authority Project) (Refunding) (Radian) (BBB-/NR) |
| 450,000 | | 5.550 | | | 04/01/10 | | 453,146 |
| 80,000 | | 5.750 | | | 04/01/19 | | 80,050 |
| |
| | |
| The accompanying notes are an integral part of these financial statements. | | 31 |
COMMERCE MISSOURI TAX-FREE INTERMEDIATE BOND FUND
Schedule of Investments (continued)
April 30, 2009 (Unaudited)
| | | | | | | |
Principal
Amount | | Interest
Rate | | | Maturity
Date | | Value |
| Municipal Bond Obligations – (continued) |
Missouri – (continued) | | | | | |
| Missouri State Environmental Improvement & Energy Resources Authority Water Pollution Control Revenue Bonds (State Revolving Funds Program) Series A (NR/Aaa) |
| $ 400,000 | | 5.500 | % | | 01/01/23 | | $ 460,800 |
| Missouri State Environmental Improvement & Energy Resources Authority Water Pollution Control Revenue Bonds (State Revolving Funds Program) Series B (NR/Aaa) |
| 1,150,000 | | 5.250 | | | 01/01/11 | | 1,162,731 |
| 1,115,000 | | 5.000 | | | 07/01/17 | | 1,283,945 |
| 2,130,000 | | 5.125 | | | 01/01/18 | | 2,300,080 |
| 725,000 | | 5.000 | | | 01/01/22 | | 761,214 |
| Missouri State Environmental Improvement & Energy Resources Authority Water Pollution Control Revenue Bonds (Unrefunded Balance State Revolving Funds Program) Series A (NR/Aaa) |
| 210,000 | | 5.125 | | | 07/01/11 | | 219,851 |
| 535,000 | | 5.200 | | | 07/01/12 | | 558,337 |
| Missouri State Environmental Improvement & Energy Resources Authority Water Pollution Control Revenue Bonds (Unrefunded Balance State Revolving Funds Program) Series D (NR/Aaa) |
| 170,000 | | 5.125 | | | 01/01/10 | | 170,090 |
| Missouri State Health & Educational Facilities Authority Revenue Bonds (BJC Health System) Series 2003 (AA/Aa2) |
| 2,180,000 | | 5.250 | | | 05/15/17 | | 2,262,339 |
| Missouri State Health & Educational Facilities Authority Revenue Bonds (Cox Health System) (NR/A2) |
| 2,350,000 | | 5.125 | | | 11/15/23 | | 2,196,263 |
| Missouri State Health & Educational Facilities Revenue Bonds (St. Lukes Health System) Series A (FSA) (AAA/Aa3) |
| 1,000,000 | | 5.000 | | | 11/15/19 | | 1,071,890 |
| Missouri State Health & Educational Facility Authority Revenue Bonds (BJC Health System) Series A (AA/Aa2) |
| 1,225,000 | | 5.000 | | | 05/15/18 | | 1,262,215 |
| Missouri State Health & Educational Facility Revenue Bonds (Barnes-Jewish, Inc.) (AA/Aa2) |
| 150,000 | | 6.000 | | | 05/15/11 | | 159,549 |
| Missouri State Health & Educational Facility Revenue Bonds (Barnes-Jewish, Inc.) Series A (AMBAC-TCRS) (A/NR) |
| 1,735,000 | | 5.150 | | | 05/15/10 | | 1,808,980 |
| Missouri State Health & Educational Facility Revenue Bonds (Central Institute for the Deaf) (Radian) (BBB-/NR)(a) |
| 1,000,000 | | 5.850 | | | 01/01/10 | | 1,032,070 |
| Missouri State Health & Educational Facility Revenue Bonds (Lake Regional Health System Project) (BBB+/NR) |
| 510,000 | | 5.000 | | | 02/15/14 | | 489,447 |
| Missouri State Health & Educational Facility Revenue Bonds (St. Louis University) (AA-/A1) |
| 1,700,000 | | 5.250 | | | 10/01/10 | | 1,702,142 |
| 1,000,000 | | 5.500 | | | 10/01/12 | | 1,108,380 |
| Missouri State Health & Educational Facility Revenue Bonds (St. Lukes Health System) Series A (FSA) (AAA/Aa3) |
| 250,000 | | 5.000 | | | 11/15/10 | | 262,505 |
| |
| | | | | | | |
Principal
Amount | | Interest
Rate | | | Maturity
Date | | Value |
| Municipal Bond Obligations – (continued) |
Missouri – (continued) | | | | | |
Missouri State Health & Educational Facility Revenue Bonds (St. Lukes Health System) Series A (FSA) (AAA/Aa3) – continued |
| $ 2,000,000 | | 5.000 | % | | 11/15/14 | | $ 2,197,000 |
| Missouri State Health & Educational Facility Revenue Bonds (University of Missouri-Columbia Arena Project) (AA+/Aa1) |
| 500,000 | | 5.000 | | | 11/01/17 | | 526,145 |
| Missouri State Health & Educational Facility Revenue Bonds (Washington University) Series A (AAA/Aaa) |
| 1,050,000 | | 5.000 | | | 02/15/17 | | 1,177,754 |
| 1,545,000 | | 5.000 | | | 02/15/20 | | 1,680,373 |
| 120,000 | | 4.750 | | | 11/15/37 | | 118,888 |
| Missouri State Highways & Transit Commission Road Revenue Bonds (Second Lien) (AAA/Aa2) |
| 1,165,000 | | 5.250 | | | 05/01/18 | | 1,357,167 |
| Missouri State Housing Development Commission Revenue Bonds (Multifamily Housing) Series II (FHA) (AA/NR) |
| 485,000 | | 4.750 | | | 12/01/10 | | 490,490 |
| Missouri State Housing Development Community Mortgage Revenue Bonds (Multifamily Housing) Series II (FHA) (AA/NR) |
| 335,000 | | 4.650 | | | 12/01/09 | | 340,136 |
| Missouri State Housing Development Community Mortgage Revenue Bonds (Single Family Homeowner Loan A-1) (AMT) (FNMA/GNMA) (AAA/NR) |
| 45,000 | | 5.800 | | | 09/01/11 | | 45,060 |
| 40,000 | | 5.900 | | | 09/01/12 | | 40,088 |
| 45,000 | | 6.000 | | | 09/01/13 | | 45,041 |
| Missouri State Housing Development Community Mortgage Revenue Bonds (Single Family Homeowner) Series E-1 (AMT) (FNMA/GNMA) (AAA/NR) |
| 35,000 | | 5.000 | | | 03/01/12 | | 35,044 |
| 35,000 | | 5.000 | | | 09/01/12 | | 35,044 |
| Missouri State Regional Convention & Sports Complex Authority Revenue Bonds (Refunding Convention & Sports Facilities Project) Series A-1 (AMBAC) (AA+/Aa2) |
| 2,000,000 | | 5.250 | | | 08/15/12 | | 2,160,840 |
| Missouri State Stormwater Control GO Bonds Series A (AAA/Aaa) |
| 300,000 | | 5.250 | | | 08/01/16 | | 326,478 |
| Monarch-Chesterfield MO Levee District Revenue Bonds (MBIA) (AA-/Baa1) |
| 1,000,000 | | 5.450 | | | 03/01/14 | | 1,037,380 |
| Neosho MO Reorganized School District No. R-5 GO Bonds (Building-Direct Deposit Program) (FSA) (AAA/Aa3) |
| 1,430,000 | | 5.250 | | | 03/01/21 | | 1,568,810 |
| New Liberty Hospital District Revenue Bonds (MBIA) (NR/Baa1) |
| 515,000 | | 5.000 | | | 12/01/10 | | 515,015 |
| 850,000 | | 5.125 | | | 12/01/12 | | 850,034 |
| Nixa MO Electric System Revenue Bonds (XLCA) (NR/NR) |
| 1,000,000 | | 4.750 | | | 04/01/15 | | 1,065,540 |
| North Kansas City MO Hospital Revenue Bonds (North Kansas City Hospital) Series A (FSA) (AAA/Aa3) |
| 1,000,000 | | 5.000 | | | 11/15/18 | | 1,043,130 |
| 1,000,000 | | 5.000 | | | 11/15/19 | | 1,034,330 |
| |
| | |
| 32 | | The accompanying notes are an integral part of these financial statements. |
COMMERCE MISSOURI TAX-FREE INTERMEDIATE BOND FUND
| | | | | | | |
Principal
Amount | | Interest
Rate | | | Maturity
Date | | Value |
| Municipal Bond Obligations – (continued) |
Missouri – (continued) | | | | | |
| North Kansas City MO School District No. 74 Direct Deposit Program GO Bonds (AA+/Aa1) |
| $ 3,000,000 | | 5.500 | % | | 03/01/28 | | $ 3,311,070 |
| Northwest Missouri State University Revenue Bonds (Housing System) (MBIA) (NR/A3) |
| 2,875,000 | | 5.000 | | | 06/01/20 | | 3,000,637 |
| O’ Fallon MO Certificates of Participation (MBIA) (NR/A1) |
| 1,000,000 | | 5.000 | | | 02/01/22 | | 1,027,470 |
| O’ Fallon MO Certificates of Participation (NR/A1) |
| 2,000,000 | | 5.250 | | | 11/01/19 | | 2,230,600 |
| OTC Public Building Corp. MO Leasehold Revenue Bonds (Refunding & Improvement-Ozarks College Project) (FSA) (AAA/Aa3) |
| 740,000 | | 4.900 | | | 03/01/16 | | 768,327 |
| OTC Public Building Corp. MO Leasehold Revenue Bonds (Refunding-Ozarks Technical Community College) (FSA) (AAA/NR) |
| 1,500,000 | | 5.000 | | | 03/01/19 | | 1,728,690 |
| Ozark MO Reorganized School District No. R-6 GO Bonds (Direct Deposit Program) (FSA) (AAA/Aa3) |
| 440,000 | | 5.000 | | | 03/01/22 | | 476,036 |
| Platte County MO GO Bonds for Parkville Neighborhood Improvement Series B (MBIA) (NR/Aa3) |
| 2,720,000 | | 5.000 | | | 02/01/22 | | 2,868,077 |
| Platte County MO Industrial Development Authority Transportation Revenue Bonds (Refunding and Improvement Zona Rosa Retail Project) (AA-/NR) |
| 435,000 | | 5.000 | | | 12/01/18 | | 486,369 |
| 850,000 | | 5.000 | | | 12/01/20 | | 925,956 |
| Platte County MO Reorganized School District No. R-3 GO Bonds for School Building (FSA) (AAA/Aa3) |
| 1,025,000 | | 4.500 | | | 03/01/22 | | 1,057,001 |
| Poplar Bluff MO Public Building Corp. Leasehold Revenue Bonds (Refunding & improvement) (NR/Baa1) |
| 390,000 | | 5.100 | | | 09/01/18 | | 390,967 |
| Raytown MO Annual Appropriation-Supported Tax Revenue Bonds (Live Redevelopment Plan Project 1) (A+/NR) |
| 150,000 | | 5.000 | | | 12/01/12 | | 158,886 |
| Raytown MO Sewer Revenue Bonds (NR/NR) |
| 100,000 | | 4.625 | | | 07/01/24 | | 96,972 |
| 100,000 | | 4.700 | | | 07/01/27 | | 94,727 |
| Ritenour MO School District Direct Deposit Program GO Bonds (AA+/NR) |
| 1,740,000 | | 4.500 | | | 03/01/17 | | 1,932,757 |
| Riverside-Quindaro MO Bend Levee District Project Revenue Bonds Series L (Radian) (BBB/NR) |
| 450,000 | | 5.500 | | | 03/01/14 | | 447,705 |
| 500,000 | | 5.500 | | | 03/01/15 | | 492,150 |
| Southeast MO State University Revenue Bonds (Installment Payment Certificates) Series 2002 (XLCA) (NR/NR) |
| 200,000 | | 4.750 | | | 04/01/12 | | 202,304 |
| |
| | | | | | | |
Principal
Amount | | Interest
Rate | | | Maturity
Date | | Value |
| Municipal Bond Obligations – (continued) |
Missouri – (continued) | | | | | |
| Springfield MO Public Building Corp. Leasehold Revenue Bonds (Taxable- Improvement-Branson National Airport) (NR/Aa3) |
| $ 540,000 | | 6.750 | % | | 03/01/28 | | $ 529,794 |
| 575,000 | | 6.850 | | | 03/01/29 | | 569,394 |
| Springfield MO Public Utility Revenue Certificates of Participation (Lease Purchase for Various Projects) Series A (MBIA) (AA-/A1) |
| 1,000,000 | | 5.000 | | | 12/01/18 | | 1,091,040 |
| Springfield MO Special Obligation Revenue Bonds (College Station Garage Project) Series A (NR/A1) |
| 190,000 | | 4.500 | | | 11/01/18 | | 199,853 |
| 530,000 | | 4.500 | | | 11/01/19 | | 548,529 |
| 610,000 | | 4.500 | | | 11/01/20 | | 624,701 |
| 645,000 | | 4.750 | | | 11/01/21 | | 668,710 |
| 685,000 | | 4.750 | | | 11/01/22 | | 702,803 |
| Springfield MO Special Obligation Revenue Bonds (Heers Garage Project) Series B (NR/A1) |
| 385,000 | | 4.750 | | | 11/01/21 | | 399,153 |
| 405,000 | | 4.750 | | | 11/01/22 | | 415,526 |
| St. Charles County MO Community College GO Bonds (Refunding) (MBIA) (NR/Aa2) |
| 2,585,000 | | 5.000 | | | 02/15/17 | | 2,968,200 |
| St. Charles County MO Public Water Supply District No. 2 Certificates of Participation (AA/NR) |
| 100,000 | | 5.200 | | | 12/01/31 | | 101,833 |
| St. Charles County MO Public Water Supply District No. 2 Certificates of Participation Series B (Refunding) (NR/Baa1) |
| 530,000 | | 5.000 | | | 12/01/12 | | 566,941 |
| St. Charles County MO Water Supply District No. 2 Certificates of Participation (AA/NR) |
| 650,000 | | 5.375 | | | 12/01/36 | | 659,126 |
| St. Charles MO Certificates of Participation Series B (NR/A2) |
| 200,000 | | 5.000 | | | 05/01/09 | | 200,000 |
| St. Charles MO Community College Educational Facilities Authority Leasehold Revenue Bonds (NR/Aa3) |
| 100,000 | | 5.250 | | | 06/01/19 | | 107,825 |
| 735,000 | | 5.200 | | | 06/01/24 | | 774,764 |
| St. Louis County MO Certificates of Participation Capital Improvement Projects (AA+/Aa2) |
| 300,000 | | 4.400 | | | 05/15/11 | | 300,333 |
| St. Louis County MO Industrial Development Authority Health Facilities Revenue Bonds (Refunding-Ranken Jordan Project) (NR/NR) |
| 490,000 | | 5.000 | | | 11/15/15 | | 401,545 |
| 515,000 | | 5.000 | | | 11/15/16 | | 409,137 |
| St. Louis County MO Parkway School District No. C-2 GO Bonds (Refunding & Improvement) (AAA/NR) |
| 400,000 | | 3.250 | | | 03/01/19 | | 407,416 |
| St. Louis County MO Rockwood School District No. R-6 GO Bonds Series A (AAA/NR)(a) |
| 1,315,000 | | 5.000 | | | 02/01/13 | | 1,483,241 |
| |
| | |
| The accompanying notes are an integral part of these financial statements. | | 33 |
COMMERCE MISSOURI TAX-FREE INTERMEDIATE BOND FUND
Schedule of Investments (continued)
April 30, 2009 (Unaudited)
| | | | | | | |
Principal
Amount | | Interest
Rate | | | Maturity
Date | | Value |
| Municipal Bond Obligations – (continued) |
Missouri – (continued) |
| St. Louis County MO School District No. R-6 Direct Deposit Program GO Bonds (AAA/NR)(a) |
| $ 1,000,000 | | 5.000 | % | | 02/01/11 | | $ 1,070,030 |
| St. Louis MO Airport Revenue Bonds (Refunding for Lambert/St. Louis International Airport) (MBIA) (FGIC) (AA-/NR) |
| 185,000 | | 5.125 | | | 07/01/12 | | 187,192 |
| St. Louis MO Airport Revenue Bonds (Refunding-Lambert International Airport) (FGIC) (AA-/NR) |
| 100,000 | | 5.125 | | | 07/01/15 | | 101,111 |
| St. Louis MO Airport Revenue Bonds Refunding for Lambert Series B (AMT) (FSA) (AAA/Aa3) |
| 2,000,000 | | 5.000 | | | 07/01/24 | | 1,818,880 |
| St. Louis MO Junior College District Building Corp. Leasehold Revenue Bonds (AA/NR) |
| 345,000 | | 3.000 | | | 04/01/10 | | 350,448 |
| 355,000 | | 3.000 | | | 04/01/11 | | 363,747 |
| 100,000 | | 4.000 | | | 04/01/16 | | 107,161 |
| St. Louis MO Municipal Finance Corp. Leasehold Revenue Bonds (Refunding City Justice Center) Series A (AMBAC) (NR/NR) |
| 700,000 | | 5.250 | | | 02/15/15 | | 707,504 |
| St. Louis MO Parking Facility Revenue Bonds (Downtown Parking Facilities Subordinated A) (NR/NR)(a) |
| 900,000 | | 5.500 | | | 02/01/12 | | 977,787 |
| St. Louis MO Parking Revenue Bonds (Taxable) Series B (AA-/Baa1) |
| 100,000 | | 5.140 | | | 12/15/14 | | 98,607 |
| St. Louis MO Special Administrative Board Transitional School District GO Bonds (Direct Deposit Program) (AA+/NR) |
| 4,250,000 | | 5.000 | | | 04/01/21 | | 4,575,550 |
| Taney County MO Certificates of Participation (MBIA) (NR/A3) |
| 1,095,000 | | 4.500 | | | 04/01/17 | | 1,128,387 |
| Taney County MO Reorganized School District No. R-V Hollister School District Direct Deposit Program GO Bonds (Refunding & Improvement) (FSA) (AAA/Aa3) |
| 1,100,000 | | 5.000 | | | 03/01/18 | | 1,171,874 |
| 1,050,000 | | 5.000 | | | 03/01/21 | | 1,187,256 |
| Troy MO Reorganized School District No. 3 Lincoln County Direct Deposit Program (AA+/NR) |
| 1,000,000 | | 5.000 | | | 03/01/17 | | 1,086,780 |
| University of Missouri Revenue Bonds System Facilities (Refunding) Series B (AA/Aa2) |
| 375,000 | | 5.375 | | | 11/01/14 | | 405,390 |
| Washington MO School District Direct Deposit GO Bonds (Refunding) (FSA) (AAA/Aa3) |
| 1,000,000 | | 5.250 | | | 03/01/13 | | 1,133,190 |
| Willard MO Certificates of Participation (Parks & Recreation Project) Series B (A/NR) |
| 625,000 | | 6.625 | | | 06/01/28 | | 700,563 |
| | | | | | | |
| | | | | | | 183,541,457 |
| |
| | | | | | | |
Principal
Amount | | Interest
Rate | | | Maturity
Date | | Value |
| Municipal Bond Obligations – (continued) |
Oregon – 0.7% |
| Salem OR Hospital Facility Authority Revenue Bonds Series A (A+/NR) |
| $ 1,500,000 | | 5.250 | % | | 08/15/17 | | $ 1,545,555 |
| |
Puerto Rico – 0.3% |
| Puerto Rico Electric Power Authority Revenue Bonds (Refunding) (MBIA) (AA-/A3) |
| 555,000 | | 5.000 | | | 07/01/22 | | 523,288 |
| |
Texas – 0.4% |
| Mansfield TX GO Certificates (AA/Aa3) |
| 700,000 | | 5.750 | | | 02/15/22 | | 772,429 |
| |
Utah – 0.4% |
| Utah State Building Ownership Authority Lease Revenue Bonds (Refunding-State Facilities Master Lease Program) Series A (AA+/Aa1) |
| 790,000 | | 5.250 | | | 05/15/21 | | 836,041 |
| |
Virginia – 0.5% |
| Virginia State Housing Development Authority Revenue Bonds Series Z (AA+/Aa1) |
| 1,150,000 | | 4.700 | | | 07/01/23 | | 1,148,758 |
| |
| TOTAL MUNICIPAL BOND OBLIGATIONS |
(Cost $191,534,865) | | | | | $196,969,941 |
| |
| | | | | | | |
| Repurchase Agreement(b) – 4.9% |
| State Street Bank & Trust Co. |
| $10,242,000 | | 0.010 | % | | 05/01/09 | | $ 10,242,000 |
Maturity Value: $10,242,003 |
(Cost $10,242,000) | | | | | |
| |
| TOTAL INVESTMENTS – 98.8% |
(Cost $201,776,865) | | | | | $207,211,941 |
| |
OTHER ASSETS IN EXCESS OF LIABILITIES – 1.2% | | 2,582,375 |
| |
| NET ASSETS – 100.0% | | $209,794,316 |
| |
| | |
| The percentage shown for each investment category reflects the value of investments in that category as a percentage of net assets. |
| (a) | | Prerefunded security. Maturity date disclosed is prerefunding date. |
| (b) | | Repurchase agreement was entered into on April 30, 2009. This agreement was fully collateralized by $9,895,000 U.S. Treasury Notes, 3.125% due 09/30/13 with a market value of $10,447,141. |
| Security ratings disclosed are issued by Standard & Poor’s Ratings Services/Moody’s Investors Service. A description of the ratings is available in the Fund’s Statement of Additional Information. |
| |
| | |
| 34 | | The accompanying notes are an integral part of these financial statements. |
COMMERCE MISSOURI TAX-FREE INTERMEDIATE BOND FUND
| | |
|
| |
| Investment Abbreviations: |
| AMBAC | | —Insured by American Municipal Bond Assurance Corp. |
| AMBAC-TCRS | | —Insured by American Municipal Bond Assurance Corp. - Transferable Custodial Receipts |
| AMT | | —Alternative Minimum Tax |
| ETM | | —Escrow to Maturity |
| FGIC | | —Insured by Financial Guaranty Insurance Co. |
| FHA | | —Insured by Federal Housing Administration |
| FNMA | | —Insured by Federal National Mortgage Association |
| FSA | | —Insured by Financial Security Assurance Co. |
| GNMA | | —Insured by Government National Mortgage Association |
| GO | | —General Obligation |
| MBIA | | —Insured by Municipal Bond Investors Assurance |
| NR | | —Not Rated |
| RR | | —Revenue Refunding |
| Radian | | —Insured by Radian Asset Assurance |
| XLCA | | —Insured by XL Capital Assurance, Inc. |
| |
PORTFOLIO COMPOSITION
| | | | | | |
| Sector Allocation | | AS OF
4/30/09 | | | AS OF
10/31/08 | |
| | |
General Obligations | | 27.7 | % | | 29.7 | % |
Lease | | 16.1 | | | 17.0 | |
Hospital | | 10.9 | | | 11.6 | |
Water/Sewer | | 8.2 | | | 12.0 | |
General | | 7.7 | | | 6.1 | |
Prerefunded/Escrow to Maturity | | 6.8 | | | 7.5 | |
Education | | 5.7 | | | 6.3 | |
Transportation | | 4.0 | | | 2.5 | |
Crossover | | 2.9 | | | 4.1 | |
Single Family Housing | | 1.9 | | | 1.0 | |
Power | | 0.9 | | | 1.0 | |
Student | | 0.7 | | | 1.3 | |
Multi-Family Housing | | 0.4 | | | 0.4 | |
Short-Term Obligation | | 4.9 | | | 1.2 | |
| | |
| TOTAL INVESTMENTS | | 98.8 | % | | 101.7 | % |
| | |
The percentage shown for each Sector Allocation reflects the value of investments in that category as a percentage of net assets.
The Fund is actively managed and, as such, its composition may differ over time.
| | |
| The accompanying notes are an integral part of these financial statements. | | 35 |
COMMERCE KANSAS TAX-FREE INTERMEDIATE BOND FUND
Kansas Tax-Free Intermediate Bond Fund
Performance Information(1) (Unaudited)
For the six months ended April 30, 2009, the Fund had a total return of 7.70%, based on its Net Asset Value (NAV). This compares to the Barclays Capital 3-15 Year Blend Index(2) six-month return of 8.01%. Past performance is no guarantee of future results.
Schedule of Investments
April 30, 2009 (Unaudited)
| | | | | | | |
Principal
Amount | | Interest
Rate | | | Maturity
Date | | Value |
| Municipal Bond Obligations – 95.2% |
Colorado – 0.6% |
| Mesa State College CO Auxiliary Facilities Enterprise Revenue Bonds (AA-/Aa3) |
| $ 400,000 | | 5.700 | % | | 05/15/26 | | $ 435,156 |
| |
Florida – 0.7% |
| Miami-Dade County FL GO Bonds (Building Better Communities Program) Series B (AA-/Aa3) |
| 500,000 | | 6.250 | | | 07/01/26 | | 548,895 |
| |
Illinois – 1.4% |
| Lake County IL School District No. 79-Fremont Series B (FSA) (NR/Aa3) |
| 1,000,000 | | 5.000 | | | 12/01/22 | | 1,074,210 |
| |
Indiana – 1.7% |
| North West Hendricks Multi School Building Corp. Industry (First Mortgage) Series A (AAA/Aa3) |
| 1,300,000 | | 5.000 | | | 01/15/31 | | 1,246,739 |
| |
Iowa – 1.4% |
| Iowa Finance Authority Single Family Mortgage Revenue Bonds Series E (GNMA/FNMA) (Go of Auth) (AAA/Aaa) |
| 350,000 | | 3.700 | | | 01/01/14 | | 355,170 |
| 700,000 | | 5.000 | | | 07/01/23 | | 714,252 |
| | | | | | | |
| | | | | | | 1,069,422 |
| |
Kansas – 85.3% |
| Augusta KS Electric Systems Revenue Bonds (AMBAC) (A/NR) |
| 1,000,000 | | 4.750 | | | 08/01/17 | | 1,049,170 |
| Chisholm Creek Utility Authority KS Water and Wastewater Facilities Revenue Bonds (Refunding) (AMBAC) (A/NR) |
| 1,000,000 | | 5.250 | | | 09/01/24 | | 1,123,740 |
| Derby KS GO Bonds (Refunding) Series B (AMBAC) (NR/A2) |
| 440,000 | | 5.000 | | | 12/01/13 | | 468,591 |
| Derby KS GO Bonds Series A (AMBAC) (NR/A2)(a) |
| 310,000 | | 4.900 | | | 12/01/11 | | 340,789 |
| Dodge City KS Unified School District No. 443 GO Bonds (Refunding) (FGIC) (NR/Baa1) |
| 1,450,000 | | 5.000 | | | 03/01/12 | | 1,514,249 |
| Douglas County KS GO Bonds (Refunding Sales Tax) Series A (AMBAC) (NR/Aa3) |
| 1,000,000 | | 5.000 | | | 08/01/12 | | 1,110,900 |
| |
| | | | | | | |
Principal
Amount | | Interest
Rate | | | Maturity
Date | | Value |
| Municipal Bond Obligations – (continued) |
Kansas – (continued) |
| Harvey County KS School District No. 373 GO Bonds (Refunding & Improvement) (FSA) (AAA/Aa3) |
| $ 495,000 | | 5.000 | % | | 09/01/15 | | $ 551,608 |
| Johnson County KS Community College Certificate of Participation (Improvement) (NR/Aaa) |
| 765,000 | | 4.000 | | | 04/01/13 | | 810,196 |
| Johnson County KS GO Bonds (Internal Improvement) Series A (AAA/Aaa) |
| 1,000,000 | | 5.000 | | | 09/01/21 | | 1,054,000 |
| Johnson County KS Unified School District No. 231 GO Bonds (Refunding & Improvement) Series A (FGIC) (AA-/NR) |
| 500,000 | | 6.000 | | | 10/01/16 | | 586,960 |
| 1,770,000 | | 5.000 | | | 10/01/18 | | 1,855,208 |
| Johnson County KS Unified School District No. 231 GO Bonds (Refunding & Improvement) Series A (FSA) (AAA/Aa3) |
| 375,000 | | 5.125 | | | 04/01/11(a) | | 404,640 |
| 625,000 | | 5.125 | | | 10/01/16 | | 656,288 |
| Johnson County KS Unified School District No. 231 GO Bonds (Refunding & Improvement) Series B (AMBAC) (A/NR) |
| 925,000 | | 5.000 | | | 10/01/22 | | 975,856 |
| 975,000 | | 5.000 | | | 10/01/23 | | 1,019,743 |
| Johnson County KS Unified School District No. 233 GO Bonds (Refunding) Series B (FGIC) (AA-/Aa3) |
| 500,000 | | 5.500 | | | 09/01/17 | | 600,815 |
| Johnson County KS Water District No. 001 Revenue Bonds (Refunding) (ADFA) (GTD) (AAA/Aaa) |
| 275,000 | | 5.000 | | | 12/01/19 | | 289,867 |
| Junction City KS GO Notes Series B (NR/NR) |
| 1,000,000 | | 4.000 | | | 06/01/09 | | 1,000,930 |
| Kansas State Department of Transportation Highway Revenue Bonds (Refunding) (AMBAC-TCRS-BNY) (AAA/Aa2) |
| 290,000 | | 5.500 | | | 09/01/10 | | 308,125 |
| Kansas State Department of Transportation Highway Revenue Bonds (Refunding) (ETM) (AAA/Aa2) |
| 300,000 | | 5.500 | | | 09/01/12 | | 341,043 |
| Kansas State Department of Transportation Highway Revenue Bonds Series A (AAA/Aa2)(a) |
| 340,000 | | 5.000 | | | 09/01/10 | | 359,067 |
| |
| (1) | | Returns assume expense reimbursements and are not annualized. Returns do not reflect the deduction of taxes that a shareholder would pay on Fund distributions or the redemption of Fund shares. |
| (2) | | The Barclays Capital 3-15 Year Blend Index is an unmanaged index composed of investment grade municipal securities ranging from 2 to 17 years in maturity. The Index figure does not reflect the deduction of any fees, expenses or taxes. |
| | |
| 36 | | The accompanying notes are an integral part of these financial statements. |
COMMERCE KANSAS TAX-FREE INTERMEDIATE BOND FUND
| | | | | | | |
Principal
Amount | | Interest
Rate | | | Maturity
Date | | Value |
| Municipal Bond Obligations – (continued) |
Kansas – (continued) |
| Kansas State Development Finance Authority Health Facilities Revenue Bonds Series 2005 (Hays Medical Center) (MBIA) (NR/A2)(b) |
| $1,960,000 | | 3.750 | % | | 05/15/26 | | $ 1,983,540 |
| Kansas State Development Finance Authority Lease Revenue Bonds (Juvenile Justice Authority) Series D (MBIA) (AA/Baa1) |
| 1,270,000 | | 5.250 | | | 05/01/13 | | 1,355,738 |
| Kansas State Development Finance Authority Lease Revenue Bonds (State Capitol Project V-I-A) (FSA) (AAA/Aa3)(a) |
| 500,000 | | 5.000 | | | 10/01/10 | | 529,800 |
| Kansas State Development Finance Authority Revenue Bonds (Athletic Facilities) Series C (A/A1) |
| 1,375,000 | | 4.750 | | | 06/01/25 | | 1,377,104 |
| Kansas State Development Finance Authority Revenue Bonds (Athletic Facilities) Series R (A/NR) |
| 350,000 | | 5.000 | | | 07/01/14 | | 350,105 |
| Kansas State Development Finance Authority Revenue Bonds (Board of Regents University Housing) Series A (MBIA) (AA-/A1) |
| 1,150,000 | | 5.000 | | | 04/01/24 | | 1,177,082 |
| Kansas State Development Finance Authority Revenue Bonds (El Dorado Department of Corrections Refunding Project A1) (MBIA) (AA/Baa1) |
| 200,000 | | 5.000 | | | 08/01/10 | | 201,468 |
| 400,000 | | 5.000 | | | 02/01/12 | | 403,052 |
| Kansas State Development Finance Authority Revenue Bonds (Juvenile Justice Authority) Series D (MBIA) (AA/Baa1) |
| 400,000 | | 5.000 | | | 05/01/12 | | 426,276 |
| Kansas State Development Finance Authority Revenue Bonds (Kansas State Projects) Series J (AMBAC) (AA/NR)(a) |
| 450,000 | | 5.000 | | | 08/01/13 | | 513,050 |
| Kansas State Development Finance Authority Revenue Bonds (Kansas State Projects) Series J (Unrefunded Balance) (AMBAC) (AA/NR) |
| 1,600,000 | | 5.000 | | | 08/01/17 | | 1,723,776 |
| Kansas State Development Finance Authority Revenue Bonds (Kansas State Projects) Series K (MBIA) (AA/Aa2) |
| 1,000,000 | | 5.250 | | | 11/01/22 | | 1,098,280 |
| Kansas State Development Finance Authority Revenue Bonds (Kansas State Projects) Series W (ETM) (MBIA) (AA/NR) |
| 20,000 | | 4.000 | | | 10/01/11 | | 21,383 |
| Kansas State Development Finance Authority Revenue Bonds (Public Water Supply Revolving Loan-2) (AMBAC) (AAA/Aaa)(a) |
| 705,000 | | 5.500 | | | 04/01/12 | | 789,579 |
| Kansas State Development Finance Authority Revenue Bonds (Public Water Supply Revolving Loan-DW) (AAA/Aaa) |
| 1,500,000 | | 6.000 | | | 04/01/27 | | 1,595,700 |
| Kansas State Development Finance Authority Revenue Bonds (Refunding-Wichita State University Housing System-P) (AMBAC) (A+/NR) |
| 600,000 | | 5.000 | | | 06/01/13 | | 652,806 |
| 630,000 | | 5.000 | | | 06/01/14 | | 678,220 |
| 300,000 | | 5.000 | | | 06/01/16 | | 318,747 |
| |
| | | | | | | |
Principal
Amount | | Interest
Rate | | | Maturity
Date | | Value |
| Municipal Bond Obligations – (continued) |
Kansas – (continued) |
| Kansas State Development Finance Authority Revenue Bonds (Transportation Revolving Fund Trust) (AA+/Aa1) |
| $1,105,000 | | 5.000 | % | | 10/01/21 | | $ 1,196,041 |
Kansas State Development Finance Authority Revenue Bonds (University of Kansas Athletic Facilities Refunding)
Series K (A/A1) |
| 1,015,000 | | 5.000 | | | 06/01/17 | | 1,094,464 |
| Kansas State Development Finance Authority Revenue Bonds (Water Pollution Control Revolving Fund II) (AAA/Aaa) |
| 280,000 | | 5.500 | | | 05/01/17 | | 338,909 |
| Lawrence KS Hospital Revenue Bonds (Refunding Lawrence Memorial Hospital) (NR/A3) |
| 550,000 | | 5.250 | | | 07/01/10 | | 559,840 |
| 1,000,000 | | 5.375 | | | 07/01/14 | | 1,033,910 |
| 455,000 | | 5.375 | | | 07/01/15 | | 467,826 |
| Leavenworth County KS Unified School District No. 464 Tonganoxie GO Bonds (Improvement) Series A (MBIA) (AA-/Baa1) |
| 150,000 | | 5.000 | | | 09/01/20 | | 161,597 |
| Leaveworth County KS Unified School District No. 458 GO Bonds (Refunding & Improvement) Series A (NR/A2) |
| 1,100,000 | | 5.250 | | | 09/01/27 | | 1,162,788 |
| 315,000 | | 5.250 | | | 09/01/29 | | 329,021 |
| Miami County Unified School District No. 416 Louisburg, KS GO Bonds (Refunding and Improvement) (MBIA) (AA-/Baa1) |
| 1,650,000 | | 5.000 | | | 09/01/17 | | 1,832,193 |
| Olathe KS Health Facilities Revenue Bonds (Medical Center Project) Series 2008 (A+/NR) |
| 1,195,000 | | 5.125 | | | 09/01/21 | | 1,191,128 |
| Olathe KS Health Facilities Revenue Bonds (Medical Center Project) Series A (AMBAC) (A+/NR) |
| 500,000 | | 5.500 | | | 09/01/10 | | 523,580 |
| Overland Park KS GO Bonds (Refunding for Internal Improvement) Series B (AAA/Aaa) |
| 995,000 | | 4.000 | | | 09/01/17 | | 1,079,694 |
Parsons KS Certificates of Participation (Taxable) Series B (AAA/NR) |
| 300,000 | | 5.700 | | | 10/01/17 | | 305,379 |
| Pittsburg KS GO Bonds (Refunding) (FSA) (NR/Aa3) |
| 600,000 | | 5.500 | | | 09/01/11 | | 652,542 |
| Reno County KS Unified School District No. 308 Hutchinson GO Bonds Series A (MBIA) (NR/A2) |
| 500,000 | | 4.500 | | | 09/01/22 | | 504,120 |
| Saline County KS Unified School District No. 305 Salina GO Bonds (FSA) (NR/Aa3) |
| 230,000 | | 5.500 | | | 09/01/16 | | 247,954 |
| Saline County KS Unified School District No. 305 Salina GO Bonds (Unrefunded Balance) (FSA) (NR/Aa3) |
| 70,000 | | 5.500 | | | 09/01/16 | | 74,690 |
| Scott County KS Unified School District No. 466 GO Bonds (Refunding) (FGIC) (AA-/NR) |
| 680,000 | | 5.250 | | | 09/01/14 | | 736,970 |
| |
| | |
| The accompanying notes are an integral part of these financial statements. | | 37 |
COMMERCE KANSAS TAX-FREE INTERMEDIATE BOND FUND
Schedule of Investments (continued)
April 30, 2009 (Unaudited)
| | | | | | | |
Principal
Amount | | Interest
Rate | | | Maturity
Date | | Value |
| Municipal Bond Obligations – (continued) |
Kansas – (continued) |
| Scott County KS Unified School District No. 466 GO Bonds (Refunding) (FGIC) (NR/NR)(a) |
| $ 670,000 | | 5.250 | % | | 09/01/12 | | $ 752,738 |
| Sedgwick & Shawnee County KS Single Family Revenue Bonds (Mortgage Backed Securities Program) Series A-2 (AMT) (GNMA) (NR/Aaa) |
| 55,000 | | 5.800 | | | 06/01/17 | | 55,440 |
| Sedgwick County KS GO Bonds Series A (AA+/Aa1) |
| 205,000 | | 4.150 | | | 08/01/10 | | 213,499 |
| Sedgwick County KS Public Building Commission Revenue Bonds (Technical Education Complex Project) Series 2008-1 (AAA/Aa1) |
| 1,000,000 | | 5.250 | | | 08/01/26 | | 1,080,450 |
| Sedgwick County KS Unified School District No. 265 GO Bonds (FGIC) (NR/A2) |
| 500,000 | | 5.500 | | | 10/01/09 | | 508,440 |
| Sedgwick County Unified School District No. 261 (Refunding & School Improvement) (FSA) (AAA/NR) |
| 1,500,000 | | 5.000 | | | 11/01/32 | | 1,515,495 |
| Shawnee County KS GO Bonds (Refunding & Improvement) Series A (NR/Aa3) |
| 250,000 | | 5.250 | | | 09/01/09 | | 253,628 |
| Shawnee County KS Unified School District No. 501 GO Bonds (NR/Aa3)(a) |
| 500,000 | | 5.000 | | | 02/01/12 | | 549,895 |
| Topeka KS GO Bonds Series A (XLCA) (NR/Aa3) |
| 100,000 | | 4.000 | | | 08/15/16 | | 102,381 |
| Topeka KS Public Building Commission Revenue Bonds (Refunding 10th & Jackson Project) Series A (MBIA) (AA/Baa1) |
| 535,000 | | 5.000 | | | 06/01/16 | | 618,947 |
| 1,000,000 | | 5.000 | | | 06/01/23 | | 1,082,200 |
| Topeka KS Public Building Commission Revenue Bonds (Refunding Department of Social and Rehabilitation Project) Series B (MBIA) (AA/Baa1) |
| 300,000 | | 5.000 | | | 06/01/23 | | 324,660 |
| 475,000 | | 5.000 | | | 06/01/24 | | 508,792 |
University of Kansas Hospital Authority Health Facilities Revenue Bonds (Kansas University Health System) (ETM)
(Go of Auth) (AAA/NR) |
| 200,000 | | 5.500 | | | 09/01/11 | | 218,764 |
| 1,000,000 | | 6.000 | | | 09/01/12(a) | | 1,138,990 |
| Wichita KS GO Bonds (Sales Tax) (AA+/Aa2) |
| 1,000,000 | | 5.000 | | | 04/01/14 | | 1,011,270 |
| Wichita KS GO Bonds Series 766 (AA+/Aa2) |
| 455,000 | | 4.300 | | | 09/01/10 | | 460,041 |
| Wichita KS Hospital Revenue Bonds (Refunding Facilities Improvement) Series XI (A+/NR) |
| 1,500,000 | | 6.750 | | | 11/15/14 | | 1,534,560 |
| Wichita KS Water & Sewer Utility Revenue Bonds Series 2003 (FGIC) (AA-/A1) |
| 1,000,000 | | 5.000 | | | 10/01/19 | | 1,046,160 |
| |
| | | | | | | |
Principal
Amount | | Interest
Rate | | | Maturity
Date | | Value |
| Municipal Bond Obligations – (continued) |
Kansas – (continued) |
| Wyandotte County KS Revenue Bonds (Refunding & Improvement) (MBIA) (AA-/A2) |
| $ 600,000 | | 4.400 | % | | 09/01/11 | | $ 605,862 |
| Wyandotte County KS School District No. 204 GO Bonds Bonner Springs (Prerefunded) Series 2000 A (ETM) (FSA) (NR/Aa3) |
| 215,000 | | 6.375 | | | 09/01/11 | | 241,299 |
| Wyandotte County KS School District No. 204 GO Bonds Bonner Springs (Refunding & Improvement) Series A (FGIC) (NR/A3) |
| 1,595,000 | | 5.000 | | | 09/01/21 | | 1,664,207 |
| Wyandotte County KS School District No. 204 GO Bonds Bonner Springs (Unrefunded Balance) Series 2000 A (FSA) (NR/Aa3) |
| 85,000 | | 6.375 | | | 09/01/11 | | 93,721 |
| Wyandotte County KS Unified Government GO Bonds (Refunding) Series A (FSA) (AAA/Aa3) |
| 1,000,000 | | 5.000 | | | 09/01/11 | | 1,075,040 |
| Wyandotte County KS Unified School District No. 500 GO Bonds (Refunding) (FSA) (AAA/Aa3) |
| 160,000 | | 5.000 | | | 09/01/12 | | 176,598 |
| 625,000 | | 5.250 | | | 09/01/16 | | 723,919 |
| 1,000,000 | | 5.250 | | | 09/01/20 | | 1,149,260 |
| | | | | | | |
| | | | | | | 63,816,393 |
| |
Oregon – 0.7% |
Salem OR Hospital Facility Authority Revenue Bonds
Series A (A+/NR) |
| 500,000 | | 5.250 | | | 08/15/18 | | 511,385 |
| |
Puerto Rico – 3.4% |
| Puerto Rico Commonwealth GO Bonds (Refunding & Public Improvement) Series A (MBIA) (AA-/Baa1) |
| 475,000 | | 5.500 | | | 07/01/16 | | 475,798 |
| Puerto Rico Commonwealth Highway & Transportation Authority Highway Revenue Bonds (Refunding) Series X (FSA) (AAA/Aa3) |
| 425,000 | | 5.500 | | | 07/01/15 | | 442,965 |
| Puerto Rico Commonwealth Highway & Transportation Authority Highway Revenue Bonds Series Y (BBB+/Baa2) |
| 500,000 | | 6.250 | | | 07/01/13 | | 522,580 |
| Puerto Rico Commonwealth Highway & Transportation Authority Revenue Bonds (Prerefunded) Series G (FGIC) (BBB/Aaa)(a) |
| 655,000 | | 5.250 | | | 07/01/13 | | 751,586 |
| Puerto Rico Commonwealth Highway & Transportation Authority Revenue Bonds (Unrefunded Balance) Series G (FGIC) (BBB/Baa3) |
| 345,000 | | 5.250 | | | 07/01/21 | | 321,343 |
| | | | | | | |
| | | | | | | 2,514,272 |
| |
| TOTAL MUNICIPAL BOND OBLIGATIONS |
(Cost $69,115,602) | | | | | $71,216,472 |
| |
| | | | | | | |
| | |
| 38 | | The accompanying notes are an integral part of these financial statements. |
COMMERCE KANSAS TAX-FREE INTERMEDIATE BOND FUND
| | | | | | | |
Principal
Amount | | Interest
Rate | | | Maturity
Date | | Value |
| Repurchase Agreement(c) – 3.8% |
| State Street Bank & Trust Co. |
| $2,851,000 | | 0.010 | % | | 05/01/09 | | $ 2,851,000 |
Maturity Value: $2,851,001 | | |
(Cost $2,851,000) | | | | | |
| |
| TOTAL INVESTMENTS – 99.0% |
(Cost $71,966,602) | | | | | $74,067,472 |
| |
OTHER ASSETS IN EXCESS OF LIABILITIES – 1.0% | | 747,575 |
| |
| NET ASSETS – 100.0% | | $74,815,047 |
| |
| | |
| The percentage shown for each investment category reflects the value of investments in that category as a percentage of net assets. |
| (a) | | Prerefunded security. Maturity date disclosed is prerefunding date. |
| (b) | | Variable rate security. Interest rate disclosed is that which is in effect at April 30, 2009. |
| (c) | | Repurchase agreement was entered into on April 30, 2009. This agreement was fully collateralized by $2,755,000 U.S. Treasury Notes, 3.125%, due 09/30/13 with a market value of $2,908,729. |
| Security ratings disclosed are issued by Standard & Poor’s Ratings Services/Moody’s Investors Service. A description of the ratings is available in the Fund’s Statement of Additional Information. |
| |
| | |
|
| |
| Investment Abbreviations: |
| ADFA | | —Arkansas Development Finance Authority |
| AMBAC | | —Insured by American Municipal Bond Assurance Corp. |
| AMBAC-TCRS | | —Insured by American Municipal Bond Assurance Corp. – Transferable Custodial Receipts |
| AMT | | —Alternative Minimum Tax |
| BNY | | —Insured by Bank of New York Mellon Corp. |
| ETM | | —Escrow to Maturity |
| FGIC | | —Insured by Financial Guaranty Insurance Co. |
| FNMA | | —Insured by Federal National Mortgage Association |
| FSA | | —Insured by Financial Security Assurance Co. |
| GNMA | | —Insured by Government National Mortgage Association |
| GO | | —General Obligation |
| GTD | | —Guaranteed |
| MBIA | | —Insured by Municipal Bond Investors Assurance |
| NR | | —Not Rated |
| XLCA | | —Insured by XL Capital Assurance, Inc. |
| |
PORTFOLIO COMPOSITION
| | | | | | |
| Sector Allocation | | AS OF
4/30/09 | | | AS OF
10/31/08 | |
| | |
General Obligations | | 44.2 | % | | 45.3 | % |
Hospital | | 10.6 | | | 11.1 | |
Lease | | 10.4 | | | 10.5 | |
Prerefunded/Escrow to Maturity | | 9.4 | | | 12.9 | |
Education | | 6.7 | | | 6.7 | |
Water/Sewer | | 4.4 | | | 2.9 | |
Transportation | | 3.8 | | | 3.7 | |
Power | | 2.2 | | | 2.4 | |
General | | 1.7 | | | 1.7 | |
Single Family Housing | | 1.5 | | | 1.5 | |
Crossover | | 0.3 | | | 0.4 | |
Short-Term Obligation | | 3.8 | | | 0.0 | |
| | |
| TOTAL INVESTMENTS | | 99.0 | % | | 99.1 | % |
| | |
The percentage shown for each Sector Allocation reflects the value of investments in that category as a percentage of net assets.
The Fund is actively managed and, as such, its composition may differ over time.
| | |
| The accompanying notes are an integral part of these financial statements. | | 39 |
COMMERCE FUNDS
Statements of Assets and Liabilities
April 30, 2009 (Unaudited)
| | | | | | | | | | | | |
| | | Growth Fund | | | Value Fund | | |
MidCap
Growth Fund | |
Assets: | | | | | | | | | | | | |
Investments in securities, at value (identified cost $123,358,964, $82,466,535, $53,450,813, $529,605,768, $78,420,772, $157,838,847, $201,776,865 and $71,966,602, respectively) | | $ | 102,277,952 | | | $ | 62,929,116 | | | $ | 43,079,048 | |
Cash | | | 177 | | | | 398 | | | | 451 | |
Receivables: | | | | | | | | | | | | |
Interest and dividends | | | 59,235 | | | | 122,926 | | | | 19,912 | |
Fund shares sold | | | 80,055 | | | | 48,955 | | | | 85,006 | |
Investment securities sold | | | — | | | | — | | | | — | |
Reimbursement from adviser | | | 7,157 | | | | 2,787 | | | | — | |
Other assets | | | 15,505 | | | | 10,135 | | | | 4,964 | |
Total Assets | | | 102,440,081 | | | | 63,114,317 | | | | 43,189,381 | |
| | | |
| | | | | | | | | | | | |
Liabilities: | | | | | | | | | | | | |
Payables: | | | | | | | | | | | | |
Investment securities purchased | | | — | | | | — | | | | — | |
Fund shares redeemed | | | 1,638,218 | | | | 30,226 | | | | 278,059 | |
Dividends | | | — | | | | — | | | | — | |
Advisory fees | | | 61,574 | | | | 37,958 | | | | 25,398 | |
Deferred trustee fees | | | 36,972 | | | | 23,501 | | | | 16,537 | |
Administrative fees | | | 12,315 | | | | 7,591 | | | | 5,080 | |
Accrued expenses | | | 46,035 | | | | 47,753 | | | | 45,276 | |
Total Liabilities | | | 1,795,114 | | | | 147,029 | | | | 370,350 | |
| | | |
| | | | | | | | | | | | |
Net Assets: | | | | | | | | | | | | |
Paid-in capital | | | 135,421,941 | | | | 97,916,469 | | | | 55,468,230 | |
Accumulated undistributed (distributions in excess of) net investment income | | | 351,199 | | | | 90,308 | | | | 46,291 | |
Accumulated net realized gain (loss) from investment transactions | | | (14,047,161 | ) | | | (15,502,070 | ) | | | (2,323,725 | ) |
Net unrealized gain (loss) on investments | | | (21,081,012 | ) | | | (19,537,419 | ) | | | (10,371,765 | ) |
Net Assets | | $ | 100,644,967 | | | $ | 62,967,288 | | | $ | 42,819,031 | |
| | | |
| | | | | | | | | | | | |
Shares Outstanding/Net Asset Value: | | | | | | | | | | | | |
Total shares outstanding, no par value (unlimited number of shares authorized): | | | 5,597,002 | | | | 4,492,172 | | | | 2,080,720 | |
Net asset value (net assets/shares outstanding) | | $ | 17.98 | | | $ | 14.02 | | | $ | 20.58 | |
| | |
| 40 | | The accompanying notes are an integral part of these financial statements. |
COMMERCE FUNDS
| | | | | | | | | | | | | | | | | |
| Bond Fund | | | Short-Term
Government
Fund | | | National
Tax-Free
Intermediate
Bond Fund | | Missouri
Tax-Free
Intermediate
Bond Fund | | | Kansas
Tax-Free
Intermediate
Bond Fund | |
| | | | | | | | | | | | | | | | | |
| | | | |
| $ | 520,592,923 | | | $ | 79,720,078 | | | $ | 160,054,400 | | $ | 207,211,941 | | | $ | 74,067,472 | |
| | 931 | | | | — | | | | — | | | 968 | | | | 217 | |
| | | | | | | | | | | | | | | | | |
| | 5,006,939 | | | | 660,885 | | | | 2,265,036 | | | 2,600,152 | | | | 869,711 | |
| | 1,156,597 | | | | 57,142 | | | | 281,381 | | | 2,236,529 | | | | 155,000 | |
| | 2,682,155 | | | | — | | | | — | | | — | | | | — | |
| | — | | | | 11,163 | | | | 10,821 | | | 15,010 | | | | 7,180 | |
| | 52,351 | | | | — | | | | 13,932 | | | 18,070 | | | | 8,149 | |
| | 529,491,896 | | | | 80,449,268 | | | | 162,625,570 | | | 212,082,670 | | | | 75,107,729 | |
| | | | |
| | | | | | | | | | | | | | | | | |
| | | | | | | | | | | | | | | | | |
| | | | | | | | | | | | | | | | | |
| | 2,772,264 | | | | 136,516 | | | | 2,503,712 | | | 1,499,724 | | | | — | |
| | 796,421 | | | | 671,649 | | | | 240,400 | | | 49,918 | | | | — | |
| | 2,027,813 | | | | 181,634 | | | | 491,166 | | | 558,869 | | | | 200,471 | |
| | 214,967 | | | | 32,426 | | | | 65,565 | | | 84,302 | | | | 30,486 | |
| | 107,417 | | | | 34,261 | | | | 30,927 | | | 31,447 | | | | 12,866 | |
| | 64,490 | | | | 9,728 | | | | 19,670 | | | 25,290 | | | | 9,146 | |
| | 78,434 | | | | 42,078 | | | | 31,075 | | | 38,804 | | | | 39,713 | |
| | 6,061,806 | | | | 1,108,292 | | | | 3,382,515 | | | 2,288,354 | | | | 292,682 | |
| | | | |
| | | | | | | | | | | | | | | | | |
| | | | | | | | | | | | | | | | | |
| | 548,002,868 | | | | 92,037,560 | | | | 156,660,223 | | | 204,178,857 | | | | 72,549,616 | |
| | (2,917,118 | ) | | | (1,093,012 | ) | | | 85,581 | | | (86,264 | ) | | | (64,882 | ) |
| | (12,642,815 | ) | | | (12,902,878 | ) | | | 281,698 | | | 266,647 | | | | 229,443 | |
| | (9,012,845 | ) | | | 1,299,306 | | | | 2,215,553 | | | 5,435,076 | | | | 2,100,870 | |
| $ | 523,430,090 | | | $ | 79,340,976 | | | $ | 159,243,055 | | $ | 209,794,316 | | | $ | 74,815,047 | |
| | | | |
| | | | | | | | | | | | | | | | | |
| | | | | | | | | | | | | | | | | |
| | 28,985,286 | | | | 4,439,947 | | | | 8,517,607 | | | 10,915,003 | | | | 3,957,520 | |
| $ | 18.06 | | | $ | 17.87 | | | $ | 18.70 | | $ | 19.22 | | | $ | 18.90 | |
| | |
| The accompanying notes are an integral part of these financial statements. | | 41 |
COMMERCE FUNDS
Statements of Operations
For the Six Months Ended April 30, 2009 (Unaudited)
| | | | | | | | | | | | |
| | | Growth Fund | | | Value Fund | | | MidCap Growth Fund | |
Investment Income: | | | | | | | | | | | | |
Interest | | $ | — | | | $ | — | | | $ | — | |
Dividends | | | 912,592 | | | | 1,119,040 | | | | 306,063 | |
Total Investment Income | | | 912,592 | | | | 1,119,040 | | | | 306,063 | |
| | | |
| | | | | | | | | | | | |
Expenses: | | | | | | | | | | | | |
Advisory fees | | | 363,857 | | | | 219,897 | | | | 138,532 | |
Administration fees | | | 72,771 | | | | 43,979 | | | | 27,706 | |
Transfer Agent fees | | | 38,876 | | | | 21,430 | | | | 23,307 | |
Shareowner servicing fees | | | 38,811 | | | | 20,524 | | | | 12,930 | |
Custody and accounting fees | | | 22,969 | | | | 30,662 | | | | 23,799 | |
Professional fees | | | 20,058 | | | | 6,127 | | | | 5,249 | |
Registration fees | | | 15,110 | | | | 5,161 | | | | 10,548 | |
Printing fees | | | 5,603 | | | | 2,172 | | | | 2,200 | |
Trustee fees | | | 2,420 | | | | 1,470 | | | | 1,108 | |
Other | | | 8,338 | | | | 6,256 | | | | 4,466 | |
Total Expenses | | | 588,813 | | | | 357,678 | | | | 249,845 | |
Less — expense reimbursements | | | (40,609 | ) | | | (5,880 | ) | | | — | |
Net Expenses | | | 548,204 | | | | 351,798 | | | | 249,845 | |
| NET INVESTMENT INCOME | | | 364,388 | | | | 767,242 | | | | 56,218 | |
| | | |
| | | | | | | | | | | | |
Realized and unrealized gain (loss) from investment transactions: | | | | | | | | | | | | |
Net realized gain (loss) from investment transactions | | | (9,564,140 | ) | | | (10,097,201 | ) | | | (2,195,365 | ) |
Net change in unrealized gain on investments | | | 6,104,169 | | | | 561,205 | | | | 3,130,064 | |
Net realized and unrealized gain (loss) from investment transactions | | | (3,459,971 | ) | | | (9,535,996 | ) | | | 934,699 | |
| NET INCREASE (DECREASE) IN NET ASSETS RESULTING FROM OPERATIONS | | $ | (3,095,583 | ) | | $ | (8,768,754 | ) | | $ | 990,917 | |
| | |
| 42 | | The accompanying notes are an integral part of these financial statements. |
COMMERCE FUNDS
| | | | | | | | | | | | | | | | | |
| Bond Fund | | Short-Term
Government Fund | | | National Tax-Free
Intermediate Bond Fund | | | Missouri Tax-Free
Intermediate Bond Fund | | | Kansas Tax-Free
Intermediate Bond Fund | |
| | | | | | | | | | | | | | | | | |
| $ | 14,957,919 | | $ | 1,509,683 | | | $ | 3,444,031 | | | $ | 3,981,980 | | | $ | 1,508,342 | |
| | 145,914 | | | — | | | | — | | | | — | | | | — | |
| | 15,103,833 | | | 1,509,683 | | | | 3,444,031 | | | | 3,981,980 | | | | 1,508,342 | |
| | | | |
| | | | | | | | | | | | | | | | | |
| | | | | | | | | | | | | | | | | |
| | 1,274,179 | | | 195,236 | | | | 372,300 | | | | 457,095 | | | | 177,447 | |
| | 382,254 | | | 58,571 | | | | 111,690 | | | | 137,129 | | | | 53,234 | |
| | 48,669 | | | 19,249 | | | | 18,707 | | | | 22,492 | | | | 19,062 | |
| | 152,901 | | | 23,428 | | | | 37,230 | | | | 45,709 | | | | 17,745 | |
| | 52,402 | | | 27,445 | | | | 24,249 | | | | 23,846 | | | | 20,845 | |
| | 43,696 | | | 10,395 | | | | 12,819 | | | | 18,201 | | | | 12,503 | |
| | 22,002 | | | 13,333 | | | | 5,448 | | | | 6,154 | | | | 18,719 | |
| | 24,695 | | | 4,247 | | | | 7,237 | | | | 9,301 | | | | 4,054 | |
| | 3,846 | | | 600 | | | | 1,134 | | | | 1,417 | | | | 516 | |
| | 32,002 | | | 10,223 | | | | 10,366 | | | | 11,355 | | | | 5,282 | |
| | 2,036,646 | | | 362,727 | | | | 601,180 | | | | 732,699 | | | | 329,407 | |
| | — | | | (97,223 | ) | | | (79,996 | ) | | | (92,769 | ) | | | (80,987 | ) |
| | 2,036,646 | | | 265,504 | | | | 521,184 | | | | 639,930 | | | | 248,420 | |
| | 13,067,187 | | | 1,244,179 | | | | 2,922,847 | | | | 3,342,050 | | | | 1,259,922 | |
| | | | |
| | | | | | | | | | | | | | | | | |
| | | | | | | | | | | | | | | | | |
| | 2,968,386 | | | 354,478 | | | | 281,661 | | | | 266,568 | | | | 229,285 | |
| | 19,502,343 | | | 1,708,209 | | | | 8,180,219 | | | | 9,016,770 | | | | 3,745,452 | |
| | 22,470,729 | | | 2,062,687 | | | | 8,461,880 | | | | 9,283,338 | | | | 3,974,737 | |
| $ | 35,537,916 | | $ | 3,306,866 | | | $ | 11,384,727 | | | $ | 12,625,388 | | | $ | 5,234,659 | |
| | |
| The accompanying notes are an integral part of these financial statements. | | 43 |
COMMERCE FUNDS
Statements of Changes in Net Assets
| | | | | | | | | | | | | | | | |
| | | Growth Fund | | | Value Fund | |
| | | For the Six
Months Ended
April 30, 2009
(Unaudited) | | | For the Fiscal
Year
Ended
October 31, 2008 | | | For the Six
Months Ended
April 30, 2009
(Unaudited) | | | For the Fiscal
Year
Ended
October 31, 2008 | |
From Operations: | | | | | | | | | | | | | | | | |
Net investment income | | $ | 364,388 | | | $ | 308,126 | | | $ | 767,242 | | | $ | 1,806,751 | |
Net realized gain (loss) from investment transactions | | | (9,564,140 | ) | | | (4,061,806 | ) | | | (10,097,201 | ) | | | (5,175,114 | ) |
Net change in unrealized gain (loss) on investments | | | 6,104,169 | | | | (64,590,862 | ) | | | 561,205 | | | | (38,391,464 | ) |
Net increase (decrease) in net assets resulting from operations | | | (3,095,583 | ) | | | (68,344,542 | ) | | | (8,768,754 | ) | | | (41,759,827 | ) |
| | | | |
| | | | | | | | | | | | | | | | |
Distributions to Shareholders: | | | | | | | | | | | | | | | | |
From net investment income | | | (314,245 | ) | | | (304,583 | ) | | | (739,119 | ) | | | (1,815,407 | ) |
From net realized gains | | | — | | | | (2,209,815 | ) | | | — | | | | (13,766,687 | ) |
Total distributions to shareholders | | | (314,245 | ) | | | (2,514,398 | ) | | | (739,119 | ) | | | (15,582,094 | ) |
| | | | |
| | | | | | | | | | | | | | | | |
From Share Transactions: | | | | | | | | | | | | | | | | |
Proceeds from sales of shares | | | 11,524,777 | | | | 15,916,326 | | | | 17,900,697 | | | | 16,080,127 | |
Reinvestment of dividends and distributions | | | 142,078 | | | | 1,554,805 | | | | 195,134 | | | | 7,929,495 | |
Cost of shares redeemed | | | (18,930,701 | ) | | | (58,734,234 | ) | | | (10,346,298 | ) | | | (43,396,751 | ) |
Net increase (decrease) in net assets resulting from share transactions | | | (7,263,846 | ) | | | (41,263,103 | ) | | | 7,749,533 | | | | (19,387,129 | ) |
| TOTAL INCREASE (DECREASE) | | | (10,673,674 | ) | | | (112,122,043 | ) | | �� | (1,758,340 | ) | | | (76,729,050 | ) |
| | | | |
| | | | | | | | | | | | | | | | |
Net Assets: | | | | | | | | | | | | | | | | |
Beginning of period | | | 111,318,641 | | | | 223,440,684 | | | | 64,725,628 | | | | 141,454,678 | |
End of period | | $ | 100,644,967 | | | $ | 111,318,641 | | | $ | 62,967,288 | | | $ | 64,725,628 | |
Accumulated undistributed (distributions in excess of) net investment income | | $ | 351,199 | | | $ | 301,056 | | | $ | 90,308 | | | $ | 62,185 | |
| | |
| 44 | | The accompanying notes are an integral part of these financial statements. |
COMMERCE FUNDS
| | | | | | | | | | | | | | |
| MidCap Growth Fund | | | Bond Fund | |
For the Six
Months Ended
April 30, 2009
(Unaudited) | | | For the Fiscal
Year
Ended
October 31, 2008 | | | For the Six
Months Ended
April 30, 2009
(Unaudited) | | | For the Fiscal
Year
Ended
October 31, 2008 | |
| | | | | | | | | | | | | | |
| $ | 56,218 | | | $ | 15,606 | | | $ | 13,067,187 | | | $ | 24,437,719 | |
| | (2,195,365 | ) | | | 1,559,469 | | | | 2,968,386 | | | | 1,762,884 | |
| | 3,130,064 | | | | (30,945,837 | ) | | | 19,502,343 | | | | (32,378,451 | ) |
| | 990,917 | | | | (29,370,762 | ) | | | 35,537,916 | | | | (6,177,848 | ) |
| | | |
| | | | | | | | | | | | | | |
| | | | | | | | | | | | | | |
| | (17,917 | ) | | | — | | | | (13,549,373 | ) | | | (25,287,261 | ) |
| | (1,678,431 | ) | | | (7,205,864 | ) | | | — | | | | — | |
| | (1,696,348 | ) | | | (7,205,864 | ) | | | (13,549,373 | ) | | | (25,287,261 | ) |
| | | |
| | | | | | | | | | | | | | |
| | | | | | | | | | | | | | |
| | 6,883,292 | | | | 4,903,744 | | | | 69,183,100 | | | | 84,570,456 | |
| | 895,718 | | | | 4,299,842 | | | | 2,590,297 | | | | 4,954,440 | |
| | (4,698,715 | ) | | | (32,539,963 | ) | | | (65,500,212 | ) | | | (100,321,536 | ) |
| | 3,080,295 | | | | (23,336,377 | ) | | | 6,273,185 | | | | (10,796,640 | ) |
| | 2,374,864 | | | | (59,913,003 | ) | | | 28,261,728 | | | | (42,261,749 | ) |
| | | |
| | | | | | | | | | | | | | |
| | | | | | | | | | | | | | |
| | 40,444,167 | | | | 100,357,170 | | | | 495,168,362 | | | | 537,430,111 | |
| $ | 42,819,031 | | | $ | 40,444,167 | | | $ | 523,430,090 | | | $ | 495,168,362 | |
| $ | 46,291 | | | $ | 7,990 | | | $ | (2,917,118 | ) | | $ | (2,434,932 | ) |
| | |
| The accompanying notes are an integral part of these financial statements. | | 45 |
COMMERCE FUNDS
Statements of Changes in Net Assets (continued)
| | | | | | | | | | | | | | | | |
| | | Short-Term
Government Fund | | | National Tax-Free
Intermediate Bond Fund | |
| | | For the Six
Months Ended
April 30, 2009
(Unaudited) | | | For the Fiscal
Year
Ended
October 31, 2008 | | | For the Six
Months Ended
April 30, 2009
(Unaudited) | | | For the Fiscal
Year
Ended
October 31, 2008 | |
From Operations: | | | | | | | | | | | | | | | | |
Net investment income | | $ | 1,244,179 | | | $ | 3,018,384 | | | $ | 2,922,847 | | | $ | 5,451,593 | |
Net realized gain from investment transactions | | | 354,478 | | | | 36,041 | | | | 281,661 | | | | 1,466,904 | |
Net change in unrealized gain (loss) on investments | | | 1,708,209 | | | | 886 | | | | 8,180,219 | | | | (8,811,509 | ) |
Net increase (decrease) in net assets resulting from operations | | | 3,306,866 | | | | 3,055,311 | | | | 11,384,727 | | | | (1,893,012 | ) |
| | | | |
| | | | | | | | | | | | | | | | |
Distributions to Shareholders: | | | | | | | | | | | | | | | | |
From net investment income | | | (1,762,705 | ) | | | (3,465,997 | ) | | | (2,914,666 | ) | | | (5,438,590 | ) |
From net realized gains | | | — | | | | — | | | | (1,437,570 | ) | | | (382,630 | ) |
Total distributions to shareholders | | | (1,762,705 | ) | | | (3,465,997 | ) | | | (4,352,236 | ) | | | (5,821,220 | ) |
| | | | |
| | | | | | | | | | | | | | | | |
From Share Transactions: | | | | | | | | | | | | | | | | |
Proceeds from sales of shares | | | 17,727,991 | | | | 14,023,014 | | | | 33,464,805 | | | | 22,039,079 | |
Reinvestment of dividends and distributions | | | 581,565 | | | | 983,617 | | | | 407,720 | | | | 345,583 | |
Cost of shares redeemed | | | (18,967,317 | ) | | | (23,651,894 | ) | | | (18,236,507 | ) | | | (23,361,249 | ) |
Net increase (decrease) in net assets resulting from share transactions | | | (657,761 | ) | | | (8,645,263 | ) | | | 15,636,018 | | | | (976,587 | ) |
| TOTAL INCREASE (DECREASE) | | | 886,400 | | | | (9,055,949 | ) | | | 22,668,509 | | | | (8,690,819 | ) |
| | | | |
| | | | | | | | | | | | | | | | |
Net Assets: | | | | | | | | | | | | | | | | |
Beginning of period | | | 78,454,576 | | | | 87,510,525 | | | | 136,574,546 | | | | 145,265,365 | |
End of period | | $ | 79,340,976 | | | $ | 78,454,576 | | | $ | 159,243,055 | | | $ | 136,574,546 | |
Accumulated undistributed (distributions in excess of) net investment income | | $ | (1,093,012 | ) | | $ | (574,486 | ) | | $ | 85,581 | | | $ | 77,400 | |
| | |
| 46 | | The accompanying notes are an integral part of these financial statements. |
COMMERCE FUNDS
| | | | | | | | | | | | | | |
Missouri Tax-Free
Intermediate Bond Fund | | | Kansas Tax-Free
Intermediate Bond Fund | |
For the Six
Months Ended
April 30, 2009
(Unaudited) | | | For the Fiscal
Year
Ended
October 31, 2008 | | | For the Six
Months Ended
April 30, 2009
(Unaudited) | | | For the Fiscal
Year
Ended
October 31, 2008 | |
| | | | | | | | | | | | | | |
| $ | 3,342,050 | | | $ | 5,760,488 | | | $ | 1,259,922 | | | $ | 2,475,301 | |
| | 266,568 | | | | 202,808 | | | | 229,285 | | | | 156,721 | |
| | 9,016,770 | | | | (6,358,066 | ) | | | 3,745,452 | | | | (2,658,442 | ) |
| | 12,625,388 | | | | (394,770 | ) | | | 5,234,659 | | | | (26,420 | ) |
| | | |
| | | | | | | | | | | | | | |
| | | | | | | | | | | | | | |
| | (3,340,584 | ) | | | (5,753,428 | ) | | | (1,259,437 | ) | | | (2,465,277 | ) |
| | (203,343 | ) | | | (645,219 | ) | | | (155,289 | ) | | | (203,301 | ) |
| | (3,543,927 | ) | | | (6,398,647 | ) | | | (1,414,726 | ) | | | (2,668,578 | ) |
| | | |
| | | | | | | | | | | | | | |
| | | | | | | | | | | | | | |
| | 54,627,707 | | | | 56,965,410 | | | | 8,751,623 | | | | 14,194,781 | |
| | 194,636 | | | | 438,830 | | | | 104,428 | | | | 227,770 | |
| | (23,947,553 | ) | | | (29,596,710 | ) | | | (6,846,861 | ) | | | (12,011,313 | ) |
| | 30,874,790 | | | | 27,807,530 | | | | 2,009,190 | | | | 2,411,238 | |
| | 39,956,251 | | | | 21,014,113 | | | | 5,829,123 | | | | (283,760 | ) |
| | | |
| | | | | | | | | | | | | | |
| | | | | | | | | | | | | | |
| | 169,838,065 | | | | 148,823,952 | | | | 68,985,924 | | | | 69,269,684 | |
| $ | 209,794,316 | | | $ | 169,838,065 | | | $ | 74,815,047 | | | $ | 68,985,924 | |
| $ | (86,264 | ) | | $ | (87,730 | ) | | $ | (64,882 | ) | | $ | (65,367 | ) |
| | |
| The accompanying notes are an integral part of these financial statements. | | 47 |
COMMERCE FUNDS
Notes to Financial Statements
April 30, 2009 (Unaudited)
The Commerce Funds (the “Trust”) are a Delaware statutory trust registered under the Investment Company Act of 1940, as amended (the “1940 Act”), as an open-end, management investment company. The Trust consists of eight portfolios (individually, a “Fund” and collectively, the “Funds”): the Growth Fund, Value Fund, MidCap Growth Fund, Bond Fund, Short-Term Government Fund, National Tax-Free Intermediate Bond Fund, Missouri Tax-Free Intermediate Bond Fund and Kansas Tax-Free Intermediate Bond Fund. Each of the Funds offers one class of shares. Prior to February 3, 2006, the Funds offered two classes of shares, Institutional and Service Shares. On February 3, 2006, all outstanding Service Shares were converted into Institutional Shares. On February 10, 2009, the Institutional Shares were redesignated as Shares. Each Fund is registered as a diversified open-end management investment company, other than the Missouri Tax-Free Intermediate Bond Fund and the Kansas Tax-Free Intermediate Bond Fund, which are registered as non-diversified under the 1940 Act.
|
| 2. SIGNIFICANT ACCOUNTING POLICIES |
The following is a summary of the significant accounting policies consistently followed by the Funds. The preparation of financial statements in conformity with U.S. generally accepted accounting principles (“GAAP”) requires management to make estimates and assumptions that may affect the amounts and disclosures on the financial statements. Actual results could differ from those estimates and assumptions.
A. Investment Valuation — The investment valuation policy of the Funds is to value investments at market value. Investments in equity securities and investment companies traded on a United States (“U.S.”) securities exchange or the NASDAQ system are valued daily at their last sale price or official closing price on the principal exchange or system on which they are traded. If no sale occurs, such securities and investment companies are valued at the last bid price. Debt securities for which market quotations are readily available are valued on the basis of quotations furnished by an independent pricing service or provided by securities dealers. The pricing services may use valuation models or matrix pricing, which considers yield or price with respect to comparable bonds, quotations from bond dealers or by reference to other securities that are considered comparable in such characteristics as rating, interest rate and maturity date, to determine current value. Unlisted equity securities for which market quotations are available are valued at the last sale price on valuation date, or if no sale occurs, at the last bid price. In the absence of market quotations, broker quotes will be utilized or the security will be fair valued. Investments in investment companies (other than those that are exchange traded) are valued at the net asset value per share (“NAV”) on the valuation date. Short-term debt obligations that mature in sixty days or less and that do not exhibit signs of credit deterioration are valued at amortized cost, which approximates market value.
While the independent service may not take into account market or security specific information, under the valuation procedures, these securities might also be fair valued by the Adviser by taking into consideration market or security specific information, including, but not limited to, corporate actions or events, market disruptions or governmental actions.
B. Security Transactions and Investment Income — Security transactions are reflected for financial reporting purposes as of the trade date. Realized gains and losses on sales of portfolio securities of the Funds are calculated using the identified-cost basis. Dividend income is recognized on the ex-dividend date, net of foreign withholding taxes, if any, which are reduced by any amounts reclaimable by the Funds, where applicable. Interest income is recorded on the basis of interest accrued, premium amortized and discount accreted. Certain mortgage security paydown gains and losses are included in interest income in the accompanying Statements of Operations. Market discounts, original issue discount (“OID”) and market premiums on debt securities are accreted/amortized to interest income over the life of the security with a corresponding adjustment in the cost basis of that security. In addition, it is the Funds’ policy to accrue for estimated capital gains taxes, if any, on foreign securities held by the Funds, which are subject to such taxes.
In addition, distributions received from the Funds’ investments in real estate investment trusts (“REITs”) often include a “return of capital” which is recorded by the Funds as a reduction of the cost basis of the securities held. The Internal Revenue
48
COMMERCE FUNDS
| | |
| 2. SIGNIFICANT ACCOUNTING POLICIES (continued) | | |
Code of 1986, as amended (the “Code”) requires a REIT to distribute at least 95% of its taxable income to investors. In many cases, however, because of “non-cash” expenses such as property depreciation, a REIT’s cash flow will exceed its taxable income. The REIT may distribute this excess cash to offer a more competitive yield. This portion of the Funds’ distributions is deemed a return of capital and is generally not taxable to shareholders.
C. Expenses — Expenses incurred by the Trust that do not specifically relate to an individual Fund of the Trust are allocated to the Funds based on each Fund’s relative average net assets.
D. Federal Taxes and Distributions to Shareholders — It is each Fund’s policy to comply with the requirements of the Internal Revenue Code of 1986, as amended (the “Code”), applicable to regulated investment companies (mutual funds) and to distribute each year substantially all of its investment company taxable income and capital gains to its shareholders. Accordingly, no federal income tax provisions are required. Distributions to shareholders are recorded on the ex-dividend date. Income and capital gains distributions, if any, are declared and paid according to the following schedule:
| | | | | | | | |
| | | Income Distribution | | Capital Gains Distribution |
| Fund | | Declared | | Paid | | Declared | | Paid |
Value | | Quarterly | | Quarterly | | Annually | | Annually |
Growth and MidCap Growth | | Annually | | Annually | | Annually | | Annually |
Bond, Short-Term Government, National Tax-Free Intermediate Bond, Missouri Tax-Free Intermediate Bond and Kansas Tax-Free Intermediate Bond | | Daily | | Monthly | | Annually | | Annually |
Net capital losses are carried forward to future fiscal years and may be used to the extent allowed by the Code to offset any future capital gains. Utilization of capital loss carryforwards will reduce the requirement of future capital gains distributions.
The characterization of distributions to shareholders for financial reporting purposes is determined in accordance with federal income tax rules, which may differ from GAAP. The source of each Fund’s distributions may be shown in the accompanying financial statements as from net investment income, net realized gain or capital. Financial statements are adjusted for permanent book/tax differences to reflect the appropriate tax character, and are not adjusted for temporary differences.
GAAP establishes financial statement accounting and disclosure requirements for recognition and measurement of tax positions taken or expected to be taken on a U.S. income tax return. The tax positions have been reviewed for the open tax years (tax years ended October 31, 2005-2008) and determined that they did not have a material impact on the Funds’ financial statements.
E. Repurchase Agreements — The Funds may enter into repurchase agreements. Repurchase agreements involve the purchase of securities subject to the seller’s agreement to repurchase the securities at a mutually agreed upon date and price. During the term of a repurchase agreement, the value of the underlying securities held as collateral on behalf of the Funds, including accrued interest is required to exceed the value of the repurchase agreement, including accrued interest. If the seller defaults or becomes insolvent, realization of the collateral by the Funds may be delayed or limited and there may be a decline in the value of the collateral during the period that the Funds seek to assert their rights. The underlying securities for all repurchase agreements are held in safekeeping at the Funds’ custodian.
49
COMMERCE FUNDS
Notes to Financial Statements (continued)
April 30, 2009 (Unaudited)
A. Advisory Agreements — The Funds have entered into an Advisory Agreement with Commerce Investment Advisors, Inc. (the “Adviser” or “Commerce”), a subsidiary of Commerce Bank, N.A. (“Commerce Bank”). Pursuant to the terms of the Advisory Agreement, the Adviser is responsible for managing the investments and making investment decisions for each of the Funds. For these services and for assuming related expenses, the Adviser is entitled to a fee, computed daily and payable monthly, at the contractual annual rate of the corresponding Fund’s average daily net assets. The contractual annual rate is 0.75% for the Growth, Value and MidCap Growth Funds and 0.50% for the Bond, Short-Term Government, National Tax-Free Intermediate Bond, Missouri Tax-Free Intermediate Bond and Kansas Tax-Free Intermediate Bond Funds, respectively.
B. Administration Agreements — Goldman Sachs Asset Management (“GSAM”), a business unit of the Investment Management Division of Goldman, Sachs & Co. (“Goldman Sachs”), and Commerce, serve as Co-Administrators of the Trust pursuant to a Co-Administration Agreement. Under the Co-Administration Agreement, GSAM and Commerce administer the Trust’s business affairs. As compensation for the services rendered under the Co-Administration Agreement, GSAM and Commerce are entitled to a fee, computed daily and payable monthly, at the contractual annual rate of the corresponding Fund’s average daily net assets. Pursuant to the Co-Administration Agreement, the Funds will pay an aggregate administrative fee at the annual rate of 0.15%, allocated as follows: (1) for each Fund, GSAM is entitled to receive 0.03% of each Fund’s average daily net assets; and (2) for each Fund, Commerce is entitled to receive 0.12% of each Fund’s average daily net assets.
C. Other Agreements — The Adviser agreed to reimburse expenses (excluding interest, taxes and extraordinary expenses exclusive of any custody expense reductions) to the extent that such expenses exceeded, on an annualized basis, 1.13%, 1.20%, 0.88%, 0.68%, 0.70%, 0.70% and 0.70% of the average net assets of the Growth, Value, Bond, Short-Term Government, National Tax-Free Intermediate Bond, Missouri Tax-Free Intermediate Bond and Kansas Tax-Free Intermediate Bond Funds, respectively. In addition, the Funds are not obligated to reimburse the Adviser for prior fiscal year expense reimbursements, if any. Such expense reimbursements, if any, are computed daily and paid monthly. In addition, the Funds have entered into certain offset arrangements with the custodian resulting in a reduction in the Funds’ expenses.
Pursuant to a Shareholder Administrative Services Plan adopted by its Board of Trustees, the Funds may enter into agreements with service organizations, such as banks and financial institutions, which may include the Adviser and its affiliates (“Service Organizations”), under which they will render shareholder administration support services. For these services, the Service Organizations are entitled to receive fees from each Fund at an annual rate of up to 0.25% of the average daily net asset value of Fund shares beneficially owned by clients of such Service Organizations. For the six months ended April 30, 2009, Commerce Bank has retained $349,278 in shareowner servicing fees.
| | |
| 4. OTHER TRANSACTIONS WITH RELATED PARTIES | | |
Certain Trustees participate in a Deferred Compensation Plan, as amended and restated (the “Plan”), which allows eligible non-affiliated Trustees as described in the Plan to defer the receipt of all or a portion of the Trustees’ fees payable. Under the Plan, such Trustees have deferred fees treated as if they had been invested by The Commerce Funds in the shares of one or more Funds of the Trust. All amounts payable to the Trustees under the Plan are accrued quarterly and determined based on the performance of such Funds.
| | |
| 5. FAIR VALUE OF INVESTMENTS | | |
For the six months ended April 30, 2009, the Funds adopted FASB Statement of Financial Accounting Standards No. 157, Fair Value Measurements (“FAS 157”). The fair value of a financial instrument is the amount that would be received to sell an asset or paid to transfer a liability in an orderly transaction between market participants at the measurement date (exit price). Fair value measurements do not include transaction costs. FASB Statement of Financial Accounting Standards No. 157, Fair Value Measurements (“FAS 157”) establishes a fair value hierarchy that prioritizes the inputs to valuation techniques used to measure fair value. The hierarchy gives the highest priority to unadjusted quoted prices in active markets for identical assets or liabilities
50
COMMERCE FUNDS
| | |
| 5. FAIR VALUE OF INVESTMENTS (continued) | | |
(Level 1 measurements) and the lowest priority to unobservable inputs (Level 3 measurements). The three levels of the fair value hierarchy under FAS 157 are described below:
Level 1 — Unadjusted quoted prices in active markets that are accessible at the measurement date for identical, unrestricted assets or liabilities;
Level 2 — Quoted prices in markets that are not active or financial instruments for which all significant inputs are observable, either directly or indirectly;
Level 3 — Prices or valuations that require inputs that are both significant to the fair value measurement and unobservable.
The following is a summary of the Funds’ investments categorized in the fair value hierarchy. All amounts in the following table reflect investments in securities:
| | | | | | | | | | | | |
| Level | | Growth | | Value | | MidCap Growth | | Bond |
Level 1 | | $ | 100,663,952 | | $ | 62,450,116 | | $ | 41,953,048 | | $ | 26,715,532 |
Level 2 | | | 1,614,000 | | | 479,000 | | | 1,126,000 | | | 493,877,391 |
Level 3 | | | — | | | — | | | — | | | — |
Total | | $ | 102,277,952 | | $ | 62,929,116 | | $ | 43,079,048 | | $ | 520,592,923 |
| | | | | | | | | | | | |
| Level | | Short-Term
Government | | National Tax-Free
Intermediate Bond | | Missouri Tax-Free
Intermediate Bond | | Kansas Tax-Free
Intermediate Bond |
Level 1 | | $ | 9,376,047 | | $ | — | | $ | — | | $ | — |
Level 2 | | | 70,344,031 | | | 160,054,400 | | | 207,211,941 | | | 74,067,472 |
Level 3 | | | — | | | — | | | — | �� | | — |
Total | | $ | 79,720,078 | | $ | 160,054,400 | | $ | 207,211,941 | | $ | 74,067,472 |
| | |
| 6. PORTFOLIO SECURITIES TRANSACTIONS | | |
The cost of purchases and proceeds from sales and maturities of long-term securities for the six months ended April 30, 2009, were as follows:
| | | | | | | | | | | | |
| Fund | | Purchases of
U.S. Government
and agency
obligations | | Purchases
(excluding
U.S. Government
and agency
obligations) | | Sales and
maturities of
U.S. Government
and agency
obligations | | Sales
and maturities
(excluding
U.S. Government
and agency
obligations) |
Growth | | $ | — | | $ | 17,222,781 | | $ | — | | $ | 24,159,979 |
Value | | | — | | | 23,885,602 | | | — | | | 15,525,890 |
MidCap Growth | | | — | | | 6,899,926 | | | — | | | 5,888,541 |
Bond | | | — | | | 91,607,652 | | | 50,355,711 | | | 11,823,944 |
Short-Term Government | | | 5,971,204 | | | 8,112,667 | | | 13,213,170 | | | — |
National Tax-Free Intermediate Bond | | | — | | | 33,170,304 | | | — | | | 18,165,225 |
Missouri Tax-Free Intermediate Bond | | | — | | | 33,278,421 | | | — | | | 14,343,292 |
Kansas Tax-Free Intermediate Bond | | | — | | | 4,834,023 | | | — | | | 5,763,961 |
51
COMMERCE FUNDS
Notes to Financial Statements (continued)
April 30, 2009 (Unaudited)
As of the Funds’ most recent fiscal year ended, October 31, 2008, the Funds’ capital loss carryforwards and certain timing differences on a tax basis were as follows:
| | | | | | | | | | | | | | | | | | | | | | | | | | | | | | | | |
| | | Growth | | | Value | | | MidCap
Growth | | | Bond | | | Short-Term
Government | | | National
Tax-Free
Intermediate
Bond | | | Missouri
Tax-Free
Intermediate
Bond | | | Kansas
Tax-Free
Intermediate
Bond | |
Capital loss carryforward:(1) | | | | | | | | | | | | | | | | | | | | | | | | | | | | | | | | |
Expiring 2010 | | $ | — | | | $ | — | | | $ | — | | | $ | (5,182,052 | ) | | $ | (679,994 | ) | | $ | — | | | $ | — | | | $ | — | |
Expiring 2011 | | | — | | | | — | | | | — | | | | — | | | | (2,174,462 | ) | | | — | | | | — | | | | — | |
Expiring 2012 | | | — | | | | — | | | | — | | | | (6,311,963 | ) | | | (3,771,248 | ) | | | — | | | | — | | | | — | |
Expiring 2013 | | | — | | | | — | | | | — | | | | (540,238 | ) | | | (2,538,488 | ) | | | — | | | | — | | | | — | |
Expiring 2014 | | | — | | | | — | | | | — | | | | (3,576,948 | ) | | | (2,653,199 | ) | | | — | | | | — | | | | — | |
Expiring 2015 | | | — | | | | — | | | | — | | | | — | | | | (1,094,544 | ) | | | — | | | | — | | | | — | |
Expiring 2016 | | | (4,003,861 | ) | | | (4,797,254 | ) | | | — | | | | — | | | | (345,421 | ) | | | — | | | | — | | | | — | |
Total capital loss carryforward: | | $ | (4,003,861 | ) | | $ | (4,797,254 | ) | | $ | — | | | $ | (15,611,201 | ) | | $ | (13,257,356 | ) | | $ | — | | | $ | — | | | $ | — | |
Timing differences (dividends payable, deferred compensation) | | $ | (12,974 | ) | | $ | (14,557 | ) | | $ | (10,645 | ) | | $ | (1,760,522 | ) | | $ | (190,544 | ) | | $ | (450,753 | ) | | $ | (525,589 | ) | | $ | (196,057 | ) |
| (1) | | Expiration occurs on October 31 of the year indicated. |
At April 30, 2009, the Fund’s aggregate security unrealized gains and losses based on cost for U.S. federal income tax purposes were as follows:
| | | | | | | | | | | | | | | | | | | | | | | | | | | | | | | | |
| | | Growth | | | Value | | | MidCap
Growth | | | Bond | | | Short-Term
Government | | | National
Tax-Free
Intermediate
Bond | | | Missouri
Tax-Free
Intermediate
Bond | | | Kansas
Tax-Free
Intermediate
Bond | |
Tax Cost | | $ | 123,838,124 | | | $ | 83,071,492 | | | $ | 53,578,383 | | | $ | 531,691,560 | | | $ | 78,625,136 | | | $ | 157,803,713 | | | $ | 201,769,850 | | | $ | 71,963,693 | |
Gross unrealized gain | | | 5,079,145 | | | | 1,585,072 | | | | 1,911,797 | | | | 21,994,550 | | | | 3,134,451 | | | | 4,191,136 | | | | 6,618,831 | | | | 2,391,637 | |
Gross unrealized loss | | | (26,639,317 | ) | | | (21,727,448 | ) | | | (12,411,132 | ) | | | (33,093,187 | ) | | | (2,039,509 | ) | | | (1,940,449 | ) | | | (1,176,740 | ) | | | (287,858 | ) |
Net unrealized security gain (loss) | | $ | (21,560,172 | ) | | $ | (20,142,376 | ) | | $ | (10,499,335 | ) | | $ | (11,098,637 | ) | | $ | 1,094,942 | | | $ | 2,250,687 | | | $ | 5,442,091 | | | $ | 2,103,779 | |
The difference between book-basis and tax-basis unrealized gains (losses) is primarily attributable to wash sales and differing treatment of accretion of market discount and premium amortization.
52
COMMERCE FUNDS
Insurance Concentrations — The Tax-Free Funds may invest in “insured” tax exempt municipal securities (“Insured Municipal Securities”). Insured Municipal Securities are securities for which scheduled payments of interest and principal are guaranteed by a private (nongovernmental) insurance company. The insurance only entitles the Funds to receive interest and the face or par value of the securities held by the Funds in the event that the underlying obligor cannot make timely payments. The insurance does not guarantee the market value of the Insured Municipal Securities or the value of the shares of the Funds. As of April 30, 2009, the following private insurers insured 5% or more of the net assets of one or more of the Funds:
| | | | | | |
| Insurer/Rating | | National Tax-Free
Intermediate Bond | | Missouri Tax-Free
Intermediate Bond | | Kansas Tax-Free
Intermediate Bond |
AMBAC Assurance Corp. (Baa1/A) | | 13% | | 5% | | 14% |
Financial Guaranty Insurance Co. (NR) | | 8 | | — | | 13 |
Financial Security Assurance Co. (Aa3/AAA/AAA) | | — | | 15 | | 13 |
MBIA Insurance Corp. (Baa1/AA-) | | 15 | | 13 | | 17 |
Market and Credit Risks — In the normal course of business, the Funds trade financial instruments and enter into financial transactions where risk of potential loss exists due to changes in the market (market risk). Additionally, the Funds may also be exposed to credit risk in the event that an issuer fails to perform or that an institution or entity with which the Funds have unsettled or open transactions defaults.
Portfolio Concentrations — As a result of the Missouri Tax-Free Intermediate Bond and Kansas Tax-Free Intermediate Bond Funds’ (each a “Tax-Free Fund” and collectively the “Tax-Free Funds”) ability to invest a large percentage of their assets in obligations of issuers within certain states, they are subject to possible concentration risks associated with economic, political or legal developments or industrial or regional matters specifically affecting such states.
Under normal market conditions, the National Tax-Free Intermediate Bond Fund invests at least 80% of its assets plus any borrowings for investment purposes (measured at the time of purchase) in municipal securities issued by or on behalf of the states, the District of Columbia or the U.S. Government, and their respective authorities, agencies, instrumentalities and political sub-divisions, the income from which, in the opinion of bond counsel, is exempt from regular federal income and federal alternative minimum taxes. The Missouri Tax-Free Intermediate Bond Fund and the Kansas Tax-Free Intermediate Bond Fund invest at least 80% of their assets plus any borrowings for investment purposes (measured at the time of purchase) in Missouri and Kansas municipal securities, respectively, the income from which, in the opinion of bond counsel, is exempt from regular federal income tax, federal alternative minimum taxes and Missouri and Kansas state taxes, respectively. Alternatively, at least 80% of the Tax-Free Funds’ distributed income must be exempt from such taxes.
For each of the Missouri and Kansas Tax-Free Funds, the actual payment of principal and interest on Missouri and Kansas municipal securities is dependent on the Missouri General Assembly and the Kansas legislature, respectively, allotting money each fiscal year for these payments.
The investments of the Growth, Value and MidCap Growth Funds may be concentrated in securities of technology companies. At times, securities of technology companies may experience significant price fluctuations.
The Value Fund may be concentrated in securities of financial companies. At times, securities of financial companies may be subject to greater price volatility than securities of companies in other sectors and may experience significant price fluctuations.
The Bond and Short-Term Government Funds may invest 80% and 100%, respectively, of their total assets in mortgage-related securities and the Bond Fund may invest 80% of its total assets in asset-backed securities. Mortgage-backed securities, especially collateralized mortgage-backed securities, may be subject to risks that include price volatility, liquidity, and
53
COMMERCE FUNDS
Notes to Financial Statements (continued)
April 30, 2009 (Unaudited)
| | |
| 8. OTHER RISKS (continued) | | |
enhanced sensitivity to interest rates. As a result, mortgage-backed securities may be more difficult to value and liquidate, if necessary. Mortgage-backed securities are also subject to prepayment risk, which may result in a decreased rate of return and a decline in the value of the securities. Asset-backed securities have a greater risk of default during periods of economic downturn than other securities. Also, asset-backed securities may be less liquid than other securities and therefore more difficult to value and liquidate, if necessary.
Indemnifications — Under the Trust’s organizational documents, its trustees, officers, employees and agents are indemnified, to the extent permitted by the Act, against certain liabilities that may arise out of performance of their duties to the Funds. Additionally, in the course of business, the Funds enter into contracts that contain a variety of indemnification clauses. The Funds’ maximum exposure under these arrangements is unknown, as this would involve future claims that may be made against the Funds that have not yet occurred. However, the Funds believe the risk of loss under these arrangements to be remote.
New Accounting Pronouncements — In April 2009 FASB issued a new FASB Staff Position FSP FAS 157-4 which amends FASB Statement No. 157, “Fair Value Measurements,” and is effective for interim and annual periods ending after June 15, 2009. FSP FAS 157-4 provides additional guidance when the volume and level of activity for the asset or liability measured at fair value has significantly decreased. Additionally, FSP FAS 157-4 expands disclosure by reporting entities with respect to categories of assets and liabilities carried at fair value. Commerce believes applying the provisions of FSP FAS 157-4 will not have a material impact on the Funds’ financial statements.
Approval of Advisory Agreement — The Trustees oversee the management of the Trust, and review the investment performance and expenses of the Funds at regularly scheduled meetings held during the Funds’ fiscal year. In addition, the Trustees determine annually whether to reapprove and continue the Trust’s investment advisory agreement (“Advisory Agreement”) with the Adviser for the Funds.
The Advisory Agreement for the Funds was most recently approved by the Trustees, including all of the Trustees who are not parties to the Advisory Agreement or “interested persons” (as such term is defined in the 1940 Act) of any party thereto (the “non-interested Trustees”), on November 18-19, 2008 (the “Annual Contract Meeting”).
Prior to the Annual Contract Meeting, the Board of Trustees received written materials provided by the Adviser relating to the Trustees’ consideration of the Advisory Agreement. At the Annual Contract Meeting, the Trustees also received and considered the Adviser’s oral presentations and discussed the information that had been provided. In connection with their deliberations, the Trustees were advised by their independent legal counsel regarding their responsibilities under applicable law and met separately in executive session with independent counsel without members of management present.
In evaluating the Advisory Agreement, the Trustees relied upon their knowledge, resulting from their meetings and other interactions throughout the year, of the Adviser and its services and personnel. Both in meetings specifically dedicated to the review of the Advisory Agreement and meetings held during the year, the Trustees reviewed materials relating to the Adviser’s investment management services. Specifically, the Trustees reviewed, among other things, information relating to: (i) the terms of the Advisory Agreement; (ii) the Funds’ investment performance over different time periods in comparison to the investment performance of mutual fund peer categories selected by Lipper Inc. (“Lipper”), a third-party provider of mutual fund data; (iii) the contractual investment advisory fees, the actual investment advisory fees (after expense reimbursements) and the total expenses borne by the Funds in comparison to those borne by mutual fund peer groups selected by Lipper; (iv) the Adviser’s staffing for the Funds and the experience of the portfolio managers; (v) the scope and depth of the Adviser’s resources and their ability to attract and retain portfolio management investment talent; (vi) the fees paid by the Funds to the Adviser and its affiliates for services, and the expenses incurred by them in connection with the provision of those services, the profitability of the Advisory Agreement to the Adviser, and a comparison of the Adviser’s profitability with that of other publicly reported profitability information of other advisers; (vii) the fall out benefits received by the Adviser and its affiliates from their relationships with the Funds; and (viii) potential economies of scale. In addition, the Trustees considered that the Adviser had a seasoned and experienced portfolio management staff and a highly disciplined and understandable investment process. In
54
COMMERCE FUNDS
| | |
| 9. OTHER MATTERS (continued) | | |
addition, the operations staff functioned efficiently and professionally, and provided the Board with frequent reports on the status of Fund operations.
In connection with their approval of the Advisory Agreement for each of the Funds, the Trustees gave weight to various factors, but did not identify any single factor as controlling their decision. As part of their review, the Trustees considered the nature, extent and quality of the services provided by the Adviser. In this regard, the Trustees considered both the investment advisory services, and the other non-advisory services, that are provided to the Funds by the Adviser. These services include services as the Funds’ Co-Administrator. The Trustees also considered that many of the Funds’ shareholders had other client relationships with affiliates of the Adviser. The Trustees concluded that the Adviser was able to commit, and had committed, substantial financial and other resources to the operations of the Funds and was able to provide quality services to the Funds. The Trustees also believed that the Adviser continued to make significant improvements to the Funds’ compliance program.
The Trustees also considered the investment performance of the Funds. In this regard, the Trustees considered whether the Funds had operated within their respective investment objectives, as well as their compliance with their investment restrictions. They also compared the investment performance of the Funds to the performance of other SEC-registered funds and to rankings and ratings issued by Lipper. For Funds that had been in existence for the applicable periods, this information on the Funds’ investment performance was provided for one, three, five and ten years. In addition, the Trustees considered the Funds’ investment performance relative to their respective performance benchmarks and in light of the objectives and credit parameters applicable to the Funds, as well as the investor base the Funds are intended to serve. In addition, the Trustees reviewed the consistency of the Adviser’s investment approach for the Funds. The Trustees also considered the in depth performance reports provided by the Adviser throughout the year with regard to underperforming Funds, and the changes made to the Adviser’s investment process in order to improve the performance of certain Funds. As a result of the Adviser’s process changes, two of the three equity Funds were in the top Lipper quartile for the one-and three-year periods, and all of the fixed income Funds were in or close to the first quartile for the one-and three-year periods.
Based on the information provided, the Trustees believed that the investment performance of the Funds was, in general, competitive in light of the factors mentioned above, including the Funds’ investment policies and the nature of their shareholder base. In reaching this conclusion, the Trustees also reviewed, among other things, the relative performance of the Funds as compared to the mutual fund categories established by Lipper, and their benchmarks for different time periods. They also noted again the potential impact of the relative risk parameters of the different Funds. The Trustees concluded that the Adviser was devoting appropriate resources in its efforts to provide favorable investment results for the Funds.
The Trustees also considered the Funds’ contractual advisory fee rates; the Funds’ total operating expense ratios; and expense reimbursements with respect to the Funds; and whether a consistent methodology was in place in determining the fees and expenses of the respective Funds. In addition, the Trustees considered the fees paid by the Funds to the Adviser and its affiliates for shareholder servicing and Co-Administration services, and reviewed information as to whether the Adviser had passed, and was likely to continue to pass, benefits from its economies of scale to shareholders. In this regard, the Trustees considered the Adviser’s view that the Funds may be sharing in economies of scale through the Adviser’s voluntary expense caps for certain of the Funds. The Trustees also determined that fee breakpoints were not appropriate at current asset levels. In addition, the Trustees considered the level of assets in the Funds; the information provided by the Adviser relating to their costs of the services provided by them and the profits realized by them; and information comparing the fee rates charged by the Adviser (which does not include fee breakpoints) with the fee rates charged by other, unaffiliated investment managers to their clients. Moreover, the Trustees also considered the Adviser’s profitability in the past year in light of Fund asset levels.
The Trustees also considered information provided by the Adviser on its use of and benefits from soft dollars in connection with the Funds’ brokerage. The Trustees also considered the Adviser’s best execution evaluation program on behalf of the Funds.
Information on the fee rates paid by the Funds under the Advisory Agreement and the Funds’ total operating expense ratios were compared to similar information for other mutual funds advised by other, unaffiliated investment management firms. These comparisons of the Funds’ fee rates and total operating expense ratios were prepared by Lipper, and they assisted the Trustees in evaluating the reasonableness of the investment advisory fees paid by the Funds.
55
COMMERCE FUNDS
Notes to Financial Statements (continued)
April 30, 2009 (Unaudited)
| | |
| 9. OTHER MATTERS (continued) | | |
After deliberation, the Trustees concluded at the Annual Contract Meeting with respect to all of the Funds, that the fees paid by Funds were reasonable in light of the services provided by the Adviser, its costs and the Funds’ current and reasonably foreseeable asset levels, and that the Advisory Agreement should be approved and continued.
|
| 10. SUMMARY OF SHARE TRANSACTIONS |
Share activity is as follows:
| | | | | | | | | | | | | | |
| | | Growth Fund | |
| | | For the Six Months Ended
April 30, 2009 (Unaudited) | | | For the Fiscal Year Ended
October 31, 2008 | |
| | | Shares | | | Dollars | | | Shares | | | Dollars | |
Shares* | | | | | | | | | | | | | | |
Shares sold | | 685,598 | | | $ | 11,524,777 | | | 645,292 | | | $ | 15,916,326 | |
Reinvestment of distributions | | 8,462 | | | | 142,078 | | | 56,466 | | | | 1,554,805 | |
Shares redeemed | | (1,134,610 | ) | | | (18,930,701 | ) | | (2,338,961 | ) | | | (58,734,234 | ) |
| Net Decrease | | (440,550 | ) | | $ | (7,263,846 | ) | | (1,637,203 | ) | | $ | (41,263,103 | ) |
| | | | |
| | | | | | | | | | | | | | |
| | | Value Fund | |
| | | For the Six Months Ended
April 30, 2009 (Unaudited) | | | For the Fiscal Year Ended
October 31, 2008 | |
| | | Shares | | | Dollars | | | Shares | | | Dollars | |
Shares* | | | | | | | | | | | | | | |
Shares sold | | 1,303,729 | | | $ | 17,900,697 | | | 697,747 | | | $ | 16,080,127 | |
Reinvestment of distributions | | 13,757 | | | | 195,134 | | | 323,569 | | | | 7,929,495 | |
Shares redeemed | | (792,789 | ) | | | (10,346,298 | ) | | (1,928,602 | ) | | | (43,396,751 | ) |
| Net Increase (Decrease) | | 524,697 | | | $ | 7,749,533 | | | (907,286 | ) | | $ | (19,387,129 | ) |
| | | | |
| | | | | | | | | | | | | | |
| | | MidCap Growth Fund | |
| | | For the Six Months Ended
April 30, 2009 (Unaudited) | | | For the Fiscal Year Ended
October 31, 2008 | |
| | | Shares | | | Dollars | | | Shares | | | Dollars | |
Shares* | | | | | | | | | | | | | | |
Shares sold | | 370,459 | | | $ | 6,883,292 | | | 162,117 | | | $ | 4,903,744 | |
Reinvestment of distributions | | 52,181 | | | | 895,718 | | | 128,969 | | | | 4,299,842 | |
Shares redeemed | | (255,716 | ) | | | (4,698,715 | ) | | (1,046,214 | ) | | | (32,539,963 | ) |
| Net Increase (Decrease) | | 166,924 | | | $ | 3,080,295 | | | (755,128 | ) | | $ | (23,336,377 | ) |
| | | | |
| | | | | | | | | | | | | | |
| | | Bond Fund | |
| | | For the Six Months Ended
April 30, 2009 (Unaudited) | | | For the Fiscal Year Ended
October 31, 2008 | |
| | | Shares | | | Dollars | | | Shares | | | Dollars | |
Shares* | | | | | | | | | | | | | | |
Shares sold | | 3,833,119 | | | $ | 69,183,100 | | | 4,596,952 | | | $ | 84,570,456 | |
Reinvestment of distributions | | 144,009 | | | | 2,590,297 | | | 270,358 | | | | 4,954,440 | |
Shares redeemed | | (3,627,331 | ) | | | (65,500,212 | ) | | (5,450,492 | ) | | | (100,321,536 | ) |
| Net Increase (Decrease) | | 349,797 | | | $ | 6,273,185 | | | (583,182 | ) | | $ | (10,796,640 | ) |
| * | | On February 10, 2009, all outstanding Institutional Shares were redesignated to Shares. |
56
COMMERCE FUNDS
| | |
| 10. SUMMARY OF SHARE TRANSACTIONS (continued) | | |
| | | | | | | | | | | | | | |
| | | Short-Term Government Fund | |
| | | For the Six Months Ended
April 30, 2009 (Unaudited) | | | For the Fiscal Year Ended
October 31, 2008 | |
| | | Shares | | | Dollars | | | Shares | | | Dollars | |
Shares* | | | | | | | | | | | | | | |
Shares sold | | 995,972 | | | $ | 17,727,991 | | | 788,477 | | | $ | 14,023,014 | |
Reinvestment of distributions | | 32,644 | | | | 581,565 | | | 55,318 | | | | 983,617 | |
Shares redeemed | | (1,062,842 | ) | | | (18,967,317 | ) | | (1,328,794 | ) | | | (23,651,894 | ) |
| Net Decrease | | (34,226 | ) | | $ | (657,761 | ) | | (484,999 | ) | | $ | (8,645,263 | ) |
| | | | |
| | | | | | | | | | | | | | |
| | | National Tax-Free Intermediate Bond Fund | |
| | | For the Six Months Ended
April 30, 2009 (Unaudited) | | | For the Fiscal Year Ended
October 31, 2008 | |
| | | Shares | | | Dollars | | | Shares | | | Dollars | |
Shares* | | | | | | | | | | | | | | |
Shares sold | | 1,824,918 | | | $ | 33,464,805 | | | 1,177,094 | | | $ | 22,039,079 | |
Reinvestment of distributions | | 22,953 | | | | 407,720 | | | 18,419 | | | | 345,583 | |
Shares redeemed | | (992,754 | ) | | | (18,236,507 | ) | | (1,248,401 | ) | | | (23,361,249 | ) |
| Net Increase (Decrease) | | 855,117 | | | $ | 15,636,018 | | | (52,888 | ) | | $ | (976,587 | ) |
| | | | |
| | | | | | | | | | | | | | |
| | | Missouri Tax-Free Intermediate Bond Fund | |
| | | For the Six Months Ended
April 30, 2009 (Unaudited) | | | For the Fiscal Year Ended
October 31, 2008 | |
| | | Shares | | | Dollars | | | Shares | | | Dollars | |
Shares* | | | | | | | | | | | | | | |
Shares sold | | 2,876,973 | | | $ | 54,627,707 | | | 3,012,619 | | | $ | 56,965,410 | |
Reinvestment of distributions | | 10,363 | | | | 194,636 | | | 23,146 | | | | 438,830 | |
Shares redeemed | | (1,270,786 | ) | | | (23,947,553 | ) | | (1,567,518 | ) | | | (29,596,710 | ) |
| Net Increase | | 1,616,550 | | | $ | 30,874,790 | | | 1,468,247 | | | $ | 27,807,530 | |
| | | | |
| | | | | | | | | | | | | | |
| | | Kansas Tax-Free Intermediate Bond Fund | |
| | | For the Six Months Ended
April 30, 2009 (Unaudited) | | | For the Fiscal Year Ended
October 31, 2008 | |
| | | Shares | | | Dollars | | | Shares | | | Dollars | |
Shares* | | | | | | | | | | | | | | |
Shares sold | | 471,512 | | | $ | 8,751,623 | | | 765,232 | | | $ | 14,194,781 | |
Reinvestment of distributions | | 5,709 | | | | 104,428 | | | 12,271 | | | | 227,770 | |
Shares redeemed | | (374,417 | ) | | | (6,846,861 | ) | | (650,052 | ) | | | (12,011,313 | ) |
| Net Increase | | 102,804 | | | $ | $2,009,190 | | | 127,451 | | | $ | $2,411,238 | |
| * | | On February 10, 2009, all outstanding Institutional Shares were redesignated to Shares. |
57
COMMERCE FUNDS
Financial Highlights
Selected Data for a Share Outstanding Throughout Each Period
| | | | | | | | | | | | | | | | | | | | | | | | | | | |
| | | | | Income (loss) from
investment operations | | | Distributions
to shareholders | |
| Year-Share Class | | Net asset
value,
beginning
of period | | Net
investment
income
(loss)(a) | | | Net realized
and unrealized
gain (loss) | | | Total from
investment
operations | | | From net
investment
income | | | From
net
realized
gains | | | Total
distributions | |
GROWTH FUND | | | | | | | | | | | | | | | | | | | | | | | | | | | |
For the Six Months Ended April 30, (Unaudited) | | | | | | | | | | | | | | | | | | | | | | | | | | | |
2009—Shares(c) | | $ | 18.44 | | $ | 0.06 | | | $ | (0.47 | ) | | $ | (0.41 | ) | | $ | (0.05 | ) | | $ | — | | | $ | (0.05 | ) |
For the Fiscal Years Ended October 31, | | | | | | | | | | | | | | | | | | | | | | | | | | | |
2008—Shares | | | 29.11 | | | 0.05 | | | | (10.39 | ) | | | (10.34 | ) | | | (0.04 | ) | | | (0.29 | ) | | | (0.33 | ) |
2007—Shares | | | 25.56 | | | 0.04 | | | | 3.55 | | | | 3.59 | | | | (0.04 | ) | | | — | | | | (0.04 | ) |
2006—Shares(e) | | | 22.56 | | | 0.04 | | | | 3.08 | | | | 3.12 | | | | (0.12 | ) | | | — | | | | (0.12 | ) |
2005—Shares | | | 20.82 | | | 0.14 | (f) | | | 1.63 | | | | 1.77 | | | | (0.03 | ) | | | — | | | | (0.03 | ) |
2004—Shares | | | 20.50 | | | (0.07 | ) | | | 0.39 | | | | 0.32 | | | | — | | | | — | | | | — | |
| | | | | | | | | | | | | | | | | | | | | | | | | | | |
VALUE FUND | | | | | | | | | | | | | | | | | | | | | | | | | | | |
For the Six Months Ended April 30, (Unaudited) | | | | | | | | | | | | | | | | | | | | | | | | | | | |
2009—Shares(c) | | $ | 16.31 | | $ | 0.18 | | | $ | (2.29 | ) | | $ | (2.11 | ) | | $ | (0.18 | ) | | $ | — | | | $ | (0.18 | ) |
For the Fiscal Years Ended October 31, | | | | | | | | | | | | | | | | | | | | | | | | | | | |
2008—Shares | | | 29.02 | | | 0.39 | | | | (9.84 | ) | | | (9.45 | ) | | | (0.39 | ) | | | (2.87 | ) | | | (3.26 | ) |
2007—Shares | | | 29.53 | | | 0.36 | | | | 1.90 | | | | 2.26 | | | | (0.36 | ) | | | (2.41 | ) | | | (2.77 | ) |
2006—Shares(e) | | | 24.96 | | | 0.35 | | | | 4.66 | | | | 5.01 | | | | (0.34 | ) | | | (0.10 | ) | | | (0.44 | ) |
2005—Shares | | | 22.70 | | | 0.27 | | | | 2.28 | | | | 2.55 | | | | (0.29 | ) | | | — | | | | (0.29 | ) |
2004—Shares | | | 20.92 | | | 0.22 | | | | 1.78 | | | | 2.00 | | | | (0.22 | ) | | | — | | | | (0.22 | ) |
| (a) | | Calculated based on the average shares outstanding methodology. |
| (b) | | Assumes investment at the net asset value at the beginning of the period, reinvestment of all dividends and distributions, a complete redemption of the investment at the net asset value at the end of the period and no sales or redemption charges. Total returns would be reduced if sales or redemption charges were taken into account. Returns do not reflect the deduction of taxes that a shareholder would pay on Fund distributions or the redemption of Fund shares. Total returns for periods less than one full year are not annualized. |
| (c) | | On February 10, 2009, all outstanding Institutional Shares were redesignated to Shares. |
| (e) | | On February 3, 2006, all outstanding Service Shares were converted into Institutional Shares. |
| (f) | | Reflects income recognized from a special dividend which amounted to $0.14 per share and 0.62% of average net assets. |
| | |
| 58 | | The accompanying notes are an integral part of these financial statements. |
COMMERCE FUNDS
| | | | | | | | | | | | | | | | | | | | | |
| | | | | | | | | | | | | | Ratios assuming no
expense reductions | | | | |
Net asset
value, end
of period | | Total
return(b) | | | Net assets
at end of
period
(in 000s) | | Ratio of
net expenses to
average net assets | | | Ratio of
net investment
income (loss) to
average net assets | | | Ratio of total
expenses to
average net assets | | | Ratio of
net investment
income (loss) to
average net assets | | | Portfolio
turnover
rate | |
| | | | | | | | | | | | | | | | | | | | | |
| | | | | | | | | | | | | | | | | | | | | |
| $17.98 | | (2.19 | )% | | $ | 100,645 | | 1.13 | %(d) | | 0.75 | %(d) | | 1.21 | %(d) | | 0.67 | %(d) | | 17 | % |
| | | | | | | | | | | | | | | | | | | | | |
| 18.44 | | (35.82 | ) | | | 111,319 | | 1.11 | | | 0.18 | | | 1.11 | | | 0.18 | | | 43 | |
| 29.11 | | 14.04 | | | | 223,441 | | 1.13 | | | 0.15 | | | 1.14 | | | 0.14 | | | 70 | |
| 25.56 | | 13.86 | | | | 173,813 | | 1.13 | | | 0.16 | | | 1.18 | | | 0.11 | | | 47 | |
| 22.56 | | 8.52 | | | | 150,676 | | 1.13 | | | 0.64 | (f) | | 1.23 | | | 0.54 | (f) | | 40 | |
| 20.82 | | 1.56 | | | | 170,513 | | 1.13 | | | (0.35 | ) | | 1.15 | | | (0.37 | ) | | 41 | |
| | | | | | | | | | | | | | | | | | | | | |
| | | | | | | | | | | | | | | | | | | | | |
| | | | | | | | | | | | | | | | | | | | | |
| $14.02 | | (12.96 | )% | | $ | 62,967 | | 1.20 | %(d) | | 2.62 | %(d) | | 1.22 | %(d) | | 2.60 | %(d) | | 26 | % |
| | | | | | | | | | | | | | | | | | | | | |
| 16.31 | | (36.04 | ) | | | 64,726 | | 1.14 | | | 1.74 | | | 1.14 | | | 1.74 | | | 45 | |
| 29.02 | | 8.11 | | | | 141,455 | | 1.13 | | | 1.25 | | | 1.13 | | | 1.25 | | | 55 | |
| 29.53 | | 20.29 | | | | 120,685 | | 1.18 | | | 1.28 | | | 1.18 | | | 1.28 | | | 49 | |
| 24.96 | | 11.26 | | | | 111,761 | | 1.18 | | | 1.12 | | | 1.19 | | | 1.11 | | | 37 | |
| 22.70 | | 9.61 | | | | 108,775 | | 1.14 | | | 1.00 | | | 1.16 | | | 0.98 | | | 81 | |
| | |
| The accompanying notes are an integral part of these financial statements. | | 59 |
COMMERCE FUNDS
Financial Highlights
Selected Data for a Share Outstanding Throughout Each Period
| | | | | | | | | | | | | | | | | | | | | | | | | | | |
| | | | | Income (loss) from
investment operations | | | Distributions
to shareholders | |
| Year-Share Class | | Net asset
value,
beginning
of period | | Net
investment
income
(loss)(a) | | | Net realized
and unrealized
gain (loss) | | | Total from
investment
operations | | | From net
investment
income | | | From net
realized
gains | | | Total
distributions | |
MIDCAP GROWTH FUND | | | | | | | | | | | | | | | | | | | | | | | | | | | |
For the Six Months Ended April 30, (Unaudited) | | | | | | | | | | | | | | | | | | | | | | | | | | | |
2009—Shares(c) | | $ | 21.13 | | $ | 0.03 | | | $ | 0.32 | | | $ | 0.35 | | | $ | (0.01 | ) | | $ | (0.89 | ) | | $ | (0.90 | ) |
For the Fiscal Years Ended October 31, | | | | | | | | | | | | | | | | | | | | | | | | | | | |
2008—Shares | | | 37.60 | | | 0.01 | | | | (13.72 | ) | | | (13.71 | ) | | | — | | | | (2.76 | ) | | | (2.76 | ) |
2007—Shares | | | 33.61 | | | (0.11 | ) | | | 4.14 | | | | 4.03 | | | | — | | | | (0.04 | ) | | | (0.04 | ) |
2006—Shares(e) | | | 28.45 | | | (0.11 | ) | | | 5.27 | | | | 5.16 | | | | — | | | | — | | | | — | |
2005—Shares | | | 24.72 | | | (0.14 | ) | | | 3.87 | | | | 3.73 | | | | — | | | | — | | | | — | |
2004—Shares | | | 23.61 | | | (0.14 | ) | | | 1.25 | | | | 1.11 | | | | — | | | | — | | | | — | |
| | | | | | | | | | | | | | | | | | | | | | | | | | | |
BOND FUND | | | | | | | | | | | | | | | | | | | | | | | | | | | |
For the Six Months Ended April 30, (Unaudited) | | | | | | | | | | | | | | | | | | | | | | | | | | | |
2009—Shares(c) | | $ | 17.29 | | $ | 0.46 | | | $ | 0.78 | | | $ | 1.24 | | | $ | (0.47 | ) | | $ | — | | | $ | (0.47 | ) |
For the Fiscal Years Ended October 31, | | | | | | | | | | | | | | | | | | | | | | | | | | | |
2008—Shares | | | 18.39 | | | 0.85 | | | | (1.07 | ) | | | (0.22 | ) | | | (0.88 | ) | | | — | | | | (0.88 | ) |
2007—Shares | | | 18.12 | | | 0.82 | | | | 0.31 | (f) | | | 1.13 | | | | (0.86 | ) | | | — | | | | (0.86 | ) |
2006—Shares(e) | | | 18.12 | | | 0.78 | | | | 0.06 | | | | 0.84 | | | | (0.84 | ) | | | — | | | | (0.84 | ) |
2005—Shares | | | 18.71 | | | 0.76 | | | | (0.49 | ) | | | 0.27 | | | | (0.86 | ) | | | — | | | | (0.86 | ) |
2004—Shares | | | 18.73 | | | 0.85 | | | | 0.03 | | | | 0.88 | | | | (0.90 | ) | | | — | | | | (0.90 | ) |
| (a) | | Calculated based on the average shares outstanding methodology. |
| (b) | | Assumes investment at the net asset value at the beginning of the period, reinvestment of all dividends and distributions, a complete redemption of the investment at the net asset value at the end of the period and no sales or redemption charges. Total returns would be reduced if sales or redemption charges were taken into account. Returns do not reflect the deduction of taxes that a shareholder would pay on Fund distributions or the redemption of Fund shares. Total returns for periods less than one full year are not annualized. |
| (c) | | On February 10, 2009, all outstanding Institutional Shares were redesignated to Shares. |
| (e) | | On February 3, 2006, all outstanding Service Shares were converted into Institutional Shares. |
| (f) | | Reflects an increase of $0.19 per share and 1.06% of average net assets due in payments received for class action settlements received this year. |
| (g) | | Total return reflects the impact of payments received for class action settlements received this year. Excluding such payments, the total return would have been 5.31%. |
| (h) | | Reflects an increase of 0.06% to total return and 0.04% of average net assets per share due to a payment made by the Trust’s Accounting Agent relating to a distribution in excess of net investment income. |
| | |
| 60 | | The accompanying notes are an integral part of these financial statements. |
COMMERCE FUNDS
| | | | | | | | | | | | | | | | | | | | | |
| | | | | | | | | | | | | | Ratios assuming no
expense reductions | | | | |
Net asset
value, end
of period | | Total
return(b) | | | Net assets
at end of
period
(in 000s) | | Ratio of
net expenses to
average net assets | | | Ratio of
net investment
income (loss) to
average net assets | | | Ratio of total
expenses to
average net assets | | | Ratio of
net investment
income (loss) to
average net assets | | | Portfolio
turnover
rate | |
| | | | | | | | | | | | | | | | | | | | | |
| | | | | | | | | | | | | | | | | | | | | |
| $20.58 | | 2.48 | % | | $ | 42,819 | | 1.35 | %(d) | | 0.30 | %(d) | | 1.35 | %(d) | | 0.30 | %(d) | | 16 | % |
| | | | | | | | | | | | | | | | | | | | | |
| 21.13 | | (39.07 | ) | | | 40,444 | | 1.21 | | | 0.02 | | | 1.21 | | | 0.02 | | | 57 | |
| 37.60 | | 12.01 | | | | 100,357 | | 1.18 | | | (0.32 | ) | | 1.18 | | | (0.32 | ) | | 65 | |
| 33.61 | | 18.14 | | | | 91,874 | | 1.22 | | | (0.35 | ) | | 1.22 | | | (0.35 | ) | | 64 | |
| 28.45 | | 15.09 | | | | 75,274 | | 1.28 | | | (0.54 | ) | | 1.29 | | | (0.55 | ) | | 87 | |
| 24.72 | | 4.70 | | | | 76,917 | | 1.23 | | | (0.57 | ) | | 1.25 | | | (0.59 | ) | | 123 | |
| | | | | | | | | | | | | | | | | | |
| | | | | | | | | | | | | | | | | | | | | |
| | | | | | | | | | | | | | | | | | | | | |
| $18.06 | | 7.23 | % | | $ | 523,430 | | 0.80 | %(d) | | 5.13 | %(d) | | 0.80 | %(d) | | 5.13 | %(d) | | 12 | % |
| | | | | | | | | | | | | | | | | | | | | |
| 17.29 | | (1.37 | ) | | | 495,168 | | 0.79 | | | 4.62 | | | 0.79 | | | 4.62 | | | 9 | |
| 18.39 | | 6.37 | (g) | | | 537,430 | | 0.82 | | | 4.50 | | | 0.82 | | | 4.50 | | | 23 | |
| 18.12 | | 4.76 | | | | 548,713 | | 0.85 | | | 4.35 | | | 0.85 | | | 4.35 | | | 38 | |
| 18.12 | | 1.46 | (h) | | | 569,200 | | 0.83 | | | 4.11 | (h) | | 0.84 | | | 4.10 | (h) | | 23 | |
| 18.71 | | 4.80 | | | | 608,773 | | 0.79 | | | 4.54 | | | 0.81 | | | 4.52 | | | 37 | |
| | |
| The accompanying notes are an integral part of these financial statements. | | 61 |
COMMERCE FUNDS
Financial Highlights
Selected Data for a Share Outstanding Throughout Each Period
| | | | | | | | | | | | | | | | | | | | | | | | | | |
| | | | | Income (loss) from
investment operations | | | Distributions
to shareholders | |
| Year-Share Class | | Net asset
value,
beginning
of period | | Net
investment
income(a) | | Net realized
and unrealized
gain (loss) | | | Total from
investment
operations | | | From net
investment
income | | | From net
realized
gains | | | Total
distributions | |
SHORT TERM GOVERNMENT FUND | | | | | | | | | | | | | | | | | | | | | | | | | | |
For the Six Months Ended April 30, (Unaudited) | | | | | | | | | | | | | | | | | | | | | | | | | | |
2009—Shares(c) | | $ | 17.53 | | $ | 0.28 | | $ | 0.46 | | | $ | 0.74 | | | $ | (0.40 | ) | | $ | — | | | $ | (0.40 | ) |
For the Fiscal Years Ended October 31, | | | | | | | | | | | | | | | | | | | | | | | | | | |
2008—Shares | | | 17.65 | | | 0.66 | | | (0.03 | ) | | | 0.63 | | | | (0.75 | ) | | | — | | | | (0.75 | ) |
2007—Shares | | | 17.56 | | | 0.69 | | | 0.16 | | | | 0.85 | | | | (0.76 | ) | | | — | | | | (0.76 | ) |
2006—Shares(e) | | | 17.57 | | | 0.61 | | | 0.11 | | | | 0.72 | | | | (0.73 | ) | | | — | | | | (0.73 | ) |
2005—Shares | | | 18.16 | | | 0.53 | | | (0.42 | ) | | | 0.11 | | | | (0.70 | ) | | | — | | | | (0.70 | ) |
2004—Shares | | | 18.53 | | | 0.54 | | | (0.18 | ) | | | 0.36 | | | | (0.73 | ) | | | — | | | | (0.73 | ) |
| | | | | | | | | | | | | | | | | | | | | | | | | | |
NATIONAL TAX-FREE INTERMEDIATE BOND FUND | | | | | | | | | | | | | | | | | | | | |
For the Six Months Ended April 30, (Unaudited) | | | | | | | | | | | | | | | | | | | | | | | | | | |
2009—Shares(c) | | $ | 17.82 | | $ | 0.36 | | $ | 1.06 | | | $ | 1.42 | | | $ | (0.36 | ) | | $ | (0.18 | ) | | $ | (0.54 | ) |
For the Fiscal Years Ended October 31, | | | | | | | | | | | | | | | | | | | | | | | | | | |
2008—Shares | | | 18.83 | | | 0.70 | | | (0.96 | ) | | | (0.26 | ) | | | (0.70 | ) | | | (0.05 | ) | | | (0.75 | ) |
2007—Shares | | | 19.07 | | | 0.71 | | | (0.19 | ) | | | 0.52 | | | | (0.71 | ) | | | (0.05 | ) | | | (0.76 | ) |
2006—Shares(e) | | | 19.05 | | | 0.72 | | | 0.13 | | | | 0.85 | | | | (0.73 | ) | | | (0.10 | ) | | | (0.83 | ) |
2005—Shares | | | 19.59 | | | 0.72 | | | (0.51 | ) | | | 0.21 | | | | (0.71 | ) | | | (0.04 | ) | | | (0.75 | ) |
2004—Shares | | | 19.74 | | | 0.71 | | | 0.17 | | | | 0.88 | | | | (0.72 | ) | | | (0.31 | ) | | | (1.03 | ) |
| (a) | | Calculated based on the average shares outstanding methodology. |
| (b) | | Assumes investment at the net asset value at the beginning of the period, reinvestment of all dividends and distributions, a complete redemption of the investment at the net asset value at the end of the period and no sales or redemption charges. Total returns would be reduced if sales or redemption charges were taken into account. Returns do not reflect the deduction of taxes that a shareholder would pay on Fund distributions or the redemption of Fund shares. Total returns for periods less than one full year are not annualized. |
| (c) | | On February 10, 2009, all outstanding Institutional Shares were redesignated to Shares. |
| (e) | | On February 3, 2006, all outstanding Service Shares were converted into Institutional Shares. |
| | |
| 62 | | The accompanying notes are an integral part of these financial statements. |
COMMERCE FUNDS
| | | | | | | | | | | | | | | | | | | | | |
| | | | | | | | | | | | | | Ratios assuming no
expense reductions | | | | |
Net asset
value, end
of period | | Total
return(b) | | | Net assets
at end of
period
(in 000s) | | Ratio of
net expenses to
average net assets | | | Ratio of
net investment
income to
average net assets | | | Ratio of total
expenses to
average net assets | | | Ratio of
net investment
income to
average net assets | | | Portfolio
turnover
rate | |
| | | | | | | | | | | | | | | | | | | | | |
| | | | | | | | | | | | | | | | | | | | | |
| $17.87 | | 4.24 | % | | $ | 79,341 | | 0.68 | %(d) | | 3.19 | %(d) | | 0.93 | %(d) | | 2.94 | %(d) | | 17 | % |
| | | | | | | | | | | | | | | | | | | | | |
| 17.53 | | 3.60 | | | | 78,455 | | 0.68 | | | 3.68 | | | 0.90 | | | 3.46 | | | 30 | |
| 17.65 | | 4.97 | | | | 87,511 | | 0.68 | | | 3.91 | | | 0.90 | | | 3.69 | | | 15 | |
| 17.56 | | 4.21 | | | | 129,940 | | 0.68 | | | 3.49 | | | 0.89 | | | 3.28 | | | 28 | |
| 17.57 | | 0.63 | | | | 157,183 | | 0.68 | | | 3.00 | | | 0.91 | | | 2.77 | | | 32 | |
| 18.16 | | 1.96 | | | | 219,533 | | 0.68 | | | 2.96 | | | 0.85 | | | 2.79 | | | 78 | |
| | | | | | | | | | | | | | | | | | |
| | | | | | | | | | | | | | | | | | | | | |
| | | | | | | | | | | | | | | | | | | | | |
| $18.70 | | 8.08 | % | | $ | 159,243 | | 0.70 | %(d) | | 3.93 | %(d) | | 0.81 | %(d) | | 3.82 | %(d) | | 12 | % |
| | | | | | | | | | | | | | | | | | | | | |
| 17.82 | | (1.47 | ) | | | 136,575 | | 0.70 | | | 3.76 | | | 0.82 | | | 3.64 | | | 45 | |
| 18.83 | | 2.81 | | | | 145,265 | | 0.70 | | | 3.78 | | | 0.83 | | | 3.65 | | | 42 | |
| 19.07 | | 4.57 | | | | 154,304 | | 0.70 | | | 3.80 | | | 0.88 | | | 3.62 | | | 42 | |
| 19.05 | | 1.09 | | | | 162,792 | | 0.70 | | | 3.71 | | | 0.87 | | | 3.54 | | | 48 | |
| 19.59 | | 4.56 | | | | 169,217 | | 0.70 | | | 3.67 | | | 0.84 | | | 3.53 | | | 33 | |
| | |
| The accompanying notes are an integral part of these financial statements. | | 63 |
COMMERCE FUNDS
Financial Highlights
Selected Data for a Share Outstanding Throughout Each Period
| | | | | | | | | | | | | | | | | | | | | | | | | |
| | | | | Income (loss) from
investment operations | | Distributions
to shareholders | |
| Year-Share Class | | Net asset
value,
beginning
of period | | Net
investment
income(a) | | Net realized
and unrealized
gain (loss) | | | Total from
investment
operations | | From net
investment
income | | | From net
realized
gains | | | Total
distributions | |
MISSOURI TAX-FREE INTERMEDIATE BOND FUND | | | | | | | | | | | | | | | | |
For the Six Months Ended April 30, (Unaudited) | | | | | | | | | | | | | | | | | | | | | | | | | |
2009—Shares(c) | | $ | 18.27 | | $ | 0.34 | | $ | 0.98 | | | $ | 1.32 | | $ | (0.34 | ) | | $ | (0.03 | ) | | $ | (0.37 | ) |
For the Fiscal Years Ended October 31, | | | | | | | | | | | | | | | | | | | | | | | | | |
2008—Shares | | | 19.01 | | | 0.69 | | | (0.66 | ) | | | 0.03 | | | (0.69 | ) | | | (0.08 | ) | | | (0.77 | ) |
2007—Shares | | | 19.22 | | | 0.71 | | | (0.19 | ) | | | 0.52 | | | (0.71 | ) | | | (0.02 | ) | | | (0.73 | ) |
2006—Shares(e) | | | 19.19 | | | 0.74 | | | 0.10 | | | | 0.84 | | | (0.75 | ) | | | (0.06 | ) | | | (0.81 | ) |
2005—Shares | | | 19.83 | | | 0.74 | | | (0.62 | ) | | | 0.12 | | | (0.74 | ) | | | (0.02 | ) | | | (0.76 | ) |
2004—Shares | | | 19.73 | | | 0.72 | | | 0.14 | | | | 0.86 | | | (0.72 | ) | | | (0.04 | ) | | | (0.76 | ) |
| | | | | | | | | | | | | | | | | | | | | | | | | |
KANSAS TAX-FREE INTERMEDIATE BOND FUND | | | | | | | | | | | | | | | | |
For the Six Months Ended April 30, (Unaudited) | | | | | | | | | | | | | | | | | | | | | | | | | |
2009—Shares(c) | | $ | 17.90 | | $ | 0.33 | | $ | 1.04 | | | $ | 1.37 | | $ | (0.33 | ) | | $ | (0.04 | ) | | $ | (0.37 | ) |
For the Fiscal Years Ended October 31, | | | | | | | | | | | | | | | | | | | | | | | | | |
2008—Shares | | | 18.58 | | | 0.64 | | | (0.63 | ) | | | 0.01 | | | (0.64 | ) | | | (0.05 | ) | | | (0.69 | ) |
2007—Shares | | | 18.78 | | | 0.66 | | | (0.14 | ) | | | 0.52 | | | (0.66 | ) | | | (0.06 | ) | | | (0.72 | ) |
2006—Shares(e) | | | 18.75 | | | 0.70 | | | 0.08 | | | | 0.78 | | | (0.70 | ) | | | (0.05 | ) | | | (0.75 | ) |
2005—Shares | | | 19.33 | | | 0.69 | | | (0.56 | ) | | | 0.13 | | | (0.69 | ) | | | (0.02 | ) | | | (0.71 | ) |
2004—Shares | | | 19.19 | | | 0.68 | | | 0.17 | | | | 0.85 | | | (0.68 | ) | | | (0.03 | ) | | | (0.71 | ) |
| (a) | | Calculated based on the average shares outstanding methodology. |
| (b) | | Assumes investment at the net asset value at the beginning of the period, reinvestment of all dividends and distributions, a complete redemption of the investment at the net asset value at the end of the period and no sales or redemption charges. Total returns would be reduced if sales or redemption charges were taken into account. Returns do not reflect the deduction of taxes that a shareholder would pay on Fund distributions or the redemption of Fund shares. Total returns for periods less than one full year are not annualized. |
| (c) | | On February 10, 2009, all outstanding Institutional Shares were redesignated to Shares. |
| (e) | | On February 3, 2006, all outstanding Service Shares were converted into Institutional Shares. |
| | |
| 64 | | The accompanying notes are an integral part of these financial statements. |
COMMERCE FUNDS
| | | | | | | | | | | | | | | | | | | | | |
| | | | | | | | | | | | | | Ratios assuming no
expense reductions | | | | |
Net asset
value, end
of period | | Total
return(b) | | | Net assets
at end of
period
(in 000s) | | Ratio of
net expenses to
average net assets | | | Ratio of
net investment
income to
average net assets | | | Ratio of total
expenses to
average net assets | | | Ratio of
net investment
income to
average net assets | | | Portfolio
turnover
rate | |
| | | | | | | | | | | | | | | | | | | | | |
| | | | | | | | | | | | | | | | | | | | | |
| $19.22 | | 7.25 | % | | $ | 209,794 | | 0.70 | %(d) | | 3.66 | %(d) | | 0.80 | %(d) | | 3.56 | %(d) | | 8 | % |
| | | | | | | | | | | | | | | | | | | | | |
| 18.27 | | 0.10 | | | | 169,838 | | 0.70 | | | 3.63 | | | 0.81 | | | 3.52 | | | 7 | |
| 19.01 | | 2.77 | | | | 148,824 | | 0.68 | | | 3.74 | | | 0.82 | | | 3.60 | | | 21 | |
| 19.22 | | 4.48 | | | | 159,628 | | 0.65 | | | 3.87 | | | 0.88 | | | 3.64 | | | 15 | |
| 19.19 | | 0.61 | | | | 172,124 | | 0.65 | | | 3.77 | | | 0.87 | | | 3.55 | | | 19 | |
| 19.83 | | 4.44 | | | | 179,089 | | 0.65 | | | 3.65 | | | 0.83 | | | 3.47 | | | 13 | |
| | | | | | | | | | | | | | | | | | | | | |
| | | | | | | | | | | | | | | | | | | | | |
| | | | | | | | | | | | | | | | | | | | | |
| $18.90 | | 7.70 | % | | $ | 74,815 | | 0.70 | %(d) | | 3.55 | %(d) | | 0.93 | %(d) | | 3.32 | %(d) | | 7 | % |
| | | | | | | | | | | | | | | | | | | | | |
| 17.90 | | 0.01 | | | | 68,986 | | 0.70 | | | 3.46 | | | 0.90 | | | 3.26 | | | 13 | |
| 18.58 | | 2.82 | | | | 69,270 | | 0.68 | | | 3.55 | | | 0.92 | | | 3.31 | | | 18 | |
| 18.78 | | 4.28 | | | | 69,075 | | 0.65 | | | 3.75 | | | 0.98 | | | 3.42 | | | 33 | |
| 18.75 | | 0.68 | | | | 68,128 | | 0.65 | | | 3.64 | | | 1.00 | | | 3.29 | | | 13 | |
| 19.33 | | 4.54 | | | | 68,940 | | 0.65 | | | 3.56 | | | 0.93 | | | 3.28 | | | 8 | |
| | |
| The accompanying notes are an integral part of these financial statements. | | 65 |
Fund Expenses (Unaudited) – Six Month Period Ended April 30, 2009
As a shareholder of the Funds you incur two types of costs: (1) transaction costs and (2) ongoing costs, including management fees; shareholder servicing fees and other Fund expenses. This Example is intended to help you understand your ongoing costs (in dollars) of investing in the Fund and to compare these costs with the ongoing costs of investing in other mutual funds.
The Example is based on an investment of $1,000 invested at the beginning of the period and held for the entire period from November 1, 2008 through April 30, 2009.
Actual Expenses — The first line in the table below provides information about actual account values and actual expenses. You may use the information in this line, together with the amount you invested, to estimate the expenses that you paid over the period. Simply divide your account value by $1,000 (for example, an $8,600 account value divided by $1,000=8.6), then multiply the result by the number in the first line under the heading entitled “Expenses Paid” to estimate the expenses you paid on your account during this period.
Hypothetical Example for Comparison Purposes — The second line in the table below provides information about hypothetical account values and hypothetical expenses based on the Funds’ actual net expense ratios and an assumed rate of return of 5% per year before expenses, which is not the Funds’ actual return. The hypothetical account values and expenses may not be used to estimate the actual ending account balance or expenses you paid for the period. You may use this information to compare the ongoing costs of investing in the Funds and other funds. To do so, compare this 5% hypothetical example with the 5% hypothetical examples that appear in the shareholder reports of the other funds.
Please note that the expenses shown in the table are meant to highlight your ongoing costs only and do not reflect any transactional costs, such as exchange fees, but shareholders of other funds may incur such costs. Therefore, the second line of the table is useful in comparing ongoing costs only, and will not help you determine the relative total costs of owning different funds. In addition, if these transactional costs were included, your costs would have been higher.
| | | | | | | | | | | | | | | | | | | | | | | | | | | | | | | | | | | | | | | | |
| Fund | | Beginning
Account
Value 11/01/08 | | Ending Account
Value 4/30/09 | | | Expenses
Paid for
the 6 months
ended
4/30/09* | | Beginning
Account
Value 11/01/08 | | Ending Account
Value 4/30/09 | | | Expenses
Paid for
the 6 months
ended
4/30/09* | | Beginning
Account
Value 11/01/08 | | Ending Account
Value 4/30/09 | | | Expenses
Paid for
the 6 months
ended
4/30/09* | | Beginning
Account
Value 11/01/08 | | Ending Account
Value 4/30/09 | | | Expenses
Paid for
the 6 months
ended
4/30/09* |
| | | Growth Fund | | Value Fund | | MidCap Growth Fund | | Bond Fund |
Shares | | | | | | | | | | | | | | | | | | | | | | | | | | | | | | | | | | | | | | | | |
| Actual | | $ | 1,000.00 | | $ | 978.10 | | | $ | 5.54 | | $ | 1,000.00 | | $ | 870.40 | | | $ | 5.56 | | $ | 1,000.00 | | $ | 1,024.80 | | | $ | 6.79 | | $ | 1,000.00 | | $ | 1,072.30 | | | $ | 4.11 |
| Hypothetical 5% return | | | 1,000.00 | | | 1,019.19 | + | | | 5.66 | | | 1,000.00 | | | 1,018.84 | + | | | 6.01 | | | 1,000.00 | | | 1,018.09 | + | | | 6.77 | | | 1,000.00 | | | 1,020.83 | + | | | 4.00 |
| | | Short-Term Government Fund | | National Tax-Free Intermediate
Bond Fund | | Missouri Tax-Free Intermediate
Bond Fund | | Kansas Tax-Free Intermediate
Bond Fund |
Shares | | | | | | | | | | | | | | | | | | | | | | | | | | | | | | | | | | | | | | | | |
| Actual | | $ | 1,000.00 | | $ | 1,042.40 | | | $ | 3.44 | | $ | 1,000.00 | | $ | 1,080.80 | | | $ | 3.60 | | $ | 1,000.00 | | $ | 1,072.50 | | | $ | 3.60 | | $ | 1,000.00 | | $ | 1,077.00 | | | $ | 3.60 |
| Hypothetical 5% return | | | 1,000.00 | | | 1,021.42 | + | | | 3.41 | | | 1,000.00 | | | 1,021.32 | + | | | 3.51 | | | 1,000.00 | | | 1,021.32 | + | | | 3.51 | | | 1,000.00 | | | 1,021.32 | + | | | 3.51 |
| * | | Expenses are calculated using each Fund’s annualized net expense ratio, which represents the ongoing expenses as a percentage of net assets for the six months ended April 30, 2009. Expenses are calculated by multiplying the annualized net expense ratio by the average account value for the period; then multiplying the result by the number of days in the most recent fiscal half year; and then dividing that result by the number of days in the year. The annualized net expense ratios for the period were as follows: |
| | | | | | | | | | |
Fund | | | | | | | Fund | | | |
| Growth | | 1.13 | % | | | | Short-Term Government | | 0.68 | % |
| Value | | 1.20 | | | | | National Tax-Free Intermediate Bond | | 0.70 | |
| MidCap Growth | | 1.35 | | | | | Missouri Tax-Free Intermediate Bond | | 0.70 | |
| Bond | | 0.80 | | | | | Kansas Tax-Free Intermediate Bond | | 0.70 | |
| + | | Hypothetical expenses are based on the Funds’ actual net expense ratios and an assumed rate of return of 5% per year before expenses. |
66
COMMERCE FUND
The Commerce Funds
Growth Fund:
The Fund is subject to market risk so that the value of the securities in which it invests may go up or down in response to the prospects of individual companies, particular industry sectors and/or general economic conditions. Investments in technology companies, who may produce or use products or services that prove commercially unsuccessful or become obsolete, may be subject to greater price volatility than securities of companies in other sectors.
Value Fund:
The Fund is subject to market risk so that the value of the securities in which it invests may go up or down in response to the prospects of individual companies, particular industry sectors and/or general economic conditions. Investments in technology companies, who may produce or use products or services that prove commercially unsuccessful or become obsolete, may be subject to greater price volatility than securities of companies in other sectors.
MidCap Growth Fund:
The Fund invests in small- and mid-capitalization securities. Generally, smaller and mid-sized companies are more vulnerable to adverse developments because of more limited product lines, markets or financial resources. As a result, the securities of smaller and mid-sized companies involve greater risks than those associated with larger, more established companies and may be subject to more abrupt or erratic trading and price movements. Investments in technology companies, who may produce or use products or services that prove commercially unsuccessful or become obsolete, may be subject to greater price volatility than securities of companies in other sectors.
Bond Fund:
Investments in fixed income securities are subject to the risks associated with debt securities including credit and interest rate risk. The guarantee on U.S. government securities applies only to the underlying securities of the Fund if held to maturity and not to the value of the Fund’s shares. Mortgage-backed securities, especially collateralized mortgage-backed securities, may be subject to risks that include price volatility, liquidity and enhanced sensitivity to interest rates. Asset-backed securities may be less liquid than other securities and therefore more difficult to value and liquidate, if necessary.
Short-Term Government Fund:
Investments in fixed income securities are subject to the risks associated with debt securities including credit and interest rate risk. The guarantee on U.S. government securities applies only to the underlying securities of the Fund if held to maturity and not to the value of the Fund’s shares. Mortgage-backed securities, especially collateralized mortgage-backed securities, may be subject to risks that include price volatility, liquidity and enhanced sensitivity to interest rates.
National Tax-Free Intermediate Bond Fund
Investments in fixed income securities are subject to the risks associated with debt securities including credit and interest rate risk. Investments in municipal securities can be significantly affected by political changes as well as uncertainties in the municipal market related to taxation or legislative changes. The Fund’s investments may subject shareholders to the federal alternative minimum tax and state income taxes.
Missouri Tax-Free Intermediate Bond Fund:
Investments in fixed income securities are subject to the risks associated with debt securities including credit and interest rate risk. The Fund invests its assets predominately in Missouri bonds. The actual payment of principal and interest on these bonds is dependent on the Missouri General Assembly allotting money each fiscal year for these payments. The Fund is
67
COMMERCE FUND
The Commerce Funds (continued)
non-diversified. Due to the small number of bonds generally held in the portfolio, the Fund may be subject to greater risks than a more diversified fund. A change in the value of any single holding may affect the overall value more than it would affect a diversified fund that holds more investments. Investments in municipal securities can be significantly affected by political changes as well as uncertainties in the municipal market related to taxation or legislative changes. In addition, the Fund’s investments may subject shareholders to federal alternative minimum tax. The investment income from this Fund may be subject to state income taxes.
Kansas Tax-Free Intermediate Bond Fund:
Investments in fixed income securities are subject to the risks associated with debt securities including credit and interest rate risk. The Fund invests its assets predominately in Kansas bonds. The actual payment of principal and interest on these bonds is dependent on the Kansas legislature allotting money each fiscal year for these payments. The Fund is non-diversified. Due to the smaller number of bonds generally held in the portfolio, the Fund may be subject to greater risks than a more diversified fund. A change in the value of any single holding may affect the overall value more than it would affect a diversified fund that holds more investments. Investments in municipal securities can be significantly affected by political changes as well as uncertainties in the municipal market related to taxation or legislative changes. In addition, the Fund’s investments may subject shareholders to federal alternative minimum tax. The investment income from this Fund may be subject to state income taxes.
68
| | |
| INVESTMENT ADVISER | | DISTRIBUTOR |
| AND CO-ADMINISTRATOR | | Goldman, Sachs & Co. |
| Commerce Investment Advisors, Inc. | | 32 Old Slip |
| 922 Walnut Street | | New York, New York 10005 |
| 4th Floor | | |
| Kansas City, Missouri 64106 | | CO-ADMINISTRATOR |
| | Goldman Sachs Asset Management |
| CUSTODIAN/ACCOUNTING AGENT | | 32 Old Slip |
| State Street Bank & Trust Company | | New York, New York 10005 |
| 1 Lincoln Street | | |
| Boston, Massachusetts 02110 | | INDEPENDENT REGISTERED |
| | PUBLIC ACCOUNTING FIRM |
| TRANSFER AGENT | | KPMG LLP |
| Boston Financial Data Services, Inc. | | 99 High Street |
| 330 W. 9th | | Boston, Massachusetts 02110 |
| 4th Floor | | |
| Kansas City, Missouri 64105 | | LEGAL COUNSEL |
| | Drinker Biddle & Reath LLP |
| | One Logan Square |
| | 18th and Cherry Streets |
| | Philadelphia, Pennsylvania 19103-6996 |
This Semi-Annual Report contains facts concerning The Commerce Funds’ objectives and policies, management, expenses, and other information. For more complete information about The Commerce Funds, a prospectus may be obtained by calling 1-800-995-6365. An investor should read the prospectus carefully before investing or sending money.
The Commerce Funds are advised by Commerce Investment Advisors, Inc., a subsidiary of Commerce Bank, N.A., which receives a fee for its services. The Commerce Funds are distributed by Goldman, Sachs & Co.
The Commerce Funds file their complete schedule of portfolio holdings with the Securities and Exchange Commission (the “SEC”) for the first and third quarters of each fiscal year on Form N-Q. The Funds’ Form N-Q is available on the SEC’s website at http://www.sec.gov. You may also review and obtain copies at the SEC’s Public Reference Room in Washington, D.C. Information about the Public Reference Room may be obtained by calling 1-800-SEC-0330.
A description of the policies and procedures that The Commerce Funds use to determine how to vote proxies relating to portfolio securities and information regarding how the Funds voted proxies relating to portfolio securities during the most recent 12-month period ended June 30 is available (i) without change, upon request by calling 1-800-995-6365 and (ii) on the SEC’s website at http://www.sec.gov.
This report is not authorized for distribution to prospective investors unless preceded or accompanied by a current prospectus, which contains, more complete information about the Commerce Funds’ investment policies, fees and expenses. Investors should read the prospectus carefully before investing.
| | | | |
| NOT FDIC INSURED | | MAY LOSE VALUE | | NO BANK GUARANTEE |
TRUSTEES
J. Eric Helsing, Chairman
David L. Bodde
Martin E. Galt III
Charles W. Peffer
OFFICERS
William Schuetter, President
Angela Dew, Vice President, Chief Compliance Officer and Anti-Money
Laundering Officer
Jeffrey Bolin, Assistant Vice President
Peter W. Fortner, Chief Accounting Officer
Scott McHugh, Treasurer
Philip V. Giuca Jr., Assistant Treasurer
Diana E. McCarthy, Secretary
George Djurasovic, Assistant Secretary

922 Walnut
Fourth Floor
Kansas City, Missouri 64106
www.commercefunds.com
1-800-995-6365
07-938/CB 5026
6/09
Not applicable for the reporting period.
| ITEM 3. | | AUDIT COMMITTEE FINANCIAL EXPERT. |
Not applicable for the reporting period.
| ITEM 4. | | PRINCIPAL ACCOUNTANT FEES AND SERVICES. |
Not applicable for the reporting period.
| ITEM 5. | | AUDIT COMMITTEE OF LISTED REGISTRANTS. |
Not applicable.
The Schedule of Investments is included as part of the Report to Shareholders filed under Item 1.
| ITEM 7. | | DISCLOSURE OF PROXY VOTING POLICIES AND PROCEDURES FOR CLOSED-END MANAGEMENT |
Not applicable.
| ITEM 8. | | PORTFOLIO MANAGERS OF CLOSED-END MANAGEMENT INVESTMENT COMPANIES. |
Not applicable.
| ITEM 9. | | PURCHASES OF EQUITY SECURITIES BY CLOSED-END MANAGEMENT INVESTMENT COMPANY AND |
Not applicable.
| ITEM 10. | | SUBMISSION OF MATTERS TO A VOTE OF SECURITY HOLDERS. |
There has been no material change to the procedures by which shareholders may recommend nominees to the registrant’s Board of Trustees.
| ITEM 11. | | CONTROLS AND PROCEDURES. |
| | (a) | The registrant’s principal executive and principal financial officers or persons performing similar functions have concluded that the registrant’s disclosure controls and procedures (as defined in Rule 30a-3(c) under the Investment Company Act of 1940, as amended (the “1940 Act”)) are effective as of a date within 90 days of the filing of this report, based on the evaluation of these controls and procedures required by Rule 30a-3(b) under the 1940 Act and 15d-15(b) under the Securities Exchange Act of 1934, as amended. |
| | (b) | There were no changes in the registrant’s internal control over financial reporting (as defined in Rule 30a-3(d) under the 1940 Act) that occurred during the second fiscal quarter of the period covered by this report that has materially affected, or is reasonably likely to materially affect, the registrant’s internal control over financial reporting. |
| | | | |
| (a)(1) | | Not applicable for the reporting period. |
| | |
| (a)(2) | | Exhibit 99.CERT | | Certifications pursuant to Section 302 of the Sarbanes-Oxley Act of 2002 are filed herewith. |
| | |
| (b)(1) | | Exhibit 99.906CERT | | Certifications pursuant to Section 906 of the Sarbanes-Oxley Act of 2002 are filed herewith. |
SIGNATURES
Pursuant to the requirements of the Securities Exchange Act of 1934 and the Investment Company Act of 1940, the registrant has duly caused this report to be signed on its behalf by the undersigned, thereunto duly authorized.
|
THE COMMERCE FUNDS |
|
| /s/ William Schuetter |
| William Schuetter |
| President |
June 26, 2009 |
Pursuant to the requirements of the Securities Exchange Act of 1934 and the Investment Company Act of 1940, this report has been signed below by the following persons on behalf of the registrant and in the capacities and on the dates indicated.
|
|
| /s/ William Schuetter |
| William Schuetter |
| President |
| The Commerce Funds |
June 26, 2009 |
|
|
| /s/ Peter Fortner |
| Peter Fortner |
| Chief Accounting Officer |
| The Commerce Funds |
June 26, 2009 |