UNITED STATES
SECURITIES AND EXCHANGE COMMISSION
Washington, D.C. 20549
FORM N-CSR
CERTIFIED SHAREHOLDER REPORT OF REGISTERED MANAGEMENT
INVESTMENT COMPANIES
Investment Company Act file number 811-8598
The Commerce Funds
(Exact name of registrant as specified in charter)
|
| 922 Walnut St., Fourth Floor, Mail Code = TB4-1, Kansas City, Missouri 64106 |
| (Address of principal executive offices) (Zip code) |
Diana E. McCarthy, Esq.,
Drinker Biddle & Reath LLP
One Logan Square, Suite 2000
Philadelphia, PA 19103
(Name and address of agent for service)
Registrant’s telephone number, including area code:1-800-995-6365
Date of fiscal year end 10/31
Date of reporting period: 4/30/11
| ITEM 1. | | REPORTS TO SHAREHOLDERS |
The Semi-Annual Report to Shareholders pursuant to Rule 30e-1 under the Investment Company Act of 1940 (17 CFR 270.30e-1) is filed herewith.

The Commerce Funds
The Commerce Funds
Semi-Annual Report
April 30, 2011
For Your Life’s Direction
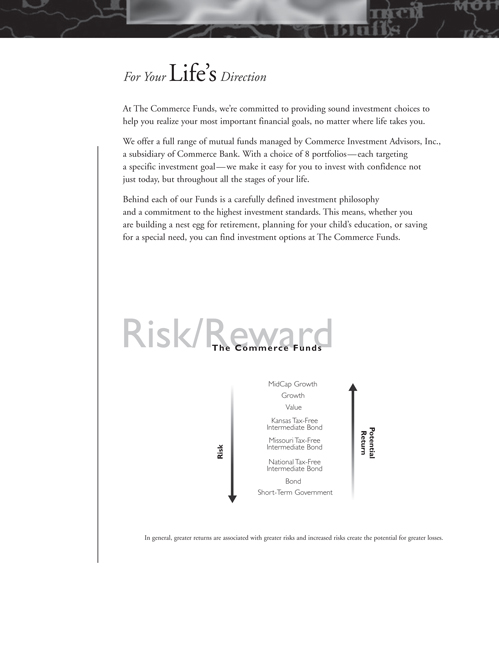
At The Commerce Funds, we’re committed to providing sound investment choices to help you realize your most important financial goals, no matter where life takes you.
We offer a full range of mutual funds managed by Commerce Investment Advisors, Inc., a subsidiary of Commerce Bank. With a choice of 8 portfolios—each targeting a specific investment goal—we make it easy for you to invest with confidence not
just today, but throughout all the stages of your life.
Behind each of our Funds is a carefully defined investment philosophy and a commitment to the highest investment standards. This means, whether you are building a nest egg for retirement, planning for your child’s education, or saving for a special need, you can find investment options at The Commerce Funds.
Risk/Reward
The Commerce Funds
Risk
MidCap Growth
Growth
Value
Kansas Tax-Free
Intermediate Bond
Missouri Tax-Free
Intermediate Bond
National Tax-Free
Intermediate Bond
Bond
Short-Term Government
Potential
Return
In general, greater returns are associated with greater risks and increased risks create the potential for greater losses.
COMMERCE FUNDS
Table of Contents
Please note:
The information in this semi-annual report is as of April 30, 2011 and is unaudited. To view more recent information about each Commerce Fund’s performance and portfolio or to obtain a prospectus, please visit our website at www.commercefunds.com. This report is not authorized for distribution to prospective shareholders unless accompanied or preceded by a prospectus, which contains more complete information about the Commerce Funds’ investment policies, management and expenses. Investors should read the prospectus carefully before investing.
You may also receive Commerce Funds information by calling toll free 1-800-995-6365 or by writing to P.O. Box 219525, Kansas City, Missouri, 64121-9525, or you may contact your investment professional. The Commerce Funds publish performance and portfolio information for each Commerce Fund at the end of every calendar quarter. Investors should read the prospectus carefully before investing or sending money.
COMMERCE FUNDS
Performance and Expense Ratio Information
April 30, 2011 (Unaudited)
| | | | | | | | | | |
PERFORMANCE REVIEW | | | | | | | | | | |
| November 1, 2010 - April 30, 2011 | | Fund Total Return(a) | | | Index Total Return | | | Index |
Equity Funds: | | | | | | | | | | |
Growth | | | 13.68 | % | | | 16.96 | % | | Russell 1000® Growth(b) |
Value | | | 18.88 | | | | 17.29 | | | Russell 1000® Value(c) |
Mid Cap Growth | | | 19.33 | | | | 22.62 | | | Russell Midcap® Growth(d) |
Fixed Income Funds: | | | | | | | | | | |
Bond | | | 1.13 | | | | 0.02 | | | Barclays Capital U.S. Aggregate Bond(e) |
Short-Term Government | | | 0.10 | | | | -0.26 | | | Citigroup 1-5 Year Treasury/Government Sponsored(f) |
National Tax-Free Intermediate Bond | | | -1.03 | | | | -0.33 | | | Barclays Capital 3-15 Year Blend(g) |
Missouri Tax-Free Intermediate Bond | | | -0.51 | | | | -0.33 | | | Barclays Capital 3-15 Year Blend(g) |
Kansas Tax-Free Intermediate Bond | | | -0.49 | | | | -0.33 | | | Barclays Capital 3-15 Year Blend(g) |
| (a) | | Returns assume expense reimbursements and are not annualized. Returns do not reflect the deduction of taxes that a shareholder would pay on capital gains or other taxable distributions or the redemption of Fund shares. |
| (b) | | The Russell 1000® Growth Index, an unmanaged index, is a market capitalization weighted index of those 1,000 Russell companies with higher price-to-book ratios and higher forecasted growth values. The Index figures do not reflect the deduction of any fees, expenses or taxes. |
| (c) | | The Russell 1000® Value Index is an unmanaged market capitalization weighted index of those 1,000 Russell companies with lower price-to-book ratios and lower forecasted growth values. The Index figures do not reflect the deduction of any fees, expenses or taxes. |
| (d) | | The Russell Midcap® Growth Index, an unmanaged index, measures the performance of those Russell midcap companies with higher price-to-book ratios and higher forecasted growth values. The Index figures do not reflect the deduction of any fees, expenses or taxes. |
| (e) | | The Barclays Capital U.S. Aggregate Bond Index is an unmanaged index comprised of the Barclays Capital Government Corporate Bond Index, Mortgage-Backed Securities Index and Asset-Backed Securities Index. The Index figures do not reflect the deduction of any fees, expenses or taxes. |
| (f) | | The Citigroup 1-5 Year Treasury/Government Sponsored Index is an unmanaged index comprised of Treasury securities with a minimum principal amount of $1 billion and U.S. Government securities with a minimum principal amount of $100 million. The securities range in maturity from one to five years. The Index figures do not reflect the deduction of any fees, expenses or taxes. |
| (g) | | The Barclays Capital 3-15 Year Blend Index is an unmanaged index composed of investment grade municipal securities ranging from 2 to 17 years in maturity. The Index figures do not reflect the deduction of any fees, expenses or taxes. |
| | | | | | | | | | | | | | | | | | | | |
STANDARDIZED AVERAGE ANNUAL TOTAL RETURNS(h) | | | | | | | | | | | | | | | | | | | | |
| For the period ended 03/31/2011 | | One Year | | | Five Years | | | Ten Years | | | Since Inception | | | Inception Date | |
Equity Funds: | | | | | | | | | | | | | | | | | | | | |
Growth | | | 13.64 | % | | | 2.73 | % | | | 2.32 | % | | | 7.15 | % | | | 12/12/94 | |
Value | | | 15.34 | | | | 0.75 | | | | 2.80 | | | | 4.32 | | | | 3/3/97 | |
Mid Cap Growth | | | 28.62 | | | | 4.42 | | | | 5.20 | | | | 7.95 | | | | 12/12/94 | |
Fixed Income Funds: | | | | | | | | | | | | | | | | | | | | |
Bond | | | 8.05 | | | | 7.37 | | | | 5.68 | | | | 6.54 | | | | 12/12/94 | |
Short-Term Government | | | 3.14 | | | | 4.82 | | | | 3.91 | | | | 5.08 | | | | 12/12/94 | |
National Tax-Free Intermediate Bond | | | 2.18 | | | | 3.93 | | | | 4.09 | | | | 4.62 | | | | 2/21/95 | |
Missouri Tax-Free Intermediate Bond | | | 1.99 | | | | 3.81 | | | | 3.93 | | | | 4.47 | | | | 2/21/95 | |
Kansas Tax-Free Intermediate Bond | | | 1.78 | | | | 3.84 | | | | 3.95 | | | | 4.16 | | | | 12/26/00 | |
| (h) | | The Standardized Average Annual Total Returns are average annual total returns as of the most recent calendar quarter-end. They assume reinvestment of all distributions at NAV. |
These returns represent past performance. Past performance does not guarantee future results. The investment return and principal value of an investment will fluctuate and, therefore, an investor’s shares, when redeemed, may be worth more or less than their original cost. Current performance may be lower or higher than the total return figures in the above charts.
Returns assume fee waivers and expense reductions. Absent these waivers and reductions, returns would have been lower. Returns do not reflect the deduction of taxes that a shareholder would pay on capital gains or other taxable distributions or the redemption of Fund shares.
| | | | | | | | |
EXPENSE RATIOS(i) | | | | | | | | |
| | | Net Expense Ratio (Current) | | | Gross Expense Ratio (Before Reimbursement) | |
Equity Funds: | | | | | | | | |
Growth | | | 1.13 | % | | | 1.25 | % |
Value | | | 0.70 | | | | 0.95 | |
Mid Cap Growth | | | 1.34 | | | | 1.34 | |
Fixed Income Funds: | | | | | | | | |
Bond | | | 0.84 | | | | 0.84 | |
Short-Term Government | | | 0.68 | | | | 0.90 | |
National Tax-Free Intermediate Bond | | | 0.70 | | | | 0.87 | |
Missouri Tax-Free Intermediate Bond | | | 0.70 | | | | 0.86 | |
Kansas Tax-Free Intermediate Bond | | | 0.70 | | | | 0.96 | |
| (i) | | The expense ratios of the Funds, both current (net of applicable fee waivers and/or expense limitations) and before waivers (gross of applicable fee waivers and/or expense limitations), are as set forth above according to the most recent publicly available Prospectus for the Funds and may differ from the expense ratios disclosed in the Financial Highlights in this report. Applicable waivers and expense limitations may be modified or terminated in the future, consistent with the terms of any arrangements in place. If this occurs, the expense ratios may change without shareholder approval. |
2
COMMERCE GROWTH FUND
Schedule of Investments
April 30, 2011 (Unaudited)
| | | | | | | | |
| | |
| Shares | | | Description | | Value | |
| | Common Stocks – 94.7% | |
| Commercial Services – 1.0% | |
| | 33,200 | | | Thomson Reuters Corp. | | | $ 1,343,604 | |
| | | |
| Communications* – 1.0% | |
| | 34,000 | | | SBA Communications Corp. Class A | | | 1,313,420 | |
| | | |
| Consumer Durables – 2.4% | |
| | 142,100 | | | Ford Motor Co.* | | | 2,198,287 | |
| | 44,300 | | | Leggett & Platt, Inc. | | | 1,164,647 | |
| | | | | | | | |
| | | | | | | 3,362,934 | |
| | | |
| Consumer Non-Durables – 5.4% | |
| | 22,500 | | | Coach, Inc. | | | 1,345,725 | |
| | 8,600 | | | Colgate-Palmolive Co. | | | 725,410 | |
| | 29,400 | | | PepsiCo, Inc. | | | 2,025,366 | |
| | 22,400 | | | Philip Morris International, Inc. | | | 1,555,456 | |
| | 9,700 | | | Polo Ralph Lauren Corp. | | | 1,268,469 | |
| | 7,800 | | | The Coca-Cola Co. | | | 526,188 | |
| | | | | | | | |
| | | | | | | 7,446,614 | |
| | | |
| Consumer Services – 5.3% | |
| | 40,800 | | | DIRECTV Class A* | | | 1,982,472 | |
| | 20,700 | | | eBay, Inc.* | | | 712,080 | |
| | 28,900 | | | Expedia, Inc. | | | 723,367 | |
| | 41,400 | | | Las Vegas Sands Corp.* | | | 1,946,214 | |
| | 5,100 | | | McDonald’s Corp. | | | 399,381 | |
| | 42,800 | | | Starbucks Corp. | | | 1,548,932 | |
| | | | | | | | |
| | | | | | | 7,312,446 | |
| | | |
| Electronic Technology – 19.0% | |
| | 15,700 | | | Apple, Inc.* | | | 5,467,211 | |
| | 83,100 | | | Cadence Design Systems, Inc.* | | | 862,578 | |
| | 84,300 | | | Cisco Systems, Inc. | | | 1,480,308 | |
| | 95,200 | | | Dell, Inc.* | | | 1,476,552 | |
| | 7,900 | | | F5 Networks, Inc.* | | | 800,744 | |
| | 16,400 | | | Harris Corp. | | | 871,332 | |
| | 74,400 | | | Hewlett-Packard Co. | | | 3,003,528 | |
| | 119,000 | | | Intel Corp. | | | 2,759,610 | |
| | 50,600 | | | Linear Technology Corp. | | | 1,760,880 | |
| | 11,600 | | | Lockheed Martin Corp. | | | 919,300 | |
| | 33,600 | | | Novellus Systems, Inc.* | | | 1,078,560 | |
| | 81,300 | | | QLogic Corp.* | | | 1,461,774 | |
| | 23,300 | | | QUALCOMM, Inc. | | | 1,324,372 | |
| | 61,800 | | | Texas Instruments, Inc. | | | 2,195,754 | |
| | 16,400 | | | Zebra Technologies Corp. Class A* | | | 644,356 | |
| | | | | | | | |
| | | | | | | 26,106,859 | |
| | | |
| Energy Minerals – 10.8% | |
| | 44,300 | | | Arch Coal, Inc. | | | 1,519,490 | |
| | 18,700 | | | Chevron Corp. | | | 2,046,528 | |
| | 8,000 | | | Cimarex Energy Co. | | | 884,720 | |
| | 19,300 | | | ConocoPhillips | | | 1,523,349 | |
| | 72,500 | | | Exxon Mobil Corp. | | | 6,380,000 | |
| | 22,200 | | | Occidental Petroleum Corp. | | | 2,537,238 | |
| | | | | | | | |
| | | | | | | 14,891,325 | |
| | | |
| Finance – 2.3% | |
| | 46,400 | | | Morgan Stanley & Co. | | | 1,213,360 | |
| | | |
| | | | | | | | |
| | |
| Shares | | | Description | | Value | |
| | Common Stocks – (continued) | |
| Finance – (continued) | |
| | 15,800 | | | Prudential Financial, Inc. | | | $ 1,002,036 | |
| | 51,400 | | | The Charles Schwab Corp. | | | 941,134 | |
| | | | | | | | |
| | | | | | | 3,156,530 | |
| | | |
| Health Services* – 1.5% | |
| | 35,000 | | | Medco Health Solutions, Inc. | | | 2,076,550 | |
| | | |
| Health Technology – 6.5% | |
| | 13,000 | | | Abbott Laboratories | | | 676,520 | |
| | 22,400 | | | Allergan, Inc. | | | 1,782,144 | |
| | 19,600 | | | C. R. Bard, Inc. | | | 2,092,300 | |
| | 48,700 | | | Gilead Sciences, Inc.* | | | 1,891,508 | |
| | 6,500 | | | Johnson & Johnson | | | 427,180 | |
| | 26,200 | | | Medtronic, Inc. | | | 1,093,850 | |
| | 15,500 | | | Stryker Corp. | | | 914,500 | |
| | | | | | | | |
| | | | | | | 8,878,002 | |
| | | |
| Industrial Services – 2.2% | |
| | 8,900 | | | Diamond Offshore Drilling, Inc. | | | 675,243 | |
| | 26,100 | | | Schlumberger Ltd. | | | 2,342,475 | |
| | | | | | | | |
| | | | | | | 3,017,718 | |
| | | |
| Non-Energy Minerals – 3.5% | |
| | 17,100 | | | Cliffs Natural Resources, Inc. | | | 1,602,612 | |
| | 26,000 | | | Freeport-McMoRan Copper & Gold, Inc. | | | 1,430,780 | |
| | 9,600 | | | Newmont Mining Corp. | | | 562,656 | |
| | 31,500 | | | Southern Copper Corp. | | | 1,179,990 | |
| | | | | | | | |
| | | | | | | 4,776,038 | |
| | | |
| Process Industries – 1.1% | |
| | 49,300 | | | International Paper Co. | | | 1,522,384 | |
| | | |
| Producer Manufacturing – 7.9% | |
| | 6,200 | | | Cummins, Inc. | | | 745,116 | |
| | 16,800 | | | Eaton Corp. | | | 899,304 | |
| | 64,100 | | | General Electric Co. | | | 1,310,845 | |
| | 22,300 | | | The Timken Co. | | | 1,257,497 | |
| | 23,900 | | | TRW Automotive Holdings Corp.* | | | 1,363,734 | |
| | 40,600 | | | United Technologies Corp. | | | 3,636,948 | |
| | 23,200 | | | WABCO Holdings, Inc.* | | | 1,713,320 | |
| | | | | | | | |
| | | | | | | 10,926,764 | |
| | | |
| Retail Trade – 5.7% | |
| | 6,400 | | | AutoZone, Inc.* | | | 1,807,232 | |
| | 12,900 | | | Dollar Tree, Inc.* | | | 741,750 | |
| | 81,700 | | | Lowe’s Cos., Inc. | | | 2,144,625 | |
| | 4,400 | | | Netflix, Inc.* | | | 1,023,748 | |
| | 14,900 | | | Target Corp. | | | 731,590 | |
| | 58,800 | | | The Gap, Inc. | | | 1,366,512 | |
| | | | | | | | |
| | | | | | | 7,815,457 | |
| | | |
| Technology Services – 15.6% | |
| | 26,700 | | | Adobe Systems, Inc.* | | | 895,785 | |
| | 33,800 | | | BMC Software, Inc.* | | | 1,697,774 | |
| | 7,400 | | | Google, Inc. Class A* | | | 4,026,340 | |
| | 39,100 | | | International Business Machines Corp. | | | 6,669,678 | |
| | | |
| | |
| The accompanying notes are an integral part of these financial statements. | | 3 |
COMMERCE GROWTH FUND
Schedule of Investments (continued)
April 30, 2011 (Unaudited)
| | | | | | | | |
| | |
| Shares | | | Description | | Value | |
| | Common Stocks – (continued) | |
| Technology Services – (continued) | |
| | 120,800 | | | Microsoft Corp. | | | $ 3,143,216 | |
| | 86,700 | | | Oracle Corp. | | | 3,125,535 | |
| | 17,700 | | | Rovi Corp.* | | | 859,512 | |
| | 26,200 | | | VeriSign, Inc. | | | 968,352 | |
| | | | | | | | |
| | | | | | | 21,386,192 | |
| | | |
| Transportation – 3.5% | |
| | 52,000 | | | Frontline Ltd. | | | 1,149,720 | |
| | 15,500 | | | Union Pacific Corp. | | | 1,603,785 | |
| | 62,450 | | | United Continental Holdings, Inc.* | | | 1,425,109 | |
| | 8,800 | | | United Parcel Service, Inc. Class B | | | 659,736 | |
| | | | | | | | |
| | | | | | | 4,838,350 | |
| | | |
| | TOTAL COMMON STOCKS | |
| (Cost $109,224,033) | | | $130,171,187 | |
| | | |
| | | | | | | | |
| | Exchange Traded Fund – 3.6% | |
| | 78,400 | | | iShares Russell 1000 Growth Index Fund | |
| (Cost $4,679,877) | | | $ 4,896,080 | |
| | | |
| | | | | | | | | | | | |
Principal
Amount | | Interest
Rate | | | Maturity
Date | | | Value | |
| Short-term Investment(a) – 1.8% | |
Repurchase Agreement – 1.8% | |
| State Street Bank & Trust Co. | |
| $2,509,000 | | | 0.010 | % | | | 05/02/11 | | | $ | 2,509,000 | |
Maturity Value: $2,509,002 | |
(Cost $2,509,000) | | | | | | | | | |
| | |
| TOTAL INVESTMENTS – 100.1% | |
(Cost $116,412,910) | | | | | | | $ | 137,576,267 | |
| | |
LIABILITIES IN EXCESS OF
OTHER ASSETS – (0.1)% | | | | (69,890) | |
| | |
| NET ASSETS – 100.0% | | | $ | 137,506,377 | |
| | |
| | |
| The percentage shown for each investment category reflects the value of investments in that category as a percentage of net assets. |
| * | | Non-income producing security. |
| (a) | | Repurchase agreement was entered into on April 29, 2011. This agreement was fully collateralized by $2,530,000 U.S. Treasury Note, 1.000%, due 04/30/12 with a market value of $2,561,160. |
| |
PORTFOLIO COMPOSITION
| | | | | | | | |
| | | AS OF
4/30/11 | | | AS OF
10/31/10 | |
| | |
Electronic Technology | | | 19.0 | % | | | 20.6 | % |
Technology Services | | | 15.6 | | | | 16.0 | |
Energy Minerals | | | 10.8 | | | | 7.8 | |
Producer Manufacturing | | | 7.9 | | | | 7.0 | |
Health Technology | | | 6.5 | | | | 10.6 | |
Retail Trade | | | 5.7 | | | | 4.9 | |
Consumer Non-Durables | | | 5.4 | | | | 8.3 | |
Consumer Services | | | 5.3 | | | | 5.0 | |
Exchange Traded Fund | | | 3.6 | | | | — | |
Transportation | | | 3.5 | | | | 2.9 | |
Non-Energy Minerals | | | 3.5 | | | | 1.5 | |
Consumer Durables | | | 2.4 | | | | 2.7 | |
Finance | | | 2.3 | | | | 3.0 | |
Industrial Services | | | 2.2 | | | | 2.0 | |
Health Services | | | 1.5 | | | | 2.5 | |
Process Industries | | | 1.1 | | | | 2.4 | |
Communications | | | 1.0 | | | | 1.1 | |
Commercial Services | | | 1.0 | | | | — | |
Distribution Services | | | — | | | | 1.2 | |
Short-term Investment | | | 1.8 | | | | 0.6 | |
| | |
| TOTAL INVESTMENTS | | | 100.1 | % | | | 100.1 | % |
| | |
The percentage shown for each investment category reflects the value of investments in that category as a percentage of net assets. Underlying investment categories of exchange traded funds (“ETFs”) held by the Fund are not reflected in the table above. Consequently, the Fund’s overall investment category allocations may differ from the percentages contained in the table above.
The Fund is actively managed and, as such, its composition may differ over time.
| | |
| 4 | | The accompanying notes are an integral part of these financial statements. |
COMMERCE VALUE FUND
Schedule of Investments
April 30, 2011 (Unaudited)
| | | | | | | | |
| | |
| Shares | | | Description | | Value | |
| | Common Stocks – 94.9% | |
| Commercial Services – 0.4% | |
| | 11,000 | | | R.R. Donnelley & Sons Co. | | | $ 207,460 | |
| | | |
| Communications – 4.9% | |
| | 55,000 | | | AT&T, Inc. | | | 1,711,600 | |
| | 6,656 | | | CenturyLink, Inc. | | | 271,432 | |
| | 22,000 | | | Verizon Communications, Inc. | | | 831,160 | |
| | | | | | | | |
| | | | | | | 2,814,192 | |
| | | |
| Consumer Non-Durables – 18.6% | |
| | 41,500 | | | Altria Group, Inc. | | | 1,113,860 | |
| | 40,000 | | | Avon Products, Inc. | | | 1,175,200 | |
| | 23,000 | | | ConAgra Foods, Inc. | | | 562,350 | |
| | 12,000 | | | General Mills, Inc. | | | 462,960 | |
| | 17,000 | | | Kimberly-Clark Corp. | | | 1,123,020 | |
| | 17,000 | | | PepsiCo, Inc. | | | 1,171,130 | |
| | 17,500 | | | Procter & Gamble Co. | | | 1,135,750 | |
| | 31,000 | | | Reynolds American, Inc. | | | 1,150,410 | |
| | 16,000 | | | The Coca-Cola Co. | | | 1,079,360 | |
| | 10,000 | | | The Hershey Co. | | | 577,100 | |
| | 11,000 | | | V.F. Corp. | | | 1,106,160 | |
| | | | | | | | |
| | | | | | | 10,657,300 | |
| | | |
| Consumer Services – 0.9% | |
| | 11,000 | | | Darden Restaurants, Inc. | | | 516,670 | |
| | | |
| Distribution Services – 1.9% | |
| | 20,000 | | | Genuine Parts Co. | | | 1,074,000 | |
| | | |
| Electronic Technology – 8.2% | |
| | 3,000 | | | General Dynamics Corp. | | | 218,460 | |
| | 25,000 | | | Intel Corp. | | | 579,750 | |
| | 20,000 | | | Intersil Corp. Class A | | | 295,400 | |
| | 32,500 | | | Linear Technology Corp. | | | 1,131,000 | |
| | 14,000 | | | Lockheed Martin Corp. | | | 1,109,500 | |
| | 29,000 | | | Microchip Technology, Inc. | | | 1,190,160 | |
| | 4,000 | | | Raytheon Co. | | | 194,200 | |
| | | | | | | | |
| | | | | | | 4,718,470 | |
| | | |
| Energy Minerals – 8.6% | |
| | 25,500 | | | Chevron Corp. | | | 2,790,720 | |
| | 27,500 | | | ConocoPhillips | | | 2,170,575 | |
| | | | | | | | |
| | | | | | | 4,961,295 | |
| | | |
| Finance – 11.3% | |
| | 3,500 | | | Bank of Hawaii Corp. | | | 170,765 | |
| | 1,500 | | | BlackRock, Inc. | | | 293,910 | |
| | 21,000 | | | Federated Investors, Inc. Class B | | | 541,380 | |
| | 30,000 | | | GATX Corp. | | | 1,268,100 | |
| | 6,000 | | | HCP, Inc. | | | 237,720 | |
| | 58,500 | | | Kimco Realty Corp. | | | 1,143,090 | |
| | 16,000 | | | Liberty Property Trust | | | 562,720 | |
| | 3,000 | | | M&T Bank Corp. | | | 265,110 | |
| | 8,000 | | | Senior Housing Properties Trust | | | 189,760 | |
| | 2,000 | | | Simon Property Group, Inc. | | | 229,080 | |
| | 4,000 | | | Taubman Centers, Inc. | | | 232,600 | |
| | 6,000 | | | The Chubb Corp. | | | 391,140 | |
| | 8,500 | | | The Travelers Cos., Inc. | | | 537,880 | |
| | | |
| | | | | | | | |
| | |
| Shares | | | Description | | Value | |
| | Common Stocks – (continued) | |
| Finance – (continued) | |
| | 2,000 | | | Vornado Realty Trust | | | $ 193,360 | |
| | 10,000 | | | Weyerhaeuser Co. | | | 230,100 | |
| | | | | | | | |
| | | | | | | 6,486,715 | |
| | | |
| Health Technology – 8.6% | |
| | 16,000 | | | Abbott Laboratories | | | 832,640 | |
| | 8,000 | | | Eli Lilly & Co. | | | 296,080 | |
| | 20,000 | | | Johnson & Johnson | | | 1,314,400 | |
| | 22,000 | | | Merck & Co., Inc. | | | 790,900 | |
| | 80,000 | | | Pfizer, Inc. | | | 1,676,800 | |
| | | | | | | | |
| | | | | | | 4,910,820 | |
| | | |
| Industrial Services – 0.9% | |
| | 13,000 | | | Waste Management, Inc. | | | 512,980 | |
| | | |
| Process Industries – 4.2% | |
| | 17,000 | | | Greif, Inc. Class A | | | 1,055,700 | |
| | 9,000 | | | MeadWestvaco Corp. | | | 303,210 | |
| | 30,000 | | | Sonoco Products Co. | | | 1,036,800 | |
| | | | | | | | |
| | | | | | | 2,395,710 | |
| | | |
| Producer Manufacturing – 6.5% | |
| | 5,000 | | | Eaton Corp. | | | 267,650 | |
| | 90,000 | | | General Electric Co. | | | 1,840,500 | |
| | 19,000 | | | Illinois Tool Works, Inc. | | | 1,109,790 | |
| | 22,000 | | | Pitney Bowes, Inc. | | | 540,320 | |
| | | | | | | | |
| | | | | | | 3,758,260 | |
| | | |
| Retail Trade – 3.0% | |
| | 60,000 | | | SUPERVALU, Inc. | | | 675,600 | |
| | 28,000 | | | The Home Depot, Inc. | | | 1,039,920 | |
| | | | | | | | |
| | | | | | | 1,715,520 | |
| | | |
| Technology Services – 5.6% | |
| | 21,000 | | | Automatic Data Processing, Inc. | | | 1,141,350 | |
| | 40,000 | | | Microsoft Corp. | | | 1,040,800 | |
| | 31,000 | | | Paychex, Inc. | | | 1,014,010 | |
| | | | | | | | |
| | | | | | | 3,196,160 | |
| | | |
| Utilities – 11.3% | |
| | 6,000 | | | Alliant Energy Corp. | | | 237,240 | |
| | 6,000 | | | DTE Energy Co. | | | 303,180 | |
| | 20,000 | | | Duke Energy Corp. | | | 373,000 | |
| | 8,000 | | | Edison International | | | 314,160 | |
| | 5,000 | | | Exelon Corp. | | | 210,750 | |
| | 47,500 | | | MDU Resources Group, Inc. | | | 1,134,775 | |
| | 21,000 | | | OGE Energy Corp. | | | 1,116,570 | |
| | 16,000 | | | ONEOK, Inc. | | | 1,119,040 | |
| | 5,000 | | | PG&E Corp. | | | 230,400 | |
| | 4,500 | | | Progress Energy, Inc. | | | 213,525 | |
| | 8,000 | | | Questar Corp. | | | 140,560 | |
| | 7,000 | | | The Southern Co. | | | 273,280 | |
| | 17,000 | | | UGI Corp. | | | 566,100 | |
| | 10,000 | | | Xcel Energy, Inc. | | | 243,300 | |
| | | | | | | | |
| | | | | | | 6,475,880 | |
| | | |
| | TOTAL COMMON STOCKS | |
| (Cost $49,708,979) | | | $54,401,432 | |
| | | |
| | |
| The accompanying notes are an integral part of these financial statements. | | 5 |
COMMERCE VALUE FUND
Schedule of Investments (continued)
April 30, 2011 (Unaudited)
| | | | | | | | |
| | |
| Shares | | | Description | | Value | |
| | Exchange Traded Fund – 2.1% | |
| | 17,500 | | | iShares Russell 1000 Value Index Fund | | | | |
| (Cost $1,162,996) | | | $ 1,232,875 | |
| | | |
| | | | | | | | | | | | |
Principal
Amount | | Interest
Rate | | | Maturity
Date | | | Value | |
| Short-term Investment(a) – 2.9% | |
Repurchase Agreement – 2.9% | |
| State Street Bank & Trust Co. | |
| $1,657,000 | | | 0.010 | % | | | 05/02/11 | | | $ | 1,657,000 | |
Maturity Value: $1,657,001 | |
(Cost $1,657,000) | | | | | | | | | |
| | |
| TOTAL INVESTMENTS – 99.9% | |
(Cost $52,528,975) | | | | | | | $ | 57,291,307 | |
| | |
OTHER ASSETS IN EXCESS OF LIABILITIES – 0.1% | | | | 56,149 | |
| | |
| NET ASSETS – 100.0% | | | $ | 57,347,456 | |
| | |
| | |
| The percentage shown for each investment category reflects the value of investments in that category as a percentage of net assets. |
| (a) | | Repurchase agreement was entered into on April 29, 2011. This agreement was fully collateralized by $1,670,000 U.S. Treasury Note, 1.000%, due 04/30/12 with a market value of $1,690,568. |
| |
PORTFOLIO COMPOSITION
| | | | | | | | |
| | | AS OF
4/30/11 | | | AS OF
10/31/10 | |
| | |
Consumer Non-Durables | | | 18.6 | % | | | 5.7 | % |
Finance | | | 11.3 | | | | 26.4 | |
Utilities | | | 11.3 | | | | 5.1 | |
Energy Minerals | | | 8.6 | | | | 9.8 | |
Health Technology | | | 8.6 | | | | 9.9 | |
Electronic Technology | | | 8.2 | | | | 3.9 | |
Producer Manufacturing | | | 6.5 | | | | 6.3 | |
Technology Services | | | 5.6 | | | | 4.2 | |
Communications | | | 4.9 | | | | 5.2 | |
Process Industries | | | 4.2 | | | | 3.0 | |
Retail Trade | | | 3.0 | | | | 1.6 | |
Exchange Traded Fund | | | 2.1 | | | | 3.0 | |
Distribution Services | | | 1.9 | | | | 0.8 | |
Consumer Services | | | 0.9 | | | | 7.5 | |
Industrial Services | | | 0.9 | | | | 3.4 | |
Commercial Services | | | 0.4 | | | | 0.9 | |
Transportation | | | — | | | | 0.9 | |
Consumer Durables | | | — | | | | 0.8 | |
Health Services | | | — | | | | 0.7 | |
Non-Energy Minerals | | | — | | | | 0.3 | |
Short-term Investment | | | 2.9 | | | | 0.7 | |
| | |
| TOTAL INVESTMENTS | | | 99.9 | % | | | 100.1 | % |
| | |
The percentage shown for each investment category reflects the value of investments in that category as a percentage of net assets. Underlying investment categories of exchange traded funds (“ETFs”) held by the Fund are not reflected in the table above. Consequently, the Fund’s overall investment category allocations may differ from the percentages contained in the table above.
The Fund is actively managed and, as such, its composition may differ over time.
| | |
| 6 | | The accompanying notes are an integral part of these financial statements. |
COMMERCE MIDCAP GROWTH FUND
Schedule of Investments
April 30, 2011 (Unaudited)
| | | | | | | | |
| | |
| Shares | | | Description | | Value | |
| | Common Stocks – 94.9% | |
| Commercial Services – 3.7% | | | | |
| | 4,900 | | | FactSet Research Systems, Inc. | | | $ 536,109 | |
| | 16,700 | | | FTI Consulting, Inc.* | | | 666,330 | |
| | 13,400 | | | Lender Processing Services, Inc. | | | 394,362 | |
| | 8,800 | | | The Brink’s Co. | | | 290,488 | |
| | 18,100 | | | The McGraw-Hill Cos., Inc. | | | 732,507 | |
| | | | | | | | |
| | | | | | | 2,619,796 | |
| | | |
| Communications* – 1.7% | | | | |
| | 16,400 | | | SBA Communications Corp. Class A | | | 633,532 | |
| | 27,100 | | | TW Telecom, Inc. | | | 583,734 | |
| | | | | | | | |
| | | | | | | 1,217,266 | |
| | | |
| Consumer Durables* – 1.3% | | | | |
| | 14,100 | | | Tempur-Pedic International, Inc. | | | 885,198 | |
| | | |
| Consumer Non-Durables – 4.3% | | | | |
| | 11,200 | | | Brown-Forman Corp., Class B | | | 804,832 | |
| | 26,500 | | | Coach, Inc. | | | 1,584,965 | |
| | 9,100 | | | The Clorox Co. | | | 633,906 | |
| | | | | | | | |
| | | | | | | 3,023,703 | |
| | | |
| Consumer Services – 5.6% | | | | |
| | 1,900 | | | Chipotle Mexican Grill, Inc. Class A* | | | 506,901 | |
| | 31,800 | | | Expedia, Inc. | | | 795,954 | |
| | 28,900 | | | Marriott International, Inc. Class A | | | 1,020,170 | |
| | 1,700 | | | Priceline.com, Inc.* | | | 929,917 | |
| | 4,400 | | | Wynn Resorts Ltd. | | | 647,460 | |
| | | | | | | | |
| | | | | | | 3,900,402 | |
| | | |
| Electronic Technology – 16.9% | | | | |
| | 116,000 | | | Advanced Micro Devices, Inc.* | | | 1,055,600 | |
| | 16,700 | | | Altera Corp. | | | 813,290 | |
| | 65,400 | | | Cadence Design Systems, Inc.* | | | 678,852 | |
| | 6,800 | | | Dolby Laboratories, Inc. Class A* | | | 340,408 | |
| | 19,800 | | | Harris Corp. | | | 1,051,974 | |
| | 32,400 | | | JDS Uniphase Corp.* | | | 675,216 | |
| | 26,200 | | | Juniper Networks, Inc.* | | | 1,004,246 | |
| | 31,400 | | | Linear Technology Corp. | | | 1,092,720 | |
| | 24,700 | | | Marvell Technology Group Ltd.* | | | 381,121 | |
| | 19,700 | | | Novellus Systems, Inc.* | | | 632,370 | |
| | 37,000 | | | NVIDIA Corp.* | | | 740,000 | |
| | 32,400 | | | ON Semiconductor Corp.* | | | 340,524 | |
| | 19,400 | | | SanDisk Corp.* | | | 953,316 | |
| | 33,800 | | | Xilinx, Inc. | | | 1,178,268 | |
| | 23,300 | | | Zebra Technologies Corp. Class A* | | | 915,457 | |
| | | | | | | | |
| | | | | | | 11,853,362 | |
| | | |
| Energy Minerals – 6.0% | | | | |
| | 19,500 | | | Arch Coal, Inc. | | | 668,850 | |
| | 6,400 | | | Cimarex Energy Co. | | | 707,776 | |
| | 9,500 | | | CONSOL Energy, Inc. | | | 513,855 | |
| | 15,400 | | | SM Energy Co. | | | 1,168,244 | |
| | 10,100 | | | Ultra Petroleum Corp.* | | | 512,979 | |
| | 4,500 | | | Walter Energy, Inc. | | | 621,990 | |
| | | | | | | | |
| | | | | | | 4,193,694 | |
| | | |
| | | | | | | | |
| | |
| Shares | | | Description | | Value | |
| | Common Stocks – (continued) | |
| Finance – 7.2% | | | | |
| | 7,995 | | | Eaton Vance Corp. | | | $ 269,991 | |
| | 8,800 | | | Endurance Specialty Holdings Ltd. | | | 390,192 | |
| | 7,800 | | | Federal Realty Investment Trust | | | 682,968 | |
| | 18,300 | | | Genworth Financial, Inc. Class A* | | | 223,077 | |
| | 4,200 | | | IntercontinentalExchange, Inc.* | | | 505,470 | |
| | 11,800 | | | Jefferies Group, Inc. | | | 285,206 | |
| | 10,600 | | | Principal Financial Group, Inc. | | | 357,750 | |
| | 7,600 | | | Rayonier, Inc. | | | 504,336 | |
| | 18,800 | | | T. Rowe Price Group, Inc. | | | 1,207,900 | |
| | 29,000 | | | TD Ameritrade Holding Corp. | | | 624,660 | |
| | | | | | | | |
| | | | | | | 5,051,550 | |
| | | |
| Health Services* – 2.7% | | | | |
| | 6,680 | | | Cerner Corp. | | | 802,802 | |
| | 11,000 | | | Laboratory Corporation of America Holdings | | | 1,061,170 | |
| | | | | | | | |
| | | | | | | 1,863,972 | |
| | | |
| Health Technology – 7.0% | | | | |
| | 6,540 | | | Allergan, Inc. | | | 520,323 | |
| | 11,080 | | | C. R. Bard, Inc. | | | 1,182,790 | |
| | 15,500 | | | DENTSPLY International, Inc. | | | 581,870 | |
| | 18,100 | | | Hill-Rom Holdings, Inc. | | | 814,681 | |
| | 11,500 | | | Illumina, Inc.* | | | 816,270 | |
| | 5,200 | | | Life Technologies Corp.* | | | 287,040 | |
| | 9,900 | | | Varian Medical Systems, Inc.* | | | 694,980 | |
| | | | | | | | |
| | | | | | | 4,897,954 | |
| | | |
| Industrial Services – 1.7% | | | | |
| | 7,800 | | | Core Laboratories NV | | | 748,644 | |
| | 10,000 | | | FMC Technologies, Inc.* | | | 464,800 | |
| | | | | | | | |
| | | | | | | 1,213,444 | |
| | | |
| Non-Energy Minerals – 1.7% | | | | |
| | 6,100 | | | Cliffs Natural Resources, Inc. | | | 571,692 | |
| | 29,400 | | | Titanium Metals Corp.* | | | 588,882 | |
| | | | | | | | |
| | | | | | | 1,160,574 | |
| | | |
| Process Industries – 7.0% | | | | |
| | 24,200 | | | Crown Holdings, Inc.* | | | 905,080 | |
| | 34,000 | | | International Paper Co. | | | 1,049,920 | |
| | 13,400 | | | Nalco Holding Co. | | | 391,414 | |
| | 10,400 | | | PPG Industries, Inc. | | | 984,568 | |
| | 15,336 | | | Sigma-Aldrich Corp. | | | 1,082,415 | |
| | 5,700 | | | The Sherwin-Williams Co. | | | 469,053 | |
| | | | | | | | |
| | | | | | | 4,882,450 | |
| | | |
| Producer Manufacturing – 9.0% | | | | |
| | 9,000 | | | Avery Dennison Corp. | | | 375,660 | |
| | 6,200 | | | Cummins, Inc. | | | 745,116 | |
| | 5,700 | | | Dover Corp. | | | 387,828 | |
| | 5,400 | | | Joy Global, Inc. | | | 545,130 | |
| | 5,800 | | | Lincoln Electric Holdings, Inc. | | | 455,764 | |
| | 25,900 | | | Masco Corp. | | | 347,578 | |
| | 10,550 | | | Parker Hannifin Corp. | | | 995,076 | |
| | | |
| | |
| The accompanying notes are an integral part of these financial statements. | | 7 |
COMMERCE MIDCAP GROWTH FUND
Schedule of Investments (continued)
April 30, 2011 (Unaudited)
| | | | | | | | |
| | |
| Shares | | | Description | | Value | |
| | Common Stocks – (continued) | |
| Producer Manufacturing – (continued) | | | | |
| | 16,900 | | | The Timken Co. | | | $ 952,991 | |
| | 9,200 | | | The Toro Co. | | | 624,772 | |
| | 15,600 | | | TRW Automotive Holdings Corp.* | | | 890,136 | |
| | | | | | | | |
| | | | | | | 6,320,051 | |
| | | |
| Retail Trade – 5.1% | | | | |
| | 3,800 | | | AutoZone, Inc.* | | | 1,073,044 | |
| | 21,900 | | | Chico’s FAS, Inc. | | | 320,397 | |
| | 4,000 | | | Netflix, Inc.* | | | 930,680 | |
| | 6,260 | | | Nordstrom, Inc. | | | 297,663 | |
| | 12,000 | | | PetSmart, Inc. | | | 506,040 | |
| | 5,700 | | | Ross Stores, Inc. | | | 420,033 | |
| | | | | | | | |
| | | | | | | 3,547,857 | |
| | | |
| Technology Services – 10.6% | | | | |
| | 14,100 | | | Akamai Technologies, Inc.* | | | 485,604 | |
| | 6,200 | | | Alliance Data Systems Corp.* | | | 589,000 | |
| | 13,300 | | | Autodesk, Inc.* | | | 598,234 | |
| | 22,700 | | | BMC Software, Inc.* | | | 1,140,221 | |
| | 55,100 | | | Compuware Corp.* | | | 624,283 | |
| | 15,500 | | | MICROS Systems, Inc.* | | | 806,310 | |
| | 14,400 | | | Red Hat, Inc.* | | | 683,568 | |
| | 15,600 | | | Rovi Corp.* | | | 757,536 | |
| | 10,200 | | | Teradata Corp.* | | | 570,384 | |
| | 18,400 | | | VeriSign, Inc. | | | 680,064 | |
| | 24,400 | | | Western Union Co. | | | 518,500 | |
| | | | | | | | |
| | | | | | | 7,453,704 | |
| | | |
| Transportation – 2.5% | | | | |
| | 8,500 | | | Con-way, Inc. | | | 330,820 | |
| | 33,600 | | | Delta Air Lines, Inc.* | | | 348,768 | |
| | 22,100 | | | Frontline Ltd. | | | 488,631 | |
| | 24,990 | | | United Continental Holdings, Inc.* | | | 570,272 | |
| | | | | | | | |
| | | | | | | 1,738,491 | |
| | | |
| Utilities – 0.9% | | | | |
| | 35,300 | | | CenterPoint Energy, Inc. | | | 656,580 | |
| | | |
| | TOTAL COMMON STOCKS | | | | |
| (Cost $47,831,542) | | | $66,480,048 | |
| | | |
| | | | | | | | |
| | Exchange Traded Fund – 4.8% | | | | |
| | 53,400 | | | iShares Russell Midcap Growth Index Fund | |
| (Cost $3,025,509) | | | $ 3,368,472 | |
| | | |
| | | | | | | | | | | | |
Principal
Amount | | Interest
Rate | | | Maturity
Date | | | Value | |
| Short-term Investment(a) – 0.5% | | | | | |
Repurchase Agreement – 0.5% | | | | | |
| State Street Bank & Trust Co. | | | | | |
| $338,000 | | | 0.010 | % | | | 05/02/11 | | | $ | 338,000 | |
Maturity Value: $338,000 | |
(Cost $338,000) | | | | | | | | | |
| | |
| TOTAL INVESTMENTS – 100.2% | | | | | |
(Cost $51,195,051) | | | | | | | $ | 70,186,520 | |
| | |
LIABILITIES IN EXCESS OF OTHER ASSETS – (0.2)% | | | | (141,208) | |
| | |
| NET ASSETS – 100.0% | | | $ | 70,045,312 | |
| | |
| | |
| The percentage shown for each investment category reflects the value of investments in that category as a percentage of net assets. |
| * | | Non-income producing security. |
| (a) | | Repurchase agreement was entered into on April 29, 2011. This agreement was fully collateralized by $345,000 U.S. Treasury Note, 1.000%, due 04/30/12 with a market value of $349,249. |
PORTFOLIO COMPOSITION
| | | | | | | | |
| | | AS OF
4/30/11 | | | AS OF
10/31/10 | |
| | |
Electronic Technology | | | 16.9 | % | | | 14.1 | % |
Technology Services | | | 10.6 | | | | 12.6 | |
Producer Manufacturing | | | 9.0 | | | | 9.3 | |
Finance | | | 7.2 | | | | 7.5 | |
Health Technology | | | 7.0 | | | | 8.9 | |
Process Industries | | | 7.0 | | | | 7.0 | |
Energy Minerals | | | 6.0 | | | | 2.5 | |
Consumer Services | | | 5.6 | | | | 6.6 | |
Retail Trade | | | 5.1 | | | | 8.0 | |
Exchange Traded Fund | | | 4.8 | | | | — | |
Consumer Non-Durables | | | 4.3 | | | | 5.1 | |
Commercial Services | | | 3.7 | | | | 2.5 | |
Health Services | | | 2.7 | | | | 4.6 | |
Transportation | | | 2.5 | | | | 4.1 | |
Communications | | | 1.7 | | | | 1.2 | |
Industrial Services | | | 1.7 | | | | 2.3 | |
Non-Energy Minerals | | | 1.7 | | | | 0.8 | |
Consumer Durables | | | 1.3 | | | | 1.5 | |
Utilities | | | 0.9 | | | | 1.1 | |
Short-term Investment | | | 0.5 | | | | 0.5 | |
| | |
| TOTAL INVESTMENTS | | | 100.2 | % | | | 100.2 | % |
| | |
The percentage shown for each investment category reflects the value of investments in that category as a percentage of net assets. Underlying investment categories of exchange traded funds (“ETFs”) held by the Fund are not reflected in the table above. Consequently, the Fund’s overall investment category allocations may differ from the percentages contained in the table above.
The Fund is actively managed and, as such, its composition may differ over time.
| | |
| 8 | | The accompanying notes are an integral part of these financial statements. |
COMMERCE BOND FUND
Schedule of Investments
April 30, 2011 (Unaudited)
| | | | | | | | | | | | |
Principal
Amount | | Interest
Rate | | | Maturity
Date | | | Value | |
| Asset-Backed Securities – 8.9% | |
Auto(a) – 0.3% | | | | | |
| Citifinancial Auto Issuance Trust Series 2009-1, Class A2 | |
| $ 1,696,419 | | | 1.830 | % | | | 11/15/12 | | | $ | 1,699,733 | |
| | |
Commercial – 1.4% | | | | | |
| LB-UBS Commercial Mortgage Trust Series 2002-C1, Class A4 | |
| 6,164,836 | | | 6.462 | | | | 03/15/31 | | | | 6,332,224 | |
| Small Business Administration Series 2006-P10B, Class 1 | |
| 2,377,915 | | | 5.681 | | | | 08/10/16 | | | | 2,574,075 | |
| | | | | | | | | | | | |
| | | | | | | | | | | 8,906,299 | |
| | |
Credit Card – 0.6% | | | | | |
| Citibank Credit Card Issuance Trust Series 2004, Class A8 | |
| 3,600,000 | | | 4.900 | | | | 12/12/16 | | | | 3,979,782 | |
| | |
Equipment(a) – 0.1% | | | | | |
| CIT Equipment Collateral Series 2010-VT1A, Class A2 | |
| 728,909 | | | 1.510 | | | | 05/15/12 | | | | 730,024 | |
| | |
Home Equity – 3.5% | | | | | |
| Ameriquest Mortgage Securities, Inc. Series 2004-FR1W, Class A6(b) | |
| 2,000,000 | | | 5.440 | | | | 05/25/34 | | | | 1,860,000 | |
| Carrington Mortgage Loan Trust Series 2006-NC5, Class A1(b) | |
| 617,306 | | | 0.263 | | | | 01/25/37 | | | | 607,933 | |
| Chase Funding Mortgage Loan Asset-Backed Certificates Series 2002-3, Class 1A5 | |
| 3,185,995 | | | 5.407 | | | | 06/25/32 | | | | 3,151,395 | |
| Countrywide Asset-Backed Certificates Series 2007-QH1, Class A1(a)(b) | |
| 1,277,985 | | | 0.413 | | | | 02/25/37 | | | | 846,380 | |
| Equifirst Mortgage Loan Trust Series 2003-2, Class 2A2 | |
| 1,068,223 | | | 3.750 | | | | 09/25/33 | | | | 1,040,013 | |
| Equity One ABS, Inc. Series 2004-2, Class AF5 | |
| 450,000 | | | 5.199 | | | | 07/25/34 | | | | 432,726 | |
| Lehman XS Trust Series 2005-1, Class 1A4(b) | |
| 903,636 | | | 0.553 | | | | 07/25/35 | | | | 756,723 | |
| Renaissance Home Equity Loan Trust Series 2005-3, Class AF3 | |
| 682,586 | | | 4.814 | | | | 11/25/35 | | | | 657,795 | |
| Renaissance Home Equity Loan Trust Series 2005-3, Class AF4 | |
| 1,125,000 | | | 5.140 | | | | 11/25/35 | | | | 979,230 | |
| Residential Asset Mortgage Products, Inc. Series 2003-RZ3, Class A6 | |
| 2,176,540 | | | 3.400 | | | | 03/25/33 | | | | 2,168,626 | |
| Residential Asset Mortgage Products, Inc. Series 2003-RZ4, Class A6 | |
| 3,971,280 | | | 5.490 | | | | 10/25/33 | | | | 3,165,070 | |
| Residential Funding Mortgage Securities I, Inc. Series 2000-HI2, Class AI5 | |
| 804,558 | | | 8.850 | | | | 03/25/25 | | | | 791,716 | |
| Residential Funding Mortgage Securities I, Inc. Series 2000-HI4, Class AI7 | |
| 818,916 | | | 8.480 | | | | 09/25/30 | | | | 809,243 | |
| SACO I Trust Series 2005-7 Class A(b) | |
| 274,674 | | | 0.773 | | | | 09/25/35 | | | | 239,580 | |
| | |
| | | | | | | | | | |
Principal
Amount | | Interest
Rate | | | Maturity
Date | | Value | |
| Asset-Backed Securities – (continued) | |
Home Equity – (continued) | | | | |
| Soundview Home Equity Loan Trust Series 2006-EQ1, Class A2(b) | |
| $ 280,331 | | | 0.323 | % | | 10/25/36 | | $ | 274,118 | |
| Southern Pacific Secured Asset Corp. Series 1998-2, Class A7 | |
| 4,049,538 | | | 6.740 | | | 07/25/29 | | | 1,895,054 | |
| Structured Asset Securities Corp. Series 2005-9XS, Class 1A3A | |
| 2,290,430 | | | 5.250 | | | 06/25/35 | | | 2,098,778 | |
| Terwin Mortgage Trust Series 2005-16HE, Class AF2 | |
| 426,357 | | | 4.429 | | | 09/25/36 | | | 422,436 | |
| Wells Fargo Home Equity Trust Series 2004-2, Class AI5(b) | |
| 554,054 | | | 4.890 | | | 05/25/34 | | | 558,931 | |
| | | | | | | | | | |
| | | | | | | | | 22,755,747 | |
| | |
Manufactured Housing – 2.2% | | | | |
| Green Tree Financial Corp. Series 1993-4, Class A5 | |
| 1,571,138 | | | 7.050 | | | 01/15/19 | | | 1,608,830 | |
| Green Tree Financial Corp. Series 1995-5, Class M1(b) | |
| 642,952 | | | 7.650 | | | 09/15/26 | | | 655,230 | |
| Green Tree Financial Corp. Series 1996-4, Class A7(b) | |
| 955,517 | | | 7.900 | | | 06/15/27 | | | 984,321 | |
| Green Tree Financial Corp. Series 1996-6, Class A6 | |
| 219,169 | | | 7.950 | | | 09/15/27 | | | 231,421 | |
| Green Tree Financial Corp. Series 1997-3, Class A6 | |
| 77,697 | | | 7.320 | | | 03/15/28 | | | 84,498 | |
| Green Tree Financial Corp. Series 1998-3, Class A5 | |
| 3,872,815 | | | 6.220 | | | 03/01/30 | | | 4,122,805 | |
| Green Tree Financial Corp. Series 1998-3, Class A6(b) | |
| 483,725 | | | 6.760 | | | 03/01/30 | | | 511,830 | |
| Lehman Manufactured Housing Contract Series 2001-B, Class A3 | |
| 416,822 | | | 4.350 | | | 05/15/14 | | | 418,267 | |
| Mid-State Trust Series 11, Class A1 | |
| 367,330 | | | 4.864 | | | 07/15/38 | | | 356,200 | |
| Newcastle Investment Trust Series 2011-MH1, Class A(a) | |
| 4,000,000 | | | 2.450 | | | 12/10/33 | | | 3,999,489 | |
| Oakwood Mortgage Investors, Inc. Series 1996-C, Class A6 | |
| 1,362,489 | | | 7.650 | | | 04/15/27 | | | 1,362,583 | |
| | | | | | | | | | |
| | | | | | | | | 14,335,474 | |
| | |
Student Loans – 0.8% | |
| Northstar Education Finance, Inc. Series 2005-1, Class A5(b) | |
| 2,019,600 | | | 1.023 | | | 10/30/45 | | | 1,940,553 | |
| SLM Student Loan Trust Series 2011-A, Class A2(a) | |
| 2,900,000 | | | 4.370 | | | 04/17/28 | | | 2,950,637 | |
| | | | | | | | | | |
| | | | | | | | | 4,891,190 | |
| | |
| TOTAL ASSET-BACKED SECURITIES | | | | |
(Cost $54,010,585) | | $ | 57,298,249 | |
| | |
| | |
| The accompanying notes are an integral part of these financial statements. | | 9 |
COMMERCE BOND FUND
Schedule of Investments (continued)
April 30, 2011 (Unaudited)
| | | | | | | | | | | | |
Principal
Amount | | Interest
Rate | | | Maturity
Date | | | Value | |
| Taxable Municipal Bond Obligations – 12.3% | |
Alabama – 0.2% | | | | | |
| Montgomery Alabama Taxable GO Warrants Series 2005 (AGM) | |
| $ 1,295,000 | | | 4.790 | % | | | 04/01/15 | | | $ | 1,402,226 | |
| | |
Alaska – 0.1% | | | | | | | | | | | | |
| Providence Alaska Health System Direct Obligation Series 2005 | |
| 500,000 | | | 4.790 | | | | 10/01/11 | | | | 508,840 | |
| | |
California – 3.0% | | | | | |
| Anaheim California Public Financing Authority Revenue Bonds Build America Bonds | |
| 4,000,000 | | | 5.685 | | | | 10/01/40 | | | | 3,826,680 | |
| Hillsborough School District GO Bonds Capital Appreciation Election 2002 C(c) | |
| 10,590,000 | | | 0.000 | | | | 09/01/42 | | | | 1,186,716 | |
| 11,420,000 | | | 0.000 | | | | 09/01/43 | | | | 1,180,371 | |
| Industry California Sales Tax Revenue Bonds Taxable Series 2005 (NATL-RE) | |
| 3,045,000 | | | 5.000 | | | | 01/01/13 | | | | 3,110,924 | |
| Napa Valley Unified School District GO Bonds (Build America Bonds-Taxable) Series B | |
| 3,000,000 | | | 6.507 | | | | 08/01/43 | | | | 3,054,120 | |
| San Francisco City & County Airports Commission Revenue Bonds Refunding Second Series C | |
| 3,000,000 | | | 5.000 | | | | 05/01/17 | | | | 3,312,960 | |
| Santa Clara County CA Fremont Union High School District GO Bonds Capital Appreciation Election 2008 B(c) | |
| 11,005,000 | | | 0.000 | | | | 08/01/37 | | | | 1,711,938 | |
| 12,290,000 | | | 0.000 | | | | 08/01/39 | | | | 1,624,615 | |
| | | | | | | | | | | | |
| | | | | | | | | | | 19,008,324 | |
| | |
District of Columbia – 0.8% | | | | | |
| Metropolitan Washington D.C. Airport Authority System Revenue Bonds Series B | |
| 5,000,000 | | | 5.250 | | | | 10/01/25 | | | | 5,368,500 | |
| | |
Florida – 0.3% | |
| Inland Protection Financing Corp. Florida Revenue Bonds Build America Bonds Series 2010 | |
| 2,000,000 | | | 4.700 | | | | 07/01/19 | | | | 2,069,760 | |
| | |
Illinois – 0.3% | |
| Will County Community Consolidated School District No. 30-C Troy Township Taxable GO Series 2007 (AGM) | |
| 1,100,000 | | | 5.650 | | | | 10/01/18 | | | | 1,198,417 | |
| Will County Forest Preservation District GO Bonds Build America Bonds Direct Payment Series 2009 | |
| 1,000,000 | | | 5.700 | | | | 12/15/27 | | | | 1,039,260 | |
| | | | | | | | | | | | |
| | | | | | | | | | | 2,237,677 | |
| | |
Indiana – 1.0% | |
| Indiana Bond Bank Revenue Bonds Taxable School Severance Funding Series 2006-11 (XLCA) | |
| 2,190,000 | | | 5.650 | | | | 07/15/13 | | | | 2,403,678 | |
| | |
| | | | | | | | | | |
Principal
Amount | | Interest
Rate | | | Maturity
Date | | Value | |
| Taxable Municipal Bond Obligations – (continued) | |
Indiana – (continued) | |
| Indianapolis Multi-School Building Corp. Revenue Bonds (Refunding First Mortgage) | |
| $ 5,000,000 | | | 3.000 | % | | 01/15/26 | | $ | 4,040,150 | |
| | | | | | | | | | |
| | | | | | | | | 6,443,828 | |
| | |
Iowa – 0.6% | | | | |
| Iowa Higher Education Loan Authority Revenue Bonds Refunding Private College Facility (Grinnell College Project) | |
| 2,500,000 | | | 5.000 | | | 12/01/19 | | | 2,908,375 | |
| | |
Maryland – 0.2% | |
| Baltimore County Maryland GO Bonds Build America Bonds Consolidated Public Improvement Series 2009 B | |
| 1,000,000 | | | 5.000 | | | 11/01/23 | | | 1,044,290 | |
| | |
Massachusetts – 0.0% | |
| University of Massachusetts Building Authority Revenue Bonds Refunding Taxable Series 2006-2 (AMBAC) | |
| 255,000 | | | 5.360 | | | 05/01/11 | | | 255,000 | |
| | |
Michigan – 0.2% | |
| Utica Community Schools GO Bonds (Taxable-Qualified School Construction-Direct Payment) | |
| 1,500,000 | | | 5.875 | | | 05/01/22 | | | 1,544,505 | |
| | |
Missouri – 1.9% | |
| Curators University of Missouri System Facilities Revenue Bonds Build America Bonds | |
| 2,500,000 | | | 5.792 | | | 11/01/41 | | | 2,674,625 | |
| Missouri Joint Municipal Electric Utility Commission Power Project Revenue Bonds Build America Bonds Series 2009 | |
| 2,000,000 | | | 5.078 | | | 01/01/17 | | | 2,067,160 | |
| Missouri Joint Municipal Electric Utility Commission Power Project Revenue Bonds Taxable Series 2009 B | |
| 1,570,000 | | | 4.693 | | | 01/01/16 | | | 1,619,110 | |
| Missouri State Highways & Transit Commission State Road Revenue Bonds Build America Bonds Series 2010 | |
| 2,800,000 | | | 4.820 | | | 05/01/23 | | | 2,921,940 | |
| New Liberty Hospital District Revenue Bonds Build America Bonds Series 2010 B | |
| 1,345,000 | | | 5.704 | | | 12/01/19 | | | 1,407,448 | |
| St. Louis Package Revenue Bonds Series 2006 B (NATL-RE) | |
| 1,560,000 | | | 5.020 | | | 12/15/12 | | | 1,618,750 | |
| | | | | | | | | | |
| | | | | | | | | 12,309,033 | |
| | |
Nevada – 0.4% | |
| Clark County Nevada Sales & Excise Tax Revenue Bonds Build America Bonds Series 2010 C | |
| 2,525,000 | | | 5.100 | | | 07/01/21 | | | 2,533,989 | |
| | |
New Jersey – 0.2% | |
| New Jersey Economic Development Authority Revenue Bonds Taxable Designated Industry Series 2004-A | |
| 1,000,000 | | | 5.200 | | | 03/01/14 | | | 1,070,060 | |
| | |
| | |
| 10 | | The accompanying notes are an integral part of these financial statements. |
COMMERCE BOND FUND
| | | | | | | | | | |
Principal
Amount | | Interest
Rate | | | Maturity
Date | | Value | |
| Taxable Municipal Bond Obligations – (continued) | |
New York – 1.2% | |
| New York GO Build America Bonds Series 2010 | |
| $ 2,000,000 | | | 4.908 | % | | 06/01/21 | | $ | 2,068,720 | |
| 1,055,000 | | | 5.008 | | | 06/01/22 | | | 1,098,497 | |
| New York State Housing Finance Agency Personal Income Tax Revenue Bonds Taxable Economic Development & Housing Series 2006 B | |
| 3,925,000 | | | 5.220 | | | 09/15/15 | | | 4,287,160 | |
| | | | | | | | | | |
| | | | | | | | | 7,454,377 | |
| | |
Ohio – 0.7% | |
| Ohio State GO Build America Bonds Series 2010 | |
| 2,500,000 | | | 3.000 | | | 11/01/18 | | | 2,386,400 | |
| Ohio State GO Build America Bonds Taxable Conservation Project Direct Payment Series 2009 C | |
| 1,960,000 | | | 4.471 | | | 03/01/19 | | | 2,057,686 | |
| | | | | | | | | | |
| | | | | | | | | 4,444,086 | |
| | |
Oregon – 0.1% | |
| Multnomah County Oregon School District 1J Portland GO Bonds Refunding Taxable Series 2004 | |
| 785,000 | | | 5.165 | | | 06/15/11 | | | 788,729 | |
| | |
Pennsylvania – 0.5% | |
| State Public School Building Authority Revenue Bonds (Qualified School Construction Bonds) | |
| 3,000,000 | | | 6.495 | | | 09/15/28 | | | 3,185,310 | |
| | |
Rhode Island – 0.5% | |
| Providence Rhode Island GO Bonds Refunding Taxable Series 2004 B (AGM) | |
| 710,000 | | | 4.960 | | | 07/15/14 | | | 750,761 | |
| Rhode Island Convention Center Authority Revenue Bonds Taxable Civic Center Series 2006 A (AGM) | |
| 2,155,000 | | | 5.810 | | | 05/15/16 | | | 2,336,214 | |
| | | | | | | | | | |
| | | | | | | | | 3,086,975 | |
| | |
South Carolina – 0.2% | |
| South Carolina State Public Service Authority Revenue Bonds Santee Cooper Taxable Series 2008 B | |
| 1,150,000 | | | 7.308 | | | 01/01/14 | | | 1,307,861 | |
| | |
| TOTAL TAXABLE MUNICIPAL BOND OBLIGATIONS | |
(Cost $75,726,345) | | $ | 78,971,745 | |
| | |
| | | | | | | | | | |
| Mortgage-Backed Obligations – 31.3% | |
Collateralized Mortgage Obligations – 27.0% | |
| ABN Amro Mortgage Corp. Series 2003-13, Class A2 | |
| $ 20,964 | | | 5.500 | % | | 02/25/18 | | $ | 20,962 | |
| Banc of America Alternative Loan Trust Series 2004-1, Class 1A1 | |
| 4,294,761 | | | 6.000 | | | 02/25/34 | | | 4,513,871 | |
| Banc of America Alternative Loan Trust Series 2005-10, Class 6A1 | |
| 2,965,359 | | | 5.500 | | | 11/25/20 | | | 2,901,942 | |
| | |
| | | | | | | | | | |
Principal
Amount | | Interest
Rate | | | Maturity
Date | | Value | |
| Mortgage-Backed Obligations – (continued) | |
Collateralized Mortgage Obligations – (continued) | |
| Banc of America Alternative Loan Trust Series 2006-3, Class 6A1 | |
| $ 634,503 | | | 6.000 | % | | 04/25/36 | | $ | 625,181 | |
| Bear Stearns Alt-A Trust Series 2005-9, Class 25A1(b) | |
| 3,436,065 | | | 5.518 | | | 11/25/35 | | | 2,580,412 | |
| Bear Stearns Asset Backed Securities Trust Series 2003-AC7, Class A2 | |
| 1,107,473 | | | 5.750 | | | 01/25/34 | | | 1,130,862 | |
| Chase Mortgage Finance Corp. Series 2003-S13, Class A1 | |
| 1,321,176 | | | 5.500 | | | 11/25/33 | | | 1,366,655 | |
| Citicorp Mortgage Securities, Inc. Series 2006-4, Class 3A1 | |
| 271,668 | | | 5.500 | | | 08/25/21 | | | 273,702 | |
| Citigroup Mortgage Loan Trust, Inc. Series 2004-NCM2, Class 1CB2 | |
| 2,164,369 | | | 6.750 | | | 08/25/34 | | | 2,186,214 | |
| Citigroup Mortgage Loan Trust, Inc. Series 2005-10, Class 1A5A(b) | |
| 1,800,191 | | | 5.593 | | | 12/25/35 | | | 1,372,286 | |
| Citigroup Mortgage Loan Trust, Inc. Series 2007-AR5, Class 1A3A(b) | |
| 902,531 | | | 5.567 | | | 04/25/37 | | | 614,490 | |
| Citigroup Mortgage Loan Trust, Inc. Series 2009-3, Class 2A1(a) | |
| 3,363,668 | | | 5.750 | | | 09/25/21 | | | 3,430,942 | |
| Citimortgage Alternative Loan Trust Series 2006-A3, Class 2A1 | |
| 575,579 | | | 5.500 | | | 07/25/36 | | | 533,124 | |
| Countrywide Alternative Loan Trust Series 2004-18CB, Class 3A1 | |
| 1,197,250 | | | 5.250 | | | 09/25/19 | | | 1,220,524 | |
| Countrywide Alternative Loan Trust Series 2005-5R, Class A2 | |
| 926,953 | | | 4.750 | | | 12/25/18 | | | 935,136 | |
| Countrywide Alternative Loan Trust Series 2005-J1, Class 3A1 | |
| 347,353 | | | 6.500 | | | 08/25/32 | | | 338,496 | |
| Countrywide Alternative Loan Trust Series 2007-J2, Class 2A1 | |
| 877,559 | | | 6.000 | | | 07/25/37 | | | 716,370 | |
| Countrywide Home Loans Trust Series 2003-J6, Class 1A1 | |
| 2,828,181 | | | 5.500 | | | 08/25/33 | | | 3,007,343 | |
| Countrywide Home Loans Trust Series 2004-J1, Class 2A4 | |
| 1,226,108 | | | 4.750 | | | 01/25/19 | | | 1,255,736 | |
| Countrywide Home Loans Trust Series 2005-27, Class 2A1 | |
| 3,449,884 | | | 5.500 | | | 12/25/35 | | | 3,133,236 | |
| Countrywide Home Loans Trust Series 2005-6, Class 2A1 | |
| 816,084 | | | 5.500 | | | 04/25/35 | | | 753,120 | |
| CS First Boston Mortgage Securities Corp. Series 2003-19, Class 1A4 | |
| 1,118,426 | | | 5.250 | | | 07/25/33 | | | 1,154,116 | |
| CS First Boston Mortgage Securities Corp. Series 2005-5, Class 2A9 | |
| 9,000,000 | | | 5.500 | | | 07/25/35 | | | 8,817,903 | |
| FHLMC REMIC PAC Series 1579, Class PM | |
| 425,076 | | | 6.700 | | | 09/15/23 | | | 476,398 | |
| FHLMC REMIC PAC Series 2103, Class TE | |
| 368,002 | | | 6.000 | | | 12/15/28 | | | 396,625 | |
| | |
| | |
| The accompanying notes are an integral part of these financial statements. | | 11 |
COMMERCE BOND FUND
Schedule of Investments (continued)
April 30, 2011 (Unaudited)
| | | | | | | | | | |
Principal
Amount | | Interest
Rate | | | Maturity
Date | | Value | |
| Mortgage-Backed Obligations – (continued) | |
Collateralized Mortgage Obligations – (continued) | |
| FHLMC REMIC PAC Series 2110, Class PG | |
| $ 1,887,542 | | | 6.000 | % | | 01/15/29 | | $ | 2,077,004 | |
| FHLMC REMIC PAC Series 2640, Class DR | |
| 1,316,014 | | | 4.000 | | | 08/15/17 | | | 1,336,877 | |
| FHLMC REMIC PAC Series 2716, Class DT | |
| 495,192 | | | 5.000 | | | 02/15/30 | | | 509,054 | |
| FHLMC REMIC PAC Series 2760, Class EC | |
| 4,050,000 | | | 4.500 | | | 04/15/17 | | | 4,185,884 | |
| FHLMC REMIC PAC Series 2836, Class XQ | |
| 183,910 | | | 4.500 | | | 09/15/27 | | | 185,520 | |
| FHLMC REMIC PAC Series 2907, Class HC | |
| 951,340 | | | 5.000 | | | 06/15/27 | | | 960,254 | |
| FHLMC REMIC Series 2391, Class Z | |
| 4,633,210 | | | 6.000 | | | 12/15/31 | | | 5,129,289 | |
| FHLMC REMIC Series 2508, Class OY | |
| 1,183,040 | | | 4.500 | | | 10/15/17 | | | 1,254,852 | |
| FHLMC REMIC Series 2603, Class C | |
| 2,620,000 | | | 5.500 | | | 04/15/23 | | | 2,889,777 | |
| FHLMC REMIC Series 2677, Class BC | |
| 800,000 | | | 4.000 | | | 09/15/18 | | | 845,390 | |
| FHLMC REMIC Series 2840, Class JL | |
| 1,087,820 | | | 4.500 | | | 06/15/23 | | | 1,127,258 | |
| FHLMC REMIC Series 2866, Class DH | |
| 2,628,956 | | | 4.000 | | | 09/15/34 | | | 2,779,397 | |
| FHLMC REMIC Series 2890, Class KB | |
| 3,115,000 | | | 4.500 | | | 02/15/19 | | | 3,317,513 | |
| FHLMC REMIC TAC Series 2658, Class A | |
| 1,069,486 | | | 4.500 | | | 08/15/18 | | | 1,101,657 | |
| First Horizon Alternative Mortgage Securities Series 2004-FA2, Class 1A1 | |
| 1,451,950 | | | 6.000 | | | 01/25/35 | | | 1,445,196 | |
| First Horizon Alternative Mortgage Securities Series 2006-RE1, Class A1 | |
| 4,980,989 | | | 5.500 | | | 05/25/35 | | | 4,396,878 | |
| FNMA REMIC FNIC PAC Series 2001-45, Class WG | |
| 697,283 | | | 6.500 | | | 09/25/31 | | | 787,383 | |
| FNMA REMIC PAC Series 2003-1, Class PG | |
| 1,316,231 | | | 5.500 | | | 09/25/31 | | | 1,375,444 | |
| FNMA REMIC PAC Series 2003-117, Class KB | |
| 3,000,000 | | | 6.000 | | | 12/25/33 | | | 3,384,835 | |
| FNMA REMIC PAC Series 2003-14, Class AP | |
| 308,338 | | | 4.000 | | | 03/25/33 | | | 323,763 | |
| FNMA REMIC PAC Series 2004-53, Class NC | |
| 3,344,635 | | | 5.500 | | | 07/25/24 | | | 3,552,902 | |
| FNMA REMIC Series 2002-73, Class OE | |
| 3,775,405 | | | 5.000 | | | 11/25/17 | | | 4,068,589 | |
| FNMA REMIC Series 2002-82, Class XE | |
| 3,205,000 | | | 5.000 | | | 12/25/17 | | | 3,452,312 | |
| FNMA REMIC Series 2003-83, Class PG | |
| 700,000 | | | 5.000 | | | 06/25/23 | | | 756,432 | |
| | |
| | | | | | | | | | |
Principal
Amount | | Interest
Rate | | | Maturity
Date | | Value | |
| Mortgage-Backed Obligations – (continued) | |
Collateralized Mortgage Obligations – (continued) | |
| FNMA REMIC Series 2003-84, Class PG | |
| $ 540,000 | | | 5.000 | % | | 03/25/32 | | $ | 580,047 | |
| FNMA Series 2003-W6, Class 2A32 | |
| 442,050 | | | 6.500 | | | 09/25/42 | | | 494,495 | |
| GNMA Series 1998-12, Class EB | |
| 675,491 | | | 6.500 | | | 05/20/28 | | | 705,479 | |
| Impac CMB Trust Series 2004-4, Class 1A1(b) | |
| 3,374,927 | | | 0.853 | | | 09/25/34 | | | 2,603,948 | |
| Impac CMB Trust Series 2004-4, Class 2A2 | |
| 5,316,246 | | | 4.857 | | | 09/25/34 | | | 5,213,674 | |
| Impac Secured Assets Corp. Series 2004-2, Class A6 | |
| 1,503,004 | | | 5.181 | | | 08/25/34 | | | 1,455,077 | |
| JPMorgan Alternative Loan Trust Series 2006-S1, Class 1A16 | |
| 3,350,245 | | | 6.000 | | | 03/25/36 | | | 2,862,298 | |
| JPMorgan Mortgage Trust Series 2005-S3, Class 1A20 | |
| 5,000,000 | | | 5.500 | | | 01/25/36 | | | 4,931,560 | |
| JPMorgan Mortgage Trust Series 2007-A2, Class 4A2(b) | |
| 1,000,000 | | | 5.900 | | | 04/25/37 | | | 894,068 | |
| Master Alternative Loans Trust Series 2004-4, Class 1A1 | |
| 657,802 | | | 5.500 | | | 05/25/34 | | | 674,016 | |
| Master Alternative Loans Trust Series 2004-4, Class 8A1 | |
| 2,341,150 | | | 6.500 | | | 05/25/34 | | | 2,429,350 | |
| Master Asset Securitization Trust Series 2003-10, Class 3A1 | |
| 590,940 | | | 5.500 | | | 11/25/33 | | | 621,910 | |
| Master Asset Securitization Trust Series 2003-7, Class 1A1 | |
| 1,076,921 | | | 5.500 | | | 09/25/33 | | | 1,122,529 | |
| Master Asset Securitization Trust Series 2004-3, Class 5A1 | |
| 113,567 | | | 6.250 | | | 01/25/32 | | | 114,716 | |
| Merrill Lynch Mortgage Investors Trust Series 2005-A8, Class A1C1(b) | |
| 488,251 | | | 5.250 | | | 08/25/36 | | | 495,263 | |
| Morgan Stanley Mortgage Loan Trust Series 2005-7, Class 2A1(b) | |
| 3,738,536 | | | 5.586 | | | 11/25/35 | | | 3,639,371 | |
| Morgan Stanley Mortgage Loan Trust Series 2007-12, Class 3A22 | |
| 3,731,795 | | | 6.000 | | | 08/25/37 | | | 3,296,279 | |
| RBSGC Mortgage Pass-Through Certificates Series 2007-B, Class 2A1(b) | |
| 4,728,774 | | | 5.997 | | | 11/25/21 | | | 4,020,886 | |
| RBSGC Mortgage Pass-Through Certificates Series 2007-B, Class 3A1(b) | |
| 340,471 | | | 5.332 | | | 07/25/35 | | | 335,238 | |
| Residential Accredit Loans, Inc. Series 2003-QS7, Class A2 | |
| 2,583,947 | | | 4.750 | | | 04/25/33 | | | 2,626,236 | |
| Residential Accredit Loans, Inc. Series 2004-QS2, Class CB | |
| 4,574,273 | | | 5.750 | | | 02/25/34 | | | 4,610,071 | |
| Residential Accredit Loans, Inc. Series 2005-QS11, Class A2(b) | |
| 741,111 | | | 0.713 | | | 07/25/35 | | | 609,012 | |
| | |
| | |
| 12 | | The accompanying notes are an integral part of these financial statements. |
COMMERCE BOND FUND
| | | | | | | | | | |
Principal
Amount | | Interest
Rate | | | Maturity
Date | | Value | |
| Mortgage-Backed Obligations – (continued) | |
Collateralized Mortgage Obligations – (continued) | |
| Residential Asset Mortgage Products, Inc. Series 2004-SL4, Class A2 | |
| $ 1,525,670 | | | 6.000 | % | | 07/25/32 | | $ | 1,539,565 | |
| Residential Asset Securitization Trust Series 2004-A6, Class A1 | |
| 3,297,128 | | | 5.000 | | | 08/25/19 | | | 3,289,640 | |
| Residential Funding Mortgage Securities Corp. Series 2003-RM2, Class AIII | |
| 751,539 | | | 6.000 | | | 05/25/33 | | | 781,670 | |
| Residential Funding Mortgage Securities I, Inc. Series 2003-S8, Class A1 | |
| 499,982 | | | 5.000 | | | 05/25/18 | | | 514,277 | |
| Residential Funding Mortgage Securities I, Inc. Series 2005-S7, Class A5 | |
| 1,375,788 | | | 5.500 | | | 11/25/35 | | | 1,316,426 | |
| Residential Funding Mortgage Securities I, Inc. Series 2005-S9, Class A5 | |
| 2,983,695 | | | 5.750 | | | 12/25/35 | | | 2,815,534 | |
| Residential Funding Mortgage Securities I, Inc. Series 2006-S12, Class 1A1 | |
| 2,678,669 | | | 5.500 | | | 12/25/21 | | | 2,672,283 | |
| Sequoia Mortgage Trust Series 2004-10, Class A1A(b) | |
| 1,035,790 | | | 0.523 | | | 11/20/34 | | | 962,539 | |
| Structured Asset Securities Corp. Series 2003-20, Class 1A1 | |
| 3,107,103 | | | 5.500 | | | 07/25/33 | | | 3,220,696 | |
| Structured Asset Securities Corp. Series 2003-31A, Class 2A7(b) | |
| 1,262,717 | | | 2.561 | | | 10/25/33 | | | 1,201,335 | |
| Structured Asset Securities Corp. Series 2003-34A, Class 3A3(b) | |
| 1,843,596 | | | 2.574 | | | 11/25/33 | | | 1,763,803 | |
| Structured Asset Securities Corp. Series 2004-11XS, Class 1A4B | |
| 3,220,006 | | | 5.710 | | | 06/25/34 | | | 2,957,286 | |
| Structured Asset Securities Corp. Series 2005-6, Class 5A2 | |
| 610,043 | | | 5.000 | | | 05/25/35 | | | 612,498 | |
| Washington Mutual Alternative Mortgage Pass-Through Certificates Series 2005-4, Class 4A1 | |
| 2,328,903 | | | 5.500 | | | 06/25/20 | | | 2,325,398 | |
| Washington Mutual MSC Mortgage Pass-Through Series 2002-MS2, Class 3A1 | |
| 165,763 | | | 6.500 | | | 05/25/32 | | | 165,724 | |
| Wells Fargo Mortgage Backed Securities Trust Series 2003-6, Class 1A1 | |
| 696,847 | | | 5.000 | | | 06/25/18 | | | 722,148 | |
| Wells Fargo Mortgage Backed Securities Trust Series 2005-1, Class 3A1 | |
| 469,785 | | | 5.250 | | | 01/25/20 | | | 483,920 | |
| Wells Fargo Mortgage Backed Securities Trust Series 2005-AR15, Class 1A2(b) | |
| 1,300,171 | | | 5.048 | | | 09/25/35 | | | 1,252,738 | |
| Wells Fargo Mortgage Backed Securities Trust Series 2006-12, Class A5 | |
| 500,000 | | | 6.000 | | | 10/25/36 | | | 200,138 | |
| | |
| | | | | | | | | | | | |
Principal
Amount | | Interest
Rate | | | Maturity
Date | | | Value | |
| Mortgage-Backed Obligations – (continued) | |
Collateralized Mortgage Obligations – (continued) | |
| Wells Fargo Mortgage Backed Securities Trust Series 2007-2, Class 3A5 | |
| $ 1,000,000 | | | 5.250 | % | | | 03/25/37 | | | $ | 963,210 | |
| WF-RBS Commercial Mortgage Trust Series 2011-C2, Class A1(a) | |
| 3,943,631 | | | 2.501 | | | | 02/15/44 | | | | 4,003,921 | |
| | |
TOTAL COLLATERALIZED MORTGAGE OBLIGATIONS | |
(Cost $152,710,571) | | | | | | | $ | 173,099,378 | |
| | |
Commercial Mortgage Obligations – 1.4% | |
| GNMA Series 2003-16, Class B | |
| $3,580,000 | | | 4.490 | % | | | 08/16/25 | | | $ | 3,748,556 | |
| GNMA Series 2003-38, Class JC(b) | |
| 93,174 | | | 7.321 | | | | 08/16/42 | | | | 105,247 | |
| GNMA Series 2004-60, Class C(b) | |
| 5,000,000 | | | 5.240 | | | | 03/16/28 | | | | 5,259,779 | |
| | |
TOTAL COMMERCIAL MORTGAGE OBLIGATIONS | |
(Cost $8,711,766) | | | | | | | $ | 9,113,582 | |
| | |
Mortgage-Backed Pass-Through Obligations – 2.9% | |
| FHLMC | |
| $ 57,425 | | | 8.500 | % | | | 02/01/19 | | | $ | 63,042 | |
| 105,802 | | | 8.500 | | | | 03/01/21 | | | | 119,405 | |
| 616,249 | | | 7.000 | | | | 05/01/26 | | | | 708,143 | |
| 37,428 | | | 7.000 | | | | 10/01/30 | | | | 43,155 | |
| 91,047 | | | 7.500 | | | | 12/01/30 | | | | 105,869 | |
| 171,888 | | | 7.500 | | | | 01/01/31 | | | | 199,871 | |
| 324,994 | | | 7.000 | | | | 08/01/31 | | | | 374,967 | |
| 3,960,038 | | | 5.000 | | | | 05/01/33 | | | | 4,205,428 | |
| 697,863 | | | 2.604 | (b) | | | 05/01/34 | | | | 723,813 | |
| 1,377,689 | | | 5.269 | (b) | | | 01/01/36 | | | | 1,474,013 | |
| FNMA | |
| 55,226 | | | 6.000 | | | | 12/01/13 | | | | 57,870 | |
| 28,440 | | | 6.500 | | | | 07/01/14 | | | | 31,258 | |
| 51,752 | | | 9.000 | | | | 11/01/21 | | | | 58,374 | |
| 84,622 | | | 9.000 | | | | 02/01/25 | | | | 99,358 | |
| 17,040 | | | 6.500 | | | | 03/01/26 | | | | 19,277 | |
| 29,984 | | | 8.000 | | | | 07/01/28 | | | | 34,968 | |
| 134,151 | | | 6.500 | | | | 10/01/28 | | | | 151,760 | |
| 93,207 | | | 2.455 | (b) | | | 12/01/28 | | | | 94,251 | |
| 55,772 | | | 6.500 | | | | 01/01/29 | | | | 63,093 | |
| 79,110 | | | 6.000 | | | | 07/01/29 | | | | 87,466 | |
| 103,725 | | | 7.500 | | | | 09/01/29 | | | | 120,807 | |
| 76,371 | | | 7.000 | | | | 03/01/31 | | | | 87,990 | |
| 35,470 | | | 7.500 | | | | 03/01/31 | | | | 41,346 | |
| 195,707 | | | 7.000 | | | | 11/01/31 | | | | 225,473 | |
| 322,969 | | | 7.000 | | | | 01/01/32 | | | | 372,091 | |
| 1,163,331 | | | 6.000 | | | | 12/01/32 | | | | 1,286,221 | |
| 313,093 | | | 5.310 | (b) | | | 02/01/33 | | | | 334,278 | |
| 1,274,582 | | | 5.000 | | | | 07/01/33 | | | | 1,354,360 | |
| 662,951 | | | 5.219 | (b) | | | 10/01/34 | | | | 697,234 | |
| 1,492,601 | | | 5.078 | (b) | | | 02/01/35 | | | | 1,583,630 | |
| | |
| | |
| The accompanying notes are an integral part of these financial statements. | | 13 |
COMMERCE BOND FUND
Schedule of Investments (continued)
April 30, 2011 (Unaudited)
| | | | | | | | | | | | |
Principal
Amount | | Interest
Rate | | | Maturity
Date | | | Value | |
| Mortgage-Backed Obligations – (continued) | |
Mortgage-Backed Pass-Through Obligations – (continued) | |
| GNMA | |
| $ 210,279 | | | 8.000 | % | | | 02/15/22 | | | $ | 245,699 | |
| 83,728 | | | 7.500 | | | | 08/20/25 | | | | 97,067 | |
| 386,736 | | | 7.500 | | | | 07/20/26 | | | | 448,172 | |
| 460,817 | | | 6.500 | | | | 04/15/31 | | | | 522,312 | |
| 345,641 | | | 6.500 | | | | 05/15/31 | | | | 391,767 | |
| 1,819,472 | | | 5.500 | | | | 04/15/33 | | | | 1,993,378 | |
| | |
TOTAL MORTGAGE-BACKED PASS-THROUGH OBLIGATIONS | |
(Cost $17,114,791) | | | | | | | $ | 18,517,206 | |
| | |
| TOTAL MORTGAGE-BACKED OBLIGATIONS | |
(Cost $178,537,128) | | | $ | 200,730,166 | |
| | |
| | | | | | | | | | | | |
| Corporate Obligations – 27.4% | |
Aerospace/Defense – 0.8% | |
| Goodrich Corp. | |
| $ 1,000,000 | | | 4.875 | % | | | 03/01/20 | | | $ | 1,050,798 | |
| Lockheed Martin Corp. | |
| 1,972,000 | | | 6.150 | | | | 09/01/36 | | | | 2,163,085 | |
| United Technologies Corp. | |
| 2,000,000 | | | 5.700 | | | | 04/15/40 | | | | 2,158,174 | |
| | | | | | | | | | | | |
| | | | | | | | | | | 5,372,057 | |
| | |
Beverages – 0.7% | |
| Anheuser-Busch Cos., Inc. | |
| 1,500,000 | | | 5.600 | | | | 03/01/17 | | | | 1,691,634 | |
| PepsiCo, Inc. | |
| 2,500,000 | | | 4.500 | | | | 01/15/20 | | | | 2,638,737 | |
| | | | | | | | | | | | |
| | | | | | | | | | | 4,330,371 | |
| | |
Cable TV – 1.3% | |
| Comcast Corp. | |
| 1,500,000 | | | 5.700 | | | | 07/01/19 | | | | 1,648,860 | |
| 1,250,000 | | | 6.400 | | | | 05/15/38 | | | | 1,325,300 | |
| DIRECTV Holdings LLC/DIRECTV Financing Co, Inc. | |
| 3,000,000 | | | 3.500 | | | | 03/01/16 | | | | 3,045,894 | |
| Time Warner Cable, Inc. | |
| 2,000,000 | | | 6.200 | | | | 07/01/13 | | | | 2,202,318 | |
| | | | | | | | | | | | |
| | | | | | | | | | | 8,222,372 | |
| | |
Chemicals – 0.5% | |
| E.I. du Pont de Nemours and Co. | |
| 1,000,000 | | | 3.250 | | | | 01/15/15 | | | | 1,045,408 | |
| Sigma-Aldrich Corp. | |
| 2,000,000 | | | 3.375 | | | | 11/01/20 | | | | 1,894,484 | |
| | | | | | | | | | | | |
| | | | | | | | | | | 2,939,892 | |
| | |
Commercial Banks – 2.4% | |
| Barclays Bank PLC | |
| 2,000,000 | | | 5.125 | | | | 01/08/20 | | | | 2,057,744 | |
| | |
| | | | | | | | | | |
Principal
Amount | | Interest
Rate | | | Maturity
Date | | Value | |
| Corporate Obligations – (continued) | |
Commercial Banks – (continued) | |
| Credit Suisse AG | |
| $3,000,000 | | | 5.400 | % | | 01/14/20 | | $ | 3,094,251 | |
| Credit Suisse New York | |
| 1,500,000 | | | 5.000 | | | 05/15/13 | | | 1,607,731 | |
| KeyBank NA | |
| 2,540,000 | | | 5.800 | | | 07/01/14 | | | 2,792,268 | |
| Wachovia Bank NA | |
| 2,000,000 | | | 5.000 | | | 08/15/15 | | | 2,158,994 | |
| Wells Fargo Bank NA | |
| 3,125,000 | | | 4.750 | | | 02/09/15 | | | 3,360,800 | |
| | | | | | | | | | |
| | | | | | | | | 15,071,788 | |
| | |
Communications Equipment – 0.4% | |
| Cisco Systems, Inc. | |
| 2,500,000 | | | 4.450 | | | 01/15/20 | | | 2,600,468 | |
| | |
Computers – 0.3% | |
| Hewlett-Packard Co. | |
| 2,000,000 | | | 2.125 | | | 09/13/15 | | | 1,986,362 | |
| | |
Consumer Services – 0.3% | |
| eBay, Inc. | |
| 2,000,000 | | | 1.625 | | | 10/15/15 | | | 1,933,334 | |
| | |
Diversified Manufacturing – 1.1% | |
| GE Capital Trust I(b) | |
| 3,525,000 | | | 6.375 | | | 11/15/67 | | | 3,657,187 | |
| Ingersoll-Rand Global Holding Co. Ltd. | |
| 1,000,000 | | | 9.500 | | | 04/15/14 | | | 1,204,123 | |
| Parker-Hannifin Corp. | |
| 2,000,000 | | | 3.500 | | | 09/15/22 | | | 1,883,504 | |
| | | | | | | | | | |
| | | | | | | | | 6,744,814 | |
| | |
Electric – 2.2% | |
| Columbus Southern Power Co. | |
| 2,870,000 | | | 5.850 | | | 10/01/35 | | | 2,976,750 | |
| Connecticut Light & Power Co. | |
| 415,000 | | | 5.650 | | | 05/01/18 | | | 465,892 | |
| Duke Energy Corp. | |
| 1,525,000 | | | 5.300 | | | 10/01/15 | | | 1,716,741 | |
| Exelon Generation Co. LLC | |
| 1,470,000 | | | 5.350 | | | 01/15/14 | | | 1,592,377 | |
| PacifiCorp | |
| 2,400,000 | | | 5.650 | | | 07/15/18 | | | 2,709,857 | |
| San Diego Gas & Electric Co. | |
| 1,585,000 | | | 5.300 | | | 11/15/15 | | | 1,780,836 | |
| Southern California Edison Co. | |
| 3,000,000 | | | 5.500 | | | 03/15/40 | | | 3,102,000 | |
| | | | | | | | | | |
| | | | | | | | | 14,344,453 | |
| | |
Financial – 6.3% | |
| Bank One Corp. | |
| 1,000,000 | | | 8.530 | | | 03/01/19 | | | 1,230,037 | |
| | |
| | |
| 14 | | The accompanying notes are an integral part of these financial statements. |
COMMERCE BOND FUND
| | | | | | | | | | |
Principal
Amount | | Interest
Rate | | | Maturity
Date | | Value | |
| Corporate Obligations – (continued) | |
Financial – (continued) | |
| Bear Stearns Companies, Inc. | |
| $1,000,000 | | | 7.250 | % | | 02/01/18 | | $ | 1,174,944 | |
| Blackstone Holdings Finance Co. LLC(a) | |
| 3,000,000 | | | 5.875 | | | 03/15/21 | | | 2,972,127 | |
| Citigroup, Inc. | |
| 2,750,000 | | | 6.010 | | | 01/15/15 | | | 3,048,169 | |
| Equitable Life Assurance Society of the United States(a) | |
| 6,220,000 | | | 7.700 | | | 12/01/15 | | | 7,233,897 | |
| General Electric Capital Corp. | |
| 2,000,000 | | | 5.900 | | | 05/13/14 | | | 2,229,934 | |
| Jefferies Group, Inc. | |
| 1,600,000 | | | 3.875 | | | 11/09/15 | | | 1,621,150 | |
| JPMorgan Chase & Co. | |
| 1,250,000 | | | 6.000 | | | 01/15/18 | | | 1,391,035 | |
| Merrill Lynch & Co., Inc. | |
| 1,270,000 | | | 6.875 | | | 04/25/18 | | | 1,441,126 | |
| Metropolitan Life Insurance Co.(a) | |
| 6,770,000 | | | 7.700 | | | 11/01/15 | | | 7,946,958 | |
| Morgan Stanley & Co. | |
| 2,600,000 | | | 6.625 | | | 04/01/18 | | | 2,902,593 | |
| National Rural Utilities Cooperative Finance Corp. | |
| 1,550,000 | | | 5.450 | | | 04/10/17 | | | 1,733,963 | |
| SunTrust Capital VIII(b) | |
| 2,670,000 | | | 6.100 | | | 12/15/36 | | | 2,616,600 | |
| TD Ameritrade Holding Corp. | |
| 2,750,000 | | | 4.150 | | | 12/01/14 | | | 2,901,575 | |
| | | | | | | | | | |
| | | | | | | | | 40,444,108 | |
| | |
Food – 0.2% | |
| Kraft Foods, Inc. | |
| 1,000,000 | | | 6.875 | | | 02/01/38 | | | 1,152,566 | |
| | |
Health Care Equipment & Supplies – 0.5% | |
| Baxter International, Inc. | |
| 2,650,000 | | | 5.375 | | | 06/01/18 | | | 2,983,834 | |
| | |
Health Technology – 0.3% | |
| Becton, Dickinson & Co. | |
| 2,000,000 | | | 3.250 | | | 11/12/20 | | | 1,885,208 | |
| | |
Industrial – 0.3% | |
| Receipts on Corporate Securities Trust NSC-1998-1 | |
| 2,016,781 | | | 6.375 | | | 05/15/17 | | | 2,078,515 | |
| | |
Insurance – 0.9% | |
| Aegon NV | |
| 2,650,000 | | | 4.625 | | | 12/01/15 | | | 2,790,667 | |
| American International Group, Inc. | |
| 1,000,000 | | | 3.650 | | | 01/15/14 | | | 1,024,918 | |
| Reinsurance Group of America, Inc. | |
| 2,000,000 | | | 6.450 | | | 11/15/19 | | | 2,193,260 | |
| | | | | | | | | | |
| | | | | | | | | 6,008,845 | |
| | |
| | | | | | | | | | |
Principal
Amount | | Interest
Rate | | | Maturity
Date | | Value | |
| Corporate Obligations – (continued) | |
Metals & Mining – 0.5% | |
| Rio Tinto Finance USA Ltd. | |
| $3,000,000 | | | 5.200 | % | | 11/02/40 | | $ | 2,929,686 | |
| | |
Multimedia – 0.6% | |
| CBS Corp. | |
| 2,600,000 | | | 8.200 | | | 05/15/14 | | | 3,056,095 | |
| The McGraw-Hill Companies, Inc. | |
| 1,000,000 | | | 5.375 | | | 11/15/12 | | | 1,060,772 | |
| | | | | | | | | | |
| | | | | | | | | 4,116,867 | |
| | |
Oil & Gas – 1.6% | |
| Apache Corp. | |
| 1,360,000 | | | 7.375 | | | 08/15/47 | | | 1,660,972 | |
| BP Capital Markets PLC | |
| 3,530,000 | | | 3.875 | | | 03/10/15 | | | 3,702,423 | |
| Tosco Corp. | |
| 2,095,000 | | | 8.125 | | | 02/15/30 | | | 2,757,317 | |
| Valero Energy Corp. | |
| 2,000,000 | | | 6.875 | | | 04/15/12 | | | 2,105,816 | |
| | | | | | | | | | |
| | | | | | | | | 10,226,528 | |
| | |
Real Estate – 1.4% | |
| AMB Property LP | |
| 2,000,000 | | | 6.125 | | | 12/01/16 | | | 2,212,252 | |
| Hospitality Properties Trust | |
| 1,240,000 | | | 6.300 | | | 06/15/16 | | | 1,371,725 | |
| Kimco Realty Corp. | |
| 2,000,000 | | | 4.300 | | | 02/01/18 | | | 2,042,296 | |
| Simon Property Group LP | |
| 1,000,000 | | | 6.750 | | | 05/15/14 | | | 1,129,607 | |
| 2,000,000 | | | 4.200 | | | 02/01/15 | | | 2,128,994 | |
| | | | | | | | | | |
| | | | | | | | | 8,884,874 | |
| | |
Retail – 0.2% | |
| Wal-Mart Stores, Inc. | |
| 1,250,000 | | | 6.200 | | | 04/15/38 | | | 1,381,578 | |
| | |
Software – 0.4% | |
| Adobe Systems, Inc. | |
| 2,700,000 | | | 4.750 | | | 02/01/20 | | | 2,773,713 | |
| | |
Sovereign Agency – 0.3% | |
| Resolution Funding Corp. | |
| 1,500,000 | | | 8.125 | | | 10/15/19 | | | 2,047,746 | |
| | |
Telecommunications – 0.8% | |
| AT&T, Inc. | |
| 2,320,000 | | | 2.500 | | | 08/15/15 | | | 2,326,051 | |
| Telefonica Emisiones SAU | |
| 2,635,000 | | | 3.729 | | | 04/27/15 | | | 2,703,067 | |
| | | | | | | | | | |
| | | | | | | | | 5,029,118 | |
| | |
Utilities – 1.3% | |
| GTE Corp. | |
| 5,310,000 | | | 6.840 | | | 04/15/18 | | | 6,182,746 | |
| | |
| | |
| The accompanying notes are an integral part of these financial statements. | | 15 |
COMMERCE BOND FUND
Schedule of Investments (continued)
April 30, 2011 (Unaudited)
| | | | | | | | | | |
Principal
Amount | | Interest
Rate | | | Maturity
Date | | Value | |
| Corporate Obligations – (continued) | |
Utilities – (continued) | |
| Pacific Gas & Electric Co. | |
| $ 2,000,000 | | | 6.350 | % | | 02/15/38 | | $ | 2,200,982 | |
| | | | | | | | | | |
| | | | | | | | | 8,383,728 | |
| | |
Yankee – 1.8% | |
| BHP Billiton Finance USA Ltd. | |
| 750,000 | | | 6.750 | | | 11/01/13 | | | 847,463 | |
| 955,000 | | | 5.250 | | | 12/15/15 | | | 1,073,937 | |
| Canadian National Railway Co. | |
| 1,190,000 | | | 6.200 | | | 06/01/36 | | | 1,339,547 | |
| Swiss Bank Corp. | |
| 7,335,000 | | | 7.375 | | | 06/15/17 | | | 8,304,166 | |
| | | | | | | | | | |
| | | | | | | | | 11,565,113 | |
| | |
| TOTAL CORPORATE OBLIGATIONS | | | | |
(Cost $164,488,844) | | $ | 175,437,938 | |
| | |
| |
| U.S. Government Agency Obligations – 14.3% | |
| FFCB | |
| $ 5,000,000 | | | 2.625 | % | | 04/17/14 | | $ | 5,214,410 | |
| 6,135,000 | | | 4.500 | | | 05/06/14 | | | 6,737,647 | |
| 6,460,000 | | | 3.000 | | | 06/17/16 | | | 6,481,156 | |
| 2,860,000 | | | 5.190 | | | 04/22/21 | | | 3,205,720 | |
| FHLB | |
| 5,000,000 | | | 1.750 | | | 08/22/12 | | | 5,085,555 | |
| 5,000,000 | | | 4.500 | | | 09/16/13 | | | 5,420,440 | |
| 7,000,000 | | | 3.625 | | | 10/18/13 | | | 7,448,616 | |
| 2,050,000 | | | 5.625 | | | 06/13/16 | | | 2,267,300 | |
| 1,915,000 | | | 5.375 | | | 08/15/24 | | | 2,144,331 | |
| 2,650,000 | | | 7.125 | | | 02/15/30 | | | 3,430,867 | |
| FHLMC | |
| 5,000,000 | | | 1.625 | | | 04/15/13 | | | 5,093,710 | |
| 29,488 | | | 6.000 | | | 12/01/13 | | | 32,000 | |
| 2,860,000 | | | 2.875 | | | 02/09/15 | | | 2,993,562 | |
| 2,500,000 | | | 5.000 | | | 02/16/17 | | | 2,831,400 | |
| 2,500,000 | | | 6.750 | | | 03/15/31 | | | 3,214,102 | |
| FNMA | |
| 4,000,000 | | | 1.300 | | | 05/25/12 | | | 4,002,360 | |
| 5,000,000 | | | 1.750 | | | 02/22/13 | | | 5,098,635 | |
| 3,000,000 | | | 1.750 | | | 05/07/13 | | | 3,060,849 | |
| 4,500,000 | | | 5.000 | | | 02/13/17 | | | 5,103,792 | |
| 3,000,000 | | | 5.000 | | | 05/11/17 | | | 3,407,718 | |
| 2,000,000 | | | 5.375 | | | 04/11/22 | | | 2,081,518 | |
| Tennessee Valley Authority | |
| 2,456,999 | | | 4.929 | | | 01/15/21 | | | 2,684,272 | |
| 1,485,096 | | | 5.131 | | | 01/15/21 | | | 1,642,888 | |
| 2,500,000 | | | 5.880 | | | 04/01/36 | | | 2,886,980 | |
| | |
| TOTAL U.S. GOVERNMENT AGENCY OBLIGATIONS | |
(Cost $88,795,558) | | $ | 91,569,828 | |
| | |
| |
| | | | | | | | | | | | |
| Principal Amount | | Interest
Rate | | | Maturity
Date | | | Value | |
| Government Guarantee Obligations(d) – 0.5% | |
| Oriental Bank & Trust | |
| $ 3,000,000 | | | 2.750 | % | | | 03/16/12 | | | $ | 3,062,910 | |
(Cost $3,000,000) | | | | | | | | | | | | |
| | |
| |
| U.S. Treasury Obligations – 2.4% | |
| United States Treasury Bonds | |
| $ 2,150,000 | | | 5.375 | % | | | 02/15/31 | | | $ | 2,498,031 | |
| 5,000,000 | | | 4.500 | | | | 02/15/36 | | | | 5,124,220 | |
| 3,000,000 | | | 3.500 | | | | 02/15/39 | | | | 2,558,436 | |
| United States Treasury Notes | |
| 5,000,000 | | | 2.750 | | | | 11/30/16 | | | | 5,142,190 | |
| | |
| TOTAL U.S. TREASURY OBLIGATIONS | | | | | |
(Cost $15,022,192) | | | $ | 15,322,877 | |
| | |
| | | | | | | | | | | | |
| Shares | | Description | | | Rate | | | Value | |
| Investment Company – 0.7% | |
| Vanguard Long-Term Investment Grade Fund Admiral Shares | |
| 506,527 | | | | | | | 5.600 | % | | $ | 4,776,552 | |
(Cost $3,961,043) | | | | | | | | | |
| | |
| | | | | | | | | | |
Principal
Amount | | Interest
Rate | | | Maturity
Date | | Value | |
| Short-term Investment(e) – 2.1% | |
Repurchase Agreement – 2.1% | |
| State Street Bank & Trust Co. | |
| $13,594,000 | | | 0.010 | % | | 05/02/11 | | $ | 13,594,000 | |
Maturity Value: $13,594,011 | |
(Cost $13,594,000) | |
| | |
| TOTAL INVESTMENTS – 99.9% | | | | |
(Cost $597,135,695) | | $ | 640,764,265 | |
| | |
OTHER ASSETS IN EXCESS OF LIABILITIES – 0.1% | | | 807,286 | |
| | |
| NET ASSETS – 100.0% | | $ | 641,571,551 | |
| | |
| | |
| The percentage shown for each investment category reflects the value of investments in that category as a percentage of net assets. |
| (a) | | Exempt from registration under Rule 144A of the Securities Act of 1933. Under procedures approved by the Board of Trustees, such securities have been determined to be liquid by the Investment Adviser and may be resold, normally to qualified institutional buyers in transactions exempt from registration. Total market value of Rule 144A securities amounted to $35,814,108, which represents approximately 5.6% of net assets as of April 30, 2011. |
| (b) | | Variable rate security. The interest rate shown reflects the rate as of April 30, 2011. |
| (c) | | Issued with a zero coupon. Income is recognized through the accretion of discount. |
| | |
| 16 | | The accompanying notes are an integral part of these financial statements. |
COMMERCE BOND FUND
| | |
| (d) | | Guaranteed under the Federal Deposit Insurance Corporation’s (“FDIC”) Temporary Liquidity Guarantee Program and is backed by the full faith and credit of the United States. The expiration date of the FDIC’s guarantee is the earlier of the maturity date of the debt or June 30, 2012. |
| (e) | | Repurchase agreement was entered into on April 29, 2011. This agreement was fully collateralized by $13,700,000 U.S. Treasury Note, 1.000%, due 04/30/12 with a market value of $13,868,731. |
| | |
| |
| Investment Abbreviations: |
| AGM | | —Insured by Assured Guaranty Municipal Corp. |
| AMBAC | | —Insured by American Municipal Bond Assurance Corp. |
| FFCB | | —Federal Farm Credit Bank |
| FHLB | | —Federal Home Loan Bank |
| FHLMC | | —Federal Home Loan Mortgage Corp. |
| FNIC | | —Financial Network Investment Corporation |
| FNMA | | —Federal National Mortgage Association |
| GNMA | | —Government National Mortgage Association |
| GO | | —General Obligation |
| MSC | | —Mortgage Securities Corp. |
| NATL-RE | | —Insured by National Reinsurance Corp. |
| PAC | | —Planned Amortization Class |
| REMIC | | —Real Estate Mortgage Investment Conduit |
| TAC | | —Targeted Amortization Class |
| XLCA | | —Insured by XL Capital Assurance, Inc. |
| |
PORTFOLIO COMPOSITION
| | | | | | | | |
| | | AS OF
4/30/11 | | | AS OF
10/31/10 | |
| | |
Corporate Obligations | | | 27.4 | % | | | 28.1 | % |
Collateralized Mortgage Obligations | | | 27.0 | | | | 28.1 | |
U.S.Government Agency Obligations | | | 14.3 | | | | 14.5 | |
Asset-Backed Securities | | | 8.9 | | | | 8.2 | |
Taxable Municipal Bond Obligations | | | 12.3 | | | | 8.0 | |
Mortgage-Backed Pass-Through Obligations | | | 2.9 | | | | 3.3 | |
U.S. Treasury Obligations | | | 2.4 | | | | 3.5 | |
Commercial Mortgage Obligations | | | 1.4 | | | | 1.7 | |
Investment Companies | | | 0.7 | | | | 0.7 | |
Government Guarantee Obligations | | | 0.5 | | | | 2.0 | |
Short-term Investment | | | 2.1 | | | | 1.4 | |
| | |
| TOTAL INVESTMENTS | | | 99.9 | % | | | 99.5 | % |
| | |
The percentage shown for each investment category reflects the value of investments in that category as a percentage of net assets. Underlying investment categories of investment companies held by the Fund are not reflected in the table above. Consequently, the Fund’s overall investment category allocations may differ from the percentages contained in the table above.
The Fund is actively managed and, as such its composition may differ over time.
| | |
| The accompanying notes are an integral part of these financial statements. | | 17 |
COMMERCE SHORT-TERM GOVERNMENT FUND
Schedule of Investments
April 30, 2011 (Unaudited)
| | | | | | | | | | |
Principal
Amount | | Interest
Rate | | | Maturity
Date | | Value | |
| Asset-Backed Securities – 1.6% | |
Commercial – 0.9% | |
| Small Business Administration Series 2006-P10B, Class 1 | |
| $ 951,166 | | | 5.681 | % | | 08/10/16 | | $ | 1,029,630 | |
| | |
Home Equity(a) – 0.7% | |
| Argent Securities, Inc. Series 2004-W5, Class AV3B | |
| 778,639 | | | 0.663 | | | 04/25/34 | | | 666,737 | |
| Lehman XS Trust Series 2005-7N, Class 1A1A | |
| 336,483 | | | 0.483 | | | 12/25/35 | | | 238,362 | |
| | | | | | | | | | |
| | | | | | | | | 905,099 | |
| | |
| TOTAL ASSET-BACKED SECURITIES | |
(Cost $1,572,919) | | $ | 1,934,729 | |
| | |
| | | | | | | | | | |
| Mortgage-Backed Obligations – 27.0% | |
Collateralized Mortgage Obligations – 22.5% | |
| ABN Amro Mortgage Corp. Series 2003-11, Class A9 | |
| $ 216,901 | | | 6.000 | % | | 10/25/33 | | $ | 220,189 | |
| American Home Mortgage Investment Trust Series 2004-3, Class 6A4 | |
| 396,935 | | | 5.010 | | | 10/25/34 | | | 397,491 | |
| Banc of America Alternative Loan Trust Series 2004-1, Class 1A1 | |
| 468,351 | | | 6.000 | | | 02/25/34 | | | 492,245 | |
| Bank of America Funding Corp. Series 2004-A, Class 1A3(a) | |
| 94,212 | | | 4.946 | | | 09/20/34 | | | 95,674 | |
| Chase Mortgage Finance Corp. Series 2003-S13, Class A1 | |
| 512,963 | | | 5.500 | | | 11/25/33 | | | 530,621 | |
| Citicorp Mortgage Securities, Inc. Series 2004-3, Class A11 | |
| 104,785 | | | 5.250 | | | 05/25/34 | | | 104,717 | |
| Citicorp Mortgage Securities, Inc. Series 2004-5, Class 2A3 | |
| 147,500 | | | 4.750 | | | 08/25/34 | | | 153,072 | |
| Citigroup Mortgage Loan Trust, Inc. Series 2004-HYB3, Class 1A(a) | |
| 259,321 | | | 2.984 | | | 09/25/34 | | | 249,371 | |
| Countrywide Alternative Loan Trust Series 2003-21T1, Class A2 | |
| 999,367 | | | 5.250 | | | 12/25/33 | | | 1,011,628 | |
| Countrywide Alternative Loan Trust Series 2004-29CB, Class A7 | |
| 490,016 | | | 5.375 | | | 01/25/35 | | | 487,399 | |
| Countrywide Alternative Loan Trust Series 2005-5R, Class A2 | |
| 555,296 | | | 4.750 | | | 12/25/18 | | | 560,197 | |
| Countrywide Home Loans Trust Series 2003-J6, Class 1A1 | |
| 138,358 | | | 5.500 | | | 08/25/33 | | | 147,123 | |
| Countrywide Home Loans, Inc. Series 2002-35, Class 3A1 | |
| 373,348 | | | 5.000 | | | 02/25/18 | | | 385,911 | |
| Countrywide Home Loans, Inc. Series 2003-HYB3, Class 7A1(a) | |
| 435,155 | | | 2.961 | | | 11/19/33 | | | 434,917 | |
| FHLMC REMIC PAC Series 023, Class PK | |
| 384,229 | | | 6.000 | | | 11/25/23 | | | 413,516 | |
| | |
| | | | | | | | | | |
Principal
Amount | | Interest
Rate | | | Maturity
Date | | Value | |
| Mortgage-Backed Obligations – (continued) | |
Collateralized Mortgage Obligations – (continued) | |
| FHLMC REMIC PAC Series 041, Class F | |
| $ 63,625 | | | 10.000 | % | | 05/15/20 | | $ | 71,686 | |
| FHLMC REMIC PAC Series 159, Class H | |
| 27,587 | | | 4.500 | | | 09/15/21 | | | 28,931 | |
| FHLMC REMIC PAC Series 2022, Class PE | |
| 91,795 | | | 6.500 | | | 01/15/28 | | | 103,489 | |
| FHLMC REMIC PAC Series 2109, Class PE | |
| 270,420 | | | 6.000 | | | 12/15/28 | | | 298,251 | |
| FHLMC REMIC PAC Series 2345, Class PQ | |
| 38,334 | | | 6.500 | | | 08/15/16 | | | 40,835 | |
| FHLMC REMIC PAC Series 2522, Class PE | |
| 281,154 | | | 5.500 | | | 03/15/22 | | | 292,244 | |
| FHLMC REMIC PAC Series 2524, Class PD | |
| 231,693 | | | 5.500 | | | 12/15/31 | | | 243,409 | |
| FHLMC REMIC PAC Series 2594, Class OR | |
| 35,861 | | | 4.250 | | | 06/15/32 | | | 36,257 | |
| FHLMC REMIC PAC Series 2668, Class OE | |
| 573,031 | | | 5.000 | | | 10/15/28 | | | 584,523 | |
| FHLMC REMIC PAC Series 2760, Class EC | |
| 1,000,000 | | | 4.500 | | | 04/15/17 | | | 1,033,551 | |
| FHLMC REMIC PAC Series 2836, Class PX | |
| 716,003 | | | 4.000 | | | 05/15/18 | | | 745,280 | |
| FHLMC REMIC PAC Series 3028, Class MC | |
| 1,510,586 | | | 5.000 | | | 06/15/29 | | | 1,544,795 | |
| FHLMC REMIC PAC Series 3059, Class CD | |
| 945,000 | | | 5.000 | | | 04/15/31 | | | 1,018,505 | |
| FHLMC REMIC PAC Series 3117, Class PC | |
| 517,883 | | | 5.000 | | | 06/15/31 | | | 541,204 | |
| FHLMC REMIC Series 2534, Class HB | |
| 341,396 | | | 5.000 | | | 10/15/16 | | | 344,751 | |
| FHLMC REMIC Series 2584, Class LX | |
| 52,074 | | | 5.500 | | | 12/15/13 | | | 52,577 | |
| FHLMC REMIC Series 2642, Class DA | |
| 464,245 | | | 5.000 | | | 05/15/22 | | | 486,201 | |
| FHLMC REMIC Series 2664, Class MA | |
| 287,993 | | | 5.000 | | | 04/15/30 | | | 294,541 | |
| FHLMC REMIC Series 2830, Class DA | |
| 360,245 | | | 5.000 | | | 07/15/19 | | | 373,456 | |
| FHLMC REMIC Series 2972, Class CA | |
| 430,082 | | | 4.500 | | | 05/15/20 | | | 457,329 | |
| FHLMC REMIC Series 3131, Class BA | |
| 223,652 | | | 5.500 | | | 11/15/24 | | | 237,189 | |
| FHLMC REMIC Series 3146, Class GA | |
| 254,427 | | | 5.500 | | | 11/15/24 | | | 270,545 | |
| FNMA REMIC PAC Series 1992, Class 89 Principal-Only Stripped Security(b) | |
| 32,140 | | | 0.000 | | | 06/25/22 | | | 28,952 | |
| FNMA REMIC PAC Series 1992-129, Class L | |
| 197,236 | | | 6.000 | | | 07/25/22 | | | 218,623 | |
| | |
| | |
| 18 | | The accompanying notes are an integral part of these financial statements. |
COMMERCE SHORT-TERM GOVERNMENT FUND
| | | | | | | | | | |
Principal
Amount | | Interest
Rate | | | Maturity
Date | | Value | |
| Mortgage-Backed Obligations – (continued) | |
Collateralized Mortgage Obligations – (continued) | |
| FNMA REMIC PAC Series 1993-132, Class A Principal-Only Stripped Security(b) | |
| $ 9,683 | | | 0.000 | % | | 10/25/22 | | $ | 9,649 | |
| FNMA REMIC PAC Series 1998-36, Class J | |
| 97,437 | | | 6.000 | | | 07/18/28 | | | 105,487 | |
| FNMA REMIC PAC Series 2001-71, Class MB | |
| 218,748 | | | 6.000 | | | 12/25/16 | | | 235,740 | |
| FNMA REMIC PAC Series 2003-117, Class KB | |
| 556,000 | | | 6.000 | | | 12/25/33 | | | 627,323 | |
| FNMA REMIC PAC Series 2003-14, Class AP | |
| 414,572 | | | 4.000 | | | 03/25/33 | | | 435,311 | |
| FNMA REMIC Series 1991-137, Class H | |
| 85,418 | | | 7.000 | | | 10/25/21 | | | 95,752 | |
| FNMA REMIC Series 1993-182, Class FA(a) | |
| 31,216 | | | 2.860 | | | 09/25/23 | | | 32,426 | |
| FNMA REMIC Series 2003-33, Class LD | |
| 1,225,846 | | | 4.250 | | | 09/25/22 | | | 1,267,681 | |
| FNMA Series 2003-W17, Class 1A6 | |
| 73,394 | | | 5.310 | | | 08/25/33 | | | 77,023 | |
| GNMA Series 1998-12, Class EB | |
| 168,873 | | | 6.500 | | | 05/20/28 | | | 176,370 | |
| GNMA Series 2001-53, Class F(a) | |
| 30,098 | | | 0.563 | | | 10/20/31 | | | 30,064 | |
| GSR Mortgage Loan Trust Series 2003-6F, Class A1 | |
| 356,817 | | | 3.000 | | | 09/25/32 | | | 351,966 | |
| GSR Mortgage Loan Trust Series 2004-6F, Class 5A1 | |
| 1,068,879 | | | 5.500 | | | 03/25/19 | | | 1,109,865 | |
| GSR Mortgage Loan Trust Series 2006-AR1, Class 2A4(a) | |
| 1,070,000 | | | 2.809 | | | 01/25/36 | | | 754,660 | |
| Indymac Index Mortgage Loan Trust Series 2004-AR6, Class 6A1(a) | |
| 430,683 | | | 5.508 | | | 10/25/34 | | | 409,461 | |
| Master Adjustable Rate Mortgages Trust Series 2004-13, Class 2A1(a) | |
| 721,034 | | | 2.796 | | | 04/21/34 | | | 717,163 | |
| Master Asset Securitization Trust Series 2003-6, Class 9A1 | |
| 29,830 | | | 4.250 | | | 07/25/33 | | | 29,846 | |
| Master Asset Securitization Trust Series 2004-3, Class 5A1 | |
| 54,006 | | | 6.250 | | | 01/25/32 | | | 54,552 | |
| Residential Accredit Loans, Inc. Series 2004-QA4, Class NB21(a) | |
| 97,976 | | | 3.686 | | | 09/25/34 | | | 95,257 | |
| Residential Accredit Loans, Inc. Series 2004-QS5, Class A5 | |
| 389,306 | | | 4.750 | | | 04/25/34 | | | 390,826 | |
| Residential Funding Mortgage Securities Corp. Series 2003-RM2, Class AII | |
| 139,572 | | | 5.000 | | | 05/25/18 | | | 143,109 | |
| Residential Funding Mortgage Securities I, Inc. Series 2003-S8, Class A1 | |
| 194,222 | | | 5.000 | | | 05/25/18 | | | 199,775 | |
| | |
| | | | | | | | | | |
Principal
Amount | | Interest
Rate | | | Maturity
Date | | Value | |
| Mortgage-Backed Obligations – (continued) | |
Collateralized Mortgage Obligations – (continued) | |
| Securitized Asset Sales, Inc. Series 1993-7, Class TA6 | |
| $ 23,934 | | | 6.250 | % | | 12/25/23 | | $ | 24,950 | |
| Sequoia Mortgage Trust Series 10, Class 1A(a) | |
| 188,192 | | | 1.013 | | | 10/20/27 | | | 178,545 | |
| Sequoia Mortgage Trust Series 2003-2, Class A1(a) | |
| 333,902 | | | 0.873 | | | 06/20/33 | | | 301,164 | |
| Structured Asset Securities Corp. Series 2003-20, Class 1A1 | |
| 812,084 | | | 5.500 | | | 07/25/33 | | | 841,773 | |
| Structured Asset Securities Corp. Series 2003-31A, Class 2A7(a) | |
| 1,145,503 | | | 2.561 | | | 10/25/33 | | | 1,089,819 | |
| Vendee Mortgage Trust Series 1996-2, Class 1Z | |
| 225,250 | | | 6.750 | | | 06/15/26 | | | 254,968 | |
| Washington Mutual MSC Mortgage Pass-Through Series 2002-MS8, Class 4A5 | |
| 196,370 | | | 5.750 | | | 12/25/32 | | | 203,989 | |
| Washington Mutual MSC Mortgage Pass-Through Series 2003-MS8, Class 2A1 | |
| 1,202,557 | | | 5.000 | | | 05/25/18 | | | 1,233,250 | |
| Wells Fargo Alternative Loan Trust Series 2003-1, Class 2A1 | |
| 749,846 | | | 5.750 | | | 09/25/18 | | | 761,098 | |
| Wells Fargo Mortgage Backed Securities Trust Series 2003-6, Class 1A1 | |
| 125,433 | | | 5.000 | | | 06/25/18 | | | 129,987 | |
| | |
| TOTAL COLLATERALIZED MORTGAGE OBLIGATIONS | |
(Cost $26,209,459) | | $ | 27,400,044 | |
| | |
Commercial Mortgage Obligations – 1.3% | |
| GNMA Series 2004-20, Class C | |
| $ 398,977 | | | 4.430 | % | | 04/16/34 | | $ | 406,745 | |
| GNMA Series 2004-60, Class C(a) | |
| 1,150,000 | | | 5.240 | | | 03/16/28 | | | 1,209,749 | |
| | |
| TOTAL COMMERCIAL MORTGAGE OBLIGATIONS | |
(Cost $1,559,051) | | $ | 1,616,494 | |
| | |
Mortgage-Backed Pass-Through Obligations – 3.2% | |
| FHLMC | |
| $ 103,060 | | | 5.500 | % | | 08/01/17 | | $ | 111,811 | |
| 245,813 | | | 5.500 | | | 09/01/21 | | | 266,839 | |
| 84,506 | | | 6.000 | | | 10/01/23 | | | 92,672 | |
| 358,943 | | | 5.000 | | | 05/01/27 | | | 381,466 | |
| FNMA | |
| 39,565 | | | 6.500 | | | 09/01/13 | | | 43,486 | |
| 118,034 | | | 10.500 | | | 11/01/15 | | | 128,185 | |
| 90,374 | | | 6.000 | | | 07/01/16 | | | 98,749 | |
| 422,692 | | | 5.500 | | | 05/01/19 | | | 459,176 | |
| 421,699 | | | 5.500 | | | 06/01/20 | | | 458,098 | |
| 4,992 | | | 4.195 | (a) | | 08/01/23 | | | 5,243 | |
| 3,425 | | | 9.000 | | | 07/01/24 | | | 3,444 | |
| 11,030 | | | 2.455 | (a) | | 12/01/28 | | | 11,154 | |
| 59,305 | | | 7.000 | | | 11/01/31 | | | 68,325 | |
| 638,978 | | | 6.000 | | | 07/01/33 | | | 706,477 | |
| 585,654 | | | 2.603 | (a) | | 02/01/34 | | | 614,633 | |
| 309,130 | | | 5.219 | (a) | | 10/01/34 | | | 325,116 | |
| | |
| | |
| The accompanying notes are an integral part of these financial statements. | | 19 |
COMMERCE SHORT-TERM GOVERNMENT FUND
Schedule of Investments (continued)
April 30, 2011 (Unaudited)
| | | | | | | | | | |
Principal
Amount | | Interest
Rate | | | Maturity
Date | | Value | |
| Mortgage-Backed Obligations – (continued) | |
Mortgage-Backed Pass-Through Obligations – (continued) | |
| GNMA | |
| $ 7,976 | | | 8.000 | % | | 07/15/17 | | $ | 9,095 | |
1,398 | | | 3.000 | (a) | | 12/20/24 | | | 1,448 | |
| 15,105 | | | 3.375 | (a) | | 04/20/26 | | | 15,741 | |
| 14,032 | | | 2.625 | (a) | | 08/20/26 | | | 14,493 | |
| 16,018 | | | 3.375 | (a) | | 01/20/28 | | | 16,697 | |
| | |
| TOTAL MORTGAGE-BACKED PASS-THROUGH OBLIGATIONS | |
(Cost $3,674,750) | | $ | 3,832,348 | |
| | |
| TOTAL MORTGAGE-BACKED OBLIGATIONS | |
(Cost $31,443,260) | | $ | 32,848,886 | |
| | |
| |
| Government Guarantee Obligations(c) – 6.2% | |
| GMAC, Inc. | |
| $1,000,000 | | | 2.200 | % | | 12/19/12 | | $ | 1,027,427 | |
| JPMorgan Chase & Co. | |
| 800,000 | | | 3.125 | | | 12/01/11 | | | 813,370 | |
| Keybank National Association | |
| 400,000 | | | 3.200 | | | 06/15/12 | | | 412,944 | |
| Morgan Stanley & Co. | |
| 750,000 | | | 2.250 | | | 03/13/12 | | | 762,338 | |
| Regions Bank | |
| 1,000,000 | | | 3.250 | | | 12/09/11 | | | 1,018,510 | |
| U.S. Bancorp | |
| 750,000 | | | 2.250 | | | 03/13/12 | | | 762,794 | |
| 1,000,000 | | | 1.800 | | | 05/15/12 | | | 1,014,651 | |
| U.S. Central Credit Union | |
| 900,000 | | | 1.900 | | | 10/19/12 | | | 918,431 | |
| Wells Fargo & Co. | |
| 800,000 | | | 3.000 | | | 12/09/11 | | | 813,567 | |
| | |
| TOTAL GOVERNMENT GUARANTEE OBLIGATIONS | |
(Cost $7,392,254) | | $ | 7,544,032 | |
| | |
| |
| U.S. Government Agency Obligations – 51.2% | |
| FFCB | |
| $1,000,000 | | | 3.875 | % | | 10/07/13 | | $ | 1,071,921 | |
| 2,600,000 | | | 2.625 | | | 04/17/14 | | | 2,711,493 | |
| 1,170,000 | | | 3.000 | | | 09/22/14 | | | 1,233,002 | |
| 150,000 | | | 4.700 | | | 08/10/15 | | | 167,295 | |
| 250,000 | | | 7.000 | | | 09/01/15 | | | 301,048 | |
| 500,000 | | | 6.125 | | | 12/29/15 | | | 590,864 | |
| FHLB | |
| 1,250,000 | | | 4.750 | | | 12/09/11 | | | 1,282,903 | |
| 1,000,000 | | | 3.500 | | | 03/08/13 | | | 1,052,849 | |
| 1,500,000 | | | 5.125 | | | 08/14/13 | | | 1,646,029 | |
| 1,000,000 | | | 3.625 | | | 10/18/13 | | | 1,064,088 | |
| 1,560,000 | | | 5.250 | | | 06/18/14 | | | 1,751,424 | |
| 1,000,000 | | | 5.250 | | | 09/12/14 | | | 1,124,319 | |
| 2,500,000 | | | 5.000 | | | 12/21/15 | | | 2,822,487 | |
| 1,000,000 | | | 4.000 | | | 03/04/16 | | | 1,047,023 | |
| 250,000 | | | 5.375 | | | 05/15/19 | | | 287,467 | |
| | |
| | | | | | | | | | |
Principal
Amount | | Interest
Rate | | | Maturity
Date | | Value | |
| U.S. Government Agency Obligations – (continued) | |
| FHLMC | |
| $1,575,000 | | | 2.125 | % | | 09/21/12 | | $ | 1,611,108 | |
| 1,500,000 | | | 4.625 | | | 10/25/12 | | | 1,591,911 | |
| 1,800,000 | | | 1.625 | | | 04/15/13 | | | 1,833,736 | |
| 1,500,000 | | | 4.000 | | | 06/12/13 | | | 1,602,132 | |
| 2,000,000 | | | 1.500 | | | 07/12/13 | | | 2,003,724 | |
| 1,000,000 | | | 1.250 | | | 07/29/13 | | | 1,002,265 | |
| 1,560,000 | | | 2.500 | | | 01/07/14 | | | 1,621,080 | |
| 1,600,000 | | | 2.500 | | | 04/23/14 | | | 1,662,846 | |
| 790,000 | | | 5.000 | | | 07/15/14 | | | 881,725 | |
| 1,000,000 | | | 4.500 | | | 01/15/15 | | | 1,106,262 | |
| 1,200,000 | | | 2.875 | | | 02/09/15 | | | 1,256,040 | |
| 1,300,000 | | | 1.750 | | | 09/10/15 | | | 1,294,046 | |
| 1,300,000 | | | 5.300 | | | 12/01/15 | | | 1,485,037 | |
| 1,500,000 | | | 1.000 | | | 08/26/16 | | | 1,502,290 | |
| FNMA | |
| 1,000,000 | | | 6.125 | | | 03/15/12 | | | 1,050,216 | |
| 2,000,000 | | | 3.625 | | | 02/12/13 | | | 2,104,266 | |
| 1,500,000 | | | 4.375 | | | 03/15/13 | | | 1,603,977 | |
| 1,200,000 | | | 0.875 | | | 03/21/14 | | | 1,202,603 | |
| 1,600,000 | | | 2.500 | | | 05/15/14 | | | 1,660,347 | |
| 1,000,000 | | | 3.000 | | | 07/28/14 | | | 1,005,479 | |
| 2,000,000 | | | 3.000 | | | 09/16/14 | | | 2,111,354 | |
| 1,250,000 | | | 4.625 | | | 10/15/14 | | | 1,386,161 | |
| 2,000,000 | | | 2.625 | | | 11/20/14 | | | 2,083,602 | |
| 1,800,000 | | | 5.000 | | | 04/15/15 | | | 2,031,340 | |
| 1,250,000 | | | 2.375 | | | 07/28/15 | | | 1,281,468 | |
| 1,000,000 | | | 4.375 | | | 10/15/15 | | | 1,103,500 | |
| 2,000,000 | | | 1.625 | | | 10/26/15 | | | 1,974,630 | |
| 1,800,000 | | | 5.000 | | | 03/15/16 | | | 2,040,998 | |
| Tennessee Valley Authority | |
| 900,000 | | | 6.790 | | | 05/23/12 | | | 961,596 | |
| | |
| TOTAL U.S. GOVERNMENT AGENCY OBLIGATIONS | |
(Cost $60,549,257) | | $ | 62,209,951 | |
| | |
| |
| U.S. Treasury Obligations – 13.1% | |
| United States Treasury Inflation Protected Securities | |
| $1,230,660 | | | 3.000 | % | | 07/15/12 | | $ | 1,316,037 | |
| 1,197,530 | | | 2.000 | | | 01/15/14 | | | 1,317,189 | |
| 1,173,880 | | | 2.000 | | | 07/15/14 | | | 1,303,924 | |
| United States Treasury Notes | |
| 435,000 | | | 4.500 | | | 04/30/12 | | | 453,233 | |
| 1,800,000 | | | 1.375 | | | 09/15/12 | | | 1,825,101 | |
| 2,400,000 | | | 1.375 | | | 11/15/12 | | | 2,435,155 | |
| 1,200,000 | | | 1.750 | | | 04/15/13 | | | 1,226,856 | |
| 1,200,000 | | | 1.750 | | | 03/31/14 | | | 1,226,156 | |
| 1,700,000 | | | 2.375 | | | 10/31/14 | | | 1,764,148 | |
| 1,200,000 | | | 2.250 | | | 01/31/15 | | | 1,237,219 | |
| 1,800,000 | | | 2.125 | | | 05/31/15 | | | 1,840,356 | |
| | |
| TOTAL U.S. TREASURY OBLIGATIONS | |
(Cost $15,255,026) | | $ | 15,945,374 | |
| | |
| |
| | |
| 20 | | The accompanying notes are an integral part of these financial statements. |
COMMERCE SHORT-TERM GOVERNMENT FUND
| | | | | | | | | | | | |
Principal
Amount | | Interest
Rate | | | Maturity
Date | | | Value | |
| Short-term Investment(d) – 0.7% | |
Repurchase Agreement – 0.7% | |
| State Street Bank & Trust Co. | |
| $ 825,000 | | | 0.010 | % | | | 05/02/11 | | | $ | 825,000 | |
Maturity Value: $825,001 | | | | | |
(Cost $825,000) | | | | | |
| | |
| TOTAL INVESTMENTS – 99.8% | | | | | |
(Cost $117,037,716) | | | | | | | $ | 121,307,972 | |
| | |
OTHER ASSETS IN EXCESS OF LIABILITIES – 0.2% | | | | 192,928 | |
| | |
| NET ASSETS – 100.0% | | | $ | 121,500,900 | |
| | |
| | |
| The percentage shown for each investment category reflects the value of investments in that category as a percentage of net assets. |
| (a) | | Variable rate security. The interest rate shown reflects the rate as of April 30, 2011. |
| (b) | | Issued with a zero coupon. Income is recognized through the accretion of discount. |
| (c) | | Guaranteed under the Federal Deposit Insurance Corporation’s (“FDIC”) Temporary Liquidity Guarantee Program and is backed by the full faith and credit of the United States. The expiration date of the FDIC’s guarantee is the earlier of the maturity date of the debt or June 30, 2012. |
| (d) | | Repurchase agreement was entered into on April 29, 2011. This agreement was fully collateralized by $835,000 U.S. Treasury Note, 1.000%, due 04/30/12 with a market value of $845,284. |
| | |
| |
| Investment Abbreviations: |
| FFCB | | —Federal Farm Credit Bank |
| FHLB | | —Federal Home Loan Bank |
| FHLMC | | —Federal Home Loan Mortgage Corp. |
| FNMA | | —Federal National Mortgage Association |
| GNMA | | —Government National Mortgage Association |
| MSC | | —Mortgage Securities Corp. |
| PAC | | —Planned Amortization Class |
| REMIC | | —Real Estate Mortgage Investment Conduit |
| |
PORTFOLIO COMPOSITION
| | | | | | | | |
| | | AS OF
4/30/11 | | | AS OF
10/31/10 | |
| | |
U.S. Government Agency Obligations | | | 51.2 | % | | | 46.1 | % |
Collateralized Mortgage Obligations | | | 22.5 | | | | 21.6 | |
U.S. Treasury Obligations | | | 13.1 | | | | 13.6 | |
Government Guarantee Obligations | | | 6.2 | | | | 7.0 | |
Mortgage-Backed Pass-Through Obligations | | | 3.2 | | | | 3.3 | |
Asset-Backed Securities | | | 1.6 | | | | 1.6 | |
Commercial Mortgage Obligations | | | 1.3 | | | | 2.5 | |
Short-term Investment | | | 0.7 | | | | 3.7 | |
| | |
| TOTAL INVESTMENTS | | | 99.8 | % | | | 99.4 | % |
| | |
The percentage shown for each investment category reflects the value of investments in that category as a percentage of net assets.
The Fund is actively managed and, as such, its composition may differ over time.
| | |
| The accompanying notes are an integral part of these financial statements. | | 21 |
COMMERCE NATIONAL TAX-FREE INTERMEDIATE BOND FUND
Schedule of Investments
April 30, 2011 (Unaudited)
| | | | | | | | | | |
Principal
Amount | | Interest
Rate | | | Maturity
Date | | Value | |
| Municipal Bond Obligations – 98.8% | |
Alabama – 0.6% | |
| Birmingham AL Special Care Facilities Financing Authority Revenue Bonds (Children’s Hospital) Series B (AMBAC) (A/A3) | |
| $1,005,000 | | | 5.000 | % | | 06/01/16 | | $ | 1,050,868 | |
| Cullman AL GO Bonds (Warrants) Series 2007 (AGM) (AA+/Aa3) | |
| 65,000 | | | 4.500 | | | 07/01/23 | | | 65,953 | |
| | | | | | | | | | |
| | | | | | | | | 1,116,821 | |
| | |
Alaska – 0.6% | |
| Alaska Industrial Development & Export Authority Revenue Bonds (Refunding-Greater Fairbanks) Series C (A/NR) | |
| 1,050,000 | | | 4.500 | | | 04/01/18 | | | 1,062,401 | |
| | |
Arizona – 9.7% | |
| Arizona Health Facilities Authority Healthcare & Education Facilities Revenue Bonds (Kirksville College) (A-/NR) | |
| 700,000 | | | 4.700 | | | 01/01/21 | | | 707,406 | |
| 750,000 | | | 4.750 | | | 01/01/22 | | | 752,070 | |
| 1,000,000 | | | 5.000 | | | 01/01/25 | | | 999,930 | |
| Arizona School Facilities Board Certificates of Participation (A+/A1) | |
| 2,810,000 | | | 5.125 | | | 09/01/21 | | | 2,945,189 | |
| Arizona State University Energy Management LLC Revenue Bonds (Tempe Campus II) Series 2009 (AA-/A1) | |
| 2,000,000 | | | 5.000 | | | 07/01/14 | | | 2,158,460 | |
| Glendale AZ Industrial Development Authority Revenue Bonds (Midwestern University) (A-/NR) | |
| 1,500,000 | | | 5.000 | | | 05/15/30 | | | 1,472,880 | |
| Glendale AZ Industrial Development Authority Revenue Bonds (Refunding-Midwestern University) (A-/NR) | |
| 1,200,000 | | | 5.250 | | | 05/15/19 | | | 1,307,304 | |
| Pinal County AZ Unified School District No. 1 Florence GO Bonds (School Improvement Project of 2006) Series C (A/NR) | |
| 860,000 | | | 5.000 | | | 07/01/17 | | | 950,928 | |
| 335,000 | | | 5.000 | | | 07/01/18 | | | 368,343 | |
| 350,000 | | | 5.000 | | | 07/01/19 | | | 378,367 | |
| 1,100,000 | | | 5.125 | | | 07/01/22 | | | 1,165,076 | |
| Queen Creek AZ Excise Tax & State Shared Revenue Bonds (NATL-RE) (A+/Baa1) | |
| 1,070,000 | | | 5.000 | | | 08/01/27 | | | 1,060,530 | |
| Yuma County AZ Library District GO Bonds Series 2007 (XLCA) (A+/Aa3) | |
| 1,000,000 | | | 5.000 | | | 07/01/19 | | | 1,070,390 | |
| 500,000 | | | 5.000 | | | 07/01/20 | | | 530,670 | |
| 1,000,000 | | | 5.000 | | | 07/01/21 | | | 1,054,610 | |
| | | | | | | | | | |
| | | | | | | | | 16,922,153 | |
| | |
Arkansas – 0.3% | |
| Arkansas State Development Finance Authority Economic Development Revenue Bonds (Taxable) (A/NR) | |
| 535,000 | | | 5.480 | | | 09/01/17 | | | 553,158 | |
| | |
| | | | | | | | | | |
Principal
Amount | | Interest
Rate | | | Maturity
Date | | Value | |
| Municipal Bond Obligations – (continued) | |
California – 3.2% | |
| Burbank CA Unified School District GO Bonds Capital Appreciation Election of 1997 Series C (NATL-RE) (FGIC) (AA-/NR)(a) | |
| $1,500,000 | | | 0.000 | % | | 07/01/27 | | $ | 519,045 | |
| California Educational Facilities Authority Revenue Bonds for Loyola Marymount University Series 2010 A (NR/A2) | |
| 500,000 | | | 5.125 | | | 10/01/40 | | | 458,385 | |
| Long Beach CA Pension Obligation Revenue Bonds Series A (AA+/Aa3) | |
| 100,000 | | | 4.960 | | | 09/01/11 | | | 101,141 | |
| Pajaro Valley CA Unified School District GO Bonds Capital Appreciation Election of 2002 Series B (AGM) (AA+/Aa2)(a) | |
| 3,855,000 | | | 0.000 | | | 08/01/26 | | | 1,475,771 | |
| Port Oakland CA Revenue Bonds Series C (A-/A3) | |
| 600,000 | | | 5.000 | | | 11/01/16 | | | 659,064 | |
| Sacramento County CA Airport System Revenue Bonds (A/A2) | |
| 1,000,000 | | | 5.000 | | | 07/01/27 | | | 1,008,710 | |
| San Mateo CA Unified High School District GO Bonds (Capital Appreciation) Series C (NATL-RE) (AA/Aa1)(a) | |
| 880,000 | | | 0.000 | | | 09/01/23 | | | 438,847 | |
| Santa Clara County CA East Side Union High School District GO Bonds (Refunding) Series B (A/Baa1) | |
| 800,000 | | | 5.250 | | | 02/01/23 | | | 823,272 | |
| | | | | | | | | | |
| | | | | | | | | 5,484,235 | |
| | |
Colorado – 1.8% | |
| Colorado Educational & Cultural Facilities Authority Revenue Bonds (Charter School-High Point Academy) (A/NR) | |
| 1,000,000 | | | 4.500 | | | 03/01/20 | | | 992,040 | |
| Colorado Educational & Cultural Facilities Authority Revenue Bonds (Charter School-University Laboratory School Project) (ETM) (NR/NR) | |
| 60,000 | | | 5.250 | | | 06/01/11 | | | 60,215 | |
| Colorado Educational & Cultural Facilities Authority Revenue Bonds (Pinnacle Charter High School) (NR/NR) | |
| 1,000,000 | | | 5.000 | | | 12/01/29 | | | 917,160 | |
| Colorado Housing & Finance Authority Revenue Bonds (Single Family Mortgage) Series A (FHA) (AAA/Aaa) | |
| 430,000 | | | 4.350 | | | 11/01/19 | | | 437,555 | |
| 450,000 | | | 4.600 | | | 11/01/20 | | | 463,964 | |
| Westminster CO Certificates of Participation (Refunding) (NATL-RE) (AA-/Baa1) | |
| 250,000 | | | 4.500 | | | 12/01/23 | | | 253,935 | |
| | | | | | | | | | |
| | | | | | | | | 3,124,869 | |
| | |
District of Columbia – 0.7% | |
| District of Columbia Revenue Bonds (Deed Tax) Series B (NR/A1) | |
| 1,165,000 | | | 5.000 | | | 06/01/25 | | | 1,165,792 | |
| | |
Florida – 8.5% | |
| Brevard County FL Health Facilities Authority Revenue Bonds (Health First, Inc. Project) Series 2005 (A-/A3) | |
| 875,000 | | | 5.000 | | | 04/01/18 | | | 899,859 | |
| | |
| | |
| 22 | | The accompanying notes are an integral part of these financial statements. |
COMMERCE NATIONAL TAX-FREE INTERMEDIATE BOND FUND
| | | | | | | | | | |
Principal
Amount | | Interest
Rate | | | Maturity
Date | | Value | |
| Municipal Bond Obligations – (continued) | |
Florida – (continued) | |
| Broward County FL Airport System Revenue Bonds (Refunding) Series O (A+/A1) | |
| $1,395,000 | | | 5.375 | % | | 10/01/29 | | $ | 1,422,802 | |
| Florida Municipal Loan Council Revenue Bonds Series A (NATL-RE) (A-/Baa1) | |
| 1,000,000 | | | 5.000 | | | 10/01/20 | | | 994,770 | |
| Gulf Breeze FL Revenue Bonds (Local Government Loan) Series J (A+/Aa3) | |
| 1,000,000 | | | 4.500 | | | 12/01/20 | | | 1,067,310 | |
| Jupiter County FL (Community Center Project) GO Bonds Series 2001 (AAA/Aa1) | |
| 50,000 | | | 5.500 | | | 07/01/21 | | | 58,625 | |
| Lake County FL School Board Certificates of Participation Series A (AMBAC) (A/NR) | |
| 1,500,000 | | | 5.000 | | | 06/01/24 | | | 1,510,935 | |
| Miami-Dade County FL Aviation Revenue Bonds (Miami International Airport) Series A (A-/A2) | |
| 1,000,000 | | | 5.000 | | | 10/01/22 | | | 1,048,920 | |
| 1,000,000 | | | 5.250 | | | 10/01/23 | | | 1,054,620 | |
| 1,000,000 | | | 5.500 | | | 10/01/25 | | | 1,052,450 | |
| Miami-Dade County FL Educational Facilities Authority Revenue Bonds (Refunding-University of Miami) Series B (AMBAC) (A-/A3) | |
| 685,000 | | | 5.250 | | | 04/01/21 | | | 745,677 | |
| Miami-Dade County FL Expressway Authority Toll Systems Revenue Bonds Series B (FGIC) (A/A3) | |
| 1,000,000 | | | 5.250 | | | 07/01/14 | | | 1,094,460 | |
| Miami-Dade County FL Special Obligation Revenue Bonds (Capital Asset Acquisition) Series A (AGM) (AA+/Aa3) | |
| 1,805,000 | | | 4.000 | | | 04/01/18 | | | 1,893,824 | |
| 1,260,000 | | | 4.000 | | | 04/01/19 | | | 1,292,634 | |
| Osceola County FL School Board Certificates of Participation Series A (FGIC) (A/Aa3) | |
| 465,000 | | | 5.000 | | | 06/01/15 | | | 495,318 | |
| Port St. Lucie FL Lease Revenue Bonds (Taxable-Wyndcrest Project) Series A (A/Aa3) | |
| 200,000 | | | 6.090 | | | 09/01/20 | | | 208,648 | |
| | | | | | | | | | |
| | | | | | | | | 14,840,852 | |
| | |
Georgia – 0.4% | |
| Brunswick GA Water & Sewer Revenue Bonds (Refunding & Improvement) Series 1992 (NATL-RE) (BBB/Baa1) | |
| 90,000 | | | 6.100 | | | 10/01/19 | | | 109,422 | |
| Cherokee County GA Water & Sewer Authority Revenue Bonds (Refunding & Improvement) Series 1993 (NATL-RE) (BBB/Aa2) | |
| 55,000 | | | 5.500 | | | 08/01/23 | | | 64,124 | |
| Gainesville & Hall County Hospital Authority Revenue Bonds (Northeast Georgia Healthcare System) Series B (A+/NR) | |
| 500,000 | | | 4.000 | | | 02/15/20 | | | 489,460 | |
| | | | | | | | | | |
| | | | | | | | | 663,006 | |
| | |
| | | | | | | | | | |
Principal
Amount | | Interest
Rate | | | Maturity
Date | | Value | |
| Municipal Bond Obligations – (continued) | |
Illinois – 14.3% | |
| Chicago IL GO Bonds (Project & Refunding) Series A (AGM) (AA+/Aa3) | |
| $1,500,000 | | | 5.000 | % | | 01/01/28 | | $ | 1,471,650 | |
| Chicago IL Metropolitan Water Reclamation District Greater Chicago GO Bonds (Refunding) Series C (AAA/Aaa) | |
| 500,000 | | | 5.250 | | | 12/01/26 | | | 570,665 | |
| Chicago IL Public Building Commission Revenue Bonds (Refunding-Chicago School Reform) Series B (FGIC) (BBB/Aa2) | |
| 1,000,000 | | | 5.250 | | | 12/01/18 | | | 1,068,160 | |
| De Kalb County IL Community Unit School District No. 428 GO Bonds (Capital Appreciation-School Building) (AA-/Aa2)(a) | |
| 1,500,000 | | | 0.000 | | | 01/01/20 | | | 985,485 | |
| Dekalb Kane & Lasalle Counties Community College District No. 523 GO Bonds Series A (AA/NR) | |
| 455,000 | | | 4.625 | | | 02/01/21 | | | 463,013 | |
| 400,000 | | | 5.000 | | | 02/01/23 | | | 408,324 | |
| Illinois Educational Facilities Authority Revenue Bonds (Columbia College Chicago) (NATL-RE) (BBB+/Baa1) | |
| 1,000,000 | | | 5.000 | | | 12/01/20 | | | 999,940 | |
| Illinois Finance Authority Revenue Bonds (Columbia College) (NATL-RE) (BBB+/Baa1) | |
| 2,000,000 | | | 5.250 | | | 12/01/22 | | | 2,002,120 | |
| Illinois Finance Authority Revenue Bonds (Poetry Foundation Project) (A+/A1) | |
| 470,000 | | | 4.850 | | | 01/01/26 | | | 472,280 | |
| 490,000 | | | 4.900 | | | 01/01/27 | | | 489,971 | |
| 1,625,000 | | | 5.000 | | | 01/01/30 | | | 1,590,160 | |
| Illinois Finance Authority Revenue Bonds (Refunding-Swedish Covenant) Series A (BBB+/NR) | |
| 1,210,000 | | | 5.500 | | | 08/15/24 | | | 1,176,592 | |
| Illinois Finance Authority Revenue Bonds (Roosevelt University) (NR/Baa2) | |
| 100,000 | | | 5.250 | | | 04/01/22 | | | 96,141 | |
| Illinois Finance Authority Revenue Bonds (Roosevelt University) Series 2007 (NR/Baa2) | |
| 650,000 | | | 5.125 | | | 04/01/19 | | | 648,089 | |
| Illinois Housing Development Authority Revenue Bonds Homeowner Mortgage Series C-1 (AA/Aa3) | |
| 235,000 | | | 3.700 | | | 02/01/13 | | | 239,810 | |
| Illinois State GO Bonds (A+/A1) | |
| 1,000,000 | | | 4.000 | | | 04/01/19 | | | 953,700 | |
| Illinois State GO Bonds (First Series) (NATL-RE) (A+/A1) | |
| 2,000,000 | | | 5.500 | | | 08/01/17 | | | 2,200,060 | |
| Illinois State GO Bonds (Refunding) Series B (A+/A1) | |
| 1,100,000 | | | 5.000 | | | 01/01/14 | | | 1,165,890 | |
| Illinois State GO Bonds Series A (A+/A1) | |
| 2,000,000 | | | 5.000 | | | 03/01/17 | | | 2,073,920 | |
| Macon & De Witt Counties IL Community Unit School District No. 001 GO Bonds (NATL-RE) (FGIC) (NR/NR) | |
| 435,000 | | | 6.150 | | | 12/01/12 | | | 461,378 | |
| | |
| | |
| The accompanying notes are an integral part of these financial statements. | | 23 |
COMMERCE NATIONAL TAX-FREE INTERMEDIATE BOND FUND
Schedule of Investments (continued)
April 30, 2011 (Unaudited)
| | | | | | | | | | |
Principal
Amount | | Interest
Rate | | | Maturity
Date | | Value | |
| Municipal Bond Obligations – (continued) | |
Illinois – (continued) | |
| Northern IL Municipal Power Agency Project Revenue Bonds (Prairie State Project) Series A (NATL-RE) (NR/A2) | |
| $1,750,000 | | | 5.000 | % | | 01/01/42 | | $ | 1,495,533 | |
| Peoria County IL Community Unit School District No. 309 GO Bonds (Capital Appreciation-Brimfield School District) Series A (AGM) (AA+/NR)(a) | |
| 540,000 | | | 0.000 | | | 04/01/18 | | | 417,193 | |
| Regional Transportation Authority IL Revenue Bonds Series A (NATL-RE) (AA/Aa3) | |
| 2,345,000 | | | 6.000 | | | 07/01/29 | | | 2,461,804 | |
| University of Illinois Board of Trustees Certificates of Participation Series A (AA-/Aa2) | |
| 1,000,000 | | | 5.000 | | | 10/01/20 | | | 1,029,210 | |
| | | | | | | | | | |
| | | | | | | | | 24,941,088 | |
| | |
Indiana – 6.1% | |
| Allen County IN War Memorial Revenue Bonds (Refunding-Coliseum Additions Building Corp.) Series A (NR/Aa3) | |
| 600,000 | | | 5.000 | | | 05/01/16 | | | 677,190 | |
| 615,000 | | | 5.000 | | | 11/01/16 | | | 697,152 | |
| Evansville IN Redevelopment Authority Revenue Bonds (Build America Bonds-Taxable) Series B (A/Aa3) | |
| 250,000 | | | 4.930 | | | 02/01/17 | | | 254,990 | |
| 675,000 | | | 6.050 | | | 02/01/23 | | | 688,318 | |
| 3,000,000 | | | 6.860 | | | 02/01/29 | | | 3,096,870 | |
| Indiana Bond Bank Revenue Bonds (Special Project-Hendricks Regional Health) Series A (AA/NR) | |
| 390,000 | | | 5.000 | | | 02/01/13 | | | 412,191 | |
| 120,000 | | | 5.000 | | | 08/01/14 | | | 130,768 | |
| Indiana Health & Educational Facilities Financing Authority Revenue Bonds (Refunding-University of Indianapolis Educational Facilities) (A-/NR) | |
| 1,090,000 | | | 5.000 | | | 10/01/15 | | | 1,184,056 | |
| Indiana State Finance Authority Lease Revenue Bonds (Refunding) Series A-1 (AA+/Aa2) | |
| 500,000 | | | 5.000 | | | 11/01/13 | | | 539,195 | |
| Indiana State University Revenue Bonds (Build America Bonds) (NR/A1) | |
| 530,000 | | | 5.310 | | | 04/01/25 | | | 531,092 | |
| Indianapolis IN Multi-School Building Corp. Revenue Bonds (Refunding-First Mortgage) (AA/Baa1) | |
| 920,000 | | | 3.000 | | | 01/15/26 | | | 743,387 | |
| Mun-Del Building Corp. Delaware County IN Revenue Bonds (Refunding-First Mortgage) (A/NR) | |
| 830,000 | | | 3.000 | | | 07/05/13 | | | 840,624 | |
| 750,000 | | | 3.000 | | | 01/05/14 | | | 762,330 | |
| | | | | | | | | | |
| | | | | | | | | 10,558,163 | |
| | |
Iowa – 0.1% | |
| Iowa Finance Authority Revenue Bonds (Single Family Mortgage) Series A (GNMA/FNMA) (AAA/Aaa) | |
| 125,000 | | | 4.300 | | | 07/01/16 | | | 126,330 | |
| | |
| | | | | | | | | | |
Principal
Amount | | Interest
Rate | | | Maturity
Date | | Value | |
| Municipal Bond Obligations – (continued) | |
Kansas – 0.0% | |
| Neosho County KS Sales Tax Revenue Bonds (NATL-RE) (ETM) (BBB/NR) | |
| $ 55,000 | | | 5.500 | % | | 08/15/11 | | $ | 55,642 | |
| | |
Kentucky – 1.7% | |
| Ashland KY Medical Center Revenue Bonds (Ashland Hospital Corp.) Series B (A+/A1) | |
| 1,000,000 | | | 5.000 | | | 02/01/23 | | | 1,014,780 | |
| Kentucky Economic Development Finance Authority Medical Center Revenue Bonds (Ashland Hospital Corp. Kings) Series C (A+/A1) | |
| 1,900,000 | | | 6.000 | | | 02/01/33 | | | 1,951,642 | |
| | | | | | | | | | |
| | | | | | | | | 2,966,422 | |
| | |
Louisiana – 4.3% | |
| East Baton Rouge LA Mortgage Finance Authority Revenue Bonds (Mortgage Backed Securities Program) Series A-2 (GNMA/FNMA/FHLMC) (NR/Aaa) | |
| 315,000 | | | 4.750 | | | 10/01/29 | | | 314,112 | |
| Louisiana Local Government Environmental Facilities Community Development Authority Revenue Bonds (Woman’s Hospital Foundation) Series A (BBB+/A3) | |
| 5,000,000 | | | 5.500 | | | 10/01/25 | | | 4,892,750 | |
| Tangipahoa Parish LA Hospital Service District No. 1 Revenue Bonds (Refunding-North Oaks Medical Center Project) Series A (BBB+/NR) | |
| 1,100,000 | | | 5.375 | | | 02/01/18 | | | 1,124,376 | |
| 1,245,000 | | | 5.000 | | | 02/01/30 | | | 1,094,442 | |
| | | | | | | | | | |
| | | | | | | | | 7,425,680 | |
| | |
Massachusetts – 4.5% | |
| Massachusetts Educational Financing Authority Education Loan Revenue Bonds (Issue I) Series A (AA/NR) | |
| 1,945,000 | | | 5.100 | | | 01/01/25 | | | 1,972,055 | |
| Massachusetts State Health & Educational Facilities Authority Revenue Bonds (UMass Memorial Health Care, Inc.) Series G (BBB+/Baa1) | |
| 960,000 | | | 5.000 | | | 07/01/20 | | | 961,334 | |
| 1,415,000 | | | 5.000 | | | 07/01/21 | | | 1,396,082 | |
| Massachusetts State Housing Finance Agency Multi Family Housing Revenue Bonds Series A (FHA) (NR/Aaa) | |
| 2,500,000 | | | 5.300 | | | 12/01/38 | | | 2,471,300 | |
| Massachusetts State Housing Finance Agency Revenue Bonds (Single Family) Series 152 (AA/Aa2) | |
| 1,000,000 | | | 4.150 | | | 12/01/28 | | | 909,650 | |
| Massachusetts State Water Resources Authority Revenue Bonds Series A (ETM) (AA+/Aa1) | |
| 60,000 | | | 6.500 | | | 07/15/19 | | | 72,429 | |
| | | | | | | | | | |
| | | | | | | | | 7,782,850 | |
| | |
Michigan – 3.5% | |
Grand Valley MI State University Revenue Bonds (FGIC)
(A+/NR) | |
| 1,500,000 | | | 5.300 | | | 12/01/24 | | | 1,578,165 | |
| | |
| | |
| 24 | | The accompanying notes are an integral part of these financial statements. |
COMMERCE NATIONAL TAX-FREE INTERMEDIATE BOND FUND
| | | | | | | | | | |
Principal
Amount | | Interest
Rate | | | Maturity
Date | | Value | |
| Municipal Bond Obligations – (continued) | |
Michigan – (continued) | |
| Grand Valley MI State University Revenue Bonds Series 1998 (FGIC) (A+/NR) | |
| $1,080,000 | | | 5.500 | % | | 02/01/18 | | $ | 1,172,880 | |
| Ingham County MI GO Bonds Series 1998 (AGM) (AA+/Aa3) | |
| 265,000 | | | 5.125 | | | 11/01/12 | | | 265,779 | |
| Lake Superior University of Michigan Revenue Bonds (Unrefunded) Series 1997 (NATL-RE) (BBB/Baa1) | |
| 355,000 | | | 5.000 | | | 11/15/12 | | | 355,937 | |
| Michigan State Housing Development Authority Rental Housing Revenue Bonds Series B (Go of Authority) (AA/NR) | |
| 690,000 | | | 4.500 | | | 10/01/19 | | | 702,013 | |
| Michigan State Housing Development Authority Single Family Home Ownership Revenue Bonds (Non AMT) Series A (Go of Auth) (AA/NR) | |
| 2,000,000 | | | 4.750 | | | 12/01/25 | | | 1,957,520 | |
| | | | | | | | | | |
| | | | | | | | | 6,032,294 | |
| | |
Minnesota – 1.5% | |
| Minnesota State Housing Finance Agency Revenue Bonds (Residential) Series A (AA+/Aa1) | |
| 605,000 | | | 3.800 | | | 07/01/17 | | | 619,339 | |
| Ortonville MN Independent School District No. 062 GO Bonds (Refunding-School Buildings) Series A (AAA/NR) | |
| 800,000 | | | 5.000 | | | 04/01/15 | | | 899,080 | |
| St. Paul MN Housing & Redevelopment Authority Health Care Revenue Bonds (Allina Health System) Series A-2 (A+/A1) | |
| 1,000,000 | | | 5.000 | | | 11/15/19 | | | 1,075,400 | |
| | | | | | | | | | |
| | | | | | | | | 2,593,819 | |
| | |
Missouri – 0.7% | |
| Kansas City MO Special Obligation Revenue Bonds (Capital Appreciation) Series E (AA-/A1)(a) | |
| 110,000 | | | 0.000 | | | 02/01/14 | | | 101,926 | |
| 125,000 | | | 0.000 | | | 02/01/15 | | | 111,615 | |
| 305,000 | | | 0.000 | | | 02/01/17 | | | 246,964 | |
| Raytown MO Sewer Revenue Bonds (NR/NR) | |
| 275,000 | | | 4.625 | | | 07/01/24 | | | 276,697 | |
| St. Louis County MO Industrial Development Authority Health Facilities Revenue Bonds (Refunding-Ranken Jordan Project) (NR/NR) | |
| 500,000 | | | 5.000 | | | 11/15/17 | | | 484,035 | |
| | | | | | | | | | |
| | | | | | | | | 1,221,237 | |
| | |
Montana – 0.3% | |
| Montana State Board Housing Revenue Bonds (Single Family Mortgage) Series A-2 (AMT) (AA+/Aa1) | |
| 220,000 | | | 4.350 | | | 06/01/16 | | | 221,188 | |
| 230,000 | | | 4.350 | | | 12/01/16 | | | 231,242 | |
| | | | | | | | | | |
| | | | | | | | | 452,430 | |
| | |
Nebraska – 1.1% | |
Douglas County NE Hospital Authority No. 002 Revenue Bonds (Refunding) (Health Facilities-Children’s Hospital)
(NR/A2) | |
| 500,000 | | | 6.000 | | | 08/15/22 | | | 538,050 | |
| | |
| | | | | | | | | | |
Principal
Amount | | Interest
Rate | | | Maturity
Date | | Value | |
| Municipal Bond Obligations – (continued) | |
Nebraska – (continued) | |
| Nebraska Investment Finance Authority Revenue Bonds Series F (GNMA/FNMA/FHLMC) (AAA/NR) | |
| $ 110,000 | | | 4.300 | % | | 09/01/14 | | $ | 112,944 | |
| 145,000 | | | 4.350 | | | 03/01/15 | | | 146,879 | |
| 95,000 | | | 4.350 | | | 09/01/15 | | | 96,417 | |
| 20,000 | | | 4.400 | | | 09/01/16 | | | 20,282 | |
| Nebraska Investment Finance Authority Single Family Housing Revenue Bonds Series A (GNMA/FNMA/FHLMC) (AAA/NR) | |
| 1,000,000 | | | 6.100 | | | 09/01/45 | | | 1,045,450 | |
| | | | | | | | | | |
| | | | | | | | | 1,960,022 | |
| | |
Nevada – 0.6% | |
| Las Vegas NV Convention & Visitors Authority Revenue Bonds (AMBAC) (A+/A1) | |
| 1,020,000 | | | 5.000 | | | 07/01/28 | | | 1,010,657 | |
| Nye County NV School District GO Bonds (Refunding) Series A (PSF-GTD) (NR/Aaa) | |
| 100,000 | | | 4.375 | | | 05/01/25 | | | 98,712 | |
| | | | | | | | | | |
| | | | | | | | | 1,109,369 | |
| | |
New Hampshire – 1.2% | |
| New Hampshire State Housing Finance Authority Revenue Bonds (Non AMT) Series A (NR/Aa3) | |
| 1,375,000 | | | 3.800 | | | 07/01/25 | | | 1,290,713 | |
| New Hampshire State Housing Finance Authority Single Family Mortgage Revenue Bonds (Non AMT) (NR/Aa2) | |
| 690,000 | | | 5.300 | | | 07/01/28 | | | 710,603 | |
| | | | | | | | | | |
| | | | | | | | | 2,001,316 | |
| | |
New Jersey – 1.2% | |
| New Jersey State Higher Education Assistance Authority Student Loan Revenue Bonds (Refunding) Series 1A (AA/Aa2) | |
| 2,000,000 | | | 4.750 | | | 12/01/23 | | | 1,951,840 | |
| Passaic County NJ GO Bonds (Refunding-Taxable Pension) Series 2003 (AGM) (NR/Aa3) | |
| 100,000 | | | 5.750 | | | 02/15/21 | | | 101,554 | |
| | | | | | | | | | |
| | | | | | | | | 2,053,394 | |
| | |
New Mexico – 0.3% | |
| Albuquerque NM Apartment Revenue Bonds (Refunding) (AMT) (AMBAC) (A+/Aa3) | |
| 500,000 | | | 5.375 | | | 07/01/13 | | | 503,030 | |
| | |
New York – 0.3% | |
| Metropolitan Transportation Authority NY Revenue Bonds Series 2008C (A/A2) | |
| 150,000 | | | 5.500 | | | 11/15/18 | | | 166,425 | |
| New York State Dormitory Authority Revenue Bonds (Consolidated City University System) Series A (AA-/Aa3) | |
| 260,000 | | | 5.750 | | | 07/01/13 | | | 272,025 | |
| | | | | | | | | | |
| | | | | | | | | 438,450 | |
| | |
North Dakota – 0.9% | |
| North Dakota State Housing Finance Agency Revenue Bonds (Home Mortgage Finance Program) Series A (NR/Aa1) | |
| 285,000 | | | 4.100 | | | 07/01/19 | | | 288,355 | |
| | |
| | |
| The accompanying notes are an integral part of these financial statements. | | 25 |
COMMERCE NATIONAL TAX-FREE INTERMEDIATE BOND FUND
Schedule of Investments (continued)
April 30, 2011 (Unaudited)
| | | | | | | | | | |
Principal
Amount | | Interest
Rate | | | Maturity
Date | | Value | |
| Municipal Bond Obligations – (continued) | |
North Dakota – (continued) | |
| North Dakota State Housing Finance Agency Revenue Bonds (Housing Finance Project) Series B (AMT) (NR/Aa1) | |
| $ 550,000 | | | 4.400 | % | | 07/01/16 | | $ | 569,646 | |
| 635,000 | | | 4.450 | | | 07/01/17 | | | 647,814 | |
| | | | | | | | | | |
| | | | | | | | | 1,505,815 | |
| | |
Ohio – 2.1% | |
| Akron OH Certificates of Participation (Parking Facilities Project) Series A (AMBAC) (A+/NR) | |
| 1,250,000 | | | 5.000 | | | 12/01/16 | | | 1,356,662 | |
| Ohio State Higher Educational Facility Commission Revenue Bonds (Cleveland Hospital) Clinic Health Series A (AA-/Aa2) | |
| 750,000 | | | 5.250 | | | 01/01/33 | | | 748,020 | |
| Ohio State Higher Educational Facility Commission Revenue Bonds (Xavier University) Series C (A-/A3) | |
| 430,000 | | | 4.250 | | | 05/01/14 | | | 454,876 | |
| 1,000,000 | | | 5.000 | | | 05/01/18 | | | 1,103,400 | |
| | | | | | | | | | |
| | | | | | | | | 3,662,958 | |
| | |
Oklahoma – 3.2% | |
| McClain County OK Economic Development Authority Educational Facilities Lease Revenue Bonds (Blanchard Public Schools Project) (A-/NR) | |
| 1,000,000 | | | 4.000 | | | 09/01/13 | | | 1,035,710 | |
| 1,000,000 | | | 4.850 | | | 09/01/18 | | | 1,061,280 | |
| 1,000,000 | | | 5.000 | | | 09/01/19 | | | 1,067,970 | |
| Oklahoma County OK Finance Authority Educational Facilities Lease Revenue Bonds (Jones Public School Project) (A-/NR) | |
| 2,000,000 | | | 5.000 | | | 09/01/18 | | | 2,161,400 | |
| Tulsa OK Industrial Authority Student Housing Revenue Bonds (University of Tulsa) Series 2006 (NR/A2) | |
| 150,000 | | | 5.250 | | | 10/01/26 | | | 154,326 | |
| | | | | | | | | | |
| | | | | | | | | 5,480,686 | |
| | |
Oregon – 0.2% | |
| Oregon State Housing & Community Services Department Revenue Bonds (Single Family Mortgage) Series E (AMT) (NR/Aa2) | |
| 370,000 | | | 5.050 | | | 07/01/17 | | | 377,826 | |
| | |
Pennsylvania – 5.1% | |
| Delaware County PA Authority University Revenue Bonds (Neumann University) (BBB/NR) | |
| 785,000 | | | 3.000 | | | 10/01/14 | | | 774,465 | |
| 1,025,000 | | | 5.000 | | | 10/01/19 | | | 1,029,141 | |
| 1,250,000 | | | 5.250 | | | 10/01/31 | | | 1,134,975 | |
| Pennsylvania Housing Finance Agency Single Family Mortgage Revenue Bonds (Non AMT) Series 103C (AA+/Aa2) | |
| 1,050,000 | | | 5.000 | | | 10/01/23 | | | 1,085,396 | |
| Pennsylvania Housing Finance Agency Single Family Mortgage Revenue Bonds Series 110B (AA+/Aa2) | |
| 2,000,000 | | | 4.125 | | | 10/01/25 | | | 1,913,260 | |
| Pennsylvania State Higher Education Facilities Authority Revenue Bonds (University of Scranton) Series 2008 (A/NR) | |
| 1,140,000 | | | 4.500 | | | 05/01/14 | | | 1,212,447 | |
| | |
| | | | | | | | | | |
Principal
Amount | | Interest
Rate | | | Maturity
Date | | Value | |
| Municipal Bond Obligations – (continued) | |
Pennsylvania – (continued) | |
| Philadelphia PA Authority for Industrial Development Revenue Bonds (Mathematics Science & Technology Charter School) (BBB+/NR) | |
| $ 460,000 | | | 5.000 | % | | 08/01/20 | | $ | 449,323 | |
| St. Mary’s PA Area Water Authority Revenue Bonds (BBB+/NR) | |
| 1,350,000 | | | 4.750 | | | 02/01/25 | | | 1,335,150 | |
| | | | | | | | | | |
| | | | | | | | | 8,934,157 | |
| | |
Puerto Rico – 0.0% | |
| Puerto Rico Electric Power Authority Revenue Bonds (Refunding) (NATL-RE) (BBB+/A3) | |
| 10,000 | | | 5.000 | | | 07/01/20 | | | 10,409 | |
| | |
Rhode Island – 0.9% | |
| Rhode Island Housing & Mortgage Finance Corp. Revenue Bonds (Multi Family Development) Series 1 (NR/Aa2) | |
| 460,000 | | | 5.125 | | | 10/01/30 | | | 452,479 | |
| Rhode Island Housing & Mortgage Finance Corp. Revenue Bonds (Multi Family Funding) Series A (NR/Aaa) | |
| 500,000 | | | 5.250 | | | 04/01/35 | | | 493,940 | |
| Rhode Island State Student Loan Authority Revenue Bonds Series 3 (AMBAC) (AMT) (NR/A3) | |
| 180,000 | | | 5.700 | | | 12/01/12 | | | 180,173 | |
| 205,000 | | | 5.800 | | | 12/01/14 | | | 205,119 | |
| 125,000 | | | 5.900 | | | 12/01/15 | | | 125,077 | |
| Rhode Island State Student Loan Authority Revenue Bonds Series 3 (AMBAC) (AMT) (NR/NR) | |
| 190,000 | | | 5.750 | | | 12/01/13 | | | 190,148 | |
| | | | | | | | | | |
| | | | | | | | | 1,646,936 | |
| | |
South Carolina – 3.9% | |
| Berkeley County SC School District Installment Lease Revenue Bonds (Securing Assets for Education) (A/A1) | |
| 2,500,000 | | | 5.250 | | | 12/01/24 | | | 2,554,775 | |
| Fort Mill SC School Facilities Corp. Revenue Bonds (Installment Purchase Revenue) Series 2006 (NR/Aa3) | |
| 550,000 | | | 5.250 | | | 12/01/22 | | | 575,635 | |
| Greenville County SC Public Facilities Corp. Certificates of Participation (Refunding-University Center Project) (AMBAC) (AA+/Aa1) | |
| 700,000 | | | 5.000 | | | 04/01/16 | | | 781,074 | |
| Kershaw County SC Public School Foundation Installment Power Revenue Bonds (School District Project) (CIFG) (BBB+/NR) | |
| 1,000,000 | | | 5.000 | | | 12/01/22 | | | 995,620 | |
| 1,500,000 | | | 5.000 | | | 12/01/28 | | | 1,440,600 | |
| Scago Educational Facilities Corp. for Beaufort School District SC Installment Revenue Bonds (AGM) (AA+/Aa2) | |
| 175,000 | | | 5.500 | | | 12/01/15 | | | 200,659 | |
| Scago Educational Facilities Corp. for Sumter County School District 17 SC Revenue Bonds (AGM) (AA+/Aa3) | |
| 255,000 | | | 5.500 | | | 12/01/15 | | | 290,238 | |
| | | | | | | | | | |
| | | | | | | | | 6,838,601 | |
| | |
| | |
| 26 | | The accompanying notes are an integral part of these financial statements. |
COMMERCE NATIONAL TAX-FREE INTERMEDIATE BOND FUND
| | | | | | | | | | |
Principal
Amount | | Interest
Rate | | | Maturity
Date | | Value | |
| Municipal Bond Obligations – (continued) | |
South Dakota – 0.1% | |
| South Dakota Housing Development Authority Revenue Bonds (Homeowner Mortgage) Series E-1 (AMT) (NR/NR) | |
| $ 185,000 | | | 5.150 | % | | 05/01/11 | | $ | 185,000 | |
| | |
Tennessee – 0.1% | |
| Tennessee Housing Development Agency Revenue Bonds (Homeownership Program) (AMT) (AA+/Aa1) | |
| 220,000 | | | 4.250 | | | 01/01/14 | | | 224,818 | |
| | |
Texas – 4.5% | |
| Canyon TX Regional Water Authority Contract Revenue Bonds (Refunding-Mid Cities Project) (AMBAC) (A/NR) | |
| 500,000 | | | 5.000 | | | 08/01/22 | | | 522,680 | |
| Cash Special Utility District TX Revenue Bonds (Refunding & Improvement) (NATL-RE) (A/Baa1) | |
| 500,000 | | | 5.250 | | | 09/01/22 | | | 525,130 | |
| Corpus Christi TX Utility System Revenue Bonds (Refunding) (AGM) (AA+/Aa3) | |
| 375,000 | | | 5.000 | | | 07/15/12 | | | 393,862 | |
| Dallas Fort Worth TX International Airport Revenue Bonds (Refunding & Improvement) Series A (FGIC) (A+/A1) | |
| 130,000 | | | 5.750 | | | 11/01/15 | | | 132,774 | |
| Houston County TX GO Bonds (Certificates of Obligation) (A/NR) | |
| 235,000 | | | 5.000 | | | 02/15/20 | | | 255,067 | |
| 590,000 | | | 5.000 | | | 02/15/24 | | | 620,049 | |
| Lower Colorado River Authority TX Revenue Bonds (Refunding) (A/A1) | |
| 800,000 | | | 5.625 | | | 05/15/39 | | | 823,664 | |
| North Texas Tollway Authority Revenue Bonds (Refunding-System First Tier) (A-/A2) | |
| 3,000,000 | | | 6.000 | | | 01/01/34 | | | 3,068,100 | |
| San Jacinto TX River Authority Special Project Revenue Bonds (The Woodlands Water Supply Systems) Series 2007 (AMBAC) (A+/NR) | |
| 330,000 | | | 5.250 | | | 10/01/21 | | | 343,665 | |
| Texas State Department of Housing & Community Affairs Single Family Mortgage Revenue Bonds (Refunding) Series G (AMT) (FHA/VA Mortgages) (AAA/Aa1) | |
| 85,000 | | | 4.600 | | | 09/01/19 | | | 85,434 | |
| Texas Woman’s University Financing Systems Revenue Bonds Series 2008 (A/Aa3) | |
| 675,000 | | | 5.500 | | | 07/01/24 | | | 743,627 | |
| Weslaco TX Independent School District GO Bonds (Maintenance Tax Notes) Series A (NR/A1) | |
| 300,000 | | | 4.500 | | | 02/15/16 | | | 326,586 | |
| | | | | | | | | | |
| | | | | | | | | 7,840,638 | |
| | |
Utah – 1.6% | |
| Tooele County UT Hazardous Waste Treatment Revenue Bonds (Union Pacific Project) Series A (BBB+/Baa2) | |
| 2,000,000 | | | 5.700 | | | 11/01/26 | | | 2,001,480 | |
| | |
| | | | | | | | | | |
Principal
Amount | | Interest
Rate | | | Maturity
Date | | Value | |
| Municipal Bond Obligations – (continued) | |
Utah – (continued) | |
| Utah Housing Corporation Single Family Mortgage Revenue Bonds (Refunding) Series A (AAA/Aaa) | |
| $ 380,000 | | | 3.600 | % | | 07/01/15 | | $ | 380,536 | |
| 350,000 | | | 3.850 | | | 07/01/16 | | | 351,088 | |
| | | | | | | | | | |
| | | | | | | | | 2,733,104 | |
| | |
Vermont – 0.8% | |
| Vermont Economic Development Authority Revenue Bonds (Central Vermont Public Service Corp.-Recovery Zone Facility) (NR/Baa1) | |
| 1,375,000 | | | 5.000 | | | 12/15/20 | | | 1,351,268 | |
| | |
Virginia – 0.6% | |
| Richmond VA Metropolitan Authority Expressway Revenue Bonds (Refunding) (FGIC) (BBB/NR) | |
| 1,000,000 | | | 5.250 | | | 07/15/17 | | | 1,104,150 | |
| | |
Washington – 4.4% | |
| Everett WA Public Facilities District Sales Tax & Interlocal Revenue Bonds Series A (A-/NR) | |
| 1,000,000 | | | 5.000 | | | 12/01/24 | | | 1,005,520 | |
| FYI Properties WA Lease Revenue Bonds (Washington State District Project) (AA/NR) | |
| 1,000,000 | | | 5.000 | | | 06/01/27 | | | 1,021,280 | |
| Puyallup WA Combined Utility Revenue Bonds Series A (AA/NR) | |
| 160,000 | | | 4.000 | | | 11/01/15 | | | 172,395 | |
| Vancouver WA GO Bonds (Refunding-Limited Tax) (AA/Aa3) | |
| 1,160,000 | | | 5.125 | | | 12/01/35 | | | 1,225,099 | |
| Washington State Health Care Facilities Authority Revenue Bonds (Catholic Health Initiatives) Series D (AA/Aa2) | |
| 500,000 | | | 6.000 | | | 10/01/23 | | | 547,440 | |
| Washington State Health Care Facilities Authority Revenue Bonds (Overlake Hospital Medical Center) (A-/A3) | |
| 2,000,000 | | | 4.375 | | | 07/01/18 | | | 2,017,660 | |
| 1,750,000 | | | 5.250 | | | 07/01/25 | | | 1,702,190 | |
| | | | | | | | | | |
| | | | | | | | | 7,691,584 | |
| | |
West Virginia – 0.6% | |
| West Virginia State Hospital Finance Authority Revenue Bonds (Refunding & Improvement-Charleston) Series A (NR/A3) | |
| 1,000,000 | | | 5.500 | | | 09/01/28 | | | 971,650 | |
| | |
Wisconsin – 1.8% | |
| Central Brown County WI Water Authority System Revenue Bonds (AMBAC) (A+/NR) | |
| 1,500,000 | | | 5.000 | | | 12/01/35 | | | 1,426,650 | |
| Milwaukee County WI Airport Revenue Bonds (Refunding) Series B (NATL-RE) (NR/A1) | |
| 115,000 | | | 5.000 | | | 12/01/14 | | | 123,628 | |
| 350,000 | | | 5.000 | | | 12/01/15 | | | 378,466 | |
| Plymouth WI Combined Utility Revenue Bonds (XLCA) (NR/A2) | |
| 100,000 | | | 4.375 | | | 05/01/12 | | | 103,181 | |
| | |
| | |
| The accompanying notes are an integral part of these financial statements. | | 27 |
COMMERCE NATIONAL TAX-FREE INTERMEDIATE BOND FUND
Schedule of Investments (continued)
April 30, 2011 (Unaudited)
| | | | | | | | | | | | |
Principal
Amount | | Interest
Rate | | | Maturity
Date | | | Value | |
| Municipal Bond Obligations – (continued) | |
Wisconsin – (continued) | |
| Wisconsin State Health & Educational Facilities Authority Revenue Bonds (Children’s Hospital of Wisconsin) (AA-/Aa3) | |
| $1,000,000 | | | 5.000 | % | | | 08/15/21 | | | $ | 1,060,620 | |
| | | | | | | | | | | | |
| | | | | | | | | | | 3,092,545 | |
| | |
Wyoming – 0.5% | | | | | |
| Wyoming Community Development Authority Housing Revenue Bonds Series 8 (AMT) (AA+/Aa1) | |
| 165,000 | | | 4.250 | | | | 06/01/14 | | | | 169,642 | |
| 280,000 | | | 4.250 | | | | 12/01/14 | | | | 289,086 | |
| 385,000 | | | 4.300 | | | | 12/01/15 | | | | 390,097 | |
| | | | | | | | | | | | |
| | | | | | | | | | | 848,825 | |
| | |
| TOTAL MUNICIPAL BOND OBLIGATIONS | |
(Cost $170,224,744) | | | $ | 171,655,793 | |
| | |
| | | | | | | | | | | | |
| Short-term Investment(b) – 1.1% | |
Repurchase Agreement – 1.1% | |
| State Street Bank & Trust Co. | |
| $1,939,000 | | | 0.010 | % | | | 05/02/11 | | | $ | 1,939,000 | |
Maturity Value: $1,939,002 | | | | | |
(Cost $1,939,000) | | | | | | | | | |
| | |
| TOTAL INVESTMENTS – 99.9% | | | | | |
(Cost $172,163,744) | | | $ | 173,594,793 | |
| | |
OTHER ASSETS IN EXCESS OF LIABILITIES – 0.1% | | | | 249,182 | |
| | |
| NET ASSETS – 100.0% | | | $ | 173,843,975 | |
| | |
| | |
| The percentage shown for each investment category reflects the value of investments in that category as a percentage of net assets. |
| (a) | | Issued with a zero coupon. Income is recognized through the accretion of discount. |
| (b) | | Repurchase agreement was entered into on April 29, 2011. This agreement was fully collateralized by $1,955,000 U.S. Treasury Note, 1.000%, due 04/30/12 with a market value of $1,979,078. |
| Security ratings disclosed, if any, are issued by Standard & Poor’s Ratings Services/Moody’s Investors Service and are unaudited. A description of the ratings is available in the Fund’s Statement of Additional Information. |
| |
| | |
| |
| Investment Abbreviations: |
| AGM | | —Insured by Assured Guaranty Municipal Corp. |
| AMBAC | | —Insured by American Municipal Bond Assurance Corp. |
| AMT | | —Alternative Minimum Tax |
| CIFG | | —Insured by CIFG Assurance North America, Inc. |
| ETM | | —Escrow to Maturity |
| FGIC | | —Insured by Financial Guaranty Insurance Co. |
| FHA | | —Insured by Federal Housing Administration |
| FHLMC | | —Federal Home Loan Mortgage Corp. |
| FNMA | | —Federal National Mortgage Association |
| GNMA | | —Government National Mortgage Association |
| GO | | —General Obligation |
| NATL-RE | | —Insured by National Reinsurance Corp. |
| NR | | —Not Rated |
| PSF-GTD | | —Guaranteed by Permanent School Fund |
| VA | | —Veterans Administration |
| XLCA | | —Insured by XL Capital Assurance, Inc. |
| |
PORTFOLIO COMPOSITION
| | | | | | | | |
| Sector Allocation | | AS OF
4/30/11 | | | AS OF
10/31/10 | |
| | |
Education | | | 15.5 | % | | | 14.4 | % |
Lease | | | 15.0 | | | | 19.1 | |
Hospital | | | 14.9 | | | | 17.2 | |
General Obligations | | | 14.7 | | | | 12.4 | |
Single Family Housing | | | 9.5 | | | | 10.6 | |
Transportation | | | 8.8 | | | | 6.8 | |
General | | | 8.7 | | | | 9.0 | |
Water/Sewer | | | 2.9 | | | | 4.6 | |
Student | | | 2.7 | | | | 3.2 | |
Power | | | 2.2 | | | | 1.9 | |
Multi Family Housing | | | 2.0 | | | | 0.0 | |
Industrial Development Revenue | | | 1.1 | | | | 0.0 | |
Crossover | | | 0.6 | | | | 0.0 | |
Prerefunded/Escrow to Maturity | | | 0.2 | | | | 0.1 | |
Short-term Investment | | | 1.1 | | | | 0.5 | |
| | |
| TOTAL INVESTMENTS | | | 99.9 | % | | | 99.8 | % |
| | |
The percentage shown for each investment category reflects the value of investments in that category as a percentage of net assets.
The Fund is actively managed and, as such its composition may differ over time.
| | |
| 28 | | The accompanying notes are an integral part of these financial statements. |
COMMERCE MISSOURI TAX-FREE INTERMEDIATE BOND FUND
Schedule of Investments
April 30, 2011 (Unaudited)
| | | | | | | | | | |
Principal
Amount | | Interest
Rate | | | Maturity
Date | | Value | |
| Municipal Bond Obligations – 97.4% | |
Arizona – 2.5% | |
| Arizona Healthcare & Education Facilities Authority Revenue Bonds (Kirksville College) (A-/NR) | |
| $1,000,000 | | | 5.000 | % | | 01/01/25 | | $ | 999,930 | |
| Arizona School Facilities Board Certificates of Participation (A+/A1) | |
| 3,000,000 | | | 5.250 | | | 09/01/23 | | | 3,104,820 | |
| Pinal City Arizona Unified School District No. 1 Florence School Improvement Project of 2006 GO Bonds Series C (A/NR) | |
| 1,155,000 | | | 5.125 | | | 07/01/23 | | | 1,215,291 | |
| 1,215,000 | | | 5.150 | | | 07/01/24 | | | 1,270,368 | |
| | | | | | | | | | |
| | | | | | | | | 6,590,409 | |
| | |
California – 1.0% | |
| Burbank CA Unified School District GO Bonds Capital Appreciation Election of 1997 Series C (NATL-RE) (FGIC) (AA-/WR)(a) | |
| 2,000,000 | | | 0.000 | | | 07/01/27 | | | 692,060 | |
| Sacramento County CA Airport System Revenue Bonds (A/A2) | |
| 2,000,000 | | | 5.000 | | | 07/01/27 | | | 2,017,420 | |
| | | | | | | | | | |
| | | | | | | | | 2,709,480 | |
| | |
Colorado – 0.3% | |
| Colorado Housing & Finance Authority Revenue Bonds (Single Family Mortgage) Series A (FHA) (AAA/Aaa) | |
| 650,000 | | | 4.350 | | | 11/01/19 | | | 661,421 | |
| | |
Florida – 1.2% | |
| Gulf Breeze FL Revenue Bonds (Local Government Loan) Series J (A+/Aa3) | |
| 1,000,000 | | | 4.500 | | | 12/01/20 | | | 1,067,310 | |
| Tampa FL Revenue Bonds (Health System-Catholic East) (A/A1) | |
| 1,875,000 | | | 5.000 | | | 11/15/16 | | | 2,033,925 | |
| | | | | | | | | | |
| | | | | | | | | 3,101,235 | |
| | |
Georgia – 0.4% | |
| Georgia Housing & Finance Authority Revenue Bonds (Single Family Mortgage) (Non AMT) Series A (AAA/NR) | |
| 1,000,000 | | | 4.500 | | | 12/01/25 | | | 1,006,160 | |
| | |
Idaho – 0.4% | |
| Idaho Housing & Finance Association Revenue Bonds (Single Family Mortgage) Series B Class I (NR/Aaa) | |
| 895,000 | | | 5.250 | | | 07/01/29 | | | 909,776 | |
| | |
Illinois – 1.7% | |
| Grundy Kendall & Will Counties IL Community School District No. 201 GO Bonds (Refunding) Series A (AA/NR) | |
| 1,500,000 | | | 5.250 | | | 10/15/27 | | | 1,564,365 | |
| Illinois Finance Authority Revenue Bonds (Poetry Foundation Project) (A+/A1) | |
| 1,000,000 | | | 5.300 | | | 01/01/40 | | | 935,750 | |
| Illinois Finance Authority Revenue Bonds (Refunding-Resurrection Health) (BBB+/Baa1) | |
| 1,000,000 | | | 5.250 | | | 05/15/15 | | | 1,038,920 | |
| | |
| | | | | | | | | | |
Principal
Amount | | Interest
Rate | | | Maturity
Date | | Value | |
| Municipal Bond Obligations – (continued) | |
Illinois – (continued) | |
| Illinois Finance Authority Revenue Bonds (Refunding-Swedish Covenant) Series A (BBB+/NR) | |
| $1,000,000 | | | 5.500 | % | | 08/15/24 | | $ | 972,390 | |
| | | | | | | | | | |
| | | | | | | | | 4,511,425 | |
| | |
Indiana – 1.5% | |
| Evansville IN Redevelopment Authority Revenue Bonds (Build America Bonds-Taxable) Series B (A/Aa3) | |
| 2,000,000 | | | 6.860 | | | 02/01/29 | | | 2,064,580 | |
| Indiana Bond Bank Revenue Bonds (Special Program-Hendricks Regional Health) Series A (AA/NR) | |
| 500,000 | | | 5.500 | | | 02/01/29 | | | 523,685 | |
| Indiana State Finance Authority Revenue Bonds (Educational Facilities for Indiana Historical Society, Inc.) (NR/A3) | |
| 1,435,000 | | | 5.000 | | | 07/01/35 | | | 1,276,145 | |
| | | | | | | | | | |
| | | | | | | | | 3,864,410 | |
| | |
Iowa – 0.8% | |
| Iowa Finance Authority Revenue Bonds (Single Family Mortgage) Series E (GNMA/FNMA) (Go of Authority) (AAA/Aaa) | |
| 710,000 | | | 5.000 | | | 07/01/23 | | | 721,388 | |
| Waterloo Community School District Infrastructure Sales & Services Tax Revenue Bonds (Refunding) Series 2011 A (A/NR) | |
| 1,245,000 | | | 5.250 | | | 01/01/30 | | | 1,266,788 | |
| | | | | | | | | | |
| | | | | | | | | 1,988,176 | |
| | |
Kentucky – 0.2% | |
| Kentucky Housing Corp. Revenue Bonds Series A (FHA) (AAA/Aaa) | |
| 445,000 | | | 5.750 | | | 07/01/39 | | | 454,096 | |
| | |
Louisiana – 3.3% | |
| Louisiana Local Government Environmental Facilities & Community Development Authority Revenue Bonds (Refunding-Independence Stadium Project) (A/NR) | |
| 1,525,000 | | | 5.000 | | | 03/01/21 | | | 1,597,575 | |
| Louisiana Local Government Environmental Facilities & Community Development Authority Revenue Bonds (Woman’s Hospital Foundation) Series A (BBB+/A3) | |
| 7,000,000 | | | 5.500 | | | 10/01/25 | | | 6,849,850 | |
| | | | | | | | | | |
| | | | | | | | | 8,447,425 | |
| | |
Michigan – 0.4% | |
| River Rouge MI School District GO Bonds (Refunding) (NATL-RE) (FGIC) (AA-/Aa2) | |
| 1,000,000 | | | 5.000 | | | 05/01/19 | | | 1,031,330 | |
| | |
Missouri – 79.4% | |
| Arnold MO Certificates of Participation (A+/NR) | |
| 200,000 | | | 3.000 | | | 11/01/17 | | | 198,716 | |
| 230,000 | | | 3.000 | | | 11/01/18 | | | 222,111 | |
| 210,000 | | | 3.000 | | | 11/01/19 | | | 199,939 | |
| 225,000 | | | 3.625 | | | 11/01/22 | | | 217,487 | |
| | |
| | |
| The accompanying notes are an integral part of these financial statements. | | 29 |
COMMERCE MISSOURI TAX-FREE INTERMEDIATE BOND FUND
Schedule of Investments (continued)
April 30, 2011 (Unaudited)
| | | | | | | | | | |
Principal
Amount | | Interest
Rate | | | Maturity
Date | | Value | |
| Municipal Bond Obligations – (continued) | |
Missouri – (continued) | |
| Arnold MO Certificates of Participation (A+/NR) (continued) | |
| $ 470,000 | | | 3.700 | % | | 11/01/23 | | $ | 449,546 | |
| 225,000 | | | 3.800 | | | 11/01/24 | | | 214,461 | |
| 480,000 | | | 3.875 | | | 11/01/25 | | | 446,429 | |
| 250,000 | | | 4.000 | | | 11/01/26 | | | 232,743 | |
| Belton MO Certificates of Participation (A/NR) | |
| 500,000 | | | 5.125 | | | 03/01/25 | | | 507,875 | |
| 500,000 | | | 5.250 | | | 03/01/29 | | | 501,670 | |
| Belton MO School District No. 124 Direct Deposit Program GO Bonds (Refunding) Series A (AA+/Aa1) | |
| 150,000 | | | 4.000 | | | 03/01/17 | | | 157,817 | |
| Belton MO School District No. 124 Direct Deposit Program GO Bonds (Refunding) Series B (AA+/Aa1) | |
| 150,000 | | | 4.000 | | | 03/01/21 | | | 157,770 | |
| Bi-State Development Agency MO Metro District Revenue Bonds (Refunding-St. Clair County Metrolink Project) (AGM) (AA+/Aa3) | |
| 2,000,000 | | | 5.250 | | | 07/01/20 | | | 2,212,640 | |
| Boone County MO Hospital Revenue Bonds (NR/A3) | |
| 2,350,000 | | | 5.750 | | | 08/01/28 | | | 2,380,268 | |
| Branson MO Reorganized School District No. R-4 GO Bonds (AGM) (AA+/Aa3) | |
| 1,000,000 | | | 5.000 | | | 03/01/18 | | | 1,076,980 | |
| 1,250,000 | | | 5.000 | | | 03/01/19 | | | 1,338,250 | |
| Branson MO Reorganized School District No. R-4 GO Bonds School District Direct Deposit Program (AMBAC) (A+/NR) | |
| 300,000 | | | 5.500 | | | 03/01/14 | | | 333,417 | |
| Bridgeton MO Certificates of Participation (NR/Aa3) | |
| 250,000 | | | 1.700 | | | 08/01/11 | | | 250,480 | |
| Camdenton MO Reorganized School District No. RIII GO Bonds (Refunding & Improvement) (AGM) (AA+/Aa3) | |
| 500,000 | | | 5.250 | | | 03/01/17 | | | 578,490 | |
| 1,000,000 | | | 5.250 | | | 03/01/21 | | | 1,077,690 | |
| Campbell MO Reorganized School District No. 2 Direct Deposit Program GO Bonds (Refunding) (AA+/NR) | |
| 215,000 | | | 1.600 | | | 03/01/13 | | | 216,215 | |
| 215,000 | | | 1.900 | | | 03/01/14 | | | 216,071 | |
| 220,000 | | | 2.250 | | | 03/01/15 | | | 220,895 | |
| Cape Girardeau County MO Industrial Development Authority Health Care Facilities Revenue Bonds (St. Francis Medical Center) Series A (A+/NR) | |
| 930,000 | | | 5.250 | | | 06/01/11 | | | 932,939 | |
| 400,000 | | | 5.250 | | | 06/01/12 | | | 415,364 | |
| 1,000,000 | | | 5.250 | | | 06/01/13 | | | 1,061,310 | |
| 1,550,000 | | | 5.500 | | | 06/01/16 | | | 1,620,029 | |
Cass County MO Reorganized School District No. R-2 Raymore-Peculiar Direct Deposit Program GO Bonds
(AA+/NR) | |
| 1,000,000 | | | 5.000 | | | 03/01/18 | | | 1,118,730 | |
| Clay County MO Public School District No. 53 Liberty Direct Deposit Program GO Bonds (Refunding) Series A (AGM) (AA+/Aa3) | |
| 1,000,000 | | | 5.000 | | | 03/01/18 | | | 1,032,850 | |
| | |
| | | | | | | | | | |
Principal
Amount | | Interest
Rate | | | Maturity
Date | | Value | |
| Municipal Bond Obligations – (continued) | |
Missouri – (continued) | |
| Clay County MO Public School District No. 53 Liberty Direct Deposit Program GO Bonds Series B (AGM) (AA+/Aa3) | |
| $1,000,000 | | | 5.000 | % | | 03/01/18 | | $ | 1,033,020 | |
| Clay County MO Public School District No. 53 Liberty School Building Direct Deposit Program GO Bonds (AA+/NR) | |
| 1,280,000 | | | 5.000 | | | 03/01/25 | | | 1,370,714 | |
| 2,435,000 | | | 5.000 | | | 03/01/28 | | | 2,553,828 | |
| Clay County MO Reorganized School District No. R-1 Kearney School Building Direct Deposit Program GO Bonds Series B (AA+/Aa1) | |
| 695,000 | | | 5.000 | | | 03/01/21 | | | 748,237 | |
| 650,000 | | | 5.000 | | | 03/01/22 | | | 696,618 | |
| Clayton MO Special Obligation Revenue Bonds (Build America Bonds) Series B (AA+/NR) | |
| 810,000 | | | 5.200 | | | 12/01/23 | | | 845,842 | |
| Clinton MO Certificates of Participation (Refunding & Improvement) (NR/NR) | |
| 400,000 | | | 5.000 | | | 12/01/12 | | | 418,892 | |
| Cole County MO Certificates of Participation (Jail Project) (NR/Aa3) | |
| 660,000 | | | 4.300 | | | 12/01/19 | | | 675,675 | |
| 1,000,000 | | | 4.500 | | | 12/01/20 | | | 1,027,420 | |
| Des Peres MO Certificates of Participation (Refunding) (AA+/NR) | |
| 390,000 | | | 3.000 | | | 08/01/14 | | | 402,921 | |
| Fenton MO Certificates of Participation (Refunding) (AA-/NR) | |
| 565,000 | | | 2.000 | | | 01/01/13 | | | 572,023 | |
| Florissant MO Certificates of Participation (FGIC) (NR/A1) | |
| 330,000 | | | 5.000 | | | 08/01/11 | | | 333,498 | |
| 560,000 | | | 5.000 | | | 08/01/12 | | | 589,926 | |
| 485,000 | | | 5.000 | | | 08/01/15 | | | 500,079 | |
| 500,000 | | | 5.000 | | | 08/01/16 | | | 513,930 | |
| 450,000 | | | 5.000 | | | 08/01/17 | | | 460,926 | |
| Fort Zumwalt MO School District Direct Deposit Program GO Bonds Series A (AA+/Aa1) | |
| 1,080,000 | | | 5.000 | | | 03/01/19 | | | 1,201,446 | |
| Fort Zumwalt MO School District GO Bonds Direct Deposit Program (Refunding) Series A (AA+/Aa1) | |
| 700,000 | | | 5.000 | | | 03/01/17 | | | 778,582 | |
| 935,000 | | | 5.000 | | | 03/01/18 | | | 1,034,129 | |
| 945,000 | | | 5.000 | | | 03/01/19 | | | 1,032,441 | |
| Franklin County MO Public Water Supply District No. 3 Certificates of Participation (NR/NR) | |
| 610,000 | | | 5.875 | | | 12/01/30 | | | 572,564 | |
| 1,455,000 | | | 6.250 | | | 12/01/35 | | | 1,342,107 | |
| Franklin County MO Public Water Supply District No. 3 Certificates of Participation (Refunding) Series C (FGIC) (NR/NR) | |
| 395,000 | | | 5.000 | | | 12/01/15 | | | 409,342 | |
| Gladstone MO Certificates of Participation Series A (XLCA) (NR/A1) | |
| 475,000 | | | 5.000 | | | 06/01/23 | | | 493,729 | |
| | |
| | |
| 30 | | The accompanying notes are an integral part of these financial statements. |
COMMERCE MISSOURI TAX-FREE INTERMEDIATE BOND FUND
| | | | | | | | | | |
Principal
Amount | | Interest
Rate | | | Maturity
Date | | Value | |
| Municipal Bond Obligations – (continued) | |
Missouri – (continued) | |
| Greene County MO Certificates of Participation (Refunding-Law Enforcement) (NR/Aa2) | |
| $ 100,000 | | | 2.000 | % | | 07/01/11 | | $ | 100,171 | |
| 425,000 | | | 2.500 | | | 07/01/15 | | | 430,542 | |
| Greene County MO Special Obligation Revenue Bonds (Refunding) (NR/Aa2) | |
| 450,000 | | | 2.000 | | | 03/01/13 | | | 456,151 | |
| 280,000 | | | 2.500 | | | 03/01/15 | | | 283,368 | |
| Greenwood MO GO Build America Bonds Taxable Series B (A-/NR) | |
| 500,000 | | | 5.625 | | | 03/01/25 | | | 491,710 | |
| Hannibal MO Industrial Development Authority Health Facilities Revenue Bonds (Refunding-Hannibal Regional Hospital) (BBB+/NR) | |
| 650,000 | | | 3.500 | | | 09/01/12 | | | 655,694 | |
| Harrisonville MO Annual Appropriation Supported Tax Revenue Bonds (Refunding-Harrisonville Towne Center Project) (A+/NR) | |
| 1,610,000 | | | 4.625 | | | 11/01/28 | | | 1,487,415 | |
| Hickman Mills MO School District No. C-1 Direct Deposit Program GO Bonds (AGM) (AA+/Aa3) | |
| 2,300,000 | | | 5.000 | | | 03/01/19 | | | 2,381,834 | |
| Higginsville MO Sewage Systems Revenue Bonds (Build America Bonds-Taxable Direct Payment to Issuer) (A-/NR) | |
| 500,000 | | | 5.924 | | | 10/01/30 | | | 479,620 | |
| I-470 & 350 Transportation Development District MO Sales Tax Revenue Bonds (Refunding & Improvement) (Radian) (NR/NR) | |
| 420,000 | | | 4.600 | | | 06/01/29 | | | 389,840 | |
| Independence MO School District (Direct Deposit Program) Series A (AA+/NR) | |
| 2,000,000 | | | 5.250 | | | 03/01/30 | | | 2,160,820 | |
| 1,700,000 | | | 5.250 | | | 03/01/31 | | | 1,826,786 | |
| Jackson County MO Consolidated School District Direct Deposit Program GO Bonds (AA+/NR) | |
| 2,365,000 | | | 5.000 | | | 03/01/25 | | | 2,537,030 | |
| Jackson County MO Consolidated School District No. 2 Direct Deposit Program GO Bonds (NATL-RE) (AA+/Baa1) | |
| 1,250,000 | | | 5.000 | | | 03/01/22 | | | 1,342,287 | |
| Jackson County MO Public Building Corp. Leasehold Revenue Bonds (Capital Improvements Project) Series B (NR/Aa3) | |
| 530,000 | | | 4.500 | | | 12/01/19 | | | 551,984 | |
| 555,000 | | | 4.500 | | | 12/01/20 | | | 572,088 | |
| Jackson County MO Public Building Corp. Leasehold Revenue Bonds Series A (NATL-RE) (NR/Aa3) | |
| 500,000 | | | 5.000 | | | 12/01/20 | | | 527,820 | |
| Jackson County MO Reorganized School District No. 4 Blue Springs GO Bonds (Refunding & Improvement) Series A (AA/NR) | |
| 2,000,000 | | | 5.000 | | | 03/01/29 | | | 2,082,620 | |
| Jackson County MO School District No. C-1 Hickman School Building Direct Deposit Program GO Bonds (AA+/NR) | |
| 500,000 | | | 5.000 | | | 03/01/24 | | | 541,370 | |
| | |
| | | | | | | | | | |
Principal
Amount | | Interest
Rate | | | Maturity
Date | | Value | |
| Municipal Bond Obligations – (continued) | |
Missouri – (continued) | |
| Jackson County MO Special Obligation Revenue Bonds (Harry S. Truman Sports Complex) (AMBAC) (A+/Aa3) | |
| $1,360,000 | | | 5.000 | % | | 12/01/22 | | $ | 1,436,364 | |
| Jackson County MO Special Obligation Revenue Bonds Series A (NATL-RE) (NR/Aa3) | |
| 1,735,000 | | | 5.500 | | | 12/01/12 | | | 1,806,187 | |
| Jefferson County MO Consolidated Public Water Supply District No. C-1 Revenue Bonds (AMBAC) (NR/NR) | |
| 1,000,000 | | | 5.250 | | | 12/01/15 | | | 1,048,850 | |
Jefferson County MO Consolidated Public Water Supply District No. C-1 Waterworks Revenue Bonds (Refunding)
(AA-/NR) | |
| 290,000 | | | 4.000 | | | 12/01/20 | | | 301,208 | |
| 435,000 | | | 4.000 | | | 12/01/21 | | | 448,698 | |
| 425,000 | | | 4.000 | | | 12/01/22 | | | 436,118 | |
| Jefferson County MO Library District Lease Certificates of Participation (Refunding) Series A (A+/NR) | |
| 455,000 | | | 5.000 | | | 03/01/29 | | | 460,014 | |
| Jefferson County MO Library District Lease Certificates of Participation (Refunding) Series B (A+/NR) | |
| 1,270,000 | | | 5.000 | | | 03/01/29 | | | 1,270,787 | |
| Joplin MO Industrial Development Authority Health Facilities Revenue Bonds (Freeman Health System Project) (BBB+/NR) | |
| 820,000 | | | 5.500 | | | 02/15/12 | | | 831,013 | |
| 555,000 | | | 5.500 | | | 02/15/14 | | | 572,827 | |
| 2,570,000 | | | 5.500 | | | 02/15/29 | | | 2,393,261 | |
| 1,500,000 | | | 5.750 | | | 02/15/35 | | | 1,384,980 | |
| Kansas City MO Land Clearance Revenue Bonds (Refunding & Improvement) Series E (XCLA) (AA-/A1) | |
| 1,000,000 | | | 5.000 | | | 12/01/15 | | | 1,112,460 | |
| Kansas City MO Metropolitan Community Leasehold Jr. College Revenue Bonds (Refunding & Improvement) (FGIC) (NR/Aa2) | |
| 1,075,000 | | | 5.000 | | | 07/01/17 | | | 1,181,855 | |
| Kansas City MO Special Obligation Revenue Bonds (Arena Project) (Refunding & Improvement) Series C (AA-/A1) | |
| 1,575,000 | | | 5.500 | | | 04/01/23 | | | 1,761,637 | |
| Kansas City MO Special Obligation Revenue Bonds (Arena Project) (Refunding & Improvement) Series D (AA-/A1) | |
| 280,000 | | | 6.431 | | | 04/01/18 | | | 286,972 | |
| Kansas City MO Special Obligation Revenue Bonds (Capital Appreciation) Series E (AA-/A1)(a) | |
| 4,465,000 | | | 0.000 | | | 02/01/18 | | | 3,423,226 | |
| Kansas City MO Special Obligation Tax Allocation (East Village Project) Series A (AA-/A1) | |
| 500,000 | | | 5.000 | | | 04/15/31 | | | 492,540 | |
| Kansas City MO Special Obligation Tax Allocation (Refunding-Kansas City Project) Series B (AA-/A1) | |
| 500,000 | | | 3.000 | | | 01/01/15 | | | 514,335 | |
| Kirkwood MO Certificates of Participation (Build America Bonds-Taxable Direct Payment) (NR/Aa2) | |
| 500,000 | | | 6.050 | | | 09/01/30 | | | 502,220 | |
| | |
| | |
| The accompanying notes are an integral part of these financial statements. | | 31 |
COMMERCE MISSOURI TAX-FREE INTERMEDIATE BOND FUND
Schedule of Investments (continued)
April 30, 2011 (Unaudited)
| | | | | | | | | | |
Principal
Amount | | Interest
Rate | | | Maturity
Date | | Value | |
| Municipal Bond Obligations – (continued) | |
Missouri – (continued) | |
| Kirkwood MO School District Educational Facilities Authority Leasehold Revenue Bonds for Kirkwood School District R-7 Project Series B (NATL-RE) (NR/Aa2) | |
| $ 750,000 | | | 5.000 | % | | 02/15/19 | | $ | 800,430 | |
| Ladue MO School District GO Bonds (Refunding & Improvement) (AAA/NR) | |
| 500,000 | | | 5.000 | | | 03/01/20 | | | 560,725 | |
| 545,000 | | | 5.000 | | | 03/01/22 | | | 606,220 | |
| 500,000 | | | 5.000 | | | 03/01/23 | | | 552,780 | |
| Lee’s Summit MO Water & Sewer Revenue Bonds (Refunding) (AMBAC) (NR/Aa2) | |
| 1,000,000 | | | 5.250 | | | 07/01/12 | | | 1,006,930 | |
| 1,135,000 | | | 5.250 | | | 07/01/15 | | | 1,140,062 | |
| Lee’s Summit MO Water & Sewer Revenue Bonds Combination Series A (AMBAC) (NR/Aa2) | |
| 480,000 | | | 5.000 | | | 07/01/20 | | | 490,829 | |
| Mehlville MO School District No. R-9 Certificates of Participation (AGM) (AA+/Aa3) | |
| 1,620,000 | | | 4.750 | | | 03/01/16 | | | 1,721,056 | |
| 850,000 | | | 4.750 | | | 03/01/17 | | | 896,818 | |
Missouri Development Finance Board Cultural Facilities Revenue Bonds (Nelson Gallery Foundation) Series A
(AA-/NR) | |
| 1,000,000 | | | 5.000 | | | 12/01/20 | | | 1,116,810 | |
| Missouri Development Finance Board Cultural Facilities Revenue Bonds (Nelson Gallery Foundation) Series A (NATL-RE) (AA-/Aa3)(b) | |
| 1,410,000 | | | 5.250 | | | 12/01/11 | | | 1,450,481 | |
| Missouri School Board Association Lease Certificates of Participation for Liberty Public School District No. 53 (AGM) (AA+/Aa3) | |
| 830,000 | | | 5.250 | | | 03/01/21 | | | 916,021 | |
| 700,000 | | | 5.250 | | | 03/01/22 | | | 769,041 | |
| Missouri State Board of Public Buildings Special Obligation Revenue Bonds Series A (AA+/Aa1) | |
| 1,000,000 | | | 5.000 | | | 10/15/20 | | | 1,053,370 | |
| Missouri State Development Finance Board Infrastructure Facilities Revenue Bonds (Independence Parks Facilities Project) Series D (A-/NR) | |
| 590,000 | | | 4.250 | | | 04/01/12 | | | 602,797 | |
| Missouri State Development Finance Board Infrastructure Facilities Revenue Bonds (Independence-Events Center) Series F (A-/NR) | |
| 1,000,000 | | | 6.125 | | | 04/01/29 | | | 1,011,180 | |
| Missouri State Development Finance Board Infrastructure Facilities Revenue Bonds (Water System) (Refunding) Series E (A-/NR) | |
| 700,000 | | | 4.000 | | | 11/01/13 | | | 735,434 | |
| Missouri State Development Finance Board Infrastructure Facilities Tax Allocation (Eastland Center Project) Series A (A-/NR) | |
| 150,000 | | | 4.500 | | | 04/01/22 | | | 150,612 | |
| | |
| | | | | | | | | | |
Principal
Amount | | Interest
Rate | | | Maturity
Date | | Value | |
| Municipal Bond Obligations – (continued) | |
Missouri – (continued) | |
| Missouri State Development Finance Board Infrastructure Facilities Tax Allocation (Hartman Heritage Center Phase II) (AMBAC) (A-/NR) | |
| $ 300,000 | | | 5.000 | % | | 04/01/13 | | $ | 309,849 | |
| 1,070,000 | | | 5.000 | | | 04/01/19 | | | 1,087,655 | |
| 1,240,000 | | | 5.000 | | | 04/01/21 | | | 1,258,786 | |
| Missouri State Development Finance Board Infrastructure Facilities Tax Allocation (Independence-Centerpoint Project) (A-/NR) | |
| 935,000 | | | 4.750 | | | 04/01/28 | | | 893,075 | |
Missouri State Environmental Improvement & Energy Resources Authority Water Pollution Control Revenue Bonds (Prerefunded-State Revolving Funds Program) Series B
(NR/Aaa)(b) | |
| 705,000 | | | 5.000 | | | 01/01/13 | | | 757,812 | |
| 715,000 | | | 5.125 | | | 01/01/13 | | | 770,034 | |
| Missouri State Environmental Improvement & Energy Resources Authority Water Pollution Control Revenue Bonds (State Revolving Funds Program) Series A (NR/Aaa) | |
| 400,000 | | | 5.500 | | | 01/01/23 | | | 463,208 | |
| Missouri State Environmental Improvement & Energy Resources Authority Water Pollution Control Revenue Bonds (State Revolving Funds Program) Series B (NR/Aaa) | |
| 1,115,000 | | | 5.000 | | | 07/01/17 | | | 1,270,509 | |
| Missouri State Environmental Improvement & Energy Resources Authority Water Pollution Control Revenue Bonds (Unrefunded Balance-State Revolving Funds Program) Series A (NR/Aaa) | |
| 185,000 | | | 5.125 | | | 07/01/11 | | | 185,622 | |
| 435,000 | | | 5.200 | | | 07/01/12 | | | 436,501 | |
| Missouri State Environmental Improvement & Energy Resources Authority Water Pollution Control Revenue Bonds (Unrefunded Balance-State Revolving Funds Program) Series B (NR/Aaa) | |
| 415,000 | | | 5.125 | | | 01/01/18 | | | 436,455 | |
| 20,000 | | | 5.000 | | | 01/01/22 | | | 20,790 | |
| Missouri State Health & Educational Facilities Authority Revenue Bonds (Barnes-Jewish, Inc.) (AA/Aa2) | |
| 150,000 | | | 6.000 | | | 05/15/11 | | | 150,222 | |
| Missouri State Health & Educational Facilities Authority Revenue Bonds (Barnes-Jewish, Inc.) Series A (AA/Aa2) | |
| 3,035,000 | | | 5.250 | | | 05/15/14 | | | 3,244,020 | |
| Missouri State Health & Educational Facilities Authority Revenue Bonds (BJC Health System) Series 2003 (AA/Aa2) | |
| 2,180,000 | | | 5.250 | | | 05/15/17 | | | 2,288,651 | |
| Missouri State Health & Educational Facilities Authority Revenue Bonds (BJC Health System) Series A (AA/Aa2) | |
| 1,225,000 | | | 5.000 | | | 05/15/18 | | | 1,289,741 | |
| Missouri State Health & Educational Facilities Authority Revenue Bonds (Children’s Mercy Hospital) (A+/NR) | |
| 1,000,000 | | | 5.000 | | | 05/15/23 | | | 1,015,850 | |
| Missouri State Health & Educational Facilities Authority Revenue Bonds (Cox Health System) (NR/A2) | |
| 2,350,000 | | | 5.125 | | | 11/15/23 | | | 2,385,884 | |
| | |
| | |
| 32 | | The accompanying notes are an integral part of these financial statements. |
COMMERCE MISSOURI TAX-FREE INTERMEDIATE BOND FUND
| | | | | | | | | | |
Principal
Amount | | Interest
Rate | | | Maturity
Date | | Value | |
| Municipal Bond Obligations – (continued) | |
Missouri – (continued) | |
Missouri State Health & Educational Facilities Authority Revenue Bonds (Lake Regional Health System Project)
(BBB+/NR) | |
| $ 510,000 | | | 5.000 | % | | 02/15/14 | | $ | 525,570 | |
| Missouri State Health & Educational Facilities Authority Revenue Bonds (Refunding-Lake Regional Health System) (BBB+/NR) | |
| 2,000,000 | | | 5.000 | | | 02/15/19 | | | 2,019,100 | |
| Missouri State Health & Educational Facilities Authority Revenue Bonds (SSM Health Care) Series B (AA-/NR) | |
| 1,000,000 | | | 4.500 | | | 06/01/25 | | | 943,840 | |
| Missouri State Health & Educational Facilities Authority Revenue Bonds (St. Louis University) (AA-/A1) | |
| 1,000,000 | | | 5.500 | | | 10/01/12 | | | 1,059,280 | |
| Missouri State Health & Educational Facilities Authority Revenue Bonds (St. Lukes Health System) Series A (AGM) (AA+/Aa3) | |
| 2,000,000 | | | 5.000 | | | 11/15/14 | | | 2,172,880 | |
| 1,000,000 | | | 5.000 | | | 11/15/19 | | | 1,082,930 | |
| Missouri State Health & Educational Facilities Authority Revenue Bonds (University of Missouri-Columbia Arena Project) (AA+/Aa1) | |
| 500,000 | | | 5.000 | | | 11/01/17 | | | 509,710 | |
| Missouri State Health & Educational Facilities Authority Revenue Bonds (Washington University) Series A (AAA/Aaa) | |
| 1,050,000 | | | 5.000 | | | 02/15/17 | | | 1,173,060 | |
| 1,545,000 | | | 5.000 | | | 02/15/20 | | | 1,688,716 | |
| 120,000 | | | 4.750 | | | 11/15/37 | | | 119,104 | |
| Missouri State Highways & Transit Commission Road Revenue Bonds (Second Lien) (AAA/Aa1) | |
| 1,165,000 | | | 5.250 | | | 05/01/18 | | | 1,362,724 | |
| Missouri State Housing Development Commission Multi Family Housing Revenue Bonds (Samantha Heights Apartments Project) Series 2 (FHA) (AA/NR) | |
| 500,000 | | | 4.375 | | | 07/01/30 | | | 459,030 | |
| 3,420,000 | | | 4.750 | | | 07/01/42 | | | 3,146,366 | |
| Missouri State Housing Development Commission Revenue Bonds (Single Family Homeowner Loan) Series A-1 (AMT) (FNMA/GNMA) (AAA/NR) | |
| 25,000 | | | 5.800 | | | 09/01/11 | | | 25,001 | |
| 20,000 | | | 5.900 | | | 09/01/12 | | | 20,001 | |
| 20,000 | | | 6.000 | | | 09/01/13 | | | 20,001 | |
| Missouri State Housing Development Commission Single Family Mortgage Revenue Bonds (Special Homeownership Loan Program Market Bonds) Series E-1 (FHLMC) (AAA/NR) | |
| 1,030,000 | | | 3.950 | | | 05/01/21 | | | 1,014,941 | |
| 1,205,000 | | | 3.950 | | | 11/01/21 | | | 1,186,684 | |
| Missouri State Regional Convention & Sports Complex Authority Revenue Bonds (Refunding-Convention & Sports Facilities Project) Series A-1 (AMBAC) (AA+/Aa2) | |
| 2,000,000 | | | 5.250 | | | 08/15/12 | | | 2,105,220 | |
| | |
| | | | | | | | | | |
Principal
Amount | | Interest
Rate | | | Maturity
Date | | Value | |
| Municipal Bond Obligations – (continued) | |
Missouri – (continued) | |
| Missouri State Stormwater Control GO Bonds Series A (AAA/Aaa)(b) | |
| $ 300,000 | | | 5.250 | % | | 08/01/12 | | $ | 318,429 | |
| Monarch-Chesterfield MO Levee District Special Tax (A-/NR) | |
| 3,425,000 | | | 4.000 | | | 03/01/19 | | | 3,465,723 | |
Monarch-Chesterfield MO Levee District Special Tax
(NATL-RE) (BBB/Baa1) | |
| 770,000 | | | 5.450 | | | 03/01/14 | | | 772,194 | |
| Neosho MO Reorganized School District No. R-5 GO Bonds (Building-Direct Deposit Program) (AGM) (AA+/Aa3) | |
| 1,430,000 | | | 5.250 | | | 03/01/21 | | | 1,579,564 | |
| Nixa MO Electric System Revenue Bonds (XLCA) (NR/NR) | |
| 1,000,000 | | | 4.750 | | | 04/01/15 | | | 1,042,990 | |
| North Kansas City MO Hospital Revenue Bonds (North Kansas City Hospital) Series A (AGM) (AA+/Aa3) | |
| 1,000,000 | | | 5.000 | | | 11/15/18 | | | 1,033,320 | |
| 1,000,000 | | | 5.000 | | | 11/15/19 | | | 1,029,170 | |
| North Kansas City MO School District No. 74 Direct Deposit Program GO Bonds (AA+/Aa1) | |
| 3,000,000 | | | 5.500 | | | 03/01/28 | | | 3,337,950 | |
| Northwest Missouri State University Revenue Bonds (Housing System) (NATL-RE) (NR/A3) | |
| 2,875,000 | | | 5.000 | | | 06/01/20 | | | 2,965,160 | |
O’ Fallon MO Certificates of Participation (NATL-RE)
(NR/Aa3) | |
| 1,000,000 | | | 5.000 | | | 02/01/22 | | | 1,035,020 | |
| O’ Fallon MO Certificates of Participation (NR/Aa3) | |
| 2,130,000 | | | 5.250 | | | 11/01/17 | | | 2,347,388 | |
| 1,000,000 | | | 5.250 | | | 11/01/18 | | | 1,101,980 | |
| 2,000,000 | | | 5.250 | | | 11/01/19 | | | 2,202,700 | |
| OTC Public Building Corp. MO Leasehold Revenue Bonds (Refunding-Ozarks Technical Community College) (AGM) (AA+/NR) | |
| 1,500,000 | | | 5.000 | | | 03/01/19 | | | 1,737,240 | |
| Ozark MO Reorganized School District No. R-6 GO Bonds (Direct Deposit Program) (AGM) (AA+/Aa3) | |
| 440,000 | | | 5.000 | | | 03/01/22 | | | 480,058 | |
| Platte County MO GO Bonds for Parkville Neighborhood Improvement Series B (NATL-RE) (NR/Aa2) | |
| 2,720,000 | | | 5.000 | | | 02/01/22 | | | 2,889,266 | |
| Platte County MO Industrial Development Authority Transportation Revenue Bonds (Refunding & Improvement-Zona Rosa Retail Project) (AA-/NR) | |
| 435,000 | | | 5.000 | | | 12/01/18 | | | 485,456 | |
| 850,000 | | | 5.000 | | | 12/01/20 | | | 933,708 | |
| Raytown MO Annual Appropriation-Supported Tax Revenue Bonds (Live Redevelopment Plan Project 1) (A+/NR) | |
| 150,000 | | | 5.000 | | | 12/01/12 | | | 155,541 | |
| Raytown MO Sewer Revenue Bonds (NR/NR) | |
| 100,000 | | | 4.625 | | | 07/01/24 | | | 100,617 | |
| 100,000 | | | 4.700 | | | 07/01/27 | | | 100,116 | |
| | |
| | |
| The accompanying notes are an integral part of these financial statements. | | 33 |
COMMERCE MISSOURI TAX-FREE INTERMEDIATE BOND FUND
Schedule of Investments (continued)
April 30, 2011 (Unaudited)
| | | | | | | | | | |
Principal
Amount | | Interest
Rate | | | Maturity
Date | | Value | |
| Municipal Bond Obligations – (continued) | |
Missouri – (continued) | |
| Republic MO Special Obligation Revenue Bonds (A/NR) | |
| $ 380,000 | | | 2.000 | % | | 05/01/14 | | $ | 377,070 | |
| 175,000 | | | 2.500 | | | 05/01/15 | | | 175,464 | |
| 150,000 | | | 2.650 | | | 05/01/16 | | | 148,751 | |
| 125,000 | | | 3.000 | | | 05/01/17 | | | 123,579 | |
| 150,000 | | | 3.150 | | | 05/01/18 | | | 144,608 | |
| 150,000 | | | 3.300 | | | 05/01/19 | | | 145,157 | |
| 250,000 | | | 3.500 | | | 05/01/20 | | | 240,562 | |
| 300,000 | | | 3.750 | | | 05/01/21 | | | 288,864 | |
| 325,000 | | | 3.875 | | | 05/01/22 | | | 313,150 | |
| Ritenour MO School District Direct Deposit Program GO Bonds (AA+/NR) | |
| 1,740,000 | | | 4.500 | | | 03/01/17 | | | 1,933,157 | |
| Riverside MO Tax Increment Revenue Tax Allocation (L-385 Levee Project) (A/NR) | |
| 1,000,000 | | | 5.250 | | | 05/01/20 | | | 1,020,170 | |
| Riverside-Quindaro MO Bend Levee District Project Revenue Bonds Series L (Radian) (BBB/NR) | |
| 450,000 | | | 5.500 | | | 03/01/14 | | | 465,525 | |
| 500,000 | | | 5.500 | | | 03/01/15 | | | 516,645 | |
| Sikeston MO Electric Revenue Bonds (Refunding) (BBB/Baa1) | |
| 530,000 | | | 5.000 | | | 06/01/22 | | | 531,124 | |
| Southeast MO State University Revenue Bonds (Installment Payment Certificates) Series 2002 (XLCA) (NR/NR) | |
| 200,000 | | | 4.750 | | | 04/01/12 | | | 200,570 | |
| Springfield MO Public Building Corp. Leasehold Revenue Bonds (Taxable Improvement-Branson National Airport) (NR/Aa2) | |
| 540,000 | | | 6.750 | | | 03/01/28 | | | 563,911 | |
| 575,000 | | | 6.850 | | | 03/01/29 | | | 601,088 | |
| Springfield MO Public Utility Revenue Certificates of Participation (Lease Purchase for Various Projects) Series A (NATL-RE) (AA/A1) | |
| 1,000,000 | | | 5.000 | | | 12/01/18 | | | 1,058,110 | |
| Springfield MO Special Obligation Revenue Bonds (College Station Garage Project) Series A (NR/Aa3) | |
| 190,000 | | | 4.500 | | | 11/01/18 | | | 201,742 | |
| 530,000 | | | 4.500 | | | 11/01/19 | | | 556,140 | |
| 610,000 | | | 4.500 | | | 11/01/20 | | | 636,498 | |
| 645,000 | | | 4.750 | | | 11/01/21 | | | 678,443 | |
| 685,000 | | | 4.750 | | | 11/01/22 | | | 717,305 | |
| Springfield MO Special Obligation Revenue Bonds (Heers Garage Project) Series B (NR/Aa3) | |
| 385,000 | | | 4.750 | | | 11/01/21 | | | 404,962 | |
| 405,000 | | | 4.750 | | | 11/01/22 | | | 424,100 | |
| St. Charles County MO Community College GO Bonds (Refunding) (NATL-RE) (NR/Aa1) | |
| 2,585,000 | | | 5.000 | | | 02/15/17 | | | 2,989,449 | |
| St. Charles County MO Public Water Supply District No. 2 Certificates of Participation (AA/NR) | |
| 2,115,000 | | | 4.000 | | | 12/01/20 | | | 2,144,991 | |
| 100,000 | | | 5.200 | | | 12/01/31 | | | 102,903 | |
| | |
| | | | | | | | | | |
Principal
Amount | | Interest
Rate | | | Maturity
Date | | Value | |
| Municipal Bond Obligations – (continued) | |
Missouri – (continued) | |
| St. Charles County MO Public Water Supply District No. 2 Certificates of Participation Series B (Refunding) (NR/Baa1) | |
| $ 530,000 | | | 5.000 | % | | 12/01/12 | | $ | 555,032 | |
| St. Charles County MO Water Supply District No. 2 Certificates of Participation (AA/NR) | |
| 650,000 | | | 5.375 | | | 12/01/36 | | | 659,035 | |
| St. Charles MO Certificates of Participation Build America Bonds Series B (NR/Aa3) | |
| 1,250,000 | | | 5.650 | | | 02/01/30 | | | 1,196,962 | |
| St. Charles MO Certificates of Participation Series B (NR/A1) | |
| 1,000,000 | | | 5.500 | | | 05/01/18 | | | 1,031,920 | |
| St. Charles MO Community College Educational Facilities Authority Leasehold Revenue Bonds (NR/Aa2) | |
| 100,000 | | | 5.250 | | | 06/01/19 | | | 106,076 | |
| 735,000 | | | 5.200 | | | 06/01/24 | | | 772,860 | |
| St. Louis County MO Industrial Development Authority Health Facilities Revenue Bonds (Refunding-Ranken Jordan Project) (NR/NR) | |
| 490,000 | | | 5.000 | | | 11/15/15 | | | 486,859 | |
| 515,000 | | | 5.000 | | | 11/15/16 | | | 506,698 | |
| St. Louis County MO Parkway School District No. C-2 GO Bonds (Refunding & Improvement) (AAA/NR) | |
| 400,000 | | | 3.250 | | | 03/01/19 | | | 419,160 | |
| St. Louis MO Airport Revenue Bonds (Refunding-Lambert International Airport) (FGIC) (BBB/Baa1) | |
| 100,000 | | | 5.125 | | | 07/01/15 | | | 100,168 | |
| St. Louis MO Airport Revenue Bonds (Refunding-Lambert International Airport) Series B (AMT) (AGM) (AA+/Aa3) | |
| 2,000,000 | | | 5.000 | | | 07/01/24 | | | 1,980,860 | |
| St. Louis MO Airport Revenue Bonds (Refunding-Lambert/St. Louis International Airport) (NATL-RE) (FGIC) (BBB/Baa1) | |
| 185,000 | | | 5.125 | | | 07/01/12 | | | 185,389 | |
| St. Louis MO Junior College District Building Corp. Leasehold Revenue Bonds (AA/NR) | |
| 100,000 | | | 4.000 | | | 04/01/16 | | | 107,461 | |
| St. Louis MO Municipal Finance Corp. Leasehold Revenue Bonds (Refunding-City Justice Center) Series A (AMBAC) (A/NR) | |
| 700,000 | | | 5.250 | | | 02/15/15 | | | 713,391 | |
| St. Louis MO Municipal Finance Corp. Leasehold Revenue Bonds (Refunding-Civil Courts Building) (A/NR) | |
| 1,255,000 | | | 3.000 | | | 08/01/14 | | | 1,284,643 | |
| 1,345,000 | | | 4.000 | | | 08/01/14 | | | 1,418,585 | |
| St. Louis MO Parking Revenue Bonds (Downtown Parking Facilities-Subordinated A) (NR/NR)(b) | |
| 835,000 | | | 5.500 | | | 02/01/12 | | | 864,459 | |
| St. Louis MO Parking Revenue Bonds (Taxable) Series B (BBB/Baa1) | |
| 100,000 | | | 5.140 | | | 12/15/14 | | | 104,963 | |
| St. Louis MO Special Administrative Board Transitional School District GO Bonds (Direct Deposit Program) (AA+/NR) | |
| 4,250,000 | | | 5.000 | | | 04/01/21 | | | 4,602,835 | |
| | |
| | |
| 34 | | The accompanying notes are an integral part of these financial statements. |
COMMERCE MISSOURI TAX-FREE INTERMEDIATE BOND FUND
| | | | | | | | | | |
Principal
Amount | | Interest
Rate | | | Maturity
Date | | Value | |
| Municipal Bond Obligations – (continued) | |
Missouri – (continued) | |
| Taney County MO Certificates of Participation (NATL-RE) (NR/A1) | |
| $1,095,000 | | | 4.500 | % | | 04/01/17 | | $ | 1,144,461 | |
| University of Missouri Revenue Bonds System Facilities (Refunding) Series B (AA+/Aa1) | |
| 375,000 | | | 5.375 | | | 11/01/14 | | | 383,006 | |
| Valley Park MO School District Educational Facilities Authority Leasehold Revenue Bonds (Refunding) (AA-/NR) | |
| 300,000 | | | 2.750 | | | 03/01/17 | | | 298,233 | |
| 345,000 | | | 3.000 | | | 03/01/18 | | | 342,043 | |
| 360,000 | | | 3.000 | | | 03/01/19 | | | 348,527 | |
| 385,000 | | | 3.150 | | | 03/01/21 | | | 364,237 | |
| 700,000 | | | 3.300 | | | 03/01/23 | | | 651,889 | |
| Warrensburg MO Certificates of Participation (Refunding & Improvement) (A/NR) | |
| 225,000 | | | 3.000 | | | 09/01/12 | | | 229,646 | |
| Washington MO School District Direct Deposit GO Bonds (Refunding) (AGM) (AA+/Aa3) | |
| 1,000,000 | | | 5.250 | | | 03/01/13 | | | 1,082,550 | |
| West Plains R-VII School District MO Lease Certificates of Participation Howell County (Refunding-GTD Performance) Series A (A-/NR) | |
| 405,000 | | | 2.700 | | | 04/15/16 | | | 398,621 | |
| 470,000 | | | 3.250 | | | 04/15/18 | | | 454,654 | |
| Willard MO Certificates of Participation (Parks & Recreation Project) Series B (A/NR) | |
| 625,000 | | | 6.625 | | | 06/01/28 | | | 718,131 | |
| | | | | | | | | | |
| | | | | | | | | 204,973,173 | |
| | |
Nevada – 1.0% | |
| Las Vegas NV Convention & Visitors Authority Revenue Bonds (Refunding) Series E (AGM) (AA+/Aa3) | |
| 2,505,000 | | | 5.400 | | | 07/01/33 | | | 2,510,185 | |
| | |
Pennsylvania – 0.7% | |
| Delaware County Authority University Revenue Bonds for Neumann University (BBB/NR) | |
| 1,000,000 | | | 5.000 | | | 10/01/25 | | | 918,870 | |
| St. Mary’s PA Area Water Authority Revenue Bonds (BBB+/NR) | |
| 1,000,000 | | | 4.750 | | | 02/01/25 | | | 989,000 | |
| | | | | | | | | | |
| | | | | | | | | 1,907,870 | |
| | |
Puerto Rico – 1.0% | |
| Puerto Rico Electric Power Authority Revenue Bonds (Refunding) (NATL-RE) (BBB+/A3) | |
| 555,000 | | | 5.000 | | | 07/01/22 | | | 562,071 | |
Puerto Rico Public Buildings Authority Revenue Bond (Unrefunded Balance-Government Facilities) Series l
(BBB/A3) | |
| 2,320,000 | | | 5.250 | | | 07/01/33 | | | 2,110,689 | |
| | | | | | | | | | |
| | | | | | | | | 2,672,760 | |
| | |
| | | | | | | | | | |
Principal
Amount | | Interest
Rate | | | Maturity
Date | | Value | |
| Municipal Bond Obligations – (continued) | |
South Carolina – 0.4% | |
Kershaw County SC Public School Foundation Installment Power Revenue Bonds (School District Project) (CIFG)
(BBB+/NR) | |
| $1,035,000 | | | 5.000 | % | | 12/01/28 | | $ | 994,014 | |
| | |
Texas – 0.3% | |
| Mansfield TX GO Certificates (AA/Aa2) | |
| 700,000 | | | 5.750 | | | 02/15/22 | | | 787,101 | |
| | |
Washington – 0.9% | |
| Washington State Health Care Facilities Authority Revenue Bonds (Overlake Hospital Medical Center) (A-/A3) | |
| 2,500,000 | | | 5.250 | | | 07/01/25 | | | 2,431,700 | |
| | |
| TOTAL MUNICIPAL BOND OBLIGATIONS | | | | |
(Cost $247,042,859) | | $ | 251,552,146 | |
| | |
| | | | | | | | | | |
| Short-term Investment(c) – 2.1% | |
Repurchase Agreement – 2.1% | |
| State Street Bank & Trust Co. | |
| $5,478,000 | | | 0.010 | % | | 05/02/11 | | $ | 5,478,000 | |
Maturity Value: $5,478,005 | | | | |
(Cost $5,478,000) | | | | |
| | |
| TOTAL INVESTMENTS – 99.5% | | | | |
(Cost $252,520,859) | | $ | 257,030,146 | |
| | |
OTHER ASSETS IN EXCESS OF LIABILITIES – 0.5% | | | 1,216,148 | |
| | |
| NET ASSETS – 100.0% | | $ | 258,246,294 | |
| | |
| | |
| The percentage shown for each investment category reflects the value of investments in that category as a percentage of net assets. |
| (a) | | Issued with a zero coupon. Income is recognized through the accretion of discount. |
| (b) | | Prerefunded security. Maturity date disclosed is prerefunding date. |
| (c) | | Repurchase agreement was entered into on April 29, 2011. This agreement was fully collateralized by $5,520,000 U.S. Treasury Note, 1.000% due 04/30/12 with a market value of $5,587,985. |
| Security ratings disclosed, if any, are issued by Standard & Poor’s Ratings Services/Moody’s Investors Service and are unaudited. A description of the ratings is available in the Fund’s Statement of Additional Information. |
| |
| | |
| The accompanying notes are an integral part of these financial statements. | | 35 |
COMMERCE MISSOURI TAX-FREE INTERMEDIATE BOND FUND
Schedule of Investments (continued)
April 30, 2011 (Unaudited)
| | |
| |
| Investment Abbreviations: |
| AGM | | —Insured by Assured Guaranty Municipal Corp. |
| AMBAC | | —Insured by American Municipal Bond Assurance Corp. |
| AMT | | —Alternative Minimum Tax |
| CIFG | | —Insured by CIFG Assurance North America, Inc. |
| FGIC | | —Insured by Financial Guaranty Insurance Co. |
| FHA | | —Insured by Federal Housing Administration |
| FHLMC | | —Federal Home Loan Mortgage Corp. |
| FNMA | | —Federal National Mortgage Association |
| GNMA | | —Government National Mortgage Association |
| GO | | —General Obligation |
| GTD | | —Guaranteed |
| NATL-RE | | —Insured by National Reinsurance Corp. |
| NR | | —Not Rated |
| Radian | | —Insured by Radian Asset Assurance |
| WR | | —Withdrawn Rating |
| XLCA | | —Insured by XL Capital Assurance, Inc. |
| |
PORTFOLIO COMPOSITION
| | | | | | | | |
| Sector Allocation | | AS OF
4/30/11 | | | AS OF
10/31/10 | |
| | |
Lease | | | 24.8 | % | | | 23.5 | % |
General Obligations | | | 23.6 | | | | 25.0 | |
Hospital | | | 17.3 | | | | 17.7 | |
General | | | 10.3 | | | | 9.9 | |
Water/Sewer | | | 5.1 | | | | 5.7 | |
Education | | | 4.9 | | | | 4.6 | |
Transportation | | | 4.5 | | | | 4.9 | |
Single Family Housing | | | 2.3 | | | | 2.1 | |
Prerefunded/Escrow to Maturity | | | 2.0 | | | | 1.9 | |
Multi Family Housing | | | 1.4 | | | | 1.6 | |
Power | | | 0.8 | | | | 1.3 | |
Crossover | | | 0.4 | | | | 1.1 | |
Short-term Investment | | | 2.1 | | | | 0.0 | |
| | |
| TOTAL INVESTMENTS | | | 99.5 | % | | | 99.3 | % |
| | |
The percentage shown for each investment category reflects the value of investments in that category as a percentage of net assets.
The Fund is actively managed and, as such its composition may differ over time.
| | |
| 36 | | The accompanying notes are an integral part of these financial statements. |
COMMERCE KANSAS TAX-FREE INTERMEDIATE BOND FUND
Schedule of Investments
April 30, 2011 (Unaudited)
| | | | | | | | | | |
Principal
Amount | | Interest
Rate | | | Maturity
Date | | Value | |
| Municipal Bond Obligations – 98.9% | |
Arizona – 0.5% | |
| Arizona Healthcare & Education Facilities Authority Revenue Bonds (Kirksville College) (A-/NR) | |
| $ 450,000 | | | 5.000 | % | | 01/01/25 | | $ | 449,969 | |
| | |
California – 1.4% | |
| Burbank CA Unified School District GO Bonds Capital Appreciation Election of 1997 Series C (NATL-RE) (FGIC) (AA-/NR)(a) | |
| 670,000 | | | 0.000 | | | 07/01/27 | | | 231,840 | |
| Sacramento County CA Airport System Revenue Bonds (A/A2) | |
| 500,000 | | | 5.000 | | | 07/01/27 | | | 504,355 | |
| San Francisco City & County Airports Commission Revenue Bonds (Refunding Second Series 32G) (NATL-RE) (FGIC) (A/A1) | |
| 445,000 | | | 5.000 | | | 05/01/24 | | | 453,255 | |
| | | | | | | | | | |
| | | | | | | | | 1,189,450 | |
| | |
Florida – 4.6% | |
| Duval County FL School Board Certificates of Participation (Master Lease Program) Series B (AA-/Aa3) | |
| 1,250,000 | | | 5.000 | | | 07/01/35 | | | 1,224,162 | |
| Miami-Dade County Aviation Revenue Bonds Series B (A-/A2) | |
| 2,000,000 | | | 5.000 | | | 10/01/41 | | | 1,766,880 | |
| Port St. Lucie FL Lease Revenue Bonds (Wyndcrest Project-Recovery Zone Facility Bonds) Series B (A/Aa3) | |
| 1,000,000 | | | 4.500 | | | 09/01/24 | | | 982,240 | |
| | | | | | | | | | |
| | | | | | | | | 3,973,282 | |
| | |
Illinois – 1.0% | |
| Illinois Finance Authority Revenue Bonds (Poetry Foundation Project) (A+/A1) | |
| 900,000 | | | 5.300 | | | 01/01/40 | | | 842,175 | |
| | |
Indiana – 3.7% | |
| Evansville IN Redevelopment Authority Revenue Bonds Lease Rent Tax Allocation (Build America Bonds-Taxable) Series B (A/Aa3) | |
| 1,000,000 | | | 6.860 | | | 02/01/29 | | | 1,032,290 | |
| Indiana State Finance Authority Revenue Bonds (Educational Facilities for Indiana Historical Society, Inc.) (NR/A3) | |
| 1,000,000 | | | 5.000 | | | 07/01/35 | | | 889,300 | |
| North West Hendricks Multi School Building Corp. Industry (First Mortgage) Series A (AA+/Aa3) | |
| 1,300,000 | | | 5.000 | | | 01/15/31 | | | 1,317,940 | |
| | | | | | | | | | |
| | | | | | | | | 3,239,530 | |
| | |
Iowa – 0.4% | |
| Iowa Finance Authority Single Family Mortgage Revenue Bonds Series E (GNMA/FNMA) (Go of Authority) (AAA/Aaa) | |
| 370,000 | | | 5.000 | | | 07/01/23 | | | 375,935 | |
| | |
Kansas – 75.1% | |
| Augusta KS Electric Systems Revenue Bonds (AMBAC) (NR/NR)(b) | |
| 1,000,000 | | | 4.750 | | | 08/01/12 | | | 1,053,950 | |
| | |
| | | | | | | | | | |
Principal
Amount | | Interest
Rate | | | Maturity
Date | | Value | |
| Municipal Bond Obligations – (continued) | |
Kansas – (continued) | |
| Burlington KS Pollution Control Revenue Bonds (Refunding Gas & Electric) (NATL-RE) (BBB+/Baa1) | |
| $ 190,000 | | | 4.850 | % | | 06/01/31 | | $ | 176,181 | |
| Chisholm Creek Utility Authority KS Water and Wastewater Facilities Revenue Bonds (Refunding) (AMBAC) (NR/NR) | |
| 1,000,000 | | | 5.250 | | | 09/01/24 | | | 1,045,860 | |
| Cowley County KS Unified School District No. 470 Arkansas City GO Bonds (Refunding) (A/NR) | |
| 940,000 | | | 4.000 | | | 09/01/17 | | | 1,015,134 | |
| 235,000 | | | 4.000 | | | 09/01/18 | | | 249,415 | |
| Derby KS GO Bonds (Refunding) Series B (AMBAC) (NR/Aa3) | |
| 440,000 | | | 5.000 | | | 12/01/13 | | | 448,879 | |
| Dodge City KS Unified School District No. 443 Ford County Certificates of Participation (Lease Purchase Agreement) (NR/A2) | |
| 400,000 | | | 2.000 | | | 12/01/11 | | | 401,528 | |
| 1,015,000 | | | 2.000 | | | 12/01/13 | | | 1,006,169 | |
| Dodge City KS Unified School District No. 443 GO Bonds (Refunding) (FGIC) (NR/A1) | |
| 1,450,000 | | | 5.000 | | | 03/01/12 | | | 1,481,407 | |
| Douglas County KS GO Bonds (Refunding Sales Tax) Series A (AMBAC) (NR/Aa2) | |
| 1,000,000 | | | 5.000 | | | 08/01/12 | | | 1,055,240 | |
| Harvey County KS School District No. 373 GO Bonds (Refunding & Improvement) (AGM) (AA+/Aa3) | |
| 495,000 | | | 5.000 | | | 09/01/15 | | | 550,787 | |
| Johnson County KS Community College Certificate of Participation (Improvement) (NR/Aaa) | |
| 765,000 | | | 4.000 | | | 04/01/13 | | | 783,727 | |
| Johnson County KS GO Bonds (Internal Improvement) Series A (AAA/Aaa) | |
| 1,000,000 | | | 5.000 | | | 09/01/21 | | | 1,049,650 | |
| Johnson County KS Public Building Commission Lease Purchase Revenue Bonds (Refunding) Series C (AAA/Aaa) | |
| 500,000 | | | 4.000 | | | 09/01/20 | | | 536,600 | |
| Johnson County KS Unified School District No 229 GO Bonds Series A (AA/Aaa) | |
| 945,000 | | | 4.000 | | | 10/01/23 | | | 996,758 | |
| Johnson County KS Unified School District No. 231 GO Bonds (Refunding & Improvement) Series A (FGIC) (AA-/NR) | |
| 500,000 | | | 6.000 | | | 10/01/16 | | | 596,935 | |
| 1,770,000 | | | 5.000 | | | 10/01/18 | | | 1,900,467 | |
| Johnson County KS Unified School District No. 231 GO Bonds (Refunding & Improvement) Series B (AMBAC) (AA-/NR) | |
| 925,000 | | | 5.000 | | | 10/01/22 | | | 987,632 | |
| 975,000 | | | 5.000 | | | 10/01/23 | | | 1,035,596 | |
| Johnson County KS Unified School District No. 232 GO Bonds (Refunding & Improvement) (NR/Aa3) | |
| 200,000 | | | 5.000 | | | 03/01/15 | | | 221,516 | |
| Johnson County KS Water District No. 001 Revenue Bonds (Refunding) (ADFA) (GTD) (AAA/Aaa) | |
| 275,000 | | | 5.000 | | | 12/01/19 | | | 285,376 | |
| | |
| | |
| The accompanying notes are an integral part of these financial statements. | | 37 |
COMMERCE KANSAS TAX-FREE INTERMEDIATE BOND FUND
Schedule of Investments (continued)
April 30, 2011 (Unaudited)
| | | | | | | | | | |
Principal
Amount | | Interest
Rate | | | Maturity
Date | | Value | |
| Municipal Bond Obligations – (continued) | |
Kansas – (continued) | |
| Kansas State Development Finance Authority Health Facilities Revenue Bonds (Hays Medical Center, Inc.) Series Q (NR/A2) | |
| $ 750,000 | | | 5.000 | % | | 05/15/35 | | $ | 658,928 | |
| Kansas State Development Finance Authority Hospital Revenue Bonds (Adventist Health) (AA-/Aa3) | |
| 1,000,000 | | | 5.500 | | | 11/15/23 | | | 1,083,440 | |
| Kansas State Development Finance Authority Hospital Revenue Bonds (Adventist Health) Series D (AA-/Aa3) | |
| 800,000 | | | 5.000 | | | 11/15/24 | | | 819,224 | |
| Kansas State Development Finance Authority Lease Revenue Bonds (Juvenile Justice Authority) Series D (NATL-RE) (AA/Baa1) | |
| 1,270,000 | | | 5.250 | | | 05/01/13 | | | 1,273,886 | |
| Kansas State Development Finance Authority Revenue Bonds (Athletic Facilities) Series A-1 (A-/A1) | |
| 500,000 | | | 4.875 | | | 07/01/27 | | | 503,480 | |
| 1,425,000 | | | 5.250 | | | 07/01/31 | | | 1,441,573 | |
| Kansas State Development Finance Authority Revenue Bonds (Athletic Facilities) Series C (A/Aa3) | |
| 1,375,000 | | | 4.750 | | | 06/01/25 | | | 1,403,531 | |
| Kansas State Development Finance Authority Revenue Bonds (Board of Regents University Housing) Series A (NATL-RE) (A/Aa3) | |
| 1,150,000 | | | 5.000 | | | 04/01/24 | | | 1,193,711 | |
| Kansas State Development Finance Authority Revenue Bonds (El Dorado Department of Corrections Refunding Project A1) (NATL-RE) (AA/Baa1) | |
| 400,000 | | | 5.000 | | | 02/01/12 | | | 400,928 | |
| Kansas State Development Finance Authority Revenue Bonds (Juvenile Justice Authority) Series D (NATL-RE) (AA/Baa1) | |
| 400,000 | | | 5.000 | | | 05/01/12 | | | 401,328 | |
| Kansas State Development Finance Authority Revenue Bonds (Kansas Project) Series M-1 (AA/Aa2) | |
| 2,000,000 | | | 5.000 | | | 11/01/27 | | | 2,095,820 | |
| Kansas State Development Finance Authority Revenue Bonds (Kansas State Projects) Series J (Unrefunded Balance) (AMBAC) (AA/NR) | |
| 1,600,000 | | | 5.000 | | | 08/01/17 | | | 1,688,768 | |
| Kansas State Development Finance Authority Revenue Bonds (Kansas State Projects) Series K (NATL-RE) (AA/Aa2) | |
| 1,000,000 | | | 5.250 | | | 11/01/22 | | | 1,108,790 | |
| Kansas State Development Finance Authority Revenue Bonds (Kansas State Projects) Series W (ETM) (NATL-RE) (AA/NR) | |
| 20,000 | | | 4.000 | | | 10/01/11 | | | 20,302 | |
| Kansas State Development Finance Authority Revenue Bonds (Public Water Supply Revolving Loan-2) (AMBAC) (AAA/Aaa)(b) | |
| 705,000 | | | 5.500 | | | 04/01/12 | | | 738,755 | |
| Kansas State Development Finance Authority Revenue Bonds (Public Water Supply Revolving Loan-DW) (AAA/Aaa)(b) | |
| 1,500,000 | | | 6.000 | | | 04/01/13 | | | 1,657,695 | |
| | |
| | | | | | | | | | |
Principal
Amount | | Interest
Rate | | | Maturity
Date | | Value | |
| Municipal Bond Obligations – (continued) | |
Kansas – (continued) | |
| Kansas State Development Finance Authority Revenue Bonds (Refunding-Wichita State University Housing System-P) (AMBAC) (A+/NR) | |
| $ 600,000 | | | 5.000 | % | | 06/01/13 | | $ | 622,632 | |
| 630,000 | | | 5.000 | | | 06/01/14 | | | 651,496 | |
| 300,000 | | | 5.000 | | | 06/01/16 | | | 308,094 | |
| Kansas State Development Finance Authority Revenue Bonds (Sisters of Charity of Leavenworth) Series A (AA/Aa3) | |
| 1,750,000 | | | 5.250 | | | 01/01/25 | | | 1,832,915 | |
| Kansas State Development Finance Authority Revenue Bonds (Transportation Revolving Fund Trust) (AA+/Aa1) | |
| 1,105,000 | | | 5.000 | | | 10/01/21 | | | 1,192,273 | |
| Kansas State Development Finance Authority Revenue Bonds (University of Kansas Athletic Facilities Refunding) Series K (A/Aa3) | |
| 1,015,000 | | | 5.000 | | | 06/01/17 | | | 1,094,637 | |
| Kansas State Development Finance Authority Revenue Bonds (Water Pollution Control Revolving Fund II) (AAA/Aaa) | |
| 280,000 | | | 5.500 | | | 05/01/17 | | | 334,379 | |
| Lawrence KS Hospital Revenue Bonds (Refunding Lawrence Memorial Hospital) (NR/A2) | |
| 1,000,000 | | | 5.375 | | | 07/01/14 | | | 1,049,450 | |
| 455,000 | | | 5.375 | | | 07/01/15 | | | 476,139 | |
| Leavenworth County KS Unified School District No. 453 GO Bonds (Refunding & Improvement) Series A (AGM) (NR/Aa3) | |
| 1,455,000 | | | 5.250 | | | 03/01/23 | | | 1,625,191 | |
| Leavenworth County KS Unified School District No. 458 GO Bonds (Refunding & Improvement) Series A (NR/Aa3) | |
| 1,100,000 | | | 5.250 | | | 09/01/27 | | | 1,181,169 | |
| 315,000 | | | 5.250 | | | 09/01/29 | | | 331,456 | |
| Leavenworth County KS Unified School District No. 464 Tonganoxie GO Bonds (Improvement) Series A (NATL-RE) (BBB/Baa1) | |
| 150,000 | | | 5.000 | | | 09/01/20 | | | 160,881 | |
| Lyons KS Public Building Commission Revenue Bonds (A/NR) | |
| 315,000 | | | 5.000 | | | 10/01/23 | | | 339,831 | |
| Miami County Unified School District No. 416 Louisburg, KS GO Bonds (Refunding and Improvement) (NATL-RE) (BBB/Baa1) | |
| 1,650,000 | | | 5.000 | | | 09/01/17 | | | 1,828,365 | |
| Olathe KS Health Facilities Revenue Bonds (Medical Center Project) Series 2008 (A+/NR) | |
| 1,195,000 | | | 5.125 | | | 09/01/21 | | | 1,239,633 | |
| Pittsburg KS GO Bonds (Refunding) (AGM) (NR/Aa3) | |
| 210,000 | | | 5.500 | | | 09/01/11 | | | 213,173 | |
| Reno County KS Unified School District No. 308 Hutchinson GO Bonds Series A (NATL-RE) (NR/Aa3) | |
| 500,000 | | | 4.500 | | | 09/01/22 | | | 520,345 | |
| Reno County KS Unified School District No. 308 Hutchinson GO Bonds Series A (NR/Aa3) | |
| 400,000 | | | 5.500 | | | 09/01/15 | | | 453,808 | |
| | |
| | |
| 38 | | The accompanying notes are an integral part of these financial statements. |
COMMERCE KANSAS TAX-FREE INTERMEDIATE BOND FUND
| | | | | | | | | | |
Principal
Amount | | Interest
Rate | | | Maturity
Date | | Value | |
| Municipal Bond Obligations – (continued) | |
Kansas – (continued) | |
| Saline County KS Unified School District No. 305 Salina GO Bonds (AGM) (NR/Aa2) | |
| $ 100,000 | | | 5.500 | % | | 09/01/16 | | $ | 101,491 | |
| Saline County KS Unified School District No. 305 Salina GO Bonds (Unrefunded Balance) (AGM) (NR/Aa2) | |
| 70,000 | | | 5.500 | | | 09/01/16 | | | 70,734 | |
| Scott County KS Unified School District No. 466 GO Bonds (Refunding) (FGIC) (BBB/NR) | |
| 680,000 | | | 5.250 | | | 09/01/14 | | | 711,294 | |
| Sedgwick County KS Public Building Commission Revenue Bonds (Technical Education Complex Project) Series 2008-1 (NR/Aaa) | |
| 1,000,000 | | | 5.250 | | | 08/01/26 | | | 1,109,010 | |
| Sedgwick County Unified School District No. 261 (Refunding & School Improvement) (AGM) (AA+/NR) | |
| 1,500,000 | | | 5.000 | | | 11/01/32 | | | 1,506,585 | |
| Sedwick & Shawnee County KS Single Family Mortgage Revenue Bonds (Morgage Backed Securities Program) Series B-3 (FHLMC/FNMA/GNMA) (NR/Aaa) | |
| 850,000 | | | 5.250 | | | 12/01/38 | | | 869,941 | |
| Shawnee County KS GO Bonds (Refunding & Improvement) (NR/Aa2) | |
| 500,000 | | | 3.000 | | | 09/01/11 | | | 504,200 | |
| 360,000 | | | 3.000 | | | 09/01/12 | | | 371,628 | |
| Shawnee County KS Unified School District No. 501 GO Bonds (NR/Aa2)(b) | |
| 500,000 | | | 5.000 | | | 02/01/12 | | | 517,510 | |
| Topeka KS GO Bonds (Refunding) Series B (NR/Aa2) | |
| 1,360,000 | | | 2.500 | | | 08/15/19 | | | 1,323,117 | |
| Topeka KS Public Building Commission Revenue Bonds (Refunding 10th & Jackson Project) Series A (NATL-RE) (AA/Baa1) | |
| 535,000 | | | 5.000 | | | 06/01/16 | | | 614,030 | |
| 1,000,000 | | | 5.000 | | | 06/01/23 | | | 1,111,580 | |
| Topeka KS Public Building Commission Revenue Bonds (Refunding Department of Social and Rehabilitation Project) Series B (NATL-RE) (AA/Baa1) | |
| 300,000 | | | 5.000 | | | 06/01/23 | | | 333,474 | |
| 475,000 | | | 5.000 | | | 06/01/24 | | | 523,892 | |
| Wichita KS Water & Sewer Utility Revenue Bonds Series 2003 (FGIC) (BBB/Aa2) | |
| 1,000,000 | | | 5.000 | | | 10/01/19 | | | 1,053,020 | |
| Wyandotte County Kansas City KS Unified Government Utility System Revenue Bonds Series A (BHAC) (AA+/Aa1) | |
| 1,000,000 | | | 5.000 | | | 09/01/24 | | | 1,088,280 | |
| Wyandotte County KS School District No. 204 GO Bonds Bonner Springs (Refunding & Improvement) Series A (FGIC) (NR/A1) | |
| 1,595,000 | | | 5.000 | | | 09/01/21 | | | 1,682,310 | |
| Wyandotte County KS School District No. 204 GO Bonds Bonner Springs (Unrefunded Balance) Series 2000 A (AGM) (NR/Aa3) | |
| 85,000 | | | 6.375 | | | 09/01/11 | | | 86,567 | |
| | |
| | | | | | | | | | |
Principal
Amount | | Interest
Rate | | | Maturity
Date | | Value | |
| Municipal Bond Obligations – (continued) | |
Kansas – (continued) | |
| Wyandotte County KS School District No. 500 GO Bonds (Refunding) (AA-/Aa2) | |
| $1,405,000 | | | 4.000 | % | | 09/01/20 | | $ | 1,555,869 | |
| Wyandotte County KS Unified School District No. 202 GO Bonds (Refunding) Series A (AMBAC) (A+/NR) | |
| 1,000,000 | | | 5.250 | | | 09/01/17 | | | 1,155,490 | |
| Wyandotte County KS Unified School District No. 500 GO Bonds (Refunding) (AGM) (AA+/Aa2) | |
| 160,000 | | | 5.000 | | | 09/01/12 | | | 169,870 | |
| | | | | | | | | | |
| | | | | | | | | 65,284,725 | |
| | |
Louisiana – 2.2% | |
| Louisiana Local Government Environmental Facilities & Community Development Authority Revenue Bonds (Woman’s Hospital Foundation) Series A (BBB+/A3) | |
| 2,000,000 | | | 5.500 | | | 10/01/25 | | | 1,957,100 | |
| | |
Massachusetts – 0.5% | |
| Massachusetts Educational Financing Authority Education Loan Revenue Bonds (Issue I) Series A (AA/NR) | |
| 480,000 | | | 5.300 | | | 01/01/30 | | | 474,365 | |
| | |
Ohio – 1.6% | |
| Ohio State Higher Educational Facility Revenue Bonds (Kenyon College Project) (A+/A1) | |
| 1,500,000 | | | 5.000 | | | 07/01/41 | | | 1,360,770 | |
| | |
Pennsylvania – 0.6% | |
| Delaware County Authority University Revenue Bonds for Neumann University (BBB/NR) | |
| 605,000 | | | 5.000 | | | 10/01/25 | | | 555,916 | |
| | |
Puerto Rico – 5.9% | |
| Puerto Rico Commonwealth GO Bonds (Refunding & Public Improvement) Series A (NATL-RE) (BBB/A3) | |
| 475,000 | | | 5.500 | | | 07/01/16 | | | 511,323 | |
| Puerto Rico Commonwealth Highway & Transportation Authority Highway Revenue Bonds (Refunding) Series X (AGM) (AA+/Aa3) | |
| 425,000 | | | 5.500 | | | 07/01/15 | | | 465,707 | |
| Puerto Rico Commonwealth Highway & Transportation Authority Highway Revenue Bonds Series Y (BBB+/A2) | |
| 500,000 | | | 6.250 | | | 07/01/13 | | | 537,935 | |
| Puerto Rico Commonwealth Highway & Transportation Authority Revenue Bonds (Unrefunded Balance) Series G (FGIC) (BBB/A3) | |
| 345,000 | | | 5.250 | | | 07/01/21 | | | 346,232 | |
| Puerto Rico Electric Power Authority Revenue Bonds (Refunding) Series ZZ (BBB+/A3) | |
| 1,275,000 | | | 5.000 | | | 07/01/21 | | | 1,303,126 | |
| Puerto Rico Electric Power Authority Revenue Bonds Series AAA (BBB+/A3) | |
| 1,000,000 | | | 5.250 | | | 07/01/21 | | | 1,036,720 | |
| | |
| | |
| The accompanying notes are an integral part of these financial statements. | | 39 |
COMMERCE KANSAS TAX-FREE INTERMEDIATE BOND FUND
Schedule of Investments (continued)
April 30, 2011 (Unaudited)
| | | | | | | | | | | | |
Principal
Amount | | Interest
Rate | | | Maturity
Date | | | Value | |
| Municipal Bond Obligations – (continued) | |
Puerto Rico – (continued) | |
| Puerto Rico Public Buildings Authority Revenue Bonds (Unrefunded Balance - Government Facilities) Series l (BBB/A3) | |
| $1,000,000 | | | 5.250 | % | | | 07/01/33 | | | $ | 909,780 | |
| | | | | | | | | | | | |
| | | | | | | | | | | 5,110,823 | |
| | |
South Carolina – 0.6% | |
| Kershaw County SC Public School Foundation Installment Power Revenue Bonds (School District Project) (CIFG) (BBB+/NR) | |
| 500,000 | | | 5.000 | | | | 12/01/28 | | | | 480,200 | |
| | |
Washington – 0.8% | |
| Washington State Health Care Facilities Authority Revenue Bonds (Overlake Hospital Medical Center) (A-/A3) | |
| 750,000 | | | 5.250 | | | | 07/01/25 | | | | 729,510 | |
| | |
| TOTAL INVESTMENTS – 98.9% | |
(Cost $84,682,607) | | | | | | | $ | 86,023,750 | |
| | |
OTHER ASSETS IN EXCESS OF LIABILITIES – 1.1% | | | | 912,889 | |
| | |
NET ASSETS – 100.0% | | | $ | 86,936,639 | |
| | |
| | |
| The percentage shown for each investment category reflects the value of investments in that category as a percentage of net assets. |
| (a) | | Issued with a zero coupon. Income is recognized through the accretion of discount. |
| (b) | | Prerefunded security. Maturity date disclosed is prerefunding date. |
| Security ratings disclosed, if any, are issued by Standard & Poor’s Ratings Services/Moody’s Investors Service and are unaudited. A description of the ratings is available in the Fund’s Statement of Additional Information. |
| |
| | |
|
| |
| Investment Abbreviations: |
| ADFA | | —Arkansas Development Finance Authority |
| AGM | | —Insured by Assured Guaranty Municipal Corp. |
| AMBAC | | —Insured by American Municipal Bond Assurance Corp. |
| BHAC | | —Berkshire Hathaway Assurance Corp. |
| CIFG | | —Insured by CIFG Assurance North America, Inc. |
| ETM | | —Escrow to Maturity |
| FGIC | | —Insured by Financial Guaranty Insurance Co. |
| FHLMC | | —Federal Home Loan Mortgage Corp. |
| FNMA | | —Federal National Mortgage Association |
| GNMA | | —Government National Mortgage Association |
| GO | | —General Obligation |
| GTD | | —Guaranteed |
| NATL-RE | | —Insured by National Reinsurance Corp. |
| NR | | —Not Rated |
| |
| | |
| 40 | | The accompanying notes are an integral part of these financial statements. |
COMMERCE KANSAS TAX-FREE INTERMEDIATE BOND FUND
PORTFOLIO COMPOSITION
| | | | | | | | |
| Sector Allocation | | AS OF
4/30/11 | | | AS OF
10/31/10 | |
| | |
General Obligations | | | 34.8 | % | | | 39.1 | % |
Education | | | 14.1 | | | | 8.2 | |
Lease | | | 13.4 | | | | 13.7 | |
Hospital | | | 11.3 | | | | 16.1 | |
General | | | 7.6 | | | | 3.3 | |
Prerefunded/Escrow to Maturity | | | 5.1 | | | | 4.9 | |
Transportation | | | 3.6 | | | | 3.3 | |
Water/Sewer | | | 3.1 | | | | 4.0 | |
Power | | | 2.7 | | | | 4.3 | |
Single Family Housing | | | 1.4 | | | | 1.9 | |
Crossover | | | 1.2 | | | | 0.0 | |
Student | | | 0.6 | | | | 0.0 | |
Short-term Investment | | | 0.0 | | | | 0.9 | |
| | |
| TOTAL INVESTMENTS | | | 98.9 | % | | | 99.7 | % |
| | |
The percentage shown for each investment category reflects the value of investments in that category as a percentage of net assets.
The Fund is actively managed and, as such its composition may differ over time.
| | |
| The accompanying notes are an integral part of these financial statements. | | 41 |
COMMERCE FUNDS
Statements of Assets and Liabilities
April 30, 2011 (Unaudited)
| | | | | | | | | | | | |
| | | Growth Fund | | | Value Fund | | | MidCap Growth Fund | |
Assets: | | | | | | | | | | | | |
Investments in securities, at value (identified cost $116,412,910, $52,528,975, $51,195,051, $597,135,695, $117,037,716, $172,163,744, $252,520,859 and $84,682,607, respectively) | | $ | 137,576,267 | | | $ | 57,291,307 | | | $ | 70,186,520 | |
Cash | | | 616 | | | | — | | | | 919 | |
Receivables: | | | | | | | | | | | | |
Interest and dividends | | | 55,982 | | | | 102,031 | | | | 19,698 | |
Fund shares sold | | | 75,856 | | | | 73,463 | | | | 1,046 | |
Reimbursement from adviser | | | 1,227 | | | | — | | | | — | |
Other assets | | | 12,182 | | | | 5,098 | | | | 6,192 | |
Total Assets | | | 137,722,130 | | | | 57,471,899 | | | | 70,214,375 | |
| | | |
| | | | | | | | | | | | |
Liabilities: | | | | | | | | | | | | |
Due to custodian | | | — | | | | — | | | | — | |
Payables: | | | | | | | | | | | | |
Investment securities purchased | | | — | | | | — | | | | — | |
Income distributions | | | — | | | | — | | | | — | |
Fund shares redeemed | | | 2,200 | | | | 33,919 | | | | 41,987 | |
Advisory fees | | | 83,096 | | | | 13,910 | | | | 42,577 | |
Deferred trustee fees | | | 46,862 | | | | 29,837 | | | | 20,209 | |
Administration fees | | | 16,619 | | | | 6,867 | | | | 8,515 | |
Accrued expenses | | | 66,976 | | | | 39,910 | | | | 55,775 | |
Total Liabilities | | | 215,753 | | | | 124,443 | | | | 169,063 | |
| | | |
| | | | | | | | | | | | |
Net Assets: | | | | | | | | | | | | |
Paid-in capital | | | 120,336,821 | | | | 63,125,574 | | | | 50,367,106 | |
Accumulated undistributed (distributions in excess of) net investment income (loss) | | | 588,868 | | | | 72,677 | | | | (66,083 | ) |
Accumulated net realized gain (loss) from investment transactions | | | (4,582,669 | ) | | | (10,613,127 | ) | | | 752,820 | |
Net unrealized gain on investments | | | 21,163,357 | | | | 4,762,332 | | | | 18,991,469 | |
Net Assets | | $ | 137,506,377 | | | $ | 57,347,456 | | | $ | 70,045,312 | |
| | | |
| | | | | | | | | | | | |
Shares Outstanding/Net Asset Value: | | | | | | | | | | | | |
Total shares outstanding, no par value (unlimited number of shares authorized): | | | 4,913,619 | | | | 2,569,389 | | | | 1,879,054 | |
Net asset value (net assets/shares outstanding) | | $ | 27.98 | | | $ | 22.32 | | | $ | 37.28 | |
| | |
| 42 | | The accompanying notes are an integral part of these financial statements. |
COMMERCE FUNDS
| | | | | | | | | | | | | | | | | | |
| Bond Fund | | | Short-Term
Government
Fund | | | National
Tax-Free
Intermediate
Bond Fund | | | Missouri
Tax-Free
Intermediate
Bond Fund | | | Kansas
Tax-Free
Intermediate
Bond Fund | |
| | | | | | | | | | | | | | | | | | |
| | | | |
| $ | 640,764,265 | | | $ | 121,307,972 | | | $ | 173,594,793 | | | $ | 257,030,146 | | | $ | 86,023,750 | |
| | 109,694 | | | | — | | | | 230 | | | | 532 | | | | — | |
| | | | | | | | | | | | | | | | | | |
| | 5,831,749 | | | | 730,913 | | | | 2,358,867 | | | | 3,363,230 | | | | 1,056,717 | |
| | 1,651,227 | | | | 311,604 | | | | 237,398 | | | | 998,383 | | | | 265,008 | |
| | — | | | | 22,291 | | | | 18,253 | | | | 33,655 | | | | 14,052 | |
| | 59,050 | | | | 11,636 | | | | 16,310 | | | | 23,681 | | | | 7,928 | |
| | 648,415,985 | | | | 122,384,416 | | | | 176,225,851 | | | | 261,449,627 | | | | 87,367,455 | |
| | | | |
| | | | | | | | | | | | | | | | | | |
| | | | | | | | | | | | | | | | | | |
| | — | | | | — | | | | — | | | | — | | | | 89,144 | |
| | | | | | | | | | | | | | | | | | |
| | 4,008,472 | | | | 320,081 | | | | — | | | | 2,239,032 | | | | — | |
| | 1,953,262 | | | | 212,308 | | | | 552,953 | | | | 671,688 | | | | 223,908 | |
| | 221,252 | | | | 181,168 | | | | 1,620,618 | | | | 32,600 | | | | 2,089 | |
| | 260,972 | | | | 50,075 | | | | 70,980 | | | | 104,636 | | | | 35,215 | |
| | 154,076 | | | | 42,184 | | | | 44,242 | | | | 48,414 | | | | 19,390 | |
| | 78,291 | | | | 15,023 | | | | 21,294 | | | | 31,391 | | | | 10,565 | |
| | 168,109 | | | | 62,677 | | | | 71,789 | | | | 75,572 | | | | 50,505 | |
| | 6,844,434 | | | | 883,516 | | | | 2,381,876 | | | | 3,203,333 | | | | 430,816 | |
| | | | |
| | | | | | | | | | | | | | | | | | |
| | | | | | | | | | | | | | | | | | |
| | 605,168,130 | | | | 131,627,566 | | | | 171,937,866 | | | | 253,177,418 | | | | 85,489,544 | |
| | (2,091,717 | ) | | | (1,004,626 | ) | | | 128,287 | | | | (80,581 | ) | | | (65,102 | ) |
| | (5,133,432 | ) | | | (13,392,296 | ) | | | 346,773 | | | | 640,170 | | | | 171,054 | |
| | 43,628,570 | | | | 4,270,256 | | | | 1,431,049 | | | | 4,509,287 | | | | 1,341,143 | |
| $ | 641,571,551 | | | $ | 121,500,900 | | | $ | 173,843,975 | | | $ | 258,246,294 | | | $ | 86,936,639 | |
| | | | |
| | | | | | | | | | | | | | | | | | |
| | | | | | | | | | | | | | | | | | |
| | 31,918,583 | | | | 6,664,942 | | | | 9,299,275 | | | | 13,442,145 | | | | 4,638,760 | |
| $ | 20.10 | | | $ | 18.23 | | | $ | 18.69 | | | $ | 19.21 | | | $ | 18.74 | |
| | |
| The accompanying notes are an integral part of these financial statements. | | 43 |
COMMERCE FUNDS
Statements of Operations
For the Six Months Ended April 30, 2011 (Unaudited)
| | | | | | | | | | | | |
| | | Growth Fund | | | Value Fund | | |
MidCap Growth Fund | |
Investment Income: | | | | | | | | | | | | |
Interest | | $ | — | | | $ | — | | | $ | — | |
Dividends | | | 1,003,519 | | | | 691,785 | | | | 338,731 | |
Total Investment Income | | | 1,003,519 | | | | 691,785 | | | | 338,731 | |
| | | |
| | | | | | | | | | | | |
Expenses: | | | | | | | | | | | | |
Advisory fees | | | 480,028 | | | | 153,909 | | | | 238,633 | |
Administration fees | | | 96,006 | | | | 38,933 | | | | 47,727 | |
Shareowner servicing fees | | | 68,329 | | | | 14,221 | | | | 26,720 | |
Transfer Agent fees | | | 39,910 | | | | 21,832 | | | | 27,175 | |
Professional fees | | | 20,467 | | | | 13,191 | | | | 14,048 | |
Custody and accounting fees | | | 11,306 | | | | 15,589 | | | | 12,628 | |
Registration fees | | | 10,838 | | | | 10,523 | | | | 10,261 | |
Trustee fees | | | 6,783 | | | | 2,531 | | | | 3,345 | |
Printing and mailing fees | | | 4,659 | | | | 2,801 | | | | 2,978 | |
Other | | | 8,991 | | | | 5,076 | | | | 5,040 | |
Total Expenses | | | 747,317 | | | | 278,606 | | | | 388,555 | |
Less — expense reimbursements | | | (24,075 | ) | | | (12,429 | ) | | | — | |
Net Expenses | | | 723,242 | | | | 266,177 | | | | 388,555 | |
| Net Investment Income (Loss) | | | 280,277 | | | | 425,608 | | | | (49,824 | ) |
| | | |
| | | | | | | | | | | | |
Realized and unrealized gain (loss) from investment transactions: | | | | | | | | | | | | |
Net realized gain from investment transactions | | | 6,027,253 | | | | 8,297,572 | | | | 2,464,810 | |
Net change in unrealized gain (loss) on investments | | | 10,141,837 | | | | 387,375 | | | | 8,558,288 | |
Net realized and unrealized gain (loss) from investment transactions | | | 16,169,090 | | | | 8,684,947 | | | | 11,023,098 | |
| NET INCREASE (DECREASE) IN NET ASSETS RESULTING FROM OPERATIONS | | $ | 16,449,367 | | | $ | 9,110,555 | | | $ | 10,973,274 | |
| | |
| 44 | | The accompanying notes are an integral part of these financial statements. |
COMMERCE FUNDS
| | | | | | | | | | | | | | | | | | |
| Bond Fund | | | Short-Term Government Fund | | | National Tax-Free Intermediate Bond Fund | | | Missouri Tax-Free Intermediate Bond Fund | | | Kansas Tax-Free Intermediate Bond Fund | |
| | | | | | |
| $ | 17,521,752 | | | $ | 1,719,008 | | | $ | 3,993,091 | | | $ | 5,475,635 | | | $ | 1,773,638 | |
| | 134,340 | | | | — | | | | — | | | | — | | | | — | |
| | 17,656,092 | | | | 1,719,008 | | | | 3,993,091 | | | | 5,475,635 | | | | 1,773,638 | |
| | | | |
| | | | | | | | | | | | | | | | | | |
| | | | | | |
| | 1,572,585 | | | | 309,597 | | | | 438,000 | | | | 629,649 | | | | 207,120 | |
| | 471,775 | | | | 92,880 | | | | 131,400 | | | | 188,895 | | | | 62,136 | |
| | 236,733 | | | | 46,200 | | | | 55,367 | | | | 91,757 | | | | 28,407 | |
| | 45,313 | | | | 23,915 | | | | 17,402 | | | | 27,809 | | | | 16,963 | |
| | 67,986 | | | | 19,317 | | | | 23,791 | | | | 30,087 | | | | 15,645 | |
| | 56,830 | | | | 22,086 | | | | 29,015 | | | | 36,786 | | | | 17,165 | |
| | 12,364 | | | | 10,846 | | | | 9,805 | | | | 5,991 | | | | 9,270 | |
| | 32,914 | | | | 6,762 | | | | 9,490 | | | | 13,593 | | | | 4,484 | |
| | 26,665 | | | | 6,255 | | | | 7,971 | | | | 10,546 | | | | 3,515 | |
| | 39,702 | | | | 9,565 | | | | 13,447 | | | | 17,729 | | | | 6,908 | |
| | 2,562,867 | | | | 547,423 | | | | 735,688 | | | | 1,052,842 | | | | 371,613 | |
| | — | | | | (126,412 | ) | | | (122,491 | ) | | | (171,345 | ) | | | (81,649 | ) |
| | 2,562,867 | | | | 421,011 | | | | 613,197 | | | | 881,497 | | | | 289,964 | |
| | 15,093,225 | | | | 1,297,997 | | | | 3,379,894 | | | | 4,594,138 | | | | 1,483,674 | |
| | | | |
| | | | | | | | | | | | | | | | | | |
| | | | | | |
| | 1,375,411 | | | | 48,001 | | | | 347,013 | | | | 640,716 | | | | 171,144 | |
| | (9,403,646 | ) | | | (1,277,216 | ) | | | (5,954,052 | ) | | | (6,749,910 | ) | | | (2,001,373 | ) |
| | (8,028,235 | ) | | | (1,229,215 | ) | | | (5,607,039 | ) | | | (6,109,194 | ) | | | (1,830,229 | ) |
| $ | 7,064,990 | | | $ | 68,782 | | | $ | (2,227,145 | ) | | $ | (1,515,056 | ) | | $ | (346,555 | ) |
| | |
| The accompanying notes are an integral part of these financial statements. | | 45 |
COMMERCE FUNDS
Statements of Changes in Net Assets
| | | | | | | | | | | | | | | | |
| | | Growth Fund | | | Value Fund | |
| | | For the Six
Months Ended
April 30, 2011
(Unaudited) | | | For the Fiscal
Year Ended
October 31, 2010 | | | For the Six
Months Ended
April 30, 2011
(Unaudited) | | | For the Fiscal
Year Ended
October 31, 2010 | |
From Operations: | | | | | | | | | | | | | | | | |
Net investment income (loss) | | $ | 280,277 | | | $ | 927,619 | | | $ | 425,608 | | | $ | 773,238 | |
Net realized gain (loss) from investment transactions | | | 6,027,253 | | | | 5,759,676 | | | | 8,297,572 | | | | (1,025,763 | ) |
Net change in unrealized gain (loss) on investments | | | 10,141,837 | | | | 11,679,609 | | | | 387,375 | | | | 8,277,144 | |
Net increase in net assets resulting from operations | | | 16,449,367 | | | | 18,366,904 | | | | 9,110,555 | | | | 8,024,619 | |
| | | | |
| | | | | | | | | | | | | | | | |
Distributions to Shareholders: | | | | | | | | | | | | | | | | |
From net investment income | | | (599,910 | ) | | | (550,888 | ) | | | (374,856 | ) | | | (790,500 | ) |
| | | | |
| | | | | | | | | | | | | | | | |
From Share Transactions: | | | | | | | | | | | | | | | | |
Proceeds from sales of shares | | | 14,311,496 | | | | 14,117,639 | | | | 6,194,111 | | | | 10,092,891 | |
Reinvestment of distributions | | | 243,853 | | | | 231,828 | | | | 77,581 | | | | 159,149 | |
Cost of shares redeemed | | | (12,465,467 | ) | | | (23,120,014 | ) | | | (7,591,554 | ) | | | (31,176,821 | ) |
Net increase (decrease) in net assets resulting from share transactions | | | 2,089,882 | | | | (8,770,547 | ) | | | (1,319,862 | ) | | | (20,924,781 | ) |
| TOTAL INCREASE (DECREASE) | | | 17,939,339 | | | | 9,045,469 | | | | 7,415,837 | | | | (13,690,662 | ) |
| | | | |
| | | | | | | | | | | | | | | | |
Net Assets: | | | | | | | | | | | | | | | | |
Beginning of period | | | 119,567,038 | | | | 110,521,569 | | | | 49,931,619 | | | | 63,622,281 | |
End of period | | $ | 137,506,377 | | | $ | 119,567,038 | | | $ | 57,347,456 | | | $ | 49,931,619 | |
Accumulated undistributed (distributions in excess of) net investment income | | $ | 588,868 | | | $ | 908,501 | | | $ | 72,677 | | | $ | 21,925 | |
| | |
| 46 | | The accompanying notes are an integral part of these financial statements. |
COMMERCE FUNDS
| | | | | | | | | | | | | | |
| MidCap Growth Fund | | | Bond Fund | |
For the Six
Months Ended
April 30, 2011
(Unaudited) | | | For the Fiscal
Year Ended
October 31, 2010 | | | For the Six
Months Ended
April 30, 2011
(Unaudited) | | | For the Fiscal
Year Ended
October 31, 2010 | |
| | | | | | | | | | | | | | |
| $ | (49,824 | ) | | $ | (122,286 | ) | | $ | 15,093,225 | | | $ | 28,995,274 | |
| | 2,464,810 | | | | 3,655,511 | | | | 1,375,411 | | | | 4,360,130 | |
| | 8,558,288 | | | | 9,862,640 | | | | (9,403,646 | ) | | | 33,158,157 | |
| | 10,973,274 | | | | 13,395,865 | | | | 7,064,990 | | | | 66,513,561 | |
| | | |
| | | | | | | | | | | | | | |
| | | | | | | | | | | | | | |
| | — | | | | (73,820 | ) | | | (14,993,557 | ) | | | (29,868,886 | ) |
| | | |
| | | | | | | | | | | | | | |
| | | | | | | | | | | | | | |
| | 10,477,610 | | | | 3,943,245 | | | | 74,531,765 | | | | 139,473,917 | |
| | — | | | | 17,725 | | | | 2,943,887 | | | | 5,321,497 | |
| | (4,785,755 | ) | | | (12,674,320 | ) | | | (76,670,312 | ) | | | (103,304,905 | ) |
| | 5,691,855 | | | | (8,713,350 | ) | | | 805,340 | | | | 41,490,509 | |
| | 16,665,129 | | | | 4,608,695 | | | | (7,123,227 | ) | | | 78,135,184 | |
| | | |
| | | | | | | | | | | | | | |
| | | | | | | | | | | | | | |
| | 53,380,183 | | | | 48,771,488 | | | | 648,694,778 | | | | 570,559,594 | |
| $ | 70,045,312 | | | $ | 53,380,183 | | | $ | 641,571,551 | | | $ | 648,694,778 | |
| $ | (66,083 | ) | | $ | (16,259 | ) | | $ | (2,091,717 | ) | | $ | (2,191,385 | ) |
| | |
| The accompanying notes are an integral part of these financial statements. | | 47 |
COMMERCE FUNDS
Statements of Changes in Net Assets (continued)
| | | | | | | | | | | | | | | | |
| | | Short-Term
Government Fund | | | National Tax-Free
Intermediate Bond Fund | |
| | | For the Six
Months Ended
April 30, 2011
(Unaudited) | | | For the Fiscal
Year Ended
October 31, 2010 | | | For the Six
Months Ended April 30, 2011
(Unaudited) | | | For the Fiscal
Year Ended
October 31, 2010 | |
From Operations: | | | | | | | | | | | | | | | | |
Net investment income | | $ | 1,297,997 | | | $ | 3,167,816 | | | $ | 3,379,894 | | | $ | 6,281,136 | |
Net realized gain from investment transactions | | | 48,001 | | | | 61,822 | | | | 347,013 | | | | 2,425,189 | |
Net change in unrealized gain (loss) on investments | | | (1,277,216 | ) | | | 2,783,401 | | | | (5,954,052 | ) | | | 4,152,801 | |
Net increase (decrease) in net assets from operations | | | 68,782 | | | | 6,013,039 | | | | (2,227,145 | ) | | | 12,859,126 | |
| | | | |
| | | | | | | | | | | | | | | | |
Distributions to Shareholders: | | | | | | | | | | | | | | | | |
From net investment income | | | (1,819,822 | ) | | | (3,849,938 | ) | | | (3,391,450 | ) | | | (6,266,632 | ) |
From net realized gains | | | — | | | | — | | | | (2,394,933 | ) | | | (422,586 | ) |
Total distributions to shareholders | | | (1,819,822 | ) | | | (3,849,938 | ) | | | (5,786,383 | ) | | | (6,689,218 | ) |
| | | | |
| | | | | | | | | | | | | | | | |
From Share Transactions: | | | | | | | | | | | | | | | | |
Proceeds from sales of shares | | | 18,899,084 | | | | 64,398,029 | | | | 16,374,672 | | | | 46,150,365 | |
Reinvestment of distributions | | | 571,713 | | | | 1,160,258 | | | | 536,769 | | | | 222,529 | |
Cost of shares redeemed | | | (29,241,142 | ) | | | (40,679,699 | ) | | | (26,951,287 | ) | | | (24,523,400 | ) |
Net increase (decrease) in net assets resulting from share transactions | | | (9,770,345 | ) | | | 24,878,588 | | | | (10,039,846 | ) | | | 21,849,494 | |
| TOTAL INCREASE (DECREASE) | | | (11,521,385 | ) | | | 27,041,689 | | | | (18,053,374 | ) | | | 28,019,402 | |
| | | | |
| | | | | | | | | | | | | | | | |
Net Assets: | | | | | | | | | | | | | | | | |
Beginning of period | | | 133,022,285 | | | | 105,980,596 | | | | 191,897,349 | | | | 163,877,947 | |
End of period | | $ | 121,500,900 | | | $ | 133,022,285 | | | $ | 173,843,975 | | | $ | 191,897,349 | |
Accumulated undistributed (distributions in excess of) net investment income | | $ | (1,004,626 | ) | | $ | (482,801 | ) | | $ | 128,287 | | | $ | 139,843 | |
| | |
| 48 | | The accompanying notes are an integral part of these financial statements. |
COMMERCE FUNDS
| | | | | | | | | | | | | | |
Missouri Tax-Free
Intermediate Bond Fund | | | Kansas Tax-Free
Intermediate Bond Fund | |
For the Six
Months Ended
April 30, 2011
(Unaudited) | | | For the Fiscal
Year Ended
October 31, 2010 | | | For the Six
Months Ended
April 30, 2011
(Unaudited) | | | For the Fiscal
Year Ended
October 31, 2010 | |
| | | | | | | | | | | | | | |
| $ | 4,594,138 | | | $ | 8,420,634 | | | $ | 1,483,674 | | | $ | 2,646,896 | |
| | 640,716 | | | | 507,154 | | | | 171,144 | | | | 654,148 | |
| | (6,749,910 | ) | | | 4,912,633 | | | | (2,001,373 | ) | | | 727,425 | |
| | (1,515,056 | ) | | | 13,840,421 | | | | (346,555 | ) | | | 4,028,469 | |
| | | |
| | | | | | | | | | | | | | |
| | | | | | | | | | | | | | |
| | (4,584,144 | ) | | | (8,414,142 | ) | | | (1,484,513 | ) | | | (2,647,292 | ) |
| | (521,922 | ) | | | (336,038 | ) | | | (653,556 | ) | | | (242,550 | ) |
| | (5,106,066 | ) | | | (8,750,180 | ) | | | (2,138,069 | ) | | | (2,889,842 | ) |
| | | |
| | | | | | | | | | | | | | |
| | | | | | | | | | | | | | |
| | 34,554,702 | | | | 80,752,601 | | | | 13,050,603 | | | | 21,235,888 | |
| | 657,246 | | | | 913,400 | | | | 335,278 | | | | 303,525 | |
| | (36,142,532 | ) | | | (50,644,920 | ) | | | (8,031,547 | ) | | | (14,488,676 | ) |
| | (930,584 | ) | | | 31,021,081 | | | | 5,354,334 | | | | 7,050,737 | |
| | (7,551,706 | ) | | | 36,111,322 | | | | 2,869,710 | | | | 8,189,364 | |
| | | |
| | | | | | | | | | | | | | |
| | | | | | | | | | | | | | |
| | 265,798,000 | | | | 229,686,678 | | | | 84,066,929 | | | | 75,877,565 | |
| $ | 258,246,294 | | | $ | 265,798,000 | | | $ | 86,936,639 | | | $ | 84,066,929 | |
| $ | (80,581 | ) | | $ | (90,575 | ) | | $ | (65,102 | ) | | $ | (64,263 | ) |
| | |
| The accompanying notes are an integral part of these financial statements. | | 49 |
COMMERCE FUNDS
Financial Highlights
Selected Data for a Share Outstanding Throughout Each Period
| | | | | | | | | | | | | | | | | | | | | | | | | | | | |
| | | | | | Income (loss) from
investment operations | | | Distributions
to shareholders | |
| Year | | Net asset
value,
beginning
of period | | | Net
investment
income(a) | | | Net realized
and unrealized
gain (loss) | | | Total from
investment
operations | | | From net
investment
income | | | From net
realized
gains | | | Total
distributions | |
GROWTH FUND | | | | | | | | | | | | | | | | | | | | | | | | | | | | |
For the Six Months Ended April 30, (Unaudited) | | | | | | | | | | | | | | | | | | | | | | | | | |
2011 | | $ | 24.73 | | | $ | 0.06 | (c) | | $ | 3.31 | | | $ | 3.37 | | | $ | (0.12 | ) | | $ | — | | | $ | (0.12 | ) |
For the Fiscal Years Ended October 31, | | | | | | | | | | | | | | | | | | | | | | | | | |
2010 | | | 21.24 | | | | 0.19 | (c) | | | 3.41 | | | | 3.60 | | | | (0.11 | ) | | | — | | | | (0.11 | ) |
2009(e) | | | 18.44 | | | | 0.10 | | | | 2.75 | | | | 2.85 | | | | (0.05 | ) | | | — | | | | (0.05 | ) |
2008 | | | 29.11 | | | | 0.05 | | | | (10.39 | ) | | | (10.34 | ) | | | (0.04 | ) | | | (0.29 | ) | | | (0.33 | ) |
2007 | | | 25.56 | | | | 0.04 | | | | 3.55 | | | | 3.59 | | | | (0.04 | ) | | | — | | | | (0.04 | ) |
2006(f) | | | 22.56 | | | | 0.04 | | | | 3.08 | | | | 3.12 | | | | (0.12 | ) | | | — | | | | (0.12 | ) |
| | | | | | | | | | | | | | | | | | | | | | | | | | | | |
VALUE FUND | | | | | | | | | | | | | | | | | | | | | | | | | | | | |
For the Six Months Ended April 30, (Unaudited) | | | | | | | | | | | | | | | | | | | | | | | | | |
2011 | | $ | 18.91 | | | $ | 0.17 | | | $ | 3.39 | | | $ | 3.56 | | | $ | (0.15 | ) | | $ | — | | | $ | (0.15 | ) |
For the Fiscal Years Ended October 31, | | | | | | | | | | | | | | | | | | | | | | | | | | | | |
2010 | | | 16.81 | | | | 0.22 | | | | 2.10 | | | | 2.32 | | | | (0.22 | ) | | | — | | | | (0.22 | ) |
2009(e) | | | 16.31 | | | | 0.30 | | | | 0.50 | | | | 0.80 | | | | (0.30 | ) | | | — | | | | (0.30 | ) |
2008 | | | 29.02 | | | | 0.39 | | | | (9.84 | ) | | | (9.45 | ) | | | (0.39 | ) | | | (2.87 | ) | | | (3.26 | ) |
2007 | | | 29.53 | | | | 0.36 | | | | 1.90 | | | | 2.26 | | | | (0.36 | ) | | | (2.41 | ) | | | (2.77 | ) |
2006(f) | | | 24.96 | | | | 0.35 | | | | 4.66 | | | | 5.01 | | | | (0.34 | ) | | | (0.10 | ) | | | (0.44 | ) |
| (a) | | Calculated based on the average shares outstanding methodology. |
| (b) | | Assumes investment at the net asset value at the beginning of the period, reinvestment of all dividends and distributions, a complete redemption of the investment at the net asset value at the end of the period and no sales or redemption charges. Total return would be reduced if a sales or redemption charge was taken into account. Returns do not reflect the deduction of taxes that a shareholder would pay on Fund distributions or the redemption of Fund shares. |
| (c) | | Reflects income recognized from a special dividend which amounted to $0.02 and $0.13 per share and 0.16% and 0.56% of average net assets for the six months ended April 30, 2011 and the fiscal year ended October 31, 2010. |
| (e) | | On February 10, 2009, all outstanding Institutional Shares were redesignated as Shares. |
| (f) | | On February 3, 2006, all outstanding Service Shares were converted into Institutional Shares. |
| | |
| 50 | | The accompanying notes are an integral part of these financial statements. |
COMMERCE FUNDS
| | | | | | | | | | | | | | | | | | | | | | | | |
| | | | | | |
Net asset
value, end
of period | | Total
return(b) | | | Net assets
at end of
period
(in 000s) | | | Ratio of
net expenses to
average net assets | | | Ratio of total
expenses to
average net assets | | | Ratio of
net investment
income to
average net assets | | | Portfolio
turnover
rate | |
| | | | | | | | | | | | | | | | | | | | | | | | |
| | | | | | | | | | | | | | | | | | | | | | | | |
| $27.98 | | | 13.68 | % | | $ | 137,506 | | | | 1.13 | %(d) | | | 1.17 | %(d) | | | 0.44 | %(c)(d) | | | 26 | % |
| | | | | | | | | | | | | | | | | | | | | | | | |
| 24.73 | | | 16.98 | | | | 119,567 | | | | 1.13 | | | | 1.24 | | | | 0.82 | (c) | | | 46 | |
| 21.24 | | | 15.55 | | | | 110,522 | | | | 1.13 | | | | 1.20 | | | | 0.52 | | | | 39 | |
| 18.44 | | | (35.82 | ) | | | 111,319 | | | | 1.11 | | | | 1.11 | | | | 0.18 | | | | 43 | |
| 29.11 | | | 14.04 | | | | 223,441 | | | | 1.13 | | | | 1.14 | | | | 0.15 | | | | 70 | |
| 25.56 | | | 13.86 | | | | 173,813 | | | | 1.13 | | | | 1.18 | | | | 0.16 | | | | 47 | |
| | | | | | | | | | | | | | | | | | | | | | | | |
| | | | | | | | | | | | | | | | | | | | | | | | |
| | | | | | | | | | | | | | | | | | | | | | | | |
| $22.32 | | | 18.88 | % | | $ | 57,347 | | | | 1.03 | %(d) | | | 1.07 | %(d) | | | 1.64 | %(d) | | | 66 | % |
| | | | | | | | | | | | | | | | | | | | | | | | |
| 18.91 | | | 13.88 | | | | 49,932 | | | | 1.20 | | | | 1.26 | | | | 1.24 | | | | 47 | |
| 16.81 | | | 5.19 | | | | 63,622 | | | | 1.20 | | | | 1.22 | | | | 1.98 | | | | 61 | |
| 16.31 | | | (36.04 | ) | | | 64,726 | | | | 1.14 | | | | 1.14 | | | | 1.74 | | | | 45 | |
| 29.02 | | | 8.11 | | | | 141,455 | | | | 1.13 | | | | 1.13 | | | | 1.25 | | | | 55 | |
| 29.53 | | | 20.29 | | | | 120,685 | | | | 1.18 | | | | 1.18 | | | | 1.28 | | | | 49 | |
| | |
| The accompanying notes are an integral part of these financial statements. | | 51 |
COMMERCE FUNDS
Financial Highlights
Selected Data for a Share Outstanding Throughout Each Period
| | | | | | | | | | | | | | | | | | | | | | | | | | | | |
| | | | | | Income (loss) from
investment operations | | | Distributions
to shareholders | |
| Year | | Net asset
value,
beginning
of period | | | Net
investment
income
(loss)(a) | | | Net realized
and unrealized
gain (loss) | | | Total from
investment
operations | | | From net
investment
income | | | From net
realized
gains | | | Total
distributions | |
MIDCAP GROWTH FUND | | | | | | | | | | | | | | | | | | | | | | | | | | | | |
For the Six Months Ended April 30, (Unaudited) | | | | | | | | | | | | | | | | | | | | | | | | | |
2011 | | $ | 31.24 | | | $ | (0.03 | )(c) | | $ | 6.07 | | | $ | 6.04 | | | $ | — | | | $ | — | | | $ | — | |
For the Fiscal Years Ended October 31, | | | | | | | | | | | | | | | | | | | | | | | | | | | | |
2010 | | | 24.06 | | | | (0.07 | ) | | | 7.29 | | | | 7.22 | | | | (0.04 | ) | | | — | | | | (0.04 | ) |
2009(e) | | | 21.13 | | | | 0.02 | | | | 3.81 | | | | 3.83 | | | | (0.01 | ) | | | (0.89 | ) | | | (0.90 | ) |
2008 | | | 37.60 | | | | 0.01 | | | | (13.72 | ) | | | (13.71 | ) | | | — | | | | (2.76 | ) | | | (2.76 | ) |
2007 | | | 33.61 | | | | (0.11 | ) | | | 4.14 | | | | 4.03 | | | | — | | | | (0.04 | ) | | | (0.04 | ) |
2006(f) | | | 28.45 | | | | (0.11 | ) | | | 5.27 | | | | 5.16 | | | | — | | | | — | | | | — | |
| | | | | | | | | | | | | | | | | | | | | | | | | | | | |
BOND FUND | | | | | | | | | | | | | | | | | | | | | | | | | | | | |
For the Six Months Ended April 30, (Unaudited) | | | | | | | | | | | | | | | | | | | | | | | | | |
2011 | | $ | 20.35 | | | $ | 0.48 | | | $ | (0.26 | ) | | $ | 0.22 | | | $ | (0.47 | ) | | $ | — | | | $ | (0.47 | ) |
For the Fiscal Years Ended October 31, | | | | | | | | | | | | | | | | | | | | | | | | | | | | |
2010 | | | 19.17 | | | | 0.93 | | | | 1.21 | | | | 2.14 | | | | (0.96 | ) | | | — | | | | (0.96 | ) |
2009(e) | | | 17.29 | | | | 0.96 | | | | 1.91 | | | | 2.87 | | | | (0.99 | ) | | | — | | | | (0.99 | ) |
2008 | | | 18.39 | | | | 0.85 | | | | (1.07 | ) | | | (0.22 | ) | | | (0.88 | ) | | | — | | | | (0.88 | ) |
2007 | | | 18.12 | | | | 0.82 | | | | 0.31 | (g) | | | 1.13 | | | | (0.86 | ) | | | — | | | | (0.86 | ) |
2006(f) | | | 18.12 | | | | 0.78 | | | | 0.06 | | | | 0.84 | | | | (0.84 | ) | | | — | | | | (0.84 | ) |
| (a) | | Calculated based on the average shares outstanding methodology. |
| (b) | | Assumes investment at the net asset value at the beginning of the period, reinvestment of all dividends and distributions, a complete redemption of the investment at the net asset value at the end of the period and no sales or redemption charges. Total return would be reduced if a sales or redemption charge was taken into account. Returns do not reflect the deduction of taxes that a shareholder would pay on Fund distributions or the redemption of Fund shares. Total returns for periods less than one full year are not annualized. |
| (c) | | Reflects income recognized from non-recurring special dividends which amounted to $0.04 per share and 0.21% of average net assets. |
| (e) | | On February 10, 2009, all outstanding Institutional Shares were redesignated as Shares. |
| (f) | | On February 3, 2006, all outstanding Service Shares were converted into Institutional Shares. |
| (g) | | Reflects an increase of $0.19 per share and 1.06% of average net assets due in payments received for class action settlements received. |
| (h) | | Total return reflects the impact of payments received for class action settlements received. Excluding such payments, the total return would have been 5.31%. |
| | |
| 52 | | The accompanying notes are an integral part of these financial statements. |
COMMERCE FUNDS
| | | | | | | | | | | | | | | | | | | | | | | | |
| | | | | | |
Net asset
value, end
of period | | Total
return(b) | | | Net assets
at end of
period
(in 000s) | | | Ratio of
net expenses to
average net assets | | | Ratio of
total expenses to
average net assets | | | Ratio of
net investment
income (loss) to
average net assets | | | Portfolio
turnover
rate | |
| | | | | | | | | | | | | | | | | | | | | | | | |
| | | | | | | | | | | | | | | | | | | | | | | | |
| $37.28 | | | 19.33 | % | | $ | 70,045 | | | | 1.22 | %(d) | | | 1.22 | %(d) | | | (0.16 | )%(c)(d) | | | 17 | % |
| | | | | | | | | | | | | | | | | | | | | | | | |
| 31.24 | | | 30.08 | | | | 53,380 | | | | 1.33 | | | | 1.33 | | | | (0.24 | ) | | | 45 | |
| 24.06 | | | 19.76 | | | | 48,771 | | | | 1.33 | | | | 1.33 | | | | 0.12 | | | | 58 | |
| 21.13 | | | (39.07 | ) | | | 40,444 | | | | 1.21 | | | | 1.21 | | | | 0.02 | | | | 57 | |
| 37.60 | | | 12.01 | | | | 100,357 | | | | 1.18 | | | | 1.18 | | | | (0.32 | ) | | | 65 | |
| 33.61 | | | 18.14 | | | | 91,874 | | | | 1.22 | | | | 1.22 | | | | (0.35 | ) | | | 64 | |
| | | | | | | | | | | | | | | | | | | | | | | | |
| | | | | | | | | | | | | | | | | | | | | | | | |
| | | | | | | | | | | | | | | | | | | | | | | | |
| $20.10 | | | 1.13 | % | | $ | 641,572 | | | | 0.81 | %(d) | | | 0.81 | %(d) | | | 4.80 | %(d) | | | 15 | % |
| | | | | | | | | | | | | | | | | | | | | | | | |
| 20.35 | | | 11.46 | | | | 648,695 | | | | 0.83 | | | | 0.83 | | | | 4.75 | | | | 26 | |
| 19.17 | | | 17.00 | | | | 570,560 | | | | 0.81 | | | | 0.81 | | | | 5.23 | | | | 22 | |
| 17.29 | | | (1.37 | ) | | | 495,168 | | | | 0.79 | | | | 0.79 | | | | 4.62 | | | | 9 | |
| 18.39 | | | 6.37 | (h) | | | 537,430 | | | | 0.82 | | | | 0.82 | | | | 4.50 | | | | 23 | |
| 18.12 | | | 4.76 | | | | 548,713 | | | | 0.85 | | | | 0.85 | | | | 4.35 | | | | 38 | |
| | |
| The accompanying notes are an integral part of these financial statements. | | 53 |
COMMERCE FUNDS
Financial Highlights
Selected Data for a Share Outstanding Throughout Each Period
| | | | | | | | | | | | | | | | | | | | | | | | | | | | |
| | | | | | Income (loss) from
investment operations | | | Distributions
to shareholders | |
| Year | | Net asset
value,
beginning
of period | | | Net
investment
income(a) | | | Net realized
and unrealized
gain (loss) | | | Total from
investment
operations | | | From net
investment
income | | | From net
realized gains | | | Total
distributions | |
SHORT TERM GOVERNMENT FUND | | | | | | | | | | | | | | | | | | | | | | | | | | | | |
For the Six Months Ended April 30, (Unaudited) | | | | | | | | | | | | | | | | | | | | | | | | | |
2011 | | $ | 18.48 | | | $ | 0.19 | | | $ | (0.17 | ) | | $ | 0.02 | | | $ | (0.27 | ) | | $ | — | | | $ | (0.27 | ) |
For the Fiscal Years Ended October 31, | | | | | | | | | | | | | | | | | | | | | | | | | | | | |
2010 | | | 18.16 | | | | 0.48 | | | | 0.42 | | | | 0.90 | | | | (0.58 | ) | | | — | | | | (0.58 | ) |
2009(d) | | | 17.53 | | | | 0.56 | | | | 0.79 | | | | 1.35 | | | | (0.72 | ) | | | — | | | | (0.72 | ) |
2008 | | | 17.65 | | | | 0.66 | | | | (0.03 | ) | | | 0.63 | | | | (0.75 | ) | | | — | | | | (0.75 | ) |
2007 | | | 17.56 | | | | 0.69 | | | | 0.16 | | | | 0.85 | | | | (0.76 | ) | | | — | | | | (0.76 | ) |
2006(e) | | | 17.57 | | | | 0.61 | | | | 0.11 | | | | 0.72 | | | | (0.73 | ) | | | — | | | | (0.73 | ) |
| | | | | �� | | | | | | | | | | | | | | | | | | | | | | | |
NATIONAL TAX-FREE INTERMEDIATE BOND FUND | | | | | | | | | | | | | | | | | | | | | |
For the Six Months Ended April 30, (Unaudited) | | | | | | | | | | | | | | | | | | | | | | | | | |
2011 | | $ | 19.50 | | | $ | 0.36 | | | $ | (0.57 | ) | | $ | (0.21 | ) | | $ | (0.36 | ) | | $ | (0.24 | ) | | $ | (0.60 | ) |
For the Fiscal Years Ended October 31, | | | | | | | | | | | | | | | | | | | | | | | | | |
2010 | | | 18.84 | | | | 0.67 | | | | 0.71 | | | | 1.38 | | | | (0.67 | ) | | | (0.05 | ) | | | (0.72 | ) |
2009(d) | | | 17.82 | | | | 0.70 | | | | 1.20 | | | | 1.90 | | | | (0.70 | ) | | | (0.18 | ) | | | (0.88 | ) |
2008 | | | 18.83 | | | | 0.70 | | | | (0.96 | ) | | | (0.26 | ) | | | (0.70 | ) | | | (0.05 | ) | | | (0.75 | ) |
2007 | | | 19.07 | | | | 0.71 | | | | (0.19 | ) | | | 0.52 | | | | (0.71 | ) | | | (0.05 | ) | | | (0.76 | ) |
2006(e) | | | 19.05 | | | | 0.72 | | | | 0.13 | | | | 0.85 | | | | (0.73 | ) | | | (0.10 | ) | | | (0.83 | ) |
| (a) | | Calculated based on the average shares outstanding methodology. |
| (b) | | Assumes investment at the net asset value at the beginning of the period, reinvestment of all dividends and distributions, a complete redemption of the investment at the net asset value at the end of the period and no sales or redemption charges. Total return would be reduced if a sales or redemption charge was taken into account. Returns do not reflect the deduction of taxes that a shareholder would pay on Fund distributions or the redemption of Fund shares. Total returns for periods less than one full year are not annualized. |
| (d) | | On February 10, 2009, all outstanding Institutional Shares were redesignated as Shares. |
| (e) | | On February 3, 2006, all outstanding Service Shares were converted into Institutional Shares. |
| | |
| 54 | | The accompanying notes are an integral part of these financial statements. |
COMMERCE FUNDS
| | | | | | | | | | | | | | | | | | | | | | | | |
| | | | | | |
Net asset
value, end
of period | | Total
return(b) | | | Net assets
at end of
period
(in 000s) | | | Ratio of
net expenses to
average net assets | | | Ratio of total
expenses to
average net assets | | | Ratio of
net investment
income to
average net assets | | | Portfolio
turnover
rate | |
| | | | | | | | | | | | | | | | | | | | | | | | |
| | | | | | | | | | | | | | | | | | | | | | | | |
| $18.23 | | | 0.10 | % | | $ | 121,501 | | | | 0.68 | %(c) | | | 0.88 | %(c) | | | 2.10 | %(c) | | | 9 | % |
| | | | | | | | | | | | | | | | | | | | | | | | |
| 18.48 | | | 5.04 | | | | 133,022 | | | | 0.68 | | | | 0.89 | | | | 2.60 | | | | 28 | |
| 18.16 | | | 7.85 | | | | 105,981 | | | | 0.68 | | | | 0.93 | | | | 3.14 | | | | 25 | |
| 17.53 | | | 3.60 | | | | 78,455 | | | | 0.68 | | | | 0.90 | | | | 3.68 | | | | 30 | |
| 17.65 | | | 4.97 | | | | 87,511 | | | | 0.68 | | | | 0.90 | | | | 3.91 | | | | 15 | |
| 17.56 | | | 4.21 | | | | 129,940 | | | | 0.68 | | | | 0.89 | | | | 3.49 | | | | 28 | |
| | | | | | | | | | | | | | | | | | | | | | | | |
| | | | | | | | | | | | | | | | | | | | | | | | |
| | | | | | | | | | | | | | | | | | | | | | | | |
| $18.69 | | | (1.03 | )% | | $ | 173,844 | | | | 0.70 | %(c) | | | 0.84 | %(c) | | | 3.86 | %(c) | | | 22 | % |
| | | | | | | | | | | | | | | | | | | | | | | | |
| 19.50 | | | 7.43 | | | | 191,897 | | | | 0.70 | | | | 0.86 | | | | 3.49 | | | | 46 | |
| 18.84 | | | 10.89 | | | | 163,878 | | | | 0.70 | | | | 0.85 | | | | 3.77 | | | | 27 | |
| 17.82 | | | (1.47 | ) | | | 136,575 | | | | 0.70 | | | | 0.82 | | | | 3.76 | | | | 45 | |
| 18.83 | | | 2.81 | | | | 145,265 | | | | 0.70 | | | | 0.83 | | | | 3.78 | | | | 42 | |
| 19.07 | | | 4.57 | | | | 154,304 | | | | 0.70 | | | | 0.88 | | | | 3.80 | | | | 42 | |
| | |
| The accompanying notes are an integral part of these financial statements. | | 55 |
COMMERCE FUNDS
Financial Highlights
Selected Data for a Share Outstanding Throughout Each Period
| | | | | | | | | | | | | | | | | | | | | | | | | | | | |
| | | | | | Income (loss) from
investment operations | | | Distributions
to shareholders | |
| Year | | Net asset
value,
beginning
of period | | | Net
investment
income(a) | | | Net realized
and unrealized
gain (loss) | | | Total from
investment
operations | | | From net
investment
income | | | From net
realized
gains | | | Total
distributions | |
MISSOURI TAX-FREE INTERMEDIATE BOND FUND | | | | | | | | | | | | | | | | | | | | | |
For the Six Months Ended April 30, (Unaudited) | | | | | | | | | | | | | | | | | | | | | | | | | |
2011 | | $ | 19.70 | | | $ | 0.35 | | | $ | (0.46 | ) | | $ | (0.11 | ) | | $ | (0.34 | ) | | $ | (0.04 | ) | | $ | (0.38 | ) |
For the Fiscal Years Ended October 31, | | | | | | | | | | | | | | | | | | | | | | | | | |
2010 | | | 19.30 | | | | 0.66 | | | | 0.43 | | | | 1.09 | | | | (0.66 | ) | | | (0.03 | ) | | | (0.69 | ) |
2009(d) | | | 18.27 | | | | 0.67 | | | | 1.05 | | | | 1.72 | | | | (0.67 | ) | | | (0.02 | ) | | | (0.69 | ) |
2008 | | | 19.01 | | | | 0.69 | | | | (0.66 | ) | | | 0.03 | | | | (0.69 | ) | | | (0.08 | ) | | | (0.77 | ) |
2007 | | | 19.22 | | | | 0.71 | | | | (0.19 | ) | | | 0.52 | | | | (0.71 | ) | | | (0.02 | ) | | | (0.73 | ) |
2006(e) | | | 19.19 | | | | 0.74 | | | | 0.10 | | | | 0.84 | | | | (0.75 | ) | | | (0.06 | ) | | | (0.81 | ) |
| | | | | | | | | | | | | | | | | | | | | | | | | | | | |
KANSAS TAX-FREE INTERMEDIATE BOND FUND | | | | | | | | | | | | | | | | | | | | | |
For the Six Months Ended April 30, (Unaudited) | | | | | | | | | | | | | | | | | | | | | | | | | |
2011 | | $ | 19.32 | | | $ | 0.33 | | | $ | (0.43 | ) | | $ | (0.10 | ) | | $ | (0.33 | ) | | $ | (0.15 | ) | | $ | (0.48 | ) |
For the Fiscal Years Ended October 31, | | | | | | | | | | | | | | | | | | | | | | | | | |
2010 | | | 19.05 | | | | 0.63 | | | | 0.33 | | | | 0.96 | | | | (0.63 | ) | | | (0.06 | ) | | | (0.69 | ) |
2009(d) | | | 17.90 | | | | 0.63 | | | | 1.20 | | | | 1.83 | | | | (0.64 | ) | | | (0.04 | ) | | | (0.68 | ) |
2008 | | | 18.58 | | | | 0.64 | | | | (0.63 | ) | | | 0.01 | | | | (0.64 | ) | | | (0.05 | ) | | | (0.69 | ) |
2007 | | | 18.78 | | | | 0.66 | | | | (0.14 | ) | | | 0.52 | | | | (0.66 | ) | | | (0.06 | ) | | | (0.72 | ) |
2006(e) | | | 18.75 | | | | 0.70 | | | | 0.08 | | | | 0.78 | | | | (0.70 | ) | | | (0.05 | ) | | | (0.75 | ) |
| (a) | | Calculated based on the average shares outstanding methodology. |
| (b) | | Assumes investment at the net asset value at the beginning of the period, reinvestment of all dividends and distributions, a complete redemption of the investment at the net asset value at the end of the period and no sales or redemption charges. Total return would be reduced if a sales or redemption charge was taken into account. Returns do not reflect the deduction of taxes that a shareholder would pay on Fund distributions or the redemption of Fund shares. Total returns for periods less than one full year are not annualized. |
| (d) | | On February 10, 2009, all outstanding Institutional Shares were redesignated as Shares. |
| (e) | | On February 3, 2006, all outstanding Service Shares were converted into Institutional Shares. |
| | |
| 56 | | The accompanying notes are an integral part of these financial statements. |
COMMERCE FUNDS
| | | | | | | | | | | | | | | | | | | | | | | | |
| | | | | | |
Net asset
value, end
of period | | Total
return(b) | | | Net assets
at end of
period
(in 000s) | | | Ratio of
net expenses to
average net assets | | | Ratio of total
expenses to
average net assets | | | Ratio of
net investment
income to
average net assets | | | Portfolio
turnover
rate | |
| | | | | | | | | | | | | | | | | | | | | | | | |
| | | | | | | | | | | | | | | | | | | | | | | | |
| $19.21 | | | (0.51 | )% | | $ | 258,246 | | | | 0.70 | %(c) | | | 0.84 | %(c) | | | 3.65 | %(c) | | | 8 | % |
| | | | | | | | | | | | | | | | | | | | | | | | |
| 19.70 | | | 5.72 | | | | 265,798 | | | | 0.70 | | | | 0.84 | | | | 3.37 | | | | 19 | |
| 19.30 | | | 9.54 | | | | 229,687 | | | | 0.70 | | | | 0.83 | | | | 3.50 | | | | 10 | |
| 18.27 | | | 0.10 | | | | 169,838 | | | | 0.70 | | | | 0.81 | | | | 3.63 | | | | 7 | |
| 19.01 | | | 2.77 | | | | 148,824 | | | | 0.68 | | | | 0.82 | | | | 3.74 | | | | 21 | |
| 19.22 | | | 4.48 | | | | 159,628 | | | | 0.65 | | | | 0.88 | | | | 3.87 | | | | 15 | |
| | | | | | | | | | | | | | | | | | | | | | | | |
| | | | | | | | | | | | | | | | | | | | | | | | |
| | | | | | | | | | | | | | | | | | | | | | | | |
| $18.74 | | | (0.49 | )% | | $ | 86,937 | | | | 0.70 | %(c) | | | 0.90 | %(c) | | | 3.58 | %(c) | | | 12 | % |
| | | | | | | | | | | | | | | | | | | | | | | | |
| 19.32 | | | 5.15 | | | | 84,067 | | | | 0.70 | | | | 0.94 | | | | 3.31 | | | | 23 | |
| 19.05 | | | 10.33 | | | | 75,878 | | | | 0.70 | | | | 0.93 | | | | 3.38 | | | | 16 | |
| 17.90 | | | 0.01 | | | | 68,986 | | | | 0.70 | | | | 0.90 | | | | 3.46 | | | | 13 | |
| 18.58 | | | 2.82 | | | | 69,270 | | | | 0.68 | | | | 0.92 | | | | 3.55 | | | | 18 | |
| 18.78 | | | 4.28 | | | | 69,075 | | | | 0.65 | | | | 0.98 | | | | 3.75 | | | | 33 | |
| | |
| The accompanying notes are an integral part of these financial statements. | | 57 |
COMMERCE FUNDS
Notes to Financial Statements
April 30, 2011 (Unaudited)
The Commerce Funds (the “Trust”) are a Delaware statutory trust registered under the Investment Company Act of 1940, as amended (the “1940 Act”), as an open-end, management investment company. The Trust consists of eight portfolios (individually, a “Fund” and collectively, the “Funds”): the Growth Fund, Value Fund, MidCap Growth Fund, Bond Fund, Short-Term Government Fund, National Tax-Free Intermediate Bond Fund, Missouri Tax-Free Intermediate Bond Fund and Kansas Tax-Free Intermediate Bond Fund. Each of the Funds offers one class of shares (the “Shares”). Each Fund is registered as a diversified open-end management investment company, other than the Missouri Tax-Free Intermediate Bond Fund and the Kansas Tax-Free Intermediate Bond Fund, which are registered as non-diversified under the 1940 Act.
The Funds have entered into an Advisory Agreement with Commerce Investment Advisors, Inc. (the “Adviser” or “Commerce”), a subsidiary of Commerce Bank (“Commerce Bank”).
| | |
| 2. SIGNIFICANT ACCOUNTING POLICIES | | |
The following is a summary of the significant accounting policies consistently followed by the Funds. The preparation of financial statements in conformity with accounting principles generally accepted in the United States of America (“GAAP”) requires management to make estimates and assumptions that may affect the amounts and disclosures in the financial statements. Actual results could differ from those estimates and assumptions.
A. Investment Valuation — The investment valuation policy of the Funds is to value investments at market value. Investments in equity securities and investment companies traded on a United States (“U.S.”) securities exchange or the NASDAQ system are valued daily at their last sale price or official closing price on the principal exchange or system on which they are traded. If no sale occurs, such securities and investment companies are valued at the last bid price. Debt securities for which market quotations are readily available are valued on the basis of quotations furnished by an independent pricing service or provided by securities dealers. The pricing services may use valuation models or matrix pricing, which considers yield or price with respect to comparable bonds, quotations from bond dealers or by reference to other securities that are considered comparable in such characteristics as rating, interest rate and maturity date, to determine current value. Unlisted equity securities for which market quotations are available are valued at the last sale price on valuation date, or if no sale occurs, at the last bid price. In the absence of market quotations, broker quotes will be utilized or the security will be fair valued. Investments in investment companies (other than those that are exchange traded) are valued at the net asset value per share (“NAV”) of the investment company on the valuation date. Short-term debt obligations that mature in sixty days or less and that do not exhibit signs of credit deterioration are valued at amortized cost, which approximates market value.
Securities for which market quotations are not readily available or are deemed not to reflect market value by the Adviser are valued at fair value using methods approved by the Board of Trustees.
B. Security and Fund Share Transactions, and Investment Income — Security and Fund share transactions are reflected for financial reporting purposes as of the trade date, which may cause the NAV as stated in the accompanying financial statements to be different than the NAV applied to Fund share transactions. Realized gains and losses on sales of portfolio securities are calculated using the identified cost basis. Dividend income is recognized on the ex-dividend date. Interest income is recorded on the basis of interest accrued, premium amortized and discount accreted. Certain mortgage security paydown gains and losses are included in interest income in the accompanying Statements of Operations. Market discounts, original issue discount and market premiums on debt securities are accreted/amortized to interest income over the life of the security with a corresponding adjustment in the cost basis of that security.
In addition, distributions received from the Funds’ investments in U.S. real estate investment trusts (“REITs”) often include a “return of capital”, which is recorded by the Funds as a reduction of the cost basis of the securities held. The Internal Revenue Code of 1986, as amended (the “Code”) requires a REIT to distribute at least 95% of its taxable income to investors.
58
COMMERCE FUNDS
| | |
| 2. SIGNIFICANT ACCOUNTING POLICIES (continued) | | |
In many cases, however, because of “non-cash” expenses such as property depreciation, a REIT’s cash flow will exceed its taxable income. The REIT may distribute this excess cash to offer a more competitive yield. This portion of the Funds’ distributions is deemed a return of capital and is generally not taxable to shareholders.
C. Expenses — Expenses incurred by the Trust that do not specifically relate to an individual Fund of the Trust are allocated to the Funds based on each Fund’s relative average net assets and are accrued daily.
D. Federal Taxes and Distributions to Shareholders — It is each Fund’s policy to comply with the requirements of the Code, applicable to regulated investment companies (mutual funds) and to distribute each year substantially all of its investment company taxable income and capital gains to its shareholders. Accordingly, the Funds are not required to make any provisions for the payment of federal income tax. Distributions to shareholders are recorded on the ex-dividend date. Income and capital gains distributions, if any, are declared and paid according to the following schedule:
| | | | | | | | |
| | | Income Distribution | | Capital Gains Distribution |
| Fund | | Declared | | Paid | | Declared | | Paid |
Value | | Quarterly | | Quarterly | | Annually | | Annually |
Growth and MidCap Growth | | Annually | | Annually | | Annually | | Annually |
Bond, Short-Term Government, National Tax-Free
Intermediate Bond, Missouri Tax-Free Intermediate Bond and Kansas Tax-Free Intermediate Bond | | Daily | | Monthly | | Annually | | Annually |
Net capital losses are carried forward to future fiscal years and may be used to the extent allowed by the Code to offset any future capital gains. Utilization of capital loss carryforwards will reduce the requirement of future capital gains distributions.
The characterization of distributions to shareholders for financial reporting purposes is determined in accordance with federal income tax rules, which may differ from GAAP. The source of each Fund’s distributions may be shown in the accompanying financial statements as from net investment income, net realized gain or capital. Certain components of the Funds’ net assets on the Statements of Assets and Liabilities reflect permanent GAAP/tax differences based on the appropriate tax character.
E. Repurchase Agreements — The Funds may enter into repurchase agreements. Repurchase agreements involve the purchase of securities subject to the seller’s agreement to repurchase the securities at a mutually agreed upon date and price. During the term of a repurchase agreement, the value of the underlying securities held as collateral on behalf of the Funds, including accrued interest, is required to exceed the value of the repurchase agreement, including accrued interest. If the seller defaults or becomes insolvent, realization of the collateral by the Funds may be delayed or limited and there may be a decline in the value of the collateral during the period while the Funds seek to assert their rights. The underlying securities for all repurchase agreements are held in safekeeping at the Funds’ custodian.
|
| 3. FAIR VALUE OF INVESTMENTS |
The fair value of a financial instrument is the amount that would be received to sell an asset or paid to transfer a liability in an orderly transaction between market participants at the measurement date (i.e., the exit price). GAAP establishes a fair value hierarchy that prioritizes the inputs to valuation techniques used to measure fair value. The hierarchy gives the highest priority
59
COMMERCE FUNDS
Notes to Financial Statements (continued)
April 30, 2011 (Unaudited)
| | |
| 3. FAIR VALUE OF INVESTMENTS (continued) | | |
to unadjusted quoted prices in active markets for identical assets or liabilities (Level 1 measurements) and the lowest priority to unobservable inputs (Level 3 measurements). The three levels of the fair value hierarchy are described below:
Level 1 — Unadjusted quoted prices in active markets that are accessible at the measurement date for identical, unrestricted assets or liabilities;
Level 2 — Quoted prices in markets that are not active or financial instruments for which significant inputs are observable (including, but not limited to, quoted prices for similar securities, interest rates, prepayment speeds and credit risk), either directly or indirectly;
Level 3 — Prices or valuations that require significant unobservable inputs (including the Adviser’s assumptions in determining fair value measurement).
The following is a summary of the Funds’ investments categorized in the fair value hierarchy as of April 30, 2011:
| | | | | | | | | | | | |
| GROWTH | | | | | | | | | |
| Investment Type | | Level 1 | | | Level 2 | | | Level 3 | |
Assets | | | | | | | | | | | | |
Common Stock and/or Other Equity Investments | | $ | 135,067,267 | | | $ | — | | | $ | — | |
Short-term Investment | | | — | | | | 2,509,000 | | | | — | |
Total | | $ | 135,067,267 | | | $ | 2,509,000 | | | $ | — | |
| | | |
VALUE Investment Type | | Level 1 | | | Level 2 | | | Level 3 | |
Assets | | | | | | | | | | | | |
Common Stock and/or Other Equity Investments | | $ | 55,634,307 | | | $ | — | | | $ | — | |
Short-term Investment | | | — | | | | 1,657,000 | | | | — | |
Total | | $ | 55,634,307 | | | $ | 1,657,000 | | | $ | — | |
| | | |
MIDCAP GROWTH Investment Type | | Level 1 | | | Level 2 | | | Level 3 | |
Assets | | | | | | | | | | | | |
Common Stock and/or Other Equity Investments | | $ | 69,848,520 | | | $ | — | | | $ | — | |
Short-term Investment | | | — | | | | 338,000 | | | | — | |
Total | | $ | 69,848,520 | | | $ | 338,000 | | | $ | — | |
| | | |
BOND Investment Type | | Level 1 | | | Level 2 | | | Level 3 | |
Assets | | | | | | | | | | | | |
Fixed Income | | | | | | | | | | | | |
Asset-Backed Securities | | $ | — | | | $ | 57,298,249 | | | $ | — | |
Taxable Municipal Bond Obligations | | | — | | | | 78,971,745 | | | | — | |
Mortgage-Backed Obligations | | | — | | | | 200,730,166 | | | | — | |
Corporate Obligations | | | — | | | | 175,437,938 | | | | — | |
U.S. Treasury Obligations and/or Other U.S. Government Agencies | | | 15,322,877 | | | | 91,569,828 | | | | — | |
Government Guarantee Obligations | | | — | | | | 3,062,910 | | | | — | |
Investment Company | | | 4,776,552 | | | | — | | | | — | |
Short-term Investment | | | — | | | | 13,594,000 | | | | — | |
Total | | $ | 20,099,429 | | | $ | 620,664,836 | | | $ | — | |
60
COMMERCE FUNDS
| | |
| 3. FAIR VALUE OF INVESTMENTS (continued) | | |
| | | | | | | | | | | | |
| | | |
SHORT-TERM GOVERNMENT Investment Type | | Level 1 | | | Level 2 | | | Level 3 | |
Assets | | | | | | | | | | | | |
Fixed Income | | | | | | | | | | | | |
Asset-Backed Securities | | $ | — | | | $ | 1,934,729 | | | $ | — | |
Mortgage-Backed Obligations | | | — | | | | 32,848,886 | | | | — | |
Government Guarantee Obligations | | | — | | | | 7,544,032 | | | | — | |
U.S. Treasury Obligations and/or Other U.S. Government Agencies | | | 15,945,374 | | | | 62,209,951 | | | | — | |
Short-term Investment | | | — | | | | 825,000 | | | | — | |
Total | | $ | 15,945,374 | | | $ | 105,362,598 | | | $ | — | |
| | | |
NATIONAL TAX-FREE INTERMEDIATE BOND Investment Type | | Level 1 | | | Level 2 | | | Level 3 | |
Assets | | | | | | | | | | | | |
Fixed Income | | | | | | | | | | | | |
Municipal Bond Obligations | | $ | — | | | $ | 171,655,793 | | | $ | — | |
Short-term Investment | | | — | | | | 1,939,000 | | | | — | |
Total | | $ | — | | | $ | 173,594,793 | | | $ | — | |
| | | |
MISSOURI TAX-FREE INTERMEDIATE BOND Investment Type | | Level 1 | | | Level 2 | | | Level 3 | |
Assets | | | | | | | | | | | | |
Fixed Income | | | | | | | | | | | | |
Municipal Bond Obligations | | $ | — | | | $ | 251,552,146 | | | $ | — | |
Short-term Investment | | | — | | |
| 5,478,000
|
| | | — | |
Total | | $ | — | | | $ | 257,030,146 | | | $ | — | |
| | | |
KANSAS TAX-FREE INTERMEDIATE BOND Investment Type | | Level 1 | | | Level 2 | | | Level 3 | |
Assets | | | | | | | | | | | | |
Fixed Income | | | | | | | | | | | | |
Municipal Bond Obligations | | $ | — | | | $ | 86,023,750 | | | $ | — | |
| | |
| 4. AGREEMENTS AND OTHER AFFILIATED TRANSACTIONS | | |
A. Advisory Agreement — Pursuant to the terms of the Advisory Agreement, the Adviser is responsible for managing the investments and making investment decisions for each of the Funds. For these services and for assuming related expenses, the Adviser is entitled to a fee, accrued daily and payable monthly, at the contractual annual rate of the corresponding Fund’s average daily net assets. The contractual annual rate is 0.75% for the Growth and MidCap Growth Funds and 0.50% for the Bond, Short-Term Government, National Tax-Free Intermediate Bond, Missouri Tax-Free Intermediate Bond and Kansas Tax-Free Intermediate Bond Funds, respectively. Effective March 1, 2011, the Adviser entered into a Fee Reduction Agreement to reduce the Value Fund’s contractual advisory fee annual rate from 0.75% to 0.30%. The effective advisory fee for the Value Fund for the six months ended April 30, 2011 was 0.59%.
B. Administration Agreements — Goldman Sachs Asset Management, L.P. (“GSAM”), an affiliate of Goldman, Sachs & Co. (“Goldman Sachs”), and Commerce, serve as Co-Administrators of the Trust pursuant to a Co-Administration Agreement. Under the Co-Administration Agreement, GSAM and Commerce administer the Trust’s business affairs. As compensation for the services rendered under the Co-Administration Agreement, GSAM and Commerce are entitled to a fee, accrued daily and
61
COMMERCE FUNDS
Notes to Financial Statements (continued)
April 30, 2011 (Unaudited)
| | |
| 4. AGREEMENTS AND OTHER AFFILIATED TRANSACTIONS (continued) | | |
payable monthly, at the contractual annual rate of the corresponding Fund’s average daily net assets. Pursuant to the Co-Administration Agreement, the Funds will pay an aggregate administrative fee at the annual rate of 0.15%, allocated as follows: (1) for each Fund, GSAM is entitled to receive 0.03% of each Fund’s average daily net assets; and (2) for each Fund, Commerce is entitled to receive 0.12% of each Fund’s average daily net assets.
C. Other Agreements — The Adviser has contractually agreed to waive fees and/or reimburse expenses (excluding interest, taxes and extraordinary expenses exclusive of any custody expense reductions for all Funds (other than the Mid Cap Growth Fund)) to the extent that such expenses exceeded, on an annualized basis, 1.13%, 0.70% (effective March 1, 2011), 0.88%, 0.68%, 0.70%, 0.70% and 0.70% of the average net assets of the Growth, Value, Bond, Short-Term Government, National Tax-Free Intermediate Bond, Missouri Tax-Free Intermediate Bond and Kansas Tax-Free Intermediate Bond Funds, respectively. Prior to March 1, 2011, the Adviser had contractually agreed to waive fees and/or reimburse expenses to 1.20% for the value Fund. In addition, the Funds are not obligated to reimburse the Adviser for prior fiscal year expense reimbursements, if any. Such expense reimbursements, if any, are accrued daily and paid monthly and are disclosed in the Statements of Operations for the six months ended April 30, 2011.
Pursuant to a Shareholder Administrative Services Plan adopted by its Board of Trustees, the Funds may enter into agreements with service organizations, such as banks and financial institutions, which include affiliates of the Adviser (“Service Organizations”), under which they will render shareholder administration support services. For these services, the Service Organizations are entitled to receive fees from each Fund at an annual rate of up to 0.25% of the average daily net asset value of Fund shares beneficially owned by clients of such Service Organizations. For the six months ended April 30, 2011, Commerce Bank has received $359,487 in shareowner servicing fees.
D. Deferred Compensation Plan — Certain Trustees participate in a Deferred Compensation Plan, as amended and restated (the “Plan”), which allows eligible non-affiliated Trustees as described in the Plan to defer the receipt of all or a portion of the Trustees’ fees payable. Under the Plan, such Trustees have deferred fees treated as if they had been invested by The Commerce Funds in the shares of one or more Funds of the Trust. All amounts payable to the Trustees under the Plan are determined based on the performance of such Funds and are accrued quarterly.
| | |
| 5. PORTFOLIO SECURITIES TRANSACTIONS | | |
The cost of purchases and proceeds from sales and maturities of long-term securities for the six months ended April 30, 2011, were as follows:
| | | | | | | | | | | | | | | | |
| Fund | | Purchases of
U.S. Government
and Agency
Obligations | | | Purchases
(Excluding
U.S. Government
and Agency
Obligations) | | | Sales and
Maturities of
U.S. Government
and Agency
Obligations | | | Sales
and Maturities
(Excluding
U.S. Government
and Agency
Obligations) | |
Growth | | $ | — | | | $ | 33,376,515 | | | $ | — | | | $ | 33,490,304 | |
Value | | | — | | | | 34,056,872 | | | | — | | | | 36,717,164 | |
MidCap Growth | | | — | | | | 16,198,805 | | | | — | | | | 10,573,444 | |
Bond | | | 23,792,820 | | | | 69,945,924 | | | | 40,038,298 | | | | 57,291,213 | |
Short-Term Government | | | 6,516,311 | | | | 5,009,347 | | | | 12,503,495 | | | | 4,232,801 | |
National Tax-Free Intermediate Bond | | | — | | | | 38,070,392 | | | | — | | | | 51,076,199 | |
Missouri Tax-Free Intermediate Bond | | | — | | | | 19,950,965 | | | | — | | | | 25,763,617 | |
Kansas Tax-Free Intermediate Bond | | | — | | | | 14,481,252 | | | | — | | | | 9,488,398 | |
62
COMMERCE FUNDS
As of the Funds’ most recent fiscal year ended, October 31, 2010, the Funds’ capital loss carryforwards and certain timing differences on a tax basis were as follows:
| | | | | | | | | | | | | | | | |
| | | Growth | | | Value | | | MidCap
Growth | | | Bond | |
Capital loss carryforward:(1) | | | | | | | | | | | | | | | | |
Expiring 2012 | | $ | — | | | $ | — | | | $ | — | | | $ | (2,391,657 | ) |
Expiring 2013 | | | — | | | | — | | | | — | | | | (540,238 | ) |
Expiring 2014 | | | — | | | | — | | | | — | | | | (3,576,948 | ) |
Expiring 2016 | | | — | | | | (4,798,672 | ) | | | — | | | | — | |
Expiring 2017 | | | (10,176,163 | ) | | | (11,694,039 | ) | | | (1,701,305 | ) | | | — | |
Expiring 2018 | | | — | | | | (1,344,255 | ) | | | — | | | | — | |
Total capital loss carryforward: | | $ | (10,176,163 | ) | | $ | (17,836,966 | ) | | $ | (1,701,305 | ) | | $ | (6,508,843 | ) |
Timing differences (income distributions, deferred compensation) | | $ | (26,881 | ) | | $ | (21,976 | ) | | $ | (16,259 | ) | | $ | (2,215,335 | ) |
| | | | |
| | | Short-Term
Government | | | National Tax-Free
Intermediate Bond | | | Missouri Tax-Free
Intermediate Bond | | | Kansas Tax-Free
Intermediate Bond | |
Capital loss carryforward:(1) | | | | | | | | | | | | | | | | |
Expiring 2011 | | $ | (2,174,462 | ) | | $ | — | | | $ | — | | | $ | — | |
Expiring 2012 | | | (3,771,248 | ) | | | — | | | | — | | | | — | |
Expiring 2013 | | | (2,538,488 | ) | | | — | | | | — | | | | — | |
Expiring 2014 | | | (2,653,199 | ) | | | — | | | | — | | | | — | |
Expiring 2015 | | | (1,094,544 | ) | | | — | | | | — | | | | — | |
Expiring 2016 | | | (347,228 | ) | | | — | | | | — | | | | — | |
Expiring 2017 | | | (400,692 | ) | | | — | | | | — | | | | — | |
Expiring 2018 | | | (460,436 | ) | | | — | | | | — | | | | — | |
Total capital loss carryforward: | | $ | (13,440,297 | ) | | $ | — | | | $ | — | | | $ | — | |
Timing differences (income distributions, deferred compensation) | | $ | (237,078 | ) | | $ | (562,085 | ) | | $ | (707,836 | ) | | $ | (224,933 | ) |
| (1) | | Expiration occurs on October 31 of the year indicated. |
As of April 30, 2011, the Funds’ aggregate security unrealized gains and losses based on cost for U.S. federal income tax purposes were as follows:
| | | | | | | | | | | | | | | | |
| | | Growth | | | Value | | | MidCap
Growth | | | Bond | |
Tax Cost | | $ | 116,407,865 | | | $ | 53,602,707 | | | $ | 51,205,736 | | | $ | 598,927,732 | |
Gross unrealized gain | | | 25,655,978 | | | | 5,296,819 | | | | 19,422,593 | | | | 50,121,797 | |
Gross unrealized loss | | | (4,487,576 | ) | | | (1,608,219 | ) | | | (441,809 | ) | | | (8,285,264 | ) |
Net unrealized security gain | | $ | 21,168,402 | | | $ | 3,688,600 | | | $ | 18,980,784 | | | $ | 41,836,533 | |
63
COMMERCE FUNDS
Notes to Financial Statements (continued)
April 30, 2011 (Unaudited)
| | |
| 6. TAX INFORMATION (continued) | | |
| | | | | | | | | | | | | | | | |
| | | Short-Term
Government | | | National Tax-Free
Intermediate Bond | | | Missouri Tax-Free
Intermediate Bond | | | Kansas Tax-Free
Intermediate Bond | |
Tax Cost | | $ | 117,795,618 | | | $ | 172,137,254 | | | $ | 252,511,414 | | | $ | 84,680,094 | |
Gross unrealized gain | | | 4,496,948 | | | | 3,478,253 | | | | 6,739,602 | | | | 2,156,863 | |
Gross unrealized loss | | | (984,594 | ) | | | (2,020,714 | ) | | | (2,220,870 | ) | | | (813,207 | ) |
Net unrealized security gain | | $ | 3,512,354 | | | $ | 1,457,539 | | | $ | 4,518,732 | | | $ | 1,343,656 | |
The difference between GAAP-basis and tax-basis unrealized gains (losses) is primarily attributable to wash sales, differences in the tax treatment of market discount accretion and premium amortization.
GSAM and Commerce have reviewed the Funds’ tax positions for all open tax years (the current and prior three fiscal years) and have concluded that no provision for income tax is required in the Funds’ financial statements. Such open tax years remain subject to examination and adjustment by tax authorities.
Under the recently enacted Regulated Investment Company Modernization Act of 2010, the Funds will be permitted to carry forward capital losses incurred in taxable years beginning after December 22, 2010 for an unlimited period. However, any losses incurred during those future taxable years will be required to be utilized prior to the losses incurred in pre-enactment taxable years. As a result of this ordering rule, pre-enactment capital loss carryforwards may be more likely to expire unused. Additionally, post-enactment capital losses that are carried forward will retain their character as either short-term or long term capital losses rather than being considered all short-term as under previous law.
Market and Credit Risks — In the normal course of business, the Funds trade financial instruments and enter into financial transactions where risk of potential loss exists due to changes in the market (market risk). Additionally, the Funds may also be exposed to credit risk in the event that an issuer fails to perform or that an institution or entity with which the Funds have unsettled or open transaction defaults.
Portfolio Concentrations — As a result of the Missouri Tax-Free Intermediate Bond and Kansas Tax-Free Intermediate Bond Funds’ ability to invest a large percentage of their assets in obligations of issuers within certain states, they are subject to possible concentration risks associated with economic, political or legal developments or industrial or regional matters specifically affecting such states.
Under normal market conditions, the Missouri Tax-Free Intermediate Bond Fund and the Kansas Tax-Free Intermediate Bond Fund invest at least 80% of their assets plus any borrowings for investment purposes (measured at the time of purchase) in Missouri and Kansas municipal securities, respectively, the income from which, in the opinion of bond counsel, is exempt from regular federal income tax, federal alternative minimum taxes and Missouri and Kansas state taxes, respectively. For each of the Missouri and Kansas Tax-Free Funds, the actual payment of principal and interest on Missouri and Kansas municipal securities is dependent on the Missouri General Assembly and the Kansas legislature, respectively, allotting money each fiscal year for these payments.
The investments of the Growth Fund may be concentrated in securities of technology companies. The Mid-Cap Growth Fund concentrates in mid-cap stocks. Investing in mid-sized companies may be riskier than investing in larger, more established companies. At times, securities of technology companies may experience significant price fluctuations.
The Bond and Short-Term Government Funds may invest 80% and 100%, respectively, of their total assets in mortgage and asset-related securities and the Bond Fund may invest 80% of its total assets in asset-backed securities. Mortgage-backed securities, especially collateralized mortgage-backed securities, may be subject to risks that include price volatility, liquidity, and enhanced sensitivity to interest rates. As a result, mortgage-backed securities may be more difficult to value and liquidate, if
64
COMMERCE FUNDS
| | |
| 7. OTHER RISKS (continued) | | |
necessary. Mortgage-backed securities are also subject to prepayment risk, which may result in a decreased rate of return and a decline in the value of the securities. Asset-backed securities are dependent upon payment of the underlying consumer loans or receivables by individuals, and the certificate holder frequently has no recourse against the entity that originated the loans or receivables. Asset-backed securities have a greater risk of default during periods of economic downturn than other securities. Also, asset-backed securities may be less liquid than other securities and therefore more difficult to value and liquidate, if necessary.
Under the Trust’s organizational documents, its trustees, officers, employees and agents are indemnified, to the extent permitted by the Act, against certain liabilities that may arise out of performance of their duties to the Funds. Additionally, in the course of business, the Funds enter into contracts that contain a variety of indemnification clauses. The Funds’ maximum exposure under these arrangements is unknown, as this would involve future claims that may be made against the Funds that have not yet occurred. However, Commerce and GSAM believe the risk of loss under these arrangements to be remote.
Approval of Advisory Agreement — The Trustees oversee the management of the Trust, and review the investment performance and expenses of the Funds at regularly scheduled meetings held during the Funds’ fiscal year. In addition, the Trustees determine annually whether to reapprove and continue the Trust’s investment advisory agreement (“Advisory Agreement”) with the Adviser (also referred to as “Commerce”) for the Funds.
The Advisory Agreement for the Funds was most recently approved by the Trustees, including all of the Trustees who are not parties to the Advisory Agreement or “interested persons” (as such term is defined in the 1940 Act) of any party thereto (the “non-interested Trustees”), on November 18, 2010 (the “Annual Contract Meeting”).
Prior to the Annual Contract Meeting, the Board of Trustees received written materials provided by the Adviser relating to the Trustees’ consideration of the Advisory Agreement. At the Annual Contract Meeting, the Trustees also received and considered the Adviser’s oral presentations and discussed the information that had been provided. In connection with their deliberations, the Trustees were advised by their independent legal counsel regarding their responsibilities under applicable law and met separately in executive session with independent counsel without members of management present.
In evaluating the Advisory Agreement, the Trustees relied upon their knowledge, resulting from their meetings and other interactions throughout the year, of the Adviser and its services and personnel. Both in meetings specifically dedicated to the review of the Advisory Agreement and meetings held during the year, the Trustees reviewed materials relating to the Adviser’s investment management services. Specifically, the Trustees reviewed, among other things, information relating to: (i) the terms of the Advisory Agreement; (ii) the Funds’ investment performance over different time periods in comparison to the investment performance of mutual fund peer categories selected by Lipper Inc. (“Lipper”), a third-party provider of mutual fund data; (iii) the contractual investment advisory fees, the actual investment advisory fees (after expense reimbursements) and the total expenses borne by the Funds in comparison to those borne by mutual fund peer groups selected by Lipper; (iv) the Adviser’s staffing for the Funds and the experience of the portfolio managers; (v) the scope and depth of the Adviser’s resources and their ability to attract and retain portfolio management investment talent; (vi) the fees paid by the Funds to the Adviser and its affiliates for services, and the expenses incurred by them in connection with the provision of those services, the profitability of the Advisory Agreement to the Adviser, and a comparison of the Adviser’s profitability with that of other publicly reported profitability information of other advisers; (vii) the fall out benefits received by the Adviser and its affiliates from their relationships with the Funds; (viii) information about fees charged to institutional accounts for which an affiliate of the Adviser, Commerce Trust Company (“CTC”) was performing services similar to those performed for the Funds; and (ix) potential economies of scale.
65
COMMERCE FUNDS
Notes to Financial Statements (continued)
April 30, 2011 (Unaudited)
| | |
| 9. OTHER MATTERS (continued) | | |
In connection with their approval of the Advisory Agreement for each of the Funds, the Trustees gave weight to various factors, but did not identify any single factor as controlling their decision. As part of their review, the Trustees considered the following factors:
Nature, quality and extent of services – The Trustees reviewed the nature, quality and extent of services of the Adviser to the Funds, taking into account the investment objectives and strategies of each Fund and knowledge gained from meetings with management, which were held on at least a quarterly basis. The Trustees also considered the available resources and key investment personnel of the Adviser and their experience and length of service to the Funds. The Trustees also discussed the Adviser’s reports to the Board, compliance record and effectiveness of oversight over the Funds’ other service providers, communications and support services to shareholders, service as the Funds’ co-administrator, adherence to investment policies, execution of portfolio transactions and selection of broker dealers and other similar factors.
The Trustees determined that the Adviser had invested in the Funds and provided a seasoned and experienced portfolio management and compliance staff. Moreover, they considered that the Adviser had a highly disciplined money management and research and analytic process and was able to attract and retain high quality personnel. The Trustees also considered that the Adviser had provided clear, concise reports to the Board and updated the Trustees frequently on issues of current interest. They concluded that the Adviser had an excellent compliance record and had provided strong oversight over the other service providers to the Funds. Finally, the Trustees considered that the Adviser and its affiliates had other client relationships with most of the shareholders and provided them with other services through these relationships. The Trustees concluded that the Funds would therefore benefit from the Adviser’s continued service to them.
Performance of the Funds – The Trustees considered both the short-term and long-term performance of the Funds. They reviewed and discussed the Lipper information presented, which compared each Fund’s performance with performance of comparable funds and peer groups identified by Lipper. They asked a number of questions with respect to how the Lipper peer groups were constructed, all of which were addressed by the co-administrators and Adviser. The Trustees also considered performance versus each Fund’s benchmark. The Trustees determined that the Fixed Income Funds were generally competitive with their Lipper peers for the one- and three-year periods, with all Fixed Income Funds being in or near to the first quartile of their Lipper peers for the three-year period. The Trustees considered that this outperformance was particularly significant given that the Fixed Income Funds generally take on less risk than other similar competing funds. The Trustees also considered performance versus the Funds’ benchmarks, noting that the Bond Fund outperformed is benchmark for the one- and three-year time periods, the Short-Term Government and National Intermediate Bond Fund had more mixed performance versus their benchmarks and the other Tax-Free Funds had under performed their benchmarks. The Trustees considered, however, that the Missouri and Kansas Tax-Free Intermediate Bond Funds tracked benchmarks that were not necessarily reflective of their concentrated state holdings.
The Trustees also considered the Equity Funds’ performance. They concluded that the Growth and Mid-Cap Growth Funds had generally competitive performance with their Lipper peers for the one- and three-year time periods. They concluded that the Value Fund had under performed during these same periods but that the Adviser was considering and discussing with the Trustees changes in order to improve performance of the Fund. The Trustees also considered performance versus the Funds’ benchmarks, noting that the Growth and Value Funds had under performed their benchmarks for the one- and three-year periods, while the Mid-Cap Growth Fund had outperformed its benchmark for the same periods.
The Trustees also reviewed and evaluated information prepared by Lipper that compared each Fund’s performance with its expenses. The Trustees noted that each Fund’s performance versus expense levels was satisfactory given the level of assets in the Funds; however the Value Fund’s comparison of performance versus assets was not as favorable. The Trustees noted that the Adviser was working on a plan to address both performance and expense issues.
66
COMMERCE FUNDS
| | |
| 9. OTHER MATTERS (continued) | | |
The Trustees concluded that while past performance is not necessarily indicative of future performance, the majority of the Funds had satisfactory performance and that the Adviser was taking steps to address the Value Fund’s performance. They also concluded that Fund shareholders were generally receiving value for the services provided by the Adviser.
Costs of Services and Profits Realized by the Adviser – The Board considered the fees and expenses of the Funds and the Lipper information provided comparing the Funds’ fees to Lipper peers. It was noted that the Funds’ advisory fees, except the Kansas Tax-Free Intermediate Bond Fund, were higher than the average advisory fees for comparable funds and that total net operating expenses were between four to nine basis points higher than the average, except for the Growth Fund, which was below the average for net operating expenses. The Trustees considered this information in light of the Adviser’s cost of providing advisory services as well as its profitability. It was noted that the Adviser’s costs had increased in the past year and that profitability had also increased by a small margin; it was also noted that the Adviser’s cost allocation methodology had not changed and had previously been reviewed by the Funds’ auditors for reasonableness. The Trustees also discussed that the Adviser appeared to have a rigorous and consistent program in place to control Fund expenses and had instituted requests for proposals and negotiated fees aggressively with other service providers when appropriate. The Trustees considered the Adviser’s profitability in light of the profitability of other investment advisers’ publicly-reported profitability margins. The Trustees considered the differences in the scale, lines of business, operations, products offered and other differences with regard to the investment advisers included in the profitability comparison.
The Trustees also considered the information provided on the Adviser’s advisory fees compared to advisory fees charged to similar institutional accounts managed by Commerce personnel. There were no comparable institutional accounts with the three Tax-Free Funds. These accounts were not managed by the Adviser but by its affiliate, but some of the same Fund investment personnel provided these advisory services. In some cases, the fees charged were lower than the fees charged to the Funds and in other cases the fees were about the same. The Trustees noted that the Adviser provides significant additional services for the Funds that its affiliate does not provide to non-mutual fund clients, including administrative services, oversight of the Funds’ other service providers, Trustee support, regulatory compliance and numerous other services, and that in servicing the Funds, the Adviser assumes many legal risks that its affiliate does not assume in servicing many of its similar clients.
Economies of Scale – The Trustees determined after review of the financial reports that the Funds had not achieved sufficient size and scale to institute breakpoints. In addition, the Trustees considered that the Adviser was managing its operations in a manner that was as efficient as possible under the circumstance of more or less static assets, with a view to keeping shareholder expense ratios as low as possible.
Fall-Out Benefits – The principal benefits to the Adviser of its relationship with the Funds are its receipt of soft dollars and its contract as a Co-Administrator of the Funds. The Trustees considered that they receive regular, extensive quarterly reports on the Adviser’s soft dollar program and that its program is in compliance with Section 28(e) of the Securities Exchange Act of 1934. They also considered that the Adviser had a system in place to test for best execution, which was also reviewed with the Board on at least an annual basis. In summary, the Trustees concluded that the Adviser and Funds were benefitting from the soft dollar products and services. With respect to the Co-Administration Agreement, the Trustees noted that they review that agreement annually using substantially the same review framework as the Advisory Agreement. The Trustees believed that Commerce was providing satisfactory services to shareholders under that agreement for reasonable rates.
After deliberation, the Trustees concluded at the Annual Contract Meeting with respect to all of the Funds, that the fees paid by Funds were reasonable in light of the services provided by the Adviser, its costs and the Funds’ current and reasonably foreseeable asset levels, and that the Advisory Agreement should be approved and continued.
67
COMMERCE FUNDS
Notes to Financial Statements (continued)
April 30, 2011 (Unaudited)
Subsequent events after the balance sheet date have been evaluated through the date the financial statements were issued and Commerce and GSAM have concluded that there is no impact requiring adjustment or disclosure in the financial statements.
| | |
| 11. SUMMARY OF SHARE TRANSACTIONS | | |
Share activity is as follows:
| | | | | | | | | | | | | | | | |
| | | Growth Fund | |
| | | For the Six Months Ended
April 30, 2011 (Unaudited) | | | For the Fiscal Year Ended
October 31, 2010 | |
| | | Shares | | | Dollars | | | Shares | | | Dollars | |
Shares sold | | | 540,591 | | | $ | 14,311,496 | | | | 616,040 | | | $ | 14,117,639 | |
Reinvestment of distributions | | | 9,336 | | | | 243,853 | | | | 9,915 | | | | 231,828 | |
Shares redeemed | | | (471,408 | ) | | | (12,465,467 | ) | | | (995,250 | ) | | | (23,120,014 | ) |
| Net Increase (Decrease) | | | 78,519 | | | $ | 2,089,882 | | | | (369,295 | ) | | $ | (8,770,547 | ) |
| | | | | | | | | | | | | | | | |
| | | Value Fund | |
| | | For the Six Months Ended
April 30, 2011
(Unaudited) | | | For the Fiscal Year Ended
October 31, 2010 | |
| | | Shares | | | Dollars | | | Shares | | | Dollars | |
Shares sold | | | 297,940 | | | $ | 6,194,111 | | | | 564,117 | | | $ | 10,092,891 | |
Reinvestment of distributions | | | 3,749 | | | | 77,581 | | | | 8,717 | | | | 159,149 | |
Shares redeemed | | | (372,537 | ) | | | (7,591,554 | ) | | | (1,717,652 | ) | | | (31,176,821 | ) |
| Net Decrease | | | (70,848 | ) | | $ | (1,319,862 | ) | | | (1,144,818 | ) | | $ | (20,924,781 | ) |
| | | | | | | | | | | | | | | | |
| | | MidCap Growth Fund | |
| | | For the Six Months Ended
April 30, 2011
(Unaudited) | | | For the Fiscal Year Ended
October 31, 2010 | |
| | | Shares | | | Dollars | | | Shares | | | Dollars | |
Shares sold | | | 306,223 | | | $ | 10,477,610 | | | | 141,993 | | | $ | 3,943,245 | |
Reinvestment of distributions | | | — | | | | — | | | | 660 | | | | 17,725 | |
Shares redeemed | | | (135,849 | ) | | | (4,785,755 | ) | | | (461,310 | ) | | | (12,674,320 | ) |
| Net Increase (Decrease) | | | 170,374 | | | $ | 5,691,855 | | | | (318,657 | ) | | $ | (8,713,350 | ) |
| | | | | | | | | | | | | | | | |
| | | Bond Fund | |
| | | For the Six Months Ended
April 30, 2011
(Unaudited) | | | For the Fiscal Year Ended
October 31, 2010 | |
| | | Shares | | | Dollars | | | Shares | | | Dollars | |
Shares sold | | | 3,733,671 | | | $ | 74,531,765 | | | | 7,088,103 | | | $ | 139,473,917 | |
Reinvestment of distributions | | | 147,095 | | | | 2,943,887 | | | | 269,514 | | | | 5,321,497 | |
Shares redeemed | | | (3,843,093 | ) | | | (76,670,312 | ) | | | (5,232,442 | ) | | | (103,304,905 | ) |
| Net Increase | | | 37,673 | | | $ | 805,340 | | | | 2,125,175 | | | $ | 41,490,509 | |
68
COMMERCE FUNDS
| | |
| 11. SUMMARY OF SHARE TRANSACTIONS (continued) | | |
| | | | | | | | | | | | | | | | |
| | | Short-Term Government Fund | |
| | | For the Six Months Ended
April 30, 2011 (Unaudited) | | | For the Fiscal Year Ended
October 31, 2010 | |
| | | Shares | | | Dollars | | | Shares | | | Dollars | |
Shares sold | | | 1,036,445 | | | $ | 18,899,084 | | | | 3,529,360 | | | $ | 64,398,029 | |
Reinvestment of distributions | | | 31,341 | | | | 571,713 | | | | 63,425 | | | | 1,160,258 | |
Shares redeemed | | | (1,601,379 | ) | | | (29,241,142 | ) | | | (2,229,565 | ) | | | (40,679,699 | ) |
| Net Increase (Decrease) | | | (533,593 | ) | | $ | (9,770,345 | ) | | | 1,363,220 | | | $ | 24,878,588 | |
| | | | | | | | | | | | | | | | |
| | | National Tax-Free Intermediate Bond Fund | |
| | | For the Six Months Ended
April 30, 2011 (Unaudited) | | | For the Fiscal Year Ended
October 31, 2010 | |
| | | Shares | | | Dollars | | | Shares | | | Dollars | |
Shares sold | | | 884,307 | | | $ | 16,374,672 | | | | 2,410,272 | | | $ | 46,150,365 | |
Reinvestment of distributions | | | 28,570 | | | | 536,769 | | | | 11,631 | | | | 222,529 | |
Shares redeemed | | | (1,455,758 | ) | | | (26,951,287 | ) | | | (1,279,385 | ) | | | (24,523,400 | ) |
| Net Increase (Decrease) | | | (542,881 | ) | | $ | (10,039,846 | ) | | | 1,142,518 | | | $ | 21,849,494 | |
| | | | | | | | | | | | | | | | |
| | | Missouri Tax-Free Intermediate Bond Fund | |
| | | For the Six Months Ended
April 30, 2011 (Unaudited) | | | For the Fiscal Year Ended
October 31, 2010 | |
| | | Shares | | | Dollars | | | Shares | | | Dollars | |
Shares sold | | | 1,811,286 | | | $ | 34,554,702 | | | | 4,142,096 | | | $ | 80,752,601 | |
Reinvestment of distributions | | | 34,363 | | | | 657,246 | | | | 46,781 | | | | 913,400 | |
Shares redeemed | | | (1,895,408 | ) | | | (36,142,532 | ) | | | (2,595,547 | ) | | | (50,644,920 | ) |
| Net Increase (Decrease) | | | (49,759 | ) | | $ | (930,584 | ) | | | 1,593,330 | | | $ | 31,021,081 | |
| | | | | | | | | | | | | | | | |
| | | Kansas Tax-Free Intermediate Bond Fund | |
| | | For the Six Months Ended
April 30, 2011 (Unaudited) | | | For the Fiscal Year Ended
October 31, 2010 | |
| | | Shares | | | Dollars | | | Shares | | | Dollars | |
Shares sold | | | 702,003 | | | $ | 13,050,603 | | | | 1,107,510 | | | $ | 21,235,888 | |
Reinvestment of distributions | | | 17,910 | | | | 335,278 | | | | 15,826 | | | | 303,525 | |
Shares redeemed | | | (432,479 | ) | | | (8,031,547 | ) | | | (756,113 | ) | | | (14,488,676 | ) |
| Net Increase | | | 287,434 | | | $ | 5,354,334 | | | | 367,223 | | | $ | 7,050,737 | |
69
70
COMMERCE FUNDS
Fund Expenses – Six Month Period Ended April 30, 2011 (Unaudited)
As a shareholder of the Funds you incur two types of costs: (1) transaction costs and (2) ongoing costs, including management fees; shareholder servicing fees and other Fund expenses. This Example is intended to help you understand your ongoing costs (in dollars) of investing in the Fund and to compare these costs with the ongoing costs of investing in other mutual funds.
The Example is based on an investment of $1,000 invested at the beginning of the period and held for the entire period from November 1, 2010 through April 30, 2011.
Actual Expenses – The first line in the table below provides information about actual account values and actual expenses. You may use the information in this line, together with the amount you invested, to estimate the expenses that you paid over the period. Simply divide your account value by $1,000 (for example, an $8,600 account value divided by $1,000=8.6), then multiply the result by the number in the first line under the heading entitled “Expenses Paid” to estimate the expenses you paid on your account during this period.
Hypothetical Example for Comparison Purposes – The second line in the table below provides information about hypothetical account values and hypothetical expenses based on the Funds’ actual net expense ratios and an assumed rate of return of 5% per year before expenses, which is not the Funds’ actual return. The hypothetical account values and expenses may not be used to estimate the actual ending account balance or expenses you paid for the period. You may use this information to compare the ongoing costs of investing in the Funds and other funds. To do so, compare this 5% hypothetical example with the 5% hypothetical examples that appear in the shareholder reports of the other funds.
Please note that the expenses shown in the table are meant to highlight your ongoing costs only and do not reflect any transactional costs, such as exchange fees, but shareholders of other funds may incur such costs. Therefore, the second line of the table is useful in comparing ongoing costs only, and will not help you determine the relative total costs of owning different funds. In addition, if these transactional costs were included, your costs would have been higher.
| | | | | | | | | | | | | | | | | | | | | | | | | | | | | | | | | | | | | | | | | | | | | | | | |
| | | Beginning
Account
Value
11/1/10 | | | Ending
Account
Value
4/30/11 | | | Expenses
Paid for
the
6 months
ended
4/30/11* | | | Beginning
Account
Value
11/1/10 | | | Ending
Account
Value
4/30/11 | | | Expenses
Paid for
the
6 months
ended
4/30/11* | | | Beginning
Account
Value
11/1/10 | | | Ending
Account
Value
4/30/11 | | | Expenses
Paid for
the
6 months
ended
4/30/11* | | | Beginning
Account
Value
11/1/10 | | | Ending
Account
Value
4/30/11 | | | Expenses
Paid for
the
6 months
ended
4/30/11* | |
| Fund | | Growth Fund | | | Value Fund | | | MidCap Growth Fund | | | Bond Fund | |
Shares | | | | | | | | | | | | | | | | | | | | | | | | | | | | | | | | | | | | | | | | | | | | | | | | |
| Actual | | $ | 1,000.00 | | | $ | 1,136.80 | | | $ | 5.99 | | | $ | 1,000.00 | | | $ | 1,188.80 | | | $ | 5.59 | | | $ | 1,000.00 | | | $ | 1,193.30 | | | $ | 6.63 | | | $ | 1,000.00 | | | $ | 1,011.30 | | | $ | 4.04 | |
| Hypothetical 5% return | | | 1,000.00 | | | | 1,019.19 | + | | | 5.66 | | | | 1,000.00 | | | | 1,019.69 | + | | | 5.16 | | | | 1,000.00 | | | | 1,018.74 | + | | | 6.11 | | | | 1,000.00 | | | | 1,020.78 | + | | | 4.06 | |
| | | Short-Term Government Fund | | | National Tax-Free Intermediate
Bond Fund | | | Missouri Tax-Free Intermediate
Bond Fund | | | Kansas Tax-Free Intermediate
Bond Fund | |
Shares | | | | | | | | | | | | | | | | | | | | | | | | | | | | | | | | | | | | | | | | | | | | | | | | |
| Actual | | $ | 1,000.00 | | | $ | 1,001.00 | | | $ | 3.37 | | | $ | 1,000.00 | | | $ | 989.70 | | | $ | 3.45 | | | $ | 1,000.00 | | | $ | 994.90 | | | $ | 3.46 | | | $ | 1,000.00 | | | $ | 995.10 | | | $ | 3.46 | |
| Hypothetical 5% return | | | 1,000.00 | | | | 1,021.42 | + | | | 3.41 | | | | 1,000.00 | | | | 1,021.32 | + | | | 3.51 | | | | 1,000.00 | | | | 1,021.32 | + | | | 3.51 | | | | 1,000.00 | | | | 1,021.32 | + | | | 3.51 | |
| * | | Expenses are calculated using each Fund’s annualized net expense ratio, which represents the ongoing expenses as a percentage of net assets for the six months ended April 30, 2011. Expenses are calculated by multiplying the annualized net expense ratio by the average account value for the period; then multiplying the result by the number of days in the most recent fiscal half year; and then dividing that result by the number of days in the year. The annualized net expense ratios for the period were as follows: |
| | | | | | | | | | | | | | |
Fund | | | | | | | | Fund | | | |
| Growth | | | 1.13 | % | | | | | | Short-Term Government | | | 0.68 | % |
| Value | | | 1.03 | | | | | | | National Tax-Free Intermediate Bond | | | 0.70 | |
| MidCap Growth | | | 1.22 | | | | | | | Missouri Tax-Free Intermediate Bond | | | 0.70 | |
| Bond | | | 0.81 | | | | | | | Kansas Tax-Free Intermediate Bond | | | 0.70 | |
| + | | Hypothetical expenses are based on the Funds’ actual annualized net expense ratios and an assumed rate of return of 5% per year before expenses. |
COMMERCE FUNDS
The Commerce Funds
Growth Fund:
The Fund is subject to market risk so that the value of the securities in which it invests may go up or down in response to the prospects of individual companies, particular industry sectors and/or general economic conditions. Investments in technology companies, which may produce or use products or services that prove commercially unsuccessful or become obsolete, may be subject to greater price volatility than securities of companies in other sectors.
Value Fund:
The Fund is subject to market risk so that the value of the securities in which it invests may go up or down in response to the prospects of individual companies, particular industry sectors and/or general economic conditions.
MidCap Growth Fund:
The Fund invests in small- and mid-capitalization securities. Generally, smaller and mid-sized companies are more vulnerable to adverse developments because of more limited product lines, markets or financial resources. As a result, the securities of smaller and mid-sized companies involve greater risks than those associated with larger, more established companies and may be subject to more abrupt or erratic trading and price movements. Investments in technology companies, which may produce or use products or services that prove commercially unsuccessful or become obsolete, may be subject to greater price volatility than securities of companies in other sectors.
Bond Fund:
Investments in fixed income securities are subject to the risks associated with debt securities including credit and interest rate risk. The guarantee on U.S. government securities applies only to the underlying securities of the Fund if held to maturity and not to the value of the Fund’s shares. Mortgage-backed securities, especially collateralized mortgage-backed securities, may be subject to risks that include price volatility, liquidity and enhanced sensitivity to interest rates. Asset-backed securities may be less liquid than other securities and therefore more difficult to value and liquidate, if necessary.
Short-Term Government Fund:
Investments in fixed income securities are subject to the risks associated with debt securities including credit and interest rate risk. The guarantee on U.S. government securities applies only to the underlying securities of the Fund if held to maturity and not to the value of the Fund’s shares. Mortgage-backed securities, especially collateralized mortgage-backed securities, may be subject to risks that include price volatility, liquidity and enhanced sensitivity to interest rates.
National Tax-Free Intermediate Bond Fund
Investments in fixed income securities are subject to the risks associated with debt securities including credit and interest rate risk. Investments in municipal securities can be significantly affected by political changes as well as uncertainties in the municipal market related to taxation or legislative changes. The Fund’s investments may subject shareholders to the federal alternative minimum tax and state income taxes.
Missouri Tax-Free Intermediate Bond Fund:
Investments in fixed income securities are subject to the risks associated with debt securities including credit and interest rate risk. The Fund invests its assets predominately in Missouri bonds. The actual payment of principal and interest on these bonds is dependent on the Missouri General Assembly allotting money each fiscal year for these payments. The Fund is non-diversified. Due to the small number of bonds generally held in the portfolio, the Fund may be subject to greater risks than a more diversified fund. A change in the value of any single holding may affect the overall value more than it would affect a
71
COMMERCE FUNDS
The Commerce Funds (continued)
diversified fund that holds more investments. Investments in municipal securities can be significantly affected by political changes as well as uncertainties in the municipal market related to taxation or legislative changes. In addition, the Fund’s investments may subject shareholders to federal alternative minimum tax. The investment income from this Fund may be subject to state income taxes.
Kansas Tax-Free Intermediate Bond Fund:
Investments in fixed income securities are subject to the risks associated with debt securities including credit and interest rate risk. The Fund invests its assets predominately in Kansas bonds. The actual payment of principal and interest on these bonds is dependent on the Kansas legislature allotting money each fiscal year for these payments. The Fund is non-diversified. Due to the smaller number of bonds generally held in the portfolio, the Fund may be subject to greater risks than a more diversified fund. A change in the value of any single holding may affect the overall value more than it would affect a diversified fund that holds more investments. Investments in municipal securities can be significantly affected by political changes as well as uncertainties in the municipal market related to taxation or legislative changes. In addition, the Fund’s investments may subject shareholders to federal alternative minimum tax. The investment income from this Fund may be subject to state income taxes.
72
INVESTMENT ADVISER
AND CO-ADMINISTRATOR
Commerce Investment Advisors, Inc.
922 Walnut Street
4th Floor
Kansas City, Missouri 64106
CUSTODIAN/ACCOUNTING AGENT
State Street Bank & Trust Company
1 Lincoln Street
Boston, Massachusetts 02111
TRANSFER AGENT
Boston Financial Data Services, Inc.
330 W. 9th
4th Floor
Kansas City, Missouri 64105
DISTRIBUTOR
Goldman, Sachs & Co.
200 West Street
New York, New York 10282
CO-ADMINISTRATOR
Goldman Sachs Asset Management, L.P.
200 West Street
New York, New York 10282
INDEPENDENT REGISTERED
PUBLIC ACCOUNTING FIRM
KPMG LLP
Two Financial Center
60 South St.
Boston, M 02111
LEGAL COUNSEL
Drinker Biddle & Reath LLP
One Logan Square
Ste. 2000
Philadelphia, Pennsylvania 19103-6996
This Semi-Annual Report contains facts concerning The Commerce Funds’ objectives and policies, management, expenses, and other information. For more complete information about The Commerce Funds, a prospectus may be obtained by calling 1-800-995-6365. An investor should read the prospectus carefully before investing or sending money.
The Commerce Funds are advised by Commerce Investment Advisors, Inc., a subsidiary of Commerce Bank, which receives a fee for its services. The Commerce Funds are distributed by Goldman, Sachs & Co.
The Commerce Funds file their complete schedule of portfolio holdings with the Securities and Exchange Commission (the “SEC”) for the first and third quarters of each fiscal year on Form N-Q. The Funds’ Form N-Q is available on the SEC’s website at http://www.sec.gov. You may also review and obtain copies at the SEC’s Public Reference Room in Washington, D.C. Information about the Public Reference Room may be obtained by calling 1-800-SEC-0330.
A description of the policies and procedures that The Commerce Funds use to determine how to vote proxies relating to portfolio securities and information regarding how the Funds voted proxies relating to portfolio securities during the most recent 12-month period ended June 30 is available (i) without change, upon request by calling 1-800-995-6365 and (ii) on the SEC’s website at http://www.sec.gov.
This report is not authorized for distribution to prospective investors unless preceded or accompanied by a current prospectus, which contains, more complete information about the Commerce Funds’ investment policies, fees and expenses. Investors should read the prospectus carefully before investing.
NOT FDIC INSURED
MAY LOSE VALUE
NO BANK GUARANTEE

TRUSTEES
Martin E. Galt III, Chairman
David L. Bodde, Lead Independent Trustee
Charles W. Peffer
James M. Snowden, Jr.
OFFICERS
William Schuetter, President
Angela Dew, Vice President, Chief Compliance Officer, and Secretary
Jeffrey Bolin, Assistant Vice President
Peter W. Fortner, Chief Accounting Officer
Scott McHugh, Treasurer
Philip V. Giuca Jr., Assistant Treasurer
Patricia Meyer, Assistant Secretary
922 Walnut
Fourth Floor
Kansas City, Missouri 64106
www.commercefunds.com
1-800-995-6365
07-938/CB 5026
6/11
Not applicable for the reporting period.
| ITEM 3. | | AUDIT COMMITTEE FINANCIAL EXPERT. |
Not applicable for the reporting period.
| ITEM 4. | | PRINCIPAL ACCOUNTANT FEES AND SERVICES. |
Not applicable for the reporting period.
| ITEM 5. | | AUDIT COMMITTEE OF LISTED REGISTRANTS. |
Not applicable.
(a) The Schedule of Investments is included as part of the Report to Shareholders filed under Item 1.
(b) Not applicable.
| ITEM 7. | | DISCLOSURE OF PROXY VOTING POLICIES AND PROCEDURES FOR CLOSED-END MANAGEMENT |
Not applicable.
| ITEM 8. | | PORTFOLIO MANAGERS OF CLOSED-END MANAGEMENT INVESTMENT COMPANIES. |
Not applicable.
| ITEM 9. | | PURCHASES OF EQUITY SECURITIES BY CLOSED-END MANAGEMENT INVESTMENT COMPANY AND |
Not applicable.
| ITEM 10. | | SUBMISSION OF MATTERS TO A VOTE OF SECURITY HOLDERS. |
There has been no material change to the procedures by which shareholders may recommend nominees to the registrant’s Board of Trustees.
| ITEM 11. | | CONTROLS AND PROCEDURES. |
| | (a) | The registrant’s principal executive and principal financial officers or persons performing similar functions have concluded that the registrant’s disclosure controls and procedures (as defined in Rule 30a-3(c) under the Investment Company Act of 1940, as amended (the “1940 Act”)) are effective as of a date within 90 days of the filing of this report, based on the evaluation of these controls and procedures required by Rule 30a-3(b) under the 1940 Act and 15d-15(b) under the Securities Exchange Act of 1934, as amended. |
| | (b) | There were no changes in the registrant’s internal control over financial reporting (as defined in Rule 30a-3(d) under the 1940 Act) that occurred during the second fiscal quarter of the period covered by this report that has materially affected, or is reasonably likely to materially affect, the registrant’s internal control over financial reporting. |
| | | | |
| (a)(1) | | Not applicable for the reporting period. |
| | |
| (a)(2) | | Exhibit 99.CERT | | Certifications pursuant to Section 302 of the Sarbanes-Oxley Act of 2002 are filed herewith. |
| | |
| (a)(3) | | Not applicable. | | |
| | |
| (b)(1) | | Exhibit 99.906CERT | | Certifications pursuant to Section 906 of the Sarbanes-Oxley Act of 2002 are filed herewith. |
SIGNATURES
Pursuant to the requirements of the Securities Exchange Act of 1934 and the Investment Company Act of 1940, the registrant has duly caused this report to be signed on its behalf by the undersigned, thereunto duly authorized.
|
THE COMMERCE FUNDS |
|
| /s/ William R. Schuetter |
| William R. Schuetter |
| President |
June 24, 2011 |
Pursuant to the requirements of the Securities Exchange Act of 1934 and the Investment Company Act of 1940, this report has been signed below by the following persons on behalf of the registrant and in the capacities and on the dates indicated.
|
|
| /s/ William R. Schuetter |
| William R. Schuetter |
| President |
| The Commerce Funds |
June 24, 2011 |
|
|
| /s/ Peter W. Fortner |
| Peter W. Fortner |
| Chief Accounting Officer |
| The Commerce Funds |
June 24, 2011 |