UNITED STATES
SECURITIES AND EXCHANGE COMMISSION
Washington, D.C. 20549
FORM N-CSR
CERTIFIED SHAREHOLDER REPORT OF REGISTERED MANAGEMENT
INVESTMENT COMPANIES
Investment Company Act file number 811-8598
The Commerce Funds
(Exact name of Registrant as specified in charter)
|
| 922 Walnut St., Fourth Floor, Mail Code = TB4-1, Kansas City, Missouri 64106 |
| (Address of principal executive offices) (Zip code) |
Diana E. McCarthy
Drinker Biddle & Reath LLP
One Logan Square
Suite 2000
Philadelphia, PA 19103-6996
(Name and address of agent for service)
Registrant’s telephone number, including area code:1-800-995-6365
Date of fiscal year end: 10/31
Date of reporting period: 10/31/17
| ITEM 1. | | REPORTS TO SHAREHOLDERS. |
The Annual Report to Shareholders pursuant to Rule 30e-1 under the Investment Company Act of 1940 (17 CFR 270.30e-1) is filed herewith.

The Commerce Funds
Annual Report
October 31, 2017
commerce funds

For Your Life’s Direction
At The Commerce Funds, we’re committed to providing sound investment choices to help you realize your most important financial goals, no matter where life takes you.
We offer a full range of mutual funds managed by Commerce Investment Advisors, Inc., a subsidiary of Commerce Bank. With a choice of 8 portfolios — each targeting a specific investment goal — we make it easy for you to invest, not just today, but throughout all the stages of your life.
Behind each of our Funds is a carefully defined investment philosophy and a commitment to the highest investment standards. This means, whether you are building a nest egg for retirement, planning for your child’s education, or saving for a special need, you can find investment options at The Commerce Funds.
Risk/Reward
The Commerce Funds
MidCap Growth
Growth
Risk
Value
Kansas Tax-Free
Intermediate Bond
Missouri Tax-Free
Intermediate Bond
Potential Return
National Tax-Free
Intermediate Bond
Bond
Short-Term Government
In general, greater returns are associated with greater risks and increased risks create the potential for greater losses.
The reports concerning the Funds included in this shareholder report may contain certain forward-looking statements about the factors that may affect the performance of the Funds in the future. These statements are based on Fund management’s predictions and expectations concerning certain future events and their expected impact on the Funds, such as performance of the economy as a whole and of specific industry sectors, changes in the levels of interest rates, the impact of developing world events, and other factors that may influence the future performance of the Funds. The Commerce Investment Advisors, Inc. (the “Adviser” or “Commerce”) believes these forward-looking statements to be reasonable, although they are inherently uncertain and difficult to predict. Actual events may cause adjustments in portfolio management strategies from those currently expected to be employed.
References to specific company’s securities should not be construed as a recommendation or investment advice and there can be no assurance that as of the date of publication of this report, the securities mentioned in each Fund’s portfolio are still held or that the securities sold have not been repurchased.
COMMERCE FUNDS
Table of Contents
Please note:
The information in this annual report is as of October 31, 2017 and is audited, except where noted. The securities mentioned in this report may no longer be held by the Funds. To view more recent information about each Commerce Fund’s performance and portfolio or to obtain a prospectus, please visit our website at www.commercefunds.com. This report is not authorized for distribution to prospective shareholders unless accompanied or preceded by a prospectus, which contains more complete information about the Commerce Funds’ investment policies, management and expenses. Investors should read the prospectus carefully before investing.
You may also receive Commerce Funds information by calling toll free 1-800-995-6365 or by writing to P.O. Box 219525, Kansas City, Missouri, 64121-9525, or you may contact your investment professional. The Commerce Funds publish performance and portfolio information for each Commerce Fund at the end of every calendar quarter. Investors should read the prospectus carefully before investing or sending money.
COMMERCE GROWTH FUND
Growth Fund Overview
We present you with the annual report for the Commerce Growth Fund for the one-year period ended October 31, 2017.
A conversation with Joe Williams, Portfolio Manager of the Growth Fund.
Q: How did the Fund perform over the review period?
A: The Fund had an annual return of 26.67%, underperforming its benchmark, the Russell 1000 Growth Index, which returned 29.71%. The Russell 1000 Growth Index reached all-time highs during the period as large cap technology companies stocks surged on the back of attractive earnings growth rates.
Q: Were there any significant adjustments made to the Fund’s portfolio during the period?
A: The Fund increased its health services sector weight to 4.6% from 1.1%, establishing an overweight position relative to the benchmark. The Fund also decreased its retail trade sector weight to 7.6% from 10.7%, establishing an underweight position relative to the benchmark.
Q: Could you describe some specific strategies and holdings that enhanced the Fund’s returns during the period?
A: The Fund’s stock selection in producer manufacturing was the largest contributor to the Fund’s performance for the period. Investments in stocks such as Mettler-Toledo International and AMETEK Inc, up 69% and 54% respectively, were top performers within the sector. The Fund’s underweight relative to the benchmark in the retail trade sector, which struggled amid competition from online retailers such as Amazon, also helped the Fund’s performance.
Q: What were some examples of strategies and holdings that didn’t work well for the Fund during the period?
A: The Fund’s underweight in electronic technology as compared to the benchmark and no allocation to the sector’s semi-conductor stocks, such as NVIDIA which was up 192%, detracted from performance. Also, the Fund’s 4% overweight to the consumer non-durables sector (only up 6.5%) detracted from performance.
2
COMMERCE GROWTH FUND
Performance Summary
October 31, 2017 (Unaudited)
The following is performance information for the Commerce Growth Fund (“Growth Fund”) for various time periods. The returns represent past performance. Past performance is no guarantee of future results. The Fund’s investment return and principal value will fluctuate so that an investor’s shares, when redeemed, may be worth more or less than their original cost. Returns do not reflect the deduction of taxes that a shareholder would pay on Fund distributions or the redemption of Fund shares. The Fund is not subject to a sales charge, so a sales charge is not applied to its total returns. In addition to the Adviser’s decisions regarding issuer/industry investment selection and allocation, other factors may affect Fund performance. These factors include, but are not limited to, Fund operating fees and expenses, portfolio turnover, and subscription and redemption cash flows affecting the Fund. Please visit our website at www.commercefunds.com to obtain the most recent month-end returns.
| | | | | | | | |
| | Performance Review | | | | | | |
| | | November 1, 2016 - October 31, 2017 | | Fund Total Return(a) | | Index Total Return(c) | | Index |
| | | Growth Fund | | 26.67% | | 29.71% | | Russell 1000® Growth(c) |
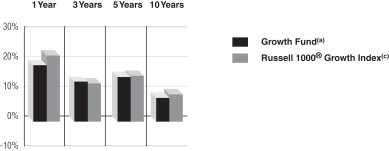
Standardized Average Annual Total Return through September 30, 2017(b)
| | | | | | | | | | |
| | Standardized Average Annual Total Return through September 30, 2017(b) | | One Year | | Three Years | | Five Years | | Ten Years |
| | | Growth Fund(a) | | 18.82% | | 13.29% | | 14.78% | | 7.90% |
| | | Russell 1000® Growth Index(c) | | 21.94% | | 12.69% | | 15.26% | | 9.08% |
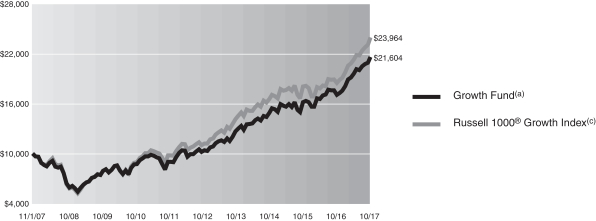
Growth Fund Shares 10 Year Performance
Performance of a $10,000 Investment, with distributions reinvested, from November 1, 2007 through October 31, 2017.
| | | | | | | | | | |
| | Average Annual Total Return through October 31, 2017 | | One Year | | Three Years | | Five Years | | Ten Years |
| | | Growth Fund(a) | | 26.67% | | 13.24% | | 16.22% | | 8.01% |
| | | | | | |
| | Expense Ratios(d) | | | | |
| | | | | Net Expense Ratio (Current) | | Gross Expense Ratio (Before Reimbursements) |
| | | Growth Fund | | 0.83% | | 0.83% |
| (a) | | Returns reflect any fee waivers or expense reductions. Returns do not reflect the deduction of taxes that a shareholder would pay on Fund distributions or the redemption of Fund shares. |
| (b) | | The Standardized Average Annual Total Returns are average annual total returns as of the most recent calendar quarter-end. They assume reinvestment of all distributions at net asset value (“NAV”). Current performance may be lower or higher than the total return figures in the above charts. Returns reflect any fee waivers and expense reductions. Absent these waivers and reductions, returns would have been lower. Returns do not reflect the deduction of taxes that a shareholder would pay on capital gains or other taxable distributions or the redemption of Fund shares. |
| (c) | | The Russell 1000® Growth Index, an unmanaged index, measures the performance of the large-cap growth segment of the U.S. equity universe. It includes those Russell 1000 companies with higher price-to-book ratios and higher forecasted growth values. The Index figures do not reflect any deduction for fees, taxes or expenses. |
| (d) | | The Fund’s expense ratios, both net (net of applicable fee waivers and/or expense reimbursements) and gross (before applicable fee waivers and/or expense reimbursements), set forth above are as of the most recent publicly available prospectus for the Fund (March 1, 2017) and may differ from the expense ratios disclosed in the Financial Highlights in this report. The Adviser has contractually agreed to reduce or limit the Total Annual Fund Operating Expenses, excluding interest, taxes, acquired fund fees and expenses and extraordinary expenses. This agreement will remain in place through March 1, 2018. After this date, the Adviser or the Fund may terminate the contractual arrangement. If this occurs, the expense ratios may change without shareholder approval. |
3
COMMERCE GROWTH FUND
Schedule of Investments
October 31, 2017
| | | | | | | | |
| | |
| Shares | | | Description | | Value | |
| | Common Stocks – 98.8% | |
| | Commercial Services – 1.0% | |
| | 18,800 | | | CDK Global, Inc. | | | $ 1,194,928 | |
| | |
| | Communications – 1.2% | |
| | 29,300 | | | Verizon Communications, Inc. | | | 1,402,591 | |
| | |
| | Consumer Durables – 2.2% | |
| | 31,065 | | | Newell Brands, Inc. | | | 1,266,831 | |
| | 28,500 | | | Toll Brothers, Inc. | | | 1,312,140 | |
| | | | | | | | |
| | | | 2,578,971 | |
| | |
| | Consumer Non-Durables – 8.5% | |
| | 18,500 | | | Colgate-Palmolive Co. | | | 1,303,325 | |
| | 12,100 | | | Dr Pepper Snapple Group, Inc. | | | 1,036,486 | |
| | 19,400 | | | Kellogg Co. | | | 1,213,082 | |
| | 11,100 | | | Kimberly-Clark Corp. | | | 1,248,861 | |
| | 11,700 | | | PepsiCo, Inc. | | | 1,289,691 | |
| | 11,400 | | | Philip Morris International, Inc. | | | 1,192,896 | |
| | 29,000 | | | The Coca-Cola Co. | | | 1,333,420 | |
| | 12,200 | | | The Estee Lauder Cos., Inc. Class A | | | 1,364,082 | |
| | | | | | | | |
| | | | 9,981,843 | |
| | |
| | Consumer Services – 7.8% | |
| | 22,800 | | | CBS Corp. Class B | | | 1,279,536 | |
| | 34,700 | | | Comcast Corp. Class A | | | 1,250,241 | |
| | 8,600 | | | McDonald’s Corp. | �� | | 1,435,426 | |
| | 25,500 | | | Rollins, Inc. | | | 1,119,705 | |
| | 38,300 | | | Service Corp. International | | | 1,358,118 | |
| | 25,400 | | | Starbucks Corp. | | | 1,392,936 | |
| | 13,700 | | | The Walt Disney Co. | | | 1,339,997 | |
| | | | | | | | |
| | | | 9,175,959 | |
| | |
| | Electronic Technology – 15.1% | |
| | 17,100 | | | Agilent Technologies, Inc. | | | 1,163,313 | |
| | 15,900 | | | Amphenol Corp. Class A | | | 1,383,300 | |
| | 40,400 | | | Apple, Inc. | | | 6,829,216 | |
| | 5,500 | | | Broadcom, Ltd. | | | 1,451,505 | |
| | 29,300 | | | Cadence Design Systems, Inc.* | | | 1,264,588 | |
| | 47,200 | | | Corning, Inc. | | | 1,477,832 | |
| | 4,400 | | | Lockheed Martin Corp. | | | 1,355,904 | |
| | 5,510 | | | The Boeing Co. | | | 1,421,470 | |
| | 6,900 | | | Thermo Fisher Scientific, Inc. | | | 1,337,427 | |
| | | | | | | | |
| | | | 17,684,555 | |
| | |
| | Finance – 9.9% | |
| | 12,600 | | | Crown Castle International Corp. | | | 1,349,208 | |
| | 8,700 | | | Digital Realty Trust, Inc. | | | 1,030,428 | |
| | 8,900 | | | Erie Indemnity Co. Class A | | | 1,075,120 | |
| | 14,300 | | | Fidelity National Information Services, Inc. | | | 1,326,468 | |
| | 20,400 | | | Intercontinental Exchange, Inc. | | | 1,348,440 | |
| | 9,500 | | | Mastercard, Inc. Class A | | | 1,413,315 | |
| | 6,500 | | | Public Storage | | | 1,347,125 | |
| | 14,000 | | | T. Rowe Price Group, Inc. | | | 1,300,600 | |
| | 13,200 | | | Visa, Inc. Class A | | | 1,451,736 | |
| | | | | | | | |
| | | | 11,642,440 | |
| | |
| | | | | | | | |
| | |
| Shares | | | Description | | Value | |
| | Common Stocks – (continued) | |
| | Health Services – 4.6% | |
| | 7,300 | | | Anthem, Inc. | | | $ 1,527,233 | |
| | 15,600 | | | Cerner Corp.* | | | 1,053,312 | |
| | 16,900 | | | HCA Healthcare, Inc.* | | | 1,278,485 | |
| | 7,300 | | | UnitedHealth Group, Inc. | | | 1,534,606 | |
| | | | | | | | |
| | | | 5,393,636 | |
| | |
| | Health Technology – 7.8% | |
| | 7,000 | | | Amgen, Inc. | | | 1,226,540 | |
| | 6,600 | | | Becton Dickinson & Co. | | | 1,377,222 | |
| | 9,600 | | | Bio-Techne Corp. | | | 1,257,792 | |
| | 9,900 | | | Celgene Corp.* | | | 999,603 | |
| | 10,100 | | | Johnson & Johnson | | | 1,408,041 | |
| | 9,300 | | | Stryker Corp. | | | 1,440,291 | |
| | 11,900 | | | Zimmer Biomet Holdings, Inc. | | | 1,447,278 | |
| | | | | | | | |
| | | | 9,156,767 | |
| | |
| | Industrial Services – 1.2% | |
| | 17,100 | | | Waste Management, Inc. | | | 1,405,107 | |
| | |
| | Process Industries – 4.5% | |
| | 10,200 | | | Ecolab, Inc. | | | 1,332,732 | |
| | 10,300 | | | Praxair, Inc. | | | 1,505,036 | |
| | 22,800 | | | RPM International, Inc. | | | 1,215,924 | |
| | 12,100 | | | The Scotts Miracle-Gro Co. | | | 1,205,402 | |
| | | | | | | | |
| | | | 5,259,094 | |
| | |
| | Producer Manufacturing – 7.8% | |
| | 16,600 | | | AMETEK, Inc. | | | 1,120,334 | |
| | 9,600 | | | Honeywell International, Inc. | | | 1,383,936 | |
| | 9,500 | | | Illinois Tool Works, Inc. | | | 1,486,940 | |
| | 6,400 | | | Lennox International, Inc. | | | 1,223,232 | |
| | 1,700 | | | Mettler-Toledo International, Inc.* | | | 1,160,471 | |
| | 10,200 | | | Nordson Corp. | | | 1,292,238 | |
| | 5,700 | | | Roper Technologies, Inc. | | | 1,471,569 | |
| | | | | | | | |
| | | | 9,138,720 | |
| | |
| | Retail Trade – 7.6% | |
| | 2,900 | | | Amazon.com, Inc.* | | | 3,205,312 | |
| | 17,000 | | | Lowe’s Cos., Inc. | | | 1,359,150 | |
| | 22,100 | | | Ross Stores, Inc. | | | 1,403,129 | |
| | 8,300 | | | The Home Depot, Inc. | | | 1,375,974 | |
| | 3,800 | | | The Sherwin-Williams Co. | | | 1,501,570 | |
| | | | | | | | |
| | | | 8,845,135 | |
| | |
| | Technology Services – 18.4% | |
| | 8,300 | | | Adobe Systems, Inc.* | | | 1,453,828 | |
| | 4,600 | | | Alphabet, Inc. Class A* | | | 4,751,984 | |
| | 12,400 | | | Automatic Data Processing, Inc. | | | 1,441,624 | |
| | 11,400 | | | Euronet Worldwide, Inc.* | | | 1,101,696 | |
| | 17,600 | | | Facebook, Inc. Class A* | | | 3,169,056 | |
| | 10,800 | | | Fiserv, Inc.* | | | 1,397,844 | |
| | 10,800 | | | Jack Henry & Associates, Inc. | | | 1,189,404 | |
| | 57,500 | | | Microsoft Corp. | | | 4,782,850 | |
| | 19,100 | | | Paychex, Inc. | | | 1,218,389 | |
| | 34,000 | | | Symantec Corp. | | | 1,105,000 | |
| | | | | | | | |
| | | | 21,611,675 | |
| | |
| | |
| 4 | | The accompanying notes are an integral part of these financial statements. |
COMMERCE GROWTH FUND
| | | | | | | | |
| | |
| Shares | | | Description | | Value | |
| | Common Stocks – (continued) | |
| | Transportation – 1.2% | |
| | 11,900 | | | United Parcel Service, Inc. Class B | | | $ 1,398,607 | |
| | |
| | TOTAL COMMON STOCKS | |
| | (Cost $84,090,029) | | | $115,870,028 | |
| | |
| | | | | | | | | | | | |
Principal
Amount | | Interest
Rate | | | Maturity
Date | | | Value | |
| Short-term Investment(a) – 1.2% | |
Repurchase Agreement – 1.2% | |
| Fixed Income Clearing Corp. | |
| $1,373,000 | | | 0.120 | % | | | 11/01/17 | | | $ | 1,373,000 | |
Maturity Value: $1,373,009 | |
(Cost $1,373,000) | | | | | | | | | |
| |
| TOTAL INVESTMENTS – 100.0% | |
(Cost $85,463,029) | | | $ | 117,243,028 | |
| |
OTHER ASSETS IN EXCESS OF LIABILITIES – 0.0% | | | | 57,778 | |
| |
| NET ASSETS – 100.0% | | | $ | 117,300,806 | |
| |
| | |
| The percentage shown for each investment category reflects the value of investments in that category as a percentage of net assets. |
| |
| * | | Non-income producing security. |
| |
| (a) | | Repurchase agreement was entered into on October 31, 2017. This agreement was fully collateralized by $1,385,000 U.S. Treasury Note, 2.875%, due 11/15/46 with a market value of $1,401,929. |
|
PORTFOLIO COMPOSITION
| | | | | | | | |
| | | AS OF
10/31/2017 | | | AS OF
10/31/2016 | |
| |
Technology Services | | | 18.4 | % | | | 18.2 | % |
Electronic Technology | | | 15.1 | | | | 11.6 | |
Finance | | | 9.9 | | | | 11.9 | |
Consumer Non-Durables | | | 8.5 | | | | 11.0 | |
Consumer Services | | | 7.8 | | | | 7.9 | |
Health Technology | | | 7.8 | | | | 7.3 | |
Producer Manufacturing | | | 7.8 | | | | 7.4 | |
Retail Trade | | | 7.6 | | | | 10.7 | |
Health Services | | | 4.6 | | | | 1.1 | |
Process Industries | | | 4.5 | | | | 3.3 | |
Consumer Durables | | | 2.2 | | | | 1.1 | |
Industrial Services | | | 1.2 | | | | 1.3 | |
Communications | | | 1.2 | | | | 1.1 | |
Transportation | | | 1.2 | | | | 1.2 | |
Repurchase Agreement | | | 1.2 | | | | 1.7 | |
Commercial Services | | | 1.0 | | | | — | |
Distribution Services | | | — | | | | 1.9 | |
Exchange Traded Fund | | | — | | | | 1.6 | |
| |
| TOTAL INVESTMENTS | | | 100.0 | % | | | 100.3 | % |
| |
The percentage shown for each investment category reflects the value of investments in that category as a percentage of net assets. Underlying investment categories of investment companies, including exchange traded funds, held by the Fund are not reflected in the table above. Consequently, the Fund’s overall investment category allocations may differ from the percentages contained in the table above.
The Fund is actively managed and, as such, its composition may differ over time.
| | |
| The accompanying notes are an integral part of these financial statements. | | 5 |
COMMERCE VALUE FUND
Value Fund Overview
We present you with the annual report for the Commerce Value Fund for the one-year period ended October 31, 2017.
A conversation with Matt Schmitt, Portfolio Manager of the Value Fund.
Q: How did the Fund perform over the review period?
A: The Fund underperformed its benchmark index by 2.49% with a return of 15.29% over the 12 month period ending October 31, 2017, while the Russell 1000 Value Index returned 17.78%. Allocations to and stock selection within electronic technology and consumer services had the greatest positive effect on Fund performance over the year. However, retail trade, commercial services, and technology services offset the positive performance for the 12 month period.
Q: Were there any significant adjustments made to the Fund’s portfolio during the period?
A: There were a few modest adjustments made to the Fund’s sector allocations during the 12 month period. The two largest sector increases were to health technology from 8.4% to 12.0% and finance from 22.5% to 26.3%. The two largest reductions were made to retail trade from 5.9% to 2.6% and technology services from 5.9% to 2.1%.
Q: Could you describe some specific strategies and holdings that enhanced the Fund’s returns during the period?
A: The Fund benefited from the security selection within electronic technology and producer manufacturing with overweight positions relative to the benchmark in Boeing Company, HP Inc., Caterpillar Inc., and Emerson Electric Co. returning 86.65%, 53.29%, 67.58%, and 31.44%, respectively. Further performance was captured by allocating to McDonald’s Corporation which returned 52.35% with a 2.01% allocation versus the index with a 0% allocation.
Q: What were some examples of strategies and holdings that didn’t work well for the Fund during the period?
A: The Fund’s security selection in the retail trade and commercial services sectors with Macy’s Inc, Target Corporation, and Omnicom Group Inc. proved to be a detractor to performance, down -45.67%, -18.53%, and -19.10% respectively. Poor stock selection within consumer durables sector detracted from performance with Tupperware Brands Corporation up 3.23% while the sector as a whole outperformed the benchmark returning 26.10%.
6
COMMERCE VALUE FUND
Performance Summary
October 31, 2017 (Unaudited)
The following is performance information for the Commerce Value Fund (“Value Fund”) for various time periods. The returns represent past performance. Past performance is no guarantee of future results. The Fund’s investment return and principal value will fluctuate so that an investor’s shares, when redeemed, may be worth more or less than their original cost. Returns do not reflect the deduction of taxes that a shareholder would pay on Fund distributions or the redemption of Fund shares. The Fund is not subject to a sales charge, so a sales charge is not applied to its total returns. In addition to the Adviser’s decisions regarding issuer/industry investment selection and allocation, other factors may affect Fund performance. These factors include, but are not limited to, Fund operating fees and expenses, portfolio turnover, and subscription and redemption cash flows affecting the Fund. Please visit our website at www.commercefunds.com to obtain the most recent month-end returns.
| | | | | | | | |
| | Performance Review | | |
| | | November 1, 2016 - October 31, 2017 | | Fund Total Return(a) | | Index Total Return(c) | | Index |
| | | Value Fund | | 15.29% | | 17.78% | | Russell 1000® Value(c) |
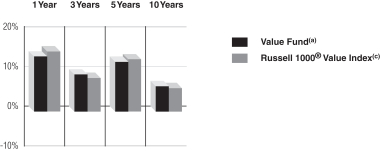
Standardized Average Annual Total Return through September 30, 2017(b)
| | | | | | | | | | |
| | Standardized Average Annual Total Return through September 30, 2017(b) | | One Year | | Three Years | | Five Years | | Ten Years |
| | | Value Fund(a) | | 13.90% | | 9.43% | | 12.59% | | 6.44% |
| | | Russell 1000® Value Index(c) | | 15.12% | | 8.53% | | 13.20% | | 5.92% |
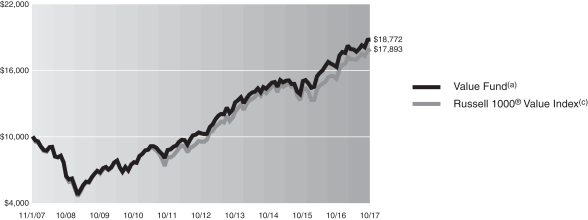
Value Fund Shares 10 Year Performance
Performance of a $10,000 Investment, with distributions reinvested, from November 1, 2007 through October 31, 2017.
| | | | | | | | | | |
| | Average Annual Total Return through October 31, 2017 | | One Year | | Three Years | | Five Years | | Ten Years |
| | | Value Fund(a) | | 15.29% | | 8.77% | | 12.85% | | 6.50% |
| | | | | | |
| | Expense Ratios(d) | | | | |
| | | | | Net Expense Ratio (Current) | | Gross Expense Ratio (Before Reimbursements) |
| | | Value Fund | | 0.71% | | 0.75% |
| (a) | | Returns reflect any fee waivers or expense reductions. Returns do not reflect the deduction of taxes that a shareholder would pay on Fund distributions or the redemption of Fund shares. |
| (b) | | The Standardized Average Annual Total Returns are average annual total returns as of the most recent calendar quarter-end. They assume reinvestment of all distributions at NAV. Current performance may be lower or higher than the total return figures in the above charts. |
Returns reflect any fee waivers and expense reductions. Absent these waivers and reductions, returns would have been lower. Returns do not reflect the deduction of taxes that a shareholder would pay on capital gains or other taxable distributions or the redemption of Fund shares.
| (c) | | The Russell 1000 ® Value Index, an unmanaged index, measures the performance of the large-cap value segment of the U.S. equity universe. It includes Russell 1000 companies with lower price-to-book ratios and lower expected growth values. The Index figures do not reflect any deduction for fees, taxes or expenses. |
| (d) | | The Fund’s expense ratios, both net (net of applicable fee waivers and/or expense reimbursements) and gross (before applicable fee waivers and/or expense reimbursements), set forth above are as of the most recent publicly available prospectus for the Fund (March 1, 2017) and may differ from the expense ratios disclosed in the Financial Highlights in this report. The Adviser has contractually agreed to reduce or limit the Total Annual Fund Operating Expenses, excluding interest, taxes, acquired fund fees and expenses and extraordinary expenses. This agreement will remain in place through March 1, 2018. After this date, the Adviser or the Fund may terminate the contractual arrangement. If this occurs, the expense ratios may change without shareholder approval. |
7
COMMERCE VALUE FUND
Schedule of Investments
October 31, 2017
| | | | | | | | |
| | |
| Shares | | | Description | | Value | |
| | Common Stocks – 98.6% | |
| | Commercial Services – 1.8% | |
| | 66,000 | | | Omnicom Group, Inc. | | | $ 4,434,540 | |
| | |
| | Communications – 5.5% | |
| | 267,000 | | | AT&T, Inc. | | | 8,984,550 | |
| | 103,500 | | | Verizon Communications, Inc. | | | 4,954,545 | |
| | | | | | | | |
| | | | | | | 13,939,095 | |
| | |
| | Consumer Durables – 1.9% | |
| | 81,500 | | | Tupperware Brands Corp. | | | 4,788,125 | |
| | |
| | Consumer Non-Durables – 8.4% | |
| | 60,000 | | | Kimberly-Clark Corp. | | | 6,750,600 | |
| | 42,000 | | | PepsiCo, Inc. | | | 4,629,660 | |
| | 52,000 | | | Procter & Gamble Co. | | | 4,489,680 | |
| | 76,500 | | | V. F. Corp. | | | 5,328,225 | |
| | | | | | | | |
| | | | | | | 21,198,165 | |
| | |
| | Consumer Services – 2.1% | |
| | 31,000 | | | McDonald’s Corp. | | | 5,174,210 | |
| | |
| | Electronic Technology – 8.2% | |
| | 149,000 | | | Cisco Systems, Inc. | | | 5,088,350 | |
| | 248,500 | | | HP, Inc. | | | 5,355,175 | |
| | 16,000 | | | Lockheed Martin Corp. | | | 4,930,560 | |
| | 20,000 | | | The Boeing Co. | | | 5,159,600 | |
| | | | | | | | |
| | | | | | | 20,533,685 | |
| | |
| | Energy Minerals – 9.6% | |
| | 97,000 | | | Chevron Corp. | | | 11,241,330 | |
| | 91,000 | | | Exxon Mobil Corp. | | | 7,584,850 | |
| | 80,000 | | | Occidental Petroleum Corp. | | | 5,165,600 | |
| | | | | | | | |
| | | | | | | 23,991,780 | |
| | |
| | Finance – 26.3% | |
| | 35,000 | | | Ameriprise Financial, Inc. | | | 5,478,900 | |
| | 80,000 | | | Arthur J. Gallagher & Co. | | | 5,066,400 | |
| | 108,000 | | | BB&T Corp. | | | 5,317,920 | |
| | 37,000 | | | CME Group, Inc. | | | 5,075,290 | |
| | 106,000 | | | JPMorgan Chase & Co. | | | 10,664,660 | |
| | 181,000 | | | Kimco Realty Corp. | | | 3,286,960 | |
| | 286,000 | | | People’s United Financial, Inc. | | | 5,336,760 | |
| | 77,500 | | | Principal Financial Group, Inc. | | | 5,103,375 | |
| | 23,500 | | | Public Storage | | | 4,870,375 | |
| | 57,000 | | | T. Rowe Price Group, Inc. | | | 5,295,300 | |
| | 187,000 | | | Wells Fargo & Co. | | | 10,498,180 | |
| | | | | | | | |
| | | | | | | 65,994,120 | |
| | |
| | Health Technology – 12.0% | |
| | 38,000 | | | Amgen, Inc. | | | 6,658,360 | |
| | 64,000 | | | Johnson & Johnson | | | 8,922,240 | |
| | 111,000 | | | Merck & Co., Inc. | | | 6,114,990 | |
| | 239,500 | | | Pfizer, Inc. | | | 8,396,870 | |
| | | | | | | | |
| | | | | | | 30,092,460 | |
| | |
| | Industrial Services – 1.9% | |
| | 86,000 | | | ONEOK, Inc. | | | 4,667,220 | |
| | |
| | | | | | | | |
| | |
| Shares | | | Description | | Value | |
| | Common Stocks – (continued) | |
| | Process Industries – 4.1% | |
| | 32,500 | | | Air Products & Chemicals, Inc. | | | $ 5,181,475 | |
| | 99,500 | | | Sonoco Products Co. | | | 5,153,105 | |
| | | | | | | | |
| | | | | | | 10,334,580 | |
| | |
| | Producer Manufacturing – 4.2% | |
| | 40,000 | | | Caterpillar, Inc. | | | 5,432,000 | |
| | 79,000 | | | Emerson Electric Co. | | | 5,092,340 | |
| | | | | | | | |
| | | | 10,524,340 | |
| | |
| | Retail Trade – 2.6% | |
| | 83,500 | | | Kohl’s Corp. | | | 3,486,960 | |
| | 163,000 | | | Macy’s, Inc. | | | 3,057,880 | |
| | | | | | | | |
| | | | 6,544,840 | |
| | |
| | Technology Services – 2.1% | |
| | 83,000 | | | Paychex, Inc. | | | 5,294,570 | |
| | |
| | Utilities – 7.9% | |
| | 62,000 | | | Dominion Energy, Inc. | | | 5,030,680 | |
| | 32,500 | | | NextEra Energy, Inc. | | | 5,039,775 | |
| | 124,000 | | | PPL Corp. | | | 4,657,440 | |
| | 97,000 | | | The Southern Co. | | | 5,063,400 | |
| | | | | | | | |
| | | | 19,791,295 | |
| | |
| | TOTAL COMMON STOCKS | |
| | (Cost $215,993,666) | | | $247,303,025 | |
| | |
| | | | | | | | |
| | Exchange Traded Fund – 2.4% | |
| | 50,000 | | | iShares Russell 1000 Value Index Fund | |
| | (Cost $5,863,745) | | | $ 5,969,500 | |
| | |
| | TOTAL INVESTMENTS – 101.0% | |
| | (Cost $221,857,411) | | | $253,272,525 | |
| | |
| LIABILITIES IN EXCESS OF OTHER
ASSETS – (1.0)% | | | (2,517,579) | |
| | |
| | NET ASSETS – 100.0% | | | $250,754,946 | |
| | |
| | | | |
| The percentage shown for each investment category reflects the value of investments in that category as a percentage of net assets. |
| | |
| 8 | | The accompanying notes are an integral part of these financial statements. |
COMMERCE VALUE FUND
PORTFOLIO COMPOSITION
| | | | | | | | |
| | | AS OF
10/31/2017 | | | AS OF
10/31/2016 | |
| |
Finance | | | 26.3 | % | | | 22.5 | % |
Health Technology | | | 12.0 | | | | 8.4 | |
Energy Minerals | | | 9.6 | | | | 9.7 | |
Consumer Non-Durables | | | 8.4 | | | | 5.7 | |
Electronic Technology | | | 8.2 | | | | 8.1 | |
Utilities | | | 7.9 | | | | 7.8 | |
Communications | | | 5.5 | | | | 5.5 | |
Producer Manufacturing | | | 4.2 | | | | 7.3 | |
Process Industries | | | 4.1 | | | | 3.7 | |
Retail Trade | | | 2.6 | | | | 5.9 | |
Exchange Traded Fund | | | 2.4 | | | | 1.5 | |
Technology Services | | | 2.1 | | | | 5.9 | |
Consumer Services | | | 2.1 | | | | 1.9 | |
Consumer Durables | | | 1.9 | | | | 1.9 | |
Industrial Services | | | 1.9 | | | | 2.0 | |
Commercial Services | | | 1.8 | | | | 1.4 | |
Repurchase Agreement | | | — | | | | 1.6 | |
| |
| TOTAL INVESTMENTS | | | 101.0 | % | | | 100.8 | % |
| |
The percentage shown for each investment category reflects the value of investments in that category as a percentage of net assets. Underlying investment categories of investment companies, including exchange traded funds, held by the Fund are not reflected in the table above. Consequently, the Fund’s overall investment category allocations may differ from the percentages contained in the table above.
The Fund is actively managed and, as such, its composition may differ over time.
| | |
| The accompanying notes are an integral part of these financial statements. | | 9 |
COMMERCE MIDCAP GROWTH FUND
MidCap Growth Fund Overview
We present you with the annual report for the Commerce MidCap Growth Fund for the one-year period ended October 31, 2017.
A conversation with Joe Williams, Portfolio Manager of the MidCap Growth Fund.
Q: How did the Fund perform over the review period?
A: The Fund has an annual return of 23.03%, underperforming its benchmark, the Russell Mid Cap Growth Index, which returned of 26.25%. The Russell Mid Cap Growth Index reached all-time highs during the period as technology companies stocks surged on the back of attractive earnings growth rates.
Q: Were there any significant adjustments made to the Fund’s portfolio during the period?
A: The Fund increased its weight in the electronic technology sector by 2.7% to 10.1%. During the period, electronic technology’s weight in the benchmark grew from 9.5% to 15%, despite the Fund’s 2.7% increase to the sector, it remains underweight to electronic technology. The Fund also reduced its retail trade sector weight by 3.4% to 2.6%. This maintained the Fund’s underweight to the sector’s declining weight in the benchmark, as retail trade’s benchmark weight fell from 9.0% to 5.3% during the period.
Q: Could you describe some specific strategies and holdings that enhanced the Fund’s returns during the period?
A: The Fund’s strong stock selection in retail trade and avoiding some of the sector’s weakest performers were the biggest contributors to the Fund’s performance for the period. Good stock selection and an overweight to the strong performing consumer services sector (up 24%) also boosted performance.
Q: What were some examples of strategies and holdings that didn’t work well for the Fund during the period?
A: The Fund’s underweight relative to the benchmark (10.1% vs. 15.0%) in the electronic technology sector (up 57%) and no allocation to the sector’s semi-conductor stocks, such as NVIDIA which was up 192%, detracted from performance.
10
COMMERCE MIDCAP GROWTH FUND
Performance Summary
October 31, 2017 (Unaudited)
The following is performance information for the Commerce MidCap Growth Fund (“MidCap Growth”) for various time periods. The returns represent past performance. Past performance is no guarantee of future results. The Fund’s investment return and principal value will fluctuate so that an investor’s shares, when redeemed, may be worth more or less than their original cost. Returns do not reflect the deduction of taxes that a shareholder would pay on Fund distributions or the redemption of Fund shares. The Fund is not subject to a sales charge, so a sales charge is not applied to its total returns. In addition to the Adviser’s decisions regarding issuer/industry investment selection and allocation, other factors may affect Fund performance. These factors include, but are not limited to, Fund operating fees and expenses, portfolio turnover, and subscription and redemption cash flows affecting the Fund. Please visit our website at www.commercefunds.com to obtain the most recent month-end returns.
| | | | | | | | |
| | Performance Review | | |
| | | November 1, 2016 - October 31, 2017 | | Fund Total Return(a) | | Index Total Return(c) | | Index |
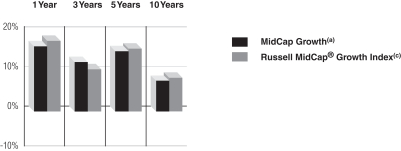
| | | MidCap Growth | | 23.03% | | 26.25% | | Russell Midcap® Growth(c) |
Standardized Average Annual Total Return through September 30, 2017(b)
| | | | | | | | | | |
| | Standardized Average Annual Total Return through September 30, 2017(b) | | One Year | | Three Years | | Five Years | | Ten Years |
| | | MidCap Growth(a) | | 16.42% | | 11.69% | | 13.72% | | 7.79% |
| | | Russell MidCap® Growth Index(c) | | 17.82% | | 9.96% | | 14.18% | | 8.20% |
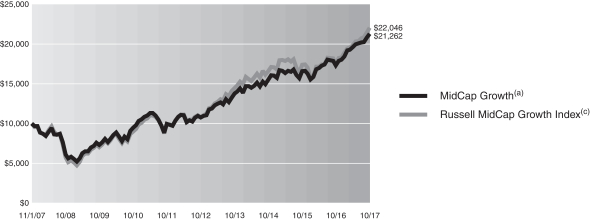
MidCap Growth Fund Shares 10 Year Performance
Performance of a $10,000 Investment, with distributions reinvested, from November 1, 2007 through October 31, 2017.
| | | | | | | | | | |
| | Average Annual Total Return through October 31, 2017 | | One Year | | Three Years | | Five Years | | Ten Years |
| | | MidCap Growth(a) | | 23.03% | | 11.13% | | 14.60% | | 7.84% |
| | | | | | |
| | Expense Ratios(d) | | | | |
| | | | | Net Expense Ratio (Current) | | Gross Expense Ratio (Before Reimbursements) |
| | | MidCap Growth | | 0.88% | | 0.88% |
| (a) | | Returns reflect any fee waivers or expense reductions. Returns do not reflect the deduction of taxes that a shareholder would pay on Fund distributions or the redemption of Fund shares. |
| (b) | | The Standardized Average Annual Total Returns are average annual total returns as of the most recent calendar quarter-end. They assume reinvestment of all distributions at NAV. Current performance may be lower or higher than the total return figures in the above charts. |
Returns reflect any fee waivers and expense reductions. Absent these waivers and reductions, returns would have been lower. Returns do not reflect the deduction of taxes that a shareholder would pay on capital gains or other taxable distributions or the redemption of Fund shares.
| (c) | | The Russell Midcap® Growth Index, an unmanaged index, measures the performance of the mid-cap growth segment at the U.S. equity universe. It includes those Russell Midcap Index companies with higher price-to-book ratios and higher forecasted growth values. The Index figures do not reflect any deduction for fees, taxes, or expenses. |
| (d) | | The Fund’s expense ratios, both net (net of applicable fee waivers and/or expense limitations) and gross (before applicable fee waivers and/or expense limitations), set forth above are as of the most recent publicly available prospectus for the Fund (March 1, 2017) and may differ from the expense ratios disclosed in the Financial Highlights in this report. Applicable waivers and expense limitations are voluntary and may be modified or terminated at any time by the Adviser. If this occurs, the expense ratios may change without shareholder approval. |
11
COMMERCE MIDCAP GROWTH FUND
Schedule of Investments
October 31, 2017
| | | | | | | | |
| | |
| Shares | | | Description | | Value | |
| | Common Stocks – 96.7% | |
| | Commercial Services – 8.6% | |
| | 22,200 | | | Bright Horizons Family Solutions, Inc.* | | | $ 1,915,860 | |
| | 11,100 | | | FactSet Research Systems, Inc. | | | 2,107,557 | |
| | 14,000 | | | Gartner, Inc.* | | | 1,754,340 | |
| | 38,100 | | | KAR Auction Services, Inc. | | | 1,803,273 | |
| | 14,900 | | | MSCI, Inc. | | | 1,748,664 | |
| | 24,000 | | | Omnicom Group, Inc. | | | 1,612,560 | |
| | 16,200 | | | WEX, Inc.* | | | 2,002,158 | |
| | | | | | | | |
| | | | 12,944,412 | |
| | |
| | Consumer Durables – 7.1% | |
| | 38,300 | | | Leggett & Platt, Inc. | | | 1,810,058 | |
| | 6,700 | | | Mohawk Industries, Inc.* | | | 1,753,792 | |
| | 38,536 | | | Newell Brands, Inc. | | | 1,571,498 | |
| | 28,500 | | | The Toro Co. | | | 1,791,225 | |
| | 43,700 | | | Toll Brothers, Inc. | | | 2,011,948 | |
| | 30,100 | | | Tupperware Brands Corp. | | | 1,768,375 | |
| | | | | | | | |
| | | | 10,706,896 | |
| | |
| | Consumer Non-Durables – 9.3% | |
| | 66,300 | | | Blue Buffalo Pet Products, Inc.* | | | 1,918,059 | |
| | 31,900 | | | Brown-Forman Corp. Class B | | | 1,818,938 | |
| | 19,700 | | | Carter’s, Inc. | | | 1,905,581 | |
| | 35,200 | | | Church & Dwight Co., Inc. | | | 1,589,984 | |
| | 19,100 | | | Dr Pepper Snapple Group, Inc. | | | 1,636,106 | |
| | 16,800 | | | McCormick & Co., Inc. | | | 1,672,104 | |
| | 42,700 | | | Tapestry, Inc. | | | 1,748,565 | |
| | 16,000 | | | The Hershey Co. | | | 1,698,880 | |
| | | | | | | | |
| | | | 13,988,217 | |
| | |
| | Consumer Services – 6.1% | |
| | 38,350 | | | Rollins, Inc. | | | 1,683,948 | |
| | 49,400 | | | Service Corp. International | | | 1,751,724 | |
| | 32,700 | | | Six Flags Entertainment Corp. | | | 2,053,233 | |
| | 120,600 | | | The Wendy’s Co. | | | 1,834,326 | |
| | 17,500 | | | Wyndham Worldwide Corp. | | | 1,869,875 | |
| | | | | | | | |
| | | | 9,193,106 | |
| | |
| | Electronic Technology – 10.1% | |
| | 21,400 | | | Amphenol Corp. Class A | | | 1,861,800 | |
| | 32,200 | | | BWX Technologies, Inc. | | | 1,929,424 | |
| | 44,900 | | | Cadence Design Systems, Inc.* | | | 1,937,884 | |
| | 20,300 | | | HEICO Corp. | | | 1,840,804 | |
| | 37,800 | | | Maxim Integrated Products, Inc. | | | 1,986,012 | |
| | 20,500 | | | Motorola Solutions, Inc. | | | 1,856,070 | |
| | 44,900 | | | NetApp, Inc. | | | 1,994,458 | |
| | 44,600 | | | Trimble, Inc.* | | | 1,823,248 | |
| | | | | | | | |
| | | | 15,229,700 | |
| | |
| | Energy Minerals – 1.4% | |
| | 17,400 | | | Cimarex Energy Co. | | | 2,034,582 | |
| | |
| | Finance – 12.0% | |
| | 136,300 | | | BGC Partners, Inc. Class A | | | 2,067,671 | |
| | 14,500 | | | Boston Properties, Inc. | | | 1,757,110 | |
| | 16,400 | | | CBOE Holdings, Inc. | | | 1,854,184 | |
| | |
| | | | | | | | |
| | |
| Shares | | | Description | | Value | |
| | Common Stocks – (continued) | |
| | Finance – (continued) | |
| | 14,300 | | | Erie Indemnity Co. Class A | | | $ 1,727,440 | |
| | 21,300 | | | Extra Space Storage, Inc. | | | 1,737,867 | |
| | 13,600 | | | Federal Realty Investment Trust | | | 1,639,072 | |
| | 44,400 | | | Gaming and Leisure Properties, Inc. | | | 1,622,376 | |
| | 21,800 | | | Morningstar, Inc. | | | 1,857,578 | |
| | 11,500 | | | SBA Communications Corp.* | | | 1,807,570 | |
| | 21,000 | | | T. Rowe Price Group, Inc. | | | 1,950,900 | |
| | | | | | | | |
| | | | 18,021,768 | |
| | |
| | Health Services* – 3.4% | |
| | 24,600 | | | Cerner Corp. | | | 1,660,992 | |
| | 31,000 | | | LifePoint Health, Inc. | | | 1,492,650 | |
| | 17,900 | | | Quintiles IMS Holdings, Inc. | | | 1,934,990 | |
| | | | | | | | |
| | | | 5,088,632 | |
| | |
| | Health Technology – 9.5% | |
| | 14,600 | | | Bio-Techne Corp. | | | 1,912,892 | |
| | 44,500 | | | Hologic, Inc.* | | | 1,684,325 | |
| | 11,000 | | | IDEXX Laboratories, Inc.* | | | 1,827,870 | |
| | 53,900 | | | QIAGEN NV* | | | 1,825,054 | |
| | 6,800 | | | The Cooper Cos., Inc. | | | 1,633,768 | |
| | 18,700 | | | West Pharmaceutical Services, Inc. | | | 1,896,180 | |
| | 14,900 | | | Zimmer Biomet Holdings, Inc. | | | 1,812,138 | |
| | 26,700 | | | Zoetis, Inc. | | | 1,703,994 | |
| | | | | | | | |
| | | | 14,296,221 | |
| | |
| | Process Industries – 4.8% | |
| | 29,500 | | | Crown Holdings, Inc.* | | | 1,775,015 | |
| | 35,000 | | | RPM International, Inc. | | | 1,866,550 | |
| | 40,300 | | | Sealed Air Corp. | | | 1,782,469 | |
| | 18,300 | | | The Scotts Miracle-Gro Co. | | | 1,823,046 | |
| | | | | | | | |
| | | | 7,247,080 | |
| | |
| | Producer Manufacturing – 10.0% | |
| | 27,700 | | | AMETEK, Inc. | | | 1,869,473 | |
| | 26,500 | | | Fortive Corp. | | | 1,914,890 | |
| | 14,700 | | | Graco, Inc. | | | 1,937,313 | |
| | 14,300 | | | IDEX Corp. | | | 1,833,403 | |
| | 2,700 | | | Mettler-Toledo International, Inc.* | | | 1,843,101 | |
| | 15,800 | | | Nordson Corp. | | | 2,001,702 | |
| | 7,300 | | | Roper Technologies, Inc. | | | 1,884,641 | |
| | 16,700 | | | Spectrum Brands Holdings, Inc. | | | 1,835,664 | |
| | | | | | | | |
| | | | 15,120,187 | |
| | |
| | Retail Trade – 2.6% | |
| | 33,700 | | | Dunkin’ Brands Group, Inc. | | | 1,990,659 | |
| | 29,300 | | | Ross Stores, Inc. | | | 1,860,257 | |
| | | | | | | | |
| | | | 3,850,916 | |
| | |
| | Technology Services – 9.6% | |
| | 13,400 | | | ANSYS, Inc.* | | | 1,831,914 | |
| | 14,100 | | | Fiserv, Inc.* | | | 1,824,963 | |
| | 16,800 | | | Jack Henry & Associates, Inc. | | | 1,850,184 | |
| | 30,400 | | | Paychex, Inc. | | | 1,939,216 | |
| | 54,600 | | | Symantec Corp. | | | 1,774,500 | |
| | |
| | |
| 12 | | The accompanying notes are an integral part of these financial statements. |
COMMERCE MIDCAP GROWTH FUND
| | | | | | | | |
| | |
| Shares | | | Description | | Value | |
| | Common Stocks – (continued) | |
| | Technology Services – (continued) | |
| | 24,700 | | | Total System Services, Inc. | | | $ 1,779,635 | |
| | 23,900 | | | Vantiv, Inc. Class A* | | | 1,673,000 | |
| | 16,800 | | | VeriSign, Inc.* | | | 1,806,336 | |
| | | | | | | | |
| | | | 14,479,748 | |
| | |
| | Transportation – 2.2% | |
| | 23,600 | | | Alaska Air Group, Inc. | | | 1,558,308 | |
| | 18,400 | | | Landstar System, Inc. | | | 1,817,000 | |
| | | | | | | | |
| | | | 3,375,308 | |
| | |
| | TOTAL COMMON STOCKS | | | | |
| | (Cost $118,808,749) | | | $145,576,773 | |
| | |
| | | | | | | | |
| | Exchange Traded Fund – 1.8% | |
| | 23,130 | | | iShares Russell Midcap Growth Index Fund | |
| | (Cost $2,597,977) | | | $ 2,692,101 | |
| | |
| | | | | | | | | | | | |
Principal
Amount | | Interest
Rate | | | Maturity
Date | | | Value | |
| Short-term Investment(a) – 1.5% | |
Repurchase Agreement – 1.5% | | | | | |
| Fixed Income Clearing Corp. | | | | | |
| $2,344,000 | | | 0.120 | % | | | 11/01/17 | | | $ | 2,344,000 | |
Maturity Value: $2,344,016 | | | | | |
(Cost $2,344,000) | | | | | | | | | |
| |
| TOTAL INVESTMENTS – 100.0% | |
(Cost $123,750,726) | | | | | | | $ | 150,612,874 | |
| |
LIABILITIES IN EXCESS OF OTHER ASSETS – 0.0% | | | | (74,032) | |
| |
| NET ASSETS – 100.0% | | | $ | 150,538,842 | |
| |
| | |
| The percentage shown for each investment category reflects the value of investments in that category as a percentage of net assets. |
| |
| * | | Non-income producing security. |
| (a) | | Repurchase agreement was entered into on October 31, 2017. This agreement was fully collateralized by $2,365,000 U.S. Treasury Note, 2.875%, due 11/15/46 with a market value of $2,393,907. |
|
PORTFOLIO COMPOSITION
| | | | | | | | |
| | | AS OF
10/31/2017 | | | AS OF
10/31/2016 | |
| |
Finance | | | 12.0 | % | | | 10.3 | % |
Electronic Technology | | | 10.1 | | | | 7.4 | |
Producer Manufacturing | | | 10.0 | | | | 9.7 | |
Technology Services | | | 9.6 | | | | 12.4 | |
Health Technology | | | 9.5 | | | | 6.6 | |
Consumer Non-Durables | | | 9.3 | | | | 7.3 | |
Commercial Services | | | 8.6 | | | | 9.3 | |
Consumer Durables | | | 7.1 | | | | 5.9 | |
Consumer Services | | | 6.1 | | | | 8.7 | |
Process Industries | | | 4.8 | | | | 3.6 | |
Health Services | | | 3.4 | | | | 3.4 | |
Retail Trade | | | 2.6 | | | | 6.0 | |
Transportation | | | 2.2 | | | | 1.3 | |
Exchange Traded Fund | | | 1.8 | | | | 2.1 | |
Repurchase Agreement | | | 1.5 | | | | 2.1 | |
Energy Minerals | | | 1.4 | | | | — | |
Distribution Services | | | — | | | | 2.5 | |
Communications | | | — | | | | 1.3 | |
| |
| TOTAL INVESTMENTS | | | 100.0 | % | | | 99.9 | % |
| |
The percentage shown for each investment category reflects
the value of investments in that category as a percentage of net assets. Underlying investment categories of investment companies, including exchange traded funds, held by the Fund are not reflected in the table above. Consequently, the Fund’s overall investment category allocations may differ from the percentages contained in the table above.
The Fund is actively managed and, as such, its composition may differ over time.
| | |
| The accompanying notes are an integral part of these financial statements. | | 13 |
COMMERCE BOND FUND
Bond Fund Overview
We present you with the annual report for the Commerce Bond Fund for the one-year period ended October 31, 2017.
A conversation with Scott Colbert, Portfolio Manager of the Bond Fund.
Q: How did the Fund perform over the review period?
A: Over the one-year period ended October 31, 2017, the Fund generated a cumulative total return of 2.44%. This return compares to the 0.90% cumulative total return of the Fund’s benchmark, the Bloomberg Barclays U.S. Aggregate Index.
Q: What were the material factors that affected the Fund’s performance relative to its benchmark during the reporting period?
A: Several factors helped the Fund’s performance exceed its benchmark during the reporting period. Most of the outperformance was attributed to the overweight position in corporate bonds. Performance was aided by spread tightening in this sector. A stable economy generated favorable credit conditions and led to a decline in the risk premium for corporate bonds. Greater exposure to lower rated investment grade credits relative to the Fund’s benchmark also assisted performance.
Q: Were there any significant adjustments made to the Fund’s portfolio during the period?
A: The Fund’s duration target relative to its benchmark was moved closer to neutral during the period. The Fund’s exposure to below investment grade rated holdings was decreased during the period. Also, exposure to mortgage-backed securities was increased.
Q: Could you describe some specific strategies and holdings that enhanced the Fund’s returns during the period?
A: Maintaining the Fund’s overweight in BBB rated holdings and an overweight in the corporate bond sector relative to its benchmark assisted performance. Excess
return calculations show that BBB rated holdings performed the best on the investment grade credit rating spectrum.
Q: What were some examples of strategies and holdings that didn’t work well for the Fund during the period?
A: Moderate lowering of corporate bond exposure to raise mortgage-backed securities exposure had a negative impact on performance. Security selection within the municipal bond sector detracted from performance.
14
COMMERCE BOND FUND
Performance Summary
October 31, 2017 (Unaudited)
The following is performance information for the Commerce Bond Fund (“Bond Fund”) for various time periods. The returns represent past performance. Past performance is no guarantee of future results. The Fund’s investment return and principal value will fluctuate so that an investor’s shares, when redeemed, may be worth more or less than their original cost. Returns do not reflect the deduction of taxes that a shareholder would pay on Fund distributions or the redemption of Fund shares. The Fund is not subject to a sales charge, so a sales charge is not applied to its total returns. In addition to the Adviser’s decisions regarding issuer/industry investment selection and allocation, other factors may affect Fund performance. These factors include, but are not limited to, Fund operating fees and expenses, portfolio turnover, and subscription and redemption cash flows affecting the Fund. Please visit our website at www.commercefunds.com to obtain the most recent month-end returns.
| | | | | | | | |
| | Performance Review | | | | | | |
| | | November 1, 2016 - October 31, 2017 | | Fund Total Return(a) | | Index Total Return(c) | | Index |
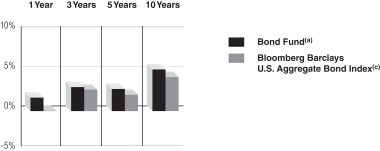
| | | Bond Fund | | 2.44% | | 0.90% | | Bloomberg Barclays U.S. Aggregate Bond(c) |
Standardized Average Annual Total Return through September 30, 2017(b)
| | | | | | | | | | |
| | Standardized Average Annual Total Return through September 30, 2017(b) | | One Year | | Three Years | | Five Years | | Ten Years |
| | | Bond Fund(a) | | 1.69% | | 3.01% | | 2.79% | | 5.23% |
| | | Bloomberg Barclays U.S. Aggregate Bond Index(c) | | 0.07% | | 2.71% | | 2.06% | | 4.27% |
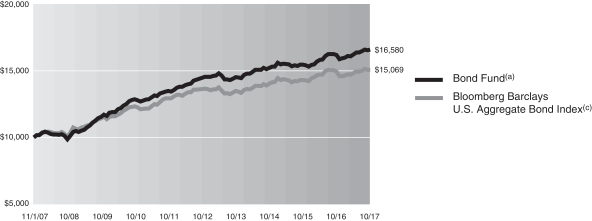
Bond Fund 10 Year Performance
Performance of a $10,000 Investment, with distributions reinvested, from November 1, 2007 through October 31, 2017.
| | | | | | | | | | |
| | Average Annual Total Return through October 31, 2017 | | One Year | | Three Years | | Five Years | | Ten Years |
| | | Bond Fund(a) | | 2.44% | | 2.90% | | 2.76% | | 5.19% |
| | | | | | |
| | Expense Ratios(d) | | | | |
| | | | | Net Expense Ratio (Current) | | Gross Expense Ratio (Before Reimbursements) |
| | | Bond Fund | | 0.67% | | 0.67% |
| (a) | | Returns reflect any fee waivers or expense reductions. Returns do not reflect the deduction of taxes that a shareholder would pay on Fund distributions or the redemption of Fund shares. |
| (b) | | The Standardized Average Annual Total Returns are average annual total returns as of the most recent calendar quarter-end. They assume reinvestment of all distributions at NAV. Current performance may be lower or higher than the total return figures in the above charts. |
Returns reflect any fee waivers and expense reductions. Absent these waivers and reductions, returns would have been lower. Returns do not reflect the deduction of taxes that a shareholder would pay on capital gains or other taxable distributions or the redemption of Fund shares.
| (c) | | The Bloomberg Barclays U.S. Aggregate Bond Index is an unmanaged index that measures the investment grade, U.S. dollar denominated, fixed-rate taxable bond market, including treasuries, government-related and corporate securities, mortgage-backed securities, asset-backed securities, and commercial mortgage-backed securities. The Index figures do not reflect any deduction for fees, taxes or expenses. |
| (d) | | The Fund’s expense ratios, both net (net of applicable fee waivers and/or expense reimbursements) and gross (before applicable fee waivers and/or expense reimbursements), set forth above are as of the most recent publicly available prospectus for the Fund (March 1, 2017) and may differ from the expense ratios disclosed in the Financial Highlights in this report. The Adviser has contractually agreed to reduce or limit the Total Annual Fund Operating Expenses, excluding interest, taxes, acquired fund fees and expenses and extraordinary expenses. This agreement will remain in place through March 1, 2018. After this date, the Adviser or the Fund may terminate the contractual arrangement. If this occurs, the expense ratios may change without shareholder approval. |
15
COMMERCE BOND FUND
Schedule of Investments
October 31, 2017
| | | | | | | | | | |
Principal
Amount | | Interest
Rate | | | Maturity
Date | | Value | |
| Asset-Backed Securities – 15.4% | |
Auto Floor Plan(a) – 0.4% | |
| NextGear Floorplan Master Owner Trust Series 2016-2A, Class A2 | |
| $ 4,845,000 | | | 2.190 | % | | 09/15/21 | | $ | 4,835,406 | |
| |
Automotive(a) – 2.0% | |
| Avis Budget Rental Car Funding AESOP LLC Series 2015-2A, Class A | |
| 5,200,000 | | | 2.630 | | | 12/20/21 | | | 5,211,154 | |
| Ford Credit Auto Owner Trust Series 2016-REV1, Class A | |
| 7,000,000 | | | 2.310 | | | 08/15/27 | | | 7,022,429 | |
| Ford Credit Auto Owner Trust Series 2017-1, Class A | |
| 2,500,000 | | | 2.620 | | | 08/15/28 | | | 2,523,818 | |
| Hertz Vehicle Financing II LP Series 2015-2A, Class A | |
| 5,000,000 | | | 2.020 | | | 09/25/19 | | | 4,995,085 | |
| Oscar US Funding Trust Series 2014-1A, Class A3 | |
| 1,303,750 | | | 1.720 | | | 04/15/19 | | | 1,301,983 | |
| | | | | | | | | | |
| | | 21,054,469 | |
| |
Credit Card – 0.5% | |
| Cabela’s Credit Card Master Note Trust Series 2015-2, Class A1 | |
| 5,680,000 | | | 2.250 | | | 07/17/23 | | | 5,691,598 | |
| |
Home Equity – 1.8% | |
| Accredited Mortgage Loan Trust Series 2004-4, Class A1B(b) | |
| (1M USD LIBOR + 0.780%) | | | | |
| 1,231,270 | | | 2.017 | | | 01/25/35 | | | 1,224,885 | |
| Ameriquest Mortgage Securities, Inc. Series 2004-FR1W, Class A6(b)(g) | |
| 1,077,210 | | | 4.463 | | | 05/25/34 | | | 1,091,152 | |
| Equifirst Mortgage Loan Trust Series 2003-2, Class 2A2(c) | |
| 340,184 | | | 4.250 | | | 09/25/33 | | | 341,979 | |
| Irwin Home Equity Series 2005-A, Class A3(b) | |
| (1M USD LIBOR + 0.760%) | | | | |
| 731,555 | | | 1.997 | | | 02/25/34 | | | 723,016 | |
| Morgan Stanley ABS Capital I, Inc. Trust Series 2005-HE1, Class M1(b) | |
| (1M USD LIBOR + 0.675%) | | | | |
| 4,845,406 | | | 1.912 | | | 12/25/34 | | | 4,727,014 | |
| New Residential Mortgage Loan Trust Series 2017-6A, Class A1(a)(b) | |
| 7,522,329 | | | 4.000 | | | 08/27/57 | | | 7,809,585 | |
| Renaissance Home Equity Loan Trust Series 2005-3, Class AF3(c) | |
| 126,654 | | | 4.814 | | | 11/25/35 | | | 127,666 | |
| Renaissance Home Equity Loan Trust Series 2005-3, Class AF4(c) | |
| 1,125,000 | | | 5.140 | | | 11/25/35 | | | 1,167,123 | |
| Southern Pacific Secured Asset Corp. Series 1998-2, Class A7(c) | |
| 1,947,660 | | | 7.490 | | | 07/25/29 | | | 1,987,900 | |
| |
| | | | | | | | | | |
Principal
Amount | | Interest
Rate | | | Maturity
Date | | Value | |
| Asset-Backed Securities – (continued) | |
Home Equity – (continued) | |
| Terwin Mortgage Trust Series 2005-16HE, Class AF2(c) | |
| $ 90,337 | | | 4.761 | % | | 09/25/36 | | $ | 90,892 | |
| | | | | | | | | | |
| | | 19,291,212 | |
| |
Manufactured Housing – 0.1% | |
| Green Tree Financial Corp. Series 1997-3, Class A6 | |
| 3,126 | | | 7.320 | | | 03/15/28 | | | 3,155 | |
| Green Tree Financial Corp. Series 1998-3, Class A5 | |
| 1,081,994 | | | 6.220 | | | 03/01/30 | | | 1,151,376 | |
| Green Tree Financial Corp. Series 1998-3, Class A6(b)(g) | |
| 135,144 | | | 6.760 | | | 03/01/30 | | | 143,454 | |
| Lehman Manufactured Housing Contract Series 2001-B, Class A3 | |
| 52,522 | | | 4.350 | | | 04/15/40 | | | 53,080 | |
| Mid-State Trust Series 2011, Class A1 | |
| 230,634 | | | 4.864 | | | 07/15/38 | | | 239,000 | |
| | | | | | | | | | |
| | | 1,590,065 | |
| |
Other – 7.8% | |
| ARL Second LLC Series 2014-1A, Class A1(a) | |
| 1,944,696 | | | 2.920 | | | 06/15/44 | | | 1,929,134 | |
| Chase Funding Mortgage Loan Asset-Backed Certificates Series 2002-3, Class 1A5(c) | |
| 1,924,896 | | | 5.907 | | | 06/25/32 | | | 1,886,107 | |
| Chase Funding Mortgage Loan Asset-Backed Certificates Series 2004-1, Class 2A2(b) | |
| (1M USD LIBOR + 0.460%) | | | | |
| 4,310,762 | | | 1.697 | | | 12/25/33 | | | 4,214,177 | |
| Countrywide Asset-Backed Certificates Series 2007-QH1, Class A1(a)(b) | |
| (1M USD LIBOR + 0.200%) | | | | |
| 697,138 | | | 1.438 | | | 02/25/37 | | | 532,159 | |
| Cronos Containers Program Ltd. Series 2013-1A, Class A(a) | |
| 550,000 | | | 3.080 | | | 04/18/28 | | | 549,024 | |
| Cronos Containers Program Ltd. Series 2014-2A, Class A(a) | |
| 3,379,630 | | | 3.270 | | | 11/18/29 | | | 3,366,554 | |
| Domino’s Pizza Master Issuer LLC Series 2017-1A, Class A23(a) | |
| 6,483,750 | | | 4.118 | | | 07/25/47 | | | 6,663,350 | |
| Dong Fang Container Finance II SPV Ltd. Series 2014-1A, Class A1(a) | |
| 1,245,833 | | | 1.950 | | | 11/25/39 | | | 1,238,410 | |
| Equity One ABS, Inc. Series 2004-2, Class AF5(c) | |
| 450,000 | | | 5.699 | | | 07/25/34 | | | 446,613 | |
| FirstKey Lending Trust Series 2015-SFR1, Class A(a) | |
| 638,926 | | | 2.553 | | | 03/09/47 | | | 636,999 | |
| Global SC Finance IV Ltd. Series 2017-1A, Class A(a) | |
| 2,487,042 | | | 3.850 | | | 04/15/37 | | | 2,524,712 | |
| Global SC Finance SRL Series 2013-1A, Class A(a) | |
| 1,617,000 | | | 2.980 | | | 04/17/28 | | | 1,600,064 | |
| |
| | |
| 16 | | The accompanying notes are an integral part of these financial statements. |
COMMERCE BOND FUND
| | | | | | | | | | |
Principal
Amount | | Interest
Rate | | | Maturity
Date | | Value | |
| Asset-Backed Securities – (continued) | |
Other – (continued) | |
| GreatAmerica Leasing Receivables Funding LLC Series 2016-1, Class A3(a) | |
| $ 3,500,000 | | | 1.730 | % | | 06/20/19 | | $ | 3,498,236 | |
| Home Partners of America Trust Series 2016-1, Class A(a)(b) | |
| (1M USD LIBOR + 1.650%) | | | | |
| 4,038,999 | | | 2.887 | | | 03/17/33 | | | 4,071,706 | |
| Invitation Homes Trust Series 2015-SFR2, Class A(a)(b) | |
| (1M USD LIBOR + 1.350%) | | | | |
| 4,370,674 | | | 2.587 | | | 06/17/32 | | | 4,378,257 | |
| JPMorgan Mortgage Acquisition Corp. Series 2006-CH1, Class A5(b) | |
| (1M USD LIBOR + 0.230%) | | | | |
| 2,178,784 | | | 1.467 | | | 07/25/36 | | | 2,175,500 | |
| Long Beach Mortgage Loan Trust Series 2003-4, Class AV1(b) | |
| (1M USD LIBOR + 0.620%) | | | | |
| 227,322 | | | 1.857 | | | 08/25/33 | | | 222,302 | |
| Longtrain Leasing III LLC Series 2015-1A, Class A1(a) | |
| 4,302,373 | | | 2.980 | | | 01/15/45 | | | 4,302,610 | |
| NP SPE II LLC Series 2016-1A, Class A1(a) | |
| 3,492,803 | | | 4.164 | | | 04/20/46 | | | 3,596,682 | |
| Progress Residential Trust Series 2015-SFR3, Class A(a) | |
| 3,492,956 | | | 3.067 | | | 11/12/32 | | | 3,523,111 | |
| State of Hawaii Department of Business Economic Development & Tourism Series 2014-A, Class A2 | |
| 8,000,000 | | | 3.242 | | | 01/01/31 | | | 8,075,920 | |
| Structured Asset Investment Loan Trust Series 2003-BC5, Class M1(b) | |
| (1M USD LIBOR + 1.125%) | | | | |
| 784,305 | | | 2.362 | | | 06/25/33 | | | 779,037 | |
| Structured Asset Securities Corp. Series 2005-9XS, Class 1A3A(c) | |
| 774,938 | | | 5.250 | | | 06/25/35 | | | 781,083 | |
| TAL Advantage V LLC Series 2014-3A, Class A(a) | |
| 3,541,667 | | | 3.270 | | | 11/21/39 | | | 3,514,267 | |
| Towd Point Mortgage Trust Series 2015-1, Class 1A2(a)(b)(g) | |
| 5,000,000 | | | 3.250 | | | 11/25/60 | | | 5,099,515 | |
| Towd Point Mortgage Trust Series 2015-4, Class A1B(a)(b)(g) | |
| 5,261,638 | | | 2.750 | | | 04/25/55 | | | 5,286,048 | |
| Towd Point Mortgage Trust Series 2016-2, Class A1(a)(b)(g) | |
| 1,388,334 | | | 3.000 | | | 08/25/55 | | | 1,401,160 | |
| Towd Point Mortgage Trust Series 2016-3, Class A1(a)(b)(g) | |
| 4,281,813 | | | 2.250 | | | 04/25/56 | | | 4,254,788 | |
| Towd Point Mortgage Trust Series 2017-3, Class A2(a)(b)(g) | |
| 1,850,000 | | | 3.000 | | | 06/25/57 | | | 1,834,825 | |
| |
| | | | | | | | | | |
Principal
Amount | | Interest
Rate | | | Maturity
Date | | Value | |
| Asset-Backed Securities – (continued) | |
Other – (continued) | |
| Wells Fargo Home Equity Trust Series 2006-2, Class A4(b) | |
(1M USD LIBOR + 0.250%) | | | | |
| $ 1,573,508 | | | 1.487 | % | | 07/25/36 | | $ | 1,568,628 | |
| | | | | | | | | | |
| | | 83,950,978 | |
| |
Student Loan – 2.8% | |
| DRB Prime Student Loan Trust Series 2016-B, Class A2(a) | |
| 2,922,371 | | | 2.890 | | | 06/25/40 | | | 2,930,419 | |
| DRB Prime Student Loan Trust Series 2017-A, Class A2B(a) | |
| 4,550,000 | | | 2.850 | | | 05/27/42 | | | 4,543,740 | |
| Navient Private Education Loan Trust Series 2015-AA, Class A2A(a) | |
| 7,349,550 | | | 2.650 | | | 12/15/28 | | | 7,382,335 | |
| Northstar Education Finance, Inc. Series 2005-1, Class A5(b) | |
| (1M USD LIBOR + 0.750%) | | | | |
| 595,761 | | | 2.064 | | | 10/30/45 | | | 590,487 | |
| SLM Student Loan Trust Series 2011-A, Class A2(a) | |
| 2,028,693 | | | 4.370 | | | 04/17/28 | | | 2,058,706 | |
| Sofi Professional Loan Program LLC Series 2016-B, Class A2B(a) | |
| 3,410,000 | | | 2.740 | | | 10/25/32 | | | 3,427,748 | |
| Sofi Professional Loan Program LLC Series 2016-E, Class A2B(a) | |
| 4,900,000 | | | 2.490 | | | 01/25/36 | | | 4,880,695 | |
| South Carolina Student Loan Corp. Series 2015-A, Class A(b) | |
| (1M USD LIBOR + 1.500%) | | | | |
| 3,850,992 | | | 2.737 | | | 01/25/36 | | | 3,870,171 | |
| | | | | | | | | | |
| | | 29,684,301 | |
| |
| TOTAL ASSET-BACKED SECURITIES | |
(Cost $159,489,062) | | $ | 166,098,029 | |
| |
| | | | | | | | | | |
| Municipal Bond Obligations – 6.5% | |
California(d) – 1.8% | |
| Anaheim California Public Financing Authority Revenue Bonds Build America Bonds | |
| $ 4,000,000 | | | 5.685 | % | | 10/01/40 | | $ | 5,122,400 | |
| Beverly Hills CA Unified School District GO Bonds (Capital Appreciation) (Refunding) Series 2016(e) | |
| 5,000,000 | | | 0.000 | | | 08/01/38 | | | 2,389,800 | |
| Foothill-De Anza CA Community College District GO Bonds (Taxable — Election of 2006) Series E | |
| 1,730,000 | | | 3.223 | | | 08/01/38 | | | 1,636,908 | |
| Hillsborough School District GO Bonds Capital Appreciation Election 2002 C(e)(f) | |
| 22,010,000 | | | 0.000 | | | 09/01/21 | | | 4,588,357 | |
| Napa Valley Unified School District GO Bonds (Build America Bonds-Taxable) Series B | |
| 3,000,000 | | | 6.507 | | | 08/01/43 | | | 4,044,570 | |
| |
| | |
| The accompanying notes are an integral part of these financial statements. | | 17 |
COMMERCE BOND FUND
Schedule of Investments (continued)
October 31, 2017
| | | | | | | | | | |
Principal
Amount | | Interest
Rate | | | Maturity
Date | | Value | |
| Municipal Bond Obligations – (continued) | |
California(d) – (continued) | |
| San Mateo Union High School District GO Bonds Refunding Taxable Series B | |
| $ 2,055,000 | | | 2.520 | % | | 09/01/20 | | $ | 2,081,818 | |
| | | | | | | | | | |
| | | 19,863,853 | |
| |
District of Columbia(d) – 0.5% | |
| Metropolitan Washington D.C. Airport Authority System Revenue Bonds Series B | |
| 5,000,000 | | | 5.250 | | | 10/01/25 | | | 5,374,050 | |
| |
Florida – 0.2% | |
| Inland Protection Financing Corp. Florida Revenue Bonds Build America Bonds Series 2010 | |
| 2,000,000 | | | 4.700 | | | 07/01/19 | | | 2,073,980 | |
| |
Idaho(a)(d) – 0.4% | |
| Idaho Housing & Finance Association Economic Development Revenue Bonds Taxable (Facilities Project) Series 2011 | |
| 4,100,000 | | | 7.000 | | | 01/01/31 | | | 4,535,051 | |
| |
Illinois – 0.2% | |
| Will County Community Consolidated School District No. 30-C GO Bonds Unrefunded Taxable Series C (AGM)(d) | |
| 485,000 | | | 5.650 | | | 10/01/18 | | | 486,693 | |
| Will County Forest Preservation District GO Bonds Build America Bonds Direct Payment Series 2009 | |
| 1,000,000 | | | 5.700 | | | 12/15/27 | | | 1,162,900 | |
| | | | | | | | | | |
| | | 1,649,593 | |
| |
Kentucky(d) – 0.3% | |
| River City, Inc. KY Parking Authority Revenue Bonds (Refunding) Series B | |
| 2,890,000 | | | 2.750 | | | 12/01/33 | | | 2,730,963 | |
| |
Maryland(d) – 0.1% | |
| Baltimore County Maryland GO Bonds Build America Bonds Consolidated Public Improvement Series B | |
| 1,000,000 | | | 5.000 | | | 11/01/23 | | | 1,054,880 | |
| |
Michigan – 0.5% | |
| Cedar Springs MI Public School District GO Bonds (Taxable-Refunding) Series B | |
| 1,800,000 | | | 2.035 | | | 05/01/21 | | | 1,770,156 | |
| Jenison MI Public Schools GO Bonds (Refunding) Series 2017 | |
| 1,110,000 | | | 4.000 | | | 05/01/23 | | | 1,233,843 | |
| 1,195,000 | | | 4.000 | | | 05/01/25 | | | 1,344,208 | |
| Utica Community Schools GO Bonds (Taxable-Qualified School Construction-Direct Payment)(d) | |
| 1,500,000 | | | 5.875 | | | 05/01/22 | | | 1,571,895 | |
| | | | | | | | | | |
| | | 5,920,102 | |
| |
Missouri – 0.7% | |
| Curators University of Missouri System Facilities Revenue Bonds Build America Bonds(d) | |
| 2,500,000 | | | 5.792 | | | 11/01/41 | | | 3,334,050 | |
| |
| | | | | | | | | | |
Principal
Amount | | Interest
Rate | | | Maturity
Date | | Value | |
| Municipal Bond Obligations – (continued) | |
Missouri – (continued) | |
| Missouri State Highways & Transit Commission State Road Revenue Bonds Build America Bonds Series 2010(d) | |
| $ 2,800,000 | | | 4.820 | % | | 05/01/23 | | $ | 3,052,084 | |
| New Liberty Hospital District Revenue Bonds Build America Bonds Series B | |
| 1,345,000 | | | 5.704 | | | 12/01/19 | | | 1,410,703 | |
| | | | | | | | | | |
| | | 7,796,837 | |
| |
Nevada(d) – 0.3% | |
| Clark County Nevada Sales & Excise Tax Revenue Bonds Build America Bonds Series C | |
| 2,525,000 | | | 5.100 | | | 07/01/21 | | | 2,723,086 | |
| |
New Jersey – 0.1% | |
| New Jersey State Higher Education Student Assistance Authority Revenue Bonds Student Loan Series 1A (AMT) | |
| 1,250,000 | | | 4.000 | | | 12/01/19 | | | 1,306,675 | |
| |
New York – 0.6% | |
| New York GO Build America Bonds Series 2010(d) | |
| 2,000,000 | | | 4.908 | | | 06/01/21 | | | 2,192,300 | |
| 1,055,000 | | | 5.008 | | | 06/01/22 | | | 1,178,055 | |
| New York Housing Development Corporation Multi-Family Housing Revenue Bonds Taxable Series I | |
| 2,600,000 | | | 1.921 | | | 11/01/18 | | | 2,606,682 | |
| | | | | | | | | | |
| | | 5,977,037 | |
| |
Ohio(d) – 0.2% | |
| Ohio State GO Build America Bonds Taxable Conservation Project Direct Payment Series C | |
| 1,960,000 | | | 4.471 | | | 03/01/19 | | | 2,037,381 | |
| |
Pennsylvania(d) – 0.3% | |
| State Public School Building Authority Revenue Bonds (Qualified School Construction Bonds) | |
| 3,000,000 | | | 6.495 | | | 09/15/28 | | | 3,727,230 | |
| |
South Carolina(d) – 0.1% | |
| South Carolina State Housing Finance & Development Authority Revenue Bonds Refunding Taxable PAC Series A-2 (FHA) | |
| 1,205,000 | | | 4.000 | | | 07/01/34 | | | 1,229,293 | |
| |
Washington(d) – 0.2% | |
| Seattle Municipal Light & Power Revenue Bonds Taxable Clean Renewable Energy Bonds Series C | |
| 2,000,000 | | | 3.750 | | | 06/01/33 | | | 1,971,940 | |
| |
| TOTAL MUNICIPAL BOND OBLIGATIONS | |
(Cost $62,833,492) | | $ | 69,971,951 | |
| |
| | | | | | | | | | |
| Mortgage-Backed Obligations – 25.5% | |
Collateralized Mortgage Obligations – 18.2% | |
| Adjustable Rate Mortgage Trust Series 2004-5, Class 3A1(b)(g) | |
| $ 721,765 | | | 3.678 | % | | 04/25/35 | | $ | 727,449 | |
| Agate Bay Mortgage Loan Trust Series 2015-3, Class A8(a)(b)(g) | |
| 1,413,547 | | | 3.000 | | | 04/25/45 | | | 1,407,629 | |
| |
| | |
| 18 | | The accompanying notes are an integral part of these financial statements. |
COMMERCE BOND FUND
| | | | | | | | | | |
Principal
Amount | | Interest
Rate | | | Maturity
Date | | Value | |
| Mortgage-Backed Obligations – (continued) | |
Collateralized Mortgage Obligations – (continued) | |
| Agate Bay Mortgage Loan Trust Series 2016-1, Class A5(a)(b)(g) | |
| $ 3,534,327 | | | 3.500 | % | | 12/25/45 | | $ | 3,614,125 | |
| Agate Bay Mortgage Loan Trust Series 2016-2, Class A3(a)(b)(g) | |
| 1,463,077 | | | 3.500 | | | 03/25/46 | | | 1,486,681 | |
| Agate Bay Mortgage Trust Series 2014-3, Class A2(a)(b)(g) | |
| 4,425,820 | | | 3.500 | | | 11/25/44 | | | 4,430,834 | |
| Banc of America Alternative Loan Trust Series 2005-10, Class 6A1 | |
| 401,462 | | | 5.500 | | | 11/25/20 | | | 403,009 | |
| Banc of America Alternative Loan Trust Series 2006-3, Class 6A1 | |
| 68,821 | | | 6.000 | | | 04/25/36 | | | 69,254 | |
| Bear Stearns Alt-A Trust Series 2004-8, Class 1A(b) | |
| (1M USD LIBOR + 0.700%) | | | | |
| 1,433,885 | | | 1.937 | | | 09/25/34 | | | 1,420,507 | |
| Bear Stearns Alt-A Trust Series 2005-9, Class 25A1(b)(g) | |
| 1,814,773 | | | 3.469 | | | 11/25/35 | | | 1,597,937 | |
| Bear Stearns Asset Backed Securities Trust Series 2003-AC7, Class A2(c) | |
| 324,766 | | | 5.750 | | | 01/25/34 | | | 329,682 | |
| Citicorp Mortgage Securities Trust, Inc. Series 2006-4, Class 3A1 | |
| 16,694 | | | 5.500 | | | 08/25/21 | | | 16,837 | |
| Citigroup Mortgage Loan Trust, Inc. Series 2004-NCM2, Class 1CB2 | |
| 820,686 | | | 6.750 | | | 08/25/34 | | | 867,037 | |
| Citigroup Mortgage Loan Trust, Inc. Series 2005-10, Class 1A5A(b)(g) | |
| 509,356 | | | 3.721 | | | 12/25/35 | | | 468,244 | |
| Citigroup Mortgage Loan Trust, Inc. Series 2007-AR5, Class 1A3A(b)(g) | |
| 222,580 | | | 3.391 | | | 04/25/37 | | | 209,413 | |
| Citigroup Mortgage Loan Trust, Inc. Series 2015-A, Class A1(a)(b)(g) | |
| 3,073,664 | | | 3.500 | | | 06/25/58 | | | 3,116,592 | |
| Citimortgage Alternative Loan Trust Series 2006-A3, Class 2A1 | |
| 58,403 | | | 5.500 | | | 07/25/36 | | | 58,787 | |
| Countrywide Alternative Loan Trust Series 2004-18CB, Class 3A1 | |
| 132,860 | | | 5.250 | | | 09/25/19 | | | 133,148 | |
| Countrywide Alternative Loan Trust Series 2005-J1, Class 3A1 | |
| 54,992 | | | 6.500 | | | 08/25/32 | | | 56,855 | |
| Countrywide Alternative Loan Trust Series 2007-J2, Class 2A1 | |
| 156,382 | | | 6.000 | | | 07/25/37 | | | 151,264 | |
| Countrywide Home Loans Trust Series 2004-J1, Class 2A4 | |
| 38,913 | | | 4.750 | | | 01/25/19 | | | 38,902 | |
| Countrywide Home Loans Trust Series 2005-27, Class 2A1 | |
| 848,023 | | | 5.500 | | | 12/25/35 | | | 738,591 | |
| Countrywide Home Loans Trust Series 2005-6, Class 2A1 | |
| 225,028 | | | 5.500 | | | 04/25/35 | | | 217,941 | |
| |
| | | | | | | | | | |
Principal
Amount | | Interest
Rate | | | Maturity
Date | | Value | |
| Mortgage-Backed Obligations – (continued) | |
Collateralized Mortgage Obligations – (continued) | |
| Countrywide Home Loans Trust Series 2005-7, Class 1A1(b) | |
| (1M USD LIBOR + 0.540%) | | | | |
| $ 1,071,810 | | | 1.777 | % | | 03/25/35 | | $ | 1,025,788 | |
| CS First Boston Mortgage Securities Corp. Series 2003-19, Class 1A4 | |
| 263,794 | | | 5.250 | | | 07/25/33 | | | 269,653 | |
| CS First Boston Mortgage Securities Corp. Series 2005-5, Class 2A9 | |
| 3,124,931 | | | 5.500 | | | 07/25/35 | | | 3,165,093 | |
| CSMC Trust Series 2014-WIN2, Class A3(a)(b)(g) | |
| 4,023,319 | | | 3.500 | | | 10/25/44 | | | 4,018,370 | |
| CSMC Trust Series 2017-HL2, Class A1(a)(b)(g) | |
| 5,000,000 | | | 3.500 | | | 10/25/47 | | | 5,054,297 | |
| CSMC Trust Series 2017-HL2, Class A3(a)(b)(g) | |
| 4,800,000 | | | 3.500 | | | 10/25/47 | | | 4,872,000 | |
| EverBank Mortgage Loan Trust Series 2013-2, Class A(a)(b)(g) | |
| 2,804,061 | | | 3.000 | | | 06/25/43 | | | 2,792,976 | |
| FHLMC REMIC PAC Series 1579, Class PM | |
| 81,747 | | | 6.700 | | | 09/15/23 | | | 89,428 | |
| FHLMC REMIC PAC Series 2103, Class TE | |
| 72,876 | | | 6.000 | | | 12/15/28 | | | 82,795 | |
| FHLMC REMIC PAC Series 2110, Class PG | |
| 334,395 | | | 6.000 | | | 01/15/29 | | | 379,117 | |
| FHLMC REMIC Series 2391, Class Z | |
| 900,499 | | | 6.000 | | | 12/15/31 | | | 1,022,897 | |
| FHLMC REMIC Series 2603, Class C | |
| 334,105 | | | 5.500 | | | 04/15/23 | | | 353,880 | |
| FHLMC REMIC Series 2677, Class BC | |
| 25,928 | | | 4.000 | | | 09/15/18 | | | 26,043 | |
| FHLMC REMIC Series 2866, Class DH | |
| 224,565 | | | 4.000 | | | 09/15/34 | | | 228,856 | |
| FHLMC REMIC Series 4088, Class EP | |
| 4,411,246 | | | 2.750 | | | 09/15/41 | | | 4,411,820 | |
| FHLMC REMIC Series 4272, Class DG | |
| 1,491,703 | | | 3.000 | | | 04/15/43 | | | 1,502,115 | |
| FHLMC REMIC Series 4679, Class DY | |
| 264,429 | | | 3.500 | | | 07/15/42 | | | 274,240 | |
| First Horizon Alternative Mortgage Securities Series 2006-RE1, Class A1 | |
| 1,479,308 | | | 5.500 | | | 05/25/35 | | | 1,382,502 | |
| FNMA REMIC FNIC PAC Series 2001-45, Class WG | |
| 96,885 | | | 6.500 | | | 09/25/31 | | | 107,406 | |
| FNMA REMIC PAC Series 2003-117, Class KB | |
| 3,000,000 | | | 6.000 | | | 12/25/33 | | | 3,400,297 | |
| FNMA REMIC PAC Series 2003-14, Class AP | |
| 63,904 | | | 4.000 | | | 03/25/33 | | | 66,131 | |
| FNMA REMIC PAC Series 2004-53, Class NC | |
| 449,697 | | | 5.500 | | | 07/25/24 | | | 479,909 | |
| FNMA REMIC Series 2002-73, Class OE | |
| 62 | | | 5.000 | | | 11/25/17 | | | 61 | |
| |
| | |
| The accompanying notes are an integral part of these financial statements. | | 19 |
COMMERCE BOND FUND
Schedule of Investments (continued)
October 31, 2017
| | | | | | | | | | |
Principal
Amount | | Interest
Rate | | | Maturity
Date | | Value | |
| Mortgage-Backed Obligations – (continued) | |
Collateralized Mortgage Obligations – (continued) | |
| FNMA REMIC Series 2002-82, Class XE | |
| $ 2,660 | | | 5.000 | % | | 12/25/17 | | $ | 2,656 | |
| FNMA REMIC Series 2003-83, Class PG | |
| 32,319 | | | 5.000 | | | 06/25/23 | | | 32,804 | |
| FNMA REMIC Series 2015-2, Class PA | |
| 5,095,862 | | | 2.250 | | | 03/25/44 | | | 5,026,915 | |
| FNMA REMIC Series 2015-30, Class JA | |
| 3,434,540 | | | 2.000 | | | 05/25/45 | | | 3,302,222 | |
| FNMA Series 2003-W6, Class 2A32 | |
| 130,771 | | | 6.500 | | | 09/25/42 | | | 149,243 | |
| GNMA REMIC Series 2015-94, Class AT | |
| 1,447,987 | | | 2.250 | | | 07/16/45 | | | 1,416,435 | |
| GNMA REMIC Series 2016-129, Class W | |
| 1,265,000 | | | 2.500 | | | 07/20/46 | | | 1,227,745 | |
| GSR Mortgage Loan Trust Series 2004-12, Class 1A1(b) | |
| (1M USD LIBOR + 0.340%) | | | | |
| 647,356 | | | 1.577 | | | 12/25/34 | | | 592,147 | |
| GSR Mortgage Loan Trust Series 2004-7, Class 1A1(b)(g) | |
| 157,700 | | | 3.120 | | | 06/25/34 | | | 155,982 | |
| Homestar Mortgage Acceptance Corp. Series 2004-2, Class AV1(b) | |
| (1M USD LIBOR + 0.700%) | | | | |
| 123,891 | | | 1.937 | | | 06/25/34 | | | 124,501 | |
| Impac CMB Trust Series 2003-2F, Class A(c) | |
| 402,835 | | | 5.730 | | | 01/25/33 | | | 415,524 | |
| Impac CMB Trust Series 2004-4, Class 1A1(b) | |
| (1M USD LIBOR + 0.640%) | | | | |
| 1,204,798 | | | 1.877 | | | 09/25/34 | | | 1,191,864 | |
| Impac CMB Trust Series 2004-4, Class 2A2(c) | |
| 2,177,325 | | | 4.624 | | | 09/25/34 | | | 2,101,931 | |
| Impac Secured Assets Corp. Series 2004-2, Class A6(c) | |
| 45,403 | | | 4.383 | | | 08/25/34 | | | 45,879 | |
| JPMorgan Alternative Loan Trust Series 2006-S1, Class 1A16 | |
| 1,324,046 | | | 6.000 | | | 03/25/36 | | | 1,149,357 | |
| JPMorgan Mortgage Trust Series 2007-A2, Class 4A2(b)(g) | |
| 391,003 | | | 3.473 | | | 04/25/37 | | | 382,188 | |
| JPMorgan Mortgage Trust Series 2013-3, Class A3(a)(b)(g) | |
| 2,133,696 | | | 3.412 | | | 07/25/43 | | | 2,137,447 | |
| JPMorgan Mortgage Trust Series 2014-2, Class 1A1(a)(b)(g) | |
| 2,496,320 | | | 3.000 | | | 06/25/29 | | | 2,526,745 | |
| JPMorgan Mortgage Trust Series 2015-6, Class A5(a)(b)(g) | |
| 3,030,747 | | | 3.500 | | | 10/25/45 | | | 3,095,387 | |
| JPMorgan Mortgage Trust Series 2017-3, Class 1A3(a)(b)(g) | |
| 12,208,703 | | | 3.500 | | | 08/25/47 | | | 12,390,405 | |
| JPMorgan Mortgage Trust Series 2017-4, Class A3(a)(b)(g) | |
| 3,500,000 | | | 3.500 | | | 11/25/47 | | | 3,551,940 | |
| JPMorgan Mortgage Trust Series 2017-4, Class A5(a)(b)(g) | |
| 2,925,000 | | | 3.500 | | | 11/25/47 | | | 2,981,213 | |
| Lehman XS Trust Series 2005-1, Class 1A4(b) | |
| (1M USD LIBOR + 0.510%) | | | | |
| 101,387 | | | 1.747 | | | 07/25/35 | | | 100,661 | |
| |
| | | | | | | | | | |
Principal
Amount | | Interest
Rate | | | Maturity
Date | | Value | |
| Mortgage-Backed Obligations – (continued) | |
Collateralized Mortgage Obligations – (continued) | |
| Master Adjustable Rate Mortgages Trust Series 2003-2, Class 6A1(b)(g) | |
| $ 472,891 | | | 3.617 | % | | 07/25/33 | | $ | 471,212 | |
| Master Alternative Loans Trust Series 2004-4, Class 1A1 | |
| 148,227 | | | 5.500 | | | 05/25/34 | | | 153,925 | |
| Master Alternative Loans Trust Series 2004-4, Class 8A1 | |
| 888,368 | | | 6.500 | | | 05/25/34 | | | 929,255 | |
| Master Alternative Loans Trust Series 2004-9, Class A6(c) | |
| 189,300 | | | 5.143 | | | 08/25/34 | | | 196,111 | |
| Master Asset Securitization Trust Series 2004-3, Class 5A1 | |
| 6,121 | | | 6.250 | | | 01/25/32 | | | 6,170 | |
| Morgan Stanley Dean Witter Capital I Series 2003-HYB1, Class A3(b)(g) | |
| 253,973 | | | 2.704 | | | 03/25/33 | | | 234,334 | |
| Morgan Stanley Mortgage Loan Trust Series 2005-7, Class 2A1(b)(g) | |
| 1,121,557 | | | 5.513 | | | 11/25/35 | | | 1,072,222 | |
| Morgan Stanley Mortgage Loan Trust Series 2007-12, Class 3A22 | |
| 957,563 | | | 6.000 | | | 08/25/37 | | | 815,609 | |
| NRP Mortgage Trust Series 2013-1, Class A23(a)(b)(g) | |
| 2,435,740 | | | 3.250 | | | 07/25/43 | | | 2,469,421 | |
| Opteum Mortgage Acceptance Corp. Asset Backed Pass-Through Certificates Series 2005-1, Class M3(b) | |
| (1M USD LIBOR + 0.855%) | | | | |
| 417,713 | | | 2.092 | | | 02/25/35 | | | 417,568 | |
| PHHMC Mortgage Pass-Through Certificates Series 2008-CIM1, Class 11A1(b) | |
| (1M USD LIBOR + 2.250%) | | | | |
| 1,422,663 | | | 3.487 | | | 05/25/38 | | | 1,387,982 | |
| RBSGC Mortgage Pass-Through Certificates Series 2007-B, Class 2A1(b)(g) | |
| 784,450 | | | 5.449 | | | 11/25/21 | | | 763,940 | |
| RBSGC Mortgage Pass-Through Certificates Series 2007-B, Class 3A1(b)(g) | |
| 27,996 | | | 4.920 | | | 07/25/35 | | | 28,239 | |
| Residential Accredit Loans, Inc. Series 2005-QS11, Class A2(b) | |
| (1M USD LIBOR + 0.500%) | | | | |
| 260,894 | | | 1.737 | | | 07/25/35 | | | 222,464 | |
| Residential Asset Securitization Trust Series 2004-A6, Class A1 | |
| 164,302 | | | 5.000 | | | 08/25/19 | | | 165,099 | |
| Residential Funding Mortgage Securities I, Inc. Series 2005-S7, Class A5 | |
| 153,470 | | | 5.500 | | | 11/25/35 | | | 144,912 | |
| Residential Funding Mortgage Securities I, Inc. Series 2005-S9, Class A5 | |
| 553,918 | | | 5.750 | | | 12/25/35 | | | 526,461 | |
| Residential Funding Mortgage Securities I, Inc. Series 2006-S12, Class 1A1 | |
| 178,521 | | | 5.500 | | | 12/25/21 | | | 180,827 | |
| |
| | |
| 20 | | The accompanying notes are an integral part of these financial statements. |
COMMERCE BOND FUND
| | | | | | | | | | |
Principal
Amount | | Interest
Rate | | | Maturity
Date | | Value | |
| Mortgage-Backed Obligations – (continued) | |
Collateralized Mortgage Obligations – (continued) | |
| Seasoned Credit Risk Transfer Trust Series 2017-3, Class MA | |
| $ 5,000,000 | | | 3.000 | % | | 07/25/56 | | $ | 5,047,067 | |
| Sequoia Mortgage Trust Series 2004-10, Class A1A(b) | |
| (1M USD LIBOR + 0.620%) | | | | |
| 461,769 | | | 1.856 | | | 11/20/34 | | | 458,063 | |
| Sequoia Mortgage Trust Series 2012-2, Class A3(b)(g) | |
| 1,511,006 | | | 3.500 | | | 04/25/42 | | | 1,526,819 | |
| Sequoia Mortgage Trust Series 2013-2, Class A1(b)(g) | |
| 2,903,894 | | | 1.874 | | | 02/25/43 | | | 2,746,563 | |
| Sequoia Mortgage Trust Series 2013-6, Class A1(b)(g) | |
| 5,014,010 | | | 2.500 | | | 05/25/43 | | | 4,886,907 | |
| Sequoia Mortgage Trust Series 2015-2, Class A10(a)(b)(g) | |
| 4,778,306 | | | 3.500 | | | 05/25/45 | | | 4,877,231 | |
| Sequoia Mortgage Trust Series 2015-3, Class A4(a)(b)(g) | |
| 4,159,138 | | | 3.500 | | | 07/25/45 | | | 4,245,244 | |
| Sequoia Mortgage Trust Series 2015-3, Class A5(a)(b)(g) | |
| 2,970,813 | | | 3.000 | | | 07/25/45 | | | 2,941,812 | |
| Sequoia Mortgage Trust Series 2015-4, Class A1(a)(b)(g) | |
| 2,690,864 | | | 3.000 | | | 11/25/30 | | | 2,730,560 | |
| Sequoia Mortgage Trust Series 2016-3, Class A1(a)(b)(g) | |
| 3,214,346 | | | 3.500 | | | 11/25/46 | | | 3,272,230 | |
| Sequoia Mortgage Trust Series 2017-1, Class A4(a)(b)(g) | |
| 6,414,802 | | | 3.500 | | | 02/25/47 | | | 6,543,599 | |
| Sequoia Mortgage Trust Series 2017-5, Class A1(a)(b)(g) | |
| 3,587,708 | | | 3.500 | | | 08/25/47 | | | 3,652,737 | |
| Sequoia Mortgage Trust Series 2017-6, Class A1(a)(b)(g) | |
| 10,309,122 | | | 3.500 | | | 09/25/47 | | | 10,486,058 | |
| Shellpoint Co-Originator Trust Series 2017-2, Class A1(a)(b)(g) | |
| 9,146,464 | | | 3.500 | | | 10/25/47 | | | 9,290,759 | |
| Structured Adjustable Rate Mortgage Loan Trust Series 2004-14, Class 1A(b)(g) | |
| 983,048 | | | 3.504 | | | 10/25/34 | | | 989,888 | |
| Structured Adjustable Rate Mortgage Loan Trust Series 2004-4, Class 3A4(b)(g) | |
| 185,935 | | | 3.520 | | | 04/25/34 | | | 187,047 | |
| Structured Asset Securities Corp. Series 2003-29, Class 5A4 | |
| 732,353 | | | 5.250 | | | 09/25/33 | | | 742,122 | |
| Structured Asset Securities Corp. Series 2003-31A, Class 2A7(b)(g) | |
| 365,318 | | | 3.392 | | | 10/25/33 | | | 370,684 | |
| Structured Asset Securities Corp. Series 2003-34A, Class 3A3(b)(g) | |
| 591,228 | | | 3.451 | | | 11/25/33 | | | 595,322 | |
| Structured Asset Securities Corp. Series 2003-34A, Class 6A(b)(g) | |
| 336,936 | | | 3.626 | | | 11/25/33 | | | 333,824 | |
| Washington Mutual Alternative Mortgage Pass-Through Certificates Series 2005-4, Class 4A1 | |
| 359,054 | | | 5.500 | | | 06/25/20 | | | 344,769 | |
| Wells Fargo Mortgage Backed Securities Trust Series 2005-AR15, Class 1A2(b)(g) | |
| 306,342 | | | 3.561 | | | 09/25/35 | | | 295,817 | |
| |
| | | | | | | | | | |
Principal
Amount | | Interest
Rate | | | Maturity
Date | | Value | |
| Mortgage-Backed Obligations – (continued) | |
Collateralized Mortgage Obligations – (continued) | |
| Wells Fargo Mortgage Backed Securities Trust Series 2007-2, Class 3A5 | |
| $ 203,094 | | | 5.250 | % | | 03/25/37 | | $ | 207,374 | |
| WinWater Mortgage Loan Trust Series 2015-5, Class A3(a)(b)(g) | |
| 10,290,862 | | | 3.500 | | | 08/20/45 | | | 10,437,591 | |
| WinWater Mortgage Loan Trust Series 2015-5, Class A5(a)(b)(g) | |
| 3,105,866 | | | 3.500 | | | 08/20/45 | | | 3,173,884 | |
| WinWater Mortgage Loan Trust Series 2016-1, Class 1A5(a)(b)(g) | |
| 5,288,845 | | | 3.500 | | | 01/20/46 | | | 5,357,642 | |
| |
| TOTAL COLLATERALIZED MORTGAGE OBLIGATIONS | |
(Cost $192,517,303) | | $ | 196,594,947 | |
| |
Commercial Mortgage Obligations – 5.2% | |
| Citigroup Commercial Mortgage Trust Series 2013-GC17, Class A2 | |
| $ 5,000,000 | | | 2.962 | % | | 11/10/46 | | $ | 5,044,429 | |
| Citigroup Commercial Mortgage Trust Series 2015-GC29, Class A2 | |
| 5,000,000 | | | 2.674 | | | 04/10/48 | | | 5,047,347 | |
| Commercial Mortgage Pass Through Certificates Series 2013-CR12, Class A2 | |
| 2,520,000 | | | 2.904 | | | 10/10/46 | | | 2,540,723 | |
| Commercial Mortgage Pass-Through Certificates Series 2014-CR14, Class A2 | |
| 3,020,000 | | | 3.147 | | | 02/10/47 | | | 3,056,478 | |
| Commercial Mortgage Trust Series 2012-CR4, Class A2 | |
| 528,770 | | | 1.801 | | | 10/15/45 | | | 528,408 | |
| Commercial Mortgage Trust Series 2013-CR6, Class A2 | |
| 940,925 | | | 2.122 | | | 03/10/46 | | | 940,517 | |
| Commercial Mortgage Trust Series 2014-CR15, Class A2 | |
| 4,735,545 | | | 2.928 | | | 02/10/47 | | | 4,784,670 | |
| Commercial Mortgage Trust Series 2014-LC15, Class A2 | |
| 700,000 | | | 2.840 | | | 04/10/47 | | | 707,893 | |
| JPMBB Commercial Mortgage Securities Trust Series 2014-C19, Class A2 | |
| 1,500,000 | | | 3.046 | | | 04/15/47 | | | 1,521,242 | |
| JPMBB Commercial Mortgage Securities Trust Series 2015-C28, Class A2 | |
| 1,915,000 | | | 2.773 | | | 10/15/48 | | | 1,941,231 | |
| LSTAR Commercial Mortgage Trust Series 2016-4, Class A2(a) | |
| 3,000,000 | | | 2.579 | | | 03/10/49 | | | 2,962,002 | |
| Morgan Stanley Bank of America Merrill Lynch Trust Series 2014-C14, Class A2 | |
| 3,625,484 | | | 2.916 | | | 02/15/47 | | | 3,666,380 | |
| Morgan Stanley Bank of America Merrill Lynch Trust Series 2015-C21, Class A2 | |
| 7,830,000 | | | 2.933 | | | 03/15/48 | | | 7,967,058 | |
| Morgan Stanley Bank of America Merrill Lynch Trust Series 2015-C22, Class A2 | |
| 5,000,000 | | | 2.739 | | | 04/15/48 | | | 5,061,197 | |
| |
| | |
| The accompanying notes are an integral part of these financial statements. | | 21 |
COMMERCE BOND FUND
Schedule of Investments (continued)
October 31, 2017
| | | | | | | | | | |
Principal
Amount | | Interest
Rate | | | Maturity
Date | | Value | |
| Mortgage-Backed Obligations – (continued) | |
Commercial Mortgage Obligations – (continued) | |
| TRU Trust Series 2016-1, Class A(a)(b) | |
| (1M USD LIBOR + 2.250%) | | | | |
| $ 4,400,713 | | | 3.489 | % | | 11/15/30 | | $ | 4,358,399 | |
| WF-RBS Commercial Mortgage Trust Series 2014-C19, Class A2 | |
| 2,455,000 | | | 2.895 | | | 03/15/47 | | | 2,477,719 | |
| WF-RBS Commercial Mortgage Trust Series 2014-C20, Class A2 | |
| 3,500,000 | | | 3.036 | | | 05/15/47 | | | 3,546,368 | |
| |
| TOTAL COMMERCIAL MORTGAGE OBLIGATIONS | |
(Cost $57,115,757) | | $ | 56,152,061 | |
| |
| Federal Agencies – 2.0% | |
| FHLMC | |
| $ 3,196 | | | 8.500 | % | | 03/01/21 | | $ | 3,222 | |
| 189,163 | | | 7.000 | | | 05/01/26 | | | 208,384 | |
| 29,299 | | | 7.500 | | | 12/01/30 | | | 35,178 | |
| 41,391 | | | 7.500 | | | 01/01/31 | | | 47,174 | |
| 73,448 | | | 7.000 | | | 08/01/31 | | | 83,447 | |
| 952,717 | | | 5.000 | | | 05/01/33 | | | 1,052,246 | |
| (1Y US Treasury Yield Curve Rate + 2.229%) | |
| 192,491 | | | 3.018 | (b) | | 05/01/34 | | | 202,409 | |
| (12M USD LIBOR + 1.824%) | |
| 203,666 | | | 3.375 | (b) | | 01/01/36 | | | 216,443 | |
| 1,444,653 | | | 4.000 | | | 06/01/42 | | | 1,534,340 | |
| 1,945,923 | | | 3.000 | | | 06/01/45 | | | 1,939,260 | |
| (12M USD LIBOR + 1.600%) | |
| 3,463,408 | | | 2.757 | (b) | | 07/01/45 | | | 3,508,457 | |
| FNMA | |
| 381 | | | 9.000 | | | 11/01/21 | | | 382 | |
| 31,035 | | | 9.000 | | | 02/01/25 | | | 31,482 | |
| 10,685 | | | 6.500 | | | 03/01/26 | | | 11,843 | |
| 1,453,804 | | | 2.500 | | | 05/01/28 | | | 1,461,381 | |
| 9,448 | | | 8.000 | | | 07/01/28 | | | 9,585 | |
| 30,364 | | | 6.500 | | | 10/01/28 | | | 34,035 | |
| 54,094 | | | 6.000 | | | 07/01/29 | | | 60,640 | |
| 12,300 | | | 7.500 | | | 09/01/29 | | | 12,470 | |
| 39,269 | | | 7.000 | | | 03/01/31 | | | 42,868 | |
| 7,834 | | | 7.500 | | | 03/01/31 | | | 8,670 | |
| 18,402 | | | 7.000 | | | 11/01/31 | | | 19,034 | |
| 35,716 | | | 7.000 | | | 01/01/32 | | | 36,446 | |
| 138,078 | | | 6.000 | | | 12/01/32 | | | 154,816 | |
| (6M USD LIBOR + 1.413%) | |
| 48,896 | | | 2.812 | (b) | | 02/01/33 | | | 51,203 | |
| 60,733 | | | 5.000 | | | 07/01/33 | | | 65,871 | |
| (12M USD LIBOR + 1.740%) | |
| 202,175 | | | 3.379 | (b) | | 10/01/34 | | | 213,461 | |
| (12M USD LIBOR + 1.760%) | |
| 123,282 | | | 3.397 | (b) | | 02/01/35 | | | 129,671 | |
| 3,230,099 | | | 3.500 | | | 08/01/35 | | | 3,366,326 | |
| (12M USD LIBOR + 1.586%) | |
| 1,230,897 | | | 2.620 | (b) | | 12/01/45 | | | 1,249,616 | |
| |
| | | | | | | | | | | | |
Principal
Amount | | Interest
Rate | | | Maturity
Date | | | Value | |
| Mortgage-Backed Obligations – (continued) | |
| Federal Agencies – (continued) | |
| GNMA | |
| $ 69,969 | | | 8.000 | % | | | 02/15/22 | | | $ | 74,176 | |
| 24,881 | | | 7.500 | | | | 08/20/25 | | | | 27,369 | |
| 131,350 | | | 7.500 | | | | 07/20/26 | | | | 151,736 | |
| 95,790 | | | 6.500 | | | | 04/15/31 | | | | 106,038 | |
| 144,141 | | | 6.500 | | | | 05/15/31 | | | | 159,562 | |
| 5,682,095 | | | 2.500 | | | | 06/20/31 | | | | 5,646,164 | |
| |
| TOTAL FEDERAL AGENCIES | | | | | |
(Cost $22,023,392) | | | | | | | $ | 21,955,405 | |
| |
| TOTAL MORTGAGE-BACKED OBLIGATIONS | |
(Cost $271,656,452) | | | $ | 274,702,413 | |
| |
| | | | | | | | | | | | |
| Corporate Obligations – 44.7% | |
Aerospace/Defense – 0.5% | |
| Goodrich Corp. | |
| $ 1,000,000 | | | 4.875 | % | | | 03/01/20 | | | $ | 1,059,362 | |
| Northrop Grumman Corp.(d) | |
| 2,355,000 | | | 2.930 | | | | 01/15/25 | | | | 2,361,021 | |
| United Technologies Corp. | |
| 2,000,000 | | | 5.700 | | | | 04/15/40 | | | | 2,506,391 | |
| | | | | | | | | | | | |
| | | | 5,926,774 | |
| |
Auto Manufacturers – 1.1% | |
| Ford Motor Co.(d) | |
| 2,000,000 | | | 4.346 | | | | 12/08/26 | | | | 2,084,108 | |
| Ford Motor Credit Co. LLC | |
| 1,000,000 | | | 2.979 | (d) | | | 08/03/22 | | | | 1,002,931 | |
| 2,500,000 | | | 4.134 | | | | 08/04/25 | | | | 2,576,677 | |
| General Motors Co. | |
| 2,000,000 | | | 5.000 | | | | 04/01/35 | | | | 2,070,367 | |
| General Motors Financial Co., Inc.(d) | |
| 2,000,000 | | | 3.950 | | | | 04/13/24 | | | | 2,061,421 | |
| 2,000,000 | | | 4.350 | | | | 01/17/27 | | | | 2,057,287 | |
| | | | | | | | | | | | |
| | | | 11,852,791 | |
| |
Banks – 8.3% | |
| Bank of America Corp. | |
| 3,325,000 | | | 5.700 | | | | 01/24/22 | | | | 3,732,500 | |
| 3,000,000 | | | 4.000 | | | | 01/22/25 | | | | 3,107,051 | |
| Bank One Corp.(c) | |
| 1,000,000 | | | 8.530 | | | | 03/01/19 | | | | 1,081,001 | |
| Citigroup, Inc. | |
| 3,000,000 | | | 5.500 | | | | 09/13/25 | | | | 3,385,988 | |
| 3,500,000 | | | 4.450 | | | | 09/29/27 | | | | 3,693,422 | |
| Citizens Bank NA(d) | |
| 3,000,000 | | | 2.450 | | | | 12/04/19 | | | | 3,018,521 | |
| Cooperatieve Rabobank UA/NY | |
| 4,510,000 | | | 2.250 | | | | 01/14/19 | | | | 4,533,571 | |
| Credit Suisse New York | |
| 3,000,000 | | | 3.000 | | | | 10/29/21 | | | | 3,065,516 | |
| |
| | |
| 22 | | The accompanying notes are an integral part of these financial statements. |
COMMERCE BOND FUND
| | | | | | | | | | |
Principal
Amount | | Interest
Rate | | | Maturity
Date | | Value | |
| Corporate Obligations – (continued) | |
Banks – (continued) | |
| Deutsche Bank AG | |
| $ 2,000,000 | | | 3.125 | % | | 01/13/21 | | $ | 2,018,939 | |
| HSBC Holdings PLC | |
| 3,130,000 | | | 6.100 | | | 01/14/42 | | | 4,215,278 | |
| HSBC USA, Inc. | |
| 1,052,000 | | | 9.300 | | | 06/01/21 | | | 1,271,273 | |
| Huntington Bancshares, Inc.(d) | |
| 3,850,000 | | | 3.150 | | | 03/14/21 | | | 3,943,666 | |
| JPMorgan Chase & Co. | |
| 1,600,000 | | | 2.250 | (d) | | 01/23/20 | | | 1,607,923 | |
| 2,000,000 | | | 4.350 | | | 08/15/21 | | | 2,137,538 | |
| 150,000 | | | 2.371 | (b)(g) | | 04/26/23 | | | 148,955 | |
| 2,500,000 | | | 7.900 | (b)(d)(g) | | 04/30/99 | | | 2,563,750 | |
| KeyBank NA | |
| 4,000,000 | | | 3.400 | | | 05/20/26 | | | 3,983,996 | |
| Lloyds Bank PLC | |
| 1,640,000 | | | 6.375 | | | 01/21/21 | | | 1,837,590 | |
| Manufacturers & Traders Trust Co.(d) | |
| 5,840,000 | | | 2.250 | | | 07/25/19 | | | 5,865,103 | |
| Morgan Stanley & Co. | |
| 4,375,000 | | | 4.100 | | | 05/22/23 | | | 4,606,030 | |
| PNC Bank NA(d) | |
| 2,500,000 | | | 2.950 | | | 01/30/23 | | | 2,531,802 | |
| PNC Financial Services Group, Inc.(b)(d) | |
| (3M USD LIBOR + 3.678%) | | | | |
| $2,500,000 | | | 6.750 | | | 07/29/49 | | | 2,812,500 | |
| Santander UK PLC | |
| 1,000,000 | | | 3.050 | | | 08/23/18 | | | 1,010,532 | |
| Sumitomo Mitsui Banking Corp. | |
| 3,000,000 | | | 1.966 | | | 01/11/19 | | | 3,001,041 | |
| The PNC Financial Services Group, Inc.(d) | |
| 3,750,000 | | | 3.150 | | | 05/19/27 | | | 3,747,929 | |
| The Toronto-Dominion Bank | |
| 2,765,000 | | | 1.800 | | | 07/13/21 | | | 2,716,930 | |
| U.S. Bancorp(d) | |
| 2,050,000 | | | 3.600 | | | 09/11/24 | | | 2,131,696 | |
| UBS Group Funding Switzerland AG(a)(b)(d)(g) | |
| 2,750,000 | | | 2.859 | | | 08/15/23 | | | 2,746,150 | |
| Wells Fargo & Co. | |
| 2,500,000 | | | 4.100 | | | 06/03/26 | | | 2,602,745 | |
| 1,500,000 | | | 4.650 | | | 11/04/44 | | | 1,611,077 | |
| 2,000,000 | | | 4.750 | | | 12/07/46 | | | 2,185,676 | |
| Wells Fargo Bank NA(h) | |
| 2,000,000 | | | 6.180 | | | 02/15/36 | | | 2,423,114 | |
| | | | | | | | | | |
| | | | | | | | | 89,338,803 | |
| |
Beverages – 0.9% | |
| Anheuser-Busch InBev Worldwide, Inc. | |
| 500,000 | | | 7.750 | | | 01/15/19 | | | 534,283 | |
| 6,000,000 | | | 4.439 | (d) | | 10/06/48 | | | 6,348,904 | |
| |
| | | | | | | | | | |
Principal
Amount | | Interest
Rate | | | Maturity
Date | | Value | |
| Corporate Obligations – (continued) | |
Beverages – (continued) | |
| PepsiCo, Inc.(d) | |
| $ 2,190,000 | | | 4.450 | % | | 04/14/46 | | $ | 2,440,668 | |
| | | | | | | | | | |
| | | | | | | | | 9,323,855 | |
Biotechnology – 0.2% | |
| Amgen, Inc. | |
| 1,295,000 | | | 6.400 | | | 02/01/39 | | | 1,685,551 | |
| |
Chemicals(d) – 0.3% | |
| Praxair, Inc. | |
| 2,740,000 | | | 3.200 | | | 01/30/26 | | | 2,802,851 | |
| |
Commercial Services – 1.0% | |
| Gonzaga University | |
| 3,500,000 | | | 4.158 | | | 04/01/46 | | | 3,511,154 | |
| Henry J. Kaiser Family Foundation | |
| 6,250,000 | | | 3.356 | | | 12/01/25 | | | 6,111,788 | |
| Northwestern University | |
| 1,000,000 | | | 4.643 | | | 12/01/44 | | | 1,184,802 | |
| | | | | | | | | | |
| | | | | | | | | 10,807,744 | |
| |
Diversified Financial Services – 4.1% | |
| Air Lease Corp.(d) | |
| 1,175,000 | | | 3.875 | | | 04/01/21 | | | 1,227,456 | |
| 2,500,000 | | | 2.625 | | | 07/01/22 | | | 2,490,551 | |
| American Express Co.(d) | |
| 3,900,000 | | | 2.500 | | | 08/01/22 | | | 3,879,982 | |
| BlackRock, Inc. | |
| 5,000,000 | | | 4.250 | | | 05/24/21 | | | 5,336,360 | |
| Blackstone Holdings Finance Co. LLC(a) | |
| 3,000,000 | | | 5.875 | | | 03/15/21 | | | 3,326,940 | |
| Brookfield Asset Management, Inc.(d) | |
| 2,000,000 | | | 4.000 | | | 01/15/25 | | | 2,056,669 | |
| CDP Financial, Inc.(a) | |
| 1,000,000 | | | 3.150 | | | 07/24/24 | | | 1,026,501 | |
| Citicorp Lease Pass-Through Trust 1999-1(a) | |
| 1,860,870 | | | 8.040 | | | 12/15/19 | | | 2,070,705 | |
| CME Group, Inc. | |
| 1,685,000 | | | 3.000 | | | 09/15/22 | | | 1,723,621 | |
| Franklin Resources, Inc. | |
| 5,000,000 | | | 2.850 | | | 03/30/25 | | | 4,958,094 | |
| Invesco Finance PLC | |
| 6,509,000 | | | 3.125 | | | 11/30/22 | | | 6,631,098 | |
| Janus Capital Group, Inc.(d) | |
| 3,000,000 | | | 4.875 | | | 08/01/25 | | | 3,225,538 | |
| Legg Mason, Inc. | |
| 3,895,000 | | | 5.625 | | | 01/15/44 | | | 4,281,945 | |
| The Charles Schwab Corp. | |
| 2,500,000 | | | 3.225 | | | 09/01/22 | | | 2,554,814 | |
| | | | | | | | | | |
| | | | | | | | | 44,790,274 | |
| |
Electric – 3.8% | |
| Arizona Public Service Co. | |
| 2,150,000 | | | 6.875 | | | 08/01/36 | | | 2,900,028 | |
| |
| | |
| The accompanying notes are an integral part of these financial statements. | | 23 |
COMMERCE BOND FUND
Schedule of Investments (continued)
October 31, 2017
| | | | | | | | | | |
Principal
Amount | | Interest
Rate | | | Maturity
Date | | Value | |
| Corporate Obligations – (continued) | |
Electric – (continued) | |
| Consumers Energy Co.(d) | |
| $ 3,290,000 | | | 3.950 | % | | 07/15/47 | | $ | 3,486,268 | |
| Duke Energy Progress LLC(d) | |
| 2,000,000 | | | 2.800 | | | 05/15/22 | | | 2,031,881 | |
| Emerson Electric Co. | |
| 1,000,000 | | | 6.125 | | | 04/15/39 | | | 1,289,921 | |
| Engie SA(a) | |
| 4,000,000 | | | 2.875 | | | 10/10/22 | | | 4,044,554 | |
| Entergy Louisiana LLC(d) | |
| 3,000,000 | | | 3.780 | | | 04/01/25 | | | 3,128,451 | |
| Gulf Power Co.(d) | |
| 1,250,000 | | | 4.550 | | | 10/01/44 | | | 1,333,544 | |
| Louisville Gas & Electric Co.(d) | |
| 1,850,000 | | | 4.650 | | | 11/15/43 | | | 2,091,906 | |
| Ohio Power Co. | |
| 2,870,000 | | | 5.850 | | | 10/01/35 | | | 3,534,620 | |
| Pacific Gas & Electric Co. | |
| 2,000,000 | | | 6.350 | | | 02/15/38 | | | 2,607,091 | |
| PacifiCorp | |
| 2,000,000 | | | 3.850 | (d) | | 06/15/21 | | | 2,103,796 | |
| 1,900,000 | | | 6.100 | | | 08/01/36 | | | 2,490,143 | |
| PPL Electric Utilities Corp.(d) | |
| 1,025,000 | | | 4.750 | | | 07/15/43 | | | 1,181,378 | |
| PSEG Power LLC | |
| 5,500,000 | | | 8.625 | | | 04/15/31 | | | 7,285,092 | |
| Southern California Edison Co. | |
| 1,000,000 | | | 5.550 | | | 01/15/37 | | | 1,245,100 | |
| | | | | | | | | | |
| | | | | | | | | 40,753,773 | |
| |
Engineering & Construction(a)(d) – 0.5% | |
| SBA Tower Trust | |
| 5,000,000 | | | 2.877 | | | 07/15/21 | | | 4,962,500 | |
| |
Gas – 0.4% | |
| KeySpan Corp. | |
| 3,375,000 | | | 8.000 | | | 11/15/30 | | | 4,563,064 | |
| |
Healthcare-Products – 0.2% | |
| Medtronic, Inc. | |
| 1,875,000 | | | 3.150 | | | 03/15/22 | | | 1,933,297 | |
| |
Healthcare-Services – 1.9% | |
| Ascension Health | |
| 1,500,000 | | | 3.945 | | | 11/15/46 | | | 1,539,973 | |
| Baptist Health South Florida, Inc. | |
| 3,695,000 | | | 4.342 | | | 11/15/41 | | | 3,937,735 | |
| Community Health Network, Inc. | |
| 2,225,000 | | | 4.237 | | | 05/01/25 | | | 2,336,449 | |
| Mayo Clinic | |
| 2,600,000 | | | 3.774 | | | 11/15/43 | | | 2,581,153 | |
| Mission Health System, Inc. | |
| 5,710,000 | | | 3.033 | | | 10/01/22 | | | 5,498,542 | |
| SSM Health Care Corp.(d) | |
| 4,990,000 | | | 3.823 | | | 06/01/27 | | | 5,196,479 | |
| | | | | | | | | | |
| | | 21,090,331 | |
| |
| | | | | | | | | | |
Principal
Amount | | Interest
Rate | | | Maturity
Date | | Value | |
| Corporate Obligations – (continued) | |
Household Products/Wares – 0.1% | |
| Kimberly-Clark Corp. | |
| $ 1,000,000 | | | 2.750 | % | | 02/15/26 | | $ | 990,899 | |
| |
Insurance – 3.2% | |
| American International Group, Inc.(d) | |
| 2,000,000 | | | 3.750 | | | 07/10/25 | | | 2,067,776 | |
| Berkshire Hathaway Finance Corp. | |
| 5,000,000 | | | 3.000 | | | 05/15/22 | | | 5,156,507 | |
| Guardian Life Global Funding(a) | |
| 2,000,000 | | | 2.000 | | | 04/26/21 | | | 1,967,361 | |
| MassMutual Global Funding II(a) | |
| 2,400,000 | | | 2.000 | | | 04/15/21 | | | 2,378,110 | |
| MetLife, Inc.(d) | |
| 2,055,000 | | | 10.750 | | | 08/01/69 | | | 3,431,850 | |
| New York Life Global Funding(a) | |
| 3,000,000 | | | 2.000 | | | 04/13/21 | | | 2,974,682 | |
| PartnerRe Finance B LLC | |
| 525,000 | | | 5.500 | | | 06/01/20 | | | 563,950 | |
| Principal Life Global Funding II(a) | |
| 2,000,000 | | | 2.200 | | | 04/08/20 | | | 1,999,032 | |
| Prudential Financial, Inc.(b)(d) | |
| (3M USD LIBOR + 4.175%) | |
| 2,000,000 | | | 5.875 | | | 09/15/42 | | | 2,210,000 | |
| Reinsurance Group of America, Inc. | |
| 2,000,000 | | | 6.450 | | | 11/15/19 | | | 2,165,632 | |
| 2,100,000 | | | 5.000 | | | 06/01/21 | | | 2,258,778 | |
| The Prudential Insurance Co. of America(a) | |
| 2,000,000 | | | 8.300 | | | 07/01/25 | | | 2,620,363 | |
| Travelers Property Casualty Corp. | |
| 2,493,000 | | | 7.750 | | | 04/15/26 | | | 3,305,758 | |
| Voya Financial, Inc. | |
| 1,800,000 | | | 3.650 | | | 06/15/26 | | | 1,815,569 | |
| | | | | | | | | | |
| | | 34,915,368 | |
| |
Machinery-Diversified(d) – 0.3% | |
| Rockwell Automation, Inc. | |
| 2,850,000 | | | 2.050 | | | 03/01/20 | | | 2,848,627 | |
| |
Media – 1.0% | |
| 21st Century Fox America, Inc. | |
| 1,000,000 | | | 7.125 | | | 04/08/28 | | | 1,254,984 | |
| CBS Corp. | |
| 2,500,000 | | | 7.875 | | | 09/01/23 | | | 3,049,692 | |
| Comcast Corp. | |
| 1,250,000 | | | 6.400 | | | 05/15/38 | | | 1,680,000 | |
| Time Warner, Inc.(d) | |
| 4,380,000 | | | 3.600 | | | 07/15/25 | | | 4,365,151 | |
| | | | | | | | | | |
| | | 10,349,827 | |
| |
Metals & Mining – 0.4% | |
| Freeport-McMoRan Copper & Gold, Inc. | |
| 1,000,000 | | | 2.375 | | | 03/15/18 | | | 1,000,000 | |
| |
| | |
| 24 | | The accompanying notes are an integral part of these financial statements. |
COMMERCE BOND FUND
| | | | | | | | | | |
Principal
Amount | | Interest
Rate | | | Maturity
Date | | Value | |
| Corporate Obligations – (continued) | |
Metals & Mining – (continued) | |
| The Timken Co. | |
| $ 2,750,000 | | | 6.875 | % | | 05/08/28 | | $ | 3,290,673 | |
| | | | | | | | | | |
| | | 4,290,673 | |
| |
Miscellaneous Manufacturing – 0.6% | |
| General Electric Co.(b)(d) | |
| (3M USD LIBOR + 3.330%) | | | | |
| 1,894,000 | | | 5.000 | | | 12/29/49 | | | 1,976,862 | |
| Parker-Hannifin Corp. | |
| 2,000,000 | | | 3.500 | | | 09/15/22 | | | 2,086,410 | |
| Siemens Financieringsmaatschappij NV(a) | |
| 2,228,000 | | | 1.700 | | | 09/15/21 | | | 2,185,385 | |
| | | | | | | | | | |
| | | 6,248,657 | |
| |
Oil-Field Services – 2.9% | |
| Apache Corp. | |
| 2,835,000 | | | 5.100 | (d) | | 09/01/40 | | | 3,026,478 | |
| 1,360,000 | | | 7.375 | | | 08/15/47 | | | 1,796,453 | |
| BP Capital Markets PLC | |
| 3,250,000 | | | 2.750 | | | 05/10/23 | | | 3,272,194 | |
| Exxon Mobil Corp.(d) | |
| 3,000,000 | | | 2.726 | | | 03/01/23 | | | 3,049,734 | |
| Halliburton Co.(d) | |
| 5,000,000 | | | 5.000 | | | 11/15/45 | | | 5,593,866 | |
| HollyFrontier Corp.(d) | |
| 3,850,000 | | | 5.875 | | | 04/01/26 | | | 4,273,160 | |
| Marathon Oil Corp.(d) | |
| 2,000,000 | | | 2.700 | | | 06/01/20 | | | 1,997,983 | |
| Phillips 66(d) | |
| 3,000,000 | | | 4.650 | | | 11/15/34 | | | 3,245,986 | |
| Statoil ASA | |
| 1,795,000 | | | 6.800 | | | 01/15/28 | | | 2,351,257 | |
| Tosco Corp. | |
| 2,095,000 | | | 8.125 | | | 02/15/30 | | | 2,958,239 | |
| | | | | | | | | | |
| | | 31,565,350 | |
| |
Paper and Forest Products – 0.4% | |
| International Paper Co. | |
| 2,925,000 | | | 8.700 | | | 06/15/38 | | | 4,325,558 | |
| |
Pharmaceuticals – 1.4% | |
| Allergan Funding SCS(d) | |
| 2,000,000 | | | 3.000 | | | 03/12/20 | | | 2,030,385 | |
| Bayer US Finance LLC(a) | |
| 2,000,000 | | | 2.375 | | | 10/08/19 | | | 2,010,671 | |
| Johnson & Johnson | |
| 4,970,000 | | | 5.950 | | | 08/15/37 | | | 6,825,214 | |
| Pfizer, Inc. | |
| 2,900,000 | | | 7.200 | | | 03/15/39 | | | 4,411,236 | |
| | | | | | | | | | |
| 15,277,506 | |
| |
| | | | | | | | | | |
Principal
Amount | | Interest
Rate | | | Maturity
Date | | Value | |
| Corporate Obligations – (continued) | |
Pipelines – 2.6% | |
| Buckeye Partners LP(d) | |
| $ 2,000,000 | | | 4.350 | % | | 10/15/24 | | $ | 2,091,170 | |
| DCP Midstream LLC | |
| 3,397,000 | | | 8.125 | | | 08/16/30 | | | 4,008,460 | |
| DCP Midstream Operating LP(d) | |
| 3,000,000 | | | 3.875 | | | 03/15/23 | | | 2,977,500 | |
| Energy Transfer LP(d) | |
| 3,000,000 | | | 4.900 | | | 03/15/35 | | | 2,969,443 | |
| Kinder Morgan Energy Partners LP | |
| 4,175,000 | | | 5.800 | | | 03/15/35 | | | 4,593,102 | |
| ONEOK Partners LP | |
| 875,000 | | | 8.625 | | | 03/01/19 | | | 944,843 | |
| Tennessee Gas Pipeline Co. LLC | |
| 628,000 | | | 8.375 | | | 06/15/32 | | | 819,929 | |
| 1,450,000 | | | 7.625 | | | 04/01/37 | | | 1,840,481 | |
| TransCanada Pipelines Ltd.(d) | |
| 2,500,000 | | | 4.875 | | | 01/15/26 | | | 2,828,199 | |
| Transcanada Trust(b)(d) | |
| (3M USD LIBOR + 3.208%) | | | | |
| 4,660,000 | | | 5.300 | | | 03/15/77 | | | 4,848,730 | |
| | | | | | | | | | |
| | | 27,921,857 | |
| |
Real Estate(d) – 5.2% | |
| CBRE Services, Inc. | |
| 4,700,000 | | | 4.875 | | | 03/01/26 | | | 5,073,247 | |
| Columbia Property Trust Operating Partnership LP | |
| 2,485,000 | | | 4.150 | | | 04/01/25 | | | 2,542,788 | |
| Digital Realty Trust LP | |
| 3,230,000 | | | 3.950 | | | 07/01/22 | | | 3,403,901 | |
| Mid-America Apartments LP | |
| 1,860,000 | | | 4.300 | | | 10/15/23 | | | 1,970,855 | |
| 1,700,000 | | | 3.600 | | | 06/01/27 | | | 1,705,814 | |
| National Retail Properties, Inc. | |
| 1,000,000 | | | 3.900 | | | 06/15/24 | | | 1,029,774 | |
| Omega Healthcare Investors, Inc. | |
| 4,500,000 | | | 4.750 | | | 01/15/28 | | | 4,515,101 | |
| Piedmont Operating Partnership LP | |
| 1,290,000 | | | 3.400 | | | 06/01/23 | | | 1,291,463 | |
| 2,800,000 | | | 4.450 | | | 03/15/24 | | | 2,934,937 | |
| Post Apartment Homes LP | |
| 1,500,000 | | | 3.375 | | | 12/01/22 | | | 1,532,134 | |
| Scentre Group Trust 1/Scentre Group Trust 2(a) | |
| 4,000,000 | | | 3.750 | | | 03/23/27 | | | 4,067,436 | |
| Select Income REIT | |
| 3,000,000 | | | 4.150 | | | 02/01/22 | | | 3,057,360 | |
| 1,000,000 | | | 4.250 | | | 05/15/24 | | | 1,013,040 | |
| Simon Property Group LP | |
| 2,815,000 | | | 3.750 | | | 02/01/24 | | | 2,955,857 | |
| 3,000,000 | | | 4.750 | | | 03/15/42 | | | 3,323,494 | |
| UDR, Inc. | |
| 2,640,000 | | | 3.750 | | | 07/01/24 | | | 2,725,728 | |
| |
| | |
| The accompanying notes are an integral part of these financial statements. | | 25 |
COMMERCE BOND FUND
Schedule of Investments (continued)
October 31, 2017
| | | | | | | | | | |
Principal
Amount | | Interest
Rate | | | Maturity
Date | | Value | |
| Corporate Obligations – (continued) | |
Real Estate(d) – (continued) | |
| Ventas Realty LP | |
| $ 2,910,000 | | | 3.500 | % | | 02/01/25 | | $ | 2,923,163 | |
| VEREIT Operating Partnership LP | |
| 2,400,000 | | | 3.950 | | | 08/15/27 | | | 2,396,726 | |
| Washington Real Estate Investment Trust | |
| 1,580,000 | | | 3.950 | | | 10/15/22 | | | 1,633,397 | |
| Weingarten Realty Investors | |
| 1,000,000 | | | 3.850 | | | 06/01/25 | | | 1,011,063 | |
| 1,660,000 | | | 3.250 | | | 08/15/26 | | | 1,600,152 | |
| WP Carey, Inc. | |
| 2,000,000 | | | 4.600 | | | 04/01/24 | | | 2,090,949 | |
| 1,575,000 | | | 4.000 | | | 02/01/25 | | | 1,584,871 | |
| | | | | | | | | | |
| | | 56,383,250 | |
| |
Retail – 0.4% | |
| CVS Pass-Through Trust(a) | |
| 2,951,654 | | | 7.507 | | | 01/10/32 | | | 3,640,261 | |
| O’Reilly Automotive, Inc.(d) | |
| 1,000,000 | | | 3.800 | | | 09/01/22 | | | 1,046,955 | |
| | | | | | | | | | |
| | | 4,687,216 | |
| |
Semiconductors – 0.9% | |
| Intel Corp. | |
| 5,000,000 | | | 3.100 | | | 07/29/22 | | | 5,188,262 | |
| Maxim Integrated Products, Inc.(d) | |
| 5,016,000 | | | 3.375 | | | 03/15/23 | | | 5,124,583 | |
| | | | | | | | | | |
| | | 10,312,845 | |
| |
Software – 0.1% | |
| Adobe Systems, Inc. | |
| 563,000 | | | 4.750 | | | 02/01/20 | | | 596,777 | |
| |
Telecommunications – 1.1% | |
| AT&T, Inc. | |
| 2,150,000 | | | 6.375 | | | 03/01/41 | | | 2,497,559 | |
| 1,500,000 | | | 4.800 | (d) | | 06/15/44 | | | 1,438,826 | |
| 3,443,000 | | | 4.550 | (d) | | 03/09/49 | | | 3,117,979 | |
| Verizon Communications, Inc.(d) | |
| 4,630,000 | | | 4.150 | | | 03/15/24 | | | 4,913,237 | |
| | | | | | | | | | |
| | | 11,967,601 | |
| |
Transportation – 0.8% | |
| Burlington Northern Santa Fe LLC(d) | |
| 1,220,000 | | | 4.950 | | | 09/15/41 | | | 1,425,405 | |
| Canadian National Railway Co. | |
| 1,190,000 | | | 6.200 | | | 06/01/36 | | | 1,584,612 | |
| Canadian Pacific Railway Co. | |
| 1,775,000 | | | 5.750 | | | 01/15/42 | | | 2,222,818 | |
| 2,500,000 | | | 6.125 | (d)(i) | | 09/15/15 | | | 3,237,967 | |
| The Kansas City Southern Railway Co.(d) | |
| 500,000 | | | 4.950 | | | 08/15/45 | | | 559,630 | |
| | | | | | | | | | |
| | | 9,030,432 | |
| |
| TOTAL CORPORATE OBLIGATIONS | |
(Cost $466,752,997) | | $ | 481,544,051 | |
| |
| | | | | | | | | | | | |
Principal
Amount | | Interest
Rate | | | Maturity
Date | | | Value | |
| Foreign Debt Obligation – 0.0% | |
Sovereign – 0.0% | |
| Ontario Province of Canada | |
| $ 245,000 | | | 1.650 | % | | | 09/27/19 | | | $ | 243,886 | |
(Cost $236,971) | | | | | |
| |
| | | | | | | | | | | | |
| U.S. Government Agency Obligations – 1.4% | |
| FFCB | |
| $ 2,860,000 | | | 5.190 | % | | | 04/22/21 | | | $ | 3,166,203 | |
| FHLB | |
| 2,650,000 | | | 7.125 | | | | 02/15/30 | | | | 3,740,740 | |
| FHLMC(d) | |
| 4,000,000 | | | 1.750 | | | | 03/26/21 | | | | 3,980,348 | |
| Resolution Funding Corp. | |
| 1,500,000 | | | 8.125 | | | | 10/15/19 | | | | 1,684,359 | |
| Tennessee Valley Authority | |
| 1,299,581 | | | 4.929 | | | | 01/15/21 | | | | 1,384,999 | |
| 684,833 | | | 5.131 | | | | 01/15/21 | | | | 732,772 | |
| |
| TOTAL U.S. GOVERNMENT AGENCY OBLIGATIONS | |
(Cost $14,044,175) | | | $ | 14,689,421 | |
| |
| | | | | | | | | | | | |
| U.S. Treasury Obligations – 4.9% | |
| United States Treasury Bond | |
| $ 9,000,000 | | | 2.750 | % | | | 11/15/42 | | | $ | 8,860,781 | |
| United States Treasury Inflation Indexed Bonds | |
| 382,324 | | | 0.125 | | | | 04/15/18 | | | | 382,279 | |
| 7,605,150 | | | 0.750 | | | | 02/15/42 | | | | 7,358,808 | |
| United States Treasury Notes | |
| 5,000,000 | | | 1.250 | | | | 03/31/19 | | | | 4,980,274 | |
| 3,000,000 | | | 1.750 | | | | 10/31/20 | | | | 3,000,820 | |
| 6,000,000 | | | 1.750 | | | | 09/30/22 | | | | 5,924,531 | |
| 7,500,000 | | | 2.125 | | | | 12/31/22 | | | | 7,528,711 | |
| 5,000,000 | | | 1.375 | | | | 08/31/23 | | | | 4,795,703 | |
| 10,000,000 | | | 2.125 | | | | 03/31/24 | | | | 9,964,063 | |
| |
| TOTAL U.S. TREASURY OBLIGATIONS | |
(Cost $53,681,182) | | | $ | 52,795,970 | |
| |
| | | | | | | | | | | | |
| Shares | | | | | Distribution Rate | | | Value | |
| Investment Company – 0.5% | |
| Vanguard Long-Term Investment Grade Fund Admiral Shares | |
| 506,527 | | | | | | | 4.060 | % | | $ | 5,374,254 | |
(Cost $3,961,043) | | | | | | | | | |
| |
| | | | | | | | | | | | |
| | |
| 26 | | The accompanying notes are an integral part of these financial statements. |
COMMERCE BOND FUND
| | | | | | | | | | |
Principal
Amount | | Interest
Rate | | | Maturity
Date | | Value | |
| Short-Term Investment(j) – 1.0% | |
Repurchase Agreement – 1.0% | |
Fixed Income Clearing Corp. | |
| $10,507,000 | | | 0.120 | % | | 11/01/17 | | $ | 10,507,000 | |
Maturity Value: $10,507,070 | | | | |
(Cost $10,507,000) | | | | |
| |
| TOTAL INVESTMENTS – 99.8% | |
(Cost $1,043,162,374) | | $ | 1,075,926,975 | |
| |
OTHER ASSETS IN EXCESS OF LIABILITIES – 0.2% | | | 2,391,023 | |
| |
| NET ASSETS – 100.0% | | $ | 1,078,317,998 | |
| |
| | |
| The percentage shown for each investment category reflects the value of investments in that category as a percentage of net assets. |
| |
| (a) | | Exempt from registration under Rule 144A of the Securities Act of 1933. Under procedures approved by the Board of Trustees, such securities may be deemed to be liquid by the Investment Adviser and may be resold, normally to qualified institutional buyers in transactions exempt from registration. Total market value of Rule 144A securities amounted to $303,556,226, which represents approximately 28.1% of net assets as of October 31, 2017. |
| (b) | | Variable or floating rate security. Interest rate disclosed is that which is in effect at October 31, 2017. |
| (c) | | Step-up Bond. Coupon rate increases in increments to maturity. Rate disclosed is as of October 31, 2017. Maturity date disclosed is the ultimate maturity. |
| (d) | | Security with “Call” features with resetting interest rates. Maturity dates disclosed are the final maturity dates. |
| (e) | | Security issued with a zero coupon. The actual effective yield of this security is different than the stated coupon due to the accretion of discount. |
| (f) | | Prerefunded security. Maturity date disclosed is prerefunding date. |
| (g) | | Rate shown is that which is in effect on October 31, 2017. Certain variable rate securities are not based on a published reference rate and spread but are determined by the issuer or agent and are based on current market conditions. |
| (h) | | Securities with “Put” features with resetting interest rates. Maturity dates disclosed are the next interest reset dates. |
| (i) | | Actual maturity date is September 15, 2115. |
| (j) | | Repurchase agreement was entered into on October 31, 2017. This agreement was fully collateralized by $11,445,000 U.S. Treasury Bond, 2.500%, due 05/15/46 with a market value of $10,721,813. |
| | |
|
| Investment Abbreviations: |
| AGM | | —Insured by Assured Guaranty Municipal Corp. |
| AMT | | —Alternative Minimum Tax |
| FFCB | | —Federal Farm Credit Bank |
| FHA | | —Insured by Federal Housing Administration |
| FHLB | | —Federal Home Loan Bank |
| FHLMC | | —Federal Home Loan Mortgage Corp. |
| FNIC | | —Financial Network Investment Corporation |
| FNMA | | —Federal National Mortgage Association |
| GNMA | | —Government National Mortgage Association |
| PLC | | —Public Limited Company |
| GO | | —General Obligation |
| LIBOR | | —London Interbank Offered Rate |
| PAC | | —Planned Amortization Class |
| REIT | | —Real Estate Investment Trust |
| REMIC | | —Real Estate Mortgage Investment Conduit |
| LLC | | —Limited Liability Company |
| LP | | —Limited Partnership |
|
PORTFOLIO COMPOSITION
| | | | | | | | |
| | | AS OF
10/31/2017 | | | AS OF
10/31/2016 | |
| |
Corporate Obligations | | | 44.7 | % | | | 45.9 | % |
Collateralized Mortgage Obligations | | | 18.2 | | | | 16.5 | |
Asset-Backed Securities | | | 15.4 | | | | 13.7 | |
Municipal Bond Obligations | | | 6.5 | | | | 7.4 | |
Commercial Mortgage Obligations | | | 5.2 | | | | 5.9 | |
U.S. Treasury Obligations | | | 4.9 | | | | 4.1 | |
Federal Agencies | | | 2.0 | | | | — | |
Repurchase Agreement | | | 1.0 | | | | 0.8 | |
Investment Company | | | 0.5 | | | | 0.5 | |
U.S. Government Agency Obligations | | | 1.4 | | | | 2.6 | |
Mortgage-Backed Pass-Through Obligations | | | — | | | | 2.5 | |
Foreign Debt Obligations | | | — | | | | 0.1 | |
| |
| TOTAL INVESTMENTS | | | 99.8 | % | | | 100 | % |
| |
The percentage shown for each investment category reflects the value of investments in that category as a percentage of net assets. Underlying investment categories of investment companies held by the Fund are not reflected in the table above. Consequently, the Fund’s overall investment category allocations may differ from the percentages contained in the table above.
The Fund is actively managed and, as such, its composition may differ over time.
| | |
| The accompanying notes are an integral part of these financial statements. | | 27 |
COMMERCE SHORT-TERM GOVERNMENT FUND
Short-Term Government Fund Overview
We present you with the annual report for the Commerce Short-Term Government Fund for the one-year period ended October 31, 2017.
A conversation with Scott Colbert, Portfolio Manager of the Short-Term Government Fund.
Q: How did the Fund perform over the review period?
A: Over the one-year period ended October 31, 2017, the Fund generated a cumulative total return of 0.31%. This return compares to the 0.08% cumulative total return of the Fund’s benchmark, the Citigroup 1-5 Year Treasury/Government Sponsored Index.
Q: What were the material factors that affected the Fund’s performance relative to its benchmark during the reporting period?
A: During the reporting period the Fund outperformed relative to its benchmark. Underweighting treasuries and maintaining the Fund’s duration lower than the benchmark’s duration during the period contributed to this outperformance.
Q: Were there any significant adjustments made to the Fund’s portfolio during the period?
A: The Fund’s exposure to U.S. government agency obligations was decreased, but remained well above the percentage held in its benchmark. The Fund’s exposure to mortgage-backed securities was increased.
Q: Could you describe some specific strategies and holdings that enhanced the Fund’s returns during the period?
A: Maintaining the Fund’s duration lower than the benchmark’s duration and raising the Fund’s exposure to non-agency mortgage-backed securities enhanced performance during the period.
Q: What were some examples of strategies and holdings that didn’t work well for the Fund during the period?
A: Security selection within U.S. government agency mortgage-backed securities held by the Fund detracted from performance during the period.
28
COMMERCE SHORT-TERM GOVERNMENT FUND
Performance Summary
October 31, 2017 (Unaudited)
The following is performance information for the Commerce Short-Term Government Fund (“Short-Term Government Fund”) for various time periods. The returns represent past performance. Past performance is no guarantee of future results. The Fund’s investment return and principal value will fluctuate so that an investor’s shares, when redeemed, may be worth more or less than their original cost. Performance reflects expense limitations in effect. In their absence, performance would be reduced. Returns do not reflect the deduction of taxes that a shareholder would pay on Fund distributions or the redemption of Fund shares. The Fund is not subject to a sales charge, so a sales charge is not applied to its total returns. In addition to the Adviser’s decisions regarding issuer/industry investment selection and allocation, other factors may affect Fund performance. These factors include, but are not limited to, Fund operating fees and expenses, portfolio turnover, and subscription and redemption cash flows affecting the Fund. Please visit our website at www.commercefunds.com to obtain the most recent month-end returns.
| | | | | | | | |
| | Performance Review | | | | | | |
| | | November 1, 2016 - October 31, 2017 | | Fund Total Return(a) | | Index Total Return(c) | | Index |
| | | Short-Term Government Fund | | 0.31% | | 0.08% | | Citigroup 1-5 Year Treasury/Government Sponsored(c) |
Standardized Average Annual Total Return through September 30, 2017(b)
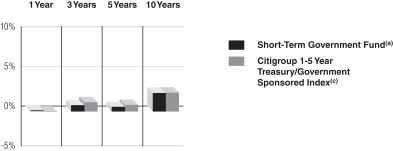
| | | | | | | | | | |
| | Standardized Average Annual Total Return through September 30, 2017(b) | | One Year | | Three Years | | Five Years | | Ten Years |
| | | Short-Term Government Fund(a) | | 0.11% | | 0.80% | | 0.61% | | 2.34% |
| | | Citigroup 1-5 Year Treasury/Government Sponsored Index(c) | | –0.03% | | 1.15% | | 0.83% | | 2.39% |
| | |
| Short-Term Government Fund 10 Year Performance | | |
Performance of a $10,000 Investment, with distributions reinvested, from November 1, 2007 through October 31, 2017.
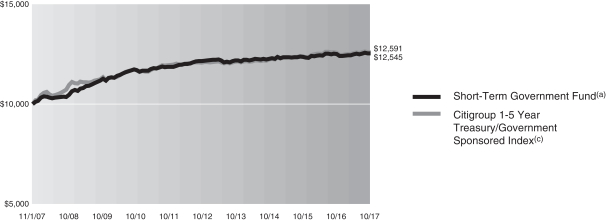
| | | | | | | | | | |
| | Average Annual Total Return through October 31, 2017 | | One Year | | Three Years | | Five Years | | Ten Years |
| | | Short-Term Government Fund(a) | | 0.31% | | 0.74% | | 0.63% | | 2.29% |
| | | | | | |
| | Expense Ratios(d) | | | | |
| | | | | Net Expense Ratio (Current) | | Gross Expense Ratio (Before Reimbursements) |
| | | Short-Term Government Fund | | 0.68% | | 0.88% |
| (a) | | Returns reflect any fee waivers or expense reductions. Returns do not reflect the deduction of taxes that a shareholder would pay on Fund distributions or the redemption of Fund shares. |
| (b) | | The Standardized Average Annual Total Returns are average annual total returns as of the most recent calendar quarter-end. They assume reinvestment of all distributions at NAV. Current performance may be lower or higher than the total return figures in the above charts. |
| | | Returns reflect any fee waivers and expense reductions. Absent these waivers and reductions, returns would have been lower. Returns do not reflect the deduction of taxes that a shareholder would pay on capital gains or other taxable distributions or the redemption of Fund shares. |
| (c) | | The Citigroup 1-5 Year Treasury/Government Sponsored Index is an unmanaged index comprised of Treasury securities with a minimum principal amount of $1 billion and U.S. Government securities with a minimum principal amount of $100 million. The securities range in maturity from one to five years. The Index figures do not reflect any deduction for fees, taxes or expenses. |
| (d) | | The Fund’s expense ratios, both net (net of applicable fee waivers and/or expense reimbursements) and gross (before applicable fee waivers and/or expense reimbursements), set forth above are as of the most recent publicly available prospectus for the Fund (March 1, 2017) and may differ from the expense ratios disclosed in the Financial Highlights in this report. The Adviser has contractually agreed to reduce or limit the Total Annual Fund Operating Expenses, excluding interest, taxes, acquired fund fees and expenses and extraordinary expenses. This agreement will remain in place through March 1, 2018. After this date, the Adviser or the Fund may terminate the contractual arrangement. If this occurs, the expense ratios may change without shareholder approval. |
29
COMMERCE SHORT-TERM GOVERNMENT FUND
Schedule of Investments
October 31, 2017
| | | | | | | | | | |
Principal
Amount | | Interest
Rate | | | Maturity
Date | | Value | |
| Asset-Backed Securities(a) – 3.2% | |
Home Equity – 1.8% | |
| Argent Securities, Inc. Series 2004-W5, Class AV3B | |
| (1M USD LIBOR + 0.900%) | | | | |
| $1,117,101 | | | 2.137 | % | | 04/25/34 | | $ | 1,126,958 | |
| Morgan Stanley Capital, Inc. Series 2002-HE3, Class A2 | |
| (1M USD LIBOR + 1.080%) | | | | |
| 310,683 | | | 2.317 | | | 03/25/33 | | | 298,409 | |
| Terwin Mortgage Trust Series 2004-7HE, Class A3(b) | |
| (1M USD LIBOR + 0.700%) | | | | |
| 238,525 | | | 2.637 | | | 07/25/34 | | | 232,828 | |
| Terwin Mortgage Trust Series 2004-9HE, Class A1(b) | |
| (1M USD LIBOR + 0.400%) | | | | |
| 142,871 | | | 2.037 | | | 09/25/34 | | | 136,327 | |
| | | | | | | | | | |
| 1,794,522 | |
| |
Other – 1.4% | |
| Countrywide Asset-Backed Certificates Series 2004-6, Class 2A4 | |
| (1M USD LIBOR + 0.900%) | | | | |
| 371,961 | | | 2.137 | | | 11/25/34 | | | 369,955 | |
| Towd Point Mortgage Trust Series 2016-3, Class A1(b) | |
| 1,070,453 | | | 2.250 | | | 04/25/56 | | | 1,063,697 | |
| | | | | | | | | | |
| | | 1,433,652 | |
| |
| TOTAL ASSET-BACKED SECURITIES | |
(Cost $2,887,926) | | $ | 3,228,174 | |
| |
| | | | | | | | | | |
| Mortgage-Backed Obligations – 27.3% | |
Collateralized Mortgage Obligations – 17.4% | |
| Adjustable Rate Mortgage Trust Series 2004-5, Class 3A1(a)(c) | |
| $ 103,453 | | | 3.678 | % | | 04/25/35 | | $ | 104,268 | |
| American Home Mortgage Investment Trust Series 2004-4, Class 5A(a) | |
| (1M USD LIBOR + 2.000%) | | | | |
| 456,881 | | | 3.453 | | | 02/25/45 | | | 462,090 | |
| Banc of America Mortgage Securities, Inc. Series 2003-J, Class 2A1(a) | |
| 216,772 | | | 3.674 | | | 11/25/33 | | | 217,338 | |
| Bank of America Funding Corp. Series 2004-A, Class 1A3(a) | |
| 10,344 | | | 3.602 | | | 09/20/34 | | | 10,532 | |
| Bear Stearns Adjustable Rate Mortgage Trust Series 2004-9, Class 24A1(a) | |
| 60,939 | | | 3.988 | | | 11/25/34 | | | 59,212 | |
| Citigroup Mortgage Loan Trust, Inc. Series 2004-HYB3, Class 1A(a)(c) | |
| 56,472 | | | 3.579 | | | 09/25/34 | | | 56,572 | |
| Countrywide Alternative Loan Trust Series 2004-29CB, Class A7 | |
| 14,332 | | | 5.375 | | | 01/25/35 | | | 14,327 | |
| FHLMC REMIC PAC Series 159, Class H | |
| 5,055 | | | 4.500 | | | 09/15/21 | | | 5,155 | |
| FHLMC REMIC PAC Series 2022, Class PE | |
| 20,206 | | | 6.500 | | | 01/15/28 | | | 22,393 | |
| |
| | | | | | | | | | |
Principal
Amount | | Interest
Rate | | | Maturity
Date | | Value | |
| Mortgage-Backed Obligations – (continued) | |
Collateralized Mortgage Obligations – (continued) | |
| FHLMC REMIC PAC Series 2109, Class PE | |
| $ 41,231 | | | 6.000 | % | | 12/15/28 | | $ | 46,703 | |
| FHLMC REMIC PAC Series 23, Class PK | |
| 99,904 | | | 6.000 | | | 11/25/23 | | | 107,380 | |
| FHLMC REMIC Series 2830, Class DA | |
| 5,200 | | | 5.000 | | | 07/15/19 | | | 5,233 | |
| FHLMC REMIC Series 2972, Class CA | |
| 1,631 | | | 4.500 | | | 05/15/20 | | | 1,651 | |
| FHLMC REMIC Series 3816, Class HA | |
| 1,074,517 | | | 3.500 | | | 11/15/25 | | | 1,123,364 | |
| FHLMC REMIC Series 4467, Class DA | |
| 891,775 | | | 3.000 | | | 11/15/41 | | | 906,970 | |
| FNMA REMIC PAC Series 1992, Class 89 Principal-Only Stripped Security(d) | |
| 5,786 | | | 0.000 | | | 06/25/22 | | | 5,579 | |
| FNMA REMIC PAC Series 1992-129, Class L | |
| 32,859 | | | 6.000 | | | 07/25/22 | | | 34,593 | |
| FNMA REMIC PAC Series 2003-117, Class KB | |
| 556,000 | | | 6.000 | | | 12/25/33 | | | 630,188 | |
| FNMA REMIC PAC Series 2003-14, Class AP | |
| 85,921 | | | 4.000 | | | 03/25/33 | | | 88,916 | |
| FNMA REMIC Series 1991-137, Class H | |
| 14,085 | | | 7.000 | | | 10/25/21 | | | 14,869 | |
| FNMA REMIC Series 1993-182, Class FA(a) | |
| (10Y US Treasury Index rate — 0.650%) | | | | |
| 6,105 | | | 1.530 | | | 09/25/23 | | | 6,090 | |
| FNMA REMIC Series 2012-110, Class CA | |
| 966,498 | | | 3.000 | | | 10/25/42 | | | 969,670 | |
| FNMA REMIC Series 2015-2, Class PA | |
| 792,419 | | | 2.250 | | | 03/25/44 | | | 781,697 | |
| FNMA REMIC Series 2016-104, Class BA | |
| 810,524 | | | 3.000 | | | 01/25/47 | | | 823,580 | |
| FNMA REMIC Series 2016-53, Class BV | |
| 936,079 | | | 3.500 | | | 11/25/27 | | | 974,100 | |
| FNMA REMIC Series 2016-96, Class A | |
| 849,418 | | | 1.750 | | | 12/25/46 | | | 820,512 | |
| FNMA REMIC Series 2017-7, Class JA | |
| 771,462 | | | 2.000 | | | 02/25/47 | | | 733,410 | |
| GNMA REMIC Series 2009-65, Class AF | |
| 110,001 | | | 4.000 | | | 07/20/39 | | | 114,399 | |
| GNMA REMIC Series 2010-115, Class QJ | |
| 146,784 | | | 3.500 | | | 11/20/38 | | | 148,576 | |
| GNMA REMIC Series 2010-14, Class PA | |
| 65,854 | | | 3.000 | | | 02/20/40 | | | 66,285 | |
| GNMA REMIC Series 2010-89, Class GL | |
| 325,483 | | | 4.000 | | | 05/20/39 | | | 334,711 | |
| GNMA REMIC Series 2013-188, Class LE | |
| 1,562,695 | | | 2.500 | | | 11/16/43 | | | 1,551,198 | |
| GNMA REMIC Series 2015-94, Class AT | |
| 646,867 | | | 2.250 | | | 07/16/45 | | | 632,772 | |
| |
| | |
| 30 | | The accompanying notes are an integral part of these financial statements. |
COMMERCE SHORT-TERM GOVERNMENT FUND
| | | | | | | | | | |
Principal
Amount | | Interest
Rate | | | Maturity
Date | | Value | |
| Mortgage-Backed Obligations – (continued) | |
Collateralized Mortgage Obligations – (continued) | |
| GSR Mortgage Loan Trust Series 2003-6F, Class A1 | |
| $ 25,224 | | | 3.000 | % | | 09/25/32 | | $ | 25,177 | |
| GSR Mortgage Loan Trust Series 2004-6F, Class 5A1 | |
| 13,758 | | | 5.500 | | | 03/25/19 | | | 13,826 | |
| GSR Mortgage Loan Trust Series 2005-AR3, Class 2A1(a) | |
| (1M USD LIBOR + 0.440%) | | | | |
| 281,038 | | | 1.677 | | | 05/25/35 | | | 259,268 | |
| GSR Mortgage Loan Trust Series 2006-AR1, Class 2A4(a)(c) | |
| 662,152 | | | 3.415 | | | 01/25/36 | | | 661,749 | |
| Homestar Mortgage Acceptance Corp. Series 2004-2, Class AV1(a) | |
| (1M USD LIBOR + 0.700%) | | | | |
| 454,808 | | | 1.937 | | | 06/25/34 | | | 457,047 | |
| Impac CMB Trust Series 2003-2F, Class A(e) | |
| 249,374 | | | 5.730 | | | 01/25/33 | | | 257,229 | |
| Impac CMB Trust Series 2003-8, Class 2A1(a) | |
| (1M USD LIBOR + 0.900%) | | | | |
| 94,558 | | | 2.137 | | | 10/25/33 | | | 93,638 | |
| Impac CMB Trust Series 2004-7, Class 1A1(a) | |
| (1M USD LIBOR + 0.740%) | | | | |
| 88,031 | | | 1.977 | | | 11/25/34 | | | 87,565 | |
| Impac CMB Trust Series 2005-2, Class 2A2(a) | |
| (1M USD LIBOR + 0.800%) | | | | |
| 115,238 | | | 2.037 | | | 04/25/35 | | | 111,431 | |
| Impac Secured Assets Corp. Series 2006-1, Class 2A1(a) | |
| (1M USD LIBOR + 0.350%) | | | | |
| 747,833 | | | 1.587 | | | 05/25/36 | | | 710,812 | |
| Indymac Index Mortgage Loan Trust Series 2004-AR6, Class 6A1(a)(c) | |
| 84,924 | | | 3.744 | | | 10/25/34 | | | 84,102 | |
| Lehman XS Trust Series 2005-7N, Class 1A1A(a) | |
| (1M USD LIBOR + 0.270%) | | | | |
| 160,452 | | | 1.507 | | | 12/25/35 | | | 159,054 | |
| Master Adjustable Rate Mortgages Trust Series 2004-13, Class 2A1(a)(c) | |
| 128,939 | | | 3.464 | | | 04/21/34 | | | 131,819 | |
| Master Alternative Loans Trust Series 2004-9, Class A6(e) | |
| 40,155 | | | 5.143 | | | 08/25/34 | | | 41,599 | |
| Master Asset Securitization Trust Series 2004-3, Class 5A1 | |
| 2,911 | | | 6.250 | | | 01/25/32 | | | 2,934 | |
| MortgageIT Trust Series 2005-1, Class 1A1(a) | |
| (1M USD LIBOR + 0.640%) | | | | |
| 911,834 | | | 1.877 | | | 02/25/35 | | | 907,688 | |
| MortgageIT Trust Series 2005-1, Class 1A2(a) | |
| (1M USD LIBOR + 0.780%) | | | | |
| 784,311 | | | 2.017 | | | 02/25/35 | | | 782,371 | |
| Residential Accredit Loans, Inc. Series 2004-QA4, Class NB21(a)(c) | |
| 34,267 | | | 4.133 | | | 09/25/34 | | | 34,126 | |
| Securitized Asset Sales, Inc. Series 1993-7, Class TA6 | |
| 6,186 | | | 6.250 | | | 12/25/23 | | | 6,243 | |
| Sequoia Mortgage Trust Series 10, Class 1A(a) | |
| (1M USD LIBOR + 0.800%) | | | | |
| 48,970 | | | 2.036 | | | 10/20/27 | | | 47,670 | |
| |
| | | | | | | | | | | | |
Principal
Amount | | Interest
Rate | | | Maturity
Date | | | Value | |
| Mortgage-Backed Obligations – (continued) | |
Collateralized Mortgage Obligations – (continued) | |
| Sequoia Mortgage Trust Series 2003-2, Class A1(a) | |
| (1M USD LIBOR + 0.660%) | | | | | |
| $ 86,018 | | | 1.896 | % | | | 06/20/33 | | | $ | 86,414 | |
| Structured Asset Securities Corp. Series 2003-31A, Class 2A7(a)(c) | |
| 331,407 | | | 3.392 | | | | 10/25/33 | | | | 336,275 | |
| Vendee Mortgage Trust Series 1996-2, Class 1Z | |
| 86,004 | | | 6.750 | | | | 06/15/26 | | | | 95,446 | |
| Washington Mutual MSC Mortgage Pass-Through Series 2003-MS8, Class 2A1 | |
| 2,014 | | | 5.000 | | | | 05/25/18 | | | | 2,012 | |
| Wells Fargo Alternative Loan Trust Series 2003-1, Class 2A1 | |
| 10,901 | | | 5.750 | | | | 09/25/18 | | | | 10,891 | |
| |
| TOTAL COLLATERALIZED MORTGAGE OBLIGATIONS | |
(Cost $15,965,190) | | | | | | | $ | 17,280,719 | |
| |
Federal Agencies – 9.9% | |
| FHLMC | |
| $ 15,917 | | | 6.000 | % | | | 10/01/23 | | | $ | 17,869 | |
| 33,008 | | | 5.000 | | | | 05/01/27 | | | | 35,690 | |
| 494,414 | | | 2.500 | | | | 04/01/28 | | | | 497,164 | |
| (12M USD LIBOR + 1.600%) | | | | | |
| 699,146 | | | 2.757 | (a) | | | 07/01/45 | | | | 708,240 | |
| (12M USD LIBOR + 1.583%) | | | | | |
| 785,830 | | | 2.640 | (a) | | | 07/01/46 | | | | 796,594 | |
| FNMA | |
| 11,052 | | | 5.500 | | | | 05/01/19 | | | | 11,203 | |
| 8,187 | | | 5.500 | | | | 06/01/20 | | | | 8,277 | |
| 897,587 | | | 2.500 | | | | 02/01/27 | | | | 907,701 | |
| 859,335 | | | 2.500 | | | | 03/01/28 | | | | 863,799 | |
| 1,567,883 | | | 2.500 | | | | 05/01/28 | | | | 1,576,024 | |
| 561,328 | | | 2.500 | | | | 01/01/30 | | | | 561,913 | |
| 5,576 | | | 7.000 | | | | 11/01/31 | | | | 5,768 | |
| 961,520 | | | 2.500 | | | | 02/01/32 | | | | 962,530 | |
| 204,457 | | | 6.000 | | | | 07/01/33 | | | | 229,311 | |
| (12M USD LIBOR + 1.655%) | | | | | |
| 146,654 | | | 3.237 | (a) | | | 02/01/34 | | | | 155,565 | |
| (12M USD LIBOR + 1.740%) | | | | | |
| 94,273 | | | 3.379 | (a) | | | 10/01/34 | | | | 99,535 | |
| 742,552 | | | 3.500 | | | | 08/01/35 | | | | 773,868 | |
| 921,794 | | | 2.500 | | | | 10/01/36 | | | | 905,940 | |
| (12M USD LIBOR + 1.586%) | | | | | |
| 626,411 | | | 2.620 | (a) | | | 12/01/45 | | | | 635,937 | |
| GNMA(a) | |
| (1Y US Treasury Yield Curve rate + 1.500%) | |
| 146 | | | 2.250 | | | | 11/20/24 | | | | 151 | |
| 344 | | | 3.000 | | | | 12/20/24 | | | | 351 | |
| 6,278 | | | 2.625 | | | | 04/20/26 | | | | 6,477 | |
| 3,815 | | | 2.125 | | | | 08/20/26 | | | | 3,871 | |
| 6,956 | | | 2.375 | | | | 01/20/28 | | | | 7,190 | |
| |
| TOTAL FEDERAL AGENCIES | |
(Cost $9,865,753) | | | | | | | $ | 9,770,968 | |
| |
| TOTAL MORTGAGE-BACKED OBLIGATIONS | |
(Cost $25,830,943) | | | | | | | $ | 27,051,687 | |
| |
| | |
| The accompanying notes are an integral part of these financial statements. | | 31 |
COMMERCE SHORT-TERM GOVERNMENT FUND
Schedule of Investments (continued)
October 31, 2017
| | | | | | | | | | | | |
Principal
Amount | | Interest
Rate | | | Maturity
Date | | | Value | |
| U.S. Government Agency Obligations – 41.6% | |
| FFCB(f) | |
| $1,000,000 | | | 1.170 | % | | | 01/13/20 | | | $ | 988,299 | |
| 1,000,000 | | | 1.400 | | | | 04/13/20 | | | | 988,292 | |
| 1,000,000 | | | 1.420 | | | | 06/29/20 | | | | 988,158 | |
| 1,000,000 | | | 1.350 | | | | 09/21/20 | | | | 983,328 | |
| 1,000,000 | | | 2.350 | | | | 08/01/23 | | | | 998,041 | |
| FHLB | |
| 1,500,000 | | | 1.125 | | | | 04/25/18 | | | | 1,498,754 | |
| 1,500,000 | | | 0.875 | | | | 06/29/18 | | | | 1,494,924 | |
| 2,500,000 | | | 2.000 | | | | 09/13/19 | | | | 2,516,292 | |
| 1,000,000 | | | 4.125 | | | | 12/13/19 | | | | 1,050,436 | |
| 1,500,000 | | | 1.375 | | | | 02/18/21 | | | | 1,478,378 | |
| 550,000 | | | 2.500 | (f) | | | 12/29/21 | | | | 550,604 | |
| 1,000,000 | | | 2.000 | (f) | | | 09/06/22 | | | | 990,541 | |
| 1,000,000 | | | 2.600 | (f) | | | 06/23/27 | | | | 966,140 | |
| FHLMC | |
| 1,000,000 | | | 0.750 | | | | 04/09/18 | | | | 997,665 | |
| 1,500,000 | | | 1.250 | | | | 08/01/19 | | | | 1,490,250 | |
| 1,000,000 | | | 1.250 | | | | 10/02/19 | | | | 992,653 | |
| 1,000,000 | | | 1.500 | | | | 01/17/20 | | | | 995,891 | |
| 1,000,000 | | | 2.250 | (f) | | | 02/28/20 | | | | 1,000,672 | |
| 900,000 | | | 1.500 | (e)(f) | | | 04/13/20 | | | | 899,735 | |
| 750,000 | | | 1.750 | (f) | | | 03/26/21 | | | | 746,315 | |
| 525,000 | | | 1.550 | (e)(f) | | | 06/28/22 | | | | 523,221 | |
| 1,000,000 | | | 2.000 | (e)(f) | | | 06/14/27 | | | | 995,791 | |
| FNMA | |
| 1,000,000 | | | 0.875 | | | | 12/20/17 | | | | 999,715 | |
| 1,000,000 | | | 0.875 | | | | 02/08/18 | | | | 999,142 | |
| 1,750,000 | | | 1.625 | | | | 11/27/18 | | | | 1,751,813 | |
| 1,000,000 | | | 1.125 | | | | 12/14/18 | | | | 995,499 | |
| 1,000,000 | | | 1.000 | | | | 02/26/19 | | | | 992,798 | |
| 1,000,000 | | | 1.150 | (f) | | | 05/24/19 | | | | 992,708 | |
| 1,000,000 | | | 1.000 | (f) | | | 07/26/19 | | | | 988,178 | |
| 2,500,000 | | | 1.750 | | | | 11/26/19 | | | | 2,503,588 | |
| 1,000,000 | | | 1.500 | | | | 06/22/20 | | | | 994,749 | |
| 1,000,000 | | | 1.750 | (f) | | | 11/20/20 | | | | 997,286 | |
| 1,000,000 | | | 1.250 | | | | 05/06/21 | | | | 980,753 | |
| 1,000,000 | | | 1.400 | (f) | | | 08/25/21 | | | | 980,240 | |
| 1,000,000 | | | 2.000 | | | | 01/05/22 | | | | 1,000,159 | |
| 900,000 | | | 2.075 | (f) | | | 02/28/22 | | | | 896,144 | |
| 950,000 | | | 2.125 | (f) | | | 02/28/22 | | | | 948,162 | |
| |
| TOTAL U.S. GOVERNMENT AGENCY OBLIGATIONS | |
(Cost $41,388,610) | | | | | | | $ | 41,155,314 | |
| |
| | | | | | | | | | | | |
| U.S. Treasury Obligations – 24.6% | |
| United States Treasury Inflation Indexed Bonds | |
| $1,062,010 | | | 0.125 | % | | | 04/15/18 | | | $ | 1,061,886 | |
| 910,760 | | | 1.375 | | | | 07/15/18 | | | | 924,765 | |
| 914,752 | | | 2.125 | | | | 01/15/19 | | | | 940,634 | |
| 1,047,690 | | | 0.125 | | | | 04/15/19 | | | | 1,050,389 | |
| 1,475,838 | | | 1.375 | | | | 01/15/20 | | | | 1,525,465 | |
| 1,048,320 | | | 0.125 | | | | 04/15/20 | | | | 1,051,999 | |
| |
| | | | | | | | | | | | |
Principal
Amount | | Interest
Rate | | | Maturity
Date | | | Value | |
| U.S. Treasury Obligations – (continued) | |
| United States Treasury Notes | |
| $3,000,000 | | | 0.750 | % | | | 03/31/18 | | | $ | 2,993,668 | |
| 2,000,000 | | | 1.375 | | | | 06/30/18 | | | | 2,000,161 | |
| 1,000,000 | | | 1.500 | | | | 01/31/19 | | | | 999,688 | |
| 1,000,000 | | | 1.375 | | | | 02/28/19 | | | | 998,164 | |
| 1,000,000 | | | 1.000 | | | | 09/30/19 | | | | 989,023 | |
| 1,000,000 | | | 1.500 | | | | 10/31/19 | | | | 998,086 | |
| 1,000,000 | | | 1.125 | | | | 12/31/19 | | | | 989,492 | |
| 1,000,000 | | | 1.625 | | | | 06/30/20 | | | | 998,008 | |
| 2,750,000 | | | 2.250 | | | | 03/31/21 | | | | 2,789,746 | |
| 1,000,000 | | | 2.000 | | | | 05/31/21 | | | | 1,005,508 | |
| 1,000,000 | | | 2.125 | | | | 06/30/21 | | | | 1,009,570 | |
| 1,000,000 | | | 2.250 | | | | 07/31/21 | | | | 1,013,789 | |
| 1,000,000 | | | 1.875 | | | | 04/30/22 | | | | 995,859 | |
| |
| TOTAL U.S. TREASURY OBLIGATIONS | |
(Cost $24,918,592) | | | | | | | $ | 24,335,900 | |
| |
| | | | | | | | | | | | |
| Short-term Investment(g) – 3.0% | |
Repurchase Agreement – 3.0% | |
Fixed Income Clearing Corp. | |
| $2,985,000 | | | 0.120 | % | | | 11/01/17 | | | $ | 2,985,000 | |
Maturity Value: $2,985,020 | |
(Cost $2,985,000) | | | | | | | | | |
| |
| TOTAL INVESTMENTS – 99.7% | |
(Cost $98,011,071) | | | | | | | $ | 98,756,075 | |
| |
OTHER ASSETS IN EXCESS OF LIABILITIES – 0.3% | | | | 255,365 | |
| |
NET ASSETS – 100.0% | | | $ | 99,011,440 | |
| |
| | |
| The percentage shown for each investment category reflects the value of investments in that category as a percentage of net assets. |
| |
| (a) | | Variable rate security. The interest rate shown reflects the rate as of October 31, 2017. |
| (b) | | Exempt from registration under Rule 144A of the Securities Act of 1933. Under procedures approved by the Board of Trustees, such securities may be deemed to be liquid by the Investment Adviser and may be resold, normally to qualified institutional buyers in transactions exempt from registration. Total market value of Rule 144A securities amounted to $1,432,852, which represents approximately 1.5% of net assets as of October 31, 2017. |
| (c) | | Rate shown is that which is in effect on October 31, 2017. Certain variable rate securities are not based on a published reference rate and spread but are determined by the issuer or agent and are based on current market conditions. |
| (d) | | Issued with a zero coupon. Income is recognized through the accretion of discount. |
| (e) | | Step-up Bond. Coupon rate increases in increments to maturity. Rate disclosed is as of October 31, 2017. Maturity date disclosed is the ultimate maturity. |
| | |
| 32 | | The accompanying notes are an integral part of these financial statements. |
COMMERCE SHORT-TERM GOVERNMENT FUND
| | |
| (f) | | Security with “Call” features with resetting interest rates. Maturity dates disclosed are the final maturity dates. |
| (g) | | Repurchase agreement was entered into on October 31, 2017. This agreement was fully collateralized by $3,010,000 U.S. Treasury Bond, 2.875%, due 11/15/46 with a market value of $3,046,791. |
| | |
|
| Investment Abbreviations: |
| FFCB | | —FederalFarm Credit Bank |
| FHLB | | —FederalHome Loan Bank |
| FHLMC | | —FederalHome Loan Mortgage Corp. |
| FNMA | | —FederalNational Mortgage Association |
| GNMA | | —GovernmentNational Mortgage Association |
| LIBOR | | —LondonInterbank Offered Rate |
| MSC | | —MortgageSecurities Corp. |
| PAC | | —PlannedAmortization Class |
| REMIC | | —RealEstate Mortgage Investment Conduit |
|
PORTFOLIO COMPOSITION
| | | | | | | | |
| | | AS OF
10/31/2017 | | | AS OF
10/31/2016 | |
| |
U.S. Government Agency Obligations | | | 41.6 | % | | | 48.1 | % |
U.S. Treasury Obligations | | | 24.6 | | | | 24.3 | |
Mortgage-Backed Obligations | | | 17.5 | | | | 15.2 | |
Federal Agencies | | | 9.9 | | | | 9.1 | |
Asset-Backed Securities | | | 3.2 | | | | 2.4 | |
Repurchase Agreement | | | 3.0 | | | | 2.8 | |
| |
| TOTAL INVESTMENTS | | | 99.7 | % | | | 101.9 | % |
| |
The percentage shown for each investment category reflects the value of investments in that category as a percentage of net assets.
The Fund is actively managed and, as such, its composition may differ over time.
| | |
| The accompanying notes are an integral part of these financial statements. | | 33 |
COMMERCE NATIONAL, MISSOURI, AND KANSAS TAX-FREE INTERMEDIATE BOND FUND
National, Missouri, and Kansas Tax-Free Intermediate Bond Funds Overview
We present you with the annual report for the Commerce National, Missouri, and Kansas Tax-Free Intermediate Bond Funds for the one-year period ended October 31, 2017.
A conversation with Brian Musielak, Portfolio Manager of the National, Missouri, and Kansas Tax-Free Intermediate Bond Funds.
Q: How did the Funds perform over the review period?
A: Over the one-year period ended October 31, 2017, the National Tax-Free Intermediate Bond Fund generated an annualized total return of +1.62%.
Over the one-year period ended October 31, 2017, the Missouri Tax-Free Intermediate Bond Fund generated an annualized total return of +1.70%.
Over the one-year period ended October 31, 2017, the Kansas Tax-Free Intermediate Bond Fund generated an annualized total return of +1.09%.
These returns compare to the +2.05% annualized total return of each Fund’s benchmark, the Bloomberg Barclays Capital 3-15 Year Municipal Bond Blend Index.
Q: What were the material factors that affected the Funds’ performance relative to its benchmark during the reporting period?
A: The Funds underperformed their benchmark largely due to being slightly long their benchmark heading into the fiscal year just in time for the bond market sell-off post the election in November. The Funds were unable to fully recover during the year. Overall municipal bonds continued their positive performance despite higher yields.
Q: Were there any significant adjustments made to the Fund’s portfolio during the period?
A: No significant adjustments were made to any of the Fund’s portfolios during the period. Maturity and duration profiles were kept in a more neutral position relative to our benchmark. Our focus continues to be on the higher-yielding, non-essential service revenue sectors where we typically identify solid risk-adjusted value opportunities. However, we have recently moved towards slightly less credit risk. Maturity and duration profiles are in a more neutral position. States where we are finding attractive local opportunities include Indiana, Ohio, Michigan, Kansas, and selectively in Illinois. At the margin, we are finding better value in AA-rated versus single A-rated issuers with maturities inside 15 years. We maintained our position in sectors such as housing, higher education, hospitals and lease revenue bonds.
Q: Could you describe some specific strategies and holdings that enhanced returns during the period?
A: In the National Tax-Free Intermediate Bond Fund, the best performing bonds were those in the more fiscally challenged states and our high conviction sectors such as Sarpy County NE Hospital Authority #1 Health Facilities Revenue—NE Medicine 3.00% due 5/15/46, Illinois State Finance Authority Revenue—OSF Healthcare System 3.25% due 5/15/39 and Los Angeles CA Universal School District 2.00% due 7/1/29.
In the Missouri Tax-Free Intermediate Bond Fund, the best performing bonds were non-Missouri bonds that included Illinois State Finance Authority Revenue—OSF Healthcare System 3.25% due 5/15/39, Orange County NY 2.25% due 3/15/33 and Orange County FL Tourist Development Tax Revenue 4.00% due 3/1/33.
In the Kansas Tax-Free Intermediate Bond Fund, the best performing bonds were non-Kansas bonds that included Illinois State Finance Authority Revenue—OSF Healthcare System 3.25% due 5/15/39, Knox County TN Health Educational & Housing Facilities Board Revenue—University Health Systems Inc 3.375% due 4/1/26, and Unified Fire Service Area UT Local Building Authority Lease Revenue 3.00% due 4/1/34.
Q: What were some examples of strategies and holdings that didn’t meet your expectations?
A: In the National Tax-Free Intermediate Bond Fund, the Rhode Island Housing & Mortgage Finance Corporation Multi Family Development 5.125% due 10/1/30, Colorado Educational & Cultural Facilities Authority Revenue Charter Schools-High Point Academy 4.50% due 3/1/20, and Massachusetts St Housing Finance Agency Housing Revenue 2.90% due 12/1/31 did not meet our expectations.
In the Missouri Tax-Free Intermediate Bond Fund, Springfield MO Special Obligation 5.00% due 7/1/28, Ozark MO Reorganized School District #R-6 MO Direct Deposit Program 4.00% due 3/1/34, and Burbank Unified School District-Capital Appreciation Bonds 0.00% due 7/1/27 did not meet our expectations.
In the Kansas Tax-Free Intermediate Bond Fund, the Johnson County KS Unified School District #233 4.00% due 9/1/30, Sedgwick County KS Unified School District #260 4.00% 10/1/30, and the Burbank Unified School District-Capital Appreciation Bonds 0.00% due 7/1/27 did not meet our expectations.
34
COMMERCE NATIONAL TAX-FREE INTERMEDIATE BOND FUND
Performance Summary
October 31, 2017 (Unaudited)
The following is performance information for the Commerce National Tax-Free Intermediate Bond Fund (“National Tax-Free Intermediate Bond Fund”) for various time periods. The returns represent past performance. Past performance is no guarantee of future results. The Fund’s investment return and principal value will fluctuate so that an investor’s shares, when redeemed, may be worth more or less than their original cost. Performance reflects expense limitations in effect. In their absence, performance would be reduced. Returns do not reflect the deduction of taxes that a shareholder would pay on Fund distributions or the redemption of Fund shares. The Fund is not subject to a sales charge, so a sales charge is not applied to its total returns. In addition to the Adviser’s decisions regarding issuer/industry investment selection and allocation, other factors may affect Fund performance. These factors include, but are not limited to, Fund operating fees and expenses, portfolio turnover, and subscription and redemption cash flows affecting the Fund. Please visit our website at www.commercefunds.com to obtain the most recent month-end returns.
| | | | | | | | |
| | Performance Review | | | | | | |
| | | November 1, 2016 - October 31, 2017 | | Fund Total Return(a) | | Index Total Return(c) | | Index |
| | | National Tax-Free Intermediate Bond Fund | | 1.62% | | 2.05% | | Bloomberg Barclays 3-15 Year Blend Municipal Bond(c) |
Standardized Average Annual Total Return through September 30, 2017(b)
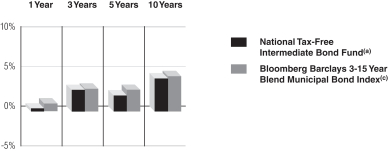
| | | | | | | | | | |
| | Standardized Average Annual Total Return through September 30, 2017(b) | | One Year | | Three Years | | Five Years | | Ten Years |
| | | National Tax-Free Intermediate Bond Fund(a) | | 0.41% | | 2.74% | | 2.00% | | 4.12% |
| | | Bloomberg Barclays 3-15 Year Blend Municipal Bond Index(c) | | 0.96% | | 2.83% | | 2.71% | | 4.42% |
National Tax-Free Intermediate Bond Fund 10 Year Performance
Performance of a $10,000 Investment, with distributions reinvested, from November 1, 2007 through October 31, 2017.
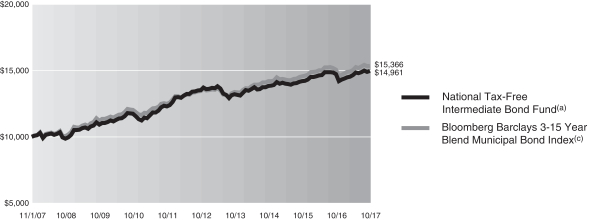
| | | | | | | | | | |
| | Average Annual Total Return through October 31, 2017 | | One Year | | Three Years | | Five Years | | Ten Years |
| | | National Tax-Free Intermediate Bond Fund(a) | | 1.62% | | 2.67% | | 2.05% | | 4.11% |
| | | | | | |
| | Expense Ratios(d) | | | | |
| | | | | Net Expense Ratio (Current) | | Gross Expense Ratio (Before Reimbursements) |
| | | National Tax-Free Intermediate Bond Fund | | 0.63% | | 0.63% |
| (a) | | Returns reflect any fee waivers or expense reductions. Returns do not reflect the deduction of taxes that a shareholder would pay on capital gains or other taxable distributions or the redemption of Fund shares. |
| (b) | | The Standardized Average Annual Total Returns are average annual total returns as of the most recent calendar quarter-end. They assume reinvestment of all distributions at NAV. Current performance may be lower or higher than the total return figures in the above charts. |
Returns reflect any fee waivers and expense reductions. Absent these waivers and reductions, returns would have been lower. Returns do not reflect the deduction of taxes that a shareholder would pay on capital gains or other taxable distributions or the redemption of Fund shares.
| (c) | | The Bloomberg Barclays 3-15 Year Blend Municipal Bond Index is an unmanaged index comprised of investment-grade municipal securities ranging from 2 to 17 years in maturity. The Index figures do not reflect any deduction for fees, taxes or expenses. |
| (d) | | The Fund’s expense ratios, both net (net of applicable fee waivers and/or expense reimbursements) and gross (before applicable fee waivers and/or expense reimbursements), set forth above are as of the most recent publicly available prospectus (March 1, 2017) for the Fund and may differ from the expense ratios disclosed in the Financial Highlights in this report. The Adviser has contractually agreed to reduce or limit the Total Annual Fund Operating Expenses, excluding interest, taxes, acquired fund fees and expenses and extraordinary expenses. This agreement will remain in place through March 1, 2018. After this date, the Adviser or the Fund may terminate the contractual arrangement. If this occurs, the expense ratios may change without shareholder approval. |
35
COMMERCE NATIONAL TAX-FREE INTERMEDIATE BOND FUND
Schedule of Investments
October 31, 2017
| | | | | | | | | | |
Principal
Amount | | Interest
Rate | | | Maturity
Date | | Value | |
| Municipal Bond Obligations – 94.7% | |
Alaska – 1.6% | |
| Alaska State Housing Finance Corp. Revenue Bonds (Refunding) Series A (AA+/NR)(a) | |
| $ 1,000,000 | | | 5.000 | % | | 12/01/29 | | $ | 1,207,070 | |
| Alaska State Municipal Bond Bank Authority Revenue Bonds Master Resolution) Series A (AA-/NR) | |
| 1,000,000 | | | 4.000 | | | 10/01/24 | | | 1,119,620 | |
| 1,000,000 | | | 5.000 | | | 10/01/25 | | | 1,198,320 | |
| 1,000,000 | | | 5.000 | (a) | | 10/01/28 | | | 1,199,820 | |
| Alaska State Municipal Bond Bank Authority Revenue Bonds Series B (AMT) (AA-/NR)(a) | |
| 450,000 | | | 5.000 | | | 03/01/27 | | | 525,240 | |
| | | | | | | | | | |
| | | 5,250,070 | |
| |
Arizona – 3.0% | |
| Arizona Health Facilities Authority Healthcare & Education Facilities Revenue Bonds (Kirksville College) (A-/NR)(a) | |
| 700,000 | | | 4.700 | | | 01/01/21 | | | 743,953 | |
| 750,000 | | | 4.750 | | | 01/01/22 | | | 795,255 | |
| 1,000,000 | | | 5.000 | | | 01/01/25 | | | 1,067,150 | |
| Goodyear Community Facilities Utilities District No 1 GO Bonds (Refunding) Series 2016 (A-/A1)(a) | |
| 880,000 | | | 4.000 | | | 07/15/32 | | | 946,933 | |
| McAllister Academic Village LLC AZ Revenue Bonds (Arizona State University) (Refunding) Series 2016 (AA-/A1)(a) | |
| 1,000,000 | | | 5.000 | | | 07/01/27 | | | 1,210,970 | |
| Pima County AZ Regional Transportation Excise Tax Revenue Bonds (Pima County Regional Transportation Fund) (AA+/NR) | |
| 1,000,000 | | | 5.000 | | | 06/01/22 | | | 1,156,770 | |
| 1,000,000 | | | 5.000 | | | 06/01/23 | | | 1,179,640 | |
| Pinal County AZ Unified School District No.1 Florence GO Bonds (School Improvement Project of 2006) Series C (A/NR) | |
| 335,000 | | | 5.000 | | | 07/01/18 | | | 343,499 | |
| 350,000 | | | 5.000 | (a) | | 07/01/19 | | | 358,550 | |
| 1,100,000 | | | 5.125 | (a) | | 07/01/22 | | | 1,129,634 | |
| Yuma AZ Municipal Property Corp. Excise Tax Revenue Bonds (Refunding-Senior Lien) Series 2015 (AA-/A1)(a) | |
| 1,050,000 | | | 4.000 | | | 07/01/26 | | | 1,174,740 | |
| | | | | | | | | | |
| | | 10,107,094 | |
| |
California – 3.3% | |
| Bay Area CA Toll Authority Toll Bridge Revenue Bonds (San Francisco) Series S-7 (AA-/A1)(a) | |
| 1,000,000 | | | 4.000 | | | 04/01/29 | | | 1,129,590 | |
| 1,000,000 | | | 4.000 | | | 04/01/32 | | | 1,103,040 | |
| Bay Area CA Toll Authority Toll Bridge Revenue Bonds (Variable) (San Francisco) Series A-1 (AA/Aa3)(a)(b)(c) | |
| 3,000,000 | | | 1.620 | | | 04/01/47 | | | 3,017,910 | |
| Bay Area CA Toll Authority Toll Bridge Revenue Bonds (Variable) (San Francisco) Series E-3 (AA/Aa3)(a)(b)(c) | |
| 1,000,000 | | | 1.620 | | | 04/01/47 | | | 1,005,970 | |
| Bonita Unified School District Taxable GO Bonds Election of 2008 Series B-1 (AA-/NR) | |
| 1,000,000 | | | 5.560 | | | 08/01/25 | | | 1,164,930 | |
| |
| | | | | | | | | | |
Principal
Amount | | Interest
Rate | | | Maturity
Date | | Value | |
| Municipal Bond Obligations – (continued) | |
California – (continued) | |
| California State Municipal Finance Authority Revenue Bonds (Refunding-Biola University) Series 2017 (NR/Baa1)(a) | |
| $ 1,090,000 | | | 5.000 | % | | 10/01/31 | | $ | 1,309,908 | |
| Fresno CA Unified School District GO Bonds Election of 2001 Series G (NR/Aa3)(a)(d) | |
| 1,000,000 | | | 0.000 | | | 08/01/24 | | | 792,790 | |
| Los Angeles CA Unified School District GO Bonds (Refunding) Series B (NR/Aa2)(a) | |
| 1,500,000 | | | 2.000 | | | 07/01/29 | | | 1,372,890 | |
| University of California CA Revenue Bonds (Unrefunded-General) Series Q (AA/NR)(a) | |
| 235,000 | | | 5.250 | | | 05/15/22 | | | 238,217 | |
| | | | | | | | | | |
| | | 11,135,245 | |
| |
Colorado – 1.6% | |
| Adams County CO Certificates of Participation (Refunding) (Improvement) Series 2015 (AA/Aa2)(a) | |
| 2,900,000 | | | 4.000 | | | 12/01/28 | | | 3,211,982 | |
| Colorado Educational & Cultural Facilities Authority Revenue Bonds (Charter School-High Point Academy) (A/NR) | |
| 625,000 | | | 4.500 | | | 03/01/20 | | | 663,925 | |
| Colorado Educational & Cultural Facilities Authority Revenue Bonds (Johnson & Wales University Project) Series B (A-/A3) | |
| 1,255,000 | | | 5.000 | | | 04/01/22 | | | 1,430,374 | |
| | | | | | | | | | |
| | | 5,306,281 | |
| |
Connecticut(a) – 0.7% | |
| Connecticut State Higher Education Supplement Loan Authority Revenue Bonds (Chesla Loan Program) Series A (AMT) (NR/A1) | |
| 935,000 | | | 3.250 | | | 11/15/24 | | | 959,404 | |
| 1,400,000 | | | 3.750 | | | 11/15/27 | | | 1,430,142 | |
| | | | | | | | | | |
| | | 2,389,546 | |
| |
District Of Columbia(a) – 1.6% | |
| District of Columbia Revenue Bonds (Deed Tax) Series B (NR/A1) | |
| 1,165,000 | | | 5.000 | | | 06/01/25 | | | 1,255,509 | |
| Washington Metropolitan Area Transit Authority Gross Revenue Bonds (Transit) Series A (AA-/A2)(e) | |
| 3,890,000 | | | 5.250 | | | 07/01/19 | | | 4,153,392 | |
| | | | | | | | | | |
| | | 5,408,901 | |
| |
Florida – 3.0% | |
| Halifax FL Hospital Medical Center Revenue Bonds (Refunding) Series 2016 (A-/NR)(a) | |
| 1,450,000 | | | 5.000 | | | 06/01/36 | | | 1,614,517 | |
| Jupiter County FL (Community Center Project) GO Bonds Series 2001 (AAA/Aaa) | |
| 50,000 | | | 5.500 | | | 07/01/21 | | | 55,412 | |
| Lake County FL School Board Certificates of Participation (Refunding-Master Lease Program) Series A (A/NR)(a) | |
| 725,000 | | | 5.000 | | | 06/01/24 | | | 833,924 | |
| |
| | |
| 36 | | The accompanying notes are an integral part of these financial statements. |
COMMERCE NATIONAL TAX-FREE INTERMEDIATE BOND FUND
| | | | | | | | | | |
Principal
Amount | | Interest
Rate | | | Maturity
Date | | Value | |
| Municipal Bond Obligations – (continued) | |
Florida – (continued) | |
| Miami-Dade County FL Aviation Revenue Bonds (Miami International Airport) Series A (A/A2)(a) | |
| $ 1,000,000 | | | 5.000 | % | | 10/01/22 | | $ | 1,103,940 | |
| Miami-Dade County FL Aviation Revenue Bonds (Prerefunded-Miami International Airport) Series A-1 (NR/NR)(a)(e) | |
| 240,000 | | | 5.500 | | | 10/01/20 | | | 269,242 | |
| Miami-Dade County FL Aviation Revenue Bonds (Unrefunded-Miami International Airport) Series A-1 (A/A2)(a) | |
| 760,000 | | | 5.500 | | | 10/01/25 | | | 850,972 | |
| Miami-Dade County FL Educational Facilities Authority Revenue Bonds (Refunding-University of Miami) Series B (AMBAC) (A-/A3)(a) | |
| 685,000 | | | 5.250 | | | 04/01/21 | | | 766,522 | |
| Seminole County FL School Board Certificates of Participation Series B (AA-/Aa3)(a) | |
| 500,000 | | | 5.000 | | | 07/01/24 | | | 571,740 | |
| Tallahassee FL Health Facilities Revenue Bonds (Tallahassee Memorial Healthcare, Inc. Project) Series A (NR/Baa1) | |
| 350,000 | | | 5.000 | | | 12/01/17 | | | 351,015 | |
| 400,000 | | | 5.000 | | | 12/01/18 | | | 414,156 | |
| 260,000 | | | 5.000 | | | 12/01/19 | | | 277,131 | |
| 330,000 | | | 5.000 | | | 12/01/20 | | | 361,086 | |
| Tampa FL Health System Revenue Bonds Series A (AA-/Aa3)(a) | |
| 1,300,000 | | | 5.250 | | | 11/15/25 | | | 1,417,325 | |
| Walton County FL School Board Certificates of Participation Series 2015 (AGM) (AA/A1)(a) | |
| 1,000,000 | | | 5.000 | | | 07/01/25 | | | 1,187,530 | |
| | | | | | | | | | |
| | | 10,074,512 | |
| |
Georgia – 0.4% | |
| Brunswick GA Water & Sewer Revenue Bonds (Refunding & Improvement) Series 1992 (ETM) (NPFG) (A/A3) | |
| 40,000 | | | 6.100 | | | 10/01/19 | | | 42,374 | |
| Cherokee County GA Water & Sewer Authority Revenue Bonds (Refunding & Improvement) Series 1993 (NPFG) (A/Aa2) | |
| 55,000 | | | 5.500 | | | 08/01/23 | | | 62,354 | |
| Fulton County GA Development Authority Revenue Bonds (Refunding-Robert W Woodruff Arts Center, Inc.) Series A (NR/A2) | |
| 1,000,000 | | | 5.000 | | | 03/15/26 | | | 1,186,880 | |
| | | | | | | | | | |
| | | 1,291,608 | |
| |
Illinois – 10.0% | |
| Arlington Heights IL GO Bonds Series 2016 (NR/Aa1)(a) | |
| 2,115,000 | | | 4.000 | | | 12/01/36 | | | 2,219,206 | |
| Cook County IL Community High School District No. 234 Taxable GO Bonds (Ridgewood Build America Bonds — Direct Payment to Issuer) Series B (Assured Guaranty) (AA/A3)(a) | |
| 300,000 | | | 6.400 | | | 12/01/28 | | | 322,590 | |
| |
| | | | | | | | | | |
Principal
Amount | | Interest
Rate | | | Maturity
Date | | Value | |
| Municipal Bond Obligations – (continued) | |
Illinois – (continued) | |
| Cook County IL Township High School District No. 208 Riverside-Brookfield GO Bonds (Refunding) Series B (AA+/NR) | |
| $ 1,090,000 | | | 5.000 | % | | 12/15/25 | | $ | 1,308,599 | |
| Countryside IL GO Bonds (Taxable-Refunding) Series 2014 (NR/Aa2) | |
| 500,000 | | | 3.300 | | | 01/01/24 | | | 506,265 | |
| DeKalb, Kane & Lasalle Counties Community College District No. 523 GO Bonds Series A (AA-/NR)(a) | |
| 400,000 | | | 5.000 | | | 02/01/23 | | | 435,296 | |
| Du Page & Cook County Community School District No. 181 GO Bonds (School Building) Series 2017 (AAA/Aaa)(a) | |
| 2,220,000 | | | 4.000 | | | 01/15/30 | | | 2,444,198 | |
| Du Page & Will County Community School District No. 204 Indian Prairie (Refunding) Series 2016 (NR/Aa1) | |
| 5,000,000 | | | 2.000 | | | 12/30/22 | | | 5,056,450 | |
| Elk Grove Village GO Bonds Series 2017 (AA+/NR) | |
| 530,000 | | | 3.000 | | | 01/01/24 | | | 563,750 | |
| 550,000 | | | 3.000 | | | 01/01/25 | | | 585,392 | |
| 1,140,000 | | | 5.000 | | | 01/01/26 | | | 1,378,249 | |
| 525,000 | | | 5.000 | (a) | | 01/01/28 | | | 636,190 | |
| Hoffman Estates IL GO Bonds (Taxable-Refunding) Series A (AA+/Aa2)(a) | |
| 1,200,000 | | | 4.200 | | | 12/01/25 | | | 1,274,436 | |
| Illinois Finance Authority Revenue Bonds (Columbia College) (NPFG) (A/A3)(a)(e) | |
| 2,000,000 | | | 5.250 | | | 12/01/17 | | | 2,006,980 | |
| Illinois Finance Authority Revenue Bonds (OSF Healthcare System) Series 2016 (A/A2)(a) | |
| 2,000,000 | | | 3.250 | | | 05/15/39 | | | 1,800,800 | |
| Illinois Finance Authority Revenue Bonds (Poetry Foundation Project) (AA-/Aa3)(a) | |
| 470,000 | | | 4.850 | | | 01/01/26 | | | 500,381 | |
| Illinois Finance Authority Revenue Bonds (Refunding-Columbia College) (ETM) Series 2011 (BBB+/NR) | |
| 300,000 | | | 5.000 | | | 12/01/17 | | | 300,972 | |
| 405,000 | | | 4.000 | | | 12/01/18 | | | 417,535 | |
| 440,000 | | | 4.500 | | | 12/01/20 | | | 482,517 | |
| Illinois Finance Authority Revenue Bonds (Refunding-OSF Healthcare System) Series A (A/A2)(a) | |
| 1,000,000 | | | 4.000 | | | 11/15/33 | | | 1,036,170 | |
| Illinois Finance Authority Revenue Bonds (Refunding-Swedish Covenant) Series A (BBB/NR)(a)(e) | |
| 1,210,000 | | | 5.500 | | | 02/15/20 | | | 1,326,668 | |
| Lake County IL Community Consolidated School District No. 46 Grayslake GO Bonds (Refunding) Series 2015 (AA+/NR) | |
| 1,000,000 | | | 5.000 | | | 11/01/23 | | | 1,169,370 | |
| Northern Illinois Municipal Power Agency Revenue Bonds (Prairie State Project) Series A (NPFG) (NR/A2)(a)(e) | |
| 1,000,000 | | | 5.000 | | | 01/01/18 | | | 1,006,550 | |
| |
| | |
| The accompanying notes are an integral part of these financial statements. | | 37 |
COMMERCE NATIONAL TAX-FREE INTERMEDIATE BOND FUND
Schedule of Investments (continued)
October 31, 2017
| | | | | | | | | | |
Principal
Amount | | Interest
Rate | | | Maturity
Date | | Value | |
| Municipal Bond Obligations – (continued) | |
Illinois – (continued) | |
| Peoria County IL Community Unit School District No. 309 GO Bonds (Capital Appreciation-Brimfield School District) Series A (Assured Guaranty) (AA/NR)(d) | |
| $ 540,000 | | | 0.000 | % | | 04/01/18 | | $ | 535,567 | |
| Peoria IL GO Bonds (Refunding) Series B (AA-/A1) | |
| 1,205,000 | | | 5.000 | | | 01/01/24 | | | 1,391,691 | |
| Peoria IL Metropolitan Airport Authority Revenue Bonds (Alternative Revenue Source) Series 2008 (NR/Aa2)(a) | |
| 1,000,000 | | | 5.000 | | | 12/01/26 | | | 1,040,330 | |
| Quad Cities IN Regional Economic Development Authority Revenue Bonds (Augustana College) Series 2012 (Refunding) (NR/Baa1)(a) | |
| 750,000 | | | 4.750 | | | 10/01/32 | | | 796,275 | |
| Winnebago County IL GO Bonds (Refunding) Series C (NR/Aa2) | |
| 765,000 | | | 5.000 | | | 12/30/25 | | | 918,497 | |
| 905,000 | | | 5.000 | | | 12/30/28 | | | 1,086,027 | |
| 960,000 | | | 5.000 | | | 12/30/29 | | | 1,159,843 | |
| | | | | | | | | | |
| | | 33,706,794 | |
| |
Indiana – 5.8% | |
| Anderson IN School Building Corp. Revenue Bonds (Refunding) Series 2015 (AA+/NR)(a) | |
| 1,565,000 | | | 4.000 | | | 07/15/26 | | | 1,709,888 | |
| Decatur Township IN Multi-School Building Corp. Revenue Bonds (Refunding-First Mortgage) (Multi Purpose) Series 2015 (AA+/NR) | |
| 2,315,000 | | | 5.000 | | | 07/15/23 | | | 2,721,607 | |
| Eastern Pulaski IN Multi-School Building Corp. Revenue Bonds (First Mortgage) Series 2015 (AA+/NR)(a) | |
| 840,000 | | | 4.000 | | | 07/15/28 | | | 904,705 | |
| 910,000 | | | 4.000 | | | 07/15/30 | | | 970,124 | |
| Evansville IN Redevelopment Authority Revenue Bonds (Build America Bonds-Taxable) Series B (A/A2)(a) | |
| 675,000 | | | 6.050 | | | 02/01/23 | | | 747,097 | |
| Indiana Finance Authority Revenue Bonds (Educational Facilities-Butler University Project) Series A (A-/NR)(a) | |
| 540,000 | | | 5.000 | | | 02/01/25 | | | 624,375 | |
| 425,000 | | | 5.000 | | | 02/01/27 | | | 490,067 | |
| 700,000 | | | 5.000 | | | 02/01/28 | | | 806,295 | |
| 600,000 | | | 5.000 | | | 02/01/29 | | | 689,232 | |
| Indiana State Finance Authority Revenue Bond (Refunding-Educational Facilities-Indianapolis Museum of Art) Series B (NR/A2)(a) | |
| 815,000 | | | 5.000 | | | 02/01/28 | | | 907,796 | |
| Indiana State University Revenue Bonds (Build America Bonds) (NR/A1)(a) | |
| 530,000 | | | 5.310 | | | 04/01/25 | | | 550,108 | |
| Lake Central Multi-District School Building Corp. Revenue Bonds (Refunding-First Mortgage) Series B (AA+/NR) | |
| 1,000,000 | | | 5.000 | | | 07/15/24 | | | 1,183,490 | |
| |
| | | | | | | | | | |
Principal
Amount | | Interest
Rate | | | Maturity
Date | | Value | |
| Municipal Bond Obligations – (continued) | |
Indiana – (continued) | |
| Plainfield IN High School Building Corp. Revenue Bonds (Refunding-First Mortgage) Series 2014 (AA+/NR)(a) | |
| $ 2,245,000 | | | 4.000 | % | | 01/15/26 | | $ | 2,522,302 | |
| 2,235,000 | | | 4.000 | | | 01/15/27 | | | 2,488,807 | |
| Southmont IN School Building Corp. Revenue Bonds (First Mortgage) Series 2017 (A/NR)(a) | |
| 1,320,000 | | | 5.000 | | | 07/15/32 | | | 1,544,756 | |
| Upland IN Economic Development Revenue Bonds (Taylor University Project) (Refunding) Series 2012 (NR/Baa1)(a) | |
| 900,000 | | | 4.500 | | | 09/01/32 | | | 936,225 | |
| | | | | | | | | | |
| | | 19,796,874 | |
| |
Kansas – 1.2% | |
| Kansas State Development Finance Authority Health Facilities Revenue Bonds (Stormont-Vail Healthcare) Series F (NR/A2)(a) | |
| 2,000,000 | | | 5.000 | | | 11/15/23 | | | 2,147,640 | |
| Kansas State Development Finance Authority Revenue Bonds (Kansas State Projects) Series H-1 (A+/Aa3) | |
| 1,580,000 | | | 5.000 | | | 11/01/24 | | | 1,875,602 | |
| | | | | | | | | | |
| | | 4,023,242 | |
| |
Kentucky – 5.1% | |
| Barren County KY School District Finance Corp. Revenue Bonds (Refunding) Series 2015 (NR/A1)(a) | |
| 1,000,000 | | | 5.000 | | | 08/01/26 | | | 1,184,390 | |
| Fayette County KY School District Finance Corp. Revenue Bonds (Refunding) Series B (A+/A1) | |
| 2,000,000 | | | 4.000 | | | 05/01/25 | | | 2,246,100 | |
| 2,000,000 | | | 4.000 | (a) | | 05/01/26 | | | 2,240,220 | |
| Kentucky State Higher Education Student Loan Corp. (Senior Lien) Series A (AMT) (A/NR)(a) | |
| 615,000 | | | 3.750 | | | 06/01/26 | | | 629,446 | |
| Kentucky State Property & Building Commission Revenue Bond (Project No 117) Series B (NR/A1)(a) | |
| 750,000 | | | 5.000 | | | 05/01/28 | | | 890,205 | |
| 915,000 | | | 5.000 | | | 05/01/29 | | | 1,079,343 | |
| Kentucky State Property & Building Commission Revenue Bond (Project No 117) Series D (NR/A1) | |
| 750,000 | | | 5.000 | | | 05/01/27 | | | 897,825 | |
| Louisville & Jefferson County KY Metropolitan Government Health System Revenue Bonds (Norton Healthcare Obligated Group) Series A (A-/NR)(a) | |
| 2,710,000 | | | 5.000 | | | 10/01/27 | | | 3,104,359 | |
| Oldham County KY School District Finance Corp. (Refunding) Series 2016 (NR/A1) | |
| 545,000 | | | 5.000 | | | 06/01/20 | | | 593,827 | |
| 595,000 | | | 5.000 | | | 06/01/21 | | | 666,002 | |
| 590,000 | | | 5.000 | | | 06/01/22 | | | 674,323 | |
| 610,000 | | | 5.000 | | | 06/01/23 | | | 710,723 | |
| 690,000 | | | 5.000 | | | 06/01/24 | | | 815,628 | |
| Owensboro KY GO Bonds Series A (NR/A2)(a) | |
| 1,200,000 | | | 5.000 | | | 05/01/25 | | | 1,387,884 | |
| | | | | | | | | | |
| 17,120,275 | |
| |
| | |
| 38 | | The accompanying notes are an integral part of these financial statements. |
COMMERCE NATIONAL TAX-FREE INTERMEDIATE BOND FUND
| | | | | | | | | | |
Principal
Amount | | Interest
Rate | | | Maturity
Date | | Value | |
| Municipal Bond Obligations – (continued) | |
Louisiana – 4.9% | |
| Iberia Parish LA Parish wide School District GO Bonds Series 2017 (AA-/NR) | |
| $ 510,000 | | | 3.000 | % | | 03/01/24 | | $ | 541,426 | |
| 530,000 | | | 4.000 | | | 03/01/25 | | | 596,542 | |
| 550,000 | | | 4.000 | | | 03/01/26 | | | 620,944 | |
| 570,000 | | | 4.000 | | | 03/01/27 | | | 644,801 | |
| 450,000 | | | 4.000 | (a) | | 03/01/28 | | | 501,098 | |
| Louisiana Local Government Environmental Facilities Community Development Authority Revenue Bonds (Woman’s Hospital Foundation) Series A (A/A2)(a)(e) | |
| 5,000,000 | | | 5.500 | | | 10/01/20 | | | 5,601,550 | |
| Louisiana Public Facilities Authority Revenue Bonds (Loyola University) Series 2011 (BBB+/Aaa)(a)(e) | |
| 3,715,000 | | | 5.250 | | | 10/01/21 | | | 4,274,702 | |
| Louisiana Public Facilities Authority Revenue Bonds (Refunding-Ochsner Clinic Foundation Project) Series 2015 (NR/A3)(a) | |
| 800,000 | | | 5.000 | | | 05/15/30 | | | 924,400 | |
| Louisiana State GO Bonds Series A (AA-/Aa3)(a) | |
| 1,655,000 | | | 4.000 | | | 04/01/35 | | | 1,739,835 | |
| St. Tammany LA Parish Wide School District No 12 GO Bonds (Refunding) Series 2017 (AA/NR)(a) | |
| 980,000 | | | 4.000 | | | 03/01/28 | | | 1,095,581 | |
| | | | | | | | | | |
| | | 16,540,879 | |
| |
Maine – 0.9% | |
| Maine State Health & Higher Educational Facilities Authority Revenue Bonds Series A (NR/A1)(a) | |
| 1,000,000 | | | 5.000 | | | 07/01/24 | | | 1,116,770 | |
| Portland ME Airport Revenue Bonds (Refunding-General) Series 2016 (BBB+/Baa1) | |
| 500,000 | | | 5.000 | | | 01/01/22 | | | 562,295 | |
| 145,000 | | | 5.000 | | | 01/01/23 | | | 165,587 | |
| 470,000 | | | 5.000 | | | 01/01/24 | | | 544,283 | |
| 215,000 | | | 5.000 | (a) | | 01/01/34 | | | 238,364 | |
| 330,000 | | | 5.000 | (a) | | 01/01/35 | | | 364,997 | |
| | | | | | | | | | |
| | | 2,992,296 | |
| |
Massachusetts – 1.5% | |
| Massachusetts Educational Financing Authority Education Loan Revenue Bonds (Issue I) Series A (AA/NR)(a) | |
| 745,000 | | | 5.100 | | | 01/01/25 | | | 763,997 | |
| Massachusetts Educational Financing Authority Revenue Bonds Series J (AMT) (AA/NR)(a) | |
| 690,000 | | | 4.250 | | | 07/01/22 | | | 710,355 | |
| Massachusetts State Housing Finance Agency Revenue Bonds Series B (AMT) (AA/Aa2) | |
| 400,000 | | | 2.500 | | | 12/01/20 | | | 409,260 | |
| 395,000 | | | 2.700 | | | 06/01/21 | | | 405,697 | |
| 400,000 | | | 3.050 | | | 06/01/22 | | | 416,396 | |
| 400,000 | | | 3.250 | | | 06/01/23 | | | 419,916 | |
| Massachusetts State Housing Finance Agency Revenue Bonds Series D (AA/Aa2)(a) | |
| 1,910,000 | | | 2.900 | | | 12/01/31 | | | 1,872,411 | |
| |
| | | | | | | | | | |
Principal
Amount | | Interest
Rate | | | Maturity
Date | | Value | |
| Municipal Bond Obligations – (continued) | |
Massachusetts – (continued) | |
| Massachusetts State Water Resources Authority Revenue Bonds Series A (ETM) (GO of Authority) (AA+/Aa1) | |
| $ 10,000 | | | 6.500 | % | | 07/15/19 | | $ | 10,475 | |
| | | | | | | | | | |
| | | 5,008,507 | |
| |
Michigan – 9.3% | |
| Comstock Park MI Public Schools GO Bonds (Refunding) Series 2015 (Q-SBLF) (AA-/NR) | |
| 730,000 | | | 5.000 | | | 05/01/24 | | | 868,196 | |
| East Lansing MI School District GO Bonds (Refunding) Series 2015 (Q-SBLF) (AA-/NR) | |
| 1,175,000 | | | 5.000 | | | 05/01/24 | | | 1,403,784 | |
| Grand Valley MI State University Revenue Bonds (Refunding) Series A (A+/A1)(a) | |
| 1,500,000 | | | 4.000 | | | 12/01/29 | | | 1,634,040 | |
| 1,375,000 | | | 4.000 | | | 12/01/30 | | | 1,489,139 | |
| Grand Valley MI State University Revenue Bonds Series 1998 (NPFG) (FGIC) (A+/A3) | |
| 205,000 | | | 5.500 | | | 02/01/18 | | | 205,693 | |
| Grand Valley MI State University Revenue Bonds Series A (A+/A1)(a) | |
| 1,595,000 | | | 5.000 | | | 12/01/28 | | | 1,880,840 | |
| Jenison MI Public Schools GO Bonds (Refunding) Series 2017 (NR/Aa3) | |
| 1,110,000 | | | 4.000 | | | 05/01/23 | | | 1,233,843 | |
| 1,195,000 | | | 4.000 | | | 05/01/25 | | | 1,344,208 | |
| Marshall MI Public Schools District GO Bonds (Refunding) Series 2015 (Q-SBLF) (AA-/NR)(a) | |
| 1,380,000 | | | 4.000 | | | 11/01/28 | | | 1,502,986 | |
| Mattawan MI Consolidated School District GO Bonds Series I (Q-SBLF) (AA-/NR)(a) | |
| 750,000 | | | 5.000 | | | 05/01/26 | | | 900,727 | |
| Michigan State Finance Authority Revenue Bonds (Refunding-Beaumont Health Credit Group) Series 2015 (A/A1) | |
| 1,500,000 | | | 5.000 | | | 08/01/24 | | | 1,781,625 | |
| 1,000,000 | | | 5.000 | (a) | | 08/01/25 | | | 1,177,620 | |
| Michigan State Housing Development Authority Rental Housing Revenue Bonds Series B (GO of Authority) (AA/NR) | |
| 690,000 | | | 4.500 | | | 10/01/19 | | | 727,557 | |
| Michigan State Housing Development Authority Revenue Bond Series B (AA+/Aa2)(a) | |
| 1,750,000 | | | 3.000 | | | 06/01/29 | | | 1,744,872 | |
| Michigan State Housing Development Authority Revenue Bonds (Non-AMT) (Non-ACE) Series B (AA+/Aa2)(a) | |
| 2,360,000 | | | 2.500 | | | 12/01/26 | | | 2,358,702 | |
| Michigan State Housing Development Authority Revenue Bonds (Taxable-Refunding) Series B (AA/NR) | |
| 500,000 | | | 2.816 | | | 04/01/25 | | | 490,360 | |
| 1,000,000 | | | 2.866 | | | 10/01/25 | | | 978,240 | |
| Michigan State Housing Development Authority Revenue Bonds Series A (AA/NR) | |
| 400,000 | | | 2.150 | | | 04/01/25 | | | 394,312 | |
| 470,000 | | | 2.550 | (a) | | 04/01/28 | | | 458,706 | |
| 410,000 | | | 2.600 | (a) | | 10/01/28 | | | 399,582 | |
| |
| | |
| The accompanying notes are an integral part of these financial statements. | | 39 |
COMMERCE NATIONAL TAX-FREE INTERMEDIATE BOND FUND
Schedule of Investments (continued)
October 31, 2017
| | | | | | | | | | |
Principal
Amount | | Interest
Rate | | | Maturity
Date | | Value | |
| Municipal Bond Obligations – (continued) | |
Michigan – (continued) | |
| Michigan State Housing Development Authority Single Family Home Ownership Revenue Bonds (Non AMT) Series A (GO of Authority) (AA+/NR)(a) | |
| $ 320,000 | | | 4.750 | % | | 12/01/25 | | $ | 338,941 | |
| Northwest Community Schools GO Bonds (School Building & Site) Series 2013 (AA-/NR)(a) | |
| 1,000,000 | | | 4.000 | | | 05/01/24 | | | 1,109,680 | |
| Saginaw Township MI Community School District (Refunding) Series 2015 (Q-SBLF) (NR/Aa1)(a) | |
| 750,000 | | | 4.000 | | | 05/01/28 | | | 828,795 | |
| South Redford MI School District GO Bonds (Refunding) Series 2014 (Q-SBLF) (AA-/NR)(a) | |
| 1,590,000 | | | 5.000 | | | 05/01/26 | | | 1,863,416 | |
| Warren Woods MI Public Schools GO Bonds (Refunding) Series 2015 (Q-SBLF) (AA-/NR) | |
| 1,480,000 | | | 5.000 | | | 05/01/24 | | | 1,760,179 | |
| Washtenaw MI Community College GO Bonds (Refunding) Series 2015 (NR/Aa1) | |
| 645,000 | | | 4.000 | | | 04/01/25 | | | 725,425 | |
| Wayne MI State University Revenue Bonds (Unrefunded-Refunding-General) Series A (A+/NR)(a) | |
| 1,670,000 | | | 5.000 | | | 11/15/24 | | | 1,793,747 | |
| | | | | | | | | | |
| | | 31,395,215 | |
| |
Minnesota – 0.5% | |
| Minnesota State Municipal Power Agency Electric Revenue Bonds(Refunding) Series 2014 (NR/A2) | |
| 500,000 | | | 4.000 | | | 10/01/21 | | | 547,340 | |
| St. Paul MN Housing & Redevelopment Authority Health Care Facilities Revenue Bonds (Refunding-Healthpartners Obligated Group) Series A (A/A2)(a) | |
| 1,000,000 | | | 5.000 | | | 07/01/28 | | | 1,176,300 | |
| | | | | | | | | | |
| | | 1,723,640 | |
| |
Mississippi – 0.9% | |
| Alcorn State University Educational Building Corp. (Refunding-Facilities) (Re-Financing Project) Series 2016 (NR/Aa2)(a) | |
| 1,560,000 | | | 4.000 | | | 09/01/33 | | | 1,677,671 | |
| Mississippi Home Corporation Homeownership Revenue Bonds Series A (GNMA/FNMA/FHLMC) (NR/Aaa) | |
| 20,000 | | | 2.700 | | | 06/01/18 | | | 20,179 | |
| Mississippi State Development Bank Special Obligation (Pearl Public School District) Series 2016 (NR/Aa3)(a) | |
| 600,000 | | | 4.000 | | | 04/01/34 | | | 637,422 | |
| 660,000 | | | 4.000 | | | 04/01/35 | | | 699,164 | |
| | | | | | | | | | |
| | | 3,034,436 | |
| |
Missouri – 1.6% | |
| Greene County MO GO Bonds Limited-Wilson Creek Marketplace NID Project (Refunding) Series A (NR/Aa2)(a)(e) | |
| 500,000 | | | 5.000 | | | 04/01/22 | | | 576,780 | |
| |
| | | | | | | | | | |
Principal
Amount | | Interest
Rate | | | Maturity
Date | | Value | |
| Municipal Bond Obligations – (continued) | |
Missouri – (continued) | |
| Joplin Industrial Development Authority Health Facilities Revenue Bonds (Freeman Health Systems ) Series 2011 (A-/NR) | |
| $ 1,490,000 | | | 4.250 | % | | 02/15/21 | | $ | 1,531,392 | |
| St. Louis Community College District Certificates of Participation Series 2017 (AA/NR)(a) | |
| 3,155,000 | | | 4.000 | | | 04/01/32 | | | 3,414,720 | |
| | | | | | | | | | |
| | | 5,522,892 | |
| |
Nebraska – 0.9% | |
| Douglas County NE Hospital Authority No. 2 Revenue Bonds (Health Facilities-Children’s Hospital Obligation Group) Series 2017 (NR/A1)(a) | |
| 1,000,000 | | | 5.000 | | | 11/15/34 | | | 1,163,200 | |
| Nebraska Public Power Generation Agency Revenue Bonds (Refunding) (Whelan Energy Center Unit 2) Series A (NR/A2) | |
| 1,750,000 | | | 5.000 | | | 01/01/23 | | | 2,023,052 | |
| Sarpy County NE Hospital Authority No.1 Revenue Bonds (Refunding-Nebraska Medicine) Series 2016 (AA-/NR)(a) | |
| 35,000 | | | 3.000 | | | 05/15/46 | | | 30,648 | |
| | | | | | | | | | |
| | | 3,216,900 | |
| |
Nevada(a) – 0.5% | |
| Las Vegas Valley NV Water District GO Bonds (Refunding) Series B (AA/Aa1) | |
| 800,000 | | | 5.000 | | | 06/01/22 | | | 818,616 | |
| Washoe County NV Highway Revenue Bonds (Fuel Tax) Series 2013 (A+/A1) | |
| 1,000,000 | | | 5.000 | | | 02/01/29 | | | 1,046,630 | |
| | | | | | | | | | |
| | | 1,865,246 | |
| |
New Jersey – 6.2% | |
| East Orange NJ GO Bonds (Refunding-Water Utilities) Series B (AGM) (AA/A2) | |
| 1,500,000 | | | 5.000 | | | 07/15/24 | | | 1,760,370 | |
| Middlesex County NJ Cops Certificates of Participation (Refunding) Series 2017 (AA+/NR) | |
| 500,000 | | | 4.000 | | | 06/15/27 | | | 567,885 | |
| 500,000 | | | 4.000 | (a) | | 06/15/28 | | | 561,945 | |
| 760,000 | | | 4.000 | (a) | | 06/15/29 | | | 846,602 | |
| Middlesex County NJ Cops Certificates of Participation (Refunding) Series 2017 (AA+/NR) | |
| 705,000 | | | 4.000 | | | 06/15/26 | | | 799,392 | |
| New Jersey Housing & Mortgage Finance Agency MF Conduit Revenue Bonds (Lexington Manor Apartments Project) Series B (NR/Aaa) | |
| 785,000 | | | 3.150 | | | 06/15/25 | | | 812,294 | |
| New Jersey State Certificates of Participation (Equipment Lease Purchase) Series A (BBB+/Baa1)(a)(e) | |
| 1,000,000 | | | 5.000 | | | 06/15/18 | | | 1,024,120 | |
| New Jersey State Economic Development Authority Revenue Bonds (School Facilities Construction) Series UU (BBB+/Baa1)(a) | |
| 1,750,000 | | | 5.000 | | | 06/15/28 | | | 1,917,913 | |
| |
| | |
| 40 | | The accompanying notes are an integral part of these financial statements. |
COMMERCE NATIONAL TAX-FREE INTERMEDIATE BOND FUND
| | | | | | | | | | |
Principal
Amount | | Interest
Rate | | | Maturity
Date | | Value | |
| Municipal Bond Obligations – (continued) | |
New Jersey – (continued) | |
| New Jersey State Higher Education Assistance Authority Student Loan Revenue Bonds (Refunding) Series 1A (AA/Aaa)(a) | |
| $ 1,140,000 | | | 4.750 | % | | 12/01/23 | | $ | 1,201,400 | |
| Passaic County NJ GO Bonds (Refunding-Taxable Pension) Series 2003 (AGM) (NR/Aa3) | |
| 100,000 | | | 5.750 | | | 02/15/21 | | | 107,965 | |
| Union City NJ GO Bonds (Refunding) Series 2017 (NR/Baa1) | |
| 1,575,000 | | | 5.000 | | | 11/01/20 | | | 1,721,412 | |
| 1,830,000 | | | 5.000 | | | 11/01/22 | | | 2,076,794 | |
| Ventnor City NJ GO Bonds (Refunding) Series 2017 (AA-/NR) | |
| 1,470,000 | | | 4.000 | | | 12/01/22 | | | 1,626,335 | |
| 1,530,000 | | | 4.000 | | | 12/01/23 | | | 1,710,861 | |
| 1,570,000 | | | 4.000 | | | 12/01/24 | | | 1,768,589 | |
| 690,000 | | | 4.000 | | | 12/01/26 | | | 780,190 | |
| 705,000 | | | 4.000 | | | 12/01/27 | | | 798,702 | |
| 730,000 | | | 4.000 | (a) | | 12/01/28 | | | 818,038 | |
| | | | | | | | | | |
| | | 20,900,807 | |
| |
New York – 0.6% | |
| Metropolitan Transportation Authority NY Revenue Bonds Series 2008 C (AA-/A1) | |
| 65,000 | | | 5.500 | | | 11/15/18 | | | 66,487 | |
| Monroe Country NY Development Corp. Revenue Bonds (Refunding John Fisher College) Series A (A-/NR)(a) | |
| 500,000 | | | 5.000 | | | 06/01/29 | | | 578,360 | |
| New York City Housing Development Corp. Revenue Bonds (Multi Family Development) Series G (AA+/Aa2)(a) | |
| 250,000 | | | 3.800 | | | 11/01/37 | | | 258,395 | |
| New York State Dormitory Authority Revenues Non Supported Debt Revenue Bonds (Refunding-Icahn School Medicine at Mount Sinai) Series A (A-/A3)(a) | |
| 1,000,000 | | | 5.000 | | | 07/01/27 | | | 1,177,920 | |
| | | | | | | | | | |
| | | 2,081,162 | |
| |
North Carolina – 0.9% | |
| North Carolina State Medical Care Commission Revenue Bonds (Refunding-NC Baptist Hospital) (A/A2)(a) | |
| 1,190,000 | | | 5.000 | | | 06/01/22 | | | 1,294,815 | |
| Western Carolina University Revenue Bonds (Refunding-Limited Obligation-Student Housing) (A/NR) | |
| 200,000 | | | 2.000 | | | 06/01/20 | | | 202,014 | |
| 420,000 | | | 3.000 | | | 06/01/21 | | | 436,065 | |
| 330,000 | | | 4.000 | | | 06/01/22 | | | 359,958 | |
| 350,000 | | | 4.000 | | | 06/01/23 | | | 385,616 | |
| 480,000 | | | 4.000 | (a) | | 06/01/25 | | | 519,883 | |
| | | | | | | | | | |
| | | 3,198,351 | |
| |
Ohio – 5.2% | |
| Akron OH Certificates of Participation (Refunding-Municipal Baseball Stadium Project) Series 2013 (A+/NR)(a) | |
| 660,000 | | | 3.000 | | | 12/01/19 | | | 665,775 | |
| Akron OH GO Bonds (Refunding) (AA-/NR)(a) | |
| 545,000 | | | 5.000 | | | 12/01/26 | | | 648,474 | |
| |
| | | | | | | | | | |
Principal
Amount | | Interest
Rate | | | Maturity
Date | | Value | |
| Municipal Bond Obligations – (continued) | |
Ohio – (continued) | |
| Hamilton County OH Sales Tax Revenue Bonds (Refunding) Series A (NR/A1)(a) | |
| $ 2,000,000 | | | 5.000 | % | | 12/01/24 | | $ | 2,257,420 | |
| Licking Heights OH Local School District GO Bonds (Refunding) Series C (NR/A1) | |
| 765,000 | | | 5.000 | | | 10/01/27 | | | 939,542 | |
| 1,115,000 | | | 5.000 | (a) | | 10/01/28 | | | 1,358,404 | |
| Mahoning County OH Career & Technical Center Board of Education Certificates of Participation (Refunding) Series 2017 (AA-/NR)(a) | |
| 630,000 | | | 4.000 | | | 12/01/26 | | | 696,131 | |
| 650,000 | | | 4.000 | | | 12/01/27 | | | 712,901 | |
| 665,000 | | | 4.000 | | | 12/01/28 | | | 725,741 | |
| 500,000 | | | 4.000 | | | 12/01/29 | | | 543,310 | |
| Middletown OH GO Bonds (Refunding-Various Purpose) Series 2017 (NR/A1) | |
| 1,095,000 | | | 4.000 | | | 12/01/25 | | | 1,241,905 | |
| 1,045,000 | | | 5.000 | | | 12/01/27 | | | 1,294,368 | |
| Ohio State Higher Educational Facility Commission Revenue Bonds (Xavier University-Refunding) Series C (BBB+/A3)(a) | |
| 1,000,000 | | | 5.000 | | | 05/01/27 | | | 1,160,310 | |
| 1,000,000 | | | 5.000 | | | 05/01/28 | | | 1,150,770 | |
| 750,000 | | | 5.000 | | | 05/01/29 | | | 857,618 | |
| Toledo OH Waterworks Revenue Bonds (Refunding-System) (AA-/Aa3)(a) | |
| 1,690,000 | | | 5.000 | | | 11/15/27 | | | 2,037,785 | |
| University of Toledo OH Revenue Bonds (Refunding-General Receipt) Series A (A/A1)(a) | |
| 700,000 | | | 4.000 | | | 06/01/35 | | | 731,164 | |
| 700,000 | | | 4.000 | | | 06/01/36 | | | 727,685 | |
| | | | | | | | | | |
| | | | | | | | | 17,749,303 | |
| |
Pennsylvania – 6.7% | |
| Butler County PA Hospital Authority Revenue Bonds (Refunding) Series 2015 (NR/Baa1) | |
| 500,000 | | | 5.000 | | | 07/01/25 | | | 583,260 | |
| 450,000 | | | 5.000 | (a) | | 07/01/26 | | | 519,183 | |
| 490,000 | | | 5.000 | (a) | | 07/01/27 | | | 562,662 | |
| Delaware County PA Authority University Revenue Bonds (Neumann University) (BBB/NR) | |
| 1,025,000 | | | 5.000 | | | 10/01/19 | | | 1,077,490 | |
| 1,250,000 | | | 5.250 | (a) | | 10/01/31 | | | 1,324,650 | |
| Pennsylvania State Higher Educational Facilities Authority Revenue Bonds (Drexel University College Medicine) Series 2007 (NPFG) (A/A3)(a)(e) | |
| 1,250,000 | | | 5.000 | | | 11/01/17 | | | 1,250,000 | |
| Pennsylvania State Housing Finance Agency Single Family Mortgage Revenue Bonds (Refunding) Series 121 (AA+/Aa2)(a) | |
| 1,000,000 | | | 3.100 | | | 10/01/36 | | | 974,760 | |
| Pennsylvania State Housing Finance Agency Single Family Mortgage Revenue Bonds Series 113 (AA+/Aa2) | |
| 795,000 | | | 4.000 | | | 10/01/18 | | | 816,393 | |
| |
| | |
| The accompanying notes are an integral part of these financial statements. | | 41 |
COMMERCE NATIONAL TAX-FREE INTERMEDIATE BOND FUND
Schedule of Investments (continued)
October 31, 2017
| | | | | | | | | | |
Principal
Amount | | Interest
Rate | | | Maturity
Date | | Value | |
| Municipal Bond Obligations – (continued) | |
Pennsylvania – (continued) | |
| Pennsylvania State Turnpike Commission Turnpike Revenue Bonds (Refunding-Subordinated) Series B (NR/A3)(a) | |
| $ 1,500,000 | | | 5.000 | % | | 06/01/29 | | $ | 1,747,635 | |
| Pennsylvania State Turnpike Commission Turnpike Revenue Bonds Series B (A/A1)(a) | |
| 2,315,000 | | | 5.000 | | | 12/01/25 | | | 2,488,741 | |
| Pennsylvania State Turnpike Commission Turnpike Revenue Bonds Series C (A/A1)(a) | |
| 500,000 | | | 5.000 | | | 12/01/26 | | | 593,845 | |
| Philadelphia PA Authority for Industrial Development City Agreement Revenue Bonds (Refunding-Central Library Project) Series B (A+/A2) | |
| 610,000 | | | 3.000 | | | 12/01/18 | | | 621,749 | |
| Philadelphia PA Authority for Industrial Development City Agreement Revenue Bonds (Refunding-Cultural & Commercial Corridors Programs) Series A (A+/A2) | |
| 2,000,000 | | | 4.000 | | | 12/01/18 | | | 2,059,920 | |
| Southcentral PA General Authority Revenue Bond (AICUP Financing Program-York College Of Pennsylvania Project) Series PP4 (A-/NR)(a) | |
| 915,000 | | | 5.000 | | | 11/01/31 | | | 1,062,388 | |
| State Public School Building Authority Revenue Bonds (Refunding-Montgomery County Community College) (NR/A1)(a) | |
| 1,065,000 | | | 5.000 | | | 05/01/29 | | | 1,254,762 | |
| Wayne County PA Hospital & Health Facilities Authority Revenue Bond (Memorial Hospital Project) Series A (AA-/NR) | |
| 550,000 | | | 4.000 | | | 07/01/25 | | | 619,173 | |
| 520,000 | | | 4.000 | | | 07/01/27 | | | 588,578 | |
| 400,000 | | | 5.000 | (a) | | 07/01/28 | | | 484,140 | |
| 500,000 | | | 4.000 | (a) | | 07/01/33 | | | 530,475 | |
| Wilkes-Barre PA Finance Authority Revenue Bonds (Refunding-University of Scranton) Series A (A-/NR) | |
| 1,000,000 | | | 5.000 | | | 11/01/24 | | | 1,170,770 | |
| 2,205,000 | | | 4.000 | (a) | | 11/01/29 | | | 2,339,792 | |
| | | | | | | | | | |
| | | | | | | | | 22,670,366 | |
| |
Rhode Island – 0.9% | |
| Rhode Island State Health & Educational Building Corp. Higher Education Facility Revenue Bonds (Bryant University Project) (A/A2) | |
| 950,000 | | | 5.000 | | | 06/01/21 | | | 1,062,309 | |
| Rhode Island State Health & Educational Building Corp. Public School Revenue Bonds Series G (AGM) (AA/A1)(a) | |
| 1,195,000 | | | 5.000 | | | 05/15/33 | | | 1,399,489 | |
| Rhode Island State Housing & Mortgage Finance Corp. Revenue Bonds (Home Funding) Series 4 (GNMA) (NR/Aa2)(a) | |
| 430,000 | | | 3.500 | | | 04/01/22 | | | 456,148 | |
| | | | | | | | | | |
| | | | | | | | | 2,917,946 | |
| |
South Carolina – 2.6% | |
| Laurens County SC School District No. 055 Installment Purchase Revenue Bonds (Refunding) Series 2015 (A-/A2) | |
| 1,000,000 | | | 5.000 | | | 12/01/24 | | | 1,169,070 | |
| |
| | | | | | | | | | |
Principal
Amount | | Interest
Rate | | | Maturity
Date | | Value | |
| Municipal Bond Obligations – (continued) | |
South Carolina – (continued) | |
| Newberry Investing in Children’s Education SC Installment Purpose Revenue Bonds (Refunding- Newberry Co. School District) Series 2014 (A/A1)(a) | |
| $ 2,925,000 | | | 5.000 | % | | 12/01/25 | | $ | 3,459,222 | |
| Scago Educational Facilities Corp. for Colleton School District Revenue Bonds (Refunding) (A-/A3)(a) | |
| 1,000,000 | | | 5.000 | | | 12/01/26 | | | 1,182,250 | |
| Scago Educational Facilities Corp. for Pickens School District Revenue Bonds (Refunding) Series 2015 (A/A1)(a) | |
| 2,550,000 | | | 5.000 | | | 12/01/27 | | | 2,978,119 | |
| | | | | | | | | | |
| | | | | | | | | 8,788,661 | |
| |
South Dakota – 2.4% | |
| South Dakota Housing Development Authority Revenue Bonds (Home Ownership Mortgage) Series D (AAA/Aaa) | |
| 980,000 | | | 2.700 | | | 05/01/25 | | | 1,006,137 | |
| South Dakota State Health & Educational Facilities Authority Revenue Bonds (Avera Health Issue) Series A (AA-/A1)(a) | |
| 1,000,000 | | | 5.000 | | | 07/01/25 | | | 1,107,910 | |
| South Dakota State Health & Educational Facilities Authority Revenue Bonds Series 2017 (NR/A1) | |
| 750,000 | | | 5.000 | | | 09/01/23 | | | 879,067 | |
| 825,000 | | | 5.000 | | | 09/01/24 | | | 979,836 | |
| 605,000 | | | 5.000 | | | 09/01/25 | | | 725,280 | |
| 1,120,000 | | | 5.000 | (a) | | 09/01/28 | | | 1,349,219 | |
| 1,700,000 | | | 5.000 | (a) | | 09/01/29 | | | 2,028,389 | |
| | | | | | | | | | |
| | | | | | | | | 8,075,838 | |
| |
Tennessee – 1.2% | |
| Knox County Health Educational & Housing Facility Board Revenue Bonds (Refunding) (University Health Systems, Inc.) Series 2017 (BBB+/NR) | |
| 2,785,000 | | | 3.375 | | | 04/01/26 | | | 2,889,410 | |
| Tennessee Housing Development Agency Revenue Bonds Homeownership Program Series 1C (Non-AMT) (GO of Agency) (AA+/Aa1)(a) | |
| 670,000 | | | 3.500 | | | 07/01/27 | | | 694,529 | |
| Tennessee Housing Development Agency Revenue Bonds Residential Financing Program Series 1C (Non-AMT-Non ACE-Issue) (AA+/Aa1)(a) | |
| 480,000 | | | 4.050 | | | 01/01/38 | | | 495,993 | |
| | | | | | | | | | |
| | | | | | | | | 4,079,932 | |
| |
Texas – 6.7% | |
| Arlington TX Higher Education Finance Corp. Revenue Bonds (Responsive Education Solutions) Series A (AAA/NR) | |
| 725,000 | | | 5.000 | | | 08/15/25 | | | 874,691 | |
| Arlington TX Higher Education Finance Corp. Revenue Bonds (Uplift Education) Series B (AAA/NR)(a) | |
| 540,000 | | | 4.000 | | | 12/01/30 | | | 588,422 | |
| 485,000 | | | 4.000 | | | 12/01/32 | | | 524,275 | |
| Celina TX GO Bonds (Certificates of Obligation) (Waterworks & Sewer System) Series 2015 (AA-/A1)(a) | |
| 930,000 | | | 5.000 | | | 09/01/27 | | | 1,114,122 | |
| 980,000 | | | 5.000 | | | 09/01/28 | | | 1,164,730 | |
| |
| | |
| 42 | | The accompanying notes are an integral part of these financial statements. |
COMMERCE NATIONAL TAX-FREE INTERMEDIATE BOND FUND
| | | | | | | | | | |
Principal
Amount | | Interest
Rate | | | Maturity
Date | | Value | |
| Municipal Bond Obligations – (continued) | |
Texas – (continued) | |
| Clifton TX Higher Education Finance Corp. Revenue Bond (Refunding-Idea Public Schools) Series 2017 (AAA/NR)(a) | |
| $ 2,500,000 | | | 4.000 | % | | 08/15/28 | | $ | 2,814,425 | |
| Forney TX Independent School District GO Bonds (Refunding) Series 2015 (PSF-GTD) (AAA/Aaa)(a) | |
| 2,630,000 | | | 4.000 | | | 08/15/24 | | | 2,689,280 | |
| Houston County TX GO Bonds (Certificates of Obligation) (A/NR)(a) | |
| 235,000 | | | 5.000 | | | 02/15/20 | | | 237,606 | |
| Katy TX Independent School District GO Bonds (Refunding) Series A (AAA/Aaa) | |
| 300,000 | | | 5.000 | | | 02/15/25 | | | 365,730 | |
| Kyle TX GO Bonds (Refunding) Series 2015 (AA-/NR)(a) | |
| 1,000,000 | | | 4.000 | | | 08/15/26 | | | 1,124,840 | |
| Lower Colorado River Authority Revenue Bonds (Prerefunded-Refunding) (NR/NR)(a)(e) | |
| 5,000 | | | 5.625 | | | 05/15/19 | | | 5,331 | |
| Mansfield TX Independent School District GO Bonds (Refunding) Series A (PSF-GTD) (NR/Aaa)(a) | |
| 2,460,000 | | | 4.000 | | | 02/15/29 | | | 2,725,065 | |
| Nolan County TX Hospital District GO Bonds Series 2014 (NR/A3)(a) | |
| 1,025,000 | | | 5.000 | | | 08/15/27 | | | 1,163,447 | |
| North Texas Tollway Authority Revenue Bonds (Prerefunded 2016-Refunding-System First Tier) Series A (Assured Guaranty) (AA/A1)(a)(e) | |
| 225,000 | | | 5.750 | | | 01/01/18 | | | 226,748 | |
| North Texas Tollway Authority Revenue Bonds (Unrefunded 2016-Refunding-System First Tier) Series A (Assured Guaranty) (AA/A1)(a) | |
| 80,000 | | | 5.750 | | | 01/01/40 | | | 80,622 | |
| North TX Tollway Authority Revenue Bonds (Prerefunded-Refunding System) (First Tier) Series A (Assured Guaranty) (AA/A1)(a)(e) | |
| 295,000 | | | 5.750 | | | 01/01/18 | | | 297,292 | |
| Odessa TX GO Bonds (Refunding) Series 2015 (AA/Aa3)(a) | |
| 1,000,000 | | | 5.000 | | | 03/01/27 | | | 1,172,330 | |
| Port Arthur TX Independent School District GO Bonds (Refunding) Series E (NR/Aa3)(a) | |
| 2,500,000 | | | 4.000 | | | 02/15/32 | | | 2,717,925 | |
| Weslaco TX GO Bonds (Refunding) Series 2016 (AA-/NR) | |
| 2,295,000 | | | 5.000 | | | 02/15/24 | | | 2,699,723 | |
| | | | | | | | | | |
| | | | | | | | | 22,586,604 | |
| |
Utah(a) – 0.2% | |
| Salt Lake City UT Airport Revenue Bonds Series B (A+/A2) | |
| 500,000 | | | 5.000 | | | 07/01/34 | | | 591,160 | |
| |
Vermont – 0.4% | |
| Vermont Economic Development Authority Revenue Bonds (Central Vermont Public Service Corp.-Recovery Zone Facility) (NR/WR) | |
| 1,000,000 | | | 5.000 | | | 12/15/20 | | | 1,093,440 | |
| |
| | | | | | | | | | | | |
Principal
Amount | | Interest
Rate | | | Maturity
Date | | | Value | |
| Municipal Bond Obligations – (continued) | |
Vermont – (continued) | |
| Vermont State Student Assistance Corp. Education Loan Revenue Bonds Series A (AMT) (AA/NR) | |
| $ 410,000 | | | 4.000 | % | | | 06/15/20 | | | $ | 429,852 | |
| | | | | | | | | | | | |
| | | | | | | | | | | 1,523,292 | |
| |
Washington – 1.7% | |
| COB Properties WA Lease Revenue Bonds (Bothell City Hall Project) Series 2014 (AA/NR)(a) | |
| 1,620,000 | | | 5.000 | | | | 12/01/26 | | | | 1,941,716 | |
| Grays Harbor County WA Public Utility District No. 1 Revenue Bonds (Refunding) Series A (A/A1)(a) | |
| 250,000 | | | 4.000 | | | | 01/01/40 | | | | 259,942 | |
| Washington Higher Education Facilities Authority Revenue Bonds Seattle University Project Series 2011 (Refunding) (A/NR) | |
| 560,000 | | | 5.000 | | | | 05/01/18 | | | | 570,461 | |
| Washington State Health Care Facilities Authority Revenue Bonds (Catholic Health Initiatives) Series D (BBB+/Baa1)(a) | |
| 500,000 | | | 6.000 | | | | 10/01/23 | | | | 520,755 | |
| Washington State Health Care Facilities Authority Revenue Bonds (Multicare Health System) Series A (AA-/Aa3)(a) | |
| 1,495,000 | | | 5.000 | | | | 08/15/27 | | | | 1,783,296 | |
| Washington State Housing Finance Commission Revenue Bonds (Refunding-Non-AMT-Single Family Program) Series 1N (NR/Aaa)(a) | |
| 775,000 | | | 3.450 | | | | 12/01/30 | | | | 787,129 | |
| | | | | | | | | | | | |
| | | | | | | | | | | 5,863,299 | |
| |
Wisconsin(a) – 0.6% | |
| Wisconsin State Health & Educational Facilities Authority Revenue Bonds (Children’s Hospital of Wisconsin) (AA/Aa3) | |
| 1,000,000 | | | 5.000 | | | | 08/15/21 | | | | 1,031,940 | |
| Wisconsin State Health & Educational Facilities Authority Revenue Bonds (Refunding-Ascension Health Credit Group) Series A (AA+/Aa2) | |
| 1,000,000 | | | 4.000 | | | | 11/15/34 | | | | 1,052,460 | |
| | | | | | | | | | | | |
| | | | | | | | | | | 2,084,400 | |
| |
Wyoming – 0.1% | |
| Lincoln County Building Corp. Lease Revenue Bonds Series 2012 (A+/NR) | |
| 305,000 | | | 3.000 | | | | 05/01/18 | | | | 307,669 | |
| |
| TOTAL MUNICIPAL BOND OBLIGATIONS | |
(Cost $312,049,205) | | | | | | | $ | 320,329,243 | |
| |
| | | | | | | | | | | | |
| | |
| The accompanying notes are an integral part of these financial statements. | | 43 |
COMMERCE NATIONAL TAX-FREE INTERMEDIATE BOND FUND
Schedule of Investments (continued)
October 31, 2017
| | | | | | | | | | | | |
Principal
Amount | | Interest
Rate | | | Maturity
Date | | | Value | |
| Short-term Investment(f) – 5.8% | |
Repurchase Agreement – 5.8% | |
| Fixed Income Clearing Corp. | |
| $19,718,000 | | | 0.120 | % | | | 11/01/17 | | | $ | 19,718,000 | |
Maturity Value: $19,718,131 | |
(Cost $19,718,000) | | | | | | | | | |
| |
| TOTAL INVESTMENTS – 100.5% | |
(Cost $331,767,205) | | | | | | | $ | 340,047,243 | |
| |
LIABILITIES IN EXCESS OF OTHER ASSETS – (0.5)% | | | | (1,630,766) | |
| |
NET ASSETS – 100.0% | | | $ | 338,416,477 | |
| |
| | |
| The percentage shown for each investment category reflects the value of investments in that category as a percentage of net assets. |
| |
| (a) | | Security with “Call” features with resetting interest rates. Maturity dates disclosed are the final maturity dates. |
| (b) | | Variable or floating rate security. Interest rate disclosed is that which is in effect at October 31, 2017. |
| (c) | | Rate shown is that which is in effect on October 31, 2017. Certain variable rate securities are not based on a published reference rate and spread but are determined by the issuer or agent and are based on current market conditions. |
| (d) | | Security issued with a zero coupon. The actual effective yield of this security is different than the stated coupon due to the accretion of discount. |
| (e) | | Prerefunded security. Maturity date disclosed is prerefunding date. |
| (f) | | Repurchase agreement was entered into on October 31, 2017. This agreement was fully collateralized by $21,470,000 U.S. Treasury Bond, 2.500%, due 05/15/46 with a market value of $20,113,354. |
| Security ratings disclosed, if any, are issued by Standard & Poor’s Ratings Services/Moody’s Investors Service and are unaudited. A description of the ratings is available in the Fund’s Statement of Additional Information. |
| | |
|
| Investment Abbreviations: |
| AGM | | —Insuredby Assured Guaranty Municipal Corp. |
| AMBAC | | —Insuredby American Municipal Bond Assurance Corp. |
| AMT | | —AlternativeMinimum Tax |
| ETM | | —Escrowto Maturity |
| FGIC | | —Insuredby Financial Guaranty Insurance Co. |
| FHLMC | | —FederalHome Loan Mortgage Corp. |
| FNMA | | —FederalNational Mortgage Association |
| GNMA | | —GovernmentNational Mortgage Association |
| GO | | —GeneralObligation |
| NR | | —NotRated |
| PSF-GTD | | —Guaranteedby Permanent School Fund |
| Q-SBLF | | —QualifiedSchool Bond Loan Fund |
| WR | | —WithdrawnRating |
|
PORTFOLIO COMPOSITION
| | | | | | | | |
| | | AS OF
10/31/2017 | | | AS OF
10/31/2016 | |
| |
General Obligation | | | 26.0 | % | | | 20.6 | % |
Lease | | | 14.0 | | | | 14.1 | |
Hospital | | | 13.1 | | | | 11.5 | |
Education | | | 11.8 | | | | 16.3 | |
Limited Tax | | | 7.1 | | | | 5.4 | |
Prerefunded/Escrow to Maturity | | | 6.9 | | | | 2.6 | |
Transportation | | | 5.9 | | | | 9.1 | |
Repurchase Agreement | | | 5.8 | | | | 0.8 | |
Single Family Housing | | | 3.2 | | | | 6.2 | |
Multi Family Housing | | | 2.4 | | | | 5.2 | |
Student | | | 1.5 | | | | 2.8 | |
Power | | | 1.2 | | | | 0.6 | |
Not For Profit | | | 0.8 | | | | 1.4 | |
Water/Sewer | | | 0.6 | | | | 1.8 | |
Crossover | | | 0.2 | | | | 0.2 | |
Investment Company | | | — | | | | 1.8 | |
| |
| TOTAL INVESTMENTS | | | 100.5 | % | | | 100.4 | % |
�� | |
The percentage shown for each investment category reflects the value of investments in that category as a percentage of net assets. Underlying investment categories of investment companies held by the Fund are not reflected in the table above. Consequently, the Fund’s overall investment category allocations may differ from the percentages contained in the table above.
The Fund is actively managed and, as such, its composition may differ over time.
| | |
| 44 | | The accompanying notes are an integral part of these financial statements. |
COMMERCE MISSOURI TAX-FREE INTERMEDIATE BOND FUND
Performance Summary
October 31, 2017 (Unaudited)
The following is performance information for the Commerce Missouri Tax-Free Intermediate Bond Fund (“Missouri Tax-Free Intermediate Bond Fund”) for various time periods. The returns represent past performance. Past performance is no guarantee of future results. The Fund’s investment return and principal value will fluctuate so that an investor’s shares, when redeemed, may be worth more or less than their original cost. Performance reflects expense limitations in effect. In their absence, performance would be reduced. Returns do not reflect the deduction of taxes that a shareholder would pay on Fund distributions or the redemption of Fund shares. The Fund is not subject to a sales charge, so a sales charge is not applied to its total returns. In addition to the Adviser’s decisions regarding issuer/industry investment selection and allocation, other factors may affect Fund performance. These factors include, but are not limited to, Fund operating fees and expenses, portfolio turnover, and subscription and redemption cash flows affecting the Fund. Please visit our website at www.commercefunds.com to obtain the most recent month-end returns.
| | | | | | | | |
| | Performance Review | | | | | | |
| | | November 1, 2016 - October 31, 2017 | | Fund Total Return(a) | | Index Total Return(c) | | Index |
| | | Missouri Tax-Free Intermediate Bond Fund | | 1.70% | | 2.05% | | Bloomberg Barclays 3-15 Year Blend Municipal Bond(c) |
Standardized Average Annual Total Return through September 30, 2017(b)
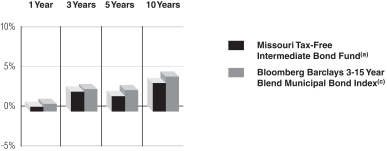
| | | | | | | | | | |
| | Standardized Average Annual Total Return through September 30, 2017(b) | | One Year | | Three Years | | Five Years | | Ten Years |
| | | Missouri Tax-Free Intermediate Bond Fund(a) | | 0.61% | | 2.51% | | 1.93% | | 3.60% |
| | | Bloomberg Barclays 3-15 Year Blend Municipal Bond Index(c) | | 0.96% | | 2.83% | | 2.71% | | 4.42% |
Missouri Tax-Free Intermediate Bond Fund 10 Year Performance
Performance of a $10,000 Investment, with distributions reinvested, from November 1, 2007 through October 31, 2017.
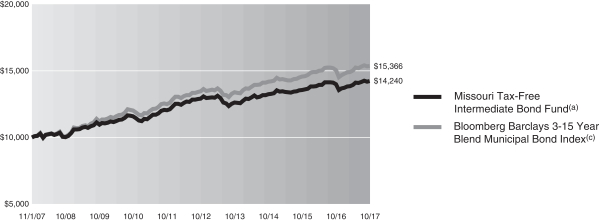
| | | | | | | | | | |
| | Average Annual Total Return through October 31, 2017 | | One Year | | Three Years | | Five Years | | Ten Years |
| | | Missouri Tax-Free Intermediate Bond Fund(a) | | 1.70% | | 2.46% | | 1.97% | | 3.60% |
| | | | | | |
| | Expense Ratios(d) | | | | |
| | | | | Net Expense Ratio (Current) | | Gross Expense Ratio (Before Reimbursements) |
| | | Missouri Tax-Free Intermediate Bond Fund | | 0.66% | | 0.66% |
| (a) | | Returns reflect any fee waivers or expense reductions. Returns do not reflect the deduction of taxes that a shareholder would pay on capital gains or other taxable distributions or the redemption of Fund shares. |
| (b) | | The Standardized Average Annual Total Returns are average annual total returns as of the most recent calendar quarter-end. They assume reinvestment of all distributions at NAV. Current performance may be lower or higher than the total return figures in the above charts. |
Returns reflect any fee waivers and expense reductions. Absent these waivers and reductions, returns would have been lower. Returns do not reflect the deduction of taxes that a shareholder would pay on capital gains or other taxable distributions or the redemption of Fund shares.
| (c) | | The Bloomberg Barclays Capital 3-15 Year Blend Municipal Bond Index is an unmanaged index comprised of investment-grade municipal securities ranging from 2 to 17 years in maturity. The Index figures do not reflect any deduction for fees, taxes or expenses. |
| (d) | | The Fund’s expense ratios, both net (net of applicable fee waivers and/or expense reimbursements) and gross (before applicable fee waivers and/or expense reimbursements), set forth above are as of the most recent publicly available prospectus (March 1, 2017) for the Fund and may differ from the expense ratios disclosed in the Financial Highlights in this report. The Adviser has contractually agreed to reduce or limit the Total Annual Fund Operating Expenses, excluding interest, taxes, acquired fund fees and expenses and extraordinary expenses. This agreement will remain in place through March 1, 2018. After this date, the Adviser or the Fund may terminate the contractual arrangement. If this occurs, the expense ratios may change without shareholder approval. |
45
COMMERCE MISSOURI TAX-FREE INTERMEDIATE BOND FUND
Schedule of Investments
October 31, 2017
| | | | | | | | | | |
Principal
Amount | | Interest
Rate | | | Maturity
Date | | Value | |
| Municipal Bond Obligations – 100.3% | |
Arizona(a) – 0.7% | |
| Arizona Healthcare & Education Facilities Authority Revenue Bonds (Kirksville College) (A-/NR) | |
| $1,000,000 | | | 5.000 | % | | 01/01/25 | | $ | 1,067,150 | |
| Pinal City Arizona Unified School District No. 1 Florence School Improvement Project of 2006 GO Bonds Series C (A/NR) | |
| 1,215,000 | | | 5.150 | | | 07/01/24 | | | 1,247,939 | |
| | | | | | | | | | |
| | | | | | | | | 2,315,089 | |
| |
California – 1.5% | |
| Burbank CA Unified School District GO Bonds Capital Appreciation Election of 1997 Series C (NPFG) (FGIC) (AA-/A3)(b) | |
| 2,000,000 | | | 0.000 | | | 07/01/27 | | | 1,562,620 | |
| California State Department of Veterans Affairs Home Purchase Revenue Bonds (Refunding) Series B (AA/Aa3)(a) | |
| 2,000,000 | | | 3.250 | | | 12/01/36 | | | 1,971,940 | |
| Washington CA Unified School District GO Bonds Capital Appreciation Election of 2004 (Yolo County) Series A (NPFG) (A+/A3)(b) | |
| 2,400,000 | | | 0.000 | | | 08/01/29 | | | 1,687,680 | |
| | | | | | | | | | |
| | | | | | | | | 5,222,240 | |
| |
Connecticut – 1.5% | |
| Hamden CT GO Bonds Series B (A+/NR) | |
| 575,000 | | | 5.000 | | | 08/15/20 | | | 628,544 | |
| 575,000 | | | 5.250 | | | 08/15/21 | | | 648,623 | |
| 575,000 | | | 5.250 | | | 08/15/22 | | | 661,572 | |
| 575,000 | | | 5.250 | | | 08/15/23 | | | 673,865 | |
| 575,000 | | | 5.250 | | | 08/15/24 | | | 686,170 | |
| 575,000 | | | 5.250 | (a) | | 08/15/26 | | | 687,125 | |
| 575,000 | | | 5.250 | (a) | | 08/15/29 | | | 673,797 | |
| 575,000 | | | 5.250 | (a) | | 08/15/31 | | | 669,421 | |
| | | | | | | | | | |
| | | | | | | | | 5,329,117 | |
| |
Florida(a) – 0.6% | |
| Orange County FL Tourist Development Tax Revenue Bonds Series A (AA-/Aa3) | |
| 2,000,000 | | | 4.000 | | | 10/01/33 | | | 2,166,780 | |
| |
Illinois – 2.5% | |
| Illinois Finance Authority Revenue Bonds (OSF Healthcare System) Series 2016 (A/A2)(a) | |
| 2,500,000 | | | 3.250 | | | 05/15/39 | | | 2,251,000 | |
| Illinois Finance Authority Revenue Bonds (Refunding-Swedish Covenant) Series A (BBB/NR)(a)(c) | |
| 1,000,000 | | | 5.500 | | | 02/15/20 | | | 1,096,420 | |
| Illinois Housing Development Authority Revenue Bonds (Refunding Homeowner Mortgage) Series C (AA/Aa3)(a) | |
| 3,000,000 | | | 2.900 | | | 08/01/31 | | | 2,902,680 | |
| Kendall Kane & Will Counties IL Community Unit School District No. 308 Series 2014 (NR/Aa3)(a) | |
| 2,000,000 | | | 4.125 | | | 02/01/30 | | | 2,117,880 | |
| |
| | | | | | | | | | |
Principal
Amount | | Interest
Rate | | | Maturity
Date | | Value | |
| Municipal Bond Obligations – (continued) | |
Illinois – (continued) | |
| Will County IL Community Unit School District No. 201 Crete-Monee GO Bonds (Capital Appreciation) Series 2004 (NPFG) (FGIC) (A/A3)(b) | |
| $ 95,000 | | | 0.000 | % | | 11/01/19 | | $ | 92,665 | |
| | | | | | | | | | |
| | | | | | | | | 8,460,645 | |
| |
Indiana(a) – 0.8% | |
| Indiana Bond Bank Revenue Bonds (Special Program-Hendricks Regional Health) Series A (AA/NR) | |
| 500,000 | | | 5.500 | | | 02/01/29 | | | 526,585 | |
| Tri-Creek IN 2002 High School Building Corporation Revenue Bonds (Refunding) Series 2016 (AA+/NR) | |
| 2,000,000 | | | 4.000 | | | 07/15/34 | | | 2,121,980 | |
| | | | | | | | | | |
| | | | | | | | | 2,648,565 | |
| |
Iowa(a)(c) – 0.4% | |
| Waterloo Community School District Infrastructure Sales & Services Tax Revenue Bonds (Refunding) Series A (A/NR) | |
| 1,245,000 | | | 5.250 | | | 07/01/19 | | | 1,329,299 | |
| |
Kansas(a) – 0.5% | |
| Kansas Development Finance Authority Hospital Revenue Bonds (Refunding-Adventist Health Sunbelt Obligation Group) Series A (AA/Aa2) | |
| 1,500,000 | | | 5.000 | | | 11/15/32 | | | 1,684,350 | |
| |
Louisiana(a)(c) – 2.3% | |
| Louisiana Local Government Environmental Facilities & Community Development Authority Revenue Bonds (Woman’s Hospital Foundation) Series A (A/A2) | |
| 7,000,000 | | | 5.500 | | | 10/01/20 | | | 7,842,170 | |
| |
Michigan(a) – 2.3% | |
| Michigan State Housing Development Authority Revenue Bonds (Non-ACE) Series B (AA+/Aa2) | |
| 1,705,000 | | | 2.950 | | | 12/01/28 | | | 1,705,750 | |
| Michigan State Housing Development Authority Revenue Bonds (Non-AMT) (Non-ACE) Series B (AA+/Aa2) | |
| 2,920,000 | | | 2.550 | | | 06/01/27 | | | 2,902,363 | |
| 2,000,000 | | | 3.350 | | | 12/01/34 | | | 1,980,680 | |
| Michigan State Housing Development Authority Revenue Bonds Series A (AA/NR) | |
| 1,400,000 | | | 3.000 | | | 10/01/32 | | | 1,354,010 | |
| | | | | | | | | | |
| | | | | | | | | 7,942,803 | |
| |
Missouri – 83.3% | |
| Arnold MO Certificates of Participation (A+/NR) | |
| 200,000 | | | 3.000 | | | 11/01/17 | | | 200,000 | |
| 230,000 | | | 3.000 | | | 11/01/18 | | | 234,414 | |
| 210,000 | | | 3.000 | (a)(c) | | 11/01/18 | | | 214,030 | |
| 225,000 | | | 3.625 | (a)(c) | | 11/01/18 | | | 230,711 | |
| 470,000 | | | 3.700 | (a)(c) | | 11/01/18 | | | 482,276 | |
| 225,000 | | | 3.800 | (a)(c) | | 11/01/18 | | | 231,100 | |
| 480,000 | | | 3.875 | (a)(c) | | 11/01/18 | | | 493,368 | |
| 250,000 | | | 4.000 | (a)(c) | | 11/01/18 | | | 257,273 | |
| |
| | |
| 46 | | The accompanying notes are an integral part of these financial statements. |
COMMERCE MISSOURI TAX-FREE INTERMEDIATE BOND FUND
| | | | | | | | | | |
Principal
Amount | | Interest
Rate | | | Maturity
Date | | Value | |
| Municipal Bond Obligations – (continued) | |
Missouri – (continued) | |
| Belton MO Certificates of Participation (A+/NR)(a)(c) | |
| $ 500,000 | | | 5.125 | % | | 03/01/18 | | $ | 506,780 | |
| 500,000 | | | 5.250 | | | 03/01/18 | | | 506,985 | |
| Belton MO School District No. 124 Direct Deposit Program GO Bonds (Refunding) Series B (AA+/Aa1)(a) | |
| 150,000 | | | 4.000 | | | 03/01/21 | | | 151,505 | |
| Bi-State Development Agency MO Metro District Revenue Bonds (Refunding-Combined Lien) Series A (AA+/Aa2)(a) | |
| 1,000,000 | | | 5.000 | | | 10/01/33 | | | 1,150,340 | |
| Bi-State Development Agency MO Metro District Revenue Bonds (Refunding-St. Clair County Metrolink Project) (AGM) (AA/A2) | |
| 2,000,000 | | | 5.250 | | | 07/01/20 | | | 2,203,380 | |
| Boone County MO Hospital Revenue Bonds (NR/Baa1)(a)(c) | |
| 2,350,000 | | | 5.750 | | | 08/01/18 | | | 2,430,158 | |
| Boone County MO Hospital Revenue Bonds Series 2012 (NR/Baa1) | |
| 400,000 | | | 4.000 | | | 08/01/18 | | | 407,276 | |
| 500,000 | | | 4.000 | | | 08/01/19 | | | 519,970 | |
| Branson MO Reorganized School District No. R-4 GO Bonds Series 2012 (A+/NR)(a) | |
| 2,000,000 | | | 4.000 | | | 03/01/27 | | | 2,141,040 | |
| Cape Girardeau County MO Industrial Development Authority Revenue Bonds (St. Francis Medical Center) Series A (A+/NR)(a) | |
| 750,000 | | | 5.000 | | | 06/01/26 | | | 840,180 | |
| Chesterfield MO Certificates of Participation (AMBAC) (NR/Aa1) | |
| 600,000 | | | 5.000 | | | 02/15/22 | | | 684,972 | |
| Clay County MO Public School District No. 53 Liberty GO Bonds (Refunding) Series 2016 (AA/NR)(a) | |
| 1,000,000 | | | 4.000 | | | 03/01/34 | | | 1,076,250 | |
| 1,000,000 | | | 4.000 | | | 03/01/35 | | | 1,073,200 | |
| 1,000,000 | | | 4.000 | | | 03/01/36 | | | 1,069,390 | |
| Clay County MO Public School District No. 53 Liberty School Building Direct Deposit Program GO Bonds (AA+/NR)(a) | |
| 1,280,000 | | | 5.000 | | | 03/01/25 | | | 1,295,885 | |
| Clayton MO Special Obligation Revenue Bonds (Build America Bonds) Series B (AA+/NR)(a) | |
| 810,000 | | | 5.200 | | | 12/01/23 | | | 848,240 | |
| Columbia MO Special Obligation Revenue Bonds (Refunding) Series 2015 (AA/NR) | |
| 495,000 | | | 5.000 | | | 02/01/18 | | | 499,891 | |
| 470,000 | | | 5.000 | | | 02/01/19 | | | 492,875 | |
| Columbia MO Water & Electric Revenue Bonds (Refunding & Improvement System) Series 2015 (A+/NR)(a) | |
| 500,000 | | | 4.000 | | | 10/01/42 | | | 515,665 | |
| Duckett Creek MO Sewer District Revenue Bonds (Refunding-System) Series 2015 (NR/Aa3) | |
| 1,300,000 | | | 5.000 | | | 12/01/24 | | | 1,547,754 | |
| 1,215,000 | | | 5.000 | | | 12/01/25 | | | 1,465,569 | |
| |
| | | | | | | | | | |
Principal
Amount | | Interest
Rate | | | Maturity
Date | | Value | |
| Municipal Bond Obligations – (continued) | |
Missouri – (continued) | |
| Grain Valley MO Certificates of Participation (Refunding) (NR/NR)(a) | |
| $ 200,000 | | | 5.000 | % | | 09/01/20 | | $ | 200,396 | |
| Great Rivers Greenway Metropolitan Park & Recreation District (Gateway Arch Project) Series 2014 (A+/A1)(a) | |
| 1,000,000 | | | 5.000 | | | 12/30/26 | | | 1,169,270 | |
| Greene County MO GO Bonds Limited-Jamestown NID Project Series B (NR/Aa2)(a)(c) | |
| 4,280,000 | | | 5.000 | | | 04/01/22 | | | 4,937,237 | |
| Greenwood MO GO Build America Bonds Taxable Series B (AA-/NR)(a) | |
| 500,000 | | | 5.625 | | | 03/01/25 | | | 537,305 | |
| Hazelwood MO School District GO Bonds (Direct Deposit Program) (Refunding) Series A (AA+/NR)(a) | |
| 2,000,000 | | | 4.000 | | | 03/01/28 | | | 2,259,060 | |
| Higginsville MO Sewage Systems Revenue Bonds (Build America Bonds-Taxable Direct Payment to Issuer) (BB+/NR)(a) | |
| 500,000 | | | 5.924 | | | 10/01/30 | | | 507,085 | |
| I-470 & 350 Transportation Development District MO Sales Tax Revenue Bonds (Refunding & Improvement) (Radian) (AGC) (AA/A3)(a) | |
| 130,000 | | | 4.600 | | | 06/01/29 | | | 130,377 | |
| Independence MO School District (Refunding) (Direct Deposit Program) Series 2016 (AA+/NR)(a) | |
| 1,500,000 | | | 4.000 | | | 03/01/30 | | | 1,661,085 | |
| Independence MO School District Lease Certificates of Participation (Refunding) Series 2016 (A+/NR) | |
| 600,000 | | | 3.000 | | | 04/01/22 | | | 632,502 | |
| 875,000 | | | 3.000 | | | 04/01/23 | | | 926,135 | |
| 500,000 | | | 3.000 | | | 04/01/24 | | | 529,335 | |
| 960,000 | | | 3.000 | (a) | | 04/01/26 | | | 1,001,597 | |
| Jackson County MO Public Building Corp. Leasehold Revenue Bonds Series A (NPFG) (NR/Aa3)(a) | |
| 500,000 | | | 5.000 | | | 12/01/20 | | | 501,650 | |
| Jackson County MO Reorganized School District No. 7 Certificates of Participation Series 2016 (AA/NR) | |
| 500,000 | | | 4.000 | | | 05/01/24 | | | 559,995 | |
| 900,000 | | | 4.000 | | | 05/01/25 | | | 1,014,723 | |
| 700,000 | | | 4.000 | (a) | | 05/01/27 | | | 783,916 | |
| 630,000 | | | 4.000 | (a) | | 05/01/29 | | | 695,848 | |
| 675,000 | | | 4.000 | (a) | | 05/01/30 | | | 740,691 | |
| Jackson County MO School District Hickman Mills C-1 Certificates of Participation (Energy Conservation Project) Series 2015 (A-/NR)(a) | |
| 475,000 | | | 3.000 | | | 04/15/28 | | | 476,102 | |
| 575,000 | | | 3.250 | | | 04/15/30 | | | 578,996 | |
| 550,000 | | | 3.300 | | | 04/15/31 | | | 552,222 | |
| 700,000 | | | 3.375 | | | 04/15/32 | | | 697,214 | |
| Jackson County MO Special Obligation Revenue Bonds (Refunding-Truman Sports Complex Project) Series 2014 (NR/A1)(a) | |
| 1,000,000 | | | 5.000 | | | 12/01/25 | | | 1,183,360 | |
| |
| | |
| The accompanying notes are an integral part of these financial statements. | | 47 |
COMMERCE MISSOURI TAX-FREE INTERMEDIATE BOND FUND
Schedule of Investments (continued)
October 31, 2017
| | | | | | | | | | |
Principal
Amount | | Interest
Rate | | | Maturity
Date | | Value | |
| Municipal Bond Obligations – (continued) | |
Missouri – (continued) | |
| Jackson County MO Special Obligation Revenue Bonds (Right of Way Project) (NR/A1)(a) | |
| $1,345,000 | | | 4.000 | % | | 12/01/26 | | $ | 1,507,449 | |
| 1,455,000 | | | 4.000 | | | 12/01/28 | | | 1,597,008 | |
| Jackson County MO Special Obligation Revenue Bonds (Truman Medical Center Projects) (NR/Aa3) | |
| 890,000 | | | 4.000 | | | 12/01/17 | | | 892,163 | |
| 595,000 | | | 4.250 | (a) | | 12/01/23 | | | 663,449 | |
| Jackson County MO Special Obligation Revenue Bonds (Truman Medical Control Project) Series B (NR/Aa3) | |
| 900,000 | | | 3.500 | | | 12/01/18 | | | 922,149 | |
| 920,000 | | | 3.850 | | | 12/01/20 | | | 987,344 | |
| 500,000 | | | 4.350 | (a) | | 12/01/23 | | | 548,615 | |
| 820,000 | | | 4.500 | (a) | | 12/01/24 | | | 899,884 | |
| Jefferson City MO School District GO Bonds (Direct Deposit Program) Series 2017 (AA+/NR)(a) | |
| 1,750,000 | | | 4.000 | | | 03/01/30 | | | 1,933,785 | |
| Jefferson County MO Consolidated Public Water Supply District No. C-1 Waterworks Revenue Bonds (Refunding) (AA/NR)(a) | |
| 290,000 | | | 4.000 | | | 12/01/20 | | | 290,719 | |
| 435,000 | | | 4.000 | | | 12/01/21 | | | 436,079 | |
| 425,000 | | | 4.000 | | | 12/01/22 | | | 426,054 | |
| Joplin MO Industrial Development Authority Health Facilities Revenue Bonds (Freeman Health System Project) (A-/NR)(a) | |
| 1,000,000 | | | 5.500 | | | 02/15/31 | | | 1,087,140 | |
| Joplin MO Industrial Development Authority Health Facilities Revenue Bonds (Refunding-Freeman Health System Project) Series 2014 (A-/NR)(a) | |
| 1,895,000 | | | 5.000 | | | 02/15/27 | | | 2,165,379 | |
| Kansas City MO GO Bonds (Refunding & Improvement) Series A (AA/Aa2)(a) | |
| 5,425,000 | | | 4.500 | | | 02/01/24 | | | 6,108,821 | |
| Kansas City MO Industrial Development Authority Revenue Bonds (AMBAC) (AA-/A1)(a)(c) | |
| 1,905,000 | | | 4.500 | | | 12/01/17 | | | 1,910,486 | |
| Kansas City MO Industrial Development Authority Revenue Bonds (Refunding & Downtown Redevelopment District) Series A (AA-/A1)(a) | |
| 2,130,000 | | | 5.500 | | | 09/01/29 | | | 2,397,656 | |
| Kansas City MO Sanitary Sewer System Revenue Bonds (Refunding) Series A (AA/Aa2)(a) | |
| 1,895,000 | | | 4.000 | | | 01/01/33 | | | 2,037,807 | |
| Kansas City MO Special Obligation Revenue Bonds (Arena Project) (Refunding & Improvement) Series C (AA-/A1)(a)(c) | |
| 1,000,000 | | | 5.500 | | | 04/01/18 | | | 1,018,490 | |
| Kansas City MO Special Obligation Revenue Bonds (Arena Project) (Refunding & Improvement) Series D (AA-/A1)(a) | |
| 50,000 | | | 6.431 | | | 04/01/18 | | | 50,422 | |
| Kansas City MO Special Obligation Revenue Bonds (Capital Appreciation) Series E (AA-/A1)(b) | |
| 4,465,000 | | | 0.000 | | | 02/01/18 | | | 4,450,265 | |
| |
| | | | | | | | | | |
Principal
Amount | | Interest
Rate | | | Maturity
Date | | Value | |
| Municipal Bond Obligations – (continued) | |
Missouri – (continued) | |
| Kansas City MO Special Obligation Revenue Bonds (Downtown Streetcar Project) Series A (AA-/A1)(a) | |
| $ 760,000 | | | 5.000 | % | | 09/01/31 | | $ | 804,711 | |
| Kansas City MO Special Obligation Revenue Bonds (Refunding) Series C (AA-/A1) | |
| 1,000,000 | | | 5.000 | | | 09/01/27 | | | 1,222,520 | |
| 1,000,000 | | | 5.000 | (a) | | 09/01/31 | | | 1,186,940 | |
| Kansas City MO Special Obligation Tax Allocation (East Village Project) Series A (AA-/A1)(a) | |
| 500,000 | | | 5.000 | | | 04/15/31 | | | 537,220 | |
| Kirkwood MO Certificates of Participation (Build America Bonds-Taxable Direct Payment) (NR/Aa2)(a) | |
| 500,000 | | | 6.050 | | | 09/01/30 | | | 510,490 | |
| Kirkwood School District Educational Facilities Authority Leasehold Revenue Bonds (Refunding) (NR/Aa2) | |
| 1,860,000 | | | 5.000 | | | 02/15/20 | | | 2,010,102 | |
| 1,700,000 | | | 5.000 | | | 02/15/21 | | | 1,890,621 | |
| Liberty MO Public School District No. 53 Lease Participation Certificates (Refunding) (School Board Association) Series 2016 (AA-/NR)(a) | |
| 1,040,000 | | | 3.000 | | | 04/01/27 | | | 1,074,372 | |
| Metropolitan St. Louis MO Sewer District Wastewater System Revenue Bonds Series A (AAA/Aa1)(a) | |
| 485,000 | | | 5.000 | | | 05/01/42 | | | 546,614 | |
| Missouri Development Finance Board Cultural Facilities Revenue Bonds (Nelson Gallery Foundation) Series A (AA-/NR) | |
| 1,000,000 | | | 5.000 | | | 12/01/20 | | | 1,105,610 | |
| Missouri Joint Municipal Electric Utility Commission Power Project Revenue Bonds (Refunding-Iatan 2 Project) Series A (NR/A2)(a) | |
| 3,115,000 | | | 5.000 | | | 01/01/31 | | | 3,564,868 | |
| Missouri School Board Association Lease Certificates of Participation for Liberty Public School District No. 53 (AA-/NR)(a) | |
| 400,000 | | | 4.000 | | | 04/01/28 | | | 425,092 | |
| 425,000 | | | 5.000 | | | 04/01/31 | | | 471,763 | |
| 475,000 | | | 5.000 | | | 04/01/32 | | | 526,841 | |
| 500,000 | | | 5.000 | | | 04/01/33 | | | 553,025 | |
| 500,000 | | | 5.000 | | | 04/01/34 | | | 551,920 | |
| Missouri State Board of Public Buildings Special Obligation (Refunding) Series A (AA+/Aa1)(a) | |
| 2,450,000 | | | 5.000 | | | 10/01/21 | | | 2,710,582 | |
| Missouri State Board of Public Buildings Special Obligation Revenue Bonds Series A (AA+/Aa1)(a) | |
| 1,825,000 | | | 3.000 | | | 10/01/26 | | | 1,885,827 | |
| Missouri State Board of Public Buildings Special Obligation Revenue Bonds Series B (AA+/Aa1)(a) | |
| 800,000 | | | 4.000 | | | 04/01/28 | | | 881,664 | |
| Missouri State Development Finance Board Cultural Facilities Revenue Bonds (Nilson Gallery Foundation) Series A (AA-/NR) | |
| 1,000,000 | | | 4.000 | | | 12/01/17 | | | 1,002,190 | |
| |
| | |
| 48 | | The accompanying notes are an integral part of these financial statements. |
COMMERCE MISSOURI TAX-FREE INTERMEDIATE BOND FUND
| | | | | | | | | | |
Principal
Amount | | Interest
Rate | | | Maturity
Date | | Value | |
| Municipal Bond Obligations – (continued) | |
Missouri – (continued) | |
| Missouri State Environmental Improvement & Energy Resources Authority Revenue Bonds (Tri-County Water Authority Project) (NR/Aa3) | |
| $ 735,000 | | | 3.000 | % | | 01/01/20 | | $ | 759,652 | |
| 595,000 | | | 5.000 | (a) | | 01/01/30 | | | 694,115 | |
| 775,000 | | | 5.000 | (a) | | 01/01/31 | | | 899,682 | |
| Missouri State Environmental Improvement & Energy Resources Authority Water Pollution Control Revenue Bonds (Unrefunded Balance-State Revolving Funds Program) Series B (GO of Authority) (NR/Aaa)(a) | |
| 380,000 | | | 5.125 | | | 01/01/18 | | | 381,307 | |
| 5,000 | | | 5.000 | | | 01/01/22 | | | 5,017 | |
| Missouri State Environmental Improvement & Energy Resources Authority Water Pollution Revenue Bonds (Prerefunded-State Revolving Funds Programs) Series A (NR/NR)(a)(c) | |
| 310,000 | | | 5.500 | | | 01/01/19 | | | 325,578 | |
| Missouri State Environmental Improvement & Energy Resources Authority Water Pollution Revenue Bonds (Unrefunded-State Revolving Funds Programs) Series A (NR/Aaa)(a) | |
| 90,000 | | | 5.500 | | | 01/01/23 | | | 94,598 | |
| Missouri State Health & Educational Facilities Authority Educational Facilities Revenue Bonds (A.T. Still University of Health Sciences) Series 2011 (A-/NR) | |
| 525,000 | | | 4.000 | | | 10/01/18 | | | 538,025 | |
| 545,000 | | | 4.000 | | | 10/01/19 | | | 572,299 | |
| 400,000 | | | 3.500 | | | 10/01/21 | | | 424,804 | |
| 1,850,000 | | | 5.250 | (a) | | 10/01/41 | | | 2,058,976 | |
| Missouri State Health & Educational Facilities Authority Educational Facilities Revenue Bonds (Kansas City University of Medicine And Biosciences) Series A (NR/A1)(a) | |
| 1,440,000 | | | 4.500 | | | 06/01/28 | | | 1,567,958 | |
| Missouri State Health & Educational Facilities Authority Educational Facilities Revenue Bonds (Ranken Technical College) Series A (NR/A3)(a)(c) | |
| 1,000,000 | | | 5.125 | | | 11/01/19 | | | 1,078,260 | |
| Missouri State Health & Educational Facilities Authority Educational Facilities Revenue Bonds (Refunding-Webster University Project) Series 2017 (NR/A2)(a) | |
| 1,590,000 | | | 4.000 | | | 04/01/33 | | | 1,678,086 | |
| 1,345,000 | | | 4.000 | | | 04/01/34 | | | 1,412,842 | |
| 1,395,000 | | | 4.000 | | | 04/01/35 | | | 1,460,760 | |
| Missouri State Health & Educational Facilities Authority Educational Facilities Revenue Bonds (University of Central Missouri) Series C (A+/NR)(a) | |
| 2,400,000 | | | 5.000 | | | 10/01/26 | | | 2,788,032 | |
| Missouri State Health & Educational Facilities Authority Health Facilities Revenue Bonds (Prerefunded-Cox Health) Series A (NR/NR)(a)(c) | |
| 1,880,000 | | | 5.125 | | | 11/15/18 | | | 1,957,531 | |
| |
| | | | | | | | | | |
Principal
Amount | | Interest
Rate | | | Maturity
Date | | Value | |
| Municipal Bond Obligations – (continued) | |
Missouri – (continued) | |
| Missouri State Health & Educational Facilities Authority Health Facilities Revenue Bonds (Refunding-Cox Health) Series A (NR/A2)(a) | |
| $2,500,000 | | | 5.000 | % | | 11/15/35 | | $ | 2,824,625 | |
| Missouri State Health & Educational Facilities Authority Health Facilities Revenue Bonds (Refunding-St. Luke’s Episcopal-Presbyterian Hospitals) Series B (A+/NR)(a) | |
| 1,000,000 | | | 5.000 | | | 12/01/33 | | | 1,148,790 | |
| Missouri State Health & Educational Facilities Authority Health Facilities Revenue Bonds (St. Lukes Episcopal) Series 2011 (A+/NR)(a) | |
| 2,270,000 | | | 5.000 | | | 12/01/25 | | | 2,535,613 | |
| Missouri State Health & Educational Facilities Authority Health Facilities Revenue Bonds (Unrefunded-Cox Health) Series A (NR/A2)(a) | |
| 470,000 | | | 5.125 | | | 11/15/23 | | | 486,290 | |
| Missouri State Health & Educational Facilities Authority Health Facllities Revenue Bonds (Refunding-St. Luke’s Episcopal-Presbyterian Hospitals) Series B (A+/NR)(a) | |
| 1,375,000 | | | 5.000 | | | 12/01/31 | | | 1,592,841 | |
| Missouri State Health & Educational Facilities Authority Revenue Bonds (BJC Health System) Series 2014 (AA/Aa2) | |
| 1,000,000 | | | 5.000 | | | 01/01/18 | | | 1,006,570 | |
| Missouri State Health & Educational Facilities Authority Revenue Bonds (Children’s Mercy Hospital) Series 2009 (A+/NR)(a) | |
| 170,000 | | | 5.000 | | | 05/15/23 | | | 179,925 | |
| Missouri State Health & Educational Facilities Authority Revenue Bonds (Children’s Mercy Hospital) Series 2009 (NR/NR)(a)(c) | |
| 830,000 | | | 5.000 | | | 05/15/19 | | | 878,381 | |
| Missouri State Health & Educational Facilities Authority Revenue Bonds (Kansas City University of Medicine & Biosciences) Series A (NR/A1)(a) | |
| 950,000 | | | 5.000 | | | 06/01/34 | | | 1,100,309 | |
| 1,100,000 | | | 5.000 | | | 06/01/37 | | | 1,263,218 | |
| Missouri State Health & Educational Facilities Authority Revenue Bonds (Refunding & Improvement-Webster University Project) Series 2011 (NR/A2)(a)(c) | |
| 4,000,000 | | | 5.000 | | | 04/01/21 | | | 4,488,320 | |
| Missouri State Health & Educational Facilities Authority Revenue Bonds (Refunding-Children’s Mercy Hospital) Series 2016 (A+/NR)(a) | |
| 1,250,000 | | | 4.000 | | | 05/15/33 | | | 1,314,700 | |
| Missouri State Health & Educational Facilities Authority Revenue Bonds (Refunding-Lake Regional Health System) (BBB+/NR) | |
| 2,000,000 | | | 5.000 | | | 02/15/19 | | | 2,080,160 | |
| Missouri State Health & Educational Facilities Authority Revenue Bonds (Refunding-The Children’s Mercy Hospital) Series 2016 (A+/NR)(a) | |
| 1,250,000 | | | 4.000 | | | 05/15/39 | | | 1,286,500 | |
| |
| | |
| The accompanying notes are an integral part of these financial statements. | | 49 |
COMMERCE MISSOURI TAX-FREE INTERMEDIATE BOND FUND
Schedule of Investments (continued)
October 31, 2017
| | | | | | | | | | |
Principal
Amount | | Interest
Rate | | | Maturity
Date | | Value | |
| Municipal Bond Obligations – (continued) | |
Missouri – (continued) | |
| Missouri State Health & Educational Facilities Authority Revenue Bonds (SSM Health Care) Series B (A+/NR)(a) | |
| $1,000,000 | | | 5.000 | % | | 06/01/21 | | $ | 1,093,770 | |
| 1,000,000 | | | 4.500 | | | 06/01/25 | | | 1,064,500 | |
| Missouri State Health & Educational Facilities Authority Revenue Bonds (St. Louis College of Pharmacy) Series B (BBB/NR)(a) | |
| 500,000 | | | 5.000 | | | 05/01/30 | | | 564,625 | |
| 1,410,000 | | | 5.000 | | | 05/01/40 | | | 1,519,684 | |
| Missouri State Health & Educational Facilities Authority Revenue Bonds (St. Lukes Health System) Series A (AGM) (AA/A1) | |
| 1,000,000 | | | 5.000 | | | 11/15/19 | | | 1,075,980 | |
| Missouri State Health & Educational Facilities Authority Revenue Bonds (Variable-Ascension Health Senior Credit Group) Series C5-REMK (AA+/Aa2)(a)(d)(e) | |
| 1,740,000 | | | 0.920 | | | 11/15/26 | | | 1,740,000 | |
| Missouri State Health & Educational Facilities Authority Revenue Bonds (Variable-BJC Health System) Series A (AA/Aa2)(a)(d)(e) | |
| 3,500,000 | | | 0.900 | | | 05/15/38 | | | 3,500,000 | |
| Missouri State Housing Development Commission Multi Family Housing Revenue Bonds (Courthouse Apartments LLC) Series 2009-1 (FHA) (AA+/NR)(a) | |
| 610,000 | | | 5.250 | | | 07/01/42 | | | 630,484 | |
| Missouri State Housing Development Commission Multi Family Housing Revenue Bonds (Samantha Heights Apartments Project) Series 2 (FHA) (AA+/NR)(a) | |
| 500,000 | | | 4.375 | | | 07/01/30 | | | 520,910 | |
| Missouri State Housing Development Commission Single Family Mortgage Revenue Bonds (Homeownership Loan Program) Series B-2 (GNMA/FNMA/FHLMC) (AA+/NR)(a) | |
| 2,025,000 | | | 3.550 | | | 11/01/30 | | | 2,092,270 | |
| Missouri State Housing Development Commission Single Family Mortgage Revenue Bonds (Special Homeownership Loan Program Market Bonds) Series E-1 (GNMA/FNMA/FHLMC) (AA+/NR)(a) | |
| 150,000 | | | 3.950 | | | 05/01/21 | | | 156,809 | |
| 185,000 | | | 3.950 | | | 11/01/21 | | | 193,233 | |
| Missouri State Housing Development Commission Single Family Mortgage Revenue Bonds (Special Homeownership Loan Program) (Non-AMT) Series E-4 (GNMA/FNMA/FHLMC) (AA+/NR)(a) | |
| 210,000 | | | 3.600 | | | 11/01/23 | | | 219,965 | |
| 315,000 | | | 3.750 | | | 05/01/24 | | | 330,507 | |
| 265,000 | | | 3.800 | | | 05/01/25 | | | 276,957 | |
| Missouri State University Auxiliary Enterprise System Revenue Bonds (Refunding) Series A (A+/A1) | |
| 1,170,000 | | | 4.000 | | | 04/01/19 | | | 1,215,782 | |
| 2,835,000 | | | 4.000 | (a) | | 04/01/26 | | | 3,060,893 | |
| Nodaway County MO Industrial Development Authority Educational Facilities Revenue Bonds (Variable-Northwest Foundation, Inc.) Series 2008 (AA-/NR)(a)(d)(e) | |
| 290,000 | | | 0.910 | | | 11/01/28 | | | 290,000 | |
| |
| | | | | | | | | | |
Principal
Amount | | Interest
Rate | | | Maturity
Date | | Value | |
| Municipal Bond Obligations – (continued) | |
Missouri – (continued) | |
| North Kansas City MO Levee District (Improvement) Series 2011 (A-/NR) | |
| $ 275,000 | | | 3.000 | % | | 04/01/18 | | $ | 277,252 | |
| 280,000 | | | 3.000 | | | 04/01/19 | | | 287,403 | |
| 265,000 | | | 3.250 | (a)(c) | | 04/01/19 | | | 272,931 | |
| 590,000 | | | 4.000 | (a)(c) | | 04/01/19 | | | 613,848 | |
| 790,000 | | | 4.500 | (a)(c) | | 04/01/19 | | | 827,462 | |
| 425,000 | | | 4.625 | (a)(c) | | 04/01/19 | | | 445,897 | |
| 445,000 | | | 4.750 | (a)(c) | | 04/01/19 | | | 467,655 | |
| North Kansas City MO School District No. 74 Certificates of Participation Series 2015 (NR/Aa3) | |
| 540,000 | | | 3.000 | | | 09/01/18 | | | 548,678 | |
| Northwest Missouri State University Revenue Bonds (Housing System) (NR/A3) | |
| 1,535,000 | | | 2.000 | | | 06/01/19 | | | 1,551,271 | |
| 2,750,000 | | | 4.000 | (a) | | 06/01/26 | | | 2,933,590 | |
| 2,925,000 | | | 4.000 | (a) | | 06/01/27 | | | 3,107,227 | |
| 1,000,000 | | | 4.000 | (a) | | 06/01/28 | | | 1,054,760 | |
| O’Fallon MO Certificates of Participation (NPFG) (NR/Aa3) | |
| 1,000,000 | | | 5.250 | | | 11/01/18 | | | 1,040,840 | |
| O’Fallon MO Special Obligation Revenue Bonds Series 2012 (AA-/NR)(a) | |
| 1,135,000 | | | 4.000 | | | 11/01/22 | | | 1,245,152 | |
| OTC Public Building Corp. MO Build America Bonds Revenue Bonds Series 2010 (AGM) (AA/NR)(a) | |
| 1,000,000 | | | 6.400 | | | 03/01/30 | | | 1,071,330 | |
| OTC Public Building Corp. MO Leasehold Revenue Bonds (Refunding-Ozarks Technical Community College) (AGM) (AA/NR) | |
| 1,500,000 | | | 5.000 | | | 03/01/19 | | | 1,577,655 | |
| Ozark MO Certificates of Participation Series 2014 (A+/NR)(a) | |
| 500,000 | | | 5.000 | | | 09/01/44 | | | 551,980 | |
| Ozark MO Reorganized School District No. R-6 GO Bonds (Direct Deposit Program) (Refunding & Improvement) Series 2015 (AA+/NR)(a) | |
| 1,000,000 | | | 4.000 | | | 03/01/30 | | | 1,073,880 | |
| 1,000,000 | | | 4.000 | | | 03/01/34 | | | 1,056,980 | |
| 1,500,000 | | | 4.000 | | | 03/01/35 | | | 1,581,660 | |
| Platte County MO Industrial Development Authority Transportation Revenue Bonds (Refunding & Improvement-Zona Rosa Retail Project) (AA-/NR)(a) | |
| 435,000 | | | 5.000 | | | 12/01/18 | | | 436,436 | |
| 850,000 | | | 5.000 | | | 12/01/20 | | | 852,898 | |
| Platte County MO R-3 School District Building Corp. Leasehold Revenue Bonds (School Project) (AA-/NR)(a) | |
| 1,000,000 | | | 4.000 | | | 04/01/23 | | | 1,093,380 | |
| 550,000 | | | 4.000 | | | 04/01/28 | | | 593,103 | |
| 800,000 | | | 4.000 | | | 04/01/29 | | | 860,240 | |
| 1,475,000 | | | 4.000 | | | 04/01/30 | | | 1,582,218 | |
| Republic MO Special Obligation Revenue Bonds (A+/NR) | |
| 150,000 | | | 3.150 | | | 05/01/18 | | | 151,581 | |
| 150,000 | | | 3.300 | (a)(c) | | 05/01/18 | | | 151,692 | |
| 250,000 | | | 3.500 | (a)(c) | | 05/01/18 | | | 253,068 | |
| |
| | |
| 50 | | The accompanying notes are an integral part of these financial statements. |
COMMERCE MISSOURI TAX-FREE INTERMEDIATE BOND FUND
| | | | | | | | | | |
Principal
Amount | | Interest
Rate | | | Maturity
Date | | Value | |
| Municipal Bond Obligations – (continued) | |
Missouri – (continued) | |
| Republic MO Special Obligation Revenue Bonds (A+/NR) – (continued) | |
| $ 300,000 | | | 3.750 | %(a)(c) | | 05/01/18 | | $ | 304,053 | |
| 325,000 | | | 3.875 | (a)(c) | | 05/01/18 | | | 329,589 | |
| 360,000 | | | 3.000 | | | 08/01/18 | | | 364,936 | |
| Rolla MO Certificates of Participation Series B (A+/NR)(a) | |
| 225,000 | | | 3.150 | | | 07/01/27 | | | 230,996 | |
| 410,000 | | | 3.450 | | | 07/01/32 | | | 416,175 | |
| Saint Louis MO Airport Revenue Bonds (Lambert-St. Louis International Airport) Series 2005 (NPFG) (A/A3) | |
| 2,135,000 | | | 5.500 | | | 07/01/28 | | | 2,735,832 | |
| Saint Louis MO Special Administrative Board of the Transitional School District GO Bonds (Direct Deposit Program) Series 2012 (AA+/NR)(a) | |
| 3,000,000 | | | 4.000 | | | 04/01/23 | | | 3,284,160 | |
| Saint Louis MO Special Administrative Board of the Transitional School District GO Bonds (Direct Deposit Program) Series A (AA+/NR)(a) | |
| 1,300,000 | | | 4.000 | | | 04/01/23 | | | 1,423,136 | |
| Saint Louis MO Special Administrative Board of the Transitional School District GO Bonds (Direct Deposit Program) Series B (AA+/NR)(a) | |
| 2,675,000 | | | 4.000 | | | 04/01/24 | | | 2,894,858 | |
| Springfield MO Public Building Corp. Leasehold Revenue Bonds (Taxable Improvement-Branson National Airport) (NR/Aa2)(a) | |
| 540,000 | | | 6.750 | | | 03/01/28 | | | 564,257 | |
| 575,000 | | | 6.850 | | | 03/01/29 | | | 600,306 | |
| Springfield MO Public Utility Revenue Bonds (Refunding) Series 2015 (AA+/NR)(a) | |
| 1,310,000 | | | 4.000 | | | 08/01/31 | | | 1,436,939 | |
| Springfield MO Special Obligation Revenue Bonds (College Station Garage Project) Series A (NR/Aa3)(a) | |
| 190,000 | | | 4.500 | | | 11/01/18 | | | 190,000 | |
| 530,000 | | | 4.500 | | | 11/01/19 | | | 530,000 | |
| 610,000 | | | 4.500 | | | 11/01/20 | | | 610,000 | |
| 645,000 | | | 4.750 | | | 11/01/21 | | | 645,000 | |
| 685,000 | | | 4.750 | | | 11/01/22 | | | 685,000 | |
| Springfield MO Special Obligation Revenue Bonds (Heers Garage Project) Series B (NR/Aa3)(a) | |
| 385,000 | | | 4.750 | | | 11/01/21 | | | 385,000 | |
| 405,000 | | | 4.750 | | | 11/01/22 | | | 405,000 | |
| Springfield MO Special Obligation Revenue Bonds (Refunding) Series A (NR/Aa2) | |
| 925,000 | | | 2.000 | | | 05/01/21 | | | 939,115 | |
| Springfield MO Special Obligation Revenue Bonds (Refunding) Series B (AMT) (NR/Aa2) | |
| 2,275,000 | | | 5.000 | | | 07/01/27 | | | 2,721,651 | |
| 1,220,000 | | | 5.000 | (a) | | 07/01/28 | | | 1,445,822 | |
| Springfield MO Special Obligation Revenue Bonds (Refunding) Series B (NR/Aa3) | |
| 1,305,000 | | | 2.000 | | | 05/01/20 | | | 1,322,213 | |
| 1,335,000 | | | 2.000 | | | 05/01/21 | | | 1,355,372 | |
| |
| | | | | | | | | | |
Principal
Amount | | Interest
Rate | | | Maturity
Date | | Value | |
| Municipal Bond Obligations – (continued) | |
Missouri – (continued) | |
| Springfield MO Special Obligation Revenue Bonds (Refunding) Series B (NR/Aa3) – (continued) | |
| $1,000,000 | | | 4.000 | %(a) | | 05/01/26 | | $ | 1,089,470 | |
| 1,405,000 | | | 4.000 | (a) | | 05/01/27 | | | 1,523,146 | |
| Springfield MO Special Obligation Revenue Bonds (Sewer Systems Improvement Project) Series 2012 (NR/Aa2) | |
| 1,275,000 | | | 5.000 | | | 04/01/22 | | | 1,457,261 | |
| 1,340,000 | | | 5.000 | (a) | | 04/01/23 | | | 1,521,744 | |
| St. Charles County MO Public Water Supply District No. 2 Certificates of Participation (Refunding) Series 2016 (AA/NR)(a) | |
| 1,000,000 | | | 4.000 | | | 12/01/31 | | | 1,060,200 | |
| St. Charles MO Certificates of Participation Build America Bonds Series B (NR/Aa3)(a) | |
| 1,250,000 | | | 5.650 | | | 02/01/30 | | | 1,325,025 | |
| St. Charles MO Certificates of Participation Series 2012 (NR/A1)(a) | |
| 1,000,000 | | | 3.000 | | | 05/01/22 | | | 1,020,330 | |
| St. Joseph MO Industrial Development Authority Special Obligation Revenue Bonds (Refunding) (Sewer System Improvements Project) Series B (A+/NR)(a) | |
| 1,085,000 | | | 5.000 | | | 04/01/26 | | | 1,295,859 | |
| St. Louis County MO Community College District Certificates of Participation Series 2017 (NR/NR)(a) | |
| 1,000,000 | | | 4.000 | | | 04/01/35 | | | 1,065,400 | |
| 2,000,000 | | | 4.000 | | | 04/01/36 | | | 2,119,100 | |
| 2,515,000 | | | 4.000 | | | 04/01/37 | | | 2,656,418 | |
| St. Louis County MO Library District Certificates of Participation (AA/Aa2)(a) | |
| 1,855,000 | | | 4.000 | | | 04/01/25 | | | 2,059,532 | |
| 1,930,000 | | | 4.000 | | | 04/01/26 | | | 2,125,007 | |
| 2,010,000 | | | 4.000 | | | 04/01/27 | | | 2,196,910 | |
| St. Louis County MO Parkway School District No. C-2 GO Bonds (Refunding & Improvement) (AAA/NR) | |
| 400,000 | | | 3.250 | | | 03/01/19 | | | 411,216 | |
| St. Louis County MO Parkway School District No. C-2 GO Bonds Series B (AAA/NR)(a) | |
| 1,000,000 | | | 4.000 | | | 03/01/32 | | | 1,094,960 | |
| St. Louis County MO Regional Convention & Sports Complex Authority Revenue Bonds (Refunding-Convention & Sports Facilities) Series B (AA/NR) | |
| 875,000 | | | 5.000 | | | 08/15/20 | | | 959,000 | |
| St. Louis County MO Special School District Certificates of Participation (Lease) Series B (AA/NR)(a) | |
| 1,735,000 | | | 4.000 | | | 04/01/26 | | | 1,867,172 | |
| St. Louis MO Airport Revenue Bonds (Refunding-Lambert International Airport) Series 2012 (AMT) (A-/A3)(a) | |
| 1,280,000 | | | 5.000 | | | 07/01/23 | | | 1,430,170 | |
| St. Louis MO Junior College District Building Corp. Leasehold Revenue Bonds (Refunding) (AA/NR) | |
| 750,000 | | | 3.000 | | | 04/01/21 | | | 786,022 | |
| 800,000 | | | 3.000 | | | 04/01/22 | | | 844,040 | |
| 800,000 | | | 3.000 | (a) | | 04/01/23 | | | 839,512 | |
| |
| | |
| The accompanying notes are an integral part of these financial statements. | | 51 |
COMMERCE MISSOURI TAX-FREE INTERMEDIATE BOND FUND
Schedule of Investments (continued)
October 31, 2017
| | | | | | | | | | |
Principal
Amount | | Interest
Rate | | | Maturity
Date | | Value | |
| Municipal Bond Obligations – (continued) | |
Missouri – (continued) | |
| St. Louis MO Muni Finance Corp. (Refunding-Carnahan Court House) Series A (A/NR) | |
| $2,710,000 | | | 5.000 | % | | 02/15/27 | | $ | 3,280,753 | |
| St. Louis MO Municipal Finance Corporation Revenue Bonds Series A (A/NR) | |
| 1,320,000 | | | 5.000 | | | 04/15/25 | | | 1,574,760 | |
| 1,390,000 | | | 5.000 | | | 04/15/26 | | | 1,676,799 | |
| St. Louis MO Municipal Finance Corporation Sales Tax Leasehold Revenue Bonds (Refunding) Series 2016 (A/NR) | |
| 1,000,000 | | | 5.000 | | | 02/15/24 | | | 1,167,990 | |
| 2,595,000 | | | 4.000 | (a) | | 02/15/35 | | | 2,719,897 | |
| St. Louis MO Special Administrative Board Transitional School District GO Bonds (Direct Deposit Program) (AA+/NR)(a)(c) | |
| 4,250,000 | | | 5.000 | | | 04/01/18 | | | 4,319,827 | |
| St. Peters MO Certificates of Participation (Refunding) Series 2013 (NR/A1)(a) | |
| 695,000 | | | 3.250 | | | 05/01/21 | | | 725,052 | |
| Stone County MO Reorganized School District No. 4 (Refunding-MO Direct Deposit Program) Series 2016 (AA+/NR)(a) | |
| 1,725,000 | | | 4.000 | | | 03/01/33 | | | 1,849,942 | |
| 1,840,000 | | | 4.000 | | | 03/01/34 | | | 1,956,527 | |
| Truman MO State University Housing Society Revenue Bonds (Refunding-Revenue) Series 2016 (NR/A1)(a) | |
| 865,000 | | | 3.000 | | | 06/01/25 | | | 909,340 | |
| Truman State University MO Housing System Revenue Bonds (Refunding) (NR/A1)(a) | |
| 765,000 | | | 4.000 | | | 06/01/21 | | | 812,025 | |
| Valley Park MO School District Educational Facilities Authority Leasehold Revenue Bonds (Refunding) (A/NR) | |
| 345,000 | | | 3.000 | | | 03/01/18 | | | 347,267 | |
| 360,000 | | | 3.000 | (a)(c) | | 03/01/18 | | | 362,365 | |
| 385,000 | | | 3.150 | (a)(c) | | 03/01/18 | | | 387,722 | |
| 700,000 | | | 3.300 | (a)(c) | | 03/01/18 | | | 705,292 | |
| Wentzville MO Certificates of Participation (Refunding) Series 2015 (NR/Aa3) | |
| 1,160,000 | | | 4.000 | | | 08/01/25 | | | 1,308,828 | |
| 1,000,000 | | | 4.000 | (a) | | 08/01/26 | | | 1,119,220 | |
| Wentzville MO School District No. 4 (Refunding) (Direct Deposit Program) Series 2016 (NR/NR)(a)(b) | |
| 2,000,000 | | | 0.000 | | | 03/01/26 | | | 1,635,000 | |
| 2,095,000 | | | 0.000 | | | 03/01/27 | | | 1,641,600 | |
| Wentzville MO School District No. 4 (Refunding) (Direct Deposit Program) Series 2017 (AA+/Aa1)(a) | |
| 1,700,000 | | | 4.000 | | | 03/01/29 | | | 1,909,695 | |
| Wentzville R-IV School District MO Lease Certificates of Participation (Refunding & Improvement Certificates) Series 2016 (NR/Aa3)(a) | |
| 1,810,000 | | | 4.000 | | | 04/01/32 | | | 1,933,207 | |
| 1,800,000 | | | 4.000 | | | 04/01/33 | | | 1,911,438 | |
| 1,800,000 | | | 4.000 | | | 04/01/34 | | | 1,902,870 | |
| |
| | | | | | | | | | | | |
Principal
Amount | | Interest
Rate | | | Maturity
Date | | | Value | |
| Municipal Bond Obligations – (continued) | |
Missouri – (continued) | |
| Wentzville R-IV School District MO Lease Certificates of Participation Series 2012 (NR/Aa3) | |
| $ 560,000 | | | 3.000 | % | | | 04/01/18 | | | $ | 564,564 | |
| 1,270,000 | | | 3.250 | (a) | | | 04/01/21 | | | | 1,300,429 | |
| Wentzville R-IV School District MO Lease Certificates of Participation Series 2015 (NR/Aa3) | |
| 565,000 | | | 5.000 | | | | 04/01/24 | | | | 665,802 | |
| 990,000 | | | 4.000 | (a) | | | 04/01/25 | | | | 1,101,048 | |
| Wright City MO Industrial Revenue Bonds (Variable-Watlow Process System, Inc.) Series 2002 (A+/NR)(a)(d)(e) | |
| 600,000 | | | 1.050 | | | | 04/01/32 | | | | 600,000 | |
| | | | | |
| | | | | | | | | | | 286,789,077 | |
| |
New Jersey – 0.7% | |
| Union City NJ GO Bonds (Refunding) Series 2017 (NR/Baa1) | |
| 2,100,000 | | | 5.000 | | | | 11/01/21 | | | | 2,343,432 | |
| |
North Dakota(a) – 1.2% | |
| North Dakota State Housing Finance Agency Homeownership Revenue Bonds (Home Mortgage Finance Program) Series C (NR/Aa2) | |
| 2,310,000 | | | 2.600 | | | | 07/01/28 | | | | 2,262,368 | |
| 1,895,000 | | | 3.150 | | | | 01/01/36 | | | | 1,836,122 | |
| | | | | |
| | | | | | | | | | | 4,098,490 | |
| |
Ohio(a) – 0.7% | |
| Ohio Housing Finance Agency RSDL Mortgage Revenue Bonds (Refunding) Series K (GNMA/FNMA/FHLMC) (NR/Aaa) | |
| 2,355,000 | | | 3.200 | | | | 09/01/36 | | | | 2,328,624 | |
| |
Pennsylvania(a) – 0.3% | |
| Delaware County Authority University Revenue Bonds for Neumann University (BBB/NR) | |
| 1,000,000 | | | 5.000 | | | | 10/01/25 | | | | 1,083,560 | |
| |
Tennessee – 0.4% | |
| Knox County Health Educational & Housing Facility Board Revenue Bonds (Refunding) (University Health Systems, Inc.) Series 2017 (BBB+/NR) | |
| 1,500,000 | | | 3.375 | | | | 04/01/26 | | | | 1,556,235 | |
| |
Wisconsin(a) – 0.6% | |
| Wisconsin State Health & Educational Facilities Authority Revenue Bonds (Refunding-Ascension Health Credit Group) Series A (AA+/Aa2) | |
| 2,000,000 | | | 4.000 | | | | 11/15/34 | | | | 2,104,920 | |
| |
| TOTAL MUNICIPAL BOND OBLIGATIONS | |
(Cost $335,356,641) | | | | | | | $ | 345,245,396 | |
| |
| | |
| 52 | | The accompanying notes are an integral part of these financial statements. |
COMMERCE MISSOURI TAX-FREE INTERMEDIATE BOND FUND
| | | | | | | | | | | | |
Principal
Amount | | Interest
Rate | | | Maturity
Date | | | Value | |
| Short-term Investment(f) – 0.4% | |
Repurchase Agreement – 0.4% | |
| Fixed Income Clearing Corp. | |
| $1,481,000 | | | 0.120 | % | | | 11/01/17 | | | $ | 1,481,000 | |
Maturity Value: $1,481,010 | | | | | |
(Cost $1,481,000) | | | | | |
| |
| TOTAL INVESTMENTS – 100.7% | | | | | |
(Cost $336,837,641) | | | | | | | $ | 346,726,396 | |
| |
LIABILITIES IN EXCESS OF OTHER ASSETS – (0.7)% | | | | (2,435,167) | |
| |
| NET ASSETS – 100.0% | | | $ | 344,291,229 | |
| |
| | |
| The percentage shown for each investment category reflects the value of investments in that category as a percentage of net assets. |
| |
| (a) | | Security with “Call” features with resetting interest rates. Maturity dates disclosed are the final maturity dates. |
| (b) | | Security issued with a zero coupon. The actual effective yield of this security is different than the stated coupon due to the accretion of discount. |
| (c) | | Prerefunded security. Maturity date disclosed is prerefunding date. |
| (d) | | Variable rate security. The interest rate shown reflects the rate as of October 31, 2017. |
| (e) | | Rate shown is that which is in effect on October 31, 2017. Certain variable rate securities are not based on a published reference rate and spread but are determined by the issuer or agent and are based on current market conditions. |
| (f) | | Repurchase agreement was entered into on October 31, 2017. This agreement was fully collateralized by $1,495,000 U.S. Treasury Bond, 2.875%, due 11/15/46 with a market value of $1,513,273. |
| Security ratings disclosed, if any, are issued by Standard & Poor’s Ratings Services/Moody’s Investors Service and are unaudited. A description of the ratings is available in the Fund’s Statement of Additional Information. |
| | |
|
| Investment Abbreviations: |
| AGC | | —Insuredby Assured Guaranty Corp. |
| AGM | | —Insuredby Assured Guaranty Municipal Corp. |
| AMBAC | | —Insuredby American Municipal Bond Assurance Corp. |
| AMT | | —AlternativeMinimum Tax |
| FGIC | | —Insuredby Financial Guaranty Insurance Co. |
| FHA | | —Insuredby Federal Housing Administration |
| FHLMC | | —FederalHome Loan Mortgage Corp. |
| FNMA | | —FederalNational Mortgage Association |
| GNMA | | —GovernmentNational Mortgage Association |
| GO | | —GeneralObligation |
| NR | | —Not Rated |
| Radian | | —Insuredby Radian Asset Assurance |
|
PORTFOLIO COMPOSITION
| | | | | | | | |
| | | AS OF
10/31/2017 | | | AS OF
10/31/2016 | |
| |
Lease | | | 25.8 | % | | | 26.5 | % |
General Obligation | | | 17.0 | | | | 14.7 | |
Prerefunded/Escrow to Maturity | | | 12.6 | | | | 6.2 | |
Hospital | | | 11.3 | | | | 13.4 | |
Education | | | 10.6 | | | | 10.7 | |
Limited Tax | | | 7.5 | | | | 7.8 | |
Single Family Housing | | | 6.1 | | | | 6.6 | |
Water/Sewer | | | 4.3 | | | | 4.5 | |
Transportation | | | 2.2 | | | | 2.8 | |
Power | | | 1.0 | | | | 1.8 | |
Multi Family Housing | | | 0.7 | | | | 0.7 | |
Not For Profit | | | 0.6 | | | | 0.6 | |
Crossover | | | 0.4 | | | | 0.5 | |
Repurchase Agreement | | | 0.4 | | | | 1.3 | |
IDR/PCR | | | 0.2 | | | | 0.2 | |
Investment Company | | | — | | | | 2.2 | |
| |
| TOTAL INVESTMENTS | | | 100.7 | % | | | 100.5 | % |
| |
The percentage shown for each investment category reflects the value of investments in that category as a percentage of net assets. Underlying investment categories of investment companies held by the Fund are not reflected in the table above. Consequently, the Fund’s overall investment category allocations may differ from the percentages contained in the table above.
The Fund is actively managed and, as such, its composition may differ over time.
| | |
| The accompanying notes are an integral part of these financial statements. | | 53 |
COMMERCE KANSAS TAX-FREE INTERMEDIATE BOND FUND
Performance Summary
October 31, 2017 (Unaudited)
The following is performance information for the Commerce Kansas Tax-Free Intermediate Bond Fund (“Kansas Tax-Free Intermediate Bond Fund”) for various time periods. The returns represent past performance. Past performance is no guarantee of future results. The Fund’s investment return and principal value will fluctuate so that an investor’s shares, when redeemed, may be worth more or less than their original cost. Performance reflects expense limitations in effect. In their absence, performance would be reduced. Returns do not reflect the deduction of taxes that a shareholder would pay on Fund distributions or the redemption of Fund shares. The Fund is not subject to a sales charge, so a sales charge is not applied to its total returns. In addition to the Adviser’s decisions regarding issuer/industry investment selection and allocation, other factors may affect Fund performance. These factors include, but are not limited to, Fund operating fees and expenses, portfolio turnover, and subscription and redemption cash flows affecting the Fund. Please visit our website at www.commercefunds.com to obtain the most recent month-end returns.
| | | | | | | | |
| | Performance Review | | | | | | |
| | | November 1, 2016 - October 31, 2017 | | Fund Total Return(a) | | Index Total Return(c) | | Index |
| | | Kansas Tax-Free Intermediate Bond Fund | | 1.09% | | 2.05% | | Bloomberg Barclays 3-15 Year Blend Municipal Bond(c) |
Standardized Average Annual Total Return through September 30, 2017(b)
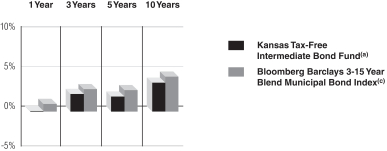
| | | | | | | | | | |
| | Standardized Average Annual Total Return through September 30, 2017(b) | | One Year | | Three Years | | Five Years | | Ten Years |
| | | Kansas Tax-Free Intermediate Bond Fund(a) | | 0.07% | | 2.22% | | 1.90% | | 3.63% |
| | | Bloomberg Barclays 3-15 Year Blend Municipal Bond Index(c) | | 0.96% | | 2.83% | | 2.71% | | 4.42% |
Kansas Tax-Free Intermediate Bond Fund Lifetime Performance
Performance of a $10,000 Investment, with distributions reinvested, from November 1, 2007 through October 31, 2017.

| | | | | | | | | | |
| | Average Annual Total Return through October 31, 2017 | | One Year | | Three Years | | Five Years | | Ten Years |
| | | Kansas Tax-Free Intermediate Bond Fund(a) | | 1.09% | | 2.13% | | 1.94% | | 3.62% |
| | | | | | |
| | Expense Ratios(d) | | | | |
| | | | | Net Expense Ratio (Current) | | Gross Expense Ratio (Before Reimbursements) |
| | | Kansas Tax-Free Intermediate Bond Fund | | 0.71% | | 0.82% |
| (a) | | Returns reflect any fee waivers or expense reductions. Returns do not reflect the deduction of taxes that a shareholder would pay on capital gains or other taxable distributions or the redemption of Fund shares. |
| (b) | | The Standardized Average Annual Total Returns are average annual total returns as of the most recent calendar quarter-end. They assume reinvestment of all distributions at NAV. Current performance may be lower or higher than the total return figures in the above charts. |
Returns reflect any fee waivers and expense reductions. Absent these waivers and reductions, returns would have been lower. Returns do not reflect the deduction of taxes that a shareholder would pay on capital gains or other taxable distributions or the redemption of Fund shares.
| (c) | | The Bloomberg Barclays 3-15 Year Blend Municipal Bond Index is an unmanaged index comprised of investment-grade municipal securities ranging from 2 to 17 years in maturity. The Index figures do not reflect any deduction for fees, taxes or expenses. |
| (d) | | The Fund’s expense ratios, both net (net of applicable fee waivers and/or expense reimbursements) and gross (before applicable fee waivers and/or expense reimbursements), set forth above are as of the most recent publicly available prospectus (March 1, 2017) for the Fund and may differ from the expense ratios disclosed in the Financial Highlights in this report. The Adviser has contractually agreed to reduce or limit the Total Annual Fund Operating Expenses, excluding interest, taxes, acquired fund fees and expenses and extraordinary expenses. This agreement will remain in place through March 1, 2018. After this date, the Adviser or the Fund may terminate the contractual arrangement. If this occurs, the expense ratios may change without shareholder approval. |
54
COMMERCE KANSAS TAX-FREE INTERMEDIATE BOND FUND
Schedule of Investments
October 31, 2017
| | | | | | | | | | |
Principal
Amount | | Interest
Rate | | | Maturity
Date | | Value | |
| Municipal Bond Obligations – 95.1% | |
Alabama(a) – 1.3% | |
| City of Jasper AL GO Bonds (Warrants) Series 2017 (NR/A2) | |
| $ 745,000 | | | 4.000 | % | | 05/01/29 | | $ | 815,194 | |
| Homewood AL Educational Building Authority Revenue Bonds (Refunding Educational Facilities Samford University) Series A (NR/A3) | |
| 1,000,000 | | | 4.000 | | | 12/01/35 | | | 1,041,210 | |
| | | | | | | | | | |
| | | | | | | | | 1,856,404 | |
| |
Arizona(a) – 0.3% | |
| Arizona Healthcare & Education Facilities Authority Revenue Bonds (Kirksville College) (A-/NR) | |
| 450,000 | | | 5.000 | | | 01/01/25 | | | 480,218 | |
| |
California(b) – 1.8% | |
| Burbank CA Unified School District GO Bonds Capital Appreciation Election of 1997 Series C (NPFG) (FGIC) (AA-/A3) | |
| 670,000 | | | 0.000 | | | 07/01/27 | | | 523,478 | |
| San Marcos Unified School District GO Bonds (Capital Appreciation) (AA-/Aa3) | |
| 2,275,000 | | | 0.000 | | | 08/01/24 | | | 1,982,526 | |
| | | | | | | | | | |
| | | | | | | | | 2,506,004 | |
| |
Illinois – 1.3% | |
| Illinois Finance Authority Revenue Bonds (OSF Healthcare System) Series 2016 (A/A2)(a) | |
| 1,500,000 | | | 3.250 | | | 05/15/39 | | | 1,350,600 | |
| Will County IL Community Unit School District No. 201 Crete-Monee GO Bonds (Capital Appreciation) Series 2004 (NPFG) (FGIC) (A+/A3)(b) | |
| 470,000 | | | 0.000 | | | 11/01/19 | | | 452,939 | |
| Will County IL Community Unit School District No. 201 Crete-Monee GO Bonds (Capital Appreciation) Series 2004 (NPFG) (FGIC) (A/A3)(b) | |
| 30,000 | | | 0.000 | | | 11/01/19 | | | 29,263 | |
| | | | | | | | | | |
| | | | | | | | | 1,832,802 | |
| |
Kansas – 80.7% | |
| Allen County KS Public Building Community Revenue Bonds (Allen County Hospital Project) Series 2012 (A/NR)(a) | |
| 1,090,000 | | | 5.000 | | | 12/01/27 | | | 1,221,683 | |
| 1,140,000 | | | 5.000 | | | 12/01/28 | | | 1,267,190 | |
| 1,195,000 | | | 5.000 | | | 12/01/29 | | | 1,318,133 | |
| Blue Valley KS Recreation Commission Certificates of Participation (Recreation Facilities) (AGM) (AA/Aa2)(a) | |
| 800,000 | | | 4.000 | | | 10/01/27 | | | 888,088 | |
| Bourbon County KS Unified School District No. 234-Fort Scott GO Bonds Series 2014 (A/NR) | |
| 900,000 | | | 5.000 | | | 09/01/23 | | | 1,050,570 | |
| Butler County KS Unified School District No. 385 GO Bonds (Refunding-School Building) Series 2017 (AA-/Aa3)(a) | |
| 1,000,000 | | | 4.000 | | | 09/01/30 | | | 1,109,730 | |
| 500,000 | | | 4.000 | | | 09/01/31 | | | 552,140 | |
| |
| | | | | | | | | | |
Principal
Amount | | Interest
Rate | | | Maturity
Date | | Value | |
| Municipal Bond Obligations – (continued) | |
Kansas – (continued) | |
| Butler County KS Unified School District No. 490 GO Bonds (Refunding-School Building) Series A (AA-/NR) | |
| $ 500,000 | | | 5.000 | % | | 09/01/18 | | $ | 516,070 | |
| Chisholm Creek Utility Authority KS Water and Wastewater Facilities Revenue Bonds (Refunding — Bel Aire & Park City Project) Series 2017 (AGM) (AA/NR) | |
| 1,315,000 | | | 5.000 | | | 09/01/26 | | | 1,597,238 | |
| 1,305,000 | | | 4.000 | (a) | | 09/01/28 | | | 1,460,151 | |
| Chisholm Creek Utility Authority KS Water and Wastewater Facilities Revenue Bonds (Refunding) (AMBAC) (NR/WR) | |
| 1,000,000 | | | 5.250 | | | 09/01/24 | | | 1,147,970 | |
| City of Abilene KS Public Building Commission Revenue Bonds Series 2011 (AA-/NR)(a) | |
| 595,000 | | | 4.150 | | | 12/01/27 | | | 621,930 | |
| City of Manhattan KS Hospital Revenue Bonds (Refunding-Mercy Regional Hospital Center, Inc.) Series 2013 (A+/NR)(a) | |
| 2,000,000 | | | 5.000 | | | 11/15/29 | | | 2,226,640 | |
| City of McPherson KS Water System Revenue Bonds Series 2012 (Refunding) (A+/NR) | |
| 500,000 | | | 3.000 | | | 10/01/18 | | | 508,155 | |
| 655,000 | | | 4.000 | | | 10/01/19 | | | 688,569 | |
| County of Shawnee KS Certificates of Participation First Responders Communications Projects Series 2012 (NR/Aa2)(a) | |
| 1,145,000 | | | 4.000 | | | 09/01/26 | | | 1,200,590 | |
| Cowley County KS Unified School District No. 470 Arkansas City GO Bonds (Refunding) (A/NR)(a) | |
| 235,000 | | | 4.000 | | | 09/01/18 | | | 235,529 | |
| Dodge City KS Revenue Bonds (Refunding & Improvement) Series B (A+/NR) | |
| 1,815,000 | | | 4.000 | | | 09/01/20 | | | 1,942,340 | |
| Finney County Unified School District No. 457 GO Bonds (Refunding) Series A (A+/NR)(a) | |
| 1,530,000 | | | 4.000 | | | 09/01/30 | | | 1,666,461 | |
| Franklin County KS Unified School District No. 290 GO Bonds Series A (NR/A1)(a) | |
| 1,720,000 | | | 5.000 | | | 09/01/32 | | | 2,010,697 | |
| 750,000 | | | 5.000 | | | 09/01/40 | | | 860,160 | |
| Geary Country KS GO Bonds (Refunding) Series 2016 (A/NR)(a) | |
| 1,000,000 | | | 4.000 | | | 09/01/29 | | | 1,099,030 | |
| Johnson & Miami County KS Unified School District No. 230 GO Bonds (Refunding) Series 2016 (NR/Aa3) | |
| 1,000,000 | | | 3.000 | | | 09/01/18 | | | 1,015,660 | |
| 1,000,000 | | | 5.000 | | | 09/01/26 | | | 1,219,090 | |
| 1,000,000 | | | 3.500 | (a) | | 09/01/30 | | | 1,049,600 | |
| Johnson & Miami County KS Unified School District No. 230 GO Bonds Series B (NR/Aa3)(a) | |
| 1,000,000 | | | 4.000 | | | 09/01/33 | | | 1,078,650 | |
| Johnson County KS Park & Recreation District Certificates of Participation Series A (NR/Aa2)(a) | |
| 1,000,000 | | | 4.000 | | | 09/01/23 | | | 1,099,380 | |
| |
| | |
| The accompanying notes are an integral part of these financial statements. | | 55 |
COMMERCE KANSAS TAX-FREE INTERMEDIATE BOND FUND
Schedule of Investments (continued)
October 31, 2017
| | | | | | | | | | |
Principal
Amount | | Interest
Rate | | | Maturity
Date | | Value | |
| Municipal Bond Obligations – (continued) | |
Kansas – (continued) | |
| Johnson County KS Public Building Commission Lease Purchase Revenue Bonds (Refunding) Series C (AAA/Aaa) | |
| $ 750,000 | | | 4.000 | % | | 09/01/18 | | $ | 768,300 | |
| 500,000 | | | 4.000 | | | 09/01/20 | | | 538,985 | |
| Johnson County KS Unified School District No. 229 GO Bonds Series A (AA+/Aaa)(a) | |
| 945,000 | | | 4.000 | | | 10/01/23 | | | 994,357 | |
| Johnson County KS Unified School District No. 231 GO Bonds (Improvement) Series 2013-A (AA-/NR) | |
| 2,395,000 | | | 5.000 | | | 10/01/22 | | | 2,775,853 | |
| Johnson County KS Unified School District No. 231 GO Bonds (Refunding & Improvement) Series A (AA-/NR)(a) | |
| 1,500,000 | | | 4.000 | | | 10/01/36 | | | 1,598,400 | |
| Johnson County KS Unified School District No. 233 GO Bonds (Refunding & Improvement) Series C (AA/Aa2)(a) | |
| 500,000 | | | 5.000 | | | 09/01/27 | | | 565,495 | |
| Johnson County KS Unified School District No. 233 GO Bonds (Refunding) Series B (AA/Aa2)(a) | |
| 1,000,000 | | | 4.000 | | | 09/01/31 | | | 1,092,460 | |
| Johnson County KS Unified School District No. 233 GO Bonds (Refunding) Series C (AA/Aa2)(a) | |
| 1,000,000 | | | 4.000 | | | 09/01/29 | | | 1,108,130 | |
| Johnson County KS Unified School District No. 512 Shawnee Mission GO Bonds (Refunding) Series A (NR/Aaa)(a) | |
| 1,000,000 | | | 4.000 | | | 10/01/35 | | | 1,079,470 | |
| Junction City KS GO Bonds (Refunding Water & Sewer System) Series B (A+/NR)(a) | |
| 825,000 | | | 5.500 | | | 09/01/36 | | | 928,991 | |
| Junction City KS GO Bonds (Refunding) Series A (A+/NR) | |
| 560,000 | | | 5.000 | | | 09/01/18 | | | 577,573 | |
| 600,000 | | | 5.000 | (a) | | 09/01/33 | | | 665,808 | |
| 600,000 | | | 5.000 | (a) | | 09/01/34 | | | 664,638 | |
| Kansas Development Finance Authority Hospital Revenue Bonds (Refunding-Adventist Health Sunbelt Obligation Group) Series A (AA/Aa2)(a) | |
| 1,500,000 | | | 5.000 | | | 11/15/32 | | | 1,684,350 | |
| Kansas Development Finance Authority Revenue Bonds (Prerefunded-Sister Leavenworth) Series A (NR/NR)(a)(c) | |
| 2,900,000 | | | 5.250 | | | 01/01/20 | | | 3,150,096 | |
| Kansas Development Finance Authority Revenue Bonds (Unrefunded-Sister Leavenworth) Series A (AA-/Aa3)(a) | |
| 440,000 | | | 5.250 | | | 01/01/25 | | | 475,116 | |
| Kansas Development Finance Authority Revenue Bonds (Wichita University Project) Series A (NR/Aa3)(a) | |
| 525,000 | | | 3.000 | | | 06/01/23 | | | 539,873 | |
| Kansas Development Finance Authority Revenue Bonds (Wichita University Union Corporation Student Housing Project) Series F-1 (NR/Aa3)(a) | |
| 1,000,000 | | | 5.000 | | | 06/01/24 | | | 1,115,630 | |
| 790,000 | | | 5.250 | | | 06/01/42 | | | 873,945 | |
| Kansas Power Pool Electric Utility Revenue Bonds (Dogwood Energy Facilities) Series A (NR/A3) | |
| 500,000 | | | 5.000 | | | 12/01/19 | | | 536,455 | |
| |
| | | | | | | | | | |
Principal
Amount | | Interest
Rate | | | Maturity
Date | | Value | |
| Municipal Bond Obligations – (continued) | |
Kansas – (continued) | |
| Kansas State Department of Transportation Highway Revenue Bonds Series 2015 (AAA/Aa2)(a) | |
| $1,250,000 | | | 5.000 | % | | 09/01/29 | | $ | 1,506,450 | |
| 1,110,000 | | | 5.000 | | | 09/01/34 | | | 1,308,801 | |
| Kansas State Development Finance Authority Health Facilities Revenue Bonds (Hays Medical Center, Inc.) Series Q (NR/WR)(a)(c) | |
| 750,000 | | | 5.000 | | | 05/15/19 | | | 793,718 | |
| Kansas State Development Finance Authority Health Facilities Revenue Bonds (Stormont-Vail Healthcare) Series F (NR/A2)(a) | |
| 1,465,000 | | | 5.000 | | | 11/15/23 | | | 1,573,146 | |
| Kansas State Development Finance Authority Hospital Revenue Bonds (Adventist Health) (AA/Aa2)(a) | |
| 1,000,000 | | | 5.500 | | | 11/15/23 | | | 1,089,400 | |
| Kansas State Development Finance Authority Hospital Revenue Bonds (Adventist Health) Series D (AA/Aa2)(a)(c) | |
| 800,000 | | | 5.000 | | | 11/15/17 | | | 801,160 | |
| Kansas State Development Finance Authority Revenue Bonds (Department of Commerce) Series K (A+/A1)(a) | |
| 2,000,000 | | | 3.500 | | | 06/01/23 | | | 2,067,020 | |
| Kansas State Development Finance Authority Revenue Bonds (Health Facilities) Series F (NR/A2)(a) | |
| 1,000,000 | | | 5.000 | | | 11/15/26 | | | 1,068,950 | |
| Kansas State Development Finance Authority Revenue Bonds (Kansas Project) Series M-1 (A+/Aa3)(a) | |
| 1,500,000 | | | 5.000 | | | 11/01/20 | | | 1,609,995 | |
| 2,000,000 | | | 5.000 | | | 11/01/27 | | | 2,142,960 | |
| Kansas State Development Finance Authority Revenue Bonds (Kansas State Projects) Series E-1 (A+/Aa3)(a) | |
| 700,000 | | | 5.000 | | | 11/01/22 | | | 773,934 | |
| Kansas State Development Finance Authority Revenue Bonds (University Projects) Series A (A+/Aa2)(a) | |
| 2,000,000 | | | 4.000 | | | 03/01/31 | | | 2,144,280 | |
| Kansas State Development Finance Authority Revenue Bonds Series G (A+/Aa3)(a) | |
| 1,000,000 | | | 5.000 | | | 04/01/30 | | | 1,138,870 | |
| Leavenworth County KS Unified School District No. 453 GO Bonds (Refunding & Improvement) Series A (AGC) (NR/Aa3)(a)(c) | |
| 1,455,000 | | | 5.250 | | | 09/01/19 | | | 1,557,505 | |
| Leavenworth County KS Unified School District No. 458 GO Bonds (Refunding & Improvement) Series A (NR/Aa3)(a)(c) | |
| 1,415,000 | | | 5.250 | | | 09/01/19 | | | 1,520,035 | |
| Leavenworth County KS Unified School District No. 464 GO Bonds (Refunding & Improvement) Series B (NR/A1)(a) | |
| 500,000 | | | 4.000 | | | 09/01/26 | | | 538,400 | |
| Lyons KS Public Building Commission Revenue Bonds (A+/NR)(a) | |
| 315,000 | | | 5.000 | | | 10/01/23 | | | 323,133 | |
| Newton KS GO Bonds (Refunding) Series A (AA-/NR)(a) | |
| 1,555,000 | | | 3.000 | | | 09/01/27 | | | 1,604,589 | |
| 1,180,000 | | | 3.000 | | | 09/01/28 | | | 1,205,995 | |
| |
| | |
| 56 | | The accompanying notes are an integral part of these financial statements. |
COMMERCE KANSAS TAX-FREE INTERMEDIATE BOND FUND
| | | | | | | | | | |
Principal
Amount | | Interest
Rate | | | Maturity
Date | | Value | |
| Municipal Bond Obligations – (continued) | |
Kansas – (continued) | |
| Overland Park KS GO Bonds (Internal Improvement) Series A (AAA/Aaa) | |
| $1,070,000 | | | 3.000 | % | | 09/01/19 | | $ | 1,106,145 | |
| Pratt County KS Public Building Commission Revenue Bonds (AA-/NR) | |
| 300,000 | | | 5.000 | | | 12/01/19 | | | 322,515 | |
| 400,000 | | | 5.000 | | | 12/01/20 | | | 442,372 | |
| Reno County KS Unified School District No. 313 GO Bonds Series A (NR/A2)(a) | |
| 1,930,000 | | | 4.000 | | | 09/01/26 | | | 2,080,057 | |
| Riley County KS Unified School District No. 383 GO Bonds (Refunding) Series 2016 (NR/Aa2)(a) | |
| 2,000,000 | | | 3.000 | | | 09/01/30 | | | 2,017,000 | |
| Sedgwick County KS Public Building Commission Revenue Bonds (Technical Education Complex Project) Series 2008-1 (NR/Aaa)(a) | |
| 1,000,000 | | | 5.250 | | | 08/01/26 | | | 1,029,260 | |
| Sedgwick County KS Unified School District No. 260 GO Bonds (Refunding) Series 2016 (NR/Aa3) | |
| 1,000,000 | | | 4.000 | | | 10/01/30 | | | 1,113,200 | |
| 1,000,000 | | | 4.000 | | | 10/01/31 | | | 1,113,050 | |
| Sedgwick County KS Unified School District No. 261 GO Bonds (Unrefunded-Refunding & School Improvement) Series 2007 (AGM) (AA/NR)(a) | |
| 25,000 | | | 5.000 | | | 11/01/32 | | | 25,080 | |
| Sedgwick County KS Unified School District No. 261 GO Bonds Series 2016 (NR/Aa3)(a) | |
| 985,000 | | | 3.000 | | | 11/01/32 | | | 966,295 | |
| Sedgwick County KS Unified School District No. 262 GO Bonds (Refunding) Series 2015 (A+/NR)(a) | |
| 800,000 | | | 4.000 | | | 09/01/25 | | | 892,992 | |
| 1,500,000 | | | 4.000 | | | 09/01/26 | | | 1,662,300 | |
| Sedgwick County KS Unified School District No. 262 GO Bonds Series 2016 (A+/NR)(a) | |
| 1,425,000 | | | 5.000 | | | 09/01/34 | | | 1,645,433 | |
| Sedgwick County KS Unified School District No. 265 GO Bonds (Refunding) Series B (NR/Aa3)(a) | |
| 1,300,000 | | | 4.000 | | | 10/01/29 | | | 1,448,330 | |
| Seward County KS Unified School District No. 480 GO Bonds (Refunding & Improvement) (A+/A1)(a) | |
| 1,000,000 | | | 5.000 | | | 09/01/23 | | | 1,154,400 | |
| Shawnee County KS Certificates of Participation (Refunding) Series B (NR/Aa2) | |
| 845,000 | | | 3.000 | | | 09/01/20 | | | 878,318 | |
| Shawnee County KS Certificates of Participation Health Agency Parks & Recreation Projects (NR/Aa2) | |
| 200,000 | | | 3.750 | | | 09/01/18 | | | 204,434 | |
| Shawnee County KS Certificates of Participation Series 2015 (NR/Aa2)(a) | |
| 485,000 | | | 4.000 | | | 09/01/30 | | | 527,079 | |
| 1,000,000 | | | 4.000 | | | 09/01/31 | | | 1,082,360 | |
| 1,065,000 | | | 5.000 | | | 09/01/32 | | | 1,244,996 | |
| |
| | | | | | | | | | |
Principal
Amount | | Interest
Rate | | | Maturity
Date | | Value | |
| Municipal Bond Obligations – (continued) | |
Kansas – (continued) | |
| Shawnee County KS GO Bonds (Refunding) Series 2015 (NR/Aa1) | |
| $ 435,000 | | | 3.000 | % | | 09/01/22 | | $ | 463,823 | |
| 450,000 | | | 3.000 | | | 09/01/23 | | | 478,985 | |
| 490,000 | | | 3.000 | | | 09/01/25 | | | 519,498 | |
| Shawnee County KS Unified School District No. 345 Seaman GO Bonds (Commercial Mortgage Backed Securities-Refunding-Improvement) Series A (NR/Aa3)(a)(b) | |
| 2,000,000 | | | 0.000 | | | 09/01/23 | | | 1,783,120 | |
| Topeka KS Public Building Commission Revenue Bonds (Refunding 10th & Jackson Project) Series A (NPFG) (A+/A3)(a) | |
| 1,000,000 | | | 5.000 | | | 06/01/23 | | | 1,041,890 | |
| Topeka KS Public Building Commission Revenue Bonds (Refunding Department of Social and Rehabilitation Project) Series B (NPFG) (A+/A3)(a) | |
| 300,000 | | | 5.000 | | | 06/01/23 | | | 312,567 | |
| 475,000 | | | 5.000 | | | 06/01/24 | | | 494,869 | |
| Washburn University KS Revenue Bonds Series 2014 (Refunding) (NR/A1) | |
| 435,000 | | | 3.000 | | | 07/01/20 | | | 453,949 | |
| 460,000 | | | 3.000 | | | 07/01/22 | | | 491,390 | |
| Wichita KS Airport Authority Airport Facilities Revenue Bonds (Flightsafety International) Series A (NR/Aa2)(a) | |
| 2,000,000 | | | 0.930 | | | 11/01/31 | | | 2,000,000 | |
| Wichita KS GO Bonds (AMT-Airport) Series C (AA+/Aa1) | |
| 590,000 | | | 5.000 | | | 12/01/25 | | | 719,977 | |
| Wichita KS GO Bonds Series B (AMT) (AA+/Aa1)(a) | |
| 940,000 | | | 4.000 | | | 12/01/42 | | | 976,369 | |
| Wichita KS Water & Sewer Utility Revenue Bonds (Refunding) Series B (AA-/NR)(a) | |
| 415,000 | | | 4.000 | | | 10/01/26 | | | 463,792 | |
| Wyandotte County Kansas City KS Unified Government Utility System Revenue Bonds (Public Utilities) Series A (A+/A3)(a) | |
| 525,000 | | | 5.000 | | | 09/01/28 | | | 599,246 | |
| Wyandotte County Kansas City KS Unified Government Utility System Revenue Bonds Series A (BHAC) (AA+/Aa1)(a)(c) | |
| 1,000,000 | | | 5.000 | | | 03/01/19 | | | 1,051,360 | |
| Wyandotte County KS School District No. 500 GO Bonds (Refunding) (AA-/Aa2) | |
| 1,405,000 | | | 4.000 | | | 09/01/20 | | | 1,520,280 | |
| Wyandotte County KS Unified Government Utility System (Refunding & Improvement) Revenue Bonds Series 2011-A (A+/NR) | |
| 1,400,000 | | | 5.000 | | | 09/01/20 | | | 1,540,602 | |
| Wyandotte County-Kansas City Unified Government Special Obligation Revenue Bonds (Refunding-Sales Tax-KS International Speedway Corp. Project) Series 2014 (A+/NR) | |
| 400,000 | | | 5.000 | | | 12/01/17 | | | 401,264 | |
| | | | | | | | | | |
| | | | | | | | | 113,422,307 | |
| |
| | |
| The accompanying notes are an integral part of these financial statements. | | 57 |
COMMERCE KANSAS TAX-FREE INTERMEDIATE BOND FUND
Schedule of Investments (continued)
October 31, 2017
| | | | | | | | | | |
Principal
Amount | | Interest
Rate | | | Maturity
Date | | Value | |
| Municipal Bond Obligations – (continued) | |
Louisiana(a)(c) – 1.6% | |
| Louisiana Local Government Environmental Facilities & Community Development Authority Revenue Bonds (Woman’s Hospital Foundation) Series A (A/A2) | |
| $2,000,000 | | | 5.500 | % | | 10/01/20 | | $ | 2,240,620 | |
| |
Maryland(a) – 0.9% | |
| Montgomery County MD Housing Opportunities Commission Manufacturing & Reconstruction Development Revenue Bonds Series A-1 (FHLMC) (NR/Aaa) | |
| 1,285,000 | | | 4.000 | | | 07/01/45 | | | 1,318,847 | |
| |
Massachusetts(a) – 0.1% | |
| Massachusetts Educational Financing Authority Education Loan Revenue Bonds (Issue I) Series A (AA/NR) | |
| 180,000 | | | 5.300 | | | 01/01/30 | | | 188,681 | |
| |
Michigan(a) – 1.9% | |
| Michigan State Housing Development Authority Revenue Bonds (Non-AMT) (Non-ACE) Series B (AA+/Aa2) | |
| 1,000,000 | | | 3.350 | | | 12/01/34 | | | 990,340 | |
| Michigan State Housing Development Authority, SF Mortgage Revenue Bonds (Non-ACE) Series B (AA+/Aa2) | |
| 1,665,000 | | | 2.900 | | | 06/01/28 | | | 1,666,415 | |
| | | | | | | | | | |
| | | | | | | | | 2,656,755 | |
| |
New Jersey – 0.8% | |
| Union City NJ GO Bonds (Refunding) Series 2017 (NR/Baa1) | |
| 1,000,000 | | | 5.000 | | | 11/01/23 | | | 1,148,030 | |
| |
Ohio(a) – 1.0% | |
| Hamilton County OH Sales Tax Revenue Bonds (Refunding) Series A (NR/A1) | |
| 1,200,000 | | | 5.000 | | | 12/01/24 | | | 1,354,452 | |
| |
Pennsylvania(a) – 0.5% | |
| Delaware County Authority University Revenue Bonds for Neumann University (BBB/NR) | |
| 605,000 | | | 5.000 | | | 10/01/25 | | | 655,554 | |
| |
Tennessee – 0.4% | |
| Knox County Health Educational & Housing Facility Board Revenue Bonds (Refunding) (University Health Systems, Inc.) Series 2017 (BBB+/NR) | |
| 500,000 | | | 3.375 | | | 04/01/26 | | | 518,745 | |
| |
Utah(a) – 1.2% | |
| Unified Fire Service Area Local Building Authority Lease Revenue Bonds (Refunding) Series 2016 (NR/Aa2) | |
| 675,000 | | | 3.000 | | | 04/01/34 | | | 657,011 | |
| 1,000,000 | | | 3.000 | | | 04/01/35 | | | 964,350 | |
| | | | | | | | | | |
| | | | | | | | | 1,621,361 | |
| |
Washington(a) – 0.6% | |
| Washington State Health Care Facilities Authority Revenue Bonds (Overlake Hospital Medical Center) (A/A2) | |
| 750,000 | | | 5.250 | | | 07/01/25 | | | 817,747 | |
| |
| | | | | | | | | | |
Principal
Amount | | Interest
Rate | | | Maturity
Date | | Value | |
| Municipal Bond Obligations – (continued) | |
Wisconsin(a) – 0.7% | |
| Wisconsin State Health & Educational Facilities Authority Revenue Bonds (Refunding-Ascension Health Credit Group) Series A (AA+/Aa2) | |
| $1,000,000 | | | 4.000 | % | | 11/15/34 | | $ | 1,052,460 | |
| |
| TOTAL MUNICIPAL BOND OBLIGATIONS | |
(Cost $129,718,292) | | $ | 133,670,987 | |
| |
| | | | | | | | | | |
| Short-term Investment(d) – 5.6% | |
Repurchase Agreement – 5.6% | |
| Fixed Income Clearing Corp. | |
| $7,842,000 | | | 0.120 | % | | 11/01/17 | | $ | 7,842,000 | |
Maturity Value: $7,842,052 | | | | |
(Cost $7,842,000) | | | | |
| |
| TOTAL INVESTMENTS – 100.7% | |
(Cost $137,560,292) | | $ | 141,512,987 | |
| |
LIABILITIES IN EXCESS OF OTHER ASSETS – (0.7)% | | | (957,676) | |
| |
NET ASSETS – 100.0% | | $ | 140,555,311 | |
| |
| | |
| The percentage shown for each investment category reflects the value of investments in that category as a percentage of net assets. |
| |
| (a) | | Security with “Call” features with resetting interest rates. Maturity dates disclosed are the final maturity dates. |
| (b) | | Security issued with a zero coupon. The actual effective yield of this security is different than the stated coupon due to the accretion of discount. |
| (c) | | Prerefunded security. Maturity date disclosed is prerefunding date. |
| (d) | | Repurchase agreement was entered into on October 31, 2017. This agreement was fully collateralized by $7,905,000 U.S. Treasury Bond, 2.875%, due 11/15/46 with a market value of $8,001,623. |
| Security ratings disclosed, if any, are issued by Standard & Poor’s Ratings Services/Moody’s Investors Service and are unaudited. A description of the ratings is available in the Fund’s Statement of Additional Information. |
| | |
|
| Investment Abbreviations: |
| AGC | | —Insured by Assured Guaranty Corp. |
| AGM | | —Insured by Assured Guaranty Municipal Corp. |
| AMBAC | | —Insured by American Municipal Bond Assurance Corp. |
| AMT | | —Alternative Minimum Tax |
| BHAC | | —Berkshire Hathaway Assurance Corp. |
| FGIC | | —Insured by Financial Guaranty Insurance Co. |
| FHLMC | | —Federal Home Loan Mortgage Corp. |
| GO | | —General Obligation |
| NR | | —Not Rated |
| NPFG | | —National Public Finance Guarantee. |
| WR | | —Withdrawn Rating. |
|
| | |
| 58 | | The accompanying notes are an integral part of these financial statements. |
COMMERCE KANSAS TAX-FREE INTERMEDIATE BOND FUND
PORTFOLIO COMPOSITION
| | | | | | | | |
| | | AS OF
10/31/2017 | | | AS OF
10/31/2016 | |
| |
General Obligation | | | 41.1 | % | | | 40.0 | % |
Lease | | | 13.1 | | | | 15.7 | |
Hospital | | | 11.1 | | | | 14.4 | |
Prerefunded/Escrow to Maturity | | | 8.9 | | | | 8.9 | |
Repurchase Agreement | | | 5.6 | | | | 0.5 | |
Education | | | 5.5 | | | | 5.0 | |
Water/Sewer | | | 4.6 | | | | 2.4 | |
Transportation | | | 3.4 | | | | 3.3 | |
Limited Tax | | | 1.9 | | | | 2.0 | |
Single Family Housing | | | 1.9 | | | | 0.9 | |
Power | | | 1.5 | | | | 1.6 | |
Crossover | | | 1.1 | | | | 1.3 | |
Multi Family Housing | | | 0.9 | | | | 1.0 | |
Student | | | 0.1 | | | | 0.2 | |
Investment Company | | | — | | | | 2.1 | |
| |
| TOTAL INVESTMENTS | | | 100.7 | % | | | 99.3 | % |
| |
The percentage shown for each investment category reflects the value of investments in that category as a percentage of net assets. Underlying investment categories of investment companies held by the Fund are not reflected in the table above. Consequently, the Fund’s overall investment category allocations may differ from the percentages contained in the table above.
The Fund is actively managed and, as such, its composition may differ over time.
| | |
| The accompanying notes are an integral part of these financial statements. | | 59 |
COMMERCE FUNDS
Statements of Assets and Liabilities
October 31, 2017
| | | | | | | | | | | | |
| | | Growth Fund | | | Value Fund | | |
MidCap
Growth Fund | |
Assets: | | | | | | | | | | | | |
Investments at value (identified cost $85,463,029, $221,857,411, $123,750,726, $1,043,162,374, $98,011,071, $331,767,205, $336,837,641 and $137,560,292, respectively) | | $ | 117,243,028 | | | $ | 253,272,525 | | | $ | 150,612,874 | |
Cash | | | 339 | | | | — | | | | 277 | |
Receivables: | | | | | | | | | | | | |
Interest and dividends | | | 43,302 | | | | 380,664 | | | | 23,118 | |
Investments sold | | | — | | | | 1,195,789 | | | | — | |
Fund shares sold | | | 188,799 | | | | 140,624 | | | | 293,010 | |
Reimbursement from adviser | | | — | | | | 29,058 | | | | — | |
Other | | | 1,886 | | | | 6,155 | | | | 2,369 | |
Total Assets | | | 117,477,354 | | | | 255,024,815 | | | | 150,931,648 | |
|
| |
Liabilities: | | | | | | | | | | | | |
Due to custodian | | | — | | | | 360,883 | | | | — | |
Payables: | | | | | | | | | | | | |
Investments purchased | | | — | | | | — | | | | — | |
Fund shares redeemed | | | 12,707 | | | | 3,729,222 | | | | 238,508 | |
Dividends | | | — | | | | — | | | | — | |
Advisory fees | | | 39,068 | | | | 66,127 | | | | 63,368 | |
Deferred trustee fees | | | 42,949 | | | | 51,397 | | | | 26,433 | |
Administrative fees | | | 14,162 | | | | 31,961 | | | | 18,377 | |
Accrued expenses | | | 67,662 | | | | 30,279 | | | | 46,120 | |
Total Liabilities | | | 176,548 | | | | 4,269,869 | | | | 392,806 | |
| | | |
| | | | | | | | | | | | |
Net Assets: | | | | | | | | | | | | |
Paid-in capital | | | 79,029,546 | | | | 195,266,282 | | | | 113,523,999 | |
Undistributed (distributions in excess of) net investment income | | | 792,301 | | | | 281,449 | | | | 596,718 | |
Accumulated net realized gain (loss) | | | 5,698,960 | | | | 23,792,101 | | | | 9,555,977 | |
Net unrealized gain on investments | | | 31,779,999 | | | | 31,415,114 | | | | 26,862,148 | |
Net Assets | | $ | 117,300,806 | | | $ | 250,754,946 | | | $ | 150,538,842 | |
| | | |
| | | | | | | | | | | | |
Shares Outstanding/Net Asset Value | | | | | | | | | | | | |
Total shares outstanding, no par value (unlimited number of shares authorized): | | | 3,532,206 | | | | 7,594,645 | | | | 3,721,041 | |
Net asset value (net assets/shares outstanding) | | $ | 33.21 | | | $ | 33.02 | | | $ | 40.46 | |
| | |
| 60 | | The accompanying notes are an integral part of these financial statements. |
COMMERCE FUNDS
| | | | | | | | | | | | | | | | | | |
| Bond Fund | | | Short-Term
Government
Fund | | | National
Tax-Free
Intermediate
Bond Fund | | | Missouri
Tax-Free
Intermediate
Bond Fund | | | Kansas
Tax-Free
Intermediate
Bond Fund | |
| | | | | | | | | | | | | | | | | | |
| | | | |
| $ | 1,075,926,975 | | | $ | 98,756,075 | | | $ | 340,047,243 | | | $ | 346,726,396 | | | $ | 141,512,987 | |
| | 706 | | | | 956 | | | | 105 | | | | 162 | | | | 82 | |
| | | | | | | | | | | | | | | | | | |
| | 6,913,440 | | | | 331,190 | | | | 3,682,471 | | | | 3,260,991 | | | | 1,341,750 | |
| | 1,646,200 | | | | — | | | | — | | | | — | | | | — | |
| | 994,069 | | | | 160,257 | | | | 177,031 | | | | 183,525 | | | | 217,440 | |
| | — | | | | 20,042 | | | | — | | | | — | | | | 14,562 | |
| | 20,466 | | | | 1,956 | | | | 6,026 | | | | 6,307 | | | | 2,497 | |
| | 1,085,501,856 | | | | 99,270,476 | | | | 343,912,876 | | | | 350,177,381 | | | | 143,089,318 | |
| | | | |
| | | | | | | | | | | | | | | | | | |
| | | | | | | | | | | | | | | | | | |
| | — | | | | — | | | | — | | | | — | | | | — | |
| | | | | | | | | | | | | | | | | | |
| | 2,578,038 | | | | — | | | | 4,328,038 | | | | 3,965,660 | | | | 1,665,000 | |
| | 1,515,697 | | | | 19,427 | | | | 291,572 | | | | 973,045 | | | | 452,901 | |
| | 2,124,349 | | | | 82,466 | | | | 557,690 | | | | 608,688 | | | | 221,293 | |
| | 338,557 | | | | 41,873 | | | | 101,698 | | | | 103,045 | | | | 54,382 | |
| | 263,440 | | | | 44,914 | | | | 79,026 | | | | 91,592 | | | | 33,864 | |
| | 132,325 | | | | 12,143 | | | | 41,744 | | | | 42,525 | | | | 17,252 | |
| | 231,452 | | | | 58,213 | | | | 96,631 | | | | 101,597 | | | | 89,315 | |
| | 7,183,858 | | | | 259,036 | | | | 5,496,399 | | | | 5,886,152 | | | | 2,534,007 | |
| | | | |
| | | | | | | | | | | | | | | | | | |
| | | | | | | | | | | | | | | | | | |
| | 1,050,891,791 | | | | 103,279,734 | | | | 329,205,546 | | | | 338,449,860 | | | | 137,205,953 | |
| | (2,983,244 | ) | | | (530,094 | ) | | | 397,583 | | | | 132,432 | | | | 44,075 | |
| | (2,355,150 | ) | | | (4,483,204 | ) | | | 533,310 | | | | (4,179,818 | ) | | | (647,412 | ) |
| | 32,764,601 | | | | 745,004 | | | | 8,280,038 | | | | 9,888,755 | | | | 3,952,695 | |
| $ | 1,078,317,998 | | | $ | 99,011,440 | | | $ | 338,416,477 | | | $ | 344,291,229 | | | $ | 140,555,311 | |
| | | | |
| | | | | | | | | | | | | | | | | | |
| | | | | | | | | | |
| | 53,816,029 | | | | 5,788,378 | | | | 17,236,792 | | | | 17,640,660 | | | | 7,263,067 | |
| $ | 20.04 | | | $ | 17.11 | | | $ | 19.63 | | | $ | 19.52 | | | $ | 19.35 | |
| | |
| The accompanying notes are an integral part of these financial statements. | | 61 |
COMMERCE FUNDS
Statements of Operations
For the Fiscal Year Ended October 31, 2017
| | | | | | | | | | | | |
| | | Growth Fund | | | Value Fund | | |
MidCap
Growth Fund | |
Investment Income: | |
Interest | | $ | 853 | | | $ | 1,261 | | | $ | 1,750 | |
Dividends | | | 1,641,755 | | | | 9,638,207 | | | | 1,764,269 | |
Total Investment Income | | | 1,642,608 | | | | 9,639,468 | | | | 1,766,019 | |
| | | |
| | | | | | | | | | | | |
Expenses: | |
Advisory fees | | | 411,367 | | | | 842,225 | | | | 646,261 | |
Administration fees | | | 149,120 | | | | 407,075 | | | | 187,416 | |
Custody and accounting fees | | | 72,504 | | | | 88,263 | | | | 72,060 | |
Transfer Agent fees | | | 58,929 | | | | 238,979 | | | | 46,195 | |
Professional fees | | | 37,508 | | | | 56,960 | | | | 38,840 | |
Shareowner servicing fees | | | 21,597 | | | | 309,761 | | | | 3,894 | |
Registration fees | | | 21,091 | | | | 51,076 | | | | 22,299 | |
Printing and mailing fees | | | 8,859 | | | | 45,601 | | | | 10,819 | |
Trustee fees | | | 6,815 | | | | 18,908 | | | | 8,521 | |
Other | | | 17,070 | | | | 28,702 | | | | 18,146 | |
Total Expenses | | | 804,860 | | | | 2,087,550 | | | | 1,054,451 | |
Less — expense reductions | | | — | | | | (122,150 | ) | | | — | |
Net Expenses | | | 804,860 | | | | 1,965,400 | | | | 1,054,451 | |
| Net Investment Income | | $ | 837,748 | | | $ | 7,674,068 | | | $ | 711,568 | |
| | | |
| | | | | | | | | | | | |
Realized and unrealized gain (loss) | |
Net realized gain | | | 5,773,825 | | | | 23,926,269 | | | | 9,592,177 | |
Net change in unrealized gain (loss) | | | 17,494,214 | | | | 8,102,839 | | | | 15,834,147 | |
Net realized and unrealized gain (loss) | | | 23,268,039 | | | | 32,029,108 | | | | 25,426,324 | |
| NET INCREASE IN NET ASSETS RESULTING FROM OPERATIONS | | $ | 24,105,787 | | | $ | 39,703,176 | | | $ | 26,137,892 | |
| | |
| 62 | | The accompanying notes are an integral part of these financial statements. |
COMMERCE FUNDS
| | | | | | | | | | | | | | | | | | |
| Bond Fund | | | Short-Term
Government
Fund | | | National
Tax-Free
Intermediate
Bond Fund | | | Missouri
Tax-Free
Intermediate
Bond Fund | | | Kansas
Tax-Free
Intermediate
Bond Fund | |
| | | | | | |
| $ | 38,181,207 | | | $ | 1,980,387 | | | $ | 9,217,306 | | | $ | 10,589,900 | | | $ | 3,912,272 | |
| | 220,312 | | | | — | | | | 6,104 | | | | 7,769 | | | | 2,886 | |
| | 38,401,519 | | | | 1,980,387 | | | | 9,223,410 | | | | 10,597,669 | | | | 3,915,158 | |
| | | | |
| | | | | | | | | | | | | | | | | | |
| | | | | | |
| | 3,926,036 | | | | 502,872 | | | | 1,162,592 | | | | 1,194,002 | | | | 619,591 | |
| | 1,523,101 | | | | 146,624 | | | | 471,304 | | | | 489,521 | | | | 194,545 | |
| | 215,827 | | | | 86,532 | | | | 127,128 | | | | 129,244 | | | | 86,848 | |
| | 107,640 | | | | 33,457 | | | | 32,490 | | | | 47,649 | | | | 29,116 | |
| | 161,229 | | | | 37,875 | | | | 62,052 | | | | 70,114 | | | | 48,312 | |
| | 745,794 | | | | 26,681 | | | | 42,255 | | | | 124,912 | | | | 41,593 | |
| | 54,300 | | | | 20,746 | | | | 28,356 | | | | 25,229 | | | | 24,182 | |
| | 79,622 | | | | 8,159 | | | | 18,259 | | | | 20,341 | | | | 8,144 | |
| | 69,712 | | | | 6,730 | | | | 21,548 | | | | 22,431 | | | | 8,919 | |
| | 81,234 | | | | 17,965 | | | | 31,733 | | | | 32,799 | | | | 19,859 | |
| | 6,964,495 | | | | 887,641 | | | | 1,997,717 | | | | 2,156,242 | | | | 1,081,109 | |
| | — | | | | (199,852 | ) | | | — | | | | — | | | | (141,755 | ) |
| | 6,964,495 | | | | 687,789 | | | | 1,997,717 | | | | 2,156,242 | | | | 939,354 | |
| $ | 31,437,024 | | | $ | 1,292,598 | | | $ | 7,225,693 | | | $ | 8,441,427 | | | $ | 2,975,804 | |
| | | | |
| | | | | | | | | | | | | | | | | | |
| | | | | | |
| | 3,944,982 | | | | 11,485 | | | | 502,807 | | | | 1,042,544 | | | | 166,792 | |
| | (11,359,534 | ) | | | (1,115,495 | ) | | | (2,583,269 | ) | | | (4,090,046 | ) | | | (1,759,653 | ) |
| | (7,414,552 | ) | | | (1,104,010 | ) | | | (2,080,462 | ) | | | (3,047,502 | ) | | | (1,592,861 | ) |
| $ | 24,022,472 | | | $ | 188,588 | | | $ | 5,145,231 | | | $ | 5,393,925 | | | $ | 1,382,943 | |
| | |
| The accompanying notes are an integral part of these financial statements. | | 63 |
COMMERCE FUNDS
Statements of Changes in Net Assets
| | | | | | | | | | | | | | | | |
| | | Growth Fund | | | Value Fund | |
| | | For the
Fiscal Year Ended
October 31, 2017 | | | For the
Fiscal Year Ended
October 31, 2016 | | | For the
Fiscal Year Ended
October 31, 2017 | | | For the
Fiscal Year Ended
October 31, 2016 | |
From Operations: | |
Net investment income | | $ | 837,748 | | | $ | 773,244 | | | $ | 7,674,068 | | | $ | 5,787,041 | |
Net realized gain | | | 5,773,825 | | | | 4,432,533 | | | | 23,926,269 | | | | 5,763,828 | |
Net change in unrealized gain (loss) | | | 17,494,214 | | | | (1,505,203 | ) | | | 8,102,839 | | | | 4,849,500 | |
Net increase in net assets resulting from operations | | | 24,105,787 | | | | 3,700,574 | | | | 39,703,176 | | | | 16,400,369 | |
| | | | |
| | | | | | | | | | | | | | | | |
Distributions to Shareholders: | |
From net investment income | | | (800,198 | ) | | | (549,518 | ) | | | (7,680,703 | ) | | | (5,767,802 | ) |
From net realized gains | | | (4,420,499 | ) | | | (7,404,370 | ) | | | (5,514,193 | ) | | | (20,357,319 | ) |
Total distributions to shareholders | | | (5,220,697 | ) | | | (7,953,888 | ) | | | (13,194,896 | ) | | | (26,125,121 | ) |
| | | | |
| | | | | | | | | | | | | | | | |
From Share Transactions: | | | | | |
Proceeds from sales of shares | | | 26,599,222 | | | | 27,465,641 | | | | 90,676,810 | | | | 123,848,344 | |
Reinvestment of distributions | | | 1,941,511 | | | | 2,666,415 | | | | 7,749,125 | | | | 14,302,366 | |
Cost of shares redeemed | | | (18,351,791 | ) | | | (13,098,534 | ) | | | (148,162,603 | ) | | | (54,238,488 | ) |
Net increase (decrease) in net assets resulting from share transactions | | | 10,188,942 | | | | 17,033,522 | | | | (49,736,668 | ) | | | 83,912,222 | |
| TOTAL INCREASE (DECREASE) | | | 29,074,032 | | | | 12,780,208 | | | | (23,228,388 | ) | | | 74,187,470 | |
| | | | |
| | | | | | | | | | | | | | | | |
Net Assets: | | | | | |
Beginning of year | | | 88,226,774 | | | | 75,446,566 | | | | 273,983,334 | | | | 199,795,864 | |
End of year | | $ | 117,300,806 | | | $ | 88,226,774 | | | $ | 250,754,946 | | | $ | 273,983,334 | |
Undistributed (distributions in excess of) net investment income | | $ | 792,301 | | | $ | 759,792 | | | $ | 281,449 | | | $ | 328,440 | |
| | |
| 64 | | The accompanying notes are an integral part of these financial statements. |
COMMERCE FUNDS
| | | | | | | | | | | | | | |
| MidCap Growth Fund | | | Bond Fund | |
For the
Fiscal Year Ended
October 31, 2017 | | | For the
Fiscal Year Ended
October 31, 2016 | | | For the
Fiscal Year Ended
October 31, 2017 | | | For the
Fiscal Year Ended
October 31, 2016 | |
| | | | | | | | | | |
| $ | 711,568 | | | $ | 526,050 | | | $ | 31,437,024 | | | $ | 32,032,983 | |
| | 9,592,177 | | | | 4,945,850 | | | | 3,944,982 | | | | 3,838,215 | |
| | 15,834,147 | | | | (1,872,390 | ) | | | (11,359,534 | ) | | | 13,997,148 | |
| | 26,137,892 | | | | 3,599,510 | | | | 24,022,472 | | | | 49,868,346 | |
| | | |
| | | | | | | | | | | | | | |
| | | | | | | | | | |
| | (588,285 | ) | | | (243,606 | ) | | | (34,372,872 | ) | | | (34,761,131 | ) |
| | (4,998,011 | ) | | | (5,127,676 | ) | | | (435,543 | ) | | | (856,615 | ) |
| | (5,586,296 | ) | | | (5,371,282 | ) | | | (34,808,415 | ) | | | (35,617,746 | ) |
| | | |
| | | | | | | | | | | | | | |
| | | | | | | | | | |
| | 40,488,721 | | | | 48,550,416 | | | | 239,610,970 | | | | 270,561,550 | |
| | 924,138 | | | | 1,230,493 | | | | 8,830,850 | | | | 10,206,297 | |
| | (17,695,417 | ) | | | (9,190,228 | ) | | | (257,659,012 | ) | | | (178,144,299 | ) |
| | 23,717,442 | | | | 40,590,681 | | | | (9,217,192 | ) | | | 102,623,548 | |
| | 44,269,038 | | | | 38,818,909 | | | | (20,003,135 | ) | | | 116,874,148 | |
| | | |
| | | | | | | | | | | | | | |
| | | | | | | | | | | | | | |
| | 106,269,804 | | | | 67,450,895 | | | | 1,098,321,133 | | | | 981,446,985 | |
| $ | 150,538,842 | | | $ | 106,269,804 | | | $ | 1,078,317,998 | | | $ | 1,098,321,133 | |
| $ | 596,718 | | | $ | 522,315 | | | $ | (2,983,244 | ) | | $ | (6,345,636 | ) |
| | |
| The accompanying notes are an integral part of these financial statements. | | 65 |
COMMERCE FUNDS
Statements of Changes in Net Assets (continued)
| | | | | | | | | | | | | | | | |
| | | Short-Term
Government Fund | | | National Tax-Free
Intermediate Bond Fund | |
| | | For the
Fiscal Year Ended
October 31, 2017 | | | For the
Fiscal Year Ended
October 31, 2016 | | | For the
Fiscal Year Ended
October 31, 2017 | | | For the
Fiscal Year Ended
October 31, 2016 | |
From Operations: | |
Net investment income | | $ | 1,292,598 | | | $ | 1,198,101 | | | $ | 7,225,693 | | | $ | 6,901,610 | |
Net realized gain (loss) | | | 11,485 | | | | (28,056 | ) | | | 502,807 | | | | 1,894,519 | |
Net change in unrealized gain (loss) | | | (1,115,495 | ) | | | (113,191 | ) | | | (2,583,269 | ) | | | 2,585,510 | |
Net increase in net assets resulting from operations | | | 188,588 | | | | 1,056,854 | | | | 5,145,231 | | | | 11,381,639 | |
| | | | |
| | | | | | | | | | | | | | | | |
Distributions to Shareholders: | | | | | |
From net investment income | | | (1,664,495 | ) | | | (1,592,309 | ) | | | (7,161,970 | ) | | | (6,897,317 | ) |
From net realized gains | | | — | | | | — | | | | (1,442,541 | ) | | | — | |
Total distributions to shareholders | | | (1,664,495 | ) | | | (1,592,309 | ) | | | (8,604,511 | ) | | | (6,897,317 | ) |
| | | | |
| | | | | | | | | | | | | | | | |
From Share Transactions: | | | | | |
Proceeds from sales of shares | | | 30,963,212 | | | | 36,539,855 | | | | 64,048,861 | | | | 71,841,884 | |
Reinvestment of distributions | | | 691,657 | | | | 624,482 | | | | 409,297 | | | | 369,139 | |
Cost of shares redeemed | | | (39,109,834 | ) | | | (32,683,721 | ) | | | (50,620,662 | ) | | | (35,062,645 | ) |
Net increase (decrease) in net assets resulting from share transactions | | | (7,454,965 | ) | | | 4,480,616 | | | | 13,837,496 | | | | 37,148,378 | |
| TOTAL INCREASE (DECREASE) | | | (8,930,872 | ) | | | 3,945,161 | | | | 10,378,216 | | | | 41,632,700 | |
| | | | |
| | | | | | | | | | | | | | | | |
Net Assets: | | | | | |
Beginning of year | | | 107,942,312 | | | | 103,997,151 | | | | 328,038,261 | | | | 286,405,561 | |
End of year | | $ | 99,011,440 | | | $ | 107,942,312 | | | $ | 338,416,477 | | | $ | 328,038,261 | |
Undistributed (distributions in excess of) net investment income | | $ | (530,094 | ) | | $ | (437,047 | ) | | $ | 397,583 | | | $ | 366,296 | |
| | |
| 66 | | The accompanying notes are an integral part of these financial statements. |
COMMERCE FUNDS
| | | | | | | | | | | | | | |
Missouri Tax-Free
Intermediate Bond Fund | | | Kansas Tax-Free
Intermediate Bond Fund | |
For the
Fiscal Year Ended
October 31, 2017 | | | For the
Fiscal Year Ended
October 31, 2016 | | | For the
Fiscal Year Ended
October 31, 2017 | | | For the
Fiscal Year Ended
October 31, 2016 | |
| | | | | | | | | | |
| $ | 8,441,427 | | | $ | 8,029,279 | | | $ | 2,975,804 | | | $ | 2,802,701 | |
| | 1,042,544 | | | | 786,985 | | | | 166,792 | | | | 167,931 | |
| | (4,090,046 | ) | | | 1,385,232 | | | | (1,759,653 | ) | | | 382,123 | |
| | 5,393,925 | | | | 10,201,496 | | | | 1,382,943 | | | | 3,352,755 | |
| | | |
| | | | | | | | | | | | | | |
| | | | | | | | | | |
| | (8,422,194 | ) | | | (8,021,892 | ) | | | (2,969,288 | ) | | | (2,799,438 | ) |
| | — | | | | — | | | | — | | | | — | |
| | (8,422,194 | ) | | | (8,021,892 | ) | | | (2,969,288 | ) | | | (2,799,438 | ) |
| | | |
| | | | | | | | | | | | | | |
| | | | | | | | | | |
| | 64,752,420 | | | | 70,464,440 | | | | 28,250,300 | | | | 33,667,785 | |
| | 1,125,126 | | | | 1,140,600 | | | | 293,726 | | | | 324,635 | |
| | (65,025,344 | ) | | | (37,466,228 | ) | | | (23,708,671 | ) | | | (14,776,648 | ) |
|
852,202 |
| | | 34,138,812 | | | | 4,835,355 | | | | 19,215,772 | |
| | (2,176,067 | ) | | | 36,318,416 | | | | 3,249,010 | | | | 19,769,089 | |
| | | |
| | | | | | | | | | | | | | |
| | | | | | | | | | | | | | |
| | 346,467,296 | | | | 310,148,880 | | | | 137,306,301 | | | | 117,537,212 | |
| $ | 344,291,229 | | | $ | 346,467,296 | | | $ | 140,555,311 | | | $ | 137,306,301 | |
| $ | 132,432 | | | $ | 99,165 | | | $ | 44,075 | | | $ | 37,559 | |
| | |
| The accompanying notes are an integral part of these financial statements. | | 67 |
COMMERCE FUNDS
Financial Highlights
Selected Data for a Share Outstanding Throughout Each Year
| | | | | | | | | | | | | | | | | | | | | | | | | | | | |
| | | | | | Income (loss) from
investment operations | | | Distributions
to shareholders | |
| Year | | Net asset
value,
beginning
of year | | | Net
investment
income(a) | | | Net realized
and unrealized
gain | | | Total from
investment
operations | | | From net
investment
income | | | From net
realized
gains | | | Total
distributions | |
GROWTH FUND | |
For the Fiscal Years Ended October 31, | |
2017 | | $ | 27.83 | | | $ | 0.24 | | | $ | 6.77 | | | $ | 7.01 | | | $ | (0.24 | ) | | $ | (1.39 | ) | | $ | (1.63 | ) |
2016 | | | 29.44 | | | | 0.28 | | | | 1.26 | | | | 1.54 | | | | (0.21 | ) | | | (2.94 | ) | | | (3.15 | ) |
2015 | | | 34.95 | | | | 0.23 | | | | 2.37 | | | | 2.60 | | | | (0.25 | ) | | | (7.86 | ) | | | (8.11 | ) |
2014 | | | 34.32 | | | | 0.22 | | | | 5.09 | | | | 5.31 | | | | (0.19 | ) | | | (4.49 | ) | | | (4.68 | ) |
2013 | | | 28.81 | | | | 0.25 | | | | 6.49 | | | | 6.74 | | | | (0.19 | ) | | | (1.04 | ) | | | (1.23 | ) |
| | | | | | | | | | | | | | | | | | | | | | | | | | | | |
VALUE FUND | | | | | | | | | | | | | | | | | | | | | | | | | | | | |
For the Fiscal Years Ended October 31, | |
2017 | | $ | 29.98 | | | $ | 0.87 | | | $ | 3.63 | | | $ | 4.50 | | | $ | (0.87 | ) | | $ | (0.59 | ) | | $ | (1.46 | ) |
2016 | | | 31.65 | | | | 0.77 | | | | 1.58 | | | | 2.35 | | | | (0.76 | ) | | | (3.26 | ) | | | (4.02 | ) |
2015 | | | 32.50 | | | | 0.86 | | | | 0.06 | | | | 0.92 | | | | (0.85 | ) | | | (0.92 | ) | | | (1.77 | ) |
2014 | | | 29.83 | | | | 0.78 | | | | 2.69 | | | | 3.47 | | | | (0.78 | ) | | | (0.02 | ) | | | (0.80 | ) |
2013 | | | 24.10 | | | | 0.77 | | | | 5.70 | | | | 6.47 | | | | (0.74 | ) | | | — | | | | (0.74 | ) |
| (a) | | Calculated based on the average shares outstanding methodology. |
| (b) | | Assumes investment at the net asset value at the beginning of the year, reinvestment of all dividends and distributions, a complete redemption of the investment at the net asset value at the end of the year and no sales or redemption charges. Total return would be reduced if a sales or redemption charge was taken into account. Returns do not reflect the deduction of taxes that a shareholder would pay on Fund distributions or the redemption of Fund shares. |
| | |
| 68 | | The accompanying notes are an integral part of these financial statements. |
COMMERCE FUNDS
| | | | | | | | | | | | | | | | | | | | | | | | |
| | | | | | |
| | | | | | | | | | | | | | | | | | | |
Net asset
value, end
of year | | Total
return(b) | | | Net assets
at end of
year
(in 000s) | | | Ratio of
net expenses to
average net assets | | | Ratio of total
expenses to
average net assets | | | Ratio of
net investment
income to
average net assets | | | Portfolio
turnover
rate | |
| | | | | | | | | | | | | | | | | | | | | | | | |
| | | | | | | | | | | | | | | | | | | | | | | | |
| $33.21 | | | 26.67 | % | | $ | 117,301 | | | | 0.78 | % | | | 0.78 | % | | | 0.81 | % | | | 34 | % |
| 27.83 | | | 5.64 | | | | 88,227 | | | | 0.82 | | | | 0.82 | | | | 1.01 | | | | 37 | |
| 29.44 | | | 8.51 | | | | 75,447 | | | | 1.04 | | | | 1.04 | | | | 0.79 | | | | 40 | |
| 34.95 | | | 17.42 | | | | 75,497 | | | | 1.08 | | | | 1.08 | | | | 0.68 | | | | 40 | |
| 34.32 | | | 24.39 | | | | 103,436 | | | | 1.07 | | | | 1.07 | | | | 0.80 | | | | 78 | |
| | | | | | | | | | | | | | | | | | | | | | | | |
| | | | | | | | | | | | | | | | | | | | | | | | |
| | | | | | | | | | | | | | | | | | | | | | | | |
| $33.02 | | | 15.29 | % | | $ | 250,755 | | | | 0.70 | % | | | 0.74 | % | | | 2.73 | % | | | 47 | % |
| 29.98 | | | 8.48 | | | | 273,983 | | | | 0.70 | | | | 0.74 | | | | 2.61 | | | | 41 | |
| 31.65 | | | 2.88 | | | | 199,796 | | | | 0.70 | | | | 0.73 | | | | 2.70 | | | | 33 | |
| 32.50 | | | 11.76 | | | | 237,325 | | | | 0.70 | | | | 0.71 | | | | 2.50 | | | | 18 | |
| 29.83 | | | 27.27 | | | | 158,742 | | | | 0.66 | | | | 0.66 | | | | 2.84 | | | | 34 | |
| | |
| The accompanying notes are an integral part of these financial statements. | | 69 |
COMMERCE FUNDS
Financial Highlights
Selected Data for a Share Outstanding Throughout Each Year
| | | | | | | | | | | | | | | | | | | | | | | | | | | | |
| | | | | | Income (loss) from
investment operations | | | Distributions
to shareholders | |
| Year | | Net asset
value,
beginning
of year | | | Net
investment
income(a) | | | Net realized
and unrealized
gain | | | Total from
investment
operations | | | From net
investment
income | | | From net
realized
gains | | | Total
distributions | |
MIDCAP GROWTH FUND | |
For the Fiscal Years Ended October 31, | |
2017 | | $ | 34.64 | | | $ | 0.20 | | | $ | 7.43 | | | $ | 7.63 | | | $ | (0.18 | ) | | $ | (1.63 | ) | | $ | (1.81 | ) |
2016 | | | 36.10 | | | | 0.21 | | | | 1.21 | | | | 1.42 | | | | (0.12 | ) | | | (2.76 | ) | | | (2.88 | ) |
2015 | | | 38.82 | | | | 0.16 | | | | 2.39 | | | | 2.55 | | | | (0.05 | ) | | | (5.22 | ) | | | (5.27 | ) |
2014 | | | 38.64 | | | | 0.06 | | | | 4.36 | | | | 4.42 | | | | (0.11 | ) | | | (4.13 | ) | | | (4.24 | ) |
2013 | | | 33.38 | | | | 0.16 | | | | 8.32 | | | | 8.48 | | | | (0.10 | ) | | | (3.12 | ) | | | (3.22 | ) |
| | | | | | | | | | | | | | | | | | | | | | | | | | | | |
BOND FUND | | | | | | | | | | | | | | | | | | | | | | | | | | | | |
For the Fiscal Years Ended October 31, | |
2017 | | $ | 20.22 | | | $ | 0.60 | | | $ | (0.12 | ) | | $ | 0.48 | | | $ | (0.65 | ) | | $ | (0.01 | ) | | $ | (0.66 | ) |
2016 | | | 19.96 | | | | 0.61 | | | | 0.33 | | | | 0.94 | | | | (0.66 | ) | | | (0.02 | ) | | | (0.68 | ) |
2015 | | | 20.43 | | | | 0.64 | | | | (0.34 | ) | | | 0.30 | | | | (0.70 | ) | | | (0.07 | ) | | | (0.77 | ) |
2014 | | | 20.24 | | | | 0.70 | | | | 0.27 | | | | 0.97 | | | | (0.78 | ) | | | — | | | | (0.78 | ) |
2013 | | | 20.99 | | | | 0.77 | | | | (0.70 | ) | | | 0.07 | | | | (0.82 | ) | | | — | | | | (0.82 | ) |
| (a) | | Calculated based on the average shares outstanding methodology. |
| (b) | | Assumes investment at the net asset value at the beginning of the year, reinvestment of all dividends and distributions, a complete redemption of the investment at the net asset value at the end of the year and no sales or redemption charges. Total return would be reduced if a sales or redemption charge was taken into account. Returns do not reflect the deduction of taxes that a shareholder would pay on Fund distributions or the redemption of Fund shares. |
| | |
| 70 | | The accompanying notes are an integral part of these financial statements. |
COMMERCE FUNDS
| | | | | | | | | | | | | | | | | | | | | | | | |
| | | | | | |
| | | | | | | | | | | | | | | | | | | |
Net asset
value, end
of year | | Total
return(b) | | | Net assets
at end of
year
(in 000s) | | | Ratio of
net expenses to
average net assets | | | Ratio of total
expenses to
average net assets | | | Ratio of
net investment
income to
average net assets | | | Portfolio
turnover
rate | |
| | | | | | | | | | | | | | | | | | | | | | | | |
| | | | | | | | | | | | | | | | | | | | | | | | |
| $40.46 | | | 23.03 | % | | $ | 150,539 | | | | 0.82 | % | | | 0.82 | % | | | 0.55 | % | | | 58 | % |
| 34.64 | | | 4.24 | | | | 106,270 | | | | 0.87 | | | | 0.87 | | | | 0.62 | | | | 39 | |
| 36.10 | | | 7.02 | | | | 67,451 | | | | 1.03 | | | | 1.03 | | | | 0.44 | | | | 50 | |
| 38.82 | | | 12.58 | | | | 64,835 | | | | 1.05 | | | | 1.05 | | | | 0.15 | | | | 43 | |
| 38.64 | | | 27.92 | | | | 65,621 | | | | 1.09 | | | | 1.09 | | | | 0.45 | | | | 75 | |
| | | | | | | | | | | | | | | | | | | | | | | | |
| | | | | | | | | | | | | | | | | | | | | | | | |
| | | | | | | | | | | | | | | | | | | | | | | | |
| $20.04 | | | 2.44 | % | | $ | 1,078,318 | | | | 0.66 | % | | | 0.66 | % | | | 2.99 | % | | | 26 | % |
| 20.22 | | | 4.79 | | | | 1,098,321 | | | | 0.67 | | | | 0.67 | | | | 3.05 | | | | 17 | |
| 19.96 | | | 1.49 | | | | 981,447 | | | | 0.68 | | | | 0.68 | | | | 3.18 | | | | 21 | |
| 20.43 | | | 4.86 | | | | 867,634 | | | | 0.70 | | | | 0.70 | | | | 3.44 | | | | 22 | |
| 20.24 | | | 0.31 | | | | 779,704 | | | | 0.72 | | | | 0.72 | | | | 3.71 | | | | 23 | |
| | |
| The accompanying notes are an integral part of these financial statements. | | 71 |
COMMERCE FUNDS
Financial Highlights
Selected Data for a Share Outstanding Throughout Each Year
| | | | | | | | | | | | | | | | | | | | | | | | | | | | |
| | | | | | Income (loss) from
investment operations | | | Distributions
to shareholders | |
| Year | | Net asset
value,
beginning
of year | | | Net
investment
income(a) | | | Net realized
and unrealized
gain (loss) | | | Total from
investment
operations | | | From net
investment
income | | | From net
realized
gains | | | Total
distributions | |
SHORT TERM GOVERNMENT FUND | |
For the Fiscal Years Ended October 31, | |
2017 | | $ | 17.34 | | | $ | 0.22 | | | $ | (0.17 | ) | | $ | 0.05 | | | $ | (0.28 | ) | | $ | — | | | $ | (0.28 | ) |
2016 | | | 17.43 | | | | 0.21 | | | | (0.02 | ) | | | 0.19 | | | | (0.28 | ) | | | — | | | | (0.28 | ) |
2015 | | | 17.54 | | | | 0.17 | | | | (0.04 | ) | | | 0.13 | | | | (0.24 | ) | | | — | | | | (0.24 | ) |
2014 | | | 17.78 | | | | 0.24 | | | | (0.12 | ) | | | 0.12 | | | | (0.36 | ) | | | — | | | | (0.36 | ) |
2013 | | | 18.14 | | | | 0.27 | | | | (0.23 | ) | | | 0.04 | | | | (0.40 | ) | | | — | | | | (0.40 | ) |
| | | | | | | | | | | | | | | | | | | | | | | | | | | | |
NATIONAL TAX-FREE INTERMEDIATE BOND FUND | | | | | | | | | |
For the Fiscal Years Ended October 31, | |
2017 | | $ | 19.84 | | | $ | 0.43 | | | $ | (0.12 | ) | | $ | 0.31 | | | $ | (0.43 | ) | | $ | (0.09 | ) | | $ | (0.52 | ) |
2016 | | | 19.54 | | | | 0.43 | | | | 0.30 | | | | 0.73 | | | | (0.43 | ) | | | — | | | | (0.43 | ) |
2015 | | | 19.45 | | | | 0.42 | | | | 0.09 | | | | 0.51 | | | | (0.42 | ) | | | — | | | | (0.42 | ) |
2014 | | | 19.27 | | | | 0.54 | | | | 0.32 | | | | 0.86 | | | | (0.54 | ) | | | (0.14 | ) | | | (0.68 | ) |
2013 | | | 20.59 | | | | 0.63 | | | | (1.07 | ) | | | (0.44 | ) | | | (0.63 | ) | | | (0.25 | ) | | | (0.88 | ) |
| (a) | | Calculated based on the average shares outstanding methodology. |
| (b) | | Assumes investment at the NAV at the beginning of the year, reinvestment of all dividends and distributions, a complete redemption of the investment at the NAV at the end of the year and no sales or redemption charges. Total return would be reduced if a sales or redemption charge was taken into account. Returns do not reflect the deduction of taxes that a shareholder would pay on Fund distributions or the redemption of Fund shares. |
| | |
| 72 | | The accompanying notes are an integral part of these financial statements. |
COMMERCE FUNDS
| | | | | | | | | | | | | | | | | | | | | | | | |
| | | | | | |
| | | | | | | | | | | | | | | | | | | |
Net asset
value, end
of year | | Total
return(b) | | | Net assets
at end of
year
(in 000s) | | | Ratio of
net expenses to
average net assets | | | Ratio of total
expenses to
average net assets | | | Ratio of
net investment
income to
average net assets | | | Portfolio
turnover
rate | |
| | | | | | | | | | | | | | | | | | | | | | | | |
| | | | | | | | | | | | | | | | | | | | | | | | |
| $17.11 | | | 0.31 | % | | $ | 99,011 | | | | 0.68 | % | | | 0.88 | % | | | 1.28 | % | | | 21 | % |
| 17.34 | | | 1.09 | | | | 107,942 | | | | 0.68 | | | | 0.88 | | | | 1.21 | | | | 35 | |
| 17.43 | | | 0.81 | | | | 103,997 | | | | 0.68 | | | | 0.83 | | | | 0.97 | | | | 68 | |
| 17.54 | | | 0.70 | | | | 97,944 | | | | 0.68 | | | | 0.88 | | | | 1.35 | | | | 27 | |
| 17.78 | | | 0.24 | | | | 103,244 | | | | 0.68 | | | | 0.83 | | | | 1.48 | | | | 25 | |
| | | | | | | | | | | | | | | | | | | | | | | | |
| | | | | | | | | | | | | | | | | | | | | | | | |
| | | | | | | | | | | | | | | | | | | | | | | | |
| $19.63 | | | 1.62 | % | | $ | 338,416 | | | | 0.61 | % | | | 0.61 | % | | | 2.22 | % | | | 37 | % |
| 19.84 | | | 3.76 | | | | 328,038 | | | | 0.62 | | | | 0.62 | | | | 2.17 | | | | 27 | |
| 19.54 | | | 2.63 | | | | 286,406 | | | | 0.64 | | | | 0.64 | | | | 2.16 | | | | 36 | |
| 19.45 | | | 4.59 | | | | 266,001 | | | | 0.67 | | | | 0.67 | | | | 2.81 | | | | 74 | |
| 19.27 | | | (2.23 | ) | | | 247,975 | | | | 0.66 | | | | 0.66 | | | | 3.18 | | | | 37 | |
| | |
| The accompanying notes are an integral part of these financial statements. | | 73 |
COMMERCE FUNDS
Financial Highlights
Selected Data for a Share Outstanding Throughout Each Year
| | | | | | | | | | | | | | | | | | | | | | | | | | | | |
| | | | | | Income (loss) from
investment operations | | | Distributions
to shareholders | |
| Year | | Net asset
value,
beginning
of year | | | Net
investment
income(a) | | | Net realized
and unrealized
gain (loss) | | | Total from
investment
operations | | | From net
investment
income | | | From net
realized
gains | | | Total
distributions | |
MISSOURI TAX-FREE INTERMEDIATE BOND FUND | |
For the Fiscal Years Ended October 31, | |
2017 | | $ | 19.68 | | | $ | 0.48 | | | $ | (0.16 | ) | | $ | 0.32 | | | $ | (0.48 | ) | | $ | — | | | $ | (0.48 | ) |
2016 | | | 19.53 | | | | 0.47 | | | | 0.15 | | | | 0.62 | | | | (0.47 | ) | | | — | | | | (0.47 | ) |
2015 | | | 19.52 | | | | 0.47 | | | | 0.01 | | | | 0.48 | | | | (0.47 | ) | | | — | | | | (0.47 | ) |
2014 | | | 19.25 | | | | 0.56 | | | | 0.37 | | | | 0.93 | | | | (0.56 | ) | | | (0.10 | ) | | | (0.66 | ) |
2013 | | | 20.39 | | | | 0.61 | | | | (1.06 | ) | | | (0.45 | ) | | | (0.61 | ) | | | (0.08 | ) | | | (0.69 | ) |
| | | | | | | | | | | | | | | | | | | | | | | | | | | | |
KANSAS TAX-FREE INTERMEDIATE BOND FUND | |
For the Fiscal Years Ended October 31, | |
2017 | | $ | 19.57 | | | $ | 0.43 | | | $ | (0.22 | ) | | $ | 0.21 | | | $ | (0.43 | ) | | $ | — | | | $ | (0.43 | ) |
2016 | | | 19.46 | | | | 0.42 | | | | 0.11 | | | | 0.53 | | | | (0.42 | ) | | | — | | | | (0.42 | ) |
2015 | | | 19.39 | | | | 0.43 | | | | 0.06 | | | | 0.49 | | | | (0.42 | ) | | | — | | | | (0.42 | ) |
2014 | | | 18.90 | | | | 0.50 | | | | 0.53 | | | | 1.03 | | | | (0.50 | ) | | | (0.04 | ) | | | (0.54 | ) |
2013 | | | 20.01 | | | | 0.57 | | | | (0.98 | ) | | | (0.41 | ) | | | (0.56 | ) | | | (0.14 | ) | | | (0.70 | ) |
| (a) | | Calculated based on the average shares outstanding methodology. |
| (b) | | Assumes investment at the net asset value at the beginning of the year, reinvestment of all dividends and distributions, a complete redemption of the investment at the net asset value at the end of the year and no sales or redemption charges. Total return would be reduced if a sales or redemption charge was taken into account. Returns do not reflect the deduction of taxes that a shareholder would pay on Fund distributions or the redemption of Fund shares. |
| | |
| 74 | | The accompanying notes are an integral part of these financial statements. |
COMMERCE FUNDS
| | | | | | | | | | | | | | | | | | | | | | | | |
| | | | | | |
| | | | | | | | | | | | | | | | | | | |
Net asset
value, end
of year | | Total
return(b) | | | Net assets
at end of
year
(in 000s) | | | Ratio of
net expenses to
average net assets | | | Ratio of total
expenses to
average net assets | | | Ratio of
net investment
income to
average net assets | | | Portfolio
turnover
rate | |
| | | | | | | | | | | | | | | | | | | | | | | | |
| | | | | | | | | | | | | | | | | | | | | | | | |
| $19.52 | | | 1.70 | % | | $ | 344,291 | | | | 0.64 | % | | | 0.64 | % | | | 2.50 | % | | | 15 | % |
| 19.68 | | | 3.21 | | | | 346,467 | | | | 0.64 | | | | 0.64 | | | | 2.40 | | | | 21 | |
| 19.53 | | | 2.48 | | | | 310,149 | | | | 0.65 | | | | 0.65 | | | | 2.43 | | | | 17 | |
| 19.52 | | | 4.92 | | | | 306,674 | | | | 0.67 | | | | 0.67 | | | | 2.90 | | | | 29 | |
| 19.25 | | | (2.29 | ) | | | 307,996 | | | | 0.64 | | | | 0.64 | | | | 3.07 | | | | 23 | |
| | | | | | | | | | | | | | | | | | | | | | | | |
| | | | | | | | | | | | | | | | | | | | | | | | |
| | | | | | | | | | | | | | | | | | | | | | | | |
| $19.35 | | | 1.09 | % | | $ | 140,555 | | | | 0.70 | % | | | 0.81 | % | | | 2.22 | % | | | 17 | % |
| 19.57 | | | 2.74 | | | | 137,306 | | | | 0.70 | | | | 0.81 | | | | 2.14 | | | | 11 | |
| 19.46 | | | 2.57 | | | | 117,537 | | | | 0.70 | | | | 0.83 | | | | 2.21 | | | | 13 | |
| 19.39 | | | 5.51 | | | | 105,395 | | | | 0.70 | | | | 0.87 | | | | 2.63 | | | | 26 | |
| 18.90 | | | (2.09 | ) | | | 103,733 | | | | 0.70 | | | | 0.83 | | | | 2.91 | | | | 22 | |
| | |
| The accompanying notes are an integral part of these financial statements. | | 75 |
COMMERCE FUNDS
Notes to Financial Statements
October 31, 2017
The Commerce Funds (the “Trust”) is a Delaware statutory trust registered under the Investment Company Act of 1940, as amended (the “Act”), as an open-end, management investment company. The Trust consists of eight portfolios (individually, a “Fund” and collectively, the “Funds”): Growth Fund, Value Fund, MidCap Growth Fund, Bond Fund, Short-Term Government Fund, National Tax-Free Intermediate Bond Fund, Missouri Tax-Free Intermediate Bond Fund and Kansas Tax-Free Intermediate Bond Fund. Each of the Funds offers one class of shares (the “Shares”). Each Fund is registered as a diversified open-end management investment company, except the Missouri Tax-Free Intermediate Bond Fund and the Kansas Tax-Free Intermediate Bond Fund, which are registered as non-diversified under the Act.
The Funds have entered into an Advisory Agreement with Commerce Investment Advisors, Inc. (the “Adviser” or “Commerce”), a subsidiary of Commerce Bank.
| | |
| 2. SIGNIFICANT ACCOUNTING POLICIES | | |
The financial statements have been prepared in accordance with accounting principles generally accepted in the United States of America (“GAAP”) and require management to make estimates and assumptions that may affect the reported amounts and disclosures. Actual results may differ from those estimates and assumptions.
A. Investment Valuation — The Funds’ valuation policy is to value investments at fair value.
B. Investment Income and Investments — Investment income is comprised of interest income, and dividend income. Interest income is accrued daily and adjusted for amortization of premiums and accretion of discounts. Dividend income is recognized on ex-dividend date. Investment transactions are reflected on trade date with realized gains and losses on sales calculated using identified cost. Investment transactions are recorded on the following business day for daily net asset value (“NAV’’) calculations. Distributions received from the Funds’ investments in United States (“U.S.”) real estate investment trusts (“REITs”) may be characterized as ordinary income, net capital gain or a return of capital. A return of capital is recorded by the Funds as a reduction to the cost basis of the REIT. For treasury inflation indexed securities, adjustments to principal due to inflation/deflation are reflected as increases/decreases to interest income with a corresponding adjustment to cost.
For securities with paydown provisions, principal payments received are treated as a proportionate reduction to the cost basis of the securities and excess or shortfall amounts are recorded as income.
C. Expenses — Expenses incurred by the Trust that do not specifically relate to an individual Fund of the Trust are allocated to the Funds based on each Fund’s average net assets and are accrued daily.
D. Federal Taxes and Distributions to Shareholders — It is each Fund’s policy to comply with the requirements of the Internal Revenue Code of 1986, as amended (the “Code”), applicable to regulated investment companies (mutual funds) and to distribute each year substantially all of its investment company taxable income and capital gains to its shareholders. Accordingly, the Funds are not required to make any provisions for the payment of federal income tax. Distributions to shareholders are recorded on the ex-dividend date. Income and capital gains distributions, if any, are declared and paid according to the following schedule:
| | | | | | | | |
| | | Income Distribution | | Capital Gains Distribution |
| Fund | | Declared | | Paid | | Declared | | Paid |
Value | | Quarterly | | Quarterly | | Annually | | Annually |
Growth and MidCap Growth | | Annually | | Annually | | Annually | | Annually |
Bond, Short-Term Government, National Tax-Free Intermediate Bond, Missouri Tax-Free Intermediate Bond and Kansas Tax-Free Intermediate Bond | | Daily | | Monthly | | Annually | | Annually |
76
COMMERCE FUNDS
| | |
| 2. SIGNIFICANT ACCOUNTING POLICIES (continued) | | |
Net capital losses, if any, are carried forward to future fiscal years and may be used to the extent allowed by the Code to offset any future capital gains. Utilization of capital loss carryforwards will reduce the requirement of future capital gains distributions.
The characterization of distributions to shareholders for financial reporting purposes is determined in accordance with federal income tax rules, which may differ from GAAP. The source of each Fund’s distributions may be shown in the accompanying financial statements as from net investment income, net realized gain or capital. Certain components of the Funds’ net assets on the Statements of Assets and Liabilities reflect permanent GAAP/tax differences based on the appropriate tax character.
| | |
| 3. INVESTMENTS AND FAIR VALUE MEASUREMENTS | | |
U.S. GAAP defines the fair value of a financial instrument as the amount that would be received to sell an asset or paid to transfer a liability in an orderly transaction between market participants at the measurement date (i.e., the exit price). GAAP establishes a fair value hierarchy that prioritizes the inputs to valuation techniques used to measure fair value. The hierarchy gives the highest priority to unadjusted quoted prices in active markets for identical assets or liabilities (Level 1 measurements) and the lowest priority to unobservable inputs (Level 3 measurements). The levels used for classifying investments are not necessarily an indication of the risk associated with investing in these investments. The three levels of the fair value hierarchy are described below:
Level 1 — Unadjusted quoted prices in active markets that are accessible at the measurement date for identical, unrestricted assets or liabilities;
Level 2 — Quoted prices in markets that are not active or financial instruments for which significant inputs are observable (including, but not limited to, quoted prices for similar investments, interest rates, prepayment speeds and credit risk), either directly or indirectly;
Level 3 — Prices or valuations that require significant unobservable inputs (including the Adviser’s assumptions in determining fair value measurement).
Changes in valuation approaches or techniques may result in transfers into or out of an assigned level within the hierarchy. In accordance with the Funds’ policy, transfers between different levels of the fair value hierarchy resulting from such changes are deemed to have occurred as of the beginning of the reporting period.
The Trust’s Board of Trustees has adopted valuation procedures (“Valuation Procedures”) that govern the valuation of the portfolio investments held by the Funds, including investments for which market quotations are not readily available. The Board of Trustees has delegated to Commerce day-to-day responsibility for implementing and maintaining internal controls and procedures related to the valuation of the Funds’ portfolio investments. To assess the continuing appropriateness of pricing sources and methodologies, Commerce regularly performs price verifications and issues challenges as necessary to third party pricing vendors or brokers, and any differences are reviewed in accordance with the Valuation Procedures.
A. Level 1 and Level 2 Fair Value Investments — The valuation techniques and significant inputs used in determining the fair values for investments classified as Level 1 and Level 2 are as follows:
Equity Securities — Equity securities and investment companies traded on a U.S. securities exchange or the NASDAQ system, are valued daily at their last sale price or official closing price on the principal exchange or system on which they are traded. If there is no sale or official closing price or it is believed by the Adviser to not represent fair value, equity securities and exchange traded investment companies are valued at the last bid price. Investments in investment companies (other than those
77
COMMERCE FUNDS
Notes to Financial Statements (continued)
October 31, 2017
| | |
| 3. INVESTMENTS AND FAIR VALUE MEASUREMENTS (continued) | | |
that are exchange traded) are valued at the NAV on the valuation date. To the extent these investments are actively traded, they are classified as Level 1 of the fair value hierarchy, otherwise they are classified as Level 2.
Unlisted equity securities for which market quotations are available are valued at their last sale price on the valuation date, or if no sale occurs, at the last bid price. Such investments are generally classified as Level 2 of the fair value hierarchy.
Debt Securities — Debt securities for which market quotations are readily available are valued daily on the basis of quotations furnished by an independent pricing service or provided by securities dealers. The pricing services may use valuation models or matrix pricing, which consider yield or price with respect to comparable bonds, quotations from bond dealers or by reference to other securities that are considered comparable in characteristics such as rating, interest rate and maturity date, to determine current value. Government obligations that mature in sixty days or less shall be valued at the market price. Short-term debt obligations that mature in sixty days or less and that do not exhibit signs of credit deterioration are valued at amortized cost, which approximates fair value. With the exception of treasury securities, which are generally classified as Level 1, these investments are generally classified as Level 2 of the fair value hierarchy.
i. Mortgage-Backed and Asset-Backed Securities — Mortgage-backed securities represent direct or indirect participations in, or are collateralized by and payable from, mortgage loans secured by residential and/or commercial real estate property. Asset-backed securities include securities whose principal and interest payments are collateralized by pools of other assets or receivables. The value of certain mortgage-backed and asset-backed securities (including adjustable rate mortgage loans) may be particularly sensitive to changes in prevailing interest rates. The value of these securities may also fluctuate in response to the market’s perception of the creditworthiness of the issuers.
Asset-backed securities may present credit risks that are not presented by mortgage-backed securities because they generally do not have the benefit of a security interest in collateral that is comparable to mortgage assets. Some asset-backed securities may only have a subordinated claim on collateral.
Collateralized mortgage-backed securities (“CMOs”) may exhibit even more price volatility and interest rate risk than other mortgage-backed securities. They may lose liquidity as CMO market makers may choose not to repurchase, or may offer prices, based on current market conditions, that are unacceptable to a Fund based on the Adviser’s analysis of the market value of the security.
ii. Treasury Inflation Indexed Securities — These are treasury securities in which the principal amount is adjusted daily to keep pace with inflation, as measured by the U.S. Consumer Pricing Index for Urban Consumers. The repayment of the original bond principal upon maturity is guaranteed by the full faith and credit of the U.S. Government.
Short Term Investments — Short-term investments, except for Government obligations, having a maturity of 60 days or less are generally valued at amortized cost, which approximates fair market value. Government obligations maturing in less than 60 days shall be valued at their market price. With the exception of treasury securities, which are generally classified as Level 1, these investments are classified as Level 2 of the fair value hierarchy.
Repurchase Agreements — Repurchase agreements involve the purchase of securities subject to the seller’s agreement to repurchase the securities at a mutually agreed upon date and price, under the terms of a Master Repurchase Agreement (“MRA”). During the term of a repurchase agreement, the value of the underlying securities held as collateral on behalf of a Fund, including accrued interest, is required to exceed the value of the repurchase agreement, including accrued interest. The gross value of repurchase agreements is included in the Statements of Assets and Liabilities for financial reporting purposes. The underlying securities for all repurchase agreements are held at the Funds’ custodian or designated subcustodians under tri-party repurchase agreements.
78
COMMERCE FUNDS
| | |
| 3. INVESTMENTS AND FAIR VALUE MEASUREMENTS (continued) | | |
An MRA governs transactions between a Fund and select counterparties. An MRA contains provisions for, among other things, initiation, of the transaction, income payments, and events of default and maintenance of securities for repurchase agreements. An MRA also permits offsetting with collateral to create one single net payment in the event of default or similar events, including the bankruptcy or insolvency of a counterparty.
If the seller defaults, a Fund could suffer a loss to the extent that the proceeds from the sale of the underlying securities and other collateral held by the Fund are less than the repurchase price and the Fund’s costs associated with delay and enforcement of the repurchase agreement. In addition, in the event of default or insolvency of the seller, a court could determine that a Fund’s interest in the collateral is not enforceable, resulting in additional losses to the Fund.
B. Level 3 Fair Value Investments — The valuation techniques and significant inputs used in determining the fair values for investments classified as Level 3 are as follows:
To the extent that the aforementioned significant inputs are unobservable, or if quotations are not readily available, or if Commerce believes that such quotations do not accurately reflect fair value, the fair value of a Fund’s investments may be determined under valuation procedures approved by the Trust’s Board of Trustees. Commerce, consistent with the Funds’ procedures and applicable regulatory guidance, may make an adjustment to the most recent valuation prices of either domestic or foreign securities in light of significant events to reflect what it believes to be the fair value of the securities at the time of determining a Fund’s NAV. Significant events that could affect a large number of securities in a particular market may include, but are not limited to: significant fluctuations in U.S. or foreign markets; market dislocations; market disruptions; or unscheduled market closings. Significant events that could also affect a single issuer may include, but are not limited to: corporate actions such as reorganizations, mergers and buyouts; ratings downgrades; and bankruptcies.
C. Fair Value Hierarchy — The following is a summary of the Funds’ investments classified in the fair value hierarchy as of October 31, 2017:
| | | | | | | | | | | | |
GROWTH
| |
| Investment Type | | Level 1 | | | Level 2 | | | Level 3 | |
Assets | | | | | | | | | | | | |
Common Stock and/or Other Equity Investments | | $ | 115,870,028 | | | $ | — | | | $ | — | |
Repurchase Agreement | | | — | | | | 1,373,000 | | | | — | |
Total | | $ | 115,870,028 | | | $ | 1,373,000 | | | $ | — | |
|
VALUE
| |
| Investment Type | | Level 1 | | | Level 2 | | | Level 3 | |
Assets | | | | | | | | | | | | |
Common Stock and/or Other Equity Investments | | $ | 247,303,025 | | | $ | — | | | $ | — | |
Exchange Traded Fund | | | 5,969,500 | | | | — | | | | — | |
Total | | $ | 253,272,525 | | | $ | — | | | $ | — | |
| | | | | | | | | | | | |
|
MIDCAP GROWTH
| |
| Investment Type | | Level 1 | | | Level 2 | | | Level 3 | |
Assets | | | | | | | | | | | | |
Common Stock and/or Other Equity Investments | | $ | 145,576,773 | | | $ | — | | | $ | — | |
Exchange Traded Fund | | | 2,692,101 | | | | — | | | | — | |
Repurchase Agreement | | | — | | | | 2,344,000 | | | | — | |
Total | | $ | 148,268,874 | | | $ | 2,344,000 | | | $ | — | |
79
COMMERCE FUNDS
Notes to Financial Statements (continued)
October 31, 2017
| | |
| 3. INVESTMENTS AND FAIR VALUE MEASUREMENTS (continued) | | |
| | | | | | | | | | | | |
|
BOND
| |
| Investment Type | | Level 1 | | | Level 2 | | | Level 3 | |
Assets | | | | | | | | | | | | |
Fixed Income | |
Asset-Backed Securities | | $ | — | | | $ | 166,098,029 | | | $ | — | |
Municipal Bond Obligations | | | — | | | | 69,971,951 | | | | — | |
Mortgage-Backed Obligations | | | — | | | | 274,702,413 | | | | — | |
Corporate Obligations | | | — | | | | 481,544,051 | | | | — | |
Foreign Debt Obligations | | | 243,886 | | | | — | | | | — | |
U.S. Treasury Obligations and/or Other U.S. Government Agencies | | | 52,795,970 | | | | 14,689,421 | | | | — | |
Investment Company | | | 5,374,254 | | | | — | | | | — | |
Repurchase Agreement | | | — | | | | 10,507,000 | | | | — | |
Total | | $ | 58,414,110 | | | $ | 1,017,512,865 | | | $ | — | |
|
SHORT-TERM GOVERNMENT
| |
| Investment Type | | Level 1 | | | Level 2 | | | Level 3 | |
Assets | | | | | | | | | | | | |
Fixed Income | |
Asset-Backed Securities | | $ | — | | | $ | 3,228,174 | | | $ | — | |
Mortgage-Backed Obligations | | | — | | | | 27,051,687 | | | | — | |
U.S. Treasury Obligations and/or Other U.S. Government Agencies | | | 24,335,900 | | | | 41,155,314 | | | | — | |
Repurchase Agreement | | | — | | | | 2,985,000 | | | | — | |
Total | | $ | 24,335,900 | | | $ | 74,420,175 | | | $ | — | |
|
NATIONAL TAX-FREE INTERMEDIATE BOND
| |
| Investment Type | | Level 1 | | | Level 2 | | | Level 3 | |
Assets | | | | | | | | | | | | |
Fixed Income | |
Municipal Bond Obligations | | $ | — | | | $ | 320,329,243 | | | $ | — | |
Repurchase Agreement | | | — | | | | 19,718,000 | | | | — | |
Total | | $ | — | | | $ | 340,047,243 | | | $ | — | |
|
MISSOURI TAX-FREE INTERMEDIATE BOND
| |
| Investment Type | | Level 1 | | | Level 2 | | | Level 3 | |
Assets | | | | | | | | | | | | |
Fixed Income | |
Municipal Bond Obligations | | $ | — | | | $ | 345,245,396 | | | $ | — | |
Repurchase Agreement | | | — | | | | 1,481,000 | | | | — | |
Total | | $ | — | | | $ | 346,726,396 | | | $ | — | |
80
COMMERCE FUNDS
| | |
| 3. INVESTMENTS AND FAIR VALUE MEASUREMENTS (continued) | | |
| | | | | | | | | | | | |
|
KANSAS TAX-FREE INTERMEDIATE BOND
| |
| Investment Type | | Level 1 | | | Level 2 | | | Level 3 | |
Assets | | | | | | | | | | | | |
Fixed Income | |
Municipal Bond Obligations | | $ | — | | | $ | 133,670,987 | | | $ | — | |
Repurchase Agreement | | | — | | | | 7,842,000 | | | | — | |
Total | | $ | — | | | $ | 141,512,987 | | | $ | — | |
For further information regarding security characteristics, see the Schedule of Investments.
|
| 4. AGREEMENTS AND AFFILIATED TRANSACTIONS |
A. Advisory Agreement — Pursuant to the terms of the Advisory Agreement, the Adviser is responsible for managing the investments and making investment decisions for each of the Funds. For these services and for assuming related expenses, the Adviser is entitled to a fee, accrued daily and payable monthly, at the contractual annual rate of the corresponding Fund’s average daily net assets. The contractual advisory fees for the Funds are as follows:
| | | | | | |
| | | Contractual Advisory Fees |
| Fund | | First
$100 million | | Next
$100 million | | Over
$200 million |
Short-Term Government, National Tax-Free Intermediate Bond, Missouri Tax-Free Intermediate Bond and Kansas Tax-Free Intermediate Bond | | 0.50% | | 0.35% | | 0.25% |
| | | First
$400 million | | Next
$300 million | | Over
$700 million |
Bond | | 0.50% | | 0.35% | | 0.25% |
| | | First
$200 million | | | | Over
$200 million |
MidCap Growth | | 0.50% | | | | 0.40% |
The contractual advisory fees for the Growth and Value Funds are 0.40% and 0.30% of the Funds’ average daily net assets, respectively.
For the fiscal year ended October 31, 2017, the effective advisory fees were 0.40%, 0.30%, 0.50%, 0.37%, 0.50%, 0.36%, 0.35% and 0.46%, for the Growth, Value, MidCap Growth, Bond, Short-Term Government, National Tax-Free Intermediate Bond, Missouri Tax-Free Intermediate Bond and Kansas Tax-Free Intermediate Bond Funds, respectively.
B. Administration Agreements — Goldman Sachs Asset Management, L.P. (“GSAM”), an affiliate of Goldman Sachs & Co. LLC (formerly Goldman, Sachs & Co.) (“Goldman Sachs”), and Commerce, serve as Co-Administrators of the Trust pursuant to a Co-Administration Agreement. Under the Co-Administration Agreement, GSAM and Commerce administer the Trust’s business affairs. As compensation for the services rendered under the Co-Administration Agreement, GSAM and Commerce are entitled to a fee, accrued daily and payable monthly, at the contractual annual rate of the corresponding Fund’s average daily net assets. Pursuant to the Co-Administration Agreement, the Funds pay an aggregate administrative fee at the annual rate of 0.145%, allocated as follows: (1) for each Fund, Commerce is entitled to receive 0.12% of each Fund’s average daily net assets; and (2) for each Fund, GSAM is entitled to receive 0.025% of each Fund’s average daily net assets. State Street Bank and Trust Company (“State Street”) also provides certain enhanced accounting and administrative services to the Funds
81
COMMERCE FUNDS
Notes to Financial Statements (continued)
October 31, 2017
| | |
| 4. AGREEMENTS AND AFFILIATED TRANSACTIONS (continued) | | |
pursuant to an Amended and Restated Enhanced Accounting and Administrative Services Agreement which services include, among other things, certain financial reporting, daily compliance and treasury services.
C. Distribution Agreement — The Commerce Funds’ shares are offered on a continuous basis through Goldman Sachs, which acts as Distributor under the Distribution Agreement with The Commerce Funds. Goldman Sachs does not receive compensation from the Funds for these services.
D. Other Agreements — The Adviser has contractually agreed to waive fees and/or reimburse expenses (excluding interest, taxes, acquired fund fees and expenses, and extraordinary expenses) for all Funds (except the MidCap Growth Fund) to the extent that such expenses exceeded, on an annualized basis, 1.00%, 0.70%, 0.80%, 0.68%, 0.70%, 0.70% and 0.70% of the average net assets of the Growth, Value, Bond, Short-Term Government, National Tax-Free Intermediate Bond, Missouri Tax-Free Intermediate Bond and Kansas Tax-Free Intermediate Bond Funds, respectively. This agreement will remain in place through March 1, 2018. After this date, the Adviser or a Fund may terminate the contractual arrangement. In addition, the Funds are not obligated to reimburse the Adviser for prior fiscal year expense reimbursements, if any. Expense reimbursements, if any, are accrued daily and paid monthly and are disclosed in the Statements of Operations for the fiscal year ended October 31, 2017.
Pursuant to a Shareholder Administrative Services Plan adopted by the Trust’s Board of Trustees, the Funds may enter into agreements with service organizations, such as banks and financial institutions, which may include affiliates of the Adviser (“Service Organizations”), under which they will render shareholder administration support services. Servicing agreements entered into by the Funds will provide that the Service Organizations will render shareholder administrative support services to their customers who are the beneficial owners of shares of the Funds in consideration for a Fund’s payment of up to 0.15% (on an annualized basis) of the average daily net asset value of the shares of the Fund beneficially owned by such customers and held by the Service Organizations. Certain shareholder agreements entered into before December 1, 2015 may provide for payments of up to 0.25% of the average daily net asset value of the shares of the Fund beneficially owned by customers and held by a Service Organization. For the fiscal year ended October 31, 2017, Commerce Bank an affiliate of the Adviser, received $436,340 in shareowner servicing fees.
E. Deferred Compensation Plan — Certain Trustees participate in a Deferred Compensation Plan, as amended and restated (the “Plan”), which allows eligible non-affiliated Trustees as described in the Plan to defer the receipt of all or a portion of the Trustees’ fees payable. Under the Plan, such Trustees have deferred fees treated as if they had been invested by The Commerce Funds in the shares of one or more Funds of the Trust. All amounts payable to the Trustees under the Plan are determined based on the performance of such Funds and are accrued monthly.
|
| 5. PORTFOLIO SECURITIES TRANSACTIONS |
The cost of purchases and proceeds from sales and maturities of long-term securities for the fiscal year ended October 31, 2017, were as follows:
| | | | | | | | | | | | | | | | |
| Fund | | Purchases of
U.S. Government
and Agency
Obligations | | | Purchases
(Excluding
U.S. Government
and Agency
Obligations) | | | Sales and
Maturities of
U.S. Government
and Agency
Obligations | | | Sales
and Maturities
(Excluding
U.S. Government
and Agency
Obligations) | |
Growth | | $ | — | | | $ | 40,608,911 | | | $ | — | | | $ | 34,966,245 | |
Value | | | — | | | | 128,018,847 | | | | — | | | | 178,522,474 | |
MidCap Growth | | | — | | | | 93,920,803 | | | | — | | | | 73,940,973 | |
82
COMMERCE FUNDS
| | |
| 5. PORTFOLIO SECURITIES TRANSACTIONS (continued) | | |
| | | | | | | | | | | | | | | | |
| | | | |
| Fund | | Purchases of
U.S. Government
and Agency
Obligations | | | Purchases
(Excluding
U.S. Government
and Agency
Obligations) | | | Sales and
Maturities of
U.S. Government
and Agency
Obligations | | | Sales
and Maturities
(Excluding
U.S. Government
and Agency
Obligations) | |
Bond | | $ | 45,429,456 | | | $ | 220,162,298 | | | $ | 36,189,262 | | | $ | 245,263,114 | |
Short-Term Government | | | 7,091,213 | | | | 14,131,724 | | | | 19,134,282 | | | | 12,286,120 | |
National Tax-Free Intermediate Bond | | | — | | | | 116,593,559 | | | | — | | | | 117,437,941 | |
Missouri Tax-Free Intermediate Bond | | | — | | | | 55,568,471 | | | | — | | | | 49,029,374 | |
Kansas Tax-Free Intermediate Bond | | | — | | | | 22,505,292 | | | | — | | | | 21,852,200 | |
The tax character of distributions paid during the fiscal year ended October 31, 2017 was as follows:
| | | | | | | | | | | | | | | | |
| | | Growth | | | Value | | | MidCap
Growth | | | Bond | |
Distributions paid from: | | | | | | | | | | | | | | | | |
Ordinary income | | $ | 1,045,003 | | | $ | 8,986,993 | | | $ | 588,285 | | | $ | 34,374,764 | |
Net long-term capital gains | | | 4,175,694 | | | | 4,207,903 | | | | 4,998,011 | | | | 433,651 | |
Total taxable distributions | | $ | 5,220,697 | | | $ | 13,194,896 | | | $ | 5,586,296 | | | $ | 34,808,415 | |
| | | | |
| | | Short-Term
Government | | | National Tax-Free
Intermediate Bond | | | Missouri Tax-Free
Intermediate Bond | | | Kansas Tax-Free
Intermediate Bond | |
Distributions paid from: | | | | | | | | | | | | | | | | |
Ordinary income | | $ | 1,664,495 | | | $ | 1,050,226 | | | $ | 14,462 | | | $ | 2,225 | |
Net long-term capital gains | | | — | | | | 776,499 | | | | — | | | | — | |
Total taxable distributions | | | 1,664,495 | | | | 1,826,725 | | | | 14,462 | | | | 2,225 | |
Total tax-exempt income distributions | | $ | — | | | $ | 6,777,786 | | | $ | 8,407,732 | | | $ | 2,967,063 | |
The tax character of distributions paid during the fiscal year ended October 31, 2016 was as follows: | |
| | | Growth | | | Value | | | MidCap
Growth | | | Bond | |
Distributions paid from: | | | | | | | | | | | | | | | | |
Ordinary income | | $ | 874,215 | | | $ | 7,044,838 | | | $ | 215,141 | | | $ | 35,578,153 | |
Net long-term capital gains | | | 7,079,673 | | | | 19,080,283 | | | | 5,156,141 | | | | 39,593 | |
Total taxable distributions | | $ | 7,953,888 | | | $ | 26,125,121 | | | $ | 5,371,282 | | | $ | 35,617,746 | |
| | | | |
| | | Short-Term
Government | | | National Tax-Free
Intermediate Bond | | | Missouri Tax-Free
Intermediate Bond | | | Kansas Tax-Free
Intermediate Bond | |
Distributions paid from: | | | | | | | | | | | | | | | | |
Ordinary income | | $ | 1,592,309 | | | $ | 30,774 | | | $ | 17,168 | | | $ | 29,580 | |
Total taxable distributions | | | 1,592,309 | | | | 30,774 | | | | 17,168 | | | | 29,580 | |
Total tax-exempt income distributions | | $ | — | | | $ | 6,866,543 | | | $ | 8,004,724 | | | $ | 2,769,858 | |
83
COMMERCE FUNDS
Notes to Financial Statements (continued)
October 31, 2017
| | |
| 6. TAX INFORMATION (continued) | | |
As of October 31, 2017, the components of accumulated earnings (losses) on a tax basis were as follows:
| | | | | | | | | | | | | | | | |
| | | Growth | | | Value | | | MidCap
Growth | | | Bond | |
Undistributed ordinary income — net | | $ | 1,685,311 | | | $ | 328,386 | | | $ | 2,373,111 | | | $ | 2,723,760 | |
Undistributed long-term capital gains | | | 4,881,298 | | | | 24,048,426 | | | | 7,847,858 | | | | — | |
Total undistributed earnings | | $ | 6,566,609 | | | $ | 24,376,812 | | | $ | 10,220,969 | | | $ | 2,723,760 | |
Capital loss carryforward | | | — | | | | — | | | | — | | | | (2,355,150 | ) |
Timing differences (distributions payable, deferred compensation) | | | (30,534 | ) | | | (46,940 | ) | | | (24,491 | ) | | | (2,335,192 | ) |
Unrealized gains (losses) — net | | | 31,735,185 | | | | 31,158,792 | | | | 26,818,365 | | | | 29,392,789 | |
Total accumulated gains (losses) — net | | $ | 38,271,260 | | | $ | 55,488,664 | | | $ | 37,014,843 | | | $ | 27,426,207 | |
| | | | |
| | | Short-Term
Government | | | National Tax-Free
Intermediate Bond | | | Missouri Tax-Free
Intermediate Bond | | | Kansas Tax-Free
Intermediate Bond | |
Undistributed ordinary income — net | | $ | 39,706 | | | $ | — | | | $ | — | | | $ | — | |
Undistributed tax-exempt income | | | — | | | | 986,871 | | | | 711,537 | | | | 267,728 | |
Undistributed long-term capital gains | | | — | | | | 533,310 | | | | — | | | | — | |
Total undistributed earnings | | $ | 39,706 | | | $ | 1,520,181 | | | $ | 711,537 | | | $ | 267,728 | |
Capital loss carryforward | | | (4,483,204 | ) | | | — | | | | (4,179,816 | ) | | | (647,412 | ) |
Timing differences (distributions payable, deferred compensation) | | | (106,163 | ) | | | (608,362 | ) | | | (665,364 | ) | | | (243,134 | ) |
Unrealized gains (losses) — net | | | 281,367 | | | | 8,299,112 | | | | 9,975,012 | | | | 3,972,176 | |
Total accumulated gains (losses) — net | | $ | (4,268,294 | ) | | $ | 9,210,931 | | | $ | 5,841,369 | | | $ | 3,349,358 | |
| | | | |
| | | Bond | | | Short-Term
Government | | | Missouri Tax-Free
Intermediate Bond | | | Kansas Tax-Free
Intermediate Bond | |
Capital loss carryforwards:(1)(2) | | | | | | | | | | | | | | | | |
Expiring 2018 | | $ | — | | | $ | (460,436 | ) | | $ | — | | | $ | — | |
Expiring 2019 | | | — | | | | (375,119 | ) | | | — | | | | — | |
Perpetual Short-term | | | — | | | | (341,974 | ) | | | (259,714 | ) | | | (118,726 | ) |
Perpetual Long-term | | | (2,355,150 | ) | | | (3,305,675 | ) | | | (3,920,102 | ) | | | (528,686 | ) |
Total capital loss carryforwards: | | $ | (2,355,150 | ) | | $ | (4,483,204 | ) | | $ | (4,179,816 | ) | | $ | (647,412 | ) |
| (1) | | Expiration occurs on October 31 of the year indicated. Short-Term Government Fund had a capital loss carry forward of $400,692 that expired in the current fiscal year. |
| (2) | | The Missouri Tax-Free Intermediate Bond Fund utilized $1,028,510 of capital losses in the current fiscal year. |
As of October 31, 2017, the Funds’ aggregate security unrealized gains and losses based on cost for U.S. federal income tax purposes were as follows:
| | | | | | | | | | | | | | | | |
| | | Growth | | | Value | | | MidCap
Growth | | | Bond | |
Tax Cost | | $ | 85,507,843 | | | $ | 222,113,733 | | | $ | 123,794,509 | | | $ | 1,046,534,186 | |
Gross unrealized gain | | | 32,378,208 | | | | 39,434,951 | | | | 28,440,500 | | | | 34,481,889 | |
Gross unrealized loss | | | (643,023 | ) | | | (8,276,159 | ) | | | (1,622,135 | ) | | | (8,089,100 | ) |
Net unrealized security gain | | $ | 31,735,185 | | | $ | 31,158,792 | | | $ | 26,818,365 | | | $ | 29,392,789 | |
84
COMMERCE FUNDS
| | |
| 6. TAX INFORMATION (continued) | | |
| | | | | | | | | | | | | | | | |
| | | | |
| | | Short-Term
Government | | | National Tax-Free
Intermediate Bond | | | Missouri Tax-Free
Intermediate Bond | | | Kansas Tax-Free
Intermediate Bond | |
Tax Cost | | $ | 98,474,708 | | | $ | 331,748,131 | | | $ | 336,751,384 | | | $ | 137,540,811 | |
Gross unrealized gain | | | 2,014,172 | | | | 8,835,117 | | | | 11,047,440 | | | | 4,396,083 | |
Gross unrealized loss | | | (1,732,805 | ) | | | (536,005 | ) | | | (1,072,428 | ) | | | (423,907 | ) |
Net unrealized security gain | | $ | 281,367 | | | $ | 8,299,112 | | | $ | 9,975,012 | | | $ | 3,972,176 | |
The difference between GAAP-basis and tax-basis unrealized gains (losses) are attributable primarily to wash sales and differences in the tax treatment of market discount accretion and premium amortization.
In order to present certain components of the Funds’ capital accounts on a tax-basis, certain reclassifications have been recorded to the Funds’ accounts. These reclassifications have no impact on the net asset value of the Funds and result primarily from dividend redesignations, expired capital loss carryforwards, differences in the tax treatment of underlying fund investments, and the recognition of income and gain/losses of certain bonds.
| | | | | | | | | | | | |
| Fund | | Paid-in Capital | | | Accumulated net realized gain (loss) | | | Undistributed (distributions in excess of) net investment income (loss) | |
Growth | | | — | | | | 5,041 | | | | (5,041 | ) |
Value | | | — | | | | 40,356 | | | | (40,356 | ) |
MidCap Growth | | | — | | | | 48,880 | | | | (48,880 | ) |
Bond | | | — | | | | (6,298,240 | ) | | | 6,298,240 | |
Short-Term Government | | | (400,692 | ) | | | 121,842 | | | | 278,850 | |
National Tax-Free Intermediate Bond | | | — | | | | 32,436 | | | | (32,436 | ) |
Missouri Tax-Free Intermediate Bond | | | | | | | (14,034 | ) | | | 14,034 | |
Commerce and GSAM have reviewed the Funds’ tax positions for all open tax years (the current and prior three fiscal years) and have concluded that no provision for income tax is required in the Funds’ financial statements. Such open tax years remain subject to examination and adjustment by tax authorities.
The Funds’ risks include, but are not limited to, the following:
Credit Risks — The fixed income funds are subject to credit risks because an issuer or guarantor of a fixed income security may be unable or unwilling to make interest and principal payments when due. A bond’s value could decline because of concerns about an issuer’s willingness to make such payments.
Interest Rate Risks — The fixed income funds are subject to interest rate risks. Interest rate risk is the risk that the value of a Fund’s portfolio will decline because of rising interest rates. The magnitude of this decline will often be greater for longer-term, fixed-income securities than shorter-term securities.
85
COMMERCE FUNDS
Notes to Financial Statements (continued)
October 31, 2017
| | |
| 7. OTHER RISKS (continued) | | |
Large Shareholder Purchase and Redemption Risk — A Fund may experience adverse effects when certain large shareholders purchase or redeem large amounts of shares of the Fund. Such large shareholder redemptions may cause the Fund to sell its securities at times when it would not otherwise do so, which may negatively impact the Fund’s net asset value and liquidity. Similarly, large share purchases may adversely affect the Fund’s performance to the extent that the Fund is delayed in investing new cash and is required to maintain a larger cash position than it ordinarily would. In addition, a large redemption could result in a Fund’s current expenses being allocated over a smaller asset base, leading to an increase in the Fund’s expense ratio.
Market Risks — In the normal course of business, the Funds trade financial instruments and enter into financial transactions where risk of potential loss exists due to changes in the market (market risk).
Portfolio Concentrations — The Missouri Tax-Free Intermediate Bond and Kansas Tax-Free Intermediate Bond Funds invest a large percentage of their assets in obligations of issuers within Missouri and Kansas, respectively. Therefore, they are subject to possible concentration risks associated with economic, political or legal developments or industrial or regional matters specifically affecting those states.
Under normal market conditions, the Missouri Tax-Free Intermediate Bond Fund and the Kansas Tax-Free Intermediate Bond Fund invest at least 80% of their assets plus any borrowings for investment purposes (measured at the time of purchase) in Missouri and Kansas municipal securities, respectively, the income from which, in the opinion of bond counsel, is exempt from regular federal income tax, federal alternative minimum taxes and Missouri and Kansas state taxes, respectively. Alternatively, at least 80% of a Fund’s distributed income must be exempt from such taxes. For each of the Missouri and Kansas Tax-Free Funds, the actual payment of principal and interest on Missouri and Kansas municipal securities is dependent on the Missouri General Assembly and the Kansas legislature, respectively, allotting money each fiscal year for these payments.
The investments of the Growth, Value and MidCap Growth Funds may be concentrated in securities of technology companies. At times, securities of technology companies may experience significant price fluctuations. The Value Fund’s performance may be adversely affected by events affecting the financial sectors, if it invests a relatively large percentage of its assets in those sectors. The financial sectors can be significantly affected by changes in interest rates, government regulation, the rate of corporate and consumer debt defaulted, price competition, and the availability and cost of capital. The MidCap Growth Fund concentrates in mid-cap stocks. Investing in smaller and mid-sized companies may be riskier than investing in larger, more established companies.
The Bond and Short-Term Government Funds may invest 80% and 100%, respectively, of their total assets in mortgage-related securities and the Bond Fund may invest 80% of its total assets in asset-backed securities. Mortgage-backed securities, especially collateralized mortgage-backed securities, may be subject to risks that include price volatility, liquidity, and enhanced sensitivity to interest rates. As a result, mortgage-backed securities may be more difficult to value and liquidate, if necessary. Mortgage-backed securities are also subject to prepayment risk, which may result in a decreased rate of return and a decline in the value of the securities. Asset-backed securities are dependent upon payment of the underlying consumer loans or receivables by individuals, and the certificate holder frequently has no recourse against the entity that originated the loans or receivables. Asset backed securities have a greater risk of default during periods of economic downturn than other securities. Also, asset-backed securities may be less liquid than other securities and therefore more difficult to value and liquidate, if necessary.
Quantitative Model Risk — The Growth, Value and MidCap Growth Funds are subject to the risk that securities selected using quantitative models may perform differently from the market as a whole for many reasons, including the factors used in building the model and the weights placed on each factor, among others. The quantitative models used by the Adviser to manage the Growth, Value and MidCap Growth Funds may not perform as expected, particularly in volatile markets.
86
COMMERCE FUNDS
Under the Trust’s organizational documents, its Trustees, officers, employees and agents are indemnified, to the extent permitted by the Act and state law, against certain liabilities that may arise out of performance of their duties to the Funds. Additionally, in the course of business, the Funds enter into contracts that contain a variety of indemnification clauses. The Funds’ maximum exposure under these arrangements is unknown, as this would involve future claims that may be made against the Funds that have not yet occurred. However, in their experience, Commerce and GSAM believe the risk of loss under these arrangements to be remote.
Subsequent events after the Statement of Assets and Liabilities date have been evaluated through the date the financial statements were issued. Commerce and GSAM have concluded that there is no impact requiring adjustment or disclosure in the financial statements.
| | |
| 10. SUMMARY OF SHARE TRANSACTIONS | | |
Share activity is as follows:
| | | | | | | | | | | | | | | | |
| | | Growth Fund | |
| | | For the Fiscal Year Ended
October 31, 2017 | | | For the Fiscal Year Ended
October 31, 2016 | |
| | | Shares | | | Dollars | | | Shares | | | Dollars | |
Shares sold | | | 911,142 | | | $ | 26,599,222 | | | | 989,866 | | | $ | 27,465,641 | |
Reinvestment of distributions | | | 72,596 | | | | 1,941,511 | | | | 98,791 | | | | 2,666,415 | |
Shares redeemed | | | (621,635 | ) | | | (18,351,791 | ) | | | (481,143 | ) | | | (13,098,534 | ) |
| Net Increase | | | 362,103 | | | $ | 10,188,942 | | | | 607,514 | | | $ | 17,033,522 | |
| | | | |
| | | | | | | | | | | | | | | | |
| | | Value Fund | |
| | | For the Fiscal Year Ended
October 31, 2017 | | | For the Fiscal Year Ended
October 31, 2016 | |
| | | Shares | | | Dollars | | | Shares | | | Dollars | |
Shares sold | | | 2,848,235 | | | $ | 90,676,810 | | | | 4,183,165 | | | $ | 123,848,344 | |
Reinvestment of distributions | | | 244,283 | | | | 7,749,125 | | | | 502,160 | | | | 14,302,366 | |
Shares redeemed | | | (4,636,926 | ) | | | (148,162,603 | ) | | | (1,859,915 | ) | | | (54,238,488 | ) |
| Net Increase (Decrease) | | | (1,544,408 | ) | | $ | (49,736,668 | ) | | | 2,825,410 | | | $ | 83,912,222 | |
| | | | |
| | | | | | | | | | | | | | | | |
| | | MidCap Growth Fund | |
| | | For the Fiscal Year Ended
October 31, 2017 | | | For the Fiscal Year Ended
October 31, 2016 | |
| | | Shares | | | Dollars | | | Shares | | | Dollars | |
Shares sold | | | 1,097,391 | | | $ | 40,488,721 | | | | 1,436,765 | | | $ | 48,550,416 | |
Reinvestment of distributions | | | 27,150 | | | | 924,138 | | | | 36,837 | | | | 1,230,493 | |
Shares redeemed | | | (471,473 | ) | | | (17,695,417 | ) | | | (273,896 | ) | | | (9,190,228 | ) |
| Net Increase | | | 653,068 | | | $ | 23,717,442 | | | | 1,199,706 | | | $ | 40,590,681 | |
| | | | |
| | | | | | | | | | | | | | | | |
87
COMMERCE FUNDS
Notes to Financial Statements (continued)
October 31, 2017
| | |
| 10. SUMMARY OF SHARE TRANSACTIONS (continued) | | |
| | | | | | | | | | | | | | | | |
| |
| | | Bond Fund | |
| | | For the Fiscal Year Ended
October 31, 2017 | | | For the Fiscal Year Ended
October 31, 2016 | |
| | | Shares | | | Dollars | | | Shares | | | Dollars | |
Shares sold | | | 12,027,618 | | | $ | 239,610,970 | | | | 13,529,418 | | | $ | 270,561,550 | |
Reinvestment of distributions | | | 443,399 | | | | 8,830,850 | | | | 508,362 | | | | 10,206,297 | |
Shares redeemed | | | (12,980,437 | ) | | | (257,659,012 | ) | | | (8,872,746 | ) | | | (178,144,299 | ) |
| Net Increase (Decrease) | | | (509,420 | ) | | $ | (9,217,192 | ) | | | 5,165,034 | | | $ | 102,623,548 | |
| | | | |
| | | | | | | | | | | | | | | | |
| | | Short-Term Government Fund | |
| | | For the Fiscal Year Ended
October 31, 2017 | | | For the Fiscal Year Ended
October 31, 2016 | |
| | | Shares | | | Dollars | | | Shares | | | Dollars | |
Shares sold | | | 1,804,340 | | | $ | 30,963,212 | | | | 2,100,812 | | | $ | 36,539,855 | |
Reinvestment of distributions | | | 40,313 | | | | 691,657 | | | | 35,914 | | | | 624,482 | |
Shares redeemed | | | (2,279,740 | ) | | | (39,109,834 | ) | | | (1,881,095 | ) | | | (32,683,721 | ) |
| Net Increase (Decrease) | | | (435,087 | ) | | $ | (7,454,965 | ) | | | 255,631 | | | $ | 4,480,616 | |
| | | | |
| | | | | | | | | | | | | | | | |
| | | National Tax-Free Intermediate Bond Fund | |
| | | For the Fiscal Year Ended
October 31, 2017 | | | For the Fiscal Year Ended
October 31, 2016 | |
| | | Shares | | | Dollars | | | Shares | | | Dollars | |
Shares sold | | | 3,299,538 | | | $ | 64,048,861 | | | | 3,616,057 | | | $ | 71,841,884 | |
Reinvestment of distributions | | | 21,268 | | | | 409,297 | | | | 18,535 | | | | 369,139 | |
Shares redeemed | | | (2,618,714 | ) | | | (50,620,662 | ) | | | (1,758,412 | ) | | | (35,062,645 | ) |
| Net Increase | | | 702,092 | | | $ | 13,837,496 | | | | 1,876,180 | | | $ | 37,148,378 | |
| | | | |
| | | | | | | | | | | | | | | | |
| | | Missouri Tax-Free Intermediate Bond Fund | |
| | | For the Fiscal Year Ended
October 31, 2017 | | | For the Fiscal Year Ended
October 31, 2016 | |
| | | Shares | | | Dollars | | | Shares | | | Dollars | |
Shares sold | | | 3,346,269 | | | $ | 64,752,420 | | | | 3,563,754 | | | $ | 70,464,440 | |
Reinvestment of distributions | | | 58,099 | | | | 1,125,126 | | | | 57,640 | | | | 1,140,600 | |
Shares redeemed | | | (3,370,613 | ) | | | (65,025,344 | ) | | | (1,891,100 | ) | | | (37,466,228 | ) |
| Net Increase | | | 33,755 | | | $ | 852,202 | | | | 1,730,294 | | | $ | 34,138,812 | |
| | | | |
| | | | | | | | | | | | | | | | |
| | | Kansas Tax-Free Intermediate Bond Fund | |
| | | For the Fiscal Year Ended
October 31, 2017 | | | For the Fiscal Year Ended
October 31, 2016 | |
| | | Shares | | | Dollars | | | Shares | | | Dollars | |
Shares sold | | | 1,467,374 | | | $ | 28,250,300 | | | | 1,712,669 | | | $ | 33,667,785 | |
Reinvestment of distributions | | | 15,267 | | | | 293,726 | | | | 16,484 | | | | 324,635 | |
Shares redeemed | | | (1,237,025 | ) | | | (23,708,671 | ) | | | (750,324 | ) | | | (14,776,648 | ) |
| Net Increase | | | 245,616 | | | $ | 4,835,355 | | | | 978,829 | | | $ | 19,215,772 | |
88
COMMERCE FUNDS
Report of Independent Registered Public Accounting Firm
To the Shareholders and Board of Trustees of
The Commerce Funds:
We have audited the accompanying statement of assets and liabilities of the Growth Fund, Value Fund, MidCap Growth Fund, Bond Fund, Short-Term Government Fund, National Tax-Free Intermediate Bond Fund, Missouri Tax-Free Intermediate Bond Fund, and Kansas Tax-Free Intermediate Bond Fund, each a series of The Commerce Funds, including the schedule of investments, as of October 31, 2017, and the related statement of operations for the year then ended, the statements of changes in net assets for each of the years in the two-year period then ended, and the financial highlights for each of the years in the five-year period then ended. These financial statements and financial highlights are the responsibility of The Commerce Funds’ management. Our responsibility is to express an opinion on these financial statements and financial highlights based on our audits.
We conducted our audits in accordance with the standards of the Public Company Accounting Oversight Board (United States). Those standards require that we plan and perform the audit to obtain reasonable assurance about whether the financial statements and financial highlights are free of material misstatement. An audit includes examining, on a test basis, evidence supporting the amounts and disclosures in the financial statements. Our procedures included confirmation of securities owned as of October 31, 2017, by correspondence with custodians and brokers. An audit also includes assessing the accounting principles used and significant estimates made by management, as well as evaluating the overall financial statement presentation. We believe that our audits provide a reasonable basis for our opinion.
In our opinion, the financial statements and financial highlights referred to above present fairly, in all material respects, the financial position of The Commerce Funds as of October 31, 2017, the results of its operations for the year then ended, the changes in its net assets for each of the years in the two-year period then ended, and the financial highlights for each of the years in the five-year period then ended, in conformity with U.S. generally accepted accounting principles.

Boston, Massachusetts
December 21, 2017
89
90
COMMERCE FUNDS
Fund Expenses – Period Ended October 31, 2017 (Unaudited)
As a shareholder of the Funds you incur two types of costs: (1) transaction costs and (2) ongoing costs, including management fees; shareholder servicing fees and other Fund expenses. This Example is intended to help you understand your ongoing costs (in dollars) of investing in the Fund and to compare these costs with the ongoing costs of investing in other mutual funds.
The Example is based on an investment of $1,000 invested at the beginning of the period and held for the entire period from May 1, 2017 through October 31, 2017, which represents a period of 184 days in a 365-day year.
Actual Expenses — The first line in the table below provides information about actual account values and actual expenses. You may use the information in this line, together with the amount you invested, to estimate the expenses that you paid over the period. Simply divide your account value by $1,000 (for example, an $8,600 account value divided by $1,000=8.6), then multiply the result by the number in the first line under the heading entitled “Expenses Paid” to estimate the expenses you paid on your account during this period.
Hypothetical Example for Comparison Purposes — The second line in the table below provides information about hypothetical account values and hypothetical expenses based on the Funds’ actual net expense ratios and an assumed rate of return of 5% per year before expenses, which is not the Funds’ actual return. The hypothetical account values and expenses may not be used to estimate the actual ending account balance or expenses you paid for the period. You may use this information to compare the ongoing costs of investing in the Funds and other funds. To do so, compare this 5% hypothetical example with the 5% hypothetical examples that appear in the shareholder reports of the other funds.
Please note that the expenses shown in the table are meant to highlight your ongoing costs only and do not reflect any transactional costs, such as exchange fees, but shareholders of other funds may incur such costs. Therefore, the second line of the table is useful in comparing ongoing costs only, and will not help you determine the relative total costs of owning different funds. In addition, if these transactional costs were included, your costs would have been higher.
| | | | | | | | | | | | | | | | | | | | | | | | | | | | | | | | | | | | | | | | | | | | | | | | |
| | | Beginning
Account
Value
5/1/17 | | | Ending
Account
Value
10/31/17 | | | Expenses
Paid for
the
6 months
ended
10/31/17* | | | Beginning
Account
Value
5/1/17 | | | Ending
Account
Value
10/31/17 | | | Expenses
Paid for
the
6 months
ended
10/31/17* | | | Beginning
Account
Value
5/1/17 | | | Ending
Account
Value
10/31/17 | | | Expenses
Paid for
the
6 months
ended
10/31/17* | | | Beginning
Account
Value
5/1/17 | | | Ending
Account
Value
10/31/17 | | | Expenses
Paid for the
6 months
ended
10/31/17* | |
| Fund | | Growth Fund | | | Value Fund | | | MidCap Growth Fund | | | Bond Fund | |
Shares | | | | | | | | | | | | | | | | | | | | | | | | | | | | | | | | | | | | | | | | | | | | | | | | |
| Actual | | $ | 1,000.00 | | | $ | 1,103.00 | | | $ | 4.19 | | | $ | 1,000.00 | | | $ | 1,051.40 | | | $ | 3.62 | | | $ | 1,000.00 | | | $ | 1,084.40 | | | $ | 4.31 | | | $ | 1,000.00 | | | $ | 1,022.50 | | | $ | 3.42 | |
| Hypothetical 5% return | | | 1,000.00 | | | | 1,021.22 | | | | 4.02 | | | | 1,000.00 | | | | 1,021.68 | | | | 3.57 | | | | 1,000.00 | | | | 1,021.07 | | | | 4.18 | | | | 1,000.00 | | | | 1,021.83 | | | | 3.41 | |
| | | Short-Term Government Fund | | | National Tax-Free Intermediate
Bond Fund | | | Missouri Tax-Free Intermediate
Bond Fund | | | Kansas Tax-Free Intermediate
Bond Fund | |
Shares | | | | | | | | | | | | | | | | | | | | | | | | | | | | | | | | | | | | | | | | | | | | | | | | |
| Actual | | $ | 1,000.00 | | | $ | 1,004.30 | | | $ | 3.44 | | | $ | 1,000.00 | | | $ | 1,021.60 | | | $ | 3.11 | | | $ | 1,000.00 | | | $ | 1,021.26 | | | $ | 3.11 | | | $ | 1,000.00 | | | $ | 1,018.00 | | | $ | 3.56 | |
| Hypothetical 5% return | | | 1,000.00 | | | | 1,021.78 | | | | 3.47 | | | | 1,000.00 | | | | 1,022.13 | | | | 3.11 | | | | 1,000.00 | | | | 1,022.13 | | | | 3.11 | | | | 1,000.00 | | | | 1,021.68 | | | | 3.57 | |
| * | | Expenses are calculated using each Fund’s annualized net expense ratio, which represents the ongoing expenses as a percentage of net assets for the six months ended October 31, 2017. Expenses are calculated by multiplying the annualized net expense ratio by the average account value for the period; then multiplying the result by the number of days in the most recent fiscal half year; and then dividing that result by the number of days in the year. The annualized net expense ratios for the period were as follows: |
| | | | | | | | | | | | | | |
Fund | | | | | | | | Fund | | | |
| Growth | | | 0.79 | % | | | | | | Short-Term Government | | | 0.68 | % |
| Value | | | 0.70 | | | | | | | National Tax-Free Intermediate Bond | | | 0.61 | |
| MidCap Growth | | | 0.82 | | | | | | | Missouri Tax-Free Intermediate Bond | | | 0.64 | |
| Bond | | | 0.67 | | | | | | | Kansas Tax-Free Intermediate Bond | | | 0.70 | |
| + | | Hypothetical expenses are based on the Funds’ actual net expense ratios and an assumed rate of return of 5% per year before expenses. |
COMMERCE FUNDS
Trustees and Officers (Unaudited)
The Board of Trustees of the Trust is responsible for the management of the business and affairs of the Trust. The Trustees and officers of the Trust and their principal occupations for the last five years are set forth below. Trustees who are not deemed to be “interested persons” of the Trust as defined in the Act are referred to as “Independent Trustees.” Trustees who are deemed to be “interested persons” of the Trust are referred to as “Interested Trustees.” The Commerce Funds’ statement of additional information (“SAI”), which includes additional information about the Trustees, is available and may be obtained without charge by calling 1-800-995-6365.
Each Trustee holds office for an indefinite term until the earliest of: (a) the election of his successor; (b) the date a trustee dies, resigns or is removed by at least two-thirds of the Board of Trustees in accordance with the Trust’s Declaration of Trust; (c) in accordance with the by-laws of the Trust (which may be changed by the Trustees without shareholder approval) at the end of the calendar year during which the Trustee attains the age of 75 years; unless the Board, in its discretion, votes to retain a trustee or (d) the Trust terminates. Each officer holds office for an indefinite term until the earliest of: (a) the election of his successor; (b) the date an officer dies, resigns or is removed by the Board of Trustees in accordance with the Trust’s by-laws; or (c) the Trust terminates.
Independent Trustees
| | | | | | | | | | |
Name,
Address and Age | | Position(s)
Held with
The Trust | | Length of
Time
Served1 | | Principal Occupation(s)
During Past 5 Years | | Number of
Funds in
Fund
Complex2
Overseen
by Trustee | | Other Directorships Held
During Past 5 Years3 |
David L. Bodde c/o The Commerce Funds 922 Walnut Street Kansas City, MO 64106 Age: 74 | | Lead Independent Trustee | | 23 years | | Emeritus Professor, International Center for Automotive Research, Clemson University, since 2016; Consultant, Ewing Marion Kauffman Foundation, since 2017; Professor, International Center for Automotive Research, Clemson University, from 2004 to 2016; Charles N. Kimball Professor of Technology and Innovation, University of Missouri, Kansas City, from July 1996 to July 2004. | | 8 | | Director, Great Plains Energy Inc., since 1994. |
| | | | | |
*Scott D. Monette c/o The Commerce Funds 922 Walnut Street Kansas City, MO 64106 Age: 56 | | Trustee | | Since August 2017 | | Chief Executive Officer, Big Heart Wines LLC, since 2013; Director, Spartan Light Metal Products, Inc., since 2014; Chief Financial Officer, from 2011 to 2013, Corporate Vice President, Treasurer and Corporate Development Officer, from 2001 to 2011, Ralcorp Holdings, Inc. | | 8 | | None |
| | | | | |
**Charles W. Peffer c/o The Commerce Funds 922 Walnut Street Kansas City, MO 64106 Age: 70 | | Trustee | | 14 years | | Retired. Former Partner and Managing Partner of KPMG LLP until September 2002. | | 8 | | Director, Garmin Ltd. (aviation and consumer technology), since 2004; Director, NPC International Inc. (restaurant and business), from 2006 to December 2011 and since 2012; Director, Sensata Technologies Holding N.V. (sensors and control systems for various manufacturing products), since 2010; Director, HD Supply Holdings, Inc. (industrial distributor of products and services in North America), since 2013. |
91
COMMERCE FUNDS
Trustees and Officers (Unaudited) (continued)
Independent Trustees (continued)
| | | | | | | | | | |
Name,
Address and Age | | Position(s)
Held with
The Trust | | Length of
Time
Served1 | | Principal Occupation(s)
During Past 5 Years | | Number of
Funds in
Fund
Complex2
Overseen
by Trustee | | Other Directorships Held
During Past 5 Years3 |
Erika Z. Schenk c/o The Commerce Funds 922 Walnut Street Kansas City, MO 64106 Age: 45 | | Trustee | | Since August 2017 | | General Counsel and Vice President of Compliance, World Wide Technology, Inc., since 2014; Senior Counsel, The Boeing Company, from 2011 to 2014. | | 8 | | None |
| | | | | |
James M. Snowden, Jr. c/o The Commerce Funds 922 Walnut Street Kansas City, MO 64106 Age: 74 | | Trustee | | 7 years | | Executive Vice President, Huntleigh Securities Corporation, since 1995. | | 8 | | None |
| | | | | |
| Interested Trustee | | | | | | | | | | |
| | | | | |
***Martin E. Galt, III c/o The Commerce Funds 922 Walnut Street Kansas City, MO 64106 Age: 75 | | Trustee and Chairman | | 13 years | | Chairman, Commerce Family Office, since December 1, 2011; Chairman, The Commerce Trust Company, September 1, 2004 to October 31, 2010; President, Investment Products, TIAA-CREF, January 1999 to October 2003. | | 8 | | None |
| 1 | | Each Trustee holds office for an indefinite term until the earliest of: (a) the election of his or her successor; (b) the date a Trustee dies, resigns or is removed by at least two-thirds of the Board in accordance with the Trust’s Declaration of Trust; (c) in accordance with the by-laws of the Trust (which may be changed by the Trustees without shareholder approval) at the end of the calendar year during which the Trustee attains the age of 75 years, unless the Board, in its discretion, votes to retain a Trustee; or (d) the Trust terminates. |
| 2 | | The “Fund Complex” consists of the Trust. |
| 3 | | Directorships of companies required to report to the SEC under the Securities Exchange Act of 1934 (i.e., “public companies”) or other investment companies registered under the 1940 Act. |
| * | | Mr. Monette has obtained a $1.5 million line of credit from Commerce Bank, N.A. (“Commerce Bank”), a subsidiary of Commerce Bancshares, the parent company of the Adviser, for purposes of his business. The line of credit is secured by assets in a trust owned by Mr. Monette’s wife. The largest amount of the loan outstanding during the two most recently completed calendar years was $225,704, and the amount outstanding as of December 31, 2016 was $199,800. The line of credit and its terms, including the rate of interest, were negotiated at arms’ length and are consistent with the terms and pricing of other similar lines of credit extended by Commerce Bank, and Mr. Monette was not provided with any preferential terms. For this reason, Mr. Monette is not considered to have a material business or professional relationship with the Adviser or its affiliates. |
| ** | | Mr. Peffer serves as an independent director of Lockton Inc. (“Lockton”), a privately owned company (since 2013). Lockton serves as the Funds’ insurance broker. Commerce Bancshares, parent company of the Adviser, pays Lockton an annual fee for insurance brokerage services provided to both the Funds and Commerce Bancshares in the amount of approximately $365,000 (the “Transaction”). The Transaction is not considered material to Lockton or Commerce Bancshares, and Mr. Peffer is not considered to have a material business relationship with either the Adviser or the Trust under the 1940 Act as a result of the Transaction. |
| ***Mr. | | Galt is an interested person of the Trust because he owns shares of the Adviser’s parent company, Commerce Bancshares, and because he also currently serves as Chairman of the Commerce Family Office. |
92
COMMERCE FUNDS
Officers
| | | | | | |
Name,
Address and Age | | Position(s) Held with The Trust | | Length of Time Served | | Principal Occupation(s) During Past 5 Years |
William R. Schuetter Commerce Investment Advisors, Inc. 922 Walnut Street Kansas City, MO 64106 Age: 57 | | President | | 9 years | | Chief Operations Officer, Commerce Investment Advisors, Inc., since May 2001; Director, Commerce Investment Advisors, Inc., since April 2008; Vice President, Commerce Bank, since 1998; President, The Commerce Funds, since May 2008. |
| | | |
Laura Spidle Commerce Investment Advisors, Inc. 922 Walnut Street Kansas City, MO 64106 Age: 48 | | Secretary, Chief Compliance Officer, Vice President and Anti-Money Laundering Officer | | Since August 2017 | | Compliance Manager, American Century Investments, 2004-2017. |
| | | |
Gordon Lui Goldman Sachs & Co. LLC 200 West Street New York, NY 10282 Age: 36 | | Treasurer | | Since August 2016 | | Vice President, Goldman Sachs Asset Management, Global Fund Services Group, since January 2011. |
| | | |
Peter W. Fortner Goldman Sachs & Co. LLC 30 Hudson Street Jersey City, NJ 07302 Age: 59 | | Chief Accounting Officer | | 10 years | | Vice President, Goldman Sachs & Co. LLC, since July 2000; Assistant Treasurer, Goldman Sachs Mutual Fund Complex, since July 2000. |
| | | |
Philip V. Giuca, Jr. Goldman Sachs & Co. LLC 30 Hudson Street Jersey City, NJ 07302 Age: 55 | | Assistant Treasurer | | 19 years | �� | Managing Director, Goldman Sachs & Co. LLC, since January 2014; Vice President, Goldman Sachs & Co. LLC, May 1992 to December 2013; Assistant Secretary, The Goldman Sachs Group Inc., and Assistant Treasurer, Goldman Sachs Mutual Fund Complex, since 2000. |
| | | |
Joseph McClain Goldman Sachs & Co. LLC 200 West Street New York, NY 10282 Age: 33 | | Assistant Secretary | | Since November 2017 | | Vice President and Assistant General Counsel, Goldman Sachs Asset Management, since February 2016; Associate, Dechert LLP, April 2012 to January 2016. |
| | | |
Jeffrey Bolin Commerce Investment Advisors, Inc. 922 Walnut Street Kansas City, MO 64106 Age: 50 | | Vice President | | 9 years | | Vice President and Business Manager, The Commerce Funds, since November 2013; Vice President and Business Manager, Commerce Investment Advisors, Inc., since March 2012; Assistant Vice President and Business Manager, The Commerce Funds, from November 2008 to November 2013; Assistant Vice President and Business Manager, Commerce Investment Advisors, Inc., November 2008 to March 2012. |
93
COMMERCE FUNDS
The Commerce Funds
Growth Fund:
The Fund is subject to market risk so that the value of the securities in which it invests may go up or down in response to the prospects of individual companies, particular industry sectors and/or general economic conditions. Investments in technology companies, which may produce or use products or services that prove commercially unsuccessful or become obsolete, may be subject to greater price volatility than securities of companies in other sectors. The Fund is also subject to quantitative model risk, which is the risk that securities selected using quantitative models may perform differently from the market as a whole for many reasons, including the factors used in building the model and the weights placed on each factor, among others. The quantitative model used by the Adviser to manage the Fund may not perform as expected, particularly in volatile markets.
Value Fund:
The Fund is subject to market risk so that the value of the securities in which it invests may go up or down in response to the prospects of individual companies, particular industry sectors and/or general economic conditions. Investments in technology companies, which may produce or use products or services that prove commercially unsuccessful or become obsolete, may be subject to greater price volatility than securities of companies in other sectors. The Value Fund’s performance may be adversely affected by events affecting the financial sectors, if it invests a relatively large percentage of its assets in those sectors. The financial sectors can be significantly affected by changes in interest rates, government regulation, the rate of corporate and consumer debt defaulted, price competition, and the availability and cost of capital. The Fund is also subject to quantitative model risk, which is the risk that securities selected using quantitative models may perform differently from the market as a whole for many reasons, including the factors used in building the model and the weights placed on each factor, among others. The quantitative model used by the Adviser to manage the Fund may not perform as expected, particularly in volatile markets.
MidCap Growth Fund:
The Fund is subject to market risk so that the value of the securities in which it invests may go up or down in response to the prospects of individual companies, particular industry sectors and/or general economic conditions. Investments in technology companies, which may produce or use products or services that prove commercially unsuccessful or become obsolete, may be subject to greater price volatility than securities of companies in other sectors. The Fund invests in small- and mid-capitalization securities. Generally, smaller and mid-sized companies are more vulnerable to adverse developments because of more limited product lines, markets or financial resources. As a result, the securities of smaller and mid-sized companies may involve greater risks than those associated with larger, more established companies and may be subject to more abrupt or erratic trading and price movements. The Fund is also subject to quantitative model risk, which is the risk that securities selected using quantitative models may perform differently from the market as a whole for many reasons, including the factors used in building the model and the weights placed on each factor, among others. The quantitative model used by the Adviser to manage the Fund may not perform as expected, particularly in volatile markets.
Bond Fund:
Investments in fixed income securities are subject to the risks associated with debt securities including credit and interest rate risk. The guarantee on U.S. government securities applies only to the underlying securities of the Fund if held to maturity and not to the value of the Fund’s shares. Mortgage-backed securities, especially collateralized mortgage-backed securities, may be subject to risks that include price volatility, liquidity and enhanced sensitivity to interest rates. Asset-backed securities may be less liquid than other securities and therefore more difficult to value and liquidate, if necessary.
94
COMMERCE FUNDS
Short-Term Government Fund:
Investments in fixed income securities are subject to the risks associated with debt securities including credit and interest rate risk. The guarantee on U.S. government securities applies only to the underlying securities of the Fund if held to maturity and not to the value of the Fund’s shares. Mortgage-backed securities, especially collateralized mortgage-backed securities, may be subject to risks that include price volatility, liquidity and enhanced sensitivity to interest rates.
National Tax-Free Intermediate Bond Fund:
Investments in fixed income securities are subject to the risks associated with debt securities including credit and interest rate risk. Investments in municipal securities can be significantly affected by political changes as well as uncertainties in the municipal market related to taxation or legislative changes. The Fund’s investments may subject shareholders to the federal alternative minimum tax and state income taxes.
Missouri Tax-Free Intermediate Bond Fund:
Investments in fixed income securities are subject to the risks associated with debt securities including credit and interest rate risk. The Fund invests its assets predominately in Missouri bonds. The actual payment of principal and interest on these bonds is dependent on the Missouri General Assembly allotting money each fiscal year for these payments. The Fund is non-diversified. Due to the small number of bonds generally held in the portfolio, the Fund may be subject to greater risks than a more diversified fund. A change in the value of any single holding may affect the overall value more than it would affect a diversified fund that holds more investments. Investments in municipal securities can be significantly affected by political changes as well as uncertainties in the municipal market related to taxation or legislative changes. In addition, the Fund’s investments may subject shareholders to federal alternative minimum tax. The investment income from this Fund may be subject to state income taxes.
Kansas Tax-Free Intermediate Bond Fund:
Investments in fixed income securities are subject to the risks associated with debt securities including credit and interest rate risk. The Fund invests its assets predominately in Kansas bonds. The actual payment of principal and interest on these bonds is dependent on the Kansas legislature allotting money each fiscal year for these payments. The Fund is non-diversified. Due to the small number of bonds generally held in the portfolio, the Fund may be subject to greater risks than a more diversified fund. A change in the value of any single holding may affect the overall value more than it would affect a diversified fund that holds more investments. Investments in municipal securities can be significantly affected by political changes as well as uncertainties in the municipal market related to taxation or legislative changes. In addition, the Fund’s investments may subject shareholders to federal alternative minimum tax. The investment income from this Fund may be subject to state income taxes.
95
COMMERCE FUNDS
The Commerce Funds (continued)
Commerce Funds Tax Information (Unaudited)
For the year ended October 31, 2017, 99.90%, 99.31%, and 94.84% of the dividends paid from net investment company taxable income by the Growth, Value, and Mid Cap Growth Funds, respectively, qualify for the dividends received deduction available to corporations.
For the year ended October 31, 2017, 100%, 97.97%, and 100% of the dividends paid from net investment company taxable income by the Growth, Value, and Mid Cap Growth Funds, respectively, qualify for the reduced tax rate under the Jobs and Growth Tax Relief and Reconciliation Act of 2003.
Pursuant to Section 852 of the Internal Revenue Code, the Growth, Value, Mid Cap Growth, Bond and National Tax-Free Intermediate Bond Funds designate $4,175,694, $4,207,903, $4,998,011, $433,651 and $776,499, respectively, or, if different, the maximum amount allowable, as capital gain dividends paid during the year ended October 31, 2017.
During the year ended October 31, 2017, 94.64%, 99.83%, and 99.93%, of the distributions from net investment income paid by the National Tax-Free Intermediate Bond, Missouri Tax-Free Intermediate Bond, and Kansas Tax-Free Intermediate Bond Funds, respectively, were exempt-interest dividends and as such, are not subject to U.S. Federal income tax.
During the year ended October 31, 2017, the Growth, Value, and National Tax-Free Intermediate Bond Funds designate $245,009, $1,309,047 and $664,509, respectively, as short-term capital gain dividends pursuant to Section 871(k) of the Internal Revenue Code.
During the year ended October 31, 2017, 100% of the distributions paid from net investment company taxable income by the Bond and Short-Term Government Funds, respectively, are designated as interest-related dividends pursuant to section 871(k) of the Internal Revenue Code.
96
ADVISER AND CO-ADMINISTRATOR
Commerce Investment Advisors, Inc.
922 Walnut Street 4th Floor
Kansas City,
Missouri 64106
CUSTODIAN/ACCOUNTING AGENT
State Street Bank & Trust Company
1 Lincoln Street
Boston, Massachusetts 02111
TRANSFER AGENT
Boston Financial Data Services, Inc.
330 W. 9th
4th Floor
Kansas City, Missouri 64105
DISTRIBUTOR
Goldman, Sachs & Co LLC
200 West Street
New York, New York 10282
CO-ADMINISTRATOR
Goldman Sachs Asset Management, L.P. 200 West Street
New York, New York 10282
INDEPENDENT REGISTERED PUBLIC ACCOUNTING FIRM
KPMG LLP
Two Financial Center
60 South St.
Boston, MA 02111
LEGAL COUNSEL
Drinker Biddle & Reath LLP One Logan Square
Suite 2000
Philadelphia, Pennsylvania 19103-6996
This Annual Report contains facts concerning The Commerce Funds’ objectives and policies, management, expenses, and other information. For more complete information about The Commerce Funds, a prospectus may be obtained by calling 1-800-995-6365. An investor should read the prospectus carefully before investing or sending money.
The Commerce Funds are advised by Commerce Investment Advisors, Inc., a subsidiary of Commerce Bank, which receives a fee for its services.The Commerce Funds are distributed by Goldman, Sachs & Co LLC.
The Commerce Funds file their complete schedule of portfolio holdings with the Securities and Exchange Commission (the “SEC”) for the first and third quarters of each fiscal year on Form N-Q.The Funds’ Form N-Q is available on the SEC’s website at http://www.sec.gov. You may also review and obtain copies at the SEC’s Public Reference Room in Washington, D.C. Information about the Public Reference Room may be obtained by calling 1-800-SEC-0330.
A description of the policies and procedures that The Commerce Funds use to determine how to vote proxies relating to portfolio securities and information regarding how the Funds voted proxies relating to portfolio securities during the most recent 12-month period ended June 30 is available (i) without change, upon request by calling 1-800-995-6365 and (ii) on the SEC’s website at http://www.sec.gov.
This material is not authorized for distribution to prospective investors unless preceded or accompanied by a current Prospectus. Investors should consider the Commerce Funds’ investment objectives, risks, and charges and expenses, and should read the Prospectus carefully before investing or sending money. The Prospectus contains this and other information about a Fund and may be obtained from your authorized dealer or from The Commerce Funds by calling
1-800-995-6365.
NOT FDIC INSURED
MAY LOSE VALUE
NO BANK GUARANTEE

| Martin | E. Galt III, Chairman |
| David | L. Bodde, Lead Independent Trustee |
| Scott | Monette Charles W. Peffer Erika Schenk James M. Snowden, Jr. |
| William | Schuetter, President |
| Laura | Spidle, Vice President, Chief Compliance officer, Anti-Money |
| Laundering | Officer and Secretary |
| Jeffrey | Bolin, Vice President |
| Peter | W. Fortner, Chief Accounting Officer |
| Philip | V. Giuca Jr., Assistant Treasurer |
| Joseph | McClain, Assistant Secretary |
| Kansas | City, Missouri 64106 www.commercefunds.com 1-800-995-6365 |
(a) As of the end of the period covered by this report, the Registrant has adopted a code of ethics, the Code of Conduct for Senior Officers, that applies to the Registrant’s principal executive officer, principal financial officer, principal accounting officer or controller or persons performing similar functions, regardless of whether these individuals are employed by the Registrant or a third party. A copy of the Code of Conduct for Senior Officers is filed herein under Item 13(a)(1).
(c) During the period covered by this report, no amendments were made to the provisions of the Code of Conduct for Senior Officers.
(d) During the period covered by this report, the Registrant did not grant any waivers, including an implicit waiver, from any provision of the Code of Conduct for Senior Officers.
| ITEM 3. | | AUDIT COMMITTEE FINANCIAL EXPERT. |
The Registrant’s Board of Trustees has determined that the Registrant has at least one “audit committee financial expert” (as defined in Item 3 of Form N-CSR) serving on its Audit Committee. Charles W. Peffer is the “audit committee financial expert” and is “independent” (as each of these terms is defined in Item 3 of Form N-CSR).
Under applicable securities laws and regulations, a person who is determined to be an audit committee financial expert will not be deemed an “expert” for any purpose, including without limitation for purposes of Section 11 of the Securities Act of 1933, as amended, as a result of being designated or identified as an audit committee financial expert. The designation or identification of a person as an audit committee financial expert does not impose on such person any duties, obligations, or liability that are greater than the duties, obligations, and liability imposed on such person as a member of the Registrant’s Audit Committee and Board of Trustees in the absence of such designation or identification. The designation or identification of a person as an audit committee financial expert does not affect the duties, obligations or liability of any other member of the Registrant’s Audit Committee or Board of Trustees.
| ITEM 4. | | PRINCIPAL ACCOUNTANT FEES AND SERVICES. |
(a) Audit Fees. The aggregate fees billed for each of the last two fiscal years for professional services rendered by the Registrant’s principal accountant for the audit of the Registrant’s annual financial statements or services that are normally provided by the accountant in connection with statutory and regulatory filings or engagements were $148,350 and $142,725 for fiscal years ended October 31, 2017 and 2016, respectively.
(b) Audit-Related Fees. There were no fees billed in either of the last two fiscal years for assurance and related services by the Registrant’s principal accountant reasonably related to the performance of the audit of the Registrant’s financial statements that were not reported under paragraph (a) of this item.
(c) Tax Fees. The aggregate fees billed in each of the last two fiscal years for professional services rendered by the principal accountant for tax compliance, tax advice and tax planning were $44,520 and $42,820 for the fiscal years ended October 31, 2017 and 2016, respectively. Tax fees for the fiscal years ended October 31, 2017 and 2016 consist of tax compliance services rendered to the Registrant. These services include the preparation of federal and state corporate tax returns and excise tax returns, as well as services relating to excise tax distribution requirements.
(d) All Other Fees. There were no fees billed in either of the last two fiscal years for products and services provided by the Registrant’s principal accountant, other than the services reported in paragraphs (a) through (c) of this Item.
(e)(l) Pursuant to a Board resolution adopted on February 10, 2004, to the extent required by applicable regulations, all audit and non-audit services provided by the independent accountants shall be pre-approved either: (a) by the Registrant’s Audit Committee as a whole; or (b) between meetings of the Audit Committee by the Chairman of the Audit Committee and the Registrant’s designated Audit Committee Financial Expert, provided that, in each case, such pre-approvals must be reported to the full Audit Committee at its next meeting.
(e)(2) There were no services described in each of paragraphs (b) through (d) of this item that were approved by the Audit Committee pursuant to paragraph (c)(7)(i)(C) of Rule 2-01 of Regulation S-X.
(f) Not applicable. The percentage of hours expended on the principal accountant’s engagement to audit the Registrant’s financial statements for the most recent fiscal year that were attributed to work performed by persons other than the principal accountant’s full-time, permanent employees was zero percent (0%).
(g) The aggregate non-audit fees billed by the Registrant’s accountant for services rendered to the Registrant, and rendered to the Registrant’s investment adviser and any entity controlling, controlled by or under common control with the adviser that provides ongoing services to the Registrant for each of the last two fiscal years of the Registrant were $287,132 and $251,109 for the fiscal years ended October 31, 2017 and 2016, respectively.
(h) The Registrant’s Audit Committee has considered whether the provision of non-audit services that were rendered to the Registrant’s investment adviser and any entity controlling, controlled by, or under common control with the investment adviser that provides ongoing services to the Registrant that were not pre-approved pursuant to paragraph (c)(7)(ii) of Rule 2-01 of Regulation S-X is compatible with maintaining the principal accountant’s independence.
| ITEM 5. | | AUDIT COMMITTEE OF LISTED REGISTRANTS. |
Not applicable.
| ITEM 6. | | SCHEDULE OF INVESTMENTS. |
(a) The Schedule of Investments is included as part of the Report to Shareholders filed under Item 1.
(b) Not applicable.
| ITEM 7. | | DISCLOSURE OF PROXY VOTING POLICIES AND PROCEDURES FOR CLOSED-END MANAGEMENT |
Not applicable.
| ITEM 8. | | PORTFOLIO MANAGERS OF CLOSED-END MANAGEMENT INVESTMENT COMPANIES. |
Not applicable.
| ITEM 9. | | PURCHASES OF EQUITY SECURITIES BY CLOSED-END MANAGEMENT INVESTMENT COMPANY AND |
Not applicable.
| ITEM 10. | | SUBMISSION OF MATTERS TO A VOTE OF SECURITY HOLDERS. |
There has been no material change to the procedures by which shareholders may recommend nominees to the Registrant’s Board of Trustees.
| ITEM 11. | | CONTROLS AND PROCEDURES. |
| | (a) | | The Registrant’s principal executive and principal financial officers or persons performing similar functions have concluded that the Registrant’s disclosure controls and procedures (as defined in Rule 30a-3(c) under the Investment Company Act of 1940, as amended (the “1940 Act”)) are effective as of a date within 90 days of the filing of this report, based on the evaluation of these controls and procedures required by Rule 30a-3(b) under the 1940 Act and Rule 15d-15(b) under the Securities Exchange Act of 1934, as amended. |
| | (b) | | There were no changes in the Registrant’s internal control over financial reporting (as defined in Rule 30a-3(d) under the 1940 Act) that occurred during the second fiscal quarter of the period covered by this report that has materially affected, or is reasonably likely to materially affect, the Registrant’s internal control over financial reporting. |
| ITEM 12. | | DISCLOSURE OF SECURITIES LENDING ACTIVITIES FOR CLOSED-END MANAGEMENT INVESTMENT COMPANIES. |
Not applicable.
| | | | |
| |
| (a)(1) | | The Commerce Funds’ Code of Conduct for Senior Officers is attached hereto. |
| | |
| (a)(2) | | Exhibit 99.CERT | | Certifications pursuant to Section 302 of the Sarbanes-Oxley Act of 2002 are filed herewith. |
| |
| (a)(3) | | Not applicable. |
| | |
| (b) | | Exhibit 99.906CERT | | Certifications pursuant to Section 906 of the Sarbanes-Oxley Act of 2002 are filed herewith. |
SIGNATURES
Pursuant to the requirements of the Securities Exchange Act of 1934 and the Investment Company Act of 1940, the Registrant has duly caused this report to be signed on its behalf by the undersigned, thereunto duly authorized.
|
| THE COMMERCE FUNDS |
|
| /s/ Bill Schuetter |
| Bill Schuetter |
| President |
| January 5, 2018 |
Pursuant to the requirements of the Securities Exchange Act of 1934 and the Investment Company Act of 1940, this report has been signed below by the following persons on behalf of the Registrant and in the capacities and on the dates indicated.
|
|
| /s/ Bill Schuetter |
| Bill Schuetter |
| President |
| The Commerce Funds |
| January 5, 2018 |
|
|
| /s/ Peter Fortner |
| Peter Fortner |
| Chief Accounting Officer |
| The Commerce Funds |
| January 5, 2018 |