UNITED STATES
SECURITIES AND EXCHANGE COMMISSION
Washington, D.C. 20549
FORM N-CSR
CERTIFIED SHAREHOLDER REPORT OF REGISTERED MANAGEMENT
INVESTMENT COMPANIES
Investment Company Act file number 811-8598
The Commerce Funds
(Exact name of Registrant as specified in charter)
|
| 922 Walnut St., Fourth Floor, Mail Code = TB4-1, Kansas City, Missouri 64106 |
| (Address of principal executive offices) (Zip code) |
Diana E. McCarthy
Drinker Biddle & Reath LLP
One Logan Square
Suite 2000
Philadelphia, PA 19103-6996
(Name and address of agent for service)
Registrant’s telephone number, including area code:1-800-995-6365
Date of fiscal year end: 10/31
Date of reporting period: 10/31/19
| ITEM 1. | | REPORTS TO SHAREHOLDERS. |
The Annual Report to Shareholders pursuant to Rule 30e-1 under the Investment Company Act of 1940 (17 CFR 270.30e-1) is filed herewith.

THE COMMERCE FUNDS Annual Report | October 31, 2019 Beginning on January 1, 2021, as permitted by regulations adopted by the Securities and Exchange Commission (“SEC”), paper copies of the The Commerce Funds’ shareholder reports like this one will no longer be sent by mail, unless you specifically request paper copies of the reports from The Commerce Funds or from your financial intermediary, such as a broker-dealer or bank. Instead, the reports will be made available on the The Commerce Funds’ website (www.commercefunds.com) and you will be notified by mail each time a report is posted and provided with a website link to access the report. If you have already elected to receive your shareholder reports electronically, you will not be affected by this change and you need not take any action. You may elect to receive shareholder reports and other communications from The Commerce Funds electronically at any time by contacting your financial intermediary (such as a broker-dealer or bank) or by calling1-800-995-6365. You may elect to receive all future reports in paper free of charge. If you invest through a financial intermediary, please contact your financial intermediary to continue receiving paper copies of your shareholder reports. You may also inform the The Commerce Funds that you wish to continue receiving paper copies of your shareholder reports by calling1-800-995-6365. Your election to receive reports in paper will apply to all funds held in your account with your financial intermediary. You must provide separate instructions to each of your financial intermediaries.
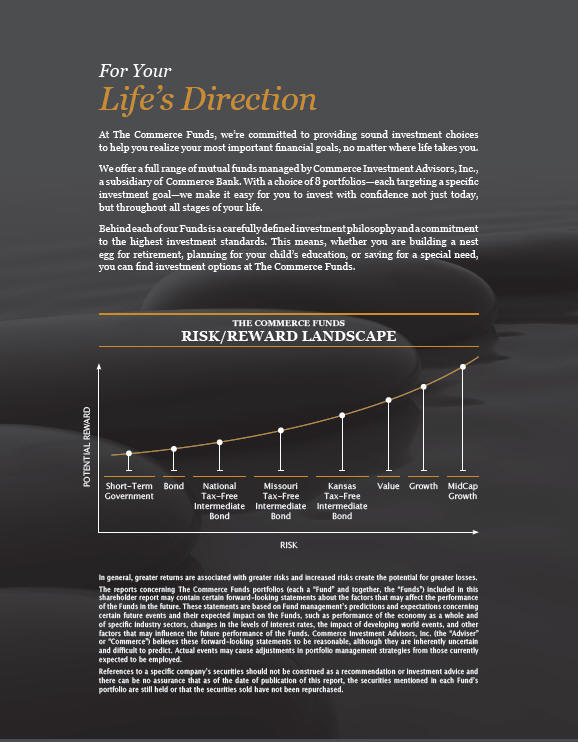
For Your Life’s Direction At The Commerce Funds, we’re committed to providing sound investment choices to help you realize your most important financial goals, no matter where life takes you. We offer a full range of mutual funds managed by Commerce Investment Advisors, Inc., a subsidiary of Commerce Bank. With a choice of 8 portfolios—each targeting a specific investment goal—we make it easy for you to invest with confidence not just today, but throughout all stages of your life. Behind each of our Funds is a carefully defined investment philosophy and a commitment to the highest investment standards. This means, whether you are building a nest egg for retirement, planning for your child’s education, or saving for a special need, you can find investment options at The Commerce Funds. THE COMMERCE FUNDS RISK/REWARD LANDSCAPE POTENTIAL REWARD RISK Short-Term Government Bond National Tax-Free Intermediate Bond Missouri Tax-Free Intermediate Bond Kansas Tax-Free Intermediate Bond Value Growth MidCap Growth In general, greater returns are associated with greater risks and increased risks create the potential for greater losses. The reports concerning The Commerce Funds portfolios (each a “Fund” and together, the “Funds”) included in this shareholder report may contain certain forward-looking statements about the factors that may affect the performance of the Funds in the future. These statements are based on Fund management’s predictions and expectations concerning certain future events and their expected impact on the Funds, such as performance of the economy as a whole and of specific industry sectors, changes in the levels of interest rates, the impact of developing world events, and other factors that may influence the future performance of the Funds. Commerce Investment Advisors, Inc. (the “Adviser” or “Commerce”) believes these forward-looking statements to be reasonable, although they are inherently uncertain and difficult to predict. Actual events may cause adjustments in portfolio management strategies from those currently expected to be employed. References to a specific company’s securities should not be construed as a recommendation or investment advice and there can be no assurance that as of the date of publication of this report, the securities mentioned in each Fund’s portfolio are still held or that the securities sold have not been repurchased.
COMMERCE FUNDS
Table of Contents
Please note:
The information in this annual report is as of October 31, 2019 and is audited, except where noted. The securities mentioned in this report may no longer be held by the Funds. To view more recent information about each Commerce Fund’s performance and portfolio or to obtain a prospectus, please visit our website atwww.commercefunds.com. This report is not authorized for distribution to prospective shareholders unless accompanied or preceded by a prospectus, which contains more complete information about the Commerce Funds’ investment policies, management and expenses. Investors should read the prospectus carefully before investing.
You may also receive Commerce Funds information by calling toll free 1-800-995-6365 or by writing to P.O. Box 219525, Kansas City, Missouri, 64121-9525, or you may contact your investment professional. The Commerce Funds publish performance and portfolio information for each Commerce Fund at the end of every calendar quarter. Investors should read the prospectus carefully before investing or sending money.
COMMERCE GROWTH FUND
Growth Fund Overview
We present you with the annual report for theCommerce Growth Fund for the one-year period ended October 31, 2019. Using a predominantly quantitative analysis, with some additional fundamental analysis depending on market conditions, the Fund invests principally in stocks of companies that have had below average price volatility in the past.
A conversation with Joe Williams, Portfolio Manager of the Growth Fund.
Q: How did the Fund perform over the review period?
A: The Fund had an annual return of 19.10% for the12-month period ended October 31, 2019, outperforming the Russell 1000 Growth Index (the “Index”), which returned 17.10% for the same period. Technology stocks were once again the drivers of the Index’s performance, as the sector, which makes up 37.60% of the Index, was up 22.3% for the period.
Q: Were there any significant adjustments made to the Fund’s portfolio during the period?
A: The Fund increased its portfolio holdings in the information technology sector to 36.0% from 32.5% during the period, thus reducing the Fund’s underweight to the sector relative to the Index. The information technology sector was the third best-performing sector for the period (up 22.3%) and the Fund saw attractive opportunities to increase its exposure to the sector. The Fund also decreased its portfolio holdings in the consumer staples sector to 3.4% from 7.2%, establishing an underweight position to the sector through the sale of Constellation Brands, Colgate-Palmolive, and Kimberly-Clark.
Q: Could you describe some specific strategies and holdings that enhanced the Fund’s returns during the period?
A: Stock selection in the industrials sector, which constitutes 11% of the Index, was the largest contributor to the Fund’s relative performance for the period. The Fund’s
industrials sector holdings returned 22.3% versus the 14.2% return of the industrials sector component of the Index. The Fund’s top performers in the industrials sector were Northrop Grumman Corporation and Armstrong World Industries, up 48% and 44%, respectively.
Q: What were some examples of strategies and holdings that didn’t work well for the Fund during the period?
A: The Fund’s underweight position in the information technology sector, specifically its underweight in semi-conductor stocks, caused some of the Fund’s underperformance for the period. The Fund didn’t own some of the information technology sector’s best performing semi-conductor stocks, such as Lam Research Corporation (up 96%), KLA Corporation (up 90%), and Advanced Micro Devices (up 86%), which hurt relative performance.
References to specific securities should not be construed as a recommendation or investment advice and securities referenced may no longer be held in a Fund’s portfolio.
2
COMMERCE GROWTH FUND
Performance Summary
October 31, 2019 (Unaudited)
The following is performance information for the Commerce Growth Fund (“Growth Fund”) for various time periods. The returns represent past performance. Past performance is no guarantee of future results. The Fund’s investment return and principal value will fluctuate so that an investor’s shares, when redeemed, may be worth more or less than their original cost. Returns do not reflect the deduction of taxes that a shareholder would pay on Fund distributions or the redemption of Fund shares. The Fund is not subject to a sales charge, so a sales charge is not applied to its total returns. In addition to the Adviser’s decisions regarding issuer/industry investment selection and allocation, other factors may affect Fund performance. These factors include, but are not limited to, Fund operating fees and expenses, portfolio turnover, and subscription and redemption cash flows affecting the Fund. Please visit our website at www.commercefunds.com to obtain the most recent month-end returns.
| | | | | | | | |
| | Performance Review | | | | | | |
| | | | |
| | | November 1, 2018 - October 31, 2019 | | Fund Total Return(a) | | Index Total Return(c) | | Index |
| | | | |
| | | Growth Fund | | 19.10% | | 17.10% | | Russell 1000® Growth(c) |
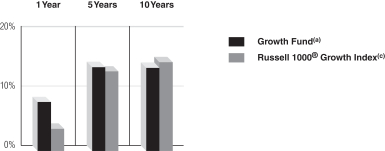
Standardized Average Annual Total Return through September 30, 2019(b)
| | | | | | | | |
| | Standardized Average Annual Total Return through September 30, 2019(b) | | One Year | | Five Years | | Ten Years |
| | | | |
| | | Growth Fund(a) | | 8.19% | | 14.14% | | 14.03% |
| | | | |
| | | Russell 1000® Growth Index(c) | | 3.71% | | 13.39% | | 14.94% |
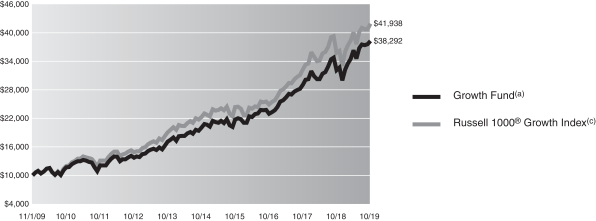
Growth Fund Shares 10 Year Performance
Performance of a $10,000 Investment, with distributions reinvested, from November 1, 2009 through October 31, 2019.
| | | | | | | | |
| | Average Annual Total Return through October 31, 2019 | | One Year | | Five Years | | Ten Years |
| | | | |
| | | Growth Fund(a) | | 19.10% | | 13.77% | | 14.37% |
| | | | | | |
| | Expense Ratios(d) | | | | |
| | | |
| | | | | Net Expense Ratio (Current) | | Gross Expense Ratio (Before Reimbursements) |
| | | |
| | | Growth Fund | | 0.77% | | 0.77% |
| (a) | | Returns reflect any applicable fee waivers or expense reductions. Returns do not reflect the deduction of taxes that a shareholder would pay on Fund distributions or the redemption of Fund shares. |
| (b) | | The Standardized Average Annual Total Returns are average annual total returns as of the most recent calendar quarter-end. They assume reinvestment of all distributions at net asset value (“NAV”). Current performance may be lower or higher than the total return figures in the above charts. Returns reflect any fee waivers and expense reductions. Absent these waivers and reductions, returns would have been lower. Returns do not reflect the deduction of taxes that a shareholder would pay on capital gains or other taxable distributions or the redemption of Fund shares. |
| (c) | | The Russell 1000® Growth Index, an unmanaged index, measures the performance of the large-cap growth segment of the U.S. equity universe. It includes those Russell 1000 companies with higher price-to-book ratios and higher forecasted growth values. The Index figures do not reflect any deduction for fees, taxes or expenses. |
| (d) | | The Fund’s expense ratios, both net (net of applicable fee waivers and/or expense reimbursements) and gross (before applicable fee waivers and/or expense reimbursements), set forth above are as of the most recent publicly available prospectus for the Fund (March 1, 2019) and may differ from the expense ratios disclosed in the Financial Highlights in this report. The Adviser has contractually agreed to reduce or limit the Total Annual Fund Operating Expenses, excluding interest, taxes, acquired fund fees and expenses and extraordinary expenses. This agreement will remain in place through March 1, 2020. After this date, the Adviser or the Fund may terminate the contractual arrangement. If this occurs, the expense ratios may change without shareholder approval. |
3
COMMERCE GROWTH FUND
Schedule of Investments
October 31, 2019
| | | | | | | | |
| | |
| Shares | | | Description | | Value | |
|
| | Common Stocks – 96.6% | |
| | Aerospace & Defense – 1.1% | |
| | 4,945 | | | Lockheed Martin Corp. | | | $ 1,862,683 | |
| | |
| | Beverages – 2.3% | |
| | 14,295 | | | PepsiCo, Inc. | | | 1,960,845 | |
| | 35,625 | | | The Coca-Cola Co. | | | 1,939,069 | |
| | | | | | | | |
| | | | | | | 3,899,914 | |
| | |
| | Biotechnology – 1.2% | |
| | 9,920 | | | Amgen, Inc. | | | 2,115,440 | |
| | |
| | Building Products – 1.9% | |
| | 16,525 | | | Armstrong World Industries, Inc. | | | 1,545,583 | |
| | 6,680 | | | Lennox International, Inc. | | | 1,652,365 | |
| | | | | | | | |
| | | | | | | 3,197,948 | |
| | |
| | Capital Markets – 4.4% | |
| | 13,600 | | | Cboe Global Markets, Inc. | | | 1,566,040 | |
| | 20,665 | | | Intercontinental Exchange, Inc. | | | 1,949,123 | |
| | 16,885 | | | T. Rowe Price Group, Inc. | | | 1,955,283 | |
| | 46,170 | | | The Charles Schwab Corp. | | | 1,879,581 | |
| | | | | | | | |
| | | | | | | 7,350,027 | |
| | |
| | Chemicals – 3.3% | |
| | 9,785 | | | Ecolab, Inc. | | | 1,879,405 | |
| | 23,530 | | | RPM International, Inc. | | | 1,704,278 | |
| | 3,555 | | | The Sherwin-Williams Co. | | | 2,034,597 | |
| | | | | | | | |
| | | | | | | 5,618,280 | |
| | |
| | Commercial Services & Supplies – 2.2% | |
| | 47,162 | | | Rollins, Inc. | | | 1,797,344 | |
| | 16,945 | | | Waste Management, Inc. | | | 1,901,398 | |
| | | | | | | | |
| | | | | | | 3,698,742 | |
| | |
| | Communications Equipment – 1.1% | |
| | 40,535 | | | Cisco Systems, Inc. | | | 1,925,818 | |
| | |
| | Diversified Consumer Services – 0.9% | |
| | 33,680 | | | Service Corp. International | | | 1,531,766 | |
| | |
| | Electrical Equipment – 2.0% | |
| | 17,535 | | | AMETEK, Inc. | | | 1,607,083 | |
| | 9,895 | | | Rockwell Automation, Inc. | | | 1,701,841 | |
| | | | | | | | |
| | | | | | | 3,308,924 | |
| | |
| | Electronic Equipment, Instruments & Components – 2.1% | |
| | 20,255 | | | Amphenol Corp. Class A | | | 2,032,184 | |
| | 29,390 | | | FLIR Systems, Inc. | | | 1,515,349 | |
| | | | | | | | |
| | | | | | | 3,547,533 | |
| | |
| | Entertainment* – 2.0% | |
| | 23,795 | | | Live Nation Entertainment, Inc. | | | 1,677,547 | |
| | 267,045 | | | Zynga, Inc. Class A | | | 1,647,668 | |
| | | | | | | | |
| | | | | | | 3,325,215 | |
| | |
| | Equity Real Estate Investment Trusts (REITs) – 2.2% | |
| | 13,785 | | | Crown Castle International Corp. | | | 1,913,220 | |
| | 7,860 | | | Public Storage | | | 1,751,680 | |
| | | | | | | | |
| | | | | | | 3,664,900 | |
| | |
| | | | | | | | |
| | |
| Shares | | | Description | | Value | |
|
| | Common Stocks – (continued) | |
| | Health Care Equipment & Supplies – 3.5% | |
| | 23,295 | | | Abbott Laboratories | | | $ 1,947,695 | |
| | 7,670 | | | Becton Dickinson & Co. | | | 1,963,520 | |
| | 8,855 | | | Stryker Corp. | | | 1,915,071 | |
| | | | | | | | |
| | | | | | | 5,826,286 | |
| | |
| | Health Care Providers & Services – 2.3% | |
| | 9,555 | | | Laboratory Corp. of America Holdings* | | | 1,574,377 | |
| | 9,270 | | | UnitedHealth Group, Inc. | | | 2,342,529 | |
| | | | | | | | |
| | | | | | | 3,916,906 | |
| | |
| | Hotels, Restaurants & Leisure – 4.4% | |
| | 15,760 | | | Marriott International, Inc. Class A | | | 1,994,428 | |
| | 9,070 | | | McDonald’s Corp. | | | 1,784,069 | |
| | 21,515 | | | Starbucks Corp. | | | 1,819,308 | |
| | 17,315 | | | Yum! Brands, Inc. | | | 1,761,109 | |
| | | | | | | | |
| | | | | | | 7,358,914 | |
| | |
| | Industrial Conglomerates – 2.3% | |
| | 11,575 | | | Honeywell International, Inc. | | | 1,999,350 | |
| | 5,425 | | | Roper Technologies, Inc. | | | 1,828,008 | |
| | | | | | | | |
| | | | | | | 3,827,358 | |
| | |
| | Interactive Media & Services* – 6.9% | |
| | 5,620 | | | Alphabet, Inc. Class A | | | 7,074,456 | |
| | 23,570 | | | Facebook, Inc. Class A | | | 4,517,190 | |
| | | | | | | | |
| | | | | | | 11,591,646 | |
| | |
| | Internet & Direct Marketing Retail* – 4.3% | |
| | 4,065 | | | Amazon.com, Inc. | | | 7,222,123 | |
| | |
| | IT Services – 13.1% | |
| | 11,945 | | | Automatic Data Processing, Inc. | | | 1,937,837 | |
| | 12,670 | | | Broadridge Financial Solutions, Inc. | | | 1,586,537 | |
| | 14,575 | | | Fidelity National Information Services, Inc. | | | 1,920,402 | |
| | 18,570 | | | Fiserv, Inc.* | | | 1,971,020 | |
| | 6,680 | | | FleetCor Technologies, Inc.* | | | 1,965,390 | |
| | 10,925 | | | Jack Henry & Associates, Inc. | | | 1,546,543 | |
| | 9,095 | | | Mastercard, Inc. Class A | | | 2,517,587 | |
| | 23,465 | | | Paychex, Inc. | | | 1,962,613 | |
| | 18,540 | | | PayPal Holdings, Inc.* | | | 1,930,014 | |
| | 8,460 | | | VeriSign, Inc.* | | | 1,607,569 | |
| | 17,470 | | | Visa, Inc. Class A | | | 3,124,684 | |
| | | | | | | | |
| | | | | | | 22,070,196 | |
| | |
| | Life Sciences Tools & Services – 3.1% | |
| | 20,820 | | | Agilent Technologies, Inc. | | | 1,577,115 | |
| | 2,320 | | | Mettler-Toledo International, Inc.* | | | 1,635,461 | |
| | 6,850 | | | Thermo Fisher Scientific, Inc. | | | 2,068,563 | |
| | | | | | | | |
| | | | | | | 5,281,139 | |
| | |
| | Machinery – 2.2% | |
| | 12,485 | | | Illinois Tool Works, Inc. | | | 2,104,721 | |
| | 13,720 | | | The Middleby Corp.* | | | 1,659,434 | |
| | | | | | | | |
| | | | | | | 3,764,155 | |
| | |
| | |
| 4 | | The accompanying notes are an integral part of these financial statements. |
COMMERCE GROWTH FUND
| | | | | | | | |
| | |
| Shares | | | Description | | Value | |
|
| | Common Stocks – (continued) | |
| | Media – 1.1% | |
| | 42,105 | | | Comcast Corp. Class A | | | $ 1,887,146 | |
| | |
| | Multiline Retail – 1.2% | |
| | 12,230 | | | Dollar General Corp. | | | 1,960,958 | |
| | |
| | Personal Products – 1.1% | |
| | 9,980 | | | The Estee Lauder Cos., Inc. Class A | | | 1,858,975 | |
| | |
| | Pharmaceuticals – 1.2% | |
| | 14,865 | | | Johnson & Johnson | | | 1,962,775 | |
| | |
| | Road & Rail – 1.2% | |
| | 11,855 | | | Union Pacific Corp. | | | 1,961,528 | |
| | |
| | Semiconductors & Semiconductor Equipment – 1.1% | |
| | 15,110 | | | Texas Instruments, Inc. | | | 1,782,829 | |
| | |
| | Software – 12.3% | |
| | 6,965 | | | Adobe, Inc.* | | | 1,935,782 | |
| | 7,360 | | | ANSYS, Inc.* | | | 1,620,304 | |
| | 33,025 | | | CDK Global, Inc. | | | 1,669,083 | |
| | 16,710 | | | Citrix Systems, Inc. | | | 1,819,051 | |
| | 19,755 | | | Manhattan Associates, Inc.* | | | 1,480,637 | |
| | 73,200 | | | Microsoft Corp. | | | 10,494,684 | |
| | 7,635 | | | Palo Alto Networks, Inc.* | | | 1,736,123 | |
| | | | | | | | |
| | | | | | | 20,755,664 | |
| | |
| | Specialty Retail – 1.2% | |
| | 8,465 | | | The Home Depot, Inc. | | | 1,985,720 | |
| | |
| | Technology Hardware, Storage & Peripherals – 6.3% | |
| | 42,495 | | | Apple, Inc. | | | 10,571,056 | |
| | |
| | Textiles, Apparel & Luxury Goods – 1.1% | |
| | 21,255 | | | Nike, Inc. Class B | | | 1,903,385 | |
| | |
| | TOTAL COMMON STOCKS | |
| | (Cost $113,596,477) | | | $162,535,949 | |
| | |
| | | | | | | | |
|
| | Exchange Traded Fund – 2.1% | |
| | 21,025 | | | iShares Russell 1000 Growth ETF | | | | |
| | (Cost $3,376,992) | | | $ 3,451,044 | |
| | |
| | | | | | | | | | | | |
| Shares | | Dividend
Rate | | | | | | Value | |
|
| Investment Company – 1.3% | |
State Street Institutional US Government Money Market
Fund — Premier Class | |
| 2,136,113 | | | 1.741 | % | | | | | | $ | 2,136,113 | |
(Cost $2,136,113) | | | | | | | | | |
| |
| TOTAL INVESTMENTS – 100.0% | |
(Cost $119,109,582) | | | | | | | $ | 168,123,106 | |
| |
OTHER ASSETS IN EXCESS OF
LIABILITIES – 0.0% | | | | 55,955 | |
| |
| NET ASSETS – 100.0% | | | | | | | $ | 168,179,061 | |
| |
| | |
|
| The percentage shown for each investment category reflects the value of investments in that category as a percentage of net assets. |
| |
| * | | Non-income producing security. |
PORTFOLIO COMPOSITION
| | | | | | | | |
| | | AS OF
10/31/19 | | | AS OF
10/31/18 | |
| |
Information Technology | | | 36.0 | % | | | 32.5 | % |
Consumer Discretionary | | | 13.0 | | | | 13.6 | |
Industrials | | | 12.9 | | | | 14.0 | |
Health Care | | | 11.4 | | | | 12.6 | |
Communication Services | | | 10.0 | | | | 7.7 | |
Financials | | | 4.4 | | | | 4.8 | |
Consumer Staples | | | 3.4 | | | | 7.2 | |
Materials | | | 3.3 | | | | 5.4 | |
Real Estate | | | 2.2 | | | | — | |
Exchange-Traded Funds | | | 2.1 | | | | 1.3 | |
Investment Company | | | 1.3 | | | | — | |
Repurchase Agreement | | | — | | | | 0.9 | |
| |
| TOTAL INVESTMENTS | | | 100.0 | % | | | 100.0 | % |
| |
The percentage shown for each investment category reflects the value of investments in that category as a percentage of net assets. Underlying investment categories of investment companies, held by the Fund are not reflected in the table above. Consequently, the Fund’s overall investment category allocations may differ from the percentages contained in the table above.
The Fund is actively managed and, as such, its composition may differ over time.
| | |
| The accompanying notes are an integral part of these financial statements. | | 5 |
COMMERCE VALUE FUND
Value Fund Overview
We present you with the annual report for theCommerce Value Fund for the one-year period ended October 31, 2019. Using a predominately quantitative analysis, with some additional fundamental analysis depending on market conditions, the Fund invests principally in stocks within the Russell 1000® Value Index (“Index”) universe that have an above average dividend yield, as determined by the Adviser.
A conversation with Matt Schmitt, Portfolio Manager of the Value Fund.
Q: How did the Fund perform over the review period?
A: The Fund returned 14.65% over the 12-month period ended October 31, 2019, outperforming the Index, which returned 11.21% for the same period. Stock selection had the greatest positive effect on the Fund outperformance over the year, while sector allocation was the primary detractor from the Fund’s performance.
Q: Were there any significant adjustments made to the Fund’s portfolio during the period?
A: There were a few adjustments made to the Fund’s sector allocations during the 12-month period. The information technology sector moved from 5.6% to 7.5% of the Fund’s portfolio with the purchase of Intel Corporation. In addition, the real estate sector went from 0.0% to 3.9% of the Fund’s portfolio with the purchase of Highwoods Properties, Inc. These increases helped the Fund to outperform the Index, as both the technology and real estate sectors were among the top performing sectors for the year. The largest sector reduction in the Fund’s portfolio during the period was made in the financials sector, which moved from 26.6% to 20.4% of the Fund’s portfolio with the sale of Aflac Incorporated, Arthur J. Gallagher & Co., BB&T Corporation, and Ameriprise Financial, Inc. In addition, the Fund’s allocation to the energy sector was reduced from 11.4% to 8.8% during the period, with the sale of Occidental Petroleum Corp. The financials and energy sectors returned 10.54% and -12.53%, respectively, over the 12-month period.
Q: Could you describe some specific strategies and holdings that enhanced the Fund’s returns during the period?
A: The Fund benefited from security selection within the consumer staples sector, with overweight positions to Procter & Gamble, PepsiCo, Inc., and Kimberly-Clark Corporation returning 44.35%, 25.79%, and 31.64%, respectively, during the period. Additionally, security selection within the energy sector helped the Fund to outperform the Index, with overweight positions to Chevron Corporation and ONEOK, Inc. returning 8.22% and 12.22%, respectively, while the energy sector returned -12.53% for the period. Further positive performance was captured by the Fund’s allocation to Target Corporation in the consumer discretionary sector, which returned 58.20% for the period. The Fund had a 1.9% allocation to Target Corporation while the Index had only a 0.4% weight of the stock during the period.
Q: What were some examples of strategies and holdings that didn’t work well for the Fund during the period?
A: The Fund’s sector allocation was the primary detractor of performance. The real estate sector, which was 5.5% of the Index, was the top performing sector during the period, returning 25.09% for the 12 months ended October 31, 2019. However, the Fund’s underweight position in the real estate sector, at 3.9%, detracted from performance. In addition, the utilities sector, which was 6.8% of the Index, was the second best performing sector during the period, returning 23.02%. The Fund’s underweight position of 3.9% in the utilities sector also detracted from performance for the year.
References to specific securities should not be construed as a recommendation or investment advice and securities referenced may no longer be held in a Fund’s portfolio.
6
COMMERCE VALUE FUND
Performance Summary
October 31, 2019 (Unaudited)
The following is performance information for the Commerce Value Fund (“Value Fund”) for various time periods. The returns represent past performance. Past performance is no guarantee of future results. The Fund’s investment return and principal value will fluctuate so that an investor’s shares, when redeemed, may be worth more or less than their original cost. Returns do not reflect the deduction of taxes that a shareholder would pay on Fund distributions or the redemption of Fund shares. The Fund is not subject to a sales charge, so a sales charge is not applied to its total returns. In addition to the Adviser’s decisions regarding issuer/industry investment selection and allocation, other factors may affect Fund performance. These factors include, but are not limited to, Fund operating fees and expenses, portfolio turnover, and subscription and redemption cash flows affecting the Fund. Please visit our website at www.commercefunds.com to obtain the most recent month-end returns.
| | | | | | | | |
| | Performance Review | | | | | | |
| | | | |
| | | November 1, 2018 - October 31, 2019 | | Fund Total Return(a) | | Index Total Return(c) | | Index |
| | | | |
| | | Value Fund | | 14.65% | | 11.21% | | Russell 1000® Value(c) |
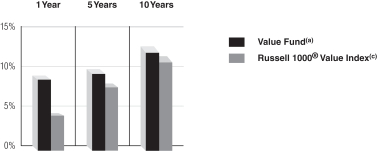
Standardized Average Annual Total Return through September 30, 2019(b)
| | | | | | | | |
| | Standardized Average Annual Total Return throughSeptember 30, 2019(b) | | One Year | | Five Years | | Ten Years |
| | | | |
| | | Value Fund(a) | | 8.72% | | 9.63% | | 12.68% |
| | | | |
| | | Russell 1000® Value Index(c) | | 4.00% | | 7.79% | | 11.46% |
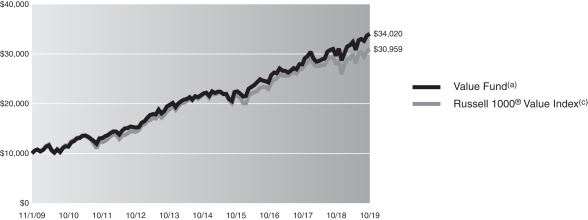
Value Fund Shares 10 Year Performance
Performance of a $10,000 Investment, with distributions reinvested, from November 1, 2009 through October 31, 2019.
| | | | | | | | |
| | Average Annual Total Return through October 31, 2019 | | One Year | | Five Years | | Ten Years |
| | | | |
| | | Value Fund(a) | | 14.65% | | 9.40% | | 13.02% |
| | | | | | |
| | Expense Ratios(d) | | | | |
| | | |
| | | | | Net Expense Ratio (Current) | | Gross Expense Ratio (Before Reimbursements) |
| | | |
| | | Value Fund | | 0.71% | | 0.80% |
| (a) | | Returns reflect any applicable fee waivers or expense reductions. Returns do not reflect the deduction of taxes that a shareholder would pay on Fund distributions or the redemption of Fund shares. |
| (b) | | The Standardized Average Annual Total Returns are average annual total returns as of the most recent calendar quarter-end. They assume reinvestment of all distributions at NAV. Current performance may be lower or higher than the total return figures in the above charts. |
Returns reflect any fee waivers and expense reductions. Absent these waivers and reductions, returns would have been lower. Returns do not reflect the deduction of taxes that a shareholder would pay on capital gains or other taxable distributions or the redemption of Fund shares.
| (c) | | The Russell 1000® Value Index, an unmanaged index, measures the performance of the large-cap value segment of the U.S. equity universe. It includes Russell 1000 companies with lower price-to-book ratios and lower expected growth values. The Index figures do not reflect any deduction for fees, taxes or expenses. |
| (d) | | The Fund’s expense ratios, both net (net of applicable fee waivers and/or expense reimbursements) and gross (before applicable fee waivers and/or expense reimbursements), set forth above are as of the most recent publicly available prospectus for the Fund (March 1, 2019) and may differ from the expense ratios disclosed in the Financial Highlights in this report. The Adviser has contractually agreed to reduce or limit the Total Annual Fund Operating Expenses, excluding interest, taxes, acquired fund fees and expenses and extraordinary expenses. This agreement will remain in place through March 1, 2020. After this date, the Adviser or the Fund may terminate the contractual arrangement. If this occurs, the expense ratios may change without shareholder approval. |
7
COMMERCE VALUE FUND
Schedule of Investments
October 31, 2019
| | | | | | | | |
| | |
| Shares | | | Description | | Value | |
|
| | Common Stocks – 94.7% | |
| | Aerospace & Defense – 1.8% | |
| | 13,750 | | | Lockheed Martin Corp. | | | $ 5,179,350 | |
| | |
| | Air Freight & Logistics – 1.8% | |
| | 45,000 | | | United Parcel Service, Inc. Class B | | | 5,182,650 | |
| | |
| | Banks – 10.3% | |
| | 68,000 | | | JPMorgan Chase & Co. | | | 8,494,560 | |
| | 338,000 | | | People’s United Financial, Inc. | | | 5,465,460 | |
| | 96,500 | | | U.S. Bancorp. | | | 5,502,430 | |
| | 193,000 | | | Wells Fargo & Co. | | | 9,964,590 | |
| | | | | | | | |
| | | | | | | 29,427,040 | |
| | |
| | Beverages – 3.7% | |
| | 98,000 | | | Molson Coors Brewing Co. Class B | | | 5,166,560 | |
| | 39,500 | | | PepsiCo, Inc. | | | 5,418,215 | |
| | | | | | | | |
| | | | | | | 10,584,775 | |
| | |
| | Biotechnology – 4.9% | |
| | 41,500 | | | Amgen, Inc. | | | 8,849,875 | |
| | 81,500 | | | Gilead Sciences, Inc. | | | 5,192,365 | |
| | | | | | | | |
| | | | | | | 14,042,240 | |
| | |
| | Capital Markets – 6.5% | |
| | 12,000 | | | BlackRock, Inc. | | | 5,540,400 | |
| | 38,000 | | | CME Group, Inc. | | | 7,818,500 | |
| | 46,500 | | | T. Rowe Price Group, Inc. | | | 5,384,700 | |
| | | | | | | | |
| | | | | | | 18,743,600 | |
| | |
| | Communications Equipment – 1.8% | |
| | 109,500 | | | Cisco Systems, Inc. | | | 5,202,345 | |
| | |
| | Containers & Packaging – 3.9% | |
| | 132,000 | | | International Paper Co. | | | 5,765,760 | |
| | 93,000 | | | Sonoco Products Co. | | | 5,366,100 | |
| | | | | | | | |
| | | | | | | 11,131,860 | |
| | |
| | Distributors – 2.0% | |
| | 55,500 | | | Genuine Parts Co. | | | 5,693,190 | |
| | |
| | Diversified Telecommunication Services – 4.8% | |
| | 218,000 | | | AT&T, Inc. | | | 8,390,820 | |
| | 90,000 | | | Verizon Communications, Inc. | | | 5,442,300 | |
| | | | | | | | |
| | | | | | | 13,833,120 | |
| | |
| | Electric Utilities – 2.0% | |
| | 24,000 | | | NextEra Energy, Inc. | | | 5,720,160 | |
| | |
| | Electrical Equipment – 2.0% | |
| | 83,000 | | | Emerson Electric Co. | | | 5,822,450 | |
| | |
| | Equity Real Estate Investment Trusts (REITs) – 3.9% | |
| | 119,500 | | | Highwoods Properties, Inc. | | | 5,592,600 | |
| | 60,500 | | | WP Carey, Inc. | | | 5,569,630 | |
| | | | | | | | |
| | | | | | | 11,162,230 | |
| | |
| | Health Care Providers & Services – 2.0% | |
| | 84,500 | | | CVS Health Corp. | | | 5,609,955 | |
| | |
| | | | | | | | |
| | |
| Shares | | | Description | | Value | |
|
| | Common Stocks – (continued) | |
| | Hotels, Restaurants & Leisure – 1.7% | |
| | 25,500 | | | McDonald’s Corp. | | | $ 5,015,850 | |
| | |
| | Household Products – 3.8% | |
| | 40,000 | | | Kimberly-Clark Corp. | | | 5,315,200 | |
| | 44,000 | | | The Procter & Gamble Co. | | | 5,478,440 | |
| | | | | | | | |
| | | | | | | 10,793,640 | |
| | |
| | Industrial Conglomerates – 1.9% | |
| | 32,500 | | | 3M Co. | | | 5,362,175 | |
| | |
| | Insurance – 3.6% | |
| | 112,500 | | | MetLife, Inc. | | | 5,263,875 | |
| | 95,000 | | | Principal Financial Group, Inc. | | | 5,071,100 | |
| | | | | | | | |
| | | | | | | 10,334,975 | |
| | |
| | IT Services – 1.9% | |
| | 65,000 | | | Paychex, Inc. | | | 5,436,600 | |
| | |
| | Machinery – 2.0% | |
| | 41,500 | | | Caterpillar, Inc. | | | 5,718,700 | |
| | |
| | Multi-Utilities – 1.9% | |
| | 66,500 | | | Dominion Energy, Inc. | | | 5,489,575 | |
| | |
| | Multiline Retail – 3.8% | |
| | 110,500 | | | Kohl’s Corp. | | | 5,664,230 | |
| | 50,000 | | | Target Corp. | | | 5,345,500 | |
| | | | | | | | |
| | | | | | | 11,009,730 | |
| | |
| | Oil, Gas & Consumable Fuels – 8.8% | |
| | 87,000 | | | Chevron Corp. | | | 10,104,180 | |
| | 149,000 | | | Exxon Mobil Corp. | | | 10,067,930 | |
| | 72,000 | | | ONEOK, Inc. | | | 5,027,760 | |
| | | | | | | | |
| | | | | | | 25,199,870 | |
| | |
| | Pharmaceuticals – 8.2% | |
| | 62,000 | | | Johnson & Johnson | | | 8,186,480 | |
| | 64,000 | | | Merck & Co., Inc. | | | 5,546,240 | |
| | 258,000 | | | Pfizer, Inc. | | | 9,899,460 | |
| | | | | | | | |
| | | | | | | 23,632,180 | |
| | |
| | Semiconductors & Semiconductor Equipment – 3.8% | |
| | 104,500 | | | Intel Corp. | | | 5,907,385 | |
| | 41,500 | | | Texas Instruments, Inc. | | | 4,896,585 | |
| | | | | | | | |
| | | | | | | 10,803,970 | |
| | |
| | Specialty Retail – 1.9% | |
| | 23,500 | | | The Home Depot, Inc. | | | 5,512,630 | |
| | |
| | TOTAL COMMON STOCKS | |
| | (Cost $237,132,277) | | | $271,644,860 | |
| | |
| | | | | | | | |
|
| | Exchange Traded Fund – 3.4% | |
| | 75,000 | | | iShares Russell 1000 Value Index Fund | | | | |
| | (Cost $9,517,142) | | | $ 9,755,250 | |
| | |
| | |
| 8 | | The accompanying notes are an integral part of these financial statements. |
COMMERCE VALUE FUND
| | | | | | | | | | |
| Shares | | | Dividend
Rate | | | | Value | |
|
| | Investment Company – 1.5% | |
| State Street Institutional US Government Money
Market Fund — Premier Class |
|
| | 4,396,208 | | | 1.741% | | | | | $ 4,396,208 | |
| | (Cost $4,396,208) | | | | | | |
| | |
| | TOTAL INVESTMENTS – 99.6% | |
| | (Cost $251,045,627) | | | | | $285,796,318 | |
| | |
| OTHER ASSETS IN EXCESS OF
LIABILITIES – 0.4% | | | 1,185,492 | |
| | |
| | NET ASSETS – 100.0% | | | | | $286,981,810 | |
| | |
| | |
|
| The percentage shown for each investment category reflects the value of investments in that category as a percentage of net assets. |
PORTFOLIO COMPOSITION
| | | | | | | | |
| | | AS OF
10/31/19 | | | AS OF
10/31/18 | |
| |
Financials | | | 20.4 | % | | | 26.6 | % |
Health Care | | | 15.1 | | | | 15.6 | |
Industrials | | | 9.5 | | | | 8.7 | |
Consumer Discretionary | | | 9.5 | | | | 8.3 | |
Energy | | | 8.8 | | | | 11.4 | |
Information Technology | | | 7.5 | | | | 5.6 | |
Consumer Staples | | | 7.4 | | | | 8.1 | |
Communication Services | | | 4.8 | | | | 4.9 | |
Utilities | | | 3.9 | | | | 4.0 | |
Real Estate | | | 3.9 | | | | — | |
Materials | | | 3.9 | | | | 3.8 | |
Exchange Traded Fund | | | 3.4 | | | | 2.7 | |
Investment Company | | | 1.5 | | | | — | |
Repurchase Agreement | | | — | | | | 0.3 | |
| |
| TOTAL INVESTMENTS | | | 99.6 | % | | | 100.0 | % |
| |
The percentage shown for each investment category reflects the value of investments in that category as a percentage of net assets. Underlying investment categories of investment companies, held by the Fund are not reflected in the table above. Consequently, the Fund’s overall investment category allocations may differ from the percentages contained in the table above.
The Fund is actively managed and, as such, its composition may differ over time.
| | |
| The accompanying notes are an integral part of these financial statements. | | 9 |
COMMERCE MIDCAP GROWTH FUND
MidCap Growth Fund Overview
We present you with the annual report for theCommerce MidCap Growth Fund for the one-year period ended October 31, 2019. Using a predominately quantitative analysis, with some additional fundamental analysis depending on market conditions, the Fund invests principally in stock of companies that have had below-average price volatility in the past.
A conversation with Joe Williams, Portfolio Manager of the MidCap Growth Fund.
Q: How did the Fund perform over the review period?
A: The Fund had an annual return of 19.76% for the12-month period ended October 31, 2019, outperforming the Russell MidCap Growth Index (the “Index”), which returned 18.93% for the same period. Technology and industrial sector stocks, which account for 50% of the securities included in the Index (of the Index’s market cap), were up 27% and 22%, respectively, pushing the Index to all-time-highs during the period.
Q: Were there any significant adjustments made to the Fund’s portfolio during the period?
A: The Fund increased its portfolio holdings in the information technology sector to 31.5% from 26.8% during the period, thus reducing the Fund’s underweight to the sector relative to the Index. The Fund also decreased its holdings in the consumer discretionary sector to 14.2% from 18.8%, establishing an underweight position to the sector primarily through selling retail stocks such as Ross Stores, Carter’s, Tiffany & Co, and Best Buy.
Q: Could you describe some specific strategies and holdings that enhanced the Fund’s returns during the period?
A: The Fund’s stock selection and overweight position in the industrials sector were the largest contributors to relative Fund performance for the year. The Fund’s industrials sector holdings were up 24.2%, outperforming the 21.6% return of the industrials sector component of the Index. The
Fund’s approximately 3% overweight to the industrials sector also helped its performance relative to the Index.
Q: What were some examples of strategies and holdings that didn’t work well for the Fund during the period?
A: Stock selection in the financials sector hurt the Fund’s relative performance. The Fund’s financials sector stocks were up 13.2%, underperforming the 19.8% return of the industrials sector component of the Index. Fund holdings of Comerica Incorporated (down 16.8%), Eaton Vance Corp (down 7.1%) and Northern Trust Corp (down 5.2%) were the primary detractors from the Fund’s relative performance in the financials sector.
References to specific securities should not be construed as a recommendation or investment advice and securities referenced may no longer be held in a Fund’s portfolio.
10
COMMERCE MIDCAP GROWTH FUND
Performance Summary
October 31, 2019 (Unaudited)
The following is performance information for the Commerce MidCap Growth Fund (“MidCap Growth”) for various time periods. The returns represent past performance. Past performance is no guarantee of future results. The Fund’s investment return and principal value will fluctuate so that an investor’s shares, when redeemed, may be worth more or less than their original cost. Returns do not reflect the deduction of taxes that a shareholder would pay on Fund distributions or the redemption of Fund shares. The Fund is not subject to a sales charge, so a sales charge is not applied to its total returns. In addition to the Adviser’s decisions regarding issuer/industry investment selection and allocation, other factors may affect Fund performance. These factors include, but are not limited to, Fund operating fees and expenses, portfolio turnover, and subscription and redemption cash flows affecting the Fund. Please visit our website at www.commercefunds.com to obtain the most recent month-end returns.
| | | | | | | | |
| | Performance Review | | | | | | |
| | | | |
| | | November 1, 2018 - October 31, 2019 | | Fund Total Return(a) | | Index Total Return(c) | | Index |
| | | | |
| | | MidCap Growth | | 19.76% | | 18.93% | | Russell Midcap® Growth(c) |
Standardized Average Annual Total Return through September 30, 2019(b)
| | | | | | | | |
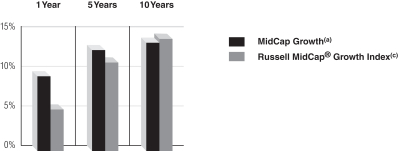
| | Standardized Average Annual Total Return through September 30, 2019(b) | | One Year | | Five Years | | Ten Years |
| | | | |
| | | MidCap Growth(a) | | 9.37% | | 12.65% | | 13.57% |
| | | | |
| | | Russell MidCap® Growth Index(c) | | 5.20% | | 11.12% | | 14.08% |
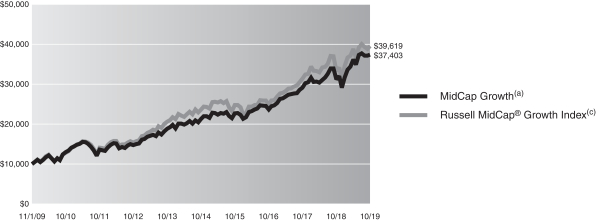
MidCap Growth Fund Shares 10 Year Performance
Performance of a $10,000 Investment, with distributions reinvested, from November 1, 2009 through October 31, 2019.
| | | | | | | | |
| | Average Annual Total Return through October 31, 2019 | | One Year | | Five Years | | Ten Years |
| | | | |
| | | MidCap Growth(a) | | 19.76% | | 11.96% | | 14.10% |
| | | | | | |
| | Expense Ratios(d) | | | | |
| | | |
| | | | | Net Expense Ratio (Current) | | Gross Expense Ratio (Before Reimbursements) |
| | | |
| | | MidCap Growth | | 0.84% | | 0.84% |
| (a) | | Returns reflect any applicable fee waivers or expense reductions. Returns do not reflect the deduction of taxes that a shareholder would pay on Fund distributions or the redemption of Fund shares. |
| (b) | | The Standardized Average Annual Total Returns are average annual total returns as of the most recent calendar quarter-end. They assume reinvestment of all distributions at NAV. Current performance may be lower or higher than the total return figures in the above charts. |
Returns reflect any fee waivers and expense reductions. Absent these waivers and reductions, returns would have been lower. Returns do not reflect the deduction of taxes that a shareholder would pay on capital gains or other taxable distributions or the redemption of Fund shares.
| (c) | | The Russell Midcap® Growth Index, an unmanaged index, measures the performance of the mid-cap growth segment at the U.S. equity universe. It includes those Russell Midcap Index companies with higher price-to-book ratios and higher forecasted growth values. The Index figures do not reflect any deduction for fees, taxes, or expenses. |
| (d) | | The Fund’s expense ratios, both net (net of applicable fee waivers and/or expense limitations) and gross (before applicable fee waivers and/or expense limitations), set forth above are as of the most recent publicly available prospectus for the Fund (March 1, 2019) and may differ from the expense ratios disclosed in the Financial Highlights in this report. Applicable waivers and expense limitations are voluntary and may be modified or terminated at any time by the Adviser. If this occurs, the expense ratios may change without shareholder approval. |
11
COMMERCE MIDCAP GROWTH FUND
Schedule of Investments
October 31, 2019
| | | | | | | | |
| | |
| Shares | | | Description | | Value | |
|
| | Common Stocks – 95.4% | |
| | Aerospace & Defense – 2.4% | |
| | 21,110 | | | HEICO Corp. | | | $ 2,603,707 | |
| | 5,160 | | | TransDigm Group, Inc. | | | 2,715,605 | |
| | | | | | | | |
| | | | | | | 5,319,312 | |
| | |
| | Air Freight & Logistics – 1.0% | |
| | 30,695 | | | CH Robinson Worldwide, Inc. | | | 2,321,770 | |
| | |
| | Airlines* – 1.2% | |
| | 29,680 | | | United Airlines Holdings, Inc. | | | 2,696,131 | |
| | |
| | Banks – 1.2% | |
| | 41,245 | | | Comerica, Inc. | | | 2,698,248 | |
| | |
| | Biotechnology* – 1.2% | |
| | 36,650 | | | BioMarin Pharmaceutical, Inc. | | | 2,683,147 | |
| | |
| | Building Products – 1.2% | |
| | 28,130 | | | Armstrong World Industries, Inc. | | | 2,630,999 | |
| | |
| | Capital Markets – 4.7% | |
| | 9,695 | | | FactSet Research Systems, Inc. | | | 2,457,876 | |
| | 16,820 | | | Morningstar, Inc. | | | 2,722,149 | |
| | 11,430 | | | MSCI, Inc. | | | 2,681,021 | |
| | 22,460 | | | T. Rowe Price Group, Inc. | | | 2,600,868 | |
| | | | | | | | |
| | | | | | | 10,461,914 | |
| | |
| | Chemicals – 1.3% | |
| | 38,540 | | | RPM International, Inc. | | | 2,791,452 | |
| | |
| | Commercial Services & Supplies – 1.3% | |
| | 77,722 | | | Rollins, Inc. | | | 2,961,985 | |
| | |
| | Communications Equipment – 1.2% | |
| | 15,975 | | | Motorola Solutions, Inc. | | | 2,656,962 | |
| | |
| | Containers & Packaging – 1.2% | |
| | 64,225 | | | Sealed Air Corp. | | | 2,682,678 | |
| | |
| | Distributors – 1.3% | |
| | 13,885 | | | Pool Corp. | | | 2,879,749 | |
| | |
| | Diversified Consumer Services – 2.3% | |
| | 17,225 | | | Bright Horizons Family Solutions, Inc.* | | | 2,558,257 | |
| | 55,710 | | | Service Corp. International | | | 2,533,691 | |
| | | | | | | | |
| | | | | | | 5,091,948 | |
| | |
| | Diversified Financial Services – 1.2% | |
| | 49,570 | | | Voya Financial, Inc. | | | 2,674,797 | |
| | |
| | Electrical Equipment – 2.5% | |
| | 29,665 | | | AMETEK, Inc. | | | 2,718,797 | |
| | 15,975 | | | Rockwell Automation, Inc. | | | 2,747,540 | |
| | | | | | | | |
| | | | | | | 5,466,337 | |
| | |
| | Electronic Equipment, Instruments & Components – 3.8% | |
| | 28,250 | | | Amphenol Corp. Class A | | | 2,834,323 | |
| | 23,185 | | | CDW Corp. | | | 2,965,593 | |
| | 50,945 | | | FLIR Systems, Inc. | | | 2,626,724 | |
| | | | | | | | |
| | | | | | | 8,426,640 | |
| | |
| | | | | | | | |
| | |
| Shares | | | Description | | Value | |
|
| | Common Stocks – (continued) | |
| | Entertainment* – 2.4% | |
| | 37,565 | | | Live Nation Entertainment, Inc. | | | $ 2,648,333 | |
| | 454,985 | | | Zynga, Inc. Class A | | | 2,807,257 | |
| | | | | | | | |
| | | | | | | 5,455,590 | |
| | |
| | Equity Real Estate Investment Trusts (REITs) – 3.5% | |
| | 22,835 | | | Extra Space Storage, Inc. | | | 2,563,685 | |
| | 33,535 | | | Lamar Advertising Co. Class A | | | 2,683,135 | |
| | 10,790 | | | SBA Communications Corp. | | | 2,596,614 | |
| | | | | | | | |
| | | | | | | 7,843,434 | |
| | |
| | Food Products – 1.2% | |
| | 16,740 | | | McCormick & Co., Inc. | | | 2,689,951 | |
| | |
| | Health Care Equipment & Supplies – 3.5% | |
| | 8,705 | | | The Cooper Cos., Inc. | | | 2,533,155 | |
| | 22,565 | | | Varian Medical Systems, Inc.* | | | 2,726,078 | |
| | 18,075 | | | West Pharmaceutical Services, Inc. | | | 2,599,908 | |
| | | | | | | | |
| | | | | | | 7,859,141 | |
| | |
| | Health Care Providers & Services – 2.2% | |
| | 6,270 | | | Chemed Corp. | | | 2,469,816 | |
| | 15,360 | | | Laboratory Corp. of America Holdings* | | | 2,530,867 | |
| | | | | | | | |
| | | | | | | 5,000,683 | |
| | |
| | Health Care Technology – 1.2% | |
| | 39,270 | | | Cerner Corp. | | | 2,635,802 | |
| | |
| | Hotels, Restaurants & Leisure – 5.0% | |
| | 10,920 | | | Domino’s Pizza, Inc. | | | 2,966,090 | |
| | 33,015 | | | Dunkin’ Brands Group, Inc. | | | 2,595,639 | |
| | 27,960 | | | Hilton Worldwide Holdings, Inc. | | | 2,711,002 | |
| | 136,525 | | | The Wendy’s Co. | | | 2,891,600 | |
| | | | | | | | |
| | | | | | | 11,164,331 | |
| | |
| | Household Products – 1.2% | |
| | 36,840 | | | Church & Dwight Co., Inc. | | | 2,576,590 | |
| | |
| | IT Services – 15.5% | |
| | 29,170 | | | Akamai Technologies, Inc.* | | | 2,523,205 | |
| | 42,985 | | | Black Knight, Inc.* | | | 2,759,637 | |
| | 37,610 | | | Booz Allen Hamilton Holding Corp. | | | 2,646,616 | |
| | 21,480 | | | Broadridge Financial Solutions, Inc. | | | 2,689,725 | |
| | 18,570 | | | Euronet Worldwide, Inc.* | | | 2,601,100 | |
| | 25,530 | | | Fiserv, Inc.* | | | 2,709,754 | |
| | 9,190 | | | FleetCor Technologies, Inc.* | | | 2,703,882 | |
| | 19,335 | | | Gartner, Inc.* | | | 2,979,137 | |
| | 40,600 | | | GoDaddy, Inc. Class A* | | | 2,640,218 | |
| | 18,125 | | | Jack Henry & Associates, Inc. | | | 2,565,775 | |
| | 32,475 | | | Paychex, Inc. | | | 2,716,209 | |
| | 13,850 | | | VeriSign, Inc.* | | | 2,631,777 | |
| | 13,040 | | | WEX, Inc.* | | | 2,466,907 | |
| | | | | | | | |
| | | | | | | 34,633,942 | |
| | |
| | Leisure Equipment & Products – 1.0% | |
| | 22,130 | | | Hasbro, Inc. | | | 2,153,470 | |
| | |
| | |
| 12 | | The accompanying notes are an integral part of these financial statements. |
COMMERCE MIDCAP GROWTH FUND
| | | | | | | | |
| | |
| Shares | | | Description | | Value | |
|
| | Common Stocks – (continued) | |
| | Life Sciences Tools & Services – 3.6% | |
| | 34,475 | | | Agilent Technologies, Inc. | | | $ 2,611,481 | |
| | 13,380 | | | Bio-Techne Corp. | | | 2,785,315 | |
| | 3,720 | | | Mettler-Toledo International, Inc.* | | | 2,622,377 | |
| | | | | | | | |
| | | | | | | 8,019,173 | |
| | |
| | Machinery – 7.1% | |
| | 37,910 | | | Fortive Corp. | | | 2,615,790 | |
| | 56,565 | | | Graco, Inc. | | | 2,556,738 | |
| | 15,635 | | | IDEX Corp. | | | 2,431,711 | |
| | 18,080 | | | Nordson Corp. | | | 2,835,125 | |
| | 22,155 | | | The Middleby Corp.* | | | 2,679,647 | |
| | 36,045 | | | The Toro Co. | | | 2,780,151 | |
| | | | | | | | |
| | | | | | | 15,899,162 | |
| | |
| | Media – 1.0% | |
| | 60,545 | | | CBS Corp. Class B | | | 2,182,042 | |
| | |
| | Multiline Retail – 1.2% | |
| | 16,890 | | | Dollar General Corp. | | | 2,708,143 | |
| | |
| | Professional Services* – 1.1% | |
| | 4,525 | | | CoStar Group, Inc. | | | 2,486,578 | |
| | |
| | Road & Rail – 1.2% | |
| | 23,435 | | | Landstar System, Inc. | | | 2,651,670 | |
| | |
| | Semiconductors & Semiconductor Equipment – 2.4% | |
| | 57,350 | | | Entegris, Inc. | | | 2,752,800 | |
| | 44,380 | | | Maxim Integrated Products, Inc. | | | 2,603,331 | |
| | | | | | | | |
| | | | | | | 5,356,131 | |
| | |
| | Software – 8.6% | |
| | 12,570 | | | ANSYS, Inc.* | | | 2,767,285 | |
| | 40,060 | | | Cadence Design Systems, Inc.* | | | 2,617,921 | |
| | 27,495 | | | Citrix Systems, Inc. | | | 2,993,106 | |
| | 12,685 | | | Palo Alto Networks, Inc.* | | | 2,884,442 | |
| | 19,310 | | | Synopsys, Inc.* | | | 2,621,333 | |
| | 80,660 | | | Teradata Corp.* | | | 2,414,154 | |
| | 10,275 | | | Tyler Technologies, Inc.* | | | 2,759,043 | |
| | | | | | | | |
| | | | | | | 19,057,284 | |
| | |
| | Specialty Retail – 2.4% | |
| | 17,100 | | | Advance Auto Parts, Inc. | | | 2,778,408 | |
| | 26,850 | | | Tractor Supply Co. | | | 2,551,287 | |
| | | | | | | | |
| | | | | | | 5,329,695 | |
| | |
| | Textiles, Apparel & Luxury Goods – 1.1% | |
| | 26,380 | | | Columbia Sportswear Co. | | | 2,386,071 | |
| | |
| | TOTAL COMMON STOCKS | |
| | (Cost $172,643,756) | | | $212,532,952 | |
| | |
| | | | | | | | |
|
| | Exchange Traded Fund – 3.3% | |
| | 51,270 | | | iShares Russell Midcap Growth Index Fund | | | | |
| | (Cost $7,120,072) | | | $ 7,381,854 | |
| | |
| | | | | | | | | | | | |
| Shares | | Dividend
Rate | | | | | | Value | |
|
| Investment Company – 1.2% | |
State Street Institutional US Government Money
Market Fund — Premier Class | |
| 2,621,081 | | | 1.741 | % | | | | | | $ | 2,621,081 | |
(Cost $2,621,081) | | | | | | | | | |
| |
| TOTAL INVESTMENTS – 99.9% | |
(Cost $182,384,909) | | | | | | | $ | 222,535,887 | |
| |
OTHER ASSETS IN EXCESS OF LIABILITIES – 0.1% | | | | 160,641 | |
| |
| NET ASSETS – 100.0% | | | | | | | $ | 222,696,528 | |
| |
| | |
|
| The percentage shown for each investment category reflects the value of investments in that category as a percentage of net assets. |
| |
| * | | Non-income producing security. |
PORTFOLIO COMPOSITION
| | | | | | | | |
| | | AS OF
10/31/19 | | | AS OF
10/31/18 | |
| |
Information Technology | | | 31.5 | % | | | 26.8 | % |
Industrials | | | 19.1 | | | | 18.9 | |
Consumer Discretionary | | | 14.2 | | | | 18.8 | |
Health Care | | | 11.8 | | | | 13.8 | |
Financials | | | 7.1 | | | | 11.0 | |
Real Estate | | | 3.5 | | | | — | |
Communication Services | | | 3.4 | | | | 1.4 | |
Materials | | | 2.4 | | | | 4.8 | |
Consumer Staples | | | 2.4 | | | | 2.8 | |
Exchange Traded Fund | | | 3.3 | | | | 0.5 | |
Investment Company | | | 1.2 | | | | — | |
Repurchase Agreement | | | — | | | | 1.3 | |
| |
| TOTAL INVESTMENTS | | | 99.9 | % | | | 100.1 | % |
| |
The percentage shown for each investment category reflects the value of investments in that category as a percentage of net assets. Underlying investment categories of investment companies, held by the Fund are not reflected in the table above. Consequently, the Fund’s overall investment category allocations may differ from the percentages contained in the table above.
The Fund is actively managed and, as such, its composition may differ over time.
| | |
| The accompanying notes are an integral part of these financial statements. | | 13 |
COMMERCE BOND FUND
Bond Fund Overview
We present you with the annual report for theCommerce Bond Fund for the one-year period ended October 31, 2019.
A conversation with Scott Colbert and Brent Schowe, Portfolio Managers of the Bond Fund.
Q: How did the Fund perform over the review period?
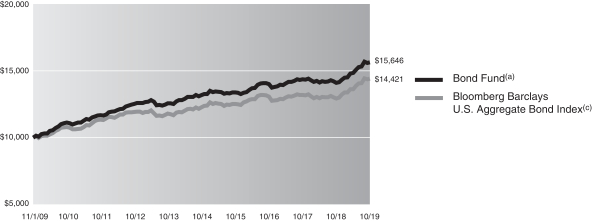
A: Over the one-year period ended October 31, 2019, the Fund generated a cumulative total return of 10.90%. This return compares to the 11.51% cumulative total return of the Fund’s benchmark, the Bloomberg Barclays U.S. Aggregate Bond Index (the “Index”).
Q: What were the material factors that affected the Fund’s performance relative to its benchmark during the reporting period?
A: A key detractor from the Fund’s performance during the period was the level of the Fund’s duration. Treasury yields across the yield curve declined over 100 basis points during the period and the Fund lagged in performance, in part, because it had a shorter duration than the Index. The Fund’s overweight positions in lower-rated, investment grade securities and corporate bonds contributed to its performance relative to the Index during the period.
Q: Were there any significant adjustments made to the Fund’s portfolio during the period?
A: The Fund’s corporate bond exposure was increased and Treasury exposure was lowered during the 12 months ended October 31, 2019. In the second half of the period, the duration of the Fund’s portfolio was gradually increased so that it was closer to the Index’s duration. After the Federal Reserve indicated that it was planning to stop raising interest rates and the inflation outlook looked subdued, the potential for additional increases in Treasury yields seemed diminished. When the probability for higher rates is lessened, it helps to maintain the Fund’s duration closer to neutral relative to the Index.
Q: Could you describe some specific strategies and holdings that enhanced the Fund’s returns during the period?
A: Maintaining an overweight position in corporate bonds and an overweight in BBB rated holdings relative to the Index helped to enhance Fund performance during the period. Give the stable nature of the economy over the period, the risk premium associated with corporate bonds declined, which helped corporate bond prices to rise. As the year progressed, the Fund’s duration was moved closer to neutral relative to the Index. This increase in the Fund’s average duration relative to the Index, on average, contributed to the Fund’s performance.
Q: What were some examples of strategies and holdings that didn’t work well for the Fund during the period?
A: Starting the period with the Fund’s duration shorter than the Index did not help the Fund’s performance. The Federal Reserve ceased raising interest rates in 2019 and instead reversed course by lowering them three times. The Fund did not fully benefit from the resulting lower interest rates because its average duration was shorter than the Index’s duration.
14
COMMERCE BOND FUND
Performance Summary
October 31, 2019 (Unaudited)
The following is performance information for the Commerce Bond Fund (“Bond Fund”) for various time periods. The returns represent past performance. Past performance is no guarantee of future results. The Fund’s investment return and principal value will fluctuate so that an investor’s shares, when redeemed, may be worth more or less than their original cost. Returns do not reflect the deduction of taxes that a shareholder would pay on Fund distributions or the redemption of Fund shares. The Fund is not subject to a sales charge, so a sales charge is not applied to its total returns. In addition to the Adviser’s decisions regarding issuer/industry investment selection and allocation, other factors may affect Fund performance. These factors include, but are not limited to, Fund operating fees and expenses, portfolio turnover, and subscription and redemption cash flows affecting the Fund. Please visit our website at www.commercefunds.com to obtain the most recent month-end returns.
| | | | | | | | |
| | Performance Review | | | | | | |
| | | | |
| | | November 1, 2018 - October 31, 2019 | | Fund Total Return(a) | | Index Total Return(c) | | Index |
| | | | |
| | | Bond Fund | | 10.90% | | 11.51% | | Bloomberg Barclays U.S. Aggregate Bond(c) |
Standardized Average Annual Total Return through September 30, 2019(b)
| | | | | | | | |
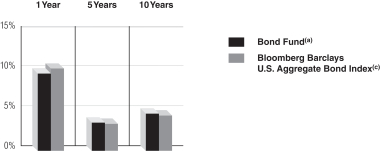
| | Standardized Average Annual Total Return through September 30, 2019(b) | | One Year | | Five Years | | Ten Years |
| | | | |
| | | Bond Fund(a) | | 9.65% | | 3.55% | | 4.64% |
| | | | |
| | | Bloomberg Barclays U.S. Aggregate Bond Index(c) | | 10.30% | | 3.38% | | 3.75% |
Bond Fund 10 Year Performance
Performance of a $10,000 Investment, with distributions reinvested, from November 1, 2009 through October 31, 2019.
| | | | | | | | |
| | Average Annual Total Return through October 31, 2019 | | One Year | | Five Years | | Ten Years |
| | | | |
| | | Bond Fund(a) | | 10.90% | | 3.48% | | 4.58% |
| | | | | | |
| | Expense Ratios(d) | | | | |
| | | |
| | | | | Net Expense Ratio (Current) | | Gross Expense Ratio (Before Reimbursements) |
| | | |
| | | Bond Fund | | 0.66% | | 0.66% |
| (a) | | Returns reflect any applicable fee waivers or expense reductions. Returns do not reflect the deduction of taxes that a shareholder would pay on Fund distributions or the redemption of Fund shares. |
| (b) | | The Standardized Average Annual Total Returns are average annual total returns as of the most recent calendar quarter-end. They assume reinvestment of all distributions at NAV. Current performance may be lower or higher than the total return figures in the above charts. |
Returns reflect any fee waivers and expense reductions. Absent these waivers and reductions, returns would have been lower. Returns do not reflect the deduction of taxes that a shareholder would pay on capital gains or other taxable distributions or the redemption of Fund shares.
| (c) | | The Bloomberg Barclays U.S. Aggregate Bond Index is an unmanaged index that measures the investment grade, U.S. dollar denominated, fixed-rate taxable bond market, including treasuries, government-related and corporate securities, mortgage-backed securities, asset-backed securities, and commercial mortgage-backed securities. The Index figures do not reflect any deduction for fees, taxes or expenses. |
| (d) | | The Fund’s expense ratios, both net (net of applicable fee waivers and/or expense reimbursements) and gross (before applicable fee waivers and/or expense reimbursements), set forth above are as of the most recent publicly available prospectus for the Fund (March 1, 2019) and may differ from the expense ratios disclosed in the Financial Highlights in this report. The Adviser has contractually agreed to reduce or limit the Total Annual Fund Operating Expenses, excluding interest, taxes, acquired fund fees and expenses and extraordinary expenses. This agreement will remain in place through March 1, 2020. After this date, the Adviser or the Fund may terminate the contractual arrangement. If this occurs, the expense ratios may change without shareholder approval. |
15
COMMERCE BOND FUND
Schedule of Investments
October 31, 2019
| | | | | | | | | | | | |
Principal
Amount | | Interest
Rate | | | Maturity
Date | | | Value | |
|
| Corporate Obligations – 41.8% | |
Aerospace/Defense – 0.2% | |
| United Technologies Corp. | |
| $ 2,000,000 | | | 5.700 | % | | | 04/15/40 | | | $ | 2,670,387 | |
| |
Auto Manufacturers – 2.0% | |
| BMW Finance NV(a)(b) | |
| 4,000,000 | | | 2.400 | | | | 08/14/24 | | | | 4,018,917 | |
|
| Ford Motor Co.(a) | |
| 2,000,000 | | | 4.346 | | | | 12/08/26 | | | | 2,010,880 | |
|
| Ford Motor Credit Co. LLC | |
| 2,500,000 | | | 4.134 | | | | 08/04/25 | | | | 2,491,576 | |
|
| General Motors Co.(a) | |
| 3,450,000 | | | 6.600 | | | | 04/01/36 | | | | 4,005,219 | |
|
| General Motors Financial Co., Inc.(a) | |
| 2,000,000 | | | 3.950 | | | | 04/13/24 | | | | 2,070,108 | |
|
| PACCAR Financial Corp. | |
| 5,000,000 | | | 2.150 | | | | 08/15/24 | | | | 5,022,712 | |
|
| Volkswagen Group of America Finance LLC(b) | |
| 4,000,000 | | | 4.750 | | | | 11/13/28 | | | | 4,536,427 | |
| | | | | | | | | | | | |
| | | | 24,155,839 | |
| |
Banks – 6.8% | |
| Bank of America Corp. | |
| 3,000,000 | | | 4.000 | | | | 01/22/25 | | | | 3,199,857 | |
|
| (3M USD LIBOR + 1.040%) | |
| 3,749,000 | | | 3.419(a)(c) | | | | 12/20/28 | | | | 3,924,129 | |
|
| BB&T Corp.(a) | |
| 5,455,000 | | | 2.500 | | | | 08/01/24 | | | | 5,526,804 | |
|
| Citigroup, Inc. | |
| 3,000,000 | | | 5.500 | | | | 09/13/25 | | | | 3,431,819 | |
| 3,500,000 | | | 4.450 | | | | 09/29/27 | | | | 3,850,637 | |
|
| Cooperatieve Rabobank UA | |
| 3,100,000 | | | 2.750 | | | | 01/10/23 | | | | 3,162,217 | |
|
| Credit Suisse AG | |
| 3,000,000 | | | 3.000 | | | | 10/29/21 | | | | 3,057,009 | |
|
| Deutsche Bank AG | |
| 2,000,000 | | | 3.125 | | | | 01/13/21 | | | | 2,009,198 | |
|
| HSBC Holdings PLC | |
| 3,130,000 | | | 6.100 | | | | 01/14/42 | | | | 4,461,733 | |
|
| HSBC USA, Inc. | |
| 1,052,000 | | | 9.300 | | | | 06/01/21 | | | | 1,160,596 | |
|
| JPMorgan Chase & Co.(c) | |
| (3M USD LIBOR + 0.610%) | |
| 1,500,000 | | | 3.514(a) | | | | 06/18/22 | | | | 1,533,732 | |
|
| (3M USD LIBOR + 1.000%) | |
| 150,000 | | | 2.936 | | | | 04/26/23 | | | | 149,805 | |
|
| (3M USD LIBOR + 1.160%) | |
| 1,650,000 | | | 3.702(a) | | | | 05/06/30 | | | | 1,774,951 | |
|
| (3M USD LIBOR + 1.330%) | |
| 2,000,000 | | | 4.452(a) | | | | 12/05/29 | | | | 2,266,389 | |
|
| (3M USD LIBOR + 3.470%) | |
| 1,222,000 | | | 5.406(a) | | | | 12/29/49 | | | | 1,229,332 | |
| |
| | | | | | | | | | | | |
Principal
Amount | | Interest
Rate | | | Maturity
Date | | | Value | |
|
| Corporate Obligations – (continued) | |
Banks – (continued) | |
|
| KeyBank NA | |
| $ 4,000,000 | | | 3.400% | | | | 05/20/26 | | | $ | 4,197,576 | |
| Lloyds Bank PLC | |
| 1,640,000 | | | 6.375 | | | | 01/21/21 | | | | 1,726,081 | |
|
| Mitsubishi UFJ Financial Group, Inc. | |
| 3,000,000 | | | 3.777 | | | | 03/02/25 | | | | 3,201,847 | |
|
| Morgan Stanley | |
| 4,375,000 | | | 4.100 | | | | 05/22/23 | | | | 4,632,717 | |
|
| PNC Bank NA(a) | |
| 2,500,000 | | | 2.950 | | | | 01/30/23 | | | | 2,562,825 | |
|
| The PNC Financial Services Group, Inc.(a) | |
| 3,750,000 | | | 3.150 | | | | 05/19/27 | | | | 3,959,018 | |
|
| (3M USD LIBOR + 3.678%) | |
| 2,500,000 | | | 6.750 | (c) | | | 07/29/49 | | | | 2,665,250 | |
|
| U.S. Bancorp(a) | |
| 2,050,000 | | | 3.600 | | | | 09/11/24 | | | | 2,180,092 | |
|
| UBS Group Funding Switzerland AG(a)(b)(c) | |
| (3M USD LIBOR + 0.954%) | |
| 2,750,000 | | | 2.859 | | | | 08/15/23 | | | | 2,789,518 | |
|
| Wells Fargo & Co. | |
| 2,500,000 | | | 4.100 | | | | 06/03/26 | | | | 2,689,979 | |
| 1,500,000 | | | 4.650 | | | | 11/04/44 | | | | 1,766,961 | |
| 5,000,000 | | | 4.750 | | | | 12/07/46 | | | | 5,972,161 | |
|
| Wells Fargo Bank NA(d) | |
| 2,000,000 | | | 6.180 | | | | 02/15/36 | | | | 2,540,000 | |
| | | | | | | | | | | | |
| | | | 81,622,233 | |
| |
Beverages(a) – 0.8% | |
| Anheuser-Busch InBev Worldwide, Inc. | |
| 6,000,000 | | | 4.439 | | | | 10/06/48 | | | | 6,734,744 | |
|
| PepsiCo, Inc. | |
| 2,190,000 | | | 4.450 | | | | 04/14/46 | | | | 2,763,829 | |
| | | | | | | | | | | | |
| | | | 9,498,573 | |
| |
Biotechnology – 0.4% | |
| Amgen, Inc. | |
| 1,295,000 | | | 6.400 | | | | 02/01/39 | | | | 1,756,064 | |
|
| Celgene Corp.(a) | |
| 3,250,000 | | | 3.900 | | | | 02/20/28 | | | | 3,570,695 | |
| | | | | | | | | | | | |
| | | | 5,326,759 | |
| |
Chemicals(a) – 0.4% | |
| PPG Industries, Inc. | |
| 2,355,000 | | | 2.400 | | | | 08/15/24 | | | | 2,377,954 | |
|
| Praxair, Inc. | |
| 2,740,000 | | | 3.200 | | | | 01/30/26 | | | | 2,902,676 | |
| | | | | | | | | | | | |
| | | | 5,280,630 | |
| |
Commercial Services – 1.0% | |
| Henry J. Kaiser Family Foundation | |
| 6,250,000 | | | 3.356 | | | | 12/01/25 | | | | 6,593,657 | |
|
| Northwestern University | |
| 1,000,000 | | | 4.643 | | | | 12/01/44 | | | | 1,277,487 | |
| |
| | |
| 16 | | The accompanying notes are an integral part of these financial statements. |
COMMERCE BOND FUND
| | | | | | | | | | | | |
Principal
Amount | | Interest
Rate | | | Maturity
Date | | | Value | |
|
| Corporate Obligations – (continued) | |
Commercial Services – (continued) | |
|
| The Corp. of Gonzaga University | |
| $ 3,500,000 | | | 4.158% | | | | 04/01/46 | | | $ | 3,987,410 | |
| | | | | | | | | | | | |
| | | | 11,858,554 | |
| |
Distribution/Wholesale(a) – 0.2% | |
|
| WW Grainger, Inc. | |
| 2,260,000 | | | 4.600 | | | | 06/15/45 | | | | 2,697,169 | |
| |
Diversified Financial Services – 3.1% | |
|
| Air Lease Corp.(a) | |
| 2,500,000 | | | 3.000 | | | | 09/15/23 | | | | 2,543,187 | |
|
| Aircastle Ltd.(a) | |
| 1,000,000 | | | 4.250 | | | | 06/15/26 | | | | 1,040,233 | |
|
| American Express Co.(a) | |
| 3,115,000 | | | 3.125 | | | | 05/20/26 | | | | 3,274,882 | |
|
| Brookfield Asset Management, Inc.(a) | |
| 2,000,000 | | | 4.000 | | | | 01/15/25 | | | | 2,138,794 | |
|
| CDP Financial, Inc.(b) | |
| 1,000,000 | | | 3.150 | | | | 07/24/24 | | | | 1,061,609 | |
|
| Citicorp Lease Pass-Through Trust1999-1(b) | |
| 1,859,423 | | | 8.040 | | | | 12/15/19 | | | | 1,871,879 | |
|
| CME Group, Inc. | |
| 1,685,000 | | | 3.000 | | | | 09/15/22 | | | | 1,744,024 | |
|
| Franklin Resources, Inc. | |
| 5,000,000 | | | 2.850 | | | | 03/30/25 | | | | 5,166,793 | |
|
| Invesco Finance PLC | |
| 6,509,000 | | | 3.125 | | | | 11/30/22 | | | | 6,683,436 | |
|
| Janus Capital Group, Inc.(a) | |
| 3,000,000 | | | 4.875 | | | | 08/01/25 | | | | 3,271,410 | |
|
| Legg Mason, Inc. | |
| 3,895,000 | | | 5.625 | | | | 01/15/44 | | | | 4,393,362 | |
|
| TD Ameritrade Holding Corp.(a) | |
| 1,225,000 | | | 2.750 | | | | 10/01/29 | | | | 1,230,207 | |
|
| The Charles Schwab Corp. | |
| 2,500,000 | | | 3.225 | | | | 09/01/22 | | | | 2,581,897 | |
| | | | | | | | | | | | |
| | | | | | | | | | | 37,001,713 | |
| |
Electric – 3.6% | |
| Arizona Public Service Co. | |
| 2,150,000 | | | 6.875 | | | | 08/01/36 | | | | 3,015,932 | |
|
| Consumers Energy Co.(a) | |
| 3,290,000 | | | 3.950 | | | | 07/15/47 | | | | 3,813,114 | |
|
| Duke Energy Progress LLC(a) | |
| 2,000,000 | | | 2.800 | | | | 05/15/22 | | | | 2,045,545 | |
|
| Emerson Electric Co. | |
| 1,000,000 | | | 6.125 | | | | 04/15/39 | | | | 1,385,678 | |
|
| Entergy Louisiana LLC(a) | |
| 3,000,000 | | | 3.780 | | | | 04/01/25 | | | | 3,181,306 | |
|
| Gulf Power Co.(a) | |
| 1,250,000 | | | 4.550 | | | | 10/01/44 | | | | 1,413,396 | |
| Louisville Gas & Electric Co.(a) | |
| 1,850,000 | | | 4.650 | | | | 11/15/43 | | | | 2,217,863 | |
| |
| | | | | | | | | | |
Principal
Amount | | Interest
Rate | | | Maturity
Date | | Value | |
|
| Corporate Obligations – (continued) | |
Electric – (continued) | |
|
| National Grid USA | |
| $ 3,375,000 | | | 8.000 | % | | 11/15/30 | | $ | 4,694,610 | |
|
| Ohio Power Co. | |
| 2,870,000 | | | 5.850 | | | 10/01/35 | | | 3,768,163 | |
|
| Pacific Gas & Electric Co.(e) | |
| 2,000,000 | | | 6.350 | | | 02/15/38 | | | 2,030,000 | |
|
| PacifiCorp | |
| 1,900,000 | | | 6.100 | | | 08/01/36 | | | 2,595,756 | |
|
| PPL Electric Utilities Corp.(a) | |
| 1,025,000 | | | 4.750 | | | 07/15/43 | | | 1,272,563 | |
|
| PSEG Power LLC | |
| 5,500,000 | | | 8.625 | | | 04/15/31 | | | 7,742,193 | |
|
| Southern California Edison Co. | |
| 1,000,000 | | | 5.550 | | | 01/15/37 | | | 1,201,661 | |
|
| Wisconsin Public Service Corp.(a) | |
| 3,000,000 | | | 3.300 | | | 09/01/49 | | | 3,101,681 | |
| | | | | | | | | | |
| | | | | | | | | 43,479,461 | |
| |
Electronics(a) – 0.2% | |
| PerkinElmer, Inc. | |
| 2,410,000 | | | 3.300 | | | 09/15/29 | | | 2,429,749 | |
| |
Gas(a) – 0.6% | |
| Atmos Energy Corp. | |
| 1,400,000 | | | 4.125 | | | 03/15/49 | | | 1,648,467 | |
|
| Boston Gas Co.(b) | |
| 1,000,000 | | | 3.001 | | | 08/01/29 | | | 1,038,313 | |
|
| Northwest Natural Gas Co. | |
| 4,650,000 | | | 3.869 | | | 06/15/49 | | | 4,993,143 | |
| | | | | | | | | | |
| | | | | | | | | 7,679,923 | |
| |
Healthcare-Services – 2.5% | |
| Adventist Health System(a) | |
| 7,000,000 | | | 2.952 | | | 03/01/29 | | | 7,029,413 | |
|
| Ascension Health | |
| 3,000,000 | | | 2.532 | (a) | | 11/15/29 | | | 3,014,045 | |
| 1,500,000 | | | 3.945 | | | 11/15/46 | | | 1,728,865 | |
|
| Baptist Health South Florida, Inc. | |
| 3,695,000 | | | 4.342 | | | 11/15/41 | | | 4,279,398 | |
|
| Community Health Network, Inc. | |
| 2,225,000 | | | 4.237 | | | 05/01/25 | | | 2,409,454 | |
|
| Mayo Clinic | |
| 2,600,000 | | | 3.774 | | | 11/15/43 | | | 2,887,473 | |
|
| SSM Health Care Corp.(a) | |
| 3,000,000 | | | 3.688 | | | 06/01/23 | | | 3,144,679 | |
| 4,990,000 | | | 3.823 | | | 06/01/27 | | | 5,371,921 | |
| | | | | | | | | | |
| | | | | | | | | 29,865,248 | |
| |
Insurance – 4.0% | |
| American International Group, Inc.(a) | |
| 2,000,000 | | | 3.750 | | | 07/10/25 | | | 2,139,595 | |
|
| Arch Capital Group Ltd. | |
| 2,149,000 | | | 7.350 | | | 05/01/34 | | | 3,106,091 | |
| |
| | |
| The accompanying notes are an integral part of these financial statements. | | 17 |
COMMERCE BOND FUND
Schedule of Investments(continued)
October 31, 2019
| | | | | | | | | | |
Principal
Amount | | Interest
Rate | | | Maturity
Date | | Value | |
|
| Corporate Obligations – (continued) | |
Insurance – (continued) | |
|
| Berkshire Hathaway Finance Corp.(a) | |
| $ 4,220,000 | | | 4.200 | % | | 08/15/48 | | $ | 4,965,598 | |
|
| Guardian Life Global Funding(b) | |
| 2,000,000 | | | 2.000 | | | 04/26/21 | | | 2,002,955 | |
|
| Loews Corp.(a) | |
| 3,900,000 | | | 3.750 | | | 04/01/26 | | | 4,206,207 | |
|
| MassMutual Global Funding II(b) | |
| 6,150,000 | | | 2.950 | | | 01/11/25 | | | 6,351,811 | |
|
| MetLife, Inc.(a) | |
| 2,055,000 | | | 10.750 | | | 08/01/39 | | | 3,379,530 | |
|
| Metropolitan Life Global Funding I(b) | |
| 1,360,000 | | | 2.400 | | | 06/17/22 | | | 1,372,600 | |
|
| New York Life Global Funding(b) | |
| 2,000,000 | | | 2.000 | | | 04/13/21 | | | 2,003,972 | |
|
| Principal Life Global Funding II(b) | |
| 2,000,000 | | | 2.200 | | | 04/08/20 | | | 2,002,075 | |
|
| Prudential Financial, Inc.(a)(c) | |
| (3M USD LIBOR + 4.175%) | |
| 2,000,000 | | | 5.875 | | | 09/15/42 | | | 2,167,740 | |
|
| Reinsurance Group of America, Inc. | |
| 2,100,000 | | | 5.000 | | | 06/01/21 | | | 2,192,255 | |
| 2,000,000 | | | 3.950 | (a) | | 09/15/26 | | | 2,114,275 | |
|
| The Prudential Insurance Co. of America(b) | |
| 2,775,000 | | | 8.300 | | | 07/01/25 | | | 3,578,487 | |
|
| The Travelers Cos., Inc.(a) | |
| 2,000,000 | | | 4.100 | | | 03/04/49 | | | 2,359,131 | |
|
| Travelers Property Casualty Corp. | |
| 1,493,000 | | | 7.750 | | | 04/15/26 | | | 1,974,824 | |
|
| Voya Financial, Inc. | |
| 1,800,000 | | | 3.650 | | | 06/15/26 | | | 1,898,275 | |
| | | | | | | | | | |
| | | | | | | | | 47,815,421 | |
| |
Media – 0.8% | |
| CBS Corp. | |
| 2,500,000 | | | 7.875 | | | 09/01/23 | | | 2,915,424 | |
|
| Comcast Corp. | |
| 1,250,000 | | | 6.400 | | | 05/15/38 | | | 1,765,176 | |
|
| DIRECTV Holdings LLC/DIRECTV Financing Co., Inc. | |
| 2,725,000 | | | 6.375 | | | 03/01/41 | | | 3,155,358 | |
|
| The Walt Disney Co.(b) | |
| 1,000,000 | | | 7.125 | | | 04/08/28 | | | 1,351,979 | |
| | | | | | | | | | |
| | | | | | | | | 9,187,937 | |
| |
Metals & Mining – 0.3% | |
| The Timken Co. | |
| 2,750,000 | | | 6.875 | | | 05/08/28 | | | 3,295,456 | |
| |
Miscellaneous Manufacturing – 0.5% | |
| General Electric Co. | |
| 1,500,000 | | | 4.500 | | | 03/11/44 | | | 1,625,650 | |
|
| (3M USD LIBOR + 3.330%) | |
| 1,894,000 | | | 5.000 | (a)(c) | | 12/29/49 | | | 1,825,343 | |
| |
| | | | | | | | | | |
Principal
Amount | | Interest
Rate | | | Maturity
Date | | Value | |
|
| Corporate Obligations – (continued) | |
Miscellaneous Manufacturing – (continued) | |
| Siemens Financieringsmaatschappij NV(b) | |
| $ 2,228,000 | | | 1.700 | % | | 09/15/21 | | $ | 2,222,825 | |
| | | | | | | | | | |
| | | | | | | | | 5,673,818 | |
| |
Oil-Field Services – 2.9% | |
| Apache Corp. | |
| 2,835,000 | | | 5.100 | (a) | | 09/01/40 | | | 2,707,360 | |
| 1,360,000 | | | 7.375 | | | 08/15/47 | | | 1,691,921 | |
|
| BP Capital Markets America, Inc. | |
| 3,250,000 | | | 2.750 | | | 05/10/23 | | | 3,329,326 | |
|
| Equinor ASA | |
| 1,795,000 | | | 6.800 | | | 01/15/28 | | | 2,354,049 | |
|
| Exxon Mobil Corp.(a) | |
| 3,000,000 | | | 2.726 | | | 03/01/23 | | | 3,085,664 | |
|
| Halliburton Co.(a) | |
| 5,000,000 | | | 5.000 | | | 11/15/45 | | | 5,511,241 | |
|
| HollyFrontier Corp.(a) | |
| 3,850,000 | | | 5.875 | | | 04/01/26 | | | 4,312,334 | |
|
| Phillips 66(a) | |
| 3,000,000 | | | 4.650 | | | 11/15/34 | | | 3,486,574 | |
|
| Saudi Arabian Oil Co.(b) | |
| 5,000,000 | | | 3.500 | | | 04/16/29 | | | 5,193,689 | |
|
| Tosco Corp. | |
| 2,095,000 | | | 8.125 | | | 02/15/30 | | | 3,037,501 | |
| | | | | | | | | | |
| | | | | | | | | 34,709,659 | |
| |
Paper and Forest Products – 0.4% | |
| International Paper Co. | |
| 2,925,000 | | | 8.700 | | | 06/15/38 | | | 4,330,834 | |
| |
Pharmaceuticals – 1.3% | |
| CVS Pass-Through Trust(b) | |
| 2,652,357 | | | 7.507 | | | 01/10/32 | | | 3,286,670 | |
|
| Johnson & Johnson | |
| 4,970,000 | | | 5.950 | | | 08/15/37 | | | 7,146,173 | |
|
| Pfizer, Inc. | |
| 2,900,000 | | | 7.200 | | | 03/15/39 | | | 4,566,013 | |
| | | | | | | | | | |
| | | | | | | | | 14,998,856 | |
| |
Pipelines – 2.1% | |
| Buckeye Partners LP(a) | |
| 2,000,000 | | | 4.350 | | | 10/15/24 | | | 2,003,074 | |
|
| DCP Midstream Operating LP | |
| 3,397,000 | | | 8.125 | | | 08/16/30 | | | 4,169,817 | |
|
| Energy Transfer Operating LP(a) | |
| 3,000,000 | | | 4.900 | | | 03/15/35 | | | 3,133,894 | |
|
| Kinder Morgan Energy Partners LP | |
| 4,175,000 | | | 5.800 | | | 03/15/35 | | | 4,894,751 | |
|
| Tennessee Gas Pipeline Co. LLC | |
| 628,000 | | | 8.375 | | | 06/15/32 | | | 873,411 | |
| 1,450,000 | | | 7.625 | | | 04/01/37 | | | 1,943,907 | |
|
| TransCanada PipeLines Ltd.(a) | |
| 2,500,000 | | | 4.875 | | | 01/15/26 | | | 2,797,821 | |
| |
| | |
| 18 | | The accompanying notes are an integral part of these financial statements. |
COMMERCE BOND FUND
| | | | | | | | | | |
Principal
Amount | | Interest
Rate | | | Maturity
Date | | Value | |
|
| Corporate Obligations – (continued) | |
Pipelines – (continued) | |
|
| Transcanada Trust(a)(c) | |
|
| (3M USD LIBOR + 3.208%) | |
| $ 4,660,000 | | | 5.300 | % | | 03/15/77 | | $ | 4,775,149 | |
| | | | | | | | | | |
| | | | | | | | | 24,591,824 | |
| |
Real Estate — 4.6% | |
| Columbia Property Trust Operating Partnership LP(a) | |
| 2,485,000 | | | 4.150 | | | 04/01/25 | | | 2,612,493 | |
|
| Mid-America Apartments LP(a) | |
| 1,860,000 | | | 4.300 | | | 10/15/23 | | | 1,990,512 | |
| 1,700,000 | | | 3.600 | | | 06/01/27 | | | 1,813,918 | |
|
| National Retail Properties, Inc.(a) | |
| 1,000,000 | | | 3.900 | | | 06/15/24 | | | 1,063,883 | |
|
| Office Properties Income Trust(a) | |
| 4,000,000 | | | 4.250 | | | 05/15/24 | | | 4,109,630 | |
|
| Omega Healthcare Investors, Inc.(a) | |
| 4,500,000 | | | 4.750 | | | 01/15/28 | | | 4,919,457 | |
|
| Piedmont Operating Partnership LP(a) | |
| 1,290,000 | | | 3.400 | | | 06/01/23 | | | 1,313,003 | |
| 2,800,000 | | | 4.450 | | | 03/15/24 | | | 2,967,776 | |
|
| Post Apartment Homes LP(a) | |
| 1,500,000 | | | 3.375 | | | 12/01/22 | | | 1,546,060 | |
|
| SBA Tower Trust(b) | |
| 5,000,000 | | | 2.877 | (a) | | 07/09/21 | | | 5,022,659 | |
| 3,520,000 | | | 3.448 | | | 03/15/23 | | | 3,630,774 | |
|
| Scentre Group Trust 1/Scentre Group Trust 2(a)(b) | |
| 4,000,000 | | | 3.750 | | | 03/23/27 | | | 4,235,852 | |
|
| Simon Property Group LP(a) | |
| 2,815,000 | | | 3.750 | | | 02/01/24 | | | 2,991,689 | |
| 3,000,000 | | | 4.750 | | | 03/15/42 | | | 3,665,016 | |
|
| STORE Capital Corp.(a) | |
| 2,000,000 | | | 4.500 | | | 03/15/28 | | | 2,195,479 | |
|
| UDR, Inc.(a) | |
| 2,640,000 | | | 3.750 | | | 07/01/24 | | | 2,807,505 | |
|
| Ventas Realty LP(a) | |
| 2,910,000 | | | 3.500 | | | 02/01/25 | | | 3,058,604 | |
|
| VEREIT Operating Partnership LP(a) | |
| 2,400,000 | | | 3.950 | | | 08/15/27 | | | 2,548,842 | |
|
| Washington Real Estate Investment Trust(a) | |
| 1,580,000 | | | 3.950 | | | 10/15/22 | | | 1,639,950 | |
|
| Weingarten Realty Investors(a) | |
| 1,000,000 | | | 3.850 | | | 06/01/25 | | | 1,042,829 | |
| | | | | | | | | | |
| | | | | | | | | 55,175,931 | |
| |
Semiconductors(a) – 0.7% | |
| Maxim Integrated Products, Inc. | |
| 5,016,000 | | | 3.375 | | | 03/15/23 | | | 5,160,619 | |
|
| Texas Instruments, Inc. | |
| 2,925,000 | | | 3.875 | | | 03/15/39 | | | 3,333,896 | |
| | | | | | | | | | |
| | | | | | | | | 8,494,515 | |
| |
| | | | | | | | | | |
Principal
Amount | | Interest
Rate | | | Maturity
Date | | Value | |
|
| Corporate Obligations – (continued) | |
Software – 0.0% | |
| Adobe, Inc. | |
| $ 563,000 | | | 4.750 | % | | 02/01/20 | | $ | 566,836 | |
| |
Telecommunications – 1.3% | |
| AT&T, Inc.(a) | |
| 4,380,000 | | | 3.600 | | | 07/15/25 | | | 4,617,065 | |
|
| Bell Canada, Inc.(a) | |
| 2,600,000 | | | 4.464 | | | 04/01/48 | | | 3,011,693 | |
|
| Sprint Spectrum Co. LLC/Sprint Spectrum Co. II LLC/Sprint Spectrum Co. III LLC(b) | |
| 2,000,000 | | | 4.738 | | | 03/20/25 | | | 2,132,520 | |
|
| Verizon Communications, Inc. | |
| 4,748,000 | | | 4.329 | | | 09/21/28 | | | 5,406,751 | |
| | | | | | | | | | |
| | | | | | | | | 15,168,029 | |
| |
Transportation – 1.1% | |
| Burlington Northern Santa Fe LLC(a) | |
| 1,220,000 | | | 4.950 | | | 09/15/41 | | | 1,515,727 | |
|
| Canadian National Railway Co. | |
| 1,190,000 | | | 6.200 | | | 06/01/36 | | | 1,684,808 | |
|
| Canadian Pacific Railway Co. | |
| 1,980,000 | | | 5.750 | | | 01/15/42 | | | 2,654,232 | |
| 2,500,000 | | | 6.125 | (a)(f) | | 09/15/15 | | | 3,677,066 | |
|
| Kansas City Southern(a) | |
| 1,000,000 | | | 4.950 | | | 08/15/45 | | | 1,212,313 | |
| 1,500,000 | | | 4.700 | | | 05/01/48 | | | 1,770,706 | |
|
| The Kansas City Southern Railway Co.(a) | |
| 500,000 | | | 4.950 | | | 08/15/45 | | | 606,156 | |
| | | | | | | | | | |
| | | | | | | | | 13,121,008 | |
| |
| TOTAL CORPORATE OBLIGATIONS | |
(Cost $468,368,898) | | $ | 500,696,362 | |
| |
| | | | | | | | | | |
|
| Mortgage-Backed Obligations – 21.7% | |
Collateralized Mortgage Obligations – 17.7% | |
| Adjustable Rate Mortgage Trust Series2004-5, Class 3A1(c)(g) | |
| $ 177,318 | | | 4.399 | % | | 04/25/35 | | $ | 179,220 | |
|
| Agate Bay Mortgage Loan Trust Series2014-3, Class A2(b)(c)(g) | |
| 3,004,024 | | | 3.500 | | | 11/25/44 | | | 3,053,794 | |
|
| Agate Bay Mortgage Loan Trust Series2015-3, Class A8(b)(c)(g) | |
| 972,731 | | | 3.000 | | | 04/25/45 | | | 957,950 | |
|
| Agate Bay Mortgage Loan Trust Series2016-1, Class A5(b)(c)(g) | |
| 1,855,394 | | | 3.500 | | | 12/25/45 | | | 1,869,997 | |
|
| Agate Bay Mortgage Loan Trust Series2016-2, Class A3(b)(c)(g) | |
| 1,079,876 | | | 3.500 | | | 03/25/46 | | | 1,101,239 | |
|
| Banc of America Alternative Loan Trust Series2005-10, Class 6A1 | |
| 65,706 | | | 5.500 | | | 11/25/20 | | | 65,765 | |
| |
| | |
| The accompanying notes are an integral part of these financial statements. | | 19 |
COMMERCE BOND FUND
Schedule of Investments(continued)
October 31, 2019
| | | | | | | | | | |
Principal
Amount | | Interest
Rate | | | Maturity
Date | | Value | |
|
| Mortgage-Backed Obligations – (continued) | |
Collateralized Mortgage Obligations – (continued) | |
|
| Banc of America Alternative Loan Trust Series2006-3, Class 6A1 | |
| $ 14,777 | | | 6.000 | % | | 04/25/36 | | $ | 14,894 | |
|
| Bear StearnsAlt-A Trust Series2004-8, Class 1A(c) | |
|
| (1M USD LIBOR + 0.700%) | |
| 314,008 | | | 2.523 | | | 09/25/34 | | | 314,047 | |
|
| Bear StearnsAlt-A Trust Series2005-9, Class 25A1(c)(g) | |
| 1,316,517 | | | 4.174 | | | 11/25/35 | | | 1,133,158 | |
|
| Bear Stearns Asset Backed Securities Trust Series2003-AC7, Class A2(h) | |
| 249,990 | | | 5.750 | | | 01/25/34 | | | 254,543 | |
|
| Citicorp Mortgage Securities Trust, Inc. Series2006-4, Class 3A1 | |
| 4,719 | | | 5.500 | | | 08/25/21 | | | 4,746 | |
|
| Citigroup Mortgage Loan Trust, Inc. Series 2004-NCM2, Class 1CB2 | |
| 608,454 | | | 6.750 | | | 08/25/34 | | | 655,893 | |
|
Citigroup Mortgage Loan Trust, Inc. Series2005-10,
Class 1A5A(c)(g) | |
| 260,255 | | | 4.742 | | | 12/25/35 | | | 242,270 | |
|
Citigroup Mortgage Loan Trust, Inc. Series2007-AR5,
Class 1A3A(c)(g) | |
| 97,637 | | | 4.703 | | | 04/25/37 | | | 93,670 | |
|
| Citigroup Mortgage Loan Trust, Inc. Series2015-A, Class A1(b)(c)(g) | |
| 1,236,840 | | | 3.500 | | | 06/25/58 | | | 1,250,442 | |
|
| CitiMortgage Alternative Loan Trust Series2006-A3, Class 2A1 | |
| 3,342 | | | 5.500 | | | 07/25/36 | | | 3,348 | |
|
| Countrywide Alternative Loan Trust Series 2004-18CB, Class 3A1 | |
| 28,691 | | | 5.250 | | | 09/25/19 | | | 28,566 | |
|
| Countrywide Alternative Loan Trust Series2005-J1, Class 3A1 | |
| 24,887 | | | 6.500 | | | 08/25/32 | | | 25,596 | |
|
| Countrywide Alternative Loan Trust Series2007-J2, Class 2A1 | |
| 23,605 | | | 6.000 | | | 07/25/37 | | | 23,526 | |
|
| Countrywide Home Loans Trust Series2005-27, Class 2A1 | |
| 605,304 | | | 5.500 | | | 12/25/35 | | | 471,082 | |
|
| Countrywide Home Loans Trust Series2005-6, Class 2A1 | |
| 118,395 | | | 5.500 | | | 04/25/35 | | | 114,388 | |
|
| Countrywide Home Loans Trust Series2005-7, Class 1A1(c) | |
|
| (1M USD LIBOR + 0.540%) | |
| 767,992 | | | 2.363 | | | 03/25/35 | | | 751,761 | |
|
| CS First Boston Mortgage Securities Corp. Series2003-19, Class 1A4 | |
| 192,965 | | | 5.250 | | | 07/25/33 | | | 200,609 | |
|
| CS First Boston Mortgage Securities Corp. Series2005-5, Class 2A9 | |
| 712,786 | | | 5.500 | | | 07/25/35 | | | 718,458 | |
|
| CSMC Trust Series 2014-WIN2, Class A3(b)(c)(g) | |
| 2,693,337 | | | 3.500 | | | 10/25/44 | | | 2,736,774 | |
| |
| | | | | | | | | | |
Principal
Amount | | Interest
Rate | | | Maturity
Date | | Value | |
|
| Mortgage-Backed Obligations – (continued) | |
Collateralized Mortgage Obligations – (continued) | |
|
| CSMC Trust Series2017-HL2, Class A1(b)(c)(g) | |
| $ 4,019,621 | | | 3.500 | % | | 10/25/47 | | $ | 4,065,606 | |
|
| CSMC Trust Series2017-HL2, Class A3(b)(c)(g) | |
| 3,545,115 | | | 3.500 | | | 10/25/47 | | | 3,611,685 | |
|
| EverBank Mortgage Loan Trust Series2013-2, Class A(b)(c)(g) | |
| 2,194,010 | | | 3.000 | | | 06/25/43 | | | 2,222,892 | |
|
| FHLMC REMIC Series 1579, Class PM | |
| 42,055 | | | 6.700 | | | 09/15/23 | | | 44,895 | |
|
| FHLMC REMIC Series 2103, Class TE | |
| 45,128 | | | 6.000 | | | 12/15/28 | | | 50,640 | |
|
| FHLMC REMIC Series 2110, Class PG | |
| 213,145 | | | 6.000 | | | 01/15/29 | | | 236,435 | |
| FHLMC REMIC Series 2391, Class Z | |
| 591,796 | | | 6.000 | | | 12/15/31 | | | 665,562 | |
|
| FHLMC REMIC Series 2603, Class C | |
| 165,469 | | | 5.500 | | | 04/15/23 | | | 170,633 | |
|
| FHLMC REMIC Series 2866, Class DH | |
| 67,687 | | | 4.000 | | | 09/15/34 | | | 68,223 | |
|
| FHLMC REMIC Series 4088, Class EP | |
| 3,305,706 | | | 2.750 | | | 09/15/41 | | | 3,355,463 | |
|
| FHLMC REMIC Series 4272, Class DG | |
| 1,127,024 | | | 3.000 | | | 04/15/43 | | | 1,155,309 | |
|
| FHLMC REMIC Series 4370, Class PA | |
| 1,047,634 | | | 3.500 | | | 09/15/41 | | | 1,079,179 | |
|
| FHLMC REMIC Series 4679, Class DY | |
| 264,429 | | | 3.500 | | | 07/15/42 | | | 277,937 | |
|
| FHLMC REMIC Series 4710, Class WA | |
| 562,054 | | | 3.500 | | | 03/15/44 | | | 583,503 | |
|
| FHLMC REMIC Series 4729, Class AG | |
| 2,365,000 | | | 3.000 | | | 01/15/44 | | | 2,450,373 | |
|
| FHLMC REMIC Series 4770, Class JH | |
| 1,545,913 | | | 4.500 | | | 10/15/45 | | | 1,603,728 | |
|
| FHLMC REMIC Series 4792, Class AC | |
| 929,073 | | | 3.500 | | | 05/15/48 | | | 964,092 | |
|
| FHLMC REMIC Series 4840, Class MB | |
| 8,505,855 | | | 4.500 | | | 09/15/46 | | | 9,100,501 | |
|
| FHLMC REMIC Series 4841, Class VH | |
| 4,217,000 | | | 4.500 | | | 10/15/37 | | | 4,537,036 | |
|
| First Horizon Alternative Mortgage Securities Series2006-RE1, Class A1 | |
| 1,072,432 | | | 5.500 | | | 05/25/35 | | | 962,408 | |
|
| Flagstar Mortgage Trust Series2017-2, Class A5(b)(c)(g) | |
| 1,738,325 | | | 3.500 | | | 10/25/47 | | | 1,774,078 | |
|
| Flagstar Mortgage Trust Series2018-2, Class A4(b)(c)(g) | |
| 8,089,966 | | | 3.500 | | | 04/25/48 | | | 8,238,175 | |
|
| Flagstar Mortgage Trust Series 2019-1INV, Class A3(b)(c)(g) | |
| 5,500,000 | | | 3.500 | | | 10/25/49 | | | 5,587,656 | |
|
| FNMA REMIC Series2001-45, Class WG | |
| 39,547 | | | 6.500 | | | 09/25/31 | | | 44,039 | |
|
| FNMA REMIC Series2003-117, Class KB | |
| 2,391,644 | | | 6.000 | | | 12/25/33 | | | 2,744,399 | |
| |
| | |
| 20 | | The accompanying notes are an integral part of these financial statements. |
COMMERCE BOND FUND
| | | | | | | | | | |
Principal
Amount | | Interest
Rate | | | Maturity
Date | | Value | |
|
| Mortgage-Backed Obligations – (continued) | |
Collateralized Mortgage Obligations – (continued) | |
|
| FNMA REMIC Series2003-14, Class AP | |
| $ 29,442 | | | 4.000 | % | | 03/25/33 | | $ | 30,431 | |
|
| FNMA REMIC Series2004-53, Class NC | |
| 220,475 | | | 5.500 | | | 07/25/24 | | | 231,016 | |
|
| FNMA REMIC Series2015-2, Class PA | |
| 3,341,634 | | | 2.250 | | | 03/25/44 | | | 3,359,366 | |
|
| FNMA REMIC Series2015-30, Class JA | |
| 2,487,690 | | | 2.000 | | | 05/25/45 | | | 2,453,196 | |
|
| FNMA REMIC Series2016-16, Class PD | |
| 4,313,240 | | | 3.000 | | | 12/25/44 | | | 4,415,426 | |
|
| FNMA REMIC Series2017-110, Class A | |
| 9,983,790 | | | 3.500 | | | 03/25/38 | | | 10,700,871 | |
|
| FNMA Series2003-W6, Class 3A | |
| 88,069 | | | 6.500 | | | 09/25/42 | | | 100,777 | |
|
| GNMA REMIC Series2015-167, Class KM | |
| 299,615 | | | 3.000 | | | 12/20/43 | | | 312,749 | |
|
| GNMA REMIC Series2015-94, Class AT | |
| 968,007 | | | 2.250 | | | 07/16/45 | | | 975,237 | |
| GNMA REMIC Series2016-129, Class W | |
| 1,166,056 | | | 2.500 | | | 07/20/46 | | | 1,203,973 | |
|
| GNMA REMIC Series2018-160, Class GE(a) | |
| 2,850,688 | | | 4.500 | | | 01/20/47 | | | 2,969,227 | |
|
| GNMA REMIC Series2018-37, Class KT | |
| 1,296,782 | | | 3.500 | | | 03/20/48 | | | 1,340,096 | |
|
| GSR Mortgage Loan Trust Series2004-12, Class 1A1(c) | |
| (1M USD LIBOR + 0.340%) | |
| 440,076 | | | 2.163 | | | 12/25/34 | | | 431,677 | |
|
| GSR Mortgage Loan Trust Series2004-7, Class 1A1(c)(g) | |
| 103,266 | | | 3.915 | | | 06/25/34 | | | 103,151 | |
|
| Impac CMB Trust Series2003-2F, Class A(h) | |
| 248,230 | | | 5.730 | | | 01/25/33 | | | 259,076 | |
|
| Impac CMB Trust Series2004-4, Class 1A1(c) | |
| (1M USD LIBOR + 0.640%) | |
| 579,965 | | | 2.463 | | | 09/25/34 | | | 579,494 | |
|
| Impac CMB Trust Series2004-4, Class 2A2(h) | |
| 1,667,311 | | | 4.836 | | | 09/25/34 | | | 1,768,910 | |
|
| Impac Secured Assets Corp. Series2004-2, Class A6(h) | |
| 10,821 | | | 4.110 | | | 08/25/34 | | | 10,895 | |
|
| JPMorgan Alternative Loan Trust Series2006-S1, Class 1A16 | |
| 1,065,208 | | | 6.000 | | | 03/25/36 | | | 853,421 | |
|
| JPMorgan Mortgage Trust Series2007-A2, Class 4A2(c)(g) | |
| 237,845 | | | 4.145 | | | 04/25/37 | | | 219,766 | |
|
| JPMorgan Mortgage Trust Series2013-3, Class A3(b)(c)(g) | |
| 1,758,306 | | | 3.393 | | | 07/25/43 | | | 1,800,167 | |
|
| JPMorgan Mortgage Trust Series2014-2, Class 1A1(b)(c)(g) | |
| 1,655,253 | | | 3.000 | | | 06/25/29 | | | 1,681,215 | |
|
| JPMorgan Mortgage Trust Series2015-6, Class A5(b)(c)(g) | |
| 1,992,547 | | | 3.500 | | | 10/25/45 | | | 2,011,724 | |
|
| JPMorgan Mortgage Trust Series2017-3, Class 1A3(b)(c)(g) | |
| 8,499,967 | | | 3.500 | | | 08/25/47 | | | 8,644,636 | |
| |
| | | | | | | | | | |
Principal
Amount | | Interest
Rate | | | Maturity
Date | | Value | |
|
| Mortgage-Backed Obligations – (continued) | |
Collateralized Mortgage Obligations – (continued) | |
|
| JPMorgan Mortgage Trust Series2017-4, Class A3(b)(c)(g) | |
| $ 2,515,792 | | | 3.500 | % | | 11/25/48 | | $ | 2,558,611 | |
|
| JPMorgan Mortgage Trust Series2017-4, Class A5(b)(c)(g) | |
| 1,896,855 | | | 3.500 | | | 11/25/48 | | | 1,919,575 | |
|
| JPMorgan Mortgage Trust Series2017-6, Class A3(b)(c)(g) | |
| 7,252,555 | | | 3.500 | | | 12/25/48 | | | 7,375,994 | |
|
| JPMorgan Mortgage Trust Series2018-4, Class A5(b)(c)(g) | |
| 3,891,786 | | | 3.500 | | | 10/25/48 | | | 3,943,072 | |
|
Master Adjustable Rate Mortgages Trust Series2003-2,
Class 6A1(c)(g) | |
| 430,320 | | | 4.339 | | | 07/25/33 | | | 439,063 | |
|
| Master Alternative Loans Trust Series2004-4, Class 1A1 | |
| 110,676 | | | 5.500 | | | 05/25/34 | | | 118,589 | |
|
| Master Alternative Loans Trust Series2004-4, Class 8A1 | |
| 666,036 | | | 6.500 | | | 05/25/34 | | | 715,234 | |
|
| Master Alternative Loans Trust Series2004-9, Class A6(h) | |
| 11,743 | | | 5.643 | | | 08/25/34 | | | 11,928 | |
|
Mello Mortgage Capital Acceptance Series 2018-MTG1,
Class A1(b)(c)(g) | |
| 3,202,466 | | | 3.500 | | | 03/25/48 | | | 3,241,120 | |
|
| Morgan Stanley Dean Witter Capital I, Inc. Trust Series 2003-HYB1, Class A3(c)(g) | |
| 141,317 | | | 3.837 | | | 03/25/33 | | | 142,338 | |
|
| Morgan Stanley Mortgage Loan Trust Series2005-7, Class 2A1(c)(g) | |
| 812,005 | | | 5.386 | | | 11/25/35 | | | 736,481 | |
| Morgan Stanley Mortgage Loan Trust Series2007-12, Class 3A22 | |
| 786,757 | | | 6.000 | | | 08/25/37 | | | 593,625 | |
|
| NRP Mortgage Trust Series2013-1, Class A23(b)(c)(g) | |
| 1,595,524 | | | 3.250 | | | 07/25/43 | | | 1,604,894 | |
|
| OBX Trust Series 2019-INV2, Class A5(b)(c)(g) | |
| 1,329,926 | | | 4.000 | | | 05/27/49 | | | 1,376,075 | |
|
| PHH Mortgage Pass-Through Certificates Series 2008-CIM1, Class 11A1(c) | |
| (1M USD LIBOR + 2.250%) | |
| 534,812 | | | 4.282 | | | 05/25/38 | | | 551,568 | |
|
| RBSGC Mortgage Pass-Through Certificates Series2007-B, Class 2A1(c)(g) | |
| 341,719 | | | 4.839 | | | 11/25/21 | | | 301,590 | |
|
| RBSGC Mortgage Pass-Through Certificates Series2007-B, Class 3A1(c)(g) | |
| 22,181 | | | 4.776 | | | 07/25/35 | | | 22,677 | |
|
| Residential Accredit Loans, Inc. Series 2005-QS11, Class A2(c) | |
| (1M USD LIBOR + 0.500%) | |
| 193,592 | | | 2.323 | | | 07/25/35 | | | 161,956 | |
|
| Residential Asset Securitization Trust Series2004-A6, Class A1 | |
| 24,290 | | | 5.000 | | | 08/25/19 | | | 24,327 | |
|
| Residential Funding Mortgage Securities I, Inc. Series2005-S7, Class A5 | |
| 112,420 | | | 5.500 | | | 11/25/35 | | | 107,018 | |
| |
| | |
| The accompanying notes are an integral part of these financial statements. | | 21 |
COMMERCE BOND FUND
Schedule of Investments(continued)
October 31, 2019
| | | | | | | | | | |
Principal
Amount | | Interest
Rate | | | Maturity
Date | | Value | |
|
| Mortgage-Backed Obligations – (continued) | |
Collateralized Mortgage Obligations – (continued) | |
|
| Residential Funding Mortgage Securities I, Inc. Series2005-S9, Class A5 | |
| $ 385,516 | | | 5.750 | % | | 12/25/35 | | $ | 392,457 | |
|
| Seasoned Credit Risk Transfer Trust Series2017-3, Class MA | |
| 4,141,241 | | | 3.000 | | | 07/25/56 | | | 4,240,583 | |
|
| Seasoned Loans Structured Transaction Series2018-1, Class A2 | |
| 1,245,000 | | | 3.500 | | | 06/25/28 | | | 1,321,831 | |
|
| Sequoia Mortgage Trust Series2004-10, Class A1A(c) | |
| (1M USD LIBOR + 0.620%) | |
| 324,256 | | | 2.466 | | | 11/20/34 | | | 322,781 | |
|
| Sequoia Mortgage Trust Series2012-2, Class A3(c)(g) | |
| 908,755 | | | 3.500 | | | 04/25/42 | | | 922,704 | |
|
| Sequoia Mortgage Trust Series2013-2, Class A1(c)(g) | |
| 2,233,279 | | | 1.874 | | | 02/25/43 | | | 2,153,213 | |
|
| Sequoia Mortgage Trust Series2013-6, Class A1(c)(g) | |
| 4,026,106 | | | 2.500 | | | 05/25/43 | | | 3,991,257 | |
|
| Sequoia Mortgage Trust Series2015-2, Class A10(b)(c)(g) | |
| 3,073,776 | | | 3.500 | | | 05/25/45 | | | 3,122,181 | |
|
| Sequoia Mortgage Trust Series2015-3, Class A4(b)(c)(g) | |
| 2,765,512 | | | 3.500 | | | 07/25/45 | | | 2,815,507 | |
|
| Sequoia Mortgage Trust Series2015-3, Class A5(b)(c)(g) | |
| 1,975,366 | | | 3.000 | | | 07/25/45 | | | 1,982,603 | |
|
| Sequoia Mortgage Trust Series2015-4, Class A1(b)(c)(g) | |
| 1,760,936 | | | 3.000 | | | 11/25/30 | | | 1,793,472 | |
|
| Sequoia Mortgage Trust Series2016-3, Class A1(b)(c)(g) | |
| 2,488,305 | | | 3.500 | | | 11/25/46 | | | 2,533,891 | |
|
| Sequoia Mortgage Trust Series2017-1, Class A4(b)(c)(g) | |
| 4,821,271 | | | 3.500 | | | 02/25/47 | | | 4,900,113 | |
|
| Sequoia Mortgage Trust Series2017-5, Class A1(b)(c)(g) | |
| 2,890,231 | | | 3.500 | | | 08/25/47 | | | 2,928,729 | |
|
| Sequoia Mortgage Trust Series2017-6, Class A1(b)(c)(g) | |
| 8,043,598 | | | 3.500 | | | 09/25/47 | | | 8,169,319 | |
|
| Sequoia Mortgage Trust Series2018-2, Class A1(b)(c)(g) | |
| 2,714,675 | | | 3.500 | | | 02/25/48 | | | 2,762,711 | |
| ShellpointCo-Originator Trust Series2017-2, Class A1(b)(c)(g) | |
| 7,403,006 | | | 3.500 | | | 10/25/47 | | | 7,471,539 | |
|
| Structured Adjustable Rate Mortgage Loan Trust Series2004-14, Class 1A(c)(g) | |
| 577,888 | | | 4.017 | | | 10/25/34 | | | 590,639 | |
|
| Structured Adjustable Rate Mortgage Loan Trust Series2004-4, Class 3A4(c)(g) | |
| 105,902 | | | 4.387 | | | 04/25/34 | | | 110,180 | |
|
| Structured Asset Securities Corp. Series2003-31A, Class 2A7(c)(g) | |
| 213,295 | | | 4.076 | | | 10/25/33 | | | 218,893 | |
|
| Structured Asset Securities Corp. Series2003-34A, Class 3A3(c)(g) | |
| 301,400 | | | 4.097 | | | 11/25/33 | | | 307,287 | |
|
| Structured Asset Securities Corp. Series2003-34A, Class 6A(c)(g) | |
| 201,953 | | | 4.500 | | | 11/25/33 | | | 206,719 | |
| |
| | | | | | | | | | |
Principal
Amount | | Interest
Rate | | | Maturity
Date | | Value | |
|
| Mortgage-Backed Obligations – (continued) | |
Collateralized Mortgage Obligations – (continued) | |
|
| Washington Mutual Alternative Mortgage Pass-Through Certificates Series2005-4, Class 4A1 | |
| $ 159,853 | | | 5.500 | % | | 06/25/20 | | $ | 142,790 | |
|
| Wells Fargo Mortgage Backed Securities Trust Series 2005-AR15, Class 1A2(c)(g) | |
| 154,379 | | | 4.775 | | | 09/25/35 | | | 154,301 | |
|
| WinWater Mortgage Loan Trust Series2015-5, Class A3(b)(c)(g) | |
| 7,710,163 | | | 3.500 | | | 08/20/45 | | | 7,777,196 | |
|
| WinWater Mortgage Loan Trust Series2015-5, Class A5(b)(c)(g) | |
| 1,825,442 | | | 3.500 | | | 08/20/45 | | | 1,844,063 | |
|
| WinWater Mortgage Loan Trust Series2016-1, Class 1A5(b)(c)(g) | |
| 3,945,673 | | | 3.500 | | | 01/20/46 | | | 4,004,148 | |
| |
| TOTAL COLLATERALIZED MORTGAGE OBLIGATIONS | |
(Cost $207,452,377) | | $ | 211,443,522 | |
| |
Commercial Mortgage Obligations – 1.9% | |
|
| Citigroup Commercial Mortgage Trust Series 2015-GC29, Class A2 | |
| $4,360,283 | | | 2.674 | % | | 04/10/48 | | $ | 4,361,699 | |
|
| Commercial Mortgage Pass-Through Certificates Series 2014-CR14, Class A2 | |
| 1,018,017 | | | 3.147 | | | 02/10/47 | | | 1,017,790 | |
|
| Commercial Mortgage Trust Series 2013-CR12, Class A2 | |
| 169,685 | | | 2.904 | | | 10/10/46 | | | 169,571 | |
|
| Commercial Mortgage Trust Series 2014-CR15, Class A2 | |
| 1,475,045 | | | 2.928 | | | 02/10/47 | | | 1,475,224 | |
|
| GNMA REMIC Series2013-68, Class B(c)(g) | |
| 1,040,000 | | | 2.500 | | | 08/16/43 | | | 1,043,288 | |
|
| JPMBB Commercial Mortgage Securities Trust Series2014-C19, Class A2 | |
| 13,578 | | | 3.046 | | | 04/15/47 | | | 13,731 | |
|
| JPMBB Commercial Mortgage Securities Trust Series2015-C28, Class A2 | |
| 762,518 | | | 2.773 | | | 10/15/48 | | | 762,842 | |
|
| LSTAR Commercial Mortgage Trust Series2016-4, Class A2(b) | |
| 3,000,000 | | | 2.579 | | | 03/10/49 | | | 3,010,178 | |
|
| Morgan Stanley Bank of America Merrill Lynch Trust Series2015-C21, Class A2 | |
| 5,776,254 | | | 2.933 | | | 03/15/48 | | | 5,774,740 | |
|
| Morgan Stanley Bank of America Merrill Lynch Trust Series2015-C22, Class A2 | |
| 5,000,000 | | | 2.739 | | | 04/15/48 | | | 5,000,668 | |
| |
| TOTAL COMMERCIAL MORTGAGE OBLIGATIONS | |
(Cost $18,882,557) | | $ | 22,629,731 | |
| |
Federal Agencies – 2.1% | |
| FHLMC | |
| $ 135 | | | 8.500 | % | | 03/01/21 | | $ | 135 | |
| 120,473 | | | 7.000 | | | 05/01/26 | | | 130,739 | |
| |
| | |
| 22 | | The accompanying notes are an integral part of these financial statements. |
COMMERCE BOND FUND
| | | | | | | | | | | | |
Principal
Amount | | Interest
Rate | | | Maturity
Date | | | Value | |
|
| Mortgage-Backed Obligations – (continued) | |
Federal Agencies – (continued) | |
| $ 21,494 | | | 7.500 | % | | | 12/01/30 | | | $ | 25,552 | |
| 25,731 | | | 7.500 | | | | 01/01/31 | | | | 29,931 | |
| 57,591 | | | 7.000 | | | | 08/01/31 | | | | 66,093 | |
| 717,112 | | | 5.000 | | | | 05/01/33 | | | | 796,390 | |
| 1,110,283 | | | 4.000 | | | | 06/01/42 | | | | 1,191,201 | |
| 1,647,358 | | | 3.000 | | | | 06/01/45 | | | | 1,663,091 | |
| (12M USD LIBOR + 1.600%) | |
| 2,524,843 | | | 2.776 | (c) | | | 07/01/45 | | | | 2,558,814 | |
| (12M USD LIBOR + 1.864%) | |
| 113,728 | | | 4.790 | (c) | | | 01/01/36 | | | | 119,232 | |
| (1Y US Treasury Yield Curve Rate + 2.229%) | |
| 107,029 | | | 4.730 | (c) | | | 05/01/34 | | | | 113,136 | |
|
| FNMA | |
| 18,625 | | | 9.000 | | | | 02/01/25 | | | | 18,877 | |
| 944,080 | | | 2.500 | | | | 05/01/28 | | | | 956,372 | |
| 5,894 | | | 8.000 | | | | 07/01/28 | | | | 5,924 | |
| 1,697,689 | | | 4.500 | | | | 01/01/48 | | | | 1,762,165 | |
| (12M USD LIBOR + 1.586%) | |
| 919,737 | | | 2.613 | (c) | | | 12/01/45 | | | | 932,909 | |
| (12M USD LIBOR + 1.740%) | |
| 60,904 | | | 4.152 | (c) | | | 10/01/34 | | | | 62,583 | |
| (12M USD LIBOR + 1.760%) | |
| 80,680 | | | 4.840 | (c) | | | 02/01/35 | | | | 84,637 | |
| (6M USD LIBOR + 1.413%) | |
| 18,812 | | | 3.913 | (c) | | | 02/01/33 | | | | 19,424 | |
|
| GNMA | |
| 26,236 | | | 8.000 | | | | 02/15/22 | | | | 27,155 | |
| 18,337 | | | 7.500 | | | | 08/20/25 | | | | 19,904 | |
| 84,965 | | | 7.500 | | | | 07/20/26 | | | | 95,356 | |
| 41,346 | | | 6.500 | | | | 04/15/31 | | | | 45,789 | |
| 127,408 | | | 6.500 | | | | 05/15/31 | | | | 141,098 | |
| 4,232,988 | | | 2.500 | | | | 06/20/31 | | | | 4,223,957 | |
| 3,331,995 | | | 5.000 | | | | 02/20/49 | | | | 3,513,138 | |
| | | |
| UMBS | | | | | | | | | | | | |
| 8,049 | | | 6.500 | | | | 03/01/26 | | | | 8,965 | |
| 19,912 | | | 6.500 | | | | 10/01/28 | | | | 22,178 | |
| 47,475 | | | 6.000 | | | | 07/01/29 | | | | 52,572 | |
| 10,920 | | | 7.500 | | | | 09/01/29 | | | | 11,025 | |
| 32,565 | | | 7.000 | | | | 03/01/31 | | | | 35,977 | |
| 5,338 | | | 7.500 | | | | 03/01/31 | | | | 5,905 | |
| 16,490 | | | 7.000 | | | | 11/01/31 | | | | 17,006 | |
| 30,521 | | | 7.000 | | | | 01/01/32 | | | | 31,043 | |
| 74,998 | | | 6.000 | | | | 12/01/32 | | | | 82,955 | |
| 26,823 | | | 5.000 | | | | 07/01/33 | | | | 28,663 | |
| 2,335,199 | | | 3.500 | | | | 08/01/35 | | | | 2,431,447 | |
| 4,570,829 | | | 5.000 | | | | 08/01/48 | | | | 5,003,435 | |
| |
TOTAL FEDERAL AGENCIES | |
(Cost $26,143,398) | | | $ | 26,334,773 | |
| |
| TOTAL MORTGAGE-BACKED OBLIGATIONS | |
(Cost $252,478,332) | | | | | | | $ | 260,408,026 | |
| |
| | | | | | | | | | |
Principal
Amount | | Interest
Rate | | | Maturity
Date | | Value | |
|
| Asset-Backed Securities – 18.0% | |
Automotive(b) – 3.3% | |
| Avis Budget Rental Car Funding AESOP LLC Series2015-2A, Class A(a) | |
| $5,200,000 | | | 2.630 | % | | 12/20/21 | | $ | 5,221,246 | |
|
| Avis Budget Rental Car Funding AESOP LLC Series2018-1A, Class A | |
| 4,150,000 | | | 3.700 | | | 09/20/24 | | | 4,348,901 | |
| Avis Budget Rental Car Funding AESOP LLC Series2019-3A, Class A | |
| 11,100,000 | | | 2.360 | | | 03/20/26 | | | 11,108,704 | |
|
| Ford Credit Auto Owner Trust Series2016-1, Class A | |
| 7,000,000 | | | 2.310 | | | 08/15/27 | | | 7,026,525 | |
|
| Ford Credit Auto Owner Trust Series2017-1, Class A | |
| 2,500,000 | | | 2.620 | | | 08/15/28 | | | 2,535,574 | |
|
| Ford Credit Auto Owner Trust Series2018-1, Class A | |
| 5,000,000 | | | 3.190 | | | 07/15/31 | | | 5,229,398 | |
|
| Hertz Vehicle Financing II LP Series2019-1A, Class A | |
| 4,500,000 | | | 3.710 | | | 03/25/23 | | | 4,638,981 | |
| | | | | | | | | | |
| | | | | | | | | 40,109,329 | |
| |
Credit Card – 0.5% | |
| Cabela’s Credit Card Master Note Trust Series2015-2, Class A1 | |
| 5,680,000 | | | 2.250 | | | 07/17/23 | | | 5,693,648 | |
| |
Home Equity – 1.1% | |
| Accredited Mortgage Loan Trust Series2004-4, Class A1B(c) | |
| (1M USD LIBOR + 0.780%) | |
| 927,474 | | | 2.603 | | | 01/25/35 | | | 928,706 | |
|
| Ameriquest Mortgage Securities, Inc. Series 2004-FR1W, Class A6(h) | |
| 688,663 | | | 4.261 | | | 05/25/34 | | | 701,583 | |
|
| EquiFirst Mortgage Loan Trust Series2003-2, Class 2A2(h) | |
| 223,318 | | | 4.250 | | | 09/25/33 | | | 236,158 | |
|
| Irwin Home Equity Series2005-A, Class A3(c) | |
| (1M USD LIBOR + 0.760%) | |
| 398,208 | | | 2.583 | | | 02/25/34 | | | 396,760 | |
|
| Morgan Stanley ABS Capital I, Inc. Trust Series2005-HE1, Class M1(c) | |
| (1M USD LIBOR + 0.675%) | |
| 3,391,495 | | | 2.498 | | | 12/25/34 | | | 3,347,901 | |
|
New Residential Mortgage Loan Trust Series2017-6A,
Class A1(a)(b)(c)(g) | |
| 5,048,691 | | | 4.000 | | | 08/27/57 | | | 5,282,755 | |
|
| Renaissance Home Equity Loan Trust Series2005-3, Class AF4(h) | |
| 1,018,357 | | | 5.140 | | | 11/25/35 | | | 1,069,808 | |
|
| Southern Pacific Secured Asset Corp. Series1998-2, Class A7(h) | |
| 1,403,810 | | | 7.490 | | | 07/25/29 | | | 1,459,256 | |
| | | | | | | | | | |
| | | | | | | | | 13,422,927 | |
| |
Manufactured Housing – 0.1% | |
|
| Green Tree Financial Corp. Series1998-3, Class A5 | |
| 490,531 | | | 6.220 | | | 03/01/30 | | | 507,071 | |
|
| Green Tree Financial Corp. Series1998-3, Class A6(c)(g) | |
| 61,269 | | | 6.760 | | | 03/01/30 | | | 63,276 | |
|
| Mid-State Trust Series 2011, Class A1 | |
| 185,368 | | | 4.864 | | | 07/15/38 | | | 195,843 | |
| | | | | | | | | | |
| | | | | | | | | 766,190 | |
| |
| | |
| The accompanying notes are an integral part of these financial statements. | | 23 |
COMMERCE BOND FUND
Schedule of Investments(continued)
October 31, 2019
| | | | | | | | | | |
Principal
Amount | | Interest
Rate | | | Maturity
Date | | Value | |
|
| Asset-Backed Securities – (continued) | |
Other – 10.3% | |
|
| AFN LLC Series2019-1A, Class A1(b) | |
| $ 4,979,167 | | | 3.780 | % | | 05/20/49 | | $ | 5,180,488 | |
|
| ARL Second LLC Series2014-1A, Class A1(a)(b) | |
| 1,311,649 | | | 2.920 | | | 06/15/44 | | | 1,322,488 | |
|
| CAL Funding III Ltd. Series2018-1A, Class A(b) | |
| 4,583,333 | | | 3.960 | | | 02/25/43 | | | 4,604,626 | |
|
| Chase Funding Mortgage Loan Asset-Backed Certificates Series2002-3, Class 1A5(h) | |
| 1,240,820 | | | 5.907 | | | 06/25/32 | | | 1,238,718 | |
|
| Chase Funding Mortgage Loan Asset-Backed Certificates Series2004-1, Class 2A2(c) | |
| (1M USD LIBOR + 0.460%) | |
| 4,269,292 | | | 2.283 | | | 12/25/33 | | | 4,182,601 | |
|
| CLI Funding LLC Series2018-1A, Class A(b) | |
| 1,053,295 | | | 4.030 | | | 04/18/43 | | | 1,064,441 | |
|
Countrywide Asset-Backed Certificates Series2007-QH1,
Class A1(b)(c) | |
| (1M LIBOR + 0.200%) | |
| 505,052 | | | 2.023 | | | 02/25/37 | | | 459,793 | |
|
| Cronos Containers Program Ltd. Series2013-1A, Class A(b) | |
| 350,000 | | | 3.080 | | | 04/18/28 | | | 350,214 | |
|
| Cronos Containers Program Ltd. Series2014-2A, Class A(b) | |
| 2,268,518 | | | 3.270 | | | 11/18/29 | | | 2,274,498 | |
|
| Domino’s Pizza Master Issuer LLC Series2017-1A, Class A23(b) | |
| 6,370,000 | | | 4.118 | | | 07/25/47 | | | 6,692,386 | |
|
| Global SC Finance IV Ltd. Series2017-1A, Class A(b) | |
| 1,983,656 | | | 3.850 | | | 04/15/37 | | | 2,029,419 | |
|
| Global SC Finance SRL Series2013-1A, Class A(b) | |
| 1,029,000 | | | 2.980 | | | 04/17/28 | | | 1,030,296 | |
|
| GreatAmerica Leasing Receivables Funding LLC Series2018-1, Class A3(a)(b) | |
| 1,250,000 | | | 2.600 | | | 06/15/21 | | | 1,253,400 | |
|
| Harvest SBA Loan Trust Series2018-1, Class A(b)(c) | |
| (1M USD LIBOR + 2.250%) | |
| 4,021,745 | | | 4.073 | | | 08/25/44 | | | 4,013,830 | |
|
| Home Partners of America Trust Series2019-1, Class A(b) | |
| 7,943,881 | | | 2.908 | | | 09/17/39 | | | 8,102,758 | |
|
| Invitation Homes Trust Series 2018-SFR2, Class A(b)(c) | |
| (1M USD LIBOR + 0.900%) | |
| 4,283,504 | | | 2.814 | | | 06/17/37 | | | 4,283,498 | |
|
| Jimmy Johns Funding LLC Series2017-1A, Class A2I(b) | |
| 4,887,500 | | | 3.610 | | | 07/30/47 | | | 4,928,506 | |
|
| Long Beach Mortgage Loan Trust Series2003-4, Class AV1(c) | |
| (1M USD LIBOR + 0.620%) | |
| 209,758 | | | 2.443 | | | 08/25/33 | | | 211,727 | |
|
| Longtrain Leasing III LLC Series2015-1A, Class A1(b) | |
| 3,076,911 | | | 2.980 | | | 01/15/45 | | | 3,094,692 | |
|
| Longtrain Leasing III LLC Series2015-1A, Class A2(b) | |
| 5,000,000 | | | 4.060 | | | 01/15/45 | | | 5,207,501 | |
|
| NP SPE II LLC Series2016-1A, Class A1(b) | |
| 2,730,174 | | | 4.164 | | | 04/20/46 | | | 2,836,755 | |
|
| Progress Residential Trust Series 2015-SFR3, Class A(b) | |
| 3,476,019 | | | 3.067 | | | 11/12/32 | | | 3,474,252 | |
| |
| | | | | | | | | | |
Principal
Amount | | Interest
Rate | | | Maturity
Date | | Value | |
|
| Asset-Backed Securities – (continued) | |
Other – (continued) | |
|
| Sofi Consumer Loan Program Trust Series2018-3, Class A2(b) | |
| $5,000,000 | | | 3.670 | % | | 08/25/27 | | $ | 5,074,531 | |
|
| State of Hawaii Department of Business Economic Development & Tourism Series2014-A, Class A2 | |
| 8,000,000 | | | 3.242 | | | 01/01/31 | | | 8,367,680 | |
|
Structured Asset Investment Loan Trust Series2003-BC5,
Class M1(c) | |
| (1M USD LIBOR + 1.125%) | |
| 443,146 | | | 2.948 | | | 06/25/33 | | | 445,288 | |
|
| Structured Asset Securities Corp. Series2005-9XS, Class 1A3A(h) | |
| 386,572 | | | 5.750 | | | 06/25/35 | | | 395,244 | |
|
| TAL Advantage V LLC Series2014-3A, Class A(b) | |
| 2,541,667 | | | 3.270 | | | 11/21/39 | | | 2,547,289 | |
|
| Towd Point Mortgage Trust Series2015-1, Class 1A2(b)(c)(g) | |
| 5,000,000 | | | 3.250 | | | 11/25/60 | | | 5,085,558 | |
|
| Towd Point Mortgage Trust Series2015-4, Class A1B(b)(c)(g) | |
| 2,475,119 | | | 2.750 | | | 04/25/55 | | | 2,481,573 | |
|
| Towd Point Mortgage Trust Series2016-2, Class A1(b)(c)(g) | |
| 839,414 | | | 3.000 | | | 08/25/55 | | | 851,494 | |
|
| Towd Point Mortgage Trust Series2016-3, Class A1(b)(c)(g) | |
| 2,352,019 | | | 2.250 | | | 04/25/56 | | | 2,346,758 | |
|
| Towd Point Mortgage Trust Series2017-3, Class A2(a)(b)(c)(g) | |
| 1,850,000 | | | 3.000 | | | 07/25/57 | | | 1,879,061 | |
|
| Towd Point Mortgage Trust Series2018-2,Class A2(b)(c)(g) | |
| 5,500,000 | | | 3.500 | | | 03/25/58 | | | 5,644,155 | |
|
| Trafigura Securitisation Finance PLC Series2018-1A, Class A2(b) | |
| 4,335,000 | | | 3.730 | | | 03/15/22 | | | 4,422,351 | |
|
| Trinity Rail Leasing LLC Series2019-1A, Class A(b) | |
| 4,918,734 | | | 3.820 | | | 04/17/49 | | | 5,122,111 | |
|
| Trinity Rail Leasing LLC Series2019-2A, Class A2(b) | |
| 3,000,000 | | | 3.100 | | | 10/18/49 | | | 3,022,266 | |
|
| Vantage Data Centers Issuer LLC Series2018-1A, Class A2(b) | |
| 1,475,000 | | | 4.072 | | | 02/16/43 | | | 1,532,258 | |
|
| Wells Fargo Home Equity Trust Series2006-2, Class A4(c) | |
| (1M USD LIBOR + 0.250%) | |
| 243,098 | | | 2.073 | | | 07/25/36 | | | 242,992 | |
|
| Wendy’s Funding LLC Series2019-1A, Class A2I(b) | |
| 2,992,500 | | | 3.783 | | | 06/15/49 | | | 3,089,367 | |
|
| Wendys Funding LLC Series2018-1A, Class A2I(b) | |
| 2,947,500 | | | 3.573 | | | 03/15/48 | | | 3,038,460 | |
| | | | | | | | | | |
| | | | | | | | | 123,425,323 | |
| |
Student Loan – 2.7% | |
|
| DRB Prime Student Loan Trust Series2016-B, Class A2(b) | |
| 1,546,162 | | | 2.890 | | | 06/25/40 | | | 1,558,723 | |
|
| DRB Prime Student Loan Trust Series2017-A, Class A2B(b) | |
| 3,678,922 | | | 2.850 | | | 05/27/42 | | | 3,732,251 | |
|
| Massachusetts Educational Financing Authority Series2018-A, Class A | |
| 4,136,242 | | | 3.850 | | | 05/25/33 | | | 4,226,412 | |
| |
| | |
| 24 | | The accompanying notes are an integral part of these financial statements. |
COMMERCE BOND FUND
| | | | | | | | | | |
Principal
Amount | | Interest
Rate | | | Maturity
Date | | Value | |
|
| Asset-Backed Securities – (continued) | |
Student Loan – (continued) | |
|
Navient Private Education Loan Trust Series2015-AA,
Class A2A(b) | |
| $4,112,432 | | | 2.650 | % | | 12/15/28 | | $ | 4,141,425 | |
|
Navient Private Education Refi Loan Trust Series2018-A,
Class A2(b) | |
| 1,125,000 | | | 3.190 | | | 02/18/42 | | | 1,145,830 | |
|
| Sofi Professional Loan Program LLC Series2016-B, Class A2B(b) | |
| 1,942,146 | | | 2.740 | | | 10/25/32 | | | 1,954,933 | |
|
| Sofi Professional Loan Program LLC Series2016-E, Class A2B(b) | |
| 3,646,274 | | | 2.490 | | | 01/25/36 | | | 3,660,434 | |
|
| Sofi Professional Loan Program Trust Series2018-C, Class A2FX(b) | |
| 6,000,000 | | | 3.590 | | | 01/25/48 | | | 6,241,591 | |
|
| South Carolina Student Loan Corp. Series2015-A, Class A(c) | |
|
| (1M USD LIBOR + 1.500%) | |
| 2,657,345 | | | 3.323 | | | 01/25/36 | | | 2,668,308 | |
|
| Towd Point Asset Trust Series2018-SL1, Class A(b)(c) | |
|
| (1M USD LIBOR + 0.600%) | |
| 2,539,676 | | | 2.745 | | | 01/25/46 | | | 2,508,168 | |
| | | | | | | | | | |
| | | | | | | | | 31,838,075 | |
| |
| TOTAL ASSET-BACKED SECURITIES | |
(Cost $209,752,098) | | $ | 215,255,492 | |
| |
| | | | | | | | | | |
|
| Municipal Bond Obligations – 8.6% | |
Alaska(a) – 0.1% | |
| Anchorage AK Certificate Participation (Taxable) Series A | |
| $1,290,000 | | | 2.765 | % | | 07/01/22 | | $ | 1,320,405 | |
| |
California – 2.0% | |
| Anaheim California Public Financing Authority Revenue Bonds Build America Bonds(a) | |
| 4,000,000 | | | 5.685 | | | 10/01/40 | | | 5,629,160 | |
| Beverly Hills CA Unified School District GO Bonds (Capital Appreciation) (Refunding) Series 2016(a)(i) | |
| 5,000,000 | | | 0.000 | | | 08/01/38 | | | 2,788,300 | |
| California State Municipal Finance Authority Refunding Revenue Bonds (Taxable-Refunding-University Of San Diego) Series B | |
| 3,130,000 | | | 2.536 | | | 10/01/29 | | | 3,097,855 | |
| Foothill-De Anza CA Community College District GO Bonds (Taxable — Election of 2006) Series E(a) | |
| 1,730,000 | | | 3.223 | | | 08/01/38 | | | 1,825,358 | |
| Napa Valley Unified School District GO Bonds (Build America Bonds-Taxable) Series B(a) | |
| 3,000,000 | | | 6.507 | | | 08/01/43 | | | 4,480,290 | |
|
| Poway CA Unified School District GO Bonds (Taxable-Refunding-Improvement Date2002-1) Series 2019 | |
| 3,750,000 | | | 2.414 | | | 08/01/27 | | | 3,789,187 | |
|
| San Mateo Union High School District GO Bonds Refunding Taxable Series B(a) | |
| 2,055,000 | | | 2.520 | | | 09/01/20 | | | 2,068,481 | |
| | | | | | | | | | |
| | | | | | | | | 23,678,631 | |
| |
| | | | | | | | | | |
Principal
Amount | | Interest
Rate | | | Maturity
Date | | Value | |
|
| Municipal Bond Obligations – (continued) | |
Connecticut – 0.3% | |
| Connecticut State GO Bonds Unlimited (Taxable) Series A | |
| $3,500,000 | | | 3.743 | % | | 09/15/25 | | $ | 3,774,855 | |
| |
Idaho(a) – 0.5% | |
| Idaho Housing & Finance Association Economic Development Revenue Bonds Taxable (Facilities Project) Series 2011(b) | |
| 4,100,000 | | | 7.000 | | | 01/01/31 | | | 4,399,464 | |
| Idaho State Building Authority Revenue Bonds Taxable (Idaho Board of Education Project) Series A | |
| 1,500,000 | | | 3.120 | | | 09/01/24 | | | 1,580,115 | |
| | | | | | | | | | |
| | | | | | | | | 5,979,579 | |
| |
Illinois – 0.4% | |
| Will County Elementary School District No 122 GO Bonds (Taxable-Refunding) Series A | |
| 2,750,000 | | | 2.111 | | | 10/01/27 | | | 2,728,055 | |
|
| Will County Forest Preservation District GO Bonds Build America Bonds Direct Payment Series 2009 | |
| 1,000,000 | | | 5.700 | | | 12/15/27 | | | 1,213,350 | |
|
| Winnebago County IL GO Bonds Series 2018 | |
| 1,035,000 | | | 3.900 | | | 12/30/25 | | | 1,130,323 | |
| | | | | | | | | | |
| | | | | | | | | 5,071,728 | |
| |
Kentucky – 0.7% | |
| Kentucky State Property & Buildings Commission Revenue Bonds (Taxable-Refunding) Series D | |
| 5,000,000 | | | 2.522 | | | 11/01/27 | | | 4,956,250 | |
|
| River City, Inc. KY Parking Authority Revenue Bonds (Refunding) Series B(a) | |
| 2,890,000 | | | 2.750 | | | 12/01/33 | | | 2,957,077 | |
| | | | | | | | | | |
| | | | | | | | | 7,913,327 | |
| |
Maryland(a) – 0.1% | |
| Baltimore County Maryland GO Bonds Build America Bonds Consolidated Public Improvement Series B | |
| 1,000,000 | | | 5.000 | | | 11/01/23 | | | 1,000,000 | |
| |
Michigan — 0.6% | |
| Cedar Springs MI Public School District GO Bonds (Taxable-Refunding) Series B(Q-SBLF) | |
| 1,800,000 | | | 2.035 | | | 05/01/21 | | | 1,808,496 | |
|
| Dearborn MI GO Bonds (Taxable) Series B | |
| 1,750,000 | | | 3.879 | | | 05/01/27 | | | 1,899,380 | |
|
| Fraser MI Public School District GO Bonds (Taxable-Refunding) Series 2019 | |
| 2,150,000 | | | 2.380 | | | 05/01/29 | | | 2,136,498 | |
|
| Utica Community Schools GO Bonds (Taxable-Qualified School Construction-Direct Payment)(Q-SBLF)(a) | |
| 1,500,000 | | | 5.875 | | | 05/01/22 | | | 1,557,015 | |
| | | | | | | | | | |
| | | | | | | | | 7,401,389 | |
| |
Mississippi(a) – 0.1% | |
| Mississippi Medical Center Educational Building Corp. Revenue Bonds (Taxable-Refunding-University) Series B | |
| 1,465,000 | | | 3.000 | | | 06/01/23 | | | 1,502,797 | |
| |
| | |
| The accompanying notes are an integral part of these financial statements. | | 25 |
COMMERCE BOND FUND
Schedule of Investments(continued)
October 31, 2019
| | | | | | | | | | |
Principal
Amount | | Interest
Rate | | | Maturity
Date | | Value | |
|
| Municipal Bond Obligations – (continued) | |
Missouri – 0.7% | |
| Curators University of Missouri System Facilities Revenue Bonds Build America Bonds(a) | |
| $2,500,000 | | | 5.792 | % | | 11/01/41 | | $ | 3,596,275 | |
| Missouri State Highways & Transit Commission State Road Revenue Bonds Build America Bonds Series 2010(a) | |
| 2,800,000 | | | 4.820 | | | 05/01/23 | | | 3,062,472 | |
| New Liberty Hospital District Revenue Bonds Build America Bonds Series B | |
| 1,345,000 | | | 5.704 | | | 12/01/19 | | | 1,347,771 | |
| | | | | | | | | | |
| | | | | | | | | 8,006,518 | |
| |
Nebraska – 0.3% | |
| University of Nebraska Facilities Corp. Revenue Bonds (Taxable-Refunding) Series A | |
| 3,750,000 | | | 2.175 | | | 10/01/26 | | | 3,760,050 | |
| |
Nevada(a) – 0.2% | |
| Clark County Nevada Sales & Excise Tax Revenue Bonds Build America Bonds Series C | |
| 2,525,000 | | | 5.100 | | | 07/01/21 | | | 2,582,419 | |
| |
New Jersey – 0.4% | |
| New Jersey State Higher Education Student Assistance Authority Revenue Bonds Student Loan Series 1A (AMT) | |
| 1,250,000 | | | 4.000 | | | 12/01/19 | | | 1,252,512 | |
| Rutgers New Jersey State University Revenue Bonds (Taxable-Refunding) Series R(a) | |
| 4,000,000 | | | 2.588 | | | 05/01/27 | | | 4,019,320 | |
| | | | | | | | | | |
| | | | | | | | | 5,271,832 | |
| |
New York(a) – 0.7% | |
| New York GO Build America Bonds Series 2010 | |
| 2,000,000 | | | 4.908 | | | 06/01/21 | | | 2,098,420 | |
| 1,055,000 | | | 5.008 | | | 06/01/22 | | | 1,131,392 | |
| New York State Thruway Authority Revenue Bonds (Taxable-Refunding) Series M | |
| 2,755,000 | | | 2.500 | | | 01/01/27 | | | 2,772,274 | |
|
| New York State Urban Development Corp. Revenue Bonds Series B | |
| 1,950,000 | | | 3.350 | | | 03/15/26 | | | 2,082,795 | |
| | | | | | | | | | |
| | | | | | | | | 8,084,881 | |
| |
Ohio(i) – 0.2% | |
| South-Western City OH School District Franklin & Pickaway Countries GO Bonds (CABS-Taxable-Refunding) Series C | |
| 2,740,000 | | | 0.000 | | | 12/01/28 | | | 2,195,863 | |
| |
Oregon – 0.2% | |
| Oregon Education Districts Full Faith & Credit Pension Obligations GO Bonds (Taxable) Series 2018(a) | |
| 495,000 | | | 4.220 | | | 06/30/30 | | | 568,260 | |
|
| Portland OR Community College District GO Bonds Series 2018 | |
| 1,250,000 | | | 3.970 | | | 06/01/27 | | | 1,397,113 | |
| | | | | | | | | | |
| | | | | | | | | 1,965,373 | |
| |
| | | | | | | | | | |
Principal
Amount | | Interest
Rate | | | Maturity
Date | | Value | |
|
| Municipal Bond Obligations – (continued) | |
Pennsylvania(a) – 0.3% | |
| State Public School Building Authority Revenue Bonds (Qualified School Construction Bonds) | |
| $3,000,000 | | | 6.495 | % | | 09/15/28 | | $ | 3,922,620 | |
| |
Rhode Island – 0.2% | |
| Rhode Island State Student Loan Authority Loan Revenue Bonds (Taxable) Series 1 | |
| 2,000,000 | | | 2.530 | | | 12/01/25 | | | 2,004,120 | |
| |
Texas(a) – 0.4% | |
| City of Houston TX GO Bonds (Taxable-Refunding) Series B | |
| 5,000,000 | | | 2.130 | | | 03/01/26 | | | 5,013,200 | |
| |
Washington(a) – 0.2% | |
| Seattle Municipal Light & Power Revenue Bonds Taxable Clean Renewable Energy Bonds Series C | |
| 2,000,000 | | | 3.750 | | | 06/01/33 | | | 2,224,420 | |
| |
| TOTAL MUNICIPAL BOND OBLIGATIONS | |
(Cost $94,063,197) | | $ | 102,674,007 | |
| |
| | | | | | | | | | |
|
| U.S. Treasury Obligations – 7.2% | |
|
| United States Treasury Bonds | |
| $ 5,000,000 | | | 3.125 | % | | 11/15/41 | | $ | 5,889,648 | |
| 5,000,000 | | | 2.750 | | | 08/15/42 | | | 5,546,484 | |
| 9,000,000 | | | 2.750 | | | 11/15/42 | | | 9,982,266 | |
| 4,000,000 | | | 2.500 | | | 02/15/45 | | | 4,255,313 | |
|
| United States Treasury Inflation Indexed Bonds | |
| 5,310,450 | | | 0.375 | | | 01/15/27 | | | 5,380,561 | |
| 7,947,870 | | | 0.750 | | | 02/15/42 | | | 8,351,520 | |
|
| United States Treasury Notes | |
| 10,000,000 | | | 1.375 | | | 08/31/20 | | | 9,981,250 | |
| 3,000,000 | | | 1.750 | | | 10/31/20 | | | 3,004,102 | |
| 6,000,000 | | | 1.750 | | | 09/30/22 | | | 6,040,078 | |
| 1,000,000 | | | 2.125 | | | 12/31/22 | | | 1,018,672 | |
| 5,000,000 | | | 1.375 | | | 08/31/23 | | | 4,973,438 | |
| 5,000,000 | | | 2.250 | | | 01/31/24 | | | 5,147,266 | |
| 10,000,000 | | | 2.125 | | | 03/31/24 | | | 10,252,734 | |
| 6,000,000 | | | 2.875 | | | 05/31/25 | | | 6,416,250 | |
| |
| TOTAL U.S. TREASURY OBLIGATIONS | |
(Cost $82,134,617) | | $ | 86,239,582 | |
| |
| | | | | | | | | | |
|
| U.S. Government Agency Obligations – 1.4% | |
| FFCB | |
| $ 2,860,000 | | | 5.190 | % | | 04/22/21 | | $ | 3,007,453 | |
|
| FHLB | |
| 3,700,000 | | | 1.500 | | | 08/15/24 | | | 3,686,069 | |
| 2,650,000 | | | 7.125 | | | 02/15/30 | | | 3,871,911 | |
|
| FNMA | |
| 5,550,000 | | | 1.625 | | | 10/15/24 | | | 5,552,976 | |
|
| New Valley Generation III | |
| 357,138 | | | 5.131 | | | 01/15/21 | | | 365,299 | |
| |
| | |
| 26 | | The accompanying notes are an integral part of these financial statements. |
COMMERCE BOND FUND
| | | | | | | | | | |
Principal
Amount | | Interest
Rate | | | Maturity
Date | | Value | |
|
| U.S. Government Agency Obligations – (continued) | |
|
| New Valley Generation V | |
| $ 768,326 | | | 4.929 | % | | 01/15/21 | | $ | 788,819 | |
| |
| TOTAL U.S. GOVERNMENT AGENCY OBLIGATIONS | |
(Cost $16,507,737) | | $ | 17,272,527 | |
| |
| | | | | | | | | | |
| Shares | | Dividend
Rate | | | | | Value | |
|
| Investment Company – 0.8% | |
|
| State Street Institutional US Government Money Market Fund — Premier Class | |
| 9,320,678 | | | 1.741 | % | | | | $ | 9,320,678 | |
| TOTAL INVESTMENTS – 99.5% | |
(Cost $1,132,625,557) | | $ | 1,191,866,674 | |
| |
OTHER ASSETS IN EXCESS OF
LIABILITIES – 0.5% | | | 5,513,129 | |
| |
| NET ASSETS – 100.0% | | $ | 1,197,379,803 | |
| |
| | |
|
| The percentage shown for each investment category reflects the value of investments in that category as a percentage of net assets. |
| |
| (a) | | Security with “Call” features with resetting interest rates. |
| |
| (b) | | Exempt from registration under Rule 144A of the Securities Act of 1933. Such securities may be resold, normally to qualified institutional buyers in transactions exempt from registration. |
| |
| (c) | | Variable rate security. The interest rate shown reflects the rate as of October 31, 2019. |
| |
| (d) | | Securities with “Put” features with resetting interest rates. Maturity dates disclosed are the next interest reset dates. |
| |
| (e) | | Security is currently in default and/ornon-income producing. |
| |
| (f) | | Actual maturity date is September 15, 2115. |
| |
| (g) | | Rate shown is that which is in effect on October 31, 2019. Certain variable rate securities are not based on a published reference rate and spread but are determined by the issuer or agent and are based on current market conditions. |
| |
| (h) | | Step-up Bond. Coupon rate increases in increments to maturity. Rate disclosed is as of October 31, 2019. Maturity date disclosed is the ultimate maturity. |
| |
| (i) | | Security issued with a zero coupon. The actual effective yield of this security is different than the stated coupon due to the accretion of discount. |
| | |
|
| Investment Abbreviations: |
| AG | | —Aktiengesellschaft (German Corporation) |
| AMT | | —Alternative Minimum Tax |
| ASA | | —Allmennaksjeselskap(Norwegian Public Company) |
| FFCB | | —Federal Farm Credit Bank |
| FHLB | | —Federal Home Loan Bank |
| FHLMC | | —Federal Home Loan Mortgage Corp. |
| FNMA | | —Federal National Mortgage Association |
| GNMA | | —Government National Mortgage Association |
| GO | | —General Obligation |
| LIBOR | | —London Interbank Offered Rate |
| LLC | | —Limited Liability Company |
| LP | | —Limited Partnership |
| NA | | —National Association |
| NV | | —NaamlozeVennootschap (Dutch Public Company) |
| PLC | | —Public Limited Company |
| Q-SBLF | | —Qualified School Bond Loan Fund |
| REMIC | | —Real Estate Mortgage Investment Conduit |
| UMBS | | —UniformMortgage Backed Securities |
|
PORTFOLIO COMPOSITION
| | | | | | | | |
| | | AS OF
10/31/19 | | | AS OF
10/31/18 | |
| |
Corporate Obligations | | | 41.8 | % | | | 40.6 | % |
Asset-Backed Securities | | | 18.0 | | | | 17.3 | |
Collateralized Mortgage Obligations | | | 17.7 | | | | 19.5 | |
Municipal Bond Obligations | | | 8.6 | | | | 5.4 | |
U.S. Treasury Obligations | | | 7.2 | | | | 9.1 | |
Federal Agencies | | | 2.1 | | | | 2.4 | |
Commercial Mortgage Obligations | | | 1.9 | | | | 3.6 | |
U.S. Government Agency Obligations | | | 1.4 | | | | 0.9 | |
Investment Company | | | 0.8 | | | | 0.4 | |
Repurchase Agreement | | | — | | | | 0.9 | |
| |
| TOTAL INVESTMENTS | | | 99.5 | % | | | 100.1 | % |
| |
The percentage shown for each investment category reflects the value of investments in that category as a percentage of net assets. Underlying investment categories of investment companies held by the Fund are not reflected in the table above. Consequently, the Fund’s overall investment category allocations may differ from the percentages contained in the table above.
The Fund is actively managed and, as such, its composition may differ over time.
| | |
| The accompanying notes are an integral part of these financial statements. | | 27 |
COMMERCE SHORT-TERM GOVERNMENT FUND
Short-Term Government Fund Overview
We present you with the annual report for theCommerce Short-Term Government Fund for theone-year period ended October 31, 2019.
A conversation with Scott Colbert and Brent Schowe, Portfolio Managers of the Short-Term Government Fund.
Q: How did the Fund perform over the review period?
A: Over theone-year period ended October 31, 2019, the Fund generated a cumulative total return of 4.73%. This return compares to the 5.88% cumulative total return of the Fund’s benchmark, the Bloomberg Barclays U.S.1-5 Year Government Bond Index (the “Index”).
Q: What were the material factors that affected the Fund’s performance relative to its benchmark during the reporting period?
A: A key detractor to the Fund’s performance during the period was the level of the Fund’s duration. Treasury yields across theshort-end of the yield curve declined 0.70% to 1.45% during the period and the Fund lagged in performance, in part, because it had a shorter duration than the Index. The Fund’s performance relative to the Index was enhanced by repositioning the Fund’s investments into a “barbell” maturity structure (described below).
Q: Were there any significant adjustments made to the Fund’s portfolio during the period?
A: The Fund’s exposures to Treasury bonds and U.S. government agency debentures were reduced during the period. In addition, the Fund’s exposure to U.S. government agency mortgage-backed securities was increased during the period.
Q: Could you describe some specific strategies and holdings that enhanced the Fund’s returns during the period?
A: Repositioning the Fund’s maturity buckets into a “barbell” maturity structure enhanced Fund performance
during the period. This strategy involved the Fund having an underweight position in securities with1- to3-year maturities while simultaneously having an overweight position in securities with less than1-year maturities and securities with4- to5-year maturities. A flattening yield curve environment is best suited for this strategy. During the period, the Treasury yield curve was inverted and securities with1- to3-year maturities generally underperformed as the yield curve flattened and moved toward an upward sloping yield curve, which benefited the Fund’s relative performance.
Q: What were some examples of strategies and holdings that didn’t work well for the Fund during the period?
A: Maintaining the Fund’s duration shorter than the Index did not help the Fund’s performance. The Federal Reserve ceased raising interest rates in 2019 and instead reversed course by lowering rates three times. The Fund did not fully benefit from the resulting lower interest rates because its average duration was shorter than the Index’s duration.
28
COMMERCE SHORT-TERM GOVERNMENT FUND
Performance Summary
October 31, 2019 (Unaudited)
The following is performance information for the Commerce Short-Term Government Fund (“Short-Term Government Fund”) for various time periods. The returns represent past performance. Past performance is no guarantee of future results. The Fund’s investment return and principal value will fluctuate so that an investor’s shares, when redeemed, may be worth more or less than their original cost. Performance reflects expense limitations in effect. In their absence, performance would be reduced. Returns do not reflect the deduction of taxes that a shareholder would pay on Fund distributions or the redemption of Fund shares. The Fund is not subject to a sales charge, so a sales charge is not applied to its total returns. In addition to the Adviser’s decisions regarding issuer/industry investment selection and allocation, other factors may affect Fund performance. These factors include, but are not limited to, Fund operating fees and expenses, portfolio turnover, and subscription and redemption cash flows affecting the Fund. Please visit our website at www.commercefunds.com to obtain the most recent month-end returns.
| | | | | | | | |
| | Performance Review |
| | | | |
| | | November 1, 2018 - October 31, 2019 | | Fund Total Return(a) | | Index Total Return | | Index |
| | | | |
| | | Short-Term Government Fund | | 4.73% | | 5.88% | | Bloomberg Barclays U.S. 1-5 Year Government Bond Index(b) |
Standardized Average Annual Total Return through September 30, 2019(c)
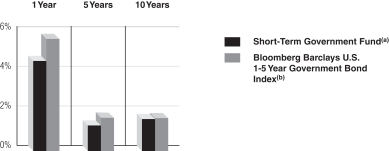
| | | | | | | | |
| | Standardized Average Annual Total Return through September 30, 2019(c) | | One Year | | Five Years | | Ten Years |
| | | | |
| | | Short-Term Government Fund(a) | | 4.57% | | 1.30% | | 1.63% |
| | | | |
| | | Bloomberg Barclays U.S. 1-5 Year Government Bond Index(b) | | 5.69% | | 1.69% | | 1.68% |
| | |
| Short-Term Government Fund 10 Year Performance | | |
Performance of a $10,000 Investment, with distributions reinvested, from November 1, 2009 through October 31, 2019.
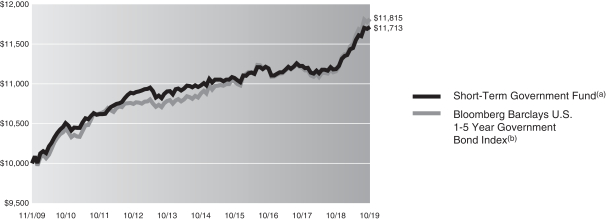
| | | | | | | | |
| | Average Annual Total Return through October 31, 2019 | | One Year | | Five Years | | Ten Years |
| | | | |
| | | Short-Term Government Fund(a) | | 4.73% | | 1.30% | | 1.59% |
| | | | | | |
| | Expense Ratios(d) | | | | |
| | | |
| | | | | Net Expense Ratio (Current) | | Gross Expense Ratio (Before Reimbursements) |
| | | |
| | | Short-Term Government Fund | | 0.68% | | 0.92% |
| (a) | | Returns reflect any applicable fee waivers or expense reductions. Returns do not reflect the deduction of taxes that a shareholder would pay on Fund distributions or the redemption of Fund shares. |
| (b) | | The Bloomberg Barclays U.S. 1-5 Year Government Bond Index is an unmanaged index comprised of U.S. Treasury and Agency securities with a minimum principal amount outstanding of $250 million and a final maturity of at least one year but no more than five years. The Index figures do not reflect any deduction for fees, taxes or expenses. |
29
COMMERCE SHORT-TERM GOVERNMENT FUND
Performance Summary(continued)
October 31, 2019 (Unaudited)
| (c) | | The Standardized Average Annual Total Returns are average annual total returns as of the most recent calendar quarter-end. They assume reinvestment of all distributions at NAV. Current performance may be lower or higher than the total return figures in the above charts. |
| | | Returns reflect any fee waivers and expense reductions. Absent these waivers and reductions, returns would have been lower. Returns do not reflect the deduction of taxes that a shareholder would pay on capital gains or other taxable distributions or the redemption of Fund shares. |
| (d) | | The Fund’s expense ratios, both net (net of applicable fee waivers and/or expense reimbursements) and gross (before applicable fee waivers and/or expense reimbursements), set forth above are as of the most recent publicly available prospectus for the Fund (March 1, 2019) and may differ from the expense ratios disclosed in the Financial Highlights in this report. The Adviser has contractually agreed to reduce or limit the Total Annual Fund Operating Expenses, excluding interest, taxes, acquired fund fees and expenses and extraordinary expenses. This agreement will remain in place through March 1, 2020. After this date, the Adviser or the Fund may terminate the contractual arrangement. If this occurs, the expense ratios may change without shareholder approval. |
30
COMMERCE SHORT-TERM GOVERNMENT FUND
Schedule of Investments
October 31, 2019
| | | | | | | | | | |
Principal
Amount | | Interest
Rate | | | Maturity
Date | | Value | |
|
| Mortgage-Backed Obligations – 57.7% | |
Collateralized Mortgage Obligations – 37.8% | |
| Adjustable Rate Mortgage Trust Series2004-5, Class 3A1(a)(b) | |
| $ 25,416 | | | 4.399 | % | | 04/25/35 | | $ | 25,688 | |
|
| Banc of America Funding Corp. Series2004-A, Class 1A3(a)(b) | |
| 5,306 | | | 4.752 | | | 09/20/34 | | | 5,513 | |
|
| Banc of America Mortgage Securities, Inc. Series2003-J, Class 2A1(a)(b) | |
| 124,206 | | | 4.227 | | | 11/25/33 | | | 126,471 | |
|
| Bear Stearns Adjustable Rate Mortgage Trust Series2004-9, Class 24A1(a)(b) | |
| 49,245 | | | 4.551 | | | 11/25/34 | | | 49,445 | |
|
| Citigroup Mortgage Loan Trust, Inc. Series 2004-HYB3, Class A1(a)(b) | |
| 31,069 | | | 4.679 | | | 09/25/34 | | | 31,942 | |
|
| Fannie Mae Grantor Trust Series2011-T2, Class A | |
| 691,429 | | | 2.500 | | | 08/25/51 | | | 685,426 | |
|
| FHLMC REMIC PAC Series 159, Class H | |
| 360 | | | 4.500 | | | 09/15/21 | | | 361 | |
|
| FHLMC REMIC PAC Series 2022, Class PE | |
| 13,086 | | | 6.500 | | | 01/15/28 | | | 14,458 | |
|
| FHLMC REMIC PAC Series 2109, Class PE | |
| 27,844 | | | 6.000 | | | 12/15/28 | | | 31,177 | |
|
| FHLMC REMIC PAC Series 23, Class PK | |
| 48,564 | | | 6.000 | | | 11/25/23 | | | 51,470 | |
|
| FHLMC REMIC Series 3816, Class HA | |
| 1,465,165 | | | 3.500 | | | 11/15/25 | | | 1,532,604 | |
|
| FHLMC REMIC Series 4467, Class DA | |
| 616,725 | | | 3.000 | | | 11/15/41 | | | 631,252 | |
|
| FHLMC REMIC Series 4640, Class LD | |
| 616,702 | | | 4.000 | | | 09/15/43 | | | 634,239 | |
|
| FHLMC REMIC Series 4713, Class DV | |
| 543,794 | | | 3.500 | | | 11/15/28 | | | 574,321 | |
|
| FHLMC REMIC Series 4776, Class C | |
| 588,639 | | | 4.500 | | | 03/15/43 | | | 598,472 | |
|
| FHLMC REMIC Series 4879, Class A | |
| 574,467 | | | 4.000 | | | 10/15/46 | | | 589,118 | |
|
| FNMA REMIC PAC Series1992-129, Class L | |
| 13,196 | | | 6.000 | | | 07/25/22 | | | 13,726 | |
|
| FNMA REMIC PAC Series1992-89, Class MA(b) | |
| 2,435 | | | 0.000 | | | 06/25/22 | | | 2,373 | |
|
| FNMA REMIC Series1991-137, Class H | |
| 5,321 | | | 7.000 | | | 10/25/21 | | | 5,456 | |
|
| FNMA REMIC Series1993-182, Class FA(b) | |
| (10Y US Treasury Index rate - 0.650%) | |
| 3,106 | | | 1.110 | | | 09/25/23 | | | 3,101 | |
|
| FNMA REMIC Series2003-117, Class KB | |
| 443,251 | | | 6.000 | | | 12/25/33 | | | 508,629 | |
|
| FNMA REMIC Series2003-14, Class AP | |
| 39,586 | | | 4.000 | | | 03/25/33 | | | 40,915 | |
|
| FNMA REMIC Series2011-146, Class NB | |
| 666,552 | | | 4.000 | | | 09/25/41 | | | 688,695 | |
| |
| | | | | | | | | | |
Principal
Amount | | Interest
Rate | | | Maturity
Date | | Value | |
|
| Mortgage-Backed Obligations – (continued) | |
Collateralized Mortgage Obligations – (continued) | |
| FNMA REMIC Series2012-100, Class WA | |
| $ 671,077 | | | 1.500 | % | | 09/25/27 | | $ | 661,730 | |
|
| FNMA REMIC Series2012-110, Class CA | |
| 614,490 | | | 3.000 | | | 10/25/42 | | | 634,489 | |
|
| FNMA REMIC Series2012-118, Class EB | |
| 698,233 | | | 1.500 | | | 11/25/27 | | | 687,555 | |
|
| FNMA REMIC Series2013-112, Class G | |
| 568,463 | | | 2.125 | | | 07/25/40 | | | 569,285 | |
|
| FNMA REMIC Series2015-15, Class CA | |
| 974,759 | | | 3.500 | | | 04/25/35 | | | 1,020,702 | |
|
| FNMA REMIC Series2015-19, Class CA | |
| 671,532 | | | 3.500 | | | 01/25/43 | | | 704,228 | |
|
| FNMA REMIC Series2015-2, Class PA | |
| 519,632 | | | 2.250 | | | 03/25/44 | | | 522,390 | |
|
| FNMA REMIC Series2016-104, Class BA | |
| 543,755 | | | 3.000 | | | 01/25/47 | | | 562,108 | |
|
| FNMA REMIC Series2016-53, Class BV | |
| 773,081 | | | 3.500 | | | 11/25/27 | | | 814,831 | |
|
| FNMA REMIC Series2016-96, Class A | |
| 593,070 | | | 1.750 | | | 12/25/46 | | | 587,013 | |
|
| FNMA REMIC Series2017-7, Class JA | |
| 539,980 | | | 2.000 | | | 02/25/47 | | | 539,330 | |
|
| FNMA REMIC Series2019-10, Class PT | |
| 618,931 | | | 3.500 | | | 03/25/49 | | | 650,726 | |
|
| GNMA REMIC Series2009-65, Class AF | |
| 58,162 | | | 4.000 | | | 07/20/39 | | | 59,975 | |
|
| GNMA REMIC Series2010-115, Class QJ | |
| 31,354 | | | 3.500 | | | 11/20/38 | | | 31,417 | |
|
| GNMA REMIC Series2010-14, Class PA(d) | |
| 32,158 | | | 3.000 | | | 02/20/40 | | | 32,562 | |
|
| GNMA REMIC Series2010-89, Class GL(d) | |
| 136,400 | | | 4.000 | | | 05/20/39 | | | 138,849 | |
|
| GNMA REMIC Series2012-13, Class EG | |
| 1,399,883 | | | 2.000 | | | 10/20/40 | | | 1,401,589 | |
|
| GNMA REMIC Series2013-188, Class LE | |
| 1,077,604 | | | 2.500 | | | 11/16/43 | | | 1,082,773 | |
|
| GNMA REMIC Series2015-94, Class AT | |
| 432,443 | | | 2.250 | | | 07/16/45 | | | 435,673 | |
|
| GNMA REMIC Series2019-21, Class MA(d) | |
| 863,838 | | | 3.500 | | | 09/20/47 | | | 901,131 | |
|
| GNMA Series2015-65, Class BD | |
| 647,647 | | | 2.250 | | | 05/20/45 | | | 648,583 | |
|
| GSR Mortgage Loan Trust Series2003-6F, Class A1 | |
| 16,949 | | | 3.000 | | | 09/25/32 | | | 16,930 | |
|
| GSR Mortgage Loan Trust Series2005-AR3, Class 2A1(c) | |
| (1M USD LIBOR + 0.440%) | |
| 142,323 | | | 2.263 | | | 05/25/35 | | | 141,283 | |
|
| GSR Mortgage Loan Trust Series2006-AR1, Class 2A4(a) | |
| 381,442 | | | 4.360 | | | 01/25/36 | | | 388,166 | |
|
| Impac CMB Trust Series2003-2F, Class A(e) | |
| 153,667 | | | 5.730 | | | 01/25/33 | | | 160,381 | |
| |
| | |
| The accompanying notes are an integral part of these financial statements. | | 31 |
COMMERCE SHORT-TERM GOVERNMENT FUND
Schedule of Investments(continued)
October 31, 2019
| | | | | | | | | | |
Principal
Amount | | Interest
Rate | | Maturity
Date | | | Value | |
|
| Mortgage-Backed Obligations – (continued) | |
Collateralized Mortgage Obligations – (continued) | |
| Impac CMB Trust Series2003-8, Class 2A1(b) | |
| (1M USD LIBOR + .900%) | |
| $ 16,539 | | 2.723% | | | 10/25/33 | | | $ | 16,725 | |
|
| Impac CMB Trust Series2004-7, Class 1A1(b) | |
| (1M USD LIBOR + 0.740%) | |
| 56,942 | | 2.563 | | | 11/25/34 | | | | 58,151 | |
|
| Impac CMB Trust Series2005-2, Class 2A2(b) | |
| (1M USD LIBOR + 0.800%) | |
| 64,456 | | 2.623 | | | 04/25/35 | | | | 63,186 | |
|
| Impac Secured Assets Corp. Series2006-1, Class 2A1(b) | |
| (1M USD LIBOR+ 0.350%) | |
| 371,287 | | 2.173 | | | 05/25/36 | | | | 363,229 | |
|
| IndyMac Index Mortgage Loan Trust Series2004-AR6, Class 6A1(a) | |
| 47,879 | | 4.546 | | | 10/25/34 | | | | 47,765 | |
|
| Lehman XS Trust Series2005-7N, Class 1A1A(b) | |
| (1M USD LIBOR 0.540%) | |
| 113,732 | | 2.363 | | | 12/25/35 | | | | 112,516 | |
|
| Master Adjustable Rate Mortgages Trust Series2004-13, Class 2A1(a) | |
| 67,437 | | 4.713 | | | 04/21/34 | | | | 69,027 | |
|
| Master Alternative Loans Trust Series2004-9, Class A6(e) | |
| 2,491 | | 5.643 | | | 08/25/34 | | | | 2,530 | |
|
| MortgageIT Trust Series2005-1, Class 1A1(b) | |
| (1M USD LIBOR + 0.640%) | |
| 475,197 | | 2.463 | | | 02/25/35 | | | | 480,868 | |
|
| MortgageIT Trust Series2005-1, Class 1A2(b) | |
| (1M USD LIBOR+ 0.780%) | |
| 408,739 | | 2.603 | | | 02/25/35 | | | | 412,824 | |
|
| Residential Accredit Loans, Inc. Series2004-QA4, Class NB21(a) | |
| 18,587 | | 4.411 | | | 09/25/34 | | | | 18,865 | |
|
| Securitized Asset Sales, Inc. Series1993-7, Class TA6 | |
| 2,567 | | 6.250 | | | 12/25/23 | | | | 2,576 | |
|
| Sequoia Mortgage Trust Series 10, Class 1A(b) | |
| (1M USD LIBOR + 0.800%) | |
| 27,585 | | 2.646 | | | 10/20/27 | | | | 27,506 | |
|
| Sequoia Mortgage Trust Series2003-2, Class A1(b) | |
| (1M USD LIBOR+ 0.660%) | |
| 46,566 | | 2.506 | | | 06/20/33 | | | | 47,422 | |
|
| Structured Asset Securities Corp. Series2003-31A, Class 2A7(a) | |
| 193,495 | | 4.076 | | | 10/25/33 | | | | 198,574 | |
|
| Vendee Mortgage Trust Series1996-2, Class 1Z | |
| 53,708 | | 6.750 | | | 06/15/26 | | | | 59,643 | |
| |
| TOTAL COLLATERALIZED MORTGAGE OBLIGATIONS | |
(Cost $21,328,646) | | | $ | 22,219,958 | |
| |
Commercial Mortgage Obligations – 2.5% | |
| GNMA REMIC Series2010-141, Class B | |
| $ 620,619 | | 2.717% | | | 02/16/44 | | | $ | 624,768 | |
| |
| | | | | | | | | | |
Principal
Amount | | Interest
Rate | | Maturity
Date | | | Value | |
|
| Mortgage-Backed Obligations – (continued) | |
Commercial Mortgage Obligations – (continued) | |
| GNMA REMIC Series2014-47, Class BC | |
| $ 848,679 | | 3.574% | | | 06/16/45 | | | $ | 862,643 | |
| |
| TOTAL COMMERCIAL MORTGAGE OBLIGATIONS | |
(Cost $1,470,944) | | | $ | 1,487,411 | |
| |
Federal Agencies – 17.4% | |
| FHLMC | |
| 7,002 | | 6.000 | | | 10/01/23 | | | | 7,737 | |
| 22,680 | | 5.000 | | | 05/01/27 | | | | 24,223 | |
| 313,774 | | 2.500 | | | 04/01/28 | | | | 317,264 | |
| (12M USD LIBOR + 1.600%) | |
| 509,681 | | 2.776(b) | | | 07/01/45 | | | | 516,539 | |
| (12M USD LIBOR + 1.582%) | |
| 577,304 | | 2.633(b) | | | 07/01/46 | | | | 585,025 | |
|
| FNMA | |
| 587,594 | | 3.500 | | | 12/01/27 | | | | 609,762 | |
| 519,288 | | 2.500 | | | 03/01/28 | | | | 526,055 | |
| 1,016,705 | | 2.500 | | | 05/01/28 | | | | 1,029,905 | |
| 390,482 | | 2.500 | | | 01/01/30 | | | | 394,948 | |
| 758,609 | | 2.500 | | | 02/01/32 | | | | 767,330 | |
| 378,865 | | 3.500 | | | 10/01/32 | | | | 392,005 | |
| 857,991 | | 3.000 | | | 08/01/33 | | | | 877,612 | |
| (12M USD LIBOR + 1.740%) | |
| 28,399 | | 4.152(b) | | | 10/01/34 | | | | 29,182 | |
| (12M USD LIBOR + 1.586%) | |
| 468,059 | | 2.613(b) | | | 12/01/45 | | | | 474,763 | |
|
| GNMA(b) | |
| (1Y US Treasury Yield Curve rate + 1.500%) | |
| 91 | | 4.125 | | | 11/20/24 | | | | 94 | |
| (1Y US Treasury Yield Curve rate + 1.500%) | |
| 180 | | 4.125 | | | 12/20/24 | | | | 181 | |
| (1Y US Treasury Yield Curve rate + 1.500%) | |
| 4,437 | | 3.875 | | | 04/20/26 | | | | 4,448 | |
| (1Y US Treasury Yield Curve rate + 1.500%) | |
| 2,962 | | 3.750 | | | 08/20/26 | | | | 2,977 | |
| (1Y US Treasury Yield Curve rate + 1.500%) | |
| 5,055 | | 4.000 | | | 01/20/28 | | | | 5,226 | |
UMBS | |
| 3 | | 5.500 | | | 06/01/20 | | | | 3 | |
| 678,875 | | 3.000 | | | 11/01/26 | | | | 697,227 | |
| 582,044 | | 3.000 | | | 12/01/26 | | | | 598,610 | |
| 4,997 | | 7.000 | | | 11/01/31 | | | | 5,153 | |
| 579,564 | | 5.000 | | | 02/01/32 | | | | 618,672 | |
| 119,225 | | 6.000 | | | 07/01/33 | | | | 132,013 | |
| 971,180 | | 3.500 | | | 07/01/34 | | | | 1,011,100 | |
| 536,827 | | 3.500 | | | 08/01/35 | | | | 558,953 | |
| |
| TOTAL FEDERAL AGENCIES | |
(Cost $10,171,819 | | | | | | $ | 10,187,007 | |
| |
| TOTAL MORTGAGE-BACKED OBLIGATIONS | |
(Cost $32,971,409) | | | $ | 33,894,376 | |
| |
| | | | | | | | | | |
| | |
| 32 | | The accompanying notes are an integral part of these financial statements. |
COMMERCE SHORT-TERM GOVERNMENT FUND
| | | | | | | | | | |
Principal
Amount | | Interest
Rate | | | Maturity
Date | | Value | |
|
| U.S. Government Agency Obligations – 26.0% | |
| FFCB(d) | |
| $1,000,000 | | | 1.170 | % | | 01/13/20 | | $ | 999,166 | |
| 1,000,000 | | | 1.400 | | | 04/13/20 | | | 998,873 | |
| 1,000,000 | | | 1.420 | | | 06/29/20 | | | 998,823 | |
| 1,000,000 | | | 1.350 | | | 09/21/20 | | | 997,928 | |
|
| FHLB | |
| 1,000,000 | | | 2.000 | (d) | | 09/06/22 | | | 1,000,037 | |
| 600,000 | | | 3.000 | | | 12/09/22 | | | 626,278 | |
|
| FHLMC(d) | |
| 1,000,000 | | | 1.875 | | | 11/27/20 | | | 1,002,813 | |
| 900,000 | | | 2.000 | | | 12/18/20 | | | 904,052 | |
| 500,000 | | | 3.100 | | | 06/29/23 | | | 504,426 | |
| 1,000,000 | | | 2.000 | (e) | | 06/14/27 | | | 1,000,122 | |
|
| FNMA | |
| 500,000 | | | 2.500 | | | 02/05/24 | | | 518,601 | |
| 1,000,000 | | | 1.750 | (d) | | 11/20/20 | | | 1,000,782 | |
| 500,000 | | | 1.250 | | | 05/06/21 | | | 497,601 | |
| 1,000,000 | | | 1.400 | (d) | | 08/25/21 | | | 996,817 | |
| 900,000 | | | 2.075 | (d) | | 02/28/22 | | | 907,802 | |
| 500,000 | | | 2.000 | | | 10/05/22 | | | 506,621 | |
| 1,000,000 | | | 2.875 | | | 09/12/23 | | | 1,048,838 | |
| 750,000 | | | 1.625 | | | 10/15/24 | | | 750,402 | |
| |
| TOTAL U.S. GOVERNMENT AGENCY OBLIGATIONS | |
(Cost $15,169,626) | | $ | 15,259,982 | |
| |
| | | | | | | | | | |
|
| U.S. Treasury Obligations – 11.9% | |
| United States Treasury Inflation Indexed Bonds | |
| $ 849,059 | | | 0.125 | % | | 04/15/20 | | $ | 844,515 | |
| 1,107,698 | | | 0.125 | | | 04/15/22 | | | 1,099,148 | |
|
| United States Treasury Notes | |
| 750,000 | | | 1.625 | | | 06/30/20 | | | 750,000 | |
| 500,000 | | | 2.250 | | | 03/31/21 | | | 504,551 | |
| 2,000,000 | | | 2.250 | | | 07/31/21 | | | 2,023,125 | |
| 750,000 | | | 2.000 | | | 04/30/24 | | | 765,029 | |
| 1,000,000 | | | 2.125 | | | 11/30/24 | | | 1,027,930 | |
| |
| TOTAL U.S. TREASURY OBLIGATIONS | |
(Cost $7,001,780) | | $ | 7,014,298 | |
| |
| | | | | | | | | | |
|
| Asset-Backed Securities – 4.1% | |
Home Equity(b) – 2.7% | |
| Argent Securities, Inc. Series2004-W5, Class AV3B | |
| (1M USD LIBOR + 0.900%) | |
| $ 922,227 | | | 2.723 | % | | 04/25/34 | | $ | 927,265 | |
|
| Morgan Stanley Capital, Inc. Series2002-HE3, Class A2 | |
| (1M USD LIBOR + 1.080%) | |
| 301,327 | | | 2.903 | | | 03/25/33 | | | 298,078 | |
|
| Terwin Mortgage Trust Series2004-7HE, Class A3(f) | |
| (1M USD LIBOR + 0.700%) | |
| 238,525 | | | 2.523 | | | 07/25/34 | | | 240,309 | |
| |
| | | | | | | | | | | | |
Principal
Amount | | Interest
Rate | | | Maturity
Date | | | Value | |
|
| Asset-Backed Securities – (continued) | |
Home Equity(b) – (continued) | |
| Terwin Mortgage Trust Series2004-9HE, Class A1(f) | |
| (1M USD LIBOR + 0.400%) | |
| $ 111,394 | | | 2.223 | % | | | 09/25/34 | | | $ | 110,941 | |
| | | | | | | | | | | | |
| | | | | | | | | | | 1,576,593 | |
| |
Other – 1.4% | |
| Countrywide Asset-Backed Certificates Series2004-6, Class 2A4(b) | |
| (1M USD LIBOR + 0.900%) | |
| 231,718 | | | 2.723 | | | | 11/25/34 | | | | 234,006 | |
|
| Towd Point Mortgage Trust Series2016-3, Class A1(a)(f) | |
| 588,005 | | | 2.250 | | | | 04/25/56 | | | | 586,689 | |
| | | | | | | | | | | | |
| | | | | | | | | | | 820,695 | |
| |
| TOTAL ASSET-BACKED SECURITIES | |
(Cost $2,064,676) | | | $ | 2,397,288 | |
| |
| | | | | | | | | | | | |
| Shares | | Dividend
Rate | | | | | | Value | |
|
| Investment Company – 1.5% | |
| State Street Institutional US Government Money Market Fund – Premier Class | |
| 856,810 | | | 1.741 | % | | | | | | $ | 856,810 | |
(Cost $856,810) | | | | | | | | | |
| |
| TOTAL INVESTMENTS – 101.2% | |
(Cost $58,064,301) | | | $ | 59,422,754 | |
| |
LIABILITIES IN EXCESS OF
OTHER ASSETS – (1.2)% | | | | (718,824) | |
| |
NET ASSETS – 100.0% | | | $ | 58,703,930 | |
| |
| | |
|
| The percentage shown for each investment category reflects the value of investments in that category as a percentage of net assets. |
| |
| (a) | | Rate shown is that which is in effect on October 31, 2019. Certain variable rate securities are not based on a published reference rate and spread but are determined by the issuer or agent and are based on current market conditions. |
| |
| (b) | | Variable rate security. The interest rate shown reflects the rate as of October 31, 2019. |
| |
| (c) | | Security issued with a zero coupon. The actual effective yield of this security is different than the stated coupon due to the accretion of discount. |
| |
| (d) | | Security with “Call” features with resetting interest rates. |
| |
| (e) | | Step-up Bond. Coupon rate increases in increments to maturity. Rate disclosed is as of October 31, 2019. Maturity date disclosed is the ultimate maturity. |
| |
| (f) | | Exempt from registration under Rule 144A of the Securities Act of 1933. Such securities may be resold, normally to qualified institutional buyers in transactions exempt from registration. |
| | |
| The accompanying notes are an integral part of these financial statements. | | 33 |
COMMERCE SHORT-TERM GOVERNMENT FUND
Schedule of Investments(continued)
October 31, 2019
| | |
|
|
| Investment Abbreviations: |
| FFCB | | —Federal Farm Credit Bank |
| FHLB | | —Federal Home Loan Bank |
| FHLMC | | —Federal Home Loan Mortgage Corp. |
| FNMA | | —Federal National Mortgage Association |
| GNMA | | —Government National Mortgage Association |
| LIBOR | | —London Interbank Offered Rate |
| PAC | | —Planned Amortization Class |
| REMIC | | —Real Estate Mortgage Investment Conduit |
| UMBS | | —UniformMortgage Backed Securities |
|
PORTFOLIO COMPOSITION
| | | | | | | | |
| |
| AS OF
10/31/19 |
| |
| AS OF
10/31/18 |
|
| |
Collateralized Mortgage Obligations | | | 37.8 | % | | | 24.0 | % |
U.S. Government Agency Obligations | | | 26.0 | | | | 41.7 | |
Federal Agencies | | | 17.4 | | | | 10.9 | |
U.S. Treasury Obligations | | | 11.9 | | | | 17.7 | |
Asset-Backed Securities | | | 4.1 | | | | 3.8 | |
Commercial Mortgage Obligations | | | 2.5 | | | | 2.3 | |
Investment Company | | | 1.5 | | | | — | |
Repurchase Agreement | | | — | | | | 0.3 | |
| |
| TOTAL INVESTMENTS | | 101.2% | | | 100.7% | |
| |
The percentage shown for each investment category reflects the value of investments in that category as a percentage of net assets. Underlying investment categories of investment companies, held by the Fund are not reflected in the table above. Consequently, the Fund’s overall investment category allocations may differ from the percentages contained in the table above.
The Fund is actively managed and, as such, its composition may differ over time.
| | |
| 34 | | The accompanying notes are an integral part of these financial statements. |
COMMERCE NATIONALTAX-FREE INTERMEDIATE BOND FUND
National, Missouri, and KansasTax-Free Intermediate Bond Funds Overview
We present you with the annual report for the Commerce National, Missouri, and Kansas Tax-Free Intermediate Bond Funds for the one-year period ended October 31, 2019.
A conversation with Brian Musielak, Portfolio Manager of the National, Missouri, and Kansas Tax-Free Intermediate Bond Funds.
Q: How did the Funds perform over the review period?
A: Over the one-year period ended October 31, 2019, the National Tax-Free Intermediate Bond Fund generated an annualized total return of 8.89%.
Over the one-year period ended October 31, 2019, the Missouri Tax-Free Intermediate Bond Fund generated an annualized total return of 7.98%.
Over the one-year period ended October 31, 2019, the Kansas Tax-Free Intermediate Bond Fund generated an annualized total return of 7.80%.
These returns compare to the 8.64% annualized total return of the Bloomberg Barclays Capital 3-15 Year Blend Municipal Bond Index (the “Index”) for the same period.
Q: What were the material factors that affected the Funds’ performance relative to their benchmark during the reporting period?
A: Regarding the National Fund’s performance, being long relative to the Index’s duration supported performance. Sector positioning was also positive. The relative underweight position to the Transportation sector detracted and while the Water/Sewer and Power sector underweight positions were additive. The Fund’s cash position lagged. The relative overweight position to the Lease, Higher Education, Housing and Hospital sectors enhanced returns. The underweight position to the Industrial Development Revenue/Pollution Control Revenue (“IDR/PCR”) and Resource Recovery sectors supported relative performance period. Overall, curve positioning was positive for the period. The positive effects of the exposures on the long-end of the curve were enough to offset lower performing short exposures.
Regarding the Missouri Fund’s, performance, being short relative to the Index’s duration hampered performance. Sector positioning was positive. The relative underweight position to the Transportation sector detracted and while the Water/Sewer and Power sector underweight positions were additive. The Fund’s cash position lagged. The relative overweight position to the Lease, Higher Education, Housing and Hospital sectors enhanced returns. The underweight position to the IDR/PCR and Resource Recovery sectors supported relative performance during the period. Overall, curve positioning was negative for the period. The positive effects of the exposures on the long-end of the curve were not enough to offset lower performing short exposures.
Regarding the Kansas Fund’s performance, being short relative to the Index’s duration detracted from performance. Sector positioning was positive. The relative underweight position to the Transportation sector detracted and while the Water/Sewer and Power sector underweight positions were additive. The Fund’s cash position lagged. The relative overweight position to the Lease, Higher Education, Housing and Hospital sectors enhanced returns. The underweight position to the IDR/PCR and Resource Recovery sectors supported relative performance during the period. Overall, curve positioning was negative for the period. The positive effects of the exposures on the long-end of the curve were not enough to offset lower performing short exposures.
Q: Were there any significant adjustments made to the Fund’s portfolio during the period?
A: Regarding each of the National, Missouri, and Kansas Tax-Free Intermediate Bond Funds, no significant adjustments were made to the Fund’s portfolio during the period. Our focus was on the higher-yielding, non-essential service revenue sectors, where we sought to identify solid risk-adjusted value opportunities. However, we emphasized less credit and duration risk in each of the Fund’s portfolios during the period. States where we believed we found attractive local opportunities for the Funds included Illinois, Indiana, Pennsylvania, Utah, Missouri, Kansas, Rhode
35
COMMERCE NATIONALTAX-FREE INTERMEDIATE BOND FUND
National, Missouri, and KansasTax-Free Intermediate Bond Funds Overview(continued)
Island and Florida. Going forward, we plan to maintain the Fund’s positions in sectors such as housing, higher education, hospitals and lease revenue bonds.
Q: Could you describe some specific strategies or holdings that enhanced returns during the period?
A: In the National Tax-Free Intermediate Bond Fund, the best performing bonds were Delaware Valley PA Regional Financial Authority Ser A 5.0% due 9/1/2033, Washoe County NV School District School Improvement — Ser C 3.0% due 10/1/2036 and Public Finance Authority WI Revenue Taxable — Ref — HI Pac Health Obligation Group — Ser A 4.082% due 7/1/2029.
In the Missouri Tax-Free Intermediate Bond Fund, the best performing bonds were Illinois State Finance Authority Revenue Ref — OSF Healthcare Sys 3.25% due 5/15/2039, Washington CA Unified School District Yolo County Capital Appreciation Election 2004 Ser A 0% due 8/1/2029 and Jackson County MO School District Hickmann MLSC-1 Certificate of Participation — Energy Conservation Project 3.375% due 4/15/2032.
In the Kansas Tax-Free Intermediate Bond Fund, the best performing bonds were Wyandotte County KS School District #204 Ser A 3.0% due 9/1/2037, Clark County NV Ref — Las Vegas Convention & Visitors Authority — Ser C 3% due 7/1/2035 and Unified Fire Service Area UT Local Building Authority Lease Revenue Ref 3.0% due 4/1/2035.
Q: What were some examples of strategies or holdings that didn’t meet your expectations?
A: In the National Tax-Free Intermediate Bond Fund, Pennsylvania State Housing Finance Agency SF Mortgage Revenue Ser 130a 2.05% due 4/1/2030, Fayette County KY School District Fin Corp 4.0% due 2/1/2030 and Mount Prospect IL Ref-Ser A 3.0% due 12/1/2028 did not meet our expectations.
In the Missouri Tax-Free Intermediate Bond Fund, Festus MO #R-VI School District Lease Certificate of Participation School District Project 5.0% due 4/1/2028, Franklin County MO Certificate of Participation Ref-Ser B 4.0% due 4/1/2028 and Missouri State Health & Educational Facilities Authority Health Facilities Revenue Ref-Cox Health-Ser A 5.0% due 11/15/2032 did not meet our expectations.
In the Kansas Tax-Free Intermediate Bond Fund, Topeka KS Utility Revenue Ref-Ser A 3.0% due 8/1/2028, Salina KS Water & Sewer Revenue Ref-Ser A 3.0% due 10/1/2027 and Topeka KS Ref-Ser A 2.0% due 8/15/2028 did not meet our expectations.
References to specific securities should not be construed as a recommendation or investment advice and securities referenced may no longer be held in a Fund’s portfolio.
36
COMMERCE NATIONALTAX-FREE INTERMEDIATE BOND FUND
Performance Summary
October 31, 2019 (Unaudited)
The following is performance information for the Commerce National Tax-Free Intermediate Bond Fund (“National Tax-Free Intermediate Bond Fund”) for various time periods. The returns represent past performance. Past performance is no guarantee of future results. The Fund’s investment return and principal value will fluctuate so that an investor’s shares, when redeemed, may be worth more or less than their original cost. Performance reflects expense limitations in effect. In their absence, performance would be reduced. Returns do not reflect the deduction of taxes that a shareholder would pay on Fund distributions or the redemption of Fund shares. The Fund is not subject to a sales charge, so a sales charge is not applied to its total returns. In addition to the Adviser’s decisions regarding issuer/industry investment selection and allocation, other factors may affect Fund performance. These factors include, but are not limited to, Fund operating fees and expenses, portfolio turnover, and subscription and redemption cash flows affecting the Fund. Please visit our website at www.commercefunds.com to obtain the most recent month-end returns.
| | | | | | | | |
| | Performance Review |
| | | | |
| | | November 1, 2018 - October 31, 2019 | | Fund Total Return(a) | | Index Total Return(c) | | Index |
| | | | |
| | | National Tax-Free Intermediate Bond Fund | | 8.89% | | 8.64% | | Bloomberg Barclays 3-15 Year Blend Municipal Bond(c) |
Standardized Average Annual Total Return through September 30, 2019(b)
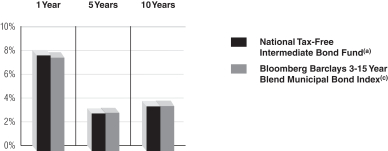
| | | | | | | | |
| | Standardized Average Annual Total Return through September 30, 2019(b) | | One Year | | Five Years | | Ten Years |
| | | | |
| | | National Tax-Free Intermediate Bond Fund(a) | | 8.06% | | 3.16% | | 3.77% |
| | | | |
| | | Bloomberg Barclays 3-15 Year Blend Municipal Bond Index(c) | | 7.86% | | 3.23% | | 3.79% |
National Tax-Free Intermediate Bond Fund 10 Year Performance
Performance of a $10,000 Investment, with distributions reinvested, from November 1, 2009 through October 31, 2019.
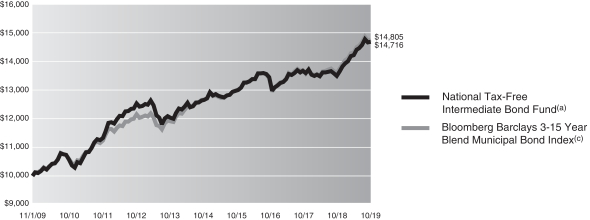
| | | | | | | | |
| | Average Annual Total Return through October 31, 2019 | | One Year | | Five Years | | Ten Years |
| | | | |
| | | National Tax-Free Intermediate Bond Fund(a) | | 8.89% | | 3.06% | | 3.94% |
| | | | | | |
| | Expense Ratios(d) | | | | |
| | | |
| | | | | Net Expense Ratio (Current) | | Gross Expense Ratio (Before Reimbursements) |
| | | |
| | | National Tax-Free Intermediate Bond Fund | | 0.59% | | 0.59% |
| (a) | | Returns reflect any applicable fee waivers or expense reductions. Returns do not reflect the deduction of taxes that a shareholder would pay on capital gains or other taxable distributions or the redemption of Fund shares. |
| (b) | | The Standardized Average Annual Total Returns are average annual total returns as of the most recent calendar quarter-end. They assume reinvestment of all distributions at NAV. Current performance may be lower or higher than the total return figures in the above charts. |
Returns reflect any fee waivers and expense reductions. Absent these waivers and reductions, returns would have been lower. Returns do not reflect the deduction of taxes that a shareholder would pay on capital gains or other taxable distributions or the redemption of Fund shares.
| (c) | | The Bloomberg Barclays 3-15 Year Blend Municipal Bond Index is an unmanaged index comprised of investment-grade municipal securities ranging from 2 to 17 years in maturity. The Index figures do not reflect any deduction for fees, taxes or expenses. |
| (d) | | The Fund’s expense ratios, both net (net of applicable fee waivers and/or expense reimbursements) and gross (before applicable fee waivers and/or expense reimbursements), set forth above are as of the most recent publicly available prospectus (March 1, 2019) for the Fund and may differ from the expense ratios disclosed in the Financial Highlights in this report. The Adviser has contractually agreed to reduce or limit the Total Annual Fund Operating Expenses, excluding interest, taxes, acquired fund fees and expenses and extraordinary expenses. This agreement will remain in place through March 1, 2020. After this date, the Adviser or the Fund may terminate the contractual arrangement. If this occurs, the expense ratios may change without shareholder approval. |
37
COMMERCE NATIONALTAX-FREE INTERMEDIATE BOND FUND
Schedule of Investments
October 31, 2019
| | | | | | | | | | |
Principal
Amount | | Interest
Rate | | | Maturity
Date | | Value | |
|
| Municipal Bond Obligations – 99.6% | |
Alabama – 1.0% | |
| Millbrook AL GO Bonds (Refunding) Series 2019(AA-/NR) | |
| $1,625,000 | | | 5.000 | % | | 09/01/25 | | $ | 1,932,076 | |
| 1,705,000 | | | 5.000 | | | 09/01/26 | | | 2,066,784 | |
| | | | | | | | | | |
| | | | | | | | | 3,998,860 | |
| |
Alaska – 1.9% | |
| Alaska State Housing Finance Corp. Revenue Bonds (Refunding) Series A (AA+/Aa2)(a) | |
| 1,000,000 | | | 5.000 | | | 12/01/29 | | | 1,221,470 | |
|
| Alaska State Municipal Bond Bank Authority Revenue Bonds (Master Resolution) Series A(AA-/NR) | |
| 1,000,000 | | | 4.000 | | | 10/01/24 | | | 1,119,160 | |
| 1,000,000 | | | 5.000 | | | 10/01/25 | | | 1,192,660 | |
| 1,000,000 | | | 5.000 | (a) | | 10/01/28 | | | 1,229,100 | |
|
| Alaska State Municipal Bond Bank Authority Revenue Bonds Series B (AMT)(AA-/NR)(a) | |
| 450,000 | | | 5.000 | | | 03/01/27 | | | 520,686 | |
|
| University of Alaska AK Revenue Bonds (Refunding)Series V-2 (A+/Baa1) | |
| 500,000 | | | 4.000 | | | 10/01/25 | | | 564,610 | |
|
| University of Alaska AK Revenue Bonds (Refunding-General) Series S (A+/Baa1)(a) | |
| 2,050,000 | | | 4.000 | | | 10/01/26 | | | 2,223,737 | |
| | | | | | | | | | |
| | | | | | | | | 8,071,423 | |
| |
Arizona – 1.9% | |
| Arizona Health Facilities Authority Healthcare & Education Facilities Revenue Bonds (Kirksville College)(A-/NR)(a) | |
| 700,000 | | | 4.700 | | | 01/01/21 | | | 703,514 | |
| 750,000 | | | 4.750 | | | 01/01/22 | | | 753,892 | |
| 1,000,000 | | | 5.000 | | | 01/01/25 | | | 1,005,490 | |
|
| Goodyear Community Facilities Utilities District No 1 GO Bonds (Refunding) Series 2016(A-/A1)(a) | |
| 880,000 | | | 4.000 | | | 07/15/32 | | | 978,622 | |
|
| McAllister Academic Village LLC AZ Revenue Bonds (Arizona State University) (Refunding) Series 2016(AA-/Aa3)(a) | |
| 1,000,000 | | | 5.000 | | | 07/01/27 | | | 1,227,060 | |
|
| Pima County AZ Regional Transportation Excise Tax Revenue Bonds (Pima County Regional Transportation Fund) (AA+/NR) | |
| 1,000,000 | | | 5.000 | | | 06/01/22 | | | 1,097,890 | |
| 1,000,000 | | | 5.000 | | | 06/01/23 | | | 1,134,020 | |
|
| Yuma AZ Municipal Property Corp. Excise Tax Revenue Bonds (Refunding-Senior Lien) Series 2015(AA-/A1)(a) | |
| 1,050,000 | | | 4.000 | | | 07/01/26 | | | 1,188,075 | |
| | | | | | | | | | |
| | | | | | | | | 8,088,563 | |
| |
Arkansas(a) – 1.8% | |
| Arkansas State Development Finance Authority State Agency Facilities Revenue Bonds (Department of Community Correction Project) Series 2018(AA-/NR) | |
| 980,000 | | | 4.000 | | | 11/01/31 | | | 1,137,133 | |
| 1,095,000 | | | 4.000 | | | 11/01/34 | | | 1,254,301 | |
| 1,000,000 | | | 4.000 | | | 11/01/35 | | | 1,142,050 | |
| |
| | | | | | | | | | |
Principal
Amount | | Interest
Rate | | | Maturity
Date | | Value | |
|
| Municipal Bond Obligations – (continued) | |
Arkansas(a) – (continued) | |
| Fort Smith AR Water & Sewer Revenue Bonds (Refunding) Series 2018 (A/NR) | |
| $ 500,000 | | | 5.000 | % | | 10/01/31 | | $ | 625,720 | |
| 1,000,000 | | | 5.000 | | | 10/01/32 | | | 1,247,290 | |
|
| National Park AR Community College District GO Bonds (Refunding) Series 2018 (A+/NR) | |
| 645,000 | | | 4.000 | | | 03/01/30 | | | 722,851 | |
| 635,000 | | | 4.000 | | | 03/01/32 | | | 703,936 | |
| 500,000 | | | 4.000 | | | 03/01/36 | | | 549,185 | |
| | | | | | | | | | |
| | | | | | | | | 7,382,466 | |
| |
California – 0.2% | |
| Corona-Norca CA Unified School District GO Bonds Series E(AA-/Aa2)(b)(c) | |
| 450,000 | | | 0.000 | | | 08/01/26 | | | 516,393 | |
|
| University of California CA Revenue Bonds (Unrefunded-General) Series Q (AA/NR)(a) | |
| 235,000 | | | 5.250 | | | 05/15/22 | | | 235,764 | |
| | | | | | | | | | |
| | | | | | | | | 752,157 | |
| |
Colorado – 1.6% | |
| Colorado Educational & Cultural Facilities Authority Revenue Bonds (Charter School-High Point Academy) (A+/NR) | |
| 215,000 | | | 4.500 | | | 03/01/20 | | | 217,169 | |
|
| Colorado Springs CO Utilities System Revenue Bonds (Variable System Improvement) Series A (AA+/Aa2)(a)(d)(e) | |
| 4,900,000 | | | 1.120 | | | 11/01/41 | | | 4,900,000 | |
|
| Colorado State Board for Community Colleges & Occupational Educational System Revenue Bonds (Refunding-Arapahoe Community College – Castle Rock Collaboration Campus) Series A (NR/Aa3)(a) | |
| 450,000 | | | 4.000 | | | 11/01/31 | | | 513,693 | |
| 850,000 | | | 4.000 | | | 11/01/32 | | | 966,603 | |
| | | | | | | | | | |
| | | | | | | | | 6,597,465 | |
| |
Connecticut – 1.1% | |
| Connecticut State Health & Educational Facilities Authority Revenue Bonds (Refunding Fairfield University) SeriesS (A-/A3) | |
| 1,000,000 | | | 5.000 | | | 07/01/28 | | | 1,251,170 | |
| 1,000,000 | | | 5.000 | (a) | | 07/01/29 | | | 1,248,890 | |
|
| Connecticut State Higher Education Supplement Loan Authority Revenue Bonds (Chesla Loan Program) Series A (AMT) (NR/A1)(a) | |
| 750,000 | | | 3.250 | | | 11/15/24 | | | 778,913 | |
| 1,115,000 | | | 3.750 | | | 11/15/27 | | | 1,171,140 | |
| | | | | | | | | | |
| | | | | | | | | 4,450,113 | |
| |
Florida – 2.4% | |
| Florida State Housing Finance Corp. Revenue Bonds Series 1 (GNMA/FNMA/FHLMC) (NR/Aaa) | |
| 1,000,000 | | | 2.000 | | | 07/01/27 | | | 1,007,960 | |
| 925,000 | | | 2.050 | | | 01/01/28 | | | 933,196 | |
| 960,000 | | | 2.100 | | | 07/01/28 | | | 969,331 | |
| 975,000 | | | 2.125 | (a) | | 01/01/29 | | | 984,925 | |
| |
| | |
| 38 | | The accompanying notes are an integral part of these financial statements. |
COMMERCE NATIONALTAX-FREE INTERMEDIATE BOND FUND
| | | | | | | | | | | | |
Principal
Amount | | Interest
Rate | | | Maturity
Date | | | Value | |
|
| Municipal Bond Obligations – (continued) | |
Florida – (continued) | |
| Jupiter County FL (Community Center Project) GO Bonds Series 2001 (AAA/Aaa) | |
| $ 35,000 | | | 5.500 | % | | | 07/01/21 | | | $ | 36,683 | |
|
| Lake County FL School Board Certificates of Participation (Refunding-Master Lease Program) Series A (A/NR)(a) | |
| 725,000 | | | 5.000 | | | | 06/01/24 | | | | 808,839 | |
|
| Miami-Dade County FL Aviation Revenue Bonds (Miami International Airport) Series A (A/A2)(a) | |
| 1,000,000 | | | 5.000 | | | | 10/01/22 | | | | 1,035,050 | |
|
| Miami-Dade County FL Aviation Revenue Bonds (Prerefunded-Miami International Airport) SeriesA-1 (NR/NR)(a)(f) | |
| 240,000 | | | 5.500 | | | | 10/01/20 | | | | 249,403 | |
|
| Miami-Dade County FL Aviation Revenue Bonds (Unrefunded-Miami International Airport) SeriesA-1 (A/A2)(a)(f) | |
| 760,000 | | | 5.500 | | | | 10/01/20 | | | | 790,134 | |
|
| Miami-Dade County FL Educational Facilities Authority Revenue Bonds (Refunding-University of Miami) Series B (AMBAC)(A-/A3)(a) | |
| 685,000 | | | 5.250 | | | | 04/01/21 | | | | 721,545 | |
|
| Seminole County FL School Board Certificates of Participation Series B(AA-/Aa3)(a) | |
| 500,000 | | | 5.000 | | | | 07/01/24 | | | | 545,790 | |
|
| Tallahassee FL Health Facilities Revenue Bonds (Tallahassee Memorial Healthcare, Inc. Project) Series A (NR/Baa1) | |
| 260,000 | | | 5.000 | | | | 12/01/19 | | | | 260,668 | |
| 330,000 | | | 5.000 | | | | 12/01/20 | | | | 341,910 | |
|
| Tampa FL Health System Revenue Bonds Series A (NR/Aa3)(a)(f) | |
| 1,300,000 | | | 5.250 | | | | 05/15/20 | | | | 1,328,249 | |
| | | | | | | | | | | | |
| | | | | | | | | | | 10,013,683 | |
| |
Georgia – 0.3% | |
| Cherokee County GA Water & Sewer Authority Revenue Bonds (Refunding & Improvement) Series 1993 (NPFG) (NR/Aa2) | |
| 45,000 | | | 5.500 | | | | 08/01/23 | | | | 48,799 | |
|
| Fulton County GA Development Authority Revenue Bonds (Refunding-Robert W Woodruff Arts Center, Inc.) Series A (NR/A2) | |
| 1,000,000 | | | 5.000 | | | | 03/15/26 | | | | 1,210,210 | |
| | | | | | | | | | | | |
| | | | | | | | | | | 1,259,009 | |
| |
Illinois – 12.1% | |
| Champaign County IL Community Unit School District No. 4 GO Bonds (Refunding) Series 2019 (AA/Aa2) | |
| 630,000 | | | 4.000 | | | | 06/01/28 | | | | 746,651 | |
|
| Cook County IL Community High School District No. 234 Taxable GO Bonds (Ridgewood Build America Bonds – Direct Payment to Issuer) Series B (Assured Guaranty) (AA/A3)(a) | |
| 300,000 | | | 6.400 | | | | 12/01/28 | | | | 301,071 | |
|
| Cook County IL School District No. 111 Burbank GO Bonds (Refunding) Series 2018 (A+/NR)(a) | |
| 1,500,000 | | | 4.000 | | | | 12/01/37 | | | | 1,618,125 | |
| |
| | | | | | | | | | |
Principal
Amount | | Interest
Rate | | | Maturity
Date | | Value | |
|
| Municipal Bond Obligations – (continued) | |
Illinois – (continued) | |
| Cook County IL School District No. 63 East Maine GO Bonds (Refunding) Series 2019 (NR/Aa2)(a) | |
| $1,460,000 | | | 4.000 | % | | 12/01/34 | | $ | 1,616,892 | |
|
| Cook County IL Township High School District No. 208 Riverside-Brookfield GO Bonds (Refunding) Series B (AA+/NR) | |
| 1,090,000 | | | 5.000 | | | 12/15/25 | | | 1,298,462 | |
|
| Countryside IL GO Bonds (Taxable-Refunding) Series 2014 (NR/Aa2) | |
| 500,000 | | | 3.300 | | | 01/01/24 | | | 521,245 | |
|
| DeKalb, Kane & Lasalle Counties Community College District No. 523 GO Bonds Series A(AA-/NR)(a) | |
| 400,000 | | | 5.000 | | | 02/01/23 | | | 417,520 | |
|
| DeKalb, Kane & Lasalle Counties IL Community College District No. 523 GO Bonds Series B(AA-/NR)(a)(b) | |
| 1,235,000 | | | 0.000 | | | 02/01/23 | | | 1,085,886 | |
|
| Du Page & Cook County Community School District No. 181 GO Bonds (School Building) Series 2017 (AAA/Aaa)(a) | |
| 2,220,000 | | | 4.000 | | | 01/15/30 | | | 2,525,472 | |
|
| Du Page & Will County Community School District No. 204 Indian Prairie (Refunding) Series 2016 (NR/Aa1) | |
| 5,000,000 | | | 2.000 | | | 12/30/22 | | | 5,094,550 | |
|
| Elk Grove Village GO Bonds Series 2017 (AA+/NR) | |
| 530,000 | | | 3.000 | | | 01/01/24 | | | 561,641 | |
| 550,000 | | | 3.000 | | | 01/01/25 | | | 589,628 | |
| 1,140,000 | | | 5.000 | | | 01/01/26 | | | 1,368,901 | |
| 525,000 | | | 5.000 | (a) | | 01/01/28 | | | 637,665 | |
|
| Hoffman Estates IL GO Bonds (Taxable-Refunding) Series A (AA+/Aa3)(a) | |
| 1,200,000 | | | 4.200 | | | 12/01/25 | | | 1,306,620 | |
|
| Illinois Finance Authority Revenue Bonds (Poetry Foundation Project)(AA-/Aa2)(a) | |
| 470,000 | | | 4.850 | | | 01/01/26 | | | 472,562 | |
|
| Illinois Finance Authority Revenue Bonds (Refunding-Columbia College) (ETM) Series 2011 (NR/NR) | |
| 440,000 | | | 4.500 | | | 12/01/20 | | | 454,978 | |
|
| Illinois Finance Authority Revenue Bonds(Refunding-OSF Healthcare System) Series A (A/A3)(a) | |
| 1,000,000 | | | 4.000 | | | 11/15/33 | | | 1,077,370 | |
|
| Illinois Finance Authority Revenue Bonds (Refunding-Swedish Covenant) Series A (NR/NR)(a)(f) | |
| 1,210,000 | | | 5.500 | | | 02/15/20 | | | 1,224,568 | |
|
| Illinois State Finance Authority Revenue Bonds SubseriesC-1 (JP Morgan Chase Bank SPA) (AA/Aa3)(a)(d)(e) | |
| 2,500,000 | | | 1.180 | | | 11/01/38 | | | 2,500,000 | |
|
| Kane County IL Forest Preservation District GO Bonds Series A (AA+/NR)(a) | |
| 1,695,000 | | | 3.000 | | | 12/15/26 | | | 1,822,091 | |
|
| Lake County IL Community Consolidated School District No. 46 Grayslake GO Bonds (Refunding) Series 2015 (AA+/NR) | |
| 1,000,000 | | | 5.000 | | | 11/01/23 | | | 1,134,350 | |
| |
| | |
| The accompanying notes are an integral part of these financial statements. | | 39 |
COMMERCE NATIONALTAX-FREE INTERMEDIATE BOND FUND
Schedule of Investments(continued)
October 31, 2019
| | | | | | | | | | | | |
Principal
Amount | | Interest
Rate | | | Maturity
Date | | | Value | |
|
| Municipal Bond Obligations – (continued) | |
Illinois – (continued) | |
| Lake County IL Community Consolidated School District No. 73 Hawthorn GO Bonds (Refunding) Series B (AA+/NR)(a) | |
| $2,450,000 | | | 4.000 | % | | | 01/01/33 | | | $ | 2,737,017 | |
|
| Mount Prospect IL GO Bonds (Refunding) Series A (AA+/NR)(a) | |
| 1,000,000 | | | 3.000 | | | | 12/01/28 | | | | 1,055,160 | |
|
| Peoria IL GO Bonds (Refunding) Series B(AA-/A2) | |
| 1,205,000 | | | 5.000 | | | | 01/01/24 | | | | 1,357,613 | |
|
| Quad Cities IN Regional Economic Development Authority Revenue Bonds (Augustana College) Series 2012 (Refunding) (NR/Baa1)(a) | |
| 750,000 | | | 4.750 | | | | 10/01/32 | | | | 793,125 | |
|
| Rolling Meadows IL GO Bonds Series 2019 (AA+/NR)(a) | |
| 495,000 | | | 4.000 | | | | 12/15/34 | | | | 562,855 | |
| 515,000 | | | 4.000 | | | | 12/15/35 | | | | 585,205 | |
| 535,000 | | | 4.000 | | | | 12/15/36 | | | | 606,604 | |
| 555,000 | | | 4.000 | | | | 12/15/37 | | | | 626,312 | |
| 580,000 | | | 4.000 | | | | 12/15/38 | | | | 653,382 | |
| 600,000 | | | 4.000 | | | | 12/15/39 | | | | 674,244 | |
|
| Round Lake IL GO Bonds (Refunding) Series 2019 (NR/Aa2) | |
| 815,000 | | | 4.000 | | | | 01/01/24 | | | | 896,027 | |
| 765,000 | | | 4.000 | | | | 01/01/25 | | | | 854,283 | |
|
| Saint Clair County IL High School District No. 203 O’Fallon GO Bonds (Refunding) Series 2017 (NR/Aa2) | |
| 845,000 | | | 4.000 | | | | 12/01/23 | | | | 915,270 | |
| 685,000 | | | 4.000 | | | | 12/01/24 | | | | 753,959 | |
| 735,000 | | | 4.000 | | | | 12/01/25 | | | | 820,885 | |
|
| Will County IL Community Unit School District No. 365 Valley View GO Bonds (Prerefunded-Capital Appreciation) Series 2003 (AGM) (AA/Aa2)(b) | |
| 4,770,000 | | | 0.000 | | | | 11/01/23 | | | | 4,486,662 | |
|
| Winnebago County IL GO Bonds (Refunding) Series C (NR/Aa2) | |
| 765,000 | | | 5.000 | | | | 12/30/25 | | | | 909,646 | |
| 905,000 | | | 5.000 | | | | 12/30/28 | | | | 1,137,467 | |
| 960,000 | | | 5.000 | | | | 12/30/29 | | | | 1,223,606 | |
| | | | | | | | | | | | |
| | | | | | | | | | | 50,025,570 | |
| |
Indiana – 7.0% | |
| Carmel IN Local Public Improvement Bank Revenue Bonds SeriesB-1 (AA/NR)(a) | |
| 1,810,000 | | | 4.000 | | | | 01/15/34 | | | | 2,047,599 | |
| 1,000,000 | | | 4.000 | | | | 01/15/35 | | | | 1,128,640 | |
|
| Decatur Township IN Multi-School Building Corp. Revenue Bonds (Refunding-First Mortgage) (Multi Purpose) Series 2015 (AA+/NR) | |
| 2,315,000 | | | 5.000 | | | | 07/15/23 | | | | 2,621,946 | |
|
| Eastern Pulaski IN Multi-School Building Corp. Revenue Bonds (First Mortgage) Series 2015 (AA+/NR)(a) | |
| 840,000 | | | 4.000 | | | | 07/15/28 | | | | 916,213 | |
|
| Evansville IN Redevelopment Authority Revenue Bonds (Build America Bonds-Taxable) Series B (A/A2)(a) | |
| 675,000 | | | 6.050 | | | | 02/01/23 | | | | 695,284 | |
| |
| | | | | | | | | | | | |
Principal
Amount | | Interest
Rate | | | Maturity
Date | | | Value | |
|
| Municipal Bond Obligations – (continued) | |
Indiana – (continued) | |
| Greater Clark In Building Corp. Revenue bonds (1st Mortgage) Series 2018 (AA+/NR)(a) | |
| $1,000,000 | | | 4.000 | % | | | 07/15/32 | | | $ | 1,139,940 | |
|
| Indiana Finance Authority Revenue Bonds (Educational Facilities-Butler University Project) Series A(A-/NR)(a) | |
| 540,000 | | | 5.000 | | | | 02/01/25 | | | | 612,765 | |
| 425,000 | | | 5.000 | | | | 02/01/27 | | | | 480,467 | |
| 700,000 | | | 5.000 | | | | 02/01/28 | | | | 790,573 | |
| 600,000 | | | 5.000 | | | | 02/01/29 | | | | 676,950 | |
|
| Indiana Finance Authority Revenue Bonds (Variable-Ascension Health) Series E4 (AA+/Aa2)(a)(d)(e) | |
| 4,000,000 | | | 1.080 | | | | 11/15/36 | | | | 4,000,000 | |
|
| Indiana State Finance Authority Revenue Bond (Refunding-Educational Facilities-Indianapolis Museum of Art) Series B (NR/A2)(a) | |
| 815,000 | | | 5.000 | | | | 02/01/28 | | | | 895,228 | |
|
| Indiana State University Revenue Bonds (Build America Bonds) (NR/A1)(a) | |
| 530,000 | | | 5.310 | | | | 04/01/25 | | | | 535,141 | |
|
| Lake Central Multi-District School Building Corp. Revenue Bonds (Refunding-First Mortgage) Series B (AA+/NR) | |
| 1,000,000 | | | 5.000 | | | | 07/15/24 | | | | 1,153,920 | |
|
| Plainfield IN High School Building Corp. Revenue Bonds (Refunding-First Mortgage) Series 2014 (AA+/NR)(a) | |
| 1,000,000 | | | 4.000 | | | | 01/15/26 | | | | 1,110,100 | |
|
| Portage IN Redevelopment Authority Lease Rent Revenue Bonds Series 2015 (A/NR)(a) | |
| 1,665,000 | | | 4.000 | | | | 08/01/30 | | | | 1,825,572 | |
|
| Southmont IN School Building Corp. Revenue Bonds (First Mortgage) Series 2017 (AA+/NR)(a) | |
| 1,320,000 | | | 5.000 | | | | 07/15/32 | | | | 1,594,877 | |
|
| St. Joseph County IN Economic Development Revenue Bonds (Refunding Saint Marys College) Series 2017(A-/NR) | |
| 1,500,000 | | | 5.000 | | | | 04/01/27 | | | | 1,822,215 | |
|
| Upland IN Economic Development Revenue Bonds (Taylor University Project) (Refunding) Series 2012 (NR/Baa1)(a) | |
| 900,000 | | | 4.500 | | | | 09/01/32 | | | | 929,169 | |
|
| Vinton-Tecumseh IN School Building Corporation Revenue Bonds (First Mortgage) Series A (AA+/NR)(a) | |
| 625,000 | | | 5.000 | | | | 07/15/30 | | | | 764,169 | |
| 500,000 | | | 5.000 | | | | 07/15/31 | | | | 608,575 | |
| 500,000 | | | 5.000 | | | | 07/15/32 | | | | 606,055 | |
|
| Westfield High School 1995 Building Corp. Revenue Bonds (1st Mortgage) Series B (A/NR)(a) | |
| 1,000,000 | | | 5.000 | | | | 01/15/31 | | | | 1,165,850 | |
| 750,000 | | | 5.000 | | | | 07/15/31 | | | | 873,945 | |
| | | | | | | | | | | | |
| | | | | | | | | | | 28,995,193 | |
| |
Iowa(a)(d)(e) – 0.2% | |
| Iowa State Finance Authority Single Family Revenue Bonds Series B (GNMA/FNMA/FHLMC) (AAA/Aaa) | |
| 1,000,000 | | | 1.090 | | | | 07/01/47 | | | | 1,000,000 | |
| |
| | |
| 40 | | The accompanying notes are an integral part of these financial statements. |
COMMERCE NATIONALTAX-FREE INTERMEDIATE BOND FUND
| | | | | | | | | | | | |
Principal
Amount | | Interest
Rate | | | Maturity
Date | | | Value | |
|
| Municipal Bond Obligations – (continued) | |
Kansas(a) – 1.9% | |
| Geary County KS Unified School District No. 475 GO Bonds Series A (NR/Aa2) | |
| $ 700,000 | | | 4.000 | % | | | 09/01/33 | | | $ | 775,831 | |
| 700,000 | | | 4.000 | | | | 09/01/34 | | | | 774,095 | |
|
| Lawrence KS Hospital Revenue Bonds (Refunding) (Lawrence Memorial Hospital) Series A (A/NR) | |
| 1,500,000 | | | 4.000 | | | | 07/01/36 | | | | 1,648,350 | |
|
| Scott County KS Unified School District No. 466 GO Bonds Series A (NR/A2) | |
| 1,015,000 | | | 5.000 | | | | 09/01/30 | | | | 1,194,543 | |
| 910,000 | | | 5.000 | | | | 09/01/34 | | | | 1,064,746 | |
|
| Wichita KS Sales Tax Special Obligation Revenue Bonds (River District Stadium Star Bond Project) Series 2018 (NR/Aa3) | |
| 1,000,000 | | | 5.000 | | | | 09/01/30 | | | | 1,231,880 | |
| 1,000,000 | | | 5.000 | | | | 09/01/31 | | | | 1,228,240 | |
| | | | | | | | | | | | |
| | | | | | | | | | | 7,917,685 | |
| |
Kentucky – 2.5% | |
| Barren County KY School District Finance Corp. Revenue Bonds (Refunding) Series 2015 (NR/A1)(a) | |
| 1,000,000 | | | 5.000 | | | | 08/01/26 | | | | 1,166,530 | |
|
| Kentucky State Property & Building Commission Revenue Bonds (Project No. 112) Series B(A-/A1)(a) | |
| 400,000 | | | 5.000 | | | | 11/01/27 | | | | 480,436 | |
|
| Kentucky State Property & Building Commission Revenue Bonds (Project No. 117) Series B (NR/A1) | |
| 1,000,000 | | | 5.000 | | | | 05/01/26 | | | | 1,197,910 | |
| 750,000 | | | 5.000 | (a) | | | 05/01/28 | | | | 907,628 | |
| 915,000 | | | 5.000 | (a) | | | 05/01/29 | | | | 1,101,550 | |
|
| Kentucky State Property & Building Commission Revenue Bonds (Project No. 117) Series D (NR/A1) | |
| 750,000 | | | 5.000 | | | | 05/01/27 | | | | 912,525 | |
|
| Oldham County KY School District Finance Corp. (Refunding) Series 2016 (NR/A1) | |
| 545,000 | | | 5.000 | | | | 06/01/20 | | | | 556,162 | |
| 595,000 | | | 5.000 | | | | 06/01/21 | | | | 628,147 | |
| 590,000 | | | 5.000 | | | | 06/01/22 | | | | 643,973 | |
| 610,000 | | | 5.000 | | | | 06/01/23 | | | | 685,585 | |
| 690,000 | | | 5.000 | | | | 06/01/24 | | | | 796,226 | |
|
| Owensboro KY GO Bonds Series A (NR/A1)(a) | |
| 1,200,000 | | | 5.000 | | | | 05/01/25 | | | | 1,341,468 | |
| | | | | | | | | | | | |
| | | | | | | | | | | 10,418,140 | |
| |
Louisiana – 3.9% | |
| Iberia Parish LA Parish wide School District GO Bonds Series 2017(AA-/NR) | |
| 510,000 | | | 3.000 | | | | 03/01/24 | | | | 542,405 | |
| 530,000 | | | 4.000 | | | | 03/01/25 | | | | 595,943 | |
| 550,000 | | | 4.000 | | | | 03/01/26 | | | | 627,369 | |
| 570,000 | | | 4.000 | | | | 03/01/27 | | | | 658,852 | |
| 450,000 | | | 4.000 | (a) | | | 03/01/28 | | | | 516,303 | |
| |
| | | | | | | | | | | | |
Principal
Amount | | Interest
Rate | | | Maturity
Date | | | Value | |
|
| Municipal Bond Obligations – (continued) | |
Louisiana – (continued) | |
| Louisiana Local Government Environmental Facilities Community Development Authority Revenue Bonds (Woman’s Hospital Foundation) Series A (NR/A2)(a)(f) | |
| $5,000,000 | | | 5.500 | % | | | 10/01/20 | | | $ | 5,195,900 | |
|
| Louisiana Public Facilities Authority Revenue Bonds (Loyola University) Series 2011 (NR/#Aaa)(a)(f) | |
| 3,715,000 | | | 5.250 | | | | 10/01/21 | | | | 4,004,584 | |
|
| Louisiana Public Facilities Authority Revenue Bonds (Refunding-Ochsner Clinic Foundation Project) Series 2015 (NR/A3)(a) | |
| 800,000 | | | 5.000 | | | | 05/15/30 | | | | 921,592 | |
|
| Louisiana State GO Bonds Series A(AA-/Aa3)(a) | |
| 1,655,000 | | | 4.000 | | | | 04/01/35 | | | | 1,853,550 | |
|
| St. Tammany LA Parish Wide School District No 12 GO Bonds (Refunding) Series 2017 (AA/NR)(a) | |
| 980,000 | | | 4.000 | | | | 03/01/28 | | | | 1,133,850 | |
| | | | | | | | | | | | |
| | | | | | | | | | | 16,050,348 | |
| |
Maine – 3.4% | |
| Maine State Governmental Facilities Authority Revenue Bonds Series A(AA-/Aa3)(a) | |
| 2,485,000 | | | 4.000 | | | | 10/01/32 | | | | 2,849,177 | |
|
| Maine State Health & Higher Educational Facilities Authority Revenue Bonds (Refunding) Series B (NR/A1)(a) | |
| 1,000,000 | | | 4.000 | | | | 07/01/33 | | | | 1,121,410 | |
|
| Maine State Health & Higher Educational Facilities Authority Revenue Bonds Series A (A+/A1)(a) | |
| 1,000,000 | | | 5.000 | | | | 07/01/35 | | | | 1,216,680 | |
|
| Maine State Health & Higher Educational Facilities Authority Revenue Bonds Series A (NR/A1)(a) | |
| 1,000,000 | | | 5.000 | | | | 07/01/24 | | | | 1,059,120 | |
|
| Maine State Housing Authority Mortgage Purchase Revenue Bonds Series B (AA+/Aa1) | |
| 1,300,000 | | | 1.950 | | | | 11/15/24 | | | | 1,322,672 | |
| 835,000 | | | 2.050 | | | | 11/15/25 | | | | 851,792 | |
| 1,000,000 | | | 2.100 | | | | 11/15/26 | | | | 1,020,490 | |
|
| Maine State Housing Authority Mortgage Purchase Revenue Bonds Series E (AA+/Aa1)(a) | |
| 840,000 | | | 2.150 | | | | 11/15/29 | | | | 837,018 | |
| 870,000 | | | 2.250 | | | | 11/15/30 | | | | 866,433 | |
| 905,000 | | | 2.350 | | | | 11/15/31 | | | | 902,059 | |
|
| Portland ME Airport Revenue Bonds (Refunding-General) Series 2016(A-/Baa1) | |
| 500,000 | | | 5.000 | | | | 01/01/22 | | | | 536,350 | |
| 145,000 | | | 5.000 | | | | 01/01/23 | | | | 159,814 | |
| 470,000 | | | 5.000 | | | | 01/01/24 | | | | 532,345 | |
| 215,000 | | | 5.000 | (a) | | | 01/01/34 | | | | 247,491 | |
| 330,000 | | | 5.000 | (a) | | | 01/01/35 | | | | 379,167 | |
| | | | | | | | | | | | |
| | | | | | | | | | | 13,902,018 | |
| |
Maryland(a) – 0.5% | |
| Maryland State Water Quality Financing Administration Bay Restoration Fund Revenue Bonds Series 2015 (AA/Aa2) | |
| 2,000,000 | | | 2.800 | | | | 03/01/26 | | | | 2,111,160 | |
| |
| | |
| The accompanying notes are an integral part of these financial statements. | | 41 |
COMMERCE NATIONALTAX-FREE INTERMEDIATE BOND FUND
Schedule of Investments(continued)
October 31, 2019
| | | | | | | | | | | | |
Principal
Amount | | Interest
Rate | | | Maturity
Date | | | Value | |
|
| Municipal Bond Obligations – (continued) | |
Massachusetts – 1.1% | |
| Massachusetts Educational Financing Authority Education Loan Revenue Bonds (Issue I) Series A (AA/NR)(a) | |
| $ 310,000 | | | 5.100 | % | | | 01/01/25 | | | $ | 311,934 | |
|
| Massachusetts Educational Financing Authority Revenue Bonds Series J (AMT) (AA/NR)(a) | |
| 495,000 | | | 4.250 | | | | 07/01/22 | | | | 510,083 | |
|
| Massachusetts State Health & Educational Facilities Authority Revenue Bonds Series 1997(AA-/Aa3)(a)(d)(e) | |
| 2,500,000 | | | 1.130 | | | | 07/01/27 | | | | 2,500,000 | |
|
| Massachusetts State Housing Finance Agency Revenue Bonds Series B (AMT) (AA/Aa2) | |
| 310,000 | | | 2.500 | | | | 12/01/20 | | | | 312,269 | |
| 300,000 | | | 2.700 | | | | 06/01/21 | | | | 303,930 | |
| 305,000 | | | 3.050 | | | | 06/01/22 | | | | 314,071 | |
| 315,000 | | | 3.250 | | | | 06/01/23 | | | | 329,276 | |
| | | | | | | | | | | | |
| | | | | | | | | | | 4,581,563 | |
| |
Michigan – 7.6% | |
| Comstock Park MI Public Schools GO Bonds (Refunding) Series 2015(Q-SBLF) (AA/NR) | |
| 730,000 | | | 5.000 | | | | 05/01/24 | | | | 844,274 | |
|
| Grand Traverse County MI Hospital Finance Authority Revenue Bonds (Munson Healthcare Obligated Group) Series A (NR/A1)(a) | |
| 445,000 | | | 5.000 | | | | 07/01/30 | | | | 544,854 | |
| 495,000 | | | 5.000 | | | | 07/01/32 | | | | 597,663 | |
|
| Grand Traverse County MI Hospital Finance Authority Revenue Bonds (Munson Healthcare Obligated Group) Series B (NR/A1)(a) | |
| 380,000 | | | 5.000 | | | | 07/01/31 | | | | 461,240 | |
|
| Grand Valley MI State University Revenue Bonds (Refunding) Series A (A+/A1)(a) | |
| 1,500,000 | | | 4.000 | | | | 12/01/29 | | | | 1,689,600 | |
| 1,375,000 | | | 4.000 | | | | 12/01/30 | | | | 1,533,400 | |
|
| Jackson College MI GO Bonds (Refunding) Series 2016 (NR/Aa2) | |
| 940,000 | | | 3.000 | | | | 05/01/25 | | | | 1,009,400 | |
|
| Jenison MI Public Schools GO Bonds (Refunding) Series 2017 (NR/Aa3) | |
| 1,110,000 | | | 4.000 | | | | 05/01/23 | | | | 1,214,751 | |
|
| Kalamazoo MI Public Schools GO Bonds Series 2018 (NR/Aa3)(a) | |
| 2,370,000 | | | 4.000 | | | | 05/01/31 | | | | 2,732,515 | |
|
| Kenowa Hills MI Public School GO Bonds (School Building & Site) Series II(Q-SBLF) (AA/NR)(a) | |
| 1,000,000 | | | 4.000 | | | | 11/01/30 | | | | 1,163,060 | |
|
| Mattawan MI Consolidated School District GO Bonds Series I(Q-SBLF) (AA/NR)(a) | |
| 750,000 | | | 5.000 | | | | 05/01/26 | | | | 886,987 | |
|
| Michigan State Building Authority Revenue Bonds (Refunding) Series I(AA-/Aa2)(a) | |
| 1,300,000 | | | 4.000 | | | | 10/15/36 | | | | 1,439,295 | |
| |
| | | | | | | | | | | | |
Principal
Amount | | Interest
Rate | | | Maturity
Date | | | Value | |
|
| Municipal Bond Obligations – (continued) | |
Michigan – (continued) | |
| Michigan State Finance Authority Limited Obligation Revenue Bonds (Refunding) (Kalamazoo College Project) Series 2018 (NR/A1)(a) | |
| $1,590,000 | | | 4.000 | % | | | 12/01/36 | | | $ | 1,778,860 | |
|
| Michigan State Housing Development Authority Revenue Bond Series B (AA+/Aa2)(a) | |
| 1,750,000 | | | 3.000 | | | | 06/01/29 | | | | 1,848,735 | |
|
| Michigan State Housing Development Authority Revenue Bonds (Taxable-Refunding) Series B (AA/NR) | |
| 500,000 | | | 2.816 | | | | 04/01/25 | | | | 517,345 | |
| 1,000,000 | | | 2.866 | | | | 10/01/25 | | | | 1,038,660 | |
|
| Michigan State Housing Development Authority Revenue Bonds Series A (AA/NR) | |
| 400,000 | | | 2.150 | | | | 04/01/25 | | | | 409,088 | |
| 470,000 | | | 2.550 | (a) | | | 04/01/28 | | | | 479,203 | |
| 410,000 | | | 2.600 | (a) | | | 10/01/28 | | | | 418,352 | |
|
| Michigan State University Revenue Bonds Series A (SPA – Royal Bank of Canada) (AA/Aa2)(a)(d)(e) | |
| 5,000,000 | | | 1.160 | | | | 08/15/30 | | | | 5,000,000 | |
|
| Northwest Community Schools GO Bonds (School Building & Site) Series 2013(Q-SBLF) (AA/NR)(a) | |
| 1,000,000 | | | 4.000 | | | | 05/01/24 | | | | 1,089,280 | |
|
| Portland MI Public Schools GO Bonds (Refunding) Series 2016(Q-SBLF) (AA/NR)(a) | |
| 1,150,000 | | | 4.000 | | | | 05/01/27 | | | | 1,308,527 | |
|
| Saginaw Township MI Community School District (Refunding) Series 2015(Q-SBLF) (NR/Aa1)(a) | |
| 750,000 | | | 4.000 | | | | 05/01/28 | | | | 852,968 | |
|
| Washtenaw MI Community College GO Bonds (Refunding) Series 2015 (NR/Aa1) | |
| 645,000 | | | 4.000 | | | | 04/01/25 | | | | 732,830 | |
|
| Wayne County MI State University Revenue Bonds (Prerefunded-Refunding-General) Series A (A+/Aa3)(a) | |
| 875,000 | | | 5.000 | | | | 11/15/24 | | | | 876,032 | |
|
| Wayne County MI State University Revenue Bonds (Prerefunded-Refunding-General) Series A (NR/NR)(a)(f) | |
| 795,000 | | | 5.000 | | | | 11/15/19 | | | | 795,922 | |
| | | | | | | | | | | | |
| | | | | | | | | | | 31,262,841 | |
| |
Minnesota – 0.1% | |
| Minnesota State Municipal Power Agency Electric Revenue Bonds(Refunding) Series 2014 (NR/A1) | |
| 500,000 | | | 4.000 | | | | 10/01/21 | | | | 526,235 | |
| |
Mississippi(a) – 1.4% | |
| Alcorn State University Educational Building Corp. (Refunding-Facilities)(Re-Financing Project) Series 2016 (NR/Aa2) | |
| 1,560,000 | | | 4.000 | | | | 09/01/33 | | | | 1,756,076 | |
|
| Mississippi State Development Bank Special Obligation (Pearl Public School District) Series 2016 (NR/Aa3) | |
| 600,000 | | | 4.000 | | | | 04/01/34 | | | | 661,656 | |
| |
| | |
| 42 | | The accompanying notes are an integral part of these financial statements. |
COMMERCE NATIONALTAX-FREE INTERMEDIATE BOND FUND
| | | | | | | | | | | | |
Principal
Amount | | Interest
Rate | | | Maturity
Date | | | Value | |
|
| Municipal Bond Obligations – (continued) | |
Mississippi(a) – (continued) | |
| Mississippi State Development Bank Special Obligation (Vicksburg Warren School District) Series 2018 (A+/NR) | |
| $ 490,000 | | | 5.250 | % | | | 03/01/34 | | | $ | 603,739 | |
| 810,000 | | | 5.250 | | | | 03/01/36 | | | | 992,939 | |
|
| Mississippi State Development Bank Special Obligation Revenue Bonds (Hinds County Project) Series 2017 (NR/Aa3) | |
| 300,000 | | | 5.000 | | | | 11/01/29 | | | | 369,990 | |
| 400,000 | | | 5.000 | | | | 11/01/30 | | | | 489,524 | |
| 500,000 | | | 5.000 | | | | 11/01/31 | | | | 610,720 | |
| 400,000 | | | 5.000 | | | | 11/01/32 | | | | 486,424 | |
| | | | | | | | | | | | |
| | | | | | | | | | | 5,971,068 | |
| |
Missouri – 0.7% | |
| Greene County MO GO Bonds Limited-Wilson Creek Marketplace NID Project (Refunding) Series A (NR/Aa2)(a)(f) | |
| 500,000 | | | 5.000 | | | | 04/01/22 | | | | 546,090 | |
|
| Joplin Industrial Development Authority Health Facilities Revenue Bonds (Freeman Health Systems ) Series 2011 (A/NR) | |
| 1,010,000 | | | 4.250 | | | | 02/15/21 | | | | 1,031,675 | |
|
| Kansas City MO Industrial Development Authority Apartments Special Obligation Revenue Bonds(Kansas City International Apartments Terminal Modified Project) Series B (A/A2) | |
| 1,155,000 | | | 5.000 | | | | 03/01/27 | | | | 1,400,033 | |
| | | | | | | | | | | | |
| | | | | | | | | | | 2,977,798 | |
| |
Montana(a) – 0.2% | |
| Yellowstone County MT School District No. 26 GO Bonds Series 2018 (A/NR) | |
| 600,000 | | | 5.000 | | | | 07/01/38 | | | | 732,408 | |
| |
Nebraska – 0.8% | |
| Douglas County NE Hospital Authority No. 2 Revenue Bonds (Health Facilities-Children’s Hospital Obligation Group) Series 2017 (NR/A1)(a) | |
| 1,000,000 | | | 5.000 | | | | 11/15/34 | | | | 1,200,320 | |
|
| Nebraska Public Power Generation Agency Revenue Bonds (Refunding) (Whelan Energy Center Unit 2) Series A (NR/A2) | |
| 1,750,000 | | | 5.000 | | | | 01/01/23 | | | | 1,941,363 | |
|
| Sarpy County NE Hospital Authority No.1 Revenue Bonds (Refunding-Nebraska Medicine) Series 2016(AA-/NR)(a) | |
| 35,000 | | | 3.000 | | | | 05/15/46 | | | | 35,211 | |
| | | | | | | | | | | | |
| | | | | | | | | | | 3,176,894 | |
| |
Nevada – 1.2% | |
| Clark County NV School District GO Bonds (Refunding) Series C (AGM) (AA/A1) | |
| 4,010,000 | | | 5.000 | | | | 06/15/27 | | | | 4,928,090 | |
| |
New Jersey – 3.7% | |
| Middlesex County NJ Cops Certificates of Participation (Refunding) Series 2017 (AA+/NR) | |
| 705,000 | | | 4.000 | | | | 06/15/26 | | | | 811,765 | |
| 500,000 | | | 4.000 | | | | 06/15/27 | | | | 580,945 | |
| 500,000 | | | 4.000 | (a) | | | 06/15/28 | | | | 579,665 | |
| 760,000 | | | 4.000 | (a) | | | 06/15/29 | | | | 876,744 | |
| |
| | | | | | | | | | | | |
Principal
Amount | | Interest
Rate | | | Maturity
Date | | | Value | |
|
| Municipal Bond Obligations – (continued) | |
New Jersey – (continued) | |
| New Jersey Housing & Mortgage Finance Agency MF Conduit Revenue Bonds (Lexington Manor Apartments Project) Series B (NR/Aaa) | |
| $ 785,000 | | | 3.150 | % | | | 06/15/25 | | | $ | 820,262 | |
|
| New Jersey State Higher Education Assistance Authority Student Loan Revenue Bonds (Refunding) Series 1A (AA/Aaa)(a) | |
| 890,000 | | | 4.750 | | | | 12/01/23 | | | | 892,287 | |
|
| New Jersey State Transportation Trust Fund Authority Revenue Bonds (Capital Appreciation) Transportation System Series 2006 (AMBAC) (AA+/Aa1)(b) | |
| 1,255,000 | | | 0.000 | | | | 12/15/26 | | | | 1,087,558 | |
|
| Passaic County NJ GO Bonds (Refunding-Taxable Pension) Series 2003 (AGM) (NR/Aa1) | |
| 65,000 | | | 5.750 | | | | 02/15/21 | | | | 67,263 | |
|
| Union City NJ GO Bonds (Refunding) Series 2017 (NR/Baa1) | |
| 1,575,000 | | | 5.000 | | | | 11/01/20 | | | | 1,628,109 | |
| 1,830,000 | | | 5.000 | | | | 11/01/22 | | | | 2,012,597 | |
|
| Ventnor City NJ GO Bonds (Refunding) Series 2017 (AA/NR) | |
| 1,470,000 | | | 4.000 | | | | 12/01/22 | | | | 1,589,996 | |
| 1,530,000 | | | 4.000 | | | | 12/01/23 | | | �� | 1,692,746 | |
| 690,000 | | | 4.000 | | | | 12/01/26 | | | | 803,319 | |
| 705,000 | | | 4.000 | | | | 12/01/27 | | | | 828,735 | |
| 730,000 | | | 4.000 | (a) | | | 12/01/28 | | | | 851,370 | |
| | | | | | | | | | | | |
| | | | | | | | | | | 15,123,361 | |
| |
New Mexico(a) – 1.2% | |
| Las Cruces NM Joint Utility Revenue Bonds (Subordinate Line System Improvement) Series 2018 (NR/Aa3) | |
| 845,000 | | | 4.000 | | | | 06/01/29 | | | | 956,058 | |
| 500,000 | | | 4.000 | | | | 06/01/30 | | | | 563,295 | |
| 1,000,000 | | | 4.000 | | | | 06/01/32 | | | | 1,113,780 | |
| 500,000 | | | 4.000 | | | | 06/01/33 | | | | 555,725 | |
|
| University of New Mexico NM Revenue Bonds (Refunding & Improvement-Subordinate Lien) Series A(AA-/Aa3) | |
| 1,685,000 | | | 2.250 | | | | 06/01/27 | | | | 1,727,631 | |
| | | | | | | | | | | | |
| | | | | | | | | | | 4,916,489 | |
| |
New York(a) – 1.4% | |
| Monroe Country NY Development Corp. Revenue Bonds (Refunding John Fisher College) Series A(A-/NR) | |
| 500,000 | | | 5.000 | | | | 06/01/29 | | | | 570,045 | |
|
| New York City Housing Development Corp. Revenue Bonds (Multi Family Development) Series G (AA+/Aa2) | |
| 250,000 | | | 3.800 | | | | 11/01/37 | | | | 255,707 | |
|
| New York City Water & Sewer System Revenue Bonds (Second Generation) Series CC (AA+/Aa1)(d)(e) | |
| 5,000,000 | | | 1.110 | | | | 06/15/41 | | | | 5,000,000 | |
| | | | | | | | | | | | |
| | | | | | | | | | | 5,825,752 | |
| |
| | |
| The accompanying notes are an integral part of these financial statements. | | 43 |
COMMERCE NATIONALTAX-FREE INTERMEDIATE BOND FUND
Schedule of Investments(continued)
October 31, 2019
| | | | | | | | | | | | |
Principal
Amount | | Interest
Rate | | | Maturity
Date | | | Value | |
|
| Municipal Bond Obligations – (continued) | |
North Carolina – 1.1% | |
| North Carolina State Housing Finance Agency Homeownership Revenue Bonds Series39-B (GNMA/FNMA/FHLMC) (AA+/Aa1)(a) | |
| $1,220,000 | | | 3.200 | % | | | 01/01/29 | | | $ | 1,313,904 | |
|
| North Carolina State Medical Care Commission Revenue Bonds(Refunding-NC Baptist Hospital) (A/A2)(a) | |
| 1,190,000 | | | 5.000 | | | | 06/01/22 | | | | 1,215,478 | |
|
| Western Carolina University Revenue Bonds (Refunding-Limited Obligation-Student Housing) (A/NR) | |
| 200,000 | | | 2.000 | | | | 06/01/20 | | | | 200,878 | |
| 420,000 | | | 3.000 | | | | 06/01/21 | | | | 431,558 | |
| 330,000 | | | 4.000 | | | | 06/01/22 | | | | 351,090 | |
| 350,000 | | | 4.000 | | | | 06/01/23 | | | | 380,195 | |
| 480,000 | | | 4.000 | (a) | | | 06/01/25 | | | | 520,862 | |
| | | | | | | | | | | | |
| | | | | | | | | | | 4,413,965 | |
| |
Ohio – 6.3% | |
| Akron OH Certificates of Participation (District Energy Project) Series 2018 (A+/NR)(a) | |
| 885,000 | | | 4.000 | | | | 12/01/29 | | | | 988,669 | |
| 960,000 | | | 4.000 | | | | 12/01/31 | | | | 1,061,818 | |
|
| Akron OH Certificates of Participation (Refunding-Municipal Baseball Stadium Project) Series 2013 (A+/NR)(a) | |
| 660,000 | | | 3.000 | | | | 12/01/19 | | | | 660,429 | |
|
| Akron OH GO Bonds (Refunding)(AA-/NR)(a) | |
| 545,000 | | | 5.000 | | | | 12/01/26 | | | | 637,263 | |
|
| Elyria OH Library Improvement Revenue Bonds Series 2018 (A+/NR)(a) | |
| 1,060,000 | | | 4.000 | | | | 12/01/34 | | | | 1,175,519 | |
|
| Licking Heights OH Local School District GO Bonds (Refunding) Series C (NR/A1) | |
| 765,000 | | | 5.000 | | | | 10/01/27 | | | | 949,862 | |
| 1,115,000 | | | 5.000 | (a) | | | 10/01/28 | | | | 1,375,051 | |
|
| Mahoning County OH Career & Technical Center Board of Education Certificates of Participation (Refunding) Series 2017(AA-/NR)(a) | |
| 630,000 | | | 4.000 | | | | 12/01/26 | | | | 702,734 | |
| 650,000 | | | 4.000 | | | | 12/01/27 | | | | 721,461 | |
| 665,000 | | | 4.000 | | | | 12/01/28 | | | | 736,321 | |
| 500,000 | | | 4.000 | | | | 12/01/29 | | | | 551,770 | |
|
| Miami Valley Career Technology Center OH GO Bonds Series 2018 (NR/Aa2)(a) | |
| 725,000 | | | 4.000 | | | | 12/01/34 | | | | 828,255 | |
| 2,245,000 | | | 4.000 | | | | 12/01/36 | | | | 2,550,365 | |
| 2,170,000 | | | 4.000 | | | | 12/01/37 | | | | 2,455,767 | |
|
| Middletown OH GO Bonds (Refunding-Various Purpose) Series 2017 (NR/A1) | |
| 1,095,000 | | | 4.000 | | | | 12/01/25 | | | | 1,256,753 | |
| 1,045,000 | | | 5.000 | | | | 12/01/27 | | | | 1,312,436 | |
|
| Ohio State Higher Educational Facility Commission Revenue Bonds (Xavier University-Refunding) Series C(A-/A3)(a) | |
| 1,000,000 | | | 5.000 | | | | 05/01/27 | | | | 1,158,630 | |
| 1,000,000 | | | 5.000 | | | | 05/01/28 | | | | 1,155,810 | |
| 750,000 | | | 5.000 | | | | 05/01/29 | | | | 862,665 | |
| |
| | | | | | | | | | | | |
Principal
Amount | | Interest
Rate | | | Maturity
Date | | | Value | |
|
| Municipal Bond Obligations – (continued) | |
Ohio – (continued) | |
| Ohio State Water Development Authority Water Pollution Control Revenue Bonds (Loan Fund) Series A (AAA/Aaa)(a)(d)(e) | |
| $4,225,000 | | | 1.090 | % | | | 12/01/36 | | | $ | 4,225,000 | |
|
| University of Toledo OH Revenue Bonds (Refunding-General Receipt) Series A (A/A1)(a) | |
| 700,000 | | | 4.000 | | | | 06/01/36 | | | | 778,813 | |
| | | | | | | | | | | | |
| | | | | | | | | | | 26,145,391 | |
| |
Oklahoma – 1.7% | |
| Leflore County OK Public Facility Authority Educational Facility Lease Revenue Bonds (Poteau Public School Project) Series 2019(A-/NR) | |
| 1,350,000 | | | 4.000 | | | | 12/01/28 | | | | 1,576,678 | |
| 1,795,000 | | | 4.000 | (a) | | | 12/01/30 | | | | 2,090,134 | |
|
| McClain County OK Economic Development Authority Educational Facilities Lease Revenue Bonds (Purcell Public Schools Project) Series 2018 (A/NR)(a) | |
| 1,000,000 | | | 5.000 | | | | 09/01/31 | | | | 1,232,220 | |
|
| Oklahoma State Capitol Improvement Authority Facility Revenue Bonds (Department of Correction) Series D(AA-/NR)(a) | |
| 2,000,000 | | | 4.000 | | | | 07/01/38 | | | | 2,259,140 | |
| | | | | | | | | | | | |
| | | | | | | | | | | 7,158,172 | |
| |
Pennsylvania – 10.3% | |
| Brandywine Heights PA Area School District GO Bonds (Refunding) Series A(AA-/NR) | |
| 1,650,000 | | | 5.000 | | | | 02/01/26 | | | | 1,977,310 | |
|
| Brandywine Heights PA Area School District GO Bonds (Refunding) Series B(AA-/NR) | |
| 1,365,000 | | | 4.000 | | | | 02/01/23 | | | | 1,473,613 | |
|
| Butler County PA Hospital Authority Revenue Bonds (Refunding) Series 2015 (NR/Baa1) | |
| 500,000 | | | 5.000 | | | | 07/01/25 | | | | 584,075 | |
| 450,000 | | | 5.000 | (a) | | | 07/01/26 | | | | 522,333 | |
| 490,000 | | | 5.000 | (a) | | | 07/01/27 | | | | 567,567 | |
|
| Centre County PA Hospital Authority Revenue Bonds (Refunding Hospital Mount Nittany Medical Center Project) Series A (A+/NR) | |
| 1,000,000 | | | 5.000 | | | | 11/15/26 | | | | 1,209,810 | |
|
| Columbia Borough PA School District GO Bonds (Refunding) Series 2019 (A+/NR)(g) | |
| 1,500,000 | | | 4.000 | | | | 02/15/22 | | | | 1,582,545 | |
| 1,790,000 | | | 4.000 | | | | 02/15/23 | | | | 1,929,441 | |
|
| Delaware County PA Authority University Revenue Bonds (Neumann University) (BBB/NR)(a) | |
| 1,250,000 | | | 5.250 | | | | 10/01/31 | | | | 1,282,525 | |
|
| Delaware Valley PA Regional Financial Authority Revenue Bonds Series A(CNTY-GTD) (A+/A1) | |
| 2,100,000 | | | 5.000 | | | | 09/01/33 | | | | 2,783,130 | |
|
| Pennsylvania State Housing Finance Agency SF Mortgage Revenue Bonds Series 130A (AA+/Aa2)(a) | |
| 795,000 | | | 2.100 | | | | 10/01/30 | | | | 782,415 | |
| |
| | |
| 44 | | The accompanying notes are an integral part of these financial statements. |
COMMERCE NATIONALTAX-FREE INTERMEDIATE BOND FUND
| | | | | | | | | | | | |
Principal
Amount | | Interest
Rate | | | Maturity
Date | | | Value | |
|
| Municipal Bond Obligations – (continued) | |
Pennsylvania – (continued) | |
| Pennsylvania State Turnpike Commission Turnpike Revenue Bonds (Refunding-Subordinated) Series B (NR/A3)(a) | |
| $1,500,000 | | | 5.000 | % | | | 06/01/29 | | | $ | 1,784,445 | |
|
| Pennsylvania State Turnpike Commission Turnpike Revenue Bonds SeriesA-2 (NR/A1)(a) | |
| 3,000,000 | | | 5.000 | | | | 12/01/35 | | | | 3,726,750 | |
|
| Pennsylvania State Turnpike Commission Turnpike Revenue Bonds Series C (A+/A1)(a) | |
| 500,000 | | | 5.000 | | | | 12/01/26 | | | | 587,635 | |
|
| Peters Township PA School District Washington County GO Bonds Series C (NR/Aa2)(a) | |
| 1,000,000 | | | 4.000 | | | | 09/01/36 | | | | 1,150,010 | |
|
| Philadelphia PA Authority for Industrial Development Pension Funding Revenue Bonds (Zero Coupon-Retirement) Series 1999 (AGM/AMBAC) (AA/A2)(b) | |
| 5,000,000 | | | 0.000 | | | | 04/15/20 | | | | 4,959,350 | |
|
| Plum Boro PA Municipal Authority Sewer Revenue Bonds (Refunding) Series C (AA/NR) | |
| 1,175,000 | | | 3.000 | | | | 11/15/27 | | | | 1,277,636 | |
|
| Salisbury Township PA School District GO Bonds Series A (AA/NR)(a) | |
| 1,390,000 | | | 4.000 | | | | 02/15/27 | | | | 1,551,310 | |
|
| Scranton PA School District GO Bonds (Refunding) Series E (AA/A2)(a) | |
| 1,000,000 | | | 5.000 | | | | 12/01/32 | | | | 1,206,350 | |
|
| Southcentral PA General Authority Revenue Bond (AICUP Financing Program-York College Of Pennsylvania Project) Series PP4(A-/NR)(a) | |
| 915,000 | | | 5.000 | | | | 11/01/31 | | | | 1,097,131 | |
|
| State Public School Building Authority Revenue Bonds (Refunding-Montgomery County Community College) (NR/A1)(a) | |
| 1,065,000 | | | 5.000 | | | | 05/01/29 | | | | 1,241,811 | |
|
| Wayne County PA Hospital & Health Facilities Authority Revenue Bond (Memorial Hospital Project) Series A(CNTY-GTD)(AA-/NR) | |
| 550,000 | | | 4.000 | | | | 07/01/25 | | | | 622,232 | |
| 520,000 | | | 4.000 | | | | 07/01/27 | | | | 604,547 | |
| 400,000 | | | 5.000 | (a) | | | 07/01/28 | | | | 492,876 | |
| 500,000 | | | 4.000 | (a) | | | 07/01/33 | | | | 552,920 | |
|
| Wilkes-Barre PA Finance Authority Revenue Bonds (Refunding-University of Scranton) Series A(A-/NR) | |
| 1,000,000 | | | 5.000 | | | | 11/01/24 | | | | 1,161,100 | |
| 2,205,000 | | | 4.000 | (a) | | | 11/01/29 | | | | 2,383,318 | |
|
| Wilson PA School District GO Bonds Series A (AA/NR) | |
| 650,000 | | | 4.000 | | | | 05/15/26 | | | | 747,526 | |
| 840,000 | | | 4.000 | (a) | | | 05/15/27 | | | | 961,338 | |
|
| York PA GO Bonds (Refunding) Series A(A-/NR) | |
| 1,640,000 | | | 5.000 | | | | 11/15/26 | | | | 1,924,934 | |
| | | | | | | | | | | | |
| | | | | | | | | | | 42,727,983 | |
| |
| | | | | | | | | | | | |
Principal
Amount | | Interest
Rate | | | Maturity
Date | | | Value | |
|
| Municipal Bond Obligations – (continued) | |
Rhode Island – 2.4% | |
| Rhode Island State & Providence Plantations Lease Certificates of Participation (Eleanor Slater Hospital Project) Series B(AA-/Aa3)(a) | |
| $1,600,000 | | | 5.000 | % | | | 11/01/30 | | | $ | 2,015,632 | |
| 1,685,000 | | | 5.000 | | | | 11/01/31 | | | | 2,116,579 | |
| 760,000 | | | 4.000 | | | | 11/01/32 | | | | 876,105 | |
| 980,000 | | | 4.000 | | | | 11/01/33 | | | | 1,127,186 | |
|
| Rhode Island State & Providence Plantations Lease Certificates of Participation (Refunding) (School Deafening Project) Series D(AA-/Aa3)(a) | |
| 1,000,000 | | | 5.000 | | | | 04/01/29 | | | | 1,226,100 | |
|
| Rhode Island State Health & Educational Building Corp. Higher Education Facility Revenue Bonds (Bryant University Project) (A/A2) | |
| 950,000 | | | 5.000 | | | | 06/01/21 | | | | 1,005,537 | |
|
| Rhode Island State Health & Educational Building Corp. Public School Revenue Bonds Series G (AGM) (AA/Aa3)(a) | |
| 1,195,000 | | | 5.000 | | | | 05/15/33 | | | | 1,447,217 | |
|
| Rhode Island State Housing & Mortgage Finance Corp. Revenue Bonds (Home Funding) Series 4 (GNMA) (NR/Aa2)(a) | |
| 205,000 | | | 3.500 | | | | 04/01/22 | | | | 211,164 | |
| | | | | | | | | | | | |
| | | | | | | | | | | 10,025,520 | |
| |
South Carolina – 0.6% | |
| Laurens County SC School District No. 055 Installment Purchase Revenue Bonds (Refunding) Series 2015(A-/A2) | |
| 1,000,000 | | | 5.000 | | | | 12/01/24 | | | | 1,154,050 | |
|
| Scago Educational Facilities Corp. for Colleton School District Revenue Bonds (Refunding)(A-/A3)(a) | |
| 1,000,000 | | | 5.000 | | | | 12/01/26 | | | | 1,173,590 | |
| | | | | | | | | | | | |
| | | | | | | | | | | 2,327,640 | |
| |
South Dakota – 0.8% | |
| South Dakota Housing Development Authority Revenue Bonds (Home Ownership Mortgage) Series D (AAA/Aaa) | |
| 670,000 | | | 2.700 | | | | 05/01/25 | | | | 705,684 | |
|
| South Dakota State Health & Educational Facilities Authority Revenue Bonds Series 2017 (NR/A1) | |
| 750,000 | | | 5.000 | | | | 09/01/23 | | | | 850,635 | |
| 825,000 | | | 5.000 | | | | 09/01/24 | | | | 960,910 | |
| 605,000 | | | 5.000 | | | | 09/01/25 | | | | 722,673 | |
| | | | | | | | | | | | |
| | | | | | | | | | | 3,239,902 | |
| |
Tennessee – 0.7% | |
| Greeneville TN Health & Educational Facilities Board Hospital Revenue Bonds (Refunding-Ballad Health Obligated Group) Series A(A-/Baa1) | |
| 500,000 | | | 5.000 | | | | 07/01/28 | | | | 620,615 | |
| 600,000 | | | 5.000 | (a) | | | 07/01/29 | | | | 737,484 | |
| 500,000 | | | 5.000 | (a) | | | 07/01/30 | | | | 610,425 | |
|
| Tennessee Housing Development Agency Revenue Bonds Homeownership Program Series 1C(Non-AMT) (GO of Agency) (AA+/Aa1)(a) | |
| 565,000 | | | 3.500 | | | | 07/01/27 | | | | 577,865 | |
| |
| | |
| The accompanying notes are an integral part of these financial statements. | | 45 |
COMMERCE NATIONALTAX-FREE INTERMEDIATE BOND FUND
Schedule of Investments(continued)
October 31, 2019
| | | | | | | | | | | | |
Principal
Amount | | Interest
Rate | | | Maturity
Date | | | Value | |
|
| Municipal Bond Obligations – (continued) | |
Tennessee – (continued) | |
| Tennessee Housing Development Agency Revenue Bonds Residential Financing Program Series 1C(Non-AMT-NonACE-Issue) (AA+/Aa1)(a) | |
| $ 330,000 | | | 4.050 | % | | | 01/01/38 | | | $ | 350,463 | |
| | | | | | | | | | | | |
| | | | | | | | | | | 2,896,852 | |
| |
Texas – 7.0% | |
| Arlington TX Higher Education Finance Corp. Revenue Bonds (KIPP Texas, Inc.) Series 2018(PSF-GTD) (AAA/NR)(a) | |
| 1,000,000 | | | 4.000 | | | | 08/15/30 | | | | 1,164,220 | |
| 1,000,000 | | | 4.000 | | | | 08/15/31 | | | | 1,160,200 | |
|
| Arlington TX Higher Education Finance Corp. Revenue Bonds (Responsive Education Solutions) Series A(PSF-GTD) (AAA/NR) | |
| 725,000 | | | 5.000 | | | | 08/15/25 | | | | 869,036 | |
|
| Arlington TX Higher Education Finance Corp. Revenue Bonds (Uplift Education) Series B(PSF-GTD) (AAA/NR)(a) | |
| 540,000 | | | 4.000 | | | | 12/01/30 | | | | 619,078 | |
| 485,000 | | | 4.000 | | | | 12/01/32 | | | | 549,694 | |
|
| Austin TX Community College District Public Facility Corp. Lease Revenue Bonds Series C (AA/Aa2)(a) | |
| 745,000 | | | 4.000 | | | | 08/01/32 | | | | 851,743 | |
| 500,000 | | | 4.000 | | | | 08/01/33 | | | | 570,360 | |
|
| Celina TX GO Bonds (Certificates of Obligation) (Waterworks & Sewer System) Series 2015 (AA/Aa3)(a) | |
| 930,000 | | | 5.000 | | | | 09/01/27 | | | | 1,108,597 | |
| 980,000 | | | 5.000 | | | | 09/01/28 | | | | 1,166,994 | |
|
| Clifton TX Higher Education Finance Corp. Revenue Bond (Refunding-Idea Public Schools) Series 2017(PSF-GTD) (AAA/NR)(a) | |
| 2,500,000 | | | 4.000 | | | | 08/15/28 | | | | 2,924,600 | |
|
| El Paso County TX Community College District Revenue Bonds Series 2016 (AGM) (AA/NR)(a) | |
| 2,000,000 | | | 4.000 | | | | 04/01/31 | | | | 2,234,760 | |
|
| El Paso Independent School District Public Facility Corp. Lease Revenue Bonds Series 2018 (NR/Aa3)(a) | |
| 815,000 | | | 4.000 | | | | 02/15/36 | | | | 908,032 | |
| 425,000 | | | 4.000 | | | | 02/15/37 | | | | 471,117 | |
|
| EL Paso TX GO Bonds Series 2016 (AA/NR)(a) | |
| 5,000,000 | | | 5.000 | | | | 08/15/28 | | | | 6,076,150 | |
|
| Houston County TX GO Bonds (Certificates of Obligation) (A/NR)(a) | |
| 235,000 | | | 5.000 | | | | 02/15/20 | | | | 235,712 | |
|
| Katy TX Independent School District GO Bonds (Refunding) Series A(PSF-GTD) (AAA/Aaa) | |
| 300,000 | | | 5.000 | | | | 02/15/25 | | | | 356,889 | |
|
| Kyle TX GO Bonds (Refunding) Series 2015(AA-/NR)(a) | |
| 1,000,000 | | | 4.000 | | | | 08/15/26 | | | | 1,120,980 | |
|
| McGregor TX Independent School District GO Bonds (Capital Appreciation) Series 2001(PSF-GTD) (AAA/NR)(b) | |
| 1,000,000 | | | 0.000 | | | | 02/15/25 | | | | 851,240 | |
|
| Texas State GO Bonds Series D (SPA – Federal Home Loan Bank) (NR/Aaa)(a)(d)(e) | |
| 2,925,000 | | | 1.180 | | | | 06/01/45 | | | | 2,925,000 | |
| |
| | | | | | | | | | | | |
Principal
Amount | | Interest
Rate | | | Maturity
Date | | | Value | |
|
| Municipal Bond Obligations – (continued) | |
Texas – (continued) | |
| Wichita Falls TX GO Bonds Series A (AA/Aa2)(a) | |
| $ 880,000 | | | 4.000 | % | | | 09/01/31 | | | $ | 1,010,117 | |
| 870,000 | | | 4.000 | | | | 09/01/32 | | | | 995,637 | |
| 750,000 | | | 4.000 | | | | 09/01/33 | | | | 856,447 | |
| | | | | | | | | | | | |
| | | | | | | | | | | 29,026,603 | |
| |
Utah – 0.8% | |
| Ogden City School District Municipal Building Authority Lease Revenue Bonds Series 2018 (NR/A1)(a) | |
| 1,280,000 | | | 5.000 | | | | 01/15/32 | | | | 1,572,365 | |
|
| Salt Lake City UT Airport Revenue Bonds Series A (A+/A2) | |
| 1,000,000 | | | 5.000 | | | | 07/01/26 | | | | 1,208,130 | |
|
| Salt Lake City UT Airport Revenue Bonds Series B (A+/A2)(a) | |
| 500,000 | | | 5.000 | | | | 07/01/34 | | | | 607,345 | |
| | | | | | | | | | | | |
| | | | | | | | | | | 3,387,840 | |
| |
Vermont – 0.9% | |
| Vermont Economic Development Authority Revenue Bonds (Central Vermont Public Service Corp.-Recovery Zone Facility) (NR/WR) | |
| 1,000,000 | | | 5.000 | | | | 12/15/20 | | | | 1,035,360 | |
|
| Vermont State Student Assistance Corp. Education Loan Revenue Bonds Series A (A/NR) | |
| 300,000 | | | 5.000 | | | | 06/15/24 | | | | 341,943 | |
| 400,000 | | | 5.000 | | | | 06/15/25 | | | | 465,860 | |
| 400,000 | | | 5.000 | | | | 06/15/26 | | | | 474,548 | |
| 780,000 | | | 5.000 | | | | 06/15/27 | | | | 940,087 | |
|
| Vermont State Student Assistance Corp. Education Loan Revenue Bonds Series A (AA/NR) | |
| 410,000 | | | 4.000 | | | | 06/15/20 | | | | 416,056 | |
| | | | | | | | | | | | |
| | | | | | | | | | | 3,673,854 | |
| |
Washington – 2.1% | |
| Chelan County Public Utility District No 1 Revenue Bonds (Variable Refunding) Series B (AA+/Aa3)(a)(d)(e) | |
| 3,000,000 | | | 1.130 | | | | 07/01/32 | | | | 3,000,000 | |
|
| Grays Harbor County WA Public Utility District No. 1 Revenue Bonds (Refunding) Series A (A/A1)(a) | |
| 250,000 | | | 4.000 | | | | 01/01/40 | | | | 266,960 | |
|
| Port of Seattle WA Special Facilities Revenue Bonds (Refunding) Series 2013 (A/A1)(a) | |
| 900,000 | | | 3.600 | | | | 06/01/26 | | | | 957,888 | |
|
| Seattle WA Municipal Light & Power Revenue Bonds (Refunding) SeriesC-2 (AA/Aa2)(d)(e) | |
| 1,435,000 | | | 1.270 | | | | 11/01/19 | | | | 1,435,000 | |
|
| Washington State GO Bonds (Built America) Series D (AA+/Aaa)(a) | |
| 1,485,000 | | | 4.586 | | | | 08/01/21 | | | | 1,555,478 | |
|
| Washington State Health Care Facilities Authority Revenue Bonds (Multicare Health System) Series A(AA-/Aa3)(a) | |
| 495,000 | | | 5.000 | | | | 08/15/27 | | | | 592,347 | |
| |
| | |
| 46 | | The accompanying notes are an integral part of these financial statements. |
COMMERCE NATIONALTAX-FREE INTERMEDIATE BOND FUND
| | | | | | | | | | | | |
Principal
Amount | | Interest
Rate | | | Maturity
Date | | | Value | |
|
| Municipal Bond Obligations – (continued) | |
Washington – (continued) | |
| Washington State Health Care Facilities Authority Revenue Bonds (Refunding-Providence St. Joseph Health) Series B(AA-/Aa3)(a) | |
| $ 150,000 | | | 5.000 | % | | | 10/01/30 | | | $ | 189,843 | |
|
| Washington State Housing Finance Commission Revenue Bonds(Refunding-Non-AMT-Single Family Program) Series 1N (NR/Aaa)(a) | |
| 775,000 | | | 3.450 | | | | 12/01/30 | | | | 820,384 | |
| | | | | | | | | | | | |
| | | | | | | | | | | 8,817,900 | |
| |
West Virginia(a) – 0.6% | |
| West Virginia State Higher Education Policy Commission Revenue Bonds (Refunding Community & Technical College Capital Improvement) Series 2017 (AAA/A1) | |
| 2,065,000 | | | 5.000 | | | | 07/01/30 | | | | 2,526,445 | |
| |
Wisconsin(a) – 1.2% | |
| Luxemburg-Casco WI School District Brown & Kewaunee Counties GO Notes (Refunding) Series 2018(AA-/NR) | |
| 520,000 | | | 4.000 | | | | 03/01/30 | | | | 595,052 | |
| 765,000 | | | 4.000 | | | | 03/01/31 | | | | 867,999 | |
| 540,000 | | | 4.000 | | | | 03/01/32 | | | | 611,096 | |
|
| Wisconsin Public Finance Authority Revenue Bonds (Taxable Refunding Hawai Pacific Health Obligated Group) Series A (NR/A1) | |
| 1,440,000 | | | 4.082 | | | | 07/01/29 | | | | 1,600,589 | |
|
| Wisconsin State Health & Educational Facilities Authority Revenue Bonds (Refunding-Ascension Health Credit Group) Series A (AA+/Aa2) | |
| 1,000,000 | | | 4.000 | | | | 11/15/34 | | | | 1,105,790 | |
| | | | | | | | | | | | |
| | | | | | | | | | | 4,780,526 | |
| |
| TOTAL MUNICIPAL BOND OBLIGATIONS | |
(Cost $394,316,274) | | | $ | 412,204,945 | |
| |
| | | | | | | | | | | | |
| Shares | | | | | Dividend
Rate | | | Value | |
|
| Investment Company – 0.2% | |
| State Street Institutional US Government Money Market Fund – Premier Class | |
| 853,954 | | | | | | | 1.741% | | | $ | 853,954 | |
(Cost $853,954) | | | | | | | | | |
| |
| TOTAL INVESTMENTS – 99.8% | |
(Cost $395,170,228) | | | $ | 413,058,899 | |
| |
OTHER ASSETS IN EXCESS OF
LIABILITIES – 0.2% | | | | 733,560 | |
| |
NET ASSETS – 100.0% | | | $ | 413,792,459 | |
| |
| | |
|
| The percentage shown for each investment category reflects the value of investments in that category as a percentage of net assets. |
| |
| (a) | | Security with “Call” features with resetting interest rates. |
| |
| (b) | | Security issued with a zero coupon. The actual effective yield of this security is different than the stated coupon due to the accretion of discount. |
| |
| (c) | | Step up Bond. Coupon is zero or below market rate for an initial period and then increases at a specified date and rate. |
| |
| (d) | | Variable rate security. The interest rate shown reflects the rate as of October 31, 2019. |
| |
| (e) | | Rate shown is that which is in effect on October 31, 2019. Certain variable rate securities are not based on a published reference rate and spread but are determined by the issuer or agent and are based on current market conditions. |
| |
| (f) | | Prerefunded security. Maturity date disclosed is prerefunding date. |
| |
| (g) | | All or portion represents a forward commitment. |
|
| Security ratings disclosed, if any, are issued by S&P Global Ratings/Moody’s Investors Service and are unaudited. A description of the ratings is available in the Fund’s Statement of Additional Information. |
| | |
|
|
| Investment Abbreviations: |
| AGM | | —Insured by Assured Guaranty Municipal Corp. |
| AMBAC | | —Insured by American Municipal Bond Assurance Corp. |
| AMT | | —Alternative Minimum Tax |
| ETM | | —Escrow to Maturity |
| FHLMC | | —Federal Home Loan Mortgage Corp. |
| FNMA | | —Federal National Mortgage Association |
| GNMA | | —Government National Mortgage Association |
| GO | | —General Obligation |
| NR | | —Not Rated |
| PSF-GTD | | —Guaranteed by Permanent School Fund |
| Q-SBLF | | —Qualified School Bond Loan Fund |
| SPA | | —Stand-by Purchase Agreement |
| WR | | —Withdrawn Rating |
|
| | |
| The accompanying notes are an integral part of these financial statements. | | 47 |
COMMERCE NATIONALTAX-FREE INTERMEDIATE BOND FUND
Schedule of Investments(continued)
October 31, 2019
PORTFOLIO COMPOSITION
| | | | | | | | |
| | | AS OF
10/31/19 | | | AS OF
10/31/18 | |
| |
General Obligation | | | 33.7 | % | | | 27.9 | % |
Lease | | | 13.4 | | | | 13.5 | |
Education | | | 12.6 | | | | 12.2 | |
Hospital | | | 9.3 | | | | 12.2 | |
Limited Tax | | | 7.3 | | | | 9.1 | |
Prerefunded/Escrow to Maturity | | | 4.6 | | | | 4.3 | |
Single Family Housing | | | 4.5 | | | | 2.5 | |
Water/Sewer | | | 4.3 | | | | 4.1 | |
Transportation | | | 3.4 | | | | 6.1 | |
Power | | | 3.2 | | | | 3.4 | |
Student | | | 1.3 | | | | 1.1 | |
Multi Family Housing | | | 1.2 | | | | 1.5 | |
Not For Profit | | | 0.6 | | | | 0.7 | |
Investment Company | | | 0.2 | | | | — | |
Crossover | | | 0.2 | | | | 0.2 | |
Repurchase Agreement | | | — | | | | 1.0 | |
Treasuries | | | — | | | | 0.6 | |
| |
| TOTAL INVESTMENTS | | | 99.8 | % | | | 100.4 | % |
| |
The percentage shown for each investment category reflects the value of investments in that category as a percentage of net assets. Underlying investment categories of investment companies held by the Fund are not reflected in the table above. Consequently, the Fund’s overall investment category allocations may differ from the percentages contained in the table above.
The Fund is actively managed and, as such, its composition may differ over time.
| | |
| 48 | | The accompanying notes are an integral part of these financial statements. |
COMMERCE MISSOURI TAX-FREE INTERMEDIATE BOND FUND
Performance Summary
October 31, 2019 (Unaudited)
The following is performance information for the Commerce Missouri Tax-Free Intermediate Bond Fund (“Missouri Tax-Free Intermediate Bond Fund”) for various time periods. The returns represent past performance. Past performance is no guarantee of future results. The Fund’s investment return and principal value will fluctuate so that an investor’s shares, when redeemed, may be worth more or less than their original cost. Performance reflects expense limitations in effect. In their absence, performance would be reduced. Returns do not reflect the deduction of taxes that a shareholder would pay on Fund distributions or the redemption of Fund shares. The Fund is not subject to a sales charge, so a sales charge is not applied to its total returns. In addition to the Adviser’s decisions regarding issuer/industry investment selection and allocation, other factors may affect Fund performance. These factors include, but are not limited to, Fund operating fees and expenses, portfolio turnover, and subscription and redemption cash flows affecting the Fund. Please visit our website at www.commercefunds.com to obtain the most recent month-end returns.
| | | | | | | | |
| | Performance Review |
| | | | |
| | | November 1, 2018 - October 31, 2019 | | Fund Total Return(a) | | Index Total Return(c) | | Index |
| | | | |
| | | Missouri Tax-Free Intermediate Bond Fund | | 7.98% | | 8.64% | | Bloomberg Barclays 3-15 Year Blend Municipal Bond(c) |
Standardized Average Annual Total Return through September 30, 2019(b)
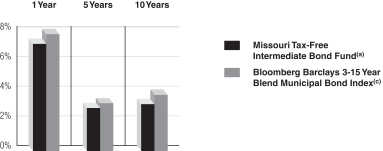
| | | | | | | | |
| | Standardized Average Annual Total Return throughSeptember 30, 2019(b) | | One Year | | Five Years | | Ten Years |
| | | | |
| | | Missouri Tax-Free Intermediate Bond Fund(a) | | 7.21% | | 2.90% | | 3.17% |
| | | | |
| | | Bloomberg Barclays 3-15 Year Blend Municipal Bond Index(c) | | 7.86% | | 3.23% | | 3.79% |
Missouri Tax-Free Intermediate Bond Fund 10 Year Performance
Performance of a $10,000 Investment, with distributions reinvested, from November 1, 2009 through October 31, 2019.
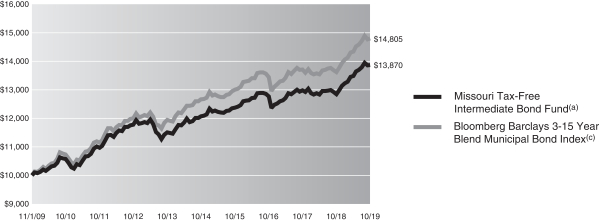
| | | | | | | | |
| | Average Annual Total Return through October 31,2019 | | One Year | | Five Years | | Ten Years |
| | | | |
| | | Missouri Tax-Free Intermediate Bond Fund(a) | | 7.98% | | 2.81% | | 3.33% |
| | | | | | |
| | Expense Ratios(d) | | | | |
| | | |
| | | | | Net Expense Ratio (Current) | | Gross Expense Ratio (Before Reimbursements) |
| | | |
| | | Missouri Tax-Free Intermediate Bond Fund | | 0.63% | | 0.63% |
| (a) | | Returns reflect any applicable fee waivers or expense reductions. Returns do not reflect the deduction of taxes that a shareholder would pay on capital gains or other taxable distributions or the redemption of Fund shares. |
| (b) | | The Standardized Average Annual Total Returns are average annual total returns as of the most recent calendar quarter-end. They assume reinvestment of all distributions at NAV. Current performance may be lower or higher than the total return figures in the above charts. |
Returns reflect any fee waivers and expense reductions. Absent these waivers and reductions, returns would have been lower. Returns do not reflect the deduction of taxes that a shareholder would pay on capital gains or other taxable distributions or the redemption of Fund shares.
| (c) | | The Bloomberg Barclays Capital 3-15 Year Blend Municipal Bond Index is an unmanaged index comprised of investment-grade municipal securities ranging from 2 to 17 years in maturity. The Index figures do not reflect any deduction for fees, taxes or expenses. |
| (d) | | The Fund’s expense ratios, both net (net of applicable fee waivers and/or expense reimbursements) and gross (before applicable fee waivers and/or expense reimbursements), set forth above are as of the most recent publicly available prospectus (March 1, 2019) for the Fund and may differ from the expense ratios disclosed in the Financial Highlights in this report. The Adviser has contractually agreed to reduce or limit the Total Annual Fund Operating Expenses, excluding interest, taxes, acquired fund fees and expenses and extraordinary expenses. This agreement will remain in place through March 1, 2020. After this date, the Adviser or the Fund may terminate the contractual arrangement. If this occurs, the expense ratios may change without shareholder approval. |
49
COMMERCE MISSOURI TAX-FREE INTERMEDIATE BOND FUND
Schedule of Investments
October 31, 2019
| | | | | | | | | | |
Principal
Amount | | Interest
Rate | | | Maturity
Date | | Value | |
|
| Municipal Bond Obligations – 97.7% | |
California(a) – 1.8% | |
| Burbank CA Unified School District GO Bonds Capital Appreciation Election of 1997 Series C (NPFG)(AA-/Baa2) | |
| $2,000,000 | | | 0.000 | % | | 07/01/27 | | $ | 1,731,100 | |
|
| Manteca CA Unified School District GO Bonds Capital Appreciation Election 2004 Series 2006 (NPFG) (NR/Aa2) | |
| 3,180,000 | | | 0.000 | | | 08/01/28 | | | 2,704,494 | |
|
| Washington CA Unified School District GO Bonds Capital Appreciation Election of 2004 (Yolo County) Series A (NPFG) (A+/Baa2) | |
| 2,400,000 | | | 0.000 | | | 08/01/29 | | | 1,950,840 | |
| | | | | | | | | | |
| | | | | | | | | 6,386,434 | |
| |
Florida(b) – 0.6% | |
| Orange County FL Tourist Development Tax Revenue BondsSeries A (AA-/Aa2) | |
| 2,000,000 | | | 4.000 | | | 10/01/33 | | | 2,258,060 | |
| |
Illinois – 2.1% | |
| Illinois Finance Authority Revenue Bonds (OSF Healthcare System) Series 2016 (A/A3)(b) | |
| 2,500,000 | | | 3.250 | | | 05/15/39 | | | 2,487,050 | |
|
| Illinois Housing Development Authority Revenue Bonds (Refunding Homeowner Mortgage) Series C (AA/Aa2)(b) | |
| 3,000,000 | | | 2.900 | | | 08/01/31 | | | 3,086,490 | |
|
| Kendall Kane & Will Counties IL Community Unit School District No. 308 Series 2014 (NR/A2)(b) | |
| 2,000,000 | | | 4.125 | | | 02/01/30 | | | 2,152,100 | |
|
| Will County IL Community Unit School District No. 201 Crete-Monee GO Bonds (Capital Appreciation) Series 2004 (NPFG) (NR/Baa2)(a) | |
| 95,000 | | | 0.000 | | | 11/01/19 | | | 95,000 | |
| | | | | | | | | | |
| | | | | | | | | 7,820,640 | |
| |
Indiana(b) – 0.6% | |
| Carmel IN Local Public Improvement Bond Bank Revenue Bonds SeriesB-1 (AA/NR) | |
| 2,000,000 | | | 4.000 | | | 01/15/35 | | | 2,257,280 | |
| |
Kansas(b) – 0.4% | |
| Dickinson County KS Public Building Commission Revenue Bonds Series 2018(AA-/NR) | |
| 1,280,000 | | | 5.000 | | | 08/01/44 | | | 1,555,021 | |
| |
Maine(b) – 0.8% | |
| Maine Governmental Facilities Authority Revenue Bonds Series A(AA-/Aa3) | |
| 2,640,000 | | | 4.000 | | | 10/01/33 | | | 3,019,870 | |
| |
Michigan(b) – 1.3% | |
| Michigan State Housing Development Authority Revenue Bonds(Non-ACE) Series B (AA+/Aa2) | |
| 1,705,000 | | | 2.950 | | | 12/01/28 | | | 1,807,863 | |
|
| Michigan State Housing Development Authority Revenue Bonds(Non-AMT)(Non-ACE) Series B (AA+/Aa2) | |
| 2,920,000 | | | 2.550 | | | 06/01/27 | | | 3,027,689 | |
| | | | | | | | | | |
| | | | | | | | | 4,835,552 | |
| |
| | | | | | | | | | | | |
Principal
Amount | | Interest
Rate | | | Maturity
Date | | | Value | |
|
| Municipal Bond Obligations – (continued) | |
Missouri – 87.3% | |
| Arnold MO Certificates of Participation (Refunding) Series 2019 (A+/NR)(b) | |
| $ 760,000 | | | 4.000 | % | | | 08/15/28 | | | $ | 873,521 | |
| 645,000 | | | 4.000 | | | | 08/15/29 | | | | 736,442 | |
| 825,000 | | | 4.000 | | | | 08/15/30 | | | | 936,631 | |
| 555,000 | | | 4.000 | | | | 08/15/31 | | | | 627,289 | |
|
| Bi-State Development Agency MO Metro District Revenue Bonds (Refunding-Combined Lien) Series A (AA+/Aa2)(b) | |
| 1,000,000 | | | 5.000 | | | | 10/01/33 | | | | 1,101,320 | |
|
| Branson MO Reorganized School District No.R-4 GO Bonds Series 2012 (A+/NR)(b) | |
| 2,000,000 | | | 4.000 | | | | 03/01/27 | | | | 2,111,440 | |
|
| Brentwood MO Certificates of Participation Series 2018(AA-/NR)(b) | |
| 2,070,000 | | | 4.000 | | | | 10/01/33 | | | | 2,286,646 | |
| 1,655,000 | | | 4.000 | | | | 10/01/34 | | | | 1,825,482 | |
|
| Cape Girardeau County MO Industrial Development Authority Revenue Bonds (St. Francis Medical Center) Series A (A+/NR)(b) | |
| 750,000 | | | 5.000 | | | | 06/01/26 | | | | 816,218 | |
|
Cape Girardeau County MO Reorganized School DistrictNo. R-2 GO Bonds (Kearney Direct Deposit Program) Series 2018
(AA+/NR)(b) | |
| 900,000 | | | 4.000 | | | | 03/01/31 | | | | 1,045,368 | |
| 750,000 | | | 4.000 | | | | 03/01/37 | | | | 850,920 | |
|
| Chesterfield MO Certificates of Participation (AMBAC) (NR/Aa1) | |
| 600,000 | | | 5.000 | | | | 02/15/22 | | | | 651,924 | |
|
| City of Columbia MO Water & Electric System Revenue Bonds (Refunding) Series B (A+/NR) | |
| 3,015,000 | | | 5.000 | | | | 10/01/27 | | | | 3,776,468 | |
|
| Clay County MO Public School District No. 53 Liberty GO Bonds (Refunding) Series 2016 (AA/NR)(b) | |
| 1,000,000 | | | 4.000 | | | | 03/01/34 | | | | 1,113,530 | |
| 1,000,000 | | | 4.000 | | | | 03/01/35 | | | | 1,111,310 | |
| 1,000,000 | | | 4.000 | | | | 03/01/36 | | | | 1,106,440 | |
|
| Clay County MO Public School District No. 53 Liberty GO Bonds Series 2018 (AA/NR)(b) | |
| 1,000,000 | | | 4.000 | | | | 03/01/33 | | | | 1,119,240 | |
| 1,000,000 | | | 4.000 | | | | 03/01/34 | | | | 1,113,530 | |
|
| Clay County MO Public School District No.R-II GO Bonds (Refunding) Series A (AA+/NR)(b) | |
| 1,735,000 | | | 4.000 | | | | 03/01/30 | | | | 2,000,802 | |
|
| Clay Jackson & Platte County MO Consolidated Public Library District No. 3 Certificates of Participation Series 2018 (NR/Aa3) | |
| 3,125,000 | | | 5.000 | | | | 03/01/23 | | | | 3,504,594 | |
|
| Clayton MO Special Obligation Revenue Bonds (Build America Bonds) Series B (AA+/NR)(b) | |
| 810,000 | | | 5.200 | | | | 12/01/23 | | | | 812,171 | |
|
| Columbia MO Water & Electric Revenue Bonds (Refunding & Improvement System) Series 2015 (A+/NR)(b) | |
| 500,000 | | | 4.000 | | | | 10/01/42 | | | | 526,860 | |
| |
| | |
| 50 | | The accompanying notes are an integral part of these financial statements. |
COMMERCE MISSOURI TAX-FREE INTERMEDIATE BOND FUND
| | | | | | | | | | | | |
Principal
Amount | | Interest
Rate | | | Maturity
Date | | | Value | |
|
| Municipal Bond Obligations – (continued) | |
Missouri – (continued) | |
| County of Franklin MO Certificates of Participation (Refunding) Series B (A+/NR) | |
| $1,075,000 | | | 4.000 | % | | | 04/01/27 | | | $ | 1,247,226 | |
| 1,100,000 | | | 4.000 | (b) | | | 04/01/28 | | | | 1,268,399 | |
|
| Duckett Creek MO Sewer District Revenue Bonds (Refunding-System) Series 2015 (NR/Aa3) | |
| 1,300,000 | | | 5.000 | | | | 12/01/24 | | | | 1,525,069 | |
| 1,215,000 | | | 5.000 | | | | 12/01/25 | | | | 1,462,532 | |
|
| Fenton MO Fire Protection District GO Bonds Series 2019 (AA+/NR)(b) | |
| 1,150,000 | | | 4.000 | | | | 03/01/32 | | | | 1,308,113 | |
| 1,200,000 | | | 4.000 | | | | 03/01/33 | | | | 1,361,496 | |
| 625,000 | | | 4.000 | | | | 03/01/34 | | | | 707,719 | |
|
| Festus MO School District No.R-VI Lease Certificates of Participation (School District Project) Series 2019 (A+/NR) | |
| 700,000 | | | 5.000 | | | | 04/01/28 | | | | 873,768 | |
| 830,000 | | | 5.000 | (b) | | | 04/01/30 | | | | 1,047,651 | |
| 905,000 | | | 5.000 | (b) | | | 04/01/31 | | | | 1,137,069 | |
|
Grain Valley MO Certificates of Participation (Refunding)
(NR/NR)(b) | |
| 130,000 | | | 5.000 | | | | 09/01/20 | | | | 130,252 | |
|
| Great Rivers Greenway Metropolitan Park & Recreation District (Gateway Arch Project) Series 2014 (A+/A1)(b) | |
| 1,000,000 | | | 5.000 | | | | 12/30/26 | | | | 1,139,910 | |
|
| Greene County MO Certificates of Participation Series 2018 (NR/Aa3)(b) | |
| 1,130,000 | | | 5.000 | | | | 09/01/36 | | | | 1,388,973 | |
| 1,000,000 | | | 5.000 | | | | 09/01/37 | | | | 1,224,590 | |
|
| Greene County MO GO Bonds Limited-Jamestown NID Project Series B (NR/Aa2)(b)(c) | |
| 4,280,000 | | | 5.000 | | | | 04/01/22 | | | | 4,674,530 | |
|
| Greene County MO Reorganized School District No.R-2 GO Bonds Series 2018 (Liberty School Building Direct Deposit Program) (AA+/NR)(b) | |
| 875,000 | | | 5.000 | | | | 03/01/38 | | | | 1,045,957 | |
|
| Greene County MO Reorganized School District No.R-3 GO Bonds Series B (Direct Deposit Program) (AA+/NR)(b) | |
| 905,000 | | | 4.000 | | | | 03/01/30 | | | | 1,036,279 | |
| 985,000 | | | 4.000 | | | | 03/01/32 | | | | 1,120,428 | |
|
| Greene County MO Special Obligation Revenue Bonds (Build America Bonds) Series A (NR/Aa3) | |
| 420,000 | | | 5.100 | | | | 12/01/19 | | | | 421,037 | |
|
| Greenwood MO GO Build America Bonds Taxable Series B(AA-/NR)(b) | |
| 500,000 | | | 5.625 | | | | 03/01/25 | | | | 506,250 | |
|
| Hannibal MO Industrial Development Authority Revenue Bonds (Hannibal Regional Hospital Healthcare System, Inc.) Series 2017 (BBB+/NR)(b) | |
| 3,225,000 | | | 5.000 | | | | 10/01/37 | | | | 3,769,509 | |
|
| Hazelwood MO School District GO Bonds (Direct Deposit Program) (Refunding) Series A (AA+/NR)(b) | |
| 2,000,000 | | | 4.000 | | | | 03/01/28 | | | | 2,288,860 | |
| |
| | | | | | | | | | | | |
Principal
Amount | | Interest
Rate | | | Maturity
Date | | | Value | |
|
| Municipal Bond Obligations – (continued) | |
Missouri – (continued) | |
| Independence MO School District (Refunding) (Direct Deposit Program) Series 2016 (AA+/NR)(b) | |
| $1,500,000 | | | 4.000 | % | | | 03/01/30 | | | $ | 1,696,305 | |
|
| Independence MO School District Lease Certificates of Participation (Refunding) Series 2016 (A+/NR) | |
| 600,000 | | | 3.000 | | | | 04/01/22 | | | | 619,944 | |
| 875,000 | | | 3.000 | | | | 04/01/23 | | | | 913,124 | |
| 500,000 | | | 3.000 | | | | 04/01/24 | | | | 527,925 | |
| 960,000 | | | 3.000 | (b) | | | 04/01/26 | | | | 1,008,413 | |
|
| Jackson County MO Public Building Corp. Leasehold Revenue Bonds Series A (NPFG) (NR/Aa3)(b) | |
| 500,000 | | | 5.000 | | | | 12/01/20 | | | | 501,430 | |
|
| Jackson County MO Reorganized School District No. 7 Certificates of Participation Series 2016 (AA/NR) | |
| 500,000 | | | 4.000 | | | | 05/01/24 | | | | 553,815 | |
| 900,000 | | | 4.000 | | | | 05/01/25 | | | | 1,015,614 | |
| 700,000 | | | 4.000 | (b) | | | 05/01/27 | | | | 798,798 | |
| 630,000 | | | 4.000 | (b) | | | 05/01/29 | | | | 714,130 | |
| 675,000 | | | 4.000 | (b) | | | 05/01/30 | | | | 761,906 | |
|
| Jackson County MO Reorganized School District No. 7 GO Bonds (Refunding) (AA+/NR)(b) | |
| 840,000 | | | 4.000 | | | | 03/01/28 | | | | 983,220 | |
| 580,000 | | | 4.000 | | | | 03/01/30 | | | | 669,720 | |
|
| Jackson County MO Reorganized School District No.4 Blue Springs GO Bonds (Direct Deposit Program) Series A (AA+/NR)(b) | |
| 1,000,000 | | | 5.500 | | | | 03/01/35 | | | | 1,323,310 | |
| 1,000,000 | | | 5.500 | | | | 03/01/36 | | | | 1,321,480 | |
|
| Jackson County MO School District Hickman MillsC-1 Certificates of Participation (Energy Conservation Project) Series 2015(A-/NR)(b) | |
| 475,000 | | | 3.000 | | | | 04/15/28 | | | | 489,654 | |
| 575,000 | | | 3.250 | | | | 04/15/30 | | | | 594,746 | |
| 550,000 | | | 3.300 | | | | 04/15/31 | | | | 568,678 | |
| 700,000 | | | 3.375 | | | | 04/15/32 | | | | 724,129 | |
|
| Jackson County MO School District No. 58 GO Bonds Series B (NR/Aa3) | |
| 2,020,000 | | | 4.000 | | | | 03/01/26 | | | | 2,333,039 | |
| 1,365,000 | | | 4.000 | (b) | | | 03/01/28 | | | | 1,589,502 | |
|
| Jackson County MO Special Obligation Revenue Bonds (Refunding-Truman Sports Complex Project) Series 2014 (NR/A1)(b) | |
| 1,000,000 | | | 5.000 | | | | 12/01/25 | | | | 1,169,830 | |
|
| Jackson County MO Special Obligation Revenue Bonds (Right of Way Project) (NR/A1)(b) | |
| 1,345,000 | | | 4.000 | | | | 12/01/26 | | | | 1,526,911 | |
| 1,455,000 | | | 4.000 | | | | 12/01/28 | | | | 1,633,936 | |
|
| Jackson County MO Special Obligation Revenue Bonds (Truman Medical Center Projects) (NR/Aa3)(b) | |
| 595,000 | | | 4.250 | | | | 12/01/23 | | | | 646,408 | |
|
| Jackson County MO Special Obligation Revenue Bonds (Truman Medical Control Project) Series B (NR/Aa3) | |
| 920,000 | | | 3.850 | | | | 12/01/20 | | | | 945,558 | |
| 500,000 | | | 4.350 | (b) | | | 12/01/23 | | | | 530,370 | |
| 820,000 | | | 4.500 | (b) | | | 12/01/24 | | | | 868,364 | |
| |
| | |
| The accompanying notes are an integral part of these financial statements. | | 51 |
COMMERCE MISSOURI TAX-FREE INTERMEDIATE BOND FUND
Schedule of Investments(continued)
October 31, 2019
| | | | | | | | | | | | |
Principal
Amount | | Interest
Rate | | | Maturity
Date | | | Value | |
|
| Municipal Bond Obligations – (continued) | |
Missouri – (continued) | |
| Jefferson City MO School District GO Bonds (Direct Deposit Program) Series 2017 (AA+/NR)(b) | |
| $ 15,000 | | | 4.000 | % | | | 03/01/30 | | | $ | 17,040 | |
|
| Jefferson City MO School District GO Bonds (Direct Deposit Program) Series 2018 (AA+/NR)(b) | |
| 1,525,000 | | | 4.000 | | | | 03/01/29 | | | | 1,780,651 | |
|
| Joplin MO Industrial Development Authority Health Facilities Revenue Bonds (Freeman Health System Project) (A/NR)(b) | |
| 1,000,000 | | | 5.500 | | | | 02/15/31 | | | | 1,044,700 | |
|
| Joplin MO Industrial Development Authority Health Facilities Revenue Bonds (Refunding-Freeman Health System Project) Series 2014 (A/NR)(b) | |
| 1,895,000 | | | 5.000 | | | | 02/15/27 | | | | 2,156,870 | |
|
| Kansas City MO GO Bonds (Refunding & Improvement) Series A (AA/Aa2)(b) | |
| 5,425,000 | | | 4.500 | | | | 02/01/24 | | | | 5,820,265 | |
|
| Kansas City MO Industrial Development Authority Apartments Special Obligation Revenue Bonds(Kansas City International Apartments Terminal Modified Project) Series B (A/A2) | |
| 2,540,000 | | | 5.000 | | | | 03/01/28 | | | | 3,128,112 | |
| 1,370,000 | | | 5.000 | | | | 03/01/29 | | | | 1,710,322 | |
|
| Kansas City MO Industrial Development Authority Revenue Bonds (Refunding & Downtown Redevelopment District) Series A(AA-/A1)(b) | |
| 2,130,000 | | | 5.500 | | | | 09/01/29 | | | | 2,284,830 | |
|
| Kansas City MO Sanitary Sewer System Revenue Bonds (Refunding) Series A (AA/Aa2)(b) | |
| 1,895,000 | | | 4.000 | | | | 01/01/33 | | | | 2,090,659 | |
|
| Kansas City MO Special Obligation Revenue Bonds (Downtown Streetcar Project) Series A(AA-/A1)(b) | |
| 760,000 | | | 5.000 | | | | 09/01/31 | | | | 761,953 | |
|
| Kansas City MO Special Obligation Revenue Bonds (Refunding) Series C(AA-/A1) | |
| 1,000,000 | | | 5.000 | | | | 09/01/27 | | | | 1,241,310 | |
| 1,000,000 | | | 5.000 | (b) | | | 09/01/31 | | | | 1,220,100 | |
|
| Kansas City MO Special Obligation Tax Allocation (East Village Project) Series A(AA-/A1)(b) | |
| 500,000 | | | 5.000 | | | | 04/15/31 | | | | 508,015 | |
|
| Kirkwood School District Educational Facilities Authority Leasehold Revenue Bonds (Refunding) (NR/Aa2) | |
| 1,860,000 | | | 5.000 | | | | 02/15/20 | | | | 1,880,069 | |
|
| Liberty MO Public School District No. 53 Lease Participation Certificates (Refunding) (School Board Association) Series 2016(AA-/NR)(b) | |
| 1,040,000 | | | 3.000 | | | | 04/01/27 | | | | 1,094,007 | |
|
| Maplewood Richmond Heights Mosch District GO Bonds (Refunding) Series 2019(AA-/NR)(b) | |
| 940,000 | | | 4.000 | | | | 03/01/28 | | | | 1,091,782 | |
|
| Maplewood Richmond Heights Mosch District GO Bonds (Refunding) Series 2019(AA-/NR)(b) | |
| 1,055,000 | | | 4.000 | | | | 03/01/29 | | | | 1,220,002 | |
| 500,000 | | | 4.000 | | | | 03/01/30 | | | | 574,005 | |
| |
| | | | | | | | | | | | |
Principal
Amount | | Interest
Rate | | | Maturity
Date | | | Value | |
|
| Municipal Bond Obligations – (continued) | |
Missouri – (continued) | |
| Metropolitan St. Louis MO Sewer District Wastewater System Revenue Bonds Series A (AAA/Aa1)(b) | |
| $ 485,000 | | | 5.000 | % | | | 05/01/42 | | | $ | 523,674 | |
|
| Missouri Development Finance Board Annual Appropriation Revenue Bonds (Fulton State Hospital Project) Series 2014 (AA+/Aa1) | |
| 1,000,000 | | | 5.000 | | | | 10/01/22 | | | | 1,109,480 | |
|
| Missouri Development Finance Board Cultural Facilities Revenue Bonds (Nelson Gallery Foundation) Series A(AA-/NR) | |
| 1,000,000 | | | 5.000 | | | | 12/01/20 | | | | 1,039,360 | |
| 2,750,000 | | | 1.200 | (b)(d) | | | 12/01/37 | | | | 2,750,000 | |
|
| Missouri Joint Municipal Electric Utility Commission Power Project Revenue Bonds (Refunding) Series 2014(A-/A3) | |
| 640,000 | | | 5.000 | | | | 01/01/25 | | | | 754,560 | |
|
| Missouri Joint Municipal Electric Utility Commission Power Project Revenue Bonds (Refunding-Iatan 2 Project) Series A (NR/A2)(b) | |
| 3,115,000 | | | 5.000 | | | | 01/01/31 | | | | 3,523,657 | |
|
| Missouri School Board Association Lease Certificates of Participation for Liberty Public School District No. 53(AA-/NR)(b) | |
| 400,000 | | | 4.000 | | | | 04/01/28 | | | | 421,280 | |
| 425,000 | | | 5.000 | | | | 04/01/31 | | | | 459,242 | |
| 475,000 | | | 5.000 | | | | 04/01/32 | | | | 513,138 | |
| 500,000 | | | 5.000 | | | | 04/01/33 | | | | 539,915 | |
| 500,000 | | | 5.000 | | | | 04/01/34 | | | | 539,655 | |
|
| Missouri State Board of Public Buildings Special Obligation (Refunding) Series A (AA+/Aa1)(b) | |
| 2,450,000 | | | 5.000 | | | | 10/01/21 | | | | 2,534,966 | |
|
| Missouri State Board of Public Buildings Special Obligation Revenue Bonds Series A (AA+/Aa1)(b) | |
| 1,015,000 | | | 4.000 | | | | 04/01/26 | | | | 1,129,056 | |
| 1,825,000 | | | 3.000 | | | | 10/01/26 | | | | 1,851,572 | |
| 635,000 | | | 2.000 | | | | 04/01/27 | | | | 644,798 | |
|
| Missouri State Board of Public Buildings Special Obligation Revenue Bonds Series B (AA+/Aa1)(b) | |
| 800,000 | | | 4.000 | | | | 04/01/28 | | | | 885,192 | |
|
| Missouri State Environmental Improvement & Energy Resources Authority Revenue Bonds(Tri-County Water Authority Project) (NR/Aa3) | |
| 735,000 | | | 3.000 | | | | 01/01/20 | | | | 737,124 | |
| 595,000 | | | 5.000 | (b) | | | 01/01/30 | | | | 694,484 | |
| 775,000 | | | 5.000 | (b) | | | 01/01/31 | | | | 901,736 | |
|
| Missouri State Environmental Improvement & Energy Resources Authority Water Pollution Control Revenue Bonds (Unrefunded Balance-State Revolving Funds Program) Series B (GO of Authority) (NR/Aaa)(b) | |
| 5,000 | | | 5.000 | | | | 01/01/22 | | | | 5,015 | |
|
| Missouri State Environmental Improvement & Energy Resources Authority Water Pollution Revenue Bonds (Unrefunded-State Revolving Funds Programs) Series A (NR/Aaa)(b) | |
| 90,000 | | | 5.500 | | | | 01/01/23 | | | | 90,296 | |
| |
| | |
| 52 | | The accompanying notes are an integral part of these financial statements. |
COMMERCE MISSOURI TAX-FREE INTERMEDIATE BOND FUND
| | | | | | | | | | | | |
Principal
Amount | | Interest
Rate | | | Maturity
Date | | | Value | |
|
| Municipal Bond Obligations – (continued) | |
Missouri – (continued) | |
| Missouri State Health & Educational Facilities Authority Educational Facilities Revenue Bonds (A.T. Still University of Health Sciences) Series 2011(A-/NR) | |
| $ 400,000 | | | 3.500 | % | | | 10/01/21 | | | $ | 415,068 | |
| 1,850,000 | | | 5.250 | (b) | | | 10/01/41 | | | | 1,980,277 | |
|
| Missouri State Health & Educational Facilities Authority Educational Facilities Revenue Bonds (Ascension Health Credit Group) SeriesC-2 (AA+/Aa2)(d) | |
| 2,800,000 | | | 1.130 | | | | 11/15/39 | | | | 2,800,000 | |
|
| Missouri State Health & Educational Facilities Authority Educational Facilities Revenue Bonds (Kansas City University of Medicine And Biosciences) Series A (NR/A1)(b) | |
| 1,440,000 | | | 4.500 | | | | 06/01/28 | | | | 1,574,914 | |
|
| Missouri State Health & Educational Facilities Authority Educational Facilities Revenue Bonds (Refunding- Southeast MO State University) Series 2019 (A/NR) | |
| 600,000 | | | 5.000 | | | | 10/01/25 | | | | 710,016 | |
| 640,000 | | | 5.000 | | | | 10/01/26 | | | | 770,618 | |
| 2,030,000 | | | 5.000 | | | | 10/01/27 | | | | 2,481,898 | |
|
| Missouri State Health & Educational Facilities Authority Educational Facilities Revenue Bonds (Refunding-Kansas City Art Institute) Series 2018(A-/NR)(b) | |
| 670,000 | | | 5.000 | | | | 09/01/33 | | | | 806,660 | |
| 800,000 | | | 5.000 | | | | 09/01/38 | | | | 949,576 | |
|
| Missouri State Health & Educational Facilities Authority Educational Facilities Revenue Bonds (University of Central Missouri) Series C (A+/NR)(b) | |
| 2,400,000 | | | 5.000 | | | | 10/01/26 | | | | 2,716,992 | |
|
| Missouri State Health & Educational Facilities Authority Health Facilities Revenue Bonds(Refunding-Cox Health) Series A (NR/A2)(b) | |
| 2,500,000 | | | 5.000 | | | | 11/15/35 | | | | 2,890,550 | |
|
| Missouri State Health & Educational Facilities Authority Health Facilities Revenue Bonds(Refunding-St. Luke’s Episcopal-Presbyterian Hospitals) Series B (A/NR)(b) | |
| 1,000,000 | | | 5.000 | | | | 12/01/33 | | | | 1,162,860 | |
|
Missouri State Health & Educational Facilities Authority Health Facilities Revenue Bonds (St. Lukes Episcopal) Series 2011
(A/NR)(b) | |
| 2,270,000 | | | 5.000 | | | | 12/01/25 | | | | 2,427,924 | |
|
| Missouri State Health & Educational Facilities Authority Health Facllities Revenue Bonds(Refunding-St. Luke’s Episcopal-Presbyterian Hospitals) Series B (A/NR)(b) | |
| 1,375,000 | | | 5.000 | | | | 12/01/31 | | | | 1,604,749 | |
|
Missouri State Health & Educational Facilities Authority Revenue Bonds (Kansas City University of Medicine & Biosciences)
Series A (NR/A1)(b) | |
| 950,000 | | | 5.000 | | | | 06/01/34 | | | | 1,145,434 | |
| 1,100,000 | | | 5.000 | | | | 06/01/37 | | | | 1,316,029 | |
|
| Missouri State Health & Educational Facilities Authority Revenue Bonds (Refunding & Improvement-Webster University Project) Series 2011 (NR/Baa1)(b)(c) | |
| 4,000,000 | | | 5.000 | | | | 04/01/21 | | | | 4,211,000 | |
| |
| | | | | | | | | | |
Principal
Amount | | Interest
Rate | | | Maturity
Date | | Value | |
|
| Municipal Bond Obligations – (continued) | |
Missouri – (continued) | |
Missouri State Health & Educational Facilities Authority Revenue Bonds (Refunding-Children’s Mercy Hospital) Series 2016
(A+/NR)(b) | |
| $1,250,000 | | | 4.000 | % | | 05/15/33 | | $ | 1,368,612 | |
|
| Missouri State Health & Educational Facilities Authority Revenue Bonds(Refunding-The Children’s Mercy Hospital) Series 2016 (A+/NR)(b) | |
| 1,250,000 | | | 4.000 | | | 05/15/39 | | | 1,347,762 | |
|
| Missouri State Health & Educational Facilities Authority Revenue Bonds (St. Louis College of Pharmacy) Series B (BBB/NR)(b) | |
| 500,000 | | | 5.000 | | | 05/01/30 | | | 544,155 | |
| 1,410,000 | | | 5.000 | | | 05/01/40 | | | 1,508,926 | |
|
| Missouri State Health & Educational Facilities Authority Revenue Bonds (St. Lukes Health System) Series A (AGM) (AA/A1) | |
| 1,000,000 | | | 5.000 | | | 11/15/19 | | | 1,001,130 | |
|
Missouri State Health & Educational Facilities Authority Revenue Bonds (Variable-Ascension Health Senior Credit Group)
SeriesC5-REMK (AA+/Aa2)(b)(d) | |
| 3,375,000 | | | 1.130 | | | 11/15/26 | | | 3,375,000 | |
|
| Missouri State Health & Educational Facilities Authority Revenue Bonds(Variable-The Washington University) Series A (JP Morgan Chase Bank SPA) (AA+/Aa1)(b)(d) | |
| 5,000,000 | | | 1.200 | | | 09/01/30 | | | 5,000,000 | |
|
Missouri State Health & Educational Facilities Authority Revenue Bonds(Variable-The Washington University)
Series B (AA+/Aa1)(b)(d) | |
| 2,500,000 | | | 1.200 | | | 09/01/30 | | | 2,500,000 | |
|
| Missouri State Housing Development Commission Multi Family Housing Revenue Bonds (Courthouse Apartments LLC)Series 2009-1 (FHA) (AA+/NR)(b) | |
| 610,000 | | | 5.250 | | | 07/01/42 | | | 614,050 | |
|
| Missouri State Housing Development Commission Multi Family Housing Revenue Bonds (Samantha Heights Apartments Project) Series 2 (FHA) (AA+/NR)(b) | |
| 500,000 | | | 4.375 | | | 07/01/30 | | | 514,705 | |
|
| Missouri State Housing Development Commission Single Family Mortgage Revenue Bonds (First Place Homeownership Loan Program) Series B (GNMA/FNMA/FHLMC) (AA+/NR)(b) | |
| 565,000 | | | 2.400 | | | 11/01/30 | | | 574,605 | |
| 550,000 | | | 2.500 | | | 05/01/31 | | | 560,241 | |
| 580,000 | | | 2.550 | | | 11/01/31 | | | 591,275 | |
|
| Missouri State Housing Development Commission Single Family Mortgage Revenue Bonds (Homeownership Loan Program)Series B-2 (GNMA/FNMA/FHLMC) (AA+/NR)(b) | |
| 1,255,000 | | | 3.550 | | | 11/01/30 | | | 1,334,128 | |
|
| Missouri State Housing Development Commission Single Family Mortgage Revenue Bonds (Homeownership Loan Program) Series D (GNMA/FNMA/FHLMC) (AA+/NR) | |
| 505,000 | | | 2.000 | | | 11/01/21 | | | 509,479 | |
| 470,000 | | | 3.050 | (b) | | 11/01/28 | | | 500,329 | |
| 405,000 | | | 3.150 | (b) | | 11/01/29 | | | 431,540 | |
| 465,000 | | | 3.250 | (b) | | 11/01/30 | | | 496,211 | |
| |
| | |
| The accompanying notes are an integral part of these financial statements. | | 53 |
COMMERCE MISSOURI TAX-FREE INTERMEDIATE BOND FUND
Schedule of Investments(continued)
October 31, 2019
| | | | | | | | | | |
Principal
Amount | | Interest
Rate | | | Maturity
Date | | Value | |
|
| Municipal Bond Obligations – (continued) | |
Missouri – (continued) | |
| Missouri State Housing Development Commission Single Family Mortgage Revenue Bonds (Special Homeownership Loan Program Market Bonds) SeriesE-1 (GNMA/FNMA/FHLMC) (AA+/NR)(b) | |
| $ 60,000 | | | 3.950 | % | | 05/01/21 | | $ | 60,000 | |
| 70,000 | | | 3.950 | | | 11/01/21 | | | 70,000 | |
|
| Missouri State Housing Development Commission Single Family Mortgage Revenue Bonds (Special Homeownership Loan Program)(Non-AMT) SeriesE-4 (GNMA/FNMA/FHLMC) (AA+/NR)(b) | |
| 180,000 | | | 3.600 | | | 11/01/23 | | | 184,966 | |
| 245,000 | | | 3.750 | | | 05/01/24 | | | 252,137 | |
| 205,000 | | | 3.800 | | | 05/01/25 | | | 210,578 | |
|
| Missouri State of Health & Educational Facilities Authority Revenue Bonds (Refunding) Series A (NR/A2)(b) | |
| 3,750,000 | | | 5.000 | | | 11/15/32 | | | 4,373,175 | |
|
| Missouri State Public Utilities Commission Revenue Notes Series 2019 (NR/MIG1)(b) | |
| 1,350,000 | | | 1.500 | | | 03/01/21 | | | 1,352,092 | |
|
| Missouri State University Auxiliary Enterprise System Revenue Bonds (Refunding) Series A (A+/A1)(b) | |
| 2,835,000 | | | 4.000 | | | 04/01/26 | | | 3,005,837 | |
|
| Nixa MO Public Schools GO Bonds (Direct Deposit Program) (Refunding) Series 2019 (AA+/NR)(b) | |
| 500,000 | | | 4.000 | | | 03/01/33 | | | 568,020 | |
| 800,000 | | | 4.000 | | | 03/01/34 | | | 905,296 | |
|
| Nodaway County MO Industrial Development Authority Educational Facilities Revenue Bonds (Variable-Northwest Foundation, Inc.) Series 2008(AA-/NR)(b)(d) | |
| 3,240,000 | | | 1.120 | | | 11/01/28 | | | 3,240,000 | |
|
| Northwest Missouri State University Revenue Bonds (Housing System) (NR/A3)(b) | |
| 2,750,000 | | | 4.000 | | | 06/01/26 | | | 2,903,917 | |
| 2,925,000 | | | 4.000 | | | 06/01/27 | | | 3,082,423 | |
| 1,000,000 | | | 4.000 | | | 06/01/28 | | | 1,051,410 | |
|
| O’Fallon MO Special Obligation Revenue Bonds Series 2012(AA-/NR)(b) | |
| 1,135,000 | | | 4.000 | | | 11/01/22 | | | 1,198,912 | |
|
| OTC Public Building Corp. MO Build America Bonds Revenue Bonds Series 2010 (AGM) (AA/NR)(b) | |
| 1,000,000 | | | 6.400 | | | 03/01/30 | | | 1,013,920 | |
|
| Ozark MO Certificates of Participation Series 2014 (A+/NR)(b) | |
| 500,000 | | | 5.000 | | | 09/01/44 | | | 553,660 | |
|
| Ozark MO Reorganized School District No.R-6 GO Bonds (Direct Deposit Program) (Refunding & Improvement) Series 2015 (AA+/NR)(b) | |
| 1,000,000 | | | 4.000 | | | 03/01/30 | | | 1,073,990 | |
| 1,000,000 | | | 4.000 | | | 03/01/34 | | | 1,063,840 | |
| 1,500,000 | | | 4.000 | | | 03/01/35 | | | 1,591,515 | |
|
| Platte County MOR-3 School District Building Corp. Leasehold Revenue Bonds (School Project)(AA-/NR)(b) | |
| 1,000,000 | | | 4.000 | | | 04/01/23 | | | 1,062,350 | |
| 550,000 | | | 4.000 | | | 04/01/28 | | | 582,533 | |
| |
| | | | | | | | | | |
Principal
Amount | | Interest
Rate | | | Maturity
Date | | Value | |
|
| Municipal Bond Obligations – (continued) | |
Missouri – (continued) | |
| Platte County MOR-3 School District Building Corp. Leasehold Revenue Bonds (School Project)(AA-/NR)(b) – (continued) | |
| $ 800,000 | | | 4.000 | % | | 04/01/29 | | $ | 848,800 | |
| 1,475,000 | | | 4.000 | | | 04/01/30 | | | 1,562,246 | |
|
| Rolla MO Certificates of Participation Series B (A+/NR)(b) | |
| 225,000 | | | 3.150 | | | 07/01/27 | | | 232,346 | |
| 410,000 | | | 3.450 | | | 07/01/32 | | | 421,341 | |
|
| Saint Louis MO Airport Revenue Bonds(Lambert-St. Louis International Airport) Series 2005 (NPFG) (A/A2) | |
| 2,135,000 | | | 5.500 | | | 07/01/28 | | | 2,788,139 | |
|
| Saint Louis MO Airport Revenue Bonds (Refunding-St. Louis Lambert International Airport) Series C (A/A2) | |
| 500,000 | | | 5.000 | | | 07/01/27 | | | 621,070 | |
| 1,000,000 | | | 5.000 | | | 07/01/28 | | | 1,265,800 | |
|
| Saint Louis MO Special Administrative Board of the Transitional School District GO Bonds (Direct Deposit Program) Series 2012 (AA+/NR)(b) | |
| 3,000,000 | | | 4.000 | | | 04/01/23 | | | 3,194,430 | |
|
| Saint Louis MO Special Administrative Board of the Transitional School District GO Bonds (Direct Deposit Program) Series A (AA+/NR)(b) | |
| 1,300,000 | | | 4.000 | | | 04/01/23 | | | 1,384,253 | |
|
| Saint Louis MO Special Administrative Board of the Transitional School District GO Bonds (Direct Deposit Program) Series B (AA+/NR)(b)(c) | |
| 1,000,000 | | | 4.000 | | | 04/01/21 | | | 1,039,550 | |
|
| Southern Platte MO Fire Protection District Series 2018 (NR/Aa2)(b) | |
| 540,000 | | | 4.000 | | | 03/01/38 | | | 596,176 | |
|
Springfield MO Public Utility Revenue Bonds (Refunding)
Series 2015 (AA+/NR)(b) | |
| 1,310,000 | | | 4.000 | | | 08/01/31 | | | 1,463,506 | |
|
| Springfield MO Special Obligation Revenue Bonds (Refunding) Series A (NR/Aa2) | |
| 925,000 | | | 2.000 | | | 05/01/21 | | | 936,868 | |
|
| Springfield MO Special Obligation Revenue Bonds (Refunding) Series B (AMT) (NR/Aa2) | |
| 2,275,000 | | | 5.000 | | | 07/01/27 | | | 2,801,935 | |
| 1,220,000 | | | 5.000 | (b) | | 07/01/28 | | | 1,497,391 | |
| 1,400,000 | | | 5.000 | (b) | | 07/01/30 | | | 1,697,262 | |
|
| Springfield MO Special Obligation Revenue Bonds (Refunding) Series B (NR/Aa3) | |
| 1,335,000 | | | 2.000 | | | 05/01/21 | | | 1,351,541 | |
| 1,000,000 | | | 4.000 | (b) | | 05/01/26 | | | 1,081,170 | |
| 1,405,000 | | | 4.000 | (b) | | 05/01/27 | | | 1,515,840 | |
|
| Springfield MO Special Obligation Revenue Bonds (Sewer Systems Improvement Project) Series 2012 (NR/Aa2) | |
| 1,275,000 | | | 5.000 | | | 04/01/22 | | | 1,390,069 | |
| 1,340,000 | | | 5.000 | (b) | | 04/01/23 | | | 1,460,935 | |
|
| St. Charles County MO Public Water Supply District No. 2 Certificates of Participation (Refunding) Series 2016 (AA+/NR)(b) | |
| 1,000,000 | | | 4.000 | | | 12/01/31 | | | 1,113,070 | |
| |
| | |
| 54 | | The accompanying notes are an integral part of these financial statements. |
COMMERCE MISSOURI TAX-FREE INTERMEDIATE BOND FUND
| | | | | | | | | | |
Principal
Amount | | Interest
Rate | | | Maturity
Date | | Value | |
|
| Municipal Bond Obligations – (continued) | |
Missouri – (continued) | |
| St. Charles MO Certificates of Participation Build America Bonds Series B (NR/Aa3)(b) | |
| $1,250,000 | | | 5.650 | % | | 02/01/30 | | $ | 1,282,650 | |
|
| St. Charles MO Certificates of Participation Series 2012 (NR/A1)(b) | |
| 1,000,000 | | | 3.000 | | | 05/01/22 | | | 1,001,250 | |
|
| St. Joseph MO Industrial Development Authority Special Obligation Revenue Bonds (Refunding) (Sewer System Improvements Project) Series B (A+/NR)(b) | |
| 1,085,000 | | | 5.000 | | | 04/01/26 | | | 1,277,566 | |
|
| St. Louis County MO Community College District Certificates of Participation Series 2017 (AA/NR)(b) | |
| 1,000,000 | | | 4.000 | | | 04/01/35 | | | 1,123,600 | |
| 2,000,000 | | | 4.000 | | | 04/01/36 | | | 2,234,480 | |
| 2,515,000 | | | 4.000 | | | 04/01/37 | | | 2,801,961 | |
|
| St. Louis County MO Library District Certificates of Participation (AA/Aa2)(b) | |
| 1,855,000 | | | 4.000 | | | 04/01/25 | | | 2,003,474 | |
| 1,930,000 | | | 4.000 | | | 04/01/26 | | | 2,083,396 | |
| 2,010,000 | | | 4.000 | | | 04/01/27 | | | 2,167,986 | |
|
| St. Louis County MO Parkway School District No.C-2 GO Bonds Series B (AAA/NR)(b) | |
| 1,000,000 | | | 4.000 | | | 03/01/32 | | | 1,109,370 | |
|
| St. Louis County MO Regional Convention & Sports Complex Authority Revenue Bonds (Refunding-Convention & Sports Facilities) Series B (AA/NR) | |
| 875,000 | | | 5.000 | | | 08/15/20 | | | 901,224 | |
|
| St. Louis County MO Special School District Certificates of Participation (Lease) Series B (AA/NR)(b) | |
| 1,735,000 | | | 4.000 | | | 04/01/26 | | | 1,837,851 | |
|
| St. Louis MO Airport Revenue Bonds (Refunding-Lambert International Airport) Series 2012 (AMT) (A/A2)(b) | |
| 1,280,000 | | | 5.000 | | | 07/01/23 | | | 1,399,322 | |
|
| St. Louis MO Junior College District Building Corp. Leasehold Revenue Bonds (Refunding) (AA/NR) | |
| 750,000 | | | 3.000 | | | 04/01/21 | | | 768,900 | |
| 800,000 | | | 3.000 | | | 04/01/22 | | | 828,904 | |
| 800,000 | | | 3.000 | (b) | | 04/01/23 | | | 829,448 | |
|
| St. Louis MO Muni Finance Corp. (Refunding-Carnahan Court House) Series A (A/NR) | |
| 2,710,000 | | | 5.000 | | | 02/15/27 | | | 3,286,227 | |
|
| St. Louis MO Municipal Finance Corporation Revenue Bonds Series A (A/NR) | |
| 1,320,000 | | | 5.000 | | | 04/15/25 | | | 1,550,234 | |
| 1,390,000 | | | 5.000 | | | 04/15/26 | | | 1,664,511 | |
|
| St. Louis MO Municipal Finance Corporation Sales Tax Leasehold Revenue Bonds (Refunding) Series 2016 (A/NR) | |
| 1,000,000 | | | 5.000 | | | 02/15/24 | | | 1,142,480 | |
| 2,595,000 | | | 4.000 | (b) | | 02/15/35 | | | 2,831,093 | |
| |
| | | | | | | | | | |
Principal
Amount | | Interest
Rate | | | Maturity
Date | | Value | |
|
| Municipal Bond Obligations – (continued) | |
Missouri – (continued) | |
| St. Louis MO Special Administrative Board of the Transitional School District GO Bonds (Direct Deposit Program) Series 2017 (AA+/NR)(b) | |
| $1,000,000 | | | 4.000 | % | | 04/01/29 | | $ | 1,134,890 | |
| 1,000,000 | | | 4.000 | | | 04/01/30 | | | 1,126,940 | |
|
| St. Peters MO Certificates of Participation (Refunding) Series 2013 (NR/Aa3)(b) | |
| 695,000 | | | 3.250 | | | 05/01/21 | | | 701,999 | |
|
Stone County MO Reorganized School District No. 4(Refunding - MO Direct Deposit Program) Series 2016
(AA+/NR)(b) | |
| 1,725,000 | | | 4.000 | | | 03/01/33 | | | 1,905,832 | |
| 1,840,000 | | | 4.000 | | | 03/01/34 | | | 2,029,373 | |
|
| Truman MO State University Housing Society Revenue Bonds (Refunding-Revenue) Series 2016 (NR/A1)(b) | |
| 865,000 | | | 3.000 | | | 06/01/25 | | | 919,279 | |
|
| Truman State University MO Housing System Revenue Bonds (Refunding) (NR/A1)(b) | |
| 765,000 | | | 4.000 | | | 06/01/21 | | | 776,437 | |
|
| University MO School District GO Bonds (Refunding) (Direct Deposit Program) Series 2017 (AA+/NR) | |
| 1,760,000 | | | 4.000 | | | 02/15/26 | | | 2,040,403 | |
|
| Valley Park MO Fire Protection District GO Bonds Series 2019 (AA/NR) | |
| 360,000 | | | 4.000 | | | 03/01/25 | | | 408,733 | |
| 535,000 | | | 4.000 | | | 03/01/26 | | | 617,909 | |
| 555,000 | | | 4.000 | | | 03/01/27 | | | 651,520 | |
| 450,000 | | | 4.000 | (b) | | 03/01/35 | | | 508,401 | |
| 500,000 | | | 4.000 | (b) | | 03/01/37 | | | 561,995 | |
| 755,000 | | | 4.000 | (b) | | 03/01/39 | | | 844,316 | |
|
| Webster County MO Marshfield School District No.R-1 GO Bonds (Direct Deposit Program) Series A (AA+/NR)(b) | |
| 500,000 | | | 4.000 | | | 03/01/32 | | | 586,185 | |
| 890,000 | | | 4.000 | | | 03/01/33 | | | 1,035,924 | |
|
| Wentzville MO Certificates of Participation (Refunding) Series 2015 (NR/A1) | |
| 1,160,000 | | | 4.000 | | | 08/01/25 | | | 1,315,011 | |
| 1,000,000 | | | 4.000 | (b) | | 08/01/26 | | | 1,128,900 | |
|
| Wentzville MO School District No. 4 (Refunding) (Direct Deposit Program) Series 2016 (AA+/Aa1)(a)(b) | |
| 2,000,000 | | | 0.000 | | | 03/01/26 | | | 1,764,640 | |
| 2,095,000 | | | 0.000 | | | 03/01/27 | | | 1,775,869 | |
|
| Wentzville MO School District No. 4 (Refunding) (Direct Deposit Program) Series 2017 (AA+/Aa1)(b) | |
| 3,200,000 | | | 4.000 | | | 03/01/29 | | | 3,654,336 | |
|
| WentzvilleR-IV School District MO Lease Certificates of Participation (Refunding & Improvement Certificates) Series 2016 (NR/Aa3)(b) | |
| 1,810,000 | | | 4.000 | | | 04/01/32 | | | 1,987,054 | |
| 1,800,000 | | | 4.000 | | | 04/01/33 | | | 1,962,720 | |
| 1,800,000 | | | 4.000 | | | 04/01/34 | | | 1,959,750 | |
|
| WentzvilleR-IV School District MO Lease Certificates of Participation Series 2015 (NR/Aa3) | |
| 565,000 | | | 5.000 | | | 04/01/24 | | | 651,914 | |
| 990,000 | | | 4.000 | (b) | | 04/01/25 | | | 1,096,148 | |
| |
| | |
| The accompanying notes are an integral part of these financial statements. | | 55 |
COMMERCE MISSOURI TAX-FREE INTERMEDIATE BOND FUND
Schedule of Investments(continued)
October 31, 2019
| | | | | | | | | | |
Principal
Amount | | Interest
Rate | | | Maturity
Date | | Value | |
|
| Municipal Bond Obligations – (continued) | |
Missouri – (continued) | |
| Wright City MO Industrial Revenue Bonds (Variable-Watlow Process System, Inc.) Series 2002 (A+/NR)(b)(d) | |
| $ 460,000 | | | 1.310 | % | | 04/01/32 | | $ | 460,000 | |
| | | | | | | | | | |
| | | | | | | | | 319,170,341 | |
| |
North Dakota(b) – 0.8% | |
| North Dakota State Housing Finance Agency Homeownership Revenue Bonds (Home Mortgage Finance Program) Series C (NR/Aa2) | |
| 2,310,000 | | | 2.600 | | | 07/01/28 | | | 2,388,910 | |
| 530,000 | | | 3.150 | | | 01/01/36 | | | 545,184 | |
| | | | | | | | | | |
| | | | | | | | | 2,934,094 | |
| |
Pennsylvania – 1.6% | |
| Delaware County Authority University Revenue Bonds for Neumann University (BBB/NR)(b) | |
| 1,000,000 | | | 5.000 | | | 10/01/25 | | | 1,033,820 | |
|
| Philadelphia PA Authority for Industrial Development Pension Funding Revenue Bonds (Zero Coupon-Retirement) Series 1999 (AGM/AMBAC) (AA/A2)(a) | |
| 4,709,000 | | | 0.000 | | | 04/15/20 | | | 4,670,716 | |
| | | | | | | | | | |
| | | | | | | | | 5,704,536 | |
| |
Tennessee – 0.4% | |
| Knox County Health Educational & Housing Facility Board Revenue Bonds (Refunding) (University Health Systems, Inc.) Series 2017 (BBB/NR) | |
| 1,500,000 | | | 3.375 | | | 04/01/26 | | | 1,614,600 | |
| |
| TOTAL MUNICIPAL BOND OBLIGATIONS | |
(Cost $342,551,793) | | $ | 357,556,428 | |
| |
| | | | | | | | | | |
| Shares | | Dividend
Rate | | | | | Value | |
|
| Investment Company – 1.7% | |
| State Street Institutional US Government Money Market Fund — Premier Class | |
| 6,079,847 | | | 1.741 | % | | | | $ | 6,079,847 | |
(Cost $6,079,847) | | | | |
| |
| TOTAL INVESTMENTS – 99.4% | |
(Cost $348,631,640) | | $ | 363,636,275 | |
| |
OTHER ASSETS IN EXCESS OF
LIABILITIES – 0.6% | | | 2,202,931 | |
| |
NET ASSETS – 100.0% | | $ | 365,839,206 | |
| |
| | |
|
| The percentage shown for each investment category reflects the value of investments in that category as a percentage of net assets. |
| |
| (a) | | Security issued with a zero coupon. The actual effective yield of this security is different than the stated coupon due to the accretion of discount. |
| |
| (b) | | Security with “Call” features with resetting interest rates. |
| |
| (c) | | Prerefunded security. Maturity date disclosed is prerefunding date. |
| | |
| |
| (d) | | Rate shown is that which is in effect on October 31, 2019. Certain variable rate securities are not based on a published reference rate and spread but are determined by the issuer or agent and are based on current market conditions. |
|
| Security ratings disclosed, if any, are issued by S&P Global Ratings/Moody’s Investors Service and are unaudited. A description of the ratings is available in the Fund’s Statement of Additional Information. |
| | |
|
| Investment Abbreviations: |
| AGM | | —Insuredby Assured Guaranty Municipal Corp. |
| AMBAC | | —Insuredby American Municipal Bond Assurance Corp. |
| AMT | | —AlternativeMinimum Tax |
| FHA | | —Insuredby Federal Housing Administration |
| FHLMC | | —FederalHome Loan Mortgage Corp. |
| FNMA | | —FederalNational Mortgage Association |
| GNMA | | —GovernmentNational Mortgage Association |
| GO | | —GeneralObligation |
| LLC | | —LimitedLiability Company |
| Non-ACE | | —Non-AdjustCurrent Earnings |
| Non-AMT | | —Non-AlternativeMinimum Tax |
| NR | | —Not Rated |
| SPA | | —Stand-by Purchase Agreement |
|
PORTFOLIO COMPOSITION
| | | | | | | | |
| | | AS OF
10/31/19 | | | AS OF
10/31/18 | |
| |
Lease | | | 28.8 | % | | | 25.0 | % |
General Obligation | | | 22.0 | | | | 20.4 | |
Education | | | 11.7 | | | | 11.6 | |
Hospital | | | 10.3 | | | | 10.6 | |
Limited Tax | | | 7.3 | | | | 7.3 | |
Single Family Housing | | | 4.6 | | | | 6.3 | |
Water/Sewer | | | 3.5 | | | | 3.6 | |
Prerefunded/Escrow to Maturity | | | 2.7 | | | | 8.3 | |
Power | | | 2.2 | | | | 1.0 | |
Transportation | | | 2.0 | | | | 2.1 | |
Investment Company | | | 1.7 | | | | — | |
Crossover | | | 1.2 | | | | 1.2 | |
Not For Profit | | | 1.0 | | | | 0.8 | |
Multi Family Housing | | | 0.3 | | | | 0.7 | |
Industrial Development Revenue/ Pollution Control Revenue | | | 0.1 | | | | 0.2 | |
Repurchase Agreement | | | — | | | | 0.3 | |
| |
| TOTAL INVESTMENTS | | | 99.4 | % | | | 99.4 | % |
| |
The percentage shown for each investment category reflects the value of investments in that category as a percentage of net assets. Underlying investment categories of investment companies held by the Fund are not reflected in the table above. Consequently, the Fund’s overall investment category allocations may differ from the percentages contained in the table above.
The Fund is actively managed and, as such, its composition may differ over time.
| | |
| 56 | | The accompanying notes are an integral part of these financial statements. |
COMMERCE KANSAS TAX-FREE INTERMEDIATE BOND FUND
Performance Summary
October 31, 2019 (Unaudited)
The following is performance information for the Commerce Kansas Tax-Free Intermediate Bond Fund (“Kansas Tax-Free Intermediate Bond Fund”) for various time periods. The returns represent past performance. Past performance is no guarantee of future results. The Fund’s investment return and principal value will fluctuate so that an investor’s shares, when redeemed, may be worth more or less than their original cost. Performance reflects expense limitations in effect. In their absence, performance would be reduced. Returns do not reflect the deduction of taxes that a shareholder would pay on Fund distributions or the redemption of Fund shares. The Fund is not subject to a sales charge, so a sales charge is not applied to its total returns. In addition to the Adviser’s decisions regarding issuer/industry investment selection and allocation, other factors may affect Fund performance. These factors include, but are not limited to, Fund operating fees and expenses, portfolio turnover, and subscription and redemption cash flows affecting the Fund. Please visit our website at www.commercefunds.com to obtain the most recent month-end returns.
| | | | | | | | |
| | Performance Review |
| | | | |
| | | November 1, 2018 - October 31, 2019 | | Fund Total Return(a) | | Index Total Return(c) | | Index |
| | | | |
| | | Kansas Tax-Free Intermediate Bond Fund | | 7.80% | | 8.64% | | Bloomberg Barclays 3-15 Year Blend Municipal Bond(c) |
Standardized Average Annual Total Return through September 30, 2019(b)
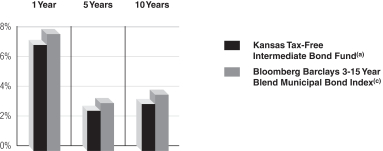
| | | | | | | | |
| | Standardized Average Annual Total Return through September 30,2019(b) | | One Year | | Five Years | | Ten Years |
| | | | |
| | | Kansas Tax-Free Intermediate Bond Fund(a) | | 7.13% | | 2.71% | | 3.15% |
| | | | |
| | | Bloomberg Barclays 3-15 Year Blend Municipal Bond Index(c) | | 7.86% | | 3.23% | | 3.79% |
Kansas Tax-Free Intermediate Bond Fund Lifetime Performance
Performance of a $10,000 Investment, with distributions reinvested, from November 1, 2009 through October 31, 2019.

| | | | | | | | |
| | Average Annual Total Return through October 31, 2019 | | One Year | | Five Years | | Ten Years |
| | | | |
| | | Kansas Tax-Free Intermediate Bond Fund(a) | | 7.80% | | 2.61% | | 3.28% |
| | | | | | |
| | Expense Ratios(d) | | | | |
| | | |
| | | | | Net Expense Ratio (Current) | | Gross Expense Ratio (Before Reimbursements) |
| | | |
| | | Kansas Tax-Free Intermediate Bond Fund | | 0.70% | | 0.77% |
| (a) | | Returns reflect any applicable fee waivers or expense reductions. Returns do not reflect the deduction of taxes that a shareholder would pay on capital gains or other taxable distributions or the redemption of Fund shares. |
| (b) | | The Standardized Average Annual Total Returns are average annual total returns as of the most recent calendar quarter-end. They assume reinvestment of all distributions at NAV. Current performance may be lower or higher than the total return figures in the above charts. |
Returns reflect any fee waivers and expense reductions. Absent these waivers and reductions, returns would have been lower. Returns do not reflect the deduction of taxes that a shareholder would pay on capital gains or other taxable distributions or the redemption of Fund shares.
| (c) | | The Bloomberg Barclays 3-15 Year Blend Municipal Bond Index is an unmanaged index comprised of investment-grade municipal securities ranging from 2 to 17 years in maturity. The Index figures do not reflect any deduction for fees, taxes or expenses. |
| (d) | | The Fund’s expense ratios, both net (net of applicable fee waivers and/or expense reimbursements) and gross (before applicable fee waivers and/or expense reimbursements), set forth above are as of the most recent publicly available prospectus (March 1, 2019) for the Fund and may differ from the expense ratios disclosed in the Financial Highlights in this report. The Adviser has contractually agreed to reduce or limit the Total Annual Fund Operating Expenses, excluding interest, taxes, acquired fund fees and expenses and extraordinary expenses. This agreement will remain in place through March 1, 2020. After this date, the Adviser or the Fund may terminate the contractual arrangement. If this occurs, the expense ratios may change without shareholder approval. |
57
COMMERCE KANSASTAX-FREE INTERMEDIATE BOND FUND
Schedule of Investments
October 31, 2019
| | | | | | | | | | | | |
Principal
Amount | | Interest
Rate | | | Maturity
Date | | | Value | |
|
| Municipal Bond Obligations – 100.5% | |
Alabama(a) – 1.2% | |
| City of Jasper AL GO Bonds (Warrants) Series 2017 (NR/A2) | |
| $ 745,000 | | | 4.000 | % | | | 05/01/29 | | | $ | 845,947 | |
|
| Homewood AL Educational Building Authority Revenue Bonds (Refunding Educational Facilities Samford University) Series A (NR/A3) | |
| 1,000,000 | | | 4.000 | | | | 12/01/35 | | | | 1,095,720 | |
| | | | | | | | | | | | |
| | | | | | | | | | | 1,941,667 | |
| |
Arizona(a) – 0.3% | |
| Arizona Healthcare & Education Facilities Authority Revenue Bonds (Kirksville College)(A-/NR) | |
| 450,000 | | | 5.000 | | | | 01/01/25 | | | | 452,471 | |
| |
California(b) – 2.7% | |
| Burbank CA Unified School District GO Bonds Capital Appreciation Election of 1997 Series C (NPFG)(AA-/Baa2) | |
| 670,000 | | | 0.000 | | | | 07/01/27 | | | | 579,918 | |
|
| Manteca CA Unified School District GO Bonds Capital Appreciation Election 2004 Series 2006 (NPFG) (NR/Aa2) | |
| 2,000,000 | | | 0.000 | | | | 08/01/28 | | | | 1,700,940 | |
|
| San Marcos Unified School District GO Bonds (Capital Appreciation)(AA-/Aa3) | |
| 2,275,000 | | | 0.000 | | | | 08/01/24 | | | | 2,118,412 | |
| | | | | | | | | | | | |
| | | | | | | | | | | 4,399,270 | |
| |
Illinois – 1.4% | |
| Illinois State Housing Development Authority Revenue Bonds (Homeowner Mortgage) SubseriesA-1 (GNMA/FNMA/FHLMC) (AA/Aa2)(a) | |
| 1,000,000 | | | 3.500 | | | | 08/01/31 | | | | 1,070,720 | |
|
| Lake County IL Community Consolidated School District No. 73 Hawthorn GO Bonds (Refunding) Series B (AA+/NR)(a) | |
| 1,000,000 | | | 4.000 | | | | 01/01/33 | | | | 1,117,150 | |
|
| Will County IL Community Unit School District No. 201 Crete-Monee GO Bonds (Capital Appreciation) Series 2004 (NPFG) (NR/Baa2)(b) | |
| 30,000 | | | 0.000 | | | | 11/01/19 | | | | 30,000 | |
| | | | | | | | | | | | |
| | | | | | | | | | | 2,217,870 | |
| |
Indiana(a) – 1.1% | |
| Carmel IN Local Public Improvement Bond Bank Revenue Bonds SeriesB-1 (AA/NR) | |
| 440,000 | | | 4.000 | | | | 01/15/35 | | | | 496,602 | |
|
| Wabash City IN Schools Building Corp. Revenue Bonds Series 2019 (AA+/NR) | |
| 1,050,000 | | | 4.000 | | | | 07/15/30 | | | | 1,218,766 | |
| | | | | | | | | | | | |
| | | | | | | | | | | 1,715,368 | |
| |
Kansas – 85.2% | |
| Allen County KS Public Building Community Revenue Bonds (Allen County Hospital Project) Series 2012 (A/NR)(a)(c) | |
| 3,425,000 | | | 5.000 | | | | 12/01/22 | | | | 3,820,040 | |
| |
| | | | | | | | | | | | |
Principal
Amount | | Interest
Rate | | | Maturity
Date | | | Value | |
|
| Municipal Bond Obligations – (continued) | |
Kansas – (continued) | |
| Arkansas City KS Public Building Commission Revenue Bonds (Refunding) Series 2019 (A/NR) | |
| $ 560,000 | | | 5.000 | % | | | 09/01/27 | | | $ | 689,136 | |
| 585,000 | | | 5.000 | | | | 09/01/28 | | | | 730,308 | |
| 415,000 | | | 5.000 | (a) | | | 09/01/29 | | | | 514,704 | |
|
| Blue Valley KS Recreation Commission Certificates of Participation (Recreation Facilities) (AGM) (AA/Aa2)(a) | |
| 800,000 | | | 4.000 | | | | 10/01/27 | | | | 902,104 | |
|
| Bourbon County KS Unified School District No.234-Fort Scott GO Bonds Series 2014 (A/NR) | |
| 900,000 | | | 5.000 | | | | 09/01/23 | | | | 1,017,882 | |
|
| Butler County KS Unified School District No. 385 GO Bonds (Refunding-School Building) Series 2017(AA-/Aa3)(a) | |
| 1,000,000 | | | 4.000 | | | | 09/01/30 | | | | 1,152,920 | |
| 500,000 | | | 4.000 | | | | 09/01/31 | | | | 573,930 | |
|
| Chisholm Creek Utility Authority KS Water and Wastewater Facilities Revenue Bonds (Refunding — Bel Aire & Park City Project) Series 2017 (AGM) (AA/NR) | |
| 1,315,000 | | | 5.000 | | | | 09/01/26 | | | | 1,598,764 | |
| 1,305,000 | | | 4.000 | (a) | | | 09/01/28 | | | | 1,504,835 | |
|
| Chisholm Creek Utility Authority KS Water and Wastewater Facilities Revenue Bonds (Refunding) (AMBAC) (NR/WR) | |
| 1,000,000 | | | 5.250 | | | | 09/01/24 | | | | 1,163,160 | |
|
| City of Abilene KS Public Building Commission Revenue Bonds (Refunding-Hospital District No. 1) Series 2017(AA-/NR)(a) | |
| 600,000 | | | 4.000 | | | | 12/01/29 | | | | 685,566 | |
| 650,000 | | | 4.000 | | | | 12/01/30 | | | | 739,011 | |
|
| City of Abilene KS Public Building Commission Revenue Bonds Series 2011(AA-/NR)(a)(c) | |
| 595,000 | | | 4.150 | | | | 12/01/19 | | | | 596,297 | |
|
| City of Dodge KS GO Bonds (Refunding) Series B (A+/NR) | |
| 670,000 | | | 4.000 | | | | 09/01/26 | | | | 770,091 | |
| 740,000 | | | 4.000 | (a) | | | 09/01/28 | | | | 853,901 | |
|
| City of Manhattan KS Hospital Revenue Bonds (Refunding-Mercy Regional Hospital Center, Inc.) Series 2013 (A+/NR)(a) | |
| 2,000,000 | | | 5.000 | | | | 11/15/29 | | | | 2,183,400 | |
|
| City of Mulvane KS GO Bonds (Refunding) Series A(AA-/NR) | |
| 500,000 | | | 5.000 | | | | 09/01/25 | | | | 598,485 | |
|
| City of Salina KS Water & Sewage System Revenue Bonds (Refunding) Series A (NR/Aa3)(a) | |
| 495,000 | | | 3.000 | | | | 10/01/27 | | | | 536,144 | |
| 350,000 | | | 3.000 | | | | 10/01/28 | | | | 375,991 | |
| 300,000 | | | 3.000 | | | | 10/01/29 | | | | 319,854 | |
|
| City of Topeka KS Combined Utility Revenue Bonds (Build America Bonds)(PMT-Recovery Zone Economic Development) Series 2010 (NR/Aa3)(a) | |
| 250,000 | | | 5.250 | | | | 08/01/40 | | | | 254,455 | |
|
| City of Topeka KS Combined Utility Revenue Bonds (Refunding) Series A (NR/Aa3)(a) | |
| 445,000 | | | 3.000 | | | | 08/01/28 | | | | 483,039 | |
| 525,000 | | | 3.000 | | | | 08/01/29 | | | | 565,268 | |
| |
| | |
| 58 | | The accompanying notes are an integral part of these financial statements. |
| | | | | | | | | | | | |
Principal
Amount | | Interest
Rate | | | Maturity
Date | | | Value | |
|
| Municipal Bond Obligations – (continued) | |
Kansas – (continued) | |
| City of Topeka KS GO Bonds (Refunding) Series A (AA/NR)(a) | |
| $2,000,000 | | | 2.000 | % | | | 08/15/28 | | | $ | 2,020,700 | |
|
| County of Shawnee KS Certificates of Participation First Responders Communications Projects Series 2012 (NR/Aa2)(a)(c) | |
| 1,145,000 | | | 4.000 | | | | 09/01/20 | | | | 1,172,274 | |
|
| Dickinson County KS Public Building Commission Revenue Bonds Series 2018(AA-/NR)(a) | |
| 1,550,000 | | | 3.250 | | | | 08/01/33 | | | | 1,658,795 | |
| 1,000,000 | | | 5.000 | | | | 08/01/44 | | | | 1,214,860 | |
|
| Dickinson County KS Unified School District No. 435 GO Bonds (Taxable-Refunding) Series 2019 (A+/NR)(a)(d) | |
| 375,000 | | | 2.950 | | | | 09/01/32 | | | | 372,971 | |
|
| Dodge City KS Revenue Bonds (Refunding & Improvement) Series B (A+/NR) | |
| 1,815,000 | | | 4.000 | | | | 09/01/20 | | | | 1,856,418 | |
|
| Finney County Unified School District No. 457 GO Bonds (Refunding) Series A (A+/NR)(a) | |
| 1,530,000 | | | 4.000 | | | | 09/01/30 | | | | 1,720,286 | |
|
| Franklin County KS Unified School District No. 290 GO Bonds Series A (NR/A1)(a) | |
| 1,720,000 | | | 5.000 | | | | 09/01/32 | | | | 2,020,226 | |
| 750,000 | | | 5.000 | | | | 09/01/40 | | | | 876,368 | |
|
| Geary Country KS GO Bonds (Refunding) Series 2016 (A/NR)(a) | |
| 1,000,000 | | | 4.000 | | | | 09/01/29 | | | | 1,127,360 | |
|
| Geary County KS Unified Government GO Bonds (Refunding & Improvement) Series B(AA-/NR)(a) | |
| 380,000 | | | 4.000 | | | | 12/01/26 | | | | 428,579 | |
| 310,000 | | | 5.000 | | | | 12/01/37 | | | | 365,493 | |
|
| Geary County KS Unified School District No. 475 (Taxable) Series C (NR/Aa2)(a) | |
| 865,000 | | | 3.661 | | | | 09/01/32 | | | | 916,485 | |
|
| Johnson & Miami Counties KS Unified School District No. 230 GO Bonds Series A (NR/Aa3)(a) | |
| 1,000,000 | | | 4.000 | | | | 09/01/32 | | | | 1,136,650 | |
|
| Johnson & Miami County KS Unified School District No. 230 GO Bonds (Refunding) Series 2016 (NR/Aa3) | |
| 1,000,000 | | | 5.000 | | | | 09/01/26 | | | | 1,231,030 | |
| 1,000,000 | | | 3.500 | (a) | | | 09/01/30 | | | | 1,090,010 | |
|
| Johnson & Miami County KS Unified School District No. 230 GO Bonds Series B (NR/Aa3)(a) | |
| 1,000,000 | | | 4.000 | | | | 09/01/33 | | | | 1,118,250 | |
|
| Johnson County KS Park & Recreation District Certificates of Participation Series A (NR/Aa2)(a) | |
| 1,000,000 | | | 4.000 | | | | 09/01/23 | | | | 1,070,730 | |
|
| Johnson County KS Public Building Commission Lease Purchase Revenue Bonds (Refunding) Series C (AAA/Aaa) | |
| 500,000 | | | 4.000 | | | | 09/01/20 | | | | 511,830 | |
|
| Johnson County KS Unified School District No. 229 GO Bonds Series A (AA+/Aaa)(a) | |
| 225,000 | | | 4.000 | | | | 10/01/23 | | | | 225,513 | |
| |
| | | | | | | | | | | | |
Principal
Amount | | Interest
Rate | | | Maturity
Date | | | Value | |
|
| Municipal Bond Obligations – (continued) | |
Kansas – (continued) | |
| Johnson County KS Unified School District No. 231 GO Bonds (Improvement) Series2013-A(AA-/NR) | |
| $2,395,000 | | | 5.000 | % | | | 10/01/22 | | | $ | 2,649,229 | |
|
| Johnson County KS Unified School District No. 231 GO Bonds (Refunding & Improvement) Series A(AA-/NR)(a) | |
| 1,500,000 | | | 4.000 | | | | 10/01/36 | | | | 1,648,860 | |
|
| Johnson County KS Unified School District No. 233 GO Bonds (Refunding & Improvement) Series C (AA/Aa2)(a) | |
| 500,000 | | | 5.000 | | | | 09/01/27 | | | | 531,940 | |
|
| Johnson County KS Unified School District No. 233 GO Bonds (Refunding) Series B (AA/Aa2)(a) | |
| 1,000,000 | | | 4.000 | | | | 09/01/31 | | | | 1,134,980 | |
|
| Johnson County KS Unified School District No. 233 GO Bonds (Refunding) Series C (AA/Aa2)(a) | |
| 1,000,000 | | | 4.000 | | | | 09/01/29 | | | | 1,147,990 | |
|
| Johnson County KS Unified School District No. 512 Shawnee Mission GO Bonds (Refunding & Improvement) Series B (NR/Aaa)(a) | |
| 630,000 | | | 4.000 | | | | 10/01/30 | | | | 722,534 | |
|
| Johnson County KS Unified School District No. 512 Shawnee Mission GO Bonds (Refunding) Series A (NR/Aaa)(a) | |
| 1,000,000 | | | 4.000 | | | | 10/01/35 | | | | 1,113,680 | |
|
| Junction City KS GO Bonds (Refunding Water & Sewer System) Series B (A+/NR)(a) | |
| 825,000 | | | 5.500 | | | | 09/01/36 | | | | 883,889 | |
|
| Junction City KS GO Bonds (Refunding) Series A (A+/NR)(a) | |
| 600,000 | | | 5.000 | | | | 09/01/33 | | | | 635,214 | |
| 600,000 | | | 5.000 | | | | 09/01/34 | | | | 634,992 | |
|
| Kansas Development Finance Authority Hospital Revenue Bonds (Refunding-Adventist Health Sunbelt Obligation Group) Series A (AA/Aa2)(a) | |
| 1,500,000 | | | 5.000 | | | | 11/15/32 | | | | 1,622,460 | |
|
| Kansas Development Finance Authority Revenue Bonds (Unrefunded-Sister Leavenworth) Series A(AA-/Aa3)(a) | |
| 440,000 | | | 5.250 | | | | 01/01/25 | | | | 442,851 | |
|
| Kansas Development Finance Authority Revenue Bonds (Wichita University Project) Series A (NR/Aa3)(a) | |
| 525,000 | | | 3.000 | | | | 06/01/23 | | | | 529,694 | |
|
| Kansas Development Finance Authority Revenue Bonds (Wichita University Union Corporation Student Housing Project) SeriesF-1 (NR/Aa3)(a) | |
| 1,000,000 | | | 5.000 | | | | 06/01/24 | | | | 1,057,130 | |
| 790,000 | | | 5.250 | | | | 06/01/42 | | | | 837,092 | |
|
| Kansas Power Pool Electric Utility Revenue Bonds (Dogwood Energy Facilities) Series A (NR/A3) | |
| 500,000 | | | 5.000 | | | | 12/01/19 | | | | 501,350 | |
|
| Kansas State Department of Transportation Highway Revenue Bonds Series 2015 (AA/Aa2)(a) | |
| 1,250,000 | | | 5.000 | | | | 09/01/29 | | | | 1,494,325 | |
| 1,110,000 | | | 5.000 | | | | 09/01/34 | | | | 1,317,603 | |
| |
| | |
| The accompanying notes are an integral part of these financial statements. | | 59 |
COMMERCE KANSASTAX-FREE INTERMEDIATE BOND FUND
Schedule of Investments(continued)
October 31, 2019
| | | | | | | | | | |
Principal
Amount | | Interest
Rate | | | Maturity
Date | | Value | |
|
| Municipal Bond Obligations – (continued) | |
Kansas – (continued) | |
| Kansas State Development Finance Authority Health Facilities Revenue Bonds (Stormont-Vail Healthcare) Series F (NR/A2)(a) | |
| $1,465,000 | | | 5.000 | % | | 11/15/23 | | $ | 1,466,729 | |
|
| Kansas State Development Finance Authority Hospital Revenue Bonds (Prefunded — Adventist Health System/Sunbelt) Series C (NR/NR)(a)(c) | |
| 20,000 | | | 5.500 | | | 11/15/19 | | | 20,025 | |
|
| Kansas State Development Finance Authority Hospital Revenue Bonds (Unrefunded — Adventist Health System/Sunbelt) Series C (AA/Aa2)(a) | |
| 980,000 | | | 5.500 | | | 11/15/23 | | | 981,303 | |
|
| Kansas State Development Finance Authority Revenue Bonds (Department of Commerce) Series K (A+/A1)(a) | |
| 2,000,000 | | | 3.500 | | | 06/01/23 | | | 2,003,120 | |
|
| Kansas State Development Finance Authority Revenue Bonds (Health Facilities) Series F (NR/A2)(a) | |
| 1,000,000 | | | 5.000 | | | 11/15/26 | | | 1,001,180 | |
|
| Kansas State Development Finance Authority Revenue Bonds (Kansas Project) SeriesM-1 (A+/Aa3)(a) | |
| 1,500,000 | | | 5.000 | | | 11/01/20 | | | 1,500,000 | |
| 2,000,000 | | | 5.000 | | | 11/01/27 | | | 2,000,000 | |
|
| Kansas State Development Finance Authority Revenue Bonds (Kansas State Projects) SeriesE-1 (A+/Aa3)(a) | |
| 700,000 | | | 5.000 | | | 11/01/22 | | | 725,368 | |
|
| Kansas State Development Finance Authority Revenue Bonds (Refunding-State of Kansas Project) Series F (A+/Aa3)(a) | |
| 1,895,000 | | | 3.000 | | | 11/01/32 | | | 1,990,697 | |
|
| Kansas State Development Finance Authority Revenue Bonds (University Projects) Series A (A+/Aa3)(a) | |
| 2,000,000 | | | 4.000 | | | 03/01/31 | | | 2,171,520 | |
|
| Kansas State Development Finance Authority Revenue Bonds Series G (A+/Aa3)(a) | |
| 1,000,000 | | | 5.000 | | | 04/01/30 | | | 1,111,720 | |
|
| Lawrence KS Hospital Revenue Bonds (Refunding) (Lawrence Memorial Hospital) Series A (A/NR)(a) | |
| 1,335,000 | | | 4.000 | | | 07/01/37 | | | 1,460,784 | |
|
| Leavenworth County KS Unified School District No. 453 GO Bonds Series A (NR/Aa3)(a) | |
| 1,165,000 | | | 4.000 | | | 09/01/31 | | | 1,315,879 | |
| 500,000 | | | 4.000 | | | 09/01/38 | | | 554,280 | |
|
| Leavenworth County KS Unified School District No. 464 GO Bonds (Refunding & Improvement) Series B (NR/A1)(a) | |
| 500,000 | | | 4.000 | | | 09/01/26 | | | 532,660 | |
|
| Leavenworth County KS Unified School District No. 469 Lansing GO Bonds (Refunding) Series 2016 (NR/A1) | |
| 1,000,000 | | | 4.000 | | | 09/01/26 | | | 1,150,090 | |
|
| Newton KS GO Bonds (Refunding) Series A(AA-/NR)(a) | |
| 1,555,000 | | | 3.000 | | | 09/01/27 | | | 1,629,889 | |
| 1,180,000 | | | 3.000 | | | 09/01/28 | | | 1,232,286 | |
|
| Pratt County KS Public Building Commission Revenue Bonds(AA-/NR) | |
| 300,000 | | | 5.000 | | | 12/01/19 | | | 300,834 | |
| 400,000 | | | 5.000 | | | 12/01/20 | | | 415,396 | |
| |
| | | | | | | | | | | | |
Principal
Amount | | Interest
Rate | | | Maturity
Date | | | Value | |
|
| Municipal Bond Obligations – (continued) | |
Kansas – (continued) | |
| Reno County KS Unified School District No. 313 GO Bonds Series A (NR/A2)(a) | |
| $1,930,000 | | | 4.000 | % | | | 09/01/26 | | | $ | 2,057,168 | |
|
| Riley County KS Unified School District No. 383 GO Bonds (Prerefunded-Refunding) Series 2016 (NR/NR)(a)(c) | |
| 170,000 | | | 3.000 | | | | 09/01/26 | | | | 187,644 | |
|
| Riley County KS Unified School District No. 383 GO Bonds (Unrerefunded-Refunding) Series 2016 (NR/Aa2)(a) | |
| 1,830,000 | | | 3.000 | | | | 09/01/30 | | | | 1,939,178 | |
|
| Scott County KS Unified School District No. 466 GO Bonds Series A (NR/A2)(a) | |
| 920,000 | | | 5.000 | | | | 09/01/28 | | | | 1,088,480 | |
| 965,000 | | | 5.000 | | | | 09/01/29 | | | | 1,139,443 | |
|
| Sedgwick County KS Unified School District No. 260 GO Bonds (Refunding) Series 2016 (NR/Aa3) | |
| 1,000,000 | | | 4.000 | | | | 10/01/30 | | | | 1,200,060 | |
| 1,000,000 | | | 4.000 | | | | 10/01/31 | | | | 1,205,560 | |
|
| Sedgwick County KS Unified School District No. 261 GO Bonds (Unrefunded-Refunding & School Improvement) Series 2007 (AGM) (AA/NR)(a) | |
| 25,000 | | | 5.000 | | | | 11/01/32 | | | | 25,074 | |
|
| Sedgwick County KS Unified School District No. 261 GO Bonds Series 2016 (NR/A1)(a) | |
| 985,000 | | | 3.000 | | | | 11/01/32 | | | | 1,026,409 | |
|
| Sedgwick County KS Unified School District No. 262 GO Bonds (Refunding) Series 2015 (A+/NR)(a) | |
| 800,000 | | | 4.000 | | | | 09/01/25 | | | | 893,536 | |
| 1,500,000 | | | 4.000 | | | | 09/01/26 | | | | 1,666,185 | |
|
| Sedgwick County KS Unified School District No. 262 GO Bonds Series 2016 (A+/NR)(a)(c) | |
| 1,425,000 | | | 5.000 | | | | 09/01/24 | | | | 1,673,705 | |
|
| Sedgwick County KS Unified School District No. 265 GO Bonds (Refunding) Series B (NR/Aa3)(a) | |
| 1,300,000 | | | 4.000 | | | | 10/01/29 | | | | 1,497,717 | |
|
| Sedgwick County KS Unified School District No. 266 GO Bonds Series A (AA/NR)(d) | |
| 300,000 | | | 3.000 | | | | 09/01/26 | | | | 323,727 | |
| 715,000 | | | 4.000 | (a) | | | 09/01/29 | | | | 827,899 | |
|
| Seward County KS Unified School District No. 480 GO Bonds (Refunding & Improvement) (A+/A1)(a)(c) | |
| 1,000,000 | | | 5.000 | | | | 09/01/22 | | | | 1,106,400 | |
|
| Seward County KS Unified School District No. 480 GO Bonds (Refunding) Series 2017 (NR/A1)(a) | |
| 1,000,000 | | | 4.000 | | | | 09/01/28 | | | | 1,158,650 | |
|
| Shawne County KS Unified School District No. 437 GO Bonds (Refunding) Series 2015 (AA/NR)(a) | |
| 910,000 | | | 4.000 | | | | 09/01/27 | | | | 1,032,950 | |
|
| Shawnee County KS Certificates of Participation (Refunding) Series B (NR/Aa2) | |
| 845,000 | | | 3.000 | | | | 09/01/20 | | | | 857,024 | |
|
| Shawnee County KS Certificates of Participation Series 2015 (NR/Aa2)(a) | |
| 485,000 | | | 4.000 | | | | 09/01/30 | | | | 540,663 | |
| |
| | |
| 60 | | The accompanying notes are an integral part of these financial statements. |
| | | | | | | | | | | | |
Principal
Amount | | Interest
Rate | | | Maturity
Date | | | Value | |
|
| Municipal Bond Obligations – (continued) | |
Kansas – (continued) | |
| Shawnee County KS Certificates of Participation Series 2015 (NR/Aa2)(a) – (continued) | |
| $1,000,000 | | | 4.000 | % | | | 09/01/31 | | | $ | 1,112,180 | |
| 1,065,000 | | | 5.000 | | | | 09/01/32 | | | | 1,260,587 | |
|
| Shawnee County KS GO Bonds (Refunding) Series 2015 (NR/Aa1) | |
| 435,000 | | | 3.000 | | | | 09/01/22 | | | | 455,837 | |
| 450,000 | | | 3.000 | | | | 09/01/23 | | | | 477,315 | |
| 490,000 | | | 3.000 | | | | 09/01/25 | | | | 532,272 | |
|
| Shawnee County KS Public Building Commission Revenue Bond (Expocentre Project) Series 2018 (NR/Aa1)(a) | |
| 600,000 | | | 4.000 | | | | 09/01/29 | | | | 698,574 | |
| 650,000 | | | 4.000 | | | | 09/01/30 | | | | 751,959 | |
|
| Shawnee County KS Unified School District No. 345 Seaman GO Bonds (Commercial Mortgage Backed Securities-Refunding-Improvement) Series A (NR/Aa3)(a)(b) | |
| 2,000,000 | | | 0.000 | | | | 09/01/23 | | | | 1,870,100 | |
|
| State of Kansas Department of Transportation High Way Revenue Bonds Series A (AA/Aa2)(a) | |
| 1,250,000 | | | 5.000 | | | | 09/01/32 | | | | 1,552,350 | |
|
| Topeka KS Combined Utility Revenue Bonds Series A (NR/Aa3)(a) | |
| 545,000 | | | 4.000 | | | | 08/01/27 | | | | 629,807 | |
|
| Topeka KS Public Building Commission Revenue Bonds (Refunding 10th & Jackson Project) Series A (NPFG) (A+/Baa2)(a) | |
| 1,000,000 | | | 5.000 | | | | 06/01/23 | | | | 1,012,890 | |
|
| Topeka KS Public Building Commission Revenue Bonds (Refunding Department of Social and Rehabilitation Project) Series B (NPFG) (A+/Baa2)(a) | |
| 300,000 | | | 5.000 | | | | 06/01/23 | | | | 303,867 | |
| 475,000 | | | 5.000 | | | | 06/01/24 | | | | 481,118 | |
|
| University of Kansas Hospital Authority (Health Facilities) Revenue Bonds Series A(AA-/NR)(a) | |
| 1,930,000 | | | 5.000 | | | | 09/01/48 | | | | 2,333,505 | |
|
| University of Kansas Hospital Authority (Refunding-Health Facilities) Revenue Bonds Series B(AA-/NR)(d) | |
| 1,500,000 | | | 5.000 | | | | 03/01/28 | | | | 1,873,980 | |
|
| Washburn University KS Revenue Bonds Series 2014 (Refunding) (NR/A1) | |
| 435,000 | | | 3.000 | | | | 07/01/20 | | | | 440,172 | |
| 460,000 | | | 3.000 | | | | 07/01/22 | | | | 480,562 | |
|
| Wichita KS GO Bonds(AMT-Airport) Series C (AA+/Aa1) | |
| 590,000 | | | 5.000 | | | | 12/01/25 | | | | 706,407 | |
|
| Wichita KS GO Bonds Series B (AMT) (AA+/Aa1)(a) | |
| 940,000 | | | 4.000 | | | | 12/01/42 | | | | 1,038,832 | |
|
| Wichita KS Sales Tax Special Obligation Revenue Bonds (River District Stadium Star Bond Project) Series 2018 (NR/Aa3)(a) | |
| 1,000,000 | | | 5.000 | | | | 09/01/32 | | | | 1,224,630 | |
|
| Wichita KS Water & Sewer Utility Revenue Bonds (Refunding) Series B(AA-/NR)(a) | |
| 415,000 | | | 4.000 | | | | 10/01/26 | | | | 466,423 | |
|
| Wichita KS Water & Sewer Utility Revenue Bonds Series A(AA-/NR)(a) | |
| 1,560,000 | | | 4.000 | | | | 10/01/29 | | | | 1,821,862 | |
| |
| | | | | | | | | | | | |
Principal
Amount | | Interest
Rate | | | Maturity
Date | | | Value | |
|
| Municipal Bond Obligations – (continued) | |
Kansas – (continued) | |
| Wyandotte County Kansas City KS Unified Government Utility System Revenue Bonds (Public Utilities) Series A (A/A2)(a) | |
| $ 525,000 | | | 5.000 | % | | | 09/01/28 | | | $ | 575,657 | |
|
| Wyandotte County Kansas City Ksunif Government Utility System Revenue Bonds (Refunding & Improvement) Series A (A/A2)(a) | |
| 1,000,000 | | | 5.000 | | | | 09/01/26 | | | | 1,155,030 | |
| 1,000,000 | | | 4.250 | | | | 09/01/39 | | | | 1,081,150 | |
|
| Wyandotte County KS School District No. 204 GO Bonds Series A (NR/Aa3)(a) | |
| 1,000,000 | | | 3.000 | | | | 09/01/37 | | | | 1,029,040 | |
|
| Wyandotte County KS School District No. 500 GO Bonds (Refunding)(AA-/Aa3) | |
| 1,405,000 | | | 4.000 | | | | 09/01/20 | | | | 1,437,652 | |
|
| Wyandotte County KS Unified Government Utility System (Refunding & Improvement) Revenue Bonds Series2011-A (A/NR) | |
| 1,400,000 | | | 5.000 | | | | 09/01/20 | | | | 1,442,812 | |
| | | | | | | | | | | | |
| | | | | | | | | | | 136,927,728 | |
| |
Massachusetts(a) – 0.0% | |
| Massachusetts Educational Financing Authority Education Loan Revenue Bonds (Issue I) Series A (AA/NR) | |
| 75,000 | | | 5.300 | | | | 01/01/30 | | | | 75,486 | |
| |
Michigan(a) – 1.1% | |
| Michigan State Housing Development Authority, SF Mortgage Revenue Bonds(Non-ACE) Series B (AA+/Aa2) | |
| 1,665,000 | | | 2.900 | | | | 06/01/28 | | | | 1,763,052 | |
| |
Nevada(a) – 0.6% | |
| Clark County NV GO Bonds (Refunding lasVegas Convention & Visitors Authority) Series C (AA+/Aa1) | |
| 1,000,000 | | | 3.000 | | | | 07/01/35 | | | | 1,033,690 | |
| |
Ohio(a) – 1.5% | |
| Elyria OH Library Improvement Revenue Bonds Series 2018 (A+/NR) | |
| 1,000,000 | | | 4.000 | | | | 12/01/42 | | | | 1,083,140 | |
|
| Hamilton County OH Sales Tax Revenue Bonds (Refunding) Series A (NR/A1) | |
| 1,200,000 | | | 5.000 | | | | 12/01/24 | | | | 1,292,952 | |
| | | | | | | | | | | | |
| | | | | | | | | | | 2,376,092 | |
| |
Pennsylvania – 1.0% | |
| Delaware County Authority University Revenue Bonds for Neumann University (BBB/NR)(a) | |
| 605,000 | | | 5.000 | | | | 10/01/25 | | | | 625,461 | |
|
| Philadelphia PA Authority for Industrial Development Pension Funding Revenue Bonds (Zero Coupon-Retirement) Series 1999 (AGM/AMBAC) (AA/A2)(b) | |
| 1,000,000 | | | 0.000 | | | | 04/15/20 | | | | 991,870 | |
| | | | | | | | | | | | |
| | | | | | | | | | | 1,617,331 | |
| |
| | |
| The accompanying notes are an integral part of these financial statements. | | 61 |
COMMERCE KANSASTAX-FREE INTERMEDIATE BOND FUND
Schedule of Investments(continued)
October 31, 2019
| | | | | | | | | | | | |
Principal
Amount | | Interest
Rate | | | Maturity
Date | | | Value | |
|
| Municipal Bond Obligations – (continued) | |
Tennessee – 0.3% | |
| Knox County Health Educational & Housing Facility Board Revenue Bonds (Refunding) (University Health Systems, Inc.) Series 2017 (BBB/NR) | |
| $ 500,000 | | | 3.375 | % | | | 04/01/26 | | | $ | 538,200 | |
| |
Texas(a) – 1.5% | |
| Arlington TX Higher Education Finance Corp. Revenue Bonds (KIPP Texas, Inc.) Series 2018(PSF-GTD) (AAA/NR) | |
| 1,000,000 | | | 4.000 | | | | 08/15/32 | | | | 1,156,370 | |
|
| Austin TX Community College District Public Facility Corp. Lease Revenue Bonds Series C (AA/Aa2) | |
| 1,090,000 | | | 4.000 | | | | 08/01/35 | | | | 1,237,510 | |
| | | | | | | | | | | | |
| | | | | | | | | | | 2,393,880 | |
| |
Utah(a) – 1.4% | |
| Unified Fire Service Area Local Building Authority Lease Revenue Bonds (Refunding) Series 2016 (NR/Aa2) | |
| 675,000 | | | 3.000 | | | | 04/01/34 | | | | 702,938 | |
| 1,000,000 | | | 3.000 | | | | 04/01/35 | | | | 1,036,570 | |
|
| Utah State Building Ownership Authority Lease Revenue Bonds (State Facilities Master Lease Program) Series 2016 (AA+/Aa1) | |
| 500,000 | | | 3.000 | | | | 05/15/34 | | | | 517,765 | |
| | | | | | | | | | | | |
| | | | | | | | | | | 2,257,273 | |
| |
Washington(a)(c) – 0.5% | |
| Washington State Health Care Facilities Authority Revenue Bonds (Overlake Hospital Medical Center) (NR/A2) | |
| 750,000 | | | 5.250 | | | | 07/01/20 | | | | 770,197 | |
| |
Wisconsin(a) – 0.7% | |
| Wisconsin State Health & Educational Facilities Authority Revenue Bonds (Refunding-Ascension Health Credit Group) Series A (AA+/Aa2) | |
| 1,000,000 | | | 4.000 | | | | 11/15/34 | | | | 1,105,790 | |
| |
| TOTAL MUNICIPAL BOND OBLIGATIONS | |
(Cost $154,588,229) | | | $ | 161,585,365 | |
| |
| | | | | | | | | | | | |
| Shares | | | | | Dividend
Rate | | | Value | |
|
| Investment Company �� 0.9% | |
| State Street Institutional US Government Money Market Fund — Premier Class | |
| 1,468,531 | | | | | | | 1.741% | | | $ | 1,468,531 | |
(Cost $1,468,531) | | | | | | | | | |
| |
| TOTAL INVESTMENTS – 101.4% | |
(Cost $156,056,760) | | | $ | 163,053,896 | |
| |
LIABILITIES IN EXCESS OF
OTHER ASSETS – (1.4)% | | | | (2,322,774) | |
| |
NET ASSETS – 100.0% | | | $ | 160,731,122 | |
| |
| | |
|
| The percentage shown for each investment category reflects the value of investments in that category as a percentage of net assets. |
| |
| (a) | | Security with “Call” features with resetting interest rates. |
| |
| (b) | | Security issued with a zero coupon. The actual effective yield of this security is different than the stated coupon due to the accretion of discount. |
| |
| (c) | | Prerefunded security. Maturity date disclosed is prerefunding date. |
| |
| (d) | | All or portion represents a forward commitment. |
|
| Security ratings disclosed, if any, are issued by S&P Global Ratings/Moody’s Investors Service and are unaudited. A description of the ratings is available in the Fund’s Statement of Additional Information. |
| | |
|
| Investment Abbreviations: |
| AGM | | —Insured by Assured Guaranty Municipal Corp. |
| AMBAC | | —Insured by American Municipal Bond Assurance Corp. |
| AMT | | —Alternative Minimum Tax |
| FHLMC | | —Federal Home Loan Mortgage Corp. |
| FNMA | | —Federal National Mortgage Association |
| GNMA | | —Government National Mortgage Association |
| GO | | —General Obligation |
| NR | | —Not Rated |
| PSF-GTD | | —Guaranteed by Permanent School Fund |
| WR | | —Withdrawn Rating |
|
PORTFOLIO COMPOSITION
| | | | | | | | |
| | | AS OF
10/31/19 | | | AS OF
10/31/18 | |
| |
General Obligation | | | 45.0 | % | | | 40.1 | % |
Lease | | | 17.6 | | | | 15.4 | |
Hospital | | | 10.2 | | | | 8.3 | |
Water/Sewer | | | 6.0 | | | | 6.0 | |
Prerefunded/Escrow to Maturity | | | 5.8 | | | | 12.9 | |
Education | | | 4.8 | | | | 5.1 | |
Limited Tax | | | 3.3 | | | | 1.9 | |
Power | | | 3.0 | | | | 1.7 | |
Transportation | | | 2.7 | | | | 3.2 | |
Single Family Housing | | | 1.8 | | | | 1.7 | |
Investment Company | | | 0.9 | | | | — | |
Crossover | | | 0.3 | | | | 0.4 | |
Student | | | — | | | | 0.1 | |
Treasuries | | | — | | | | 2.9 | |
Repurchase Agreement | | | — | | | | 0.2 | |
| |
| TOTAL INVESTMENTS | | | 101.4 | % | | | 99.9 | % |
| |
The percentage shown for each investment category reflects the value of investments in that category as a percentage of net assets. Underlying investment categories of investment companies held by the Fund are not reflected in the table above. Consequently, the Fund’s overall investment category allocations may differ from the percentages contained in the table above.
The Fund is actively managed and, as such, its composition may differ over time.
| | |
| 62 | | The accompanying notes are an integral part of these financial statements. |
COMMERCE FUNDS
Statements of Assets and Liabilities
October 31, 2019
| | | | | | | | | | | | | | | | |
| | | Growth Fund | | | Value Fund | | | MidCap
Growth Fund | | | Bond Fund | |
Assets: | |
Investments at value (identified cost $119,109,582, $251,045,627, $182,384,909 and $1,132,625,557, respectively) | | $ | 168,123,106 | | | $ | 285,796,318 | | | $ | 222,535,887 | | | $ | 1,191,866,674 | |
Receivables: | |
Interest and dividends | | | 42,740 | | | | 428,891 | | | | 55,044 | | | | 7,369,877 | |
Fund shares sold | | | 226,909 | | | | 1,097,734 | | | | 338,143 | | | | 1,607,750 | |
Other | | | 4,849 | | | | 7,874 | | | | 6,574 | | | | 34,350 | |
| | | | |
Total Assets | | | 168,397,604 | | | | 287,330,817 | | | | 222,935,648 | | | | 1,200,878,651 | |
| | | | |
| | | | | | | | | | | | | | | | |
Liabilities: | |
Payables: | | | | | | | | | | | | | | | | |
Dividends | | | — | | | | — | | | | — | | | | 2,173,620 | |
Fund shares redeemed | | | 16,733 | | | | 54,640 | | | | 8,297 | | | | 251,318 | |
Advisory fees | | | 55,735 | | | | 79,622 | | | | 91,413 | | | | 363,672 | |
Deferred trustee fees | | | 53,181 | | | | 71,756 | | | | 41,331 | | | | 350,848 | |
Administrative fees | | | 20,204 | | | | 34,363 | | | | 26,980 | | | | 146,891 | |
Accrued expenses | | | 72,690 | | | | 108,626 | | | | 71,099 | | | | 212,499 | |
| | | | |
Total Liabilities | | | 218,543 | | | | 349,007 | | | | 239,120 | | | | 3,498,848 | |
| | | | |
| | | | | | | | | | | | | | | | |
Net Assets: | |
Paid-in capital | | | 109,216,020 | | | | 238,119,204 | | | | 168,311,676 | | | | 1,145,585,626 | |
Total distributable earnings | | | 58,963,041 | | | | 48,862,606 | | | | 54,384,852 | | | | 51,794,177 | |
| | | | |
Net Assets | | $ | 168,179,061 | | | $ | 286,981,810 | | | $ | 222,696,528 | | | $ | 1,197,379,803 | |
| | | | |
| | | | | | | | | | | | | | | | |
Shares Outstanding/Net Asset Value | |
Total shares outstanding, no par value (unlimited number of shares authorized): | | | 4,493,453 | | | | 9,111,498 | | | | 5,074,967 | | | | 58,532,776 | |
Net asset value (net assets/shares outstanding) | | $ | 37.43 | | | $ | 31.50 | | | $ | 43.88 | | | $ | 20.46 | |
| | |
| The accompanying notes are an integral part of these financial statements. | | 63 |
COMMERCE FUNDS
Statements of Assets and Liabilities(continued)
October 31, 2019
| | | | | | | | | | | | | | | | |
| | | Short-Term
Government
Fund | | | National
Tax-Free
Intermediate
Bond Fund | | | Missouri
Tax-Free
Intermediate
Bond Fund | | | Kansas
Tax-Free
Intermediate
Bond Fund | |
Assets: | | | | | | | | | | | | | | | | |
Investments at value (identified cost $58,064,301, $395,170,228, $348,631,640 and $156,056,760, respectively) | | $ | 59,422,754 | | | $ | 413,058,899 | | | $ | 363,636,275 | | | $ | 163,053,896 | |
Receivables: | | | | | | | | | | | | | | | | |
Interest and dividends | | | 216,257 | | | | 4,309,325 | | | | 2,904,882 | | | | 1,434,370 | |
Fund shares sold | | | 949 | | | | 976,425 | | | | 210,996 | | | | 86,621 | |
Investments sold | | | 245,215 | | | | — | | | | — | | | | — | |
Reimbursement from Adviser | | | 23,460 | | | | — | | | | — | | | | 16,941 | |
Other | | | 1,995 | | | | 12,004 | | | | 10,579 | | | | 4,746 | |
| | | | |
Total Assets | | | 59,910,630 | | | | 418,356,653 | | | | 366,762,732 | | | | 164,596,574 | |
| | | | |
| | | | | | | | | | | | | | | | |
Liabilities: | | | | | | | | | | | | | | | | |
Payables: | | | | | | | | | | | | | | | | |
Investments purchased on an extended settlement basis | | | — | | | | 3,510,071 | | | | — | | | | 3,386,235 | |
Dividends | | | 52,504 | | | | 657,289 | | | | 538,171 | | | | 255,001 | |
Fund shares redeemed | | | 1,006,037 | | | | 22,340 | | | | 14,332 | | | | 14,171 | |
Advisory fees | | | 25,360 | | | | 117,017 | | | | 106,980 | | | | 60,479 | |
Deferred trustee fees | | | 49,417 | | | | 108,870 | | | | 118,564 | | | | 45,748 | |
Administrative fees | | | 7,354 | | | | 50,629 | | | | 44,807 | | | | 19,778 | |
Accrued expenses | | | 66,028 | | | | 97,978 | | | | 100,672 | | | | 84,040 | |
| | | | |
Total Liabilities | | | 1,206,700 | | | | 4,564,194 | | | | 923,526 | | | | 3,865,452 | |
| | | | |
| | | | | | | | | | | | | | | | |
Net Assets: | | | | | | | | | | | | | | | | |
Paid-in capital | | | 62,439,803 | | | | 393,994,650 | | | | 353,714,527 | | | | 153,911,870 | |
Total distributable earnings (loss) | | | (3,735,873 | ) | | | 19,797,809 | | | | 12,124,679 | | | | 6,819,252 | |
| | | | |
Net Assets | | $ | 58,703,930 | | | $ | 413,792,459 | | | $ | 365,839,206 | | | $ | 160,731,122 | |
| | | | |
| | | | | | | | | | | | | | | | |
Shares Outstanding/Net Asset Value | | | | | | | | | | | | | | | | |
Total shares outstanding, no par value (unlimited number of shares authorized): | | | 3,424,813 | | | | 20,557,712 | | | | 18,395,366 | | | | 8,130,866 | |
Net asset value (net assets/shares outstanding) | | $ | 17.14 | | | $ | 20.13 | | | $ | 19.89 | | | $ | 19.77 | |
| | |
| 64 | | The accompanying notes are an integral part of these financial statements. |
COMMERCE FUNDS
Statements of Operations
For the Fiscal Year Ended October 31, 2019
| | | | | | | | | | | | | | | | |
| | | Growth Fund | | | Value Fund | | | MidCap
Growth Fund | | | Bond Fund | |
Investment Income: | | | | | | | | | | | | | | | | |
Dividends | | $ | 1,976,290 | | | $ | 7,942,324 | | | $ | 2,150,232 | | | $ | 409,725 | |
Interest | | | 3,461 | | | | 4,998 | | | | 4,175 | | | | 40,757,931 | |
| | | | |
Total Investment Income | | | 1,979,751 | | | | 7,947,322 | | | | 2,154,407 | | | | 41,167,656 | |
| | | | |
| | | | | | | | | | | | | | | | |
Expenses: | | | | |
Advisory fees | | | 580,365 | | | | 740,208 | | | | 939,633 | | | | 4,108,701 | |
Administration fees | | | 210,382 | | | | 357,767 | | | | 274,294 | | | | 1,629,047 | |
Custody, accounting and administrative services | | | 94,045 | | | | 100,571 | | | | 96,499 | | | | 252,548 | |
Transfer Agent fees | | | 75,258 | | | | 150,732 | | | | 60,822 | | | | 92,767 | |
Professional fees | | | 41,304 | | | | 52,535 | | | | 45,216 | | | | 184,154 | |
Registration fees | | | 28,308 | | | | 29,091 | | | | 29,486 | | | | 43,340 | |
Shareholder servicing fees | | | 22,206 | | | | 273,992 | | | | 36,884 | | | | 465,455 | |
Trustee fees | | | 14,579 | | | | 24,301 | | | | 18,857 | | | | 108,321 | |
Printing and mailing fees | | | 5,967 | | | | 6,919 | | | | 7,549 | | | | 43,111 | |
Other | | | 19,089 | | | | 25,113 | | | | 21,529 | | | | 76,763 | |
| | | | |
Total Expenses | | | 1,091,503 | | | | 1,761,229 | | | | 1,530,769 | | | | 7,004,207 | |
Less — expense reductions | | | — | | | | (34,076 | ) | | | — | | | | — | |
| | | | |
Net Expenses | | | 1,091,503 | | | | 1,727,153 | | | | 1,530,769 | | | | 7,004,207 | |
| | | | |
| Net Investment Income | | $ | 888,248 | | | $ | 6,220,169 | | | $ | 623,638 | | | $ | 34,163,449 | |
| | | | |
| | | | | | | | | | | | | | | | |
Realized and unrealized gain (loss) | | | | | | | | | | | | | | | | |
Net realized gain | | | 9,109,887 | | | | 14,324,618 | | | | 13,769,207 | | | | 894,787 | |
Net change in unrealized gain | | | 16,695,958 | | | | 14,044,958 | | | | 18,303,980 | | | | 80,084,677 | |
| | | | |
Net realized and unrealized gain | | | 25,805,845 | | | | 28,369,576 | | | | 32,073,187 | | | | 80,979,464 | |
| | | | |
| NET INCREASE IN NET ASSETS RESULTING FROM OPERATIONS | | $ | 26,694,093 | | | $ | 34,589,745 | | | $ | 32,696,825 | | | $ | 115,142,913 | |
| | |
| The accompanying notes are an integral part of these financial statements. | | 65 |
COMMERCE FUNDS
Statements of Operations(continued)
For the Fiscal Year Ended October 31, 2019
| | | | | | | | | | | | | | | | |
| | | Short-Term
Government
Fund | | | National
Tax-Free
Intermediate
Bond Fund | | | Missouri
Tax-Free
Intermediate
Bond Fund | | | Kansas
Tax-Free
Intermediate
Bond Fund | |
Investment Income: | | | | | | | | | | | | | | | | |
Interest | | $ | 1,819,862 | | | $ | 10,774,627 | | | $ | 9,957,036 | | | $ | 4,474,826 | |
Dividends | | | 14,566 | | | | 108,665 | | | | 64,408 | | | | 39,024 | |
| | | | |
Total Investment Income | | | 1,834,428 | | | | 10,883,292 | | | | 10,021,444 | | | | 4,513,850 | |
| | | | |
| | | | | | | | | | | | | | | | |
Expenses: | | | | |
Advisory fees | | | 339,792 | | | | 1,323,143 | | | | 1,213,810 | | | | 689,953 | |
Custody, accounting and administrative services | | | 109,867 | | | | 175,578 | | | | 151,949 | | | | 117,265 | |
Administration fees | | | 98,540 | | | | 564,423 | | | | 501,010 | | | | 223,695 | |
Shareholder servicing fees | | | 34,796 | | | | 18,563 | | | | 103,590 | | | | 30,207 | |
Professional fees | | | 32,138 | | | | 72,892 | | | | 76,049 | | | | 51,681 | |
Transfer Agent fees | | | 32,111 | | | | 39,759 | | | | 53,462 | | | | 32,912 | |
Registration fees | | | 26,871 | | | | 35,630 | | | | 32,560 | | | | 29,131 | |
Trustee fees | | | 6,772 | | | | 37,646 | | | | 33,305 | | | | 14,937 | |
Printing and mailing fees | | | 1,928 | | | | 15,091 | | | | 12,805 | | | | 5,939 | |
Other | | | 15,678 | | | | 33,255 | | | | 31,731 | | | | 20,132 | |
| | | | |
Total Expenses | | | 698,493 | | | | 2,315,980 | | | | 2,210,271 | | | | 1,215,852 | |
Less — expense reductions | | | (236,376 | ) | | | — | | | | — | | | | (135,947 | ) |
| | | | |
Net Expenses | | | 462,117 | | | | 2,315,980 | | | | 2,210,271 | | | | 1,079,905 | |
| | | | |
| Net Investment Income | | $ | 1,372,311 | | | $ | 8,567,312 | | | $ | 7,811,173 | | | $ | 3,433,945 | |
| | | | |
| | | | | | | | | | | | | | | | |
Realized and unrealized gain (loss) | | | | | | | | | | | | | | | | |
Net realized gain (loss) | | | (143,045 | ) | | | 1,478,453 | | | | 940,419 | | | | 168,322 | |
Net change in unrealized gain | | | 1,948,557 | | | | 22,601,410 | | | | 17,398,500 | | | | 7,872,076 | |
| | | | |
Net realized and unrealized gain | | | 1,805,512 | | | | 24,079,863 | | | | 18,338,919 | | | | 8,040,398 | |
| | | | |
| NET INCREASE IN NET ASSETS RESULTING FROM OPERATIONS | | $ | 3,177,823 | | | $ | 32,647,175 | | | $ | 26,150,092 | | | $ | 11,474,343 | |
| | |
| 66 | | The accompanying notes are an integral part of these financial statements. |
COMMERCE FUNDS
Statements of Changes in Net Assets
| | | | | | | | | | | | | | | | |
| | | Growth Fund | | | Value Fund | |
| | | For the
Year Ended
October 31, 2019 | | | For the
Year Ended
October 31, 2018 | | | For the
Year Ended
October 31, 2019 | | | For the
Year Ended
October 31, 2018 | |
From Operations: | | | | | |
Net investment income | | $ | 888,248 | | | $ | 822,328 | | | $ | 6,220,169 | | | $ | 5,995,713 | |
Net realized gain | | | 9,109,887 | | | | 10,175,736 | | | | 14,324,618 | | | | 19,764,273 | |
Net change in unrealized gain (loss) | | | 16,695,958 | | | | 537,567 | | | | 14,044,958 | | | | (10,709,381 | ) |
| | | | |
Net increase in net assets resulting from operations | | | 26,694,093 | | | | 11,535,631 | | | | 34,589,745 | | | | 15,050,605 | |
| | | | |
| | | | | | | | | | | | | | | | |
Distributions to Shareholders: | | | | | |
| | | | |
From distributable earnings | | | (10,962,638 | ) | | | (6,575,305 | ) | | | (26,253,766 | ) | | | (30,012,642 | ) |
| | | | |
| | | | | | | | | | | | | | | | |
From Share Transactions: | | | | | |
Proceeds from sales of shares | | | 46,446,484 | | | | 20,191,185 | | | | 92,248,719 | | | | 37,893,508 | |
Reinvestment of distributions | | | 3,506,471 | | | | 2,055,410 | | | | 12,844,437 | | | | 15,981,071 | |
Cost of shares redeemed | | | (21,273,028 | ) | | | (20,740,048 | ) | | | (47,636,049 | ) | | | (68,478,764 | ) |
| | | | |
Net increase (decrease) in net assets resulting from share transactions | | | 28,679,927 | | | | 1,506,547 | | | | 57,457,107 | | | | (14,604,185 | ) |
| | | | |
| TOTAL INCREASE (DECREASE) | | | 44,411,382 | | | | 6,466,873 | | | | 65,793,086 | | | | (29,566,222 | ) |
| | | | |
| | | | | | | | | | | | | | | | |
Net Assets: | | | | | |
Beginning of year | | | 123,767,679 | | | | 117,300,806 | | | | 221,188,724 | | | | 250,754,946 | |
| | | | |
End of year | | $ | 168,179,061 | | | $ | 123,767,679 | | | $ | 286,981,810 | | | $ | 221,188,724 | |
| | |
| The accompanying notes are an integral part of these financial statements. | | 67 |
COMMERCE FUNDS
Statements of Changes in Net Assets(continued)
| | | | | | | | | | | | | | | | |
| | | MidCap Growth Fund | | | Bond Fund | |
| | | For the
Year Ended
October 31, 2019 | | | For the
Year Ended
October 31, 2018 | | | For the
Year Ended
October 31, 2019 | | | For the
Year Ended
October 31, 2018 | |
From Operations: | | | | |
Net investment income | | $ | 623,638 | | | $ | 701,081 | | | $ | 34,163,449 | | | $ | 32,534,402 | |
Net realized gain | | | 13,769,207 | | | | 14,485,824 | | | | 894,787 | | | | 1,608,401 | |
Net change in unrealized gain (loss) | | | 18,303,980 | | | | (5,015,150 | ) | | | 80,084,677 | | | | (53,608,161 | ) |
| | | | |
Net increase (decrease) in net assets resulting from operations | | | 32,696,825 | | | | 10,171,755 | | | | 115,142,913 | | | | (19,465,358 | ) |
| | | | |
| | | | | | | | | | | | | | | | |
Distributions to Shareholders: | | | | |
| | | | |
From distributable earnings | | | (15,147,303 | ) | | | (10,351,268 | ) | | | (36,117,722 | ) | | | (35,191,863 | ) |
| | | | |
| | | | | | | | | | | | | | | | |
From Share Transactions: | | | | |
Proceeds from sales of shares | | | 63,051,963 | | | | 28,200,978 | | | | 208,987,812 | | | | 225,636,108 | |
Reinvestment of distributions | | | 2,943,603 | | | | 2,080,020 | | | | 8,838,942 | | | | 8,486,779 | |
Cost of shares redeemed | | | (22,567,243 | ) | | | (18,921,644 | ) | | | (194,375,265 | ) | | | (162,880,541 | ) |
| | | | |
Net increase in net assets resulting from share transactions | | | 43,428,323 | | | | 11,359,354 | | | | 23,451,489 | | | | 71,242,346 | |
| | | | |
| TOTAL INCREASE | | | 60,977,845 | | | | 11,179,841 | | | | 102,476,680 | | | | 16,585,125 | |
| | | | |
| | | | | | | | | | | | | | | | |
Net Assets: | | | | |
Beginning of year | | | 161,718,683 | | | | 150,538,842 | | | | 1,094,903,123 | | | | 1,078,317,998 | |
| | | | |
End of year | | $ | 222,696,528 | | | $ | 161,718,683 | | | $ | 1,197,379,803 | | | $ | 1,094,903,123 | |
| | |
| 68 | | The accompanying notes are an integral part of these financial statements. |
COMMERCE FUNDS
Statements of Changes in Net Assets(continued)
| | | | | | | | | | | | | | | | |
| | | Short-Term
Government Fund | | | NationalTax-Free
Intermediate Bond Fund | |
| | | For the
Year Ended
October 31, 2019 | | | For the
Year Ended
October 31, 2018 | | | For the
Year Ended
October 31, 2019 | | | For the
Year Ended
October 31, 2018 | |
From Operations: | | | | | | | | |
Net investment income | | $ | 1,372,311 | | | $ | 1,388,607 | | | $ | 8,567,312 | | | $ | 7,823,016 | |
Net realized gain (loss) | | | (143,045 | ) | | | (484,024 | ) | | | 1,478,453 | | | | 471,403 | |
Net change in unrealized gain (loss) | | | 1,948,557 | | | | (1,335,108 | ) | | | 22,601,410 | | | | (12,992,777 | ) |
| | | | |
Net increase (decrease) in net assets resulting from operations | | | 3,177,823 | | | | (430,525 | ) | | | 32,647,175 | | | | (4,698,358 | ) |
| | | | |
| | | | | | | | | | | | | | | | |
Distributions to Shareholders: | | | | | | | | |
| | | | |
From distributable earnings | | | (1,490,983 | ) | | | (1,559,449 | ) | | | (9,018,330 | ) | | | (8,343,609 | ) |
| | | | |
| | | | | | | | | | | | | | | | |
From Share Transactions: | | | | | | | | |
Proceeds from sales of shares | | | 17,845,619 | | | | 16,994,231 | | | | 77,541,416 | | | | 75,177,523 | |
Reinvestment of distributions | | | 662,024 | | | | 677,010 | | | | 329,208 | | | | 261,061 | |
Cost of shares redeemed | | | (33,030,664 | ) | | | (43,152,596 | ) | | | (49,950,844 | ) | | | (38,569,260 | ) |
| | | | |
Net increase (decrease) in net assets resulting from share transactions | | | (14,523,021 | ) | | | (25,481,355 | ) | | | 27,919,780 | | | | 36,869,324 | |
| | | | |
| TOTAL INCREASE (DECREASE) | | | (12,836,181 | ) | | | (27,471,329 | ) | | | 51,548,625 | | | | 23,827,357 | |
| | | | |
| | | | | | | | | | | | | | | | |
Net Assets: | | | | | | | | |
Beginning of year | | | 71,540,111 | | | | 99,011,440 | | | | 362,243,834 | | | | 338,416,477 | |
| | | | |
End of year | | $ | 58,703,930 | | | $ | 71,540,111 | | | $ | 413,792,459 | | | $ | 362,243,834 | |
| | |
| The accompanying notes are an integral part of these financial statements. | | 69 |
COMMERCE FUNDS
Statements of Changes in Net Assets(continued)
| | | | | | | | | | | | | | | | |
| | | MissouriTax-Free
Intermediate Bond Fund | | | KansasTax-Free
Intermediate Bond Fund | |
| | For the
Year Ended
October 31, 2019 | | | For the
Year Ended
October 31, 2018 | | | For the
Year Ended
October 31, 2019 | | | For the
Year Ended
October 31, 2018 | |
From Operations: | | | | |
Net investment income | | $ | 7,811,173 | | | $ | 8,427,510 | | | $ | 3,433,945 | | | $ | 3,159,648 | |
Net realized gain | | | 940,419 | | | | 174,412 | | | | 168,322 | | | | 226,514 | |
Net change in unrealized gain (loss) | | | 17,398,500 | | | | (12,282,620 | ) | | | 7,872,076 | | | | (4,827,635 | ) |
| | | | |
Net increase (decrease) in net assets resulting from operations | | | 26,150,092 | | | | (3,680,698 | ) | | | 11,474,343 | | | | (1,441,473 | ) |
| | | | |
| | | | | | | | | | | | | | | | |
Distributions to Shareholders: | | | | |
| | | | |
From distributable earnings | | | (7,784,178 | ) | | | (8,401,906 | ) | | | (3,417,665 | ) | | | (3,145,311 | ) |
| | | | |
| | | | | | | | | | | | | | | | |
From Share Transactions: | | | | |
Proceeds from sales of shares | | | 60,746,649 | | | | 56,679,475 | | | | 27,143,394 | | | | 26,979,044 | |
Reinvestment of distributions | | | 944,160 | | | | 1,104,145 | | | | 262,003 | | | | 283,506 | |
Cost of shares redeemed | | | (54,018,331 | ) | | | (50,191,431 | ) | | | (22,226,243 | ) | | | (15,735,787 | ) |
| | | | |
Net increase in net assets resulting from share transactions | | | 7,672,478 | | | | 7,592,189 | | | | 5,179,154 | | | | 11,526,763 | |
| | | | |
| TOTAL INCREASE (DECREASE) | | | 26,038,392 | | | | (4,490,415 | ) | | | 13,235,832 | | | | 6,939,979 | |
| | | | |
| | | | | | | | | | | | | | | | |
Net Assets: | | | | | | | | | | | | | |
Beginning of year | | | 339,800,814 | | | | 344,291,229 | | | | 147,495,290 | | | | 140,555,311 | |
| | | | |
End of year | | $ | 365,839,206 | | | $ | 339,800,814 | | | $ | 160,731,122 | | | $ | 147,495,290 | |
| | |
| 70 | | The accompanying notes are an integral part of these financial statements. |
COMMERCE GROWTH FUND
Financial Highlights
Selected Data for a Share Outstanding Throughout Each Year
| | | | | | | | | | | | | | | | | | | | |
| | | Growth Fund | |
| | | Year Ended October 31, | |
| | | 2019 | | | 2018 | | | 2017 | | | 2016 | | | 2015 | |
Per Share Data | | | | | | | | | | | | | | | | | | | | |
| | | | | |
Net asset value, beginning of year | | $ | 34.61 | | | $ | 33.21 | | | $ | 27.83 | | | $ | 29.44 | | | $ | 34.95 | |
| | | | | |
Net investment income(a) | | | 0.21 | | | | 0.23 | | | | 0.24 | | | | 0.28 | | | | 0.23 | |
| | | | | |
Net realized and unrealized gain | | | 5.69 | | | | 3.04 | | | | 6.77 | | | | 1.26 | | | | 2.37 | |
| | | | | |
Total from investment operations | | | 5.90 | | | | 3.27 | | | | 7.01 | | | | 1.54 | | | | 2.60 | |
| | | | | |
Distributions to shareholders from net investment income | | | (0.22 | ) | | | (0.23 | ) | | | (0.24 | ) | | | (0.21 | ) | | | (0.25 | ) |
| | | | | |
Distributions to shareholders from net realized gains | | | (2.86 | ) | | | (1.64 | ) | | | (1.39 | ) | | | (2.94 | ) | | | (7.86 | ) |
| | | | | |
Total distributions | | | (3.08 | ) | | | (1.87 | ) | | | (1.63 | ) | | | (3.15 | ) | | | (8.11 | ) |
| | | | | |
Net asset value, end of year | | $ | 37.43 | | | $ | 34.61 | | | $ | 33.21 | | | $ | 27.83 | | | $ | 29.44 | |
Total return(b) | | | 19.10 | % | | | 10.23 | % | | | 26.67 | % | | | 5.64 | % | | | 8.51 | % |
| | | | | |
Net assets, end of year (in 000s) | | $ | 168,179 | | | $ | 123,768 | | | $ | 117,301 | | | $ | 88,227 | | | $ | 75,447 | |
| | | | | |
Ratio of net expenses to average net assets | | | 0.75 | % | | | 0.76 | % | | | 0.78 | % | | | 0.82 | % | | | 1.04 | % |
| | | | | |
Ratio of total expenses to average net assets | | | 0.75 | % | | | 0.76 | % | | | 0.78 | % | | | 0.82 | % | | | 1.04 | % |
| | | | | |
Ratio of net investment income to average net assets | | | 0.61 | % | | | 0.67 | % | | | 0.81 | % | | | 1.01 | % | | | 0.79 | % |
| | | | | |
Portfolio turnover rate | | | 39 | % | | | 45 | % | | | 34 | % | | | 37 | % | | | 40 | % |
| (a) | | Calculated based on the average shares outstanding methodology. |
| (b) | | Assumes investment at the NAV at the beginning of the year, reinvestment of all dividends and distributions, a complete redemption of the investment at the NAV at the end of the year and no sales or redemption charges (if any). Total return would be reduced if a sales or redemption charge was taken into account. Returns do not reflect the deduction of taxes that shareholder would pay on Fund distributions or the redemption of Fund shares. |
| | |
| The accompanying notes are an integral part of these financial statements. | | 71 |
COMMERCE VALUE FUND
Financial Highlights(continued)
Selected Data for a Share Outstanding Throughout Each Year
| | | | | | | | | | | | | | | | | | | | |
| | | Value Fund | |
| | | Year Ended October 31, | |
| | | 2019 | | | 2018 | | | 2017 | | | 2016 | | | 2015 | |
Per Share Data | | | | | | | | | | | | | | | | | | | | |
| | | | | |
Net asset value, beginning of year | | $ | 30.97 | | | $ | 33.02 | | | $ | 29.98 | | | $ | 31.65 | | | $ | 32.50 | |
| | | | | |
Net investment income(a) | | | 0.76 | | | | 0.81 | | | | 0.87 | | | | 0.77 | | | | 0.86 | |
| | | | | |
Net realized and unrealized gain | | | 3.32 | | | | 1.20 | | | | 3.63 | | | | 1.58 | | | | 0.06 | |
| | | | | |
Total from investment operations | | | 4.08 | | | | 2.01 | | | | 4.50 | | | | 2.35 | | | | 0.92 | |
| | | | | |
Distributions to shareholders from net investment income | | | (0.79 | ) | | | (0.80 | ) | | | (0.87 | ) | | | (0.76 | ) | | | (0.85 | ) |
| | | | | |
Distributions to shareholders from net realized gains | | | (2.76 | ) | | | (3.26 | ) | | | (0.59 | ) | | | (3.26 | ) | | | (0.92 | ) |
| | | | | |
Total distributions | | | (3.55 | ) | | | (4.06 | ) | | | (1.46 | ) | | | (4.02 | ) | | | (1.77 | ) |
| | | | | |
Net asset value, end of year | | $ | 31.50 | | | $ | 30.97 | | | $ | 33.02 | | | $ | 29.98 | | | $ | 31.65 | |
Total return(b) | | | 14.65 | % | | | 6.22 | % | | | 15.29 | % | | | 8.48 | % | | | 2.88 | % |
| | | | | |
Net assets, end of year (in 000s) | | $ | 286,982 | | | $ | 221,189 | | | $ | 250,755 | | | $ | 273,983 | | | $ | 199,796 | |
| | | | | |
Ratio of net expenses to average net assets | | | 0.70 | % | | | 0.70 | % | | | 0.70 | % | | | 0.70 | % | | | 0.70 | % |
| | | | | |
Ratio of total expenses to average net assets | | | 0.71 | % | | | 0.79 | % | | | 0.74 | % | | | 0.74 | % | | | 0.73 | % |
| | | | | |
Ratio of net investment income to average net assets | | | 2.52 | % | | | 2.56 | % | | | 2.73 | % | | | 2.61 | % | | | 2.70 | % |
| | | | | |
Portfolio turnover rate | | | 36 | % | | | 49 | % | | | 47 | % | | | 41 | % | | | 33 | % |
| (a) | | Calculated based on the average shares outstanding methodology. |
| (b) | | Assumes investment at the NAV at the beginning of the year, reinvestment of all dividends and distributions, a complete redemption of the investment at the NAV at the end of the year and no sales or redemption charges (if any). Total return would be reduced if a sales or redemption charge was taken into account. Returns do not reflect the deduction of taxes that a shareholder would pay on Fund distributions or the redemption of Fund shares. |
| | |
| 72 | | The accompanying notes are an integral part of these financial statements. |
COMMERCE MID CAP GROWTH FUND
Financial Highlights(continued)
Selected Data for a Share Outstanding Throughout Each Year
| | | | | | | | | | | | | | | | | | | | |
| | | MidCap Growth Fund | |
| | | Year Ended October 31, | |
| | | 2019 | | | 2018 | | | 2017 | | | 2016 | | | 2015 | |
Per Share Data | | | | | | | | | | | | | | | | | | | | |
| | | | | |
Net asset value, beginning of year | | $ | 40.44 | | | $ | 40.46 | | | $ | 34.64 | | | $ | 36.10 | | | $ | 38.82 | |
| | | | | |
Net investment income(a) | | | 0.14 | | | | 0.18 | | | | 0.20 | | | | 0.21 | | | | 0.16 | |
| | | | | |
Net realized and unrealized gain | | | 7.00 | | | | 2.58 | | | | 7.43 | | | | 1.21 | | | | 2.39 | |
| | | | | |
Total from investment operations | | | 7.14 | | | | 2.76 | | | | 7.63 | | | | 1.42 | | | | 2.55 | |
| | | | | |
Distributions to shareholders from net investment income | | | (0.17 | ) | | | (0.20 | ) | | | (0.18 | ) | | | (0.12 | ) | | | (0.05 | ) |
| | | | | |
Distributions to shareholders from net realized gains | | | (3.53 | ) | | | (2.58 | ) | | | (1.63 | ) | | | (2.76 | ) | | | (5.22 | ) |
| | | | | |
Total distributions | | | (3.70 | ) | | | (2.78 | ) | | | (1.81 | ) | | | (2.88 | ) | | | (5.27 | ) |
| | | | | |
Net asset value, end of year | | $ | 43.88 | | | $ | 40.44 | | | $ | 40.46 | | | $ | 34.64 | | | $ | 36.10 | |
Total return(b) | | | 19.76 | % | | | 7.04 | % | | | 23.03 | % | | | 4.24 | % | | | 7.02 | % |
| | | | | |
Net assets, end of year (in 000s) | | $ | 222,697 | | | $ | 161,719 | | | $ | 150,539 | | | $ | 106,270 | | | $ | 67,451 | |
| | | | | |
Ratio of net expenses to average net assets | | | 0.81 | % | | | 0.83 | % | | | 0.82 | % | | | 0.87 | % | | | 1.03 | % |
| | | | | |
Ratio of total expenses to average net assets | | | 0.81 | % | | | 0.83 | % | | | 0.82 | % | | | 0.87 | % | | | 1.03 | % |
| | | | | |
Ratio of net investment income to average net assets | | | 0.33 | % | | | 0.44 | % | | | 0.55 | % | | | 0.62 | % | | | 0.44 | % |
| | | | | |
Portfolio turnover rate | | | 53 | % | | | 71 | % | | | 58 | % | | | 39 | % | | | 50 | % |
| (a) | | Calculated based on the average shares outstanding methodology. |
| (b) | | Assumes investment at the NAV at the beginning of the year, reinvestment of all dividends and distributions, a complete redemption of the investment at the NAV at the end of the year and no sales or redemption charges (if any). Total return would be reduced if a sales or redemption charge was taken into account. Returns do not reflect the deduction of taxes that a shareholder would pay on Fund distributions or the redemption of Fund shares. |
| | |
| The accompanying notes are an integral part of these financial statements. | | 73 |
COMMERCE BOND FUND
Financial Highlights(continued)
Selected Data for a Share Outstanding Throughout Each Year
| | | | | | | | | | | | | | | | | | | | |
| | | Bond Fund | |
| | | Year Ended October 31, | |
| | | 2019 | | | 2018 | | | 2017 | | | 2016 | | | 2015 | |
Per Share Data | | | | | | | | | | | | | | | | | | | | |
| | | | | |
Net asset value, beginning of year | | $ | 19.05 | | | $ | 20.04 | | | $ | 20.22 | | | $ | 19.96 | | | $ | 20.43 | |
| | | | | |
Net investment income(a) | | | 0.60 | | | | 0.59 | | | | 0.60 | | | | 0.61 | | | | 0.64 | |
| | | | | |
Net realized and unrealized gain (loss) | | | 1.45 | | | | (0.94 | ) | | | (0.12 | ) | | | 0.33 | | | | (0.34 | ) |
| | | | | |
Total from investment operations | | | 2.05 | | | | (0.35 | ) | | | 0.48 | | | | 0.94 | | | | 0.30 | |
| | | | | |
Distributions to shareholders from net investment income | | | (0.64 | ) | | | (0.64 | ) | | | (0.65 | ) | | | (0.66 | ) | | | (0.70 | ) |
| | | | | |
Distributions to shareholders from net realized gains | | | — | | | | — | | | | (0.01 | ) | | | (0.02 | ) | | | (0.07 | ) |
| | | | | |
Total distributions | | | (0.64 | ) | | | (0.64 | ) | | | (0.66 | ) | | | (0.68 | ) | | | (0.77 | ) |
| | | | | |
Net asset value, end of year | | $ | 20.46 | | | $ | 19.05 | | | $ | 20.04 | | | $ | 20.22 | | | $ | 19.96 | |
Total return(b) | | | 10.90 | % | | | (1.80 | )% | | | 2.44 | % | | | 4.79 | % | | | 1.49 | % |
| | | | | |
Net assets, end of year (in 000s) | | $ | 1,197,380 | | | $ | 1,094,903 | | | $ | 1,078,318 | | | $ | 1,098,321 | | | $ | 981,447 | |
| | | | | |
Ratio of net expenses to average net assets | | | 0.62 | % | | | 0.66 | % | | | 0.66 | % | | | 0.67 | % | | | 0.68 | % |
| | | | | |
Ratio of total expenses to average net assets | | | 0.62 | % | | | 0.66 | % | | | 0.66 | % | | | 0.67 | % | | | 0.68 | % |
| | | | | |
Ratio of net investment income to average net assets | | | 3.04 | % | | | 3.00 | % | | | 2.99 | % | | | 3.05 | % | | | 3.18 | % |
| | | | | |
Portfolio turnover rate | | | 16 | % | | | 17 | % | | | 26 | % | | | 17 | % | | | 21 | % |
| (a) | | Calculated based on the average shares outstanding methodology. |
| (b) | | Assumes investment at the NAV at the beginning of the year, reinvestment of all dividends and distributions, a complete redemption of the investment at the NAV at the end of the year and no sales or redemption charges (if any). Total return would be reduced if a sales or redemption charge was taken into account. Returns do not reflect the deduction of taxes that a shareholder would pay on Fund distributions or the redemption of Fund shares. |
| | |
| 74 | | The accompanying notes are an integral part of these financial statements. |
COMMERCE SHORT-TERM GOVERNMENT FUND
Financial Highlights(continued)
Selected Data for a Share Outstanding Throughout Each Year
| | | | | | | | | | | | | | | | | | | | |
| | | Short Term Government Fund | |
| | | Year Ended October 31, | |
| | | 2019 | | | 2018 | | | 2017 | | | 2016 | | | 2015 | |
Per Share Data | | | | | | | | | | | | | | | | | | | | |
| | | | | |
Net asset value, beginning of year | | $ | 16.73 | | | $ | 17.11 | | | $ | 17.34 | | | $ | 17.43 | | | $ | 17.54 | |
| | | | | |
Net investment income(a) | | | 0.34 | | | | 0.28 | | | | 0.22 | | | | 0.21 | | | | 0.17 | |
| | | | | |
Net realized and unrealized gain (loss) | | | 0.44 | | | | (0.35 | ) | | | (0.17 | ) | | | (0.02 | ) | | | (0.04 | ) |
| | | | | |
Total from investment operations | | | 0.78 | | | | (0.07 | ) | | | 0.05 | | | | 0.19 | | | | 0.13 | |
| | | | | |
Distributions to shareholders from net investment income | | | (0.37 | ) | | | (0.31 | ) | | | (0.28 | ) | | | (0.28 | ) | | | (0.24 | ) |
| | | | | |
Net asset value, end of year | | $ | 17.14 | | | $ | 16.73 | | | $ | 17.11 | | | $ | 17.34 | | | $ | 17.43 | |
Total return(b) | | | 4.73 | % | | | (0.38 | )% | | | 0.31 | % | | | 1.09 | % | | | 0.81 | % |
| | | | | |
Net assets, end of year (in 000s) | | $ | 58,704 | | | $ | 71,540 | | | $ | 99,011 | | | $ | 107,942 | | | $ | 103,997 | |
| | | | | |
Ratio of net expenses to average net assets | | | 0.68 | % | | | 0.68 | % | | | 0.68 | % | | | 0.68 | % | | | 0.68 | % |
| | | | | |
Ratio of total expenses to average net assets | | | 1.03 | % | | | 0.92 | % | | | 0.88 | % | | | 0.88 | % | | | 0.83 | % |
| | | | | |
Ratio of net investment income to average net assets | | | 2.02 | % | | | 1.64 | % | | | 1.28 | % | | | 1.21 | % | | | 0.97 | % |
| | | | | |
Portfolio turnover rate | | | 30 | % | | | 17 | % | | | 21 | % | | | 35 | % | | | 68 | % |
| (a) | | Calculated based on the average shares outstanding methodology. |
| (b) | | Assumes investment at the NAV at the beginning of the year, reinvestment of all dividends and distributions, a complete redemption of the investment at the NAV at the end of the year and no sales or redemption charges (if any). Total return would be reduced if a sales or redemption charge was taken into account. Returns do not reflect the deduction of taxes that a shareholder would pay on Fund distributions or the redemption of Fund shares. |
| | |
| The accompanying notes are an integral part of these financial statements. | | 75 |
COMMERCE NATIONAL TAX-FREE INTERMEDIATE BOND FUND
Financial Highlights(continued)
Selected Data for a Share Outstanding Throughout Each Year
| | | | | | | | | | | | | | | | | | | | |
| | | NationalTax-Free Intermediate Bond Fund | |
| | | Year Ended October 31, | |
| | | 2019 | | | 2018 | | | 2017 | | | 2016 | | | 2015 | |
Per Share Data | | | | | | | | | | | | | | | | | | | | |
| | | | | |
Net asset value, beginning of year | | $ | 18.92 | | | $ | 19.63 | | | $ | 19.84 | | | $ | 19.54 | | | $ | 19.45 | |
| | | | | |
Net investment income(a) | | | 0.43 | | | | 0.43 | | | | 0.43 | | | | 0.43 | | | | 0.42 | |
| | | | | |
Net realized and unrealized gain (loss) | | | 1.23 | | | | (0.68 | ) | | | (0.12 | ) | | | 0.30 | | | | 0.09 | |
| | | | | |
Total from investment operations | | | 1.66 | | | | (0.25 | ) | | | 0.31 | | | | 0.73 | | | | 0.51 | |
| | | | | |
Distributions to shareholders from net investment income | | | (0.43 | ) | | | (0.43 | ) | | | (0.43 | ) | | | (0.43 | ) | | | (0.42 | ) |
| | | | | |
Distributions to shareholders from net realized gains | | | (0.02 | ) | | | (0.03 | ) | | | (0.09 | ) | | | — | | | | — | |
| | | | | |
Total distributions | | | (0.45 | ) | | | (0.46 | ) | | | (0.52 | ) | | | (0.43 | ) | | | (0.42 | ) |
| | | | | |
Net asset value, end of year | | $ | 20.13 | | | $ | 18.92 | | | $ | 19.63 | | | $ | 19.84 | | | $ | 19.54 | |
Total return(b) | | | 8.89 | % | | | (1.31 | )% | | | 1.62 | % | | | 3.76 | % | | | 2.63 | % |
| | | | | |
Net assets, end of year (in 000s) | | $ | 413,792 | | | $ | 362,244 | | | $ | 338,416 | | | $ | 328,038 | | | $ | 286,406 | |
| | | | | |
Ratio of net expenses to average net assets | | | 0.59 | % | | | 0.59 | % | | | 0.61 | % | | | 0.62 | % | | | 0.64 | % |
| | | | | |
Ratio of total expenses to average net assets | | | 0.59 | % | | | 0.59 | % | | | 0.61 | % | | | 0.62 | % | | | 0.64 | % |
| | | | | |
Ratio of net investment income to average net assets | | | 2.20 | % | | | 2.21 | % | | | 2.22 | % | | | 2.17 | % | | | 2.16 | % |
| | | | | |
Portfolio turnover rate | | | 29 | % | | | 33 | % | | | 37 | % | | | 27 | % | | | 36 | % |
| (a) | | Calculated based on the average shares outstanding methodology. |
| (b) | | Assumes investment at the NAV at the beginning of the year, reinvestment of all dividends and distributions, a complete redemption of the investment at the NAV at the end of the year and no sales or redemption charges (if any). Total return would be reduced if a sales or redemption charge was taken into account. Returns do not reflect the deduction of taxes that a shareholder would pay on Fund distributions or the redemption of Fund shares. |
| | |
| 76 | | The accompanying notes are an integral part of these financial statements. |
COMMERCE MISSOURI TAX-FREE INTERMEDIATE BOND FUND
Financial Highlights(continued)
Selected Data for a Share Outstanding Throughout Each Year
| | | | | | | | | | | | | | | | | | | | |
| | | MissouriTax-Free Intermediate Bond Fund | |
| | | Year Ended October 31, | |
| | | 2019 | | | 2018 | | | 2017 | | | 2016 | | | 2015 | |
Per Share Data | | | | | | | | | | | | | | | | | | | | |
| | | | | |
Net asset value, beginning of year | | $ | 18.84 | | | $ | 19.52 | | | $ | 19.68 | | | $ | 19.53 | | | $ | 19.52 | |
| | | | | |
Net investment income(a) | | | 0.44 | | | | 0.47 | | | | 0.48 | | | | 0.47 | | | | 0.47 | |
| | | | | |
Net realized and unrealized gain (loss) | | | 1.05 | | | | (0.68 | ) | | | (0.16 | ) | | | 0.15 | | | | 0.01 | |
| | | | | |
Total from investment operations | | | 1.49 | | | | (0.21 | ) | | | 0.32 | | | | 0.62 | | | | 0.48 | |
| | | | | |
Distributions to shareholders from net investment income | | | (0.44 | ) | | | (0.47 | ) | | | (0.48 | ) | | | (0.47 | ) | | | (0.47 | ) |
| | | | | |
Net asset value, end of year | | $ | 19.89 | | | $ | 18.84 | | | $ | 19.52 | | | $ | 19.68 | | | $ | 19.53 | |
Total return(b) | | | 7.98 | % | | | (1.09 | )% | | | 1.70 | % | | | 3.21 | % | | | 2.48 | % |
| | | | | |
Net assets, end of year (in 000s) | | $ | 365,839 | | | $ | 339,801 | | | $ | 344,291 | | | $ | 346,467 | | | $ | 310,149 | |
| | | | | |
Ratio of net expenses to average net assets | | | 0.64 | % | | | 0.63 | % | | | 0.64 | % | | | 0.64 | % | | | 0.65 | % |
| | | | | |
Ratio of total expenses to average net assets | | | 0.64 | % | | | 0.63 | % | | | 0.64 | % | | | 0.64 | % | | | 0.65 | % |
| | | | | |
Ratio of net investment income to average net assets | | | 2.26 | % | | | 2.46 | % | | | 2.50 | % | | | 2.40 | % | | | 2.43 | % |
| | | | | |
Portfolio turnover rate | | | 25 | % | | | 18 | % | | | 15 | % | | | 21 | % | | | 17 | % |
| (a) | | Calculated based on the average shares outstanding methodology. |
| (b) | | Assumes investment at the NAV at the beginning of the year, reinvestment of all dividends and distributions, a complete redemption of the investment at the NAV at the end of the year and no sales or redemption charges (if any). Total return would be reduced if a sales or redemption charge was taken into account. Returns do not reflect the deduction of taxes that a shareholder would pay on Fund distributions or the redemption of Fund shares. |
| | |
| The accompanying notes are an integral part of these financial statements. | | 77 |
COMMERCE KANSAS TAX-FREE INTERMEDIATE BOND FUND
Financial Highlights(continued)
Selected Data for a Share Outstanding Throughout Each Year
| | | | | | | | | | | | | | | | | | | | |
| | | KansasTax-Free Intermediate Bond Fund | |
| | | Year Ended October 31, | |
| | | 2019 | | | 2018 | | | 2017 | | | 2016 | | | 2015 | |
Per Share Data | | | | | | | | | | | | | | | | | | | | |
| | | | | |
Net asset value, beginning of year | | $ | 18.75 | | | $ | 19.35 | | | $ | 19.57 | | | $ | 19.46 | | | $ | 19.39 | |
| | | | | |
Net investment income(a) | | | 0.43 | | | | 0.42 | | | | 0.43 | | | | 0.42 | | | | 0.43 | |
| | | | | |
Net realized and unrealized gain (loss) | | | 1.02 | | | | (0.60 | ) | | | (0.22 | ) | | | 0.11 | | | | 0.06 | |
| | | | | |
Total from investment operations | | | 1.45 | | | | (0.18 | ) | | | 0.21 | | | | 0.53 | | | | 0.49 | |
| | | | | |
Distributions to shareholders from net investment income | | | (0.43 | ) | | | (0.42 | ) | | | (0.43 | ) | | | (0.42 | ) | | | (0.42 | ) |
| | | | | |
Net asset value, end of year | | $ | 19.77 | | | $ | 18.75 | | | $ | 19.35 | | | $ | 19.57 | | | $ | 19.46 | |
Total return(b) | | | 7.80 | % | | | (0.94 | )% | | | 1.09 | % | | | 2.74 | % | | | 2.57 | % |
| | | | | |
Net assets, end of year (in 000s) | | $ | 160,731 | | | $ | 147,495 | | | $ | 140,555 | | | $ | 137,306 | | | $ | 117,537 | |
| | | | | |
Ratio of net expenses to average net assets | | | 0.70 | % | | | 0.70 | % | | | 0.70 | % | | | 0.70 | % | | | 0.70 | % |
| | | | | |
Ratio of total expenses to average net assets | | | 0.79 | % | | | 0.77 | % | | | 0.81 | % | | | 0.81 | % | | | 0.83 | % |
| | | | | |
Ratio of net investment income to average net assets | | | 2.23 | % | | | 2.21 | % | | | 2.22 | % | | | 2.14 | % | | | 2.21 | % |
| | | | | |
Portfolio turnover rate | | | 14 | % | | | 8 | % | | | 17 | % | | | 11 | % | | | 13 | % |
| (a) | | Calculated based on the average shares outstanding methodology. |
| (b) | | Assumes investment at the NAV at the beginning of the year, reinvestment of all dividends and distributions, a complete redemption of the investment at the NAV at the end of the year and no sales or redemption charges (if any). Total return would be reduced if a sales or redemption charge was taken into account. Returns do not reflect the deduction of taxes that a shareholder would pay on Fund distributions or the redemption of Fund shares. |
| | |
| 78 | | The accompanying notes are an integral part of these financial statements. |
COMMERCE FUNDS
Notes to Financial Statements
October 31, 2019
The Commerce Funds (the “Trust”) is a Delaware statutory trust registered under the Investment Company Act of 1940, as amended (the “Act”), as anopen-end, management investment company. The Trust consists of eight portfolios (individually, a “Fund” and collectively, the “Funds”): Growth Fund, Value Fund, MidCap Growth Fund, Bond Fund, Short-Term Government Fund, NationalTax-Free Intermediate Bond Fund, MissouriTax-Free Intermediate Bond Fund and KansasTax-Free Intermediate Bond Fund. Each of the Funds offers one class of shares (the “Shares”). Each Fund is registered as a diversifiedopen-end management investment company, except the MissouriTax-Free Intermediate Bond Fund and the KansasTax-Free Intermediate Bond Fund, which are registered asnon-diversified under the Act.
The Funds have entered into an Advisory Agreement with Commerce Investment Advisors, Inc. (the “Adviser” or “Commerce”), a subsidiary of Commerce Bank.
|
| 2. SIGNIFICANT ACCOUNTING POLICIES |
The financial statements have been prepared in accordance with accounting principles generally accepted in the United States of America (“GAAP”) and require management to make estimates and assumptions that may affect the reported amounts and disclosures. Actual results may differ from those estimates and assumptions. Each Fund is an investment company under GAAP and follows the accounting and reporting guidance applicable to investment companies.
A. Investment Valuation — The Funds’ valuation policy is to value investments at fair value.
B. Investment Income and Investments — Investment income is comprised of interest income and dividend income, Interest income is accrued daily and adjusted for amortization of premiums and accretion of discounts. Dividend income is recognized on theex-dividend date. Investment transactions are reflected on trade date with realized gains and losses on sales calculated using identified cost. Investment transactions are recorded on the following business day for daily net asset value (“NAV”) calculations. Distributions received from the Funds’ investments in United States (“U.S.”) real estate investment trusts (“REITs”) may be characterized as ordinary income, net capital gain or a return of capital. A return of capital is recorded by the Funds as a reduction to the cost basis of the REIT. For treasury inflation indexed securities, adjustments to principal due to inflation/deflation are reflected as increases/decreases to interest income with a corresponding adjustment to cost.
For securities with paydown provisions, principal payments received are treated as a proportionate reduction to the cost basis of the securities and excess or shortfall amounts are recorded as income.
C. Expenses — Expenses incurred by the Trust that do not specifically relate to an individual Fund of the Trust are allocated to the Funds based on each Fund’s average net assets and are accrued daily.
D. Federal Taxes and Distributions to Shareholders — It is each Fund’s policy to comply with the requirements of the Internal Revenue Code of 1986, as amended (the “Code”), applicable to regulated investment companies (mutual funds) and to distribute each year substantially all of its investment company taxable income and capital gains to its shareholders. Accordingly, the Funds are not required to make any provisions for the payment of federal income tax. Distributions to shareholders are recorded on theex-dividend date. Income and capital gains distributions, if any, are declared and paid according to the following schedule:
| | | | | | | | |
| | | Income Distribution | | Capital Gains Distribution |
| Fund | | Declared | | Paid | | Declared | | Paid |
| | | | |
Value | | Quarterly | | Quarterly | | Annually | | Annually |
| | | | |
Growth and MidCap Growth | | Annually | | Annually | | Annually | | Annually |
| | | | |
Bond, Short-Term Government, NationalTax-Free Intermediate Bond, MissouriTax-Free Intermediate Bond and KansasTax-Free Intermediate Bond | | Daily | | Monthly | | Annually | | Annually |
79
COMMERCE FUNDS
Notes to Financial Statements(continued)
October 31, 2019
| | |
| 2. SIGNIFICANT ACCOUNTING POLICIES (continued) | | |
Net capital losses, if any, are carried forward to future fiscal years and may be used to the extent allowed by the Code to offset any future capital gains. Utilization of capital loss carryforwards will reduce the requirement of future capital gains distributions.
The characterization of distributions to shareholders for financial reporting purposes is determined in accordance with federal income tax rules, which may differ from GAAP. The source of each Fund’s distributions may be shown in the accompanying financial statements as either from distributable earnings or capital. Certain components of the Funds’ net assets on the Statements of Assets and Liabilities reflect permanent GAAP/tax differences based on the appropriate tax character.
|
| 3. INVESTMENTS AND FAIR VALUE MEASUREMENTS |
U.S. GAAP defines the fair value of a financial instrument as the amount that would be received to sell an asset or paid to transfer a liability in an orderly transaction between market participants at the measurement date (i.e., the exit price). GAAP establishes a fair value hierarchy that prioritizes the inputs to valuation techniques used to measure fair value. The hierarchy gives the highest priority to unadjusted quoted prices in active markets for identical assets or liabilities (Level 1 measurements) and the lowest priority to unobservable inputs (Level 3 measurements). The levels used for classifying investments are not necessarily an indication of the risk associated with investing in these investments. The three levels of the fair value hierarchy are described below:
Level 1 — Unadjusted quoted prices in active markets that are accessible at the measurement date for identical, unrestricted assets or liabilities;
Level 2 — Quoted prices in markets that are not active or financial instruments for which significant inputs are observable (including, but not limited to, quoted prices for similar investments, interest rates, prepayment speeds and credit risk), either directly or indirectly;
Level 3 — Prices or valuations that require significant unobservable inputs (including the Adviser’s assumptions in determining fair value measurement).
The Trust’s Board of Trustees has adopted valuation procedures (“Valuation Procedures”) that govern the valuation of the portfolio investments held by the Funds, including investments for which market quotations are not readily available. The Board of Trustees has delegated to Commerceday-to-day responsibility for implementing and maintaining internal controls and procedures related to the valuation of the Funds’ portfolio investments. To assess the continuing appropriateness of pricing sources and methodologies, Commerce regularly performs price verifications and issues challenges as necessary to third party pricing vendors or brokers, and any differences are reviewed in accordance with the Valuation Procedures.
A. Level 1 and Level 2 Fair Value Investments — The valuation techniques and significant inputs used in determining the fair values for investments classified as Level 1 and Level 2 are as follows:
Equity Securities — Equity securities traded on a U.S. securities exchange or the NASDAQ system, or those located on certain foreign exchanges, including but not limited to the Americas, are valued daily at their last sale price or official closing price on the principal exchange or system on which they are traded. If there is no sale or official closing price or such price is believed by the Adviser to not represent fair value, equity securities may be valued at the closing bid price. To the extent these investments are actively traded, they are classified as Level 1 of the fair value hierarchy, otherwise they are generally classified as Level 2.
Unlisted equity securities for which market quotations are available are valued at the last sale price on the valuation date, or if no sale occurs, at the last bid price and are generally classified as Level 2.
80
COMMERCE FUNDS
| | |
| 3. INVESTMENTS AND FAIR VALUE MEASUREMENTS (continued) | | |
Underlying Funds (including Money Market Funds) — Underlying Funds (“Underlying Funds”) include other investment companies in which the Funds may invest. Investments in the Underlying Funds are valued at the NAV per share on the day of valuation. Because the Funds invests in Underlying Funds that fluctuate in value, the Funds’ shares will correspondingly fluctuate in value. To the extent these investments are actively traded, they are classified as Level 1 of the fair value hierarchy, otherwise they are generally classified as Level 2. For information regarding an Underlying Fund’s accounting policies and investment holdings, please see the Underlying Fund’s shareholder report.
Debt Securities — Debt securities for which market quotations are readily available are valued daily on the basis of quotations furnished by an independent pricing service or provided by securities dealers. The pricing services may use valuation models or matrix pricing, which consider yield or price with respect to comparable bonds, quotations from bond dealers or by reference to other securities that are considered comparable in characteristics such as rating, interest rate and maturity date, to determine current value.
i. Mortgage-Backed and Asset-Backed Securities — Mortgage-backed securities represent direct or indirect participations in, or are collateralized by and payable from, mortgage loans secured by residential and/or commercial real estate property. Asset-backed securities include securities whose principal and interest payments are collateralized by pools of other assets or receivables. The value of certain mortgage-backed and asset-backed securities (including adjustable rate mortgage loans) may be particularly sensitive to changes in prevailing interest rates. The value of these securities may also fluctuate in response to the market’s perception of the creditworthiness of the issuers.
Asset-backed securities may present credit risks that are not presented by mortgage-backed securities because they generally do not have the benefit of a security interest in collateral that is comparable to mortgage assets. Some asset-backed securities may only have a subordinated claim on collateral.
Collateralized mortgage-backed securities (“CMOs”) may exhibit even more price volatility and interest rate risk than other mortgage-backed securities. They may lose liquidity as CMO market makers may choose not to repurchase, or may offer prices, based on current market conditions, that are unacceptable to a Fund based on the Adviser’s analysis of the market value of the security.
ii. Treasury Inflation Indexed Securities — These are treasury securities in which the principal amount is adjusted daily to keep pace with inflation, as measured by the U.S. Consumer Pricing Index for Urban Consumers. The repayment of the original bond principal upon maturity is guaranteed by the full faith and credit of the U.S. Government. The value of U.S. Treasury inflation protected public obligations will generally fluctuate in response to changes in real interest rates, generally decreasing when real interest rates rise and increasing when real interest rates fall. Inflation-protected bonds typically have lower yields than conventional fixed-rate bonds because of their inflation adjustment feature.
Short Term Investments — Short-term investments, except for Government obligations, having a maturity of 60 days or less are generally valued at amortized cost, which approximates fair market value. Government obligations maturing in less than 60 days shall be valued at their market price. With the exception of treasury securities, which are generally classified as Level 1, these investments are classified as Level 2 of the fair value hierarchy.
Repurchase Agreements — Repurchase agreements involve the purchase of securities subject to the seller’s agreement to repurchase the securities at a mutually agreed upon date and price, under the terms of a Master Repurchase Agreement (“MRA”). During the term of a repurchase agreement, the value of the underlying securities held as collateral on behalf of a Fund, including accrued interest, is required to exceed the value of the repurchase agreement, including accrued interest. The gross value of repurchase agreements is included in the Statements of Assets and Liabilities for financial reporting purposes. The underlying securities for all repurchase agreements are held at the Funds’ custodian or designatedsub-custodians undertri-party repurchase agreements.
81
COMMERCE FUNDS
Notes to Financial Statements(continued)
October 31, 2019
| | |
| 3. INVESTMENTS AND FAIR VALUE MEASUREMENTS (continued) | | |
An MRA governs transactions between a Fund and select counterparties. An MRA contains provisions for, among other things, initiation, income payments, and events of default and maintenance of securities for repurchase agreements. An MRA also permits offsetting with collateral to create one single net payment in the event of default or similar events, including the bankruptcy or insolvency of a counterparty.
If the seller defaults, a Fund could suffer a loss to the extent that the proceeds from the sale of the underlying securities and other collateral held by the Fund are less than the repurchase price and the Fund’s costs associated with delay and enforcement of the repurchase agreement. In addition, in the event of default or insolvency of the seller, a court could determine that a Fund’s interest in the collateral is not enforceable, resulting in additional losses to the Fund.
When-Issued Securities and Forward Commitments — When-issued securities, including TBA (“To Be Announced”) securities, are securities that are authorized but not yet issued in the market and purchased in order to secure what is considered to be an advantageous price or yield to a Fund. A forward commitment involves entering into a contract to purchase or sell securities, typically on an extended settlement basis, for a fixed price at a future date. The purchase of securities on a when-issued or forward commitment basis involves a risk of loss if the value of the security to be purchased declines before the settlement date. Conversely, the sale of securities on a forward commitment basis involves the risk that the value of the securities sold may increase before the settlement date. Although a Fund will generally purchase securities on a when-issued or forward commitment basis with the intention of acquiring the securities for its portfolio, the Fund may dispose of when-issued securities or forward commitments prior to settlement, which may result in a realized gain or loss. For financial reporting purposes, cash collateral that has been pledged to cover obligations of a Fund and cash collateral received, if any, is reported separately on the Statements of Assets and Liabilities as receivables/payables for collateral on certain contracts.Non-cash collateral pledged by a Fund, if any, is noted in the Schedules of Investments
B. Level 3 Fair Value Investments — The valuation techniques and significant inputs used in determining the fair values for investments classified as Level 3 are as follows:
To the extent that the aforementioned significant inputs are unobservable, or if quotations are not readily available, or if Commerce believes that such quotations do not accurately reflect fair value, the fair value of a Fund’s investments may be determined under valuation procedures approved by the Trust’s Board of Trustees. Commerce, consistent with the Funds’ procedures and applicable regulatory guidance, may make an adjustment to the most recent valuation prices of either domestic or foreign securities in light of significant events to reflect what it believes to be the fair value of the securities at the time of determining a Fund’s NAV. Significant events that could affect a large number of securities in a particular market may include, but are not limited to: significant fluctuations in U.S. or foreign markets; market dislocations; market disruptions; or unscheduled market closings. Significant events that could also affect a single issuer may include, but are not limited to: corporate actions such as reorganizations, mergers and buy outs; ratings downgrades; and bankruptcies.
C. Fair Value Hierarchy — The following is a summary of the Funds’ investments classified in the fair value hierarchy as of October 31, 2019:
| | | | | | | | | | | | |
| GROWTH | | | | | | | | | | | | |
| Investment Type | | Level 1 | | | Level 2 | | | Level 3 | |
Assets | | | | | | | | |
Common Stock and/or Other Equity Investments | | $ | 162,535,949 | | | $ | — | | | $ | — | |
Exchange Traded Fund | | | 3,451,044 | | | | — | | | | — | |
Investment Company | | | 2,136,113 | | | | — | | | | — | |
| | | |
Total | | $ | 168,123,106 | | | $ | — | | | $ | — | |
82
COMMERCE FUNDS
| | |
| 3. INVESTMENTS AND FAIR VALUE MEASUREMENTS (continued) | | |
| | | | | | | | | | | | |
|
| VALUE | |
| Investment Type | | Level 1 | | | Level 2 | | | Level 3 | |
Assets | | | | | | | | | | | | |
Common Stock and/or Other Equity Investments | | $ | 271,644,860 | | | $ | — | | | $ | — | |
Exchange Traded Fund | | | 9,755,250 | | | | — | | | | — | |
Investment Company | | | 4,396,208 | | | | — | | | | — | |
| | | |
Total | | $ | 285,796,318 | | | $ | — | | | $ | — | |
|
| MIDCAP GROWTH | |
| Investment Type | | Level 1 | | | Level 2 | | | Level 3 | |
Assets | | | | | | | | | | | | |
Common Stock and/or Other Equity Investments | | $ | 212,532,952 | | | $ | — | | | $ | — | |
Exchange Traded Fund | | | 7,381,854 | | | | — | | | | — | |
Investment Company | | | 2,621,081 | | | | — | | | | — | |
| | | |
Total | | $ | 222,535,887 | | | $ | — | | | $ | — | |
|
| BOND | |
| Investment Type | | Level 1 | | | Level 2 | | | Level 3 | |
Assets | | | | |
Fixed Income | |
Corporate Obligations | | $ | — | | | $ | 500,696,362 | | | $ | — | |
Mortgage-Backed Obligations | | | — | | | | 260,408,026 | | | | — | |
Asset-Backed Securities | | | — | | | | 215,255,492 | | | | — | |
Municipal Bond Obligations | | | — | | | | 102,674,007 | | | | — | |
U.S. Treasury and/or Other U.S. Government Agencies | | | 86,239,582 | | | | 17,272,527 | | | | — | |
Investment Company | | | 9,320,678 | | | | — | | | | — | |
| | | |
Total | | $ | 95,560,260 | | | $ | 1,096,306,414 | | | $ | — | |
|
| SHORT-TERM GOVERNMENT | |
| Investment Type | | Level 1 | | | Level 2 | | | Level 3 | |
Assets | | | | | | | | | | | | |
Fixed Income | |
Asset-Backed Securities | | $ | — | | | $ | 2,397,288 | | | $ | — | |
Mortgage-Backed Obligations | | | — | | | | 33,894,376 | | | | — | |
U.S. Treasury and/or Other U.S. Government Agencies | | | 7,014,298 | | | | 15,259,982 | | | | — | |
Investment Company | | | 856,810 | | | | — | | | | — | |
| | | |
Total | | $ | 7,871,108 | | | $ | 51,551,646 | | | $ | — | |
| | | |
| NATIONALTAX-FREE INTERMEDIATE BOND | | | | | | | | | | | | |
| Investment Type | | Level 1 | | | Level 2 | | | Level 3 | |
Assets | | | | | | | | | | | | |
Fixed Income | | | | | | | | | | | | |
Municipal Bond Obligations | | $ | — | | | $ | 412,204,945 | | | $ | — | |
Investment Company | | | 853,954 | | | | — | | | | — | |
| | | |
Total | | $ | 853,954 | | | $ | 412,204,945 | | | $ | — | |
83
COMMERCE FUNDS
Notes to Financial Statements(continued)
October 31, 2019
| | |
| 3. INVESTMENTS AND FAIR VALUE MEASUREMENTS (continued) | | |
| | | | | | | | | | | | |
|
| MISSOURITAX-FREE INTERMEDIATE BOND | |
| Investment Type | | Level 1 | | | Level 2 | | | Level 3 | |
Assets | | | | | | | | | | | | |
Fixed Income | |
Municipal Bond Obligations | | $ | — | | | $ | 357,556,428 | | | $ | — | |
Investment Company | | | 6,079,847 | | | | — | | | | — | |
| | | |
Total | | $ | 6,079,847 | | | $ | 357,556,428 | | | $ | — | |
|
| KANSASTAX-FREE INTERMEDIATE BOND | |
| Investment Type | | Level 1 | | | Level 2 | | | Level 3 | |
Assets | | | | | | | | | | | | |
Fixed Income | |
Municipal Bond Obligations | | $ | — | | | $ | 161,585,365 | | | $ | — | |
Investment Company | | | 1,468,531 | | | | — | | | | — | |
| | | |
Total | | $ | 1,468,531 | | | $ | 161,585,365 | | | $ | — | |
For further information regarding security characteristics, see the Schedule of Investments.
|
| 4. AGREEMENTS AND OTHER AFFILIATED TRANSACTIONS |
A. Advisory Agreement — Pursuant to the terms of the Advisory Agreement, the Adviser is responsible for managing the investments and making investment decisions for each of the Funds. For these services and for assuming related expenses, the Adviser is entitled to a fee, accrued daily and payable monthly, at the contractual annual rate of the corresponding Fund’s average daily net assets. The contractual advisory fees for the Funds are as follows:
| | | | | | |
| | | Contractual Advisory Fees |
| Fund | | First $100 million | | Next
$100 million | | Over
$200 million |
| | | |
Short-Term Government, NationalTax-Free Intermediate Bond, MissouriTax-Free Intermediate Bond and KansasTax-Free Intermediate Bond | | 0.50% | | 0.35% | | 0.25% |
| | | First $400 million | | Next
$300 million | | Over
$700 million |
| | | |
Bond | | 0.50% | | 0.35% | | 0.25% |
| | | First $200 million | | | | Over
$200 million |
| | | |
MidCap Growth Fund | | 0.50% | | | | 0.40% |
The contractual advisory fees for the Growth and Value Funds are 0.40% and 0.30% of the Funds’ average daily net assets, respectively.
For the fiscal year ended October 31, 2019, the effective advisory fees were 0.40%, 0.30%, 0.50%, 0.37%, 0.50%, 0.34%, 0.35% and 0.45%, for the Growth, Value, MidCap Growth, Bond, Short-Term Government, NationalTax-Free Intermediate Bond, MissouriTax-Free Intermediate Bond and KansasTax-Free Intermediate Bond Funds, respectively.
B. Administration Agreements — Goldman Sachs Asset Management, L.P. (“GSAM”), an affiliate of Goldman Sachs & Co. LLC (“Goldman Sachs”), and Commerce serve asCo-Administrators of the Trust pursuant to aCo-Administration
84
COMMERCE FUNDS
| | |
| 4. AGREEMENTS AND OTHER AFFILIATED TRANSACTIONS (continued) | | |
Agreement. Under theCo-Administration Agreement, GSAM and Commerce administer the Trust’s business affairs. As compensation for the services rendered under theCo-Administration Agreement, GSAM and Commerce are entitled to a fee, accrued daily and payable monthly, at the contractual annual rate of the corresponding Fund’s average daily net assets. Pursuant to theCo-Administration Agreement, the Funds pay an aggregate administrative fee at the annual rate of 0.145%, allocated as follows: (1) for each Fund, Commerce is entitled to receive 0.12% of each Fund’s average daily net assets; and (2) for each Fund, GSAM is entitled to receive 0.025% of each Fund’s average daily net assets. State Street Bank and Trust Company (“State Street”) also provides certain enhanced accounting and administrative services to the Funds pursuant to an Amended and Restated Enhanced Accounting and Administrative Services Agreement which services include, among other things, certain financial reporting, daily compliance and treasury services.
C. Distribution Agreement — The Commerce Funds’ shares are offered on a continuous basis through Goldman Sachs which acts as Distributor under the Distribution Agreement with The Commerce Funds. Goldman Sachs does not receive compensation from the Funds for these services.
D. Other Agreements — The Adviser has contractually agreed to waive fees and/or reimburse expenses (excluding interest, taxes, acquired fund fees and expenses, and extraordinary expenses) for all Funds (except the MidCap Growth Fund) to the extent that such expenses exceeded, on an annualized basis, 1.00%, 0.70%, 0.80%, 0.68%, 0.70%, 0.70% and 0.70% of the average net assets of the Growth, Value, Bond, Short-Term Government, NationalTax-Free Intermediate Bond, MissouriTax-Free Intermediate Bond and KansasTax-Free Intermediate Bond Funds, respectively. This agreement will remain in place through March 1, 2020. After this date, the Adviser or a Fund may terminate the contractual arrangement. In addition, the Funds are not obligated to reimburse the Adviser for prior fiscal year expense reimbursements, if any. Expense reimbursements, if any, are accrued daily and paid monthly and are disclosed in the Statements of Operations for the fiscal year ended October 31, 2019.
Pursuant to a Shareholder Administrative Services Plan adopted by the Trust’s Board of Trustees, the Funds may enter into agreements with service organizations, such as banks and financial institutions, which may include affiliates of the Adviser (“Service Organizations”), under which they will render shareholder administration support services. Servicing agreements entered into by the Funds will provide that the Service Organizations will render shareholder administrative support services to their customers who are the beneficial owners of shares of the Funds in consideration for a Fund’s payment of up to 0.15% (on an annualized basis) of the average daily net asset value of the shares of the Fund beneficially owned by such customers and held by the Service Organizations. Certain shareholder agreements entered into before November 17, 2015 may provide for payments of up to 0.25% of the average daily net asset value of the shares of the Fund beneficially owned by customers and held by a Service Organization. For the fiscal year ended October 31, 2019, Commerce Bank an affiliate of the Adviser, received $77,562 in shareowner servicing fees.
E. Deferred Compensation Plan — Certain Trustees participate in a Deferred Compensation Plan, as amended and restated (the “Plan”), which allows eligible Trustees as described in the Plan to defer the receipt of all or a portion of the Trustees’ fees payable. Under the Plan, such Trustees have deferred fees treated as if they had been invested by The Commerce Funds in the shares of one or more Funds of the Trust. All amounts payable to the Trustees under the Plan are determined based on the performance of such Funds and are accrued monthly.
85
COMMERCE FUNDS
Notes to Financial Statements(continued)
October 31, 2019
| | |
| 5. PORTFOLIO SECURITIES TRANSACTIONS | | |
The costs of purchases and proceeds from sales and maturities of long-term securities for the fiscal year ended October 31, 2019, was as follows:
| | | | | | | | | | | | | | | | |
| Fund | | Purchases of
U.S. Government
and Agency
Obligations | | | Purchases
(Excluding
U.S. Government
and Agency
Obligations) | | | Sales and
Maturities of
U.S. Government
and Agency
Obligations | | | Sales
and Maturities
(Excluding
U.S. Government
and Agency
Obligations) | |
| | | | |
Growth | | $ | — | | | $ | 74,051,751 | | | $ | — | | | $ | 56,411,858 | |
| | | | |
Value | | | — | | | | 120,891,627 | | | | — | | | | 88,047,626 | |
| | | | |
MidCap Growth | | | — | | | | 126,516,984 | | | | — | | | | 98,449,246 | |
| | | | |
Bond | | | 60,394,583 | | | | 175,472,215 | | | | 22,084,269 | | | | 156,170,624 | |
| | | | |
Short-Term Government | | | 20,092,974 | | | | — | | | | 32,455,663 | | | | 2,348,756 | |
| | | | |
NationalTax-Free Intermediate Bond | | | — | | | | 141,042,238 | | | | — | | | | 111,703,038 | |
| | | | |
MissouriTax-Free Intermediate Bond | | | — | | | | 85,836,390 | | | | — | | | | 85,550,476 | |
| | | | |
KansasTax-Free Intermediate Bond | | | — | | | | 32,736,472 | | | | — | | | | 20,770,084 | |
The tax character of distributions paid during the fiscal year ended October 31, 2019 was as follows:
| | | | | | | | | | | | | | | | |
| | | Growth | | | Value | | | MidCap
Growth | | | Bond | |
Distributions paid from: | | | | | | | | | | | | | | | | |
Ordinary income | | $ | 2,887,326 | | | $ | 6,449,812 | | | $ | 4,531,023 | | | $ | 36,117,722 | |
Net long-term capital gains | | | 8,075,312 | | | | 19,803,954 | | | | 10,616,279 | | | | — | |
Total taxable distributions | | $ | 10,962,638 | | | $ | 26,253,766 | | | $ | 15,147,302 | | | $ | 36,117,722 | |
| | | | |
| | | Short-Term Government | | | National Tax-Free
Intermediate Bond | | | Missouri Tax-Free Intermediate Bond | | | Kansas Tax-Free Intermediate Bond | |
Distributions paid from: | | | | | | | | | | | | | | | | |
Ordinary income | | $ | 1,490,983 | | | $ | 415,561 | | | $ | 317,917 | | | $ | 76,060 | |
Net long-term capital gains | | | — | | | | 465,255 | | | | — | | | | — | |
Total taxable distributions | | | 1,490,983 | | | | 880,816 | | | | 317,917 | | | | 76,060 | |
Totaltax-exempt income distributions | | $ | — | | | $ | 8,137,514 | | | $ | 7,466,261 | | | $ | 3,341,605 | |
The tax character of distributions paid during the fiscal year ended October 31, 2018 was as follows: | |
| | | | |
| | | Growth | | | Value | | | MidCap
Growth | | | Bond | |
Distributions paid from: | | | | | | | | | | | | | | | | |
Ordinary income | | $ | 1,693,926 | | | $ | 5 ,963,887 | | | $ | 2 ,494,526 | | | $ | 35,191,863 | |
Net long-term capital gains | | | 4,881,379 | | | | 24,048,755 | | | | 7,856,742 | | | | — | |
Total taxable distributions | | $ | 6,575,305 | | | $ | 30,012,642 | | | $ | 10,351,268 | | | $ | 35,191,863 | |
86
COMMERCE FUNDS
| | |
| 6. TAX INFORMATION (continued) | | |
| | | | | | | | | | | | | | | | |
| | | | |
| | | Short-Term Government | | | National Tax-Free
Intermediate Bond | | | Missouri Tax-Free Intermediate Bond | | | Kansas Tax-Free Intermediate Bond | |
Distributions paid from: | | | | | | | | | | | | | | | | |
Ordinary income | | $ | 1,559,449 | | | $ | 331,120 | | | $ | 18,336 | | | $ | 17,775 | |
Net long-term capital gains | | | — | | | | 534,418 | | | | — | | | | — | |
Total taxable distributions | | | 1,559,449 | | | | 865,538 | | | | 18,336 | | | | 17,775 | |
Totaltax-exempt income distributions | | $ | — | | | $ | 7,478,071 | | | $ | 8,383,570 | | | $ | 3,127,536 | |
As of October 31, 2019, the components of accumulated earnings (losses) on a tax basis were as follows:
| | | | | | | | | | | | | | | | |
| | | Growth | | | Value | | | MidCap
Growth | | | Bond | |
Undistributed ordinary income — net | | $ | 901,722 | | | $ | 1,585,807 | | | $ | 2,426,388 | | | $ | 2,455,079 | |
Undistributed long-term capital gains | | | 9,094,762 | | | | 12,685,062 | | | | 11,853,618 | | | | — | |
Total undistributed earnings | | $ | 9,996,484 | | | $ | 14,270,869 | | | $ | 14,280,006 | | | $ | 2,455,079 | |
Capital loss carryforward | | | — | | | | — | | | | — | | | | (3,229,031 | ) |
Timing differences (distributions payable, deferred compensation) | | | (40,237 | ) | | | (65,943 | ) | | | (38,732 | ) | | | (2,466,038 | ) |
Unrealized gains (losses) — net | | | 49,006,794 | | | | 34,657,680 | | | | 40,143,578 | | | | 55,034,167 | |
Total accumulated gains (losses) — net | | $ | 58,963,041 | | | $ | 48,862,606 | | | $ | 54,384,852 | | | $ | 51,794,177 | |
| | | | |
| | | Short-Term Government | | | NationalTax-Free
Intermediate Bond | | | MissouriTax-Free
Intermediate Bond | | | KansasTax-Free
Intermediate Bond | |
Undistributed ordinary income —net | | $ | 165,065 | | | $ | 355,450 | | | $ | — | | | $ | — | |
Undistributedtax-exempt income | | | — | | | | 1,166,451 | | | | 689,970 | | | | 324,703 | |
Undistributed long-term capital gains | | | — | | | | 1,121,151 | | | | — | | | | — | |
Total undistributed earnings | | $ | 165,065 | | | $ | 2,643,052 | | | $ | 689,970 | | | $ | 324,703 | |
Capital loss carryforward | | | (5,157,656 | ) | | | — | | | | (3,072,742 | ) | | | (245,766 | ) |
Timing differences (distributions payable, deferred compensation) | | | (80,042 | ) | | | (736,073 | ) | | | (619,918 | ) | | | (287,977 | ) |
Unrealized gains (losses) — net | | $ | 1,336,760 | | | $ | 17,890,830 | | | $ | 15,127,369 | | | $ | 7,028,292 | |
Total accumulated gains (losses) — net | | $ | (3,735,873 | ) | | $ | 19,797,809 | | | $ | 12,124,679 | | | $ | 6,819,252 | |
| | | | |
| | | Bond | | | Short-Term
Government | | | Missouri Tax-Free
Intermediate Bond | | | Kansas Tax-Free
Intermediate Bond | |
Capital loss carryforwards:(1)(2) | | | | | | | | | | | | | | | | |
Perpetual Short-term | | $ | (387,008 | ) | | $ | (514,293 | ) | | $ | (417,774 | ) | | $ | — | |
Perpetual Long-term | | | (2,842,023 | ) | | | (4,643,363 | ) | | | (2,654,968 | ) | | | (245,776 | ) |
Total capital loss carryforwards: | | $ | (3,229,031 | ) | | $ | (5,157,656 | ) | | $ | (3,072,742 | ) | | $ | (245,776 | ) |
| (1) | | Expiration occurs on October 31 of the year indicated. Short-Term Government Fund had a capital loss carry forward of $375,119 that expired in the current fiscal year. |
| (2) | | The MissouriTax-Free Intermediate Bond and KansasTax-Free Intermediate Bond Funds utilized $939,182 and $175,548, respectively, of capital losses in the current fiscal year. |
87
COMMERCE FUNDS
Notes to Financial Statements(continued)
October 31, 2019
| | |
| 6. TAX INFORMATION (continued) | | |
As of October 31, 2019, the Funds’ aggregate security unrealized gains and losses based on cost for U.S. federal income tax purposes were as follows:
| | | | | | | | | | | | | | | | |
| | | Growth | | | Value | | | MidCap
Growth | | | Bond | |
| | | | |
Tax Cost | | $ | 119,116,312 | | | $ | 251,138,638 | | | $ | 182,392,309 | | | $ | 1,136,832,507 | |
Gross unrealized gain | | | 49,998,850 | | | | 41,571,066 | | | | 44,600,106 | | | | 63,436,257 | |
Gross unrealized loss | | | (992,056 | ) | | | (6,913,386 | ) | | | (4,456,528 | ) | | | (8,402,090 | ) |
Net unrealized security gain | | $ | 49,006,794 | | | $ | 34,657,680 | | | $ | 40,143,578 | | | $ | 55,034,167 | |
| | | | |
| | | Short-Term
Government | | | NationalTax-Free
Intermediate Bond | | | MissouriTax-Free
Intermediate Bond | | | KansasTax-Free
Intermediate Bond | |
| | | | |
Tax Cost | | $ | 58,085,994 | | | $ | 395,168,069 | | | $ | 348,508,906 | | | $ | 156,025,604 | |
Gross unrealized gain | | | 1,499,677 | | | | 17,949,913 | | | | 15,306,825 | | | | 7,120,553 | |
Gross unrealized loss | | | (162,917 | ) | | | (59,083 | ) | | | (179,456 | ) | | | (92,261 | ) |
Net unrealized security gain | | $ | 1,336,760 | | | $ | 17,890,830 | | | $ | 15,127,369 | | | $ | 7,028,292 | |
The difference between GAAP-basis andtax-basis unrealized gains (losses) are attributable primarily to wash sales and differences in the tax treatment of market discount accretion and premium amortization.
The Commerce Short-Term Government Fund reclassed $375,119 from paid in capital to distributable earnings for the year ending October 31, 2019. In order to present certain components of the Funds’ capital accounts on atax-basis, certain reclassifications have been recorded to the Funds’ accounts. These reclassifications have no impact on the net asset value of the Funds’ and result primarily from expired capital loss carryforwards.
Commerce and GSAM have reviewed the Funds’ tax positions for all open tax years (the current and prior three fiscal years) and have concluded that no provision for income tax is required in the Funds’ financial statements. Such open tax years remain subject to examination and adjustment by tax authorities.
The Funds’ risks include, but are not limited to, the following:
Credit Risk — The fixed income Funds are subject to credit risk because an issuer or guarantor of a fixed income security may be unable or unwilling to make interest and principal payments when due. A bond’s value could decline because of concerns about an issuer’s willingness to make such payments.
High Yield Risk — The Bond Fund is subject to high yield risk. High yield securities are subject to greater levels of credit and liquidity risk. High yield securities are considered speculative with respect to an issuer’s ability to make principal and interest payments and may be more volatile than higher-rated securities of similar maturity.
Interest Rate Risk — The fixed income Funds are subject to interest rate risk. Interest rate risk is the risk that the value of the Fund’s portfolio will decline because of rising interest rates. The magnitude of this decline will often be greater for longer-term, fixed-income securities than shorter-term securities.
Investment Companies Risk — The Funds may invest, consistent with their respective investment objectives and strategies, in securities of other investment companies subject to statutory limitations prescribed by the Act. These limitations include a
88
COMMERCE FUNDS
| | |
| 7. OTHER RISKS (continued) | | |
prohibition on any Fund acquiring more than 3% of the voting shares of any other investment company, and a prohibition on investing more than 5% of the Fund’s total assets in securities of any one investment company or more than 10% of its total assets in securities of all investment companies (except money market funds). The Funds will indirectly bear their proportionate share of any management fees and other expenses paid by such other investment companies.
Liquidity Risk — The fixed income Funds are subject to liquidity risk. Each fixed income Fund may not be able to pay
redemption proceeds within the time periods described in the Funds’ prospectus because of unusual market conditions, an unusually high number of redemption requests or other reasons. Liquidity risk may result from the lack of an active market or reduced number and capacity of traditional market participants to make a market in fixed income securities, and may be magnified in a rising interest rate environment or other circumstances where investor redemptions from fixed income mutual funds may be higher than normal, causing increased supply in the market due to selling activity. Certain portfolio securities held by the fixed income funds may be less liquid than others, which may make those securities difficult or impossible to sell at an advantageous time or price.
Mid-Cap and Small-Cap Risk — The Growth, Value and MidCap Growth Funds are subject to the risks associated with investing in equity securities ofmid- andsmall-cap companies. Investing in securities of smaller andmid-sized companies may be riskier than investing in larger, more established companies. Smaller andmid-sized companies are more vulnerable to adverse developments because of more limited product lines, markets or financial resources. Also, these stocks may trade less often and in limited volume compared to larger cap stocks trading on a national securities exchange. The prices of these stocks may be more volatile than the prices of larger company stocks. As a result, the Fund’s net asset value may be subject to rapid and substantial changes.
Non-Diversification Risk —Non-diversified funds typically hold fewer securities than diversified funds do. Consequently, the change in value of any one security may affect the overall value of anon-diversified portfolio more than it would a diversified portfolio.
Portfolio Concentration Risk — The MissouriTax-Free Intermediate Bond and KansasTax-Free Intermediate Bond Funds invest a large percentage of their assets in obligations of issuers within Missouri and Kansas, respectively. Therefore, they are subject to possible concentration risks associated with economic, political or legal developments or industrial or regional matters specifically affecting those states.
Under normal market conditions, the MissouriTax-Free Intermediate Bond Fund and the KansasTax-Free Intermediate Bond Fund invest at least 80% of their assets plus any borrowings for investment purposes (measured at the time of purchase) in Missouri and Kansas municipal securities, respectively, the income from which, in the opinion of bond counsel, is exempt from regular federal income tax, federal alternative minimum taxes and Missouri and Kansas state taxes, respectively. Alternatively, at least 80% of a Fund’s distributed income must be exempt from such taxes. For each of the Missouri and KansasTax-Free Funds, the actual payment of principal and interest on Missouri and Kansas municipal securities is dependent on the Missouri General Assembly and the Kansas legislature, respectively, allotting money each fiscal year for these payments.
The investments of the Growth, Value and MidCap Growth Funds may be concentrated in securities of technology companies. At times, securities of technology companies may experience significant price fluctuations. The Value Fund’s performance may be adversely affected by events affecting the financial sectors, if it invests a relatively large percentage of its assets in those sectors. The financial sectors can be significantly affected by changes in interest rates, government regulation, the rate of corporate and consumer debt defaulted, price competition, and the availability and cost of capital. The MidCap Growth Fund concentrates inmid-cap stocks. Investing in smaller andmid-sized companies may be riskier than investing in larger, more established companies.
89
COMMERCE FUNDS
Notes to Financial Statements(continued)
October 31, 2019
| | |
| 7. OTHER RISKS (continued) | | |
The Bond and Short-Term Government Funds may invest 80% and 100%, respectively, of their total assets in mortgage-related securities and the Bond Fund may invest 80% of its total assets in asset-backed securities. Mortgage-backed securities, especially collateralized mortgage-backed securities, may be subject to risks that include price volatility, liquidity, and enhanced sensitivity to interest rates. As a result, mortgage-backed securities may be more difficult to value and liquidate, if necessary. Mortgage-backed securities are also subject to prepayment risk, which may result in a decreased rate of return and a decline in the value of the securities. Asset-backed securities are dependent upon payment of the underlying consumer loans or receivables by individuals, and the certificate holder frequently has no recourse against the entity that originated the loans or receivables. Asset backed securities have a greater risk of default during periods of economic downturn than other securities. Also, asset-backed securities may be less liquid than other securities and therefore more difficult to value and liquidate, if necessary.
Quantitative Model Risk — The Growth, Value and MidCap Growth Funds are subject to the risk that securities selected using quantitative models may perform differently from the market as a whole for many reasons, including the factors used in building the model and the weights placed on each factor, among others. The quantitative models used by the Adviser to manage the Growth, Value and MidCap Growth Funds may not perform as expected, particularly in volatile markets.
Under the Trust’s organizational documents, its Trustees, officers, employees and agents are indemnified, to the extent permitted by the Act and state law, against certain liabilities that may arise out of performance of their duties to the Funds. Additionally, in the course of business, the Funds enter into contracts that contain a variety of indemnification clauses. The Funds’ maximum exposure under these arrangements is unknown, as this would involve future claims that may be made against the Funds that have not yet occurred. However, in their experience, Commerce and GSAM believe the risk of loss under these arrangements to be remote.
In March 2017, the Financial Accounting Standards Board issued Accounting Standards Update ASU2017-08—Receivables— Nonrefundable Fees and Other Costs (Subtopic310-20): Premium Amortization on Purchased Callable Debt Securities (“ASU 08”). The amendments in the ASU 08 shorten the amortization period for certain callable debt securities held at a premium, by requiring amortization to the earliest call date. ASU 08 is effective for fiscal years, and interim periods within those fiscal years, beginning after December 15, 2018. GSAM and Commerce are currently evaluating the impact, if any, of the amendments.
Effective November 13, 2019, GSAM’s fee received for services rendered under the Co-Administration Agreement was reduced from 0.025% to 0.0175%. This reduction correlates to a change in certain services previously performed by GSAM that have been subsequently outsourced to a third party.
90
COMMERCE FUNDS
| | |
| 11. SUMMARY OF SHARE TRANSACTIONS | | |
Share activity is as follows:
| | | | | | | | |
| | | Growth Fund | |
| | | For the Fiscal Year Ended
October 31, 2019 | | | For the Fiscal Year Ended
October 31, 2018 | |
| | | Shares | | | Shares | |
Shares sold | | | 1,435,623 | | | | 583,548 | |
Reinvestment of distributions | | | 114,471 | | | | 63,113 | |
Shares redeemed | | | (632,744 | ) | | | (602,764 | ) |
| | |
| Net Increase | | | 917,350 | | | | 43,897 | |
| |
| | | Value Fund | |
| | | For the Fiscal Year Ended
October 31, 2019 | | | For the Fiscal Year Ended
October 31, 2018 | |
| | | Shares | | | Shares | |
Shares sold | | | 3,141,884 | | | | 1,202,012 | |
Reinvestment of distributions | | | 449,519 | | | | 509,370 | |
Shares redeemed | | | (1,622,403 | ) | | | (2,163,529 | ) |
| | |
| Net Increase (Decrease) | | | 1,969,000 | | | | (452,147 | ) |
| |
| | | MidCap Growth Fund | |
| | | For the Fiscal Year Ended
October 31, 2019 | | | For the Fiscal Year Ended
October 31, 2018 | |
| | | Shares | | | Shares | |
Shares sold | | | 1,567,135 | | | | 687,173 | |
Reinvestment of distributions | | | 82,049 | | | | 52,801 | |
Shares redeemed | | | (572,763 | ) | | | (462,469 | ) |
| | |
| Net Increase | | | 1,076,421 | | | | 277,505 | |
| |
| | | Bond Fund | |
| | | For the Fiscal Year Ended
October 31, 2019 | | | For the Fiscal Year Ended
October 31, 2018 | |
| | | Shares | | | Shares | |
Shares sold | | | 10,557,791 | | | | 11,553,547 | |
Reinvestment of distributions | | | 444,510 | | | | 434,821 | |
Shares redeemed | | | (9,933,288 | ) | | | (8,340,634 | ) |
| | |
| Net Increase | | | 1,069,013 | | | | 3,647,734 | |
| |
| | | Short-Term Government Fund | |
| | | For the Fiscal Year Ended
October 31, 2019 | | | For the Fiscal Year Ended
October 31, 2018 | |
| | | Shares | | | Shares | |
Shares sold | | | 1,053,150 | | | | 1,007,390 | |
Reinvestment of distributions | | | 38,905 | | | | 40,144 | |
Shares redeemed | | | (1,943,531 | ) | | | (2,559,623 | ) |
| | |
| Net Decrease | | | (851,476 | ) | | | (1,512,089 | ) |
91
COMMERCE FUNDS
Notes to Financial Statements(continued)
October 31, 2019
| | |
| 11. SUMMARY OF SHARE TRANSACTIONS (continued) | | |
| | | | | | | | |
| |
| | | NationalTax-Free Intermediate Bond Fund | |
| | | For the Fiscal Year Ended
October 31, 2019 | | | For the Fiscal Year Ended
October 31, 2018 | |
| | | Shares | | | Shares | |
Shares sold | | | 3,945,791 | | | | 3,895,625 | |
Reinvestment of distributions | | | 16,700 | | | | 13,530 | |
Shares redeemed | | | (2,551,185 | ) | | | (1,999,541 | ) |
| | |
| Net Increase | | | 1,411,306 | | | | 1,909,614 | |
| |
| | | MissouriTax-Free Intermediate Bond Fund | |
| | | For the Fiscal Year Ended
October 31, 2019 | | | For the Fiscal Year Ended
October 31, 2018 | |
| | | Shares | | | Shares | |
Shares sold | | | 3,104,366 | | | | 2,948,018 | |
Reinvestment of distributions | | | 48,245 | | | | 57,611 | |
Shares redeemed | | | (2,793,097 | ) | | | (2,610,437 | ) |
| | |
| Net Increase | | | 359,514 | | | | 395,192 | |
| |
| | | Kansas Tax-Free Intermediate Bond Fund | |
| | | For the Fiscal Year Ended
October 31, 2019 | | | For the Fiscal Year Ended
October 31, 2018 | |
| | | Shares | | | Shares | |
Shares sold | | | 1,398,891 | | | | 1,414,687 | |
Reinvestment of distributions | | | 13,449 | | | | 14,883 | |
Shares redeemed | | | (1,149,868 | ) | | | (824,243 | ) |
| | |
| Net Increase | | | 262,472 | | | | 605,327 | |
92
COMMERCE FUNDS
Report of Independent Registered Public Accounting Firm
To the Shareholders and Board of Trustees
The Commerce Funds:
Opinion on the Financial Statements
We have audited the accompanying statements of assets and liabilities of The Growth Fund, The Value Fund, The MidCap Growth Fund, The Bond Fund, The Short-Term Government Fund, The NationalTax-Free Intermediate Bond Fund, The MissouriTax-Free Intermediate Bond Fund, and The KansasTax-Free Intermediate Bond Fund (the Funds), each a series of The Commerce Funds, including the schedules of investments, as of October 31, 2019, the related statements of operations for the year then ended, the statements of changes in net assets for each of the years in thetwo-year period then ended, and the related notes (collectively, the financial statements) and the financial highlights for each of the years in thefive-year period then ended. In our opinion, the financial statements and financial highlights present fairly, in all material respects, the financial position of the Funds as of October 31, 2019, the results of their operations for the year then ended, the changes in their net assets for each of the years in thetwo-year period then ended, and the financial highlights for each of the years in thefive-year period then ended, in conformity with U.S. generally accepted accounting principles.
Basis for Opinion
These financial statements and financial highlights are the responsibility of the Funds’ management. Our responsibility is to express an opinion on these financial statements and financial highlights based on our audits. We are a public accounting firm registered with the Public Company Accounting Oversight Board (United States) (PCAOB) and are required to be independent with respect to the Funds in accordance with the U.S. federal securities laws and the applicable rules and regulations of the Securities and Exchange Commission and the PCAOB.
We conducted our audits in accordance with the standards of the PCAOB. Those standards require that we plan and perform the audit to obtain reasonable assurance about whether the financial statements and financial highlights are free of material misstatement, whether due to error or fraud. Our audits included performing procedures to assess the risks of material misstatement of the financial statements and financial highlights, whether due to error or fraud, and performing procedures that respond to those risks. Such procedures included examining, on a test basis, evidence regarding the amounts and disclosures in the financial statements and financial highlights. Such procedures also included confirmation of securities owned as of October 31, 2019, by correspondence with custodian and brokers, or by other appropriate auditing procedures. Our audits also included evaluating the accounting principles used and significant estimates made by management, as well as evaluating the overall presentation of the financial statements and financial highlights. We believe that our audits provide a reasonable basis for our opinion.

We have served as the auditor of one or more Commerce investment companies since 1994.
Boston, Massachusetts
December 19, 2019
93
94
COMMERCE FUNDS
Fund Expenses– Six Month Period Ended October 31, 2019 (Unaudited)
As a shareholder of the Funds you incur two types of costs: (1) transaction costs and (2) ongoing costs, including management fees; shareholder servicing fees and other Fund expenses. This Example is intended to help you understand your ongoing costs (in dollars) of investing in the Fund and to compare these costs with the ongoing costs of investing in other mutual funds.
The example is based on an investment of $1,000 invested at the beginning of the period and held for the entire period from May 1, 2019 through October 31, 2019, which represents a period of 184 days in a365-day year.
Actual Expenses — The first line in the table below provides information about actual account values and actual expenses. You may use the information in this line, together with the amount you invested, to estimate the expenses that you paid over the period. Simply divide your account value by $1,000 (for example, an $8,600 account value divided by $1,000=8.6), then multiply the result by the number in the first line under the heading entitled “Expenses Paid” to estimate the expenses you paid on your account during this period.
Hypothetical Example for Comparison Purposes — The second line in the table below provides information about hypothetical account values and hypothetical expenses based on the Funds’ actual net expense ratios and an assumed rate of return of 5% per year before expenses, which is not the Funds’ actual return. The hypothetical account values and expenses may not be used to estimate the actual ending account balance or expenses you paid for the period. You may use this information to compare the ongoing costs of investing in the Funds and other funds. To do so, compare this 5% hypothetical example with the 5% hypothetical examples that appear in the shareholder reports of the other funds.
Please note that the expenses shown in the table are meant to highlight your ongoing costs only and do not reflect any transactional costs, such as exchange fees, but shareholders of other funds may incur such costs. Therefore, the second line of the table is useful in comparing ongoing costs only, and will not help you determine the relative total costs of owning different funds. In addition, if these transactional costs were included, your costs would have been higher.
| | | | | | | | | | | | | | | | | | | | | | | | | | | | | | | | | | | | | | | | | | | | | | | | |
| | | Beginning
Account
Value
5/1/19 | | | Ending
Account
Value
10/31/19 | | | Expenses
Paid for
the
6 months
ended
10/31/19* | | | Beginning
Account
Value
5/1/19 | | | Ending
Account
Value
10/31/19 | | | Expenses
Paid for
the
6 months
ended
10/31/19* | | | Beginning
Account
Value
5/1/19 | | | Ending
Account
Value
10/31/19 | | | Expenses
Paid for
the
6 months
ended
10/31/19* | | | Beginning
Account
Value
5/1/19 | | | Ending
Account
Value
10/31/19 | | | Expenses
Paid for
the
6 months
ended
10/31/19* | |
| | | | | |
| Fund | | Growth Fund | | | Value Fund | | | MidCap Growth Fund | | | Bond Fund | |
Shares | | | | | | | | | | | | | | | | | | | | | | | | | | | | | | | | | | | | | | | | | | | | | | | | |
| Actual | | $ | 1,000.00 | | | $ | 1,053.50 | | | $ | 3.93 | | | $ | 1,000.00 | | | $ | 1,049.00 | | | $ | 3.62 | | | $ | 1,000.00 | | | $ | 1,032.20 | | | $ | 4.15 | | | $ | 1,000.00 | | | $ | 1,053.70 | | | $ | 3.21 | |
| Hypothetical 5% return | | | 1,000.00 | | | | 1,021.37 | + | | | 3.87 | | | | 1,000.00 | | | | 1,021.68 | + | | | 3.57 | | | | 1,000.00 | | | | 1,021.12 | + | | | 4.13 | | | | 1,000.00 | | | | 1,022.08 | + | | | 3.16 | |
| | | | | |
| | | Short-Term Government Fund | | | NationalTax-Free Intermediate
Bond Fund | | | MissouriTax-Free Intermediate
Bond Fund | | | KansasTax-Free Intermediate
Bond Fund | |
Shares | | | | | | | | | | | | | | | | | | | | | | | | | | | | | | | | | | | | | | | | | | | | | | | | |
| Actual | | $ | 1,000.00 | | | $ | 1,022.90 | | | $ | 3.47 | | | $ | 1,000.00 | | | $ | 1,033.00 | | | $ | 3.07 | | | $ | 1,000.00 | | | $ | 1,028.70 | | | $ | 3.27 | | | $ | 1,000.00 | | | $ | 1,027.30 | | | $ | 3.58 | |
| Hypothetical 5% return | | | 1,000.00 | | | | 1,021.78 | + | | | 3.47 | | | | 1,000.00 | | | | 1,022.18 | + | | | 3.06 | | | | 1,000.00 | | | | 1,021.98 | + | | | 3.26 | | | | 1,000.00 | | | | 1,021.68 | + | | | 3.57 | |
| * | | Expenses are calculated using each Fund’s annualized net expense ratio, which represents the ongoing expenses as a percentage of net assets for the six months ended October 31, 2019. Expenses are calculated by multiplying the annualized net expense ratio by the average account value for the period; then multiplying the result by the number of days in the most recent fiscal half year; and then dividing that result by the number of days in the year. The annualized net expense ratios for the period were as follows: |
| | | | | | | | | | | | | | |
Fund | | | | | | | | Fund | | | |
| Growth | | | 0.76 | % | | | | | | Short-Term Government | | | 0.68 | % |
| Value | | | 0.70 | | | | | | | NationalTax-Free Intermediate Bond | | | 0.60 | |
| MidCap Growth | | | 0.81 | | | | | | | MissouriTax-Free Intermediate Bond | | | 0.64 | |
| Bond | | | 0.62 | | | | | | | KansasTax-Free Intermediate Bond | | | 0.70 | |
| + | | Hypothetical expenses are based on the Funds’ actual net expense ratios and an assumed rate of return of 5% per year before expenses. |
COMMERCE FUNDS
Trustees and Officers(Unaudited)
The Board of Trustees of the Trust is responsible for the management of the business and affairs of the Trust. The Trustees and officers of the Trust and their principal occupations for the last five years are set forth below. Trustees who are not deemed to be “interested persons” of the Trust as defined in the Act are referred to as “Independent Trustees.” Trustees who are deemed to be “interested persons” of the Trust are referred to as “Interested Trustees.” The Commerce Funds’ statement of additional information (“SAI”), which includes additional information about the Trustees, is available and may be obtained without charge by calling1-800-995-6365.
Each Trustee holds office for an indefinite term until the earliest of: (a) the election of his successor; (b) the date a trustee dies, resigns or is removed by at leasttwo-thirds of the Board of Trustees in accordance with the Trust’s Declaration of Trust; (c) in accordance with theby-laws of the Trust (which may be changed by the Trustees without shareholder approval) at the end of the calendar year during which the Trustee attains the age of 75 years; unless the Board, in its discretion, votes to retain a trustee or (d) the Trust terminates. Each officer holds office for an indefinite term until the earliest of: (a) the election of his successor; (b) the date an officer dies, resigns or is removed by the Board of Trustees in accordance with the Trust’sby-laws; or (c) the Trust terminates.
Independent Trustees
| | | | | | | | | | |
Name,
Address and Age | | Position(s)
Held with
The Trust | | Length of
Time
Served1 | | Principal Occupation(s)
During Past 5 Years | | Number of
Funds in
Fund
Complex2
Overseen
by Trustee | | Other Directorships Held
During Past 5 Years3 |
David L. Bodde c/o The Commerce Funds 922 Walnut Street Kansas City, MO 64106 Age: 76 | | Lead Independent Trustee | | 25 years | | Emeritus Professor, International Center for Automotive Research, Clemson University, since 2016; Consultant, Ewing Marion Kauffman Foundation, since 2017; Professor, International Center for Automotive Research, Clemson University, from 2004 to 2016; Charles N. Kimball Professor of Technology and Innovation, University of Missouri, Kansas City, from July 1996 to July 2004. | | 8 | | Director, Great Plains Energy Inc., from 1994 to 2018. |
| | | | | |
*Scott D. Monette c/o The Commerce Funds 922 Walnut Street Kansas City, MO 64106 Age: 58 | | Trustee | | Since August 2017 | | Chief Executive Officer, Big Heart Wines LLC, since 2013; Director, Spartan Light Metal Products, Inc., since 2014; Chief Financial Officer, from 2011 to 2013, Corporate Vice President, Treasurer and Corporate Development Officer, from 2001 to 2011, Ralcorp Holdings, Inc. (food manufacturing). | | 8 | | None |
| | | | | |
**Charles W. Peffer c/o The Commerce Funds 922 Walnut Street Kansas City, MO 64106 Age: 72 | | Trustee | | 16 years | | Retired. Former Partner and Managing Partner of KPMG LLP until September 2002. | | 8 | | Director, Garmin Ltd. (aviation and consumer technology), since 2004; Director, Sensata Technologies Holding N.V. (sensors and control systems for various manufacturing products), since 2010; Director, HD Supply Holdings, Inc. (industrial distributor of products and services in North America), since 2013. |
95
COMMERCE FUNDS
Trustees and Officers(Unaudited) (continued)
Independent Trustees (continued)
| | | | | | | | | | |
Name,
Address and Age | | Position(s)
Held with
The Trust | | Length of
Time
Served1 | | Principal Occupation(s)
During Past 5 Years | | Number of
Funds in
Fund
Complex2
Overseen
by Trustee | | Other Directorships Held
During Past 5 Years3 |
Erika Z. Schenk c/o The Commerce Funds 922 Walnut Street Kansas City, MO 64106 Age: 47 | | Trustee | | Since August 2017 | | General Counsel and Vice President of Compliance, World Wide Technology, Inc., (technology solutions and services) since 2014; Senior Counsel, The Boeing Company (aerospace manufacturing), from 2011 to 2014. | | 8 | | None |
| | | | | |
James M. Snowden, Jr. c/o The Commerce Funds 922 Walnut Street Kansas City, MO 64106 Age: 76 | | Trustee | | 9 years | | Executive Vice President, Huntleigh Securities Corporation, since 1995. | | 8 | | None |
| | | | | |
***V. Raymond Stranghoener c/o The Commerce Funds 922 Walnut Street Kansas City, MO 64106 Age: 68 | | Trustee and Chairman | | Since February 2018 | | Chairman, since 2018, Chairman and CEO, from 2016 to 2018, President and CEO, from 1999 to 2016, Commerce Trust Company. | | 8 | | None |
| 1 | | Each Trustee holds office for an indefinite term until the earliest of: (a) the election of his or her successor; (b) the date a Trustee dies, resigns or is removed by at leasttwo-thirds of the Board in accordance with the Trust’s Declaration of Trust; (c) in accordance with theby-laws of the Trust (which may be changed by the Trustees without shareholder approval) at the end of the calendar year during which the Trustee attains the age of 75 years, unless the Board, in its discretion, votes to retain a Trustee; or (d) the Trust terminates. |
| 2 | | The “Fund Complex” consists of the Trust. |
| 3 | | Directorships of companies required to report to the SEC under the Securities Exchange Act of 1934 (i.e., “public companies”) or other investment companies registered under the 1940 Act. |
| * | | Mr. Monette has obtained a $1.5 million line of credit from Commerce Bank, N.A. (“Commerce Bank”), a subsidiary of Commerce Bancshares, the parent company of the Adviser, for purposes of his business. The line of credit is secured by assets in a trust owned by Mr. Monette’s wife. The largest amount of the loan outstanding during the two most recently completed calendar years was $200,458, and the amount outstanding as of December 31, 2018 was $0. The line of credit and its terms, including the rate of interest, were negotiated at arms’ length and are consistent with the terms and pricing of other similar lines of credit extended by Commerce Bank, and Mr. Monette was not provided with any preferential terms. For this reason, Mr. Monette is not considered to have a material business or professional relationship with the Adviser or its affiliates. |
| ** | | Mr. Peffer serves as an independent director of Lockton Inc. (“Lockton”), a privately owned company (since 2013). Lockton serves as the Funds’ insurance broker. Commerce Bancshares, parent company of the Adviser, pays Lockton an annual fee for insurance brokerage services provided to both the Funds and Commerce Bancshares in the amount of approximately $375,000 (the “Transaction”). The Transaction is not considered material to Lockton or Commerce Bancshares, and Mr. Peffer is not considered to have a material business relationship with either the Adviser or the Trust under the 1940 Act as a result of the Transaction. |
| *** | | Mr. Stranghoener is an interested person of the Trust because he is the Chairman of CTC, an affiliate of the Adviser, and Commerce Bancshares, the parent company of the Adviser. In addition, Mr. Stranghoener owns shares of Commerce Bancshares. Mr. Stranghoener was elected as Chair of the Board as of January 1, 2019, to succeed Mr. Galt upon his retirement from the Board. |
96
COMMERCE FUNDS
Officers
| | | | | | |
Name,
Address and Age | | Position(s) Held with The Trust | | Length of Time Served | | Principal Occupation(s) During Past 5 Years |
William R. Schuetter Commerce Investment Advisors, Inc. 922 Walnut Street Kansas City, MO 64106 Age: 59 | | President | | 11 years | | Chief Operations Officer, Commerce Investment Advisors, Inc., since May 2001; Director, Commerce Investment Advisors, Inc., since April 2008; Vice President, Commerce Bank, since 1998; President, The Commerce Funds, since May 2008. |
| | | |
Laura Spidle Commerce Investment Advisors, Inc. 922 Walnut Street Kansas City, MO 64106 Age: 50 | | Secretary, Chief Compliance Officer, Vice President and Anti-Money Laundering Officer | | Since August 2017 | | Compliance Manager, American Century Investments, 2004-2017. |
| | | |
Peter W. Fortner Goldman Sachs & Co. LLC 30 Hudson Street Jersey City, NJ 07302 Age: 61 | | Chief Accounting Officer and Treasurer | | 12 years | | Vice President, Goldman Sachs & Co. LLC, since July 2000; Assistant Treasurer, Goldman Sachs Mutual Fund Complex, since July 2000; Treasurer of the Goldman Sachs Philanthropy Fund, since September 2019. |
| | | |
Philip V. Giuca, Jr. Goldman Sachs & Co. LLC 30 Hudson Street Jersey City, NJ 07302 Age: 57 | | Assistant Treasurer | | 21 years | | Managing Director, Goldman Sachs & Co. LLC, since January 2014; Vice President, Goldman Sachs & Co. LLC, May 1992 to December 2013; Assistant Secretary, The Goldman Sachs Group Inc., and Assistant Treasurer, Goldman Sachs Mutual Fund Complex, since 2000. |
| | | |
Joseph McClain Goldman Sachs & Co. LLC 200 West Street New York, NY 10282 Age: 35 | | Assistant Secretary | | Since November 2017 | | Vice President and Assistant General Counsel, Goldman Sachs Asset Management, since February 2016; Associate, Dechert LLP, April 2012 to January 2016. |
| | | |
Jeffrey Bolin Commerce Investment Advisors, Inc. 922 Walnut Street Kansas City, MO 64106 Age: 52 | | Vice President | | 11 years | | Vice President and Business Manager, The Commerce Funds, since November 2013; Vice President and Business Manager, Commerce Investment Advisors, Inc., since March 2012; Assistant Vice President and Business Manager, The Commerce Funds, from November 2008 to November 2013; Assistant Vice President and Business Manager, Commerce Investment Advisors, Inc., November 2008 to March 2012. |
97
COMMERCE FUNDS
The Commerce Funds
Growth Fund:
The Fund is subject to market risk so that the value of the securities in which it invests may go up or down in response to the prospects of individual companies, particular industry sectors and/or general economic conditions. Investments in technology companies, which may produce or use products or services that prove commercially unsuccessful or become obsolete, may be subject to greater price volatility than securities of companies in other sectors. The Fund is also subject to quantitative model risk, which is the risk that securities selected using quantitative models may perform differently from the market as a whole for many reasons, including the factors used in building the model and the weights placed on each factor, among others. The quantitative model used by the Adviser to manage the Fund may not perform as expected, particularly in volatile markets.
Value Fund:
The Fund is subject to market risk so that the value of the securities in which it invests may go up or down in response to the prospects of individual companies, particular industry sectors and/or general economic conditions. Investments in technology companies, which may produce or use products or services that prove commercially unsuccessful or become obsolete, may be subject to greater price volatility than securities of companies in other sectors. The Value Fund’s performance may be adversely affected by events affecting the financial sectors, if it invests a relatively large percentage of its assets in those sectors. The financial sectors can be significantly affected by changes in interest rates, government regulation, the rate of corporate and consumer debt defaulted, price competition, and the availability and cost of capital. The Fund is also subject to quantitative model risk, which is the risk that securities selected using quantitative models may perform differently from the market as a whole for many reasons, including the factors used in building the model and the weights placed on each factor, among others. The quantitative model used by the Adviser to manage the Fund may not perform as expected, particularly in volatile markets.
MidCap Growth Fund:
The Fund is subject to market risk so that the value of the securities in which it invests may go up or down in response to the prospects of individual companies, particular industry sectors and/or general economic conditions. Investments in technology companies, which may produce or use products or services that prove commercially unsuccessful or become obsolete, may be subject to greater price volatility than securities of companies in other sectors. The Fund invests in small- andmid-capitalization securities. Generally, smaller andmid-sized companies are more vulnerable to adverse developments because of more limited product lines, markets or financial resources. As a result, the securities of smaller andmid-sized companies may involve greater risks than those associated with larger, more established companies and may be subject to more abrupt or erratic trading and price movements. The Fund is also subject to quantitative model risk, which is the risk that securities selected using quantitative models may perform differently from the market as a whole for many reasons, including the factors used in building the model and the weights placed on each factor, among others. The quantitative model used by the Adviser to manage the Fund may not perform as expected, particularly in volatile markets.
Bond Fund:
Investments in fixed income securities are subject to the risks associated with debt securities including credit and interest rate risk. The guarantee on U.S. government securities applies only to the underlying securities of the Fund if held to maturity and not to the value of the Fund’s shares. Mortgage-backed securities, especially collateralized mortgage-backed securities, may be subject to risks that include price volatility, liquidity and enhanced sensitivity to interest rates. Asset-backed securities may be less liquid than other securities and therefore more difficult to value and liquidate, if necessary.
98
COMMERCE FUNDS
Short-Term Government Fund:
Investments in fixed income securities are subject to the risks associated with debt securities including credit and interest rate risk. The guarantee on U.S. government securities applies only to the underlying securities of the Fund if held to maturity and not to the value of the Fund’s shares. Mortgage-backed securities, especially collateralized mortgage-backed securities, may be subject to risks that include price volatility, liquidity and enhanced sensitivity to interest rates.
NationalTax-Free Intermediate Bond Fund:
Investments in fixed income securities are subject to the risks associated with debt securities including credit and interest rate risk. Investments in municipal securities can be significantly affected by political changes as well as uncertainties in the municipal market related to taxation or legislative changes. The Fund’s investments may subject shareholders to the federal alternative minimum tax and state income taxes.
MissouriTax-Free Intermediate Bond Fund:
Investments in fixed income securities are subject to the risks associated with debt securities including credit and interest rate risk. The Fund invests its assets predominately in Missouri bonds. The actual payment of principal and interest on these bonds is dependent on the Missouri General Assembly allotting money each fiscal year for these payments. The Fund isnon-diversified. Due to the small number of bonds generally held in the portfolio, the Fund may be subject to greater risks than a more diversified fund. A change in the value of any single holding may affect the overall value more than it would affect a diversified fund that holds more investments. Investments in municipal securities can be significantly affected by political changes as well as uncertainties in the municipal market related to taxation or legislative changes. In addition, the Fund’s investments may subject shareholders to federal alternative minimum tax. The investment income from this Fund may be subject to state income taxes.
KansasTax-Free Intermediate Bond Fund:
Investments in fixed income securities are subject to the risks associated with debt securities including credit and interest rate risk. The Fund invests its assets predominately in Kansas bonds. The actual payment of principal and interest on these bonds is dependent on the Kansas legislature allotting money each fiscal year for these payments. The Fund isnon-diversified. Due to the small number of bonds generally held in the portfolio, the Fund may be subject to greater risks than a more diversified fund. A change in the value of any single holding may affect the overall value more than it would affect a diversified fund that holds more investments. Investments in municipal securities can be significantly affected by political changes as well as uncertainties in the municipal market related to taxation or legislative changes. In addition, the Fund’s investments may subject shareholders to federal alternative minimum tax. The investment income from this Fund may be subject to state income taxes.
99
COMMERCE FUNDS
The Commerce Funds(continued)
Commerce Funds Tax Information (Unaudited)
For the year ended October 31, 2019, 54.78%, 96.33%, and 38.94% of the dividends paid from net investment company taxable income by the Growth, Value, and Mid Cap Growth Funds, respectively, qualify for the dividends received deduction available to corporations.
For the year ended October 31, 2019, 55.14%, 100%, and 37.80% of the dividends paid from net investment company taxable income by the Growth, Value, and Mid Cap Growth Funds, respectively, qualify for the reduced tax rate under the Jobs and Growth Tax Relief and Reconciliation Act of 2003.
Pursuant to Section 852 of the Internal Revenue Code, the Growth, Value, Mid Cap Growth, and NationalTax-Free Intermediate Bond Funds designate $8,075,312, $19,803,954, $10,616,279, and $465,255, respectively, or, if different, the maximum amount allowable, as capital gain dividends paid during the year ended October 31, 2019.
During the year ended October 31, 2019, 95.14%, 95.92%, and 97.77%, of the distributions from net investment income paid by the NationalTax-Free Intermediate Bond, MissouriTax-Free Intermediate Bond, and KansasTax-Free Intermediate Bond Funds, respectively, were exempt-interest dividends and as such, are not subject to U.S. Federal income tax.
During the year ended October 31, 2019, the Growth and Mid Cap Growth Funds designate $2,074,010 and $3,836,772, respectively, as short-term capital gain dividends pursuant to Section 871(k) of the Internal Revenue Code.
During the year ended October 31, 2019, 100% of the distributions paid from net investment company taxable income by the Bond and Short-Term Government Funds, respectively, are designated as interest-related dividends pursuant to section 871(k) of the Internal Revenue Code.
100

ADVISER ANDCO-ADMINISTRATOR Commerce Investment Advisors, Inc. 922 Walnut Street, 4th Floor Kansas City, Missouri 64106CO-ADMINISTRATOR Goldman Sachs Asset Management, L.P. 200 West Street New York, New York 10282 CUSTODIAN/ACCOUNTING AGENT State Street Bank & Trust Company 1 Lincoln Street Boston, Massachusetts 02111 TRANSFER AGENT SS&C Technologies Inc. 2000 Crown Colony Drive Quincy, Massachusetts 02167 DISTRIBUTOR Goldman Sachs & Co. LLC 200 West Street New York, New York 10282 INDEPENDENT REGISTERED PUBLIC ACCOUNTING FIRM KPMG LLP Two Financial Center 60 South Street Boston, Massachusetts 02111 LEGAL COUNSEL Drinker Biddle & Reath LLP One Logan Square Suite 2000 Philadelphia, Pennsylvania 19103-6996 IMPORTANT INFORMATION This Annual Report contains facts concerning The Commerce Funds’ objectives and policies, management, expenses, and other information. For more complete information about The Commerce Funds, a prospectus may be obtained by calling1-800-995-6365. An investor should read the prospectus carefully before investing or sending money. The Commerce Funds are advised by Commerce Investment Advisors, Inc., a subsidiary of Commerce Bank, which receives a fee for its services. The Commerce Funds are distributed by Goldman Sachs & Co. LLC. The Commerce Funds file their complete schedule of portfolio holdings with the SEC for each month in a fiscal quarter within 60 days after the end of the relevant fiscal quarter on Form N-PORT. The Funds’ schedule of portfolio holdings for the third month of each fiscal quarter is available on the SEC’s website at http://www.sec.gov. A description of the policies and procedures that The Commerce Funds use to determine how to vote proxies relating to portfolio securities and information regarding how the Funds voted proxies relating to portfolio securities during the most recent 12-month period ended June 30 is available (i) without change, upon request by calling 1-800-995-6365 and (ii) on the SEC’s website at http://www.sec.gov. This material is not authorized for distribution to prospective investors unless preceded or accompanied by a current Prospectus. Investors should consider a Fund’s objective, risks, and charges and expenses, and read the Prospectus carefully before investing or sending money. The Prospectus contains this and other information about a Fund and may be obtained from your authorized dealer or from Commerce Funds by calling 1-800-995-6365. NOT FDIC INSURED MAY LOSE VALUE NO BANK GUARANTEE

TRUSTEES V. Raymond Stranghoener Chairman David L. Bodde Lead Independent Trustee Scott D. Monette Charles W. Peffer Erika Z. Schenk James M. Snowden, Jr. OFFICERS William Schuetter President Laura Spidle Vice President, Chief Compliance Officer; Anti-Money Laundering Officer and Secretary Jeffrey Bolin Vice President Peter W. Fortner Chief Accounting Officer Treasurer Philip V. Giuca Jr. Assistant Treasurer Joseph McClain Assistant Secretary COMMERCE FUNDS 922 Walnut Street, 4th Floor Kansas City, MO 64106 www.commercefunds.com1-800-995-6365 commerce funds 187095-OTU-1104162
(a) As of the end of the period covered by this report, the Registrant has adopted a code of ethics, the Code of Conduct for Senior Officers, that applies to the Registrant’s principal executive officer, principal financial officer, principal accounting officer or controller or persons performing similar functions, regardless of whether these individuals are employed by the Registrant or a third party. A copy of the Code of Conduct for Senior Officers is filed herein under Item 13(a)(1).
(c) During the period covered by this report, no amendments were made to the provisions of the Code of Conduct for Senior Officers.
(d) During the period covered by this report, the Registrant did not grant any waivers, including an implicit waiver, from any provision of the Code of Conduct for Senior Officers.
| ITEM 3. | | AUDIT COMMITTEE FINANCIAL EXPERT. |
The Registrant’s Board of Trustees has determined that the Registrant has at least one “audit committee financial expert” (as defined in Item 3 of Form N-CSR) serving on its Audit Committee. Scott D. Monette is the “audit committee financial expert” and is “independent” (as each of these terms is defined in Item 3 of Form N-CSR).
Under applicable securities laws and regulations, a person who is determined to be an audit committee financial expert will not be deemed an “expert” for any purpose, including without limitation for purposes of Section 11 of the Securities Act of 1933, as amended, as a result of being designated or identified as an audit committee financial expert. The designation or identification of a person as an audit committee financial expert does not impose on such person any duties, obligations, or liability that are greater than the duties, obligations, and liability imposed on such person as a member of the Registrant’s Audit Committee and Board of Trustees in the absence of such designation or identification. The designation or identification of a person as an audit committee financial expert does not affect the duties, obligations or liability of any other member of the Registrant’s Audit Committee or Board of Trustees.
| ITEM 4. | | PRINCIPAL ACCOUNTANT FEES AND SERVICES. |
(a) Audit Fees. The aggregate fees billed for each of the last two fiscal years for professional services rendered by the Registrant’s principal accountant for the audit of the Registrant’s annual financial statements or services that are normally provided by the accountant in connection with statutory and regulatory filings or engagements were $157,550 and $152,600 for fiscal years ended October 31, 2019 and 2018, respectively.
(b) Audit-Related Fees. There were no fees billed in either of the last two fiscal years for assurance and related services by the Registrant’s principal accountant reasonably related to the performance of the audit of the Registrant’s financial statements that were not reported under paragraph (a) of this item.
(c) Tax Fees. The aggregate fees billed in each of the last two fiscal years for professional services rendered by the principal accountant for tax compliance, tax advice and tax planning were $47,240 and $45,880 for the fiscal years ended October 31, 2019 and 2018, respectively. Tax fees for the fiscal years ended October 31, 2019 and 2018 consist of tax compliance services rendered to the Registrant. These services include the preparation of federal and state corporate tax returns and excise tax returns, as well as services relating to excise tax distribution requirements.
(d) All Other Fees. There were no fees billed in either of the last two fiscal years for products and services provided by the Registrant’s principal accountant, other than the services reported in paragraphs (a) through (c) of this Item.
(e)(l) Pursuant to a Board resolution adopted on February 10, 2004, to the extent required by applicable regulations, all audit and non-audit services provided by the independent accountants shall be pre-approved either: (a) by the Registrant’s Audit Committee as a whole; or (b) between meetings of the Audit Committee by the Chairman of the Audit Committee and the Registrant’s designated Audit Committee Financial Expert, provided that, in each case, such pre-approvals must be reported to the full Audit Committee at its next meeting.
(e)(2) There were no services described in each of paragraphs (b) through (d) of this item that were approved by the Audit Committee pursuant to paragraph (c)(7)(i)(C) of Rule 2-01 of Regulation S-X.
(f) Not applicable. The percentage of hours expended on the principal accountant’s engagement to audit the Registrant’s financial statements for the most recent fiscal year that were attributed to work performed by persons other than the principal accountant’s full-time, permanent employees was zero percent (0%).
(g) The aggregate non-audit fees billed by the Registrant’s accountant for services rendered to the Registrant, and rendered to the Registrant’s investment adviser and any entity controlling, controlled by or under common control with the adviser that provides ongoing services to the Registrant for each of the last two fiscal years of the Registrant were $313,143 and $349,470 for the fiscal years ended October 31, 2019 and 2018, respectively.
(h) The Registrant’s Audit Committee has considered whether the provision of non-audit services that were rendered to the Registrant’s investment adviser and any entity controlling, controlled by, or under common control with the investment adviser that provides ongoing services to the Registrant that were not pre-approved pursuant to paragraph (c)(7)(ii) of Rule 2-01 of Regulation S-X is compatible with maintaining the principal accountant’s independence.
| ITEM 5. | | AUDIT COMMITTEE OF LISTED REGISTRANTS. |
Not applicable.
| ITEM 6. | | SCHEDULE OF INVESTMENTS. |
(a) The Schedule of Investments is included as part of the Report to Shareholders filed under Item 1.
(b) Not applicable.
| ITEM 7. | | DISCLOSURE OF PROXY VOTING POLICIES AND PROCEDURES FOR CLOSED-END MANAGEMENT |
Not applicable.
| ITEM 8. | | PORTFOLIO MANAGERS OF CLOSED-END MANAGEMENT INVESTMENT COMPANIES. |
Not applicable.
| ITEM 9. | | PURCHASES OF EQUITY SECURITIES BY CLOSED-END MANAGEMENT INVESTMENT COMPANY AND |
Not applicable.
| ITEM 10. | | SUBMISSION OF MATTERS TO A VOTE OF SECURITY HOLDERS. |
There has been no material change to the procedures by which shareholders may recommend nominees to the Registrant’s Board of Trustees.
| ITEM 11. | | CONTROLS AND PROCEDURES. |
| | (a) | | The Registrant’s principal executive and principal financial officers or persons performing similar functions have concluded that the Registrant’s disclosure controls and procedures (as defined in Rule 30a-3(c) under the Investment Company Act of 1940, as amended (the “1940 Act”)) are effective as of a date within 90 days of the filing of this report, based on the evaluation of these controls and procedures required by Rule 30a-3(b) under the 1940 Act and Rule 15d-15(b) under the Securities Exchange Act of 1934, as amended. |
| | (b) | | There was no change in the Registrant’s internal control over financial reporting (as defined in Rule 30a-3(d) under the 1940 Act) that occurred during the period covered by this report that has materially affected, or is reasonably likely to materially affect, the Registrant’s internal control over financial reporting. |
| ITEM 12. | | DISCLOSURE OF SECURITIES LENDING ACTIVITIES FOR CLOSED-END MANAGEMENT INVESTMENT COMPANIES. |
Not applicable.
| | | | |
| |
| (a)(1) | | The Commerce Funds’ Code of Conduct for Senior Officers is attached hereto. |
| | |
| (a)(2) | | Exhibit 99.CERT | | Certifications pursuant to Section 302 of the Sarbanes-Oxley Act of 2002 are filed herewith. |
| |
| (a)(3) | | Not applicable. |
| |
| (a)(4) | | Not applicable. |
| | |
| (b) | | Exhibit 99.906CERT | | Certifications pursuant to Section 906 of the Sarbanes-Oxley Act of 2002 are filed herewith. |
SIGNATURES
Pursuant to the requirements of the Securities Exchange Act of 1934 and the Investment Company Act of 1940, the Registrant has duly caused this report to be signed on its behalf by the undersigned, thereunto duly authorized.
|
| THE COMMERCE FUNDS |
|
| /s/ Bill Schuetter |
| Bill Schuetter |
| President |
January 7, 2020 |
Pursuant to the requirements of the Securities Exchange Act of 1934 and the Investment Company Act of 1940, this report has been signed below by the following persons on behalf of the Registrant and in the capacities and on the dates indicated.
|
|
| /s/ Bill Schuetter |
| Bill Schuetter |
| President |
| The Commerce Funds |
January 7, 2020 |
|
|
| /s/ Peter Fortner |
| Peter Fortner |
| Chief Accounting Officer |
| The Commerce Funds |
January 7, 2020 |