UNITED STATES
SECURITIES AND EXCHANGE COMMISSION
WASHINGTON, D. C. 20549
FORM N-CSR
Investment Company Act file number: 811-08606
DWS Target Date Series
(Exact Name of Registrant as Specified in Charter)
345 Park Avenue
New York, NY 10154-0004
(Address of Principal Executive Offices) (Zip Code)
Registrant’s Telephone Number, including Area Code: (212) 250-3220
Paul Schubert
60 Wall Street
New York, NY 10005
(Name and Address of Agent for Service)
| Date of fiscal year end: | 8/31 |
| Date of reporting period: | 8/31/2012 |
| ITEM 1. | REPORT TO STOCKHOLDERS |
AUGUST 31, 2012 Annual Report to Shareholders |
DWS Target Date Series DWS LifeCompass Retirement Fund DWS LifeCompass 2015 Fund DWS LifeCompass 2020 Fund DWS LifeCompass 2030 Fund DWS LifeCompass 2040 Fund |
 |
Contents
4 Portfolio Management Review 11 Performance Summaries 26 Investment Portfolios 41 Statements of Assets and Liabilities 45 Statements of Operations 47 Statements of Changes in Net Assets 52 Financial Highlights 71 Notes to Financial Statements 95 Report of Independent Registered Public Accounting Firm 96 Information About Each Fund's Expenses 100 Tax Information 101 Summary of Management Fee Evaluation by Independent Fee Consultant 105 Board Members and Officers 110 Account Management Resources |
This report must be preceded or accompanied by a prospectus. To obtain a summary prospectus, if available, or prospectus for any of our funds, refer to the Account Management Resources information provided in the back of this booklet. We advise you to consider each fund's objectives, risks, charges and expenses carefully before investing. The summary prospectus and prospectus contain this and other important information about the fund. Please read the prospectus carefully before you invest.
Although allocation among different asset categories generally limits risk, portfolio management may favor an asset category that underperforms other assets or markets as a whole. Bond investments are subject to interest-rate and credit risks. When interest rates rise, bond prices generally fall. Credit risk refers to the ability of an issuer to make timely payments of principal and interest. Investing in derivatives entails special risks relating to liquidity, leverage and credit that may reduce returns and/or increase volatility. Because ETFs trade on a securities exchange, their shares may trade at a premium or discount to their net asset value. ETFs also incur fees and expenses so they may not fully match the performance of the indexes they are designed to track. Investing in foreign securities, particularly those of emerging markets, presents certain risks, such as currency fluctuations, political and economic changes, and market risks. The fund may lend securities to approved institutions. Stocks may decline in value. See the prospectus for details.
Target date funds are designed for investors seeking to meet their respective investment goals, such as retirement, around the target date year. The target date is the approximate date when investors plan to start withdrawing their money in the fund. As the fund approaches its target year, the fund will decrease its emphasis on growth of capital and increase its emphasis on current income. The principal value of the funds is not guaranteed at any time, including at the target date. There is no guarantee that the fund will provide adequate income at and through retirement.
DWS Investments is part of Deutsche Bank's Asset Management division and, within the U.S., represents the retail asset management activities of Deutsche Bank AG, Deutsche Bank Trust Company Americas, Deutsche Investment Management Americas Inc. and DWS Trust Company.
NOT FDIC/NCUA INSURED NO BANK GUARANTEE MAY LOSE VALUE NOT A DEPOSIT NOT INSURED BY ANY FEDERAL GOVERNMENT AGENCY
All performance information below is historical and does not guarantee future results. Returns shown are for Class A shares, unadjusted for sales charges. Investment return and principal fluctuate, so your shares may be worth more or less when redeemed. Current performance may differ from performance data shown. Please visit www.dws-investments.com for the most recent month-end performance of all share classes. Fund performance includes reinvestment of all distributions. Unadjusted returns do not reflect sales charges and would have been lower if they had. Please refer to pages 11 through 25 for more complete performance information.
During the one-year period ended August 31, 2012, the five funds in the LifeCompass Series finished in line with, or modestly behind, their Morningstar peer group averages, but lagged their benchmark indices:
DWS LifeCompass Retirement Fund S&P Target Date Retirement Index Morningstar Retirement Income Funds avg. | 6.79% 6.95% 7.00% |
DWS LifeCompass 2015 Fund S&P Target Date 2015 Index Morningstar Target Date 2011-2015 Funds avg. | 7.54% 8.11% 7.42% |
DWS LifeCompass 2020 Fund S&P Target 2020 Index Morningstar Target Date 2016-2020 Funds avg. | 8.01% 8.60% 8.05% |
DWS LifeCompass 2030 Fund S&P Target 2030 Index Morningstar Target Date 2026-2030 Funds avg. | 8.26% 9.28% 8.51% |
DWS LifeCompass 2040 Fund S&P Target 2040 Index Morningstar Target Date 2036-2040 Funds avg. | 8.04% 9.67% 8.71% |
The U.S. equity market experienced elevated volatility and periodic uncertainty during the past 12 months, due in part to concerns about the European crisis, slowing growth in China and unsteady economic conditions here in the United States. Despite these headwinds, the Russell 1000® Index returned 17.33% and finished the year just short of the 52-week high it established in early April. Small caps also performed well, as measured by the 13.40% return of the Russell 2000® Index. The U.S. market was supported by low interest rates, robust profit margins and solid corporate earnings, as well as its status as a relative "safe haven" amid heightened investor concerns regarding the problems overseas.
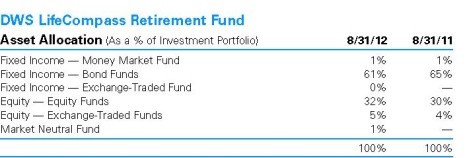
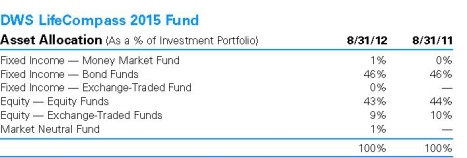
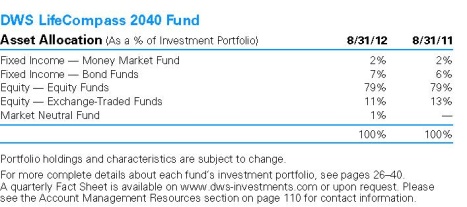
| The funds pursue their investment objectives by investing in other DWS mutual funds. The funds may also invest in securities of Exchange-Traded Funds (ETFs) when the economic exposure to a particular market or sector is not available through a DWS fund. Each fund has a target asset allocation which portfolio management uses as a reference point in setting the fund's actual asset allocations. In making its asset allocation decisions, portfolio management uses a proprietary mix of quantitative and qualitative inputs, such as return forecasts for asset classes and investment guidelines. Based on the desired exposure to particular investments and risk analysis, portfolio management then decides which funds to use as underlying funds and in which proportions. |
While the uncertainty benefited the U.S. market to some extent, it also led to underperformance for developed-market international equities. The developed markets returned -0.04%, as measured by the MSCI EAFE Index, while emerging-markets stocks returned -5.80%, as gauged by the MSCI Emerging Markets Index.


The domestic bond market performed very well during the 12-month period ended August 31, 2012, as sluggish growth and moderate inflation enabled the U.S. Federal Reserve Board (the Fed) to maintain its policy of near-zero interest rates. In addition, the debt crisis in Europe fueled a "flight to quality" into government bonds by investors who were looking to reduce their exposure to a potential worst-case scenario in one or more of the region's peripheral economies. In combination, these factors fueled a powerful rally in U.S. Treasuries that caused the 10-year note to fall from 2.23% to 1.57%. (Bond prices and yields move in opposite directions.) The decline in prevailing rates, together with investors' ongoing search for yield, helped fuel robust returns for other areas of the bond market. For the year, the Barclays Aggregate U.S. Bond Index delivered a gain of 5.78%.
Fund Performance
We take a two-pronged approach to managing the funds. First, we manage the portfolios with each fund's specific target date in mind. Once a year, we shift each fund's strategic asset allocation to maintain a "glide path" throughout the life of each fund as the targeted retirement date draws closer. In addition, we supplement our broad, long-term strategic allocation with monthly tactical shifts designed to take advantage of the various opportunities available in the global financial markets or, when necessary, to reduce risk.
The longer-term component of our approach — the strategic asset allocation — contributed positively to our results in the past year. The LifeCompass Funds have a higher allocation to equities in the longer-dated funds than the average fund in their respective peer groups, which we believe provides greater capital appreciation potential for young participants. On the other end of the spectrum, market declines are most damaging if they happen right before or right after retirement when account balances are the largest. Capital preservation is the most critical at that stage, and our glide path therefore has the lowest allocation to equities closer to the target dates. This explains both the higher allocation to equities in the longer-dated funds and — given the strong performance of the stock market in the past year — their slightly higher returns relative to the funds with closer target dates. The LifeCompass funds also have a higher allocation to alternative assets than the typical fund in the category, a positive for our 12-month results.
Our tactical shifts added modestly to performance. For the majority of the reporting period, the funds held an overweight position in domestic equities, which added value given the strong performance of the U.S. market. In addition, the European debt crisis continued to be a headwind for international equities even though some foreign markets have fallen to attractive valuation levels. Within the funds' international equity allocation, we moved to an underweight in "core" European countries such as France and Germany during the spring in order to take advantage of the low valuations in Italy and, to a lesser extent, Spain. Canada remains our largest country underweight on the equity side, as we are concerned about the outlook for the nation's economic growth. Overall, we continue to believe that equities are inexpensive relative to bonds, and we maintain an overweight in the asset class — albeit to a lesser extent than at the beginning of the reporting period (which is consistent with our move down the "glide path"). On the bond side, our tactical shifts between the U.S. and foreign markets added value during the year.
Unfortunately, the benefits of our strategic and tactical allocations were offset by the underperformance of the underlying funds, which was the primary cause of the shortfall in the majority of the LifeCompass funds.
Outlook and Positioning
The funds have historically tended to perform better in favorable market environments, and there are two reasons why this is the case. First, a steeper glide path (i.e., a higher weighting in equities further away from the target dates) aids performance when stocks rally. Second, our more diversified allocation means that the fund can benefit from its weighting in higher-risk asset categories — such as emerging-market equities and bonds, international bonds, international small-cap equities and commodities — amid favorable market conditions. This helps explain the fund's outperformance in rising markets, and underperformance in falling markets, during the past year.
| "The LifeCompass Funds have a higher allocation to equities in the longer-dated funds than the average fund in their respective peer group. We believe this strategy provides greater capital appreciation potential for young participants." |
We are maintaining a rigorous approach to strategic and tactical asset allocation, combined with diligent risk management. As the market environment continues to evolve, we will review these strategic allocations annually and alter the asset mix as we deem appropriate. Our most recent reallocation occurred in June, when we further diversified the funds by adding additional asset categories such as global high-yield bonds, preferred stocks, convertible bonds and local-currency emerging-markets bonds. These new categories have higher current yields than investment-grade bonds and lower historical risk than equities. Thus, instead of moving our shareholders into bonds or cash — which currently have negative yields once inflation is taken into account — we are using the proceeds from our reduced overweight in stocks to invest in high-yielding, but less volatile, assets.
Subadvisor
QS Investors, LLC ("QS Investors"), New York, New York, is the subadvisor for the fund. QS Investors manages and advises assets on behalf of institutional clients and retail funds, providing global expertise in research, portfolio management and quantitative analysis.
Portfolio Management Team
Robert Wang, Head of Portfolio Management and Trading, QS Investors
• Joined QS Investors in 2010 after 28 years of experience of trading fixed income, foreign exchange and derivative products at Deutsche Asset Management and J.P. Morgan.
• BS, The Wharton School, University of Pennsylvania.
Inna Okounkova, Head of Strategic Asset Allocation Portfolio Management, QS Investors
On leave through December 31, 2012.
• Joined QS Investors in 2010 after 11 years with Deutsche Asset Management as a quantitative analyst, portfolio manager and Head of Strategic Asset Allocation Portfolio Management.
• MS, Moscow State University; MBA, University of Chicago — Graduate School of Business.
The views expressed reflect those of the portfolio management team only through the end of the period of the report as stated on the cover. The management team's views are subject to change at any time based on market and other conditions and should not be construed as a recommendation. Past performance is no guarantee of future results. Current and future portfolio holdings are subject to risk.
Terms to Know
The S&P Target Date Retirement Income Index seeks to represent investment opportunity generally available in target date funds through an asset allocation which targets an immediate retirement allocation.
The S&P Target Date 2015 Index seeks to represent investment opportunity generally available in target date funds through an asset allocation which targets retirement horizon on or around 2015.
The S&P Target Date 2020 Index seeks to represent investment opportunity generally available in target date funds through an asset allocation which targets retirement horizon on or around 2020.
The S&P Target Date 2030 Index seeks to represent investment opportunity generally available in target date funds through an asset allocation which targets retirement horizon on or around 2030.
The S&P Target Date 2040 Index seeks to represent investment opportunity generally available in target date funds through an asset allocation which targets retirement horizon on or around 2040.
Index returns do not reflect any fees or expenses and it is not possible to invest directly into an index.
An exchange-traded fund (ETF) is a security that tracks an index, or asset like an index fund, but trades like a stock on an exchange.
The Russell 1000 Index is an unmanaged index that measures the performance of the 1,000 largest companies in the Russell 3000® Index.
The Russell 2000 Index is an unmanaged index that measures the performance of the 2,000 smallest companies in the Russell 3000 Index.
The Morgan Stanley Capital International (MSCI) EAFE Index tracks the performance of stocks in select developed markets outside of the United States. The index is calculated using closing local market prices and translates into U.S. dollars using the London close foreign exchange rates.
The Morgan Stanley Capital International (MSCI) Emerging Markets Index tracks the performance of stocks in select emerging markets. The index is calculated using closing local market prices and translates into U.S. dollars using the London close foreign exchange rates.
The Barclays U.S. Aggregate Bond Index is an unmanaged, market-value-weighted measure of Treasury issues, corporate bond issues and mortgage securities.
Index returns do not reflect fees or expenses and it is not possible to invest directly in an index.
Diversification neither assures a profit nor guarantees against a loss.
The Morningstar Retirement Income Funds category includes funds that invest in a mix of stocks, bonds and cash tailored to investors already in or entering retirement. These funds tend to be managed using a more conservative asset-allocation strategy and aim to provide investors with steady income throughout retirement.
The Morningstar Target Date Funds categories include funds that provide diversified exposure to stocks, bonds and cash for those investors who have a specific date in mind (such as the years 2011-2015, 2016-2020, and 2036-2040) for retirement. These portfolios aim to provide investors with an optimal level of return and risk, based solely on the target date. Management adjusts the allocation among asset classes to more-conservative mixes as the target date approaches, following a preset glide path.
Glide path refers to the asset allocation mix of securities in a target date fund, which is determined by the target date for the investment. The allocation tends to become more conservative with more fixed-income securities and fewer equities the closer it is to the target date of the investment.
DWS LifeCompass Retirement Fund
Average Annual Total Returns as of 8/31/12 | ||||
| Unadjusted for Sales Charge | 1-Year | 3-Year | 5-Year | 10-Year |
| Class A | 6.79% | 7.09% | 1.41% | 4.37% |
| Class B | 5.99% | 6.29% | 0.65% | 3.58% |
| Class C | 6.00% | 6.29% | 0.65% | 3.59% |
S&P® Target Date Retirement Income Index† | 6.95% | 7.58% | 3.43% | 5.36% |
Russell 1000® Index†† | 17.33% | 13.82% | 1.47% | 6.86% |
Russell 2000® Index††† | 13.40% | 13.89% | 1.90% | 9.00% |
Barclays Intermediate U.S. Aggregate Bond Index†††† | 4.05% | 5.56% | 6.07% | 5.06% |
| Adjusted for the Maximum Sales Charge | ||||
Class A (max 5.75% load) | 0.65% | 5.00% | 0.22% | 3.75% |
Class B (max 4.00% CDSC) | 2.99% | 5.69% | 0.47% | 3.58% |
Class C (max 1.00% CDSC) | 6.00% | 6.29% | 0.65% | 3.59% |
S&P Target Date Retirement Income Index† | 6.95% | 7.58% | 3.43% | 5.36% |
Russell 1000 Index†† | 17.33% | 13.82% | 1.47% | 6.86% |
Russell 2000 Index††† | 13.40% | 13.89% | 1.90% | 9.00% |
Barclays Intermediate U.S. Aggregate Bond Index†††† | 4.05% | 5.56% | 6.07% | 5.06% |
| No Sales Charges | ||||
| Class S | 6.97% | 7.33% | 1.66% | 4.62% |
S&P Target Date Retirement Income Index† | 6.95% | 7.58% | 3.43% | 5.36% |
Russell 1000 Index†† | 17.33% | 13.82% | 1.47% | 6.86% |
Russell 2000 Index††† | 13.40% | 13.89% | 1.90% | 9.00% |
Barclays Intermediate U.S. Aggregate Bond Index†††† | 4.05% | 5.56% | 6.07% | 5.06% |
Performance in the Average Annual Total Returns table above and the Growth of an Assumed $10,000 Investment line graph that follows is historical and does not guarantee future results. Investment return and principal fluctuate so your shares may be worth more or less when redeemed. Current performance may differ from performance data shown. Please visit www.dws-investments.com for the Fund's most recent month-end performance. Fund performance includes reinvestment of all distributions. Unadjusted returns do not reflect sales charges and would have been lower if they had.
The gross expense ratios of the Fund, as stated in the fee table of the prospectus dated December 1, 2011 are 1.29%, 2.01%, 1.98% and 0.97% for Class A, Class B, Class C and Class S shares, respectively, and may differ from the expense ratios disclosed in the Financial Highlights tables in this report. These expense ratios include net expenses of the underlying funds in which the Fund invests.
DWS LifeCompass Retirement Fund
Index returns do not reflect any fees or expenses and it is not possible to invest directly into an index.
Performance figures do not reflect the deduction of taxes that a shareholder would pay on fund distributions or the redemption of fund shares.
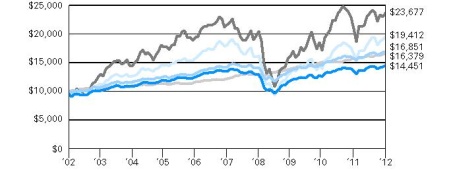
Growth of an Assumed $10,000 Investment (Adjusted for Maximum Sales Charge) |
 |
 |
| Yearly periods ended August 31 |
The Fund's growth of an assumed $10,000 investment is adjusted for the maximum sales charge of 5.75%. This results in a net initial investment of $9,425.
The growth of $10,000 is cumulative.
Performance of other share classes will vary based on the sales charges and the fee structure of those classes.
† The S&P Target Date Retirement Income Index seeks to represent investment opportunity generally available in target date funds through an asset allocation which targets an immediate retirement allocation.
On December 1, 2011 the S&P Target Date Retirement Income Index replaced the Russell 1000 Index, Russell 2000 Index and the Barclays Intermediate U.S. Aggregate Bond Index because portfolio management believes that it more accurately reflects the fund's asset allocation.
†† The Russell 1000 Index is an unmanaged index that measures the performance of the 1,000 largest companies in the Russell 3000 Index, which represents approximately 92% of the total market capitalization of the Russell 3000 Index.
††† The Russell 2000 Index is an unmanaged index that measures the performance of the 2,000 smallest companies in the Russell 3000 Index, which represents approximately 8% of the total market capitalization of the Russell 3000 Index.
†††† The Barclays Intermediate U.S. Aggregate Bond Index is an unmanaged index that covers the U.S. investment-grade fixed-rate bond market, including government and credit securities, agency mortgage securities, asset-backed securities and commercial mortgage-backed securities.
DWS LifeCompass Retirement Fund
| Net Asset Value and Distribution Information | ||||||||||||||||
| Class A | Class B | Class C | Class S | |||||||||||||
Net Asset Value: 8/31/12 | $ | 11.58 | $ | 11.58 | $ | 11.57 | $ | 11.57 | ||||||||
| 8/31/11 | $ | 11.06 | $ | 11.06 | $ | 11.05 | $ | 11.06 | ||||||||
Distribution Information: Twelve Months as of 8/31/12: Income Dividends | $ | .22 | $ | .14 | $ | .14 | $ | .25 | ||||||||
Morningstar Rankings — Retirement Income Funds Category as of 8/31/12 | ||||
| Period | Rank | Number of Fund Classes Tracked | Percentile Ranking (%) | |
Class A 1-Year | 176 | of | 283 | 62 |
| 3-Year | 186 | of | 243 | 76 |
| 5-Year | 159 | of | 166 | 95 |
| 10-Year | 15 | of | 23 | 64 |
Class B 1-Year | 217 | of | 283 | 76 |
| 3-Year | 210 | of | 243 | 86 |
| 5-Year | 165 | of | 166 | 99 |
| 10-Year | 23 | of | 23 | 100 |
Class C 1-Year | 216 | of | 283 | 76 |
| 3-Year | 209 | of | 243 | 86 |
| 5-Year | 166 | of | 166 | 100 |
| 10-Year | 22 | of | 23 | 95 |
Class S 1-Year | 161 | of | 283 | 57 |
| 3-Year | 179 | of | 243 | 73 |
| 5-Year | 154 | of | 166 | 92 |
| 10-Year | 13 | of | 23 | 55 |
Source: Morningstar, Inc. Rankings are historical and do not guarantee future results. Rankings are based on total return unadjusted for sales charges with distributions reinvested. If sales charges had been included, rankings might have been less favorable.
Average Annual Total Returns as of 8/31/12 | ||||
| Unadjusted for Sales Charge | 1-Year | 3-Year | 5-Year | 10-Year |
| Class A | 7.54% | 7.96% | 0.40% | 4.60% |
| Class B | 6.84% | 7.16% | -0.35% | 3.82% |
| Class C | 6.84% | 7.16% | -0.34% | 3.84% |
S&P Target Date 2015 Index† | 8.11% | 8.90% | 2.72% | 6.30% |
Russell 1000 Index†† | 17.33% | 13.82% | 1.47% | 6.86% |
Russell 2000 Index††† | 13.40% | 13.89% | 1.90% | 9.00% |
Barclays U.S. Aggregate Bond Index†††† | 5.78% | 6.51% | 6.66% | 5.48% |
| Adjusted for the Maximum Sales Charge | ||||
Class A (max 5.75% load) | 1.36% | 5.85% | -0.78% | 3.98% |
Class B (max 4.00% CDSC) | 3.84% | 6.58% | -0.53% | 3.82% |
Class C (max 1.00% CDSC) | 6.84% | 7.16% | -0.34% | 3.84% |
S&P Target Date 2015 Index† | 8.11% | 8.90% | 2.72% | 6.30% |
Russell 1000 Index†† | 17.33% | 13.82% | 1.47% | 6.86% |
Russell 2000 Index††† | 13.40% | 13.89% | 1.90% | 9.00% |
Barclays U.S. Aggregate Bond Index†††† | 5.78% | 6.51% | 6.66% | 5.48% |
| No Sales Charges | ||||
| Class S | 7.92% | 8.24% | 0.67% | 4.85% |
S&P Target Date 2015 Index† | 8.11% | 8.90% | 2.72% | 6.30% |
Russell 1000 Index†† | 17.33% | 13.82% | 1.47% | 6.86% |
Russell 2000 Index††† | 13.40% | 13.89% | 1.90% | 9.00% |
Barclays U.S. Aggregate Bond Index†††† | 5.78% | 6.51% | 6.66% | 5.48% |
Performance in the Average Annual Total Returns table above and the Growth of an Assumed $10,000 Investment line graph that follows is historical and does not guarantee future results. Investment return and principal fluctuate so your shares may be worth more or less when redeemed. Current performance may differ from performance data shown. Please visit www.dws-investments.com for the Fund's most recent month-end performance. Fund performance includes reinvestment of all distributions. Unadjusted returns do not reflect sales charges and would have been lower if they had.
The gross expense ratios of the Fund, as stated in the fee table of the prospectus dated December 1, 2011 are 1.26%, 2.06%, 1.97% and 1.03% for Class A, Class B, Class C and Class S shares, respectively, and may differ from the expense ratios disclosed in the Financial Highlights tables in this report. These expense ratios include net expenses of the underlying funds in which the Fund invests.
Index returns do not reflect any fees or expenses and it is not possible to invest directly into an index.
Performance figures do not reflect the deduction of taxes that a shareholder would pay on fund distributions or the redemption of fund shares.
DWS LifeCompass 2015 Fund
Growth of an Assumed $10,000 Investment (Adjusted for Maximum Sales Charge) |
 |
 |
| Yearly periods ended August 31 |
The Fund's growth of an assumed $10,000 investment is adjusted for the maximum sales charge of 5.75%. This results in a net initial investment of $9,425.
The growth of $10,000 is cumulative.
Performance of other share classes will vary based on the sales charges and the fee structure of those classes.
† The S&P Target Date 2015 Index seeks to represent investment opportunity generally available in target date funds through an asset allocation which targets retirement horizon on or around 2015.
On December 1, 2011 the S&P Target Date 2015 Index replaced the Russell 1000 Index, Russell 2000 Index and the Barclays U.S. Aggregate Bond Index because portfolio management believes that it more accurately reflects the fund's asset allocation.
†† The Russell 1000 Index is an unmanaged index that measures the performance of the 1,000 largest companies in the Russell 3000 Index, which represents approximately 92% of the total market capitalization of the Russell 3000 Index.
††† The Russell 2000 Index is an unmanaged index that measures the performance of the 2,000 smallest companies in the Russell 3000 Index, which represents approximately 8% of the total market capitalization of the Russell 3000 Index.
†††† The Barclays U.S. Aggregate Bond Index is an unmanaged, market-value-weighted measure of Treasury issues, agency issues, corporate bond issues and mortgage securities.
DWS LifeCompass 2015 Fund
| Net Asset Value and Distribution Information | ||||||||||||||||
| Class A | Class B | Class C | Class S | |||||||||||||
Net Asset Value: 8/31/12 | $ | 11.14 | $ | 11.13 | $ | 11.13 | $ | 11.13 | ||||||||
| 8/31/11 | $ | 10.57 | $ | 10.55 | $ | 10.55 | $ | 10.55 | ||||||||
Distribution Information: Twelve Months as of 8/31/12: Income Dividends | $ | .21 | $ | .13 | $ | .13 | $ | .24 | ||||||||
Morningstar Rankings — Target Date 2011-2015 Funds Category as of 8/31/12 | ||||
| Period | Rank | Number of Fund Classes Tracked | Percentile Ranking (%) | |
Class A 1-Year | 92 | of | 162 | 56 |
| 3-Year | 98 | of | 138 | 71 |
| 5-Year | 67 | of | 88 | 76 |
| 10-Year | 2 | of | 5 | 25 |
Class B 1-Year | 110 | of | 162 | 68 |
| 3-Year | 122 | of | 138 | 88 |
| 5-Year | 79 | of | 88 | 89 |
| 10-Year | 5 | of | 5 | 100 |
Class C 1-Year | 109 | of | 162 | 67 |
| 3-Year | 120 | of | 138 | 86 |
| 5-Year | 78 | of | 88 | 88 |
| 10-Year | 4 | of | 5 | 75 |
Class S 1-Year | 82 | of | 162 | 50 |
| 3-Year | 88 | of | 138 | 63 |
| 5-Year | 64 | of | 88 | 72 |
| 10-Year | 1 | of | 5 | 1 |
Source: Morningstar, Inc. Rankings are historical and do not guarantee future results. Rankings are based on total return unadjusted for sales charges with distributions reinvested. If sales charges had been included, rankings might have been less favorable.
Average Annual Total Returns as of 8/31/12 | ||||
| Unadjusted for Sales Charge | 1-Year | 3-Year | 5-Year | 10-Year |
| Class A | 8.01% | 8.36% | 0.01% | 5.20% |
| Class B | 7.34% | 7.57% | -0.72% | 4.42% |
| Class C | 7.17% | 7.54% | -0.72% | 4.42% |
S&P Target Date 2020 Index† | 8.60% | 9.40% | 2.32% | 6.52% |
Russell 1000 Index†† | 17.33% | 13.82% | 1.47% | 6.86% |
Russell 2000 Index††† | 13.40% | 13.89% | 1.90% | 9.00% |
Barclays U.S. Aggregate Bond Index†††† | 5.78% | 6.51% | 6.66% | 5.48% |
| Adjusted for the Maximum Sales Charge | ||||
Class A (max 5.75% load) | 1.80% | 6.24% | -1.17% | 4.58% |
Class B (max 4.00% CDSC) | 4.34% | 6.99% | -0.90% | 4.42% |
Class C (max 1.00% CDSC) | 7.17% | 7.54% | -0.72% | 4.42% |
S&P Target Date 2020 Index† | 8.60% | 9.40% | 2.32% | 6.52% |
Russell 1000 Index†† | 17.33% | 13.82% | 1.47% | 6.86% |
Russell 2000 Index††† | 13.40% | 13.89% | 1.90% | 9.00% |
Barclays U.S. Aggregate Bond Index†††† | 5.78% | 6.51% | 6.66% | 5.48% |
| No Sales Charges | ||||
| Class S | 8.19% | 8.62% | 0.25% | 5.45% |
S&P Target Date 2020 Index† | 8.60% | 9.40% | 2.32% | 6.52% |
Russell 1000 Index†† | 17.33% | 13.82% | 1.47% | 6.86% |
Russell 2000 Index††† | 13.40% | 13.89% | 1.90% | 9.00% |
Barclays U.S. Aggregate Bond Index†††† | 5.78% | 6.51% | 6.66% | 5.48% |
Performance in the Average Annual Total Returns table above and the Growth of an Assumed $10,000 Investment line graph that follows is historical and does not guarantee future results. Investment return and principal fluctuate so your shares may be worth more or less when redeemed. Current performance may differ from performance data shown. Please visit www.dws-investments.com for the Fund's most recent month-end performance. Fund performance includes reinvestment of all distributions. Unadjusted returns do not reflect sales charges and would have been lower if they had.
The gross expense ratios of the Fund, as stated in the fee table of the prospectus dated December 1, 2011 are 1.32%, 2.18%, 2.04% and 1.06% for Class A, Class B, Class C and Class S shares, respectively, and may differ from the expense ratios disclosed in the Financial Highlights tables in this report. These expense ratios include net expenses of the underlying funds in which the Fund invests.
Index returns do not reflect any fees or expenses and it is not possible to invest directly into an index.
Performance figures do not reflect the deduction of taxes that a shareholder would pay on fund distributions or the redemption of fund shares.
DWS LifeCompass 2020 Fund
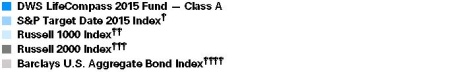
Growth of an Assumed $10,000 Investment (Adjusted for Maximum Sales Charge) |
 |
 |
| Yearly periods ended August 31 |
The Fund's growth of an assumed $10,000 investment is adjusted for the maximum sales charge of 5.75%. This results in a net initial investment of $9,425.
The growth of $10,000 is cumulative.
Performance of other share classes will vary based on the sales charges and the fee structure of those classes.
† The S&P Target Date 2020 Index seeks to represent investment opportunity generally available in target date funds through an asset allocation which targets retirement horizon on or around 2020.
On December 1, 2011 the S&P Target Date 2020 Index replaced the Russell 1000 Index, Russell 2000 Index and the Barclays U.S. Aggregate Bond Index because portfolio management believes that it more accurately reflects the fund's asset allocation.
†† The Russell 1000 Index is an unmanaged index that measures the performance of the 1,000 largest companies in the Russell 3000 Index, which represents approximately 92% of the total market capitalization of the Russell 3000 Index.
††† The Russell 2000 Index is an unmanaged index that measures the performance of the 2,000 smallest companies in the Russell 3000 Index, which represents approximately 8% of the total market capitalization of the Russell 3000 Index.
†††† The Barclays U.S. Aggregate Bond Index is an unmanaged, market-value-weighted measure of Treasury issues, agency issues, corporate bond issues and mortgage securities.
DWS LifeCompass 2020 Fund
| Net Asset Value and Distribution Information | ||||||||||||||||
| Class A | Class B | Class C | Class S | |||||||||||||
Net Asset Value: 8/31/12 | $ | 13.50 | $ | 13.39 | $ | 13.38 | $ | 13.52 | ||||||||
| 8/31/11 | $ | 12.74 | $ | 12.62 | $ | 12.63 | $ | 12.77 | ||||||||
Distribution Information: Twelve Months as of 8/31/12: Income Dividends | $ | .24 | $ | .14 | $ | .14 | $ | .27 | ||||||||
Morningstar Rankings — Target Date 2016-2020 Funds Category as of 8/31/12 | ||||
| Period | Rank | Number of Fund Classes Tracked | Percentile Ranking (%) | |
Class A 1-Year | 114 | of | 207 | 55 |
| 3-Year | 135 | of | 188 | 72 |
| 5-Year | 121 | of | 141 | 85 |
| 10-Year | 15 | of | 21 | 70 |
Class B 1-Year | 145 | of | 207 | 70 |
| 3-Year | 166 | of | 188 | 88 |
| 5-Year | 126 | of | 141 | 89 |
| 10-Year | 20 | of | 21 | 95 |
Class C 1-Year | 149 | of | 207 | 72 |
| 3-Year | 167 | of | 188 | 89 |
| 5-Year | 127 | of | 141 | 90 |
| 10-Year | 21 | of | 21 | 100 |
Class S 1-Year | 104 | of | 207 | 50 |
| 3-Year | 124 | of | 188 | 66 |
| 5-Year | 118 | of | 141 | 83 |
| 10-Year | 14 | of | 21 | 65 |
Source: Morningstar, Inc. Rankings are historical and do not guarantee future results. Rankings are based on total return unadjusted for sales charges with distributions reinvested. If sales charges had been included, rankings might have been less favorable.
Average Annual Total Returns as of 8/31/12 | ||||
| Unadjusted for Sales Charge | 1-Year | 3-Year | 5-Year | Life of Fund* |
| Class A | 8.26% | 8.69% | -0.82% | 3.40% |
| Class B | 7.48% | 7.86% | -1.55% | 2.63% |
| Class C | 7.48% | 7.90% | -1.55% | 2.63% |
S&P Target Date 2030 Index† | 9.28% | 10.00% | 1.41% | 5.08% |
Russell 1000 Index†† | 17.33% | 13.82% | 1.47% | 5.33% |
Russell 2000 Index††† | 13.40% | 13.89% | 1.90% | 5.69% |
Barclays U.S. Aggregate Bond Index†††† | 5.78% | 6.51% | 6.66% | 5.51% |
| Adjusted for the Maximum Sales Charge | ||||
Class A (max 5.75% load) | 2.03% | 6.56% | -1.99% | 2.62% |
Class B (max 4.00% CDSC) | 4.48% | 7.28% | -1.72% | 2.63% |
Class C (max 1.00% CDSC) | 7.48% | 7.90% | -1.55% | 2.63% |
S&P Target Date 2030 Index† | 9.28% | 10.00% | 1.41% | 5.08% |
Russell 1000 Index†† | 17.33% | 13.82% | 1.47% | 5.33% |
Russell 2000 Index††† | 13.40% | 13.89% | 1.90% | 5.69% |
Barclays U.S. Aggregate Bond Index†††† | 5.78% | 6.51% | 6.66% | 5.51% |
| No Sales Charges | ||||
| Class S | 8.52% | 9.00% | -0.58% | 3.66% |
S&P Target Date 2030 Index† | 9.28% | 10.00% | 1.41% | 5.08% |
Russell 1000 Index†† | 17.33% | 13.82% | 1.47% | 5.33% |
Russell 2000 Index††† | 13.40% | 13.89% | 1.90% | 5.69% |
Barclays U.S. Aggregate Bond Index†††† | 5.78% | 6.51% | 6.66% | 5.51% |
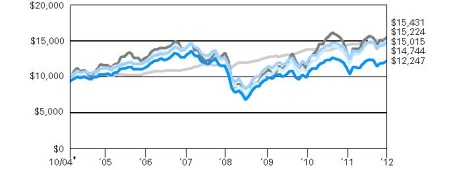
* The Fund commenced operations on November 1, 2004. The performance shown for each index is for the time period of October 31, 2004 through August 31, 2012, which is based on the performance period of the life of the Fund.
Performance in the Average Annual Total Returns table above and the Growth of an Assumed $10,000 Investment line graph that follows is historical and does not guarantee future results. Investment return and principal fluctuate so your shares may be worth more or less when redeemed. Current performance may differ from performance data shown. Please visit www.dws-investments.com for the Fund's most recent month-end performance. Fund performance includes reinvestment of all distributions. Unadjusted returns do not reflect sales charges and would have been lower if they had.
The gross expense ratios of the Fund, as stated in the fee table of the prospectus dated December 1, 2011 are 1.48%, 2.24%, 2.18% and 1.23% for Class A, Class B, Class C and Class S shares, respectively, and may differ from the expense ratios disclosed in the Financial Highlights tables in this report. These expense ratios include net expenses of the underlying funds in which the Fund invests.
DWS LifeCompass 2030 Fund
Index returns do not reflect any fees or expenses and it is not possible to invest directly into an index.
Performance figures do not reflect the deduction of taxes that a shareholder would pay on fund distributions or the redemption of fund shares.
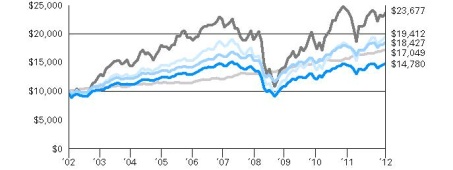
Growth of an Assumed $10,000 Investment (Adjusted for Maximum Sales Charge) |
 |
 |
| Yearly periods ended August 31 |
The Fund's growth of an assumed $10,000 investment is adjusted for the maximum sales charge of 5.75%. This results in a net initial investment of $9,425.
The growth of $10,000 is cumulative.
Performance of other share classes will vary based on the sales charges and the fee structure of those classes.
* The Fund commenced operations on November 1, 2004. The performance shown for each index is for the time period of October 31, 2004 through August 31, 2012, which is based on the performance period of the life of the Fund.
† The S&P Target Date 2030 Index seeks to represent investment opportunity generally available in target date funds through an asset allocation which targets retirement horizon on or around 2030.
On December 1, 2011 the S&P Target Date 2030 Index replaced the Russell 1000 Index, Russell 2000 Index and the Barclays U.S. Aggregate Bond Index because portfolio management believes that it more accurately reflects the fund's asset allocation.
†† The Russell 1000 Index is an unmanaged index that measures the performance of the 1,000 largest companies in the Russell 3000 Index, which represents approximately 92% of the total market capitalization of the Russell 3000 Index.
††† The Russell 2000 Index is an unmanaged index that measures the performance of the 2,000 smallest companies in the Russell 3000 Index, which represents approximately 8% of the total market capitalization of the Russell 3000 Index.
†††† The Barclays U.S. Aggregate Bond Index is an unmanaged, market-value-weighted measure of Treasury issues, agency issues, corporate bond issues and mortgage securities.
DWS LifeCompass 2030 Fund
| Net Asset Value and Distribution Information | ||||||||||||||||
| Class A | Class B | Class C | Class S | |||||||||||||
Net Asset Value: 8/31/12 | $ | 9.71 | $ | 9.67 | $ | 9.67 | $ | 9.72 | ||||||||
| 8/31/11 | $ | 9.10 | $ | 9.06 | $ | 9.06 | $ | 9.11 | ||||||||
Distribution Information: Twelve Months as of 8/31/12: Income Dividends | $ | .13 | $ | .06 | $ | .06 | $ | .15 | ||||||||
Morningstar Rankings — Target Date 2026-2030 Funds Category as of 8/31/12 | ||||
| Period | Rank | Number of Fund Classes Tracked | Percentile Ranking (%) | |
Class A 1-Year | 134 | of | 207 | 64 |
| 3-Year | 150 | of | 188 | 79 |
| 5-Year | 123 | of | 141 | 87 |
Class B 1-Year | 157 | of | 207 | 75 |
| 3-Year | 166 | of | 188 | 88 |
| 5-Year | 126 | of | 141 | 89 |
Class C 1-Year | 156 | of | 207 | 75 |
| 3-Year | 165 | of | 188 | 87 |
| 5-Year | 127 | of | 141 | 90 |
Class S 1-Year | 113 | of | 207 | 54 |
| 3-Year | 137 | of | 188 | 73 |
| 5-Year | 114 | of | 141 | 80 |
Source: Morningstar, Inc. Rankings are historical and do not guarantee future results. Rankings are based on total return unadjusted for sales charges with distributions reinvested. If sales charges had been included, rankings might have been less favorable.
Average Annual Total Returns as of 8/31/12 | |||
| Unadjusted for Sales Charge | 1-Year | 3-Year | Life of Fund* |
| Class A | 8.04% | 8.56% | -1.19% |
| Class C | 7.25% | 7.77% | -1.90% |
S&P Target Date 2040 Index† | 9.67% | 10.31% | 0.31% |
Russell 1000 Index†† | 17.33% | 13.82% | 1.31% |
Russell 2000 Index††† | 13.40% | 13.89% | 2.63% |
Barclays U.S. Aggregate Bond Index†††† | 5.78% | 6.51% | 6.25% |
| Adjusted for the Maximum Sales Charge | |||
Class A (max 5.75% load) | 1.83% | 6.44% | -2.40% |
Class C (max 1.00% CDSC) | 7.25% | 7.77% | -1.90% |
S&P Target Date 2040 Index† | 9.67% | 10.31% | 0.31% |
Russell 1000 Index†† | 17.33% | 13.82% | 1.31% |
Russell 2000 Index††† | 13.40% | 13.89% | 2.63% |
Barclays U.S. Aggregate Bond Index†††† | 5.78% | 6.51% | 6.25% |
| No Sales Charges | |||
| Class S | 8.43% | 8.86% | -0.90% |
S&P Target Date 2040 Index† | 9.67% | 10.31% | 0.31% |
Russell 1000 Index†† | 17.33% | 13.82% | 1.31% |
Russell 2000 Index††† | 13.40% | 13.89% | 2.63% |
Barclays U.S. Aggregate Bond Index†††† | 5.78% | 6.51% | 6.25% |
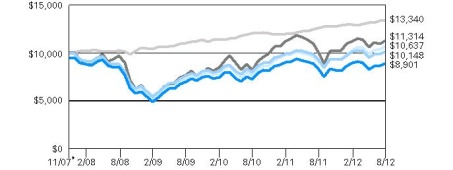
* The Fund commenced operations on November 15, 2007. The performance shown for each index is for the time period of November 30, 2007 through August 31, 2012, which is based on the performance period of the life of the Fund.
Performance in the Average Annual Total Returns table above and the Growth of an Assumed $10,000 Investment line graph that follows is historical and does not guarantee future results. Investment return and principal fluctuate so your shares may be worth more or less when redeemed. Current performance may differ from performance data shown. Please visit www.dws-investments.com for the Fund's most recent month-end performance. Fund performance includes reinvestment of all distributions. Unadjusted returns do not reflect sales charges and would have been lower if they had.
The gross expense ratios of the Fund, as stated in the fee table of the prospectus dated December 1, 2011 are 1.72%, 2.54% and 1.47% for Class A, Class C and Class S shares, respectively, and may differ from the expense ratios disclosed in the Financial Highlights tables in this report. These expense ratios include net expenses of the underlying funds in which the Fund invests.
Index returns do not reflect any fees or expenses and it is not possible to invest directly into an index.
Performance figures do not reflect the deduction of taxes that a shareholder would pay on fund distributions or the redemption of fund shares.
DWS LifeCompass 2040 Fund
Growth of an Assumed $10,000 Investment (Adjusted for Maximum Sales Charge) |
 |
 |
| Yearly periods ended August 31 |
The Fund's growth of an assumed $10,000 investment is adjusted for the maximum sales charge of 5.75%. This results in a net initial investment of $9,425.
The growth of $10,000 is cumulative.
Performance of other share classes will vary based on the sales charges and the fee structure of those classes.
* The Fund commenced operations on November 15, 2007. The performance shown for each index is for the time period of November 30, 2007 through August 31, 2012, which is based on the performance period of the life of the Fund.
† The S&P Target Date 2040 Index seeks to represent investment opportunity generally available in target date funds through an asset allocation which targets retirement horizon on or around 2040.
On December 1, 2011 the S&P Target Date 2040 Index replaced the Russell 1000 Index, Russell 2000 Index and the Barclays U.S. Aggregate Bond Index because portfolio management believes that it more accurately reflects the fund's asset allocation.
†† The Russell 1000 Index is an unmanaged index that measures the performance of the 1,000 largest companies in the Russell 3000 Index, which represents approximately 92% of the total market capitalization of the Russell 3000 Index.
††† The Russell 2000 Index is an unmanaged index that measures the performance of the 2,000 smallest companies in the Russell 3000 Index, which represents approximately 8% of the total market capitalization of the Russell 3000 Index.
†††† The Barclays U.S. Aggregate Bond Index is an unmanaged, market-value-weighted measure of Treasury issues, agency issues, corporate bond issues and mortgage securities.
| Net Asset Value and Distribution Information | ||||||||||||
| Class A | Class C | Class S | ||||||||||
Net Asset Value: 8/31/12 | $ | 8.26 | $ | 8.23 | $ | 8.29 | ||||||
| 8/31/11 | $ | 7.92 | $ | 7.89 | $ | 7.94 | ||||||
Distribution Information: Twelve Months as of 8/31/12: Income Dividends | $ | .10 | $ | .05 | $ | .12 | ||||||
| Capital Gain Distributions | $ | .17 | $ | .17 | $ | .17 | ||||||
Morningstar Rankings — Target Date 2036-2040 Funds Category as of 8/31/12 | ||||
| Period | Rank | Number of Fund Classes Tracked | Percentile Ranking (%) | |
Class A 1-Year | 141 | of | 204 | 69 |
| 3-Year | 160 | of | 185 | 86 |
Class C 1-Year | 160 | of | 204 | 78 |
| 3-Year | 168 | of | 185 | 90 |
Class S 1-Year | 125 | of | 204 | 61 |
| 3-Year | 152 | of | 185 | 82 |
Source: Morningstar, Inc. Rankings are historical and do not guarantee future results. Rankings are based on total return unadjusted for sales charges with distributions reinvested. If sales charges had been included, rankings might have been less favorable.
| Shares | Value ($) | |||||||
| Equity — Equity Funds 32.0% | ||||||||
| DWS Capital Growth Fund "Institutional" (a) | 33,295 | 2,004,694 | ||||||
| DWS Core Equity Fund "Institutional" (a) | 289,048 | 5,113,265 | ||||||
| DWS Diversified International Equity Fund "Institutional" (a) | 331,947 | 2,160,972 | ||||||
| DWS Dreman Mid Cap Value Fund "Institutional" (a) | 72,572 | 835,309 | ||||||
| DWS Dreman Small Cap Value Fund "Institutional" (a) | 44,768 | 1,603,607 | ||||||
| DWS EAFE Equity Index Fund "Institutional" (a) | 191,146 | 2,202,007 | ||||||
| DWS Emerging Markets Equity Fund "Institutional" (a) | 85,751 | 1,305,988 | ||||||
| DWS Equity 500 Index Fund "Institutional" (a) | 46,423 | 7,437,823 | ||||||
| DWS Equity Dividend Fund "Institutional" (a) | 66,540 | 2,347,534 | ||||||
| DWS Global Thematic Fund "Institutional" (a) | 37,779 | 820,942 | ||||||
| DWS International Fund "Institutional" (a) | 3,570 | 143,679 | ||||||
| DWS Small Cap Growth Fund "Institutional"* (a) | 52,251 | 1,282,759 | ||||||
| DWS Technology Fund "Institutional"* (a) | 52,705 | 861,200 | ||||||
Total Equity — Equity Funds (Cost $26,307,880) | 28,119,779 | |||||||
| Equity — Exchange-Traded Funds 4.8% | ||||||||
| iShares MSCI Canada Index Fund | 30,442 | 837,155 | ||||||
| iShares MSCI United Kingdom Index Fund | 74,260 | 1,260,192 | ||||||
| iShares S&P U.S. Preferred Stock Index Fund | 10,560 | 420,077 | ||||||
| SPDR Barclays Capital Convertible Securities Fund | 22,174 | 857,247 | ||||||
| Vanguard FTSE All World ex-U.S. Small-Cap Fund | 10,226 | 858,063 | ||||||
Total Equity — Exchange-Traded Funds (Cost $4,129,824) | 4,232,734 | |||||||
| Fixed Income — Bond Funds 60.9% | ||||||||
| DWS Core Fixed Income Fund "Institutional" (a) | 1,844,128 | 18,588,809 | ||||||
| DWS Enhanced Commodity Strategy Fund "Institutional" (a) | 252,030 | 877,065 | ||||||
| DWS Enhanced Emerging Markets Fixed Income Fund "Institutional" (a) | 80,519 | 880,881 | ||||||
| DWS Enhanced Global Bond Fund "S" (a) | 870,008 | 8,882,785 | ||||||
| DWS Global High Income Fund "Institutional" (a) | 80,909 | 565,555 | ||||||
| DWS Global Inflation Fund "Institutional" (a) | 233,467 | 2,603,157 | ||||||
| DWS High Income Fund "Institutional" (a) | 518,187 | 2,518,389 | ||||||
| DWS U.S. Bond Index Fund "Institutional" (a) | 1,661,103 | 18,521,299 | ||||||
Total Fixed Income — Bond Funds (Cost $53,677,941) | 53,437,940 | |||||||
| Fixed Income — Exchange-Traded Fund 0.5% | ||||||||
| WisdomTree Emerging Markets Local Debt Fund (Cost $401,974) | 8,266 | 424,790 | ||||||
| Market Neutral Fund 1.0% | ||||||||
| DWS Disciplined Market Neutral Fund "Institutional" (a) (Cost $873,036) | 91,354 | 876,997 | ||||||
| Fixed Income — Money Market Fund 1.0% | ||||||||
| Central Cash Management Fund, 0.14% (a) (b) (Cost $897,700) | 897,700 | 897,700 | ||||||
| % of Net Assets | Value ($) | |||||||
Total Investment Portfolio (Cost $86,288,355)† | 100.2 | 87,989,940 | ||||||
| Other Assets and Liabilities, Net | (0.2 | ) | (186,966 | ) | ||||
| Net Assets | 100.0 | 87,802,974 | ||||||
* Non-income producing security.
† The cost for federal income tax purposes was $86,754,951. At August 31, 2012, net unrealized appreciation for all securities based on tax cost was $1,234,989. This consisted of aggregate gross unrealized appreciation for all securities in which there was an excess of value over tax cost of $3,373,541 and aggregate gross unrealized depreciation for all securities in which there was an excess of tax cost over value of $2,138,552.
(a) Affiliated fund managed by Deutsche Investment Management Americas Inc.
(b) The rate shown is the annualized seven-day yield at period end.
EAFE: Europe, Australasia and Far East
FTSE: Financial Times and the London Stock Exchange
MSCI: Morgan Stanley Capital International
S&P: Standard & Poor's
SPDR: Standard & Poor's Depositary Receipt
During the period ended August 31, 2012, purchases and sales of affiliated Underlying Funds (excluding money market funds) aggregated $41,469,605 and $46,777,324, respectively. Purchases and sales of non-affiliated Underlying Funds (excluding money market funds) aggregated $4,101,155 and $3,064,855, respectively.
Fair Value Measurements
Various inputs are used in determining the value of the Fund's investments. These inputs are summarized in three broad levels. Level 1 includes quoted prices in active markets for identical securities. Level 2 includes other significant observable inputs (including quoted prices for similar securities, interest rates, prepayment speeds and credit risk). Level 3 includes significant unobservable inputs (including the Fund's own assumptions in determining the fair value of investments). The inputs or methodology used for valuing securities are not necessarily an indication of the risk associated with investing in those securities.
The following is a summary of the inputs used as of August 31, 2012 in valuing the Fund's investments. For information on the Fund's policy regarding the valuation of investments, please refer to the Security Valuation section of Note A in the accompanying Notes to Financial Statements.
| Assets | Level 1 | Level 2 | Level 3 | Total | ||||||||||||
| Equity Funds | $ | 28,119,779 | $ | — | $ | — | $ | 28,119,779 | ||||||||
| Exchange-Traded Funds (c) | 4,657,524 | — | — | 4,657,524 | ||||||||||||
| Bond Funds | 53,437,940 | — | — | 53,437,940 | ||||||||||||
| Market Neutral Fund | 876,997 | — | — | 876,997 | ||||||||||||
| Money Market Funds | 897,700 | — | — | 897,700 | ||||||||||||
| Total | $ | 87,989,940 | $ | — | $ | — | $ | 87,989,940 | ||||||||
There have been no transfers between Level 1 and Level 2 fair value measurements during the year ended August 31, 2012.
(c) See Investment Portfolio for additional detailed categorizations.
| Shares | Value ($) | |||||||
| Equity — Equity Funds 42.7% | ||||||||
| DWS Capital Growth Fund "Institutional" (a) | 107,305 | 6,460,859 | ||||||
| DWS Core Equity Fund "Institutional" (a) | 542,445 | 9,595,855 | ||||||
| DWS Diversified International Equity Fund "Institutional" (a) | 604,725 | 3,936,762 | ||||||
| DWS Dreman Mid Cap Value Fund "Institutional" (a) | 113,443 | 1,305,723 | ||||||
| DWS Dreman Small Cap Value Fund "Institutional" (a) | 68,315 | 2,447,060 | ||||||
| DWS EAFE Equity Index Fund "Institutional" (a) | 329,473 | 3,795,526 | ||||||
| DWS Emerging Markets Equity Fund "Institutional" (a) | 184,545 | 2,810,616 | ||||||
| DWS Equity 500 Index Fund "Institutional" (a) | 100,436 | 16,091,799 | ||||||
| DWS Equity Dividend Fund "Institutional" (a) | 176,522 | 6,227,683 | ||||||
| DWS Global Small Cap Growth Fund "Institutional" (a) | 4,045 | 151,391 | ||||||
| DWS Global Thematic Fund "Institutional" (a) | 46,909 | 1,019,322 | ||||||
| DWS International Fund "Institutional" (a) | 32,485 | 1,307,522 | ||||||
| DWS RREEF Real Estate Securities Fund "Institutional" (a) | 51,397 | 1,128,678 | ||||||
| DWS Small Cap Core Fund "S"* (a) | 64,754 | 1,217,381 | ||||||
| DWS Small Cap Growth Fund "Institutional"* (a) | 70,427 | 1,728,990 | ||||||
| DWS Technology Fund "Institutional"* (a) | 90,006 | 1,470,693 | ||||||
Total Equity — Equity Funds (Cost $56,548,865) | 60,695,860 | |||||||
| Equity — Exchange-Traded Funds 9.3% | ||||||||
| iShares MSCI Australia Index Fund | 65,763 | 1,543,458 | ||||||
| iShares MSCI Canada Index Fund | 55,269 | 1,519,897 | ||||||
| iShares MSCI Germany Index Fund | 46,660 | 990,125 | ||||||
| iShares MSCI Italy Index Fund | 80,896 | 948,910 | ||||||
| iShares MSCI Japan Index Fund | 153,575 | 1,391,389 | ||||||
| iShares MSCI United Kingdom Index Fund | 118,609 | 2,012,795 | ||||||
| iShares S&P U.S. Preferred Stock Index Fund | 18,083 | 719,342 | ||||||
| SPDR Barclays Capital Convertible Securities Fund | 37,462 | 1,448,281 | ||||||
| Vanguard FTSE All World ex-U.S. Small-Cap Fund | 30,966 | 2,598,357 | ||||||
Total Equity — Exchange-Traded Funds (Cost $13,498,258) | 13,172,554 | |||||||
| Fixed Income — Bond Funds 45.8% | ||||||||
| DWS Core Fixed Income Fund "Institutional" (a) | 2,293,285 | 23,116,315 | ||||||
| DWS Enhanced Commodity Strategy Fund "Institutional" (a) | 408,339 | 1,421,020 | ||||||
| DWS Enhanced Emerging Markets Fixed Income Fund "Institutional" (a) | 127,054 | 1,389,969 | ||||||
| DWS Enhanced Global Bond Fund "S" (a) | 683,033 | 6,973,769 | ||||||
| DWS Global High Income Fund "Institutional" (a) | 101,651 | 710,541 | ||||||
| DWS Global Inflation Fund "Institutional" (a) | 315,069 | 3,513,017 | ||||||
| DWS High Income Fund "Institutional" (a) | 806,265 | 3,918,446 | ||||||
| DWS U.S. Bond Index Fund "Institutional" (a) | 2,154,047 | 24,017,624 | ||||||
Total Fixed Income — Bond Funds (Cost $64,783,943) | 65,060,701 | |||||||
| Fixed Income — Exchange-Traded Fund 0.5% | ||||||||
| WisdomTree Emerging Markets Local Debt Fund (Cost $688,403) | 14,156 | 727,477 | ||||||
| Market Neutral Fund 1.4% | ||||||||
| DWS Disciplined Market Neutral Fund "Institutional" (a) (Cost $1,944,642) | 203,244 | 1,951,143 | ||||||
| Fixed Income — Money Market Fund 0.7% | ||||||||
| Central Cash Management Fund, 0.14% (a) (b) (Cost $944,404) | 944,404 | 944,404 | ||||||
| % of Net Assets | Value ($) | |||||||
Total Investment Portfolio (Cost $138,408,515)† | 100.4 | 142,552,139 | ||||||
| Other Assets and Liabilities, Net | (0.4 | ) | (587,679 | ) | ||||
| Net Assets | 100.0 | 141,964,460 | ||||||
* Non-income producing security.
† The cost for federal income tax purposes was $139,398,876. At August 31, 2012, net unrealized appreciation for all securities based on tax cost was $3,153,263. This consisted of aggregate gross unrealized appreciation for all securities in which there was an excess of value over tax cost of $6,541,199 and aggregate gross unrealized depreciation for all securities in which there was an excess of tax cost over value of $3,387,936.
(a) Affiliated fund managed by Deutsche Investment Management Americas Inc.
(b) The rate shown is the annualized seven-day yield at period end.
EAFE: Europe, Australasia and Far East
FTSE: Financial Times and the London Stock Exchange
MSCI: Morgan Stanley Capital International
S&P: Standard & Poor's
SPDR: Standard & Poor's Depositary Receipt
During the period ended August 31, 2012, purchases and sales of affiliated Underlying Funds (excluding money market funds) aggregated $51,821,120 and $66,019,836, respectively. Purchases and sales of non-affiliated Underlying Funds (excluding money market funds) aggregated $4,139,427 and $4,662,284, respectively.
Fair Value Measurements
Various inputs are used in determining the value of the Fund's investments. These inputs are summarized in three broad levels. Level 1 includes quoted prices in active markets for identical securities. Level 2 includes other significant observable inputs (including quoted prices for similar securities, interest rates, prepayment speeds and credit risk). Level 3 includes significant unobservable inputs (including the Fund's own assumptions in determining the fair value of investments). The inputs or methodology used for valuing securities are not necessarily an indication of the risk associated with investing in those securities.
The following is a summary of the inputs used as of August 31, 2012 in valuing the Fund's investments. For information on the Fund's policy regarding the valuation of investments, please refer to the Security Valuation section of Note A in the accompanying Notes to Financial Statements.
| Assets | Level 1 | Level 2 | Level 3 | Total | ||||||||||||
| Equity Funds | $ | 60,695,860 | $ | — | $ | — | $ | 60,695,860 | ||||||||
| Exchange-Traded Funds (c) | 13,900,031 | — | — | 13,900,031 | ||||||||||||
| Bond Funds | 65,060,701 | — | — | 65,060,701 | ||||||||||||
| Market Neutral Fund | 1,951,143 | — | — | 1,951,143 | ||||||||||||
| Money Market Funds | 944,404 | — | — | 944,404 | ||||||||||||
| Total | $ | 142,552,139 | $ | — | $ | — | $ | 142,552,139 | ||||||||
There have been no transfers between Level 1 and Level 2 fair value measurements during the year ended August 31, 2012.
(c) See Investment Portfolio for additional detailed categorizations.
| Shares | Value ($) | |||||||
| Equity — Equity Funds 52.9% | ||||||||
| DWS Capital Growth Fund "Institutional" (a) | 137,011 | 8,249,409 | ||||||
| DWS Core Equity Fund "Institutional" (a) | 825,483 | 14,602,788 | ||||||
| DWS Diversified International Equity Fund "Institutional" (a) | 1,086,787 | 7,074,985 | ||||||
| DWS Dreman Mid Cap Value Fund "Institutional" (a) | 162,495 | 1,870,322 | ||||||
| DWS Dreman Small Cap Value Fund "Institutional" (a) | 124,268 | 4,451,274 | ||||||
| DWS EAFE Equity Index Fund "Institutional" (a) | 541,992 | 6,243,742 | ||||||
| DWS Emerging Markets Equity Fund "Institutional" (a) | 341,554 | 5,201,869 | ||||||
| DWS Equity 500 Index Fund "Institutional" (a) | 167,580 | 26,849,646 | ||||||
| DWS Equity Dividend Fund "Institutional" (a) | 249,963 | 8,818,686 | ||||||
| DWS Global Small Cap Growth Fund "Institutional" (a) | 54,970 | 2,057,537 | ||||||
| DWS Global Thematic Fund "Institutional" (a) | 144,469 | 3,139,313 | ||||||
| DWS International Fund "Institutional" (a) | 50,063 | 2,015,021 | ||||||
| DWS Large Cap Focus Growth Fund "Institutional" (a) | 61,655 | 2,083,947 | ||||||
| DWS Large Cap Value Fund "Institutional" (a) | 184,161 | 3,355,410 | ||||||
| DWS RREEF Real Estate Securities Fund "Institutional" (a) | 87,027 | 1,911,110 | ||||||
| DWS Small Cap Core Fund "S"* (a) | 32,474 | 610,504 | ||||||
| DWS Small Cap Growth Fund "Institutional"* (a) | 144,181 | 3,539,647 | ||||||
| DWS Technology Fund "Institutional"* (a) | 278,408 | 4,549,188 | ||||||
Total Equity — Equity Funds (Cost $100,176,911) | 106,624,398 | |||||||
| Equity — Exchange-Traded Funds 9.6% | ||||||||
| iShares MSCI Australia Index Fund | 90,755 | 2,130,020 | ||||||
| iShares MSCI Canada Index Fund | 77,185 | 2,122,588 | ||||||
| iShares MSCI Germany Index Fund | 41,870 | 888,481 | ||||||
| iShares MSCI Italy Index Fund | 78,111 | 916,242 | ||||||
| iShares MSCI Japan Index Fund | 213,739 | 1,936,475 | ||||||
| iShares MSCI United Kingdom Index Fund | 274,517 | 4,658,553 | ||||||
| iShares S&P U.S. Preferred Stock Index Fund | 25,343 | 1,008,145 | ||||||
| SPDR Barclays Capital Convertible Securities Fund | 79,350 | 3,067,671 | ||||||
| Vanguard FTSE All World ex-U.S. Small-Cap Fund | 30,937 | 2,595,924 | ||||||
Total Equity — Exchange-Traded Funds (Cost $19,160,282) | 19,324,099 | |||||||
| Fixed Income — Bond Funds 35.3% | ||||||||
| DWS Core Fixed Income Fund "Institutional" (a) | 2,450,444 | 24,700,476 | ||||||
| DWS Enhanced Commodity Strategy Fund "Institutional" (a) | 579,092 | 2,015,240 | ||||||
| DWS Enhanced Emerging Markets Fixed Income Fund "Institutional" (a) | 181,755 | 1,988,405 | ||||||
| DWS Enhanced Global Bond Fund "S" (a) | 752,677 | 7,684,836 | ||||||
| DWS Global High Income Fund "Institutional" (a) | 144,607 | 1,010,802 | ||||||
| DWS Global Inflation Fund "Institutional" (a) | 295,111 | 3,290,486 | ||||||
| DWS High Income Fund "Institutional" (a) | 1,000,130 | 4,860,633 | ||||||
| DWS U.S. Bond Index Fund "Institutional" (a) | 2,299,684 | 25,641,478 | ||||||
Total Fixed Income — Bond Funds (Cost $70,731,119) | 71,192,356 | |||||||
| Fixed Income — Exchange-Traded Fund 0.5% | ||||||||
| WisdomTree Emerging Markets Local Debt Fund (Cost $964,767) | 19,839 | 1,019,526 | ||||||
| Market Neutral Fund 1.6% | ||||||||
| DWS Disciplined Market Neutral Fund "Institutional" (a) (Cost $3,321,524) | 346,444 | 3,325,857 | ||||||
| Fixed Income — Money Market Fund 0.1% | ||||||||
| Central Cash Management Fund, 0.14% (a) (b) (Cost $235,298) | 235,298 | 235,298 | ||||||
| % of Net Assets | Value ($) | |||||||
Total Investment Portfolio (Cost $194,589,901)† | 100.0 | 201,721,534 | ||||||
| Other Assets and Liabilities, Net | 0.0 | 3,634 | ||||||
| Net Assets | 100.0 | 201,725,168 | ||||||
* Non-income producing security.
† The cost for federal income tax purposes was $195,876,679. At August 31, 2012, net unrealized appreciation for all securities based on tax cost was $5,844,855. This consisted of aggregate gross unrealized appreciation for all securities in which there was an excess of value over tax cost of $10,014,607 and aggregate gross unrealized depreciation for all securities in which there was an excess of tax cost over value of $4,169,752.
(a) Affiliated fund managed by Deutsche Investment Management Americas Inc.
(b) The rate shown is the annualized seven-day yield at period end.
During the year ended August 31, 2012, purchases and sales of affiliated Underlying Funds (excluding money market funds) aggregated $86,520,162 and $100,312,736, respectively. Purchase and sales on non-affiliated Underlying Funds (excluding money market funds) aggregated $6,926,053 and $9,893,413, respectively.
EAFE: Europe, Australasia and Far East
FTSE: Financial Times and the London Stock Exchange
MSCI: Morgan Stanley Capital International
S&P: Standard & Poor's
SPDR: Standard & Poor's Depositary Receipt
Fair Value Measurements
Various inputs are used in determining the value of the Fund's investments. These inputs are summarized in three broad levels. Level 1 includes quoted prices in active markets for identical securities. Level 2 includes other significant observable inputs (including quoted prices for similar securities, interest rates, prepayment speeds and credit risk). Level 3 includes significant unobservable inputs (including the Fund's own assumptions in determining the fair value of investments). The inputs or methodology used for valuing securities are not necessarily an indication of the risk associated with investing in those securities.
The following is a summary of the inputs used as of August 31, 2012 in valuing the Fund's investments. For information on the Fund's policy regarding the valuation of investments, please refer to the Security Valuation section of Note A in the accompanying Notes to Financial Statements.
| Assets | Level 1 | Level 2 | Level 3 | Total | ||||||||||||
| Equity Funds | $ | 106,624,398 | $ | — | $ | — | $ | 106,624,398 | ||||||||
| Exchange-Traded Funds (c) | 20,343,625 | — | — | 20,343,625 | ||||||||||||
| Bond Funds | 71,192,356 | — | — | 71,192,356 | ||||||||||||
| Market Neutral Fund | 3,325,857 | — | — | 3,325,857 | ||||||||||||
| Money Market Funds | 235,298 | — | — | 235,298 | ||||||||||||
| Total | $ | 201,721,534 | $ | — | $ | — | $ | 201,721,534 | ||||||||
There have been no transfers between Level 1 and Level 2 fair value measurements during the year ended August 31, 2012.
(c) See Investment Portfolio for additional detailed categorizations.
| Shares | Value ($) | |||||||
| Equity — Equity Funds 68.4% | ||||||||
| DWS Capital Growth Fund "Institutional" (a) | 91,989 | 5,538,684 | ||||||
| DWS Core Equity Fund "Institutional" (a) | 306,157 | 5,415,912 | ||||||
| DWS Diversified International Equity Fund "Institutional" (a) | 452,868 | 2,948,172 | ||||||
| DWS Dreman Mid Cap Value Fund "Institutional" (a) | 58,899 | 677,923 | ||||||
| DWS Dreman Small Cap Value Fund "Institutional" (a) | 53,092 | 1,901,757 | ||||||
| DWS EAFE Equity Index Fund "Institutional" (a) | 231,545 | 2,667,394 | ||||||
| DWS Emerging Markets Equity Fund "Institutional" (a) | 139,872 | 2,130,250 | ||||||
| DWS Equity 500 Index Fund "Institutional" (a) | 74,298 | 11,904,011 | ||||||
| DWS Equity Dividend Fund "Institutional" (a) | 117,627 | 4,149,885 | ||||||
| DWS Global Small Cap Growth Fund "Institutional" (a) | 17,646 | 660,499 | ||||||
| DWS Global Thematic Fund "Institutional" (a) | 37,676 | 818,690 | ||||||
| DWS International Fund "Institutional" (a) | 25,465 | 1,024,951 | ||||||
| DWS Large Cap Value Fund "Institutional" (a) | 81,081 | 1,477,289 | ||||||
| DWS RREEF Real Estate Securities Fund "Institutional" (a) | 30,323 | 665,900 | ||||||
| DWS Small Cap Core Fund "S"* (a) | 27,304 | 513,309 | ||||||
| DWS Small Cap Growth Fund "Institutional"* (a) | 59,847 | 1,469,236 | ||||||
| DWS Technology Fund "Institutional"* (a) | 89,693 | 1,465,584 | ||||||
| DWS World Dividend Fund "Institutional" (a) | 31,004 | 734,184 | ||||||
Total Equity — Equity Funds (Cost $41,997,181) | 46,163,630 | |||||||
| Equity — Exchange-Traded Funds 11.0% | ||||||||
| iShares MSCI Australia Index Fund | 29,283 | 687,272 | ||||||
| iShares MSCI Canada Index Fund | 34,271 | 942,453 | ||||||
| iShares MSCI Germany Index Fund | 28,102 | 596,324 | ||||||
| iShares MSCI Italy Index Fund | 53,562 | 628,282 | ||||||
| iShares MSCI Japan Index Fund | 68,013 | 616,198 | ||||||
| iShares MSCI United Kingdom Index Fund | 113,894 | 1,932,781 | ||||||
| iShares S&P U.S. Preferred Stock Index Fund | 8,052 | 320,309 | ||||||
| SPDR Barclays Capital Convertible Securities Fund | 17,300 | 668,818 | ||||||
| Vanguard FTSE All World ex-U.S. Small-Cap Fund | 12,374 | 1,038,302 | ||||||
Total Equity — Exchange-Traded Funds (Cost $7,224,024) | 7,430,739 | |||||||
| Fixed Income — Bond Funds 17.5% | ||||||||
| DWS Core Fixed Income Fund "Institutional" (a) | 293,287 | 2,956,334 | ||||||
| DWS Enhanced Commodity Strategy Fund "Institutional" (a) | 190,041 | 661,343 | ||||||
| DWS Enhanced Emerging Markets Fixed Income Fund "Institutional" (a) | 30,795 | 336,902 | ||||||
| DWS Enhanced Global Bond Fund "S" (a) | 368,709 | 3,764,523 | ||||||
| DWS High Income Fund "Institutional" (a) | 170,762 | 829,903 | ||||||
| DWS U.S. Bond Index Fund "Institutional" (a) | 295,651 | 3,296,503 | ||||||
Total Fixed Income — Bond Funds (Cost $11,726,011) | 11,845,508 | |||||||
| Fixed Income — Exchange-Traded Fund 0.5% | ||||||||
| WisdomTree Emerging Markets Local Debt Fund (Cost $306,514) | 6,303 | 323,911 | ||||||
| Market Neutral Fund 1.5% | ||||||||
| DWS Disciplined Market Neutral Fund "Institutional" (a) (Cost $988,230) | 103,388 | 992,527 | ||||||
| Fixed Income - Money Market Fund 1.2% | ||||||||
| Central Cash Management Fund, 0.14% (a) (b) (Cost $833,112) | 833,112 | 833,112 | ||||||
| % of Net Assets | Value ($) | |||||||
Total Investment Portfolio (Cost $63,075,072)† | 100.1 | 67,589,427 | ||||||
| Other Assets and Liabilities, Net | (0.1 | ) | (96,067 | ) | ||||
| Net Assets | 100.0 | 67,493,360 | ||||||
* Non-income producing security.
† The cost for federal income tax purposes was $63,592,151. At August 31, 2012, net unrealized appreciation for all securities based on tax cost was $3,997,276. This consisted of aggregate gross unrealized appreciation for all securities in which there was an excess of value over tax cost of $5,382,394 and aggregate gross unrealized depreciation for all securities in which there was an excess of tax cost over value of $1,385,118.
(a) Affiliated fund managed by Deutsche Investment Management Americas Inc.
(b) The rate shown is the annualized seven-day yield at period end.
During the year ended August 31, 2012, purchases and sales of affiliated Underlying Funds (excluding money market funds) aggregated $26,813,353 and $26,611,326, respectively. Purchase and sales on non-affiliated Underlying Funds (excluding money market funds) aggregated $2,564,766 and $2,678,170, respectively.
EAFE: Europe, Australasia and Far East
FTSE: Financial Times and the London Stock Exchange
MSCI: Morgan Stanley Capital International
S&P: Standard & Poor's
SPDR: Standard & Poor's Depositary Receipt
Fair Value Measurements
Various inputs are used in determining the value of the Fund's investments. These inputs are summarized in three broad levels. Level 1 includes quoted prices in active markets for identical securities. Level 2 includes other significant observable inputs (including quoted prices for similar securities, interest rates, prepayment speeds and credit risk). Level 3 includes significant unobservable inputs (including the Fund's own assumptions in determining the fair value of investments). The inputs or methodology used for valuing securities are not necessarily an indication of the risk associated with investing in those securities.
The following is a summary of the inputs used as of August 31, 2012 in valuing the Fund's investments. For information on the Fund's policy regarding the valuation of investments, please refer to the Security Valuation section of Note A in the accompanying Notes to Financial Statements.
| Assets | Level 1 | Level 2 | Level 3 | Total | ||||||||||||
| Equity Funds | $ | 46,163,630 | $ | — | $ | — | $ | 46,163,630 | ||||||||
| Exchange-Traded Funds (c) | 7,754,650 | — | — | 7,754,650 | ||||||||||||
| Bond Funds | 11,845,508 | — | — | 11,845,508 | ||||||||||||
| Market Neutral Fund | 992,527 | — | — | 992,527 | ||||||||||||
| Money Market Funds | 833,112 | — | — | 833,112 | ||||||||||||
| Total | $ | 67,589,427 | $ | — | $ | — | $ | 67,589,427 | ||||||||
There have been no transfers between Level 1 and Level 2 fair value measurements during the year ended August 31, 2012.
(c) See Investment Portfolio for additional detailed categorizations.
DWS LifeCompass 2040 Fund
| Shares | Value ($) | |||||||
| Equity — Equity Funds 79.0% | ||||||||
| DWS Capital Growth Fund "Institutional" (a) | 59,322 | 3,571,780 | ||||||
| DWS Core Equity Fund "Institutional" (a) | 206,281 | 3,649,106 | ||||||
| DWS Diversified International Equity Fund "Institutional" (a) | 356,137 | 2,318,451 | ||||||
| DWS Dreman Mid Cap Value Fund "Institutional" (a) | 32,510 | 374,185 | ||||||
| DWS Dreman Small Cap Value Fund "Institutional" (a) | 33,526 | 1,200,907 | ||||||
| DWS EAFE Equity Index Fund "Institutional" (a) | 188,375 | 2,170,081 | ||||||
| DWS Emerging Markets Equity Fund "Institutional" (a) | 106,959 | 1,628,991 | ||||||
| DWS Equity 500 Index Fund "Institutional" (a) | 47,528 | 7,614,920 | ||||||
| DWS Equity Dividend Fund "Institutional" (a) | 85,298 | 3,009,328 | ||||||
| DWS Global Small Cap Growth Fund "Institutional" (a) | 10,106 | 378,252 | ||||||
| DWS Global Thematic Fund "Institutional" (a) | 31,943 | 694,120 | ||||||
| DWS International Fund "Institutional" (a) | 22,212 | 894,048 | ||||||
| DWS Large Cap Value Fund "Institutional" (a) | 51,759 | 943,049 | ||||||
| DWS RREEF Real Estate Securities Fund "Institutional" (a) | 18,279 | 401,416 | ||||||
| DWS Small Cap Core Fund "S"* (a) | 21,724 | 408,418 | ||||||
| DWS Small Cap Growth Fund "Institutional"* (a) | 38,008 | 933,108 | ||||||
| DWS Technology Fund "Institutional"* (a) | 58,440 | 954,909 | ||||||
| DWS World Dividend Fund "Institutional" (a) | 15,878 | 375,996 | ||||||
Total Equity — Equity Funds (Cost $27,734,626) | 31,521,065 | |||||||
| Equity — Exchange-Traded Funds 10.5% | ||||||||
| iShares MSCI Australia Index Fund | 16,785 | 393,944 | ||||||
| iShares MSCI Canada Index Fund | 15,636 | 429,990 | ||||||
| iShares MSCI Germany Index Fund | 1,339 | 28,413 | ||||||
| iShares MSCI Italy Index Fund | 34,337 | 402,773 | ||||||
| iShares MSCI Japan Index Fund | 38,649 | 350,160 | ||||||
| iShares MSCI United Kingdom Index Fund | 67,342 | 1,142,794 | ||||||
| iShares S&P U.S. Preferred Stock Index Fund | 4,620 | 183,784 | ||||||
| SPDR Barclays Capital Convertible Securities Fund | 10,000 | 386,600 | ||||||
| Vanguard FTSE All World ex-U.S. Small-Cap Fund | 10,395 | 872,244 | ||||||
Total Equity — Exchange-Traded Funds (Cost $4,012,973) | 4,190,702 | |||||||
| Fixed Income — Bond Funds 7.2% | ||||||||
| DWS Core Fixed Income Fund "Institutional" (a) | 48,170 | 485,552 | ||||||
| DWS Enhanced Commodity Strategy Fund "Institutional" (a) | 111,502 | 388,026 | ||||||
| DWS Enhanced Emerging Markets Fixed Income Fund "Institutional" (a) | 17,897 | 195,798 | ||||||
| DWS Enhanced Global Bond Fund "S" (a) | 56,026 | 572,022 | ||||||
| DWS High Income Fund "Institutional" (a) | 80,425 | 390,864 | ||||||
| DWS U.S. Bond Index Fund "Institutional" (a) | 74,081 | 825,998 | ||||||
Total Fixed Income — Bond Funds (Cost $2,828,776) | 2,858,260 | |||||||
| Market Neutral Fund 1.4% | ||||||||
| DWS Disciplined Market Neutral Fund "Institutional" (a) (Cost $576,041) | 60,254 | 578,434 | ||||||
| Fixed Income — Money Market Fund 2.0% | ||||||||
| Central Cash Management Fund, 0.14% (a) (b) (Cost $798,059) | 798,059 | 798,059 | ||||||
| % of Net Assets | Value ($) | |||||||
Total Investment Portfolio (Cost $35,950,475)† | 100.1 | 39,946,520 | ||||||
| Other Assets and Liabilities, Net | (0.1 | ) | (30,203 | ) | ||||
| Net Assets | 100.0 | 39,916,317 | ||||||
* Non-income producing.
† The cost for federal income tax purposes was $36,264,843. At August 31, 2012, net unrealized appreciation for all securities based on tax cost was $3,681,677. This consisted of aggregate gross unrealized appreciation for all securities in which there was an excess of value over tax cost of $4,245,029 and aggregate gross unrealized depreciation for all securities in which there was an excess of tax cost over value of $563,352.
(a) Affiliated fund managed by Deutsche Investment Management Americas Inc.
(b) The rate shown is the annualized seven-day yield at period end.
During the period ended August 31, 2012, purchases and sales of affiliated Underlying Funds (excluding money market funds) aggregated $17,475,555 and $11,770,692, respectively. Purchases and sales of non-affiliated Underlying Funds (excluding money market funds) aggregated $1,965,349 and $1,615,028, respectively.
EAFE: Europe, Australasia and Far East
FTSE: Financial Times and the London Stock Exchange
MSCI: Morgan Stanley Capital International
S&P: Standard & Poor's
SPDR: Standard & Poor's Depositary Receipt
Fair Value Measurements
Various inputs are used in determining the value of the Fund's investments. These inputs are summarized in three broad levels. Level 1 includes quoted prices in active markets for identical securities. Level 2 includes other significant observable inputs (including quoted prices for similar securities, interest rates, prepayment speeds and credit risk). Level 3 includes significant unobservable inputs (including the Fund's own assumptions in determining the fair value of investments). The inputs or methodology used for valuing securities are not necessarily an indication of the risk associated with investing in those securities.
The following is a summary of the inputs used as of August 31, 2012 in valuing the Fund's investments. For information on the Fund's policy regarding the valuation of investments, please refer to the Security Valuation section of Note A in the accompanying Notes to Financial Statements.
| Assets | Level 1 | Level 2 | Level 3 | Total | ||||||||||||
| Equity Funds | $ | 31,521,065 | $ | — | $ | — | $ | 31,521,065 | ||||||||
| Exchange-Traded Funds | 4,190,702 | — | — | 4,190,702 | ||||||||||||
| Bond Funds | 2,858,260 | — | — | 2,858,260 | ||||||||||||
| Market Neutral Fund | 578,434 | — | — | 578,434 | ||||||||||||
| Money Market Funds | 798,059 | — | — | 798,059 | ||||||||||||
| Total | $ | 39,946,520 | $ | — | $ | — | $ | 39,946,520 | ||||||||
There have been no transfers between Level 1 and Level 2 fair value measurements during the year ended August 31, 2012.
The accompanying notes are an integral part of the financial statements.
| as of August 31, 2012 | ||||||||||||
| Assets | DWS LifeCompass Retirement Fund | DWS LifeCompass 2015 Fund | DWS LifeCompass 2020 Fund | |||||||||
| Investments in affiliated Underlying Funds, at value (cost $81,756,557, $124,221,854 and $174,464,852) | $ | 83,332,416 | $ | 128,652,108 | $ | 181,377,909 | ||||||
| Investments in non-affiliated Underlying Funds, at value (cost $4,531,798, $14,186,661 and $20,125,049) | 4,657,524 | 13,900,031 | 20,343,625 | |||||||||
| Total investments in securities, at value (cost $86,288,355, $138,408,515 and $194,589,901) | 87,989,940 | 142,552,139 | 201,721,534 | |||||||||
| Receivable for investments sold | — | — | 500,000 | |||||||||
| Receivable for Fund shares sold | 18,953 | 191,594 | 17,158 | |||||||||
| Dividends receivable | 23,485 | 28,177 | 28,928 | |||||||||
| Interest receivable | 99 | 88 | 115 | |||||||||
| Other assets | 8,832 | 9,736 | 9,819 | |||||||||
| Total assets | 88,041,309 | 142,781,734 | 202,277,554 | |||||||||
| Liabilities | ||||||||||||
| Payable for Fund shares redeemed | 124,463 | 641,049 | 309,616 | |||||||||
| Accrued Trustees' fees | 2,444 | 3,413 | 2,179 | |||||||||
| Other accrued expenses and payables | 111,428 | 172,812 | 240,591 | |||||||||
| Total liabilities | 238,335 | 817,274 | 552,386 | |||||||||
| Net assets, at value | $ | 87,802,974 | $ | 141,964,460 | $ | 201,725,168 | ||||||
| Net Assets Consist of | ||||||||||||
| Undistributed net investment income | 536,594 | 456,024 | 3,080,482 | |||||||||
| Net unrealized appreciation (depreciation) on investments | 1,701,585 | 4,143,624 | 7,131,633 | |||||||||
| Accumulated net realized gain (loss) | (13,981,630 | ) | (42,992,487 | ) | (32,715,815 | ) | ||||||
| Paid-in capital | 99,546,425 | 180,357,299 | 224,228,868 | |||||||||
| Net assets, at value | $ | 87,802,974 | $ | 141,964,460 | $ | 201,725,168 | ||||||
The accompanying notes are an integral part of the financial statements.
Statements of Assets and Liabilities as of August 31, 2012 (continued) | ||||||||
| Assets | DWS LifeCompass 2030 Fund | DWS LifeCompass 2040 Fund | ||||||
| Investments in affiliated Underlying Funds, at value (cost $55,544,534 and $31,937,502) | $ | 59,834,777 | $ | 35,755,818 | ||||
| Investments in non-affiliated Underlying Funds, at value (cost $7,530,538 and $4,012,973) | 7,754,650 | 4,190,702 | ||||||
| Total investments in securities, at value (cost $63,075,072 and $35,950,475) | 67,589,427 | 39,946,520 | ||||||
| Receivable for Fund shares sold | 5,858 | 34,155 | ||||||
| Dividends receivable | 2,412 | 1,030 | ||||||
| Interest receivable | 87 | 66 | ||||||
| Due from Advisor | 2,384 | 3,113 | ||||||
| Other assets | 3,426 | 4,526 | ||||||
| Total assets | 67,603,594 | 39,989,410 | ||||||
| Liabilities | ||||||||
| Payable for Fund shares redeemed | 13,872 | 4,329 | ||||||
| Accrued Trustees' fees | 1,409 | 1,347 | ||||||
| Other accrued expenses and payables | 94,953 | 67,417 | ||||||
| Total liabilities | 110,234 | 73,093 | ||||||
| Net assets, at value | $ | 67,493,360 | $ | 39,916,317 | ||||
| Net Assets Consist of | ||||||||
| Undistributed net investment income | 472,687 | 114,452 | ||||||
| Net unrealized appreciation (depreciation) on investments | 4,514,355 | 3,996,045 | ||||||
| Accumulated net realized gain (loss) | (3,975,352 | ) | (17,778 | ) | ||||
| Paid-in capital | 66,481,670 | 35,823,598 | ||||||
| Net assets, at value | $ | 67,493,360 | $ | 39,916,317 | ||||
The accompanying notes are an integral part of the financial statements.
Statements of Assets and Liabilities as of August 31, 2012 (continued) | ||||||||||||
| Net Asset Value | DWS LifeCompass Retirement Fund | DWS LifeCompass 2015 Fund | DWS LifeCompass 2020 Fund | |||||||||
Class A Net assets applicable to shares outstanding | $ | 29,348,875 | $ | 58,206,329 | $ | 80,362,320 | ||||||
| Shares outstanding of beneficial interest, $.01 par value, unlimited number of shares authorized | 2,535,371 | 5,222,988 | 5,954,621 | |||||||||
Net Asset Value and redemption price per share | $ | 11.58 | $ | 11.14 | $ | 13.50 | ||||||
| Maximum offering price per share (100 ÷ 94.25 of net asset value) | $ | 12.29 | $ | 11.82 | $ | 14.32 | ||||||
Class B Net assets applicable to shares outstanding | $ | 643,962 | $ | 1,464,315 | $ | 2,578,212 | ||||||
| Shares outstanding of beneficial interest, $.01 par value, unlimited number of shares authorized | 55,626 | 131,538 | 192,592 | |||||||||
Net Asset Value, offering and redemption price (subject to contingent deferred sales charge) per share | $ | 11.58 | $ | 11.13 | $ | 13.39 | ||||||
Class C Net assets applicable to shares outstanding | $ | 5,238,098 | $ | 10,860,591 | $ | 13,756,604 | ||||||
| Shares outstanding of beneficial interest, $.01 par value, unlimited number of shares authorized | 452,817 | 975,988 | 1,028,502 | |||||||||
Net Asset Value, offering and redemption price (subject to contingent deferred sales charge) per share | $ | 11.57 | $ | 11.13 | $ | 13.38 | ||||||
Class S Net assets applicable to shares outstanding | $ | 52,572,039 | $ | 71,433,225 | $ | 105,028,032 | ||||||
| Shares outstanding of beneficial interest, $.01 par value, unlimited number of shares authorized | 4,542,635 | 6,418,620 | 7,768,509 | |||||||||
Net Asset Value, offering and redemption price per share | $ | 11.57 | $ | 11.13 | $ | 13.52 | ||||||
The accompanying notes are an integral part of the financial statements.
Statements of Assets and Liabilities as of August 31, 2012 (continued) | ||||||||
| Net Asset Value | DWS LifeCompass 2030 Fund | DWS LifeCompass 2040 Fund | ||||||
Class A Net assets applicable to shares outstanding | $ | 41,360,895 | $ | 21,777,788 | ||||
| Shares outstanding of beneficial interest, $.01 par value, unlimited number of shares authorized | 4,260,812 | 2,634,952 | ||||||
Net Asset Value and redemption price per share | $ | 9.71 | $ | 8.26 | ||||
| Maximum offering price per share (100 ÷ 94.25 of net asset value) | $ | 10.30 | $ | 8.76 | ||||
Class B Net assets applicable to shares outstanding | $ | 923,724 | — | |||||
| Shares outstanding of beneficial interest, $.01 par value, unlimited number of shares authorized | 95,508 | — | ||||||
Net Asset Value, offering and redemption price (subject to contingent deferred sales charge) per share | $ | 9.67 | — | |||||
Class C Net assets applicable to shares outstanding | $ | 4,603,437 | $ | 209,267 | ||||
| Shares outstanding of beneficial interest, $.01 par value, unlimited number of shares authorized | 476,243 | 25,436 | ||||||
Net Asset Value, offering and redemption price (subject to contingent deferred sales charge) per share | $ | 9.67 | $ | 8.23 | ||||
Class S Net assets applicable to shares outstanding | $ | 20,605,304 | $ | 17,929,262 | ||||
| Shares outstanding of beneficial interest, $.01 par value, unlimited number of shares authorized | 2,120,527 | 2,163,740 | ||||||
Net Asset Value, offering and redemption price per share | $ | 9.72 | $ | 8.29 | ||||
The accompanying notes are an integral part of the financial statements.
| for the year ended August 31, 2012 | ||||||||||||
| Investment Income | DWS LifeCompass Retirement Fund | DWS LifeCompass 2015 Fund | DWS LifeCompass 2020 Fund | |||||||||
| Income distributions from affiliated Underlying Funds | $ | 2,101,607 | $ | 3,052,448 | $ | 4,046,527 | ||||||
| Dividends | 142,127 | 419,962 | 679,286 | |||||||||
| Total income | 2,243,734 | 3,472,410 | 4,725,813 | |||||||||
Expenses: Administration fee | 86,859 | 144,135 | 210,711 | |||||||||
| Services to shareholders | 164,499 | 312,954 | 451,060 | |||||||||
| Distribution and service fees | 124,521 | 283,937 | 379,032 | |||||||||
| Custodian fee | 13,846 | 13,782 | 14,875 | |||||||||
| Audit and tax fees | 43,004 | 45,583 | 41,443 | |||||||||
| Legal fees | 9,519 | 10,230 | 9,285 | |||||||||
| Reports to shareholders | 23,752 | 23,939 | 41,099 | |||||||||
| Registration fees | 47,189 | 48,593 | 49,674 | |||||||||
| Trustees' fees and expenses | 6,611 | 9,237 | 8,552 | |||||||||
| Other | 5,516 | 7,223 | 7,651 | |||||||||
| Total expenses before expense reductions | 525,316 | 899,613 | 1,213,382 | |||||||||
| Expense reductions | (78,240 | ) | (137,104 | ) | (123,110 | ) | ||||||
| Total expenses after expense reductions | 447,076 | 762,509 | 1,090,272 | |||||||||
| Net investment income | 1,796,658 | 2,709,901 | 3,635,541 | |||||||||
| Realized and Unrealized Gain (Loss) | ||||||||||||
Net realized gain (loss) from: Sale of affiliated Underlying Funds | 3,016,745 | 6,586,407 | 8,940,202 | |||||||||
| Sale of non-affiliated Underlying Funds | (229,028 | ) | 123,199 | (77,174 | ) | |||||||
| Capital gain distributions from affiliated Underlying Funds | 339,165 | 420,532 | 487,916 | |||||||||
| 3,126,882 | 7,130,138 | 9,350,944 | ||||||||||
| Change in net unrealized appreciation (depreciation) on investments | 680,690 | 667,092 | 2,743,520 | |||||||||
| Net gain (loss) | 3,807,572 | 7,797,230 | 12,094,464 | |||||||||
| Net increase (decrease) in net assets resulting from operations | $ | 5,604,230 | $ | 10,507,131 | $ | 15,730,005 | ||||||
The accompanying notes are an integral part of the financial statements.
Statements of Operations for the year ended August 31, 2012 (continued) | ||||||||
| Investment Income | DWS LifeCompass 2030 Fund | DWS LifeCompass 2040 Fund | ||||||
| Income distributions from affiliated Underlying Funds | $ | 1,016,561 | $ | 516,048 | ||||
| Dividends | 249,430 | 134,067 | ||||||
| Total income | 1,265,991 | 650,115 | ||||||
Expenses: Administration fee | 64,839 | 36,188 | ||||||
| Services to shareholders | 158,476 | 92,824 | ||||||
| Distribution and service fees | 151,339 | 49,634 | ||||||
| Custodian fee | 12,280 | 11,304 | ||||||
| Audit and tax fees | 43,004 | 42,084 | ||||||
| Legal fees | 6,543 | 6,140 | ||||||
| Reports to shareholders | 15,407 | 13,382 | ||||||
| Registration fees | 47,027 | 39,386 | ||||||
| Trustees' fees and expenses | 4,399 | 3,280 | ||||||
| Other | 4,512 | 2,236 | ||||||
| Total expenses before expense reductions | 507,826 | 296,458 | ||||||
| Expense reductions | (139,883 | ) | (136,535 | ) | ||||
| Total expenses after expense reductions | 367,943 | 159,923 | ||||||
| Net investment income | 898,048 | 490,192 | ||||||
| Realized and Unrealized Gain (Loss) | ||||||||
Net realized gain (loss) from: Sale of affiliated Underlying Funds | 2,850,090 | 429,178 | ||||||
| Sale of non-affiliated Underlying Funds | (195,735 | ) | (242,465 | ) | ||||
| Capital gain distributions from affiliated Underlying Funds | 63,376 | 20,823 | ||||||
| 2,717,731 | 207,536 | |||||||
| Change in net unrealized appreciation (depreciation) on investments | 1,383,611 | 2,088,450 | ||||||
| Net gain (loss) | 4,101,342 | 2,295,986 | ||||||
| Net increase (decrease) in net assets resulting from operations | $ | 4,999,390 | $ | 2,786,178 | ||||
The accompanying notes are an integral part of the financial statements.
| DWS LifeCompass Retirement Fund | ||||||||
| Increase (Decrease) in Net Assets | Years Ended August 31, | |||||||
| 2012 | 2011 | |||||||
Operations: Net investment income | $ | 1,796,658 | $ | 2,079,681 | ||||
| Net realized gain (loss) | 3,126,882 | 3,980,630 | ||||||
| Change in net unrealized appreciation (depreciation) | 680,690 | 1,335,804 | ||||||
| Net increase (decrease) in net assets resulting from operations | 5,604,230 | 7,396,115 | ||||||
Distributions to shareholders from: Net investment income: Class A | (489,850 | ) | (619,675 | ) | ||||
| Class B | (12,122 | ) | (22,616 | ) | ||||
| Class C | (67,176 | ) | (83,937 | ) | ||||
| Class S | (1,209,417 | ) | (1,272,345 | ) | ||||
| Total distributions | (1,778,565 | ) | (1,998,573 | ) | ||||
Fund share transactions: Proceeds from shares sold | 21,387,872 | 13,246,278 | ||||||
| Reinvestment of distributions | 1,669,497 | 1,857,229 | ||||||
| Payments for shares redeemed | (27,513,642 | ) | (25,376,517 | ) | ||||
| Net increase (decrease) in net assets from Fund share transactions | (4,456,273 | ) | (10,273,010 | ) | ||||
| Increase (decrease) in net assets | (630,608 | ) | (4,875,468 | ) | ||||
| Net assets at beginning of period | 88,433,582 | 93,309,050 | ||||||
| Net assets at end of period (including undistributed net investment income of $536,594 and $517,378, respectively) | $ | 87,802,974 | $ | 88,433,582 | ||||
The accompanying notes are an integral part of the financial statements.
Statements of Changes in Net Assets (continued) | ||||||||
| DWS LifeCompass 2015 Fund | ||||||||
| Increase (Decrease) in Net Assets | Years Ended August 31, | |||||||
| 2012 | 2011 | |||||||
Operations: Net investment income | $ | 2,709,901 | $ | 3,121,608 | ||||
| Net realized gain (loss) | 7,130,138 | 5,626,381 | ||||||
| Change in net unrealized appreciation (depreciation) | 667,092 | 9,286,088 | ||||||
| Net increase (decrease) in net assets resulting from operations | 10,507,131 | 18,034,077 | ||||||
Distributions to shareholders from: Net investment income: Class A | (1,197,809 | ) | (1,211,886 | ) | ||||
| Class B | (27,607 | ) | (46,984 | ) | ||||
| Class C | (146,265 | ) | (140,080 | ) | ||||
| Class S | (1,581,986 | ) | (1,419,083 | ) | ||||
| Total distributions | (2,953,667 | ) | (2,818,033 | ) | ||||
Fund share transactions: Proceeds from shares sold | 21,387,569 | 29,751,711 | ||||||
| Reinvestment of distributions | 2,895,880 | 2,732,145 | ||||||
| Payments for shares redeemed | (38,894,054 | ) | (63,400,011 | ) | ||||
| Net increase (decrease) in net assets from Fund share transactions | (14,610,605 | ) | (30,916,155 | ) | ||||
| Increase (decrease) in net assets | (7,057,141 | ) | (15,700,111 | ) | ||||
| Net assets at beginning of period | 149,021,601 | 164,721,712 | ||||||
| Net assets at end of period (including undistributed net investment income of $456,024 and $699,254, respectively) | $ | 141,964,460 | $ | 149,021,601 | ||||
The accompanying notes are an integral part of the financial statements.
Statements of Changes in Net Assets (continued) | ||||||||
| DWS LifeCompass 2020 Fund | ||||||||
| Increase (Decrease) in Net Assets | Years Ended August 31, | |||||||
| 2012 | 2011 | |||||||
Operations: Net investment income | $ | 3,635,541 | $ | 3,838,909 | ||||
| Net realized gain (loss) | 9,350,944 | 5,362,362 | ||||||
| Change in net unrealized appreciation (depreciation) | 2,743,520 | 15,938,665 | ||||||
| Net increase (decrease) in net assets resulting from operations | 15,730,005 | 25,139,936 | ||||||
Distributions to shareholders from: Net investment income: Class A | (1,502,293 | ) | (1,475,168 | ) | ||||
| Class B | (45,397 | ) | (84,614 | ) | ||||
| Class C | (169,327 | ) | (171,165 | ) | ||||
| Class S | (2,284,134 | ) | (2,068,106 | ) | ||||
| Total distributions | (4,001,151 | ) | (3,799,053 | ) | ||||
Fund share transactions: Proceeds from shares sold | 47,424,798 | 36,735,648 | ||||||
| Reinvestment of distributions | 3,911,051 | 3,705,873 | ||||||
| Payments for shares redeemed | (68,411,756 | ) | (58,903,698 | ) | ||||
| Net increase (decrease) in net assets from Fund share transactions | (17,075,907 | ) | (18,462,177 | ) | ||||
| Increase (decrease) in net assets | (5,347,053 | ) | 2,878,706 | |||||
| Net assets at beginning of period | 207,072,221 | 204,193,515 | ||||||
| Net assets at end of period (including undistributed net investment income of $3,080,482 and $3,430,224, respectively) | $ | 201,725,168 | $ | 207,072,221 | ||||
The accompanying notes are an integral part of the financial statements.
Statements of Changes in Net Assets (continued) | ||||||||
| DWS LifeCompass 2030 Fund | ||||||||
| Increase (Decrease) in Net Assets | Years Ended August 31, | |||||||
| 2012 | 2011 | |||||||
Operations: Net investment income | $ | 898,048 | $ | 841,589 | ||||
| Net realized gain (loss) | 2,717,731 | 2,042,061 | ||||||
| Change in net unrealized appreciation (depreciation) | 1,383,611 | 5,243,074 | ||||||
| Net increase (decrease) in net assets resulting from operations | 4,999,390 | 8,126,724 | ||||||
Distributions to shareholders from: Net investment income: Class A | (559,338 | ) | (488,313 | ) | ||||
| Class B | (8,276 | ) | (6,884 | ) | ||||
| Class C | (30,766 | ) | (19,944 | ) | ||||
| Class S | (330,616 | ) | (184,779 | ) | ||||
| Total distributions | (928,996 | ) | (699,920 | ) | ||||
Fund share transactions: Proceeds from shares sold | 20,589,069 | 18,946,505 | ||||||
| Reinvestment of distributions | 924,310 | 695,197 | ||||||
| Payments for shares redeemed | (20,322,985 | ) | (22,917,426 | ) | ||||
| Net increase (decrease) in net assets from Fund share transactions | 1,190,394 | (3,275,724 | ) | |||||
| Increase (decrease) in net assets | 5,260,788 | 4,151,080 | ||||||
| Net assets at beginning of period | 62,232,572 | 58,081,492 | ||||||
| Net assets at end of period (including undistributed net investment income of $472,687 and $511,986, respectively) | $ | 67,493,360 | $ | 62,232,572 | ||||
The accompanying notes are an integral part of the financial statements.
Statements of Changes in Net Assets (continued) | ||||||||
| DWS LifeCompass 2040 Fund | ||||||||
| Increase (Decrease) in Net Assets | Years Ended August 31, | |||||||
| 2012 | 2011 | |||||||
Operations: Net investment income | $ | 490,192 | $ | 361,182 | ||||
| Net realized gain (loss) | 207,536 | 1,172,563 | ||||||
| Change in net unrealized appreciation (depreciation) | 2,088,450 | 1,620,889 | ||||||
| Net increase (decrease) in net assets resulting from operations | 2,786,178 | 3,154,634 | ||||||
Distributions to shareholders from: Net investment income: Class A | (258,932 | ) | (182,773 | ) | ||||
| Class C | (1,209 | ) | (713 | ) | ||||
| Class S | (239,720 | ) | (140,260 | ) | ||||
Net realized gains: Class A | (417,665 | ) | (319,212 | ) | ||||
| Class C | (4,452 | ) | (3,940 | ) | ||||
| Class S | (325,057 | ) | (198,324 | ) | ||||
| Total distributions | (1,247,035 | ) | (845,222 | ) | ||||
Fund share transactions: Proceeds from shares sold | 17,486,885 | 13,930,857 | ||||||
| Reinvestment of distributions | 1,247,035 | 845,178 | ||||||
| Payments for shares redeemed | (11,637,070 | ) | (10,509,807 | ) | ||||
| Net increase (decrease) in net assets from Fund share transactions | 7,096,850 | 4,266,228 | ||||||
| Increase (decrease) in net assets | 8,635,993 | 6,575,640 | ||||||
| Net assets at beginning of period | 31,280,324 | 24,704,684 | ||||||
| Net assets at end of period (including undistributed net investment income of $114,452 and $126,953, respectively) | $ | 39,916,317 | $ | 31,280,324 | ||||
The accompanying notes are an integral part of the financial statements.
| DWS LifeCompass Retirement Fund — Class A | ||||||||||||||||||||
| Years Ended August 31, | ||||||||||||||||||||
| 2012 | 2011 | 2010 | 2009 | 2008 | ||||||||||||||||
| Selected Per Share Data | ||||||||||||||||||||
| Net asset value, beginning of period | $ | 11.06 | $ | 10.47 | $ | 10.08 | $ | 11.49 | $ | 12.51 | ||||||||||
Income (loss) from investment operations: Net investment incomea | .22 | .24 | .25 | .36 | .40 | |||||||||||||||
| Net realized and unrealized gain (loss) | .52 | .58 | .42 | (1.36 | ) | (.98 | ) | |||||||||||||
| Total from investment operations | .74 | .82 | .67 | (1.00 | ) | (.58 | ) | |||||||||||||
Less distributions from: Net investment income | (.22 | ) | (.23 | ) | (.28 | ) | (.41 | ) | (.44 | ) | ||||||||||
| Net asset value, end of period | $ | 11.58 | $ | 11.06 | $ | 10.47 | $ | 10.08 | $ | 11.49 | ||||||||||
Total Return (%)b,c,d | 6.79 | 7.81 | 6.67 | (8.29 | ) | (4.76 | ) | |||||||||||||
| Ratios to Average Net Assets and Supplemental Data | ||||||||||||||||||||
| Net assets, end of period ($ millions) | 29 | 27 | 31 | 31 | 34 | |||||||||||||||
Ratio of expenses before expense reductions (%)e | .74 | .71 | .74 | .77 | .69 | |||||||||||||||
Ratio of expenses after expense reductions (%)e | .62 | .62 | .61 | .52 | .56 | |||||||||||||||
| Ratio of net investment income (%) | 1.99 | 2.12 | 2.39 | 3.84 | 3.24 | |||||||||||||||
| Portfolio turnover rate (%) | 53 | 37 | 53 | 41 | 48 | |||||||||||||||
a Based on average shares outstanding during the period. b Total return does not reflect the effect of any sales charge. c Total return would have been lower had certain expenses not been reduced. d Total return would have been lower if the Advisor had not reduced some Underlying Funds' expenses. e The Fund invests in other Funds and indirectly bears its proportionate share of fees and expenses incurred by the Underlying Funds in which the Fund is invested. This ratio does not include these indirect fees and expenses. | ||||||||||||||||||||
| DWS LifeCompass Retirement Fund — Class B | ||||||||||||||||||||
| Years Ended August 31, | ||||||||||||||||||||
| 2012 | 2011 | 2010 | 2009 | 2008 | ||||||||||||||||
| Selected Per Share Data | ||||||||||||||||||||
| Net asset value, beginning of period | $ | 11.06 | $ | 10.47 | $ | 10.08 | $ | 11.49 | $ | 12.52 | ||||||||||
Income (loss) from investment operations: Net investment incomea | .14 | .15 | .17 | .29 | .30 | |||||||||||||||
| Net realized and unrealized gain (loss) | .52 | .58 | .42 | (1.36 | ) | (.97 | ) | |||||||||||||
| Total from investment operations | .66 | .73 | .59 | (1.07 | ) | (.67 | ) | |||||||||||||
Less distributions from: Net investment income | (.14 | ) | (.14 | ) | (.20 | ) | (.34 | ) | (.36 | ) | ||||||||||
| Net asset value, end of period | $ | 11.58 | $ | 11.06 | $ | 10.47 | $ | 10.08 | $ | 11.49 | ||||||||||
Total Return (%)b,c,d | 5.99 | 7.00 | 5.87 | (8.99 | ) | (5.46 | ) | |||||||||||||
| Ratios to Average Net Assets and Supplemental Data | ||||||||||||||||||||
| Net assets, end of period ($ millions) | 1 | 1 | 2 | 3 | 6 | |||||||||||||||
Ratio of expenses before expense reductions (%)e | 1.48 | 1.43 | 1.43 | 1.56 | 1.42 | |||||||||||||||
Ratio of expenses after expense reductions (%)e | 1.37 | 1.37 | 1.36 | 1.27 | 1.31 | |||||||||||||||
| Ratio of net investment income (%) | 1.24 | 1.37 | 1.64 | 3.09 | 2.49 | |||||||||||||||
| Portfolio turnover rate (%) | 53 | 37 | 53 | 41 | 48 | |||||||||||||||
a Based on average shares outstanding during the period. b Total return does not reflect the effect of any sales charge. c Total return would have been lower had certain expenses not been reduced. d Total return would have been lower if the Advisor had not reduced some Underlying Funds' expenses. e The Fund invests in other Funds and indirectly bears its proportionate share of fees and expenses incurred by the Underlying Funds in which the Fund is invested. This ratio does not include these indirect fees and expenses. | ||||||||||||||||||||
| DWS LifeCompass Retirement Fund — Class C | ||||||||||||||||||||
| Years Ended August 31, | ||||||||||||||||||||
| 2012 | 2011 | 2010 | 2009 | 2008 | ||||||||||||||||
| Selected Per Share Data | ||||||||||||||||||||
| Net asset value, beginning of period | $ | 11.05 | $ | 10.46 | $ | 10.07 | $ | 11.49 | $ | 12.52 | ||||||||||
Income (loss) from investment operations: Net investment incomea | .14 | .15 | .17 | .29 | .31 | |||||||||||||||
| Net realized and unrealized gain (loss) | .52 | .58 | .42 | (1.37 | ) | (.98 | ) | |||||||||||||
| Total from investment operations | .66 | .73 | .59 | (1.08 | ) | (.67 | ) | |||||||||||||
Less distributions from: Net investment income | (.14 | ) | (.14 | ) | (.20 | ) | (.34 | ) | (.36 | ) | ||||||||||
| Net asset value, end of period | $ | 11.57 | $ | 11.05 | $ | 10.46 | $ | 10.07 | $ | 11.49 | ||||||||||
Total Return (%)b,c,d | 6.00 | 7.01 | 5.88 | (9.06 | ) | (5.43 | ) | |||||||||||||
| Ratios to Average Net Assets and Supplemental Data | ||||||||||||||||||||
| Net assets, end of period ($ millions) | 5 | 6 | 7 | 8 | 13 | |||||||||||||||
Ratio of expenses before expense reductions (%)e | 1.43 | 1.40 | 1.40 | 1.45 | 1.38 | |||||||||||||||
Ratio of expenses after expense reductions (%)e | 1.37 | 1.37 | 1.36 | 1.27 | 1.29 | |||||||||||||||
| Ratio of net investment income (%) | 1.23 | 1.37 | 1.64 | 3.09 | 2.51 | |||||||||||||||
| Portfolio turnover rate (%) | 53 | 37 | 53 | 41 | 48 | |||||||||||||||
a Based on average shares outstanding during the period. b Total return does not reflect the effect of any sales charge. c Total return would have been lower had certain expenses not been reduced. d Total return would have been lower if the Advisor had not reduced some Underlying Funds' expenses. e The Fund invests in other Funds and indirectly bears its proportionate share of fees and expenses incurred by the Underlying Funds in which the Fund is invested. This ratio does not include these indirect fees and expenses. | ||||||||||||||||||||
| DWS LifeCompass Retirement Fund — Class S | ||||||||||||||||||||
| Years Ended August 31, | ||||||||||||||||||||
| 2012 | 2011 | 2010 | 2009 | 2008 | ||||||||||||||||
| Selected Per Share Data | ||||||||||||||||||||
| Net asset value, beginning of period | $ | 11.06 | $ | 10.46 | $ | 10.08 | $ | 11.49 | $ | 12.51 | ||||||||||
Income (loss) from investment operations: Net investment incomea | .25 | .26 | .28 | .38 | .43 | |||||||||||||||
| Net realized and unrealized gain (loss) | .51 | .59 | .41 | (1.35 | ) | (.98 | ) | |||||||||||||
| Total from investment operations | .76 | .85 | .69 | (.97 | ) | (.55 | ) | |||||||||||||
Less distributions from: Net investment income | (.25 | ) | (.25 | ) | (.31 | ) | (.44 | ) | (.47 | ) | ||||||||||
| Net asset value, end of period | $ | 11.57 | $ | 11.06 | $ | 10.46 | $ | 10.08 | $ | 11.49 | ||||||||||
Total Return (%)b,c | 6.97 | 8.18 | 6.84 | (8.04 | ) | (4.52 | ) | |||||||||||||
| Ratios to Average Net Assets and Supplemental Data | ||||||||||||||||||||
| Net assets, end of period ($ millions) | 53 | 54 | 53 | 53 | 71 | |||||||||||||||
Ratio of expenses before expense reductions (%)d | .45 | .39 | .42 | .50 | .44 | |||||||||||||||
Ratio of expenses after expense reductions (%)d | .37 | .37 | .36 | .27 | .30 | |||||||||||||||
| Ratio of net investment income (%) | 2.20 | 2.37 | 2.64 | 4.09 | 3.50 | |||||||||||||||
| Portfolio turnover rate (%) | 53 | 37 | 53 | 41 | 48 | |||||||||||||||
a Based on average shares outstanding during the period. b Total return would have been lower had certain expenses not been reduced. c Total return would have been lower if the Advisor had not reduced some Underlying Funds' expenses. d The Fund invests in other Funds and indirectly bears its proportionate share of fees and expenses incurred by the Underlying Funds in which the Fund is invested. This ratio does not include these indirect fees and expenses. | ||||||||||||||||||||
| DWS LifeCompass 2015 Fund — Class A | ||||||||||||||||||||
| Years Ended August 31, | ||||||||||||||||||||
| 2012 | 2011 | 2010 | 2009 | 2008 | ||||||||||||||||
| Selected Per Share Data | ||||||||||||||||||||
| Net asset value, beginning of period | $ | 10.57 | $ | 9.70 | $ | 9.39 | $ | 11.12 | $ | 12.47 | ||||||||||
Income (loss) from investment operations: Net investment incomea | .20 | .20 | .20 | .26 | .29 | |||||||||||||||
| Net realized and unrealized gain (loss) | .58 | .85 | .33 | (1.68 | ) | (1.20 | ) | |||||||||||||
| Total from investment operations | .78 | 1.05 | .53 | (1.42 | ) | (.91 | ) | |||||||||||||
Less distributions from: Net investment income | (.21 | ) | (.18 | ) | (.22 | ) | (.31 | ) | (.44 | ) | ||||||||||
| Net asset value, end of period | $ | 11.14 | $ | 10.57 | $ | 9.70 | $ | 9.39 | $ | 11.12 | ||||||||||
Total Return (%)b,c,d | 7.54 | 10.80 | 5.61 | (12.46 | ) | (7.39 | ) | |||||||||||||
| Ratios to Average Net Assets and Supplemental Data | ||||||||||||||||||||
| Net assets, end of period ($ millions) | 58 | 63 | 70 | 77 | 97 | |||||||||||||||
Ratio of expenses before expense reductions (%)e | .66 | .65 | .65 | .69 | .64 | |||||||||||||||
Ratio of expenses after expense reductions (%)e | .58 | .58 | .57 | .48 | .51 | |||||||||||||||
| Ratio of net investment income (%) | 1.83 | 1.88 | 2.02 | 3.05 | 2.37 | |||||||||||||||
| Portfolio turnover rate (%) | 39 | 31 | 51 | 32 | 29 | |||||||||||||||
a Based on average shares outstanding during the period. b Total return does not reflect the effect of any sales charge. c Total return would have been lower had certain expenses not been reduced. d Total return would have been lower if the Advisor had not reduced some Underlying Funds' expenses. e The Fund invests in other Funds and indirectly bears its proportionate share of fees and expenses incurred by the Underlying Funds in which the Fund is invested. This ratio does not include these indirect fees and expenses. | ||||||||||||||||||||
| DWS LifeCompass 2015 Fund — Class B | ||||||||||||||||||||
| Years Ended August 31, | ||||||||||||||||||||
| 2012 | 2011 | 2010 | 2009 | 2008 | ||||||||||||||||
| Selected Per Share Data | ||||||||||||||||||||
| Net asset value, beginning of period | $ | 10.55 | $ | 9.69 | $ | 9.38 | $ | 11.11 | $ | 12.47 | ||||||||||
Income (loss) from investment operations: Net investment incomea | .12 | .12 | .13 | .20 | .19 | |||||||||||||||
| Net realized and unrealized gain (loss) | .59 | .84 | .32 | (1.69 | ) | (1.19 | ) | |||||||||||||
| Total from investment operations | .71 | .96 | .45 | (1.49 | ) | (1.00 | ) | |||||||||||||
Less distributions from: Net investment income | (.13 | ) | (.10 | ) | (.14 | ) | (.24 | ) | (.36 | ) | ||||||||||
| Net asset value, end of period | $ | 11.13 | $ | 10.55 | $ | 9.69 | $ | 9.38 | $ | 11.11 | ||||||||||
Total Return (%)b,c,d | 6.84 | 9.88 | 4.82 | (13.14 | ) | (8.06 | ) | |||||||||||||
| Ratios to Average Net Assets and Supplemental Data | ||||||||||||||||||||
| Net assets, end of period ($ millions) | 1 | 3 | 7 | 10 | 17 | |||||||||||||||
Ratio of expenses before expense reductions (%)e | 1.54 | 1.45 | 1.37 | 1.48 | 1.39 | |||||||||||||||
Ratio of expenses after expense reductions (%)e | 1.33 | 1.33 | 1.32 | 1.23 | 1.26 | |||||||||||||||
| Ratio of net investment income (%) | 1.13 | 1.13 | 1.27 | 2.30 | 1.62 | |||||||||||||||
| Portfolio turnover rate (%) | 39 | 31 | 51 | 32 | 29 | |||||||||||||||
a Based on average shares outstanding during the period. b Total return does not reflect the effect of any sales charge. c Total return would have been lower had certain expenses not been reduced. d Total return would have been lower if the Advisor had not reduced some Underlying Funds' expenses. e The Fund invests in other Funds and indirectly bears its proportionate share of fees and expenses incurred by the Underlying Funds in which the Fund is invested. This ratio does not include these indirect fees and expenses. | ||||||||||||||||||||
| DWS LifeCompass 2015 Fund — Class C | ||||||||||||||||||||
| Years Ended August 31, | ||||||||||||||||||||
| 2012 | 2011 | 2010 | 2009 | �� | 2008 | |||||||||||||||
| Selected Per Share Data | ||||||||||||||||||||
| Net asset value, beginning of period | $ | 10.55 | $ | 9.69 | $ | 9.38 | $ | 11.10 | $ | 12.47 | ||||||||||
Income (loss) from investment operations: Net investment incomea | .12 | .12 | .13 | .20 | .20 | |||||||||||||||
| Net realized and unrealized gain (loss) | .59 | .84 | .32 | (1.68 | ) | (1.20 | ) | |||||||||||||
| Total from investment operations | .71 | .96 | .45 | (1.48 | ) | (1.00 | ) | |||||||||||||
Less distributions from: Net investment income | (.13 | ) | (.10 | ) | (.14 | ) | (.24 | ) | (.37 | ) | ||||||||||
| Net asset value, end of period | $ | 11.13 | $ | 10.55 | $ | 9.69 | $ | 9.38 | $ | 11.10 | ||||||||||
Total Return (%)b,c,d | 6.84 | 9.89 | 4.83 | (13.05 | ) | (8.12 | ) | |||||||||||||
| Ratios to Average Net Assets and Supplemental Data | ||||||||||||||||||||
| Net assets, end of period ($ millions) | 11 | 13 | 15 | 18 | 28 | |||||||||||||||
Ratio of expenses before expense reductions (%)e | 1.38 | 1.36 | 1.34 | 1.41 | 1.33 | |||||||||||||||
Ratio of expenses after expense reductions (%)e | 1.33 | 1.33 | 1.32 | 1.23 | 1.25 | |||||||||||||||
| Ratio of net investment income (%) | 1.10 | 1.13 | 1.28 | 2.30 | 1.63 | |||||||||||||||
| Portfolio turnover rate (%) | 39 | 31 | 51 | 32 | 29 | |||||||||||||||
a Based on average shares outstanding during the period. b Total return does not reflect the effect of any sales charge. c Total return would have been lower had certain expenses not been reduced. d Total return would have been lower if the Advisor had not reduced some Underlying Funds' expenses. e The Fund invests in other Funds and indirectly bears its proportionate share of fees and expenses incurred by the Underlying Funds in which the Fund is invested. This ratio does not include these indirect fees and expenses. | ||||||||||||||||||||
| DWS LifeCompass 2015 Fund — Class S | ||||||||||||||||||||
| Years Ended August 31, | ||||||||||||||||||||
| 2012 | 2011 | 2010 | 2009 | 2008 | ||||||||||||||||
| Selected Per Share Data | ||||||||||||||||||||
| Net asset value, beginning of period | $ | 10.55 | $ | 9.69 | $ | 9.38 | $ | 11.11 | $ | 12.45 | ||||||||||
Income (loss) from investment operations: Net investment incomea | .22 | .23 | .22 | .28 | .32 | |||||||||||||||
| Net realized and unrealized gain (loss) | .60 | .84 | .33 | (1.68 | ) | (1.19 | ) | |||||||||||||
| Total from investment operations | .82 | 1.07 | .55 | (1.40 | ) | (.87 | ) | |||||||||||||
Less distributions from: Net investment income | (.24 | ) | (.21 | ) | (.24 | ) | (.33 | ) | (.47 | ) | ||||||||||
| Net asset value, end of period | $ | 11.13 | $ | 10.55 | $ | 9.69 | $ | 9.38 | $ | 11.11 | ||||||||||
Total Return (%)b,c | 7.92 | 10.98 | 5.89 | (12.25 | ) | (7.10 | ) | |||||||||||||
| Ratios to Average Net Assets and Supplemental Data | ||||||||||||||||||||
| Net assets, end of period ($ millions) | 71 | 70 | 73 | 71 | 100 | |||||||||||||||
Ratio of expenses before expense reductions (%)d | .44 | .42 | .41 | .46 | .41 | |||||||||||||||
Ratio of expenses after expense reductions (%)d | .33 | .33 | .32 | .23 | .26 | |||||||||||||||
| Ratio of net investment income (%) | 2.07 | 2.13 | 2.27 | 3.30 | 2.62 | |||||||||||||||
| Portfolio turnover rate (%) | 39 | 31 | 51 | 32 | 29 | |||||||||||||||
a Based on average shares outstanding during the period. b Total return would have been lower had certain expenses not been reduced. c Total return would have been lower if the Advisor had not reduced some Underlying Funds' expenses. d The Fund invests in other Funds and indirectly bears its proportionate share of fees and expenses incurred by the Underlying Funds in which the Fund is invested. This ratio does not include these indirect fees and expenses. | ||||||||||||||||||||
| DWS LifeCompass 2020 Fund — Class A | ||||||||||||||||||||
| Years Ended August 31, | ||||||||||||||||||||
| 2012 | 2011 | 2010 | 2009 | 2008 | ||||||||||||||||
| Selected Per Share Data | ||||||||||||||||||||
| Net asset value, beginning of period | $ | 12.74 | $ | 11.56 | $ | 11.21 | $ | 13.66 | $ | 15.47 | ||||||||||
Income (loss) from investment operations: Net investment incomea | .22 | .22 | .21 | .27 | .29 | |||||||||||||||
| Net realized and unrealized gain (loss) | .78 | 1.18 | .36 | (2.27 | ) | (1.55 | ) | |||||||||||||
| Total from investment operations | 1.00 | 1.40 | .57 | (2.00 | ) | (1.26 | ) | |||||||||||||
Less distributions from: Net investment income | (.24 | ) | (.22 | ) | (.23 | ) | (.37 | ) | (.55 | ) | ||||||||||
| Net realized gains | — | — | — | (.08 | ) | — | ||||||||||||||
| Total distributions | (.24 | ) | (.22 | ) | (.23 | ) | (.45 | ) | (.55 | ) | ||||||||||
| Increase from regulatory settlements | — | — | .01 | f | — | — | ||||||||||||||
| Net asset value, end of period | $ | 13.50 | $ | 12.74 | $ | 11.56 | $ | 11.21 | $ | 13.66 | ||||||||||
Total Return (%)b,c,d | 8.01 | 12.08 | 5.10 | f | (14.08 | ) | (8.48 | ) | ||||||||||||
| Ratios to Average Net Assets and Supplemental Data | ||||||||||||||||||||
| Net assets, end of period ($ millions) | 80 | 79 | 80 | 77 | 85 | |||||||||||||||
Ratio of expenses before expense reductions (%)e | .63 | .68 | .67 | .71 | .66 | |||||||||||||||
Ratio of expenses after expense reductions (%)e | .59 | .59 | .58 | .49 | .52 | |||||||||||||||
| Ratio of net investment income (%) | 1.69 | 1.70 | 1.82 | 2.63 | 1.96 | |||||||||||||||
| Portfolio turnover rate (%) | 45 | 26 | 50 | 32 | 31 | |||||||||||||||
a Based on average shares outstanding during the period. b Total return does not reflect the effect of any sales charge. c Total return would have been lower had certain expenses not been reduced. d Total return would have been lower if the Advisor had not reduced some Underlying Funds' expenses. e The Fund invests in other Funds and indirectly bears its proportionate share of fees and expenses incurred by the Underlying Funds in which the Fund is invested. This ratio does not include these indirect fees and expenses. f Includes a non-recurring payment from the Advisor which amounted to $0.0004 per share recorded as a result of the Advisor's settlement with the SEC and NY Attorney General in connection with certain trading arrangements. The Fund also received $0.0063 per share of non-affiliated regulatory settlements. Excluding these non-recurring payments, total return would have been 0.06% lower. | ||||||||||||||||||||
| DWS LifeCompass 2020 Fund — Class B | ||||||||||||||||||||
| Years Ended August 31, | ||||||||||||||||||||
| 2012 | 2011 | 2010 | 2009 | 2008 | ||||||||||||||||
| Selected Per Share Data | ||||||||||||||||||||
| Net asset value, beginning of period | $ | 12.62 | $ | 11.45 | $ | 11.11 | $ | 13.53 | $ | 15.32 | ||||||||||
Income (loss) from investment operations: Net investment incomea | .14 | .13 | .13 | .19 | .18 | |||||||||||||||
| Net realized and unrealized gain (loss) | .77 | 1.16 | .34 | (2.24 | ) | (1.54 | ) | |||||||||||||
| Total from investment operations | .91 | 1.29 | .47 | (2.05 | ) | (1.36 | ) | |||||||||||||
Less distributions from: Net investment income | (.14 | ) | (.12 | ) | (.14 | ) | (.29 | ) | (.43 | ) | ||||||||||
| Net realized gains | — | — | — | (.08 | ) | — | ||||||||||||||
| Total distributions | (.14 | ) | (.12 | ) | (.14 | ) | (.37 | ) | (.43 | ) | ||||||||||
| Increase from regulatory settlements | — | — | .01 | f | — | — | ||||||||||||||
| Net asset value, end of period | $ | 13.39 | $ | 12.62 | $ | 11.45 | $ | 11.11 | $ | 13.53 | ||||||||||
Total Return (%)b,d | 7.34 | 11.24 | c | 4.24 | c,f | (14.69 | )c | (9.15 | )c | |||||||||||
| Ratios to Average Net Assets and Supplemental Data | ||||||||||||||||||||
| Net assets, end of period ($ millions) | 3 | 5 | 10 | 14 | 22 | |||||||||||||||
Ratio of expenses before expense reductions (%)e | 1.23 | 1.54 | 1.39 | 1.47 | 1.42 | |||||||||||||||
Ratio of expenses after expense reductions (%)e | 1.23 | 1.34 | 1.33 | 1.24 | 1.28 | |||||||||||||||
| Ratio of net investment income (%) | 1.07 | .95 | 1.07 | 1.88 | 1.20 | |||||||||||||||
| Portfolio turnover rate (%) | 45 | 26 | 50 | 32 | 31 | |||||||||||||||
a Based on average shares outstanding during the period. b Total return does not reflect the effect of any sales charge. c Total return would have been lower had certain expenses not been reduced. d Total return would have been lower if the Advisor had not reduced some Underlying Funds' expenses. e The Fund invests in other Funds and indirectly bears its proportionate share of fees and expenses incurred by the Underlying Funds in which the Fund is invested. This ratio does not include these indirect fees and expenses. f Includes a non-recurring payment from the Advisor which amounted to $0.0004 per share recorded as a result of the Advisor's settlement with the SEC and NY Attorney General in connection with certain trading arrangements. The Fund also received $0.0063 per share of non-affiliated regulatory settlements. Excluding these non-recurring payments, total return would have been 0.06% lower. | ||||||||||||||||||||
| DWS LifeCompass 2020 Fund — Class C | ||||||||||||||||||||
| Years Ended August 31, | ||||||||||||||||||||
| 2012 | 2011 | 2010 | 2009 | 2008 | ||||||||||||||||
| Selected Per Share Data | ||||||||||||||||||||
| Net asset value, beginning of period | $ | 12.63 | $ | 11.45 | $ | 11.11 | $ | 13.54 | $ | 15.32 | ||||||||||
Income (loss) from investment operations: Net investment incomea | .12 | .13 | .13 | .19 | .18 | |||||||||||||||
| Net realized and unrealized gain (loss) | .77 | 1.17 | .34 | (2.25 | ) | (1.52 | ) | |||||||||||||
| Total from investment operations | .89 | 1.30 | .47 | (2.06 | ) | (1.34 | ) | |||||||||||||
Less distributions from: Net investment income | (.14 | ) | (.12 | ) | (.14 | ) | (.29 | ) | (.44 | ) | ||||||||||
| Net realized gains | — | — | — | (.08 | ) | — | ||||||||||||||
| Total distributions | (.14 | ) | (.12 | ) | (.14 | ) | (.37 | ) | (.44 | ) | ||||||||||
| Increase from regulatory settlements | — | — | .01 | f | — | — | ||||||||||||||
| Net asset value, end of period | $ | 13.38 | $ | 12.63 | $ | 11.45 | $ | 11.11 | $ | 13.54 | ||||||||||
Total Return (%)b,d | 7.17 | 11.33 | c | 4.24 | c,f | (14.74 | )c | (9.05 | )c | |||||||||||
| Ratios to Average Net Assets and Supplemental Data | ||||||||||||||||||||
| Net assets, end of period ($ millions) | 14 | 16 | 18 | 21 | 30 | |||||||||||||||
Ratio of expenses before expense reductions (%)e | 1.33 | 1.40 | 1.37 | 1.44 | 1.38 | |||||||||||||||
Ratio of expenses after expense reductions (%)e | 1.33 | 1.34 | 1.33 | 1.24 | 1.27 | |||||||||||||||
| Ratio of net investment income (%) | .95 | .95 | 1.07 | 1.88 | 1.21 | |||||||||||||||
| Portfolio turnover rate (%) | 45 | 26 | 50 | 32 | 31 | |||||||||||||||
a Based on average shares outstanding during the period. b Total return does not reflect the effect of any sales charge. c Total return would have been lower had certain expenses not been reduced. d Total return would have been lower if the Advisor had not reduced some Underlying Funds' expenses. e The Fund invests in other Funds and indirectly bears its proportionate share of fees and expenses incurred by the Underlying Funds in which the Fund is invested. This ratio does not include these indirect fees and expenses. f Includes a non-recurring payment from the Advisor which amounted to $0.0004 per share recorded as a result of the Advisor's settlement with the SEC and NY Attorney General in connection with certain trading arrangements. The Fund also received $0.0063 per share of non-affiliated regulatory settlements. Excluding these non-recurring payments, total return would have been 0.06% lower. | ||||||||||||||||||||
| DWS LifeCompass 2020 Fund — Class S | ||||||||||||||||||||
| Years Ended August 31, | ||||||||||||||||||||
| 2012 | 2011 | 2010 | 2009 | 2008 | ||||||||||||||||
| Selected Per Share Data | ||||||||||||||||||||
| Net asset value, beginning of period | $ | 12.77 | $ | 11.58 | $ | 11.23 | $ | 13.69 | $ | 15.50 | ||||||||||
Income (loss) from investment operations: Net investment incomea | .24 | .25 | .24 | .29 | .32 | |||||||||||||||
| Net realized and unrealized gain (loss) | .78 | 1.19 | .36 | (2.28 | ) | (1.54 | ) | |||||||||||||
| Total from investment operations | 1.02 | 1.44 | .60 | (1.99 | ) | (1.22 | ) | |||||||||||||
Less distributions from: Net investment income | (.27 | ) | (.25 | ) | (.26 | ) | (.39 | ) | (.59 | ) | ||||||||||
| Net realized gains | — | — | — | (.08 | ) | — | ||||||||||||||
| Total distributions | (.27 | ) | (.25 | ) | (.26 | ) | (.47 | ) | (.59 | ) | ||||||||||
| Increase from regulatory settlements | — | — | .01 | e | — | — | ||||||||||||||
| Net asset value, end of period | $ | 13.52 | $ | 12.77 | $ | 11.58 | $ | 11.23 | $ | 13.69 | ||||||||||
Total Return (%)b,c | 8.19 | 12.43 | 5.36 | e | (13.90 | ) | (8.22 | ) | ||||||||||||
| Ratios to Average Net Assets and Supplemental Data | ||||||||||||||||||||
| Net assets, end of period ($ millions) | 105 | 107 | 96 | 96 | 129 | |||||||||||||||
Ratio of expenses before expense reductions (%)d | .42 | .42 | .45 | .51 | .45 | |||||||||||||||
Ratio of expenses after expense reductions (%)d | .34 | .34 | .33 | .24 | .28 | |||||||||||||||
| Ratio of net investment income (%) | 1.87 | 1.95 | 2.07 | 2.88 | 2.20 | |||||||||||||||
| Portfolio turnover rate (%) | 45 | 26 | 50 | 32 | 31 | |||||||||||||||
a Based on average shares outstanding during the period. b Total return would have been lower had certain expenses not been reduced. c Total return would have been lower if the Advisor had not reduced some Underlying Funds' expenses. d The Fund invests in other Funds and indirectly bears its proportionate share of fees and expenses incurred by the Underlying Funds in which the Fund is invested. This ratio does not include these indirect fees and expenses. e Includes a non-recurring payment from the Advisor which amounted to $.0004 per share recorded as a result of the Advisor's settlement with the SEC and NY Attorney General in connection with certain trading arrangements. The Fund also received $.0063 per share of non-affiliated regulatory settlements. Excluding these non-recurring payments, total return would have been 0.06% lower. | ||||||||||||||||||||
| DWS LifeCompass 2030 Fund — Class A | ||||||||||||||||||||
| Years Ended August 31, | ||||||||||||||||||||
| 2012 | 2011 | 2010 | 2009 | 2008 | ||||||||||||||||
| Selected Per Share Data | ||||||||||||||||||||
| Net asset value, beginning of period | $ | 9.10 | $ | 8.04 | $ | 7.87 | $ | 10.26 | $ | 12.27 | ||||||||||
Income (loss) from investment operations: Net investment incomea | .13 | .12 | .11 | .13 | .14 | |||||||||||||||
| Net realized and unrealized gain (loss) | .61 | 1.04 | .18 | (1.94 | ) | (1.32 | ) | |||||||||||||
| Total from investment operations | .74 | 1.16 | .29 | (1.81 | ) | (1.18 | ) | |||||||||||||
Less distributions from: Net investment income | (.13 | ) | (.10 | ) | (.12 | ) | (.11 | ) | (.38 | ) | ||||||||||
| Net realized gains | — | — | — | (.47 | ) | (.45 | ) | |||||||||||||
| Total distributions | (.13 | ) | (.10 | ) | (.12 | ) | (.58 | ) | (.83 | ) | ||||||||||
| Net asset value, end of period | $ | 9.71 | $ | 9.10 | $ | 8.04 | $ | 7.87 | $ | 10.26 | ||||||||||
Total Return (%)b,c,d | 8.26 | 14.44 | 3.63 | (16.57 | ) | (10.40 | ) | |||||||||||||
| Ratios to Average Net Assets and Supplemental Data | ||||||||||||||||||||
| Net assets, end of period ($ millions) | 41 | 38 | 40 | 31 | 23 | |||||||||||||||
Ratio of expenses before expense reductions (%)e | .80 | .80 | .85 | 1.17 | .99 | |||||||||||||||
Ratio of expenses after expense reductions (%)e | .58 | .58 | .55 | .45 | .47 | |||||||||||||||
| Ratio of net investment income (%) | 1.39 | 1.30 | 1.33 | 1.83 | 1.27 | |||||||||||||||
| Portfolio turnover rate (%) | 46 | 32 | 44 | 40 | 30 | |||||||||||||||
a Based on average shares outstanding during the period. b Total return does not reflect the effect of any sales charge. c Total return would have been lower had certain expenses not been reduced. d Total return would have been lower if the Advisor had not reduced some Underlying Funds' expenses. e The Fund invests in other Funds and indirectly bears its proportionate share of fees and expenses incurred by the Underlying Funds in which the Fund is invested. This ratio does not include these indirect fees and expenses. | ||||||||||||||||||||
| DWS LifeCompass 2030 Fund — Class B | ||||||||||||||||||||
| Years Ended August 31, | ||||||||||||||||||||
| 2012 | 2011 | 2010 | 2009 | 2008 | ||||||||||||||||
| Selected Per Share Data | ||||||||||||||||||||
| Net asset value, beginning of period | $ | 9.06 | $ | 8.02 | $ | 7.84 | $ | 10.21 | $ | 12.21 | ||||||||||
Income (loss) from investment operations: Net investment incomea | .06 | .05 | .05 | .08 | .06 | |||||||||||||||
| Net realized and unrealized gain (loss) | .61 | 1.02 | .19 | (1.92 | ) | (1.33 | ) | |||||||||||||
| Total from investment operations | .67 | 1.07 | .24 | (1.84 | ) | (1.27 | ) | |||||||||||||
Less distributions from: Net investment income | (.06 | ) | (.03 | ) | (.06 | ) | (.06 | ) | (.28 | ) | ||||||||||
| Net realized gains | — | — | — | (.47 | ) | (.45 | ) | |||||||||||||
| Total distributions | (.06 | ) | (.03 | ) | (.06 | ) | (.53 | ) | (.73 | ) | ||||||||||
| Net asset value, end of period | $ | 9.67 | $ | 9.06 | $ | 8.02 | $ | 7.84 | $ | 10.21 | ||||||||||
Total Return (%)b,c,d | 7.48 | 13.36 | 2.98 | (17.11 | ) | (11.09 | ) | |||||||||||||
| Ratios to Average Net Assets and Supplemental Data | ||||||||||||||||||||
| Net assets, end of period ($ millions) | 1 | 1 | 2 | 2 | 3 | |||||||||||||||
Ratio of expenses before expense reductions (%)e | 1.55 | 1.56 | 1.63 | 2.07 | 1.80 | |||||||||||||||
Ratio of expenses after expense reductions (%)e | 1.33 | 1.33 | 1.30 | 1.20 | 1.22 | |||||||||||||||
| Ratio of net investment income (%) | .63 | .55 | .59 | 1.08 | .51 | |||||||||||||||
| Portfolio turnover rate (%) | 46 | 32 | 44 | 40 | 30 | |||||||||||||||
a Based on average shares outstanding during the period. b Total return does not reflect the effect of any sales charge. c Total return would have been lower had certain expenses not been reduced. d Total return would have been lower if the Advisor had not reduced some Underlying Funds' expenses. e The Fund invests in other Funds and indirectly bears its proportionate share of fees and expenses incurred by the Underlying Funds in which the Fund is invested. This ratio does not include these indirect fees and expenses. | ||||||||||||||||||||
| DWS LifeCompass 2030 Fund — Class C | ||||||||||||||||||||
| Years Ended August 31, | ||||||||||||||||||||
| 2012 | 2011 | 2010 | 2009 | 2008 | ||||||||||||||||
| Selected Per Share Data | ||||||||||||||||||||
| Net asset value, beginning of period | $ | 9.06 | $ | 8.01 | $ | 7.83 | $ | 10.21 | $ | 12.21 | ||||||||||
Income (loss) from investment operations: Net investment incomea | .06 | .05 | .05 | .08 | .06 | |||||||||||||||
| Net realized and unrealized gain (loss) | .61 | 1.03 | .19 | (1.93 | ) | (1.33 | ) | |||||||||||||
| Total from investment operations | .67 | 1.08 | .24 | (1.85 | ) | (1.27 | ) | |||||||||||||
Less distributions from: Net investment income | (.06 | ) | (.03 | ) | (.06 | ) | (.06 | ) | (.28 | ) | ||||||||||
| Net realized gains | — | — | — | (.47 | ) | (.45 | ) | |||||||||||||
| Total distributions | (.06 | ) | (.03 | ) | (.06 | ) | (.53 | ) | (.73 | ) | ||||||||||
| Net asset value, end of period | $ | 9.67 | $ | 9.06 | $ | 8.01 | $ | 7.83 | $ | 10.21 | ||||||||||
Total Return (%)b,c,d | 7.48 | 13.50 | 2.99 | (17.22 | ) | (11.09 | ) | |||||||||||||
| Ratios to Average Net Assets and Supplemental Data | ||||||||||||||||||||
| Net assets, end of period ($ millions) | 5 | 5 | 5 | 6 | 8 | |||||||||||||||
Ratio of expenses before expense reductions (%)e | 1.48 | 1.50 | 1.54 | 1.96 | 1.74 | |||||||||||||||
Ratio of expenses after expense reductions (%)e | 1.33 | 1.33 | 1.30 | 1.20 | 1.23 | |||||||||||||||
| Ratio of net investment income (%) | .61 | .55 | .59 | 1.08 | .51 | |||||||||||||||
| Portfolio turnover rate (%) | 46 | 32 | 44 | 40 | 30 | |||||||||||||||
a Based on average shares outstanding during the period. b Total return does not reflect the effect of any sales charge. c Total return would have been lower had certain expenses not been reduced. d Total return would have been lower if the Advisor had not reduced some Underlying Funds' expenses. e The Fund invests in other Funds and indirectly bears its proportionate share of fees and expenses incurred by the Underlying Funds in which the Fund is invested. This ratio does not include these indirect fees and expenses. | ||||||||||||||||||||
| DWS LifeCompass 2030 Fund — Class S | ||||||||||||||||||||
| Years Ended August 31, | ||||||||||||||||||||
| 2012 | 2011 | 2010 | 2009 | 2008 | ||||||||||||||||
| Selected Per Share Data | ||||||||||||||||||||
| Net asset value, beginning of period | $ | 9.11 | $ | 8.05 | $ | 7.87 | $ | 10.27 | $ | 12.29 | ||||||||||
Income (loss) from investment operations: Net investment incomea | .15 | .15 | .13 | .15 | .17 | |||||||||||||||
| Net realized and unrealized gain (loss) | .61 | 1.04 | .19 | (1.95 | ) | (1.33 | ) | |||||||||||||
| Total from investment operations | .76 | 1.19 | .32 | (1.80 | ) | (1.16 | ) | |||||||||||||
Less distributions from: Net investment income | (.15 | ) | (.13 | ) | (.14 | ) | (.13 | ) | (.41 | ) | ||||||||||
| Net realized gains | — | — | — | (.47 | ) | (.45 | ) | |||||||||||||
| Total distributions | (.15 | ) | (.13 | ) | (.14 | ) | (.60 | ) | (.86 | ) | ||||||||||
| Net asset value, end of period | $ | 9.72 | $ | 9.11 | $ | 8.05 | $ | 7.87 | $ | 10.27 | ||||||||||
Total Return (%)b,c | 8.52 | 14.72 | 4.02 | (16.43 | ) | (10.23 | ) | |||||||||||||
| Ratios to Average Net Assets and Supplemental Data | ||||||||||||||||||||
| Net assets, end of period ($ millions) | 21 | 18 | 11 | 7 | 6 | |||||||||||||||
Ratio of expenses before expense reductions (%)d | .55 | .55 | .59 | .97 | .77 | |||||||||||||||
Ratio of expenses after expense reductions (%)d | .33 | .33 | .30 | .20 | .21 | |||||||||||||||
| Ratio of net investment income (%) | 1.58 | 1.55 | 1.58 | 2.08 | 1.52 | |||||||||||||||
| Portfolio turnover rate (%) | 46 | 32 | 44 | 40 | 30 | |||||||||||||||
a Based on average shares outstanding during the period. b Total return would have been lower had certain expenses not been reduced. c Total return would have been lower if the Advisor had not reduced some Underlying Funds' expenses. d The Fund invests in other Funds and indirectly bears its proportionate share of fees and expenses incurred by the Underlying Funds in which the Fund is invested. This ratio does not include these indirect fees and expenses. | ||||||||||||||||||||
| DWS LifeCompass 2040 Fund — Class A | ||||||||||||||||||||
| Years Ended August 31, | Period Ended 8/31/08a | |||||||||||||||||||
| 2012 | 2011 | 2010 | 2009 | |||||||||||||||||
| Selected Per Share Data | ||||||||||||||||||||
| Net asset value, beginning of period | $ | 7.92 | $ | 7.14 | $ | 6.97 | $ | 8.77 | $ | 10.00 | ||||||||||
Income (loss) from investment operations: Net investment incomeb | .10 | .09 | .08 | .08 | .06 | |||||||||||||||
| Net realized and unrealized gain (loss) | .51 | .94 | .17 | (1.74 | ) | (.96 | ) | |||||||||||||
| Total from investment operations | .61 | 1.03 | .25 | (1.66 | ) | (.90 | ) | |||||||||||||
Less distributions from: Net investment income | (.10 | ) | (.09 | ) | (.08 | ) | (.05 | ) | (.33 | ) | ||||||||||
| Net realized gains | (.17 | ) | (.16 | ) | — | (.09 | ) | — | ||||||||||||
| Total distributions | (.27 | ) | (.25 | ) | (.08 | ) | (.14 | ) | (.33 | ) | ||||||||||
| Net asset value, end of period | $ | 8.26 | $ | 7.92 | $ | 7.14 | $ | 6.97 | $ | 8.77 | ||||||||||
Total Return (%)c,d,e | 8.04 | 14.34 | 3.58 | (18.67 | ) | (9.24 | )** | |||||||||||||
| Ratios to Average Net Assets and Supplemental Data | ||||||||||||||||||||
| Net assets, end of period ($ millions) | 22 | 17 | 17 | 9 | 2 | |||||||||||||||
Ratio of expenses before expense reductions (%)f | .93 | 1.02 | 1.22 | 2.90 | 7.14 | * | ||||||||||||||
Ratio of expenses after expense reductions (%)f | .55 | .55 | .54 | .49 | .49 | * | ||||||||||||||
| Ratio of net investment income (%) | 1.28 | 1.11 | 1.12 | 1.32 | .86 | * | ||||||||||||||
| Portfolio turnover rate (%) | 38 | 33 | 39 | 30 | 17 | ** | ||||||||||||||
a For the period from November 15, 2007 (commencement of operations) to August 31, 2008. b Based on average shares outstanding during the period. c Total return does not reflect the effect of any sales charge. d Total return would have been lower had certain expenses not been reduced. e Total return would have been lower if the Advisor had not reduced some Underlying Funds' expenses. f The Fund invests in other Funds and indirectly bears its proportionate share of fees and expenses incurred by the Underlying Funds in which the Fund is invested. This ratio does not include these indirect fees and expenses. * Annualized ** Not annualized | ||||||||||||||||||||
| DWS LifeCompass 2040 Fund — Class C | ||||||||||||||||||||
| Years Ended August 31, | Period Ended 8/31/08a | |||||||||||||||||||
| 2012 | 2011 | 2010 | 2009 | |||||||||||||||||
| Selected Per Share Data | ||||||||||||||||||||
| Net asset value, beginning of period | $ | 7.89 | $ | 7.11 | $ | 6.94 | $ | 8.73 | $ | 10.00 | ||||||||||
Income (loss) from investment operations: Net investment incomeb | .04 | .03 | .03 | .04 | .01 | |||||||||||||||
| Net realized and unrealized gain (loss) | .52 | .94 | .17 | (1.73 | ) | (.96 | ) | |||||||||||||
| Total from investment operations | .56 | .97 | .20 | (1.69 | ) | (.95 | ) | |||||||||||||
Less distributions from: Net investment income | (.05 | ) | (.03 | ) | (.03 | ) | (.01 | ) | (.32 | ) | ||||||||||
| Net realized gains | (.17 | ) | (.16 | ) | — | (.09 | ) | — | ||||||||||||
| Total distributions | (.22 | ) | (.19 | ) | (.03 | ) | (.10 | ) | (.32 | ) | ||||||||||
| Net asset value, end of period | $ | 8.23 | $ | 7.89 | $ | 7.11 | $ | 6.94 | $ | 8.73 | ||||||||||
Total Return (%)c,d,e | 7.25 | 13.53 | 2.81 | (19.43 | ) | (9.54 | )** | |||||||||||||
| Ratios to Average Net Assets and Supplemental Data | ||||||||||||||||||||
| Net assets, end of period ($ millions) | .2 | .2 | .2 | .2 | .3 | |||||||||||||||
Ratio of expenses before expense reductions (%)f | 1.75 | 1.84 | 2.20 | 3.86 | 7.87 | * | ||||||||||||||
Ratio of expenses after expense reductions (%)f | 1.30 | 1.30 | 1.28 | 1.24 | 1.24 | * | ||||||||||||||
| Ratio of net investment income (%) | .51 | .36 | .37 | .57 | .11 | * | ||||||||||||||
| Portfolio turnover rate (%) | 38 | 33 | 39 | 30 | 17 | ** | ||||||||||||||
a For the period from November 15, 2007 (commencement of operations) to August 31, 2008. b Based on average shares outstanding during the period. c Total return does not reflect the effect of any sales charge. d Total return would have been lower had certain expenses not been reduced. e Total return would have been lower if the Advisor had not reduced some Underlying Funds' expenses. f The Fund invests in other Funds and indirectly bears its proportionate share of fees and expenses incurred by the Underlying Funds in which the Fund is invested. This ratio does not include these indirect fees and expenses. * Annualized ** Not annualized | ||||||||||||||||||||
| DWS LifeCompass 2040 Fund — Class S | ||||||||||||||||||||
| Years Ended August 31, | Period Ended 8/31/08a | |||||||||||||||||||
| 2012 | 2011 | 2010 | 2009 | |||||||||||||||||
| Selected Per Share Data | ||||||||||||||||||||
| Net asset value, beginning of period | $ | 7.94 | $ | 7.16 | $ | 6.99 | $ | 8.79 | $ | 10.00 | ||||||||||
Income (loss) from investment operations: Net investment incomeb | .12 | .11 | .10 | .10 | .08 | |||||||||||||||
| Net realized and unrealized gain (loss) | .52 | .94 | .17 | (1.74 | ) | (.96 | ) | |||||||||||||
| Total from investment operations | .64 | 1.05 | .27 | (1.64 | ) | (.88 | ) | |||||||||||||
Less distributions from: Net investment income | (.12 | ) | (.11 | ) | (.10 | ) | (.07 | ) | (.33 | ) | ||||||||||
| Net realized gains | (.17 | ) | (.16 | ) | — | (.09 | ) | — | ||||||||||||
| Total distributions | (.29 | ) | (.27 | ) | (.10 | ) | (.16 | ) | (.33 | ) | ||||||||||
| Net asset value, end of period | $ | 8.29 | $ | 7.94 | $ | 7.16 | $ | 6.99 | $ | 8.79 | ||||||||||
Total Return (%)c,d | 8.43 | 14.60 | 3.83 | (18.32 | ) | (9.11 | )** | |||||||||||||
| Ratios to Average Net Assets and Supplemental Data | ||||||||||||||||||||
| Net assets, end of period ($ millions) | 18 | 14 | 8 | 4 | 2 | |||||||||||||||
Ratio of expenses before expense reductions (%)e | .68 | .77 | .99 | 2.70 | 6.98 | * | ||||||||||||||
Ratio of expenses after expense reductions (%)e | .30 | .30 | .29 | .24 | .24 | * | ||||||||||||||
| Ratio of net investment income (%) | 1.45 | 1.36 | 1.37 | 1.57 | 1.11 | * | ||||||||||||||
| Portfolio turnover rate (%) | 38 | 33 | 39 | 30 | 17 | ** | ||||||||||||||
a For the period from November 15, 2007 (commencement of operations) to August 31, 2008. b Based on average shares outstanding during the period. c Total return would have been lower had certain expenses not been reduced. d Total return would have been lower if the Advisor had not reduced some Underlying Funds' expenses. e The Fund invests in other Funds and indirectly bears its proportionate share of fees and expenses incurred by the Underlying Funds in which the Fund is invested. This ratio does not include these indirect fees and expenses. * Annualized ** Not annualized | ||||||||||||||||||||
A. Organization and Significant Accounting Policies
DWS LifeCompass Retirement Fund, DWS LifeCompass 2015 Fund, DWS LifeCompass 2020 Fund, DWS LifeCompass 2030 Fund and DWS LifeCompass 2040 Fund (hereinafter referred to individually as "Fund" or collectively as "Funds") are each a diversified series of DWS Target Date Series (the "Trust"), which is registered under the Investment Company Act of 1940, as amended (the "1940 Act"), as an open-end management investment company organized as a Massachusetts business trust. The Funds mainly invest in other affiliated DWS funds (the "Underlying DWS Funds") and non-affiliated exchange-traded funds ("ETFs"). ETFs and Underlying DWS Funds are collectively referred to as "Underlying Funds." Each Underlying DWS Fund's accounting policies and investment holdings are outlined in the Underlying DWS Funds' financial statements and are available upon request.
Each Fund offers multiple classes of shares which provide investors with different purchase options. Class A shares are offered to investors subject to an initial sales charge. Class B shares of the Fund are closed to new purchases, except exchanges or the reinvestment of dividends or other distributions. Class B shares were offered to investors without an initial sales charge and are subject to higher ongoing expenses than Class A shares and a contingent deferred sales charge payable upon certain redemptions. Class B shares automatically convert to Class A shares six years after issuance. Class C shares are offered to investors without an initial sales charge but are subject to higher ongoing expenses than Class A shares and a contingent deferred sales charge payable upon certain redemptions within one year of purchase. Class C shares do not automatically convert into another class. Class S shares are not subject to initial or contingent deferred sales charges and are generally not available to new investors except under certain circumstances.
Investment income, realized and unrealized gains and losses, and certain fund-level expenses and expense reductions, if any, are borne pro rata on the basis of relative net assets by the holders of all classes of shares, except that each class bears certain expenses unique to that class such as services to shareholders, distribution and service fees and certain other class-specific expenses. Differences in class-level expenses may result in payment of different per share dividends by class. All shares of each Fund have equal rights with respect to voting subject to class-specific arrangements.
The Funds' financial statements are prepared in accordance with accounting principles generally accepted in the United States of America which require the use of management estimates. Actual results could differ from those estimates. The policies described below are followed consistently by each Fund in the preparation of its financial statements.
Security Valuation. Investments are stated at value determined as of the close of regular trading on the New York Stock Exchange on each day the exchange is open for trading.
Various inputs are used in determining the value of each Fund's investments. These inputs are summarized in three broad levels. Level 1 includes quoted prices in active markets for identical securities. Level 2 includes other significant observable inputs (including quoted prices for similar securities, interest rates, prepayment speeds, and credit risk). Level 3 includes significant unobservable inputs (including each Fund's own assumptions in determining the fair value of investments). The inputs or methodology used for valuing securities are not necessarily an indication of the risk associated with investing in those securities.
Investments in the Underlying DWS Funds are valued at the net asset value per share of each class of the Underlying DWS Funds and are categorized as Level 1.
ETFs are valued at the most recent sale price or official closing price reported on the exchange (U.S. or foreign) or over-the-counter market on which they trade and are categorized as Level 1 securities. ETFs for which no sales are reported are valued at the calculated mean between the most recent bid and asked quotations on the relevant market or, if a mean cannot be determined, at the most recent bid quotation.
Disclosure about the classification of fair value measurements is included in a table following each Fund's Investment Portfolio.
New Accounting Pronouncement. In December 2011, Accounting Standards Update 2011-11 (ASU 2011-11), Disclosures about Offsetting Assets and Liabilities, was issued and is effective for fiscal years beginning on or after January 1, 2013, and interim periods within those annual periods. ASU 2011-11 is intended to enhance disclosure requirements on the offsetting of financial assets and liabilities. Management is currently evaluating the application of ASU 2011-11 and its impact, if any, on the Fund's financial statements.
Federal Income Taxes. Each Fund's policy is to comply with the requirements of the Internal Revenue Code, as amended, which are applicable to regulated investment companies, and to distribute all of its taxable income to its shareholders. Each Fund is treated as a single corporate taxpayer.
Under the Regulated Investment Company Modernization Act of 2010, net capital losses may be carried forward indefinitely, and their character is retained as short-term and/or long-term. Previously, net capital losses were carried forward for eight years and treated as short-term. As a transition rule, the Act requires that post-enactment net capital losses be used before pre-enactment net capital losses.
At August 31, 2012, DWS LifeCompass Retirement Fund had a net tax basis capital loss carryforward of approximately $13,206,000 of pre-enactment losses, which may be applied against any realized net taxable capital gains of each succeeding year until fully utilized or until August 31, 2018, ($12,626,000) and August 31, 2019 ($580,000), the respective expiration dates, whichever occurs first.
In addition, from November 1, 2011 through August 31, 2012, the Fund elects to defer qualified late year losses of approximately $309,000 of net short-term realized capital losses and treat them as arising in the fiscal year ending August 31, 2013.
At August 31, 2012, DWS LifeCompass 2015 Fund had a net tax basis capital loss carryforward of approximately $41,942,000 of pre-enactment losses, which may be applied against any realized net taxable capital gains of each succeeding year until fully utilized or until August 31, 2017 ($2,422,000), August 31, 2018 ($29,353,000) and August 31, 2019 ($10,167,000), the respective expiration dates, whichever occurs first.
In addition, from November 1, 2011 through August 31, 2012, the Fund elects to defer qualified late year losses of approximately $60,000 of net short-term realized capital losses and treat them as arising in the fiscal year ending August 31, 2013.
At August 31, 2012, DWS LifeCompass 2020 Fund had a net tax basis capital loss carryforward of approximately $31,163,000 of pre-enactment losses, which may be applied against any realized net taxable capital gains of each succeeding year until fully utilized or until August 31, 2018 ($21,737,000) and August 31, 2019 ($9,426,000), the respective expiration dates, whichever occurs first.
In addition, from November 1, 2011 through August 31,2012, the Fund elects to defer qualified late year losses of approximately $266,000 of net short-term realized capital losses and treat them as arising in the fiscal year ending August 31, 2013.
At August 31, 2012, DWS LifeCompass 2030 Fund had a net tax basis capital loss carryforward of approximately $3,299,000 of pre-enactment losses, which may be applied against any realized net taxable capital gains of each succeeding year until fully utilized or until August 31, 2018 ($2,386,000) and August 31, 2019 ($913,000), the respective expiration dates, whichever occurs first.
In addition, from November 1, 2011 through August 31, 2012, the Fund elects to defer qualified late year losses of approximately $160,000 of net short-term realized capital losses and treat them as arising in the fiscal year ending August 31, 2013.
The Funds have reviewed the tax positions for the open tax years as of August 31, 2012 and have determined that no provision for income tax is required in the Funds' financial statements. The Funds' federal tax returns for the prior three fiscal years remain open subject to examination by the Internal Revenue Service.
Distribution of Income and Gains. Net investment income from DWS LifeCompass Retirement Fund and DWS LifeCompass 2015 Fund, if any, is declared and distributed to shareholders quarterly. Net investment income from DWS LifeCompass 2020 Fund, DWS LifeCompass 2030 Fund and DWS LifeCompass 2040 Fund, if any, is declared and distributed to shareholders annually. Net realized gains from investment transactions, in excess of available capital loss carryforwards, would be taxable to each Fund if not distributed and, therefore, will be distributed to shareholders at least annually. The Funds may also make additional distributions for tax purposes if necessary.
The timing and characterization of certain income and capital gain distributions are determined annually in accordance with federal tax regulations which may differ from accounting principles generally accepted in the United States of America. These differences primarily relate to certain securities sold at a loss. As a result, net investment income (loss) and net realized gain (loss) on investment transactions for a reporting period may differ significantly from distributions during such period. Accordingly, each Fund may periodically make reclassifications among certain of its capital accounts without impacting the net asset value of a Fund.
At August 31, 2012, DWS LifeCompass Retirement Fund's components of distributable earnings (accumulated losses) on a tax basis are as follows:
| Undistributed ordinary income* | $ | 536,594 | ||
| Capital loss carryforwards | $ | (13,206,000 | ) | |
| Net unrealized appreciation (depreciation) on investments | $ | 1,234,989 |
In addition, during the years ended August 31, 2012 and August 31, 2011, the tax character of distributions paid to shareholders by DWS LifeCompass Retirement Fund is summarized as follows:
| Years Ended August 31, | ||||||||
| 2012 | 2011 | |||||||
| Distributions from ordinary income* | $ | 1,778,565 | $ | 1,998,573 | ||||
* For tax purposes, short-term capital gain distributions are considered ordinary income distributions.
At August 31, 2012, DWS LifeCompass 2015 Fund's components of distributable earnings (accumulated losses) on a tax basis are as follows:
| Undistributed ordinary income* | $ | 456,024 | ||
| Capital loss carryforwards | $ | (41,942,000 | ) | |
| Net unrealized appreciation (depreciation) on investments | $ | 3,153,263 |
In addition, during the years ended August 31, 2012 and August 31, 2011, the tax character of distributions paid to shareholders by DWS LifeCompass 2015 Fund is summarized as follows:
| Years Ended August 31, | ||||||||
| 2012 | 2011 | |||||||
| Distributions from ordinary income* | $ | 2,953,667 | $ | 2,818,033 | ||||
* For tax purposes, short-term capital gain distributions are considered ordinary income distributions.
At August 31, 2012, DWS LifeCompass 2020 Fund's components of distributable earnings (accumulated losses) on a tax basis are as follows:
| Undistributed ordinary income* | $ | 3,080,482 | ||
| Capital loss carryforwards | $ | (31,163,000 | ) | |
| Net unrealized appreciation (depreciation) on investments | $ | 5,844,855 |
In addition, during the years ended August 31, 2012 and August 31, 2011, the tax character of distributions paid to shareholders by DWS LifeCompass 2020 Fund is summarized as follows:
| Years Ended August 31, | ||||||||
| 2012 | 2011 | |||||||
| Distributions from ordinary income* | $ | 4,001,151 | $ | 3,799,053 | ||||
* For tax purposes, short-term capital gain distributions are considered ordinary income distributions.
At August 31, 2012, DWS LifeCompass 2030 Fund's components of distributable earnings (accumulated losses) on a tax basis are as follows:
| Undistributed ordinary income* | $ | 472,687 | ||
| Capital loss carryforwards | $ | (3,299,000 | ) | |
| Net unrealized appreciation (depreciation) on investments | $ | 3,997,276 |
In addition, during the years ended August 31, 2012 and August 31, 2011, the tax character of distributions paid to shareholders by DWS LifeCompass 2030 Fund is summarized as follows:
| Years Ended August 31, | ||||||||
| 2012 | 2011 | |||||||
| Distributions from ordinary income* | $ | 928,996 | $ | 699,920 | ||||
* For tax purposes, short-term capital gain distributions are considered ordinary income distributions.
At August 31, 2012, DWS LifeCompass 2040 Fund's components of distributable earnings (accumulated losses) on a tax basis are as follows:
| Undistributed ordinary income* | $ | 114,452 | ||
| Undistributed long-term capital gains | $ | 296,590 | ||
| Net unrealized appreciation (depreciation) on investments | $ | 3,681,677 |
In addition, during the years ended August 31, 2012 and August 31, 2011, the tax character of distributions paid to shareholders by DWS LifeCompass 2040 Fund is summarized as follows:
| Years Ended August 31, | ||||||||
| 2012 | 2011 | |||||||
| Distributions from ordinary income* | $ | 639,400 | $ | 356,600 | ||||
| Distributions from long-term capital gains | $ | 607,635 | $ | 488,622 | ||||
* For tax purposes, short-term capital gain distributions are considered ordinary income distributions.
Contingencies. In the normal course of business, the Funds may enter into contracts with service providers that contain general indemnification clauses. The Funds' maximum exposure under these arrangements is unknown as this would involve future claims that may be made against the Funds that have not yet been made. However, based on experience, the Funds expect the risk of loss to be remote.
Other. Investment transactions are accounted for on a trade date plus one basis for daily net asset value calculations. However, for financial reporting purposes, investment transactions are reported on trade date. Interest income is recorded on the accrual basis. Distributions of income and capital gains from the Underlying Funds are recorded on the ex-dividend date. Dividend income is recorded on the ex-dividend date.
B. Related Parties
Management Agreement. Under the Investment Management Agreement with Deutsche Investment Management Americas Inc. ("DIMA" or the "Advisor"), an indirect, wholly owned subsidiary of Deutsche Bank AG, the Advisor directs the investments of each Fund in accordance with its investment objectives, policies and restrictions. The Advisor determines the securities, instruments and other contracts relating to investments to be purchased, sold or entered into by each Fund or delegates such responsibility to the Fund's subadvisor.
QS Investors, LLC ("QS Investors") acts as investment subadvisor to the Funds. As an investment subadvisor to the Funds, QS Investors renders strategic asset allocation services to the Funds. QS Investors is paid by the Advisor for the services QS Investors provides to the Funds.
The Funds do not invest in the Underlying DWS Funds for the purpose of exercising management or control; however, investments within the set limits may represent 5% or more of an Underlying DWS Fund's outstanding shares. At August 31, 2012, DWS LifeCompass Retirement Fund held 5% or greater of the following Underlying DWS Fund's outstanding shares: approximately 6% of DWS Enhanced Global Bond Fund, 5% of DWS Core Fixed Income Fund and 5% of DWS US Bond Index Fund. At August 31, 2012, DWS LifeCompass 2015 Fund held 5% or greater of the following Underlying DWS Funds' outstanding shares: approximately 6% of DWS Core Fixed Income Fund, 6% of DWS U.S. Bond Index Fund, 5% of DWS Enhanced Global Bond Fund and 5% of DWS Diversified International Equity Fund. At August 31, 2012, DWS LifeCompass 2020 Fund held 5% or greater of the following Underlying DWS Funds' outstanding shares: approximately 10% of DWS Diversified International Equity Fund, 6% of DWS Core Fixed Income Fund, 6% of DWS U.S. Bond Index Fund and 5% of DWS Enhanced Global Bond Fund. At August 31, 2012, DWS LifeCompass 2030 Fund and DWS LifeCompass 2040 Fund did not invest in more than 5% of any Underlying DWS Fund.
For the period from September 1, 2011 through November 30, 2012, the Advisor has contractually agreed to reimburse or pay certain operating expenses to the extent necessary to maintain the Funds' operating expenses (excluding certain expenses such as extraordinary expenses, taxes, brokerage, interest and indirect expenses of Underlying Funds) as a percentage of average daily net assets as follows:
| LifeCompass Retirement Fund | LifeCompass 2015 Fund | LifeCompass 2020 Fund | LifeCompass 2030 Fund | LifeCompass 2040 Fund | |
| Class A | .62% | .58% | .59% | .58% | .55% |
| Class B | 1.37% | 1.33% | 1.34% | 1.33% | — |
| Class C | 1.37% | 1.33% | 1.34% | 1.33% | 1.30% |
| Class S | .37% | .33% | .34% | .33% | .30% |
Each Fund indirectly bears its proportionate share of fees and expenses incurred by the Underlying DWS Funds and ETFs in which it is invested.
Administration Fee. Pursuant to an Administrative Services Agreement, DIMA provides most administrative services to the Funds. For all services provided under the Administrative Services Agreement, the Funds pay DIMA an annual fee ("Administration Fee") of 0.10% of each Fund's average daily net assets, computed and accrued daily and payable monthly. For the year ended August 31, 2012, the Administration Fee for each Fund was as follows:
| Administration Fee | Total Aggregated | Waived | Unpaid at August 31, 2012 | |||||||||
| DWS LifeCompass Retirement Fund | $ | 86,859 | $ | — | $ | 7,189 | ||||||
| DWS LifeCompass 2015 Fund | $ | 144,135 | $ | — | $ | 12,014 | ||||||
| DWS LifeCompass 2020 Fund | $ | 210,711 | $ | — | $ | 17,097 | ||||||
| DWS LifeCompass 2030 Fund | $ | 64,839 | $ | — | $ | 5,681 | ||||||
| DWS LifeCompass 2040 Fund | $ | 36,188 | $ | 36,188 | $ | — | ||||||
Service Provider Fees. DWS Investments Service Company ("DISC"), an affiliate of the Advisor, is the transfer agent, dividend-paying agent and shareholder service agent for the Funds. Pursuant to a sub-transfer agency agreement between DISC and DST Systems, Inc. ("DST"), DISC has delegated certain transfer agent, dividend-paying agent and shareholder service agent functions to DST. DISC compensates DST out of the shareholder servicing fee it receives from the Funds. For the year ended August 31, 2012, the amounts charged to the Funds by DISC were as follows:
| Services to Shareholders | Total Aggregated | Waived | Unpaid at August 31, 2012 | |||||||||
| DWS LifeCompass Retirement Fund | ||||||||||||
| Class A | $ | 46,991 | $ | 29,023 | $ | 8,868 | ||||||
| Class B | 1,052 | 1,052 | — | |||||||||
| Class C | 4,938 | 3,395 | 299 | |||||||||
| Class S | 88,087 | 44,755 | 7,509 | |||||||||
| $ | 141,068 | $ | 78,225 | $ | 16,676 | |||||||
| DWS LifeCompass 2015 Fund | ||||||||||||
| Class A | $ | 101,699 | $ | 47,386 | $ | 16,807 | ||||||
| Class B | 4,597 | 4,392 | 205 | |||||||||
| Class C | 10,193 | 5,356 | 1,112 | |||||||||
| Class S | 152,915 | 79,970 | 17,420 | |||||||||
| $ | 269,404 | $ | 137,104 | $ | 35,544 | |||||||
| DWS LifeCompass 2020 Fund | ||||||||||||
| Class A | $ | 126,426 | $ | 28,172 | $ | 38,280 | ||||||
| Class B | 1,208 | — | 1,208 | |||||||||
| Class C | 11,176 | — | 5,462 | |||||||||
| Class S | 248,296 | 94,938 | 22,305 | |||||||||
| $ | 387,106 | $ | 123,110 | $ | 67,255 | |||||||
| DWS LifeCompass 2030 Fund | ||||||||||||
| Class A | $ | 89,429 | $ | 85,504 | $ | 360 | ||||||
| Class B | 2,088 | 2,088 | — | |||||||||
| Class C | 5,306 | 5,306 | — | |||||||||
| Class S | 46,570 | 44,818 | — | |||||||||
| $ | 143,393 | $ | 137,716 | $ | 360 | |||||||
| DWS LifeCompass 2040 Fund | ||||||||||||
| Class A | $ | 48,568 | $ | 48,272 | $ | — | ||||||
| Class C | 672 | 672 | — | |||||||||
| Class S | 40,146 | 40,146 | — | |||||||||
| $ | 89,386 | $ | 89,090 | $ | — | |||||||
For the year ended August 31, 2012, the Advisor reimbursed DWS LifeCompass 2040 Fund $441 of sub-recordkeeping expenses for Class S shares.
In addition, for the year ended August 31, 2012, the Advisor reimbursed DWS LifeCompass 2040 Fund $10,799 of other expenses.
Distribution and Service Fees. Under the Funds' Class B and Class C 12b-1 Plans, DWS Investments Distributors, Inc. ("DIDI"), an affiliate of the Advisor, receives a fee ("Distribution Fee") of 0.75% of average daily net assets of each of Class B and C shares. In accordance with the Funds' Underwriting and Distribution Services Agreements, DIDI enters into related selling group agreements with various firms at various rates for sales of Class B and C shares. For the year ended August 31, 2012, the Distribution Fees were as follows:
| Distribution Fees | Total Aggregated | Unpaid at August 31, 2012 | ||||||
| DWS LifeCompass Retirement Fund | ||||||||
| Class B | $ | 7,009 | $ | 437 | ||||
| Class C | 41,187 | 3,339 | ||||||
| $ | 48,196 | $ | 3,776 | |||||
| DWS LifeCompass 2015 Fund | ||||||||
| Class B | $ | 15,881 | $ | 940 | ||||
| Class C | 87,035 | 6,869 | ||||||
| $ | 102,916 | $ | 7,809 | |||||
| DWS LifeCompass 2020 Fund | ||||||||
| Class B | $ | 27,176 | $ | 1,603 | ||||
| Class C | 109,257 | 8,233 | ||||||
| $ | 136,433 | $ | 9,836 | |||||
| DWS LifeCompass 2030 Fund | ||||||||
| Class B | $ | 8,722 | $ | 577 | ||||
| Class C | 34,064 | 2,706 | ||||||
| $ | 42,786 | $ | 3,283 | |||||
| DWS LifeCompass 2040 Fund | ||||||||
| Class C | $ | 1,594 | $ | 131 | ||||
In addition, DIDI provides information and administrative services for a fee ("Service Fee") to Class A, B and C shareholders at an annual rate of up to 0.25% of average daily net assets for each such class. DIDI in turn has various agreements with financial services firms that provide these services and pays these fees based upon the assets of shareholder accounts the firms service. For the year ended August 31, 2012, the Service Fees were as follows:
| Service Fees | Total Aggregated | Waived | Unpaid at August 31, 2012 | Annual Effective Rate | ||||||||||||
| DWS LifeCompass Retirement Fund | ||||||||||||||||
| Class A | $ | 60,316 | $ | — | $ | 16,993 | .25 | % | ||||||||
| Class B | 2,305 | 15 | 503 | .25 | % | |||||||||||
| Class C | 13,704 | — | 3,328 | .25 | % | |||||||||||
| $ | 76,325 | $ | 15 | $ | 20,824 | |||||||||||
| DWS LifeCompass 2015 Fund | ||||||||||||||||
| Class A | $ | 146,821 | $ | — | $ | 37,549 | .25 | % | ||||||||
| Class B | 5,264 | — | 977 | .25 | % | |||||||||||
| Class C | 28,936 | — | 6,821 | .25 | % | |||||||||||
| $ | 181,021 | $ | — | $ | 45,347 | |||||||||||
| DWS LifeCompass 2020 Fund | ||||||||||||||||
| Class A | $ | 197,131 | $ | — | $ | 51,193 | .25 | % | ||||||||
| Class B | 9,054 | — | 1,655 | .25 | % | |||||||||||
| Class C | 36,414 | — | 6,759 | .25 | % | |||||||||||
| $ | 242,599 | $ | — | $ | 59,607 | |||||||||||
| DWS LifeCompass 2030 Fund | ||||||||||||||||
| Class A | $ | 94,355 | $ | — | $ | 25,498 | .24 | % | ||||||||
| Class B | 2,876 | 500 | 332 | .20 | % | |||||||||||
| Class C | 11,322 | 1,667 | 1,786 | .21 | % | |||||||||||
| $ | 108,553 | $ | 2,167 | $ | 27,616 | |||||||||||
| DWS LifeCompass 2040 Fund | ||||||||||||||||
| Class A | $ | 47,510 | $ | — | $ | 12,972 | .24 | % | ||||||||
| Class C | 530 | 17 | 113 | .24 | % | |||||||||||
| $ | 48,040 | $ | 17 | $ | 13,085 | |||||||||||
Underwriting Agreement and Contingent Deferred Sales Charge. DIDI is the principal underwriter for the Funds. Underwriting commissions paid in connection with the distribution of Class A shares for the year ended August 31, 2012 for DWS LifeCompass Retirement Fund, DWS LifeCompass 2015 Fund, DWS LifeCompass 2020 Fund, DWS LifeCompass 2030 Fund and DWS LifeCompass 2040 Fund aggregated $729, $2,025, $8,023, $2,985 and $863, respectively.
In addition, DIDI receives any contingent deferred sales charge ("CDSC") from Class B share redemptions occurring within six years of purchase and Class C share redemptions occurring within one year of purchase. There is no such charge upon redemption of any share appreciation or reinvested dividends. The CDSC is based on declining rates, ranging from 4% to 1% for Class B and 1% for Class C, of the value of the shares redeemed. For the year ended August 31, 2012, the CDSC for Class B shares aggregated $2,338, $3,264, $9,514 and $1,801, respectively, for DWS LifeCompass Retirement Fund, DWS LifeCompass 2015 Fund, DWS LifeCompass 2020 Fund and DWS LifeCompass 2030 Fund and Class C shares aggregated $168, $278, $3,155 and $47, respectively, for DWS LifeCompass Retirement Fund, DWS LifeCompass 2015 Fund, DWS LifeCompass 2020 Fund and DWS LifeCompass 2030 Fund. For the year ended August 31, 2012, the CDSC for Class C shares aggregated $143 for DWS LifeCompass 2040 Fund. A deferred sales charge of up to 1% is assessed on certain redemptions of Class A shares. For the year ended August 31, 2012, DIDI received $7, $210, $194, $87 and $441, respectively, for Class A shares of DWS LifeCompass Retirement Fund, DWS LifeCompass 2015 Fund, DWS LifeCompass 2020 Fund, DWS LifeCompass 2030 Fund and DWS LifeCompass 2040 Fund.
Typesetting and Filing Service Fees. Under an agreement with DIMA, DIMA is compensated for providing typesetting and certain regulatory filing services to the Funds. For the year ended August 31, 2012, the amounts charged to the Funds by DIMA included in the Statements of Operations under "reports to shareholders" were as follows:
| Typesetting and Filing Service Fees | Total Aggregated | Unpaid at August 31, 2012 | ||||||
| DWS LifeCompass Retirement Fund | $ | 10,016 | $ | 3,608 | ||||
| DWS LifeCompass 2015 Fund | $ | 9,641 | $ | 3,269 | ||||
| DWS LifeCompass 2020 Fund | $ | 10,963 | $ | 4,244 | ||||
| DWS LifeCompass 2030 Fund | $ | 9,683 | $ | 2,621 | ||||
| DWS LifeCompass 2040 Fund | $ | 9,138 | $ | 5,120 | ||||
Trustees' Fees and Expenses. The Fund paid retainer fees to each Trustee not affiliated with the Advisor, plus specified amounts to the Board Chairperson and to each committee Chairperson.
Affiliated Cash Management Vehicle. The Fund may invest uninvested cash balances in Central Cash Management Fund, which is managed by the Advisor. The Fund indirectly bears its proportionate share of the expenses of Central Cash Management Fund. Central Cash Management Fund does not pay the Advisor an investment management fee. Central Cash Management Fund seeks a high level of current income consistent with liquidity and the preservation of capital.
C. Concentration of Ownership
From time to time, the Funds may have a concentration of several shareholder accounts holding a significant percentage of shares outstanding. Investment activities of these shareholders could have a material impact on the Funds. At August 31, 2012, there was one shareholder account that held approximately 18% and 10% of the outstanding shares of DWS LifeCompass 2015 Fund and DWS LifeCompass 2030 Fund, respectively, and two shareholder accounts that held approximately 21% and 14% of the outstanding shares of DWS LifeCompass 2040 Fund.
D. Share Transactions
DWS LifeCompass Retirement Fund
The following table summarizes share and dollar activity in the Fund:
| Year Ended August 31, 2012 | Year Ended August 31, 2011 | |||||||||||||||
| Shares | Dollars | Shares | Dollars | |||||||||||||
| Shares sold | ||||||||||||||||
| Class A | 866,019 | $ | 9,828,778 | 625,028 | $ | 7,001,633 | ||||||||||
| Class B | 4,214 | 48,373 | 1,108 | 12,470 | ||||||||||||
| Class C | 40,803 | 455,994 | 38,380 | 426,341 | ||||||||||||
| Class S | 989,095 | 11,054,727 | 518,544 | 5,805,834 | ||||||||||||
| $ | 21,387,872 | $ | 13,246,278 | |||||||||||||
| Shares issued to shareholders in reinvestment of distributions | ||||||||||||||||
| Class A | 43,683 | $ | 480,631 | 54,639 | $ | 607,558 | ||||||||||
| Class B | 1,092 | 11,973 | 1,979 | 21,986 | ||||||||||||
| Class C | 5,424 | 59,602 | 6,642 | 73,851 | ||||||||||||
| Class S | 101,377 | 1,117,291 | 103,780 | 1,153,834 | ||||||||||||
| $ | 1,669,497 | $ | 1,857,229 | |||||||||||||
| Shares redeemed | ||||||||||||||||
| Class A | (850,859 | ) | $ | (9,475,448 | ) | (1,205,637 | ) | $ | (13,476,808 | ) | ||||||
| Class B | (65,023 | ) | (723,653 | ) | (102,319 | ) | (1,133,919 | ) | ||||||||
| Class C | (112,759 | ) | (1,266,084 | ) | (167,952 | ) | (1,873,573 | ) | ||||||||
| Class S | (1,432,428 | ) | (16,048,457 | ) | (794,346 | ) | (8,892,217 | ) | ||||||||
| $ | (27,513,642 | ) | $ | (25,376,517 | ) | |||||||||||
| Net increase (decrease) | ||||||||||||||||
| Class A | 58,843 | $ | 833,961 | (525,970 | ) | $ | (5,867,617 | ) | ||||||||
| Class B | (59,717 | ) | (663,307 | ) | (99,232 | ) | (1,099,463 | ) | ||||||||
| Class C | (66,532 | ) | (750,488 | ) | (122,930 | ) | (1,373,381 | ) | ||||||||
| Class S | (341,956 | ) | (3,876,439 | ) | (172,022 | ) | (1,932,549 | ) | ||||||||
| $ | (4,456,273 | ) | $ | (10,273,010 | ) | |||||||||||
DWS LifeCompass 2015 Fund
The following table summarizes share and dollar activity in the Fund:
| Year Ended August 31, 2012 | Year Ended August 31, 2011 | |||||||||||||||
| Shares | Dollars | Shares | Dollars | |||||||||||||
| Shares sold | ||||||||||||||||
| Class A | 1,021,922 | $ | 10,949,401 | 1,386,254 | $ | 14,800,601 | ||||||||||
| Class B | 1,333 | 14,309 | 3,552 | 38,168 | ||||||||||||
| Class C | 45,171 | 485,137 | 68,855 | 745,610 | ||||||||||||
| Class S | 916,308 | 9,938,722 | 1,305,688 | 14,167,332 | ||||||||||||
| $ | 21,387,569 | $ | 29,751,711 | |||||||||||||
| Shares issued to shareholders in reinvestment of distributions | ||||||||||||||||
| Class A | 111,162 | $ | 1,170,957 | 107,427 | $ | 1,160,363 | ||||||||||
| Class B | 2,543 | 26,616 | 4,117 | 44,505 | ||||||||||||
| Class C | 12,401 | 130,275 | 11,138 | 120,712 | ||||||||||||
| Class S | 148,856 | 1,568,032 | 130,448 | 1,406,565 | ||||||||||||
| $ | 2,895,880 | $ | 2,732,145 | |||||||||||||
| Shares redeemed | ||||||||||||||||
| Class A | �� | (1,877,103 | ) | $ | (20,135,834 | ) | (2,693,350 | ) | $ | (29,116,094 | ) | |||||
| Class B | (178,995 | ) | (1,907,940 | ) | (429,962 | ) | (4,605,548 | ) | ||||||||
| Class C | (326,683 | ) | (3,495,746 | ) | (405,123 | ) | (4,406,071 | ) | ||||||||
| Class S | (1,241,730 | ) | (13,354,534 | ) | (2,367,649 | ) | (25,272,298 | ) | ||||||||
| $ | (38,894,054 | ) | $ | (63,400,011 | ) | |||||||||||
| Net increase (decrease) | ||||||||||||||||
| Class A | (744,019 | ) | $ | (8,015,476 | ) | (1,199,669 | ) | $ | (13,155,130 | ) | ||||||
| Class B | (175,119 | ) | (1,867,015 | ) | (422,293 | ) | (4,522,875 | ) | ||||||||
| Class C | (269,111 | ) | (2,880,334 | ) | (325,130 | ) | (3,539,749 | ) | ||||||||
| Class S | (176,566 | ) | (1,847,780 | ) | (931,513 | ) | (9,698,401 | ) | ||||||||
| $ | (14,610,605 | ) | $ | (30,916,155 | ) | |||||||||||
DWS LifeCompass 2020 Fund
The following table summarizes share and dollar activity in the Fund:
| Year Ended August 31, 2012 | Year Ended August 31, 2011 | |||||||||||||||
| Shares | Dollars | Shares | Dollars | |||||||||||||
| Shares sold | ||||||||||||||||
| Class A | 1,210,096 | $ | 15,657,143 | 1,651,472 | $ | 21,428,120 | ||||||||||
| Class B | 779 | 10,331 | 961 | 12,691 | ||||||||||||
| Class C | 61,269 | 779,995 | 75,157 | 969,629 | ||||||||||||
| Class S | 2,398,717 | 30,977,329 | 1,086,176 | 14,325,208 | ||||||||||||
| $ | 47,424,798 | $ | 36,735,648 | |||||||||||||
| Shares issued to shareholders in reinvestment of distributions | ||||||||||||||||
| Class A | 118,697 | $ | 1,477,775 | 111,942 | $ | 1,449,646 | ||||||||||
| Class B | 3,553 | 44,061 | 6,272 | 80,851 | ||||||||||||
| Class C | 12,013 | 148,966 | 11,797 | 152,184 | ||||||||||||
| Class S | 179,795 | 2,240,249 | 156,231 | 2,023,192 | ||||||||||||
| $ | 3,911,051 | $ | 3,705,873 | |||||||||||||
| Shares redeemed | ||||||||||||||||
| Class A | (1,558,970 | ) | $ | (20,201,212 | ) | (2,511,735 | ) | $ | (32,725,044 | ) | ||||||
| Class B | (220,129 | ) | (2,806,589 | ) | (506,878 | ) | (6,531,780 | ) | ||||||||
| Class C | (283,723 | ) | (3,658,948 | ) | (389,133 | ) | (5,056,604 | ) | ||||||||
| Class S | (3,227,711 | ) | (41,745,007 | ) | (1,115,625 | ) | (14,590,270 | ) | ||||||||
| $ | (68,411,756 | ) | $ | (58,903,698 | ) | |||||||||||
| Net increase (decrease) | ||||||||||||||||
| Class A | (230,177 | ) | $ | (3,066,294 | ) | (748,321 | ) | $ | (9,847,278 | ) | ||||||
| Class B | (215,797 | ) | (2,752,197 | ) | (499,645 | ) | (6,438,238 | ) | ||||||||
| Class C | (210,441 | ) | (2,729,987 | ) | (302,179 | ) | (3,934,791 | ) | ||||||||
| Class S | (649,199 | ) | (8,527,429 | ) | 126,782 | 1,758,130 | ||||||||||
| $ | (17,075,907 | ) | $ | (18,462,177 | ) | |||||||||||
DWS LifeCompass 2030 Fund
The following table summarizes share and dollar activity in the Fund:
| Year Ended August 31, 2012 | Year Ended August 31, 2011 | |||||||||||||||
| Shares | Dollars | Shares | Dollars | |||||||||||||
| Shares sold | ||||||||||||||||
| Class A | 1,293,121 | $ | 11,961,734 | 1,006,910 | $ | 9,521,517 | ||||||||||
| Class B | 12,529 | 119,294 | 8,226 | 77,808 | ||||||||||||
| Class C | 32,178 | 297,256 | 62,134 | 596,065 | ||||||||||||
| Class S | 879,028 | 8,210,785 | 911,543 | 8,751,115 | ||||||||||||
| $ | 20,589,069 | $ | 18,946,505 | |||||||||||||
| Shares issued to shareholders in reinvestment of distributions | ||||||||||||||||
| Class A | 62,629 | $ | 556,144 | 51,473 | $ | 484,869 | ||||||||||
| Class B | 899 | 8,003 | 703 | 6,638 | ||||||||||||
| Class C | 3,340 | 29,695 | 2,023 | 19,076 | ||||||||||||
| Class S | 37,215 | 330,468 | 19,598 | 184,614 | ||||||||||||
| $ | 924,310 | $ | 695,197 | |||||||||||||
| Shares redeemed | ||||||||||||||||
| Class A | (1,268,844 | ) | $ | (11,623,141 | ) | (1,906,708 | ) | $ | (17,842,607 | ) | ||||||
| Class B | (63,741 | ) | (594,813 | ) | (84,354 | ) | (805,174 | ) | ||||||||
| Class C | (65,577 | ) | (609,158 | ) | (199,236 | ) | (1,893,004 | ) | ||||||||
| Class S | (812,241 | ) | (7,495,873 | ) | (251,483 | ) | (2,376,641 | ) | ||||||||
| $ | (20,322,985 | ) | $ | (22,917,426 | ) | |||||||||||
| Net increase (decrease) | ||||||||||||||||
| Class A | 86,906 | $ | 894,737 | (848,325 | ) | $ | (7,836,221 | ) | ||||||||
| Class B | (50,313 | ) | (467,516 | ) | (75,425 | ) | (720,728 | ) | ||||||||
| Class C | (30,059 | ) | (282,207 | ) | (135,079 | ) | (1,277,863 | ) | ||||||||
| Class S | 104,002 | 1,045,380 | 679,658 | 6,559,088 | ||||||||||||
| $ | 1,190,394 | $ | (3,275,724 | ) | ||||||||||||
DWS LifeCompass 2040 Fund
The following table summarizes share and dollar activity in the Fund:
| Year Ended August 31, 2012 | Year Ended August 31, 2011 | |||||||||||||||
| Shares | Dollars | Shares | Dollars | |||||||||||||
| Shares sold | ||||||||||||||||
| Class A | 1,110,402 | $ | 8,824,620 | 855,046 | $ | 7,123,918 | ||||||||||
| Class C | 3,978 | 31,296 | 10,217 | 83,740 | ||||||||||||
| Class S | 1,075,064 | 8,630,969 | 800,407 | 6,723,199 | ||||||||||||
| $ | 17,486,885 | $ | 13,930,857 | |||||||||||||
| Shares issued to shareholders in reinvestment of distributions | ||||||||||||||||
| Class A | 89,497 | $ | 676,598 | 60,626 | $ | 501,985 | ||||||||||
| Class C | 749 | 5,660 | 557 | 4,609 | ||||||||||||
| Class S | 74,706 | 564,777 | 40,892 | 338,584 | ||||||||||||
| $ | 1,247,035 | $ | 845,178 | |||||||||||||
| Shares redeemed | ||||||||||||||||
| Class A | (769,258 | ) | $ | (6,090,804 | ) | (1,025,883 | ) | $ | (8,385,896 | ) | ||||||
| Class C | (8,775 | ) | (70,122 | ) | (7,673 | ) | (63,502 | ) | ||||||||
| Class S | (696,126 | ) | (5,476,144 | ) | (246,568 | ) | (2,060,409 | ) | ||||||||
| $ | (11,637,070 | ) | $ | (10,509,807 | ) | |||||||||||
| Net increase (decrease) | ||||||||||||||||
| Class A | 430,641 | $ | 3,410,414 | (110,211 | ) | $ | (759,993 | ) | ||||||||
| Class C | (4,048 | ) | (33,166 | ) | 3,101 | 24,847 | ||||||||||
| Class S | 453,644 | 3,719,602 | 594,731 | 5,001,374 | ||||||||||||
| $ | 7,096,850 | $ | 4,266,228 | |||||||||||||
E. Transactions with Affiliates
The Funds mainly invest in Underlying DWS Funds and ETFs. The Underlying DWS Funds in which the Funds invest are considered to be affiliated investments. A summary of each Fund's transactions with affiliated Underlying DWS Funds during the year ended August 31, 2012 is as follows:
DWS LifeCompass Retirement Fund
| Affiliate | Value ($) at 8/31/2011 | Purchases Cost ($) | Sales Cost ($) | Realized Gain/ (Loss) ($) | Income Distributions ($) | Capital Gain Distributions ($) | Value ($) at 8/31/2012 | |||||||||||||||||||||
| DWS Capital Growth Fund | 2,430,760 | 187,916 | 1,035,000 | 196,150 | 17,916 | — | 2,004,694 | |||||||||||||||||||||
| DWS Core Equity Fund | 2,433,119 | 2,613,895 | 260,000 | 50,265 | 48,895 | — | 5,113,265 | |||||||||||||||||||||
| DWS Diversified International Equity Fund | 1,081,405 | 1,659,725 | 535,000 | (2,515 | ) | 34,725 | — | 2,160,972 | ||||||||||||||||||||
| DWS Dreman Mid Cap Value Fund | 895,603 | 9,845 | 140,000 | 3,513 | 9,845 | — | 835,309 | |||||||||||||||||||||
| DWS Dreman Small Cap Value Fund | 840,570 | 1,688,592 | 1,095,000 | 95,558 | 17,499 | 11,093 | 1,603,607 | |||||||||||||||||||||
| DWS EAFE Equity Index Fund | 1,068,691 | 1,371,064 | 235,000 | 7,891 | 36,064 | — | 2,202,007 | |||||||||||||||||||||
| DWS Emerging Markets Equity Fund | 826,863 | 832,986 | 315,000 | 39,223 | 2,986 | — | 1,305,988 | |||||||||||||||||||||
| DWS Equity 500 Index Fund | 3,913,316 | 3,394,988 | 480,000 | 105,073 | 89,988 | — | 7,437,823 | |||||||||||||||||||||
| DWS Equity Dividend Fund | 3,785,820 | 67,631 | 1,930,000 | 493,338 | 67,631 | — | 2,347,534 | |||||||||||||||||||||
| DWS Global Thematic Fund | 855,931 | 567,406 | 615,000 | 20,963 | 12,406 | — | 820,942 | |||||||||||||||||||||
| DWS International Fund | 1,621,152 | 167,134 | 1,509,264 | (91,489 | ) | 22,134 | — | 143,679 | ||||||||||||||||||||
| DWS Large Cap Value Fund | 1,159,977 | 9,890 | 1,203,830 | 84,723 | 9,890 | — | — | |||||||||||||||||||||
| DWS S&P 500 Plus Fund | 2,910,452 | — | 3,265,087 | 901,693 | — | — | — | |||||||||||||||||||||
| DWS Small Cap Core Fund | 808,589 | 80,000 | 906,055 | 22,791 | — | — | — | |||||||||||||||||||||
| DWS Small Cap Growth Fund | 798,079 | 915,000 | 610,000 | 166,459 | — | — | 1,282,759 | |||||||||||||||||||||
| DWS Technology Fund | 1,376,084 | — | 765,000 | 392,967 | — | — | 861,200 | |||||||||||||||||||||
| DWS Core Fixed Income Fund | 16,116,805 | 6,191,220 | 4,590,000 | 217,424 | 463,888 | — | 18,588,809 | |||||||||||||||||||||
| DWS Enhanced Commodity Strategy Fund | 893,061 | 293,083 | �� | 155,000 | (1,612 | ) | 78,083 | — | 877,065 | |||||||||||||||||||
| DWS Enhanced Emerging Markets Fixed Income Fund | 900,619 | 162,640 | 205,000 | 6,273 | 42,640 | — | 880,881 | |||||||||||||||||||||
| DWS Enhanced Global Bond Fund | 5,934,657 | 9,637,440 | 6,425,000 | (73,703 | ) | 222,440 | — | 8,882,785 | ||||||||||||||||||||
| DWS Floating Rate Fund | 874,442 | 14,445 | 909,808 | 6,868 | 14,445 | — | — | |||||||||||||||||||||
| DWS Global High Income Fund | — | 554,755 | — | — | 5,076 | — | 565,555 | |||||||||||||||||||||
| DWS Global Inflation Fund | 3,675,487 | 708,994 | 1,825,000 | 220,201 | 109,413 | 129,581 | 2,603,157 | |||||||||||||||||||||
| DWS High Income Fund | 2,174,210 | 1,314,677 | 1,130,000 | 45,200 | 204,676 | — | 2,518,389 | |||||||||||||||||||||
| DWS Short Duration Fund | 10,561,020 | 71,511 | 10,553,280 | (338,265 | ) | 71,511 | — | — | ||||||||||||||||||||
| DWS U.S. Bond Index Fund | 16,211,777 | 7,709,048 | 5,715,000 | 450,442 | 517,252 | 198,491 | 18,521,299 | |||||||||||||||||||||
| DWS Disciplined Market Neutral Fund | — | 1,245,720 | 370,000 | (2,686 | ) | 721 | — | 876,997 | ||||||||||||||||||||
| Central Cash Management Fund | 839,954 | 27,936,280 | 27,878,533 | — | 1,483 | — | 897,700 | |||||||||||||||||||||
| Total | 84,988,443 | 69,405,885 | 74,655,857 | 3,016,745 | 2,101,607 | 339,165 | 83,332,416 | |||||||||||||||||||||
DWS LifeCompass 2015 Fund
| Affiliate | Value ($) at 8/31/2011 | Purchases Cost ($) | Sales Cost ($) | Realized Gain/ (Loss) ($) | Income Distributions ($) | Capital Gain Distributions ($) | Value ($) at 8/31/2012 | |||||||||||||||||||||
| DWS Capital Growth Fund | 5,865,723 | 2,150,120 | 2,885,000 | 660,684 | 55,120 | — | 6,460,859 | |||||||||||||||||||||
| DWS Core Equity Fund | 5,994,880 | 3,035,572 | — | — | 100,572 | — | 9,595,855 | |||||||||||||||||||||
| DWS Diversified International Equity Fund | 1,541,248 | 3,133,394 | 675,000 | 22,649 | 63,394 | — | 3,936,762 | |||||||||||||||||||||
| DWS Dreman Mid Cap Value Fund | 1,490,592 | 16,981 | 315,000 | 60,798 | 16,981 | — | 1,305,723 | |||||||||||||||||||||
| DWS Dreman Small Cap Value Fund | 1,725,044 | 1,358,007 | 925,000 | 143,221 | 35,501 | 22,506 | 2,447,060 | |||||||||||||||||||||
| DWS EAFE Equity Index Fund | 1,468,478 | 2,397,299 | 120,000 | 14,195 | 87,299 | — | 3,795,526 | |||||||||||||||||||||
| DWS Emerging Markets Equity Fund | 2,104,624 | 1,146,528 | 265,000 | 34,020 | 6,528 | — | 2,810,616 | |||||||||||||||||||||
| DWS Equity 500 Index Fund | 10,119,113 | 4,342,130 | — | — | 232,130 | — | 16,091,799 | |||||||||||||||||||||
| DWS Equity Dividend Fund | 8,126,006 | 162,731 | 3,045,000 | 728,073 | 162,731 | — | 6,227,683 | |||||||||||||||||||||
| DWS Global Small Cap Growth Fund | — | 580,000 | 385,000 | (35,358 | ) | — | — | 151,391 | ||||||||||||||||||||
| DWS Global Thematic Fund | 1,448,125 | 166,746 | 570,000 | (37,602 | ) | 21,746 | — | 1,019,322 | ||||||||||||||||||||
| DWS Health Care Fund | 1,513,612 | — | 1,465,422 | 258,726 | — | — | — | |||||||||||||||||||||
| DWS International Fund | 3,330,711 | 137,887 | 2,045,000 | (152,408 | ) | 57,887 | — | 1,307,522 | ||||||||||||||||||||
| DWS Large Cap Value Fund | 3,727,574 | 27,820 | 3,852,415 | 833,062 | 27,820 | — | — | |||||||||||||||||||||
| DWS RREEF Real Estate Securities Fund | 1,480,590 | 106,976 | 670,000 | 161,257 | 21,976 | — | 1,128,678 | |||||||||||||||||||||
| DWS S&P 500 Plus Fund | 7,390,270 | — | 8,355,425 | 2,008,455 | — | — | — | |||||||||||||||||||||
| DWS Small Cap Core Fund | 3,934,844 | 320,000 | 3,455,000 | 917,423 | — | — | 1,217,381 | |||||||||||||||||||||
| DWS Small Cap Growth Fund | 1,453,521 | 795,000 | 815,000 | 259,995 | — | — | 1,728,990 | |||||||||||||||||||||
| DWS Technology Fund | 2,923,408 | 80,000 | 1,920,000 | 608,170 | — | — | 1,470,693 | |||||||||||||||||||||
| DWS Core Fixed Income Fund | 17,365,547 | 7,498,491 | 2,725,000 | 109,415 | 516,568 | — | 23,116,315 | |||||||||||||||||||||
| DWS Enhanced Commodity Strategy Fund | 1,532,120 | 307,323 | 155,000 | (428 | ) | 132,323 | — | 1,421,020 | ||||||||||||||||||||
| DWS Enhanced Emerging Markets Fixed Income Fund | 1,546,714 | 141,083 | 335,000 | 11,628 | 71,083 | — | 1,389,969 | |||||||||||||||||||||
| DWS Enhanced Global Bond Fund | 7,432,585 | 8,781,316 | 8,815,000 | (257,159 | ) | 251,316 | — | 6,973,769 | ||||||||||||||||||||
| DWS Floating Rate Fund | 1,496,290 | 79,507 | 1,609,837 | (16,521 | ) | 24,507 | — | — | ||||||||||||||||||||
| DWS Global High Income Fund | — | 692,545 | — | — | 7,948 | — | 710,541 | |||||||||||||||||||||
| DWS Global Inflation Fund | 6,302,903 | 940,466 | 3,775,000 | 363,861 | 162,262 | 188,204 | 3,513,017 | |||||||||||||||||||||
| DWS High Income Fund | 3,728,290 | 1,580,662 | 1,630,000 | 56,001 | 330,662 | — | 3,918,446 | |||||||||||||||||||||
| DWS Short Duration Fund | 11,555,646 | 86,272 | 11,581,737 | (431,399 | ) | 86,272 | — | — | ||||||||||||||||||||
| DWS U.S. Bond Index Fund | 17,461,030 | 9,525,285 | 3,345,000 | 266,987 | 577,384 | 209,822 | 24,017,624 | |||||||||||||||||||||
| DWS Disciplined Market Neutral Fund | — | 2,230,979 | 285,000 | (1,338 | ) | 979 | — | 1,951,143 | ||||||||||||||||||||
| Central Cash Management Fund | 562,847 | 30,356,285 | 29,974,728 | — | 1,459 | — | 944,404 | |||||||||||||||||||||
| Total | 134,622,335 | 82,177,405 | 95,994,564 | 6,586,407 | 3,052,448 | 420,532 | 128,652,108 | |||||||||||||||||||||
DWS LifeCompass 2020 Fund
| Affiliate | Value ($) at 8/31/2011 | Purchases Cost ($) | Sales Cost ($) | Realized Gain/ (Loss) ($) | Income Distributions ($) | Capital Gain Distributions ($) | Value ($) at 8/31/2012 | |||||||||||||||||||||
| DWS Capital Growth Fund | 5,620,403 | 3,777,413 | 2,805,000 | 679,605 | 62,413 | — | 8,249,409 | |||||||||||||||||||||
| DWS Core Equity Fund | 10,173,708 | 7,110,810 | 3,670,000 | 797,016 | 180,810 | — | 14,602,788 | |||||||||||||||||||||
| DWS Diversified International Equity Fund | 4,429,319 | 3,736,643 | 960,000 | 38,391 | 131,643 | — | 7,074,985 | |||||||||||||||||||||
| DWS Dreman Mid Cap Value Fund | 2,074,949 | 23,879 | 410,000 | 108,739 | 23,879 | — | 1,870,322 | |||||||||||||||||||||
| DWS Dreman Small Cap Value Fund | 3,077,803 | 2,199,077 | 1,265,000 | 219,137 | 60,637 | 38,440 | 4,451,274 | |||||||||||||||||||||
| DWS EAFE Equity Index Fund | 2,047,921 | 4,509,576 | 350,000 | 41,518 | 134,576 | — | 6,243,742 | |||||||||||||||||||||
| DWS Emerging Markets Equity Fund | 3,924,835 | 2,216,953 | 640,000 | 141,495 | 11,953 | — | 5,201,869 | |||||||||||||||||||||
| DWS Equity 500 Index Fund | 18,726,119 | 9,363,942 | 3,815,000 | 300,106 | 393,942 | — | 26,849,646 | |||||||||||||||||||||
| DWS Equity Dividend Fund | 11,008,084 | 228,587 | 3,800,000 | 861,561 | 228,587 | — | 8,818,686 | |||||||||||||||||||||
| DWS Global Small Cap Growth Fund | — | 2,240,000 | 260,000 | 11,169 | — | — | 2,057,537 | |||||||||||||||||||||
| DWS Global Thematic Fund | 2,006,834 | 1,846,642 | 750,000 | (10,090 | ) | 31,642 | — | 3,139,313 | ||||||||||||||||||||
| DWS Health Care Fund | 3,295,592 | — | 3,190,669 | 223,485 | — | — | — | |||||||||||||||||||||
| DWS International Fund | 3,864,108 | 300,152 | 2,055,000 | (226,434 | ) | 70,152 | — | 2,015,021 | ||||||||||||||||||||
| DWS Large Cap Focus Growth Fund | 2,640,709 | 100,148 | 1,085,000 | 299,694 | 148 | — | 2,083,947 | |||||||||||||||||||||
| DWS Large Cap Value Fund | 8,685,010 | 120,299 | 5,845,000 | 1,557,211 | 120,299 | — | 3,355,410 | |||||||||||||||||||||
| DWS RREEF Real Estate Securities Fund | 2,051,740 | 142,756 | 620,000 | 217,424 | 32,756 | — | 1,911,110 | |||||||||||||||||||||
| DWS S&P 500 Plus Fund | 10,815,331 | — | 12,309,038 | 3,261,725 | — | — | — | |||||||||||||||||||||
| DWS Small Cap Core Fund | 5,761,338 | 235,000 | 5,990,000 | 917,785 | — | — | 610,504 | |||||||||||||||||||||
| DWS Small Cap Growth Fund | 2,499,046 | 1,415,000 | 870,000 | 271,302 | — | — | 3,539,647 | |||||||||||||||||||||
| DWS Technology Fund | 5,374,426 | — | 2,015,000 | 848,341 | — | — | 4,549,188 | |||||||||||||||||||||
| DWS World Dividend Fund | 3,133,938 | 51,004 | 3,203,587 | (2,232,615 | ) | 51,004 | — | — | ||||||||||||||||||||
| DWS Core Fixed Income Fund | 18,158,797 | 10,186,349 | 4,705,000 | 236,955 | 554,469 | — | 24,700,476 | |||||||||||||||||||||
| DWS Enhanced Commodity Strategy Fund | 2,139,347 | 634,912 | 375,000 | 11,018 | 189,912 | — | 2,015,240 | |||||||||||||||||||||
| DWS Enhanced Emerging Markets Fixed Income Fund | 2,161,226 | 382,906 | 610,000 | 16,162 | 102,906 | — | 1,988,405 | |||||||||||||||||||||
| DWS Enhanced Global Bond Fund | 5,690,851 | 13,130,125 | 10,790,000 | (174,516 | ) | 270,125 | — | 7,684,836 | ||||||||||||||||||||
| DWS Floating Rate Fund | 2,089,008 | 154,538 | 2,290,801 | (2,727 | ) | 34,538 | — | — | ||||||||||||||||||||
| DWS Global High Income Fund | — | 985,605 | — | — | 11,179 | — | 1,010,802 | |||||||||||||||||||||
| DWS Global Inflation Fund | 6,612,686 | 1,559,650 | 4,910,000 | 350,613 | 183,019 | 236,631 | 3,290,486 | |||||||||||||||||||||
| DWS High Income Fund | 4,692,660 | 3,003,214 | 3,120,000 | 166,269 | 438,214 | — | 4,860,633 | |||||||||||||||||||||
| DWS Short Duration Fund | 11,072,276 | 101,374 | 11,118,641 | (404,923 | ) | 101,374 | — | — | ||||||||||||||||||||
| DWS U.S. Bond Index Fund | 18,272,619 | 12,727,207 | 5,775,000 | 419,663 | 623,289 | 212,845 | 25,641,478 | |||||||||||||||||||||
| DWS Disciplined Market Neutral Fund | — | 4,036,401 | 710,000 | (4,877 | ) | 1,401 | — | 3,325,857 | ||||||||||||||||||||
| Central Cash Management Fund | 1,069,091 | 45,901,403 | 46,735,195 | — | 1,660 | — | 235,298 | |||||||||||||||||||||
| Total | 183,169,774 | 132,421,565 | 147,047,931 | 8,940,202 | 4,046,527 | 487,916 | 181,377,909 | |||||||||||||||||||||
DWS LifeCompass 2030 Fund
| Affiliate | Value ($) at 8/31/2011 | Purchases Cost ($) | Sales Cost ($) | Realized Gain/ (Loss) ($) | Income Distributions ($) | Capital Gain Distributions ($) | Value ($) at 8/31/2012 | |||||||||||||||||||||
| DWS Capital Growth Fund | 3,353,980 | 1,890,750 | 580,000 | 111,602 | 35,750 | — | 5,538,684 | |||||||||||||||||||||
| DWS Core Equity Fund | 4,899,756 | 534,284 | 465,000 | 2,279 | 74,283 | — | 5,415,912 | |||||||||||||||||||||
| DWS Diversified International Equity Fund | 2,417,820 | 825,577 | 200,000 | (240 | ) | 60,577 | — | 2,948,172 | ||||||||||||||||||||
| DWS Dreman Mid Cap Value Fund | 645,252 | 7,426 | 30,000 | 481 | 7,426 | — | 677,923 | |||||||||||||||||||||
| DWS Dreman Small Cap Value Fund | 1,349,009 | 803,374 | 435,000 | 88,183 | 26,546 | 16,828 | 1,901,757 | |||||||||||||||||||||
| DWS EAFE Equity Index Fund | 622,786 | 2,031,437 | — | — | 51,437 | — | 2,667,394 | |||||||||||||||||||||
| DWS Emerging Markets Equity Fund | 1,812,720 | 715,476 | 255,000 | 37,805 | 5,476 | — | 2,130,250 | |||||||||||||||||||||
| DWS Equity 500 Index Fund | 6,370,975 | 5,734,290 | 1,175,000 | 48,653 | 149,290 | — | 11,904,011 | |||||||||||||||||||||
| DWS Equity Dividend Fund | 5,220,235 | 94,502 | 1,695,000 | 150,818 | 94,502 | — | 4,149,885 | |||||||||||||||||||||
| DWS Global Small Cap Growth Fund | 624,390 | 87,827 | 45,000 | 5,523 | 7,096 | 10,731 | 660,499 | |||||||||||||||||||||
| DWS Global Thematic Fund | 619,348 | 284,371 | 70,000 | (18,127 | ) | 9,371 | — | 818,690 | ||||||||||||||||||||
| DWS Health Care Fund | 855,942 | — | 828,691 | 103,801 | — | — | — | |||||||||||||||||||||
| DWS International Fund | 1,939,454 | 61,941 | 940,000 | (75,271 | ) | 41,941 | — | 1,024,951 | ||||||||||||||||||||
| DWS Large Cap Value Fund | 2,534,251 | 40,510 | 1,200,000 | 231,717 | 40,510 | — | 1,477,289 | |||||||||||||||||||||
| DWS RREEF Real Estate Securities Fund | 845,789 | 11,822 | 280,000 | 105,005 | 11,822 | — | 665,900 | |||||||||||||||||||||
| DWS S&P 500 Plus Fund | 4,612,506 | — | 5,253,724 | 1,366,476 | — | — | — | |||||||||||||||||||||
| DWS Small Cap Core Fund | 2,312,021 | 140,000 | 2,180,000 | 454,629 | — | — | 513,309 | |||||||||||||||||||||
| DWS Small Cap Growth Fund | 1,019,120 | 325,000 | 50,000 | 14,076 | — | — | 1,469,236 | |||||||||||||||||||||
| DWS Technology Fund | 2,430,254 | — | 1,365,000 | 357,648 | — | — | 1,465,584 | |||||||||||||||||||||
| DWS World Dividend Fund | 1,129,770 | 29,188 | 435,000 | (103,565 | ) | 29,188 | — | 734,184 | ||||||||||||||||||||
| DWS Core Fixed Income Fund | 1,587,683 | 2,228,831 | 960,000 | 23,850 | 48,795 | — | 2,956,334 | |||||||||||||||||||||
| DWS Enhanced Commodity Strategy Fund | 657,499 | 239,483 | 120,000 | (14,764 | ) | 59,483 | — | 661,343 | ||||||||||||||||||||
| DWS Enhanced Emerging Markets Fixed Income Fund | 668,216 | 138,151 | 465,000 | (14,456 | ) | 28,151 | — | 336,902 | ||||||||||||||||||||
| DWS Enhanced Global Bond Fund | 1,046,580 | 5,670,141 | 2,885,000 | (51,332 | ) | 90,141 | — | 3,764,523 | ||||||||||||||||||||
| DWS Global Inflation Fund | 679,323 | 190,385 | 880,633 | 60,917 | 16,361 | 24,024 | — | |||||||||||||||||||||
| DWS High Income Fund | 803,812 | 275,139 | 290,000 | (6,259 | ) | 65,139 | — | 829,903 | ||||||||||||||||||||
| DWS Short Duration Fund | 1,725,911 | 4,898 | 1,723,278 | (51,350 | ) | 4,898 | — | — | ||||||||||||||||||||
| DWS U.S. Bond Index Fund | 1,593,242 | 3,038,112 | 1,390,000 | 29,200 | 57,187 | 11,793 | 3,296,503 | |||||||||||||||||||||
| DWS Disciplined Market Neutral Fund | — | 1,410,438 | 415,000 | (7,209 | ) | 439 | — | 992,527 | ||||||||||||||||||||
| Central Cash Management Fund | 365,387 | 20,305,296 | 19,837,570 | — | 752 | — | 833,112 | |||||||||||||||||||||
| Total | 54,743,031 | 47,118,649 | 46,448,896 | 2,850,090 | 1,016,561 | 63,376 | 59,834,777 | |||||||||||||||||||||
DWS LifeCompass 2040 Fund
| Affiliate | Value ($) at 8/31/2011 | Purchases Cost ($) | Sales Cost ($) | Realized Gain/ (Loss) ($) | Income Distributions ($) | Capital Gain Distributions ($) | Value ($) at 8/31/2012 | |||||||||||||||||||||
| DWS Capital Growth Fund | 2,245,633 | 971,887 | 175,000 | (8,865 | ) | 21,887 | — | 3,571,780 | ||||||||||||||||||||
| DWS Core Equity Fund | 2,384,189 | 2,231,412 | 1,155,000 | (117,509 | ) | 46,414 | — | 3,649,106 | ||||||||||||||||||||
| DWS Diversified International Equity Fund | 1,384,268 | 1,201,943 | 210,000 | (14,198 | ) | 36,943 | — | 2,318,451 | ||||||||||||||||||||
| DWS Dreman Mid Cap Value Fund | 378,336 | 34,053 | 65,000 | (4,206 | ) | 4,053 | — | 374,185 | ||||||||||||||||||||
| DWS Dreman Small Cap Value Fund | 842,745 | 372,511 | 120,000 | (9,747 | ) | 16,837 | 10,674 | 1,200,907 | ||||||||||||||||||||
| DWS EAFE Equity Index Fund | 709,990 | 1,488,785 | 30,000 | (5,134 | ) | 43,785 | — | 2,170,081 | ||||||||||||||||||||
| DWS Emerging Markets Equity Fund | 1,129,559 | 683,762 | 75,000 | (12,057 | ) | 3,762 | — | 1,628,991 | ||||||||||||||||||||
| DWS Equity 500 Index Fund | 3,175,072 | 4,196,579 | 345,000 | (24,963 | ) | 86,579 | — | 7,614,920 | ||||||||||||||||||||
| DWS Equity Dividend Fund | 3,006,130 | 61,090 | 410,000 | (65,787 | ) | 61,090 | — | 3,009,328 | ||||||||||||||||||||
| DWS Global Small Cap Growth Fund | 318,066 | 134,533 | 70,000 | (1,319 | ) | 3,795 | 5,738 | 378,252 | ||||||||||||||||||||
| DWS Global Thematic Fund | 477,254 | 260,620 | 55,000 | (7,346 | ) | 10,620 | — | 694,120 | ||||||||||||||||||||
| DWS Health Care Fund | 311,520 | — | 301,602 | 15,842 | — | — | — | |||||||||||||||||||||
| DWS International Fund | 1,542,226 | 118,893 | 730,000 | (122,392 | ) | 23,893 | — | 894,048 | ||||||||||||||||||||
| DWS Large Cap Value Fund | 1,096,585 | 41,293 | 265,000 | (14,895 | ) | 21,293 | — | 943,049 | ||||||||||||||||||||
| DWS RREEF Real Estate Securities Fund | 405,319 | 6,213 | 65,000 | (589 | ) | 6,213 | — | 401,416 | ||||||||||||||||||||
| DWS S&P 500 Plus Fund | 2,330,548 | 220,000 | 2,922,876 | 625,440 | — | — | — | |||||||||||||||||||||
| DWS Small Cap Core Fund | 1,127,992 | 120,000 | 980,000 | 196,783 | — | — | 408,418 | |||||||||||||||||||||
| DWS Small Cap Growth Fund | 570,381 | 300,000 | 50,000 | (3,010 | ) | — | — | 933,108 | ||||||||||||||||||||
| DWS Technology Fund | 1,028,176 | — | 280,000 | 41,347 | — | — | 954,909 | |||||||||||||||||||||
| DWS World Dividend Fund | 442,885 | 11,784 | 85,000 | (4,547 | ) | 11,784 | — | 375,996 | ||||||||||||||||||||
| DWS Core Fixed Income Fund | 376,638 | 549,980 | 448,041 | 4,671 | 4,931 | — | 485,552 | |||||||||||||||||||||
| DWS Enhanced Commodity Strategy Fund | 327,869 | 171,878 | 50,000 | (17,542 | ) | 31,878 | — | 388,026 | ||||||||||||||||||||
| DWS Enhanced Emerging Markets Fixed Income Fund | 327,572 | 115,430 | 245,000 | (13,184 | ) | 15,430 | — | 195,798 | ||||||||||||||||||||
| DWS Enhanced Global Bond Fund | — | 1,704,237 | 1,135,000 | 2,538 | 9,238 | — | 572,022 | |||||||||||||||||||||
| DWS High Income Fund | 319,366 | 337,327 | 285,000 | (7,184 | ) | 32,327 | — | 390,864 | ||||||||||||||||||||
| DWS Short Duration Fund | 85,200 | 10,776 | 94,879 | (2,911 | ) | 776 | — | — | ||||||||||||||||||||
| DWS U.S. Bond Index Fund | 380,881 | 1,300,334 | 875,000 | 5,841 | 21,675 | 4,411 | 825,998 | |||||||||||||||||||||
| DWS Disciplined Market Neutral Fund | — | 820,235 | 240,000 | (4,193 | ) | 235 | — | 578,434 | ||||||||||||||||||||
| DWS Gold & Precious Metals Fund | — | 10,000 | 8,294 | (1,706 | ) | — | — | — | ||||||||||||||||||||
| Central Cash Management Fund | 648,102 | 14,516,626 | 14,366,669 | — | 610 | — | 798,059 | |||||||||||||||||||||
| Total | 27,372,502 | 31,992,181 | 26,137,361 | 429,178 | 516,048 | 20,823 | 35,755,818 | |||||||||||||||||||||
To the Trustees of DWS Target Date Series and the Shareholders of DWS LifeCompass Retirement Fund, DWS LifeCompass 2015 Fund, DWS LifeCompass 2020 Fund, DWS LifeCompass 2030 Fund and DWS LifeCompass 2040 Fund:
In our opinion, the accompanying statements of assets and liabilities, including the investment portfolios, and the related statements of operations and of changes in net assets and the financial highlights present fairly, in all material respects, the financial position of DWS LifeCompass Retirement Fund, DWS LifeCompass 2015 Fund, DWS LifeCompass 2020 Fund, DWS LifeCompass 2030 Fund and DWS LifeCompass 2040 Fund, respectively (the five funds constituting DWS Target Date Series) (the "Trust"), at August 31, 2012 and the results of each of their operations, the changes in each of their net assets and the financial highlights for each of the periods indicated therein, in conformity with accounting principles generally accepted in the United States of America. These financial statements and financial highlights (hereafter referred to as "financial statements") are the responsibility of the Trust's management. Our responsibility is to express an opinion on these financial statements based on our audits. We conducted our audits of these financial statements in accordance with the standards of the Public Company Accounting Oversight Board (United States). Those standards require that we plan and perform the audit to obtain reasonable assurance about whether the financial statements are free of material misstatement. An audit includes examining, on a test basis, evidence supporting the amounts and disclosures in the financial statements, assessing the accounting principles used and significant estimates made by management, and evaluating the overall financial statement presentation. We believe that our audits, which included confirmation of securities at August 31, 2012 by correspondence with the custodian and transfer agent, provide a reasonable basis for our opinion.
Boston, Massachusetts October 25, 2012 | PricewaterhouseCoopers LLP |
As an investor of the Funds, you incur two types of costs: ongoing expenses and transaction costs. Ongoing expenses include distribution and service (12b-1) fees and other Fund expenses. Examples of transaction costs include sales charges (loads) and account maintenance fees, which are not shown in this section. The following tables are intended to help you understand your ongoing expenses (in dollars) of investing in the Funds and to help you compare these expenses with the ongoing expenses of investing in mutual funds. In addition to the ongoing expenses which the Funds bear directly, the Funds' shareholders indirectly bear the expenses of the Underlying Funds in which the Funds invest. These expenses are not included in the Funds' annualized expense ratios used to calculate the expense estimate in the tables. In the most recent six-month period, DWS LifeCompass Retirement Fund, DWS LifeCompass 2015 Fund, Class A and S shares of DWS LifeCompass 2020 Fund, DWS LifeCompass 2030 Fund and DWS LifeCompass 2040 Fund limited the ongoing expenses the Funds bear directly; had they not done so, expenses would have been higher. The examples in the tables are based on an investment of $1,000 invested at the beginning of the six-month period and held for the entire period (March 1, 2012 to August 31, 2012).
The tables illustrate your Fund's expenses in two ways:
•Actual Fund Return. This helps you estimate the actual dollar amount of ongoing expenses (but not transaction costs) paid on a $1,000 investment in the Fund using the Fund's actual return during the period. To estimate the expenses you paid over the period, simply divide your account value by $1,000 (for example, an $8,600 account value divided by $1,000 = 8.6), then multiply the result by the number in the "Expenses Paid per $1,000" line under the share class you hold.
•Hypothetical 5% Fund Return. This helps you to compare your Fund's ongoing expenses (but not transaction costs) with those of other mutual funds using the Fund's actual expense ratio and a hypothetical rate of return of 5% per year before expenses. Examples using a 5% hypothetical fund return may be found in the shareholder reports of other mutual funds. The hypothetical account values and expenses may not be used to estimate the actual ending account balance or expenses you paid for the period.
Please note that the expenses shown in these tables are meant to highlight your ongoing expenses only and do not reflect any transaction costs. The "Expenses Paid per $1,000" line of the tables is useful in comparing ongoing expenses only and will not help you determine the relative total expense of owning different funds. An account maintenance fee of $6.25 per quarter for Class S shares may apply for certain accounts whose balances do not meet the applicable minimum initial investment. This fee is not included in these tables. If it was, the estimate of expenses paid for Class S shares during the period would be higher, and account value during the period would be lower, by this amount.
DWS LifeCompass Retirement Fund
Expenses and Value of a $1,000 Investment for the six months ended August 31, 2012 (Unaudited) | ||||||||||||||||
| Actual Fund Return | Class A | Class B | Class C | Class S | ||||||||||||
| Beginning Account Value 3/1/12 | $ | 1,000.00 | $ | 1,000.00 | $ | 1,000.00 | $ | 1,000.00 | ||||||||
| Ending Account Value 8/31/12 | $ | 1,016.20 | $ | 1,013.30 | $ | 1,012.40 | $ | 1,017.50 | ||||||||
| Expenses Paid per $1,000* | $ | 3.14 | $ | 6.93 | $ | 6.93 | $ | 1.88 | ||||||||
| Hypothetical 5% Fund Return | Class A | Class B | Class C | Class S | ||||||||||||
| Beginning Account Value 3/1/12 | $ | 1,000.00 | $ | 1,000.00 | $ | 1,000.00 | $ | 1,000.00 | ||||||||
| Ending Account Value 8/31/12 | $ | 1,022.02 | $ | 1,018.25 | $ | 1,018.25 | $ | 1,023.28 | ||||||||
| Expenses Paid per $1,000* | $ | 3.15 | $ | 6.95 | $ | 6.95 | $ | 1.88 | ||||||||
* Expenses are equal to the Fund's annualized expense ratio for each share class, multiplied by the average account value over the period, multiplied by 184 (the number of days in the most recent six-month period), then divided by 366.
| Annualized Expense Ratios** | Class A | Class B | Class C | Class S |
| DWS LifeCompass Retirement Fund | .62% | 1.37% | 1.37% | .37% |
** The Fund invests in other funds and indirectly bears its proportionate share of fees and expenses incurred by the Underlying Funds in which the Fund is invested. These ratios do not include these indirect fees and expenses.
For more information, please refer to the Fund's prospectus.
DWS LifeCompass 2015 Fund
Expenses and Value of a $1,000 Investment for the six months ended August 31, 2012 (Unaudited) | ||||||||||||||||
| Actual Fund Return | Class A | Class B | Class C | Class S | ||||||||||||
| Beginning Account Value 3/1/12 | $ | 1,000.00 | $ | 1,000.00 | $ | 1,000.00 | $ | 1,000.00 | ||||||||
| Ending Account Value 8/31/12 | $ | 1,010.40 | $ | 1,007.50 | $ | 1,007.50 | $ | 1,012.60 | ||||||||
| Expenses Paid per $1,000* | $ | 2.93 | $ | 6.71 | $ | 6.71 | $ | 1.67 | ||||||||
| Hypothetical 5% Fund Return | Class A | Class B | Class C | Class S | ||||||||||||
| Beginning Account Value 3/1/12 | $ | 1,000.00 | $ | 1,000.00 | $ | 1,000.00 | $ | 1,000.00 | ||||||||
| Ending Account Value 8/31/12 | $ | 1,022.22 | $ | 1,018.45 | $ | 1,018.45 | $ | 1,023.48 | ||||||||
| Expenses Paid per $1,000* | $ | 2.95 | $ | 6.75 | $ | 6.75 | $ | 1.68 | ||||||||
* Expenses are equal to the Fund's annualized expense ratio for each share class, multiplied by the average account value over the period, multiplied by 184 (the number of days in the most recent six-month period), then divided by 366.
| Annualized Expense Ratios** | Class A | Class B | Class C | Class S |
| DWS LifeCompass 2015 Fund | .58% | 1.33% | 1.33% | .33% |
** The Fund invests in other funds and indirectly bears its proportionate share of fees and expenses incurred by the Underlying Funds in which the Fund is invested. These ratios do not include these indirect fees and expenses.
For more information, please refer to the Fund's prospectus.
DWS LifeCompass 2020 Fund
Expenses and Value of a $1,000 Investment for the six months ended August 31, 2012 (Unaudited) | ||||||||||||||||
| Actual Fund Return | Class A | Class B | Class C | Class S | ||||||||||||
| Beginning Account Value 3/1/12 | $ | 1,000.00 | $ | 1,000.00 | $ | 1,000.00 | $ | 1,000.00 | ||||||||
| Ending Account Value 8/31/12 | $ | 1,008.20 | $ | 1,006.00 | $ | 1,004.50 | $ | 1,009.00 | ||||||||
| Expenses Paid per $1,000* | $ | 2.98 | $ | 5.40 | $ | 6.65 | $ | 1.72 | ||||||||
| Hypothetical 5% Fund Return | Class A | Class B | Class C | Class S | ||||||||||||
| Beginning Account Value 3/1/12 | $ | 1,000.00 | $ | 1,000.00 | $ | 1,000.00 | $ | 1,000.00 | ||||||||
| Ending Account Value 8/31/12 | $ | 1,022.17 | $ | 1,019.76 | $ | 1,018.50 | $ | 1,023.43 | ||||||||
| Expenses Paid per $1,000* | $ | 3.00 | $ | 5.43 | $ | 6.70 | $ | 1.73 | ||||||||
* Expenses are equal to the Fund's annualized expense ratio for each share class, multiplied by the average account value over the period, multiplied by 184 (the number of days in the most recent six-month period), then divided by 366.
| Annualized Expense Ratios** | Class A | Class B | Class C | Class S |
| DWS LifeCompass 2020 Fund | .59% | 1.07% | 1.32% | .34% |
** The Fund invests in other funds and indirectly bears its proportionate share of fees and expenses incurred by the Underlying Funds in which the Fund is invested. These ratios do not include these indirect fees and expenses.
For more information, please refer to the Fund's prospectus.
DWS LifeCompass 2030 Fund
Expenses and Value of a $1,000 Investment for the six months ended August 31, 2012 (Unaudited) | ||||||||||||||||
| Actual Fund Return | Class A | Class B | Class C | Class S | ||||||||||||
| Beginning Account Value 3/1/12 | $ | 1,000.00 | $ | 1,000.00 | $ | 1,000.00 | $ | 1,000.00 | ||||||||
| Ending Account Value 8/31/12 | $ | 1,001.00 | $ | 996.90 | $ | 997.90 | $ | 1,002.10 | ||||||||
| Expenses Paid per $1,000* | $ | 2.92 | $ | 6.68 | $ | 6.68 | $ | 1.66 | ||||||||
| Hypothetical 5% Fund Return | Class A | Class B | Class C | Class S | ||||||||||||
| Beginning Account Value 3/1/12 | $ | 1,000.00 | $ | 1,000.00 | $ | 1,000.00 | $ | 1,000.00 | ||||||||
| Ending Account Value 8/31/12 | $ | 1,022.22 | $ | 1,018.45 | $ | 1,018.45 | $ | 1,023.48 | ||||||||
| Expenses Paid per $1,000* | $ | 2.95 | $ | 6.75 | $ | 6.75 | $ | 1.68 | ||||||||
* Expenses are equal to the Fund's annualized expense ratio for each share class, multiplied by the average account value over the period, multiplied by 184 (the number of days in the most recent six-month period), then divided by 366.
| Annualized Expense Ratios** | Class A | Class B | Class C | Class S |
| DWS LifeCompass 2030 Fund | .58% | 1.33% | 1.33% | .33% |
** The Fund invests in other funds and indirectly bears its proportionate share of fees and expenses incurred by the Underlying Funds in which the Fund is invested. These ratios do not include these indirect fees and expenses.
For more information, please refer to the Fund's prospectus.
DWS LifeCompass 2040 Fund
Expenses and Value of a $1,000 Investment for the six months ended August 31, 2012 (Unaudited) | ||||||||||||
| Actual Fund Return | Class A | Class C | Class S | |||||||||
| Beginning Account Value 3/1/12 | $ | 1,000.00 | $ | 1,000.00 | $ | 1,000.00 | ||||||
| Ending Account Value 8/31/12 | $ | 994.00 | $ | 991.60 | $ | 996.40 | ||||||
| Expenses Paid per $1,000* | $ | 2.76 | $ | 6.51 | $ | 1.51 | ||||||
| Hypothetical 5% Fund Return | Class A | Class C | Class S | |||||||||
| Beginning Account Value 3/1/12 | $ | 1,000.00 | $ | 1,000.00 | $ | 1,000.00 | ||||||
| Ending Account Value 8/31/12 | $ | 1,022.37 | $ | 1,018.60 | $ | 1,023.63 | ||||||
| Expenses Paid per $1,000* | $ | 2.80 | $ | 6.60 | $ | 1.53 | ||||||
* Expenses are equal to the Fund's annualized expense ratio for each share class, multiplied by the average account value over the period, multiplied by 184 (the number of days in the most recent six-month period), then divided by 366.
| Annualized Expense Ratios** | Class A | Class C | Class S |
| DWS LifeCompass 2040 Fund | .55% | 1.30% | .30% |
** The Fund invests in other funds and indirectly bears its proportionate share of fees and expenses incurred by the Underlying Funds in which the Fund is invested. These ratios do not include these indirect fees and expenses.
For more information, please refer to the Fund's prospectus.
DWS LifeCompass 2040 Fund paid distributions of $0.14 per share from net long-term capital gains during its year ended August 31, 2012, of which 100% represents 15% rate gains.
Pursuant to Section 852 of the Internal Revenue Code, DWS LifeCompass 2040 Fund designates $332,000 as capital gain dividends for its year ended August 31, 2012, of which 100% represents 15% rate gains.
For corporate shareholders, 100%, 100%, 100%, 100% and 100% of the ordinary dividends (i.e., income dividends plus short-term capital gains) paid during the fiscal year ended August 31, 2012, for DWS LifeCompass Retirement Fund, DWS LifeCompass 2015 Fund, DWS LifeCompass 2020 Fund, DWS LifeCompass 2030 Fund and DWS LifeCompass 2040 Fund, respectively, qualified for the dividends received deduction.
For federal income tax purposes, DWS LifeCompass Retirement Fund, DWS LifeCompass 2015 Fund, DWS LifeCompass 2020 Fund, DWS LifeCompass 2030 Fund and DWS LifeCompass 2040 Fund designate $2,466,000, $3,818,046, $5,198,000, $1,393,000 and $715,000, respectively, or the maximum amount allowable under tax law, as qualified dividend income.
Please consult a tax advisor if you have questions about federal or state income tax laws, or on how to prepare your tax returns. If you have specific questions about your account, please call (800) 621-1048.
September 26, 2011
Pursuant to an Order entered into by Deutsche Investment Management Americas and affiliates (collectively, "DeAM") with the Attorney General of New York, I, Thomas H. Mack, have been appointed the Independent Fee Consultant for the DWS Funds (formerly the DWS Scudder Funds). My duties include preparing an annual written evaluation of the management fees DeAM charges the Funds, considering among other factors the management fees charged by other mutual fund companies for like services, management fees DeAM charges other clients for like services, DeAM's costs of supplying services under the management agreements and related profit margins, possible economies of scale if a Fund grows larger, and the nature and quality of DeAM's services, including fund performance. This report summarizes my evaluation for 2011, including my qualifications, the evaluation process for each of the DWS Funds, consideration of certain complex-level factors, and my conclusions. I served in substantially the same capacity in 2007, 2008, 2009 and 2010.
Qualifications
For more than 35 years I have served in various professional capacities within the investment management business. I have held investment analysis and advisory positions, including securities analyst, portfolio strategist and director of investment policy with a large investment firm. I have also performed business management functions, including business development, financial management and marketing research and analysis.
Since 1991, I have been an independent consultant within the asset management industry. I have provided services to over 125 client organizations, including investment managers, mutual fund boards, product distributors and related organizations. Over the past ten years I have completed a number of assignments for mutual fund boards, specifically including assisting boards with management contract renewal.
I hold a Master of Business Administration degree, with highest honors, from Harvard University and Master of Science and Bachelor of Science (highest honors) degrees from the University of California at Berkeley. I am an independent director and audit committee financial expert for two closed-end mutual funds and have served in various leadership and financial oversight capacities with non-profit organizations.
Evaluation of Fees for each DWS Fund
My work focused primarily on evaluating, fund-by-fund, the fees charged to each of the 109 mutual fund portfolios in the DWS Fund family. For each Fund, I considered each of the key factors mentioned above, as well as any other relevant information. In doing so I worked closely with the Funds' Independent Directors in their annual contract renewal process, as well as in their approval of contracts for several new funds (documented separately).
In evaluating each Fund's fees, I reviewed comprehensive materials provided by or on behalf of DeAM, including expense information prepared by Lipper Analytical, comparative performance information, profitability data, manager histories, and other materials. I also accessed certain additional information from the Lipper and Morningstar databases and drew on my industry knowledge and experience.
To facilitate evaluating this considerable body of information, I prepared for each Fund a document summarizing the key data elements in each area as well as additional analytics discussed below. This made it possible to consider each key data element in the context of the others.
In the course of contract renewal, DeAM agreed to implement a number of fee and expense adjustments requested by the Independent Directors which will favorably impact future fees and expenses, and my evaluation includes the effects of these changes.
Fees and Expenses Compared with Other Funds
The competitive fee and expense evaluation for each fund focused on two primary comparisons:
The Fund's contractual management fee (the advisory fee plus the administration fee where applicable) compared with those of a group of typically 12-15 funds in the same Lipper investment category (e.g. Large Capitalization Growth) having similar distribution arrangements and being of similar size.
The Fund's total expenses compared with a broader universe of funds from the same Lipper investment category and having similar distribution arrangements.
These two comparisons provide a view of not only the level of the fee compared with funds of similar scale but also the total expense the Fund bears for all the services it receives, in comparison with the investment choices available in the Fund's investment category and distribution channel. The principal figure-of-merit used in these comparisons was the subject Fund's percentile ranking against peers.
DeAM's Fees for Similar Services to Others
DeAM provided management fee schedules for all of its US domiciled fund and non-fund investment management accounts in any of the investment categories where there is a DWS Fund. These similar products included the other DWS Funds, non-fund pooled accounts, institutional accounts and sub-advisory accounts. Using this information, I calculated for each Fund the fee that would be charged to each similar product, at the subject Fund's asset level.
Evaluating information regarding non-fund products is difficult because there are varying levels of services required for different types of accounts, with mutual funds generally requiring considerably more regulatory and administrative types of service as well as having more frequent cash flows than other types of accounts. Also, while mutual fund fees for similar fund products can be expected to be similar, there will be some differences due to different pricing conditions in different distribution channels (e.g. retail funds versus those used in variable insurance products), differences in underlying investment processes and other factors.
Costs and Profit Margins
DeAM provided a detailed profitability analysis for each Fund. After making some adjustments so that the presentation would be more comparable to the available industry figures, I reviewed profit margins from investment management alone, from investment management plus other fund services (excluding distribution) provided to the Funds by DeAM (principally shareholder services), and DeAM profits from all sources, including distribution. A later section comments on overall profitability.
Economies of Scale
Economies of scale — an expected decline in management cost per dollar of fund assets as fund assets grow — are very rarely quantified and documented because of inherent difficulties in collecting and analyzing relevant data. However, in virtually every investment category that I reviewed, larger funds tend to have lower fees and lower total expenses than smaller funds. To see how each DWS Fund compares with this industry observation, I reviewed:
The trend in Fund assets over the last five years and the accompanying trend in total expenses. This shows if the Fund has grown and, if so, whether total expense (management fees as well as other expenses) have declined as a percent of assets.
Whether the Fund has break-points in its management fee schedule, the extent of the fee reduction built into the schedule and the asset levels where the breaks take effect, and in the case of a sub-advised Fund how the Fund's break-points compare with those of the sub-advisory fee schedule.
How the Fund's contractual fee schedule compares with trends in the industry data. To accomplish this, I constructed a chart showing how actual latest-fiscal-year contractual fees of the Fund and of other similar funds relate to average fund assets, with the subject Fund's contractual fee schedule superimposed.
Quality of Service — Performance
The quality-of-service evaluation focused on investment performance, which is the principal result of the investment management service. Each Fund's performance was reviewed over the past 1, 3, 5 and 10 years, as applicable, and compared with that of other funds in the same investment category and with a suitable market index.
In addition, I calculated and reviewed risk-adjusted returns relative to an index of similar mutual funds' returns and a suitable market index. The risk-adjusted returns analysis provides a way of determining the extent to which the Fund's return comparisons are mainly the product of investment value-added (or lack thereof) or alternatively taking considerably more or less risk than is typical in its investment category.
I also received and considered the history of portfolio manager changes for each Fund, as this provided an important context for evaluating the performance results.
Complex-Level Considerations
While this evaluation was conducted mainly at the individual fund level, there are some issues relating to the reasonableness of fees that can alternatively be considered across the whole fund complex:
I reviewed DeAM's profitability analysis for all DWS Funds, with a view toward determining if the allocation procedures used were reasonable and how profit levels compared with public data for other investment managers.
I considered whether DeAM and affiliates receive any significant ancillary or "fall-out" benefits that should be considered in interpreting the direct profitability results. These would be situations where serving as the investment manager of the Funds is beneficial to another part of the Deutsche Bank organization.
I considered how aggregated DWS Fund expenses had varied over the years, by asset class and in the context of trends in asset levels.
I reviewed the structure of the DeAM organization, trends in staffing levels, and information on compensation of investment management and other professionals compared with industry data.
Findings
Based on the process and analysis discussed above, which included reviewing a wide range of information from management and external data sources and considering among other factors the fees DeAM charges other clients, the fees charged by other fund managers, DeAM's costs and profits associated with managing the Funds, economies of scale, possible fall-out benefits, and the nature and quality of services provided, in my opinion the management fees charged the DWS Funds are reasonable.

Thomas H. Mack
President, Thomas H. Mack & Co., Inc.
The following table presents certain information regarding the Board Members and Officers of the fund as of August 31, 2012. Each Board Member's year of birth is set forth in parentheses after his or her name. Unless otherwise noted, (i) each Board Member has engaged in the principal occupation(s) noted in the table for at least the most recent five years, although not necessarily in the same capacity; and (ii) the address of each Independent Board Member is c/o Paul K. Freeman, Independent Chairman, DWS Funds, PO Box 101833, Denver, CO 80250-1833. Except as otherwise noted below, the term of office for each Board Member is until the election and qualification of a successor, or until such Board Member sooner dies, resigns, is removed or as otherwise provided in the governing documents of the fund. Because the fund does not hold an annual meeting of shareholders, each Board Member will hold office for an indeterminate period. The Board Members may also serve in similar capacities with other funds in the fund complex. The Length of Time Served represents the year in which the Board Member joined the Board of one or more DWS funds now overseen by the Board.
| Independent Board Members | ||||
Name, Year of Birth, Position with the Fund and Length of Time Served1 | Business Experience and Directorships During the Past Five Years | Number of Funds in DWS Fund Complex Overseen | Other Directorships Held by Board Member | |
Paul K. Freeman (1950) Chairperson since 2009 Board Member since 1993 | Consultant, World Bank/Inter-American Development Bank; Executive and Governing Council of the Independent Directors Council (Chairman of Education Committee); formerly: Project Leader, International Institute for Applied Systems Analysis (1998-2001); Chief Executive Officer, The Eric Group, Inc. (environmental insurance) (1986-1998) | 104 | — | |
John W. Ballantine (1946) Board Member since 1999 | Retired; formerly, Executive Vice President and Chief Risk Management Officer, First Chicago NBD Corporation/The First National Bank of Chicago (1996-1998); Executive Vice President and Head of International Banking (1995-1996). Directorships: Chairman of the Board, Healthways, Inc. (provider of disease and care management services); Portland General Electric (utility company); Stockwell Capital Investments PLC (private equity); former Directorships: First Oak Brook Bancshares, Inc. and Oak Brook Bank; Prisma Energy International | 104 | — | |
Henry P. Becton, Jr. (1943) Board Member since 1990 | Vice Chair and former President, WGBH Educational Foundation. Directorships: Public Radio International; Public Radio Exchange (PRX); The PBS Foundation; North Bennett Street School (Boston); former Directorships: Association of Public Television Stations; Boston Museum of Science; American Public Television; Concord Academy; New England Aquarium; Mass. Corporation for Educational Telecommunications; Committee for Economic Development; Public Broadcasting Service; Connecticut College | 104 | Lead Director, Becton Dickinson and Company2 (medical technology company); Lead Director, Belo Corporation2 (media company) | |
Dawn-Marie Driscoll (1946) Board Member since 1987 | President, Driscoll Associates (consulting firm); Executive Fellow, Center for Business Ethics, Bentley University; formerly, Partner, Palmer & Dodge (1988-1990); Vice President of Corporate Affairs and General Counsel, Filene's (1978-1988). Directorships: Director of ICI Mutual Insurance Company (since 2007); Advisory Board, Center for Business Ethics, Bentley University; Trustee, Southwest Florida Community Foundation (charitable organization); former Directorships: Investment Company Institute (audit, executive, nominating committees) and Independent Directors Council (governance, executive committees) | 104 | Trustee, Sun Capital Advisers, Inc. (22 open-end mutual funds advised by Sun Capital Advisers, Inc.) (since 2007) | |
Keith R. Fox, CFA (1954) Board Member since 1996 | Managing General Partner, Exeter Capital Partners (a series of private investment funds) (since 1986). Directorships: Progressive International Corporation (kitchen goods importer and distributor); BoxTop Media Inc. (advertising); The Kennel Shop (retailer); former Chairman, National Association of Small Business Investment Companies | 104 | Trustee, Sun Capital Advisers, Inc. (22 open-end mutual funds advised by Sun Capital Advisers, Inc.) (since 2011) | |
Kenneth C. Froewiss (1945) Board Member since 2001 | Adjunct Professor of Finance, NYU Stern School of Business (September 2009-present; Clinical Professor from 1997-September 2009); Member, Finance Committee, Association for Asian Studies (2002-present); Director, Mitsui Sumitomo Insurance Group (US) (2004-present); prior thereto, Managing Director, J.P. Morgan (investment banking firm) (until 1996) | 104 | — | |
Richard J. Herring (1946) Board Member since 1990 | Jacob Safra Professor of International Banking and Professor, Finance Department, The Wharton School, University of Pennsylvania (since July 1972); Co-Director, Wharton Financial Institutions Center (since July 2000); Co-Chair, U.S. Shadow Financial Regulatory Committee; Executive Director, Financial Economists Roundtable; formerly: Vice Dean and Director, Wharton Undergraduate Division (July 1995-June 2000); Director, Lauder Institute of International Management Studies (July 2000-June 2006) | 104 | Director, Japan Equity Fund, Inc. (since September 2007), Thai Capital Fund, Inc. (since September 2007), Singapore Fund, Inc. (since September 2007), Independent Director of Barclays Bank Delaware (since September 2010) | |
William McClayton (1944) Board Member since 2004 | Private equity investor (since October 2009); previously, Managing Director, Diamond Management & Technology Consultants, Inc. (global consulting firm) (2001-2009); Directorship: Board of Managers, YMCA of Metropolitan Chicago; formerly: Senior Partner, Arthur Andersen LLP (accounting) (1966-2001); Trustee, Ravinia Festival | 104 | — | |
Rebecca W. Rimel (1951) Board Member since 1995 | President and Chief Executive Officer, The Pew Charitable Trusts (charitable organization) (1994 to present); Trustee, Washington College (2011 to present); formerly: Executive Vice President, The Glenmede Trust Company (investment trust and wealth management) (1983-2004); Board Member, Investor Education (charitable organization) (2004-2005); Trustee, Executive Committee, Philadelphia Chamber of Commerce (2001-2007); Trustee, Pro Publica (charitable organization) (2007-2010); Trustee, Thomas Jefferson Foundation (charitable organization) (1994 to 2012) | 104 | Director, CardioNet, Inc.2 (health care) (2009- present); Director, Viasys Health Care2 (January 2007- June 2007) | |
William N. Searcy, Jr. (1946) Board Member since 1993 | Private investor since October 2003; formerly: Pension & Savings Trust Officer, Sprint Corporation2 (telecommunications) (November 1989-September 2003) | 104 | Trustee, Sun Capital Advisers, Inc. (22 open-end mutual funds advised by Sun Capital Advisers, Inc.) (since 1998) | |
Jean Gleason Stromberg (1943) Board Member since 1997 | Retired. Formerly, Consultant (1997-2001); Director, Financial Markets U.S. Government Accountability Office (1996-1997); Partner, Fulbright & Jaworski, L.L.P. (law firm) (1978-1996). Directorships: The William and Flora Hewlett Foundation; former Directorships: Service Source, Inc., Mutual Fund Directors Forum (2002-2004), American Bar Retirement Association (funding vehicle for retirement plans) (1987-1990 and 1994-1996) | 104 | — | |
Robert H. Wadsworth (1940) Board Member since 1999 | President, Robert H. Wadsworth & Associates, Inc. (consulting firm) (1983 to present); Director, National Horizon, Inc. (non-profit organization); Director and Treasurer, The Phoenix Boys Choir Association | 107 | — | |
Officers4 | ||
Name, Year of Birth, Position with the Fund and Length of Time Served5 | Principal Occupation(s) During Past 5 Years and Other Directorships Held | |
W. Douglas Beck, CFA6 (1967) President, 2011-present | Managing Director3, Deutsche Asset Management (2006-present); President of DWS family of funds and Head of Product Management, U.S. for DWS Investments; formerly, Executive Director, Head of Product Management (2002-2006) and President (2005-2006) of the UBS Funds at UBS Global Asset Management; Co-Head of Manager Research/Managed Solutions Group, Merrill Lynch (1998-2002) | |
John Millette7 (1962) Vice President and Secretary, 1999-present | Director3, Deutsche Asset Management | |
Paul H. Schubert6 (1963) Chief Financial Officer, 2004-present Treasurer, 2005-present | Managing Director3, Deutsche Asset Management (since July 2004); formerly, Executive Director, Head of Mutual Fund Services and Treasurer for UBS Family of Funds (1998-2004); Vice President and Director of Mutual Fund Finance at UBS Global Asset Management (1994-1998) | |
Caroline Pearson7 (1962) Chief Legal Officer, 2010-present | Managing Director3, Deutsche Asset Management; formerly, Assistant Secretary for DWS family of funds (1997-2010) | |
Melinda Morrow6 (1970) Vice President, 2012-present | Director3, Deutsche Asset Management | |
Paul Antosca7 (1957) Assistant Treasurer, 2007-present | Director3, Deutsche Asset Management | |
Jack Clark7 (1967) Assistant Treasurer, 2007-present | Director3, Deutsche Asset Management | |
Diane Kenneally7 (1966) Assistant Treasurer, 2007-present | Director3, Deutsche Asset Management | |
John Caruso6 (1965) Anti-Money Laundering Compliance Officer, 2010-present | Managing Director3, Deutsche Asset Management | |
Robert Kloby6 (1962) Chief Compliance Officer, 2006-present | Managing Director3, Deutsche Asset Management | |
1 The length of time served represents the year in which the Board Member joined the board of one or more DWS funds currently overseen by the Board.
2 A publicly held company with securities registered pursuant to Section 12 of the Securities Exchange Act of 1934.
3 Executive title, not a board directorship.
4 As a result of their respective positions held with the Advisor, these individuals are considered "interested persons" of the Advisor within the meaning of the 1940 Act. Interested persons receive no compensation from the fund.
5 The length of time served represents the year in which the officer was first elected in such capacity for one or more DWS funds.
6 Address: 60 Wall Street, New York, NY 10005.
7 Address: One Beacon Street, Boston, MA 02108.
The fund's Statement of Additional Information ("SAI") includes additional information about the Board Members. The SAI is available, without charge, upon request. If you would like to request a copy of the SAI, you may do so by calling the following toll-free number: (800) 621-1048.
| For More Information | The automated telephone system allows you to access personalized account information and obtain information on other DWS funds using either your voice or your telephone keypad. Certain account types within Classes A, B, C and S also have the ability to purchase, exchange or redeem shares using this system. For more information, contact your financial advisor. You may also access our automated telephone system or speak with a DWS Investments representative by calling the appropriate number below: For shareholders of Classes A, B and C: (800) 621-1048 For shareholders of Class S: (800) 728-3337 | |
| Web Site | www.dws-investments.com View your account transactions and balances, trade shares, monitor your asset allocation, and change your address, 24 hours a day. Obtain prospectuses and applications, blank forms, interactive worksheets, news about DWS funds, subscription to fund updates by e-mail, retirement planning information, and more. | |
| Written Correspondence | DWS Investments PO Box 219151 Kansas City, MO 64121-9151 | |
| Proxy Voting | The fund's policies and procedures for voting proxies for portfolio securities and information about how the fund voted proxies related to its portfolio securities during the 12-month period ended June 30 are available on our Web site — www.dws-investments.com (click on "proxy voting"at the bottom of the page) — or on the SEC's Web site — www.sec.gov. To obtain a written copy of the fund's policies and procedures without charge, upon request, call us toll free at (800) 621-1048. | |
| Portfolio Holdings | Following the fund's fiscal first and third quarter-end, a complete portfolio holdings listing is filed with the SEC on Form N-Q. This form will be available on the SEC's Web site at www.sec.gov, and it also may be reviewed and copied at the SEC's Public Reference Room in Washington, D.C. Information on the operation of the SEC's Public Reference Room may be obtained by calling (800) SEC-0330. The fund's portfolio holdings are also posted on www.dws-investments.com from time to time. Please see the fund's current prospectus for more information. | |
| Principal Underwriter | If you have questions, comments or complaints, contact: DWS Investments Distributors, Inc. 222 South Riverside Plaza Chicago, IL 60606-5808 (800) 621-1148 | |
| Investment Management | Deutsche Investment Management Americas Inc. ("DIMA" or the "Advisor"), which is part of Deutsche Asset Management, is the investment advisor for the fund. DIMA and its predecessors have more than 80 years of experience managing mutual funds and DIMA provides a full range of investment advisory services to both institutional and retail clients. DIMA is an indirect, wholly owned subsidiary of Deutsche Bank AG. Deutsche Bank AG is a major global banking institution engaged in a wide variety of financial services, including investment management, retail, private and commercial banking, investment banking and insurance. DWS Investments is the retail brand name in the U.S. for the asset management activities of Deutsche Bank AG and DIMA. As such, DWS is committed to delivering the investing expertise, insight and resources of this global investment platform to American investors. | |
DWS LifeCompass Retirement Fund
| Class A | Class B | Class C | Class S | ||
| Nasdaq Symbol | SUCAX | SUCBX | SUCCX | SCPCX | |
| CUSIP Number | 23337A 608 | 23337A 707 | 23337A 806 | 23337A 871 | |
| Fund Number | 480 | 680 | 780 | 2080 |
DWS LifeCompass 2015 Fund
| Class A | Class B | Class C | Class S | ||
| Nasdaq Symbol | SPDAX | SPDBX | SPDCX | SPBAX | |
| CUSIP Number | 23337A 103 | 23337A 202 | 23337A 301 | 23337A 509 | |
| Fund Number | 481 | 681 | 781 | 2081 |
DWS LifeCompass 2020 Fund
| Class A | Class B | Class C | Class S | ||
| Nasdaq Symbol | SUPAX | SUPBX | SUPCX | SPGRX | |
| CUSIP Number | 23337A 863 | 23337A 855 | 23337A 848 | 23337A 822 | |
| Fund Number | 482 | 682 | 782 | 2082 |
DWS LifeCompass 2030 Fund
| Class A | Class B | Class C | Class S | ||
| Nasdaq Symbol | PLUSX | PLSBX | PLSCX | PPLSX | |
| CUSIP Number | 23337A 814 | 23337A 798 | 23337A 780 | 23337A 772 | |
| Fund Number | 1084 | 1284 | 1384 | 2084 |
DWS LifeCompass 2040 Fund
| Class A | Class B | Class C | Class S | ||
| Nasdaq Symbol | TGTAX | — | TGTCX | TGTSX | |
| CUSIP Number | 23337A 764 | — | 23337A 756 | 23337A 749 | |
| Fund Number | 457 | — | 757 | 2057 |
Notes
Notes
Notes
Notes

| ITEM 2. | CODE OF ETHICS |
As of the end of the period covered by this report, the registrant has adopted a code of ethics, as defined in Item 2 of Form N-CSR, that applies to its Principal Executive Officer and Principal Financial Officer. There have been no amendments to, or waivers from, a provision of the code of ethics during the period covered by this report that would require disclosure under Item 2. A copy of the code of ethics is filed as an exhibit to this Form N-CSR. | |
| ITEM 3. | AUDIT COMMITTEE FINANCIAL EXPERT |
| The fund’s audit committee is comprised solely of trustees who are "independent" (as such term has been defined by the Securities and Exchange Commission ("SEC") in regulations implementing Section 407 of the Sarbanes-Oxley Act (the "Regulations")). The fund’s Board of Trustees has determined that there are several "audit committee financial experts" (as such term has been defined by the Regulations) serving on the fund’s audit committee including Mr. William McClayton, the chair of the fund’s audit committee. An “audit committee financial expert” is not an “expert” for any purpose, including for purposes of Section 11 of the Securities Act of 1933 and the designation or identification of a person as an “audit committee financial expert” does not impose on such person any duties, obligations or liability that are greater than the duties, obligations and liability imposed on such person as a member of the audit committee and board of directors in the absence of such designation or identification. | |
| ITEM 4. | PRINCIPAL ACCOUNTANT FEES AND SERVICES |
DWS LIFECOMPASS RETIREMENT FUND
FORM N-CSR DISCLOSURE RE: AUDIT FEES
The following table shows the amount of fees that PricewaterhouseCoopers, LLP (“PWC”), the Fund’s independent registered public accounting firm, billed to the Fund during the Fund’s last two fiscal years. The Audit Committee approved in advance all audit services and non-audit services that PWC provided to the Fund.
Services that the Fund’s Independent Registered Public Accounting Firm Billed to the Fund
| Fiscal Year Ended August 31, | Audit Fees Billed to Fund | Audit-Related Fees Billed to Fund | Tax Fees Billed to Fund | All Other Fees Billed to Fund | ||||||||||||
| 2012 | $ | 39,115 | $ | 0 | $ | 0 | $ | 0 | ||||||||
| 2011 | $ | 37,781 | $ | 0 | $ | 0 | $ | 0 | ||||||||
Services that the Fund’s Independent Registered Public Accounting Firm Billed to the Adviser and Affiliated Fund Service Providers
The following table shows the amount of fees billed by PWC to Deutsche Investment Management Americas Inc. (“DeIM” or the “Adviser”), and any entity controlling, controlled by or under common control with DeIM (“Control Affiliate”) that provides ongoing services to the Fund (“Affiliated Fund Service Provider”), for engagements directly related to the Fund’s operations and financial reporting, during the Fund’s last two fiscal years.
| Fiscal Year Ended August 31, | Audit-Related Fees Billed to Adviser and Affiliated Fund Service Providers | Tax Fees Billed to Adviser and Affiliated Fund Service Providers | All Other Fees Billed to Adviser and Affiliated Fund Service Providers | |||||||||
| 2012 | $ | 0 | $ | 56,300 | $ | 0 | ||||||
| 2011 | $ | 0 | $ | 0 | $ | 0 | ||||||
The “Tax Fees Billed to the Advisor” were billed for services associated with foreign tax filings.
Non-Audit Services
The following table shows the amount of fees that PWC billed during the Fund’s last two fiscal years for non-audit services. The Audit Committee pre-approved all non-audit services that PWC provided to the Adviser and any Affiliated Fund Service Provider that related directly to the Fund’s operations and financial reporting. The Audit Committee requested and received information from PWC about any non-audit services that PWC rendered during the Fund’s last fiscal year to the Adviser and any Affiliated Fund Service Provider. The Committee considered this information in evaluating PWC’s independence.
| Fiscal Year Ended August 31, | Total Non-Audit Fees Billed to Fund (A) | Total Non-Audit Fees billed to Adviser and Affiliated Fund Service Providers (engagements related directly to the operations and financial reporting of the Fund) (B) | Total Non-Audit Fees billed to Adviser and Affiliated Fund Service Providers (all other engagements) (C) | Total of (A), (B) and (C) | ||||||||||||
| 2012 | $ | 0 | $ | 56,300 | $ | 0 | $ | 56,300 | ||||||||
| 2011 | $ | 0 | $ | 0 | $ | 0 | $ | 0 | ||||||||
Audit Committee Pre-Approval Policies and Procedures. Generally, each Fund’s Audit Committee must pre approve (i) all services to be performed for a Fund by a Fund’s Independent Registered Public Accounting Firm and (ii) all non-audit services to be performed by a Fund’s Independent Registered Public Accounting Firm for the DIMA Entities with respect to operations and financial reporting of the Fund, except that the Chairperson or Vice Chairperson of each Fund’s Audit Committee may grant the pre-approval for non-audit services described in items (i) and (ii) above for non-prohibited services for engagements of less than $100,000. All such delegated pre approvals shall be presented to each Fund’s Audit Committee no later than the next Audit Committee meeting.
There were no amounts that were approved by the Audit Committee pursuant to the de minimis exception under Rule 2-01 of Regulation S-X.
According to the registrant’s principal Independent Registered Public Accounting Firm, substantially all of the principal Independent Registered Public Accounting Firm's hours spent on auditing the registrant's financial statements were attributed to work performed by full-time permanent employees of the principal Independent Registered Public Accounting Firm.
***
PwC advised the Fund's Audit Committee that it had identified one matter that it determined could be inconsistent with the SEC's auditor independence rules (Rule 2-01(c) of Regulation S-X). As part of a "Global Migration Support" engagement in which PwC's UK network affiliate ("PwC-UK") provided assistance to Deutsche Bank ("DB") with respect to processing internship applications for DB employees seeking short term assignments with DB in the UK, PwC-UK paid application fees on behalf of DB for six applicants at 170 pounds each (1,020 pounds in total). PwC advised the Committee that it believes that this matter did not affect its objectivity or its impartial judgment in conducting its audit and issuing a report on the financial statements of the Fund as the Fund's independent auditor and confirmed its independence under the SEC’s auditor independence rules. In reaching this conclusion, PwC noted that the engagement team was not aware of the payment of the application fees by PwC-UK and that DB reimbursed PwC-UK for the fees.
DWS LIFECOMPASS 2015 FUND
FORM N-CSR DISCLOSURE RE: AUDIT FEES
The following table shows the amount of fees that PricewaterhouseCoopers, LLP (“PWC”), the Fund’s independent registered public accounting firm, billed to the Fund during the Fund’s last two fiscal years. The Audit Committee approved in advance all audit services and non-audit services that PWC provided to the Fund.
Services that the Fund’s Independent Registered Public Accounting Firm Billed to the Fund
| Fiscal Year Ended August 31, | Audit Fees Billed to Fund | Audit-Related Fees Billed to Fund | Tax Fees Billed to Fund | All Other Fees Billed to Fund | ||||||||||||
| 2012 | $ | 39,115 | $ | 0 | $ | 0 | $ | 0 | ||||||||
| 2011 | $ | 37,781 | $ | 0 | $ | 0 | $ | 0 | ||||||||
Services that the Fund’s Independent Registered Public Accounting Firm Billed to the Adviser and Affiliated Fund Service Providers
The following table shows the amount of fees billed by PWC to Deutsche Investment Management Americas Inc. (“DeIM” or the “Adviser”), and any entity controlling, controlled by or under common control with DeIM (“Control Affiliate”) that provides ongoing services to the Fund (“Affiliated Fund Service Provider”), for engagements directly related to the Fund’s operations and financial reporting, during the Fund’s last two fiscal years.
| Fiscal Year Ended August 31, | Audit-Related Fees Billed to Adviser and Affiliated Fund Service Providers | Tax Fees Billed to Adviser and Affiliated Fund Service Providers | All Other Fees Billed to Adviser and Affiliated Fund Service Providers | |||||||||
| 2012 | $ | 0 | $ | 56,300 | $ | 0 | ||||||
| 2011 | $ | 0 | $ | 0 | $ | 0 | ||||||
The “Tax Fees Billed to the Advisor” were billed for services associated with foreign tax filings.
Non-Audit Services
The following table shows the amount of fees that PWC billed during the Fund’s last two fiscal years for non-audit services. The Audit Committee pre-approved all non-audit services that PWC provided to the Adviser and any Affiliated Fund Service Provider that related directly to the Fund’s operations and financial reporting. The Audit Committee requested and received information from PWC about any non-audit services that PWC rendered during the Fund’s last fiscal year to the Adviser and any Affiliated Fund Service Provider. The Committee considered this information in evaluating PWC’s independence.
| Fiscal Year Ended August 31, | Total Non-Audit Fees Billed to Fund (A) | Total Non-Audit Fees billed to Adviser and Affiliated Fund Service Providers (engagements related directly to the operations and financial reporting of the Fund) (B) | Total Non-Audit Fees billed to Adviser and Affiliated Fund Service Providers (all other engagements) (C) | Total of (A), (B) and (C) | ||||||||||||
| 2012 | $ | 0 | $ | 56,300 | $ | 0 | $ | 56,300 | ||||||||
| 2011 | $ | 0 | $ | 0 | $ | 0 | $ | 0 | ||||||||
Audit Committee Pre-Approval Policies and Procedures. Generally, each Fund’s Audit Committee must pre approve (i) all services to be performed for a Fund by a Fund’s Independent Registered Public Accounting Firm and (ii) all non-audit services to be performed by a Fund’s Independent Registered Public Accounting Firm for the DIMA Entities with respect to operations and financial reporting of the Fund, except that the Chairperson or Vice Chairperson of each Fund’s Audit Committee may grant the pre-approval for non-audit services described in items (i) and (ii) above for non-prohibited services for engagements of less than $100,000. All such delegated pre approvals shall be presented to each Fund’s Audit Committee no later than the next Audit Committee meeting.
There were no amounts that were approved by the Audit Committee pursuant to the de minimis exception under Rule 2-01 of Regulation S-X.
According to the registrant’s principal Independent Registered Public Accounting Firm, substantially all of the principal Independent Registered Public Accounting Firm's hours spent on auditing the registrant's financial statements were attributed to work performed by full-time permanent employees of the principal Independent Registered Public Accounting Firm.
***
PwC advised the Fund's Audit Committee that it had identified one matter that it determined could be inconsistent with the SEC's auditor independence rules (Rule 2-01(c) of Regulation S-X). As part of a "Global Migration Support" engagement in which PwC's UK network affiliate ("PwC-UK") provided assistance to Deutsche Bank ("DB") with respect to processing internship applications for DB employees seeking short term assignments with DB in the UK, PwC-UK paid application fees on behalf of DB for six applicants at 170 pounds each (1,020 pounds in total). PwC advised the Committee that it believes that this matter did not affect its objectivity or its impartial judgment in conducting its audit and issuing a report on the financial statements of the Fund as the Fund's independent auditor and confirmed its independence under the SEC’s auditor independence rules. In reaching this conclusion, PwC noted that the engagement team was not aware of the payment of the application fees by PwC-UK and that DB reimbursed PwC-UK for the fees.
DWS LIFECOMPASS 2020 FUND
FORM N-CSR DISCLOSURE RE: AUDIT FEES
The following table shows the amount of fees that PricewaterhouseCoopers, LLP (“PWC”), the Fund’s independent registered public accounting firm, billed to the Fund during the Fund’s last two fiscal years. The Audit Committee approved in advance all audit services and non-audit services that PWC provided to the Fund.
Services that the Fund’s Independent Registered Public Accounting Firm Billed to the Fund
| Fiscal Year Ended August 31, | Audit Fees Billed to Fund | Audit-Related Fees Billed to Fund | Tax Fees Billed to Fund | All Other Fees Billed to Fund | ||||||||||||
| 2012 | $ | 39,115 | $ | 0 | $ | 0 | $ | 0 | ||||||||
| 2011 | $ | 37,781 | $ | 0 | $ | 0 | $ | 0 | ||||||||
Services that the Fund’s Independent Registered Public Accounting Firm Billed to the Adviser and Affiliated Fund Service Providers
The following table shows the amount of fees billed by PWC to Deutsche Investment Management Americas Inc. (“DeIM” or the “Adviser”), and any entity controlling, controlled by or under common control with DeIM (“Control Affiliate”) that provides ongoing services to the Fund (“Affiliated Fund Service Provider”), for engagements directly related to the Fund’s operations and financial reporting, during the Fund’s last two fiscal years.
| Fiscal Year Ended August 31, | Audit-Related Fees Billed to Adviser and Affiliated Fund Service Providers | Tax Fees Billed to Adviser and Affiliated Fund Service Providers | All Other Fees Billed to Adviser and Affiliated Fund Service Providers | |||||||||
| 2012 | $ | 0 | $ | 56,300 | $ | 0 | ||||||
| 2011 | $ | 0 | $ | 0 | $ | 0 | ||||||
The “Tax Fees Billed to the Advisor” were billed for services associated with foreign tax filings.
Non-Audit Services
The following table shows the amount of fees that PWC billed during the Fund’s last two fiscal years for non-audit services. The Audit Committee pre-approved all non-audit services that PWC provided to the Adviser and any Affiliated Fund Service Provider that related directly to the Fund’s operations and financial reporting. The Audit Committee requested and received information from PWC about any non-audit services that PWC rendered during the Fund’s last fiscal year to the Adviser and any Affiliated Fund Service Provider. The Committee considered this information in evaluating PWC’s independence.
| Fiscal Year Ended August 31, | Total Non-Audit Fees Billed to Fund (A) | Total Non-Audit Fees billed to Adviser and Affiliated Fund Service Providers (engagements related directly to the operations and financial reporting of the Fund) (B) | Total Non-Audit Fees billed to Adviser and Affiliated Fund Service Providers (all other engagements) (C) | Total of (A), (B) and (C) | ||||||||||||
| 2012 | $ | 0 | $ | 56,300 | $ | 0 | $ | 56,300 | ||||||||
| 2011 | $ | 0 | $ | 0 | $ | 0 | $ | 0 | ||||||||
Audit Committee Pre-Approval Policies and Procedures. Generally, each Fund’s Audit Committee must pre approve (i) all services to be performed for a Fund by a Fund’s Independent Registered Public Accounting Firm and (ii) all non-audit services to be performed by a Fund’s Independent Registered Public Accounting Firm for the DIMA Entities with respect to operations and financial reporting of the Fund, except that the Chairperson or Vice Chairperson of each Fund’s Audit Committee may grant the pre-approval for non-audit services described in items (i) and (ii) above for non-prohibited services for engagements of less than $100,000. All such delegated pre approvals shall be presented to each Fund’s Audit Committee no later than the next Audit Committee meeting.
There were no amounts that were approved by the Audit Committee pursuant to the de minimis exception under Rule 2-01 of Regulation S-X.
According to the registrant’s principal Independent Registered Public Accounting Firm, substantially all of the principal Independent Registered Public Accounting Firm's hours spent on auditing the registrant's financial statements were attributed to work performed by full-time permanent employees of the principal Independent Registered Public Accounting Firm.
***
PwC advised the Fund's Audit Committee that it had identified one matter that it determined could be inconsistent with the SEC's auditor independence rules (Rule 2-01(c) of Regulation S-X). As part of a "Global Migration Support" engagement in which PwC's UK network affiliate ("PwC-UK") provided assistance to Deutsche Bank ("DB") with respect to processing internship applications for DB employees seeking short term assignments with DB in the UK, PwC-UK paid application fees on behalf of DB for six applicants at 170 pounds each (1,020 pounds in total). PwC advised the Committee that it believes that this matter did not affect its objectivity or its impartial judgment in conducting its audit and issuing a report on the financial statements of the Fund as the Fund's independent auditor and confirmed its independence under the SEC’s auditor independence rules. In reaching this conclusion, PwC noted that the engagement team was not aware of the payment of the application fees by PwC-UK and that DB reimbursed PwC-UK for the fees.
DWS LIFECOMPASS 2030 FUND
FORM N-CSR DISCLOSURE RE: AUDIT FEES
The following table shows the amount of fees that PricewaterhouseCoopers, LLP (“PWC”), the Fund’s independent registered public accounting firm, billed to the Fund during the Fund’s last two fiscal years. The Audit Committee approved in advance all audit services and non-audit services that PWC provided to the Fund.
Services that the Fund’s Independent Registered Public Accounting Firm Billed to the Fund
| Fiscal Year Ended August 31, | Audit Fees Billed to Fund | Audit-Related Fees Billed to Fund | Tax Fees Billed to Fund | All Other Fees Billed to Fund | ||||||||||||
| 2012 | $ | 39,115 | $ | 0 | $ | 0 | $ | 0 | ||||||||
| 2011 | $ | 37,781 | $ | 0 | $ | 0 | $ | 0 | ||||||||
Services that the Fund’s Independent Registered Public Accounting Firm Billed to the Adviser and Affiliated Fund Service Providers
The following table shows the amount of fees billed by PWC to Deutsche Investment Management Americas Inc. (“DeIM” or the “Adviser”), and any entity controlling, controlled by or under common control with DeIM (“Control Affiliate”) that provides ongoing services to the Fund (“Affiliated Fund Service Provider”), for engagements directly related to the Fund’s operations and financial reporting, during the Fund’s last two fiscal years.
| Fiscal Year Ended August 31, | Audit-Related Fees Billed to Adviser and Affiliated Fund Service Providers | Tax Fees Billed to Adviser and Affiliated Fund Service Providers | All Other Fees Billed to Adviser and Affiliated Fund Service Providers | |||||||||
| 2012 | $ | 0 | $ | 56,300 | $ | 0 | ||||||
| 2011 | $ | 0 | $ | 0 | $ | 0 | ||||||
The “Tax Fees Billed to the Advisor” were billed for services associated with foreign tax filings.
Non-Audit Services
The following table shows the amount of fees that PWC billed during the Fund’s last two fiscal years for non-audit services. The Audit Committee pre-approved all non-audit services that PWC provided to the Adviser and any Affiliated Fund Service Provider that related directly to the Fund’s operations and financial reporting. The Audit Committee requested and received information from PWC about any non-audit services that PWC rendered during the Fund’s last fiscal year to the Adviser and any Affiliated Fund Service Provider. The Committee considered this information in evaluating PWC’s independence.
| Fiscal Year Ended August 31, | Total Non-Audit Fees Billed to Fund (A) | Total Non-Audit Fees billed to Adviser and Affiliated Fund Service Providers (engagements related directly to the operations and financial reporting of the Fund) (B) | Total Non-Audit Fees billed to Adviser and Affiliated Fund Service Providers (all other engagements) (C) | Total of (A), (B) and (C) | ||||||||||||
| 2012 | $ | 0 | $ | 56,300 | $ | 0 | $ | 56,300 | ||||||||
| 2011 | $ | 0 | $ | 0 | $ | 0 | $ | 0 | ||||||||
Audit Committee Pre-Approval Policies and Procedures. Generally, each Fund’s Audit Committee must pre approve (i) all services to be performed for a Fund by a Fund’s Independent Registered Public Accounting Firm and (ii) all non-audit services to be performed by a Fund’s Independent Registered Public Accounting Firm for the DIMA Entities with respect to operations and financial reporting of the Fund, except that the Chairperson or Vice Chairperson of each Fund’s Audit Committee may grant the pre-approval for non-audit services described in items (i) and (ii) above for non-prohibited services for engagements of less than $100,000. All such delegated pre approvals shall be presented to each Fund’s Audit Committee no later than the next Audit Committee meeting.
There were no amounts that were approved by the Audit Committee pursuant to the de minimis exception under Rule 2-01 of Regulation S-X.
According to the registrant’s principal Independent Registered Public Accounting Firm, substantially all of the principal Independent Registered Public Accounting Firm's hours spent on auditing the registrant's financial statements were attributed to work performed by full-time permanent employees of the principal Independent Registered Public Accounting Firm.
***
PwC advised the Fund's Audit Committee that it had identified one matter that it determined could be inconsistent with the SEC's auditor independence rules (Rule 2-01(c) of Regulation S-X). As part of a "Global Migration Support" engagement in which PwC's UK network affiliate ("PwC-UK") provided assistance to Deutsche Bank ("DB") with respect to processing internship applications for DB employees seeking short term assignments with DB in the UK, PwC-UK paid application fees on behalf of DB for six applicants at 170 pounds each (1,020 pounds in total). PwC advised the Committee that it believes that this matter did not affect its objectivity or its impartial judgment in conducting its audit and issuing a report on the financial statements of the Fund as the Fund's independent auditor and confirmed its independence under the SEC’s auditor independence rules. In reaching this conclusion, PwC noted that the engagement team was not aware of the payment of the application fees by PwC-UK and that DB reimbursed PwC-UK for the fees.
DWS LIFECOMPASS 2040 FUND
FORM N-CSR DISCLOSURE RE: AUDIT FEES
The following table shows the amount of fees that PricewaterhouseCoopers, LLP (“PWC”), the Fund’s independent registered public accounting firm, billed to the Fund during the Fund’s last two fiscal years. The Audit Committee approved in advance all audit services and non-audit services that PWC provided to the Fund.
Services that the Fund’s Independent Registered Public Accounting Firm Billed to the Fund
| Fiscal Year Ended August 31, | Audit Fees Billed to Fund | Audit-Related Fees Billed to Fund | Tax Fees Billed to Fund | All Other Fees Billed to Fund | ||||||||||||
| 2012 | $ | 39,115 | $ | 0 | $ | 0 | $ | 0 | ||||||||
| 2011 | $ | 37,781 | $ | 0 | $ | 0 | $ | 0 | ||||||||
Services that the Fund’s Independent Registered Public Accounting Firm Billed to the Adviser and Affiliated Fund Service Providers
The following table shows the amount of fees billed by PWC to Deutsche Investment Management Americas Inc. (“DeIM” or the “Adviser”), and any entity controlling, controlled by or under common control with DeIM (“Control Affiliate”) that provides ongoing services to the Fund (“Affiliated Fund Service Provider”), for engagements directly related to the Fund’s operations and financial reporting, during the Fund’s last two fiscal years.
| Fiscal Year Ended August 31, | Audit-Related Fees Billed to Adviser and Affiliated Fund Service Providers | Tax Fees Billed to Adviser and Affiliated Fund Service Providers | All Other Fees Billed to Adviser and Affiliated Fund Service Providers | |||||||||
| 2012 | $ | 0 | $ | 56,300 | $ | 0 | ||||||
| 2011 | $ | 0 | $ | 0 | $ | 0 | ||||||
The “Tax Fees Billed to the Advisor” were billed for services associated with foreign tax filings.
Non-Audit Services
The following table shows the amount of fees that PWC billed during the Fund’s last two fiscal years for non-audit services. The Audit Committee pre-approved all non-audit services that PWC provided to the Adviser and any Affiliated Fund Service Provider that related directly to the Fund’s operations and financial reporting. The Audit Committee requested and received information from PWC about any non-audit services that PWC rendered during the Fund’s last fiscal year to the Adviser and any Affiliated Fund Service Provider. The Committee considered this information in evaluating PWC’s independence.
| Fiscal Year Ended August 31, | Total Non-Audit Fees Billed to Fund (A) | Total Non-Audit Fees billed to Adviser and Affiliated Fund Service Providers (engagements related directly to the operations and financial reporting of the Fund) (B) | Total Non-Audit Fees billed to Adviser and Affiliated Fund Service Providers (all other engagements) (C) | Total of (A), (B) and (C) | ||||||||||||
| 2012 | $ | 0 | $ | 56,300 | $ | 0 | $ | 56,300 | ||||||||
| 2011 | $ | 0 | $ | 0 | $ | 0 | $ | 0 | ||||||||
Audit Committee Pre-Approval Policies and Procedures. Generally, each Fund’s Audit Committee must pre approve (i) all services to be performed for a Fund by a Fund’s Independent Registered Public Accounting Firm and (ii) all non-audit services to be performed by a Fund’s Independent Registered Public Accounting Firm for the DIMA Entities with respect to operations and financial reporting of the Fund, except that the Chairperson or Vice Chairperson of each Fund’s Audit Committee may grant the pre-approval for non-audit services described in items (i) and (ii) above for non-prohibited services for engagements of less than $100,000. All such delegated pre approvals shall be presented to each Fund’s Audit Committee no later than the next Audit Committee meeting.
There were no amounts that were approved by the Audit Committee pursuant to the de minimis exception under Rule 2-01 of Regulation S-X.
According to the registrant’s principal Independent Registered Public Accounting Firm, substantially all of the principal Independent Registered Public Accounting Firm's hours spent on auditing the registrant's financial statements were attributed to work performed by full-time permanent employees of the principal Independent Registered Public Accounting Firm.
***
PwC advised the Fund's Audit Committee that it had identified one matter that it determined could be inconsistent with the SEC's auditor independence rules (Rule 2-01(c) of Regulation S-X). As part of a "Global Migration Support" engagement in which PwC's UK network affiliate ("PwC-UK") provided assistance to Deutsche Bank ("DB") with respect to processing internship applications for DB employees seeking short term assignments with DB in the UK, PwC-UK paid application fees on behalf of DB for six applicants at 170 pounds each (1,020 pounds in total). PwC advised the Committee that it believes that this matter did not affect its objectivity or its impartial judgment in conducting its audit and issuing a report on the financial statements of the Fund as the Fund's independent auditor and confirmed its independence under the SEC’s auditor independence rules. In reaching this conclusion, PwC noted that the engagement team was not aware of the payment of the application fees by PwC-UK and that DB reimbursed PwC-UK for the fees.
| ITEM 5. | AUDIT COMMITTEE OF LISTED REGISTRANTS | |
| Not applicable | ||
| ITEM 6. | SCHEDULE OF INVESTMENTS | |
| Not applicable | ||
| ITEM 7. | DISCLOSURE OF PROXY VOTING POLICIES AND PROCEDURES FOR CLOSED-END MANAGEMENT INVESTMENT COMPANIES | |
| Not applicable | ||
| ITEM 8. | PORTFOLIO MANAGERS OF CLOSED-END MANAGEMENT INVESTMENT COMPANIES | |
| Not applicable | ||
| ITEM 9. | PURCHASES OF EQUITY SECURITIES BY CLOSED-END MANAGEMENT INVESTMENT COMPANY AND AFFILIATED PURCHASERS | |
| Not applicable | ||
| ITEM 10. | SUBMISSION OF MATTERS TO A VOTE OF SECURITY HOLDERS | |
| There were no material changes to the procedures by which shareholders may recommend nominees to the Fund’s Board. The primary function of the Nominating and Governance Committee is to identify and recommend individuals for membership on the Board and oversee the administration of the Board Governance Guidelines. Shareholders may recommend candidates for Board positions by forwarding their correspondence by U.S. mail or courier service to Paul K. Freeman, Independent Chairman, DWS Funds, P.O. Box 101833, Denver, CO 80250-1833. | ||
| ITEM 11. | CONTROLS AND PROCEDURES | |
| (a) | The Chief Executive and Financial Officers concluded that the Registrant’s Disclosure Controls and Procedures are effective based on the evaluation of the Disclosure Controls and Procedures as of a date within 90 days of the filing date of this report. | |
| (b) | There have been no changes in the registrant’s internal control over financial reporting that occurred during the second fiscal quarter of the period covered by this report that has materially affected, or is reasonably likely to materially affect, the registrant’s internal controls over financial reporting. | |
| ITEM 12. | EXHIBITS | |
| (a)(1) | Code of Ethics pursuant to Item 2 of Form N-CSR is filed and attached hereto as EX-99.CODE ETH. | |
| (a)(2) | Certification pursuant to Rule 30a-2(a) under the Investment Company Act of 1940 (17 CFR 270.30a-2(a)) is filed and attached hereto as Exhibit 99.CERT. | |
| (b) | Certification pursuant to Rule 30a-2(b) under the Investment Company Act of 1940 (17 CFR 270.30a-2(b)) is furnished and attached hereto as Exhibit 99.906CERT. | |
Form N-CSR Item F
SIGNATURES
Pursuant to the requirements of the Securities Exchange Act of 1934 and the Investment Company Act of 1940, the registrant has duly caused this report to be signed on its behalf by the undersigned, thereunto duly authorized.
| Registrant: | DWS Target Date Series |
| By: | /s/W. Douglas Beck W. Douglas Beck President |
| Date: | October 30, 2012 |
Pursuant to the requirements of the Securities Exchange Act of 1934 and the Investment Company Act of 1940, this report has been signed below by the following persons on behalf of the registrant and in the capacities and on the dates indicated.
| By: | /s/W. Douglas Beck W. Douglas Beck President |
| Date: | October 30, 2012 |
| By: | /s/Paul Schubert Paul Schubert Chief Financial Officer and Treasurer |
| Date: | October 30, 2012 |