UNITED STATES
SECURITIES AND EXCHANGE COMMISSION
WASHINGTON, D. C. 20549
FORM N-CSR
Investment Company Act file number: 811-08606
Deutsche Target Date Series
(Exact Name of Registrant as Specified in Charter)
345 Park Avenue
New York, NY 10154-0004
(Address of Principal Executive Offices) (Zip Code)
Registrant’s Telephone Number, including Area Code: (212) 250-3220
Paul Schubert
60 Wall Street
New York, NY 10005
(Name and Address of Agent for Service)
| Date of fiscal year end: | 8/31 |
| Date of reporting period: | 8/31/2014 |
| ITEM 1. | REPORT TO STOCKHOLDERS |

August 31, 2014
Annual Report
to Shareholders
Deutsche Target Date Series
(formerly DWS Target Date Series)
Deutsche LifeCompass Retirement Fund
(formerly DWS LifeCompass Retirement Fund)
Deutsche LifeCompass 2015 Fund
(formerly DWS LifeCompass 2015 Fund)
Deutsche LifeCompass 2020 Fund
(formerly DWS LifeCompass 2020 Fund)
Deutsche LifeCompass 2030 Fund
(formerly DWS LifeCompass 2030 Fund)
Deutsche LifeCompass 2040 Fund
(formerly DWS LifeCompass 2040 Fund)
Contents
3 Letter to Shareholders 4 Portfolio Management Review 12 Performance Summaries 22 Investment Portfolios 38 Statements of Assets and Liabilities 42 Statements of Operations 44 Statements of Changes in Net Assets 49 Financial Highlights 68 Notes to Financial Statements 95 Report of Independent Registered Public Accounting Firm 96 Information About Each Fund's Expenses 102 Tax Information 103 Advisory Agreement Board Considerations and Fee Evaluation 110 Board Members and Officers 115 Account Management Resources |
This report must be preceded or accompanied by a prospectus. To obtain a summary prospectus, if available, or prospectus for any of our funds, refer to the Account Management Resources information provided in the back of this booklet. We advise you to consider each fund's objectives, risks, charges and expenses carefully before investing. The summary prospectus and prospectus contain this and other important information about the fund. Please read the prospectus carefully before you invest.
Although allocation among different asset categories generally limits risk, portfolio management may favor an asset category that underperforms other assets or markets as a whole. Bond investments are subject to interest-rate, credit, liquidity and market risks to varying degrees. When interest rates rise, bond prices generally fall. Credit risk refers to the ability of an issuer to make timely payments of principal and interest. Investing in derivatives entails special risks relating to liquidity, leverage and credit that may reduce returns and/or increase volatility. Because Exchange Traded Funds (ETFs) trade on a securities exchange, their shares may trade at a premium or discount to their net asset value. ETFs also incur fees and expenses so they may not fully match the performance of the indexes they are designed to track. Investing in foreign securities, particularly those of emerging markets, presents certain risks, such as currency fluctuations, political and economic changes, and market risks. The fund may lend securities to approved institutions. Stocks may decline in value. See the prospectus for details.
Target date funds are designed for investors seeking to meet their respective investment goals, such as retirement, around the target date year. The target date is the approximate date when investors plan to start withdrawing their money in the fund. As the fund approaches its target year, the fund will decrease its emphasis on growth of capital and increase its emphasis on current income. The principal value of the funds is not guaranteed at any time, including at the target date. There is no guarantee that the fund will provide adequate income at and through retirement.
Deutsche Asset & Wealth Management represents the asset management and wealth management activities conducted by Deutsche Bank AG or any of its subsidiaries, including the Advisor and DeAWM Distributors, Inc.
NOT FDIC/NCUA INSURED NO BANK GUARANTEE MAY LOSE VALUE NOT A DEPOSIT NOT INSURED BY ANY FEDERAL GOVERNMENT AGENCY
Dear Shareholder:
I am very pleased to tell you that the DWS funds have been renamed Deutsche funds, aligning more closely with the Deutsche Asset & Wealth Management brand. We are proud to adopt the Deutsche name — a brand that fully represents the global access, discipline and intelligence that support all of our products and services.
Deutsche Asset & Wealth Management combines the asset management and wealth management divisions of Deutsche Bank to deliver a comprehensive suite of active, passive and alternative investment capabilities. Your investment in the Deutsche funds means you have access to the thought leadership and resources of one of the world’s largest and most influential financial institutions.
In conjunction with your fund’s name change, please note that the Deutsche funds’ Web address has changed as well. The former dws-investments.com is now deutschefunds.com.
In addition, key service providers have been renamed as follows:
| Former Name | New name, effective August 11, 2014 |
| DWS Investments Distributors, Inc. | DeAWM Distributors, Inc. |
| DWS Trust Company | DeAWM Trust Company |
| DWS Investments Service Company | DeAWM Service Company |
These changes have no effect on the day-to-day management of your investment, and there is no action required on your part. You will continue to experience the benefits that come from our decades of experience, in-depth research and worldwide network of investment professionals.
Thanks for your continued support. We appreciate your trust and the opportunity to put our capabilities to work for you.
Best regards,


Brian Binder
President, Deutsche Funds
Market Overview and Fund Performance
All performance information below is historical and does not guarantee future results. Returns shown are for Class A shares, unadjusted for sales charges. Investment return and principal fluctuate, so your shares may be worth more or less when redeemed. Current performance may differ from performance data shown. Please visit deutschefunds.com for the most recent month-end performance of all share classes. Fund performance includes reinvestment of all distributions. Unadjusted returns do not reflect sales charges and would have been lower if they had. Please refer to pages 12 through 21 for more complete performance information.
During the one-year period ended August 31, 2014, the five funds in the LifeCompass Series performed as follows:
Deutsche LifeCompass Retirement Fund S&P Target Date Retirement Income Index Morningstar Retirement Income Funds avg. | 11.36% 9.33% 10.02% |
Deutsche LifeCompass 2015 Fund S&P Target Date 2015 Index Morningstar Target Date 2011–2015 Funds avg. | 12.65% 12.94% 12.00% |
Deutsche LifeCompass 2020 Fund S&P Target Date 2020 Index Morningstar Target Date 2016–2020 Funds avg. | 14.68% 14.46% 13.33% |
Deutsche LifeCompass 2030 Fund S&P Target Date 2030 Index Morningstar Target Date 2026–2030 Funds avg. | 17.23% 16.75% 16.23% |
Deutsche LifeCompass 2040 Fund S&P Target Date 2040 Index Morningstar Target Date 2036–2040 Funds avg. | 18.54% 18.51% 18.06% |
Financial assets delivered strong returns during the past year, providing a tailwind for the five funds in the LifeCompass Series. Domestic equities were the best-performing major asset class, based on the 25.36% return of large-cap stocks, as gauged by the Russell 1000® Index, and the 17.68% return of small-cap stocks, as measured by the Russell 2000® Index. U.S. stocks were boosted by favorable earnings trends and the relative strength of the country’s economy compared to its major developed-market counterparts. Given the backdrop of improving growth and the likelihood that the U.S. Federal Reserve Board (the Fed) will maintain its policy of near-zero interest rates for at least another year, investors continued to move cash out of lower-risk investments and into equities.
Investment Strategy Each fund is currently managed using a dynamic asset allocation risk-managed process. The Deutsche LifeCompass Retirement Fund (the "Retirement Fund") is generally designed for investors who are retired. The Deutsche LifeCompass 2015, 2020, 2030 and 2040 Funds (the "Target Date Fund(s)") are generally designed for investors who anticipate retiring around one of those dates. Each Target Date Fund’s target level of portfolio risk and asset allocation will approach that of the Retirement Fund over time and, upon reaching its stated target year, will be similar to that of the Retirement Fund. |
International equities also performed very well during the past 12 months, reflecting the positive backdrop for both economic growth and global central bank policy. While the economic recovery has been more uneven overseas than it has in the United States, investors responded favorably to Europe’s return to positive growth in late 2013 and the first half of this year. In addition, economic conditions in the emerging markets showed signs of stabilizing, particularly in key individual countries such as China, India and Brazil. Central bank policy also played an important role in market performance. Although the U.S. Federal Reserve has curtailed the stimulus policy known as quantitative easing, the central banks of both Europe and Japan picked up the slack with accommodative policies of their own. Taken together, these factors helped propel the foreign markets to robust, double-digit gains during the period. The developed-market MSCI EAFE Index finished with a return of 16.43%, while the MSCI Emerging Markets Index posted a gain of 19.98%.
The bond market also delivered a gain during the past year, a result that ran contrary to the very negative expectations that existed at the beginning of the period. Entering the fund’s reporting period, the prevailing fear was that bond prices would be pressured by the less accommodative policies of the Fed. The Fed began the process of tapering its quantitative easing in late 2013, and it has stated its intention to begin raising interest rates next year. Despite this potential headwind, bonds were helped by an environment of slower-than-expected first-quarter growth, high demand from institutional investors and the continued appetite for income- producing assets. The investment-grade Barclays U.S. Aggregate Bond Index finished with a return of 5.66%, while the Credit Suisse High Yield Index delivered a gain of 10.46%.
"Consistent with the broader environment, the funds’ equity allocations performed very well and were the primary driver of returns during the past year."
Fund Performance
The Deutsche LifeCompass Funds are structured to meet the needs of investors with a wide range of retirement time horizons. With five funds in the series, this group of funds may be appropriate for a variety of investors, ranging from those who are retired and in need of current income to those with many years to invest for the future.
The LifeCompass Funds are invested in a mix of stocks, bonds and alternative investments. The funds’ target weightings in stocks are higher for the longer-dated funds and lower for those closest to maturity. Given the outperformance of stocks relative to bonds during the past year, the returns of the five funds in the series increased in tandem with the length of time until their maturity.
Consistent with the broader environment, the funds’ equity allocations performed very well and were the primary driver of returns during the past year. The best returns came from our positions in domestic large-cap funds, which a key element of performance was given that the asset class carries a substantial weighting across all of the portfolios. While U.S. large-caps made the largest contribution, performance was strong across the board as all of the funds in our equity allocations finished the annual period with a positive return.
As designed, the funds’ fixed-income allocation provided income, diversification and a measure of stability. Our bond allocation also delivered robust performance during the past 12 months, with all of the funds in the fixed-income portfolio finishing with a positive return. The strongest performance came from our allocations to the credit-sensitive segments of the bond market, particularly high-yield bonds, emerging-markets debt and funds with substantial positions in investment-grade corporate bonds.
The funds also devote a portion of their portfolios to alternative assets. While the results of our individual allocations were mixed, the net effect was positive for the funds. Our allocations to global infrastructure stocks, real estate and convertible bonds performed very well, offsetting the negative impact of our allocations to commodities and a market-neutral strategy.
Outlook and Positioning
The allocation to alternative assets represents a new addition during the past year. We believe the alternative asset classes not only have favorable longer-term prospects, but they can also help augment diversification and provide a measure of protection against the possibility of rising inflation.
We financed these purchases by reducing the funds’ allocation to bonds. Although we believe bonds can continue to fulfill their traditional roles of income, portfolio stability and diversification, we also expect bond yields to trend gradually higher over time — a shift that could reduce bonds’ total return potential in the years ahead. Our fixed-income allocation remains well diversified among a variety of market segments, which provides exposure to a wide variety of outcomes in the world economy and financial markets.
The funds continue to have a healthy exposure to equities, with a tilt in favor of the U.S. market. While stocks’ risk-return profile is less favorable now in the wake of their outstanding gains of the past three years, we continue to believe the broader environment — characterized by low interest rates and favorable economic growth — remains supportive for equities. Our equity allocation remains well diversified among both geographies and market capitalization ranges.
We are pleased that the funds delivered strong absolute returns and performed well relative to their respective benchmarks during the past year. We continue to review the funds’ asset allocation periodically, and we are always looking for opportunities to expand our investment universe and increase diversification among managers and investment styles.
Portfolio Management Team
Pankaj Bhatnagar, PhD, Managing Director
Portfolio Manager of the fund. Began managing the fund in 2013.
— Joined Deutsche Asset & Wealth Management in 2000 with seven years of industry experience; previously, served in Quantitative Strategy roles at Nomura Securities, Credit Suisse and Salomon Brothers.
— Portfolio Manager for the Quantitative Group: New York.
— Degree in Civil Engineering, Indian Institute of Technology; MBA, Kent State University; PhD in Finance, University of North Carolina at Chapel Hill.
Louis Cucciniello, Managing Director
Portfolio Manager of the fund. Began managing the fund in 2013.
— Global Co-Head of Retirement and Hybrid Products and Member of Alternatives and Fund Solutions Executive Committee.
— Joined Deutsche Asset & Wealth Management in 2013.
— Formerly, Global Head of Multi-Asset Trading at Deutsche Bank, London.
— Joined Deutsche Bank in 2006 with 13 years of industry experience; previously served as Head of FX Options, Trading and Sales for non-Japan Asia at JP Morgan Singapore, as an Emerging Markets and Commodities Trader and as an Analyst in the Market Risk Management Group at JP Morgan NY.
— BS in Engineering Physics, Cornell University; MBA, University of Chicago.
Darwei Kung, Director
Portfolio Manager of the fund. Began managing the fund in 2013.
— Joined Deutsche Asset & Wealth Management in 2006; previously has worked as a Director, Engineering and Business Development at Calpoint LLC from 2001–2004.
— Portfolio Manager: New York.
— BS and MS, University of Washington, Seattle; MS and MBA, Carnegie Mellon University.
The views expressed reflect those of the portfolio management team only through the end of the period of the report as stated on the cover. The management team's views are subject to change at any time based on market and other conditions and should not be construed as a recommendation. Past performance is no guarantee of future results. Current and future portfolio holdings are subject to risk.
Terms to Know
The S&P Target Date Retirement Income Index seeks to represent investment opportunity generally available in target date funds through an asset allocation which targets an immediate retirement allocation.
The S&P Target Date 2015 Index seeks to represent investment opportunity generally available in target date funds through an asset allocation which targets retirement horizon on or around 2015.
The S&P Target Date 2020 Index seeks to represent investment opportunity generally available in target date funds through an asset allocation which targets retirement horizon on or around 2020.
The S&P Target Date 2030 Index seeks to represent investment opportunity generally available in target date funds through an asset allocation which targets retirement horizon on or around 2030.
The S&P Target Date 2040 Index seeks to represent investment opportunity generally available in target date funds through an asset allocation which targets retirement horizon on or around 2040.
The Russell 1000 Index is an unmanaged index that measures the performance of the 1,000 largest companies in the Russell 3000® Index.
The Russell 2000 Index is an unmanaged index that measures the performance of the 2,000 smallest companies in the Russell 3000 Index.
The Morgan Stanley Capital International (MSCI) EAFE Index tracks the performance of stocks in select developed markets outside of the United States. The index is calculated using closing local market prices and translates into U.S. dollars using the London close foreign exchange rates.
The Morgan Stanley Capital International (MSCI) Emerging Markets Index tracks the performance of stocks in select emerging markets. The index is calculated using closing local market prices and translates into U.S. dollars using the London close foreign exchange rates.
The Barclays U.S. Aggregate Bond Index is an unmanaged, market-value-weighted measure of Treasury issues, corporate bond issues and mortgage securities.
The Credit Suisse High Yield Index tracks the performance of the global high-yield debt market.
Index returns do not reflect any fees or expenses and it is not possible to invest directly into an index.
The Morningstar Retirement Income Funds category includes funds that invest in a mix of stocks, bonds and cash tailored to investors already in or entering retirement. These funds tend to be managed using a more conservative asset-allocation strategy and aim to provide investors with steady income throughout retirement.
The Morningstar Target Date Funds categories include funds that provide diversified exposure to stocks, bonds and cash for those investors who have a specific date in mind (such as the years 2011–2015, 2016–2020, 2026–2030 and 2036–2040) for retirement. These portfolios aim to provide investors with an optimal level of return and risk, based solely on the target date. Management adjusts the allocation among asset classes to more conservative mixes as the target date approaches, following a preset glide path.
Quantitative easing is a monetary policy central banks often employ when interest rates are at or near zero. This policy involves a country’s central bank purchasing government securities in the open market, which causes the price of the securities purchased to rise and their yields to fall. The central banks hope that lower borrowing costs will encourage consumers and businesses to spend more, thus helping the overall economy.
An exchange-traded fund (ETF) is a security that tracks an index, or asset like an index fund, but trades like a stock on an exchange.
Deutsche LifeCompass Retirement Fund
| Class A | 1-Year | 5-Year | 10-Year |
Average Annual Total Returns as of 8/31/14 | |||
| Unadjusted for Sales Charge | 11.36% | 7.37% | 4.48% |
| Adjusted for the Maximum Sales Charge (max 5.75% load) | 4.95% | 6.10% | 3.86% |
S&P® Target Date Retirement Income Index† | 9.33% | 7.14% | 5.14% |
| Class B | 1-Year | 5-Year | 10-Year |
Average Annual Total Returns as of 8/31/14 | |||
| Unadjusted for Sales Charge | 10.51% | 6.56% | 3.70% |
| Adjusted for the Maximum Sales Charge (max 4.00% CDSC) | 7.51% | 6.41% | 3.70% |
S&P® Target Date Retirement Income Index† | 9.33% | 7.14% | 5.14% |
| Class C | 1-Year | 5-Year | 10-Year |
Average Annual Total Returns as of 8/31/14 | |||
| Unadjusted for Sales Charge | 10.53% | 6.57% | 3.71% |
| Adjusted for the Maximum Sales Charge (max 1.00% CDSC) | 10.53% | 6.57% | 3.71% |
S&P® Target Date Retirement Income Index† | 9.33% | 7.14% | 5.14% |
| Class S | 1-Year | 5-Year | 10-Year |
Average Annual Total Returns as of 8/31/14 | |||
| No Sales Charges | 11.65% | 7.62% | 4.74% |
S&P® Target Date Retirement Income Index† | 9.33% | 7.14% | 5.14% |
Performance in the Average Annual Total Returns table above and the Growth of an Assumed $10,000 Investment line graph that follows is historical and does not guarantee future results. Investment return and principal fluctuate so your shares may be worth more or less when redeemed. Current performance may differ from performance data shown. Please visit deutschefunds.com for the Fund's most recent month-end performance. Fund performance includes reinvestment of all distributions. Unadjusted returns do not reflect sales charges and would have been lower if they had.
The gross expense ratios of the Fund, as stated in the fee table of the prospectus dated December 1, 2013 are 1.29%, 2.09%, 2.01% and 1.00% for Class A, Class B, Class C and Class S shares, respectively, and may differ from the expense ratios disclosed in the Financial Highlights tables in this report. These expense ratios include net expenses of the underlying funds in which the Fund invests.
Index returns do not reflect any fees or expenses and it is not possible to invest directly into an index.
Performance figures do not reflect the deduction of taxes that a shareholder would pay on fund distributions or the redemption of fund shares.
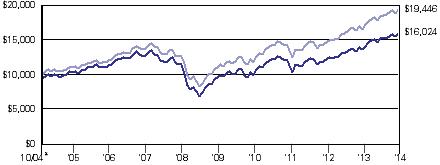
Deutsche LifeCompass Retirement Fund
Growth of an Assumed $10,000 Investment (Adjusted for Maximum Sales Charge) |
 |
 |
| Yearly periods ended August 31 |
The Fund's growth of an assumed $10,000 investment is adjusted for the maximum sales charge of 5.75%. This results in a net initial investment of $9,425.
The growth of $10,000 is cumulative.
Performance of other share classes will vary based on the sales charges and the fee structure of those classes.
† The S&P Target Date Retirement Income Index seeks to represent investment opportunity generally available in target date funds through an asset allocation which targets an immediate retirement allocation.
| Class A | Class B | Class C | Class S | |||||||||||||
| Net Asset Value | ||||||||||||||||
| 8/31/14 | $ | 12.92 | $ | 12.92 | $ | 12.91 | $ | 12.91 | ||||||||
| 8/31/13 | $ | 11.84 | $ | 11.84 | $ | 11.83 | $ | 11.83 | ||||||||
Distribution Information as of 8/31/14 | ||||||||||||||||
| Income Dividends, Twelve Months | $ | .25 | $ | .16 | $ | .16 | $ | .28 | ||||||||
| Class A | 1-Year | 5-Year | 10-Year |
Average Annual Total Returns as of 8/31/14 | |||
| Unadjusted for Sales Charge | 12.65% | 8.64% | 4.76% |
| Adjusted for the Maximum Sales Charge (max 5.75% load) | 6.17% | 7.36% | 4.15% |
S&P Target Date 2015 Index† | 12.94% | 9.50% | 6.29% |
| Class B | 1-Year | 5-Year | 10-Year |
Average Annual Total Returns as of 8/31/14 | |||
| Unadjusted for Sales Charge | 11.91% | 7.83% | 3.98% |
| Adjusted for the Maximum Sales Charge (max 4.00% CDSC) | 8.91% | 7.68% | 3.98% |
S&P Target Date 2015 Index† | 12.94% | 9.50% | 6.29% |
| Class C | 1-Year | 5-Year | 10-Year |
Average Annual Total Returns as of 8/31/14 | |||
| Unadjusted for Sales Charge | 11.82% | 7.81% | 4.00% |
| Adjusted for the Maximum Sales Charge (max 1.00% CDSC) | 11.82% | 7.81% | 4.00% |
S&P Target Date 2015 Index† | 12.94% | 9.50% | 6.29% |
| Class S | 1-Year | 5-Year | 10-Year |
Average Annual Total Returns as of 8/31/14 | |||
| No Sales Charges | 12.95% | 8.90% | 5.01% |
S&P Target Date 2015 Index† | 12.94% | 9.50% | 6.29% |
Performance in the Average Annual Total Returns table above and the Growth of an Assumed $10,000 Investment line graph that follows is historical and does not guarantee future results. Investment return and principal fluctuate so your shares may be worth more or less when redeemed. Current performance may differ from performance data shown. Please visit deutschefunds.com for the Fund's most recent month-end performance. Fund performance includes reinvestment of all distributions. Unadjusted returns do not reflect sales charges and would have been lower if they had.
The gross expense ratios of the Fund, as stated in the fee table of the prospectus dated December 1, 2013 are 1.25%, 2.13%, 1.97% and 1.02% for Class A, Class B, Class C and Class S shares, respectively, and may differ from the expense ratios disclosed in the Financial Highlights tables in this report. These expense ratios include net expenses of the underlying funds in which the Fund invests.
Index returns do not reflect any fees or expenses and it is not possible to invest directly into an index.
Performance figures do not reflect the deduction of taxes that a shareholder would pay on fund distributions or the redemption of fund shares.
Deutsche LifeCompass 2015 Fund
Growth of an Assumed $10,000 Investment (Adjusted for Maximum Sales Charge) |
 |
 |
| Yearly periods ended August 31 |
The Fund's growth of an assumed $10,000 investment is adjusted for the maximum sales charge of 5.75%. This results in a net initial investment of $9,425.
The growth of $10,000 is cumulative.
Performance of other share classes will vary based on the sales charges and the fee structure of those classes.
† The S&P Target Date 2015 Index seeks to represent investment opportunity generally available in target date funds through an asset allocation which targets retirement horizon on or around 2015.
| Class A | Class B | Class C | Class S | |||||||||||||
| Net Asset Value | ||||||||||||||||
| 8/31/14 | $ | 12.85 | $ | 12.84 | $ | 12.83 | $ | 12.83 | ||||||||
| 8/31/13 | $ | 11.66 | $ | 11.64 | $ | 11.64 | $ | 11.64 | ||||||||
Distribution Information as of 8/31/14 | ||||||||||||||||
| Income Dividends, Twelve Months | $ | .27 | $ | .18 | $ | .18 | $ | .30 | ||||||||
| Class A | 1-Year | 5-Year | 10-Year |
Average Annual Total Returns as of 8/31/14 | |||
| Unadjusted for Sales Charge | 14.68% | 9.58% | 5.36% |
| Adjusted for the Maximum Sales Charge (max 5.75% load) | 8.09% | 8.29% | 4.74% |
S&P Target Date 2020 Index† | 14.46% | 10.46% | 6.67% |
| Class B | 1-Year | 5-Year | 10-Year |
Average Annual Total Returns as of 8/31/14 | |||
| Unadjusted for Sales Charge | 13.77% | 8.78% | 4.58% |
| Adjusted for the Maximum Sales Charge (max 4.00% CDSC) | 10.77% | 8.63% | 4.58% |
S&P Target Date 2020 Index† | 14.46% | 10.46% | 6.67% |
| Class C | 1-Year | 5-Year | 10-Year |
Average Annual Total Returns as of 8/31/14 | |||
| Unadjusted for Sales Charge | 13.84% | 8.77% | 4.58% |
| Adjusted for the Maximum Sales Charge (max 1.00% CDSC) | 13.84% | 8.77% | 4.58% |
S&P Target Date 2020 Index† | 14.46% | 10.46% | 6.67% |
| Class S | 1-Year | 5-Year | 10-Year |
Average Annual Total Returns as of 8/31/14 | |||
| No Sales Charges | 14.95% | 9.86% | 5.62% |
S&P Target Date 2020 Index† | 14.46% | 10.46% | 6.67% |
Performance in the Average Annual Total Returns table above and the Growth of an Assumed $10,000 Investment line graph that follows is historical and does not guarantee future results. Investment return and principal fluctuate so your shares may be worth more or less when redeemed. Current performance may differ from performance data shown. Please visit deutschefunds.com for the Fund's most recent month-end performance. Fund performance includes reinvestment of all distributions. Unadjusted returns do not reflect sales charges and would have been lower if they had.
The gross expense ratios of the Fund, as stated in the fee table of the prospectus dated December 1, 2013 are 1.28%, 2.05%, 1.99% and 1.03% for Class A, Class B, Class C and Class S shares, respectively, and may differ from the expense ratios disclosed in the Financial Highlights tables in this report. These expense ratios include net expenses of the underlying funds in which the Fund invests.
Index returns do not reflect any fees or expenses and it is not possible to invest directly into an index.
Performance figures do not reflect the deduction of taxes that a shareholder would pay on fund distributions or the redemption of fund shares.
Deutsche LifeCompass 2020 Fund
Growth of an Assumed $10,000 Investment (Adjusted for Maximum Sales Charge) |
 |
 |
| Yearly periods ended August 31 |
The Fund's growth of an assumed $10,000 investment is adjusted for the maximum sales charge of 5.75%. This results in a net initial investment of $9,425.
The growth of $10,000 is cumulative.
Performance of other share classes will vary based on the sales charges and the fee structure of those classes.
† The S&P Target Date 2020 Index seeks to represent investment opportunity generally available in target date funds through an asset allocation which targets retirement horizon on or around 2020.
| Class A | Class B | Class C | Class S | |||||||||||||
| Net Asset Value | ||||||||||||||||
| 8/31/14 | $ | 16.10 | $ | 15.95 | $ | 15.96 | $ | 16.12 | ||||||||
| 8/31/13 | $ | 14.34 | $ | 14.22 | $ | 14.22 | $ | 14.37 | ||||||||
Distribution Information as of 8/31/14 | ||||||||||||||||
| Income Dividends, Twelve Months | $ | .34 | $ | .22 | $ | .22 | $ | .38 | ||||||||
| Class A | 1-Year | 5-Year | Life of Fund* |
Average Annual Total Returns as of 8/31/14 | |||
| Unadjusted for Sales Charge | 17.23% | 10.93% | 5.55% |
| Adjusted for the Maximum Sales Charge (max 5.75% load) | 10.49% | 9.63% | 4.92% |
S&P Target Date 2030 Index† | 16.75% | 11.91% | 7.00% |
| Class B | 1-Year | 5-Year | Life of Fund* |
Average Annual Total Returns as of 8/31/14 | |||
| Unadjusted for Sales Charge | 16.18% | 10.08% | 4.76% |
| Adjusted for the Maximum Sales Charge (max 4.00% CDSC) | 13.18% | 9.95% | 4.76% |
S&P Target Date 2030 Index† | 16.75% | 11.91% | 7.00% |
| Class C | 1-Year | 5-Year | Life of Fund* |
Average Annual Total Returns as of 8/31/14 | |||
| Unadjusted for Sales Charge | 16.29% | 10.11% | 4.76% |
| Adjusted for the Maximum Sales Charge (max 1.00% CDSC) | 16.29% | 10.11% | 4.76% |
S&P Target Date 2030 Index† | 16.75% | 11.91% | 7.00% |
| Class S | 1-Year | 5-Year | Life of Fund* |
Average Annual Total Returns as of 8/31/14 | |||
| No Sales Charges | 17.41% | 11.23% | 5.81% |
S&P Target Date 2030 Index† | 16.75% | 11.91% | 7.00% |
Performance in the Average Annual Total Returns table above and the Growth of an Assumed $10,000 Investment line graph that follows is historical and does not guarantee future results. Investment return and principal fluctuate so your shares may be worth more or less when redeemed. Current performance may differ from performance data shown. Please visit deutschefunds.com for the Fund's most recent month-end performance. Fund performance includes reinvestment of all distributions. Unadjusted returns do not reflect sales charges and would have been lower if they had.
The gross expense ratios of the Fund, as stated in the fee table of the prospectus dated December 1, 2013 are 1.43%, 2.22%, 2.13% and 1.18% for Class A, Class B, Class C and Class S shares, respectively, and may differ from the expense ratios disclosed in the Financial Highlights tables in this report. These expense ratios include net expenses of the underlying funds in which the Fund invests.
Index returns do not reflect any fees or expenses and it is not possible to invest directly into an index.
Performance figures do not reflect the deduction of taxes that a shareholder would pay on fund distributions or the redemption of fund shares.
Deutsche LifeCompass 2030 Fund
Growth of an Assumed $10,000 Investment (Adjusted for Maximum Sales Charge) |
 |
 |
| Yearly periods ended August 31 |
The Fund's growth of an assumed $10,000 investment is adjusted for the maximum sales charge of 5.75%. This results in a net initial investment of $9,425.
The growth of $10,000 is cumulative.
Performance of other share classes will vary based on the sales charges and the fee structure of those classes.
* The Fund commenced operations on November 1, 2004. The performance shown for each index is for the time period of October 31, 2004 through August 31, 2014 which is based on the performance period of the life of the Fund.
† The S&P Target Date 2030 Index seeks to represent investment opportunity generally available in target date funds through an asset allocation which targets retirement horizon on or around 2030.
| Class A | Class B | Class C | Class S | |||||||||||||
| Net Asset Value | ||||||||||||||||
| 8/31/14 | $ | 12.04 | $ | 11.99 | $ | 11.99 | $ | 12.05 | ||||||||
| 8/31/13 | $ | 10.66 | $ | 10.63 | $ | 10.62 | $ | 10.68 | ||||||||
Distribution Information as of 8/31/14 | ||||||||||||||||
| Income Dividends, Twelve Months | $ | .31 | $ | .22 | $ | .22 | $ | .34 | ||||||||
| Capital Gain Distributions | $ | .13 | $ | .13 | $ | .13 | $ | .13 | ||||||||
| Class A | 1-Year | 5-Year | Life of Fund* |
Average Annual Total Returns as of 8/31/14 | |||
| Unadjusted for Sales Charge | 18.54% | 11.54% | 3.64% |
| Adjusted for the Maximum Sales Charge (max 5.75% load) | 11.73% | 10.23% | 2.74% |
S&P Target Date 2040 Index† | 18.51% | 12.82% | 4.91% |
| Class C | 1-Year | 5-Year | Life of Fund* |
Average Annual Total Returns as of 8/31/14 | |||
| Unadjusted for Sales Charge | 17.63% | 10.70% | 2.87% |
| Adjusted for the Maximum Sales Charge (max 1.00% CDSC) | 17.63% | 10.70% | 2.87% |
S&P Target Date 2040 Index† | 18.51% | 12.82% | 4.91% |
| Class S | 1-Year | 5-Year | Life of Fund* |
Average Annual Total Returns as of 8/31/14 | |||
| No Sales Charges | 18.82% | 11.80% | 3.90% |
S&P Target Date 2040 Index† | 18.51% | 12.82% | 4.91% |
Performance in the Average Annual Total Returns table above and the Growth of an Assumed $10,000 Investment line graph that follows is historical and does not guarantee future results. Investment return and principal fluctuate so your shares may be worth more or less when redeemed. Current performance may differ from performance data shown. Please visit deutschefunds.com for the Fund's most recent month-end performance. Fund performance includes reinvestment of all distributions. Unadjusted returns do not reflect sales charges and would have been lower if they had.
The gross expense ratios of the Fund, as stated in the fee table of the prospectus dated December 1, 2013 are 1.60%, 2.36% and 1.36% for Class A, Class C and Class S shares, respectively, and may differ from the expense ratios disclosed in the Financial Highlights tables in this report. These expense ratios include net expenses of the underlying funds in which the Fund invests.
Index returns do not reflect any fees or expenses and it is not possible to invest directly into an index.
Performance figures do not reflect the deduction of taxes that a shareholder would pay on fund distributions or the redemption of fund shares.
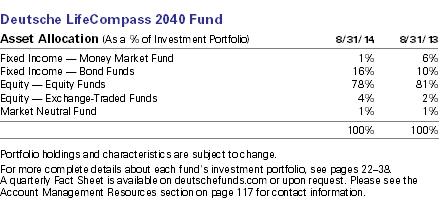
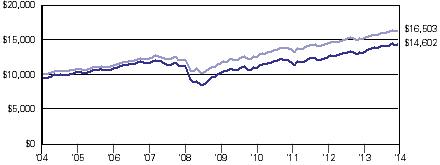
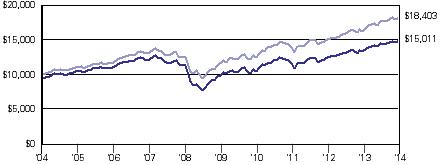
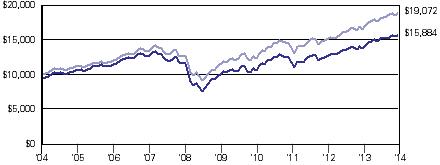
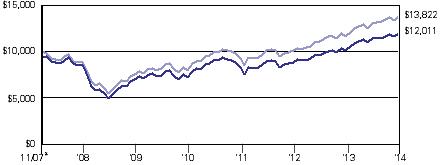
Deutsche LifeCompass 2040 Fund
Growth of an Assumed $10,000 Investment (Adjusted for Maximum Sales Charge) |
 |
 |
| Yearly periods ended August 31 |
The Fund's growth of an assumed $10,000 investment is adjusted for the maximum sales charge of 5.75%. This results in a net initial investment of $9,425.
The growth of $10,000 is cumulative.
Performance of other share classes will vary based on the sales charges and the fee structure of those classes.
* The Fund commenced operations on November 15, 2007. The performance shown for each index is for the time period of November 30, 2007 through August 31, 2014 which is based on the performance period of the life of the Fund.
† The S&P Target Date 2040 Index seeks to represent investment opportunity generally available in target date funds through an asset allocation which targets retirement horizon on or around 2040.
| Class A | Class C | Class S | ||||||||||
| Net Asset Value | ||||||||||||
| 8/31/14 | $ | 9.47 | $ | 9.43 | $ | 9.49 | ||||||
| 8/31/13 | $ | 9.20 | $ | 9.16 | $ | 9.22 | ||||||
Distribution Information as of 8/31/14 | ||||||||||||
| Income Dividends, Twelve Months | $ | .26 | $ | .18 | $ | .29 | ||||||
| Capital Gain Distributions | $ | 1.09 | $ | 1.09 | $ | 1.09 | ||||||
| Shares | Value ($) | |||||||
| Equity — Equity Funds 42.5% | ||||||||
| Deutsche Capital Growth Fund "Institutional" (a) | 7,976 | 641,929 | ||||||
| Deutsche Core Equity Fund "Institutional" (a) | 245,058 | 6,177,909 | ||||||
| Deutsche EAFE Equity Index Fund "Institutional" (a) | 129,969 | 1,941,743 | ||||||
| Deutsche Emerging Markets Equity Fund "Institutional" (a) | 65,996 | 1,176,057 | ||||||
| Deutsche Equity 500 Index Fund "Institutional" (a) | 26,542 | 6,036,150 | ||||||
| Deutsche Global Equity Fund "Institutional" (a) | 90,340 | 766,989 | ||||||
| Deutsche Global Growth Fund "Institutional" (a) | 9,731 | 294,761 | ||||||
| Deutsche Global Infrastructure Fund "Institutional" (a) | 153,475 | 2,414,164 | ||||||
| Deutsche Global Small Cap Fund "Institutional" (a) | 25,379 | 1,181,144 | ||||||
| Deutsche Latin America Equity Fund "S" (a) | 2,154 | 71,887 | ||||||
| Deutsche Real Estate Securities Fund "Institutional" (a) | 100,148 | 2,350,462 | ||||||
| Deutsche Real Estate Securities Income Fund "Institutional" (a) | 6,559 | 72,603 | ||||||
| Deutsche Small Cap Core Fund "S" (a) | 64,057 | 1,744,276 | ||||||
| Deutsche Small Cap Growth Fund "S" (a) | 6,843 | 226,041 | ||||||
| Deutsche Small Cap Value Fund "Institutional" (a) | 2,889 | 81,191 | ||||||
| Deutsche World Dividend Fund "Institutional" (a) | 26,900 | 826,111 | ||||||
Total Equity — Equity Funds (Cost $19,838,276) | 26,003,417 | |||||||
| Equity — Exchange-Traded Funds 6.0% | ||||||||
| Deutsche X-trackers MSCI Europe Hedged Equity Fund (b) | 4,300 | 117,305 | ||||||
| Deutsche X-trackers MSCI Japan Hedged Equity Fund (b) | 1,600 | 59,040 | ||||||
| iShares MSCI Pacific ex Japan Fund | 13,600 | 695,232 | ||||||
| SPDR Barclays Convertible Securities Fund | 51,838 | 2,651,514 | ||||||
| SPDR S&P Emerging Asia Pacific Fund | 1,600 | 141,455 | ||||||
Total Equity — Exchange-Traded Funds (Cost $3,228,855) | 3,664,546 | |||||||
| Fixed Income — Bond Funds 49.5% | ||||||||
| Deutsche Core Fixed Income Fund "Institutional" (a) | 439,550 | 4,377,913 | ||||||
| Deutsche Core Plus Income Fund "Institutional" (a) | 158,113 | 1,748,726 | ||||||
| Deutsche Enhanced Commodity Strategy Fund "Institutional" (a) | 180,243 | 2,761,320 | ||||||
| Deutsche Enhanced Emerging Markets Fixed Income Fund "Institutional" (a) | 180,441 | 1,955,982 | ||||||
| Deutsche Enhanced Global Bond Fund "S" (a) | 177,700 | 1,757,452 | ||||||
| Deutsche Floating Rate Fund "Institutional" (a) | 136,794 | 1,285,864 | ||||||
| Deutsche Global Inflation Fund "Institutional" (a) | 658,710 | 6,751,774 | ||||||
| Deutsche High Income Fund "Institutional" (a) | 169,545 | 856,200 | ||||||
| Deutsche Short Duration Fund "S" (a) | 418,457 | 3,833,068 | ||||||
| Deutsche U.S. Bond Index Fund "Institutional" (a) | 480,787 | 4,904,031 | ||||||
Total Fixed Income — Bond Funds (Cost $30,273,842) | 30,232,330 | |||||||
| Market Neutral Fund 1.2% | ||||||||
| Deutsche Diversified Market Neutral Fund "Institutional" (a) (Cost $802,075) | 85,952 | 740,050 | ||||||
| Fixed Income — Money Market Fund 1.2% | ||||||||
| Central Cash Management Fund, 0.05% (a) (c) (Cost $740,018) | 740,018 | 740,018 | ||||||
| % of Net Assets | Value ($) | |||||||
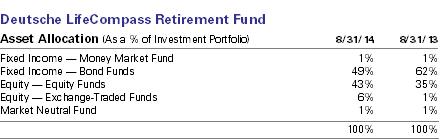
Total Investment Portfolio (Cost $54,883,066)† | 100.4 | 61,380,361 | ||||||
| Other Assets and Liabilities, Net | (0.4 | ) | (261,204 | ) | ||||
| Net Assets | 100.0 | 61,119,157 | ||||||
† The cost for federal income tax purposes was $55,101,076. At August 31, 2014, net unrealized appreciation for all securities based on tax cost was $6,279,285. This consisted of aggregate gross unrealized appreciation for all securities in which there was an excess of value over tax cost of $6,916,798 and aggregate gross unrealized depreciation for all securities in which there was an excess of tax cost over value of $637,513.
(a) Affiliated fund managed by Deutsche Investment Management Americas Inc.
(b) Affiliated fund managed by DBX Advisors LLC, a subsidiary of Deutsche Bank AG.
(c) The rate shown is the annualized seven-day yield at period end.
EAFE: Europe, Australasia and Far East
MSCI: Morgan Stanley Capital International
S&P: Standard & Poor's
SPDR: Standard & Poor's Depositary Receipt
During the year ended August 31, 2014, purchases and sales of affiliated Underlying Funds (excluding money market funds) aggregated $36,437,960 and $54,554,245, respectively. Purchases and sales of non-affiliated Underlying Funds (excluding money market funds) aggregated $4,047,387 and $1,793,214, respectively.
Fair Value Measurements
Various inputs are used in determining the value of the Fund's investments. These inputs are summarized in three broad levels. Level 1 includes quoted prices in active markets for identical securities. Level 2 includes other significant observable inputs (including quoted prices for similar securities, interest rates, prepayment speeds and credit risk). Level 3 includes significant unobservable inputs (including the Fund's own assumptions in determining the fair value of investments). The level assigned to the securities valuations may not be an indication of the risk or liquidity associated with investing in those securities.
The following is a summary of the inputs used as of August 31, 2014 in valuing the Fund's investments. For information on the Fund's policy regarding the valuation of investments, please refer to the Security Valuation section of Note A in the accompanying Notes to Financial Statements.
| Assets | Level 1 | Level 2 | Level 3 | Total | ||||||||||||
| Equity Funds | $ | 26,003,417 | $ | — | $ | — | $ | 26,003,417 | ||||||||
| Exchange-Traded Funds | 3,664,546 | — | — | 3,664,546 | ||||||||||||
| Bond Funds | 30,232,330 | — | — | 30,232,330 | ||||||||||||
| Market Neutral Fund | 740,050 | — | — | 740,050 | ||||||||||||
| Money Market Fund | 740,018 | — | — | 740,018 | ||||||||||||
| Total | $ | 61,380,361 | $ | — | $ | — | $ | 61,380,361 | ||||||||
There have been no transfers between fair value measurement levels during the year ended August 31, 2014.
| Shares | Value ($) | |||||||
| Equity — Equity Funds 48.1% | ||||||||
| Deutsche Capital Growth Fund "Institutional" (a) | 12,418 | 999,438 | ||||||
| Deutsche Core Equity Fund "Institutional" (a) | 381,499 | 9,617,597 | ||||||
| Deutsche EAFE Equity Index Fund "Institutional" (a) | 234,932 | 3,509,882 | ||||||
| Deutsche Emerging Markets Equity Fund "Institutional" (a) | 100,814 | 1,796,514 | ||||||
| Deutsche Equity 500 Index Fund "Institutional" (a) | 41,320 | 9,396,970 | ||||||
| Deutsche Global Equity Fund "Institutional" (a) | 163,306 | 1,386,466 | ||||||
| Deutsche Global Growth Fund "Institutional" (a) | 17,591 | 532,837 | ||||||
| Deutsche Global Infrastructure Fund "Institutional" (a) | 209,994 | 3,303,205 | ||||||
| Deutsche Global Small Cap Fund "Institutional" (a) | 45,877 | 2,135,129 | ||||||
| Deutsche Latin America Equity Fund "S" (a) | 3,291 | 109,814 | ||||||
| Deutsche Real Estate Securities Fund "Institutional" (a) | 134,911 | 3,166,358 | ||||||
| Deutsche Real Estate Securities Income Fund "Institutional" (a) | 8,838 | 97,835 | ||||||
| Deutsche Small Cap Core Fund "S" (a) | 86,511 | 2,355,683 | ||||||
| Deutsche Small Cap Growth Fund "S" (a) | 9,241 | 305,242 | ||||||
| Deutsche Small Cap Value Fund "Institutional" (a) | 3,904 | 109,697 | ||||||
| Deutsche World Dividend Fund "Institutional" (a) | 48,626 | 1,493,303 | ||||||
Total Equity — Equity Funds (Cost $29,664,128) | 40,315,970 | |||||||
| Equity — Exchange-Traded Funds 5.9% | ||||||||
| Deutsche X-trackers MSCI Europe Hedged Equity Fund (b) | 8,000 | 218,240 | ||||||
| Deutsche X-trackers MSCI Japan Hedged Equity Fund (b) | 3,000 | 110,700 | ||||||
| iShares MSCI Pacific ex Japan Fund | 25,600 | 1,308,672 | ||||||
| SPDR Barclays Convertible Securities Fund | 59,981 | 3,068,028 | ||||||
| SPDR S&P Emerging Asia Pacific Fund | 2,400 | 212,184 | ||||||
Total Equity — Exchange-Traded Funds (Cost $4,299,323) | 4,917,824 | |||||||
| Fixed Income — Bond Funds 44.4% | ||||||||
| Deutsche Core Fixed Income Fund "Institutional" (a) | 508,890 | 5,068,546 | ||||||
| Deutsche Core Plus Income Fund "Institutional" (a) | 183,048 | 2,024,513 | ||||||
| Deutsche Enhanced Commodity Strategy Fund "Institutional" (a) | 239,022 | 3,661,820 | ||||||
| Deutsche Enhanced Emerging Markets Fixed Income Fund "Institutional" (a) | 240,573 | 2,607,812 | ||||||
| Deutsche Enhanced Global Bond Fund "S" (a) | 208,087 | 2,057,976 | ||||||
| Deutsche Floating Rate Fund "Institutional" (a) | 186,799 | 1,755,910 | ||||||
| Deutsche Global Inflation Fund "Institutional" (a) | 850,525 | 8,717,880 | ||||||
| Deutsche High Income Fund "Institutional" (a) | 231,512 | 1,169,134 | ||||||
| Deutsche Short Duration Fund "S" (a) | 484,448 | 4,437,547 | ||||||
| Deutsche U.S. Bond Index Fund "Institutional" (a) | 556,657 | 5,677,905 | ||||||
Total Fixed Income — Bond Funds (Cost $37,208,144) | 37,179,043 | |||||||
| Market Neutral Fund 1.4% | ||||||||
| Deutsche Diversified Market Neutral Fund "Institutional" (a) (Cost $1,311,898) | 140,259 | 1,207,628 | ||||||
| Fixed Income — Money Market Fund 1.1% | ||||||||
| Central Cash Management Fund, 0.05% (a) (c) (Cost $961,188) | 961,188 | 961,188 | ||||||
| % of Net Assets | Value ($) | |||||||
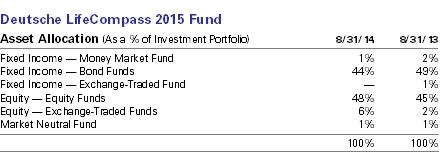
Total Investment Portfolio (Cost $73,444,681)† | 100.9 | 84,581,653 | ||||||
| Other Assets and Liabilities, Net | (0.9 | ) | (782,467 | ) | ||||
| Net Assets | 100.0 | 83,799,186 | ||||||
† The cost for federal income tax purposes was $74,090,091. At August 31, 2014, net unrealized appreciation for all securities based on tax cost was $10,491,562. This consisted of aggregate gross unrealized appreciation for all securities in which there was an excess of value over tax cost of $11,642,165 and aggregate gross unrealized depreciation for all securities in which there was an excess of tax cost over value of $1,150,603.
(a) Affiliated fund managed by Deutsche Investment Management Americas Inc.
(b) Affiliated fund managed by DBX Advisors LLC, a subsidiary of Deutsche Bank AG.
(c) The rate shown is the annualized seven-day yield at period end.
EAFE: Europe, Australasia and Far East
MSCI: Morgan Stanley Capital International
S&P: Standard & Poor's
SPDR: Standard & Poor's Depositary Receipt
During the year ended August 31, 2014, purchases and sales of affiliated Underlying Funds (excluding money market funds) aggregated $48,368,172 and $65,214,674, respectively. Purchases and sales of non-affiliated Underlying Funds (excluding money market funds) aggregated $5,017,743 and $3,479,780, respectively.
Fair Value Measurements
Various inputs are used in determining the value of the Fund's investments. These inputs are summarized in three broad levels. Level 1 includes quoted prices in active markets for identical securities. Level 2 includes other significant observable inputs (including quoted prices for similar securities, interest rates, prepayment speeds and credit risk). Level 3 includes significant unobservable inputs (including the Fund's own assumptions in determining the fair value of investments). The level assigned to the securities valuations may not be an indication of the risk or liquidity associated with investing in those securities.
The following is a summary of the inputs used as of August 31, 2014 in valuing the Fund's investments. For information on the Fund's policy regarding the valuation of investments, please refer to the Security Valuation section of Note A in the accompanying Notes to Financial Statements.
| Assets | Level 1 | Level 2 | Level 3 | Total | ||||||||||||
| Equity Funds | $ | 40,315,970 | $ | — | $ | — | $ | 40,315,970 | ||||||||
| Exchange-Traded Funds | 4,917,824 | — | — | 4,917,824 | ||||||||||||
| Bond Funds | 37,179,043 | — | — | 37,179,043 | ||||||||||||
| Market Neutral Fund | 1,207,628 | — | — | 1,207,628 | ||||||||||||
| Money Market Fund | 961,188 | — | — | 961,188 | ||||||||||||
| Total | $ | 84,581,653 | $ | — | $ | — | $ | 84,581,653 | ||||||||
There have been no transfers between fair value measurement levels during the year ended August 31, 2014.
| Shares | Value ($) | |||||||
| Equity — Equity Funds 59.0% | ||||||||
| Deutsche Capital Growth Fund "Institutional" (a) | 33,061 | 2,660,740 | ||||||
| Deutsche Core Equity Fund "Institutional" (a) | 1,015,686 | 25,605,454 | ||||||
| Deutsche EAFE Equity Index Fund "Institutional" (a) | 595,139 | 8,891,373 | ||||||
| Deutsche Emerging Markets Equity Fund "Institutional" (a) | 279,682 | 4,983,934 | ||||||
| Deutsche Equity 500 Index Fund "Institutional" (a) | 110,009 | 25,018,140 | ||||||
| Deutsche Global Equity Fund "Institutional" (a) | 413,662 | 3,511,994 | ||||||
| Deutsche Global Growth Fund "Institutional" (a) | 44,561 | 1,349,748 | ||||||
| Deutsche Global Infrastructure Fund "Institutional" (a) | 395,339 | 6,218,684 | ||||||
| Deutsche Global Small Cap Fund "Institutional" (a) | 116,216 | 5,408,696 | ||||||
| Deutsche Latin America Equity Fund "S" (a) | 9,131 | 304,701 | ||||||
| Deutsche Real Estate Securities Fund "Institutional" (a) | 253,984 | 5,960,999 | ||||||
| Deutsche Real Estate Securities Income Fund "Institutional" (a) | 16,631 | 184,101 | ||||||
| Deutsche Small Cap Core Fund "S" (a) | 212,666 | 5,790,888 | ||||||
| Deutsche Small Cap Growth Fund "S" (a) | 22,720 | 750,441 | ||||||
| Deutsche Small Cap Value Fund "Institutional" (a) | 9,593 | 269,572 | ||||||
| Deutsche World Dividend Fund "Institutional" (a) | 123,175 | 3,782,703 | ||||||
Total Equity — Equity Funds (Cost $77,300,204) | 100,692,168 | |||||||
| Equity — Exchange-Traded Funds 5.5% | ||||||||
| Deutsche X-trackers MSCI Europe Hedged Equity Fund (b) | 20,000 | 545,599 | ||||||
| Deutsche X-trackers MSCI Japan Hedged Equity Fund (b) | 7,300 | 269,370 | ||||||
| iShares MSCI Pacific ex Japan Fund | 63,800 | 3,261,457 | ||||||
| SPDR Barclays Convertible Securities Fund | 93,170 | 4,765,645 | ||||||
| SPDR S&P Emerging Asia Pacific Fund | 6,600 | 583,506 | ||||||
Total Equity — Exchange-Traded Funds (Cost $8,240,818) | 9,425,577 | |||||||
| Fixed Income — Bond Funds 35.0% | ||||||||
| Deutsche Core Fixed Income Fund "Institutional" (a) | 790,873 | 7,877,092 | ||||||
| Deutsche Core Plus Income Fund "Institutional" (a) | 284,483 | 3,146,380 | ||||||
| Deutsche Enhanced Commodity Strategy Fund "Institutional" (a) | 405,364 | 6,210,182 | ||||||
| Deutsche Enhanced Emerging Markets Fixed Income Fund "Institutional" (a) | 512,318 | 5,553,522 | ||||||
| Deutsche Enhanced Global Bond Fund "S" (a) | 387,392 | 3,831,308 | ||||||
| Deutsche Floating Rate Fund "Institutional" (a) | 368,363 | 3,462,610 | ||||||
| Deutsche Global Inflation Fund "Institutional" (a) | 1,141,723 | 11,702,666 | ||||||
| Deutsche High Income Fund "Institutional" (a) | 456,522 | 2,305,438 | ||||||
| Deutsche Short Duration Fund "S" (a) | 752,925 | 6,896,791 | ||||||
| Deutsche U.S. Bond Index Fund "Institutional" (a) | 865,077 | 8,823,783 | ||||||
Total Fixed Income — Bond Funds (Cost $59,952,363) | 59,809,772 | |||||||
| Market Neutral Fund 1.2% | ||||||||
| Deutsche Diversified Market Neutral Fund "Institutional" (a) (Cost $2,233,552) | 240,651 | 2,072,008 | ||||||
| Fixed Income — Money Market Fund 0.4% | ||||||||
| Central Cash Management Fund, 0.05% (a) (c) (Cost $690,763) | 690,763 | 690,763 | ||||||
| % of Net Assets | Value ($) | |||||||
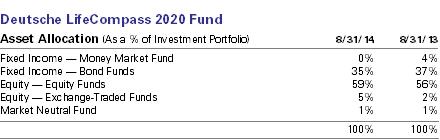
Total Investment Portfolio (Cost $148,417,700)† | 101.1 | 172,690,288 | ||||||
| Other Assets and Liabilities, Net | (1.1 | ) | (1,803,040 | ) | ||||
| Net Assets | 100.0 | 170,887,248 | ||||||
† The cost for federal income tax purposes was $149,391,184. At August 31, 2014, net unrealized appreciation for all securities based on tax cost was $23,299,104. This consisted of aggregate gross unrealized appreciation for all securities in which there was an excess of value over tax cost of $25,178,676 and aggregate gross unrealized depreciation for all securities in which there was an excess of tax cost over value of $1,879,572.
(a) Affiliated fund managed by Deutsche Investment Management Americas Inc.
(b) Affiliated fund managed by DBX Advisors LLC, a subsidiary of Deutsche Bank AG.
(c) The rate shown is the annualized seven-day yield at period end.
EAFE: Europe, Australasia and Far East
MSCI: Morgan Stanley Capital International
S&P: Standard & Poor's
SPDR: Standard & Poor's Depositary Receipt
During the year ended August 31, 2014, purchases and sales of affiliated Underlying Funds (excluding money market funds) aggregated $94,130,943 and $111,094,707, respectively. Purchase and sales on non-affiliated Underlying Funds (excluding money market funds) aggregated $7,787,336 and $3,806,365, respectively.
Fair Value Measurements
Various inputs are used in determining the value of the Fund's investments. These inputs are summarized in three broad levels. Level 1 includes quoted prices in active markets for identical securities. Level 2 includes other significant observable inputs (including quoted prices for similar securities, interest rates, prepayment speeds and credit risk). Level 3 includes significant unobservable inputs (including the Fund's own assumptions in determining the fair value of investments). The level assigned to the securities valuations may not be an indication of the risk or liquidity associated with investing in those securities.
The following is a summary of the inputs used as of August 31, 2014 in valuing the Fund's investments. For information on the Fund's policy regarding the valuation of investments, please refer to the Security Valuation section of Note A in the accompanying Notes to Financial Statements.
| Assets | Level 1 | Level 2 | Level 3 | Total | ||||||||||||
| Equity Funds | $ | 100,692,168 | $ | — | $ | — | $ | 100,692,168 | ||||||||
| Exchange-Traded Funds | 9,425,577 | — | — | 9,425,577 | ||||||||||||
| Bond Funds | 59,809,772 | — | — | 59,809,772 | ||||||||||||
| Market Neutral Fund | 2,072,008 | — | — | 2,072,008 | ||||||||||||
| Money Market Fund | 690,763 | — | — | 690,763 | ||||||||||||
| Total | $ | 172,690,288 | $ | — | $ | — | $ | 172,690,288 | ||||||||
There have been no transfers between fair value measurement levels during the year ended August 31, 2014.
| Shares | Value ($) | |||||||
| Equity — Equity Funds 74.5% | ||||||||
| Deutsche Capital Growth Fund "Institutional" (a) | 15,187 | 1,222,234 | ||||||
| Deutsche Core Equity Fund "Institutional" (a) | 466,579 | 11,762,459 | ||||||
| Deutsche EAFE Equity Index Fund "Institutional" (a) | 247,005 | 3,690,261 | ||||||
| Deutsche Emerging Markets Equity Fund "Institutional" (a) | 115,299 | 2,054,626 | ||||||
| Deutsche Equity 500 Index Fund "Institutional" (a) | 50,535 | 11,492,722 | ||||||
| Deutsche Global Equity Fund "Institutional" (a) | 171,663 | 1,457,423 | ||||||
| Deutsche Global Growth Fund "Institutional" (a) | 18,492 | 560,109 | ||||||
| Deutsche Global Infrastructure Fund "Institutional" (a) | 128,446 | 2,020,456 | ||||||
| Deutsche Global Small Cap Fund "Institutional" (a) | 48,232 | 2,244,720 | ||||||
| Deutsche Latin America Equity Fund "S" (a) | 3,766 | 125,663 | ||||||
| Deutsche Real Estate Securities Fund "Institutional" (a) | 84,079 | 1,973,342 | ||||||
| Deutsche Real Estate Securities Income Fund "Institutional" (a) | 5,505 | 60,935 | ||||||
| Deutsche Small Cap Core Fund "S" (a) | 99,788 | 2,717,232 | ||||||
| Deutsche Small Cap Growth Fund "S" (a) | 10,662 | 352,156 | ||||||
| Deutsche Small Cap Value Fund "Institutional" (a) | 4,501 | 126,486 | ||||||
| Deutsche World Dividend Fund "Institutional" (a) | 51,118 | 1,569,825 | ||||||
Total Equity — Equity Funds (Cost $32,724,295) | 43,430,649 | |||||||
| Equity — Exchange-Traded Funds 5.1% | ||||||||
| Deutsche X-trackers MSCI Europe Hedged Equity Fund (b) | 8,300 | 226,424 | ||||||
| Deutsche X-trackers MSCI Japan Hedged Equity Fund (b) | 3,000 | 110,700 | ||||||
| iShares MSCI Pacific ex Japan Fund | 26,500 | 1,354,680 | ||||||
| SPDR Barclays Convertible Securities Fund | 20,560 | 1,051,644 | ||||||
| SPDR S&P Emerging Asia Pacific Fund | 2,700 | 238,707 | ||||||
Total Equity — Exchange-Traded Funds (Cost $2,702,617) | 2,982,155 | |||||||
| Fixed Income — Bond Funds 24.8% | ||||||||
| Deutsche Core Fixed Income Fund "Institutional" (a) | 174,871 | 1,741,716 | ||||||
| Deutsche Core Plus Income Fund "Institutional" (a) | 62,907 | 695,752 | ||||||
| Deutsche Enhanced Commodity Strategy Fund "Institutional" (a) | 116,114 | 1,778,859 | ||||||
| Deutsche Enhanced Emerging Markets Fixed Income Fund "Institutional" (a) | 174,557 | 1,892,196 | ||||||
| Deutsche Enhanced Global Bond Fund "S" (a) | 92,917 | 918,945 | ||||||
| Deutsche Floating Rate Fund "Institutional" (a) | 116,805 | 1,097,967 | ||||||
| Deutsche Global Inflation Fund "Institutional" (a) | 207,865 | 2,130,617 | ||||||
| Deutsche High Income Fund "Institutional" (a) | 144,771 | 731,092 | ||||||
| Deutsche Short Duration Fund "S" (a) | 166,489 | 1,525,037 | ||||||
| Deutsche U.S. Bond Index Fund "Institutional" (a) | 191,270 | 1,950,950 | ||||||
Total Fixed Income — Bond Funds (Cost $14,611,795) | 14,463,131 | |||||||
| Market Neutral Fund 1.4% | ||||||||
| Deutsche Diversified Market Neutral Fund "Institutional" (a) (Cost $856,048) | 92,941 | 800,221 | ||||||
| Fixed Income — Money Market Fund 0.9% | ||||||||
| Central Cash Management Fund, 0.05% (a) (c) (Cost $551,477) | 551,477 | 551,477 | ||||||
| % of Net Assets | Value ($) | |||||||
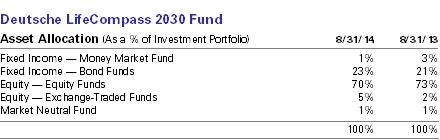
Total Investment Portfolio (Cost $51,446,232)† | 106.7 | 62,227,633 | ||||||
| Other Assets and Liabilities, Net | (6.7 | ) | (3,901,539 | ) | ||||
| Net Assets | 100.0 | 58,326,094 | ||||||
† The cost for federal income tax purposes was $51,772,594. At August 31, 2014, net unrealized appreciation for all securities based on tax cost was $10,455,039. This consisted of aggregate gross unrealized appreciation for all securities in which there was an excess of value over tax cost of $11,109,361 and aggregate gross unrealized depreciation for all securities in which there was an excess of tax cost over value of $654,322.
(a) Affiliated fund managed by Deutsche Investment Management Americas Inc.
(b) Affiliated fund managed by DBX Advisors LLC, a subsidiary of Deutsche Bank AG.
(c) The rate shown is the annualized seven-day yield at period end.
EAFE: Europe, Australasia and Far East
MSCI: Morgan Stanley Capital International
S&P: Standard & Poor's
SPDR: Standard & Poor's Depositary Receipt
During the year ended August 31, 2014, purchases and sales of affiliated Underlying Funds (excluding money market funds) aggregated $34,116,111 and $43,217,890, respectively. Purchase and sales on non-affiliated Underlying Funds (excluding money market funds) aggregated $2,358,595 and $1,308,477, respectively.
Fair Value Measurements
Various inputs are used in determining the value of the Fund's investments. These inputs are summarized in three broad levels. Level 1 includes quoted prices in active markets for identical securities. Level 2 includes other significant observable inputs (including quoted prices for similar securities, interest rates, prepayment speeds and credit risk). Level 3 includes significant unobservable inputs (including the Fund's own assumptions in determining the fair value of investments). The level assigned to the securities valuations may not be an indication of the risk or liquidity associated with investing in those securities.
The following is a summary of the inputs used as of August 31, 2014 in valuing the Fund's investments. For information on the Fund's policy regarding the valuation of investments, please refer to the Security Valuation section of Note A in the accompanying Notes to Financial Statements.
| Assets | Level 1 | Level 2 | Level 3 | Total | ||||||||||||
| Equity Funds | $ | 43,430,649 | $ | — | $ | — | $ | 43,430,649 | ||||||||
| Exchange-Traded Funds | 2,982,155 | — | — | 2,982,155 | ||||||||||||
| Bond Funds | 14,463,131 | — | — | 14,463,131 | ||||||||||||
| Market Neutral Fund | 800,221 | — | — | 800,221 | ||||||||||||
| Money Market Fund | 551,477 | — | — | 551,477 | ||||||||||||
| Total | $ | 62,227,633 | $ | — | $ | — | $ | 62,227,633 | ||||||||
There have been no transfers between fair value measurement levels during the year ended August 31, 2014.
Deutsche LifeCompass 2040 Fund
| Shares | Value ($) | |||||||
| Equity — Equity Funds 86.0% | ||||||||
| Deutsche Capital Growth Fund "Institutional" (a) | 7,396 | 595,237 | ||||||
| Deutsche Core Equity Fund "Institutional" (a) | 227,214 | 5,728,066 | ||||||
| Deutsche EAFE Equity Index Fund "Institutional" (a) | 129,092 | 1,928,637 | ||||||
| Deutsche Emerging Markets Equity Fund "Institutional" (a) | 63,613 | 1,133,577 | ||||||
| Deutsche Equity 500 Index Fund "Institutional" (a) | 24,609 | 5,596,674 | ||||||
| Deutsche Global Equity Fund "Institutional" (a) | 89,721 | 761,728 | ||||||
| Deutsche Global Growth Fund "Institutional" (a) | 9,665 | 292,748 | ||||||
| Deutsche Global Infrastructure Fund "Institutional" (a) | 57,042 | 897,267 | ||||||
| Deutsche Global Small Cap Fund "Institutional" (a) | 25,207 | 1,173,124 | ||||||
| Deutsche Latin America Equity Fund "S" (a) | 2,076 | 69,289 | ||||||
| Deutsche Real Estate Securities Fund "Institutional" (a) | 36,646 | 860,083 | ||||||
| Deutsche Real Estate Securities Income Fund "Institutional" (a) | 2,396 | 26,528 | ||||||
| Deutsche Small Cap Core Fund "S" (a) | 55,049 | 1,498,976 | ||||||
| Deutsche Small Cap Growth Fund "S" (a) | 5,882 | 194,294 | ||||||
| Deutsche Small Cap Value Fund "Institutional" (a) | 2,485 | 69,816 | ||||||
| Deutsche World Dividend Fund "Institutional" (a) | 26,717 | 820,465 | ||||||
Total Equity — Equity Funds (Cost $15,135,594) | 21,646,509 | |||||||
| Equity — Exchange-Traded Funds 4.8% | ||||||||
| Deutsche X-trackers MSCI Europe Hedged Equity Fund (b) | 4,400 | 120,032 | ||||||
| Deutsche X-trackers MSCI Japan Hedged Equity Fund (b) | 1,600 | 59,040 | ||||||
| iShares MSCI Pacific ex Japan Fund | 14,000 | 715,680 | ||||||
| SPDR Barclays Convertible Securities Fund | 3,834 | 196,109 | ||||||
| SPDR S&P Emerging Asia Pacific Fund | 1,500 | 132,615 | ||||||
Total Equity — Exchange-Traded Funds (Cost $1,166,794) | 1,223,476 | |||||||
| Fixed Income — Bond Funds 18.1% | ||||||||
| Deutsche Core Fixed Income Fund "Institutional" (a) | 32,298 | 321,687 | ||||||
| Deutsche Core Plus Income Fund "Institutional" (a) | 11,621 | 128,523 | ||||||
| Deutsche Enhanced Commodity Strategy Fund "Institutional" (a) | 58,794 | 900,719 | ||||||
| Deutsche Enhanced Emerging Markets Fixed Income Fund "Institutional" (a) | 80,078 | 868,041 | ||||||
| Deutsche Enhanced Global Bond Fund "S" (a) | 28,844 | 285,268 | ||||||
| Deutsche Floating Rate Fund "Institutional" (a) | 61,076 | 574,110 | ||||||
| Deutsche Global Inflation Fund "Institutional" (a) | 44,287 | 453,939 | ||||||
| Deutsche High Income Fund "Institutional" (a) | 75,692 | 382,243 | ||||||
| Deutsche Short Duration Fund "S" (a) | 30,752 | 281,689 | ||||||
| Deutsche U.S. Bond Index Fund "Institutional" (a) | 35,335 | 360,419 | ||||||
Total Fixed Income — Bond Funds (Cost $4,607,018) | 4,556,638 | |||||||
| Market Neutral Fund 1.5% | ||||||||
| Deutsche Diversified Market Neutral Fund "Institutional" (a) (Cost $382,124) | 43,594 | 375,343 | ||||||
| Fixed Income — Money Market Fund 0.5% | ||||||||
| Central Cash Management Fund, 0.05% (a) (c) (Cost $118,593) | 118,593 | 118,593 | ||||||
| % of Net Assets | Value ($) | |||||||
Total Investment Portfolio (Cost $21,410,123)† | 110.9 | 27,920,559 | ||||||
| Other Assets and Liabilities, Net | (10.9 | ) | (2,739,633 | ) | ||||
| Net Assets | 100.0 | 25,180,926 | ||||||
† The cost for federal income tax purposes was $21,650,982. At August 31, 2014, net unrealized appreciation for all securities based on tax cost was $6,269,577. This consisted of aggregate gross unrealized appreciation for all securities in which there was an excess of value over tax cost of $6,597,297 and aggregate gross unrealized depreciation for all securities in which there was an excess of tax cost over value of $327,720.
(a) Affiliated fund managed by Deutsche Investment Management Americas Inc.
(b) Affiliated fund managed by DBX Advisors LLC, a subsidiary of Deutsche Bank AG.
(c) The rate shown is the annualized seven-day yield at period end.
EAFE: Europe, Australasia and Far East
MSCI: Morgan Stanley Capital International
S&P: Standard & Poor's
SPDR: Standard & Poor's Depositary Receipt
During the year ended August 31, 2014, purchases and sales of affiliated Underlying Funds (excluding money market funds) aggregated $18,187,161 and $24,147,250, respectively. Purchase and sales on non-affiliated Underlying Funds (excluding money market funds) aggregated $1,236,782 and $979,356, respectively.
Fair Value Measurements
Various inputs are used in determining the value of the Fund's investments. These inputs are summarized in three broad levels. Level 1 includes quoted prices in active markets for identical securities. Level 2 includes other significant observable inputs (including quoted prices for similar securities, interest rates, prepayment speeds and credit risk). Level 3 includes significant unobservable inputs (including the Fund's own assumptions in determining the fair value of investments). The level assigned to the securities valuations may not be an indication of the risk or liquidity associated with investing in those securities.
The following is a summary of the inputs used as of August 31, 2014 in valuing the Fund's investments. For information on the Fund's policy regarding the valuation of investments, please refer to the Security Valuation section of Note A in the accompanying Notes to Financial Statements.
| Assets | Level 1 | Level 2 | Level 3 | Total | ||||||||||||
| Equity Funds | $ | 21,646,509 | $ | — | $ | — | $ | 21,646,509 | ||||||||
| Exchange-Traded Funds | 1,223,476 | — | — | 1,223,476 | ||||||||||||
| Bond Funds | 4,556,638 | — | — | 4,556,638 | ||||||||||||
| Market Neutral Fund | 375,343 | — | — | 375,343 | ||||||||||||
| Money Market Fund | 118,593 | — | — | 118,593 | ||||||||||||
| Total | $ | 27,920,559 | $ | — | $ | — | $ | 27,920,559 | ||||||||
There have been no transfers between fair value measurement levels during the year ended August 31, 2014.
The accompanying notes are an integral part of the financial statements.
| as of August 31, 2014 | ||||||||||||
| Assets | Deutsche LifeCompass Retirement Fund | Deutsche LifeCompass 2015 Fund | Deutsche LifeCompass 2020 Fund | |||||||||
| Investments in affiliated Underlying Funds, at value (cost $51,831,622, $69,476,286 and $140,996,801) | $ | 57,892,160 | $ | 79,992,769 | $ | 164,079,680 | ||||||
| Investments in non-affiliated Underlying Funds, at value (cost $3,051,444, $3,968,395 and $7,420,899) | 3,488,201 | 4,588,884 | 8,610,608 | |||||||||
| Total investments in securities, at value (cost $54,883,066, $73,444,681 and $148,417,700) | 61,380,361 | 84,581,653 | 172,690,288 | |||||||||
| Receivable for Fund shares sold | 4,225 | 10,877 | 5,623 | |||||||||
| Dividends receivable | 2,280 | 2,588 | 4,088 | |||||||||
| Interest receivable | 20 | 23 | 52 | |||||||||
| Other assets | 8,749 | 9,363 | 9,515 | |||||||||
| Total assets | 61,395,635 | 84,604,504 | 172,709,566 | |||||||||
| Liabilities | ||||||||||||
| Payable for Fund shares redeemed | 187,980 | 676,430 | 1,638,160 | |||||||||
| Accrued Trustees' fees | 1,529 | 748 | 2,227 | |||||||||
| Other accrued expenses and payables | 86,969 | 128,140 | 181,931 | |||||||||
| Total liabilities | 276,478 | 805,318 | 1,822,318 | |||||||||
| Net assets, at value | $ | 61,119,157 | $ | 83,799,186 | $ | 170,887,248 | ||||||
| Net Assets Consist of | ||||||||||||
| Undistributed net investment income | 776,434 | 707,434 | 2,793,101 | |||||||||
| Net unrealized appreciation (depreciation) on investments | 6,497,295 | 11,136,972 | 24,272,588 | |||||||||
| Accumulated net realized gain (loss) | (11,255,310 | ) | (35,269,750 | ) | (17,580,189 | ) | ||||||
| Paid-in capital | 65,100,738 | 107,224,530 | 161,401,748 | |||||||||
| Net assets, at value | $ | 61,119,157 | $ | 83,799,186 | $ | 170,887,248 | ||||||
The accompanying notes are an integral part of the financial statements.
Statements of Assets and Liabilities as of August 31, 2014 (continued) | ||||||||||||
| Net Asset Value | Deutsche LifeCompass Retirement Fund | Deutsche LifeCompass 2015 Fund | Deutsche LifeCompass 2020 Fund | |||||||||
Class A Net assets applicable to shares outstanding | $ | 14,499,085 | $ | 39,513,044 | $ | 68,171,416 | ||||||
| Shares outstanding of beneficial interest, $.01 par value, unlimited number of shares authorized | 1,122,416 | 3,074,862 | 4,235,543 | |||||||||
Net Asset Value and redemption price per share | $ | 12.92 | $ | 12.85 | $ | 16.10 | ||||||
| Maximum offering price per share (100 ÷ 94.25 of net asset value) | $ | 13.71 | $ | 13.63 | $ | 17.08 | ||||||
Class B Net assets applicable to shares outstanding | $ | 108,396 | $ | 351,538 | $ | 778,352 | ||||||
| Shares outstanding of beneficial interest, $.01 par value, unlimited number of shares authorized | 8,390 | 27,386 | 48,788 | |||||||||
Net Asset Value, offering and redemption price (subject to contingent deferred sales charge) per share | $ | 12.92 | $ | 12.84 | $ | 15.95 | ||||||
Class C Net assets applicable to shares outstanding | $ | 3,934,612 | $ | 9,334,958 | $ | 12,667,532 | ||||||
| Shares outstanding of beneficial interest, $.01 par value, unlimited number of shares authorized | 304,797 | 727,454 | 793,918 | |||||||||
Net Asset Value, offering and redemption price (subject to contingent deferred sales charge) per share | $ | 12.91 | $ | 12.83 | $ | 15.96 | ||||||
Class S Net assets applicable to shares outstanding | $ | 42,577,064 | $ | 34,599,646 | $ | 89,269,948 | ||||||
| Shares outstanding of beneficial interest, $.01 par value, unlimited number of shares authorized | 3,296,762 | 2,695,818 | 5,537,256 | |||||||||
Net Asset Value, offering and redemption price per share | $ | 12.91 | $ | 12.83 | $ | 16.12 | ||||||
The accompanying notes are an integral part of the financial statements.
Statements of Assets and Liabilities as of August 31, 2014 (continued) | ||||||||
| Assets | Deutsche LifeCompass 2030 Fund | Deutsche LifeCompass 2040 Fund | ||||||
| Investments in affiliated Underlying Funds, at value (cost $49,082,789 and $20,423,489) | $ | 59,582,602 | $ | 26,876,155 | ||||
| Investments in non-affiliated Underlying Funds, at value (cost $2,363,443 and $986,634) | 2,645,031 | 1,044,404 | ||||||
| Total investments in securities, at value (cost $51,446,232 and $21,410,123) | 62,227,633 | 27,920,559 | ||||||
| Receivable for Fund shares sold | 4,786 | 10,508 | ||||||
| Dividends receivable | 947 | 148 | ||||||
| Interest receivable | 35 | 14 | ||||||
| Other assets | 3,122 | 4,267 | ||||||
| Total assets | 62,236,523 | 27,935,496 | ||||||
| Liabilities | ||||||||
| Payable for Fund shares redeemed | 3,810,259 | 2,689,395 | ||||||
| Accrued Trustees' fees | 1,113 | 848 | ||||||
| Other accrued expenses and payables | 99,057 | 64,327 | ||||||
| Total liabilities | 3,910,429 | 2,754,570 | ||||||
| Net assets, at value | $ | 58,326,094 | $ | 25,180,926 | ||||
| Net Assets Consist of | ||||||||
| Undistributed net investment income | 175,576 | — | ||||||
| Net unrealized appreciation (depreciation) on investments | 10,781,401 | 6,510,436 | ||||||
| Accumulated net realized gain (loss) | 4,109,193 | 2,668,458 | ||||||
| Paid-in capital | 43,259,924 | 16,002,032 | ||||||
| Net assets, at value | $ | 58,326,094 | $ | 25,180,926 | ||||
The accompanying notes are an integral part of the financial statements.
Statements of Assets and Liabilities as of August 31, 2014 (continued) | ||||||||
| Net Asset Value | Deutsche LifeCompass 2030 Fund | Deutsche LifeCompass 2040 Fund | ||||||
Class A Net assets applicable to shares outstanding | $ | 31,668,714 | $ | 11,621,441 | ||||
| Shares outstanding of beneficial interest, $.01 par value, unlimited number of shares authorized | 2,630,968 | 1,227,487 | ||||||
Net Asset Value and redemption price per share | $ | 12.04 | $ | 9.47 | ||||
| Maximum offering price per share (100 ÷ 94.25 of net asset value) | $ | 12.77 | $ | 10.05 | ||||
Class B Net assets applicable to shares outstanding | $ | 295,930 | — | |||||
| Shares outstanding of beneficial interest, $.01 par value, unlimited number of shares authorized | 24,672 | — | ||||||
Net Asset Value, offering and redemption price (subject to contingent deferred sales charge) per share | $ | 11.99 | — | |||||
Class C Net assets applicable to shares outstanding | $ | 5,866,536 | $ | 376,903 | ||||
| Shares outstanding of beneficial interest, $.01 par value, unlimited number of shares authorized | 489,298 | 39,986 | ||||||
Net Asset Value, offering and redemption price (subject to contingent deferred sales charge) per share | $ | 11.99 | $ | 9.43 | ||||
Class S Net assets applicable to shares outstanding | $ | 20,494,914 | $ | 13,182,582 | ||||
| Shares outstanding of beneficial interest, $.01 par value, unlimited number of shares authorized | 1,701,155 | 1,389,355 | ||||||
Net Asset Value, offering and redemption price per share | $ | 12.05 | $ | 9.49 | ||||
The accompanying notes are an integral part of the financial statements.
| for the year ended August 31, 2014 | ||||||||||||
| Investment Income | Deutsche LifeCompass Retirement Fund | Deutsche LifeCompass 2015 Fund | Deutsche LifeCompass 2020 Fund | |||||||||
| Income distributions from affiliated Underlying Funds | $ | 1,378,606 | $ | 1,842,117 | $ | 3,267,940 | ||||||
| Dividends | 97,625 | 125,871 | 186,169 | |||||||||
| Total income | 1,476,231 | 1,967,988 | 3,454,109 | |||||||||
Expenses: Administration fee | 64,348 | 88,237 | 174,288 | |||||||||
| Services to shareholders | 103,541 | 166,878 | 372,373 | |||||||||
| Distribution and service fees | 81,215 | 206,519 | 320,119 | |||||||||
| Custodian fee | 10,477 | 10,700 | 10,857 | |||||||||
| Professional fees | 57,579 | 55,987 | 59,753 | |||||||||
| Reports to shareholders | 17,704 | 32,791 | 36,457 | |||||||||
| Registration fees | 48,715 | 48,710 | 50,103 | |||||||||
| Trustees' fees and expenses | 4,484 | 3,171 | 8,106 | |||||||||
| Other | 4,190 | 3,931 | 6,600 | |||||||||
| Total expenses before expense reductions | 392,253 | 616,924 | 1,038,656 | |||||||||
| Expense reductions | (174,220 | ) | (222,401 | ) | (347,968 | ) | ||||||
| Total expenses after expense reductions | 218,033 | 394,523 | 690,688 | |||||||||
| Net investment income | 1,258,198 | 1,573,465 | 2,763,421 | |||||||||
| Realized and Unrealized Gain (Loss) | ||||||||||||
Net realized gain (loss) from: Sale of affiliated Underlying Funds | 101,009 | 3,335,024 | 6,774,922 | |||||||||
| Sale of non-affiliated Underlying Funds | 90,096 | 71,387 | 160,212 | |||||||||
| Capital gain distributions from affiliated Underlying Funds | 1,236,696 | 1,750,520 | 3,634,939 | |||||||||
| 1,427,801 | 5,156,931 | 10,570,073 | ||||||||||
| Change in net unrealized appreciation (depreciation) on investments | 4,471,310 | 3,965,036 | 10,684,422 | |||||||||
| Net gain (loss) | 5,899,111 | 9,121,967 | 21,254,495 | |||||||||
| Net increase (decrease) in net assets resulting from operations | $ | 7,157,309 | $ | 10,695,432 | $ | 24,017,916 | ||||||
The accompanying notes are an integral part of the financial statements.
Statements of Operations for the year ended August 31, 2014 (continued) | ||||||||
| Investment Income | Deutsche LifeCompass 2030 Fund | Deutsche LifeCompass 2040 Fund | ||||||
| Income distributions from affiliated Underlying Funds | $ | 1,002,019 | $ | 407,045 | ||||
| Dividends | 40,435 | 10,715 | ||||||
| Total income | 1,042,454 | 417,760 | ||||||
Expenses: Administration fee | 61,253 | 28,214 | ||||||
| Services to shareholders | 141,391 | 76,099 | ||||||
| Distribution and service fees | 144,656 | 39,541 | ||||||
| Custodian fee | 8,223 | 8,573 | ||||||
| Professional fees | 58,886 | 58,989 | ||||||
| Reports to shareholders | 20,229 | 15,503 | ||||||
| Registration fees | 47,962 | 39,072 | ||||||
| Trustees' fees and expenses | 4,053 | 3,146 | ||||||
| Other | 3,303 | 2,858 | ||||||
| Total expenses before expense reductions | 489,956 | 271,995 | ||||||
| Expense reductions | (213,914 | ) | (171,258 | ) | ||||
| Total expenses after expense reductions | 276,042 | 100,737 | ||||||
| Net investment income | 766,412 | 317,023 | ||||||
| Realized and Unrealized Gain (Loss) | ||||||||
Net realized gain (loss) from: Sale of affiliated Underlying Funds | 3,550,044 | 2,598,747 | ||||||
| Sale of non-affiliated Underlying Funds | 75,802 | 91,877 | ||||||
| Capital gain distributions from affiliated Underlying Funds | 1,381,549 | 636,686 | ||||||
| 5,007,395 | 3,327,310 | |||||||
| Change in net unrealized appreciation (depreciation) on investments | 4,019,423 | 1,276,527 | ||||||
| Net gain (loss) | 9,026,818 | 4,603,837 | ||||||
| Net increase (decrease) in net assets resulting from operations | $ | 9,793,230 | $ | 4,920,860 | ||||
The accompanying notes are an integral part of the financial statements.
| Deutsche LifeCompass Retirement Fund | ||||||||
| Increase (Decrease) in Net Assets | Years Ended August 31, | |||||||
| 2014 | 2013 | |||||||
Operations: Net investment income | $ | 1,258,198 | $ | 1,783,709 | ||||
| Net realized gain (loss) | 1,427,801 | 1,626,366 | ||||||
| Change in net unrealized appreciation (depreciation) | 4,471,310 | 324,400 | ||||||
| Net increase (decrease) in net assets resulting from operations | 7,157,309 | 3,734,475 | ||||||
Distributions to shareholders from: Net investment income: Class A | (339,703 | ) | (531,042 | ) | ||||
| Class B | (2,329 | ) | (5,786 | ) | ||||
| Class C | (51,308 | ) | (60,155 | ) | ||||
| Class S | (1,004,508 | ) | (1,135,083 | ) | ||||
| Total distributions | (1,397,848 | ) | (1,732,066 | ) | ||||
Fund share transactions: Proceeds from shares sold | 5,300,124 | 7,255,554 | ||||||
| Reinvestment of distributions | 1,300,846 | 1,629,194 | ||||||
| Payments for shares redeemed | (23,607,193 | ) | (26,324,212 | ) | ||||
| Net increase (decrease) in net assets from Fund share transactions | (17,006,223 | ) | (17,439,464 | ) | ||||
| Increase (decrease) in net assets | (11,246,762 | ) | (15,437,055 | ) | ||||
| Net assets at beginning of period | 72,365,919 | 87,802,974 | ||||||
| Net assets at end of period (including undistributed net investment income of $776,434 and $689,466, respectively) | $ | 61,119,157 | $ | 72,365,919 | ||||
The accompanying notes are an integral part of the financial statements.
Statements of Changes in Net Assets (continued) Deutsche LifeCompass 2015 Fund | ||||||||
| Increase (Decrease) in Net Assets | Years Ended August 31, | |||||||
| 2014 | 2013 | |||||||
Operations: Net investment income | $ | 1,573,465 | $ | 2,597,186 | ||||
| Net realized gain (loss) | 5,156,931 | 3,021,698 | ||||||
| Change in net unrealized appreciation (depreciation) | 3,965,036 | 3,028,312 | ||||||
| Net increase (decrease) in net assets resulting from operations | 10,695,432 | 8,647,196 | ||||||
Distributions to shareholders from: Net investment income: Class A | (946,286 | ) | (1,013,306 | ) | ||||
| Class B | (8,004 | ) | (13,224 | ) | ||||
| Class C | (139,503 | ) | (124,673 | ) | ||||
| Class S | (876,057 | ) | (1,252,690 | ) | ||||
| Total distributions | (1,969,850 | ) | (2,403,893 | ) | ||||
Fund share transactions: Proceeds from shares sold | 7,236,544 | 11,680,242 | ||||||
| Reinvestment of distributions | 1,921,691 | 2,352,615 | ||||||
| Payments for shares redeemed | (26,578,286 | ) | (69,746,965 | ) | ||||
| Net increase (decrease) in net assets from Fund share transactions | (17,420,051 | ) | (55,714,108 | ) | ||||
| Increase (decrease) in net assets | (8,694,469 | ) | (49,470,805 | ) | ||||
| Net assets at beginning of period | 92,493,655 | 141,964,460 | ||||||
| Net assets at end of period (including undistributed net investment income of $707,434 and $750,631, respectively) | $ | 83,799,186 | $ | 92,493,655 | ||||
The accompanying notes are an integral part of the financial statements.
Statements of Changes in Net Assets (continued) Deutsche LifeCompass 2020 Fund | ||||||||
| Increase (Decrease) in Net Assets | Years Ended August 31, | |||||||
| 2014 | 2013 | |||||||
Operations: Net investment income | $ | 2,763,421 | $ | 3,848,910 | ||||
| Net realized gain (loss) | 10,570,073 | 5,564,685 | ||||||
| Change in net unrealized appreciation (depreciation) | 10,684,422 | 6,456,533 | ||||||
| Net increase (decrease) in net assets resulting from operations | 24,017,916 | 15,870,128 | ||||||
Distributions to shareholders from: Net investment income: Class A | (1,576,885 | ) | (1,459,194 | ) | ||||
| Class B | (18,342 | ) | (28,814 | ) | ||||
| Class C | (195,670 | ) | (154,707 | ) | ||||
| Class S | (2,206,725 | ) | (2,258,510 | ) | ||||
| Total distributions | (3,997,622 | ) | (3,901,225 | ) | ||||
Fund share transactions: Proceeds from shares sold | 18,103,584 | 22,018,173 | ||||||
| Reinvestment of distributions | 3,903,214 | 3,814,271 | ||||||
| Payments for shares redeemed | (44,279,635 | ) | (66,386,724 | ) | ||||
| Net increase (decrease) in net assets from Fund share transactions | (22,272,837 | ) | (40,554,280 | ) | ||||
| Increase (decrease) in net assets | (2,252,543 | ) | (28,585,377 | ) | ||||
| Net assets at beginning of period | 173,139,791 | 201,725,168 | ||||||
| Net assets at end of period (including undistributed net investment income of $2,793,101 and $3,133,771, respectively) | $ | 170,887,248 | $ | 173,139,791 | ||||
The accompanying notes are an integral part of the financial statements.
Statements of Changes in Net Assets (continued) Deutsche LifeCompass 2030 Fund | ||||||||
| Increase (Decrease) in Net Assets | Years Ended August 31, | |||||||
| 2014 | 2013 | |||||||
Operations: Net investment income | $ | 766,412 | $ | 1,274,250 | ||||
| Net realized gain (loss) | 5,007,395 | 4,149,138 | ||||||
| Change in net unrealized appreciation (depreciation) | 4,019,423 | 2,247,623 | ||||||
| Net increase (decrease) in net assets resulting from operations | 9,793,230 | 7,671,011 | ||||||
Distributions to shareholders from: Net investment income: Class A | (936,205 | ) | (690,169 | ) | ||||
| Class B | (6,746 | ) | (6,214 | ) | ||||
| Class C | (97,384 | ) | (40,054 | ) | ||||
| Class S | (557,333 | ) | (424,344 | ) | ||||
Net realized gains: Class A | (383,216 | ) | — | |||||
| Class B | (3,904 | ) | — | |||||
| Class C | (56,413 | ) | — | |||||
| Class S | (207,781 | ) | — | |||||
| Total distributions | (2,248,982 | ) | (1,160,781 | ) | ||||
Fund share transactions: Proceeds from shares sold | 10,951,539 | 20,688,469 | ||||||
| Reinvestment of distributions | 2,234,315 | 1,154,677 | ||||||
| Payments for shares redeemed | (25,444,117 | ) | (32,806,627 | ) | ||||
| Net increase (decrease) in net assets from Fund share transactions | (12,258,263 | ) | (10,963,481 | ) | ||||
| Increase (decrease) in net assets | (4,714,015 | ) | (4,453,251 | ) | ||||
| Net assets at beginning of period | 63,040,109 | 67,493,360 | ||||||
| Net assets at end of period (including undistributed net investment income of $175,576 and $604,798, respectively) | $ | 58,326,094 | $ | 63,040,109 | ||||
The accompanying notes are an integral part of the financial statements.
Statements of Changes in Net Assets (continued) Deutsche LifeCompass 2040 Fund | ||||||||
| Increase (Decrease) in Net Assets | Years Ended August 31, | |||||||
| 2014 | 2013 | |||||||
Operations: Net investment income | $ | 317,023 | $ | 733,627 | ||||
| Net realized gain (loss) | 3,327,310 | 3,100,651 | ||||||
| Change in net unrealized appreciation (depreciation) | 1,276,527 | 1,237,864 | ||||||
| Net increase (decrease) in net assets resulting from operations | 4,920,860 | 5,072,142 | ||||||
Distributions to shareholders from: Net investment income: Class A | (424,135 | ) | (314,923 | ) | ||||
| Class C | (6,606 | ) | (1,747 | ) | ||||
| Class S | (355,254 | ) | (332,082 | ) | ||||
Net realized gains: Class A | (1,779,542 | ) | (157,332 | ) | ||||
| Class C | (39,685 | ) | (1,860 | ) | ||||
| Class S | (1,352,960 | ) | (140,701 | ) | ||||
| Total distributions | (3,958,182 | ) | (948,645 | ) | ||||
Fund share transactions: Proceeds from shares sold | 9,125,464 | 15,013,740 | ||||||
| Reinvestment of distributions | 3,956,379 | 948,565 | ||||||
| Payments for shares redeemed | (19,556,591 | ) | (29,309,123 | ) | ||||
| Net increase (decrease) in net assets from Fund share transactions | (6,474,748 | ) | (13,346,818 | ) | ||||
| Increase (decrease) in net assets | (5,512,070 | ) | (9,223,321 | ) | ||||
| Net assets at beginning of period | 30,692,996 | 39,916,317 | ||||||
| Net assets at end of period (including undistributed net investment income of $0 and $206,866, respectively) | $ | 25,180,926 | $ | 30,692,996 | ||||
The accompanying notes are an integral part of the financial statements.
| Deutsche LifeCompass Retirement Fund — Class A | ||||||||||||||||||||
| Years Ended August 31, | ||||||||||||||||||||
| 2014 | 2013 | 2012 | 2011 | 2010 | ||||||||||||||||
| Selected Per Share Data | ||||||||||||||||||||
| Net asset value, beginning of period | $ | 11.84 | $ | 11.58 | $ | 11.06 | $ | 10.47 | $ | 10.08 | ||||||||||
Income (loss) from investment operations: Net investment incomea | .23 | .25 | .22 | .24 | .25 | |||||||||||||||
| Net realized and unrealized gain (loss) | 1.10 | .25 | .52 | .58 | .42 | |||||||||||||||
| Total from investment operations | 1.33 | .50 | .74 | .82 | .67 | |||||||||||||||
Less distributions from: Net investment income | (.25 | ) | (.24 | ) | (.22 | ) | (.23 | ) | (.28 | ) | ||||||||||
| Net asset value, end of period | $ | 12.92 | $ | 11.84 | $ | 11.58 | $ | 11.06 | $ | 10.47 | ||||||||||
Total Return (%)b,c,d | 11.36 | 4.33 | 6.79 | 7.81 | 6.67 | |||||||||||||||
| Ratios to Average Net Assets and Supplemental Data | ||||||||||||||||||||
| Net assets, end of period ($ millions) | 14 | 23 | 29 | 27 | 31 | |||||||||||||||
Ratio of expenses before expense reductions (%)e | .77 | .74 | .74 | .71 | .74 | |||||||||||||||
Ratio of expenses after expense reductions (%)e | .46 | .47 | .62 | .62 | .61 | |||||||||||||||
| Ratio of net investment income (%) | 1.85 | 2.08 | 1.99 | 2.12 | 2.39 | |||||||||||||||
| Portfolio turnover rate (%) | 64 | 28 | 53 | 37 | 53 | |||||||||||||||
a Based on average shares outstanding during the period. b Total return does not reflect the effect of any sales charge. c Total return would have been lower had certain expenses not been reduced. d Total return would have been lower if the Advisor had not reduced some Underlying Funds' expenses. e The Fund invests in other Funds and indirectly bears its proportionate share of fees and expenses incurred by the Underlying Funds in which the Fund is invested. This ratio does not include these indirect fees and expenses. | ||||||||||||||||||||
| Deutsche LifeCompass Retirement Fund — Class B | ||||||||||||||||||||
| Years Ended August 31, | ||||||||||||||||||||
| 2014 | 2013 | 2012 | 2011 | 2010 | ||||||||||||||||
| Selected Per Share Data | ||||||||||||||||||||
| Net asset value, beginning of period | $ | 11.84 | $ | 11.58 | $ | 11.06 | $ | 10.47 | $ | 10.08 | ||||||||||
Income (loss) from investment operations: Net investment incomea | .14 | .16 | .14 | .15 | .17 | |||||||||||||||
| Net realized and unrealized gain (loss) | 1.10 | .25 | .52 | .58 | .42 | |||||||||||||||
| Total from investment operations | 1.24 | .41 | .66 | .73 | .59 | |||||||||||||||
Less distributions from: Net investment income | (.16 | ) | (.15 | ) | (.14 | ) | (.14 | ) | (.20 | ) | ||||||||||
| Net asset value, end of period | $ | 12.92 | $ | 11.84 | $ | 11.58 | $ | 11.06 | $ | 10.47 | ||||||||||
Total Return (%)b,c,d | 10.51 | 3.55 | 5.99 | 7.00 | 5.87 | |||||||||||||||
| Ratios to Average Net Assets and Supplemental Data | ||||||||||||||||||||
| Net assets, end of period ($ millions) | .1 | .2 | 1 | 1 | 2 | |||||||||||||||
Ratio of expenses before expense reductions (%)e | 1.69 | 1.54 | 1.48 | 1.43 | 1.43 | |||||||||||||||
Ratio of expenses after expense reductions (%)e | 1.21 | 1.23 | 1.37 | 1.37 | 1.36 | |||||||||||||||
| Ratio of net investment income (%) | 1.11 | 1.36 | 1.24 | 1.37 | 1.64 | |||||||||||||||
| Portfolio turnover rate (%) | 64 | 28 | 53 | 37 | 53 | |||||||||||||||
a Based on average shares outstanding during the period. b Total return does not reflect the effect of any sales charge. c Total return would have been lower had certain expenses not been reduced. d Total return would have been lower if the Advisor had not reduced some Underlying Funds' expenses. e The Fund invests in other Funds and indirectly bears its proportionate share of fees and expenses incurred by the Underlying Funds in which the Fund is invested. This ratio does not include these indirect fees and expenses. | ||||||||||||||||||||
| Deutsche LifeCompass Retirement Fund — Class C | ||||||||||||||||||||
| Years Ended August 31, | ||||||||||||||||||||
| 2014 | 2013 | 2012 | 2011 | 2010 | ||||||||||||||||
| Selected Per Share Data | ||||||||||||||||||||
| Net asset value, beginning of period | $ | 11.83 | $ | 11.57 | $ | 11.05 | $ | 10.46 | $ | 10.07 | ||||||||||
Income (loss) from investment operations: Net investment incomea | .13 | .16 | .14 | .15 | .17 | |||||||||||||||
| Net realized and unrealized gain (loss) | 1.11 | .25 | .52 | .58 | .42 | |||||||||||||||
| Total from investment operations | 1.24 | .41 | .66 | .73 | .59 | |||||||||||||||
Less distributions from: Net investment income | (.16 | ) | (.15 | ) | (.14 | ) | (.14 | ) | (.20 | ) | ||||||||||
| Net asset value, end of period | $ | 12.91 | $ | 11.83 | $ | 11.57 | $ | 11.05 | $ | 10.46 | ||||||||||
Total Return (%)b,c,d | 10.53 | 3.55 | 6.00 | 7.01 | 5.88 | |||||||||||||||
| Ratios to Average Net Assets and Supplemental Data | ||||||||||||||||||||
| Net assets, end of period ($ millions) | 4 | 4 | 5 | 6 | 7 | |||||||||||||||
Ratio of expenses before expense reductions (%)e | 1.48 | 1.46 | 1.43 | 1.40 | 1.40 | |||||||||||||||
Ratio of expenses after expense reductions (%)e | 1.21 | 1.22 | 1.37 | 1.37 | 1.36 | |||||||||||||||
| Ratio of net investment income (%) | 1.07 | 1.32 | 1.23 | 1.37 | 1.64 | |||||||||||||||
| Portfolio turnover rate (%) | 64 | 28 | 53 | 37 | 53 | |||||||||||||||
a Based on average shares outstanding during the period. b Total return does not reflect the effect of any sales charge. c Total return would have been lower had certain expenses not been reduced. d Total return would have been lower if the Advisor had not reduced some Underlying Funds' expenses. e The Fund invests in other Funds and indirectly bears its proportionate share of fees and expenses incurred by the Underlying Funds in which the Fund is invested. This ratio does not include these indirect fees and expenses. | ||||||||||||||||||||
| Deutsche LifeCompass Retirement Fund — Class S | ||||||||||||||||||||
| Years Ended August 31, | ||||||||||||||||||||
| 2014 | 2013 | 2012 | 2011 | 2010 | ||||||||||||||||
| Selected Per Share Data | ||||||||||||||||||||
| Net asset value, beginning of period | $ | 11.83 | $ | 11.57 | $ | 11.06 | $ | 10.46 | $ | 10.08 | ||||||||||
Income (loss) from investment operations: Net investment incomea | .26 | .28 | .25 | .26 | .28 | |||||||||||||||
| Net realized and unrealized gain (loss) | 1.10 | .25 | .51 | .59 | .41 | |||||||||||||||
| Total from investment operations | 1.36 | .53 | .76 | .85 | .69 | |||||||||||||||
Less distributions from: Net investment income | (.28 | ) | (.27 | ) | (.25 | ) | (.25 | ) | (.31 | ) | ||||||||||
| Net asset value, end of period | $ | 12.91 | $ | 11.83 | $ | 11.57 | $ | 11.06 | $ | 10.46 | ||||||||||
Total Return (%)b,c | 11.65 | 4.59 | 6.97 | 8.18 | 6.84 | |||||||||||||||
| Ratios to Average Net Assets and Supplemental Data | ||||||||||||||||||||
| Net assets, end of period ($ millions) | 43 | 45 | 53 | 54 | 53 | |||||||||||||||
Ratio of expenses before expense reductions (%)d | .47 | .45 | .45 | .39 | .42 | |||||||||||||||
Ratio of expenses after expense reductions (%)d | .21 | .22 | .37 | .37 | .36 | |||||||||||||||
| Ratio of net investment income (%) | 2.08 | 2.34 | 2.20 | 2.37 | 2.64 | |||||||||||||||
| Portfolio turnover rate (%) | 64 | 28 | 53 | 37 | 53 | |||||||||||||||
a Based on average shares outstanding during the period. b Total return would have been lower had certain expenses not been reduced. c Total return would have been lower if the Advisor had not reduced some Underlying Funds' expenses. d The Fund invests in other Funds and indirectly bears its proportionate share of fees and expenses incurred by the Underlying Funds in which the Fund is invested. This ratio does not include these indirect fees and expenses. | ||||||||||||||||||||
| Deutsche LifeCompass 2015 Fund — Class A | ||||||||||||||||||||
| Years Ended August 31, | ||||||||||||||||||||
| 2014 | 2013 | 2012 | 2011 | 2010 | ||||||||||||||||
| Selected Per Share Data | ||||||||||||||||||||
| Net asset value, beginning of period | $ | 11.66 | $ | 11.14 | $ | 10.57 | $ | 9.70 | $ | 9.39 | ||||||||||
Income (loss) from investment operations: Net investment incomea | .22 | .24 | .20 | .20 | .20 | |||||||||||||||
| Net realized and unrealized gain (loss) | 1.24 | .51 | .58 | .85 | .33 | |||||||||||||||
| Total from investment operations | 1.46 | .75 | .78 | 1.05 | .53 | |||||||||||||||
Less distributions from: Net investment income | (.27 | ) | (.23 | ) | (.21 | ) | (.18 | ) | (.22 | ) | ||||||||||
| Net asset value, end of period | $ | 12.85 | $ | 11.66 | $ | 11.14 | $ | 10.57 | $ | 9.70 | ||||||||||
Total Return (%)b,c,d | 12.65 | 6.74 | 7.54 | 10.80 | 5.61 | |||||||||||||||
| Ratios to Average Net Assets and Supplemental Data | ||||||||||||||||||||
| Net assets, end of period ($ millions) | 40 | 44 | 58 | 63 | 70 | |||||||||||||||
Ratio of expenses before expense reductions (%)e | .71 | .68 | .66 | .65 | .65 | |||||||||||||||
Ratio of expenses after expense reductions (%)e | .46 | .47 | .58 | .58 | .57 | |||||||||||||||
| Ratio of net investment income (%) | 1.76 | 2.08 | 1.83 | 1.88 | 2.02 | |||||||||||||||
| Portfolio turnover rate (%) | 61 | 31 | 39 | 31 | 51 | |||||||||||||||
a Based on average shares outstanding during the period. b Total return does not reflect the effect of any sales charge. c Total return would have been lower had certain expenses not been reduced. d Total return would have been lower if the Advisor had not reduced some Underlying Funds' expenses. e The Fund invests in other Funds and indirectly bears its proportionate share of fees and expenses incurred by the Underlying Funds in which the Fund is invested. This ratio does not include these indirect fees and expenses. | ||||||||||||||||||||
| Deutsche LifeCompass 2015 Fund — Class B | ||||||||||||||||||||
| Years Ended August 31, | ||||||||||||||||||||
| 2014 | 2013 | 2012 | 2011 | 2010 | ||||||||||||||||
| Selected Per Share Data | ||||||||||||||||||||
| Net asset value, beginning of period | $ | 11.64 | $ | 11.13 | $ | 10.55 | $ | 9.69 | $ | 9.38 | ||||||||||
Income (loss) from investment operations: Net investment incomea | .13 | .16 | .12 | .12 | .13 | |||||||||||||||
| Net realized and unrealized gain (loss) | 1.25 | .49 | .59 | .84 | .32 | |||||||||||||||
| Total from investment operations | 1.38 | .65 | .71 | .96 | .45 | |||||||||||||||
Less distributions from: Net investment income | (.18 | ) | (.14 | ) | (.13 | ) | (.10 | ) | (.14 | ) | ||||||||||
| Net asset value, end of period | $ | 12.84 | $ | 11.64 | $ | 11.13 | $ | 10.55 | $ | 9.69 | ||||||||||
Total Return (%)b,c,d | 11.91 | 5.86 | 6.84 | 9.88 | 4.82 | |||||||||||||||
| Ratios to Average Net Assets and Supplemental Data | ||||||||||||||||||||
| Net assets, end of period ($ millions) | .4 | 1 | 1 | 3 | 7 | |||||||||||||||
Ratio of expenses before expense reductions (%)e | 1.70 | 1.56 | 1.54 | 1.45 | 1.37 | |||||||||||||||
Ratio of expenses after expense reductions (%)e | 1.21 | 1.22 | 1.33 | 1.33 | 1.32 | |||||||||||||||
| Ratio of net investment income (%) | 1.08 | 1.39 | 1.13 | 1.13 | 1.27 | |||||||||||||||
| Portfolio turnover rate (%) | 61 | 31 | 39 | 31 | 51 | |||||||||||||||
a Based on average shares outstanding during the period. b Total return does not reflect the effect of any sales charge. c Total return would have been lower had certain expenses not been reduced. d Total return would have been lower if the Advisor had not reduced some Underlying Funds' expenses. e The Fund invests in other Funds and indirectly bears its proportionate share of fees and expenses incurred by the Underlying Funds in which the Fund is invested. This ratio does not include these indirect fees and expenses. | ||||||||||||||||||||
| Deutsche LifeCompass 2015 Fund — Class C | ||||||||||||||||||||
| Years Ended August 31, | ||||||||||||||||||||
| 2014 | 2013 | 2012 | 2011 | 2010 | ||||||||||||||||
| Selected Per Share Data | ||||||||||||||||||||
| Net asset value, beginning of period | $ | 11.64 | $ | 11.13 | $ | 10.55 | $ | 9.69 | $ | 9.38 | ||||||||||
Income (loss) from investment operations: Net investment incomea | .12 | .15 | .12 | .12 | .13 | |||||||||||||||
| Net realized and unrealized gain (loss) | 1.25 | .50 | .59 | .84 | .32 | |||||||||||||||
| Total from investment operations | 1.37 | .65 | .71 | .96 | .45 | |||||||||||||||
Less distributions from: Net investment income | (.18 | ) | (.14 | ) | (.13 | ) | (.10 | ) | (.14 | ) | ||||||||||
| Net asset value, end of period | $ | 12.83 | $ | 11.64 | $ | 11.13 | $ | 10.55 | $ | 9.69 | ||||||||||
Total Return (%)b,c,d | 11.82 | 5.86 | 6.84 | 9.89 | 4.83 | |||||||||||||||
| Ratios to Average Net Assets and Supplemental Data | ||||||||||||||||||||
| Net assets, end of period ($ millions) | 9 | 10 | 11 | 13 | 15 | |||||||||||||||
Ratio of expenses before expense reductions (%)e | 1.43 | 1.40 | 1.38 | 1.36 | 1.34 | |||||||||||||||
Ratio of expenses after expense reductions (%)e | 1.21 | 1.22 | 1.33 | 1.33 | 1.32 | |||||||||||||||
| Ratio of net investment income (%) | 1.01 | 1.30 | 1.10 | 1.13 | 1.28 | |||||||||||||||
| Portfolio turnover rate (%) | 61 | 31 | 39 | 31 | 51 | |||||||||||||||
a Based on average shares outstanding during the period. b Total return does not reflect the effect of any sales charge. c Total return would have been lower had certain expenses not been reduced. d Total return would have been lower if the Advisor had not reduced some Underlying Funds' expenses. e The Fund invests in other Funds and indirectly bears its proportionate share of fees and expenses incurred by the Underlying Funds in which the Fund is invested. This ratio does not include these indirect fees and expenses. | ||||||||||||||||||||
| Deutsche LifeCompass 2015 Fund — Class S | ||||||||||||||||||||
| Years Ended August 31, | ||||||||||||||||||||
| 2014 | 2013 | 2012 | 2011 | 2010 | ||||||||||||||||
| Selected Per Share Data | ||||||||||||||||||||
| Net asset value, beginning of period | $ | 11.64 | $ | 11.13 | $ | 10.55 | $ | 9.69 | $ | 9.38 | ||||||||||
Income (loss) from investment operations: Net investment incomea | .25 | .28 | .22 | .23 | .22 | |||||||||||||||
| Net realized and unrealized gain (loss) | 1.24 | .48 | .60 | .84 | .33 | |||||||||||||||
| Total from investment operations | 1.49 | .76 | .82 | 1.07 | .55 | |||||||||||||||
Less distributions from: Net investment income | (.30 | ) | (.25 | ) | (.24 | ) | (.21 | ) | (.24 | ) | ||||||||||
| Net asset value, end of period | $ | 12.83 | $ | 11.64 | $ | 11.13 | $ | 10.55 | $ | 9.69 | ||||||||||
Total Return (%)b,c | 12.95 | 6.92 | 7.92 | 10.98 | 5.89 | |||||||||||||||
| Ratios to Average Net Assets and Supplemental Data | ||||||||||||||||||||
| Net assets, end of period ($ millions) | 35 | 38 | 71 | 70 | 73 | |||||||||||||||
Ratio of expenses before expense reductions (%)d | .47 | .45 | .44 | .42 | .41 | |||||||||||||||
Ratio of expenses after expense reductions (%)d | .21 | .22 | .33 | .33 | .32 | |||||||||||||||
| Ratio of net investment income (%) | 2.03 | 2.41 | 2.07 | 2.13 | 2.27 | |||||||||||||||
| Portfolio turnover rate (%) | 61 | 31 | 39 | 31 | 51 | |||||||||||||||
a Based on average shares outstanding during the period. b Total return would have been lower had certain expenses not been reduced. c Total return would have been lower if the Advisor had not reduced some Underlying Funds' expenses. d The Fund invests in other Funds and indirectly bears its proportionate share of fees and expenses incurred by the Underlying Funds in which the Fund is invested. This ratio does not include these indirect fees and expenses. | ||||||||||||||||||||
| Deutsche LifeCompass 2020 Fund — Class A | ||||||||||||||||||||
| Years Ended August 31, | ||||||||||||||||||||
| 2014 | 2013 | 2012 | 2011 | 2010 | ||||||||||||||||
| Selected Per Share Data | ||||||||||||||||||||
| Net asset value, beginning of period | $ | 14.34 | $ | 13.50 | $ | 12.74 | $ | 11.56 | $ | 11.21 | ||||||||||
Income (loss) from investment operations: Net investment incomea | .23 | .27 | .22 | .22 | .21 | |||||||||||||||
| Net realized and unrealized gain (loss) | 1.87 | .83 | .78 | 1.18 | .36 | |||||||||||||||
| Total from investment operations | 2.10 | 1.10 | 1.00 | 1.40 | .57 | |||||||||||||||
Less distributions from: Net investment income | (.34 | ) | (.26 | ) | (.24 | ) | (.22 | ) | (.23 | ) | ||||||||||
| Increase from regulatory settlements | — | — | — | — | .01 | f | ||||||||||||||
| Net asset value, end of period | $ | 16.10 | $ | 14.34 | $ | 13.50 | $ | 12.74 | $ | 11.56 | ||||||||||
Total Return (%)b,c,d | 14.68 | 8.28 | 8.01 | 12.08 | 5.10 | f | ||||||||||||||
| Ratios to Average Net Assets and Supplemental Data | ||||||||||||||||||||
| Net assets, end of period ($ millions) | 68 | 72 | 80 | 79 | 80 | |||||||||||||||
Ratio of expenses before expense reductions (%)e | .65 | .67 | .63 | .68 | .67 | |||||||||||||||
Ratio of expenses after expense reductions (%)e | .46 | .47 | .59 | .59 | .58 | |||||||||||||||
| Ratio of net investment income (%) | 1.52 | 1.93 | 1.69 | 1.70 | 1.82 | |||||||||||||||
| Portfolio turnover rate (%) | 60 | 32 | 45 | 26 | 50 | |||||||||||||||
a Based on average shares outstanding during the period. b Total return does not reflect the effect of any sales charge. c Total return would have been lower had certain expenses not been reduced. d Total return would have been lower if the Advisor had not reduced some Underlying Funds' expenses. e The Fund invests in other Funds and indirectly bears its proportionate share of fees and expenses incurred by the Underlying Funds in which the Fund is invested. This ratio does not include these indirect fees and expenses. f Includes a non-recurring payment from the Advisor which amounted to $0.0004 per share recorded as a result of the Advisor's settlement with the SEC and NY Attorney General in connection with certain trading arrangements. The Fund also received $0.0063 per share of non-affiliated regulatory settlements. Excluding these non-recurring payments, total return would have been 0.06% lower. | ||||||||||||||||||||
| Deutsche LifeCompass 2020 Fund — Class B | ||||||||||||||||||||
| Years Ended August 31, | ||||||||||||||||||||
| 2014 | 2013 | 2012 | 2011 | 2010 | ||||||||||||||||
| Selected Per Share Data | ||||||||||||||||||||
| Net asset value, beginning of period | $ | 14.22 | $ | 13.39 | $ | 12.62 | $ | 11.45 | $ | 11.11 | ||||||||||
Income (loss) from investment operations: Net investment incomea | .13 | .18 | .14 | .13 | .13 | |||||||||||||||
| Net realized and unrealized gain (loss) | 1.82 | .82 | .77 | 1.16 | .34 | |||||||||||||||
| Total from investment operations | 1.95 | 1.00 | .91 | 1.29 | .47 | |||||||||||||||
Less distributions from: Net investment income | (.22 | ) | (.17 | ) | (.14 | ) | (.12 | ) | (.14 | ) | ||||||||||
| Increase from regulatory settlements | — | — | — | — | .01 | f | ||||||||||||||
| Net asset value, end of period | $ | 15.95 | $ | 14.22 | $ | 13.39 | $ | 12.62 | $ | 11.45 | ||||||||||
Total Return (%)b,d | 13.77 | c | 7.55 | c | 7.34 | 11.24 | c | 4.24 | c,f | |||||||||||
| Ratios to Average Net Assets and Supplemental Data | ||||||||||||||||||||
| Net assets, end of period ($ millions) | 1 | 1 | 3 | 5 | 10 | |||||||||||||||
Ratio of expenses before expense reductions (%)e | 1.54 | 1.44 | 1.23 | 1.54 | 1.39 | |||||||||||||||
Ratio of expenses after expense reductions (%)e | 1.21 | 1.22 | 1.23 | 1.34 | 1.33 | |||||||||||||||
| Ratio of net investment income (%) | .83 | 1.26 | 1.07 | .95 | 1.07 | |||||||||||||||
| Portfolio turnover rate (%) | 60 | 32 | 45 | 26 | 50 | |||||||||||||||
a Based on average shares outstanding during the period. b Total return does not reflect the effect of any sales charge. c Total return would have been lower had certain expenses not been reduced. d Total return would have been lower if the Advisor had not reduced some Underlying Funds' expenses. e The Fund invests in other Funds and indirectly bears its proportionate share of fees and expenses incurred by the Underlying Funds in which the Fund is invested. This ratio does not include these indirect fees and expenses. f Includes a non-recurring payment from the Advisor which amounted to $0.0004 per share recorded as a result of the Advisor's settlement with the SEC and NY Attorney General in connection with certain trading arrangements. The Fund also received $0.0063 per share of non-affiliated regulatory settlements. Excluding these non-recurring payments, total return would have been 0.06% lower. | ||||||||||||||||||||
| Deutsche LifeCompass 2020 Fund — Class C | ||||||||||||||||||||
| Years Ended August 31, | ||||||||||||||||||||
| 2014 | 2013 | 2012 | 2011 | 2010 | ||||||||||||||||
| Selected Per Share Data | ||||||||||||||||||||
| Net asset value, beginning of period | $ | 14.22 | $ | 13.38 | $ | 12.63 | $ | 11.45 | $ | 11.11 | ||||||||||
Income (loss) from investment operations: Net investment incomea | .12 | .16 | .12 | .13 | .13 | |||||||||||||||
| Net realized and unrealized gain (loss) | 1.84 | .84 | .77 | 1.17 | .34 | |||||||||||||||
| Total from investment operations | 1.96 | 1.00 | .89 | 1.30 | .47 | |||||||||||||||
Less distributions from: Net investment income | (.22 | ) | (.16 | ) | (.14 | ) | (.12 | ) | (.14 | ) | ||||||||||
| Increase from regulatory settlements | — | — | — | — | .01 | f | ||||||||||||||
| Net asset value, end of period | $ | 15.96 | $ | 14.22 | $ | 13.38 | $ | 12.63 | $ | 11.45 | ||||||||||
Total Return (%)b,d | 13.84 | c | 7.52 | c | 7.17 | 11.33 | c | 4.24 | c,f | |||||||||||
| Ratios to Average Net Assets and Supplemental Data | ||||||||||||||||||||
| Net assets, end of period ($ millions) | 13 | 13 | 14 | 16 | 18 | |||||||||||||||
Ratio of expenses before expense reductions (%)e | 1.37 | 1.38 | 1.33 | 1.40 | 1.37 | |||||||||||||||
Ratio of expenses after expense reductions (%)e | 1.21 | 1.22 | 1.33 | 1.34 | 1.33 | |||||||||||||||
| Ratio of net investment income (%) | .77 | 1.18 | .95 | .95 | 1.07 | |||||||||||||||
| Portfolio turnover rate (%) | 60 | 32 | 45 | 26 | 50 | |||||||||||||||
a Based on average shares outstanding during the period. b Total return does not reflect the effect of any sales charge. c Total return would have been lower had certain expenses not been reduced. d Total return would have been lower if the Advisor had not reduced some Underlying Funds' expenses. e The Fund invests in other Funds and indirectly bears its proportionate share of fees and expenses incurred by the Underlying Funds in which the Fund is invested. This ratio does not include these indirect fees and expenses. f Includes a non-recurring payment from the Advisor which amounted to $0.0004 per share recorded as a result of the Advisor's settlement with the SEC and NY Attorney General in connection with certain trading arrangements. The Fund also received $0.0063 per share of non-affiliated regulatory settlements. Excluding these non-recurring payments, total return would have been 0.06% lower. | ||||||||||||||||||||
| Deutsche LifeCompass 2020 Fund — Class S | ||||||||||||||||||||
| Years Ended August 31, | ||||||||||||||||||||
| 2014 | 2013 | 2012 | 2011 | 2010 | ||||||||||||||||
| Selected Per Share Data | ||||||||||||||||||||
| Net asset value, beginning of period | $ | 14.37 | $ | 13.52 | $ | 12.77 | $ | 11.58 | $ | 11.23 | ||||||||||
Income (loss) from investment operations: Net investment incomea | .27 | .31 | .24 | .25 | .24 | |||||||||||||||
| Net realized and unrealized gain (loss) | 1.86 | .84 | .78 | 1.19 | .36 | |||||||||||||||
| Total from investment operations | 2.13 | 1.15 | 1.02 | 1.44 | .60 | |||||||||||||||
Less distributions from: Net investment income | (.38 | ) | (.30 | ) | (.27 | ) | (.25 | ) | (.26 | ) | ||||||||||
| Increase from regulatory settlements | — | — | — | — | .01 | e | ||||||||||||||
| Net asset value, end of period | $ | 16.12 | $ | 14.37 | $ | 13.52 | $ | 12.77 | $ | 11.58 | ||||||||||
Total Return (%)b,c | 14.95 | 8.62 | 8.19 | 12.43 | 5.36 | e | ||||||||||||||
| Ratios to Average Net Assets and Supplemental Data | ||||||||||||||||||||
| Net assets, end of period ($ millions) | 89 | 87 | 105 | 107 | 96 | |||||||||||||||
Ratio of expenses before expense reductions (%)d | .42 | .42 | .42 | .42 | .45 | |||||||||||||||
Ratio of expenses after expense reductions (%)d | .21 | .22 | .34 | .34 | .33 | |||||||||||||||
| Ratio of net investment income (%) | 1.77 | 2.20 | 1.87 | 1.95 | 2.07 | |||||||||||||||
| Portfolio turnover rate (%) | 60 | 32 | 45 | 26 | 50 | |||||||||||||||
a Based on average shares outstanding during the period. b Total return would have been lower had certain expenses not been reduced. c Total return would have been lower if the Advisor had not reduced some Underlying Funds' expenses. d The Fund invests in other Funds and indirectly bears its proportionate share of fees and expenses incurred by the Underlying Funds in which the Fund is invested. This ratio does not include these indirect fees and expenses. e Includes a non-recurring payment from the Advisor which amounted to $.0004 per share recorded as a result of the Advisor's settlement with the SEC and NY Attorney General in connection with certain trading arrangements. The Fund also received $.0063 per share of non-affiliated regulatory settlements. Excluding these non-recurring payments, total return would have been 0.06% lower. | ||||||||||||||||||||
| Deutsche LifeCompass 2030 Fund — Class A | ||||||||||||||||||||
| Years Ended August 31, | ||||||||||||||||||||
| 2014 | 2013 | 2012 | 2011 | 2010 | ||||||||||||||||
| Selected Per Share Data | ||||||||||||||||||||
| Net asset value, beginning of period | $ | 10.66 | $ | 9.71 | $ | 9.10 | $ | 8.04 | $ | 7.87 | ||||||||||
Income (loss) from investment operations: Net investment incomea | .14 | .19 | .13 | .12 | .11 | |||||||||||||||
| Net realized and unrealized gain (loss) | 1.68 | .92 | .61 | 1.04 | .18 | |||||||||||||||
| Total from investment operations | 1.82 | 1.11 | .74 | 1.16 | .29 | |||||||||||||||
Less distributions from: Net investment income | (.31 | ) | (.16 | ) | (.13 | ) | (.10 | ) | (.12 | ) | ||||||||||
| Net realized gains | (.13 | ) | — | — | — | — | ||||||||||||||
| Total distributions | (.44 | ) | (.16 | ) | (.13 | ) | (.10 | ) | (.12 | ) | ||||||||||
| Net asset value, end of period | $ | 12.04 | $ | 10.66 | $ | 9.71 | $ | 9.10 | $ | 8.04 | ||||||||||
Total Return (%)b,c,d | 17.23 | 11.61 | 8.26 | 14.44 | 3.63 | |||||||||||||||
| Ratios to Average Net Assets and Supplemental Data | ||||||||||||||||||||
| Net assets, end of period ($ millions) | 32 | 40 | 41 | 38 | 40 | |||||||||||||||
Ratio of expenses before expense reductions (%)e | .82 | .82 | .80 | .80 | .85 | |||||||||||||||
Ratio of expenses after expense reductions (%)e | .46 | .47 | .58 | .58 | .55 | |||||||||||||||
| Ratio of net investment income (%) | 1.25 | 1.84 | 1.39 | 1.30 | 1.33 | |||||||||||||||
| Portfolio turnover rate (%) | 60 | 41 | 46 | 32 | 44 | |||||||||||||||
a Based on average shares outstanding during the period. b Total return does not reflect the effect of any sales charge. c Total return would have been lower had certain expenses not been reduced. d Total return would have been lower if the Advisor had not reduced some Underlying Funds' expenses. e The Fund invests in other Funds and indirectly bears its proportionate share of fees and expenses incurred by the Underlying Funds in which the Fund is invested. This ratio does not include these indirect fees and expenses. | ||||||||||||||||||||
| Deutsche LifeCompass 2030 Fund — Class B | ||||||||||||||||||||
| Years Ended August 31, | ||||||||||||||||||||
| 2014 | 2013 | 2012 | 2011 | 2010 | ||||||||||||||||
| Selected Per Share Data | ||||||||||||||||||||
| Net asset value, beginning of period | $ | 10.63 | $ | 9.67 | $ | 9.06 | $ | 8.02 | $ | 7.84 | ||||||||||
Income (loss) from investment operations: Net investment incomea | .06 | .12 | .06 | .05 | .05 | |||||||||||||||
| Net realized and unrealized gain (loss) | 1.65 | .93 | .61 | 1.02 | .19 | |||||||||||||||
| Total from investment operations | 1.71 | 1.05 | .67 | 1.07 | .24 | |||||||||||||||
Less distributions from: Net investment income | (.22 | ) | (.09 | ) | (.06 | ) | (.03 | ) | (.06 | ) | ||||||||||
| Net realized gains | (.13 | ) | — | — | — | — | ||||||||||||||
| Total distributions | (.35 | ) | (.09 | ) | (.06 | ) | (.03 | ) | (.06 | ) | ||||||||||
| Net asset value, end of period | $ | 11.99 | $ | 10.63 | $ | 9.67 | $ | 9.06 | $ | 8.02 | ||||||||||
Total Return (%)b,c,d | 16.18 | 10.90 | 7.48 | 13.36 | 2.98 | |||||||||||||||
| Ratios to Average Net Assets and Supplemental Data | ||||||||||||||||||||
| Net assets, end of period ($ millions) | .3 | 1 | 1 | 1 | 2 | |||||||||||||||
Ratio of expenses before expense reductions (%)e | 1.65 | 1.61 | 1.55 | 1.56 | 1.63 | |||||||||||||||
Ratio of expenses after expense reductions (%)e | 1.21 | 1.22 | 1.33 | 1.33 | 1.30 | |||||||||||||||
| Ratio of net investment income (%) | .51 | 1.13 | .63 | .55 | .59 | |||||||||||||||
| Portfolio turnover rate (%) | 60 | 41 | 46 | 32 | 44 | |||||||||||||||
a Based on average shares outstanding during the period. b Total return does not reflect the effect of any sales charge. c Total return would have been lower had certain expenses not been reduced. d Total return would have been lower if the Advisor had not reduced some Underlying Funds' expenses. e The Fund invests in other Funds and indirectly bears its proportionate share of fees and expenses incurred by the Underlying Funds in which the Fund is invested. This ratio does not include these indirect fees and expenses. | ||||||||||||||||||||
| Deutsche LifeCompass 2030 Fund — Class C | ||||||||||||||||||||
| Years Ended August 31, | ||||||||||||||||||||
| 2014 | 2013 | 2012 | 2011 | 2010 | ||||||||||||||||
| Selected Per Share Data | ||||||||||||||||||||
| Net asset value, beginning of period | $ | 10.62 | $ | 9.67 | $ | 9.06 | $ | 8.01 | $ | 7.83 | ||||||||||
Income (loss) from investment operations: Net investment incomea | .05 | .11 | .06 | .05 | .05 | |||||||||||||||
| Net realized and unrealized gain (loss) | 1.67 | .93 | .61 | 1.03 | .19 | |||||||||||||||
| Total from investment operations | 1.72 | 1.04 | .67 | 1.08 | .24 | |||||||||||||||
Less distributions from: Net investment income | (.22 | ) | (.09 | ) | (.06 | ) | (.03 | ) | (.06 | ) | ||||||||||
| Net realized gains | (.13 | ) | — | — | — | — | ||||||||||||||
| Total distributions | (.35 | ) | (.09 | ) | (.06 | ) | (.03 | ) | (.06 | ) | ||||||||||
| Net asset value, end of period | $ | 11.99 | $ | 10.62 | $ | 9.67 | $ | 9.06 | $ | 8.01 | ||||||||||
Total Return (%)b,c,d | 16.29 | 10.80 | 7.48 | 13.50 | 2.99 | |||||||||||||||
| Ratios to Average Net Assets and Supplemental Data | ||||||||||||||||||||
| Net assets, end of period ($ millions) | 6 | 5 | 5 | 5 | 5 | |||||||||||||||
Ratio of expenses before expense reductions (%)e | 1.48 | 1.52 | 1.48 | 1.50 | 1.54 | |||||||||||||||
Ratio of expenses after expense reductions (%)e | 1.21 | 1.22 | 1.33 | 1.33 | 1.30 | |||||||||||||||
| Ratio of net investment income (%) | .46 | 1.06 | .61 | .55 | .59 | |||||||||||||||
| Portfolio turnover rate (%) | 60 | 41 | 46 | 32 | 44 | |||||||||||||||
a Based on average shares outstanding during the period. b Total return does not reflect the effect of any sales charge. c Total return would have been lower had certain expenses not been reduced. d Total return would have been lower if the Advisor had not reduced some Underlying Funds' expenses. e The Fund invests in other Funds and indirectly bears its proportionate share of fees and expenses incurred by the Underlying Funds in which the Fund is invested. This ratio does not include these indirect fees and expenses. | ||||||||||||||||||||
| Deutsche LifeCompass 2030 Fund — Class S | ||||||||||||||||||||
| Years Ended August 31, | ||||||||||||||||||||
| 2014 | 2013 | 2012 | 2011 | 2010 | ||||||||||||||||
| Selected Per Share Data | ||||||||||||||||||||
| Net asset value, beginning of period | $ | 10.68 | $ | 9.72 | $ | 9.11 | $ | 8.05 | $ | 7.87 | ||||||||||
Income (loss) from investment operations: Net investment incomea | .17 | .22 | .15 | .15 | .13 | |||||||||||||||
| Net realized and unrealized gain (loss) | 1.67 | .93 | .61 | 1.04 | .19 | |||||||||||||||
| Total from investment operations | 1.84 | 1.15 | .76 | 1.19 | .32 | |||||||||||||||
Less distributions from: Net investment income | (.34 | ) | (.19 | ) | (.15 | ) | (.13 | ) | (.14 | ) | ||||||||||
| Net realized gains | (.13 | ) | — | — | — | — | ||||||||||||||
| Total distributions | (.47 | ) | (.19 | ) | (.15 | ) | (.13 | ) | (.14 | ) | ||||||||||
| Net asset value, end of period | $ | 12.05 | $ | 10.68 | $ | 9.72 | $ | 9.11 | $ | 8.05 | ||||||||||
Total Return (%)b,c | 17.41 | 11.99 | 8.52 | 14.72 | 4.02 | |||||||||||||||
| Ratios to Average Net Assets and Supplemental Data | ||||||||||||||||||||
| Net assets, end of period ($ millions) | 20 | 18 | 21 | 18 | 11 | |||||||||||||||
Ratio of expenses before expense reductions (%)d | .56 | .57 | .55 | .55 | .59 | |||||||||||||||
Ratio of expenses after expense reductions (%)d | .21 | .22 | .33 | .33 | .30 | |||||||||||||||
| Ratio of net investment income (%) | 1.49 | 2.12 | 1.58 | 1.55 | 1.58 | |||||||||||||||
| Portfolio turnover rate (%) | 60 | 41 | 46 | 32 | 44 | |||||||||||||||
a Based on average shares outstanding during the period. b Total return would have been lower had certain expenses not been reduced. c Total return would have been lower if the Advisor had not reduced some Underlying Funds' expenses. d The Fund invests in other Funds and indirectly bears its proportionate share of fees and expenses incurred by the Underlying Funds in which the Fund is invested. This ratio does not include these indirect fees and expenses. | ||||||||||||||||||||
| Deutsche LifeCompass 2040 Fund — Class A | ||||||||||||||||||||
| Years Ended August 31, | ||||||||||||||||||||
| 2014 | 2013 | 2012 | 2011 | 2010 | ||||||||||||||||
| Selected Per Share Data | ||||||||||||||||||||
| Net asset value, beginning of period | $ | 9.20 | $ | 8.26 | $ | 7.92 | $ | 7.14 | $ | 6.97 | ||||||||||
Income (loss) from investment operations: Net investment incomea | .10 | .16 | .10 | .09 | .08 | |||||||||||||||
| Net realized and unrealized gain (loss) | 1.52 | .96 | .51 | .94 | .17 | |||||||||||||||
| Total from investment operations | 1.62 | 1.12 | .61 | 1.03 | .25 | |||||||||||||||
Less distributions from: Net investment income | (.26 | ) | (.12 | ) | (.10 | ) | (.09 | ) | (.08 | ) | ||||||||||
| Net realized gains | (1.09 | ) | (.06 | ) | (.17 | ) | (.16 | ) | — | |||||||||||
| Total distributions | (1.35 | ) | (.18 | ) | (.27 | ) | (.25 | ) | (.08 | ) | ||||||||||
| Net asset value, end of period | $ | 9.47 | $ | 9.20 | $ | 8.26 | $ | 7.92 | $ | 7.14 | ||||||||||
Total Return (%)b,c,d | 18.54 | 13.84 | 8.04 | 14.34 | 3.58 | |||||||||||||||
| Ratios to Average Net Assets and Supplemental Data | ||||||||||||||||||||
| Net assets, end of period ($ millions) | 12 | 18 | 22 | 17 | 17 | |||||||||||||||
Ratio of expenses before expense reductions (%)e | 1.07 | .96 | .93 | 1.02 | 1.22 | |||||||||||||||
Ratio of expenses after expense reductions (%)e | .46 | .47 | .55 | .55 | .54 | |||||||||||||||
| Ratio of net investment income (%) | 1.02 | 1.77 | 1.28 | 1.11 | 1.12 | |||||||||||||||
| Portfolio turnover rate (%) | 69 | 45 | 38 | 33 | 39 | |||||||||||||||
a Based on average shares outstanding during the period. b Total return does not reflect the effect of any sales charge. c Total return would have been lower had certain expenses not been reduced. d Total return would have been lower if the Advisor had not reduced some Underlying Funds' expenses. e The Fund invests in other Funds and indirectly bears its proportionate share of fees and expenses incurred by the Underlying Funds in which the Fund is invested. This ratio does not include these indirect fees and expenses. | ||||||||||||||||||||
| Deutsche LifeCompass 2040 Fund — Class C | ||||||||||||||||||||
| Years Ended August 31, | ||||||||||||||||||||
| 2014 | 2013 | 2012 | 2011 | 2010 | ||||||||||||||||
| Selected Per Share Data | ||||||||||||||||||||
| Net asset value, beginning of period | $ | 9.16 | $ | 8.23 | $ | 7.89 | $ | 7.11 | $ | 6.94 | ||||||||||
Income (loss) from investment operations: Net investment incomea | .02 | .09 | .04 | .03 | .03 | |||||||||||||||
| Net realized and unrealized gain (loss) | 1.52 | .96 | .52 | .94 | .17 | |||||||||||||||
| Total from investment operations | 1.54 | 1.05 | .56 | .97 | .20 | |||||||||||||||
Less distributions from: Net investment income | (.18 | ) | (.06 | ) | (.05 | ) | (.03 | ) | (.03 | ) | ||||||||||
| Net realized gains | (1.09 | ) | (.06 | ) | (.17 | ) | (.16 | ) | — | |||||||||||
| Total distributions | (1.27 | ) | (.12 | ) | (.22 | ) | (.19 | ) | (.03 | ) | ||||||||||
| Net asset value, end of period | $ | 9.43 | $ | 9.16 | $ | 8.23 | $ | 7.89 | $ | 7.11 | ||||||||||
Total Return (%)b,c,d | 17.63 | 12.88 | 7.25 | 13.53 | 2.81 | |||||||||||||||
| Ratios to Average Net Assets and Supplemental Data | ||||||||||||||||||||
| Net assets, end of period ($ millions) | .4 | .3 | .2 | .2 | .2 | |||||||||||||||
Ratio of expenses before expense reductions (%)e | 1.83 | 1.72 | 1.75 | 1.84 | 2.20 | |||||||||||||||
Ratio of expenses after expense reductions (%)e | 1.21 | 1.22 | 1.30 | 1.30 | 1.28 | |||||||||||||||
| Ratio of net investment income (%) | .26 | .97 | .51 | .36 | .37 | |||||||||||||||
| Portfolio turnover rate (%) | 69 | 45 | 38 | 33 | 39 | |||||||||||||||
a Based on average shares outstanding during the period. b Total return does not reflect the effect of any sales charge. c Total return would have been lower had certain expenses not been reduced. d Total return would have been lower if the Advisor had not reduced some Underlying Funds' expenses. e The Fund invests in other Funds and indirectly bears its proportionate share of fees and expenses incurred by the Underlying Funds in which the Fund is invested. This ratio does not include these indirect fees and expenses. | ||||||||||||||||||||
| Deutsche LifeCompass 2040 Fund — Class S | ||||||||||||||||||||
| Years Ended August 31, | ||||||||||||||||||||
| 2014 | 2013 | 2012 | 2011 | 2010 | ||||||||||||||||
| Selected Per Share Data | ||||||||||||||||||||
| Net asset value, beginning of period | $ | 9.22 | $ | 8.29 | $ | 7.94 | $ | 7.16 | $ | 6.99 | ||||||||||
Income (loss) from investment operations: Net investment incomea | .12 | .19 | .12 | .11 | .10 | |||||||||||||||
| Net realized and unrealized gain (loss) | 1.53 | .94 | .52 | .94 | .17 | |||||||||||||||
| Total from investment operations | 1.65 | 1.13 | .64 | 1.05 | .27 | |||||||||||||||
Less distributions from: Net investment income | (.29 | ) | (.14 | ) | (.12 | ) | (.11 | ) | (.10 | ) | ||||||||||
| Net realized gains | (1.09 | ) | (.06 | ) | (.17 | ) | (.16 | ) | — | |||||||||||
| Total distributions | (1.38 | ) | (.20 | ) | (.29 | ) | (.27 | ) | (.10 | ) | ||||||||||
| Net asset value, end of period | $ | 9.49 | $ | 9.22 | $ | 8.29 | $ | 7.94 | $ | 7.16 | ||||||||||
Total Return (%)b,c | 18.82 | 13.96 | 8.43 | 14.60 | 3.83 | |||||||||||||||
| Ratios to Average Net Assets and Supplemental Data | ||||||||||||||||||||
| Net assets, end of period ($ millions) | 13 | 12 | 18 | 14 | 8 | |||||||||||||||
Ratio of expenses before expense reductions (%)d | .81 | .72 | .68 | .77 | .99 | |||||||||||||||
Ratio of expenses after expense reductions (%)d | .21 | .22 | .30 | .30 | .29 | |||||||||||||||
| Ratio of net investment income (%) | 1.27 | 2.15 | 1.45 | 1.36 | 1.37 | |||||||||||||||
| Portfolio turnover rate (%) | 69 | 45 | 38 | 33 | 39 | |||||||||||||||
a Based on average shares outstanding during the period. b Total return would have been lower had certain expenses not been reduced. c Total return would have been lower if the Advisor had not reduced some Underlying Funds' expenses. d The Fund invests in other Funds and indirectly bears its proportionate share of fees and expenses incurred by the Underlying Funds in which the Fund is invested. This ratio does not include these indirect fees and expenses. | ||||||||||||||||||||
A. Organization and Significant Accounting Policies
Deutsche LifeCompass Retirement Fund (formerly DWS LifeCompass Retirement Fund), Deutsche LifeCompass 2015 Fund (formerly DWS LifeCompass 2015 Fund), Deutsche LifeCompass 2020 Fund (formerly DWS LifeCompass 2020 Fund), Deutsche LifeCompass 2030 Fund (formerly DWS LifeCompass 2030 Fund) and Deutsche LifeCompass 2040 Fund (formerly DWS LifeCompass 2040 Fund) (hereinafter referred to individually as "Fund" or collectively as "Funds") are each a diversified series of Deutsche Target Date Series (formerly DWS Target Date Series) (the "Trust"), which is registered under the Investment Company Act of 1940, as amended (the "1940 Act"), as an open-end management investment company organized as a Massachusetts business trust. The Funds mainly invest in other affiliated Deutsche funds (formerly DWS Funds) (i.e., mutual funds, exchange-traded funds and other pooled investment vehicles managed by Deutsche Investment Management Americas Inc. or one of its affiliates, together the "Underlying Deutsche Funds") and non-affiliated exchange-traded funds ("Non-affiliated ETFs"). Non-affiliated ETFs and Underlying Deutsche Funds are collectively referred to as "Underlying Funds." Each Underlying Deutsche Fund's accounting policies and investment holdings are outlined in the Underlying Deutsche Funds' financial statements and are available upon request.
Each Fund offers multiple classes of shares which provide investors with different purchase options. Class A shares are offered to investors subject to an initial sales charge. Class B shares are closed to new purchases, except exchanges or the reinvestment of dividends or other distributions. Class B shares were offered to investors without an initial sales charge and are subject to higher ongoing expenses than Class A shares and a contingent deferred sales charge payable upon certain redemptions. Class B shares automatically convert to Class A shares six years after issuance. Class C shares are offered to investors without an initial sales charge but are subject to higher ongoing expenses than Class A shares and a contingent deferred sales charge payable upon certain redemptions within one year of purchase. Class C shares do not automatically convert into another class. Class S shares are not subject to initial or contingent deferred sales charges and are only available to a limited group of investors.
Investment income, realized and unrealized gains and losses, and certain fund-level expenses and expense reductions, if any, are borne pro rata on the basis of relative net assets by the holders of all classes of shares, except that each class bears certain expenses unique to that class such as services to shareholders, distribution and service fees and certain other class-specific expenses. Differences in class-level expenses may result in payment of different per share dividends by class. All shares of each Fund have equal rights with respect to voting subject to class-specific arrangements.
The Funds' financial statements are prepared in accordance with accounting principles generally accepted in the United States of America which require the use of management estimates. Actual results could differ from those estimates. The policies described below are followed consistently by each Fund in the preparation of its financial statements.
Security Valuation. Investments are stated at value determined as of the close of regular trading on the New York Stock Exchange on each day the exchange is open for trading.
Various inputs are used in determining the value of the Fund's investments. These inputs are summarized in three broad levels. Level 1 includes quoted prices in active markets for identical securities. Level 2 includes other significant observable inputs (including quoted prices for similar securities, interest rates, prepayment speeds and credit risk). Level 3 includes significant unobservable inputs (including the Fund's own assumptions in determining the fair value of investments). The level assigned to the securities valuations may not be an indication of the risk or liquidity associated with investing in those securities.
Investments in Mutual Funds are valued at the net asset value per share of each class of the Mutual Fund and are categorized as Level 1.
ETFs are valued at the most recent sale price or official closing price reported on the exchange (U.S. or foreign) or over-the-counter market on which they trade. ETFs for which no sales are reported are valued at the calculated mean between the most recent bid and asked quotations on the relevant market or, if a mean cannot be determined, at the most recent bid quotation. ETFs are categorized as Level 1 securities.
Disclosure about the classification of fair value measurements is included in a table following each Fund's Investment Portfolio.
Federal Income Taxes. Each Fund's policy is to comply with the requirements of the Internal Revenue Code, as amended, which are applicable to regulated investment companies, and to distribute all of its taxable income to its shareholders. Each Fund is treated as a single corporate taxpayer.
Under the Regulated Investment Company Modernization Act of 2010, net capital losses incurred post-enactment may be carried forward indefinitely, and their character is retained as short-term and/or long-term. Previously, net capital losses were carried forward for eight years and treated as short-term. As a transition rule, the Act requires that post-enactment net capital losses be used before pre-enactment net capital losses.
At August 31, 2014, Deutsche LifeCompass Retirement Fund had a net tax basis capital loss carryforward of approximately $11,038,000 of pre-enactment losses, which may be applied against any realized net taxable capital gains of each succeeding year until fully utilized or until August 31, 2018, ($10,458,000) and August 31, 2019 ($580,000), the respective expiration dates, whichever occurs first.
At August 31, 2014, Deutsche LifeCompass 2015 Fund had a net tax basis capital loss carryforward of approximately $34,624,000 of pre-enactment losses, which may be applied against any realized net taxable capital gains of each succeeding year until fully utilized or until August 31, 2018 ($24,457,000) and August 31, 2019 ($10,167,000), the respective expiration dates, whichever occurs first.
At August 31, 2014, Deutsche LifeCompass 2020 Fund had a net tax basis capital loss carryforward of approximately $16,606,000 of pre-enactment losses, which may be applied against any realized net taxable capital gains of each succeeding year until fully utilized or until August 31, 2018 ($7,180,000) and August 31, 2019 ($9,426,000), the respective expiration dates, whichever occurs first.
The Funds have reviewed the tax positions for the open tax years as of August 31, 2014 and have determined that no provision for income tax and/or uncertain tax provisions is required in the Funds' financial statements. The Funds' federal tax returns for the prior three fiscal years remain open subject to examination by the Internal Revenue Service.
Distribution of Income and Gains. Distributions from net investment income of Deutsche LifeCompass Retirement Fund and Deutsche LifeCompass 2015 Fund are declared and distributed to shareholders quarterly. Distributions from net investment income of Deutsche LifeCompass 2020 Fund, Deutsche LifeCompass 2030 Fund and Deutsche LifeCompass 2040 Fund, if any, are declared and distributed to shareholders annually. Net realized gains from investment transactions, in excess of available capital loss carryforwards, would be taxable to each Fund if not distributed and, therefore, will be distributed to shareholders at least annually. The Funds may also make additional distributions for tax purposes if necessary.
The timing and characterization of certain income and capital gain distributions are determined annually in accordance with federal tax regulations which may differ from accounting principles generally accepted in the United States of America. These differences primarily relate to certain securities sold at a loss. As a result, net investment income (loss) and net realized gain (loss) on investment transactions for a reporting period may differ significantly from distributions during such period. Accordingly, each Fund may periodically make reclassifications among certain of its capital accounts without impacting the net asset value of a Fund.
At August 31, 2014, Deutsche LifeCompass Retirement Fund's components of distributable earnings (accumulated losses) on a tax basis are as follows:
| Undistributed ordinary income* | $ | 776,434 | ||
| Capital loss carryforwards | $ | (11,038,000 | ) | |
| Net unrealized appreciation (depreciation) on investments | $ | 6,279,285 |
In addition, during the years ended August 31, 2014 and August 31, 2013, the tax character of distributions paid to shareholders by Deutsche LifeCompass Retirement Fund is summarized as follows:
| Years Ended August 31, | ||||||||
| 2014 | 2013 | |||||||
| Distributions from ordinary income* | $ | 1,397,848 | $ | 1,732,066 | ||||
* For tax purposes, short-term capital gain distributions are considered ordinary income distributions.
At August 31, 2014, Deutsche LifeCompass 2015 Fund's components of distributable earnings (accumulated losses) on a tax basis are as follows:
| Undistributed ordinary income* | $ | 707,434 | ||
| Capital loss carryforwards | $ | (34,624,000 | ) | |
| Net unrealized appreciation (depreciation) on investments | $ | 10,491,562 |
In addition, during the years ended August 31, 2014 and August 31, 2013, the tax character of distributions paid to shareholders by Deutsche LifeCompass 2015 Fund is summarized as follows:
| Years Ended August 31, | ||||||||
| 2014 | 2013 | |||||||
| Distributions from ordinary income* | $ | 1,969,850 | $ | 2,403,893 | ||||
* For tax purposes, short-term capital gain distributions are considered ordinary income distributions.
At August 31, 2014, Deutsche LifeCompass 2020 Fund's components of distributable earnings (accumulated losses) on a tax basis are as follows:
| Undistributed ordinary income* | $ | 2,793,101 | ||
| Capital loss carryforwards | $ | (16,606,000 | ) | |
| Net unrealized appreciation (depreciation) on investments | $ | 23,299,104 |
In addition, during the years ended August 31, 2014 and August 31, 2013, the tax character of distributions paid to shareholders by Deutsche LifeCompass 2020 Fund is summarized as follows:
| Years Ended August 31, | ||||||||
| 2014 | 2013 | |||||||
| Distributions from ordinary income* | $ | 3,997,622 | $ | 3,901,225 | ||||
* For tax purposes, short-term capital gain distributions are considered ordinary income distributions.
At August 31, 2014, Deutsche LifeCompass 2030 Fund's components of distributable earnings (accumulated losses) on a tax basis are as follows:
| Undistributed ordinary income* | $ | 1,460,553 | ||
| Undistributed long-term capital gains | $ | 3,150,578 | ||
| Net unrealized appreciation (depreciation) on investments | $ | 10,455,039 |
In addition, during the years ended August 31, 2014 and August 31, 2013, the tax character of distributions paid to shareholders by Deutsche LifeCompass 2030 Fund is summarized as follows:
| Years Ended August 31, | ||||||||
| 2014 | 2013 | |||||||
| Distributions from ordinary income* | $ | 1,597,668 | $ | 1,160,781 | ||||
| Distributions from long-term capital gains | $ | 651,314 | $ | — | ||||
* For tax purposes, short-term capital gain distributions are considered ordinary income distributions.
At August 31, 2014, Deutsche LifeCompass 2040 Fund's components of distributable earnings (accumulated losses) on a tax basis are as follows:
| Undistributed ordinary income* | $ | 558,746 | ||
| Undistributed long-term capital gains | $ | 2,350,571 | ||
| Net unrealized appreciation (depreciation) on investments | $ | 6,269,577 |
In addition, during the years ended August 31, 2014 and August 31, 2013, the tax character of distributions paid to shareholders by Deutsche LifeCompass 2040 Fund is summarized as follows:
| Years Ended August 31, | ||||||||
| 2014 | 2013 | |||||||
| Distributions from ordinary income* | $ | 1,161,122 | $ | 648,752 | ||||
| Distributions from long-term capital gains | $ | 2,797,060 | $ | 299,893 | ||||
* For tax purposes, short-term capital gain distributions are considered ordinary income distributions.
Contingencies. In the normal course of business, the Funds may enter into contracts with service providers that contain general indemnification clauses. The Funds' maximum exposure under these arrangements is unknown as this would involve future claims that may be made against the Funds that have not yet been made. However, based on experience, the Funds expect the risk of loss to be remote.
Other. Investment transactions are accounted for on a trade date plus one basis for daily net asset value calculations. However, for financial reporting purposes, investment transactions are reported on trade date. Interest income is recorded on the accrual basis. Distributions of income and capital gains from the Underlying Funds are recorded on the ex-dividend date. Realized gains and losses from investment transactions are recorded on an identified cost basis.
B. Related Parties
Management Agreement. Under the Investment Management Agreement with Deutsche Investment Management Americas Inc. ("DIMA" or the "Advisor"), an indirect, wholly owned subsidiary of Deutsche Bank AG, the Advisor directs the investments of each Fund in accordance with its investment objectives, policies and restrictions. The Advisor determines the securities, instruments and other contracts relating to investments to be purchased, sold or entered into by each Fund or delegates such responsibility to the Fund's subadvisor. The Advisor has agreed not to be paid a management fee directly from the Funds for performing its services under the Investment Management Agreement. However, the Advisor will receive management fees from managing the Underlying Deutsche Funds in which each Fund invests.
The Funds do not invest in the Underlying Deutsche Funds for the purpose of exercising management or control; however, investments within the set limits may represent 5% or more of an Underlying Deutsche Funds' outstanding shares. At August 31, 2014, Deutsche LifeCompass 2015 Fund held 5% or greater of the following Underlying Deutsche Funds' outstanding shares: approximately 5% of Deutsche Global Inflation Fund. At August 31, 2014, Deutsche LifeCompass 2020 Fund held 5% or greater of the following Underlying Deutsche Funds' outstanding shares: approximately 7% of Deutsche Global Equity Fund, 7% of Deutsche Global Inflation Fund, 6% of Deutsche Small Cap Core Fund, 6% of Deutsche U.S. Bond Index Fund and 5% of Deutsche Emerging Market Equity Fund. At August 31, 2014, Deutsche LifeCompass Retirement Fund, Deutsche LifeCompass 2030 Fund and Deutsche LifeCompass 2040 Fund did not invest in more than 5% of any Underlying Deutsche Fund.
For the period from September 1, 2013 through November 30, 2014, the Advisor has contractually agreed to reimburse or pay certain operating expenses to the extent necessary to maintain the Funds' operating expenses (excluding certain expenses such as extraordinary expenses, taxes, brokerage, interest and indirect expenses of Underlying Funds) as a percentage of average daily net assets as follows:
| Deutsche LifeCompass Retirement Fund | Deutsche LifeCompass 2015 Fund | Deutsche LifeCompass 2020 Fund | Deutsche LifeCompass 2030 Fund | Deutsche LifeCompass 2040 Fund | |
| Class A | .46% | .46% | .46% | .46% | .46% |
| Class B | 1.21% | 1.21% | 1.21% | 1.21% | — |
| Class C | 1.21% | 1.21% | 1.21% | 1.21% | 1.21% |
| Class S | .21% | .21% | .21% | .21% | .21% |
For the year ended August 31, 2014, fees waived and/or expenses reimbursed for each fund were as follows:
Deutsche LifeCompass Retirement Fund Class A | $ | 51,069 | ||
| Class B | 837 | |||
| Class C | 10,825 | |||
| Class S | 111,489 | |||
| $ | 174,220 | |||
Deutsche LifeCompass 2015 Fund Class A | $ | 106,377 | ||
| Class B | 2,638 | |||
| Class C | 21,084 | |||
| Class S | 92,302 | |||
| $ | 222,401 | |||
Deutsche LifeCompass 2020 Fund Class A | $ | 139,042 | ||
| Class B | 3,701 | |||
| Class C | 21,697 | |||
| Class S | 183,528 | |||
| $ | 347,968 | |||
Deutsche LifeCompass 2030 Fund Class A | $ | 128,831 | ||
| Class B | 1,540 | |||
| Class C | 14,686 | |||
| Class S | 68,857 | |||
| $ | 213,914 | |||
Deutsche LifeCompass 2040 Fund Class A | $ | 92,971 | ||
| Class C | 2,084 | |||
| Class S | 76,203 | |||
| $ | 171,258 |
Each Fund indirectly bears its proportionate share of fees and expenses incurred by the Underlying Deutsche Funds and Non-affiliated ETFs in which it is invested.
Administration Fee. Pursuant to an Administrative Services Agreement, DIMA provides most administrative services to the Funds. For all services provided under the Administrative Services Agreement, the Funds pay DIMA an annual fee ("Administration Fee") of 0.10% of each Fund's average daily net assets, computed and accrued daily and payable monthly. For the year ended August 31, 2014, the Administration Fee for each Fund was as follows:
| Administration Fee | Total Aggregated | Unpaid at August 31, 2014 | ||||||
| Deutsche LifeCompass Retirement Fund | $ | 64,348 | $ | 5,168 | ||||
| Deutsche LifeCompass 2015 Fund | $ | 88,237 | $ | 7,116 | ||||
| Deutsche LifeCompass 2020 Fund | $ | 174,288 | $ | 14,517 | ||||
| Deutsche LifeCompass 2030 Fund | $ | 61,253 | $ | 5,193 | ||||
| Deutsche LifeCompass 2040 Fund | $ | 28,214 | $ | 2,341 | ||||
Service Provider Fees. DeAWM Service Company ("DSC"), an affiliate of the Advisor, is the transfer agent, dividend-paying agent and shareholder service agent for the Funds. Pursuant to a sub-transfer agency agreement between DSC and DST Systems, Inc. ("DST"), DSC has delegated certain transfer agent, dividend-paying agent and shareholder service agent functions to DST. DSC compensates DST out of the shareholder servicing fee it receives from the Funds. For the year ended August 31, 2014, the amounts charged to the Funds by DSC were as follows:
| Services to Shareholders | Total Aggregated | Unpaid at August 31, 2014 | ||||||
Deutsche LifeCompass Retirement Fund Class A | $ | 26,535 | $ | 3,513 | ||||
| Class B | 447 | 60 | ||||||
| Class C | 3,035 | 395 | ||||||
| Class S | 50,309 | 7,193 | ||||||
| $ | 80,326 | $ | 11,161 | |||||
Deutsche LifeCompass 2015 Fund Class A | $ | 61,344 | $ | 9,320 | ||||
| Class B | 2,062 | 338 | ||||||
| Class C | 7,496 | 1,147 | ||||||
| Class S | 60,393 | 8,800 | ||||||
| $ | 131,295 | $ | 19,605 | |||||
Deutsche LifeCompass 2020 Fund Class A | $ | 118,364 | $ | 18,547 | ||||
| Class B | 3,341 | 433 | ||||||
| Class C | 11,473 | 1,637 | ||||||
| Class S | 159,992 | 24,930 | ||||||
| $ | 293,170 | $ | 45,547 | |||||
Deutsche LifeCompass 2030 Fund Class A | $ | 76,207 | $ | 12,058 | ||||
| Class B | 921 | 128 | ||||||
| Class C | 4,535 | 628 | ||||||
| Class S | 40,104 | 6,772 | ||||||
| $ | 121,767 | $ | 19,586 | |||||
Deutsche LifeCompass 2040 Fund Class A | $ | 38,190 | $ | 5,690 | ||||
| Class C | 873 | 138 | ||||||
| Class S | 30,456 | 5,172 | ||||||
| $ | 69,519 | $ | 11,000 | |||||
Distribution and Service Fees. Under the Funds' Class B and Class C 12b-1 Plans, DeAWM Distributors, Inc. ("DDI"), an affiliate of the Advisor, receives a fee ("Distribution Fee") of 0.75% of average daily net assets of each of Class B and C shares. In accordance with the Funds' Underwriting and Distribution Services Agreements, DDI enters into related selling group agreements with various firms at various rates for sales of Class B and C shares. For the year ended August 31, 2014, the Distribution Fees were as follows:
| Distribution Fees | Total Aggregated | Unpaid at August 31, 2014 | ||||||
Deutsche LifeCompass Retirement Fund Class B | $ | 1,302 | $ | 69 | ||||
| Class C | 29,740 | 2,481 | ||||||
| $ | 31,042 | $ | 2,550 | |||||
Deutsche LifeCompass 2015 Fund Class B | $ | 4,049 | $ | 225 | ||||
| Class C | 72,767 | 6,054 | ||||||
| $ | 76,816 | $ | 6,279 | |||||
Deutsche LifeCompass 2020 Fund Class B | $ | 8,457 | $ | 498 | ||||
| Class C | 100,951 | 8,017 | ||||||
| $ | 109,408 | $ | 8,515 | |||||
Deutsche LifeCompass 2030 Fund Class B | $ | 2,630 | $ | 186 | ||||
| Class C | 40,214 | 3,677 | ||||||
| $ | 42,844 | $ | 3,863 | |||||
Deutsche LifeCompass 2040 Fund Class C | $ | 2,512 | $ | 238 | ||||
In addition, DDI provides information and administrative services for a fee ("Service Fee") to Class A, B and C shareholders at an annual rate of up to 0.25% of average daily net assets for each such class. DDI in turn has various agreements with financial services firms that provide these services and pays these fees based upon the assets of shareholder accounts the firms service. For the year ended August 31, 2014, the Service Fees were as follows:
| Service Fees | Total Aggregated | Unpaid at August 31, 2014 | Annual Rate | |||||||||
Deutsche LifeCompass Retirement Fund Class A | $ | 40,023 | $ | 11,052 | .24 | % | ||||||
| Class B | 416 | 115 | .24 | % | ||||||||
| Class C | 9,734 | 2,468 | .25 | % | ||||||||
| $ | 50,173 | $ | 13,635 | |||||||||
Deutsche LifeCompass 2015 Fund Class A | $ | 104,188 | $ | 27,724 | .24 | % | ||||||
| Class B | 1,342 | 277 | .25 | % | ||||||||
| Class C | 24,173 | 6,173 | .25 | % | ||||||||
| $ | 129,703 | $ | 34,174 | |||||||||
Deutsche LifeCompass 2020 Fund Class A | $ | 174,428 | $ | 44,003 | .24 | % | ||||||
| Class B | 2,747 | 526 | .24 | % | ||||||||
| Class C | 33,536 | 8,278 | .25 | % | ||||||||
| $ | 210,711 | $ | 52,807 | |||||||||
Deutsche LifeCompass 2030 Fund Class A | $ | 87,664 | $ | 22,477 | .24 | % | ||||||
| Class B | 870 | 192 | .25 | % | ||||||||
| Class C | 13,278 | 3,707 | .25 | % | ||||||||
| $ | 101,812 | $ | 26,376 | |||||||||
Deutsche LifeCompass 2040 Fund Class A | $ | 36,193 | $ | 9,008 | .24 | % | ||||||
| Class C | 836 | 228 | .25 | % | ||||||||
| $ | 37,029 | $ | 9,236 | |||||||||
Underwriting Agreement and Contingent Deferred Sales Charge. DDI is the principal underwriter for the Funds. Underwriting commissions paid in connection with the distribution of Class A shares for the year ended August 31, 2014 for Deutsche LifeCompass Retirement Fund, Deutsche LifeCompass 2015 Fund, Deutsche LifeCompass 2020 Fund, Deutsche LifeCompass 2030 Fund and Deutsche LifeCompass 2040 Fund aggregated $3,865, $2,379, $4,650, $3,693 and $1,819, respectively.
In addition, DDI receives any contingent deferred sales charge ("CDSC") from Class B share redemptions occurring within six years of purchase and Class C share redemptions occurring within one year of purchase. There is no such charge upon redemption of any share appreciation or reinvested dividends. The CDSC is based on declining rates, ranging from 4% to 1% for Class B and 1% for Class C, of the value of the shares redeemed. For the year ended August 31, 2014, the CDSC for Class B shares aggregated $204, $682, $740 and $1,584, respectively, for Deutsche LifeCompass Retirement Fund, Deutsche LifeCompass 2015 Fund, Deutsche LifeCompass 2020 Fund and Deutsche LifeCompass 2030 Fund, and Class C shares aggregated $16, $308, $160 and $350, respectively, for Deutsche LifeCompass Retirement Fund, Deutsche LifeCompass 2015 Fund, Deutsche LifeCompass 2020 Fund and Deutsche LifeCompass 2030 Fund. A deferred sales charge of up to 1% is assessed on certain redemptions of Class A shares.
Typesetting and Filing Service Fees. Under an agreement with DIMA, DIMA is compensated for providing typesetting and certain regulatory filing services to the Funds. For the year ended August 31, 2014, the amounts charged to the Funds by DIMA included in the Statements of Operations under "Reports to shareholders" were as follows:
| Typesetting and Filing Service Fees | Total Aggregated | Unpaid at August 31, 2014 | ||||||
| Deutsche LifeCompass Retirement Fund | $ | 11,155 | $ | 3,292 | ||||
| Deutsche LifeCompass 2015 Fund | $ | 11,134 | $ | 3,105 | ||||
| Deutsche LifeCompass 2020 Fund | $ | 11,155 | $ | 3,307 | ||||
| Deutsche LifeCompass 2030 Fund | $ | 11,418 | $ | 3,437 | ||||
| Deutsche LifeCompass 2040 Fund | $ | 10,600 | $ | 2,850 | ||||
Trustees' Fees and Expenses. The Fund paid retainer fees to each Trustee not affiliated with the Advisor, plus specified amounts to the Board Chairperson and Vice Chairperson and to each committee Chairperson.
Affiliated Cash Management Vehicles. The Fund may invest uninvested cash balances in Central Cash Management Fund and Deutsche Variable NAV Money Fund, affiliated money market funds which are managed by the Advisor. Each affiliated money market fund seeks to provide a high level of current income consistent with liquidity and the preservation of capital. Each affiliated money market fund is managed in accordance with Rule 2a-7 under the Investment Company Act of 1940, which governs the quality, maturity, diversity and liquidity of instruments in which a money market fund may invest. Central Cash Management Fund seeks to maintain a stable net asset value, and Deutsche Variable NAV Money Fund maintains a floating net asset value. The Fund indirectly bears its proportionate share of the expenses of each affiliated money market fund in which it invests. Central Cash Management Fund does not pay the Advisor an investment management fee.
C. Concentration of Ownership
From time to time, the Funds may have a concentration of several shareholder accounts holding a significant percentage of shares outstanding. Investment activities of these shareholders could have a material impact on the Funds. At August 31, 2014, there was one shareholder account that held approximately 20% of the outstanding shares of Deutsche LifeCompass 2030 Fund and two shareholder accounts that held approximately 38% and 11% of the outstanding shares of Deutsche LifeCompass 2040 Fund.
D. Share Transactions
Deutsche LifeCompass Retirement Fund
The following table summarizes share and dollar activity in the Fund:
| Year Ended August 31, 2014 | Year Ended August 31, 2013 | |||||||||||||||
| Shares | Dollars | Shares | Dollars | |||||||||||||
| Shares sold | ||||||||||||||||
| Class A | 144,214 | $ | 1,796,271 | 271,555 | $ | 3,235,053 | ||||||||||
| Class B | 1 | 34 | 3,426 | 40,567 | ||||||||||||
| Class C | 31,864 | 401,521 | 17,770 | 211,923 | ||||||||||||
| Class S | 250,109 | 3,102,298 | 317,092 | 3,768,011 | ||||||||||||
| $ | 5,300,124 | $ | 7,255,554 | |||||||||||||
| Shares issued to shareholders in reinvestment of distributions | ||||||||||||||||
| Class A | 26,835 | $ | 332,734 | 44,356 | $ | 522,220 | ||||||||||
| Class B | 188 | 2,326 | 488 | 5,751 | ||||||||||||
| Class C | 3,618 | 44,885 | 4,567 | 53,790 | ||||||||||||
| Class S | 74,236 | 920,901 | 89,052 | 1,047,433 | ||||||||||||
| $ | 1,300,846 | $ | 1,629,194 | |||||||||||||
| Shares redeemed | ||||||||||||||||
| Class A | (986,501 | ) | $ | (12,145,543 | ) | (913,414 | ) | $ | (10,777,810 | ) | ||||||
| Class B | (12,039 | ) | (150,021 | ) | (39,300 | ) | (468,602 | ) | ||||||||
| Class C | (110,076 | ) | (1,352,653 | ) | (95,763 | ) | (1,134,192 | ) | ||||||||
| Class S | (804,522 | ) | (9,958,976 | ) | (1,171,840 | ) | (13,943,608 | ) | ||||||||
| $ | (23,607,193 | ) | $ | (26,324,212 | ) | |||||||||||
| Net increase (decrease) | ||||||||||||||||
| Class A | (815,452 | ) | $ | (10,016,538 | ) | (597,503 | ) | $ | (7,020,537 | ) | ||||||
| Class B | (11,850 | ) | (147,661 | ) | (35,386 | ) | (422,284 | ) | ||||||||
| Class C | (74,594 | ) | (906,247 | ) | (73,426 | ) | (868,479 | ) | ||||||||
| Class S | (480,177 | ) | (5,935,777 | ) | (765,696 | ) | (9,128,164 | ) | ||||||||
| $ | (17,006,223 | ) | $ | (17,439,464 | ) | |||||||||||
Deutsche LifeCompass 2015 Fund
The following table summarizes share and dollar activity in the Fund:
| Year Ended August 31, 2014 | Year Ended August 31, 2013 | |||||||||||||||
| Shares | Dollars | Shares | Dollars | |||||||||||||
| Shares sold | ||||||||||||||||
| Class A | 319,911 | $ | 3,947,336 | 438,702 | $ | 5,070,229 | ||||||||||
| Class B | 178 | 2,381 | 586 | 6,847 | ||||||||||||
| Class C | 44,310 | 553,766 | 30,157 | 350,403 | ||||||||||||
| Class S | 221,210 | 2,733,061 | 541,540 | 6,252,763 | ||||||||||||
| $ | 7,236,544 | $ | 11,680,242 | |||||||||||||
| Shares issued to shareholders in reinvestment of distributions | ||||||||||||||||
| Class A | 74,196 | $ | 917,900 | 85,951 | $ | 983,511 | ||||||||||
| Class B | 639 | 7,881 | 1,109 | 12,674 | ||||||||||||
| Class C | 10,260 | 127,137 | 9,747 | 111,563 | ||||||||||||
| Class S | 70,384 | 868,773 | 109,304 | 1,244,867 | ||||||||||||
| $ | 1,921,691 | $ | 2,352,615 | |||||||||||||
| Shares redeemed | ||||||||||||||||
| Class A | (1,131,327 | ) | $ | (14,012,739 | ) | (1,935,559 | ) | $ | (22,345,695 | ) | ||||||
| Class B | (35,690 | ) | (441,349 | ) | (70,974 | ) | (821,958 | ) | ||||||||
| Class C | (154,483 | ) | (1,920,319 | ) | (188,525 | ) | (2,181,183 | ) | ||||||||
| Class S | (834,217 | ) | (10,203,879 | ) | (3,831,023 | ) | (44,398,129 | ) | ||||||||
| $ | (26,578,286 | ) | $ | (69,746,965 | ) | |||||||||||
| Net increase (decrease) | ||||||||||||||||
| Class A | (737,220 | ) | $ | (9,147,503 | ) | (1,410,906 | ) | $ | (16,291,955 | ) | ||||||
| Class B | (34,873 | ) | (431,087 | ) | (69,279 | ) | (802,437 | ) | ||||||||
| Class C | (99,913 | ) | (1,239,416 | ) | (148,621 | ) | (1,719,217 | ) | ||||||||
| Class S | (542,623 | ) | (6,602,045 | ) | (3,180,179 | ) | (36,900,499 | ) | ||||||||
| $ | (17,420,051 | ) | $ | (55,714,108 | ) | |||||||||||
Deutsche LifeCompass 2020 Fund
The following table summarizes share and dollar activity in the Fund:
| Year Ended August 31, 2014 | Year Ended August 31, 2013 | |||||||||||||||
| Shares | Dollars | Shares | Dollars | |||||||||||||
| Shares sold | ||||||||||||||||
| Class A | 435,911 | $ | 6,714,593 | 679,740 | $ | 9,581,129 | ||||||||||
| Class B | 6 | 462 | 375 | 5,280 | ||||||||||||
| Class C | 84,960 | 1,286,716 | 66,255 | 945,480 | ||||||||||||
| Class S | 654,530 | 10,101,813 | 814,682 | 11,486,284 | ||||||||||||
| $ | 18,103,584 | $ | 22,018,173 | |||||||||||||
| Shares issued to shareholders in reinvestment of distributions | ||||||||||||||||
| Class A | 101,530 | $ | 1,548,325 | 105,996 | $ | 1,434,136 | ||||||||||
| Class B | 1,185 | 18,004 | 2,093 | 28,184 | ||||||||||||
| Class C | 11,867 | 180,378 | 10,294 | 138,762 | ||||||||||||
| Class S | 141,410 | 2,156,507 | 163,576 | 2,213,189 | ||||||||||||
| $ | 3,903,214 | $ | 3,814,271 | |||||||||||||
| Shares redeemed | ||||||||||||||||
| Class A | (1,318,288 | ) | $ | (20,298,625 | ) | (1,723,967 | ) | $ | (24,066,063 | ) | ||||||
| Class B | (54,435 | ) | (828,092 | ) | (93,028 | ) | (1,307,266 | ) | ||||||||
| Class C | (210,298 | ) | (3,235,167 | ) | (197,662 | ) | (2,770,639 | ) | ||||||||
| Class S | (1,301,456 | ) | (19,917,751 | ) | (2,703,995 | ) | (38,242,756 | ) | ||||||||
| $ | (44,279,635 | ) | $ | (66,386,724 | ) | |||||||||||
| Net increase (decrease) | ||||||||||||||||
| Class A | (780,847 | ) | $ | (12,035,707 | ) | (938,231 | ) | $ | (13,050,798 | ) | ||||||
| Class B | (53,244 | ) | (809,626 | ) | (90,560 | ) | (1,273,802 | ) | ||||||||
| Class C | (113,471 | ) | (1,768,073 | ) | (121,113 | ) | (1,686,397 | ) | ||||||||
| Class S | (505,516 | ) | (7,659,431 | ) | (1,725,737 | ) | (24,543,283 | ) | ||||||||
| $ | (22,272,837 | ) | $ | (40,554,280 | ) | |||||||||||
Deutsche LifeCompass 2030 Fund
The following table summarizes share and dollar activity in the Fund:
| Year Ended August 31, 2014 | Year Ended August 31, 2013 | |||||||||||||||
| Shares | Dollars | Shares | Dollars | |||||||||||||
| Shares sold | ||||||||||||||||
| Class A | 384,587 | $ | 4,416,203 | 977,071 | $ | 10,132,173 | ||||||||||
| Class B | 7,227 | 82,371 | 872 | 8,812 | ||||||||||||
| Class C | 128,709 | 1,466,862 | 50,069 | 516,039 | ||||||||||||
| Class S | 436,364 | 4,986,103 | 982,064 | 10,031,445 | ||||||||||||
| $ | 10,951,539 | $ | 20,688,469 | |||||||||||||
| Shares issued to shareholders in reinvestment of distributions | ||||||||||||||||
| Class A | 115,396 | $ | 1,310,897 | 70,183 | $ | 685,755 | ||||||||||
| Class B | 925 | 10,529 | 544 | 5,324 | ||||||||||||
| Class C | 13,312 | 151,488 | 4,032 | 39,437 | ||||||||||||
| Class S | 67,084 | 761,401 | 43,455 | 424,161 | ||||||||||||
| $ | 2,234,315 | $ | 1,154,677 | |||||||||||||
| Shares redeemed | ||||||||||||||||
| Class A | (1,595,034 | ) | $ | (18,333,321 | ) | (1,582,047 | ) | $ | (16,387,897 | ) | ||||||
| Class B | (31,467 | ) | (353,037 | ) | (48,937 | ) | (497,408 | ) | ||||||||
| Class C | (88,661 | ) | (1,013,163 | ) | (94,406 | ) | (969,882 | ) | ||||||||
| Class S | (503,728 | ) | (5,744,596 | ) | (1,444,611 | ) | (14,951,440 | ) | ||||||||
| $ | (25,444,117 | ) | $ | (32,806,627 | ) | |||||||||||
| Net increase (decrease) | ||||||||||||||||
| Class A | (1,095,051 | ) | $ | (12,606,221 | ) | (534,793 | ) | $ | (5,569,969 | ) | ||||||
| Class B | (23,315 | ) | (260,137 | ) | (47,521 | ) | (483,272 | ) | ||||||||
| Class C | 53,360 | 605,187 | (40,305 | ) | (414,406 | ) | ||||||||||
| Class S | (280 | ) | 2,908 | (419,092 | ) | (4,495,834 | ) | |||||||||
| $ | (12,258,263 | ) | $ | (10,963,481 | ) | |||||||||||
Deutsche LifeCompass 2040 Fund
The following table summarizes share and dollar activity in the Fund:
| Year Ended August 31, 2014 | Year Ended August 31, 2013 | |||||||||||||||
| Shares | Dollars | Shares | Dollars | |||||||||||||
| Shares sold | ||||||||||||||||
| Class A | 461,141 | $ | 4,407,641 | 753,047 | $ | 6,664,916 | ||||||||||
| Class C | 10,166 | 97,675 | 8,538 | 73,935 | ||||||||||||
| Class S | 494,633 | 4,620,148 | 947,361 | 8,274,889 | ||||||||||||
| $ | 9,125,464 | $ | 15,013,740 | |||||||||||||
| Shares issued to shareholders in reinvestment of distributions | ||||||||||||||||
| Class A | 246,765 | $ | 2,203,612 | 57,036 | $ | 472,255 | ||||||||||
| Class C | 5,178 | 46,290 | 425 | 3,528 | ||||||||||||
| Class S | 190,881 | 1,706,477 | 57,031 | 472,782 | ||||||||||||
| $ | 3,956,379 | $ | 948,565 | |||||||||||||
| Shares redeemed | ||||||||||||||||
| Class A | (1,479,032 | ) | $ | (13,866,770 | ) | (1,446,422 | ) | $ | (12,829,812 | ) | ||||||
| Class C | (6,795 | ) | (61,047 | ) | (2,962 | ) | (26,375 | ) | ||||||||
| Class S | (598,629 | ) | (5,628,774 | ) | (1,865,662 | ) | (16,452,936 | ) | ||||||||
| $ | (19,556,591 | ) | $ | (29,309,123 | ) | |||||||||||
| Net increase (decrease) | ||||||||||||||||
| Class A | (771,126 | ) | $ | (7,255,517 | ) | (636,339 | ) | $ | (5,692,641 | ) | ||||||
| Class C | 8,549 | 82,918 | 6,001 | 51,088 | ||||||||||||
| Class S | 86,885 | 697,851 | (861,270 | ) | (7,705,265 | ) | ||||||||||
| $ | (6,474,748 | ) | $ | (13,346,818 | ) | |||||||||||
E. Transactions with Affiliates
The Funds mainly invest in Underlying Deutsche Funds and Non-affiliated ETFs. The Underlying Deutsche Funds in which the Funds invest are considered to be affiliated investments. A summary of each Fund's transactions with affiliated Underlying Deutsche Funds during the year ended August 31, 2014 is as follows:
Deutsche LifeCompass Retirement Fund
| Affiliate | Value ($) at 8/31/2013 | Purchases Cost ($) | Sales Cost ($) | Realized Gain/ (Loss) ($) | Income Distributions ($) | Capital Gain Distributions ($) | Value ($) at 8/31/2014 | |||||||||||||||||||||
| Deutsche Capital Growth Fund | 1,373,306 | 82,984 | 988,498 | 215,634 | 4,760 | 47,224 | 641,929 | |||||||||||||||||||||
| Deutsche Core Equity Fund | 5,206,345 | 3,007,171 | 3,072,732 | 112,790 | 60,376 | 458,295 | 6,177,909 | |||||||||||||||||||||
| Deutsche Core Fixed Income Fund | 16,198,603 | 284,607 | 12,397,625 | (861,250 | ) | 276,627 | — | 4,377,913 | ||||||||||||||||||||
| Deutsche Core Plus Income Fund | — | 1,908,443 | 168,600 | 38 | 14,043 | — | 1,748,726 | |||||||||||||||||||||
| Deutsche Diversified Market Neutral Fund | 746,294 | 187,905 | 109,966 | (6,460 | ) | — | 79,805 | 740,050 | ||||||||||||||||||||
| Deutsche EAFE Equity Index Fund | 4,001,232 | 542,597 | 3,037,800 | 325,268 | 63,083 | — | 1,941,743 | |||||||||||||||||||||
| Deutsche Emerging Markets Equity Fund | 1,114,914 | 674,382 | 772,600 | (57,156 | ) | 8,757 | — | 1,176,057 | ||||||||||||||||||||
| Deutsche Enhanced Commodity Strategy Fund | 766,633 | 2,494,710 | 397,100 | (133,312 | ) | 4,210 | — | 2,761,320 | ||||||||||||||||||||
| Deutsche Enhanced Emerging Markets Fixed Income Fund | — | 1,974,008 | 107,100 | 1,421 | 36,008 | — | 1,955,982 | |||||||||||||||||||||
| Deutsche Enhanced Global Bond Fund | 1,893,718 | 167,406 | 363,195 | (13,299 | ) | 76,283 | 13,123 | 1,757,452 | ||||||||||||||||||||
| Deutsche Equity 500 Index Fund | 9,555,418 | 143,101 | 5,370,220 | 1,216,206 | 143,101 | — | 6,036,150 | |||||||||||||||||||||
| Deutsche Floating Rate Fund | 760,975 | 1,435,500 | 902,804 | (1,642 | ) | 65,000 | — | 1,285,864 | ||||||||||||||||||||
| Deutsche Global Equity Fund | 601,261 | 222,976 | 155,100 | 4,730 | 13,276 | — | 766,989 | |||||||||||||||||||||
| Deutsche Global Growth Fund | — | 1,126,093 | 882,747 | 32,568 | 5,393 | — | 294,761 | |||||||||||||||||||||
| Deutsche Global High Income Fund | 763,277 | 8,138 | 790,080 | 27,017 | 8,271 | — | — | |||||||||||||||||||||
| Deutsche Global Inflation Fund | 3,743,563 | 6,866,488 | 3,930,200 | (325,921 | ) | 81,792 | — | 6,751,774 | ||||||||||||||||||||
| Deutsche Global Infrastructure Fund | — | 2,341,839 | — | — | 6,597 | 1,542 | 2,414,164 | |||||||||||||||||||||
| Deutsche Global Small Cap Fund | — | 1,884,746 | 687,800 | (26,217 | ) | 3,341 | 48,305 | 1,181,144 | ||||||||||||||||||||
| Deutsche High Income Fund | 1,918,113 | 385,724 | 1,497,277 | 65,503 | 57,823 | — | 856,200 | |||||||||||||||||||||
| Deutsche International Fund | 671,161 | — | 739,741 | 116,509 | — | — | — | |||||||||||||||||||||
| Deutsche Mid Cap Value Fund | 187,261 | — | 203,195 | 58,998 | — | — | — | |||||||||||||||||||||
| Deutsche Latin America Equity Fund | — | 202,671 | 125,700 | (14,185 | ) | 1,036 | 5,735 | 71,887 | ||||||||||||||||||||
| Deutsche Real Estate Securities Fund | — | 2,307,571 | — | — | 5,162 | 4,579 | 2,350,462 | |||||||||||||||||||||
| Deutsche Real Estate Securities Income Fund | — | 72,800 | — | — | — | — | 72,603 | |||||||||||||||||||||
| Deutsche Short Duration Fund | 2,647,359 | 4,742,962 | 3,540,090 | (11,362 | ) | 132,462 | — | 3,833,068 | ||||||||||||||||||||
| Deutsche Small Cap Core Fund | 2,354,005 | 124,903 | 1,093,700 | 167,115 | 10,820 | 30,085 | 1,744,276 | |||||||||||||||||||||
| Deutsche Small Cap Growth Fund | — | 414,151 | 188,500 | (2,135 | ) | — | 13,451 | 226,041 | ||||||||||||||||||||
| Deutsche Small Cap Value Fund | — | 327,443 | 211,000 | (17,197 | ) | 1,497 | 43,146 | 81,191 | ||||||||||||||||||||
| Deutsche U.S. Bond Index Fund | 16,492,615 | 821,075 | 12,129,509 | (764,176 | ) | 289,647 | 491,406 | 4,904,031 | ||||||||||||||||||||
| Deutsche World Dividend Fund | — | 867,153 | 57,700 | (1,143 | ) | 5,453 | — | 826,111 | ||||||||||||||||||||
| Deutsche X-trackers MSCI Europe Hedged Equity ETF | — | 455,389 | 332,574 | (4,618 | ) | 2,925 | — | 117,305 | ||||||||||||||||||||
| Deutsche X-trackers MSCI Japan Hedged Equity ETF | — | 363,024 | 301,092 | (2,715 | ) | — | — | 59,040 | ||||||||||||||||||||
| Central Cash Management Fund | 566,090 | 24,220,787 | 24,046,859 | — | 863 | — | 740,018 | |||||||||||||||||||||
| Total | 71,562,143 | 60,658,747 | 78,601,104 | 101,009 | 1,378,606 | 1,236,696 | 57,892,160 | |||||||||||||||||||||
Deutsche LifeCompass 2015 Fund
| Affiliate | Value ($) at 8/31/2013 | Purchases Cost ($) | Sales Cost ($) | Realized Gain/ (Loss) ($) | Income Distributions ($) | Capital Gain Distributions ($) | Value ($) at 8/31/2014 | |||||||||||||||||||||
| Deutsche Capital Growth Fund | 3,125,344 | 128,925 | 2,619,148 | 719,300 | 7,484 | 74,241 | 999,438 | |||||||||||||||||||||
| Deutsche Core Equity Fund | 7,805,972 | 5,180,506 | 4,972,207 | 177,468 | 93,883 | 720,523 | 9,617,597 | |||||||||||||||||||||
| Deutsche Core Fixed Income Fund | 16,258,228 | 892,784 | 12,414,580 | (397,469 | ) | 317,726 | — | 5,068,546 | ||||||||||||||||||||
| Deutsche Core Plus Income Fund | — | 2,209,748 | 195,700 | 43 | 16,548 | — | 2,024,513 | |||||||||||||||||||||
| Deutsche Diversified Market Neutral Fund | 1,219,603 | 278,505 | 150,523 | (10,109 | ) | — | 132,405 | 1,207,628 | ||||||||||||||||||||
| Deutsche EAFE Equity Index Fund | 8,516,758 | 202,319 | 6,182,000 | 846,680 | 159,609 | — | 3,509,882 | |||||||||||||||||||||
| Deutsche Emerging Markets Equity Fund | 1,903,807 | 707,414 | 1,077,500 | (28,914 | ) | 15,180 | — | 1,796,514 | ||||||||||||||||||||
| Deutsche Enhanced Commodity Strategy Fund | 499,342 | 3,359,983 | 47,800 | (7,701 | ) | 5,583 | — | 3,661,820 | ||||||||||||||||||||
| Deutsche Enhanced Emerging Markets Fixed Income Fund | 981,335 | 1,590,522 | 87,100 | (1,895 | ) | 63,122 | — | 2,607,812 | ||||||||||||||||||||
| Deutsche Enhanced Global Bond Fund | 1,855,771 | 295,840 | 151,294 | (5,882 | ) | 78,583 | 13,056 | 2,057,976 | ||||||||||||||||||||
| Deutsche Equity 500 Index Fund | 15,227,214 | 434,098 | 8,931,071 | 2,277,386 | 226,298 | — | 9,396,970 | |||||||||||||||||||||
| Deutsche Floating Rate Fund | 1,001,062 | 1,822,963 | 1,057,419 | (2,156 | ) | 84,663 | — | 1,755,910 | ||||||||||||||||||||
| Deutsche Global Equity Fund | 741,531 | 835,308 | 346,435 | 2,738 | 28,808 | — | 1,386,466 | |||||||||||||||||||||
| Deutsche Global Growth Fund | — | 1,237,351 | 778,774 | 39,606 | 5,851 | — | 532,837 | |||||||||||||||||||||
| Deutsche Global High Income Fund | 996,497 | 10,625 | 1,031,490 | 39,128 | 10,762 | — | — | |||||||||||||||||||||
| Deutsche Global Inflation Fund | 2,545,232 | 7,016,717 | 933,700 | (60,196 | ) | 107,117 | — | 8,717,880 | ||||||||||||||||||||
| Deutsche Global Infrastructure Fund | — | 3,204,013 | — | — | 9,089 | 2,124 | 3,303,205 | |||||||||||||||||||||
| Deutsche Global Small Cap Fund | — | 3,581,875 | 1,414,800 | (49,905 | ) | 7,251 | 104,824 | 2,135,129 | ||||||||||||||||||||
| Deutsche High Income Fund | 2,009,553 | 495,455 | 1,388,715 | 59,626 | 70,055 | — | 1,169,134 | |||||||||||||||||||||
| Deutsche International Fund | 817,151 | — | 900,648 | 106,865 | — | — | — | |||||||||||||||||||||
| Deutsche Latin America Equity Fund | — | 316,739 | 197,200 | (21,504 | ) | 1,795 | 9,944 | 109,814 | ||||||||||||||||||||
| Deutsche Real Estate Securities Fund | — | 3,108,613 | — | — | 7,002 | 6,211 | 3,166,358 | |||||||||||||||||||||
| Deutsche Real Estate Securities Income Fund | — | 98,100 | — | — | — | — | 97,835 | |||||||||||||||||||||
| Deutsche Short Duration Fund | 2,593,412 | 6,375,897 | 4,506,506 | (15,028 | ) | 160,597 | — | 4,437,547 | ||||||||||||||||||||
| Deutsche Small Cap Core Fund | 3,035,724 | 388,707 | 1,535,100 | 320,199 | 13,143 | 36,548 | 2,355,683 | |||||||||||||||||||||
| Deutsche Small Cap Growth Fund | — | 524,038 | 220,100 | (1,969 | ) | — | 16,338 | 305,242 | ||||||||||||||||||||
| Deutsche Small Cap Value Fund | — | 408,537 | 256,400 | (20,515 | ) | 1,820 | 52,417 | 109,697 | ||||||||||||||||||||
| Deutsche U.S. Bond Index Fund | 16,746,608 | 935,869 | 11,646,380 | (721,884 | ) | 327,507 | 581,889 | 5,677,905 | ||||||||||||||||||||
| Deutsche World Dividend Fund | 1,161,188 | 1,023,339 | 814,400 | 105,882 | 15,839 | — | 1,493,303 | |||||||||||||||||||||
| Deutsche X-trackers MSCI Europe Hedged Equity ETF | — | 943,308 | 714,441 | (8,969 | ) | 5,708 | — | 218,240 | ||||||||||||||||||||
| Deutsche X-trackers MSCI Japan Hedged Equity ETF | — | 760,074 | 643,243 | (5,801 | ) | — | — | 110,700 | ||||||||||||||||||||
| Central Cash Management Fund | 1,931,573 | 31,424,028 | 32,394,413 | — | 1,094 | — | 961,188 | |||||||||||||||||||||
| Total | 90,972,905 | 79,792,200 | 97,609,087 | 3,335,024 | 1,842,117 | 1,750,520 | 79,992,769 | |||||||||||||||||||||
Deutsche LifeCompass 2020 Fund
| Affiliate | Value ($) at 8/31/2013 | Purchases Cost ($) | Sales Cost ($) | Realized Gain/ (Loss) ($) | Income Distributions ($) | Capital Gain Distributions ($) | Value ($) at 8/31/2014 | |||||||||||||||||||||
| Deutsche Capital Growth Fund | 4,582,122 | 319,680 | 2,952,958 | 910,161 | 19,027 | 188,753 | 2,660,740 | |||||||||||||||||||||
| Deutsche Core Equity Fund | 19,896,696 | 12,096,051 | 10,523,707 | 379,189 | 242,245 | 1,831,806 | 25,605,454 | |||||||||||||||||||||
| Deutsche Core Fixed Income Fund | 19,255,841 | 952,441 | 12,785,949 | (291,268 | ) | 445,024 | — | 7,877,092 | ||||||||||||||||||||
| Deutsche Core Plus Income Fund | — | 3,393,505 | 263,100 | 12 | 24,905 | — | 3,146,380 | |||||||||||||||||||||
| Deutsche Diversified Market Neutral Fund | 1,760,386 | 701,203 | 180,567 | (11,249 | ) | — | 194,603 | 2,072,008 | ||||||||||||||||||||
| Deutsche EAFE Equity Index Fund | 15,976,072 | 1,391,592 | 10,378,500 | 1,228,722 | 329,048 | — | 8,891,373 | |||||||||||||||||||||
| Deutsche Emerging Markets Equity Fund | 5,185,471 | 1,231,632 | 2,186,600 | (72,759 | ) | 42,116 | — | 4,983,934 | ||||||||||||||||||||
| Deutsche Enhanced Commodity Strategy Fund | 1,809,383 | 5,667,013 | 1,042,271 | (288,581 | ) | 9,413 | — | 6,210,182 | ||||||||||||||||||||
| Deutsche Enhanced Emerging Markets Fixed Income Fund | 1,732,292 | 3,735,669 | 109,896 | (5,210 | ) | 110,269 | — | 5,553,522 | ||||||||||||||||||||
| Deutsche Enhanced Global Bond Fund | 3,540,062 | 473,453 | 293,287 | (8,225 | ) | 151,787 | 25,366 | 3,831,308 | ||||||||||||||||||||
| Deutsche Equity 500 Index Fund | 32,219,540 | 556,057 | 14,230,275 | 3,514,480 | 556,057 | — | 25,018,140 | |||||||||||||||||||||
| Deutsche Floating Rate Fund | 1,793,006 | 3,101,498 | 1,412,273 | (3,562 | ) | 128,398 | — | 3,462,610 | ||||||||||||||||||||
| Deutsche Global Equity Fund | 4,437,427 | 247,892 | 1,824,073 | 292,783 | 68,791 | — | 3,511,994 | |||||||||||||||||||||
| Deutsche Global Growth Fund | 1,714,980 | 3,518,543 | 4,339,955 | 322,880 | 27,943 | — | 1,349,748 | |||||||||||||||||||||
| Deutsche Global High Income Fund | 1,801,017 | 19,203 | 1,864,261 | 60,702 | 19,511 | — | — | |||||||||||||||||||||
| Deutsche Global Inflation Fund | 5,688,144 | 9,335,818 | 3,484,500 | (332,410 | ) | 149,317 | — | 11,702,666 | ||||||||||||||||||||
| Deutsche Global Infrastructure Fund | — | 6,033,550 | — | — | 16,901 | 3,949 | 6,218,684 | |||||||||||||||||||||
| Deutsche Global Small Cap Fund | — | 8,410,828 | 2,925,151 | (121,746 | ) | 17,316 | 250,312 | 5,408,696 | ||||||||||||||||||||
| Deutsche High Income Fund | 2,257,390 | 1,398,285 | 1,407,446 | 82,358 | 96,885 | — | 2,305,438 | |||||||||||||||||||||
| Deutsche International Fund | 1,983,163 | — | 2,185,802 | 286,173 | — | — | — | |||||||||||||||||||||
Deutsche Large Cap Focus Growth Fund | 611,440 | — | 678,209 | 291,539 | — | — | — | |||||||||||||||||||||
Deutsche Large Cap Value Fund | 2,219,378 | 11,998 | 2,377,407 | 1,009,876 | 11,998 | — | — | |||||||||||||||||||||
| Deutsche Latin America Equity Fund | — | 841,730 | 513,500 | (54,028 | ) | 4,982 | 27,592 | 304,701 | ||||||||||||||||||||
| Deutsche Real Estate Securities Fund | — | 5,854,168 | — | — | 13,020 | 11,548 | 5,960,999 | |||||||||||||||||||||
| Deutsche Real Estate Securities Income Fund | — | 184,600 | — | — | — | — | 184,101 | |||||||||||||||||||||
| Deutsche Short Duration Fund | 4,947,064 | 11,782,066 | 9,804,671 | (25,773 | ) | 232,566 | — | 6,896,791 | ||||||||||||||||||||
| Deutsche Small Cap Core Fund | 6,943,154 | 788,491 | 3,001,877 | 420,192 | 30,626 | 85,165 | 5,790,888 | |||||||||||||||||||||
| Deutsche Small Cap Growth Fund | — | 1,180,165 | 432,800 | (2,186 | ) | — | 38,065 | 750,441 | ||||||||||||||||||||
| Deutsche Small Cap Value Fund | — | 914,221 | 544,515 | (30,279 | ) | 4,249 | 122,372 | 269,572 | ||||||||||||||||||||
| Deutsche Technology Fund | 982,509 | — | 1,063,279 | 442,485 | — | — | — | |||||||||||||||||||||
| Deutsche U.S. Bond Index Fund | 22,204,079 | 1,981,248 | 14,825,577 | (1,180,968 | ) | 472,249 | 855,408 | 8,823,783 | ||||||||||||||||||||
| Deutsche World Dividend Fund | — | 3,872,879 | 183,056 | (2,085 | ) | 27,179 | — | 3,782,703 | ||||||||||||||||||||
| Deutsche X-trackers MSCI Europe Hedged Equity ETF | — | 2,297,920 | 1,725,882 | (22,292 | ) | 14,080 | — | 545,599 | ||||||||||||||||||||
| Deutsche X-trackers MSCI Japan Hedged Equity ETF | — | 1,837,544 | 1,553,363 | (14,009 | ) | — | — | 269,370 | ||||||||||||||||||||
| Central Cash Management Fund | 6,092,349 | 48,065,354 | 53,466,940 | — | 2,038 | — | 690,763 | |||||||||||||||||||||
| Total | 169,632,965 | 142,196,297 | 164,561,647 | 6,774,922 | 3,267,940 | 3,634,939 | 164,079,680 | |||||||||||||||||||||
Deutsche LifeCompass 2030 Fund
| Affiliate | Value ($) at 8/31/2013 | Purchases Cost ($) | Sales Cost ($) | Realized Gain/ (Loss) ($) | Income Distributions ($) | Capital Gain Distributions ($) | Value ($) at 8/31/2014 | |||||||||||||||||||||
| Deutsche Capital Growth Fund | 2,914,689 | 175,080 | 2,237,800 | 690,591 | 8,505 | 84,375 | 1,222,234 | |||||||||||||||||||||
| Deutsche Core Equity Fund | 8,561,845 | 6,081,180 | 4,734,778 | 172,240 | 108,724 | 818,856 | 11,762,459 | |||||||||||||||||||||
| Deutsche Core Fixed Income Fund | 4,678,161 | 151,876 | 3,182,400 | (62,126 | ) | 93,476 | — | 1,741,716 | ||||||||||||||||||||
| Deutsche Core Plus Income Fund | — | 742,069 | 49,700 | (64 | ) | 5,269 | — | 695,752 | ||||||||||||||||||||
| Deutsche Diversified Market Neutral Fund | 640,313 | 321,887 | 88,300 | (3,807 | ) | — | 67,887 | 800,221 | ||||||||||||||||||||
| Deutsche EAFE Equity Index Fund | 7,793,736 | 739,240 | 5,716,600 | 659,828 | 121,656 | — | 3,690,261 | |||||||||||||||||||||
| Deutsche Emerging Markets Equity Fund | 2,205,302 | 672,390 | 1,134,399 | (34,135 | ) | 17,176 | — | 2,054,626 | ||||||||||||||||||||
| Deutsche Enhanced Commodity Strategy Fund | 659,130 | 1,556,968 | 376,700 | (85,408 | ) | 2,768 | — | 1,778,859 | ||||||||||||||||||||
| Deutsche Enhanced Emerging Markets Fixed Income Fund | — | 2,183,168 | 310,600 | (3,010 | ) | 15,168 | — | 1,892,196 | ||||||||||||||||||||
| Deutsche Enhanced Global Bond Fund | 710,286 | 258,891 | 72,600 | (1,703 | ) | 31,934 | 4,880 | 918,945 | ||||||||||||||||||||
| Deutsche Equity 500 Index Fund | 15,359,958 | 432,968 | 7,300,244 | 1,709,013 | 255,968 | — | 11,492,722 | |||||||||||||||||||||
| Deutsche Floating Rate Fund | — | 1,564,139 | 459,200 | (173 | ) | 21,039 | — | 1,097,967 | ||||||||||||||||||||
| Deutsche Global Equity Fund | 1,350,954 | 171,910 | 279,600 | 41,133 | 25,320 | — | 1,457,423 | |||||||||||||||||||||
| Deutsche Global Growth Fund | — | 2,045,789 | 1,587,700 | 65,726 | 10,285 | — | 560,109 | |||||||||||||||||||||
| Deutsche Global Inflation Fund | 634,755 | 1,705,330 | 232,800 | (30,472 | ) | 28,201 | — | 2,130,617 | ||||||||||||||||||||
| Deutsche Global Infrastructure Fund | — | 1,960,708 | — | — | 5,518 | 1,289 | 2,020,456 | |||||||||||||||||||||
| Deutsche Global Real Estate Securities Fund | 677,506 | 32,784 | 745,786 | 7,427 | 12,598 | — | — | |||||||||||||||||||||
| Deutsche Global Small Cap Fund | — | 3,346,534 | 1,073,600 | (45,535 | ) | 6,373 | 92,132 | 2,244,720 | ||||||||||||||||||||
| Deutsche High Income Fund | 984,122 | 668,020 | 941,000 | 51,530 | 24,423 | — | 731,092 | |||||||||||||||||||||
| Deutsche International Fund | 753,810 | — | 830,834 | 108,035 | — | — | — | |||||||||||||||||||||
| Deutsche Large Cap Value Fund | 1,867,876 | 10,098 | 2,000,877 | 442,073 | 10,098 | — | — | |||||||||||||||||||||
| Deutsche Latin America Equity Fund | — | 351,353 | 215,700 | (22,861 | ) | 2,031 | 11,254 | 125,663 | ||||||||||||||||||||
| Deutsche Real Estate Securities Fund | — | 2,329,481 | 350,440 | (40,568 | ) | 9,013 | 21,733 | 1,973,342 | ||||||||||||||||||||
| Deutsche Real Estate Securities Income Fund | — | 61,100 | — | — | — | — | 60,935 | |||||||||||||||||||||
| Deutsche Science & Technology Fund | 475,797 | — | 514,907 | 210,854 | — | — | — | |||||||||||||||||||||
| Deutsche Short Duration Fund | 993,009 | 1,679,360 | 1,140,279 | (4,522 | ) | 47,360 | — | 1,525,037 | ||||||||||||||||||||
| Deutsche Small Cap Core Fund | 3,144,241 | 630,564 | 1,536,000 | 237,943 | 13,298 | 36,981 | 2,717,232 | |||||||||||||||||||||
| Deutsche Small Cap Growth Fund | — | 554,635 | 204,100 | (2,143 | ) | — | 16,535 | 352,156 | ||||||||||||||||||||
| Deutsche Small Cap Value Fund | — | 412,025 | 241,987 | (17,360 | ) | 1,847 | 53,177 | 126,486 | ||||||||||||||||||||
| Deutsche U.S. Bond Index Fund | 5,025,530 | 370,837 | 3,339,227 | (300,137 | ) | 101,647 | 172,450 | 1,950,950 | ||||||||||||||||||||
| Deutsche X-trackers MSCI Europe Hedged Equity ETF | — | 902,446 | 665,190 | (9,111 | ) | 5,707 | — | 226,424 | ||||||||||||||||||||
| Deutsche X-trackers MSCI Japan Hedged Equity ETF | — | 711,741 | 595,342 | (5,369 | ) | — | — | 110,700 | ||||||||||||||||||||
| Deutsche World Dividend Fund | 1,255,322 | 1,291,540 | 1,059,200 | (177,845 | ) | 15,849 | — | 1,569,825 | ||||||||||||||||||||
| Central Cash Management Fund | 1,621,205 | 20,467,005 | 21,536,733 | — | 768 | — | 551,477 | |||||||||||||||||||||
| Total | 62,307,547 | 54,583,116 | 64,754,623 | 3,550,044 | 1,002,019 | 1,381,549 | 59,582,602 | |||||||||||||||||||||
Deutsche LifeCompass 2040 Fund
| Affiliate | Value ($) at 8/31/2013 | Purchases Cost ($) | Sales Cost ($) | Realized Gain/ (Loss) ($) | Income Distributions ($) | Capital Gain Distributions ($) | Value ($) at 8/31/2014 | |||||||||||||||||||||
| Deutsche Capital Growth Fund | 1,816,886 | 157,709 | 1,600,700 | 509,412 | 4,193 | 41,591 | 595,237 | |||||||||||||||||||||
| Deutsche Core Equity Fund | 4,270,118 | 3,756,222 | 3,209,599 | 84,516 | 53,019 | 403,647 | 5,728,066 | |||||||||||||||||||||
| Deutsche Core Fixed Income Fund | 531,045 | 821,123 | 1,043,000 | (7,959 | ) | 13,832 | — | 321,687 | ||||||||||||||||||||
| Deutsche Core Plus Income Fund | — | 129,673 | 1,800 | (5 | ) | 973 | — | 128,523 | ||||||||||||||||||||
| Deutsche Diversified Market Neutral Fund | 316,201 | 439,952 | 347,500 | (19,469 | ) | — | 31,952 | 375,343 | ||||||||||||||||||||
| Deutsche EAFE Equity Index Fund | 4,265,093 | 526,932 | 3,332,400 | 415,280 | 68,082 | — | 1,928,637 | |||||||||||||||||||||
| Deutsche Emerging Markets Equity Fund | 1,452,842 | 363,903 | 881,300 | (16,345 | ) | 10,782 | — | 1,133,577 | ||||||||||||||||||||
| Deutsche Enhanced Commodity Strategy Fund | 322,086 | 686,109 | 76,300 | (14,426 | ) | 1,597 | — | 900,719 | ||||||||||||||||||||
| Deutsche Enhanced Emerging Markets Fixed Income Fund | — | 1,034,077 | 172,200 | (1,484 | ) | 6,577 | — | 868,041 | ||||||||||||||||||||
| Deutsche Enhanced Global Bond Fund | 220,825 | 304,684 | 246,100 | (6,325 | ) | 9,538 | 1,446 | 285,268 | ||||||||||||||||||||
| Deutsche Equity 500 Index Fund | 7,372,518 | 645,458 | 3,872,201 | 861,391 | 123,809 | — | 5,596,674 | |||||||||||||||||||||
| Deutsche Floating Rate Fund | — | 745,657 | 167,800 | (388 | ) | 10,157 | — | 574,110 | ||||||||||||||||||||
| Deutsche Global Equity Fund | 704,877 | 121,250 | 177,000 | 17,679 | 14,284 | — | 761,728 | |||||||||||||||||||||
| Deutsche Global Growth Fund | 229,811 | 942,343 | 960,600 | 37,331 | 5,802 | — | 292,748 | |||||||||||||||||||||
| Deutsche Global Inflation Fund | 314,918 | 385,249 | 253,200 | (32,151 | ) | 5,849 | — | 453,939 | ||||||||||||||||||||
| Deutsche Global Infrastructure Fund | — | 870,633 | — | — | 2,459 | 574 | 897,267 | |||||||||||||||||||||
| Deutsche Global Small Cap Fund | — | 1,916,980 | 726,800 | (26,746 | ) | 3,596 | 51,979 | 1,173,124 | ||||||||||||||||||||
| Deutsche High Income Fund | 326,753 | 356,303 | 306,700 | 15,723 | 9,803 | — | 382,243 | |||||||||||||||||||||
| Deutsche International Fund | 529,652 | — | 583,772 | 146,337 | — | — | — | |||||||||||||||||||||
| Deutsche Large Cap Value Fund | 1,385,513 | 7,490 | 1,484,168 | 319,893 | 7,490 | — | — | |||||||||||||||||||||
| Deutsche Latin America Equity Fund | — | 216,933 | 140,300 | (15,329 | ) | 1,274 | 7,060 | 69,289 | ||||||||||||||||||||
| Deutsche Real Estate Securities Fund | — | 844,773 | — | — | 1,893 | 1,680 | 860,083 | |||||||||||||||||||||
| Deutsche Real Estate Securities Income Fund | — | 26,600 | — | — | — | — | 26,528 | |||||||||||||||||||||
| Deutsche Science and Technology Fund | 228,393 | — | 247,156 | 104,613 | — | — | — | |||||||||||||||||||||
| Deutsche Short Duration Fund | 308,692 | 239,762 | 265,400 | (1,276 | ) | 9,162 | — | 281,689 | ||||||||||||||||||||
| Deutsche Small Cap Core Fund | 1,901,226 | 477,446 | 1,163,800 | 185,545 | 7,660 | 21,299 | 1,498,976 | |||||||||||||||||||||
| Deutsche Small Cap Growth Fund | — | 338,027 | 144,500 | (2,320 | ) | — | 9,527 | 194,294 | ||||||||||||||||||||
| Deutsche Small Cap Value Fund | — | 251,641 | 156,800 | (16,677 | ) | 1,062 | 30,579 | 69,816 | ||||||||||||||||||||
| Deutsche U.S. Bond Index Fund | 1,136,140 | 102,483 | 854,830 | (62,518 | ) | 19,998 | 35,352 | 360,419 | ||||||||||||||||||||
| Deutsche X-trackers MSCI Europe Hedged Equity ETF | — | 493,890 | 368,060 | (4,886 | ) | 3,068 | — | 120,032 | ||||||||||||||||||||
| Deutsche X-trackers MSCI Japan Hedged Equity ETF | — | 390,643 | 328,464 | (2,962 | ) | — | — | 59,040 | ||||||||||||||||||||
| Deutsche World Dividend Fund | 1,179,151 | 593,216 | 1,034,800 | 132,293 | 10,616 | — | 820,465 | |||||||||||||||||||||
| Central Cash Management Fund | 1,727,399 | 19,995,992 | 21,604,798 | — | 470 | — | 118,593 | |||||||||||||||||||||
| Total | 30,540,139 | 38,183,153 | 45,752,048 | 2,598,747 | 407,045 | 636,686 | 26,876,155 | |||||||||||||||||||||
To the Trustees of Deutsche Target Date Series and the Shareholders of Deutsche LifeCompass Retirement Fund, Deutsche LifeCompass 2015 Fund, Deutsche LifeCompass 2020 Fund, Deutsche LifeCompass 2030 Fund and Deutsche LifeCompass 2040 Fund:
In our opinion, the accompanying statements of assets and liabilities, including the investment portfolios, and the related statements of operations and of changes in net assets and the financial highlights present fairly, in all material respects, the financial positions of Deutsche LifeCompass Retirement Fund (formerly DWS LifeCompass Retirement Fund), Deutsche LifeCompass 2015 Fund (formerly DWS LifeCompass 2015 Fund), Deutsche LifeCompass 2020 Fund (formerly DWS LifeCompass 2020 Fund), Deutsche LifeCompass 2030 Fund (formerly DWS LifeCompass 2030 Fund) and Deutsche LifeCompass 2040 Fund (formerly DWS LifeCompass 2040 Fund), respectively (the five funds constituting Deutsche Target Date Series (formerly DWS Target Date Series)) (the "Trust"), at August 31, 2014 and the results of each of their operations, the changes in each of their net assets and the financial highlights for each of the periods indicated therein, in conformity with accounting principles generally accepted in the United States of America. These financial statements and financial highlights (hereafter referred to as "financial statements") are the responsibility of the Trust's management. Our responsibility is to express an opinion on these financial statements based on our audits. We conducted our audits of these financial statements in accordance with the standards of the Public Company Accounting Oversight Board (United States). Those standards require that we plan and perform the audit to obtain reasonable assurance about whether the financial statements are free of material misstatement. An audit includes examining, on a test basis, evidence supporting the amounts and disclosures in the financial statements, assessing the accounting principles used and significant estimates made by management, and evaluating the overall financial statement presentation. We believe that our audits, which included confirmation of securities at August 31, 2014 by correspondence with the custodian and transfer agent, provide a reasonable basis for our opinion.
Boston, Massachusetts October 23, 2014 | PricewaterhouseCoopers LLP |
As an investor of a Fund, you incur two types of costs: ongoing expenses and transaction costs. Ongoing expenses include distribution and service (12b-1) fees and other Fund expenses. Examples of transaction costs include sales charges (loads) and account maintenance fees, which are not shown in this section. The following tables are intended to help you understand your ongoing expenses (in dollars) of investing in each Fund and to help you compare these expenses with the ongoing expenses of investing in other mutual funds. In addition to the ongoing expenses which the Funds bear directly, the Funds' shareholders indirectly bear the expenses of the Underlying Funds in which the Funds invest. These expenses are not included in the Funds' annualized expense ratios used to calculate the expense estimate in the tables. In the most recent six-month period, Deutsche LifeCompass Retirement Fund, Deutsche LifeCompass 2015 Fund, Deutsche LifeCompass 2020 Fund, Deutsche LifeCompass 2030 Fund and Deutsche LifeCompass 2040 Fund limited the ongoing expenses the Funds bear directly; had they not done so, expenses would have been higher. The examples in the tables are based on an investment of $1,000 invested at the beginning of the six-month period and held for the entire period (March 1, 2014 to August 31, 2014).
The tables illustrate your Fund's expenses in two ways:
—Actual Fund Return. This helps you estimate the actual dollar amount of ongoing expenses (but not transaction costs) paid on a $1,000 investment in the Fund using the Fund's actual return during the period. To estimate the expenses you paid over the period, simply divide your account value by $1,000 (for example, an $8,600 account value divided by $1,000 = 8.6), then multiply the result by the number in the "Expenses Paid per $1,000" line under the share class you hold.
—Hypothetical 5% Fund Return. This helps you to compare your Fund's ongoing expenses (but not transaction costs) with those of other mutual funds using the Fund's actual expense ratio and a hypothetical rate of return of 5% per year before expenses. Examples using a 5% hypothetical fund return may be found in the shareholder reports of other mutual funds. The hypothetical account values and expenses may not be used to estimate the actual ending account balance or expenses you paid for the period.
Please note that the expenses shown in these tables are meant to highlight your ongoing expenses only and do not reflect any transaction costs. The "Expenses Paid per $1,000" line of the tables is useful in comparing ongoing expenses only and will not help you determine the relative total expense of owning different funds. Subject to certain exceptions, an account maintenance fee of $20.00 assessed once per calendar year for Classes A, B, C and S shares may apply for accounts with balances less than $10,000. This fee is not included in these tables. If it was, the estimate of expenses paid for Classes A, B, C and S shares during the period would be higher, and account value during the period would be lower, by this amount.
Deutsche LifeCompass Retirement Fund
Expenses and Value of a $1,000 Investment for the six months ended August 31, 2014 (Unaudited) | ||||||||||||||||
| Actual Fund Return | Class A | Class B | Class C | Class S | ||||||||||||
| Beginning Account Value 3/1/14 | $ | 1,000.00 | $ | 1,000.00 | $ | 1,000.00 | $ | 1,000.00 | ||||||||
| Ending Account Value 8/31/14 | $ | 1,034.90 | $ | 1,031.10 | $ | 1,031.10 | $ | 1,036.30 | ||||||||
| Expenses Paid per $1,000* | $ | 2.36 | $ | 6.19 | $ | 6.19 | $ | 1.08 | ||||||||
| Hypothetical 5% Fund Return | Class A | Class B | Class C | Class S | ||||||||||||
| Beginning Account Value 3/1/14 | $ | 1,000.00 | $ | 1,000.00 | $ | 1,000.00 | $ | 1,000.00 | ||||||||
| Ending Account Value 8/31/14 | $ | 1,022.89 | $ | 1,019.11 | $ | 1,019.11 | $ | 1,024.15 | ||||||||
| Expenses Paid per $1,000* | $ | 2.35 | $ | 6.16 | $ | 6.16 | $ | 1.07 | ||||||||
* Expenses are equal to the Fund's annualized expense ratio for each share class, multiplied by the average account value over the period, multiplied by 184 (the number of days in the most recent six-month period), then divided by 365.
| Annualized Expense Ratios** | Class A | Class B | Class C | Class S |
| Deutsche LifeCompass Retirement Fund | .46% | 1.21% | 1.21% | .21% |
** The Fund invests in other funds and indirectly bears its proportionate share of fees and expenses incurred by the Underlying Funds in which the Fund is invested. These ratios do not include these indirect fees and expenses.
For more information, please refer to the Fund's prospectus.
For an analysis of the fees associated with an investment in the Fund or similar funds, please refer to http://apps.finra.org/fundanalyzer/1/fa.aspx.
Deutsche LifeCompass 2015 Fund
Expenses and Value of a $1,000 Investment for the six months ended August 31, 2014 (Unaudited) | ||||||||||||||||
| Actual Fund Return | Class A | Class B | Class C | Class S | ||||||||||||
| Beginning Account Value 3/1/14 | $ | 1,000.00 | $ | 1,000.00 | $ | 1,000.00 | $ | 1,000.00 | ||||||||
| Ending Account Value 8/31/14 | $ | 1,036.10 | $ | 1,032.30 | $ | 1,032.30 | $ | 1,037.40 | ||||||||
| Expenses Paid per $1,000* | $ | 2.36 | $ | 6.20 | $ | 6.20 | $ | 1.08 | ||||||||
| Hypothetical 5% Fund Return | Class A | Class B | Class C | Class S | ||||||||||||
| Beginning Account Value 3/1/14 | $ | 1,000.00 | $ | 1,000.00 | $ | 1,000.00 | $ | 1,000.00 | ||||||||
| Ending Account Value 8/31/14 | $ | 1,022.89 | $ | 1,019.11 | $ | 1,019.11 | $ | 1,024.15 | ||||||||
| Expenses Paid per $1,000* | $ | 2.35 | $ | 6.16 | $ | 6.16 | $ | 1.07 | ||||||||
* Expenses are equal to the Fund's annualized expense ratio for each share class, multiplied by the average account value over the period, multiplied by 184 (the number of days in the most recent six-month period), then divided by 365.
| Annualized Expense Ratios** | Class A | Class B | Class C | Class S |
| Deutsche LifeCompass 2015 Fund | .46% | 1.21% | 1.21% | .21% |
** The Fund invests in other funds and indirectly bears its proportionate share of fees and expenses incurred by the Underlying Funds in which the Fund is invested. These ratios do not include these indirect fees and expenses.
For more information, please refer to the Fund's prospectus.
For an analysis of the fees associated with an investment in the Fund or similar funds, please refer to http://apps.finra.org/fundanalyzer/1/fa.aspx.
Deutsche LifeCompass 2020 Fund
Expenses and Value of a $1,000 Investment for the six months ended August 31, 2014 (Unaudited) | ||||||||||||||||
| Actual Fund Return | Class A | Class B | Class C | Class S | ||||||||||||
| Beginning Account Value 3/1/14 | $ | 1,000.00 | $ | 1,000.00 | $ | 1,000.00 | $ | 1,000.00 | ||||||||
| Ending Account Value 8/31/14 | $ | 1,040.80 | $ | 1,037.10 | $ | 1,037.70 | $ | 1,042.00 | ||||||||
| Expenses Paid per $1,000* | $ | 2.37 | $ | 6.21 | $ | 6.21 | $ | 1.08 | ||||||||
| Hypothetical 5% Fund Return | Class A | Class B | Class C | Class S | ||||||||||||
| Beginning Account Value 3/1/14 | $ | 1,000.00 | $ | 1,000.00 | $ | 1,000.00 | $ | 1,000.00 | ||||||||
| Ending Account Value 8/31/14 | $ | 1,022.89 | $ | 1,019.11 | $ | 1,019.11 | $ | 1,024.15 | ||||||||
| Expenses Paid per $1,000* | $ | 2.35 | $ | 6.16 | $ | 6.16 | $ | 1.07 | ||||||||
* Expenses are equal to the Fund's annualized expense ratio for each share class, multiplied by the average account value over the period, multiplied by 184 (the number of days in the most recent six-month period), then divided by 365.
| Annualized Expense Ratios** | Class A | Class B | Class C | Class S |
| Deutsche LifeCompass 2020 Fund | .46% | 1.21% | 1.21% | .21% |
** The Fund invests in other funds and indirectly bears its proportionate share of fees and expenses incurred by the Underlying Funds in which the Fund is invested. These ratios do not include these indirect fees and expenses.
For more information, please refer to the Fund's prospectus.
For an analysis of the fees associated with an investment in the Fund or similar funds, please refer to http://apps.finra.org/fundanalyzer/1/fa.aspx.
Deutsche LifeCompass 2030 Fund
Expenses and Value of a $1,000 Investment for the six months ended August 31, 2014 (Unaudited) | ||||||||||||||||
| Actual Fund Return | Class A | Class B | Class C | Class S | ||||||||||||
| Beginning Account Value 3/1/14 | $ | 1,000.00 | $ | 1,000.00 | $ | 1,000.00 | $ | 1,000.00 | ||||||||
| Ending Account Value 8/31/14 | $ | 1,046.00 | $ | 1,041.70 | $ | 1,042.60 | $ | 1,047.80 | ||||||||
| Expenses Paid per $1,000* | $ | 2.37 | $ | 6.23 | $ | 6.23 | $ | 1.08 | ||||||||
| Hypothetical 5% Fund Return | Class A | Class B | Class C | Class S | ||||||||||||
| Beginning Account Value 3/1/14 | $ | 1,000.00 | $ | 1,000.00 | $ | 1,000.00 | $ | 1,000.00 | ||||||||
| Ending Account Value 8/31/14 | $ | 1,022.89 | $ | 1,019.11 | $ | 1,019.11 | $ | 1,024.15 | ||||||||
| Expenses Paid per $1,000* | $ | 2.35 | $ | 6.16 | $ | 6.16 | $ | 1.07 | ||||||||
* Expenses are equal to the Fund's annualized expense ratio for each share class, multiplied by the average account value over the period, multiplied by 184 (the number of days in the most recent six-month period), then divided by 365.
| Annualized Expense Ratios** | Class A | Class B | Class C | Class S |
| Deutsche LifeCompass 2030 Fund | .46% | 1.21% | 1.21% | .21% |
** The Fund invests in other funds and indirectly bears its proportionate share of fees and expenses incurred by the Underlying Funds in which the Fund is invested. These ratios do not include these indirect fees and expenses.
For more information, please refer to the Fund's prospectus.
For an analysis of the fees associated with an investment in the Fund or similar funds, please refer to http://apps.finra.org/fundanalyzer/1/fa.aspx.
Deutsche LifeCompass 2040 Fund
Expenses and Value of a $1,000 Investment for the six months ended August 31, 2014 (Unaudited) | ||||||||||||
| Actual Fund Return | Class A | Class C | Class S | |||||||||
| Beginning Account Value 3/1/14 | $ | 1,000.00 | $ | 1,000.00 | $ | 1,000.00 | ||||||
| Ending Account Value 8/31/14 | $ | 1,048.70 | $ | 1,045.50 | $ | 1,049.80 | ||||||
| Expenses Paid per $1,000* | $ | 2.38 | $ | 6.24 | $ | 1.08 | ||||||
| Hypothetical 5% Fund Return | Class A | Class C | Class S | |||||||||
| Beginning Account Value 3/1/14 | $ | 1,000.00 | $ | 1,000.00 | $ | 1,000.00 | ||||||
| Ending Account Value 8/31/14 | $ | 1,022.89 | $ | 1,019.11 | $ | 1,024.15 | ||||||
| Expenses Paid per $1,000* | $ | 2.35 | $ | 6.16 | $ | 1.07 | ||||||
* Expenses are equal to the Fund's annualized expense ratio for each share class, multiplied by the average account value over the period, multiplied by 184 (the number of days in the most recent six-month period), then divided by 365.
| Annualized Expense Ratios** | Class A | Class C | Class S |
| Deutsche LifeCompass 2040 Fund | .46% | 1.21% | .21% |
** The Fund invests in other funds and indirectly bears its proportionate share of fees and expenses incurred by the Underlying Funds in which the Fund is invested. These ratios do not include these indirect fees and expenses.
For more information, please refer to the Fund's prospectus.
For an analysis of the fees associated with an investment in the Fund or similar funds, please refer to http://apps.finra.org/fundanalyzer/1/fa.aspx.
Deutsche LifeCompass 2030 Fund and Deutsche LifeCompass 2040 Fund paid distributions of $0.13 and $0.96 per share, respectively, from net long-term capital gains during its year ended August 31, 2014.
Pursuant to Section 852 of the Internal Revenue Code, Deutsche LifeCompass 2030 Fund and Deutsche LifeCompass 2040 Fund designate $3,510,000 and $2,723,000, respectively, as capital gain dividends for its year ended August 31, 2014.
For corporate shareholders, 100%, 100%, 100%, 100% and 100% of the ordinary dividends (i.e., income dividends plus short-term capital gains) paid during the fiscal year ended August 31, 2014, for Deutsche LifeCompass Retirement Fund, Deutsche LifeCompass 2015 Fund, Deutsche LifeCompass 2020 Fund, Deutsche LifeCompass 2030 Fund and Deutsche LifeCompass 2040 Fund, respectively, qualified for the dividends received deduction.
For federal income tax purposes, Deutsche LifeCompass Retirement Fund, Deutsche LifeCompass 2015 Fund, Deutsche LifeCompass 2020 Fund, Deutsche LifeCompass 2030 Fund and Deutsche LifeCompass 2040 Fund designate $1,624,000, $2,165,000, $3,800,000, $1,147,000 and $460,000, respectively, or the maximum amount allowable under tax law, as qualified dividend income.
Please consult a tax advisor if you have questions about federal or state income tax laws, or on how to prepare your tax returns. If you have specific questions about your account, please call (800) 728-3337.
The Board of Trustees approved the renewal of the DWS LifeCompass Retirement Fund's, the DWS LifeCompass 2015 Fund's, the DWS LifeCompass 2020 Fund's, the DWS LifeCompass 2030 Fund's and the DWS LifeCompass 2040 Fund's investment management agreement (the "Agreement") with Deutsche Investment Management Americas Inc. ("DIMA") in September 2013.
In terms of the process that the Board followed prior to approving the Agreement, shareholders should know that:
— In September 2013, all of the Funds' Trustees were independent of DIMA and its affiliates.
— The Trustees met frequently during the past year to discuss fund matters and dedicated a substantial amount of time to contract review matters. Over the course of several months, the Board's Contract Committee, in coordination with the Board's Fixed Income and Asset Allocation Oversight Committee, reviewed comprehensive materials received from DIMA, independent third parties and independent counsel. These materials included an analysis of the Funds' performance, fees and expenses, and profitability compiled by a fee consultant retained by the Funds' Independent Trustees (the "Fee Consultant"). The Board also received extensive information throughout the year regarding performance of the Funds.
— The Independent Trustees regularly meet privately with their independent counsel to discuss contract review and other matters. In addition, the Independent Trustees were also advised by the Fee Consultant in the course of their review of the Funds' contractual arrangements and considered a comprehensive report prepared by the Fee Consultant in connection with their deliberations.
— In connection with reviewing the Agreement, the Board also reviewed the terms of each Fund's Rule 12b-1 plan, distribution agreement, administrative services agreement, transfer agency agreement and other material service agreements.
— Based on its evaluation of the information provided, the Contract Committee presented its findings and recommendations to the Board. The Board then reviewed the Contract Committee's findings and recommendations.
In connection with the contract review process, the Contract Committee and the Board considered the factors discussed below, among others. The Board also considered that DIMA and its predecessors have managed the Funds since their inception, and the Board believes that a long-term relationship with a capable, conscientious advisor is in the best interests of the Funds. The Board considered, generally, that shareholders chose to invest or remain invested in each respective Fund knowing that DIMA managed the Fund. DIMA is part of Deutsche Bank AG, a major global banking institution that is engaged in a wide range of financial services. The Board believes that there are advantages to being part of a global asset management business that offers a wide range of investing expertise and resources, including hundreds of portfolio managers and analysts with research capabilities in many countries throughout the world.
As part of the contract review process, the Board carefully considered the fees and expenses of each DWS fund overseen by the Board in light of the fund's performance. In many cases, this led to a negotiation with DIMA of lower expense caps as part of the 2012 and 2013 contract review processes than had previously been in place. As part of these negotiations, the Board indicated that it would consider relaxing these new lower caps in future years following sustained improvements in performance, among other considerations.
In June 2012, Deutsche Bank AG ("DB"), DIMA's parent company, announced that DB would combine its Asset Management (of which DIMA was a part) and Wealth Management divisions. DB has advised the Independent Trustees that the U.S. asset management business is a critical and integral part of DB, and that it has, and will continue to, reinvest a significant portion of the substantial savings it expects to realize by combining its Asset Management and Wealth Management divisions into the new Asset and Wealth Management ("AWM") division, including ongoing enhancements to its investment capabilities. DB also has confirmed its commitment to maintaining strong legal and compliance groups within the AWM division.
While shareholders may focus primarily on fund performance and fees, the Funds' Board considers these and many other factors, including the quality and integrity of DIMA's personnel and such other issues as back-office operations, fund valuations, and compliance policies and procedures.
Nature, Quality and Extent of Services. The Board considered the terms of the Agreement, including the scope of advisory services provided under the Agreement. The Board noted that, under the Agreement, DIMA provides portfolio management services to each Fund and that, pursuant to a separate administrative services agreement, DIMA provides administrative services to each Fund. The Board considered the experience and skills of senior management and investment personnel, the resources made available to such personnel, the ability of DIMA to attract and retain high-quality personnel, and the organizational depth and stability of DIMA. The Board reviewed each Fund's performance over short-term and long-term periods and compared those returns to various agreed-upon performance measures, including market indices and a peer universe compiled by the Fee Consultant using information supplied by Morningstar Direct ("Morningstar"), an independent fund data service. The Board also noted that it has put into place a process of identifying "Focus Funds" (e.g., funds performing poorly relative to their benchmark or a peer universe compiled by an independent fund data service), and receives more frequent reporting and information from DIMA regarding such funds, along with DIMA's remedial plans to address underperformance. The Board believes this process is an effective manner of identifying and addressing underperforming funds.
LifeCompass 2015 Fund. Based on the information provided, the Board noted that for the one-, three- and five-year periods ended December 31, 2012, the LifeCompass 2015 Fund's performance (Class A shares) was in the 2nd quartile, 3rd quartile and 4th quartile, respectively, of the applicable Morningstar universe (the 1st quartile being the best performers and the 4th quartile being the worst performers). The Board also observed that the Fund has underperformed its benchmark in the three- and five-year periods and has outperformed its benchmark in the one-year period ended December 31, 2012.
LifeCompass 2020 Fund. Based on the information provided, the Board noted that for the one-, three- and five-year periods ended December 31, 2012, the LifeCompass 2020 Fund's performance (Class A shares) was in 2nd quartile, 4th quartile and 4th quartile, respectively, of the applicable Morningstar universe (the 1st quartile being the best performers and the 4th quartile being the worst performers). The Board also observed that the Fund has underperformed its benchmark in the three- and five-year periods and has outperformed its benchmark in the one-year period ended December 31, 2012.
LifeCompass 2030 Fund. Based on the information provided, the Board noted that for the one-, three- and five-year periods ended December 31, 2012, the LifeCompass 2030 Fund's performance (Class A shares) was in the 3rd quartile, 4th quartile and 4th quartile, respectively, of the applicable Morningstar universe (the 1st quartile being the best performers and the 4th quartile being the worst performers). The Board also observed that the Fund has underperformed its benchmark in the one-, three- and five-year periods ended December 31, 2012.
LifeCompass 2040 Fund. Based on the information provided, the Board noted that for the one-, three- and five-year periods ended December 31, 2012, the LifeCompass 2040 Fund's performance (Class A shares) was in the 4th quartile of the applicable Morningstar universe (the 1st quartile being the best performers and the 4th quartile being the worst performers). The Board also observed that the Fund has underperformed its benchmark in the one-, three- and five-year periods ended December 31, 2012.
LifeCompass Retirement Fund. Based on the information provided, the Board noted that for the one-, three- and five-year periods ended December 31, 2012, the LifeCompass Retirement Fund's performance (Class A shares) was in the 2nd quartile, 3rd quartile and 4th quartile, respectively, of the applicable Morningstar universe (the 1st quartile being the best performers and the 4th quartile being the worst performers). The Board also observed that the Fund has underperformed its benchmark in the three- and five-year periods and has outperformed its benchmark in the one-year period ended December 31, 2012.
The Board noted the disappointing investment performance of each Fund in recent periods and continued to discuss with senior management of DIMA the factors contributing to such underperformance and actions being taken to improve performance. The Board recognized that DIMA has made changes to its investment personnel and processes in recent years in an effort to enhance its investment platform and improve long-term performance across the DWS fund complex.
Fees and Expenses. The Board considered the Funds' investment management fee schedules, operating expenses and total expense ratios, and comparative information provided by Lipper Inc. ("Lipper") and the Fee Consultant regarding investment management fee rates paid to other investment advisors by similar funds (1st quartile being the most favorable and 4th quartile being the least favorable). With respect to management fees paid to other investment advisors by similar funds, the Trustees noted that the Funds do not pay any Fund-level investment advisory fees, but do bear administrative fees.
LifeCompass 2015 Fund. As a result of the administrative fee, the total management fee rates paid by the LifeCompass 2015 Fund were at the median of the applicable Lipper peer group (based on Lipper data provided as of December 31, 2012). The Board noted that the Fund's Class A shares total (net) operating expenses (excluding 12b-1 fees) were expected to be higher than the median (4th quartile) of the applicable Lipper expense universe (based on Lipper data provided as of December 31, 2012, and analyzing Lipper expense universe Class A (net) expenses less any applicable 12b-1 fees) ("Lipper Universe Expenses").
LifeCompass 2020 Fund. As a result of the administrative fee, the total management fee rates paid by the LifeCompass 2020 Fund were lower than the median (1st quartile) of the applicable Lipper peer group (based on Lipper data provided as of December 31, 2012). The Board noted that the Fund's Class A shares total (net) operating expenses (excluding 12b-1 fees) were expected to be higher than the median (4th quartile) of the applicable Lipper Universe Expenses.
LifeCompass 2030 Fund. As a result of the administrative fee, the total management fee rates paid by the LifeCompass 2030 Fund were lower than the median (1st quartile) of the applicable Lipper peer group (based on Lipper data provided as of December 31, 2012). The Board noted that the Fund's Class A shares total (net) operating expenses (excluding 12b-1 fees) were expected to be higher than the median (4th quartile) of the applicable Lipper Universe Expenses.
LifeCompass 2040 Fund. As a result of the administrative fee, the total management fee rates paid by the LifeCompass 2040 Fund were at the median of the applicable Lipper peer group (based on Lipper data provided as of December 31, 2012). The Board noted that the Fund's Class A shares total (net) operating expenses (excluding 12b-1 fees) were expected to be higher than the median (4th quartile) of the applicable Lipper Universe Expenses.
LifeCompass Retirement Fund. As a result of the administrative fee, the total management fee rates paid by the LifeCompass Retirement Fund were at the median of the applicable Lipper peer group (based on Lipper data provided as of December 31, 2012). The Board noted that the Fund's Class A shares total (net) operating expenses (excluding 12b-1 fees) were expected to be higher than the median (4th quartile) of the applicable Lipper Universe Expenses.
The Board also reviewed data comparing total (net) operating expenses of each share class of each Fund to the applicable Lipper Universe Expenses. The Board also considered information prepared by the Funds' Fee Consultant regarding the competitiveness of each Fund's total expenses relative to a more customized peer universe. The Board considered the Funds' total management fee rates as compared to fees charged by DIMA to comparable funds and considered differences between the Funds and the comparable funds. The Board also considered how each Fund's total (net) operating expenses compared to the total (net) operating expenses of a more customized peer group selected by Lipper (based on such factors as asset size). The Board also noted that the expense limitations agreed to by DIMA helped to ensure that each Fund's total (net) operating expenses would remain competitive.
The information considered by the Board as part of its review of management fees included information regarding fees charged by DIMA and its affiliates to similar institutional accounts and to similar funds offered primarily to European investors ("DWS Europe funds"), in each case as applicable. The Board observed that advisory fee rates for institutional accounts generally were lower than the management fees charged by similarly managed DWS U.S. mutual funds ("DWS Funds"), but also took note of the differences in services provided to DWS Funds as compared to institutional accounts. In the case of DWS Europe funds, the Board observed that fee rates for DWS Europe funds generally were higher than for similarly managed DWS Funds, but noted that differences in the types of services provided to DWS Funds relative to DWS Europe funds made it difficult to compare such fees.
On the basis of the information provided, the Board concluded that each Fund's management fees were reasonable and appropriate in light of the nature, quality and extent of services provided by DIMA.
Profitability. The Board reviewed detailed information regarding revenues received by DIMA from advising the DWS Funds along with the estimated costs and pre-tax profits realized by DIMA from advising the DWS Funds. The Board also received information regarding the estimated enterprise-wide profitability of DWS and its affiliates with respect to all fund services in totality. The Board did not receive profitability information with respect to the Funds (which, as noted above, do not pay any investment advisory fees), but did receive such information with respect to the funds in which the Fund invests. The Board also reviewed information regarding the profitability of certain similar investment management firms. The Board noted that while information regarding the profitability of such firms is limited (and in some cases is not necessarily prepared on a comparable basis), DIMA and its affiliates' overall profitability with respect to the DWS fund complex (after taking into account distribution and other services provided to the funds by DIMA and its affiliates) was lower than the overall profitability levels of many comparable firms for which such data was available.
Economies of Scale. The Board considered whether there are economies of scale with respect to the management of the Funds and whether the Funds benefit from any economies of scale. The Board concluded that each Fund's fee schedule represents an appropriate sharing between each Fund and DIMA of such economies of scale as may exist in the management of the Fund at current asset levels.
Other Benefits to DIMA and Its Affiliates. The Board also considered the character and amount of other incidental benefits received by DIMA and its affiliates, including any fees received by DIMA for administrative services provided to the Funds and any fees received by an affiliate of DIMA for distribution services. The Board also considered benefits to DIMA related to brokerage and soft-dollar allocations, including allocating brokerage to pay for research generated by parties other than the executing broker dealers, which pertain primarily to funds investing in equity securities, along with the incidental public relations benefits to DIMA related to DWS Funds advertising and cross-selling opportunities among DIMA products and services. The Board concluded that management fees were reasonable in light of these fallout benefits.
Compliance. The Board considered the significant attention and resources dedicated by DIMA to documenting and enhancing its compliance processes in recent years. The Board noted in particular (i) the experience and seniority of both DIMA's chief compliance officer and the Funds' chief compliance officer; (ii) the large number of DIMA compliance personnel; and (iii) the substantial commitment of resources by DIMA and its affiliates to compliance matters.
Based on all of the information considered and the conclusions reached, the Board unanimously determined that the continuation of the Agreement is in the best interests of each Fund. In making this determination, the Board did not give particular weight to any single factor identified above. The Board considered these factors over the course of numerous meetings, certain of which were in executive session with only the Independent Trustees and their independent counsel present. It is possible that individual Trustees may have weighed these factors differently in reaching their individual decisions to approve the continuation of the Agreement.
The following table presents certain information regarding the Board Members and Officers of the fund. Each Board Member's year of birth is set forth in parentheses after his or her name. Unless otherwise noted, (i) each Board Member has engaged in the principal occupation(s) noted in the table for at least the most recent five years, although not necessarily in the same capacity; and (ii) the address of each Independent Board Member is c/o Kenneth C. Froewiss, Chairman, Deutsche Mutual Funds, P.O. Box 390601, Cambridge, MA 02139. Except as otherwise noted below, the term of office for each Board Member is until the election and qualification of a successor, or until such Board Member sooner dies, resigns, is removed or as otherwise provided in the governing documents of the fund. Because the fund does not hold an annual meeting of shareholders, each Board Member will hold office for an indeterminate period. The Board Members may also serve in similar capacities with other funds in the fund complex.
| Independent Board Members | ||||
Name, Year of Birth, Position with the Fund and Length of Time Served1 | Business Experience and Directorships During the Past Five Years | Number of Funds in Deutsche Fund Complex Overseen | Other Directorships Held by Board Member | |
Kenneth C. Froewiss (1945) Chairperson since 2013, and Board Member since 2001 | Adjunct Professor of Finance, NYU Stern School of Business (September 2009–present; Clinical Professor from 1997–September 2009); Member, Finance Committee, Association for Asian Studies (2002–present); Director, Mitsui Sumitomo Insurance Group (US) (2004–present); prior thereto, Managing Director, J.P. Morgan (investment banking firm) (until 1996) | 105 | — | |
William McClayton (1944) Vice Chairperson since 2013, and Board Member since 2004 | Private equity investor (since October 2009); previously, Managing Director, Diamond Management & Technology Consultants, Inc. (global consulting firm) (2001–2009); Directorship: Board of Managers, YMCA of Metropolitan Chicago; formerly: Senior Partner, Arthur Andersen LLP (accounting) (1966–2001); Trustee, Ravinia Festival | 105 | — | |
John W. Ballantine (1946) Board Member since 1999 | Retired; formerly, Executive Vice President and Chief Risk Management Officer, First Chicago NBD Corporation/The First National Bank of Chicago (1996–1998); Executive Vice President and Head of International Banking (1995–1996); former Directorships: Director and former Chairman of the Board, Healthways, Inc.2 (provider of disease and care management services) (2003–2014); Stockwell Capital Investments PLC (private equity); First Oak Brook Bancshares, Inc. and Oak Brook Bank; Prisma Energy International | 105 | Portland General Electric2 (utility company) (2003– present) | |
Henry P. Becton, Jr. (1943) Board Member since 1990 | Vice Chair and former President, WGBH Educational Foundation. Directorships: Public Radio International; Public Radio Exchange (PRX); North Bennett Street School (Boston); former Directorships: Belo Corporation2 (media company); The PBS Foundation; Association of Public Television Stations; Boston Museum of Science; American Public Television; Concord Academy; New England Aquarium; Mass. Corporation for Educational Telecommunications; Committee for Economic Development; Public Broadcasting Service; Connecticut College | 105 | Lead Director, Becton Dickinson and Company2 (medical technology company) | |
Dawn-Marie Driscoll (1946) Board Member since 1987 | Emeritus Executive Fellow, Center for Business Ethics, Bentley University; formerly: President, Driscoll Associates (consulting firm); Partner, Palmer & Dodge (law firm) (1988–1990); Vice President of Corporate Affairs and General Counsel, Filene's (retail) (1978–1988). Directorships: Director of ICI Mutual Insurance Company (since 2007); Advisory Board, Center for Business Ethics, Bentley University; Trustee and former Chairman of the Board, Southwest Florida Community Foundation (charitable organization); former Directorships: Sun Capital Advisers Trust (mutual funds) (2007–2012), Investment Company Institute (audit, executive, nominating committees) and Independent Directors Council (governance, executive committees) | 105 | — | |
Keith R. Fox, CFA (1954) Board Member since 1996 | Managing General Partner, Exeter Capital Partners (a series of private investment funds) (since 1986). Directorships: Progressive International Corporation (kitchen goods importer and distributor); The Kennel Shop (retailer); former Chairman, National Association of Small Business Investment Companies; former Directorships: BoxTop Media Inc. (advertising); Sun Capital Advisers Trust (mutual funds) (2011–2012) | 105 | — | |
Paul K. Freeman (1950) Board Member since 1993 | Consultant, World Bank/Inter-American Development Bank; Chair, Governing Council of the Independent Directors Council (Chairman of Education Committee); formerly: Project Leader, International Institute for Applied Systems Analysis (1998–2001); Chief Executive Officer, The Eric Group, Inc. (environmental insurance) (1986–1998); Directorships: Denver Zoo Foundation (December 2012–present); former Directorships: Prisma Energy International | 105 | — | |
Richard J. Herring (1946) Board Member since 1990 | Jacob Safra Professor of International Banking and Professor, Finance Department, The Wharton School, University of Pennsylvania (since July 1972); Co-Director, Wharton Financial Institutions Center; Co-Chair, U.S. Shadow Financial Regulatory Committee; Executive Director, Financial Economists Roundtable; formerly: Vice Dean and Director, Wharton Undergraduate Division (July 1995–June 2000); Director, Lauder Institute of International Management Studies (July 2000–June 2006) | 105 | Director, Aberdeen Singapore and Japan Funds (since 2007); Independent Director of Barclays Bank Delaware (since September 2010) | |
Rebecca W. Rimel (1951) Board Member since 1995 | President and Chief Executive Officer, The Pew Charitable Trusts (charitable organization) (1994 to present); formerly: Executive Vice President, The Glenmede Trust Company (investment trust and wealth management) (1983–2004); Board Member, Investor Education (charitable organization) (2004–2005); Trustee, Executive Committee, Philadelphia Chamber of Commerce (2001–2007); Director, Viasys Health Care2 (January 2007–June 2007); Trustee, Thomas Jefferson Foundation (charitable organization) (1994–2012) | 105 | Director, Becton Dickinson and Company2 (medical technology company) (2012– present); Director, BioTelemetry Inc.2 (health care) (2009– present) | |
William N. Searcy, Jr. (1946) Board Member since 1993 | Private investor since October 2003; formerly: Pension & Savings Trust Officer, Sprint Corporation2 (telecommunications) (November 1989–September 2003); Trustee, Sun Capital Advisers Trust (mutual funds) (1998–2012) | 105 | — | |
Jean Gleason Stromberg (1943) Board Member since 1997 | Retired. Formerly, Consultant (1997–2001); Director, Financial Markets U.S. Government Accountability Office (1996–1997); Partner, Norton Rose Fulbright, L.L.P. (law firm) (1978–1996). Directorships: The William and Flora Hewlett Foundation (charitable organization); former Directorships: Service Source, Inc. (nonprofit), Mutual Fund Directors Forum (2002–2004), American Bar Retirement Association (funding vehicle for retirement plans) (1987–1990 and 1994–1996) | 105 | — | |
Robert H. Wadsworth (1940) Board Member since 1999 | President, Robert H. Wadsworth & Associates, Inc. (consulting firm) (1983 to present); Director, The Phoenix Boys Choir Association | 105 | — | |
Officers4 | ||
Name, Year of Birth, Position with the Fund and Length of Time Served5 | Business Experience and Directorships During the Past Five Years | |
Brian E. Binder8 (1972) President and Chief Executive Officer, 2013–present | Managing Director3 and Head of Fund Administration, Deutsche Asset & Wealth Management (2013–present); formerly: Head of Business Management and Consulting at Invesco, Ltd. (2010–2012); Chief Administrative Officer, Van Kampen Funds Inc. (2008–2010); and Chief Administrative Officer, Morgan Stanley Investment Management Americas Distribution (2003–2008) | |
John Millette7 (1962) Vice President and Secretary, 1999–present | Director,3 Deutsche Asset & Wealth Management | |
Paul H. Schubert6 (1963) Chief Financial Officer, 2004–present Treasurer, 2005–present | Managing Director,3 Deutsche Asset & Wealth Management (since July 2004); formerly: Executive Director, Head of Mutual Fund Services and Treasurer for UBS Family of Funds (1998–2004); Vice President and Director of Mutual Fund Finance at UBS Global Asset Management (1994–1998) | |
Caroline Pearson7 (1962) Chief Legal Officer, 2010–present | Managing Director,3 Deutsche Asset & Wealth Management; formerly: Assistant Secretary for DWS family of funds (1997–2010) | |
Melinda Morrow6 (1970) Vice President, 2012–present | Director,3 Deutsche Asset & Wealth Management | |
Hepsen Uzcan7 (1974) Assistant Secretary, 2013–present | Director,3 Deutsche Asset & Wealth Management | |
Paul Antosca7 (1957) Assistant Treasurer, 2007–present | Director,3 Deutsche Asset & Wealth Management | |
Jack Clark7 (1967) Assistant Treasurer, 2007–present | Director,3 Deutsche Asset & Wealth Management | |
Diane Kenneally7 (1966) Assistant Treasurer, 2007–present | Director,3 Deutsche Asset & Wealth Management | |
Wayne Salit6 (1967) Anti-Money Laundering Compliance Officer, 2014–present | Director,3 Deutsche Asset & Wealth Management; formerly: Managing Director, AML Compliance Officer at BNY Mellon (2011–2014); and Director, AML Compliance Officer at Deutsche Bank (2004–2011) | |
Robert Kloby6 (1962) Chief Compliance Officer, 2006–present | Managing Director,3 Deutsche Asset & Wealth Management | |
1 The length of time served represents the year in which the Board Member joined the board of one or more Deutsche funds currently overseen by the Board.
2 A publicly held company with securities registered pursuant to Section 12 of the Securities Exchange Act of 1934.
3 Executive title, not a board directorship.
4 As a result of their respective positions held with the Advisor, these individuals are considered "interested persons" of the Advisor within the meaning of the 1940 Act. Interested persons receive no compensation from the fund.
5 The length of time served represents the year in which the officer was first elected in such capacity for one or more Deutsche funds.
6 Address: 60 Wall Street, New York, NY 10005.
7 Address: One Beacon Street, Boston, MA 02108.
8 Address: 222 South Riverside Plaza, Chicago, IL 60606.
The fund's Statement of Additional Information ("SAI") includes additional information about the Board Members. The SAI is available, without charge, upon request. If you would like to request a copy of the SAI, you may do so by calling the following toll-free number: (800) 728-3337.
| For More Information | The automated telephone system allows you to access personalized account information and obtain information on other Deutsche funds using either your voice or your telephone keypad. Certain account types within Classes A, B, C and S also have the ability to purchase, exchange or redeem shares using this system. For more information, contact your financial advisor. You may also access our automated telephone system or speak with a Shareholder Service representative by calling: (800) 728-3337 | |
| Web Site | deutschefunds.com View your account transactions and balances, trade shares, monitor your asset allocation, subscribe to fund and account updates by e-mail, and change your address, 24 hours a day. Obtain prospectuses and applications, blank forms, interactive worksheets, news about Deutsche funds, retirement planning information, and more. | |
| Written Correspondence | Deutsche Asset & Wealth Management PO Box 219151 Kansas City, MO 64121-9151 | |
| Proxy Voting | The fund's policies and procedures for voting proxies for portfolio securities and information about how the fund voted proxies related to its portfolio securities during the 12-month period ended June 30 are available on our Web site — deutschefunds.com (click on "proxy voting"at the bottom of the page) — or on the SEC's Web site — sec.gov. To obtain a written copy of the fund's policies and procedures without charge, upon request, call us toll free at (800) 728-3337. | |
| Portfolio Holdings | Following the fund's fiscal first and third quarter-end, a complete portfolio holdings listing is filed with the SEC on Form N-Q. This form will be available on the SEC's Web site at sec.gov, and it also may be reviewed and copied at the SEC's Public Reference Room in Washington, D.C. Information on the operation of the SEC's Public Reference Room may be obtained by calling (800) SEC-0330. The fund's portfolio holdings are also posted on deutschefunds.com from time to time. Please see the fund's current prospectus for more information. | |
| Principal Underwriter | If you have questions, comments or complaints, contact: DeAWM Distributors, Inc. 222 South Riverside Plaza Chicago, IL 60606-5808 (800) 621-1148 | |
| Investment Management | Deutsche Investment Management Americas Inc. ("DIMA" or the "Advisor"), which is part of Deutsche Asset & Wealth Management, is the investment advisor for the fund. DIMA and its predecessors have more than 80 years of experience managing mutual funds and DIMA provides a full range of investment advisory services to both institutional and retail clients. DIMA is an indirect, wholly owned subsidiary of Deutsche Bank AG. Deutsche Bank AG is a major global banking institution engaged in a wide variety of financial services, including investment management, retail, private and commercial banking, investment banking and insurance. Deutsche Asset & Wealth Management is the retail brand name in the U.S. for the wealth management and asset management activities of Deutsche Bank AG and DIMA. Deutsche Asset & Wealth Management is committed to delivering the investing expertise, insight and resources of this global investment platform to American investors. | |
Deutsche LifeCompass Retirement Fund
| Class A | Class B | Class C | Class S | ||
| Nasdaq Symbol | SUCAX | SUCBX | SUCCX | SCPCX | |
| CUSIP Number | 25158W 502 | 25158W 601 | 25158W 841 | 25158W 775 | |
| Fund Number | 480 | 680 | 780 | 2080 |
Deutsche LifeCompass 2015 Fund
| Class A | Class B | Class C | Class S | ||
| Nasdaq Symbol | SPDAX | SPDBX | SPDCX | SPBAX | |
| CUSIP Number | 25158W 106 | 25158W 205 | 25158W 304 | 25158W 403 | |
| Fund Number | 481 | 681 | 781 | 2081 |
Deutsche LifeCompass 2020 Fund
| Class A | Class B | Class C | Class S | ||
| Nasdaq Symbol | SUPAX | SUPBX | SUPCX | SPGRX | |
| CUSIP Number | 25158W 783 | 25158W 791 | 25158W 817 | 25158W 825 | |
| Fund Number | 482 | 682 | 782 | 2082 |
Deutsche LifeCompass 2030 Fund
| Class A | Class B | Class C | Class S | ||
| Nasdaq Symbol | PLUSX | PLSBX | PLSCX | PPLSX | |
| CUSIP Number | 25158W 833 | 25158W 858 | 25158W 866 | 25158W 874 | |
| Fund Number | 1084 | 1284 | 1384 | 2084 |
Deutsche LifeCompass 2040 Fund
| Class A | Class C | Class S | ||
| Nasdaq Symbol | TGTAX | TGTCX | TGTSX | |
| CUSIP Number | 25158W 882 | 25158W 809 | 25158W 700 | |
| Fund Number | 457 | 757 | 2057 |
Notes
Notes

| ITEM 2. | CODE OF ETHICS |
As of the end of the period covered by this report, the registrant has adopted a code of ethics, as defined in Item 2 of Form N-CSR, that applies to its Principal Executive Officer and Principal Financial Officer. There have been no amendments to, or waivers from, a provision of the code of ethics during the period covered by this report that would require disclosure under Item 2. A copy of the code of ethics is filed as an exhibit to this Form N-CSR. | |
| ITEM 3. | AUDIT COMMITTEE FINANCIAL EXPERT |
| The fund’s audit committee is comprised solely of trustees who are "independent" (as such term has been defined by the Securities and Exchange Commission ("SEC") in regulations implementing Section 407 of the Sarbanes-Oxley Act (the "Regulations")). The fund’s Board of Trustees has determined that there are several "audit committee financial experts" (as such term has been defined by the Regulations) serving on the fund’s audit committee including Mr. Paul K. Freeman, the chair of the fund’s audit committee. An “audit committee financial expert” is not an “expert” for any purpose, including for purposes of Section 11 of the Securities Act of 1933 and the designation or identification of a person as an “audit committee financial expert” does not impose on such person any duties, obligations or liability that are greater than the duties, obligations and liability imposed on such person as a member of the audit committee and board of directors in the absence of such designation or identification. | |
| ITEM 4. | PRINCIPAL ACCOUNTANT FEES AND SERVICES |
DEUTSCHE LIFECOMPASS RETIREMENT FUND
FORM N-CSR DISCLOSURE RE: AUDIT FEES
The following table shows the amount of fees that PricewaterhouseCoopers, LLP (“PWC”), the Fund’s independent registered public accounting firm, billed to the Fund during the Fund’s last two fiscal years. The Audit Committee approved in advance all audit services and non-audit services that PWC provided to the Fund.
Services that the Fund’s Independent Registered Public Accounting Firm Billed to the Fund
| Fiscal Year Ended August 31, | Audit Fees Billed to Fund | Audit-Related Fees Billed to Fund | Tax Fees Billed to Fund | All Other Fees Billed to Fund | ||||||||||||
| 2014 | $ | 40,940 | $ | 0 | $ | 0 | $ | 0 | ||||||||
| 2013 | $ | 39,147 | $ | 0 | $ | 0 | $ | 0 | ||||||||
Services that the Fund’s Independent Registered Public Accounting Firm Billed to the Adviser and Affiliated Fund Service Providers
The following table shows the amount of fees billed by PWC to Deutsche Investment Management Americas Inc. (“DIMA” or the “Adviser”), and any entity controlling, controlled by or under common control with DIMA (“Control Affiliate”) that provides ongoing services to the Fund (“Affiliated Fund Service Provider”), for engagements directly related to the Fund’s operations and financial reporting, during the Fund’s last two fiscal years.
| Fiscal Year Ended August 31, | Audit-Related Fees Billed to Adviser and Affiliated Fund Service Providers | Tax Fees Billed to Adviser and Affiliated Fund Service Providers | All Other Fees Billed to Adviser and Affiliated Fund Service Providers | |||||||||
| 2014 | $ | 0 | $ | 63,439 | $ | 0 | ||||||
| 2013 | $ | 0 | $ | 66,535 | $ | 0 | ||||||
The “Tax Fees Billed to the Advisor” were billed for services associated with foreign tax filings.
Non-Audit Services
The following table shows the amount of fees that PWC billed during the Fund’s last two fiscal years for non-audit services. The Audit Committee pre-approved all non-audit services that PWC provided to the Adviser and any Affiliated Fund Service Provider that related directly to the Fund’s operations and financial reporting. The Audit Committee requested and received information from PWC about any non-audit services that PWC rendered during the Fund’s last fiscal year to the Adviser and any Affiliated Fund Service Provider. The Committee considered this information in evaluating PWC’s independence.
| Fiscal Year Ended August 31, | Total Non-Audit Fees Billed to Fund (A) | Total Non-Audit Fees billed to Adviser and Affiliated Fund Service Providers (engagements related directly to the operations and financial reporting of the Fund) (B) | Total Non-Audit Fees billed to Adviser and Affiliated Fund Service Providers (all other engagements) (C) | Total of (A), (B) and (C) | ||||||||||||
| 2014 | $ | 0 | $ | 63,439 | $ | 0 | $ | 63,439 | ||||||||
| 2013 | $ | 0 | $ | 66,535 | $ | 0 | $ | 66,535 | ||||||||
Audit Committee Pre-Approval Policies and Procedures. Generally, each Fund’s Audit Committee must pre approve (i) all services to be performed for a Fund by a Fund’s Independent Registered Public Accounting Firm and (ii) all non-audit services to be performed by a Fund’s Independent Registered Public Accounting Firm for the DIMA Entities with respect to operations and financial reporting of the Fund, except that the Chairperson or Vice Chairperson of each Fund’s Audit Committee may grant the pre-approval for non-audit services described in items (i) and (ii) above for non-prohibited services for engagements of less than $100,000. All such delegated pre approvals shall be presented to each Fund’s Audit Committee no later than the next Audit Committee meeting.
There were no amounts that were approved by the Audit Committee pursuant to the de minimis exception under Rule 2-01 of Regulation S-X.
According to the registrant’s principal Independent Registered Public Accounting Firm, substantially all of the principal Independent Registered Public Accounting Firm's hours spent on auditing the registrant's financial statements were attributed to work performed by full-time permanent employees of the principal Independent Registered Public Accounting Firm.
***
DEUTSCHE LIFECOMPASS 2015 FUND
FORM N-CSR DISCLOSURE RE: AUDIT FEES
The following table shows the amount of fees that PricewaterhouseCoopers, LLP (“PWC”), the Fund’s independent registered public accounting firm, billed to the Fund during the Fund’s last two fiscal years. The Audit Committee approved in advance all audit services and non-audit services that PWC provided to the Fund.
Services that the Fund’s Independent Registered Public Accounting Firm Billed to the Fund
| Fiscal Year Ended August 31, | Audit Fees Billed to Fund | Audit-Related Fees Billed to Fund | Tax Fees Billed to Fund | All Other Fees Billed to Fund | ||||||||||||
| 2014 | $ | 40,940 | $ | 0 | $ | 0 | $ | 0 | ||||||||
| 2013 | $ | 39,147 | $ | 0 | $ | 0 | $ | 0 | ||||||||
Services that the Fund’s Independent Registered Public Accounting Firm Billed to the Adviser and Affiliated Fund Service Providers
The following table shows the amount of fees billed by PWC to Deutsche Investment Management Americas Inc. (“DIMA” or the “Adviser”), and any entity controlling, controlled by or under common control with DIMA (“Control Affiliate”) that provides ongoing services to the Fund (“Affiliated Fund Service Provider”), for engagements directly related to the Fund’s operations and financial reporting, during the Fund’s last two fiscal years.
| Fiscal Year Ended August 31, | Audit-Related Fees Billed to Adviser and Affiliated Fund Service Providers | Tax Fees Billed to Adviser and Affiliated Fund Service Providers | All Other Fees Billed to Adviser and Affiliated Fund Service Providers | |||||||||
| 2014 | $ | 0 | $ | 63,439 | $ | 0 | ||||||
| 2013 | $ | 0 | $ | 66,535 | $ | 0 | ||||||
The “Tax Fees Billed to the Advisor” were billed for services associated with foreign tax filings.
Non-Audit Services
The following table shows the amount of fees that PWC billed during the Fund’s last two fiscal years for non-audit services. The Audit Committee pre-approved all non-audit services that PWC provided to the Adviser and any Affiliated Fund Service Provider that related directly to the Fund’s operations and financial reporting. The Audit Committee requested and received information from PWC about any non-audit services that PWC rendered during the Fund’s last fiscal year to the Adviser and any Affiliated Fund Service Provider. The Committee considered this information in evaluating PWC’s independence.
| Fiscal Year Ended August 31, | Total Non-Audit Fees Billed to Fund (A) | Total Non-Audit Fees billed to Adviser and Affiliated Fund Service Providers (engagements related directly to the operations and financial reporting of the Fund) (B) | Total Non-Audit Fees billed to Adviser and Affiliated Fund Service Providers (all other engagements) (C) | Total of (A), (B) and (C) | ||||||||||||
| 2014 | $ | 0 | $ | 63,439 | $ | 0 | $ | 63,439 | ||||||||
| 2013 | $ | 0 | $ | 66,535 | $ | 0 | $ | 66,535 | ||||||||
Audit Committee Pre-Approval Policies and Procedures. Generally, each Fund’s Audit Committee must pre approve (i) all services to be performed for a Fund by a Fund’s Independent Registered Public Accounting Firm and (ii) all non-audit services to be performed by a Fund’s Independent Registered Public Accounting Firm for the DIMA Entities with respect to operations and financial reporting of the Fund, except that the Chairperson or Vice Chairperson of each Fund’s Audit Committee may grant the pre-approval for non-audit services described in items (i) and (ii) above for non-prohibited services for engagements of less than $100,000. All such delegated pre approvals shall be presented to each Fund’s Audit Committee no later than the next Audit Committee meeting.
There were no amounts that were approved by the Audit Committee pursuant to the de minimis exception under Rule 2-01 of Regulation S-X.
According to the registrant’s principal Independent Registered Public Accounting Firm, substantially all of the principal Independent Registered Public Accounting Firm's hours spent on auditing the registrant's financial statements were attributed to work performed by full-time permanent employees of the principal Independent Registered Public Accounting Firm.
***
DEUTSCHE LIFECOMPASS 2020 FUND
FORM N-CSR DISCLOSURE RE: AUDIT FEES
The following table shows the amount of fees that PricewaterhouseCoopers, LLP (“PWC”), the Fund’s independent registered public accounting firm, billed to the Fund during the Fund’s last two fiscal years. The Audit Committee approved in advance all audit services and non-audit services that PWC provided to the Fund.
Services that the Fund’s Independent Registered Public Accounting Firm Billed to the Fund
| Fiscal Year Ended August 31, | Audit Fees Billed to Fund | Audit-Related Fees Billed to Fund | Tax Fees Billed to Fund | All Other Fees Billed to Fund | ||||||||||||
| 2014 | $ | 40,940 | $ | 0 | $ | 0 | $ | 0 | ||||||||
| 2013 | $ | 39,147 | $ | 0 | $ | 0 | $ | 0 | ||||||||
Services that the Fund’s Independent Registered Public Accounting Firm Billed to the Adviser and Affiliated Fund Service Providers
The following table shows the amount of fees billed by PWC to Deutsche Investment Management Americas Inc. (“DIMA” or the “Adviser”), and any entity controlling, controlled by or under common control with DIMA (“Control Affiliate”) that provides ongoing services to the Fund (“Affiliated Fund Service Provider”), for engagements directly related to the Fund’s operations and financial reporting, during the Fund’s last two fiscal years.
| Fiscal Year Ended August 31, | Audit-Related Fees Billed to Adviser and Affiliated Fund Service Providers | Tax Fees Billed to Adviser and Affiliated Fund Service Providers | All Other Fees Billed to Adviser and Affiliated Fund Service Providers | |||||||||
| 2014 | $ | 0 | $ | 63,439 | $ | 0 | ||||||
| 2013 | $ | 0 | $ | 66,535 | $ | 0 | ||||||
The “Tax Fees Billed to the Advisor” were billed for services associated with foreign tax filings.
Non-Audit Services
The following table shows the amount of fees that PWC billed during the Fund’s last two fiscal years for non-audit services. The Audit Committee pre-approved all non-audit services that PWC provided to the Adviser and any Affiliated Fund Service Provider that related directly to the Fund’s operations and financial reporting. The Audit Committee requested and received information from PWC about any non-audit services that PWC rendered during the Fund’s last fiscal year to the Adviser and any Affiliated Fund Service Provider. The Committee considered this information in evaluating PWC’s independence.
| Fiscal Year Ended August 31, | Total Non-Audit Fees Billed to Fund (A) | Total Non-Audit Fees billed to Adviser and Affiliated Fund Service Providers (engagements related directly to the operations and financial reporting of the Fund) (B) | Total Non-Audit Fees billed to Adviser and Affiliated Fund Service Providers (all other engagements) (C) | Total of (A), (B) and (C) | ||||||||||||
| 2014 | $ | 0 | $ | 63,439 | $ | 0 | $ | 63,439 | ||||||||
| 2013 | $ | 0 | $ | 66,535 | $ | 0 | $ | 66,535 | ||||||||
Audit Committee Pre-Approval Policies and Procedures. Generally, each Fund’s Audit Committee must pre approve (i) all services to be performed for a Fund by a Fund’s Independent Registered Public Accounting Firm and (ii) all non-audit services to be performed by a Fund’s Independent Registered Public Accounting Firm for the DIMA Entities with respect to operations and financial reporting of the Fund, except that the Chairperson or Vice Chairperson of each Fund’s Audit Committee may grant the pre-approval for non-audit services described in items (i) and (ii) above for non-prohibited services for engagements of less than $100,000. All such delegated pre approvals shall be presented to each Fund’s Audit Committee no later than the next Audit Committee meeting.
There were no amounts that were approved by the Audit Committee pursuant to the de minimis exception under Rule 2-01 of Regulation S-X.
According to the registrant’s principal Independent Registered Public Accounting Firm, substantially all of the principal Independent Registered Public Accounting Firm's hours spent on auditing the registrant's financial statements were attributed to work performed by full-time permanent employees of the principal Independent Registered Public Accounting Firm.
***
DEUTSCHE LIFECOMPASS 2030 FUND
FORM N-CSR DISCLOSURE RE: AUDIT FEES
The following table shows the amount of fees that PricewaterhouseCoopers, LLP (“PWC”), the Fund’s independent registered public accounting firm, billed to the Fund during the Fund’s last two fiscal years. The Audit Committee approved in advance all audit services and non-audit services that PWC provided to the Fund.
Services that the Fund’s Independent Registered Public Accounting Firm Billed to the Fund
| Fiscal Year Ended August 31, | Audit Fees Billed to Fund | Audit-Related Fees Billed to Fund | Tax Fees Billed to Fund | All Other Fees Billed to Fund | ||||||||||||
| 2014 | $ | 40,940 | $ | 0 | $ | 0 | $ | 0 | ||||||||
| 2013 | $ | 39,147 | $ | 0 | $ | 0 | $ | 0 | ||||||||
Services that the Fund’s Independent Registered Public Accounting Firm Billed to the Adviser and Affiliated Fund Service Providers
The following table shows the amount of fees billed by PWC to Deutsche Investment Management Americas Inc. (“DIMA” or the “Adviser”), and any entity controlling, controlled by or under common control with DIMA (“Control Affiliate”) that provides ongoing services to the Fund (“Affiliated Fund Service Provider”), for engagements directly related to the Fund’s operations and financial reporting, during the Fund’s last two fiscal years.
| Fiscal Year Ended August 31, | Audit-Related Fees Billed to Adviser and Affiliated Fund Service Providers | Tax Fees Billed to Adviser and Affiliated Fund Service Providers | All Other Fees Billed to Adviser and Affiliated Fund Service Providers | |||||||||
| 2014 | $ | 0 | $ | 63,439 | $ | 0 | ||||||
| 2013 | $ | 0 | $ | 66,535 | $ | 0 | ||||||
The “Tax Fees Billed to the Advisor” were billed for services associated with foreign tax filings.
Non-Audit Services
The following table shows the amount of fees that PWC billed during the Fund’s last two fiscal years for non-audit services. The Audit Committee pre-approved all non-audit services that PWC provided to the Adviser and any Affiliated Fund Service Provider that related directly to the Fund’s operations and financial reporting. The Audit Committee requested and received information from PWC about any non-audit services that PWC rendered during the Fund’s last fiscal year to the Adviser and any Affiliated Fund Service Provider. The Committee considered this information in evaluating PWC’s independence.
| Fiscal Year Ended August 31, | Total Non-Audit Fees Billed to Fund (A) | Total Non-Audit Fees billed to Adviser and Affiliated Fund Service Providers (engagements related directly to the operations and financial reporting of the Fund) (B) | Total Non-Audit Fees billed to Adviser and Affiliated Fund Service Providers (all other engagements) (C) | Total of (A), (B) and (C) | ||||||||||||
| 2014 | $ | 0 | $ | 63,439 | $ | 0 | $ | 63,439 | ||||||||
| 2013 | $ | 0 | $ | 66,535 | $ | 0 | $ | 66,535 | ||||||||
Audit Committee Pre-Approval Policies and Procedures. Generally, each Fund’s Audit Committee must pre approve (i) all services to be performed for a Fund by a Fund’s Independent Registered Public Accounting Firm and (ii) all non-audit services to be performed by a Fund’s Independent Registered Public Accounting Firm for the DIMA Entities with respect to operations and financial reporting of the Fund, except that the Chairperson or Vice Chairperson of each Fund’s Audit Committee may grant the pre-approval for non-audit services described in items (i) and (ii) above for non-prohibited services for engagements of less than $100,000. All such delegated pre approvals shall be presented to each Fund’s Audit Committee no later than the next Audit Committee meeting.
There were no amounts that were approved by the Audit Committee pursuant to the de minimis exception under Rule 2-01 of Regulation S-X.
According to the registrant’s principal Independent Registered Public Accounting Firm, substantially all of the principal Independent Registered Public Accounting Firm's hours spent on auditing the registrant's financial statements were attributed to work performed by full-time permanent employees of the principal Independent Registered Public Accounting Firm.
***
DEUTSCHE LIFECOMPASS 2040 FUND
FORM N-CSR DISCLOSURE RE: AUDIT FEES
The following table shows the amount of fees that PricewaterhouseCoopers, LLP (“PWC”), the Fund’s independent registered public accounting firm, billed to the Fund during the Fund’s last two fiscal years. The Audit Committee approved in advance all audit services and non-audit services that PWC provided to the Fund.
Services that the Fund’s Independent Registered Public Accounting Firm Billed to the Fund
| Fiscal Year Ended August 31, | Audit Fees Billed to Fund | Audit-Related Fees Billed to Fund | Tax Fees Billed to Fund | All Other Fees Billed to Fund | ||||||||||||
| 2014 | $ | 40,940 | $ | 0 | $ | 0 | $ | 0 | ||||||||
| 2013 | $ | 39,147 | $ | 0 | $ | 0 | $ | 0 | ||||||||
Services that the Fund’s Independent Registered Public Accounting Firm Billed to the Adviser and Affiliated Fund Service Providers
The following table shows the amount of fees billed by PWC to Deutsche Investment Management Americas Inc. (“DIMA” or the “Adviser”), and any entity controlling, controlled by or under common control with DIMA (“Control Affiliate”) that provides ongoing services to the Fund (“Affiliated Fund Service Provider”), for engagements directly related to the Fund’s operations and financial reporting, during the Fund’s last two fiscal years.
| Fiscal Year Ended August 31, | Audit-Related Fees Billed to Adviser and Affiliated Fund Service Providers | Tax Fees Billed to Adviser and Affiliated Fund Service Providers | All Other Fees Billed to Adviser and Affiliated Fund Service Providers | |||||||||
| 2014 | $ | 0 | $ | 63,439 | $ | 0 | ||||||
| 2013 | $ | 0 | $ | 66,535 | $ | 0 | ||||||
The “Tax Fees Billed to the Advisor” were billed for services associated with foreign tax filings.
Non-Audit Services
The following table shows the amount of fees that PWC billed during the Fund’s last two fiscal years for non-audit services. The Audit Committee pre-approved all non-audit services that PWC provided to the Adviser and any Affiliated Fund Service Provider that related directly to the Fund’s operations and financial reporting. The Audit Committee requested and received information from PWC about any non-audit services that PWC rendered during the Fund’s last fiscal year to the Adviser and any Affiliated Fund Service Provider. The Committee considered this information in evaluating PWC’s independence.
| Fiscal Year Ended August 31, | Total Non-Audit Fees Billed to Fund (A) | Total Non-Audit Fees billed to Adviser and Affiliated Fund Service Providers (engagements related directly to the operations and financial reporting of the Fund) (B) | Total Non-Audit Fees billed to Adviser and Affiliated Fund Service Providers (all other engagements) (C) | Total of (A), (B) and (C) | ||||||||||||
| 2014 | $ | 0 | $ | 63,439 | $ | 0 | $ | 63,439 | ||||||||
| 2013 | $ | 0 | $ | 66,535 | $ | 0 | $ | 66,535 | ||||||||
Audit Committee Pre-Approval Policies and Procedures. Generally, each Fund’s Audit Committee must pre approve (i) all services to be performed for a Fund by a Fund’s Independent Registered Public Accounting Firm and (ii) all non-audit services to be performed by a Fund’s Independent Registered Public Accounting Firm for the DIMA Entities with respect to operations and financial reporting of the Fund, except that the Chairperson or Vice Chairperson of each Fund’s Audit Committee may grant the pre-approval for non-audit services described in items (i) and (ii) above for non-prohibited services for engagements of less than $100,000. All such delegated pre approvals shall be presented to each Fund’s Audit Committee no later than the next Audit Committee meeting.
There were no amounts that were approved by the Audit Committee pursuant to the de minimis exception under Rule 2-01 of Regulation S-X.
According to the registrant’s principal Independent Registered Public Accounting Firm, substantially all of the principal Independent Registered Public Accounting Firm's hours spent on auditing the registrant's financial statements were attributed to work performed by full-time permanent employees of the principal Independent Registered Public Accounting Firm.
***
| ITEM 5. | AUDIT COMMITTEE OF LISTED REGISTRANTS | |
| Not applicable | ||
| ITEM 6. | SCHEDULE OF INVESTMENTS | |
| Not applicable | ||
| ITEM 7. | DISCLOSURE OF PROXY VOTING POLICIES AND PROCEDURES FOR CLOSED-END MANAGEMENT INVESTMENT COMPANIES | |
| Not applicable | ||
| ITEM 8. | PORTFOLIO MANAGERS OF CLOSED-END MANAGEMENT INVESTMENT COMPANIES | |
| Not applicable | ||
| ITEM 9. | PURCHASES OF EQUITY SECURITIES BY CLOSED-END MANAGEMENT INVESTMENT COMPANY AND AFFILIATED PURCHASERS | |
| Not applicable | ||
| ITEM 10. | SUBMISSION OF MATTERS TO A VOTE OF SECURITY HOLDERS | |
| There were no material changes to the procedures by which shareholders may recommend nominees to the Fund’s Board. The primary function of the Nominating and Governance Committee is to identify and recommend individuals for membership on the Board and oversee the administration of the Board Governance Guidelines. Shareholders may recommend candidates for Board positions by forwarding their correspondence by U.S. mail or courier service to Kenneth C. Froewiss, Independent Chairman, Deutsche Mutual Funds, P.O. Box 390601, Cambridge, MA 02139. | ||
| ITEM 11. | CONTROLS AND PROCEDURES | |
| (a) | The Chief Executive and Financial Officers concluded that the Registrant’s Disclosure Controls and Procedures are effective based on the evaluation of the Disclosure Controls and Procedures as of a date within 90 days of the filing date of this report. | |
| (b) | There have been no changes in the registrant’s internal control over financial reporting that occurred during the second fiscal quarter of the period covered by this report that has materially affected, or is reasonably likely to materially affect, the registrant’s internal controls over financial reporting. | |
| ITEM 12. | EXHIBITS | |
| (a)(1) | Code of Ethics pursuant to Item 2 of Form N-CSR is filed and attached hereto as EX-99.CODE ETH. | |
| (a)(2) | Certification pursuant to Rule 30a-2(a) under the Investment Company Act of 1940 (17 CFR 270.30a-2(a)) is filed and attached hereto as Exhibit 99.CERT. | |
| (b) | Certification pursuant to Rule 30a-2(b) under the Investment Company Act of 1940 (17 CFR 270.30a-2(b)) is furnished and attached hereto as Exhibit 99.906CERT. | |
SIGNATURES
Pursuant to the requirements of the Securities Exchange Act of 1934 and the Investment Company Act of 1940, the registrant has duly caused this report to be signed on its behalf by the undersigned, thereunto duly authorized.
| Registrant: | Deutsche Target Date Series |
| By: | /s/Brian E. Binder Brian E. Binder President |
| Date: | October 30, 2014 |
Pursuant to the requirements of the Securities Exchange Act of 1934 and the Investment Company Act of 1940, this report has been signed below by the following persons on behalf of the registrant and in the capacities and on the dates indicated.
| By: | /s/Brian E. Binder Brian E. Binder President |
| Date: | October 30, 2014 |
| By: | /s/Paul Schubert Paul Schubert Chief Financial Officer and Treasurer |
| Date: | October 30, 2014 |