UNITED STATES
SECURITIES AND EXCHANGE COMMISSION
WASHINGTON, D. C. 20549
FORM N-CSRS
Investment Company Act file number: 811-08606
Deutsche DWS Asset Allocation Trust
(Exact Name of Registrant as Specified in Charter)
875 Third Avenue
New York, NY 10022-6225
(Address of Principal Executive Offices) (Zip Code)
Registrant’s Telephone Number, including Area Code: (212) 454-4500
Diane Kenneally
100 Summer Street
Boston, MA 02110
(Name and Address of Agent for Service)
| Date of fiscal year end: | 8/31 |
| Date of reporting period: | 2/28/2022 |
| ITEM 1. | REPORT TO STOCKHOLDERS |
| (a) | |


| 2 | | | DWS Equity Sector Strategy Fund |


| DWS Equity Sector Strategy Fund | | | 3 |
| Performance Summary | February 28, 2022 (Unaudited) |
| Class A | 6-Month ‡ | 1-Year | 5-Year | 10-Year |
| Average Annual Total Returns as of 2/28/22 | ||||
| Unadjusted for Sales Charge | –4.09% | 7.95% | 8.25% | 6.20% |
| Adjusted for the Maximum Sales Charge (max 5.75% load) | –9.61% | 1.74% | 6.98% | 5.57% |
| S&P 500® Index† | –2.62% | 16.39% | 15.17% | 14.59% |
| Average Annual Total Returns as of 12/31/21 (most recent calendar quarter end) | ||||
| Unadjusted for Sales Charge | 20.38% | 10.85% | 7.89% | |
| Adjusted for the Maximum Sales Charge (max 5.75% load) | 13.46% | 9.54% | 7.26% | |
| S&P 500® Index† | 28.71% | 18.47% | 16.55% | |
| Class C | 6-Month ‡ | 1-Year | 5-Year | 10-Year |
| Average Annual Total Returns as of 2/28/22 | ||||
| Unadjusted for Sales Charge | –4.47% | 7.08% | 7.42% | 5.40% |
| Adjusted for the Maximum Sales Charge (max 1.00% CDSC) | –5.19% | 7.08% | 7.42% | 5.40% |
| S&P 500® Index† | –2.62% | 16.39% | 15.17% | 14.59% |
| Average Annual Total Returns as of 12/31/21 (most recent calendar quarter end) | ||||
| Unadjusted for Sales Charge | 19.37% | 10.01% | 7.09% | |
| Adjusted for the Maximum Sales Charge (max 1.00% CDSC) | 19.37% | 10.01% | 7.09% | |
| S&P 500® Index† | 28.71% | 18.47% | 16.55% | |
| Class S | 6-Month ‡ | 1-Year | 5-Year | 10-Year |
| Average Annual Total Returns as of 2/28/22 | ||||
| No Sales Charges | –3.99% | 8.24% | 8.52% | 6.46% |
| S&P 500® Index† | –2.62% | 16.39% | 15.17% | 14.59% |
| Average Annual Total Returns as of 12/31/21 (most recent calendar quarter end) | ||||
| No Sales Charges | 20.68% | 11.13% | 8.16% | |
| S&P 500® Index† | 28.71% | 18.47% | 16.55% | |
| 4 | | | DWS Equity Sector Strategy Fund |
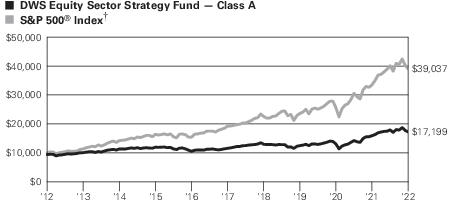
| † | S&P 500 Index is an unmanaged, capitalization-weighted index of 500 stocks. The index is designed to measure performance of the broad domestic economy through changes in the aggregate market value of 500 stocks representing all major industries. |
| ‡ | Total returns shown for periods less than one year are not annualized. |
| DWS Equity Sector Strategy Fund | | | 5 |
| Class A | Class C | Class S | |
| Net Asset Value | |||
| 2/28/22 | $14.24 | $14.02 | $14.28 |
| 8/31/21 | $19.81 | $19.65 | $19.83 |
| Distribution Information as of 2/28/22 | |||
| Capital Gain Distributions | $ 5.08 | $ 5.08 | $ 5.08 |
| 6 | | | DWS Equity Sector Strategy Fund |
| DWS Equity Sector Strategy Fund | | | 7 |
| Portfolio Summary | (Unaudited) |
| Asset Allocation (As a % of Investment Portfolio) | 2/28/22 | 8/31/21 |
| Common Stocks | 97% | 97% |
| Cash Equivalents | 3% | 3% |
| Exchange-Traded Funds | 0% | — |
| 100% | 100% |
| Sector Diversification (As a % of Common Stocks) | 2/28/22 | 8/31/21 |
| Information Technology | 28% | 29% |
| Health Care | 18% | 18% |
| Financials | 12% | 14% |
| Communication Services | 11% | 11% |
| Consumer Discretionary | 11% | 12% |
| Industrials | 8% | 5% |
| Consumer Staples | 5% | 5% |
| Real Estate | 3% | 3% |
| Utilities | 3% | 3% |
| Energy | 1% | — |
| 100% | 100% |
| 8 | | | DWS Equity Sector Strategy Fund |
| Ten Largest Equity Holdings at February 28, 2022 (28.9% of Net Assets) | |
| 1 Apple, Inc. | 6.6% |
| Designs, manufactures and markets personal computers and related computing and mobile-communication devices | |
| 2 Microsoft Corp. | 5.8% |
| Develops, manufactures, licenses, sells and supports software products | |
| 3 Alphabet, Inc. | 4.4% |
| Holding company with subsidiaries that provide Web-based search, maps, hardware products and various software applications | |
| 4 Amazon.com, Inc. | 3.3% |
| Online retailer offering a wide range of products | |
| 5 Johnson & Johnson | 1.6% |
| Provider of health care products | |
| 6 Berkshire Hathaway, Inc. | 1.6% |
| Holding company of insurance business and a variety of other businesses | |
| 7 NVIDIA Corp. | 1.5% |
| Designs, develops and markets three dimensional (3D) graphic processors | |
| 8 Meta Platforms, Inc. | 1.4% |
| Operator of social networking Web site | |
| 9 UnitedHealth Group, Inc. | 1.4% |
| Operator of organized health systems | |
| 10 JPMorgan Chase & Co. | 1.3% |
| Provider of global financial services | |
| DWS Equity Sector Strategy Fund | | | 9 |
| Investment Portfolio | as of February 28, 2022 (Unaudited) |
| Shares | Value ($) | ||
| Common Stocks 96.1% | |||
| Communication Services 10.3% | |||
| Diversified Telecommunication Services 1.3% | |||
| AT&T, Inc. | 18,845 | 446,438 | |
| Lumen Technologies, Inc. | 2,486 | 25,755 | |
| Verizon Communications, Inc. | 10,948 | 587,579 | |
| 1,059,772 | |||
| Entertainment 1.7% | |||
| Activision Blizzard, Inc. | 1,541 | 125,591 | |
| Electronic Arts, Inc. | 686 | 89,242 | |
| Live Nation Entertainment, Inc.* | 335 | 40,475 | |
| Netflix, Inc.* | 1,135 | 447,780 | |
| Take-Two Interactive Software, Inc.* | 284 | 46,008 | |
| Walt Disney Co.* | 4,515 | 670,297 | |
| 1,419,393 | |||
| Interactive Media & Services 6.0% | |||
| Alphabet, Inc. “A” * | 707 | 1,909,706 | |
| Alphabet, Inc. “C” * | 657 | 1,772,468 | |
| Match Group, Inc.* | 678 | 75,590 | |
| Meta Platforms, Inc. “A” * | 5,654 | 1,193,164 | |
| Twitter, Inc.* | 1,887 | 67,083 | |
| 5,018,011 | |||
| Media 1.3% | |||
| Charter Communications, Inc. “A” * | 380 | 228,676 | |
| Comcast Corp. “A” | 13,839 | 647,112 | |
| Fox Corp. “A” | 971 | 40,617 | |
| Interpublic Group of Companies, Inc. | 1,200 | 44,160 | |
| Omnicom Group, Inc. | 632 | 53,018 | |
| Paramount Global “B” | 1,870 | 57,241 | |
| 1,070,824 | |||
| Consumer Discretionary 10.2% | |||
| Auto Components 0.5% | |||
| Aptiv PLC* | 2,358 | 305,219 | |
| BorgWarner, Inc. | 2,082 | 85,383 | |
| 390,602 | |||
| Hotels, Restaurants & Leisure 2.8% | |||
| Booking Holdings, Inc.* | 135 | 293,254 | |
| 10 | | | DWS Equity Sector Strategy Fund |
| Shares | Value ($) | ||
| Caesars Entertainment, Inc.* | 716 | 60,280 | |
| Carnival Corp.* | 2,689 | 54,667 | |
| Chipotle Mexican Grill, Inc.* | 91 | 138,625 | |
| Darden Restaurants, Inc. | 426 | 61,864 | |
| Domino’s Pizza, Inc. | 118 | 51,001 | |
| Expedia Group, Inc.* | 485 | 95,113 | |
| Hilton Worldwide Holdings, Inc.* | 914 | 136,058 | |
| Las Vegas Sands Corp.* | 1,098 | 47,060 | |
| Marriott International, Inc. “A” * | 894 | 152,105 | |
| McDonald’s Corp. | 2,404 | 588,427 | |
| MGM Resorts International | 1,264 | 55,983 | |
| Norwegian Cruise Line Holdings Ltd.* | 1,240 | 24,168 | |
| Royal Caribbean Cruises Ltd.* | 734 | 59,248 | |
| Starbucks Corp. | 3,871 | 355,319 | |
| Wynn Resorts Ltd.* | 338 | 29,244 | |
| Yum! Brands, Inc. | 944 | 115,715 | |
| 2,318,131 | |||
| Household Durables 1.1% | |||
| D.R. Horton, Inc. | 2,337 | 199,580 | |
| Garmin Ltd. | 1,030 | 113,753 | |
| Lennar Corp. “A” | 1,973 | 177,333 | |
| Mohawk Industries, Inc.* | 383 | 53,919 | |
| Newell Brands, Inc. | 2,594 | 61,608 | |
| NVR, Inc.* | 23 | 114,044 | |
| PulteGroup, Inc. | 1,802 | 89,487 | |
| Whirlpool Corp. | 427 | 85,942 | |
| 895,666 | |||
| Internet & Direct Marketing Retail 3.4% | |||
| Amazon.com, Inc.* | 894 | 2,745,707 | |
| eBay, Inc. | 1,295 | 70,694 | |
| Etsy, Inc.* | 255 | 39,497 | |
| 2,855,898 | |||
| Specialty Retail 1.5% | |||
| AutoZone, Inc.* | 36 | 67,082 | |
| Best Buy Co., Inc. | 369 | 35,660 | |
| CarMax, Inc.* | 274 | 29,956 | |
| Home Depot, Inc. | 1,759 | 555,545 | |
| Lowe’s Companies, Inc. | 1,161 | 256,651 | |
| O’Reilly Automotive, Inc.* | 113 | 73,364 | |
| Ross Stores, Inc. | 602 | 55,017 | |
| DWS Equity Sector Strategy Fund | | | 11 |
| Shares | Value ($) | ||
| TJX Companies, Inc. | 2,041 | 134,910 | |
| Tractor Supply Co. | 187 | 38,109 | |
| Ulta Beauty, Inc.* | 90 | 33,705 | |
| 1,279,999 | |||
| Textiles, Apparel & Luxury Goods 0.9% | |||
| NIKE, Inc. “B” | 4,421 | 603,688 | |
| Tapestry, Inc. | 967 | 39,550 | |
| VF Corp. | 1,136 | 65,911 | |
| 709,149 | |||
| Consumer Staples 5.0% | |||
| Beverages 1.5% | |||
| Brown-Forman Corp. “B” | 408 | 26,614 | |
| Coca-Cola Co. | 8,581 | 534,081 | |
| Constellation Brands, Inc. “A” | 367 | 79,133 | |
| Monster Beverage Corp.* | 853 | 71,993 | |
| PepsiCo, Inc. | 3,057 | 500,553 | |
| 1,212,374 | |||
| Food & Staples Retailing 1.1% | |||
| Costco Wholesale Corp. | 785 | 407,611 | |
| Kroger Co. | 1,179 | 55,177 | |
| Sysco Corp. | 894 | 77,868 | |
| Walgreens Boots Alliance, Inc. | 1,256 | 57,889 | |
| Walmart, Inc. | 2,494 | 337,089 | |
| 935,634 | |||
| Household Products 1.1% | |||
| Church & Dwight Co., Inc. | 424 | 41,489 | |
| Clorox Co. | 218 | 31,782 | |
| Colgate-Palmolive Co. | 1,454 | 111,885 | |
| Kimberly-Clark Corp. | 588 | 76,528 | |
| Procter & Gamble Co. | 4,238 | 660,662 | |
| 922,346 | |||
| Personal Products 0.2% | |||
| Estee Lauder Companies, Inc. “A” | 517 | 153,202 | |
| Tobacco 1.1% | |||
| Altria Group, Inc. | 6,456 | 331,128 | |
| Philip Morris International, Inc. | 5,521 | 558,008 | |
| 889,136 | |||
| 12 | | | DWS Equity Sector Strategy Fund |
| Shares | Value ($) | ||
| Energy 1.1% | |||
| Energy Equipment & Services | |||
| Baker Hughes Co. | 7,025 | 206,394 | |
| Halliburton Co. | 7,056 | 236,588 | |
| Schlumberger NV | 11,082 | 434,858 | |
| 877,840 | |||
| Financials 11.6% | |||
| Banks 4.8% | |||
| Bank of America Corp. | 18,313 | 809,435 | |
| Citigroup, Inc. | 4,993 | 295,735 | |
| Citizens Financial Group, Inc. | 1,059 | 55,513 | |
| Comerica, Inc. | 327 | 31,225 | |
| Fifth Third Bancorp. | 1,707 | 81,663 | |
| First Republic Bank | 470 | 81,432 | |
| Huntington Bancshares, Inc. | 3,588 | 55,686 | |
| JPMorgan Chase & Co. | 7,573 | 1,073,851 | |
| KeyCorp. | 2,322 | 58,212 | |
| M&T Bank Corp. | 321 | 58,496 | |
| People’s United Financial, Inc. | 1,067 | 22,492 | |
| PNC Financial Services Group, Inc. | 1,063 | 211,803 | |
| Regions Financial Corp. | 2,397 | 57,983 | |
| Signature Bank | 153 | 52,768 | |
| SVB Financial Group* | 152 | 92,112 | |
| Truist Financial Corp. | 3,289 | 204,642 | |
| U.S. Bancorp. | 3,370 | 190,540 | |
| Wells Fargo & Co. | 10,026 | 535,088 | |
| Zions Bancorp NA | 391 | 27,718 | |
| 3,996,394 | |||
| Capital Markets 2.6% | |||
| Bank of New York Mellon Corp. | 1,608 | 85,465 | |
| BlackRock, Inc. | 305 | 226,886 | |
| Charles Schwab Corp. | 3,262 | 275,509 | |
| CME Group, Inc. | 751 | 177,634 | |
| FactSet Research Systems, Inc. | 79 | 32,081 | |
| Intercontinental Exchange, Inc. | 1,181 | 151,310 | |
| MarketAxess Holdings, Inc. | 81 | 30,896 | |
| Moody’s Corp. | 348 | 112,066 | |
| Morgan Stanley | 3,161 | 286,829 | |
| MSCI, Inc. | 176 | 88,297 | |
| DWS Equity Sector Strategy Fund | | | 13 |
| Shares | Value ($) | ||
| Nasdaq, Inc. | 248 | 42,445 | |
| Northern Trust Corp. | 439 | 50,002 | |
| Raymond James Financial, Inc. | 401 | 43,970 | |
| S&P Global, Inc. | 514 | 193,110 | |
| State Street Corp. | 786 | 67,069 | |
| T. Rowe Price Group, Inc. | 482 | 69,678 | |
| The Goldman Sachs Group, Inc. | 764 | 260,746 | |
| 2,193,993 | |||
| Diversified Financial Services 1.6% | |||
| Berkshire Hathaway, Inc. “B” * | 3,990 | 1,282,586 | |
| Insurance 2.6% | |||
| Aflac, Inc. | 1,755 | 107,213 | |
| Allstate Corp. | 827 | 101,192 | |
| American International Group, Inc. | 2,418 | 148,078 | |
| Aon PLC “A” | 633 | 184,925 | |
| Arthur J. Gallagher & Co. | 602 | 95,230 | |
| Brown & Brown, Inc. | 683 | 46,178 | |
| Chubb Ltd. | 1,242 | 252,921 | |
| Cincinnati Financial Corp. | 437 | 53,659 | |
| Everest Re Group Ltd. | 113 | 33,699 | |
| Globe Life, Inc. | 268 | 27,057 | |
| Hartford Financial Services Group, Inc. | 991 | 68,855 | |
| Lincoln National Corp. | 497 | 33,508 | |
| Loews Corp. | 581 | 35,639 | |
| Marsh & McLennan Companies, Inc. | 1,469 | 228,297 | |
| MetLife, Inc. | 2,054 | 138,748 | |
| Principal Financial Group, Inc. | 716 | 50,578 | |
| Progressive Corp. | 1,674 | 177,327 | |
| Prudential Financial, Inc. | 1,099 | 122,714 | |
| Travelers Companies, Inc. | 703 | 120,796 | |
| W.R. Berkley Corp. | 404 | 36,481 | |
| Willis Towers Watson PLC | 360 | 80,028 | |
| 2,143,123 | |||
| Health Care 17.3% | |||
| Biotechnology 3.3% | |||
| AbbVie, Inc. | 6,940 | 1,025,524 | |
| Amgen, Inc. | 2,240 | 507,315 | |
| Biogen, Inc.* | 594 | 125,340 | |
| Gilead Sciences, Inc. | 5,051 | 305,081 | |
| Incyte Corp.* | 741 | 50,610 | |
| 14 | | | DWS Equity Sector Strategy Fund |
| Shares | Value ($) | ||
| Moderna, Inc.* | 1,529 | 234,854 | |
| Regeneron Pharmaceuticals, Inc.* | 421 | 260,330 | |
| Vertex Pharmaceuticals, Inc.* | 1,018 | 234,160 | |
| 2,743,214 | |||
| Health Care Equipment & Supplies 3.4% | |||
| Abbott Laboratories | 4,534 | 546,891 | |
| ABIOMED, Inc.* | 119 | 36,978 | |
| Align Technology, Inc.* | 199 | 101,781 | |
| Baxter International, Inc. | 1,266 | 107,572 | |
| Becton, Dickinson & Co. | 733 | 198,848 | |
| Boston Scientific Corp.* | 3,661 | 161,706 | |
| DENTSPLY SIRONA, Inc. | 562 | 30,427 | |
| DexCom, Inc.* | 255 | 105,547 | |
| Edwards Lifesciences Corp.* | 1,614 | 181,365 | |
| Hologic, Inc.* | 644 | 45,833 | |
| IDEXX Laboratories, Inc.* | 219 | 116,585 | |
| Intuitive Surgical, Inc.* | 941 | 273,200 | |
| Medtronic PLC | 3,442 | 361,376 | |
| ResMed, Inc. | 387 | 95,492 | |
| STERIS PLC | 258 | 61,920 | |
| Stryker Corp. | 871 | 229,378 | |
| Teleflex, Inc. | 119 | 40,021 | |
| The Cooper Companies, Inc. | 128 | 52,355 | |
| Zimmer Biomet Holdings, Inc. | 533 | 67,792 | |
| 2,815,067 | |||
| Health Care Providers & Services 3.3% | |||
| AmerisourceBergen Corp. | 379 | 54,019 | |
| Anthem, Inc. | 610 | 275,628 | |
| Cardinal Health, Inc. | 708 | 38,239 | |
| Centene Corp.* | 1,486 | 122,773 | |
| Cigna Corp. | 833 | 198,071 | |
| CVS Health Corp. | 3,339 | 346,087 | |
| HCA Healthcare, Inc. | 616 | 154,191 | |
| Henry Schein, Inc.* | 352 | 30,406 | |
| Humana, Inc. | 323 | 140,285 | |
| Laboratory Corp. of America Holdings* | 242 | 65,645 | |
| McKesson Corp. | 386 | 106,135 | |
| Quest Diagnostics, Inc. | 313 | 41,088 | |
| DWS Equity Sector Strategy Fund | | | 15 |
| Shares | Value ($) | ||
| UnitedHealth Group, Inc. | 2,383 | 1,133,998 | |
| Universal Health Services, Inc. “B” | 187 | 26,915 | |
| 2,733,480 | |||
| Health Care Technology 0.1% | |||
| Cerner Corp. | 1,096 | 102,202 | |
| Life Sciences Tools & Services 2.1% | |||
| Agilent Technologies, Inc. | 799 | 104,158 | |
| Bio-Rad Laboratories, Inc. “A” * | 58 | 36,306 | |
| Bio-Techne Corp. | 104 | 43,619 | |
| Charles River Laboratories International, Inc.* | 135 | 39,307 | |
| Danaher Corp. | 1,657 | 454,697 | |
| Illumina, Inc.* | 423 | 138,152 | |
| IQVIA Holdings, Inc.* | 500 | 115,060 | |
| Mettler-Toledo International, Inc.* | 60 | 84,524 | |
| PerkinElmer, Inc. | 332 | 59,630 | |
| Thermo Fisher Scientific, Inc. | 1,017 | 553,248 | |
| Waters Corp.* | 160 | 50,677 | |
| West Pharmaceutical Services, Inc. | 194 | 75,093 | |
| 1,754,471 | |||
| Pharmaceuticals 5.1% | |||
| Bristol-Myers Squibb Co. | 6,792 | 466,407 | |
| Catalent, Inc.* | 545 | 55,612 | |
| Eli Lilly & Co. | 2,399 | 599,630 | |
| Johnson & Johnson | 8,087 | 1,330,877 | |
| Merck & Co., Inc. | 7,710 | 590,432 | |
| Pfizer, Inc. | 17,431 | 818,211 | |
| Viatris, Inc. | 3,738 | 41,155 | |
| Zoetis, Inc. | 1,472 | 285,053 | |
| 4,187,377 | |||
| Industrials 7.3% | |||
| Aerospace & Defense 2.4% | |||
| Boeing Co.* | 1,803 | 370,228 | |
| General Dynamics Corp. | 760 | 178,182 | |
| Howmet Aerospace, Inc. | 1,277 | 45,870 | |
| L3Harris Technologies, Inc. | 635 | 160,217 | |
| Lockheed Martin Corp. | 790 | 342,702 | |
| Northrop Grumman Corp. | 487 | 215,322 | |
| Raytheon Technologies Corp. | 4,950 | 508,365 | |
| 16 | | | DWS Equity Sector Strategy Fund |
| Shares | Value ($) | ||
| Textron, Inc. | 730 | 53,385 | |
| TransDigm Group, Inc.* | 174 | 115,986 | |
| 1,990,257 | |||
| Airlines 0.5% | |||
| Alaska Air Group, Inc.* | 584 | 32,786 | |
| American Airlines Group, Inc.* | 3,073 | 53,009 | |
| Delta Air Lines, Inc.* | 2,998 | 119,680 | |
| Southwest Airlines Co.* | 2,743 | 120,144 | |
| United Airlines Holdings, Inc.* | 1,525 | 67,710 | |
| 393,329 | |||
| Electrical Equipment 1.0% | |||
| AMETEK, Inc. | 966 | 125,377 | |
| Eaton Corp. PLC | 1,684 | 259,824 | |
| Emerson Electric Co. | 2,490 | 231,371 | |
| Generac Holdings, Inc.* | 270 | 85,177 | |
| Rockwell Automation, Inc. | 489 | 130,358 | |
| 832,107 | |||
| Industrial Conglomerates 1.6% | |||
| 3M Co. | 2,016 | 299,678 | |
| General Electric Co. | 3,842 | 366,950 | |
| Honeywell International, Inc. | 2,448 | 464,508 | |
| Roper Technologies, Inc. | 370 | 165,841 | |
| 1,296,977 | |||
| Machinery 1.4% | |||
| Caterpillar, Inc. | 1,203 | 225,659 | |
| Cummins, Inc. | 322 | 65,727 | |
| Deere & Co. | 623 | 224,292 | |
| Dover Corp. | 322 | 50,509 | |
| Fortive Corp. | 798 | 51,670 | |
| IDEX Corp. | 172 | 33,007 | |
| Illinois Tool Works, Inc. | 637 | 137,809 | |
| Ingersoll Rand, Inc. | 922 | 46,579 | |
| Otis Worldwide Corp. | 952 | 74,570 | |
| PACCAR, Inc. | 780 | 71,612 | |
| Parker-Hannifin Corp. | 288 | 85,360 | |
| Stanley Black & Decker, Inc. | 370 | 60,199 | |
| Westinghouse Air Brake Technologies Corp. | 429 | 39,820 | |
| Xylem, Inc. | 408 | 36,292 | |
| 1,203,105 | |||
| DWS Equity Sector Strategy Fund | | | 17 |
| Shares | Value ($) | ||
| Road & Rail 0.4% | |||
| CSX Corp. | 2,595 | 87,997 | |
| Norfolk Southern Corp. | 288 | 73,878 | |
| Old Dominion Freight Line, Inc. | 106 | 33,287 | |
| Union Pacific Corp. | 753 | 185,200 | |
| 380,362 | |||
| Information Technology 27.4% | |||
| Communications Equipment 1.1% | |||
| Arista Networks, Inc.* | 602 | 73,883 | |
| Cisco Systems, Inc. | 11,398 | 635,667 | |
| F5, Inc.* | 168 | 33,743 | |
| Juniper Networks, Inc. | 870 | 29,397 | |
| Motorola Solutions, Inc. | 455 | 100,296 | |
| 872,986 | |||
| Electronic Equipment, Instruments & Components 0.8% | |||
| Amphenol Corp. “A” | 1,749 | 132,941 | |
| CDW Corp. | 392 | 67,604 | |
| Corning, Inc. | 2,225 | 89,890 | |
| Keysight Technologies, Inc.* | 544 | 85,609 | |
| TE Connectivity Ltd. | 944 | 134,454 | |
| Teledyne Technologies, Inc.* | 136 | 58,396 | |
| Trimble, Inc.* | 729 | 50,848 | |
| Zebra Technologies Corp. “A” * | 156 | 64,481 | |
| 684,223 | |||
| IT Services 4.5% | |||
| Accenture PLC “A” | 1,511 | 477,506 | |
| Akamai Technologies, Inc.* | 385 | 41,680 | |
| Automatic Data Processing, Inc. | 1,004 | 205,258 | |
| Broadridge Financial Solutions, Inc. | 275 | 40,208 | |
| Cognizant Technology Solutions Corp. “A” | 1,253 | 107,921 | |
| EPAM Systems, Inc.* | 144 | 29,916 | |
| Fidelity National Information Services, Inc. | 1,481 | 141,036 | |
| Fiserv, Inc.* | 1,437 | 140,352 | |
| FleetCor Technologies, Inc.* | 196 | 45,903 | |
| Gartner, Inc.* | 200 | 56,084 | |
| Global Payments, Inc. | 700 | 93,366 | |
| International Business Machines Corp. | 2,135 | 261,559 | |
| Jack Henry & Associates, Inc. | 178 | 31,470 | |
| MasterCard, Inc. “A” | 2,079 | 750,145 | |
| 18 | | | DWS Equity Sector Strategy Fund |
| Shares | Value ($) | ||
| Paychex, Inc. | 769 | 91,557 | |
| PayPal Holdings, Inc.* | 2,834 | 317,210 | |
| VeriSign, Inc.* | 235 | 50,224 | |
| Visa, Inc. “A” | 3,936 | 850,648 | |
| 3,732,043 | |||
| Semiconductors & Semiconductor Equipment 5.5% | |||
| Advanced Micro Devices, Inc.* | 3,352 | 413,436 | |
| Analog Devices, Inc. | 1,092 | 175,037 | |
| Applied Materials, Inc. | 1,947 | 261,287 | |
| Broadcom, Inc. | 836 | 491,100 | |
| Enphase Energy, Inc.* | 279 | 46,509 | |
| Intel Corp. | 8,138 | 388,182 | |
| KLA Corp. | 321 | 111,868 | |
| Lam Research Corp. | 297 | 166,721 | |
| Microchip Technology, Inc. | 1,160 | 81,583 | |
| Micron Technology, Inc. | 2,307 | 205,000 | |
| Monolithic Power Systems, Inc. | 90 | 41,283 | |
| NVIDIA Corp. | 5,115 | 1,247,293 | |
| NXP Semiconductors NV | 542 | 103,045 | |
| Qorvo, Inc.* | 220 | 30,092 | |
| QUALCOMM, Inc. | 2,325 | 399,877 | |
| Skyworks Solutions, Inc. | 334 | 46,149 | |
| SolarEdge Technologies, Inc.* | 109 | 34,817 | |
| Teradyne, Inc. | 340 | 40,093 | |
| Texas Instruments, Inc. | 1,864 | 316,861 | |
| 4,600,233 | |||
| Software 8.6% | |||
| Adobe, Inc.* | 1,014 | 474,228 | |
| ANSYS, Inc.* | 189 | 61,272 | |
| Autodesk, Inc.* | 475 | 104,609 | |
| Cadence Design Systems, Inc.* | 614 | 92,978 | |
| Fortinet, Inc.* | 289 | 99,566 | |
| Intuit, Inc. | 609 | 288,891 | |
| Microsoft Corp. | 16,172 | 4,832,032 | |
| NortonLifeLock, Inc. | 1,228 | 35,587 | |
| Oracle Corp. | 3,474 | 263,920 | |
| Paycom Software, Inc.* | 105 | 35,617 | |
| salesforce.com, Inc.* | 2,105 | 443,166 | |
| ServiceNow, Inc.* | 425 | 246,466 | |
| DWS Equity Sector Strategy Fund | | | 19 |
| Shares | Value ($) | ||
| Synopsys, Inc.* | 333 | 104,026 | |
| Tyler Technologies, Inc.* | 89 | 38,115 | |
| 7,120,473 | |||
| Technology Hardware, Storage & Peripherals 6.9% | |||
| Apple, Inc. | 33,247 | 5,489,744 | |
| Hewlett Packard Enterprise Co. | 2,775 | 44,178 | |
| HP, Inc. | 2,463 | 84,629 | |
| NetApp, Inc. | 478 | 37,466 | |
| Seagate Technology Holdings PLC | 444 | 45,803 | |
| Western Digital Corp.* | 678 | 34,537 | |
| 5,736,357 | |||
| Real Estate 3.0% | |||
| Equity Real Estate Investment Trusts (REITs) 2.8% | |||
| Alexandria Real Estate Equities, Inc. | 361 | 68,373 | |
| American Tower Corp. | 1,151 | 261,127 | |
| AvalonBay Communities, Inc. | 354 | 84,461 | |
| Boston Properties, Inc. | 363 | 44,398 | |
| Crown Castle International Corp. | 1,091 | 181,750 | |
| Digital Realty Trust, Inc. | 716 | 96,603 | |
| Duke Realty Corp. | 973 | 51,569 | |
| Equinix, Inc. | 228 | 161,818 | |
| Equity Residential | 866 | 73,870 | |
| Essex Property Trust, Inc. | 165 | 52,333 | |
| Extra Space Storage, Inc. | 344 | 64,724 | |
| Healthpeak Properties, Inc. | 1,360 | 42,242 | |
| Host Hotels & Resorts, Inc. | 1,826 | 33,361 | |
| Iron Mountain, Inc. | 742 | 36,492 | |
| Kimco Realty Corp. | 1,565 | 36,824 | |
| Mid-America Apartment Communities, Inc. | 292 | 59,746 | |
| Prologis, Inc. | 1,857 | 270,843 | |
| Public Storage | 387 | 137,393 | |
| Realty Income Corp. | 1,464 | 96,756 | |
| Regency Centers Corp. | 394 | 25,961 | |
| SBA Communications Corp. | 275 | 83,432 | |
| Simon Property Group, Inc. | 839 | 115,413 | |
| UDR, Inc. | 735 | 40,329 | |
| Ventas, Inc. | 1,019 | 55,026 | |
| Welltower, Inc. | 1,102 | 91,786 | |
| Weyerhaeuser Co. | 1,971 | 76,632 | |
| 2,343,262 | |||
| 20 | | | DWS Equity Sector Strategy Fund |
| Shares | Value ($) | ||
| Real Estate Management & Development 0.2% | |||
| CBRE Group, Inc. “A” * | 1,157 | 112,056 | |
| Utilities 2.9% | |||
| Electric Utilities 1.9% | |||
| Alliant Energy Corp. | 654 | 38,194 | |
| American Electric Power Co., Inc. | 1,317 | 119,386 | |
| Constellation Energy Corp. | 849 | 39,037 | |
| Duke Energy Corp. | 2,039 | 204,736 | |
| Edison International | 986 | 62,532 | |
| Entergy Corp. | 527 | 55,446 | |
| Evergy, Inc. | 607 | 37,883 | |
| Eversource Energy | 898 | 73,456 | |
| Exelon Corp. | 2,548 | 108,443 | |
| FirstEnergy Corp. | 1,412 | 59,092 | |
| NextEra Energy, Inc. | 5,215 | 408,178 | |
| NRG Energy, Inc. | 645 | 24,407 | |
| PPL Corp. | 1,954 | 51,136 | |
| Southern Co. | 2,777 | 179,866 | |
| Xcel Energy, Inc. | 1,410 | 94,935 | |
| 1,556,727 | |||
| Independent Power & Renewable Electricity Producers 0.0% | |||
| AES Corp. | 1,465 | 31,102 | |
| Multi-Utilities 1.0% | |||
| Ameren Corp. | 774 | 66,525 | |
| CenterPoint Energy, Inc. | 1,898 | 51,910 | |
| CMS Energy Corp. | 874 | 55,945 | |
| Consolidated Edison, Inc. | 1,077 | 92,374 | |
| Dominion Energy, Inc. | 2,443 | 194,292 | |
| DTE Energy Co. | 584 | 71,009 | |
| Public Service Enterprise Group, Inc. | 1,512 | 98,023 | |
| Sempra Energy | 970 | 139,894 | |
| WEC Energy Group, Inc. | 948 | 86,154 | |
| 856,126 | |||
| Total Common Stocks (Cost $82,234,170) | 79,701,609 | ||
| Exchange-Traded Funds 0.6% | |||
| Energy Select Sector SPDR Fund (Cost $465,360) | 7,000 | 494,060 | |
| DWS Equity Sector Strategy Fund | | | 21 |
| Shares | Value ($) | ||
| Cash Equivalents 2.7% | |||
| DWS Central Cash Management Government Fund, 0.06% (a) (Cost $2,291,130) | 2,291,130 | 2,291,130 | |
| % of Net Assets | Value ($) | ||
| Total Investment Portfolio (Cost $84,990,660) | 99.4 | 82,486,799 | |
| Other Assets and Liabilities, Net | 0.6 | 480,941 | |
| Net Assets | 100.0 | 82,967,740 |
| Value ($) at 8/31/2021 | Pur- chases Cost ($) | Sales Proceeds ($) | Net Real- ized Gain/ (Loss) ($) | Net Change in Unreal- ized Appreci- ation (Depreci- ation) ($) | Income ($) | Capital Gain Distri- butions ($) | Number of Shares at 2/28/2022 | Value ($) at 2/28/2022 |
| Cash Equivalents 2.7% | ||||||||
| DWS Central Cash Management Government Fund, 0.06% (a) | ||||||||
| 2,778,020 | 5,929,980 | 6,416,870 | — | — | 419 | — | 2,291,130 | 2,291,130 |
| * | Non-income producing security. |
| (a) | Affiliated fund managed by DWS Investment Management Americas, Inc. The rate shown is the annualized seven-day yield at period end. |
| SPDR: Standard & Poor’s Depositary Receipt |
| 22 | | | DWS Equity Sector Strategy Fund |
| Assets | Level 1 | Level 2 | Level 3 | Total |
| Common Stocks (a) | $79,701,609 | $— | $— | $79,701,609 |
| Exchange-Traded Funds | 494,060 | — | — | 494,060 |
| Short-Term Investments | 2,291,130 | — | — | 2,291,130 |
| Total | $82,486,799 | $ — | $ — | $82,486,799 |
| (a) | See Investment Portfolio for additional detailed categorizations. |
| DWS Equity Sector Strategy Fund | | | 23 |
| Assets | |
| Investments in non-affiliated securities, at value (cost $82,699,530) | $ 80,195,669 |
| Investment in DWS Central Cash Management Government Fund (cost $2,291,130) | 2,291,130 |
| Cash | 64 |
| Receivable for investments sold | 463,676 |
| Receivable for Fund shares sold | 7,633 |
| Dividends receivable | 92,602 |
| Interest receivable | 130 |
| Other assets | 34,046 |
| Total assets | 83,084,950 |
| Liabilities | |
| Payable for Fund shares redeemed | 24,779 |
| Accrued Trustees' fees | 733 |
| Other accrued expenses and payables | 91,698 |
| Total liabilities | 117,210 |
| Net assets, at value | $ 82,967,740 |
| Net Assets Consist of | |
| Distributable earnings (loss) | (4,215,764) |
| Paid-in capital | 87,183,504 |
| Net assets, at value | $ 82,967,740 |
| 24 | | | DWS Equity Sector Strategy Fund |
| Net Asset Value | |
| Class A | |
| Net Asset Value and redemption price per share ($34,095,323 ÷ 2,394,233 outstanding shares of beneficial interest, $.01 par value, unlimited number of shares authorized) | $ 14.24 |
| Maximum offering price per share (100 ÷ 94.25 of $14.24) | $ 15.11 |
| Class C | |
| Net Asset Value, offering and redemption price (subject to contingent deferred sales charge) per share ($837,449 ÷ 59,718 outstanding shares of beneficial interest, $.01 par value, unlimited number of shares authorized) | $ 14.02 |
| Class S | |
| Net Asset Value, offering and redemption price per share ($48,034,968 ÷ 3,363,227 outstanding shares of beneficial interest, $.01 par value, unlimited number of shares authorized) | $ 14.28 |
| DWS Equity Sector Strategy Fund | | | 25 |
| Investment Income | |
| Income: | |
| Dividends (net of foreign taxes withheld of $97) | $ 607,587 |
| Income distributions — DWS Central Cash Management Government Fund | 419 |
| Total income | 608,006 |
| Expenses: | |
| Management fee | 131,069 |
| Administration fee | 42,945 |
| Services to shareholders | 76,236 |
| Distribution and service fees | 48,167 |
| Custodian fee | 2,534 |
| Audit fee | 24,115 |
| Legal fees | 11,546 |
| Tax fees | 3,940 |
| Reports to shareholders | 12,017 |
| Registration fees | 22,806 |
| Trustees' fees and expenses | 2,298 |
| Other | 4,592 |
| Total expenses before expense reductions | 382,265 |
| Expense reductions | (119,961) |
| Total expenses after expense reductions | 262,304 |
| Net investment income | 345,702 |
| Realized and Unrealized Gain (Loss) | |
| Net realized gain (loss) from investments | 476,491 |
| Change in net unrealized appreciation (depreciation) on investments | (4,323,524) |
| Net gain (loss) | (3,847,033) |
| Net increase (decrease) in net assets resulting from operations | $ (3,501,331) |
| 26 | | | DWS Equity Sector Strategy Fund |
| Six Months Ended February 28, 2022 | Year Ended August 31, | |
| Increase (Decrease) in Net Assets | (Unaudited) | 2021 |
| Operations: | ||
| Net investment income | $ 345,702 | $ 763,638 |
| Net realized gain (loss) | 476,491 | 23,363,217 |
| Change in net unrealized appreciation (depreciation) | (4,323,524) | (4,562,053) |
| Net increase (decrease) in net assets resulting from operations | (3,501,331) | 19,564,802 |
| Distributions to shareholders: | ||
| Class A | (9,443,677) | (599,295) |
| Class C | (228,655) | (12,735) |
| Class S | (13,274,465) | (956,259) |
| Total distributions | (22,946,797) | (1,568,289) |
| Fund share transactions: | ||
| Proceeds from shares sold | 1,157,477 | 2,764,076 |
| Reinvestment of distributions | 22,466,339 | 1,531,544 |
| Payments for shares redeemed | (5,753,916) | (10,024,675) |
| Net increase (decrease) in net assets from Fund share transactions | 17,869,900 | (5,729,055) |
| Increase (decrease) in net assets | (8,578,228) | 12,267,458 |
| Net assets at beginning of period | 91,545,968 | 79,278,510 |
| Net assets at end of period | $ 82,967,740 | $ 91,545,968 |
| DWS Equity Sector Strategy Fund | | | 27 |
| DWS Equity Sector Strategy Fund — Class A | ||||||
| Six Months Ended 2/28/22 | Years Ended August 31, | |||||
| (Unaudited) | 2021 | 2020 | 2019 | 2018 | 2017 | |
| Selected Per Share Data | ||||||
| Net asset value, beginning of period | $19.81 | $16.02 | $15.64 | $15.88 | $15.73 | $14.61 |
| Income (loss) from investment operations: | ||||||
| Net investment incomea | .06 | .14 | .18 | .34 | .28 | .26 |
| Net realized and unrealized gain (loss) | (.55) | 3.96 | 1.43 | (.29) | .13 | 1.31 |
| Total from investment operations | (.49) | 4.10 | 1.61 | .05 | .41 | 1.57 |
| Less distributions from: | ||||||
| Net investment income | — | (.31) | (1.18) | (.29) | (.26) | (.45) |
| Net realized gains | (5.08) | — | (.05) | — | — | — |
| Total distributions | (5.08) | (.31) | (1.23) | (.29) | (.26) | (.45) |
| Net asset value, end of period | $14.24 | $19.81 | $16.02 | $15.64 | $15.88 | $15.73 |
| Total Return (%)b,c | (4.09) * | 25.86 d | 10.44 d | .56 d | 2.59 d | 11.05 d |
| Ratios to Average Net Assets and Supplemental Data | ||||||
| Net assets, end of period ($ millions) | 34 | 37 | 32 | 33 | 37 | 39 |
| Ratio of expenses before expense reductions (%) | .99 ** | .81 e | .86 e | .87 e | .83 e | .83 e |
| Ratio of expenses after expense reductions (%) | .73 ** | .76 e | .71 e | .69 e | .70 e | .63 e |
| Ratio of net investment income (%) | .64 ** | .78 | 1.19 | 2.24 | 1.75 | 1.74 |
| Portfolio turnover rate (%) | 26 * | 136 | 63 | 93 | 35 | 11 |
| a | Based on average shares outstanding during the period. |
| b | Total return does not reflect the effect of any sales charges. |
| c | Total return would have been lower had certain expenses not been reduced. |
| d | Total return would have been lower if the Advisor had not reduced some Underlying DWS Funds’ expenses. |
| e | The Fund invested in other funds and indirectly bore its proportionate share of fees and expenses incurred by the Underlying Funds in which the Fund was invested. This ratio does not include these indirect fees and expenses. |
| * | Not annualized |
| ** | Annualized |
| 28 | | | DWS Equity Sector Strategy Fund |
| DWS Equity Sector Strategy Fund — Class C | ||||||
| Six Months Ended 2/28/22 | Years Ended August 31, | |||||
| (Unaudited) | 2021 | 2020 | 2019 | 2018 | 2017 | |
| Selected Per Share Data | ||||||
| Net asset value, beginning of period | $19.65 | $15.90 | $15.52 | $15.75 | $15.60 | $14.49 |
| Income (loss) from investment operations: | ||||||
| Net investment income (loss)a | (.01) | (.01) | .07 | .23 | .18 | .15 |
| Net realized and unrealized gain (loss) | (.54) | 3.93 | 1.40 | (.28) | .11 | 1.30 |
| Total from investment operations | (.55) | 3.92 | 1.47 | (.05) | .29 | 1.45 |
| Less distributions from: | ||||||
| Net investment income | — | (.17) | (1.04) | (.18) | (.14) | (.34) |
| Net realized gains | (5.08) | — | (.05) | — | — | — |
| Total distributions | (5.08) | (.17) | (1.09) | (.18) | (.14) | (.34) |
| Net asset value, end of period | $14.02 | $19.65 | $15.90 | $15.52 | $15.75 | $15.60 |
| Total Return (%)b,c | (4.47) * | 24.84 d | 9.57 d | (.15) d | 1.82 d | 10.27 d |
| Ratios to Average Net Assets and Supplemental Data | ||||||
| Net assets, end of period ($ millions) | 1 | 1 | 1 | 1 | 2 | 7 |
| Ratio of expenses before expense reductions (%) | 1.86 ** | 1.65 e | 1.69 e | 1.65 e | 1.59 e | 1.60 e |
| Ratio of expenses after expense reductions (%) | 1.48 ** | 1.58 e | 1.46 e | 1.44 e | 1.45 e | 1.38 e |
| Ratio of net investment income (loss) (%) | (.11) ** | (.07) | .44 | 1.53 | 1.11 | .99 |
| Portfolio turnover rate (%) | 26 * | 136 | 63 | 93 | 35 | 11 |
| a | Based on average shares outstanding during the period. |
| b | Total return does not reflect the effect of any sales charges. |
| c | Total return would have been lower had certain expenses not been reduced. |
| d | Total return would have been lower if the Advisor had not reduced some Underlying DWS Funds’ expenses. |
| e | The Fund invested in other funds and indirectly bore its proportionate share of fees and expenses incurred by the Underlying Funds in which the Fund was invested. This ratio does not include these indirect fees and expenses. |
| * | Not annualized |
| ** | Annualized |
| DWS Equity Sector Strategy Fund | | | 29 |
| DWS Equity Sector Strategy Fund — Class S | ||||||
| Six Months Ended 2/28/22 | Years Ended August 31, | |||||
| (Unaudited) | 2021 | 2020 | 2019 | 2018 | 2017 | |
| Selected Per Share Data | ||||||
| Net asset value, beginning of period | $19.83 | $16.03 | $15.66 | $15.90 | $15.75 | $14.63 |
| Income (loss) from investment operations: | ||||||
| Net investment incomea | .08 | .18 | .22 | .38 | .33 | .30 |
| Net realized and unrealized gain (loss) | (.55) | 3.97 | 1.43 | (.29) | .12 | 1.31 |
| Total from investment operations | (.47) | 4.15 | 1.65 | .09 | .45 | 1.61 |
| Less distributions from: | ||||||
| Net investment income | — | (.35) | (1.23) | (.33) | (.30) | (.49) |
| Net realized gains | (5.08) | — | (.05) | — | — | — |
| Total distributions | (5.08) | (.35) | (1.28) | (.33) | (.30) | (.49) |
| Net asset value, end of period | $14.28 | $19.83 | $16.03 | $15.66 | $15.90 | $15.75 |
| Total Return (%)b | (3.99) * | 26.23 c | 10.66 c | .82 c | 2.85 c | 11.32 c |
| Ratios to Average Net Assets and Supplemental Data | ||||||
| Net assets, end of period ($ millions) | 48 | 53 | 46 | 46 | 51 | 56 |
| Ratio of expenses before expense reductions (%) | .76 ** | .58 d | .63 d | .65 d | .60 d | .61 d |
| Ratio of expenses after expense reductions (%) | .48 ** | .53 d | .46 d | .44 d | .45 d | .38 d |
| Ratio of net investment income (%) | .89 ** | 1.01 | 1.44 | 2.50 | 2.03 | 1.99 |
| Portfolio turnover rate (%) | 26 * | 136 | 63 | 93 | 35 | 11 |
| a | Based on average shares outstanding during the period. |
| b | Total return would have been lower had certain expenses not been reduced. |
| c | Total return would have been lower if the Advisor had not reduced some Underlying DWS Funds’ expenses. |
| d | The Fund invested in other funds and indirectly bore its proportionate share of fees and expenses incurred by the Underlying Funds in which the Fund was invested. This ratio does not include these indirect fees and expenses. |
| * | Not annualized |
| ** | Annualized |
| 30 | | | DWS Equity Sector Strategy Fund |
| Notes to Financial Statements | (Unaudited) |
| A. | Organization and Significant Accounting Policies |
| DWS Equity Sector Strategy Fund | | | 31 |
| 32 | | | DWS Equity Sector Strategy Fund |
| DWS Equity Sector Strategy Fund | | | 33 |
| B. | Purchases and Sales of Securities |
| C. | Related Parties |
| 34 | | | DWS Equity Sector Strategy Fund |
| Class A | .73% | ||
| Class C | 1.48% | ||
| Class S | .48% |
| Class A | $ 46,561 |
| Class C | 1,687 |
| Class S | 71,713 |
| $ 119,961 |
| DWS Equity Sector Strategy Fund | | | 35 |
| Services to Shareholders | Total Aggregated | Unpaid at February 28, 2022 |
| Class A | $ 11,293 | $ 3,818 |
| Class C | 561 | 171 |
| Class S | 30,967 | 10,395 |
| $ 42,821 | $ 14,384 |
| Sub-Recordkeeping | Total Aggregated |
| Class A | $ 13,818 |
| Class C | 566 |
| Class S | 8,113 |
| $ 22,497 |
| Distribution Fee | Total Aggregated | Unpaid at February 28, 2022 |
| Class C | $ 3,310 | $ 490 |
| 36 | | | DWS Equity Sector Strategy Fund |
| Service Fee | Total Aggregated | Unpaid at February 28, 2022 | Annualized Rate |
| Class A | $ 43,754 | $ 14,108 | .24% |
| Class C | 1,103 | 438 | .25% |
| $ 44,857 | $ 14,546 |
| D. | Line of Credit |
| DWS Equity Sector Strategy Fund | | | 37 |
| E. | Fund Share Transactions |
| Six Months Ended February 28, 2022 | Year Ended August 31, 2021 | |||
| Shares | Dollars | Shares | Dollars | |
| Shares sold | ||||
| Class A | 44,155 | $ 708,124 | 70,356 | $ 1,278,371 |
| Class C | 1,586 | 25,163 | 1,809 | 31,296 |
| Class S | 24,688 | 424,190 | 83,033 | 1,454,409 |
| $ 1,157,477 | $ 2,764,076 | |||
| Shares issued to shareholders in reinvestment of distributions | ||||
| Class A | 605,113 | $ 9,197,715 | 34,013 | $ 583,669 |
| Class C | 14,510 | 217,507 | 722 | 12,359 |
| Class S | 856,373 | 13,051,117 | 54,549 | 935,516 |
| $ 22,466,339 | $ 1,531,544 | |||
| Shares redeemed | ||||
| Class A | (145,167) | $ (2,343,970) | (228,571) | $ (4,046,676) |
| Class C | (3,276) | (58,895) | (32,749) | (593,862) |
| Class S | (199,441) | (3,351,051) | (312,358) | (5,384,137) |
| $ (5,753,916) | $ (10,024,675) | |||
| Net increase (decrease) | ||||
| Class A | 504,101 | $ 7,561,869 | (124,202) | $ (2,184,636) |
| Class C | 12,820 | 183,775 | (30,218) | (550,207) |
| Class S | 681,620 | 10,124,256 | (174,776) | (2,994,212) |
| $ 17,869,900 | $ (5,729,055) | |||
| 38 | | | DWS Equity Sector Strategy Fund |
| F. | Other — COVID-19 Pandemic |
| DWS Equity Sector Strategy Fund | | | 39 |
| — | Actual Fund Return. This helps you estimate the actual dollar amount of ongoing expenses (but not transaction costs) paid on a $1,000 investment in the Fund using the Fund’s actual return during the period. To estimate the expenses you paid over the period, simply divide your account value by $1,000 (for example, an $8,600 account value divided by $1,000 = 8.6), then multiply the result by the number in the “Expenses Paid per $1,000” line under the share class you hold. |
| — | Hypothetical 5% Fund Return. This helps you to compare your Fund’s ongoing expenses (but not transaction costs) with those of other mutual funds using the Fund’s actual expense ratio and a hypothetical rate of return of 5% per year before expenses. Examples using a 5% hypothetical fund return may be found in the shareholder reports of other mutual funds. The hypothetical account values and expenses may not be used to estimate the actual ending account balance or expenses you paid for the period. |
| 40 | | | DWS Equity Sector Strategy Fund |
| Actual Fund Return | Class A | Class C | Class S |
| Beginning Account Value 9/1/21 | $1,000.00 | $1,000.00 | $1,000.00 |
| Ending Account Value 2/28/22 | $ 959.10 | $ 955.30 | $ 960.10 |
| Expenses Paid per $1,000* | $ 3.55 | $ 7.18 | $ 2.33 |
| Hypothetical 5% Fund Return | Class A | Class C | Class S |
| Beginning Account Value 9/1/21 | $1,000.00 | $1,000.00 | $1,000.00 |
| Ending Account Value 2/28/22 | $1,021.17 | $1,017.46 | $1,022.41 |
| Expenses Paid per $1,000* | $ 3.66 | $ 7.40 | $ 2.41 |
| * | Expenses are equal to the Fund’s annualized expense ratio for each share class, multiplied by the average account value over the period, multiplied by 181 (the number of days in the most recent six-month period), then divided by 365. |
| Annualized Expense Ratios | Class A | Class C | Class S |
| DWS Equity Sector Strategy Fund | .73% | 1.48% | .48% |
| DWS Equity Sector Strategy Fund | | | 41 |
| 42 | | | DWS Equity Sector Strategy Fund |
| — | During the entire process, all of the Fund’s Trustees were independent of DIMA and its affiliates (the “Independent Trustees” ). |
| — | The Board met frequently during the past year to discuss fund matters and dedicated a substantial amount of time to contract review matters. Over the course of several months, the Board reviewed extensive materials received from DIMA, independent third parties and independent counsel. These materials included an analysis of the Fund’s performance, fees and expenses, and profitability from a fee consultant retained by the Fund’s Independent Trustees (the “Fee Consultant” ). |
| — | The Board also received extensive information throughout the year regarding performance of the Fund. |
| — | The Independent Trustees regularly met privately with counsel to discuss contract review and other matters. In addition, the Independent Trustees were advised by the Fee Consultant in the course of their review of the Fund’s contractual arrangements and considered a comprehensive report prepared by the Fee Consultant in connection with their deliberations. |
| — | In connection with reviewing the Agreement, the Board also reviewed the terms of the Fund’s Rule 12b-1 plan, distribution agreement, administrative services agreement, transfer agency agreement and other material service agreements. |
| DWS Equity Sector Strategy Fund | | | 43 |
| 44 | | | DWS Equity Sector Strategy Fund |
| DWS Equity Sector Strategy Fund | | | 45 |
| 46 | | | DWS Equity Sector Strategy Fund |
| DWS Equity Sector Strategy Fund | | | 47 |
| For More Information | The automated telephone system allows you to access personalized account information and obtain information on other DWS funds using either your voice or your telephone keypad. Certain account types within Classes A, C and S also have the ability to purchase, exchange or redeem shares using this system. |
| For more information, contact your financial representative. You may also access our automated telephone system or speak with a Shareholder Service representative by calling: (800) 728-3337 | |
| Web Site | dws.com View your account transactions and balances, trade shares, monitor your asset allocation, subscribe to fund and account updates by e-mail, and change your address, 24 hours a day. |
| Obtain prospectuses and applications, news about DWS funds, insight from DWS economists and investment specialists and access to DWS fund account information. | |
| Written Correspondence | DWSPO Box 219151 Kansas City, MO 64121-9151 |
| Proxy Voting | The Fund’s policies and procedures for voting proxies for portfolio securities and information about how the Fund voted proxies related to its portfolio securities during the most recent 12-month period ended June 30 are available on our Web site — dws.com/en-us/resources/proxy-voting — or on the SEC’s Web site — sec.gov. To obtain a written copy of the Fund’s policies and procedures without charge, upon request, call us toll free at (800) 728-3337. |
| Portfolio Holdings | Following the Fund’s fiscal first and third quarter-end, a complete portfolio holdings listing is posted on dws.com, and is available free of charge by contacting your financial intermediary, or if you are a direct investor, by calling (800) 728-3337. In addition, the portfolio holdings listing is filed with SEC on the Fund’s Form N-PORT and will be available on the SEC’s Web site at sec.gov. Additional portfolio holdings for the Fund are also posted on dws.com from time to time. Please see the Fund’s current prospectus for more information. |
| Principal Underwriter | If you have questions, comments or complaints, contact:DWS Distributors, Inc. 222 South Riverside Plaza Chicago, IL 60606-5808 (800) 621-1148 |
| 48 | | | DWS Equity Sector Strategy Fund |
| Investment Management | DWS Investment Management Americas, Inc. (“DIMA” or the “Advisor” ), which is part of the DWS Group GmbH & Co. KGaA (“DWS Group” ), is the investment advisor for the Fund. DIMA and its predecessors have more than 90 years of experience managing mutual funds and DIMA provides a full range of investment advisory services to both institutional and retail clients. DIMA is an indirect, wholly owned subsidiary of DWS Group. |
| DWS Group is a global organization that offers a wide range of investing expertise and resources, including hundreds of portfolio managers and analysts and an office network that reaches the world’s major investment centers. This well-resourced global investment platform brings together a wide variety of experience and investment insight across industries, regions, asset classes and investing styles. |
| Class A | Class C | Class S | |
| Nasdaq Symbol | SUPAX | SUPCX | SPGRX |
| CUSIP Number | 25158W 783 | 25158W 817 | 25158W 825 |
| Fund Number | 482 | 782 | 2082 |
| DWS Equity Sector Strategy Fund | | | 49 |
| FACTS | What Does DWS Do With Your Personal Information? |
| Why? | Financial companies choose how they share your personal information. Federal law gives consumers the right to limit some but not all sharing. Federal law also requires us to tell you how we collect, share and protect your personal information. Please read this notice carefully to understand what we do. |
| What? | The types of personal information we collect and share can include: — Social Security number — Account balances — Purchase and transaction history — Bank account information — Contact information such as mailing address, e-mail address and telephone number |
| How? | All financial companies need to share customers’ personal information to run their everyday business. In the section below, we list the reasons financial companies can share their customers’ personal information, the reasons DWS chooses to share and whether you can limit this sharing. |
| Reasons we can share your personal information | Does DWS share? | Can you limit this sharing? |
| For our everyday business purposes —such as to process your transactions, maintain your account(s), respond to court orders or legal investigations | Yes | No |
| For our marketing purposes — to offer our products and services to you | Yes | No |
| For joint marketing with other financial companies | No | We do not share |
| For our affiliates’ everyday business purposes — information about your transactions and experiences | No | We do not share |
| For our affiliates’ everyday business purposes — information about your creditworthiness | No | We do not share |
| For non-affiliates to market to you | No | We do not share |
| Questions? | Call (800) 728-3337 or e-mail us at service@dws.com |
| 50 | | | DWS Equity Sector Strategy Fund |
| Who we are | |
| Who is providing this notice? | DWS Distributors, Inc; DWS Investment Management Americas, Inc.; DWS Trust Company; the DWS Funds |
| What we do | |
| How does DWS protect my personal information? | To protect your personal information from unauthorized access and use, we use security measures that comply with federal law. These measures include computer safeguards, secured files, and secured buildings. |
| How does DWS collect my personal information? | We collect your personal information, for example, when you: — open an account — give us your contact information — provide bank account information for ACH or wire transactions — tell us where to send money — seek advice about your investments |
| Why can’t I limit all sharing? | Federal law gives you the right to limit only — sharing for affiliates’ everyday business purposes — information about your creditworthiness — affiliates from using your information to market to you — sharing for non-affiliates to market to you State laws and individual companies may give you additional rights to limit sharing. |
| Definitions | |
| Affiliates | Companies related by common ownership or control. They can be financial or non-financial companies. Our affiliates include financial companies with the DWS or Deutsche Bank (“DB” ) name, such as DB AG Frankfurt. |
| Non-affiliates | Companies not related by common ownership or control. They can be financial and non-financial companies. Non-affiliates we share with include account service providers, service quality monitoring services, mailing service providers and verification services to help in the fight against money laundering and fraud. |
| Joint marketing | A formal agreement between non-affiliated financial companies that together market financial products or services to you. DWS does not jointly market. |
| DWS Equity Sector Strategy Fund | | | 51 |

| (b) Not applicable | ||
| ITEM 2. | CODE OF ETHICS | |
| Not applicable. | ||
| ITEM 3. | AUDIT COMMITTEE FINANCIAL EXPERT | |
| Not applicable | ||
| ITEM 4. | PRINCIPAL ACCOUNTANT FEES AND SERVICES | |
| Not applicable | ||
| ITEM 5. | AUDIT COMMITTEE OF LISTED REGISTRANTS | |
| Not applicable | ||
| ITEM 6. | SCHEDULE OF INVESTMENTS | |
| Not applicable | ||
| ITEM 7. | DISCLOSURE OF PROXY VOTING POLICIES AND PROCEDURES FOR CLOSED-END MANAGEMENT INVESTMENT COMPANIES | |
| Not applicable | ||
| ITEM 8. | PORTFOLIO MANAGERS OF CLOSED-END MANAGEMENT INVESTMENT COMPANIES | |
| Not applicable | ||
| ITEM 9. | PURCHASES OF EQUITY SECURITIES BY CLOSED-END MANAGEMENT INVESTMENT COMPANY AND AFFILIATED PURCHASERS | |
| Not applicable | ||
| ITEM 10. | SUBMISSION OF MATTERS TO A VOTE OF SECURITY HOLDERS | |
| There were no material changes to the procedures by which shareholders may recommend nominees to the Fund’s Board. The primary function of the Nominating and Governance Committee is to identify and recommend individuals for membership on the Board and oversee the administration of the Board Governance Guidelines. Shareholders may recommend candidates for Board positions by forwarding their correspondence by U.S. mail or courier service to Keith R. Fox, DWS Funds Board Chair, c/o Thomas R. Hiller, Ropes & Gray LLP, Prudential Tower, 800 Boylston Street, Boston, MA 02199-3600. | ||
| ITEM 11. | CONTROLS AND PROCEDURES | |
| (a) | The Chief Executive and Financial Officers concluded that the Registrant’s Disclosure Controls and Procedures are effective based on the evaluation of the Disclosure Controls and Procedures as of a date within 90 days of the filing date of this report. | |
| (b) | There have been no changes in the registrant’s internal control over financial reporting that occurred during the period covered by this report that has materially affected, or is reasonably likely to materially affect, the registrant’s internal controls over financial reporting. | |
| ITEM 12. | Disclosure of Securities Lending Activities for Closed-End Management Investment Companies. | |
| Not applicable | ||
| ITEM 13. | EXHIBITS | |
| (a)(1) | Not applicable | |
| (a)(2) | Certification pursuant to Rule 30a-2(a) under the Investment Company Act of 1940 (17 CFR 270.30a-2(a)) is filed and attached hereto as Exhibit 99.CERT. | |
| (b) | Certification pursuant to Rule 30a-2(b) under the Investment Company Act of 1940 (17 CFR 270.30a-2(b)) is furnished and attached hereto as Exhibit 99.906CERT. | |
SIGNATURES
Pursuant to the requirements of the Securities Exchange Act of 1934 and the Investment Company Act of 1940, the registrant has duly caused this report to be signed on its behalf by the undersigned, thereunto duly authorized.
| Registrant: | DWS Equity Sector Strategy Fund, a series of Deutsche DWS Asset Allocation Trust |
| By: | /s/Hepsen Uzcan Hepsen Uzcan President |
| Date: | 4/29/2022 |
Pursuant to the requirements of the Securities Exchange Act of 1934 and the Investment Company Act of 1940, this report has been signed below by the following persons on behalf of the registrant and in the capacities and on the dates indicated.
| By: | /s/Hepsen Uzcan Hepsen Uzcan President |
| Date: | 4/29/2022 |
| By: | /s/Diane Kenneally Diane Kenneally Chief Financial Officer and Treasurer |
| Date: | 4/29/2022 |