Portfolio Management Team
David Bianco, CFA, Chief Investment Officer Americas
Portfolio Manager of the Fund. Began managing the Fund in 2021.
—Rejoined DWS in 2012 with 15 years of industry experience; previously worked as Chief US Equity Strategist at Deutsche Bank and, before rejoining, at BofA Merrill Lynch and at UBS, as the Valuation & Accounting Strategist at UBS, a Quantitative Strategist at Deutsche Bank and an industry equity analyst at Deutsche Bank, Credit Suisse and at NatWest Markets.
—Chief Investment Strategist and Head of US Active Equity Management: New York.
—BS in Economics, University of Pennsylvania.
Di Kumble, CFA, Senior Portfolio Manager Equity
Portfolio Manager of the Fund. Began managing the Fund in 2021.
—Joined DWS in 2003 with seven years of industry experience. Prior to joining, she served as a Portfolio Manager at Graham Capital Management. Previously, she worked as a Quantitative Strategist at ITG Inc. and Morgan Stanley.
—Senior Portfolio Manager, Head of Tax Managed Equities: New York.
—BS, Beijing University; PhD in Chemistry, Princeton University.
Dokyoung Lee, CFA, Regional Head of Multi Asset & Solutions
Portfolio Manager of the Fund. Began managing the Fund in 2018.
—Joined DWS in 2018 with 24 years of industry experience; previously, worked as Head of Research and Portfolio Manager in the Global Multi-Asset Group at Oppenheimer Funds, and in research and portfolio management roles at AllianceBernstein.
—Americas Multi-Asset Head: New York.
—BSE, Princeton University.
Effective April 25, 2023, the portfolio management team is as follows:
David Bianco, CFA, Chief Investment Officer Americas
Portfolio Manager of the Fund. Began managing the Fund in 2021.
—Rejoined DWS in 2012 with 15 years of industry experience; previously worked as Chief US Equity Strategist at Deutsche Bank and, before rejoining, at BofA Merrill Lynch and at UBS, as the Valuation & Accounting Strategist at UBS, a Quantitative Strategist at Deutsche Bank and an industry equity analyst at Deutsche Bank, Credit Suisse and at NatWest Markets.
—Chief Investment Strategist and Head of US Active Equity Management: New York.
—BS in Economics, University of Pennsylvania.
Di Kumble, CFA, Senior Portfolio Manager Equity
Portfolio Manager of the Fund. Began managing the Fund in 2021.
—Joined DWS in 2003 with seven years of industry experience. Prior to joining, she served as a Portfolio Manager at Graham Capital Management. Previously, she worked as a Quantitative Strategist at ITG Inc. and Morgan Stanley.
—Senior Portfolio Manager, Head of Tax Managed Equities: New York.
—BS, Beijing University; PhD in Chemistry, Princeton University.


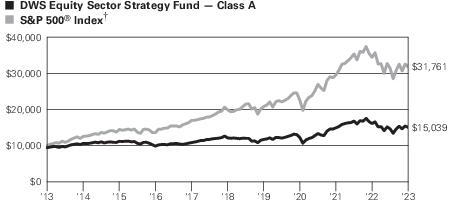 Yearly periods ended February 28