Exhibit (c)(4)
COMPLETE APPRAISAL
SUMMARY APPRAISAL REPORT
OF
MOUNTAIN VIEW APARTMENTS
650 EAST BONITA AVENUE
SAN DIMAS, CALIFORNIA
KTR JOB NO. 7-7-06013D
| | | |
| Ms. Martha Long | | May 4, 2006 |
| Senior Vice President | | |
| AIMCO | | |
| 4582 S. Ulster Street Parkway, Suite 1100 | | |
| Denver, Colorado 80237 | | |
| | | |
| Re: | | Mountain View Apartments |
| | | 650 East Bonita Avenue |
| | | San Dimas, California |
Dear Ms. Long:
At your request, KTR Newmark Real Estate Services LLC has appraised the above referenced property. The purpose of the appraisal is to estimate the Market Value of the Fee Simple Estate of the subject property, free and clear of financing, as of April 11, 2006. The date of value corresponds to the date the subject property was most recently inspected by the appraiser.
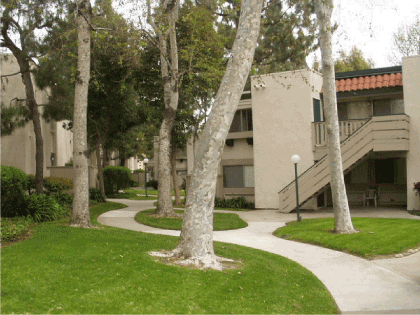
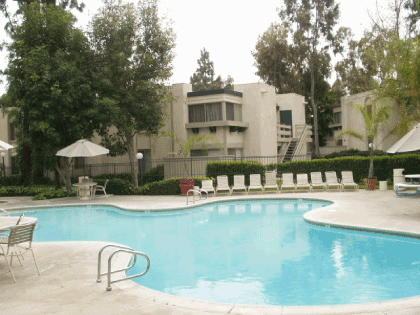
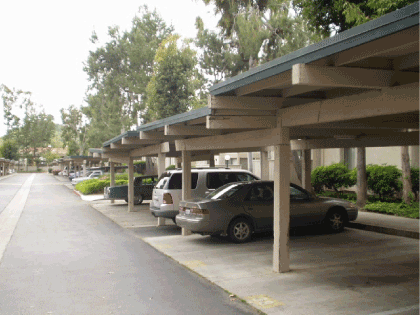
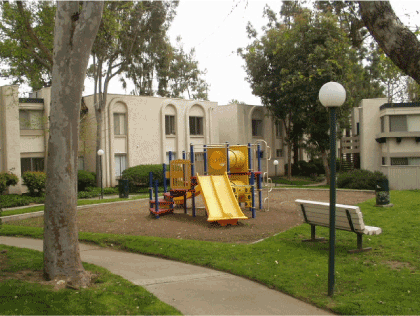
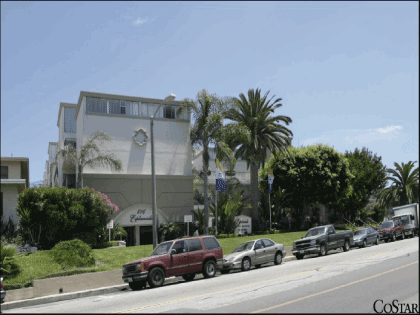
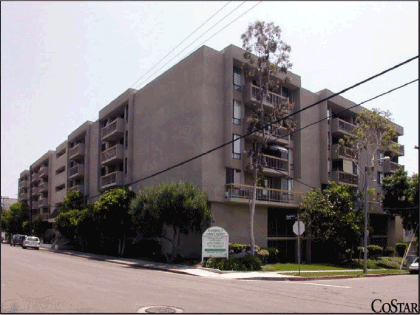
The subject property consists of an approximate 8.16+ acre tract of land improved with a 168-unit garden-style apartment complex known as the Mountain View Apartments. Construction of the improvements was reportedly completed in 1978. The structural improvements were observed to be in average physical condition and consist of two-story wood frame construction with stucco and wood trim exterior walls and flat roofs with built-up covers. Amenities common to all units include standard kitchen appliances, cable TV pre-wire, patio/balcony, ceiling fans and mini-blinds. Community amenities include on-site management/leasing office, fitness center, sauna, swimming pool, spa, covered parking, playground and laundry facility. The Mountain View Apartments contain 167,366 rentable square feet, which suggests an average unit size of 996 square feet.
The following report contains information considered relevant to the valuation of the property and the methods by which collected data have been analyzed in arriving at our value conclusion. Our analysis included an inspection of the premises, interviews with knowledgeable market participants, a review of historical income and expense statements, the current rent roll, and other relevant financial and market information. As an income-producing property, greatest reliance is placed upon the value derived through the Income Capitalization Approach, with support provided by the conclusion rendered through implementation of the Sales Comparison Approach.
This appraisal report has been prepared in order to comply with the reporting requirements set forth under Standards Rule 2-2(b) of the Uniform Standards of Professional Appraisal Practice (USPAP) for a Complete Appraisal in Summary Report format. As such, it presents only summary discussions of the data, reasoning, and analyses that were used in the appraisal process to develop the appraiser’s opinion of value. Supporting documentation not presented herein has been retained in the appraiser’s file. The depth of discussion contained in this report is specific to the needs of the client and for the intended use stated herein.
| | | |
| Ms. Martha Long | | May 4, 2006 |
| AIMCO | | Page 2 |
The attached Summary Appraisal Report describes our investigation and analyses, together with Certification, Basic Assumptions and Limiting Conditions, upon which we have based our opinion that the market value of the Fee Simple Estate of the subject property, as of April 11, 2006, is:
THIRTY MILLION TWO HUNDRED THOUSAND DOLLARS
($30,200,000)
It has been a pleasure to be of service to you. Please do not hesitate to call with any questions you may have regarding our assumptions, observations or conclusion.
Very truly yours,
KTR NEWMARK REAL ESTATE SERVICES LLC
| | | | | | | |
| By: | | William L. Corbin, MAI | | By: | | Steven J. Goldberg, MAI, CCIM |
| | | Senior Vice President for the Firm | | | | Senior Vice President for the Firm |
| | | |
| Mountain View Apartments | | May 4, 2006 |
| San Dimas, California | | Page i |
CERTIFICATE OF VALUE
We, William L. Corbin, MAI and Steven J. Goldberg, MAI, certify that to the best of our knowledge and belief:
The statements of fact contained in this appraisal are true and correct.
The reported analyses, opinions, and conclusions are limited only by the reported assumptions and limiting conditions, are our personal, unbiased professional analyses, opinions, and conclusions.
We have no present or prospective interest in the property that is the subject property of this appraisal, and have no personal interest or bias with respect to the parties involved.
Our compensation is not contingent upon the reporting of a predetermined value or direction in value that favors the cause of the client, the amount of value estimate, the attainment of a stipulated result, or the occurrence of a subsequent event
Our analyses, opinions, and conclusions were developed, and this report has been prepared, in conformity with the Uniform Standards of Professional Appraisal Practice (USPAP) as promulgated by the Appraisal Standards Board of the Appraisal Foundation, the Code of Professional Ethics and the Standards of Professional Appraisal Practice of the Appraisal Institute, and Title XI (and amendments) of the Financial Institutions Reform, Recovery and Enforcement Act of 1989 (FIRREA) effective August 9, 1990.
Charles K. Russell provided significant professional help in this appraisal assignment.
Charles Russell made a personal a personal inspection of the property that is the subject of this appraisal. Neither William L. Corbin nor Steven J. Goldberg inspected the subject property.
This appraisal was not prepared in conjunction with a request for a specific value or a value within a given range or predicated upon loan approval.
We have the knowledge and experience necessary to perform this appraisal assignment and have previously appraised this type of property.
As of the date of this appraisal, William L. Corbin, MAI and Steven J. Goldberg, MAI, have completed the requirements under the continuing education program of the Appraisal Institute.
The use of this report is subject to the requirements of the Appraisal Institute relating to review its duly authorized representatives.
As of the date of this appraisal, William L. Corbin MAI is currently certified with the State of California Office of Real Estate Appraisers and is licensed as a Certified General Real Estate Appraiser (AG025737) until February 27, 2007.
KTR NEWMARK REAL ESTATE SERVICES LLC
| | | | | | | |
| By: | | William L. Corbin, MAI | | By: | | Steven J. Goldberg, MAI, CCIM |
| | | Senior Vice President for the Firm | | | | Senior Vice President for the Firm |
| | | |
| Mountain View Apartments | | May 4, 2006 |
| San Dimas, California | | Page iii |
BASIC ASSUMPTIONS AND LIMITING CONDITIONS
This Appraisal Report is subject to underlying assumptions and limiting conditions qualifying the information contained in the Report as follows:
The valuation estimates apply only to the property specifically identified and described in the ensuing Report.
Information and data contained in the Report, although obtained from public record and other reliable sources and where possible, carefully checked by the Appraiser, are accepted as satisfactory evidence upon which rests the final expression of property value.
The Appraiser has made no legal survey nor has he commissioned one to be prepared and therefore, reference to a sketch, plat, diagram or previous survey appearing in the Report is only for the purpose of assisting the reader in visualizing the property.
It is assumed that all information known to the client and relative to the valuation have been accurately furnished and that there are no undisclosed leases, agreements, liens or other encumbrances affecting the use of the property.
Ownership and management are assumed to be competent and in responsible hands.
No responsibility beyond reasonableness is assumed for matters of a legal nature, whether existing or pending.
Information identified as being furnished or prepared by others is believed to be reliable but no responsibility for its accuracy is assumed.
The Appraiser, by reason of this appraisal, shall not be required to give testimony as an expert witness in any legal hearing or before any court of law unless justly and fairly compensated for such service.
By reason of the Purpose of the Appraisal or Function of the Report herein set forth, the value reported is only applicable to the Property Rights Appraised and the Appraisal Report should not be used for any other purpose.
Disclosure of the contents of this report is governed by the by-laws and Regulations of the Appraisal Institute.
Unless otherwise stated in this report, the existence of hazardous material, which may or may not be present on the property, was not observed by the appraiser. The appraiser has no knowledge of the existence of such materials on or in the property. The appraiser, however, is not qualified to detect such substances. The presence of substances such as asbestos, urea-formaldehyde foam insulation or other potentially hazardous materials may affect the value of the property. Any value estimate is predicated on the assumption that there is no such material on or in the property that would cause a loss in value. No responsibility is assumed for any such conditions, or for any expertise or engineering knowledge required to discover them. The client is urged to retain an expert in this field, if desired.
| | | |
| Mountain View Apartments | | May 4, 2006 |
| San Dimas, California | | Page iv |
In arriving at the value set forth in this appraisal no consideration has been given to the effect of state, local or federal income and gains taxes or of occupancy, hotel, capital levy, gift, estate, succession, inheritance or similar taxes which may be imposed upon any owner, lessee, or mortgagee by reason of any sale, conveyance, transfer, leasing, hypothecation, mortgage, pledge or other disposition of the appraised property.
The appraiser was not provided architectural plans for the subject property, thus the square footage as indicated on the rent roll, marketing brochures, and unit mix provided by the client has been utilized. In the event this information is inaccurate, we reserve the right to modify this appraisal if so warranted.
| | | |
| Mountain View Apartments | | May 4, 2006 |
| San Dimas, California | | Page v |
SUBJECT PROPERTY PHOTOGRAPH
| | | |
| Mountain View Apartments | | May 4, 2006 |
| San Dimas, California | | Page vi |
TABLE OF CONTENTS
| | | | | |
| Title Page | | | | |
| Letter of Transmittal | | | | |
| Certificate of Value | | | i | |
| Basic Assumptions and Limiting Conditions | | | ii | |
| Subject Photograph | | | iv | |
| Table of Contents | | | v | |
| | | | | |
| Executive Summary | | | 1 | |
| Introduction and Premises of the Appraisal | | | 2 | |
| Regional Overview | | | 4 | |
| Neighborhood Overview | | | 9 | |
| Site Analysis | | | 11 | |
| Real Estate Taxes | | | 12 | |
| Zoning | | | 13 | |
| Description of Improvements | | | 13 | |
| Apartment Market Overview | | | 16 | |
| Economic Rent Analysis | | | 19 | |
| Highest and Best Use | | | 25 | |
| | | | | |
| Valuation Procedure | | | 26 | |
| Income Capitalization Approach | | | 27 | |
| Sales Comparison Approach | | | 32 | |
| Reconciliation and Final Value Conclusion | | | 37 | |
| | | | | |
ADDENDA | | | | |
| Subject Photographs | | | | |
| Comparable Rental Photographs | | | | |
| Comparable Sale Photographs | | | | |
| Regional Location Map | | | | |
| Neighborhood Map | | | | |
| Comparable Rentals Map | | | | |
| Comparable Sales Map | | | | |
| Qualifications | | | | |
| | | |
| Mountain View Apartments | | May 4, 2006 |
| San Dimas, California | | Page 1 |
EXECUTIVE SUMMARY
| | | |
| Property: | | Mountain View Apartments |
| | | |
| Location: | | 650 East Bonita Avenue, San Dimas, California |
| | | |
| Assessors Parcel ID No: | | 5722-019-017 – Los Angeles County Assessor |
| | | |
| Purpose of Appraisal: | | To estimate the Market Value of the subject property as of the date of value. |
| | | |
| Date of Value: | | April 11, 2006 |
| | | |
| Date of Report: | | May 4, 2006 |
| | | |
| Interest Appraised: | | Fee Simple Estate |
| | | |
| Description of Property: | | The subject property consists of an approximate 8.16+ acre tract of land |
| | | improved with a 168-unit garden-style apartment complex known as the Mountain View Apartments. |
| | | Construction of the improvements was reportedly completed in 1978. The Mountain View Apartments |
| | | contains 167,366 rentable square feet, which suggests an average unit size of 996 square feet. |
| | | |
| Location: | | The subject property is located in the central portion of the City of San Dimas, at the |
| | | southwest corner of East Bonita Avenue and South San Dimas Canyon Road. |
| | | |
| Zoning: | | The subject site is zoned MF-16 (Multiple-Family Zone) by the City of San Dimas. The |
| | | intended use of land in this zoning district is primarily multifamily use. |
| | | |
| Flood Zone: | | According to the Federal Emergency Management Agency (FEMA), the property is located |
| | | within Zone C, an area outside any special flood hazard areas as defined by FEMA. |
| | | |
| Highest and Best Use: | | Multifamily residential development. |
| | | |
| Marketing Period: | | Less than 12 months |
| | | |
| Valuation Assumptions: | | |
| | | |
| Average Market Rent (per Unit) | | $1,572 |
| Market Vacancy/Credit Loss | | 7.0% |
| Operating Expense Ratio | | 43% |
| Net Operating Income | | $1,663,454 |
| Overall Capitalization Rate | | 5.5% |
| | | |
| Mountain View Apartments | | May 4, 2006 |
| San Dimas, California | | Page 2 |
| | | |
| Final Estimate of Market Value, by Approach | | |
| Cost Approach: | | N/A |
| Sales Comparison Approach: | | $30,350,000 |
| Income Approach: | | $30,200,000 |
| Final Estimate of Market Value: | | $30,200,000 |
INTRODUCTION AND PREMISES OF THE APPRAISAL
| | | |
| Scope of the Assignment | | According to the Appraisal Institute’s Code of Professional Ethics and Uniform Standards of Professional Appraisal Practice, the scope of the appraisal is cited as “the extent of the process of collecting, confirming, and reporting data” included in an appraisal report. The scope of this appraisal employs all applicable appraisal techniques and constitutes a Complete Appraisal as defined by USPAP. The presentation of data, analyses and conclusions are presented in summary report format. |
| | | |
| | | The data included in this report has been researched from the subject property’s influencing market. County and City officials were interviewed regarding taxes, zoning requirements, flood zone information, demographic data, planned construction, recently completed developments, and other economic impacting events. Market participants, including real estate brokers and property managers, were consulted regarding market parameters and activity. Lenders as well as investor surveys were consulted regarding investment parameters. The Sales Comparison and Income Capitalization Approaches to value have been performed in estimating the Market Value of the subject. Sales utilized were confirmed with a principal or representative involved with the sale. Leasing agents for the competitive complexes were interviewed regarding property specific information. Supply and demand factors affecting the local market have been analyzed. |
| | | |
| Purpose and Use of Appraisal | | The purpose of the appraisal is to estimate the Market Value of the Fee Simple Estate of the subject property as of April 11, 2006. It is for the internal use of AIMCO to facilitate asset evaluation and to be utilized in conjunction with a planned transaction with the limited partners. |
| | | |
| Property Rights Appraised | | The property interest appraised is that of the Fee Simple Estate. A Fee Simple Estate is defined byThe Dictionary of Real Estate Appraisal, Second Edition AIREA, as: |
| | | |
| | | “Absolute ownership unencumbered by any other interest or estate, subject only to the limitations of the four powers of government (eminent domain, escheat, police power and taxation)”. |
| | | |
| Marketing Period | | The value conclusion reported herein assumes a marketing period of less than one year. According to the Korpacz Real Estate Investor Survey, 1st Quarter 2006, indicates that apartment properties in the national market have an average marketing time of 5.69 months, generally similar to the average of 5.81 months reported one year ago. This estimate seems |
| | | |
| Mountain View Apartments | | May 4, 2006 |
| San Dimas, California | | Page 3 |
| | | |
| | | reasonable, given recent market activity in the influencing area and the profile of the subject property. |
| | | |
| Property History | | Property tax records indicate that VMS National Properties ET AL is the current owner of record. The current owner acquired title to the property on November 7, 1984. No details pertaining the conveyance were provided to the appraisers. No conveyances involving the subject property were noted within the three-year period preceding the effective date of value. To our knowledge there are no contracts of sale pending as of the date this report was prepared, nor are we aware that the property is listed for sale. |
| | | |
| Most Likely Buyer | | National and regional investors typically purchase multifamily properties of this size in markets such as the subject. |
| | | |
| Definition of Market Value | | Market Value, as approved and adopted by the Appraisal Foundation in the Uniform Standards of Professional Appraisal Practice is as follows: |
| | | |
| | | “The most probable price which a property should bring in a competitive and open market under all conditions requisite to a fair sale, the buyer and seller each acting prudently and knowledgeably, and assuming the price is not affected by undue stimulus. |
| | | |
| | | Implicit in this definition is the consummation of a sale as of a specified date and the passing of title from seller to buyer under conditions whereby: |
| | | |
| | | 1. buyer and seller are typically motivated; |
| | | |
| | | 2. both parties are well-informed or well advised, and acting in what they consider their best interests; |
| | | |
| | | 3. a reasonable time is allowed for exposure in the open market; |
| | | |
| | | 4. payment is made in terms of cash in United States dollars or in terms of financial arrangements comparable thereto; and |
| | | |
| | | 5. the price represents the normal consideration for the property sold unaffected by special or creative financing or sales concessions granted by anyone associated with the sale.” |
| | | |
| Mountain View Apartments | | May 4, 2006 |
| San Dimas, California | | Page 4 |
| | | |
REGIONAL OVERVIEW | | |
| | | |
| Introduction | | Real estate values reflect the influence of four primary forces that motivate human activity; social trends, economic conditions, governmental policies and environmental factors. The purpose of the regional overview is to describe and analyze the area within which the interactions of the four major forces influence properties similar to the subject. This section will further analyze past trends for insight into possible future trends affecting the value of real estate. |
| | | |
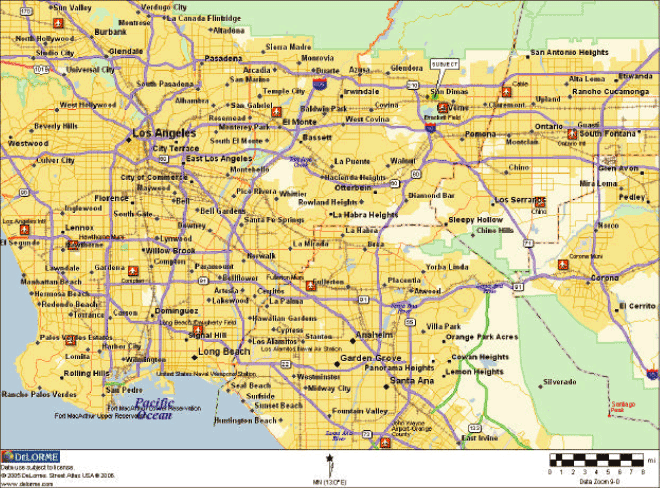
| Overview | | The subject property is located in the Los Angeles MSA, within the city of San Dimas and approximately 45 miles northeast of the Los Angeles Central Business District. Los Angeles County, in which the subject is located, was the first to develop and has always been the largest of the five counties comprising the Los Angeles Metropolitan Area (LAMA). Los Angeles County’s population is 3.5 times the size of Orange County’s, the second largest county in the LAMA. It is 1.5 times the size of the other four counties in the region combined. |
| | | |
| Population | | The urbanized central and southern portions of Los Angeles County are nearly fully developed. Only the northern portion of the county has significant developable land remaining for future growth. However, these areas are separated from the urbanized areas by natural barriers. Most of the future growth in Orange County is expected to occur in the southeastern part of the county where there are large undeveloped tracts of land. Growth in older parts of both counties will be primarily in-fill of vacant parcels and redevelopment of older properties. |
| | | |
| | | During the period between 1970 and 1980, the county’s population grew at an average annual compound rate of 0.60%. This was slow compared to Orange County’s rate of 3.13% during the same decade. This was due to Los Angeles County’s already large size and Orange County’s appeal as an alternative residential area. During the 1980s the pace accelerated in Los Angeles County to 1.68% annual compound growth, while Orange County’s slowed to 2.23%. Both counties’ populations increased at slower rates of 1.13% and 1.61% annually between 1990 and 2000. However, this slowed growth still equated to an average annual population increase of 105,180 persons per year in Los Angeles County and 41,784 persons per year in Orange County. |
| | | |
| | | The slowing of the population growth rates has resulted from the growing scarcity of available land for new development in both counties. Population trends are summarized in the following table showing historical population growth. While the figures in the table are tabulated by the U.S. Census, according to the California Department of Finance the January 2003 populations for Los Angeles and Orange counties were 9.979,600 and 2,978,800, respectively. The figures show 2003 |
| | | |
| Mountain View Apartments | | May 4, 2006 |
| San Dimas, California | | Page 5 |
| | | |
| | | population increases of 1.18% and 1.13%, respectively, for the two counties, which kept decreasing since 2002. |
LOS ANGELES AND ORANGE COUNTIES POPULATION
| | | | | | | | | | | | | | | | | |
| | | Los Angeles County | | Orange County |
| Year | | Population | | Ann. Rate # Chg. | | Population | | Ann. Cpnd. Rate |
| |
U.S. Census – (As of April 1)
|
| 1970 | | | 7,041,980 | | | | — | | | | 1,420,386 | | | | — | |
| 1980 | | | 7,477,400 | | | | 0.60 | % | | | 1,932,921 | | | | 3.13 | % |
| 1990 | | | 8,832,500 | | | | 1.68 | % | | | 2,410,556 | | | | 2.23 | % |
| 2000 | | | 9,884,300 | | | | 1.13 | % | | | 2,828,400 | | | | 1.61 | % |
California Department of Finance – (As of January 1)
|
| 1997 | | | 9,147,100 | | | | | | | | 2,672,800 | | | | | |
| 1998 | | | 9,225,800 | | | | 0.86 | % | | | 2,724,500 | | | | 1.93 | % |
| 1999 | | | 9,330,100 | | | | 1.13 | % | | | 2,776,100 | | | | 1.89 | % |
| 2000 | | | 9,487,400 | | | | 1.69 | % | | | 2,829,800 | | | | 1.93 | % |
| 2001 | | | 9,646,300 | | | | 1.67 | % | | | 2,880,600 | | | | 1.80 | % |
| 2002 | | | 9,817,400 | | | | 1.77 | % | | | 2,930,500 | | | | 1.73 | % |
| 2003 | | | 9,979,600 | | | | 1.65 | % | | | 2,978,800 | | | | 1.65 | % |
| 2004 | | | 10,107,451 | | | | 1.28 | * | | | 3,022,613 | | | | 1.47 | % |
| 2005 | | | 10,226,506 | | | | 1.18 | % | | | 3,056,885 | | | | 1.13 | % |
| | | |
| Employment and Industry | | The sheer size of the five-county Los Angeles Metropolitan Area economy is its most important asset. As a country, the area would reportedly be ranked 11th in the world in terms of productivity and accounts for over 5% of jobs and spending nationally. Job growth from 1994 through 1999 outpaced the national average and in 2001 the region had approximately 1.4 million more jobs than in 1993 when the region’s employment was at its lowest point in recession of the early 1990’s. The Los Angeles region’s recovery has been led by motion picture production, foreign trade, and gains in older manufacturing sectors such as apparel, textiles, furniture, and toys. |
| | | |
| | | At the beginning of 2001, the U.S. and California economies were generally viewed as having slipped into recession. The mild economic downturn was compounded by the 9-11-01 event. However, in its2002-2003 Economic Forecast & Industry Outlook for the Los Angeles Five — County Area, the Los Angeles Economic Development Council (LAEDC) forecasted the five-county region to be minimally impacted by the recession in 2002, with recovery for the region, the state and the nation beginning late 2002. |
| | | |
| | | Economic reality has caused economists to revise their projections regarding the characteristics of the recovery and its timing. During 2002 and 2003, the overall economy, nationally and in California, experienced a “jobless recovery”, a recovery fueled by low interest rates and consumer spending, with increasing corporate profits but no or minimal job growth. |
| | | |
| | | In its mid-year2004-2005 Economic Forecast, the LAEDC projected total Los Angeles County non-farm employment to grow by just 1.0% in 2004, but projected this would increase to 1.6% growth in 2005. In its mid-year2005-2006 Economic Forecast, the LAEDC projected total Los Angeles non-farm employment to again grow by just 1.0% in 2004 or by |
| | | |
| Mountain View Apartments | | May 4, 2006 |
| San Dimas, California | | Page 6 |
| | | |
| | | 40,500 jobs in Los Angeles County in 2005, and projected this would increase to 1.1% growth in 2006. It also forecasted all five counties in the Southern California region to have positive job growth in 2005 and 2006 as follows: Los Angeles – 1.0% and 1.1%, San Bernardino-Riverside – 3.0% and 3.0%, Orange – 1.9% and 1.8%, and San Diego – 1.7% and 1.8%. Year-to-date October 2005, Los Angeles County has gained 14,400 job growth. |
| | | |
| | | LAEDC reports “there is much hand wringing about the weak non-farm employment performance of Los Angeles County. For example, the 2005 estimated average is 4,033,800 jobs, compared with the 2001 average of 4,135,700 jobs, which would be fifteen years of no job growth. However, total civilian employment should average 4,670,800 jobs in 2005, compared with the 2001 average of 4,259,700 jobs. The 2005 average is a new high for the county in this indicator. Many analysts feel that the civilian employment survey is not as accurate as the non-farm establishment survey due to the small sample size, but more people are working as independent contractors or in other ways that do not get captured by the establishment survey. A good case can be made that Los Angeles County is on the leading edge of this trend. Examples include the motion picture/TV production industry, software development, and the independent truck drivers who work at the ports. Anecdotal information also indicates that manufacturing and small contractors are using independent contractors.” |
| | | |
| | | The agency states that looking forward “four industries in Southern California will see good growth into 2006: “classic” aerospace, business & professional management services, technology, and tourism. The list of longer term challenges for Southern California remains little changed, and includes congestion, housing, educational quality, and the question of “who’s in charge.” |
LOS ANGELES COUNTY HISTORICAL JOB GROWTH
| | | | | | | | | | | | | | | | | | | | | | | | | | | | | | | | | | | | | |
| Category | | 1997 | | 1998 | | 1999 | | 2000 | | 2001 | | 2002 | | 2003 | | 2004 | | Oct ‘05 |
| |
| Mining | | | 3,600 | | | | 36,000 | | | | 3,500 | | | | 3,600 | | | | 3,800 | | | | 3,800 | | | | 3,800 | | | | 4,000 | | | | 4,100 | |
| Construction | | | 113,700 | | | | 126,600 | | | | 131,300 | | | | 137,300 | | | | 138,000 | | | | 134,800 | | | | 136,900 | | | | 141,000 | | | | 150,200 | |
| Manufacturing | | | 641,100 | | | | 636,000 | | | | 620,000 | | | | 604,600 | | | | 550,400 | | | | 522,400 | | | | 488,800 | | | | 478,200 | | | | 472,300 | |
| Trade/Trans/Util | | | 779,400 | | | | 787,800 | | | | 805,300 | | | | 817,300 | | | | 806,000 | | | | 809,600 | | | | 798,600 | | | | 802,500 | | | | 789,400 | |
| Information | | | 220,400 | | | | 223,000 | | | | 239,100 | | | | 249,000 | | | | 217,700 | | | | 197,900 | | | | 206,600 | | | | 203,200 | | | | 209,000 | |
| Financial Activities | | | 221,100 | | | | 224,000 | | | | 223,800 | | | | 219,900 | | | | 231,800 | | | | 237,100 | | | | 242,400 | | | | 245,000 | | | | 246,300 | |
| Professional & Business | | | 578,500 | | | | 592,500 | | | | 608,300 | | | | 610,500 | | | | 583,600 | | | | 575,700 | | | | 560,400 | | | | 570,500 | | | | 572,200 | |
| Education & Health | | | 384,600 | | | | 397,600 | | | | 410,100 | | | | 423,000 | | | | 447,000 | | | | 463,000 | | | | 472,400 | | | | 476,600 | | | | 483,900 | |
| Leisure & Hospitality | | | 329,500 | | | | 335,100 | | | | 339,800 | | | | 350,000 | | | | 348,700 | | | | 356,900 | | | | 367,700 | | | | 372,400 | | | | 383,800 | |
| Other Services | | | 131,700 | | | | 136,100 | | | | 137,200 | | | | 140,600 | | | | 143,400 | | | | 146,600 | | | | 145,000 | | | | 144,900 | | | | 146,200 | |
| Government | | | 542,000 | | | | 556,600 | | | | 580,800 | | | | 591,100 | | | | 610,300 | | | | 612,600 | | | | 595,500 | | | | 584,800 | | | | 580,100 | |
| |
| Total | | | 3,945,600 | | | | 4,051,300 | | | | 4,099,200 | | | | 4,146,900 | | | | 4,080,700 | | | | 4,060,400 | | | | 4,018,100 | | | | 4,023,100 | | | | 4,037,500 | |
| Change | | | — | | | | 105,700 | | | | 47,900 | | | | 47,700 | | | | -66,200 | | | | -20,300 | | | | -42,300 | | | | 5,000 | | | | 14,400 | |
| | | | | | | | | | | | | | | | | | | | | | | | | | | | | | | | | | | | | |
| Unemployment | | | 6.0 | % | | | 6.0 | % | | | 5.3 | % | | | 5.3 | % | | | 6.3 | % | | | 6.4 | % | | | 6.3 | % | | | 6.0 | % | | | 4.5 | % |
| California | | | 5.8 | % | | | 5.5 | % | | | 4.7 | % | | | 4.7 | % | | | 6.2 | % | | | 6.7 | % | | | 6.3 | % | | | 5.7 | % | | | 5.2 | % |
| U.S. | | | 4.7 | % | | | 4.4 | % | | | 4.0 | % | | | 4.0 | % | | | 5.7 | % | | | 6.0 | % | | | 5.7 | % | | | 5.4 | % | | | 5.0 | % |
Source: CA Employment Development Department
The following table summarized the major employers in Los Angeles County, sorted in alphabetical order by company name.
| | | |
| Mountain View Apartments | | May 4, 2006 |
| San Dimas, California | | Page 7 |
MAJOR EMPLOYERS IN LOS ANGELES COUNTY
| | | | | |
| Employer Name | | Location | | Industry |
| |
| Aerospace Corp. | | El Segundo | | Commercial Physical Research |
| American Honda Motor Con Inc. | | Torrance | | Automobile & Truck Broker |
| American Honda Motorcycle DIV | | Torrance | | Marketing Programs & Services |
| Amtrak | | Los Angeles | | Government |
| California Institute of Technology | | Pasadena | | University |
| California State University | | Long Beach | | Recylcing Centers |
| Edison International | | Rosemead | | Utilities-Holding Company |
| Fox Films | | Los Angeles | | Television Station |
| Jet Propulsion Lab | | Pasadena | | Marketing Programs & Services |
| Kaiser Foundation Hospital | | Los Angeles | | Hospital |
| Kaiser Permanente | | Los Angeles | | Physicians & Surgeons |
| King Drew Medical Ctr. | | Los Angeles | | Hospital |
| Little CO of Mary Hospital | | Torrance | | Hospital |
| Lockheed Martin Aeronautics Co | | Burbank | | Aircraft Manufacturer |
| Long Beach Memorial Hospital | | Long Beach | | Hospital |
| Los Angeles County Medical Center | | Los Angeles | | Hospital |
| Memorial Rehabilitation Hospital | | Long Beach | | Rehabilitation Services |
| Six Flags | | Valencia | | Amusement Park |
| UCLA | | Los Angeles | | University |
| USC | | Los Angeles | | University |
| VA Greater Los Angeles | | Los Angeles | | Hospital |
| Walt Disney CO | | Burbank | | Motion Picture Producer & Studio |
| Westcoast | | Carson | | Marketing Programs & Services |
| Xerox Corp | | El Segundo | | Office Machiens NEC |
| | | |
| Transportation | | Transportation throughout Southern California is largely dependent on the private automobile, which is supplemented by local and county bus and rail services. One of the assets for Southern California, which has spurred its tremendous growth, has been its freeway system. The Southern California freeway system consists of 650 miles in six to twelve lanes of modern concrete roadways. The region is also well served with a modern system of surface streets. |
| | | |
| | | The LAMA is a classic example of the multiple nuclei theory of urbanization. Its formation into an urban conglomerate of multiple centers was facilitated by the proliferation of automobiles and the construction of numerous highways and interstate freeways. These are complemented by international and regional airports, the port facilities and rail lines conveniently situated throughout the region. |
| | | |
| | | While Los Angeles is served by all modes of transportation, the dominance of the highway system is evident. The basin is crisscrossed by interstate freeways connecting the area to all others areas of Southern California and the southwestern United States. Construction is on-going in the improvement of the system, with the expansion of the Orange County stretch of north-south Interstate 5 the current focus. In addition to the freeways, there is a large network of highways and thoroughfares providing surface road transport throughout the entire basin. The LAMA has become the transportation and distribution hub for the entire southwest U.S.
Aside from the growing light-rail system, passenger and freight rail links are found throughout the Los Angeles-Orange County-San Diego area. Connections provide service to other parts of the continental U.S. and |
| | | |
| Mountain View Apartments | | May 4, 2006 |
| San Dimas, California | | Page 8 |
| | | |
| | | Canada. The proximity of several international and regional airports and deep-water ports in the LAMA has been an important factor in the growth of international trade. Los Angeles International Airport is one of the busiest commercial airports in the United States. Twenty-three miles south of Downtown, the Los Angeles/Long Beach harbors provide sea transportation and cargo facilities, and combined represents the United State’s busiest port. Container volume continues to grow at these facilities. The proposed Alameda Corridor project, expected to be developed within a ten-year time span, will greatly improve access between the Los Angeles/Long Beach harbors and the railyards southeast of Downtown L.A. through a cooperative use of existing rail right-of-ways. |
| | | |
| | | Nonetheless, population growth within the region continues to burden the existing transportation infrastructure. The LAEDC reports that California’s budget problems will impact local governments, as will as transportation projects in the near term and as the region’s population continues to grow, the “transportation deficit” will worsen. |
| | | |
| Foreign Trade | | The combined Ports of Los Angeles and Long Beach represent the largest man-made facilities on the West Coast providing break-bulk, dry-bulk, general containerized, and liquid cargo shipping. These, combined with the Los Angeles and Ontario international airports and the John Wayne airport, handle one of the highest levels of freight volume in the world. In 1993 the LAMA region passed New York in trade goods volume as the largest in the nation. Together, the ports account for about 25% of all U.S. water-based trade. The following table shows historical port volume by physical cargo units. |
HISTORICAL PORT CARGO VOLUME
(IN TEUs –equivalent to one 20-foot cargo container)
| | | | | | | | | | | | | | | | | |
| Year | | Port of Los Angeles | | Port of Long Beach | | Total Containers | | % Chg. |
| |
| 1995 | | | 2,500,000 | | | | 2,843,502 | | | | 5,343,502 | | | | | |
| 1996 | | | 2,600,000 | | | | 3,067,334 | | | | 5,667,334 | | | | 6.1 | % |
| 1997 | | | 2,900,000 | | | | 3,504,603 | | | | 6,404,603 | | | | 13.0 | % |
| 1998 | | | 3,300,000 | | | | 4,097,689 | | | | 7,397,689 | | | | 15.5 | % |
| 1999 | | | 3,828,850 | | | | 4,408,480 | | | | 8,237,330 | | | | 11.4 | % |
| 2000 | | | 4,879,428 | | | | 4,600,787 | | | | 9,480,215 | | | | 15.1 | % |
| 2001 | | | 5,183,519 | | | | 4,462,959 | | | | 9,646,478 | | | | 1.8 | % |
| 2002 | | | 6,105,863 | | | | 4,524,038 | | | | 10,629,901 | | | | 10.2 | % |
| 2003 | | | 7,178,940 | | | | 4,658,124 | | | | 11,837,064 | | | | 11.4 | % |
| 2004 | | | 7,385,227 | | | | 5,703,832 | | | | 13,089,059 | | | | 10.6 | % |
| | | |
| | | The total dollar volume of trade through the Los Angeles Customs District has increased in every year since 1979. Los Angeles passed New York to retake the lead in foreign trade volume for the nation. The top five trade centers in 2003 were Los Angeles ($214.3 billion), New York ($209.8 billion), Detroit ($179.3 billion), Laredo (114.3 billion), and New Orleans ($87.7 billion). Excluding the peak recessionary year |
| | | |
| Mountain View Apartments | | May 4, 2006 |
| San Dimas, California | | Page 9 |
| | | |
| | | of 2001, Los Angeles county ports have had double-digit trade increases in every year from 1997 forward. |
| | | |
| | | The growth in foreign trade supports job gains in professional services (like construction, design, and engineering), financial services, wholesale trade, manufacturing, and tourism and entertainment, according the Center for the Continuing Study of the California Economy. |
| | | |
| Conclusion | | The Los Angeles Metropolitan Area’s diversity and strength have acted as a magnet in attracting in-migration which, coupled with a steady natural increase, have created the second largest population center in the country. A possible impediment to future growth in the developed areas of the region is the capacity of the infrastructure. In many areas it has stressed by sustained population and economic growth. Some improvements to these systems have now commenced planning or construction. |
| | | |
| | | Notwithstanding the above, most economic forecasts predict strong population and economic growth for the region over the next decade. The economic base of the region has changed and diversified since the onset of the last recession. Declining industries have been replaced with growth industries. This change has been facilitated by the strong entrepreneurial approach to problem solving which is the character of the region. |
| | | |
NEIGHBORHOOD OVERVIEW | | |
| | | |
| | | TheAppraisal of Real Estatedefines a neighborhood as “a group of complimentary land uses”. A neighborhood should be distinguished from a district, which is defined as “a type of neighborhood that is characterized by homogenous land use”. A neighborhood will contain land uses complimentary to one another. For example, predominantly residential neighborhoods typically contain some commercial properties that provide services for local residents. The boundaries of a neighborhood can be physical such as a lake, stream or major highway or they may be less easily discernible such as changes in prevailing land use or occupant characteristics. |
| | | |
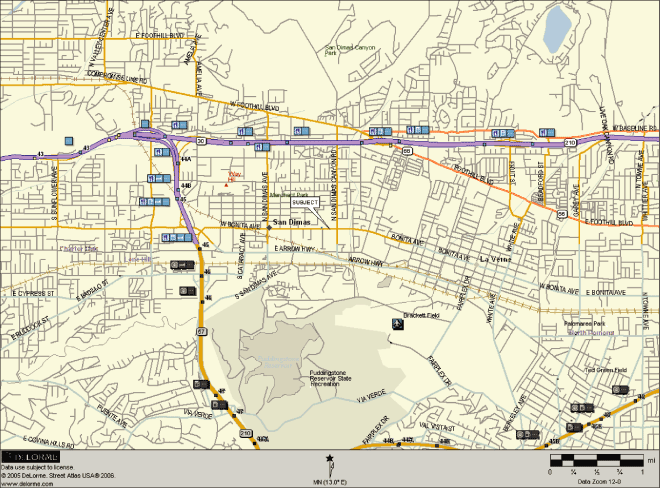
| Location: | | The subject property is located in the central portion of the City of San Dimas, at the southwest corner of East Bonita Avenue and South Dimas Canyon Road. San Dimas is a city located in the northest sector of Los Angeles County, approximately 45 miles northeast of the City of Los Angeles. |
| | | |
| | | As of the 2004 census, San Dimas had a total population of 36,200, and encompasses 15.5 square miles. The Foothill Freeway (I-210) connects San Dimas to the San Fernando Valley, and the San Bernardino Freeway (I-10) connects it to downtown Los Angeles. Situated at the southwest corner of East Bonita Avenue and South San Dimas Canyon Road, the |
| | | |
| Mountain View Apartments | | May 4, 2006 |
| San Dimas, California | | Page 10 |
| | | |
| | | subject property is accessible to neighborhood services and employment centers. The location of the subject property is rated as average. |
| | | |
| Access: | | Primary roadways in the neighborhood include the east/west traffic arteries of East Foothill Boulevard, East Bonita Avenue, East Arrow Highway, and Interstates IH-210 and IH-10. North/south traffic arteries include SH-57, North San Dimas Avenue, White Avenue, Garey Avenue and North Towne Avenue.. All of the aforementioned north/south roadways provide direct access to both IH-210 and IH-10. IH-210 is approximately one mile north of the subject property and IH-10 is approximately 2.5 miles south. The well-managed network of regional highways renders good access to and within the neighborhood. |
| | | |
| | | The subject neighborhood is accessible to neighborhood services and employment centers. Recreational parks and lakes are located within a short commute of the subject neighborhood. Commercial, retail uses and local businesses are abundant along the two Interstates and East Bonita Avenue. Travel time to downtown Los Angeles, approximately 45 miles southwest, is around one hour. Public services, including schools and medical facilities, are in close proximity. |
| | | |
| Land Use: | | The subject neighborhood is a mature commercial and residential district. The area realized much of its growth in the mid 1960’s to late 1970s. Most of the apartments in the area were built in the 1970s. As the City of San Dimas has become fairly densely populated, most of the land in the subject neighborhood has been developed. Approximately 85% of the land area is developed with limited land available to accommodate additional development. |
| | | |
| | | Multifamily, single-family and commercial development is prevalent along the primary roadways. Underutilized land in the form of public green belts, parks and athletic fields are in close proximity to the subject property and scattered throughout the neighborhood. The predominate land uses in the neighborhood are both commercial and residential in nature. Residential uses consist of both single and multifamily developments. |
| | | |
| Adjacent Land Uses: | | South: Single-family residential housing |
| | | North: Office complex and townhomes |
| | | East: Bicycle shop and seminary |
| | | West: Single-family residential housing |
| | | |
| New Construction: | | Due to the mature nature of the neighborhood and limited availability of vacant land suitable for development, no new construction was noted in the immediate vicinity of the subject property. |
| | | |
| Change in Current Use | | The neighborhood can be classified as being in a mature stage of its life cycle as there is limited land available to accommodate new development. This area of San Dimas is anticipated to remain a desirable |
| | | |
| Mountain View Apartments | | May 4, 2006 |
| San Dimas, California | | Page 11 |
| | | |
| | | commercial and residential location. No material change in existing land uses is anticipated. |
| | | |
| Conclusion | | The property is located in the central portion of the City of San Dimas. The area is easily accessible from all parts of San Dimas as well as cities from beyond due to its proximity to two interstate freeways. As a result of its desirable location, the area has proven to be a desirable residential and commercial location. Employers are located in close proximity to the subject neighborhood. The presence of employers in the area as well as its close proximity to educational and medical facilities has enhanced the desirability of the neighborhood as a residential location. Area residents are offered a broad range of services and good access to other parts of San Dimas and the greater Los Angeles area. |
| | | |
SITE ANALYSIS | | |
| | | |
| Location | | The site is located in the central portion of the City of San Dimas, at the southwest corner of East Bonita Avenue and South San Dimas Canyon Road. |
| |
| Size | | The site is near square in shape and consists of a total land area of approximately 8.16 + acres. |
| |
| Excess Land | | None |
| |
| Topography | | Generally level and on grade with the bounding streets of East Bonita Avenue and South San Dimas Canyon Road. |
| |
| Site Improvements | | The approximate 8.16 + acre site is improved with a 168-unit garden-style apartment community known as the Mountain View Apartments. See Description of the Improvements section of this report for details concerning site improvements. |
| |
| Street Improvements | | East Bonita Avenue is a neighborhood collector street that is oriented in an east/west direction. South San Dimas Canyon Road is Oriented in an north/.south direction |
| |
| Desirability of Location | | Average |
| |
| Access to Major Arteries | | Good |
| |
| Access to Local Arteries | | Average |
| |
| Curb Appeal | | Average |
| |
| Ingress/Egress | | Average – Adequate road frontage along two minor neighborhood collector streets. |
| |
| Visibility from Road | | Average |
| |
| Public Transportation | | Average |
| |
| Neighborhood Appearance | | Average |
| |
| Flood Zone Map | | According to the Federal Emergency Management Agency (FEMA), the property is located within Zone C, an area outside any special flood hazard areas as defined by FEMA. |
| |
| Easements | | The appraisers were not provided with a site survey or title documents that provide information on the existence of easements and encroachments. Other than typical utility easements, visual observation of the site did not reveal the existence of adverse easements or encroachments, however in the absence of a site survey and title |
| | | |
| Mountain View Apartments | | May 4, 2006 |
| |
| San Dimas, California | | Page 12 |
| | | |
| | | documents, the appraiser makes no representation as to the presence of adverse easements or encroachments. |
| |
| Soil Conditions | | Visual observation does not indicate any surface or subsurface soil conditions that are unusual for the area. Based on our inspection, it appears that the soil is of adequate load bearing capacity to support the subject improvements. No major foundation cracks were visible upon inspection of the subject improvements that would indicate the subsoil conditions are not stable. No nuisances or hazards were noted. |
| |
| Land Use Restrictions | | The appraisers are unaware of any deed restrictions which may adversely affect the utility of the subject site; however, this is not a guarantee that such restrictions may exist. Therefore, it is recommended that a current title policy be obtained for the subject property which would disclose any land use restrictions which may exist. |
| |
| Utilities | | All municipal utilities (water and sewer) and private services (electric, gas, telephone) are available to the site. |
| |
| Conclusion | | The subject represents a desirable site for multifamily development. |
| | | |
REAL ESTATE TAXES | | |
| | | |
| Assessor’s Parcel No: | | 8390-014-027 (Los Angeles County Assessor) |
| |
| Effective tax rate | | 1.2939959 per $100 of assessed value |
| |
| Equalization Rate | | Assessed values for real property in Los Angeles County are based on 100% of the market value estimated for the property by the county assessor. |
| |
| 2005-2006 Assessed Value | | $11,062,350 |
| |
| Tax Analysis: | | The subject property is situated within the taxing jurisdictions of the City of San Dimas, Los Angeles County, Unified Schools, Community College, Flood Control, Metro Water District and a General Tax Levy. The Los Angeles County Property Appraiser assesses the property for all of the applicable taxing jurisdictions. |
| |
| | | The subject property is under the taxing jurisdiction of Los Angeles County. The Proposition 13 Amendment to the California State Constitution limits the maximum annual tax on real property to one percent of market value plus an additional sum to pay for bonded indebtedness on affected property. Per Proposition 13, properties are only reassessed upon sale or significant improvement. Between these events, the assessed value may be increased by a maximum of 2.0% per year. For the purposes of this report, the assessed value is based on an assumed sale at our concluded market value. Our estimates of property taxes used in the direct capitalization method assumes a sale of the subject property at our market value conclusion and the above effective tax rate. |
| |
| Estimated Tax Liability | | $391,300 (Concluded value multiplied by the effective tax rate of approximately 1.30 per $100 of assessed value.) |
| | | |
| Mountain View Apartments | | May 4, 2006 |
| San Dimas, California | | Page 13 |
| | | |
ZONING | | |
| | | |
| |
| Zoning: | | The site is zoned MF-16 (Multiple-Family Zone) by the City of San Dimas. |
| |
| Permitted Use | | The MF zoning designation is intended to provide for the development of medium and high density multiple-family projects, to ensure that such development is compatible with contiguous uses, to encourage well planned neighborhoods through creative and imaginative site planning and to ensure integrated design and unified control of design.. The MF-16 designation shall have a maximum density of 16 units per acre. |
| |
| Site Area: | | N/A |
| |
| Maximum Ground Coverage: | | 60 percent of the total lot or parcel area. |
| |
| Maximum Height: | | 2 stories or 30 feet |
| |
| Maximum Density: | | 16 units per acre |
| |
| Front Set Back: | | Average depth of 25 feet with minimum depth of 15 feet. |
| |
| Side Yard: | | 20 to 30 feet |
| |
| Rear Set Back: | | 20 feet |
| |
| Minimum Floor Area: | | 450 to 850 (0-3 bedrooms, add 200 feet per additional bedroom) |
| |
| Parking Requirements: | | No requirement |
| |
| Comments: | | It appears as though the existing improvements represent a non- conforming use of the site with regard to zoning, in that its developed density exceeds the allowed density. |
| | | |
DESCRIPTION OF IMPROVEMENTS | | |
| | | |
| The subject improvements consist of a 168-unit garden-style apartment complex known as the Mountain View Apartments. The following offers a description of the improvements. |
| | | |
| KTR Site Inspector: | | Charles K. Russell |
| |
| Date of Inspection: | | April 11, 2006 |
| |
| Property Contact: | | Sharry Rees |
| |
| Year Built: | | 1978 |
| |
| Number Units: | | 168 |
| |
| Configuration/Stories: | | Garden-style complex, 2-story residential structures |
| |
| Net Rentable Area: | | 167,336 square feet |
| |
| EXTERIOR | | |
| |
| Foundations: | | Reinforced concrete slabs, on grade |
| |
| Frame: | | Wood frame |
| |
| Exterior Walls: | | Stucco and wood trim |
| |
| Roof: | | Flat built-up |
| |
| Doors and Windows: | | Exterior entrance doors are hollow core wood. Interior doors are hollow core wood. The windows are single-pane glass set in aluminum frames. |
| |
| HVAC: | | Central AC condensing units, heat provided by a gas-fired boiler system. |
| |
| Plumbing: | | Kitchens contain sink and dishwasher. Bathrooms contain porcelain toilet and sink and combination fiberglass bathtub/shower unit. Hot water is provided by a gas-fired boiler system. |
| |
| Electrical: | | Property is sub-metered for electric, electricity is paid by the tenant. |
| | | |
| Mountain View Apartments | | May 4, 2006 |
| San Dimas, California | | Page 14 |
| | | |
| Parking and Walkways: | | The parking areas and internal roadways are asphalt paved. Walkways are concrete paved. There is adequate on-site parking provided. |
| | | |
| INTERIOR | | |
| |
| Walls and Ceilings: | | Walls are painted sheetrock and the gypsum ceilings are covered with a sprayed-on textured surface. |
| |
| Floors: | | Interior floors are carpet over padding and sheet vinyl in living areas, carpet over padding in bedrooms and sheet vinyl in the kitchens and bathroom. |
| |
| Kitchen Equipment: | | Built-in wood cabinets with laminate counter tops and stainless steel or porcelain sink. Appliances include a combination range/oven, exhaust fan, disposal and dishwasher. |
| | | |
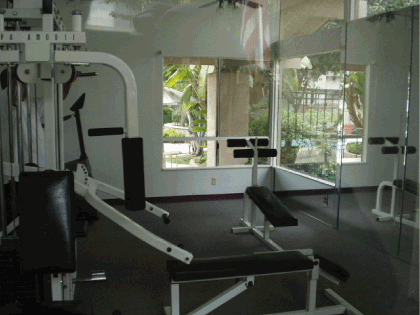
| PROJECT AMENITIES | | |
| |
| Security: | | No |
| |
| Swimming Pool: | | Yes |
| |
| Fitness Center: | | Yes |
| |
| Clubroom: | | No |
| |
| Tennis Court: | | No |
| |
| Basketball Court: | | No |
| |
| On-site Management Office: | | Yes |
| |
| Laundry Room: | | Yes |
| |
| Microwave: | | No |
| |
| Compactor: | | No |
| |
| Fireplace: | | No |
| |
| Ceiling Fans: | | In living area |
| |
| Cable TV: | | Yes (prewire) |
| |
| Balconies/Patios: | | Yes |
| |
| Perimeter Fencing: | | No |
| |
| Access Controlled Entry: | | No |
| |
| Other: | | Covered parking, playground and sauna |
The following chart illustrates the property’s unit breakdown and size.
MOUNTAIN VIEW APARTMENTS – UNIT MIX
| | | | | | | | | | | | | |
| Unit Type | | No, of units | | Size (SF) | | Total (SF) |
| |
| 2BR/1BA | | | 68 | | | | 912 | | | | 62,016 | |
| 2BR/2BA | | | 56 | | | | 996 | | | | 55,776 | |
| 3BR/2BA | | | 44 | | | | 1126 | | | | 49,544 | |
| Totals/Average | | | 168 | | | | 996 | | | | 167,336 | |
CONDITION/MAINTENANCE
| | | |
| Overall Condition: | | Average |
| |
| Landscaping: | | Average |
| |
| Parking: | | Adequate |
| |
| Sidewalks/Curbs: | | Average |
| |
| Walls/Fences: | | Average |
| |
| Refuse Area: | | Average |
| |
| Basement: | | N/A |
| | | |
| Mountain View Apartments | | May 4, 2006 |
| San Dimas, California | | Page 15 |
| | | |
| Health Club: | | Average |
| |
| Club Room: | | Average |
| |
| Exterior Walls: | | Average |
| |
| Roofs: | | Average |
| |
| Stairs: | | Average |
| |
| Lobby/Hallways: | | Average |
| |
| Entry Doors: | | Average |
| |
| Patios/Balconies: | | Average |
| |
| Elevators: | | Average |
| |
| Apartment Interiors: | | |
| |
| Overall: | | Average |
| |
| Kitchen Equipment: | | Average |
| |
| Mechanical Equipment: | | Average |
| |
| Bathroom: | | Average |
| |
| Walls/Ceilings: | | Average |
| |
| Layout: | | Average |
| |
| Light and View Quality: | | Average |
| | | |
| Cosmetic Repairs: | | Our physical inspection revealed that the subject property is in average condition. |
| |
| Deferred Maintenance: | | No material elements of deferred maintenance were noted during the appraiser’s inspection of the property and on-site management reported none. |
| |
| Comparability: | | Similar to competing properties of the same vintage. |
| |
| Observed Effective Age: | | 20 years (lower than actual age of the improvements due to adequate upkeep and maintenance of the improvements) |
| |
| Economic Life: | | 45 years (per Marshall Valuation Service Manuel) |
| |
| Remaining Economic Life: | | 25 years |
| |
| General Comments: | | Based on our inspection, the subject property is considered to be of average quality construction and to be in average condition overall. It competes effectively with other properties of the same vintage. |
| | | |
| Mountain View Apartments | | May 4, 2006 |
| San Dimas, California | | Page 16 |
APARTMENT MARKET OVERVIEW
The following apartment market analysis is designed to provide the reader an understanding of the Los Angeles area apartment market and its direct influence on the Norwalk market. The most recent source of data available to the appraisers was the “Hendricks & Partners Apartment Update 2005-Review” and the “Apartment Research Report-October 2005”, prepared by Marcus & Millichap.
LOS ANGELES COUNTY APARTMENT MARKET
| | | |
| Overview | | The Los Angeles apartment market is ranked 5th in the nation out of 37 markets nationally in 2005, down from rank No. 3 in 2004, and No. 2 in 2003, by Marcus & Millichap, a national brokerage firm specializing in apartment investment sales. |
| | | |
| | | Most economic reports project that long-term job growth in Los Angeles County should be in the range of 40,000 to 80,000 per year. The Los Angeles Economic Development Council projects growth of about 40,500 jobs in Los Angeles County in 2005, in its mid-year 2005-2006 forecast. Generally, demand for one rental unit is generated by the creation of six jobs. Based on this ratio, demand for roughly 7,000 to 13,000 new units per year would be required to meet annual demand. Marcus & Millichap reports 5,000 to 6,000 units each year will be added in the foreseeable future. Of the 5,000 units being completed in 2005, roughly one-third will be luxury apartments built in the Downtown submarket. Clearly, 6,000 new apartment units per year are not nearly enough to meet the demand created by the roughly 120,000 new residents to the county each year. |
| | | |
| | | Home price appreciation moderated across L.A. and Ventura counties in 2005 as affordability waned and interest rates began to tick up. As single-family housing affordability dwindled to 12% in L.A. and 13% in Ventura by the end of 2005, developers and buyers showed increased interest in multifamily product and many renters were unable to make the transition to home ownership. Consequently, vacancy rates remained tight in the L.A. North apartment market as investors converted buildings to condos, further reducing excess supply. |
| | | |
| | | Absorption dropped to 334 units in 2005 from 1,484 units in 2004. This is more of a reflection of a lack of new rental product than a drop in demand. |
| | | |
| | | Only 333 units entered lease-up in 2005, the market’s lowest total in years. This figure amounts to about 20% of 2004’s annual total. Of these 333 units, less than 100 were in the Pasadena (Burbank/Glendale submarket). |
| | | |
| | | With construction and absorption keeping pace with one another, the average apartment vacancy rate measured 3.7% at the end of 2005, virtually unchanged from a year prior. |
| | | |
| | | With most submarkets reporting rent gains of 5% or better, the region’s overall average rent increased 5.1% over the 12-month period ended December 2005, up from $1,291 to $1,357. |
| | | |
| Mountain View Apartments | | May 4, 2006 |
| San Dimas, California | | Page 17 |
L.A. NORTH/VENTURA COUNTY 2005 FOURTH QUARTER VACANCY & RENT
| | | | | | | | | | | | | | | | | | | | | | | | | |
| | | Vacancy | | Vacancy | | Avg. Rent | | Avg. Rent | | Avg. Rent | | Avg. Rent |
| Submarket | | 2005 | | 2004 | | Increase 2005 | | Increase 2004 | | 2005 | | 2004 |
| |
| Burbank/Glendale | | | 3.1 | % | | | 3.7 | % | | | 6.4 | % | | | 7.6 | % | | $ | 1,743 | | | $ | 1,638 | |
| Northeast Valley | | | 2.3 | % | | | 1.5 | % | | | 4.9 | % | | | 6.8 | % | | $ | 984 | | | $ | 937 | |
| Western Valley | | | 7.5 | % | | | 4.5 | % | | | 5.5 | % | | | 7.1 | % | | $ | 1,646 | | | $ | 1,561 | |
| Northwest | | | 2.6 | % | | | 4.3 | % | | | 5.9 | % | | | 6.2 | % | | $ | 1,353 | | | $ | 1,278 | |
| Canoga/Reseda | | | 2.4 | % | | | 3.4 | % | | | 3.8 | % | | | 6.5 | % | | $ | 1,148 | | | $ | 1,106 | |
| South Valley | | | 5.1 | % | | | 3.1 | % | | | 0.1 | % | | | 3.1 | % | | $ | 1,479 | | | $ | 1,478 | |
| Mid-Valley | | | 4.1 | % | | | 3.2 | % | | | 3.5 | % | | | 2.1 | % | | $ | 1,097 | | | $ | 1,060 | |
| Tarzana/Woodland Hills | | | 2.9 | % | | | 3.0 | % | | | 8.1 | % | | | 1.7 | % | | $ | 1,557 | | | $ | 1,441 | |
| Ventura County | | | 4.5 | % | | | 5.2 | % | | | 4.5 | % | | | 2.9 | % | | $ | 1,368 | | | $ | 1,390 | |
| Santa Clarita | | | 3.3 | % | | | 3.7 | % | | | 5.1 | % | | | 2.9 | % | | $ | 1,393 | | | $ | 1,325 | |
| Desert Communities | | | 3.2 | % | | | 1.8 | % | | | 6.6 | % | | | 8.8 | % | | $ | 898 | | | $ | 843 | |
| Totals | | | 3.7 | % | | | 3.8 | % | | | 5.1 | % | | | 4.1 | % | | $ | 1,357 | | | $ | 1,291 | |
L.A. County Vacancy and Rental Rates
| | | |
| | | We have reviewed the findings of the fourth quarter 2005REALFACTS Apartment Vacancy/Rent Surveyfor the Los Angeles County apartment market and its 29 sub-markets. The study summarizes trends that have occurred over the last two years. It separates buildings by categories, including age, size, and rent level. In addition, we have interviewed managers, owners, and leasing agents in the subject’s area regarding their views of the current market conditions. The chart below summarizes the current countywide inventory characteristics. |
LOS ANGELES COUNTY
APARTMENT MARKET CHARACTERISTICS
| | | |
| Number of Complexes | | 518 |
| Total Unit Inventory | | 121,601 |
| Avg. Year Built | | 1978 |
| Avg. No. Units Per Complex | | 234 |
| Avg. Occupancy Rate | | 95.8% |
| Avg. Rent/Unit/Month | | $1,475 |
Source: RealFacts, 4Q’05
| | | |
| | | The following table shows the historical apartment rent growth by unit type and total market occupancy rates for Los Angeles County. |
| | | |
| Mountain View Apartments | | May 4, 2006 |
| San Dimas, California | | Page 18 |
LOS ANGELES COUNTY HISTORICAL RENT AND OCCUPANCY TREND
| | | | | | | | | | | | | | | | | | | | | | | | | | | | | | | | | | | | | | | | | |
| | | | | | | | | | | | | | | | | | | | | | | | | | | | | | | | | | | | | | | % Chg. |
| Unit Type | | 1997 | | 1998 | | 1999 | | 2000 | | 2001 | | 2002 | | 2003 | | 2004 | | 2005 | | An. Avg. |
| |
| Studio | | $ | 690 | | | $ | 697 | | | $ | 733 | | | $ | 822 | | | $ | 894 | | | $ | 929 | | | $ | 951 | | | $ | 992 | | | $ | 1,055 | | | | 6.6 | % |
| Jr. 1/1 | | $ | 640 | | | $ | 670 | | | $ | 713 | | | $ | 813 | | | $ | 879 | | | $ | 1,010 | | | $ | 1,117 | | | $ | 1,167 | | | $ | 1,188 | | | | 10.7 | % |
| 1/1 | | $ | 800 | | | $ | 840 | | | $ | 894 | | | $ | 1,008 | | | $ | 1,087 | | | $ | 1,135 | | | $ | 1,187 | | | $ | 1,241 | | | $ | 1,306 | | | | 7.9 | % |
| 2/1 | | $ | 760 | | | $ | 788 | | | $ | 836 | | | $ | 920 | | | $ | 1,032 | | | $ | 1,107 | | | $ | 1,159 | | | $ | 1,209 | | | $ | 1,263 | | | | 8.3 | % |
| 2/2 | | $ | 1,052 | | | $ | 1,095 | | | $ | 1,146 | | | $ | 1,281 | | | $ | 1,402 | | | $ | 1,456 | | | $ | 1,530 | | | $ | 1,597 | | | $ | 1,690 | | | | 7.6 | % |
| 2 TH | | $ | 1,069 | | | $ | 1,141 | | | $ | 1,282 | | | $ | 1,406 | | | $ | 1,514 | | | $ | 1,595 | | | $ | 1,663 | | | $ | 1,583 | | | $ | 1,666 | | | | 7.0 | % |
| 3/2 | | $ | 1,161 | | | $ | 1,225 | | | $ | 1,297 | | | $ | 1,405 | | | $ | 1,528 | | | $ | 1,631 | | | $ | 1,692 | | | $ | 1,732 | | | $ | 1,831 | | | | 7.2 | % |
| 3 TH | | $ | 1,598 | | | $ | 1,601 | | | $ | 1,787 | | | $ | 1,996 | | | $ | 2,118 | | | $ | 2,152 | | | $ | 2,083 | | | $ | 2,056 | | | $ | 2,319 | | | | 5.6 | % |
| Wtg. Avg. | | $ | 901 | | | $ | 939 | | | $ | 995 | | | $ | 1,111 | | | $ | 1,206 | | | $ | 1,269 | | | $ | 1,328 | | | $ | 1,383 | | | $ | 1,467 | | | | 7.9 | % |
| |
| | | | | | | | | | | | | | | | | | | | | | | | | | | | | | | | | | | | | | | | | |
| Occupancy | | | 95.0 | % | | | 96.3 | % | | | 97.3 | % | | | 97.5 | % | | | 96.4 | % | | | 95.4 | % | | | 95.3 | % | | | 95.2 | % | | | 95.8 | % | | | — | |
| |
Source: RealFacts
| | | |
| | | The data shows the consistent strength of the county apartment market with a high average occupancy over 95% for the last eight years. Rent growth also averaged a high annual rate of 7.9% over the nine years from 1997 to 2005. |
| |
| | | The following table shows the Los Angeles County trend in apartment rents and occupancy quarter-by-quarter over the last 36 months. This data gives a more detailed look at recent market trends. This data indicates the county apartment market vacancy has fallen in a narrow range from the fourth quarter of 2003 to the fourth quarter of 2005, and market rental rates have increased 6.5% over the last year. |
LOS ANGELES COUNTY RECENT RENT AND OCCUPANCY TREND
| | | | | | | | | | | | | | | | | | | | | | | | | | | | | | | | | | | | | | | | | |
| | | | | | | | | | | | | | | | | | | | | | | | | | | | | | | | | | | | | | | Prev. Yr. |
| Unit Type | | 4Q ‘03 | | 1Q ‘04 | | 2Q ‘04 | | 3Q ‘04 | | 4Q ‘04 | | 1Q ‘05 | | 2Q ‘05 | | 3Q ‘05 | | 4Q ‘05 | | % Chg. |
| |
| 0/1 | | $ | 967 | | | $ | 978 | | | $ | 990 | | | $ | 995 | | | $ | 1,005 | | | $ | 1,023 | | | $ | 1,054 | | | $ | 1,057 | | | $ | 1,085 | | | | 8.0 | % |
| Jr. 1/1 | | $ | 1,152 | | | $ | 1,173 | | | $ | 1,168 | | | $ | 1,177 | | | $ | 1,146 | | | $ | 1,149 | | | $ | 1,184 | | | $ | 1,209 | | | $ | 1,211 | | | | 5.7 | % |
| 1/1 | | $ | 1,204 | | | $ | 1,213 | | | $ | 1,235 | | | $ | 1,256 | | | $ | 1,266 | | | $ | 1,281 | | | $ | 1,297 | | | $ | 1,314 | | | $ | 1,336 | | | | 5.5 | % |
| 2/1 | | $ | 1,181 | | | $ | 1,211 | | | $ | 1,222 | | | $ | 1,242 | | | $ | 1,224 | | | $ | 1,233 | | | $ | 1,257 | | | $ | 1,275 | | | $ | 1,288 | | | | 5.2 | % |
| 2/2 | | $ | 1,556 | | | $ | 1,559 | | | $ | 1,585 | | | $ | 1,613 | | | $ | 1,629 | | | $ | 1,664 | | | $ | 1,670 | | | $ | 1,698 | | | $ | 1,736 | | | | 6.6 | % |
| 2 TH | | $ | 1,580 | | | $ | 1,587 | | | $ | 1,602 | | | $ | 1,568 | | | $ | 1,580 | | | $ | 1,631 | | | $ | 1,667 | | | $ | 1,669 | | | $ | 1,698 | | | | 7.5 | % |
| 3/2 | | $ | 1,705 | | | $ | 1,701 | | | $ | 1,719 | | | $ | 1,749 | | | $ | 1,760 | | | $ | 1,793 | | | $ | 1,835 | | | $ | 1,843 | | | $ | 1,854 | | | | 5.3 | % |
| 3 TH | | $ | 2,091 | | | $ | 2,113 | | | $ | 2,120 | | | $ | 2,009 | | | $ | 2,017 | | | $ | 2,320 | | | $ | 2,341 | | | $ | 2,288 | | | $ | 2,325 | | | | 15.3 | % |
| Wtg. Avg. | | $ | 1,347 | | | $ | 1,355 | | | $ | 1,376 | | | $ | 1,394 | | | $ | 1,408 | | | $ | 1,435 | | | $ | 1,457 | | | $ | 1,475 | | | $ | 1,500 | | | | 6.5 | % |
| |
| | | | | | | | | | | | | | | | | | | | | | | | | | | | | | | | | | | | | | | | | |
| Occupancy | | | 96.0 | % | | | 94.9 | % | | | 94.7 | % | | | 95.2 | % | | | 95.8 | % | | | 95.3 | % | | | 95.5 | % | | | 96.7 | % | | | 95.9 | % | | | — | |
| |
Source: RealFacts
| | | |
| Conclusion | | The overall Los Angeles area’s economy should continue to post solid employment and population growth over the coming years. The subject’s L.A. North/Ventura County market area seems to be at a slightly higher level of occupancy but lower level of rent than the overall Los Angeles area. As demand and new construction in the L.A. North/Ventura County continue to be on an equal par, occupancy is anticipated to remain high over the coming year. As occupancy levels continue to be high, concessions will likely continue to be nonexistent. The remainder of the Los Angeles area has seen an increase in apartment development, keeping up with job and demand growth. |
| | | |
| Mountain View Apartments | | May 4, 2006 |
| San Dimas, California | | Page 19 |
ECONOMIC RENT ANALYSIS
Five competitive properties follow. They are located in the influencing area of the subject property and define the range of property type and rents available. The information regarding the rent comparables was obtained through physical inspections and interviews of rental agents and property managers. The rents commanded by competitive properties in the influencing area are utilized to determine the economic rent potential for the subject property.
Rent Comparable #1
| | | |
| Address: | | The Lakes at Raintree Village |
| | | 444 North Amelia Avenue |
| | | San Dimas, California |
| | | |
| Number of Units: | | N/A |
| | | |
| Year Built: | | Late 1970s (estimate) |
| | | |
| Description: | | Garden-style apartments with two-story residential buildings. Stucco, brick and wood sided exterior walls, pitched roofs with asphalt shingle cover. |
| | | |
| Amenities: | | Apartment features include standard kitchen appliances, vaulted ceilings, mini-blinds, patio/balcony and ceiling fans. Property features include swimming pools, spas, clubhouse, tennis court sand volleyball court, covered parking, laundry facilities and on-site management. |
Rental Data:
| | | | | | | | | | | | | |
| Unit Type | | Size (SF) | | Quoted Rent/Unit | | Quoted Rent/SF |
| |
| 2BR/1-2BA | | | 925 | | | $ | 1,260-$1,325 | | | $ | 1.36-$1.43 | |
| |
| Totals/Average | | | 925 | | | $ | 1,293 | | | $ | 1.40 | |
| |
| | | |
| Occupancy: | | 100% |
| | | |
| Concessions: | | No concessions at this time |
| | | |
| Comments: | | This property is located approximately two miles northwest of the subject property. It is similar to the subject property in terms of amenities, age and physical characteristics. It is inferior as to location and curb appeal. |
| | | |
| Mountain View Apartments | | May 4, 2006 |
| San Dimas, California | | Page 20 |
| | | |
Rent Comparable #2 | | |
| | | |
| Address: | | Amber Ridge |
| | | 2421 Foothill Blvd |
| | | La Verne, California |
| | | |
| Number of Units: | | N/A |
| | | |
| Year Built: | | 1976 |
| | | |
| Description: | | Garden-style apartments with two-story residential buildings. Stucco and wood trim exterior walls, flat roofs with built-up cover. |
| | | |
| Amenities: | | Apartment features include standard kitchen appliances, mini-blinds, patio/balcony and ceiling fans. Property features include swimming pool, fitness center, covered parking, laundry facilities and on-site management. |
Rental Data:
| | | | | | | | | | | | | |
| Unit Type | | Size (SF) | | Quoted Rent/Unit | | Quoted Rent/SF |
| |
| 2BR/1-2BA | | | 1,000 | | | $ | 1,275-$1,500 | | | $ | 1.28-$1.50 | |
| 3BR/2BA | | | 1,434 | | | $ | 1,650 | | | $ | 1.15 | |
| |
| Totals/Average | | | 1,217 | | | $ | 1,519 | | | $ | 1.27 | |
| |
| | | |
| Occupancy: | �� | 95% |
| | | |
| Concessions: | | No concessions at this time |
| | | |
| Comments: | | This property is located approximately two miles northwest of the subject property. It is similar to the subject property in terms of amenities, age and physical characteristics. It is inferior as to location and curb appeal. |
| | | |
| Mountain View Apartments | | May 4, 2006 |
| San Dimas, California | | Page 21 |
| | | |
Rent Comparable #3 | | |
| | | |
| Address: | | Monte Vista |
| | | 1825 Foothill Blvd. |
| | | La Verne, California |
| | | |
| Number of Units: | | N/A |
| | | |
| Age: | | Early 1970s (estimate) |
| | | |
| Description: | | Garden-style apartments with two-story residential buildings. Stucco and wood trim exterior walls, flat roofs with built-up cover. |
| | | |
| Amenities: | | Apartment features include standard kitchen appliances, mini-blinds, patio/balcony and ceiling fans. Property features include swimming pool, fitness center, gated access, laundry facility and on-site management. |
Rental Data:
| | | | | | | | | | | | | |
| Unit Type | | Size (SF) | | Quoted Rent/Unit | | Quoted Rent/SF |
| |
| 2BR/1BA | | | 902 | | | $ | 1,352 | | | $ | 1.50 | |
| |
| 2BR/1BA | | | 950 | | | $ | 1,412 | | | $ | 1.49 | |
| 2BR/2BA | | | 985 | | | $ | 1,506 | | | $ | 1.53 | |
| 3BR/2BA | | | 1,080 | | | $ | 1,606 | | | $ | 1.49 | |
| 3BR/2BA | | | 1,115 | | | $ | 1,712 | | | $ | 1.54 | |
| |
| Totals/Average | | | 1,006 | | | $ | 1,518 | | | $ | 1.51 | |
| |
| | | |
| Occupancy: | | 97% |
| | | |
| Concessions: | | No concessions at this time |
| | | |
| Comments: | | This property is located approximately three miles northwest of the subject property. It is similar to the subject property in terms of amenities and physical characteristics. It is inferior as to location, age and curb appeal. |
| | | |
| Mountain View Apartments | | May 4, 2006 |
| San Dimas, California | | Page 22 |
| | | |
Rent Comparable #4 | | |
| | | |
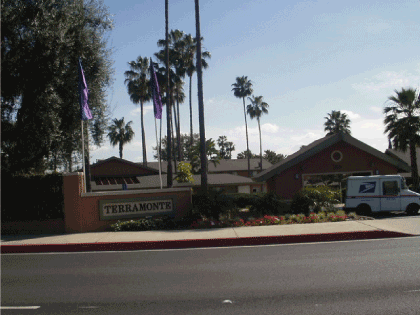
| Address | | Terramonte |
| | | 150 West Foothill |
| | | Pomona, California |
| | | |
| Number of Units: | | N/A |
| | | |
| Age: | | 1978 |
| | | |
| Description: | | Garden-style apartments with two-story residential buildings. Stucco, Brick and wood trim exterior walls, pitched roofs with asphalt-shingle cover. |
| | | |
| Amenities: | | Apartment features include standard kitchen appliances, patio/balcony mini-blinds and ceiling fans. Property features include swimming pool, fitness center, business center, detached garages and laundry facility. |
Rental Data:
| | | | | | | | | | | | | |
| Unit Type | | Size (SF) | | Quoted Rent/Unit | | Quoted Rent/SF |
| |
| 2BR/1BA | | | 888 | | | $ | 1,375 | | | $ | 1.55 | |
| 2BR/2BA | | | 1,002 | | | $ | 1,415 | | | $ | 1.41 | |
| |
| Totals/Average | | | 945 | | | $ | 1,395 | | | $ | 1.48 | |
| |
| | | |
| Occupancy: | | 96% |
| | | |
| Concessions: | | No concessions at this time |
| | | |
| Comments: | | This property is located approximately five miles northwest of the subject property. It is similar to the subject property in terms of age, physical characteristics and curb appeal. It has slightly superior amenities, with an inferior location. |
| | | |
| Mountain View Apartments | | May 4, 2006 |
| San Dimas, California | | Page 23 |
| | | |
Rent Comparable #5 | | |
| |
| Address: | | Club Pacifica |
| | | 21042 East Arrow Highway |
| | | Covina, California |
| | | |
| Number of Units: | | N/A |
| | | |
| Year Built: | | Late 1970s to early 1980s (estimate) |
| | | |
| Description: | | Garden-style apartments with two-story residential buildings. Stucco, Brick and wood trim exterior walls, pitched roofs with asphalt-shingle cover. |
| | | |
| Amenities: | | Apartment features include standard kitchen appliances, patio/balcony mini-blinds, w/d connections and ceiling fans. Property features include swimming pool, spa, fitness center, recreation room, detached garages, tennis court, racquetball courts and laundry facility. |
Rental Data:
| | | | | | | | | | | | | |
| Unit Type | | Size (SF) | | Quoted Rent/Unit | | Quoted Rent/SF |
| |
| 2BR/1BA | | | 879 | | | $ | 1,345 | | | $ | 1.53 | |
| 2BR/2BA | | | 1,000 | | | $ | 1,425 | | | $ | 1.43 | |
| |
| Totals/Average | | | 940 | | | $ | 1,385 | | | $ | 1.48 | |
| |
| | | |
| Occupancy: | | 98% |
| | | |
| Concessions: | | No concessions at this time |
| | | |
| Comments: | | This property is situated three miles west of the subject property. It is similar to the subject property in terms of age, physical characteristics and curb appeal. It has superior amenities, with an inferior location. |
| | | |
| Mountain View Apartments | | May 4, 2006 |
| San Dimas, California | | Page 24 |
ANALYSIS
The subject property is situated in a good San Dimas location at the corner of East Bonita Avenue and South San Dimas Canyon Road. It is competitive with other properties in terms of location, age condition, amenities, and unit size. The tables below illustrate the comparables with the most similar floor plans in relation to the subject’s floor plans.
TWO-BEDROOM FLOOR PLANS
| | | | | | | | | | | | | |
| Comparable # | | Unit Size (SF) | | Rent/Month | | Rent/SF |
| |
| Subject | | | 912 | | | $ | 1,453 | | | $ | 1.59 | |
| Subject | | | 996 | | | $ | 1,547 | | | $ | 1.55 | |
| The Lakes | | | 925 | | | $ | 1,260-$1,325 | | | $ | 1.36-$1.43 | |
| Amber Ridge | | | 1,000 | | | $ | 1,275-$1,500 | | | $ | 1.28-$1.50 | |
| Monte Vista | | | 902-985 | | | $ | 1,352-$1,506 | | | $ | 1.49-$1.53 | |
| Terramonte | | | 888-1,002 | | | $ | 1,375-$1,415 | | | $ | 1.41-$1.55 | |
| Club Pacifica | | | 879-1,000 | | | $ | 1,345-$1,425 | | | $ | 1.43-$1.53 | |
THREE-BEDROOM FLOOR PLANS
| | | | | | | | | | | | | |
| Comparable # | | Unit Size (SF) | | Rent/Month | | Rent/SF |
| |
| Subject | | | 1,126 | | | $ | 1,787 | | | $ | 1.59 | |
| Amber Ridge | | | 1,434 | | | $ | 1,650 | | | $ | 1.15 | |
| Monte Vista | | | 1,080-1,115 | | | $ | 1,606-$1,712 | | | $ | 1.49-$1.54 | |
The subject is similar to The Lakes and Amber Ridge in terms of age, amenities and physical characteristics and similar to Monte Vista in terms of amenities and physical characteristics. The subject is superior to The lakes and Amber Ridge as far as location and curb appeal, while superior to Monte Vista in terms of location, age and curb appeal. The subject is inferior to Terramonte and Club Pacifica in terms of amenities but has a superior location to both of these comparables. In general, the subject’s rental rates should be similar to the rents achieved by the Terramonte and Club Pacifica apartments and above the rents representative of The Lakes, Amber Ridge and Monte Vista apartments.
As indicated above, the rent (on a per square foot basis) for the subject’s two-bedroom floor plans are within a tolerable variance of the high range of rents illustrated by the Terramonte and Club Pacifica apartments and above those of The Lakes, Amber Ridge and Monte Vista apartments as analyzed above.
Only the Amber Ridge and Monte Vista apartments offer a three bedroom floor plan. The quoted rents for the subject’s three-bedroom units (on a per square foot basis) are above the range of rents illustrated by both of these comparables. As mentioned above, the subject is superior to both of these comparables, and it’s rental rates should be above those implied by these two comparables. The rental rates for the subject’s three bedroom units is deemed to be market oriented.
Based upon the rents illustrated by the competing properties and rent actually commanded by the subject property, the following rents will be processed as the property’s economic rent potential for valuation purposes. The following table summarizes the economic rent structure estimated for the subject property.
ECONOMIC RENT POTENTIAL-MOUNTAIN VIEW APARTMENTS
| | | | | | | | | | | | | | | | | | | | | | | | | |
| Unit Type | | Mix | | Size (SF) | | Total Area | | Economic Rent/Unit | | Economic Rent/SF | | Total Rent |
| |
| 2BR/1BA | | | 68 | | | | 912 | | | | 62,016 | | | $ | 1,453 | | | $ | 1.59 | | | $ | 98,804 | |
| 2BR/2BA | | | 56 | | | | 996 | | | | 55,776 | | | $ | 1,547 | | | $ | 1.55 | | | $ | 86,632 | |
| 3BR/2BA | | | 44 | | | | 1126 | | | | 49,544 | | | $ | 1,787 | | | $ | 1.59 | | | $ | 78,628 | |
| |
| Totals/Average | | | 168 | | | | 996 | | | | 167,336 | | | $ | 1,572 | | | $ | 1.58 | | | $ | 264,064 | |
| |
| | | |
| Mountain View Apartments | | May 4, 2006 |
| San Dimas, California | | Page 25 |
HIGHEST AND BEST USE
According to the Third Edition ofThe Dictionary of Real Estate Appraisal, published by the Appraisal Institute, highest and best use is defined as:
“the reasonably probable and legal use of vacant land or an improved property; which is physically possible, appropriately supported, financially feasible, and that results in the highest value. The four criteria the highest and best use must meet are legal permissibility, physical possibility, financial feasibility, and maximum profitability”.
| | | |
| HIGHEST AND BEST USE AS IF VACANT |
| |
| Surrounding Land Uses | | Equally divided between commercial, single-family and multi-family developments along east Bonita Avenue and South San Dimas Canyon Road. |
| | | |
| Physically Possible | | The size and accessibility of the site would allow for most development. However, development intensity would be restricted by the subject property’s location, along East Bellevue Drive, a lightly traveled neighborhood collector street that can only handle a limited level of vehicular traffic. The majority of high intensity retail and commercial uses in the neighborhood are situated at major intersections. Given the site’s secondary location, high intensity retail use is not indicated. Of the potential legal uses, multifamily use would appear to be the most appropriate physically possible use. |
| | | |
| Legally Permissible | | Multifamily use is the intended use of the site. |
| | | |
| Financial Feasible | | The determination of financial feasibility is dependent primarily on demand. The immediate market exhibits strong demand characteristics as evidenced by stable rental rates, high occupancy levels and the lack of rent concessions in competing apartment projects. New apartment construction is occurring in various areas throughout the Los Angeles area indicating that financial feasibility exists to warrant the cost of such construction. New apartment development is considered to be financially feasible at this time. |
| | | |
| Conclusion | | Based on the three criteria previously discussed, the maximally profitable use of the site would be multifamily residential development. |
| | | |
| HIGHEST AND BEST USE AS IMPROVED |
| |
| Current Improvements | | 168-unit multifamily apartment complex. The existing improvements contribute significantly to overall property value indicating that the value of the improved property greatly exceeds the value of the site assuming it to be vacant. |
| | | |
| Conclusion | | Continued use of the existing improvements |
| | | |
| Mountain View Apartments | | May 4, 2006 |
| San Dimas, California | | Page 26 |
VALUATION
There are three traditional approaches that can be employed in establishing Market Value. These approaches and their applicability to the valuation of the subject property are summarized as follows:
THE COST APPROACH
This method estimates the replacement or reproduction cost of the improvements, less the estimated depreciation (physical, functional, economic), plus the estimated market value of the land, in order to arrive at a final value indication. This approach is based on the premise that an informed purchaser would pay no more for a property than the cost of constructing a building of similar utility and condition.
The Cost Approach is a reliable indicator of value for: (a) new properties; (b) special use properties; and (c) properties where the cost of reproducing the improvement is easily and accurately quantified and there is no external or economic obsolescence. Due to the age of the improvements, they have incurred physical deterioration due to normal wear and usage. Given the inherent inaccuracies and subjectivity involved in estimating substantial degrees of physical deterioration, the cost approach is not considered a reliable, independent approach to value in this instance
THE SALES COMPARISON APPROACH
Using this technique, the property value is indicated by comparing the subject to similar, nearby properties that have recently sold. Essentially, the procedure is to gather bona fide, recent arm’s length sales of comparable properties and compare the most important characteristics of the sales to the subject. Adjustments are then made to the comparable properties for differences such as terms of financing, date of sale, location, and physical characteristics.
Attaining data with a high degree of comparability is most important when this technique is utilized. The reliability is dependent upon the availability of comparable sales data, the verification of the sales data, the degree of comparability and extent of adjustment necessary for differences and the absence of non-typical conditions affecting the sales price. As numerous sales of properties similar to the subject have occurred in the San Dimas/Los Angeles area, this approach has been employed in the valuation process.
THE INCOME CAPITALIZATION APPROACH
The Income Capitalization Approach is a process in which the anticipated flow of future benefits is capitalized into a value indication. The Income Capitalization Approach is widely applied in appraising income-producing properties. The reliability of this technique is dependent upon the reliability of the net income estimate and the capitalization rate. Since the subject is income producing realty and anticipated to continue to be so, this approach has been employed in the valuation of the Fee Simple Estate.
RECONCILIATION AND FINAL VALUE ESTIMATE
The final step in the Appraisal Process is the reconciliation of the value indicators into a single value estimate. In the reconciliation or correlation, the appraiser considers the relative applicability of each of the three approaches, examines the range between the value indications and places major emphasis on the approach that appears to produce the most reliable solution to the specific appraisal problem. The purpose of the appraisal, the type of property and the adequacy and reliability of the data are analyzed and appropriate weight is given to each of the approaches to value.
| | | |
| Mountain View Apartments | | May 4, 2006 |
| San Dimas, California | | Page 27 |
INCOME CAPITALIZATION APPROACH
Investment properties are normally valued in proportion to their ability to produce income; hence, an analysis of the property in terms of its ability to provide a sufficient net annual return on invested capital is an important means of valuing any asset. Value is estimated by deducting an appropriate vacancy and collection allowance and all applicable expenses from the anticipated gross annual income to arrive at a projected net operating income which is then capitalized at an interest rate, or investment yield, commensurate with the risk inherent in the ownership of the property. Such a conversion of projected income considers competitive returns offered by alternative investments.
There are two primary income capitalization methods: Direct Capitalization, which converts a single year’s net operating income into an indication of value and the Discounted Cash Flow Analysis (DCF), which estimates the present worth through the process of discounting the forecasted net income and the reversionary sale over the course of an anticipated investment period. The Direct Capitalization technique is employed in this analysis.
DIRECT CAPITALIZATION
The basic steps in the Direct Capitalization method are as follows:
1. Calculate POTENTIAL GROSS INCOME from the dwelling units;
2. Estimate VACANCY AND CREDIT LOSS to arrive at Effective Gross Income;
3. Estimate OPERATING EXPENSES to arrive at the stabilized Net Operating Income;
4. Develop the OVERALL CAPITALIZATION RATE;
5. Divide NOI by the CAP RATE to arrive at VALUE.
Revenue:As presented in the Economic Rent Analysis section of this report, the monthly economic rent potential is estimated at $264,064. The annual gross rent potential estimated for the apartment units total $3,168,768.
Loss to Lease: Loss to lease considers a loss in income due to leases in effect, whereby effective rental rates are lower than asking, or market, rental rates. As a percentage of the property’s gross rent potential, the historical loss to lease ranges from 3.4% in 2003 to 5.9% in 2005. Based on the previous history at the subject property, we have deducted a loss to lease expense of 6.0% of the potential gross income or $190,126.
Concessions:Rent concessions in the market are minimal or non-existent at area apartments. Traditional apartment concessions consist of reduced or free rent over a portion of the lease term. As a percentage of the property’s gross rent potential, concessions amounted to 0.0% in 2003, 0.5% in 2004 and 0.7% in 2005. Concessions are budgeted at 1.5% for 2006. For our analysis, concessions are projected at 1.0% of the estimated gross rent potential or $31,688.
Vacancy and Credit Loss:As of the date of inspection, the subject property was 95% occupied. On site management indicated that the property generally maintains an occupancy in the mid 90% range. The properties identified as income comparables within the Economic Rent Analysis section of this report illustrate occupancy levels that range from 95% to 100%. The average occupancy of the income comparables surveyed equates to approximately 97%. Information presented in the Apartment Market Overview section of this report indicates that the average occupancy for properties within the Los Angeles area is approximately 96%, an amount similar to the estimated average occupancy produced by primary comparables in the immediate area of the subject property.
| | | |
| Mountain View Apartments | | May 4, 2006 |
| San Dimas, California | | Page 28 |
As indicated in the Economic Rent Analysis section of this report, the quoted rent structure for the subject property seems to be market oriented based on a review of the comparable rentals in the area. It appears as though the subject’s occupancy level is similar to those levels realized by competing properties in the area as a result of its rent structure.
Historically, vacancy and credit loss at the subject property was 9.1% of the gross rent potential in 2003, 8.0% in 2004 and 7.5% in 2005. The 2006 budget has vacancy and credit loss at 5.3%.
Based on the subject’s 2006 budget and current level of occupancy, tempered against the average occupancy reported by competing properties in the influencing area and occupancy level indicated for properties in the Los Angeles area, a vacancy factor of 6.0% is estimated for the subject property. In addition, a 1.0% allowance for credit loss is assessed. The combined vacancy and credit loss allowance equates to 7.0%.
Utility Income:Included in this category is the revenue received from tenants paying or reimbursing ownership for their share of water and sewer usage. Total utility income in 2003 was $67,161, decreasing to $65,904 in 2004 and increasing to $69,500 in 2005. Budgeted 2006 utility income is $57,948. Based on the historical and budgeted utility income receipts, we have estimated Utility Income to be $67,200 or $400 per unit.
Other Income:Included within this category is the revenue received from such items as application fees, forfeited deposits, and late fees. As a percentage of the property’s gross rent potential, Other Income receipts range from 4.6% to 6.5%. Other income is budgeted at 3.5% for 2006. Based on historical and budgeted 2006, other income receipts, we have estimated Other Income to be approximately 4.2% of the gross rent potential or $134,400.
Expenses:In order to project expenses for valuation purposes, the expenses historically incurred in the operation of the subject property have been reviewed. The budgeted expenses for 2006 have also been considered. Typical operating expenses for garden apartments in the San Dimas/Los Angeles area, as reported by IREM have been reviewed and analyzed. The following table summarizes the three-year operating history for the subject property and outlines the operating budget for the current year.
| | | |
| Mountain View Apartments | | May 4, 2006 |
| San Dimas, California | | Page 29 |
SUMMARY OF OPERATING HISTORY AND BUDGET – MOUNTAIN VIEW APARTMENTS
| | | | | | | | | | | | | | | | | | | | | | | | | | | | | | | | | | | | | |
| | | | 2003 | | | | 2004 | | | | 2005 | | | | 2006 Budget | |
| Item | | | Actual | | | Per Unit | | | | Actual | | | Per Unit | | | | Total | | | Per Unit | | | | Total | | | Per Unit | |
| | | | | | | | | | | | | |
| Gross Rent Potential | | | $ | 2,541,584 | | | $ | 15,128 | | | | $ | 2,705,864 | | | $ | 16,106 | | | | $ | 2,921,184 | | | $ | 17,388 | | | | $ | 2,861,751 | | | $ | 17,034 | |
| Loss to Lease | | | ($ | 86,717 | ) | | ($ | 516 | ) | | | ($ | 122,398 | ) | | ($ | 729 | ) | | | ($ | 171,838 | ) | | ($ | 1,023 | ) | | | $ | 0 | | | $ | 0 | |
| Concessions | | | ($ | 673 | ) | | | ($4 | ) | | | ($ | 13,403 | ) | | | ($80 | ) | | | ($ | 19,144 | ) | | ($ | 114 | ) | | | ($ | 42,792 | ) | | ($ | 255 | ) |
| Vacancy/Credit Loss | | | ($ | 231,011 | ) | | ($ | 1,375 | ) | | | ($ | 215,936 | ) | | ($ | 1,285 | ) | | | ($ | 218,010 | ) | | ($ | 1,298 | ) | | | ($ | 150,356 | ) | | ($ | 895 | ) |
| Utility Income | | | $ | 67,161 | | | $ | 400 | | | | $ | 65,904 | | | $ | 392 | | | | $ | 69,500 | | | $ | 414 | | | | $ | 57,948 | | | $ | 345 | |
| Other Income | | | $ | 164,881 | | | $ | 981 | | | | $ | 132,122 | | | $ | 786 | | | | $ | 134,943 | | | $ | 803 | | | | $ | 99,771 | | | $ | 594 | |
| | | | | | | | | | | | | | | | | | | | | | | | | | | | | |
| Effective Gross Income | | | $ | 2,455,225 | | | $ | 14,614 | | | | $ | 2,552,153 | | | $ | 15,191 | | | | $ | 2,716,635 | | | $ | 16,170 | | | | $ | 2,826,322 | | | $ | 16,823 | |
| | | | | | | | | | | | | | | | | | | | | | | | | | | | | | | | | | | | | |
| Utilities | | | $ | 157,664 | | | $ | 938 | | | | $ | 160,747 | | | $ | 957 | | | | $ | 149,677 | | | $ | 891 | | | | $ | 186,412 | | | $ | 1,110 | |
| Repairs & Maintenance | | | $ | 174,017 | | | $ | 1,036 | | | | $ | 150,645 | | | $ | 897 | | | | $ | 133,241 | | | $ | 793 | | | | $ | 142,322 | | | $ | 847 | |
| Administrative | | | $ | 47,269 | | | $ | 281 | | | | $ | 55,172 | | | $ | 328 | | | | $ | 54,367 | | | $ | 324 | | | | $ | 56,592 | | | $ | 337 | |
| Marketing | | | $ | 33,447 | | | $ | 199 | | | | $ | 52,765 | | | $ | 314 | | | | $ | 59,745 | | | $ | 356 | | | | $ | 53,971 | | | $ | 321 | |
| Payroll | | | $ | 167,651 | | | $ | 998 | | | | $ | 206,385 | | | $ | 1,228 | | | | $ | 218,978 | | | $ | 1,303 | | | | $ | 226,624 | | | $ | 1,349 | |
| Management | | | $ | 113,646 | | | $ | 676 | | | | $ | 108,925 | | | $ | 648 | | | | $ | 115,152 | | | $ | 685 | | | | $ | 120,207 | | | $ | 716 | |
| Insurance | | | $ | 73,385 | | | $ | 437 | | | | $ | 71,510 | | | $ | 426 | | | | $ | 73,868 | | | $ | 440 | | | | $ | 84,199 | | | $ | 501 | |
| Real Estate Taxes | | | $ | 129,767 | | | $ | 772 | | | | $ | 136,699 | | | $ | 814 | | | | $ | 141,775 | | | $ | 844 | | | | $ | 148,150 | | | $ | 882 | |
| | | | | | | | | | | | | | | | | | | | | | | | | | | | | |
| Total Expenses | | | $ | 896,996 | | | $ | 5,338 | | | | $ | 942,848 | | | $ | 5,612 | | | | $ | 946,803 | | | $ | 5,636 | | | | $ | 1,018,477 | | | $ | 6,062 | |
| | | | | | | | | | | | | | | | | | | | | | | | | | | | | | | | | | | | | |
| Net Operating Income | | | $ | 1,558,379 | | | $ | 9,276 | | | | $ | 1,609,305 | | | $ | 9,579 | | | | $ | 1,769,832 | | | $ | 10,535 | | | | $ | 1,807,845 | | | $ | 10,761 | |
| | | |
| Utilities | | This expense covers the cost of electricity, water and sewer and gas usage for the property. The subject’s historical utilities expense ranges from a low of $891 per unit in 2005 to a high of $957 per unit in 2004. An amount equivalent to $1,110 per unit is reflected in the 2006 budget. Based on historical expenditures, the budgeted 2006 amount appears to be somewhat high. Utilities are processed at $925 per unit or $155,400. |
| | | |
| Repair & Maintenance: | | This category includes general repair and maintenance items, contract services and turnover expenses. The subject’s historical repair and maintenance expense ranges from a low of $793 per unit in 2005 to a high of $1,036 per unit in 2003. An amount equivalent to $847 per unit is budgeted for 2006. The repairs and maintenance expense is estimated at $850 per unit or $142,800. |
| | | |
| Administrative | | Office expenses, telephone, management unit expenses, computer maintenance and supplies, professional fees and miscellaneous expenses are covered in this category. The subject’s historical administrative expense ranges from a low of $281 per unit in 2003 to a high of $328 per unit in 2004. An amount equivalent to $337 per unit is reflected in the 2006 budget. Administrative expenses are projected at $325 per unit or $54,600. |
| | | |
| Marketing | | Included in this category are all newspaper and printed advertising, payments to locator services, leasing commissions, and resident referrals. The subject’s historical marketing expense ranges from a low of $199 per unit in 2003 to a high of $356 per unit in 2005. An amount equivalent to $321 per unit is budgeted for 2006. Marketing expenses are projected at $325 per unit or $54,600. |
| | | |
| Payroll: | | This expense covers salaries, payroll taxes, and workers compensation insurance for on site management, leasing, and maintenance personnel. |
| | | |
| Mountain View Apartments | | May 4, 2006 |
| San Dimas, California | | Page 30 |
| | | |
| | | The subject’s historical payroll expense ranges from a low of $998 per unit in 2003 to a high of $1,303 per unit in 2005. An amount equivalent to $1,349 per unit is budgeted for 2006. Payroll expenses are projected at $1,250 per unit or $210,000. |
| | | |
| Management | | A typical management fee on a property of this type is 3% to 5% of the effective gross income. The subject’s historical management fee has been based on an amount equivalent to approximately 4.5% of Effective Gross Income. A market-oriented fee in the range of 4.0% to 4.5% or 4.25% is considered reasonable. Based on the preceding estimate of Effective Gross Income, the subject’s management fee is estimated to be $124,386 or $740 per unit. |
| | | |
| Insurance | | This expense item covers the building and includes fire, extended coverage, vehicle, and owner’s liability. The subject’s historical insurance expense ranges from a low of $426 per unit in 2004 to a high of $440 per unit in 2005. An amount equivalent to $501 per unit is reflected in the 2006 budget. Based on historical expenditures, insurance expenses are projected at $425 per unit or $71,400. |
| | | |
| Taxes | | As discussed in the Real Estate Tax section, the tax burden for the subject property is estimated at $391,300 or $2,329 per unit. |
| | | |
| Reserves for Replacements | | In addition to the repairs and maintenance expenditures, the property will incur annual capital expenditures to keep it in prime condition. A reserve category is typical for multifamily property; therefore we have included reserves as an additional budget item. Reserves for replacement for a property of this vintage typically range from $200 to $400 per unit. Given the age of the subject property, a reserve for replacement allowance aligned with the higher end of the range of $350 per unit or $58,800 is estimated for the subject property. |
Net Operating Income:The Net Operating Income is that amount of the income remaining after paying all operating expenses. This affords the owner capital to satisfy debt service, if any, and provide a return on owner’s equity. We have estimated the NOI to be $1,663,454. The subject’s income and expense pro forma is summarized below.
| | | |
| Mountain View Apartments | | May 4, 2006 |
| San Dimas, California | | Page 31 |
OPERATING PRO FORMA
| | | | | | | | | |
| Item | | Total | | | Per Unit | |
| |
| Gross Potential Rent | | $ | 3,168,768 | | | $ | 18,862 | |
| Loss to Lease | | ($ | 190,126 | ) | | ($ | 1,132 | ) |
| Concessions | | ($ | 31,688 | ) | | ($ | 189 | ) |
| Vacancy/Credit Loss | | ($ | 221,814 | ) | | ($ | 1,320 | ) |
| Utility Income | | $ | 67,200 | | | $ | 400 | |
| Other Income | | $ | 134,400 | | | $ | 800 | |
| | | | | | | |
| Effective Gross Income | | $ | 2,926,740 | | | $ | 17,421 | |
| | | | | | | | | |
| Utilities | | $ | 155,400 | | | $ | 925 | |
| Repairs & Maintenance | | $ | 142,800 | | | $ | 850 | |
| Administrative | | $ | 54,600 | | | $ | 325 | |
| Marketing | | $ | 54,600 | | | $ | 325 | |
| Payroll | | $ | 210,000 | | | $ | 1,250 | |
| Management | | $ | 124,386 | | | $ | 740 | |
| Insurance | | $ | 71,400 | | | $ | 425 | |
| Real Estate Taxes | | $ | 391,300 | | | $ | 2,329 | |
| Reserves | | $ | 58,800 | | | $ | 350 | |
| | | | | | | |
| Total Expenses | | $ | 1,263,286 | | | $ | 7,520 | |
| | | | | | | | | |
| Net Operating Income | | $ | 1,663,454 | | | $ | 9,902 | |
Capitalization:Capitalization rates express relationships between net income and total value. The rate employed must be consistent with and reflective of those rates currently employed by investors active in the market place.
In order to perform this analysis, estimates of an appropriate capitalization rate must be formed. By its nature this is a judgmental process, however, selected rates should approximate the investment perimeters expected to be employed by the most probable buyer for the subject property.
Several approaches are typically followed in selecting the investment parameters; review and analysis of alternative real estate and non-real estate investments; review and analysis of published real estate investor surveys; derivation of rates from empirical market data; and use of in-house experience with similar types of investments.
| | | |
| Most Probable Buyer | | Considering the size and quality of the asset, the subject buyer would most likely attract national or regional investors. |
| | | |
| Market Extraction | | The following table summarizes the market derived overall rates. The sales are further detailed in theSales Comparison Approach. |
SUMMARY OF MARKET DERIVED OVERALL RATES
| | | | | | | | | | | | | | | | | | | | | |
| | | Sale 1 | | Sale 2 | | Sale 3 | | Sale 4 | | Sale 5 |
| |
| Name | | Woodbridge | | Chateau | | The Hamptons | | Esplanade | | | N/A | |
| Sale Date | | Aug-05 | | May-05 | | Sept-04 | | Jun-04 | | Apr-03 |
| Cap Rate (OAR) | | | 5.8 | % | | | 4.9 | % | | | 5.7 | % | | | 6.5 | % | | | 6.0 | % |
| | | |
| | | The sales exhibit overall rates that fall within a range from 4.9% to 6.5% and produce an average of 5.8%. The sales represent transactions of early 1970s to mid 1980s vintage apartment complexes that are generally similar to the subject property in terms of construction and physical characteristics. The comparable properties are situated in Los Angeles area locations that demonstrate generally similar demographic |
| | | |
| Mountain View Apartments | | May 4, 2006 |
| San Dimas, California | | Page 32 |
| | | |
| | | characteristics of the subject neighborhood. The capitalization rates indicated by the sales data are representative of an appropriate rate that would be applicable to the subject property. Based on the indicators exhibited by market data, a capitalization rate of approximately 5.5% is suggested. |
| | | |
| Survey of Investors | | The most useful approach used to estimate an approximate rate of return required by the most probable buyer is to analyze the current investment parameters applied by institutional investors and advisors to real estate pension and portfolio funds when acquiring real estate. According to the First Quarter 2006` Korpacz Real Estate Investor Survey, prepared by Price Waterhouse Coopers, capitalization rates for institutional grade apartment properties range from 4.25% to 8.00% with an average of 6.07%. According to the same survey, non-institutional grade properties exhibit a range of cap rates of 4.50% to 10.50% with an average of 7.25%. Capitalization rates in the Los Angeles area are generally aligned with the low end of the survey range and below the national average. The rates produced by the sales outlined above are appropriately aligned with the low end of the survey range. |
| | | |
| Conclusion | | The sales exhibit overall rates that range from 4.9% to 6.5% and produce an average of 5.8%. Based on the indicators exhibited by the sales data and confirmed through review of investor surveys, an appropriate cap rate for the subject property is concluded to be 5.5%. |
Valuation:Capitalizing the estimated Net Operating Income of $1,663,454 by a 5.5% rate results in a value conclusion of $30,200,000, rounded ($1,663,454 NOI¸ 5.5% OAR = $30,244,618).
THE SALES COMPARISON APPROACH
The Sales Comparison Approach to value is the process of comparing recent sales of competitive properties. The estimated value derived via this approach represents the probable price at which the subject property would be sold by a willing seller to a willing buyer as of the date of value.
To estimate the property value by the Sales Comparison Approach, five multifamily apartment building sales, which are summarized in the following table, have been examined and analyzed. All of the sales are garden style apartments with similar physical characteristics within the Los Angeles area apartment market. The appraisal indicators exhibited by the sales data outlined in the following chart are utilized for purposes of estimating a value for the subject via the Sale Comparison Approach.
The price per apartment unit has been relied upon as the unit of comparison in this approach. The comparative process involves judgment as to the similarity between the subject property and the comparable sale property with regard to a variety of factors affecting value such as location, age and condition of the structure, market conditions, rent levels, property rights conveyed, financing terms, conditions of sale, operational efficiencies and other factors.
| | | |
| Mountain View Apartments | | May 4, 2006 |
| San Dimas, California | | Page 33 |
ANALYSIS OF SALES:This approach relies on an active market. Sufficient data from the Los Angeles area exists to formulate a value via the Sales Comparison Approach. Below are five sale comparables of similar vintage garden style apartments with similar characteristics to the subject property.
SUMMARY OF COMPARABLE BUILDING SALES
| | | | | | | | | | | |
| Sale No. | | 1 | | 2 | | 3 | | 4 | | 5 |
| |
| Name | | Woodbridge | | Chateau | | The Hamptons | | Esplanade | | N/A |
| Location | | 1101 Sepulveda Blvd | | 4524 N Claybourn Ave | | 1022 Grand Ave | | 616 Esplanade | | 7320 Hawthorn Ave |
| | | Torrance, CA | | Burbank, CA | | Diamond Bar, CA | | Redondo Beach,, CA | | Los Angeles, CA |
| Sales Price | | $42,800,000 | | $23,700,000 | | $34,100,000 | | $24,065,000 | | $15,861,200 |
| Sale Date | | 1-Aug-2005 | | 12-May-2005 | | 20-Sep-2004 | | 2-Jun-2004 | | 30-Apr-2003 |
| Year Built | | 1973 | | 1974 | | 1979 | | 1971 | | 1985 |
| No. of Units | | 214 | | 110 | | 204 | | 105 | | 99 |
| Net Rentable Area (SF) | | 1168,094 | | 110,566 | | 183,668 | | 90,096 | | 102,058 |
| Avg. Unit Size (SF) | | 898 | | 1,005 | | 900 | | 858 | | 1,031 |
| Occupancy | | 95% | | 95% | | 97% | | 98% | | 96% |
| Price/SF | | $222.81 | | $214.35 | | $185.66 | | $267.10 | | $155.41 |
| Price/Unit | | $200,000 | | $215,455 | | $167,157 | | $229,190 | | $160,214 |
| Net Income | | $2,482,630 | | $1,164,315 | | $1,943,700 | | $1,569,762 | | $959,204 |
| NOI/SF | | $12.168 | | $10.53 | | $10.58 | | $17.42 | | $9.40 |
| NOI/Unit | | $11,601 | | $10,585 | | $9,528 | | $14,950 | | $9,689 |
| Cap Rate (OAR) | | 5.8% | | 4.9% | | 5.7% | | 6.5% | | 6.0% |
| EGIM | | 11.8 | | 13.4 | | 9.2 | | 11.0 | | 10.7 |
| Expense Ratio (OER) | | 31% | | 34% | | 47% | | 28% | | 35% |
Comparable #1:This is the August 2005 sale of a 214-unit apartment complex that is located in the City of Torrance, approximately 36 miles southwest of the subject property. The alternative location of the comparable property is rated as being superior to that of the subject property. Built in 1973, construction is wood frame with stucco and wood trim exterior and flat built-up roof. This property is situated on 10.2 acres. Units include one and two and three-bedroom floor plans. Amenities include swimming pools, gated access, recreation room and laundry facility. Unit amenities include standard kitchen appliances, patio/balcony, mini-blinds and ceiling fans. The comparable’s average unit size of 898 square feet is similar to the subject’s 996 average square foot unit size.
In comparison to the subject, this property is superior in terms of location, which requires a downward adjustment to the sales price paid for this comparable.
Comparable #2:This is the May 2005 sale of a comparable property located approximately 30 miles west of the subject property, in the City of Burbank. The alternative location of the comparable property is rated as being superior to that of the subject. This property consists of a 110-unit apartment complex developed in 1974. Construction is wood frame with stucco and wood trim exteriors and flat built-up roof. This property is situated on 1.3 acres. Apartment units include one and two-bedroom floor plans. Amenities include swimming pool, spa, fitness center, elevator, gated covered parking and laundry facility. Unit amenities include standard kitchen appliances, patios/balconies, fireplace, ceiling fans, central a/c and mini-blinds. The comparable’s average unit size of 1,005 square feet is similar to the subject’s 996 average square foot unit size.
In comparison to the subject, this property is superior in terms of location, which requires a downward adjustment to the sales price paid for this comparable.
Comparable #3:This is the September 2004 sale of a comparable property located approximately eight miles southwest of the subject property in Diamond Bar. The location of the comparable property is rated as being slightly inferior to that of the subject. This property consists of a 204-unit apartment complex developed in 1979. Construction is wood frame with stucco and wood trim exteriors and pitched roof.
| | | |
| Mountain View Apartments | | May 4, 2006 |
| San Dimas, California | | Page 34 |
This property is situated on 12.6 acres. Apartment units include two and three-bedroom floor plans. Amenities include swimming pool, covered parking, on-site management/clubhouse, fitness center and laundry facilities. Unit amenities include standard kitchen appliances, central a/c, patio/balcony, mini-blinds and ceiling fans. The comparables’ average unit size of 900 square feet is similar to the subject’s 996 average square foot unit size.
In comparison to the subject, this property is superior in terms of location, which requires a downward adjustment to the sales price paid for this comparable.
Comparable #4:This is the June 2004 sale of a comparable property located 39 miles southwest of the subject property in Redondo Beach. The location of the comparable property is rated as being superior to that of the subject. This property consists of a 105-unit apartment complex developed in 1971. Construction is wood frame with stucco and wood trim exteriors and flat built-up roof. This property is situated on 1.2 acres. Apartment units include one and two-bedroom floor plans. Amenities include swimming pool, spa, gated covered parking, recreation room, elevator and laundry facilities. Unit amenities include standard kitchen appliances, patio/balcony, mini-blinds and ceiling fans. The comparables’ average unit size of 858 square feet is similar to the subject’s 996 average square foot unit size.
In comparison to the subject, this property is superior in terms of location and inferior in terms of age and condition. A downward adjustment will be made to the sales price per unit paid for this comparable for superior location. An upward adjustment will be applied for inferior age and condition.
Comparable #5:This is the April 2003 sale of a comparable property located approximately 30 miles west of the subject property in Los Angeles. The location of the comparable property is rated as being inferior to that of the subject. This property consists of a 99-unit apartment complex developed in 1985. Construction is wood frame with stucco and wood trim exteriors and flat built-up roof. This property is situated on 1.1 acres. Apartment units include one and two-bedroom floor plans. Amenities include gated access, five swimming pool, spa, gated covered parking, fitness center, and laundry facility. Unit amenities include standard kitchen appliances, microwave, fireplace, central a/c, patio/balcony, mini-blinds and ceiling fans. The comparable’s average unit size of 1,031 square feet is similar to the subject’s 996 average square foot unit size.
In comparison to the subject, this property is inferior in terms of location and superior in terms of age and condition. An upward adjustment will be made to the sales price per unit paid for this comparable for inferior location. A downward adjustment will be applied for superior age and condition.
PRICE PER UNIT ANALYSIS
The comparables are examined utilizing the following criteria:
FINANCING:The comparable sales were either all cash transactions or were financed by primary lenders at market-oriented rates. Adjustments are not required since atypical financing is not indicated.
TIME:The sales analyzed occurred within the past three years. No adjustment for changes in market conditions is required for the 2005 Sale Comparables. Sales #3, #4 and #5 occurred in 2004 and 2003 respectively. A 3% annual time adjustment for each of these sales is warranted.
LOCATION:Adjustments are made for locational attributes including proximity to area employers, local transportation and access to local neighborhood services. The location of each sale is analyzed individually as it compares to the subject property’s location. Sales #1, #2 and #4 are considered to have
| | | |
| Mountain View Apartments | | May 4, 2006 |
| San Dimas, California | | Page 35 |
superior locations as the subject property and downward adjustment is required. Sales #3 and #5 are situated in inferior locations and upward adjustment is applied for this factor.
AGE/CONDITION:Adjustments for age/physical condition were based on exterior observation, as well as the original date of construction. All of the sales were constructed in the 1970’s or 1985. Sales #5 is rated as being superior in terms of age and curb appeal. A downward adjustment is applied for these factors. Sale #4 is rated as being inferior in terms of age and curb appeal. An upward adjustment is applied for these factors.
UNIT SIZE/UTILITY:The subject property has 168 apartment units with an average unit size of 996 square feet. Generally properties with larger average unit sizes command higher sale prices per unit. Conversely, properties with smaller average unit sizes sell for less. Appropriate adjustments to the sale price paid for the comparables have been applied based on average unit size of the respective properties.
AMENITIES:The subject property is a 1978 vintage asset with standard community amenities and standard tenant amenities. All of the sales offer similar community and unit amenities.
The following chart summarizes the adjustments considered for each of the factors described above.
COMPARABLE SALES ADJUSTMENT GRID
| | | | | | | | | | | | | | | | | | | | | |
| Sale No. | | 1 | | | 2 | | | 3 | | | 4 | | | 5 | |
| |
| Sales Price/Unit | | $ | 200,000 | | | $ | 215,455 | | | $ | 167,157 | | | $ | 229,190 | | | $ | 160,214 | |
| | | | | | | | | | | | | | | | | | | | | |
| Conditions of Sale | | | 0.0 | % | | | 0.0 | % | | | 0.0 | % | | | 0.0 | % | | | 0.0 | % |
| Adjusted Price | | $ | 200,000 | | | $ | 215,455 | | | $ | 167,157 | | | $ | 229,190 | | | $ | 160,214 | |
| | | | | | | | | | | | | | | | | | | | | |
| Time | | | 0.0 | % | | | 0.0 | % | | | 3.0 | % | | | 3.0 | % | | | 6.0 | % |
| Time Adjusted Price | | $ | 200,000 | | | $ | 215,455 | | | $ | 172,172 | | | $ | 236,066 | | | $ | 169,826 | |
| | | | | | | | | | | | | | | | | | | | | |
| Location | | | -10.0 | % | | | -15.0 | % | | | 5.0 | % | | | -25.0 | % | | | 15.0 | % |
| Age/Condition | | | 0.0 | % | | | 0.0 | % | | | 0.0 | % | | | 5.0 | % | | | -5.0 | % |
| Unit Size/Utility | | | 0.0 | % | | | 0.0 | % | | | 0.0 | % | | | 0.0 | % | | | 0.0 | % |
| Amenities | | | 0.0 | % | | | 0.0 | % | | | 0.0 | % | | | 0.0 | % | | | 0.0 | % |
| | | | | | | | | | | | | | | | |
| Total Adjustments (%) | | | -10.0 | % | | | -15.0 | % | | | 5.0 | % | | | -20.0 | % | | | 10.0 | % |
| | | | | | | | | | | | | | | | | | | | | |
| Adjusted Sale Price | | $ | 180,000 | | | $ | 183,137 | | | $ | 180,781 | | | $ | 188,853 | | | $ | 186,809 | |
Source: Adjustments by KTR.
The unadjusted sales prices range from $160,214 to $229,190 per unit. After adjustment, the comparable sales illustrate a range from $180,000 to $188,853 per unit with an average of $183,916 per unit. All of the sales required adjustments for location. Two of the sales required adjustments because of superior physical characteristics. Sales #1, #2, #3 and #5 required the least overall adjustments and produce an average adjusted price of $182,682 per unit. Based on the adjustments considered and indicators exhibited by the sales data and equal emphasis placed on Sales #1, #2, #3 and #5, a value of $182,500 per unit is estimated for the subject property. Application of the $182,500 per unit value indicator to the 168 units comprising the subject property results in a value estimate of $30,700,000, rounded.
$182,500 per unit x 168 units = $30,660,000
EGIM ANALYSIS:The sales illustrate EGIMs that range from 9.2 to 13.4. Important in selecting an appropriate EGIM is the review of corresponding operating expenses. There is an inverse relationship which generally holds among EGIMs and operating expenses. Properties which have higher expense
| | | |
| Mountain View Apartments | | May 4, 2006 |
| San Dimas, California | | Page 36 |
ratios typically sell for relatively less and therefore produce a lower EGIM. The operating expense ratios for the sales range from 28% to 47%.
In selecting an appropriate EGIM, consideration must be given to the operating expense ratio estimated for the subject. Based on the income and expenses estimated for the subject property in the Income Approach, the subject’s operating expense ratio is calculated at 43%. The subject’s expense ratio is aligned with the high end of the range of ratios exhibited by the sales data, indicating that an appropriate EGIM is toward the low end of the comparable range. In consideration of the preceding, an EGIM of 10.25 is concluded.
Based on the effective gross income of $2,926,740 estimated for the subject property, a value indication of $30,000,000 (rounded) is concluded.
$2,926,740 x 10.25 = $29,999,085 or $30,000,000, rounded
CONCLUSION:The noted value indicator utilizing the sales price per unit and EGIM methods is $30,700,000 and $30,000,000 respectively. Due to the similarity of the resulting value indicators, relatively equal consideration was given to both techniques when concluding to a final value via the Sales Comparison Approach of $30,350,000.
As such, the Market Value of the subject property’s Fee Simple Interest via the Sales Comparison Approach is therefore estimated at:
Value via the Sales Comparison Approach $30,350,000
| | | |
| Mountain View Apartments | | May 4, 2006 |
| San Dimas, California | | Page 37 |
RECONCILIATION
| | | |
| Cost Approach | | N/A |
| Income Capitalization Approach | | $30,200,000 |
| Sales Comparison Approach | | $30,350,000 |
Income and Sales approaches to value were employed in the appraisal of the subject property. Buyers and sellers rarely rely on the Cost Approach to price commercial real estate. Furthermore, the age of the improvements and subjectivity involved in estimating substantial degrees of physical deterioration reduces the reliability of this approach. As such, a Cost Approach was not employed.
The value derived from the Income Capitalization Approach is well documented and market oriented. The local market is active in terms of investment sales of similar apartment complexes and sufficient sales data was available to develop a defensible value via the Sales Comparison Approach. The value derived through use of the Sales Comparison Approach supports the value concluded for the property via the Income Capitalization Approach. Due to the income producing nature of the subject property, the results of the Income Capitalization Approach are emphasized.
FINAL ESTIMATE OF VALUE $30,200,000
| | | |
| Mountain View Apartments | | May 4, 2006 |
| San Dimas, California | | Page 38 |
ADDENDA
| | | |
| Mountain View Apartments | | May 4, 2006 |
| San Dimas, California | | Page 39 |
SUBJECT PHOTOGRAPHS
- 39 -
| | | |
| Mountain View Apartments | | May 4, 2006 |
| San Dimas, California | | Page 40 |
VIEW OF PROPERTY FROM EAST BONITA AVENUE
VIEW OF MANAGEMENT/LEASING OFFICE
- 40 -
| | | |
| Mountain View Apartments | | May 4, 2006 |
| San Dimas, California | | Page 41 |
VIEW OF COMMON INTERIOR GROUNDS
VIEW OF TYPICAL BUILDING ELEVATION
- 41 -
| | | |
| Mountain View Apartments | | May 4, 2006 |
| San Dimas, California | | Page 42 |
VIEW OF POOL AREA
COVERED PARKING
- 42 -
| | | |
| Mountain View Apartments | | May 4, 2006 |
| San Dimas, California | | Page 43 |
VIEW OF PLAYGROUND
VIEW OF FITNESS CENTER
- 43 -
| | | |
| Mountain View Apartments | | May 4, 2006 |
| San Dimas, California | | Page 44 |
COMPARABLE RENTAL PHOTOGRAPHS
- 44 -
| | | |
| Mountain View Apartments | | May 4, 2006 |
| San Dimas, California | | Page 45 |
COMPARABLE #1
COMPARABLE #2
- 45 -
| | | |
| Mountain View Apartments | | May 4, 2006 |
| San Dimas, California | | Page 46 |
COMPARABLE #3
COMPARABLE #4
- 46 -
| | | |
| Mountain View Apartments | | May 4, 2006 |
| San Dimas, California | | Page 47 |
COMPARABLE #5
- 47 -
| | | |
| Mountain View Apartments | | May 4, 2006 |
| San Dimas, California | | Page 48 |
COMPARABLE SALE PHOTOGRAPHS
- 48 -
| | | |
| Mountain View Apartments | | May 4, 2006 |
| San Dimas, California | | Page 49 |
IMPROVED SALE #1
NO PHOTO AVAILABLE
IMPROVED SALE #2
- 49 -
| | | |
| Mountain View Apartments | | May 4, 2006 |
| San Dimas, California | | Page 50 |
IMPROVED SALE #3
IMPROVED SALE #4
- 50 -
| | | |
| Mountain View Apartments | | May 4, 2006 |
| San Dimas, California | | Page 51 |
IMPROVED SALE #5
- 51 -
| | | |
| Mountain View Apartments | | May 4, 2006 |
| San Dimas, California | | Page 52 |
REGIONAL LOCATION MAP
- 52 -
| | | |
| Mountain View Apartments | | May 4, 2006 |
| San Dimas, California | | Page 53 |
NEIGHBORHOOD MAP
- 53 -
| | | |
| Mountain View Apartments | | May 4, 2006 |
| San Dimas, California | | Page 54 |
COMPARABLE RENTALS MAP
- 54 -
| | | |
| Mountain View Apartments | | May 4, 2006 |
| San Dimas, California | | Page 55 |
COMPARABLE SALES MAP
- 55 -
| | | |
| Mountain View Apartments | | May 4, 2006 |
| San Dimas, California | | Page 56 |
QUALIFICATIONS
- 56 -
| | | |
| Mountain View Apartments | | May 4, 2006 |
| San Dimas, California | | Page 57 |
WILLIAM L. CORBIN, MAI
EXECUTIVE VICE PRESIDENT
WILLIAM CORBIN, MAIis Executive Vice President and manager of the Western Regional Office of KTR Newmark Real Estate Services LLC, located at 10866 Wilshire Boulevard, Los Angeles, California 90046. His direct telephone number is 310/ 234-4754.
Education
University of California at Los Angeles, 1977
Bachelor of Arts
Major in Economics
University of Southern California, 1980
Master of Business Administration
Concentration in Real Estate and Finance
Designations
MAI Member — Appraisal Institute
Licenses
California Certified General Real Estate Appraiser
Arizona Certified General Real Estate Appraiser
Affiliations
National Council of Real Estate Investment Fiduciaries (NCREIF) designated representative
- Valuation sub-committee co-chairperson for Standardized Commercial Appraisal Report
- 57 -
| | | |
| Mountain View Apartments | | May 4, 2006 |
| San Dimas, California | | Page 58 |
WILLIAM L. CORBIN, MAI
Experience
Mr. Corbin began his career with an intensive education in real estate market analysis as a consultant withRobert Charles Lesser & Co.from 1980 to 1983. With RCLCo, he performed over 75 market supply and demand, economic feasibility, and strategic planning assignments for prominent regional and national clients. During this very active construction period, nationally, Mr. Corbin had the opportunity to visit and analyze commercial real estate market conditions is over 20 major metropolitan areas in the Western and Central U.S.
As a mortgage banker from 1983 to 19168, Mr. Corbin arranged a wide variety of financing structures with institutional lenders and equity investors, including permanent loans, construction loans, and joint ventures. In total withGeorge Smith Financial Services/Grubb & Ellisand Center Financial Group, he worked with over 90 institutions and closed over 150 transactions totaling in excess of $700,000,000.
As an appraiser, Mr. Corbin has performed numerous current value narrative appraisals for national and regional institutional lenders and investors. His previous experience in commercial real estate finance gives him particular insight to the capital and investment markets and their impact on institutional real estate activity and values. He has performed a wide variety of appraisals of warehouse distribution buildings, industrial and business parks, office buildings, shopping centers, and apartments. He worked withLandauer Associatesfrom 19168 to 1995, managing the Aetna Realty Investors account for western region property appraisals.
Currently withKTR Newmarkten years, Mr. Corbin is responsible for managing the Los Angeles regional office, developing and managing institutional accounts, as well as performing direct valuation work for those clients. He also heads KTR Newmark’s national pension fund valuation practice and is the firm’s designated representative to NCREIF, a national organization of pension fund advisors that creates and implements operational policy standards for the industry. Mr. Corbin is currently the chairperson for NCREIF’s valuation sub-committee that is contributing to developing a standardized commercial appraisal report in conjunction with the Appraisal Institute that will become the valuation industry standard.
In addition to professional experience, Mr. Corbin has served as a real estate course instructor and conference collaborator for UCLA Extension
WILLIAM L. CORBIN, MAI
- 58 -
| | | |
| Mountain View Apartments | | May 4, 2006 |
| San Dimas, California | | Page 59 |
Following is a list of representative clients Mr. Corbin has performed services for:
| | | |
Clients — As Appraiser and Consultant | | |
| Aetna Realty Investors, Inc. | | Massachusetts Mutual Life |
| Bechtel Corporation | | McCullough Oil Properties |
| CALTRANS | | Mobil Land Development |
| Catellus Corp. | | Chevron Land Development |
| | | |
| Philips, North America | | Home Savings of America |
| | | |
| KOAR Hotel Group | | Safeway Stores |
| Copley Institutional Realty | | Santa Anita Realty |
| Estate of James Campbell | | Santa Fe Land Improvement Co. |
| Franklin Properties, Inc. | | Taft Broadcasting Co. |
| Triton Energy Corp | | Comerica Bank |
| Union Oil/Moreland Development | | Trammell Crow Company |
| Kaiser Aluminum Corp. | | Bank of New York |
| Lockheed Air Terminal, Inc. | | Majestic Realty |
| Hong Kong and Shanghai Bank Corp. | | Canadian Imperial Bank of Commerce |
| | | |
| PNC Bank | | Sakura Bank |
| | | |
| CALSTRS | | Newfield Enterprises |
| Heller Financial | | J. P. Morgan Mortgage Capital |
| Chase Commercial Mortgage Banking | | Lend Lease Mortgage Capital |
| Daiwa Securities America | | Whitehall Fund II |
| Lennar Partners | | AMB Institutional Realty Advisors |
| SSR Realty Advisors | | TA Associates Realty |
| Douglas, Emmett Realty Advisors | | LACERA |
| Dresdner Bank | | Henderson Global Investors |
| Prudential Mortgage Capital | | Prudential Insurance Company of America |
| TIAA-CREF | | INVESCO |
| Principal Real Estate Investors | | Cornerstone Real Estate Advisers |
| | | |
| RREEF | | Deutsche Bank |
| Eurohypo Bank | | |
| | | |
Clients — As Mortgage Banker | | |
| Aetna Life & Casualty | | AFL-CIO Housing Trust |
| BALCOR | | Bank of America |
| Citicorp REIG | | Creative Artists Agency |
| Forest City Properties | | General Electric Credit |
| Heller Financial Services | | Hollywood Center Studios |
| Home Savings of America | | Industrial Bank of Japan |
| MetroBank | | Massachusetts Mutual Life |
| Principal Mutual Life | | Security Pacific National Bank |
| Societe Generale | | Textron Financial Services |
| U.S. Bancorp | | Union Bank |
| William Morris Agency | | DeAnza Group, Inc. |
- 59 -
| | | |
| Mountain View Apartments | | May 4, 2006 |
| San Dimas, California | | Page 60 |
| | | |
| IBEW Pension Fund | | Nationwide Life |
STEVEN J. GOLDBERG, MAI, CCIM
SENIOR VICE PRESIDENT
STEVEN J. GOLDBERG is Manager of the Dallas Appraisal Division of KTR Newmark Real Estate Services LLC. His responsibilities include staff supervision, appraisal management, maintaining product quality, marketing and client development. In his current capacity, Mr. Goldberg oversees all valuation assignments involving real estate assets located in the Southwest region.
Mr. Goldberg has over 23 years of nationwide experience in real estate valuation, investment analysis and evaluation consultation. He has performed appraisals throughout the United States and has extensive experience in most markets situated in the Southwest and Southeast regions of the country. Mr. Goldberg’s particular area of expertise is in the appraisal and analysis of multifamily apartment projects. In addition to his expertise in the multifamily market, Mr. Goldberg has extensive experience in the appraisal of other income-producing properties including office buildings, retail properties, lodging facilities, industrial properties and mixed-use projects.
Mr. Goldberg has performed marketability, consultation and feasibility reports, has served as an expert witness and has testified in various state and federal courts. These activities have been performed on behalf of real estate investors, life insurance companies, pension funds, investment banking firms, foreign and domestic financial institutions, mortgage bankers, conduit lenders, real estate advisors, law firms and governmental agencies.
Mr. Goldberg received his Bachelor of Business Administration Degree from the University of Texas in Austin, with major concentrations in both Finance and Real Estate/Urban Land Economics. He is a designated member of the Appraisal Institute and the Commercial Investment Real Estate Institute having been awarded the MAI designation in 1989 and the CCIM designation in 1994. He has attended numerous continuing education courses and has completed the requirements under the continuing education program of the Appraisal Institute.
Mr. Goldberg is state certified as a General Real Estate Appraiser in Texas and Arizona. He is also a licensed Real Estate Broker in the State Texas. He is affiliated with the North Texas Commercial Association of Realtors, International Council of Shopping Centers and Mortgage Bankers Association.
- 60 -