Exhibit (c)(5)
COMPLETE APPRAISAL
SUMMARY APPRAISAL REPORT
OF
PATHFINDER VILLAGE APARTMENTS
39800 FREMONT BOULEVARD
FREMONT, CALIFORNIA
KTR JOB NO. 7-7-06013E
| | |
| Ms. Martha Long | | April 30, 2006 |
| Senior Vice President | | |
| AIMCO | | |
| 4582 S. Ulster Street Parkway, Suite 1100 | | |
| Denver, Colorado 80237 | | |
| | | |
| Re: | | Pathfinder Village Apartments |
| | | 39800 Fremont Boulevard |
| | | Fremont, California |
Dear Ms. Long:
At your request, KTR Newmark Real Estate Services LLC has appraised the above referenced property. The purpose of the appraisal is to estimate the Market Value of the Fee Simple Estate of the subject property, free and clear of financing, as of April 14, 2006. The date of value corresponds to the date the subject property was most recently inspected by the appraiser.
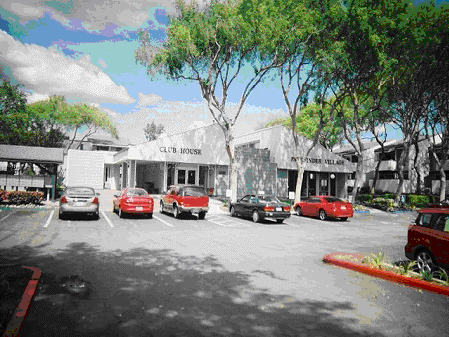
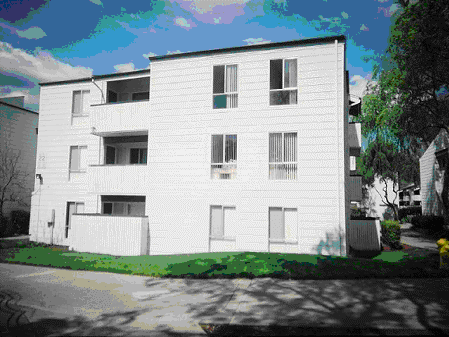
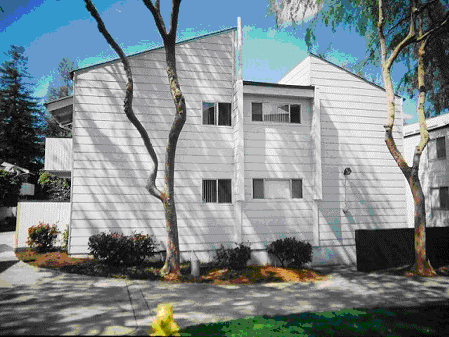
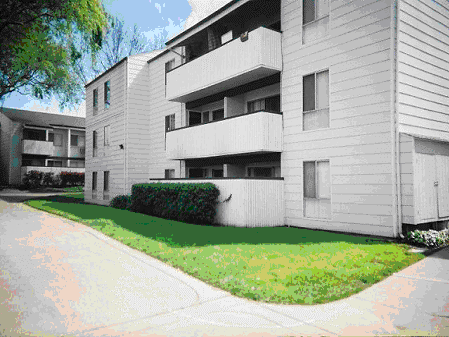
The subject property consists of a 8.13-acre tract of land improved with a 246-unit garden-style apartment complex known as the Pathfinder Village Apartments. Construction of the improvements was reportedly completed in 1973. The structural improvements were observed to be in average physical condition and consist of two-and three-story wood frame residential buildings with stucco veneer and wood trim exterior walls and pitched roofs with asphalt shingle cover.
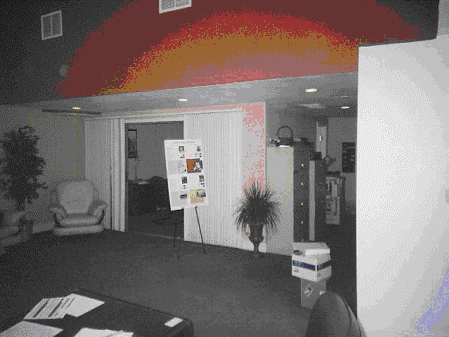
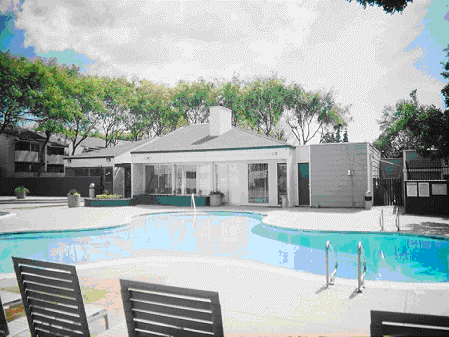
Amenities common to all units include electric kitchen appliances, patio/balcony, microwave, and mini-blinds. Other apartment features include disability access, ceiling fan(s), dishwasher, and oversized closets. Community amities include clubhouse, fitness center, covered parking, two laundry facilities, public transportation and swimming pool. The interiors have recently been upgraded. As of the date of inspection, a portion of the clubhouse was being converted into a child development center. Pathfinder Village Apartments contain 235,780 rentable square feet, which suggests an average unit size of 958 square feet. The subject offers only two and three-bedroom floor plans.
The following report contains information considered relevant to the valuation of the property and the methods by which collected data have been analyzed in arriving at our value conclusion. Our analysis included an inspection of the premises, interviews with knowledgeable market participants, a review of historical income and expense statements, the current rent roll, and other relevant financial and market information. As an income-producing property, greatest reliance is placed upon the value derived through the Income Capitalization Approach, with support provided by the conclusion rendered through implementation of the Sales Comparison Approach.
This appraisal report has been prepared in order to comply with the reporting requirements set forth under Standards Rule 2-2(b) of the Uniform Standards of Professional Appraisal Practice (USPAP) for a Complete Appraisal in Summary Report format. As such, it presents only summary discussions of the data, reasoning, and analyses that were used in the appraisal process to develop the appraiser’s opinion of value. Supporting documentation not presented herein has been retained in the appraiser’s file. The depth of discussion contained in this report is specific to the needs of the client and for the intended use stated herein.
| | |
Ms. Martha Long
AIMCO | | April 30, 2006
Page 2 |
The attached Summary Appraisal Report describes our investigation and analyses, together with Certification, Basic Assumptions and Limiting Conditions, upon which we have based our opinion that the market value of the Fee Simple Estate of the subject property, as of April 14, 2006, is:
THIRTY-TWO MILLION SIX HUNDRED THOUSAND DOLLARS
($32,600,000)
It has been a pleasure to be of service to you. Please do not hesitate to call with any questions you may have regarding our assumptions, observations or conclusion.
Very truly yours,
KTR NEWMARK REAL ESTATE SERVICES LLC
| | | | | | | |
| By: | | William L. Corbin, MAI
Senior Vice President for the Firm | | By: | | Steven J. Goldberg, MAI, CCIM
Senior Vice President for the Firm |
| | | | | | | |
| By: | | Jackson L. Aills
Appraiser | | | | |
| | |
| Pathfinder Village Apartments | | April 30, 2006 |
| Fremont, California | | Page i |
CERTIFICATE OF VALUE
We, William L. Corbin, MAI, Steven J. Goldberg, MAI, and Jackson L. Aills, certify that to the best of our knowledge and belief:
The statements of fact contained in this appraisal are true and correct.
The reported analyses, opinions, and conclusions are limited only by the reported assumptions and limiting conditions, are our personal, unbiased professional analyses, opinions, and conclusions.
We have no present or prospective interest in the property that is the subject property of this appraisal, and have no personal interest or bias with respect to the parties involved.
Our compensation is not contingent upon the reporting of a predetermined value or direction in value that favors the cause of the client, the amount of value estimate, the attainment of a stipulated result, or the occurrence of a subsequent event.
Our analyses, opinions, and conclusions were developed, and this report has been prepared, in conformity with the Uniform Standards of Professional Appraisal Practice (USPAP) as promulgated by the Appraisal Standards Board of the Appraisal Foundation, the Code of Professional Ethics and the Standards of Professional Appraisal Practice of the Appraisal Institute, and Title XI (and amendments) of the Financial Institutions Reform, Recovery and Enforcement Act of 1989 (FIRREA) effective August 9, 1990.
Jackson L. Aills made a personal a personal inspection of the property that is the subject of this appraisal. Neither William L. Corbin nor Steven J. Goldberg inspected the subject property.
This appraisal was not prepared in conjunction with a request for a specific value or a value within a given range or predicated upon loan approval.
We have the knowledge and experience necessary to perform this appraisal assignment and have previously appraised this type of property.
As of the date of this appraisal, William L. Corbin, MAI and Steven J. Goldberg, MAI, have completed the requirements under the continuing education program of the Appraisal Institute.
The use of this report is subject to the requirements of the Appraisal Institute relating to review its duly authorized representatives.
| | |
| Pathfinder Village Apartments | | April 30, 2006 |
| Fremont, California | | Page ii |
As of the date of this appraisal, William L. Corbin MAI is currently certified with the State of California Office of Real Estate Appraisers and is licensed as a Certified General Real Estate Appraiser (AG025737) until February 27, 2007.
KTR NEWMARK REAL ESTATE SERVICES LLC
| | | | | | | |
| By: | | William L. Corbin, MAI | | By: | | Steven J. Goldberg, MAI, CCIM |
| | | Senior Vice President for the Firm | | | | Senior Vice President for the Firm |
| | | | | | | |
| By: | | Jackson L. Aills | | | | |
| | | Appraiser | | | | |
| | |
| Pathfinder Village Apartments | | April 30, 2006 |
| Fremont, California | | Page iii |
BASIC ASSUMPTIONS AND LIMITING CONDITIONS
This Appraisal Report is subject to underlying assumptions and limiting conditions qualifying the information contained in the Report as follows:
The valuation estimates apply only to the property specifically identified and described in the ensuing Report.
Information and data contained in the Report, although obtained from public record and other reliable sources and where possible, carefully checked by the Appraiser, are accepted as satisfactory evidence upon which rests the final expression of property value.
The Appraiser has made no legal survey nor has he commissioned one to be prepared and therefore, reference to a sketch, plat, diagram or previous survey appearing in the Report is only for the purpose of assisting the reader in visualizing the property.
It is assumed that all information known to the client and relative to the valuation have been accurately furnished and that there are no undisclosed leases, agreements, liens or other encumbrances affecting the use of the property.
Ownership and management are assumed to be competent and in responsible hands.
No responsibility beyond reasonableness is assumed for matters of a legal nature, whether existing or pending.
Information identified as being furnished or prepared by others is believed to be reliable but no responsibility for its accuracy is assumed.
The Appraiser, by reason of this appraisal, shall not be required to give testimony as an expert witness in any legal hearing or before any court of law unless justly and fairly compensated for such service.
By reason of the Purpose of the Appraisal or Function of the Report herein set forth, the value reported is only applicable to the Property Rights Appraised and the Appraisal Report should not be used for any other purpose.
Disclosure of the contents of this report is governed by the by-laws and Regulations of the Appraisal Institute.
Unless otherwise stated in this report, the existence of hazardous material, which may or may not be present on the property, was not observed by the appraiser. The appraiser has no knowledge of the existence of such materials on or in the property. The appraiser, however, is not qualified to detect such substances. The presence of substances such as asbestos, urea-formaldehyde foam insulation or other potentially hazardous materials may affect the value of the property. Any value estimate is predicated on the assumption that there is no such material on or in the property that would cause a loss in value. No responsibility is assumed for any such conditions, or for any expertise or engineering knowledge required to discover them. The client is urged to retain an expert in this field, if desired.
| | |
| Pathfinder Village Apartments | | April 30, 2006 |
| Fremont, California | | Page iv |
In arriving at the value set forth in this appraisal no consideration has been given to the effect of state, local or federal income and gains taxes or of occupancy, hotel, capital levy, gift, estate, succession, inheritance or similar taxes which may be imposed upon any owner, lessee, or mortgagee by reason of any sale, conveyance, transfer, leasing, hypothecation, mortgage, pledge or other disposition of the appraised property.
The appraiser was not provided architectural plans for the subject property, thus the square footage as indicated on the rent roll, marketing brochures, and unit mix provided by the client has been utilized. In the event this information is inaccurate, we reserve the right to modify this appraisal if so warranted.
| | |
| Pathfinder Village Apartments | | April 30, 2006 |
| Fremont, California | | Page iv |
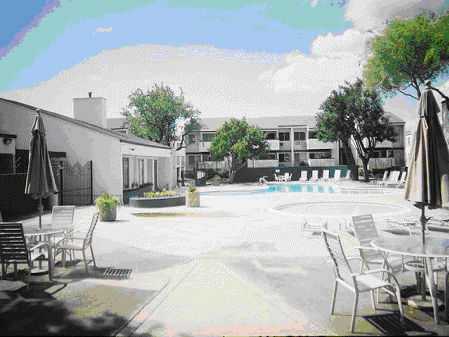
SUBJECT PROPERTY PHOTOGRAPH
| | |
Pathfinder Village Apartments
Fremont, California | | April 20, 2006
Page vi |
| |
TABLE OF CONTENTS
| | | | | |
| Title Page | | | | |
| Letter of Transmittal | | | | |
| Certificate of Value | | | i | |
| Basic Assumptions and Limiting Conditions | | iii |
| Subject Photograph | | | v | |
| Table of Contents | | vi |
| | | | | |
| Executive Summary | | | 1 | |
| Introduction and Premises of the Appraisal | | | 2 | |
| Regional Overview | | | 4 | |
| Neighborhood Overview | | | 11 | |
| Site Analysis | | | 13 | |
| Real Estate Taxes | | | 14 | |
| Zoning | | | 15 | |
| Description of Improvements | | | 16 | |
| Apartment Market Overview | | | 18 | |
| Economic Rent Analysis | | | 21 | |
| Highest and Best Use | | | 28 | |
| | | | | |
| Valuation Procedure | | | 29 | |
| Income Capitalization Approach | | | 30 | |
| Sales Comparison Approach | | | 35 | |
| Reconciliation and Final Value Conclusion | | | 39 | |
| | | | | |
ADDENDA | | | | |
| Subject Photographs | | | | |
| Comparable Rental Photographs | | | | |
| Comparable Sale Photographs | | | | |
| Regional Location Map | | | | |
| Neighborhood Map | | | | |
| Comparable Rentals Map | | | | |
| Comparable Sales Map | | | | |
| Qualifications | | | | |
| | |
Pathfinder Village Apartments
Fremont, California | | April 20, 2006
Page 1 |
| |
EXECUTIVE SUMMARY
| | | |
| Property: | | Pathfinder Village Apartments |
| | | |
| Location: | | 39800 Fremont Boulevard, Fremont, California |
| | | |
| Assessor’s Parcel ID No: | | 525-850-2-11 |
| | | Alameda County Assessor’s Office |
| | | |
| Purpose of Appraisal: | | To estimate the Market Value of the subject property as of the date of value. |
| | | |
| Date of Value: | | April 14, 2006 |
| | | |
| Date of Report: | | April 30, 2006 |
| | | |
| Interest Appraised: | | Fee Simple Estate |
| | | |
| Description of Property: | | The subject property consists of an 8.13-acre tract of land improved with a 246-unit garden-style apartment complex known as the Pathfinder Village Apartments. Construction of the improvements was reportedly completed in 1973. Pathfinder Village Apartments contains 235,780 rentable square feet, which suggests an average unit size of 958 square feet. |
| | | |
| Location: | | The subject property is located in the central sector of the City of Fremont, along the north side of Fremont Boulevard, approximately 525 feet west of Stevenson Boulevard. |
| | | |
| Zoning: | | The subject site is zoned R-3 — Multi-Family Residence District by the City of Fremont. This is a medium density multifamily district located in certain areas close to the center of the city and various outlying areas. |
| | | |
| Flood Zone: | | According to the Federal Emergency Management Agency, the property is within Zone X, outside any special Flood Hazard Areas, according to FEMA Map No. 065028-0030C, Dated 02/09/2000. |
| | | |
| Highest and Best Use: | | Multifamily residential development. |
| | | |
| Marketing Period: | | Less than 12 months |
| | | |
| Valuation Assumptions: | | |
| | | |
| Average Market Rent (per Unit) | | $1,371 |
| Market Vacancy/Credit Loss | | 6.0% |
| Operating Expense Ratio | | 53% |
| Net Operating Income | | $1,793,185 |
| Overall Capitalization Rate | | 5.5% |
| | |
Pathfinder Village Apartments
Fremont, California | | April 20, 2006
Page 2 |
| |
| | | |
| Final Estimate of Market Value, by Approach | | |
| Cost Approach: | | N/A |
| Sales Comparison Approach: | | $33,100,000 |
| Income Approach: | | $32,600,000 |
| Final Estimate of Market Value: | | $32,600,000 |
INTRODUCTION AND PREMISES OF THE APPRAISAL
| | | |
| Scope of the Assignment | | According to the Appraisal Institute’s Code of Professional Ethics and Uniform Standards of Professional Appraisal Practice, the scope of the appraisal is cited as “the extent of the process of collecting, confirming, and reporting data” included in an appraisal report. The scope of this appraisal employs all applicable appraisal techniques and constitutes a Complete Appraisal as defined by USPAP. The presentation of data, analyses and conclusions are presented in summary report format. |
| | | |
| | | The data included in this report has been researched from the subject property’s influencing market. County and City officials were interviewed regarding taxes, zoning requirements, flood zone information, demographic data, planned construction, recently completed developments, and other economic impacting events. Market participants, including real estate brokers and property managers, were consulted regarding market parameters and activity. Lenders as well as investor surveys were consulted regarding investment parameters. The Sales Comparison and Income Capitalization Approaches to value have been performed in estimating the Market Value of the subject. Sales utilized were confirmed with a principal or representative involved with the sale. Leasing agents for the competitive complexes were interviewed regarding property specific information. Supply and demand factors affecting the local market have been analyzed. |
| | | |
| Purpose and Use of Appraisal | | The purpose of the appraisal is to estimate the Market Value of the Fee Simple Estate of the subject property as of April 14, 2006. It is for the internal use of AIMCO to facilitate asset evaluation and to be utilized in conjunction with a planned transaction with the limited partners. |
| | | |
| Property Rights Appraised | | The property interest appraised is that of the Fee Simple Estate. A Fee Simple Estate is defined byThe Dictionary of Real Estate Appraisal, Second Edition AIREA, as: |
| | | |
| | | “Absolute ownership unencumbered by any other interest or estate, subject only to the limitations of the four powers of government (eminent domain, escheat, police power and taxation)”. |
| | | |
| Marketing Period | | The value conclusion reported herein assumes a marketing period of less than one year. According to the Korpacz Real Estate Investor Survey, 1st Quarter 2006 indicates that apartment properties in the national market have an average marketing time of 5.69 months, generally similar to the average of 5.81 months reported one year ago. This estimate seems |
| | |
Pathfinder Village Apartments
Fremont, California | | April 20, 2006
Page 3 |
| |
| | | |
| | | reasonable, given recent market activity in the influencing area and the profile of the subject property. |
| | | |
| Property History | | Property tax records indicate that VMS National Properties Joint Venture is the current owner of record. VMS National Properties owns and manages approximately 15 apartment communities with approximately 2,500 individual units. The partnership’s managing general partner, MAERIL, is a subsidiary of AIMCO. MAERIL provides the company with management and administrative services. |
| | | |
| | | No conveyances involving the subject property were noted within the three-year period preceding the effective date of value. To our knowledge there are no contracts of sale pending as of the date this report was prepared, nor are we aware that the property is listed for sale. |
| | | |
| Most Likely Buyer | | National and regional investors typically purchase multifamily properties of this size in markets such as the subject. |
| | | |
| Definition of Market Value | | Market Value, as approved and adopted by the Appraisal Foundation in the Uniform Standards of Professional Appraisal Practice is as follows: |
| | | |
| | | “The most probable price which a property should bring in a competitive and open market under all conditions requisite to a fair sale, the buyer and seller each acting prudently and knowledgeably, and assuming the price is not affected by undue stimulus. |
| | | |
| | | Implicit in this definition is the consummation of a sale as of a specified date and the passing of title from seller to buyer under conditions whereby: |
| | | |
1. | | buyer and seller are typically motivated; |
| | | |
2. | | both parties are well-informed or well advised, and acting in what they consider their best interests; |
| | | |
3. | | a reasonable time is allowed for exposure in the open market; |
| | | |
4. | | payment is made in terms of cash in United States dollars or in terms of financial arrangements comparable thereto; and |
| | | |
5. | | the price represents the normal consideration for the property sold unaffected by special or creative financing or sales concessions granted by anyone associated with the sale.” |
| | |
Pathfinder Village Apartments
Fremont, California | | April 20, 2006
Page 4 |
| |
REGIONAL OVERVIEW
| | | |
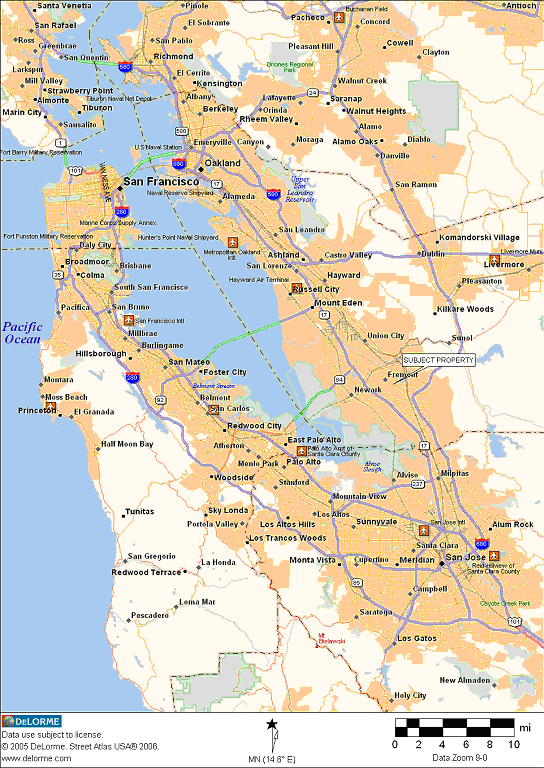
| Overview | | The subject property is situated in the City of Fremont, Alameda County, within the San Francisco Bay Area. The San Francisco Bay Area, referred to locally as the Bay Area, is a geographically diverse metropolitan area that surrounds San Francisco Bay in northern California. Home to almost eight million people, it is composed of cities, towns, villages, military bases, airports, and associated regional, state, and national parks sprawled over nine counties and connected by a massive network of roads, highways, railroads, and commuter rail. |
| | | |
| | | The Bay Area is atypical in that its population is distributed across several regional urban and suburban centers. San Francisco was until recently the largest city in the region (it was surpassed by San Jose in the 1990 census) and remains the traditional and cultural center. The metropolitan area comprising the city of San Francisco together with Oakland and San Jose is the fifth-largest metropolitan area in the United States, after New York, Los Angeles, Chicago
and Washington, D.C.-Baltimore. |
| | | |
| Metropolitan Area | | The San Francisco Bay Area consists of the nine counties including San Francisco, San Mateo, Santa Clara, Alameda, Contra Costa, Solano, Napa, Sonoma, and Marin, situated on the perimeter of San Francisco Bay and San Pablo Bay. San Francisco is in the geographical and cultural center of the region. It is surrounded by Marin, Napa, Sonoma and Solano Counties to the north; Alameda and Contra Costa Counties to the east; and San Mateo and Santa Clara Counties to the south. The large land area and highly diversified physical features of the Bay Area support a wide range of land uses. Land uses range from large agricultural areas to major urban centers, and environments range from mountain to marine. |
| | | |
| | | The San Francisco Bay Area is divided in the to the following sub-regions. |
| | | |
| | | San Francisco — The City and County of San Francisco is generally placed in a category by itself geographically, mentally, and culturally. It is separated by water from the north, west and east, and by a county line from its neighbor cities to the south. San Francisco serves as the cultural and financial center of the region, and once was the population and economic center. It remains the Bay Area’s center of attraction, and it is the heart of its nightlife. |
| | | |
| | | East Bay - The eastern side of the bay, dominated by the city of Oakland but also including Alameda, Berkeley, Fremont, Livermore, Hayward and several small cities, is known locally as the East Bay. The East Bay is split into two regions, the inner East Bay, which sits on the Bay coastline, and the outer East Bay, consisting of inland valleys separated from the inner East Bay by hills and mountains. |
| | |
Pathfinder Village Apartments
Fremont, California | | April 20, 2006
Page 5 |
| |
| | | |
| | | The inner East Bay consists of Oakland, Hayward, Fremont, Berkeley, and smaller suburbs surrounding or surrounded by these four major cities, such as Emeryville, San Leandro, and Richmond. The inner East Bay is more urban, more densely populated, has a much older building stock (built before World War II) and a more ethnically diverse population. Oakland hosts the region’s largest seaport and professional sports franchises in basketball, football, and baseball. As with many inner urban areas the Inner East Bay also features a high accumulation of crime as well as socio-economic problems. According to the FBI Uniformed Crime Reports, more than 50% of all homicides in the Bay Area in 2002 occurred within the city limits of Oakland and Richmond. |
| | | |
| | | The outer East Bay consists of the cities of Walnut Creek, Concord, and Pleasant Hill, to the north (also referred as Central Contra Costa County) and the cities of Dublin, Pleasanton, Livermore, Danville, San Ramon to the south (sometimes referred to as the Livermore-Amador Valley or the Tri-Valley), as well as other smaller towns, such as Alamo and Orinda. They are connected to the inner East Bay by BART and by highways and the Caldecott Tunnel. The outer East Bay is mostly suburban to rural and was mostly built after World War II. |
| | | |
| | | South Bay - The communities along the southern edge of the Bay are known as the South Bay, Santa Clara Valley, and Silicon Valley, although some Peninsula and East Bay towns are sometimes included in the latter. It includes the city of San Jose, and its smaller neighbors including Gilroy and the high-tech hubs of Santa Clara, Cupertino, Palo Alto and Sunnyvale, as well as many other suburbs. |
| | | |
| | | Peninsula — The area between the South Bay and the City and County of San Francisco is known as the San Francisco Peninsula, locally just as The Peninsula. This area consists of a series of small cities and suburban communities along the Bay such as Palo Alto and Stanford University, Mountain View, Daly City, San Mateo, and Foster City, as well as various towns along the Pacific coast, such as Pacifica and Half Moon Bay. |
| | | |
| | | North Bay - The region north of the Golden Gate Bridge is known locally as the North Bay. This area consists of Marin County and extends northward into Sonoma and Napa Counties and eastward to Solano County. With some exceptions, this region is quite affluent, and is generally the least urbanized part of the Bay Area, with many areas of undeveloped park and farmland. It is the only section of the Bay Area that is not served by a commuter rail transit service, though Sonoma-Marin service has entered the planning phase. The lack of transportation services is mainly because the lack of population mass in the North Bay, and the fact that it is separated completely from the rest of the Bay Area by water, the only access points being the Golden Gate Bridge leading to San Francisco, the Richmond-San Rafael and Carquinez Bridges leading |
| | |
Pathfinder Village Apartments
Fremont, California | | April 20, 2006
Page 6 |
| |
| | | |
| | | to Richmond, and the Benicia Bridge leading to Concord. |
| | | |
| Geography | | The large land area and highly diversified physical features of the Bay Area compose one of the most varied environments in the United States, and support a wide range of land uses and living environments. The dominant influence of the area’s climate is the San Francisco Bay, which moderates the temperatures in the coastal areas, while inland climates that are further removed from the Bay’s influence experience a wide range of temperatures. Rainfall averages 25 inches per year and generally falls from November through March. January is the coldest month and the average daily high temperature is 55 degrees Fahrenheit; the average daily low temperature is 45 degrees Fahrenheit. September, one of the warmest months, averages a daily high of 68 degrees Fahrenheit. |
| | | |
| | | The most powerful geographical influence is exerted by the fault zones that lace the region. In 1989, the Loma Prieta earthquake caused heavy damage along the Bay Area Peninsula as well as the East Bay. This earthquake was the most serious one to occur since 1906. Most infrastructure damaged by the earthquake has been repaired. Other physical damage, including collapsed and unsafe buildings, has generally also been repaired. Despite the physical damage caused by the earthquake, the economy of the region suffered no significant long-term damage. |
| | | |
| Population | | Population trends affect employment, retail spending, housing, bank deposits, and many other essential demand parameters analyzed in determining real estate productivity. Population growth, stability, or decline is a strong indicator of real estate viability within an area. |
| | | |
| | | The mild climate of the Bay Area has played an important role in development, and contributes to a desirable living environment. During the 1960s and 1970s, the regional population grew at an average annualized rate of 1.9%. During the 1980s, the population grew by approximately 1.4% per year. Population growth during the period from 2000 through 2015 is projected at approximately 0.9% annually. The slowing in the rate of population growth reflects the diminishing supply of available land and the high cost of housing in the area. |
| | | |
| | | San Francisco is the focal point of the San Francisco Bay Area and forms part of the greater San Jose-San Francisco-Oakland Combined Statistical Area (CSA) whose population is over 7 million. The highest rates of growth are projected in Solano and Santa Clara counties. Santa Clara County is the Bay Area Center for the technology industry. While population growth is expected to be substantial, it will still occur at a rate that is far slower than the growth in Southern California or many other portions of the state. The Bay Area has some of the highest housing costs in the nation. When the comparison is made between household income and housing costs, the Bay Area remains one of the least affordable areas in the nation. |
| | |
Pathfinder Village Apartments
Fremont, California | | April 20, 2006
Page 7 |
| |
| | | |
| Economic | | The San Francisco MSA, which encompasses the Counties of San Francisco, San Mateo, and Marin, is the nation’s fourth largest metropolitan area. Historically, San Francisco has been the financial and business center of the western United States. Beginning in late-1994 and early-1995, the strengthening high technology and computer-related industries located in the southern Bay Area began to lead the state out of its deep recession. In the second half of the 1990s, the local economy was driven by the growth in technology, particularly Internet, software, and other computer-related technology ventures. The technological advances during the mid- to late-1990s, coupled with a strong stock market and nearly limitless availability of capital provided an environment for surging employment growth, real estate values, and overall prosperity in the region. The explosion of the so-called dot.com industry, funded primarily from venture capital, fueled an economic boom in Bay Area in the late 1990’s and early 2000 of unprecedented proportion. As a result, every aspect of the real estate market experienced huge gains. |
| | | |
| | | Commercial and industrial vacancy rates became almost non-existent while lease rates doubled in some instances during this period. While sale prices never matched the increase in rents, there was significant appreciation of commercial and industrial property sales prices. Apartment availability also became extremely tight with rents climbing 30% to 40%. Home prices surged as well, appreciation was in the neighborhood of 25% to 35% in this short time period. During this time a new market phenomenon also sprung out of the disparity between demand and supply of homes. Realtors began the practice of listing prices slightly below their market values to entice bidding wars. It thus became the accepted market practice to bid over the listing price, often substantially above the listing price. |
| | | |
| | | In March 2001 the tech-heavy NASDAQ declined due to concerns of over-inflated stock prices as negative reports about company profitability and news about declining demand for computer related goods and services surfaced. The Dow Jones quickly followed and entire stock market, including non-tech blue-chip stocks, also tumbled. This trend continued further into 2001. As a result of the stock market tumble, both the national and local economies contracted. The stock market tumble was compounded by the September 11, 2001 terrorist attacks on the World Trade Center and the Pentagon. The risk of air piracy, attacks on large landmarks, bio-terrorism and other threats to public safety has raised the level of uncertainty in the markets. It has also severely impacted the travel and tourism business, which rely heavily on air travel. |
| | | |
| | | Technology based companies were particularly impacted by the stock market decline. The Bay Area, which is generally regarded as being top-heavy in the technology sector, suffered considerably. Many of the newer |
| | |
Pathfinder Village Apartments
Fremont, California | | April 20, 2006
Page 8 |
| |
| | | |
| | | and more financially sensitive companies went out of business, while the larger and more established companies, such as Cisco Systems, Hewlett-Packard and Oracle, had significant layoffs in attempt to weather the storm. Unemployment rates have been on a declining trend since 2002. |
| | | |
| | | Recent information regarding national and local economic recoveries indicates that a recovery started to take place in 2004, and is continuing in 2006. |
| | | |
| Employment | | Employment affects the real estate market since an overall increase in total employment translates into more space utilized for office employees, more retail space to sell goods and services, and more money flowing through the area economy. For example, if sectors such as Finance/Insurance/Real Estate, Services and Miscellaneous, and Government, which typically consist of white-collar jobs, experience an increase in employment, this would in turn help support the office and retail real estate markets. |
| | | |
| | | South Bay — The South Bay economy is entering a growth cycle after recovering from the dotcom bust. For example, at the end of 2005, San Jose boasted 121 job openings per 1,000 people, which was the highest rate among the nation’s 50 most populous metro areas. The stabilization and recovery that began in 2005 will accelerate moderately in 2006 and 2007. Standard year-end employment figures for 2005 showed a relatively flat job market. Other statistics imply that the final employment figures for 2005 will be revised substantially upward, to above 1.0%. In 2006, employment will increase by 1.5% and by 1.1% in 2007. The strong residential investment market has boosted a variety of sectors, from finance to retail, which has spurred follow-on job creation. |
| | | |
| | | East Bay - Employment in the East Bay will accelerate from nearly 1.3% growth in 2005 to over 1.5% in 2006 and 2007 as the East Bay will benefit economically from two trends. The first trend is a product of geography. The East Bay region has open land and a growing population, unlike the other Bay Area regions. To illustrate, the city of Brentwood in Contra Costa County has grown from 23,000 to 40,000 residents over the last five years. In comparison, the city of Belmont in San Mateo County has grown from 25,123 residents to 25,470 residents in the same time frame. Population growth spurs employment growth in a variety of sectors like construction and household services. A second trend influencing the East Bay region economically is the relocation or addition of corporate offices from San Francisco and the South bay to be closer to their employees. These trends will compound as the East Bay population continues to grow. |
| | | |
| Transportation | | The Bay Area is served by many public transportation systems, including three international airports (SFO, OAK, SJC), six overlapping bus transit agencies, four rapid transit and regional rail systems including BART, and multiple public ferry services. |
| | |
Pathfinder Village Apartments
Fremont, California | | April 20, 2006
Page 9 |
| |
| | | |
| | | The freeway and highway system is very extensive; however, many freeways are heavily congested during rush hour, especially the trans-bay bridges. |
| | | |
| | | The Bay Area’s transportation infrastructure includes 1,500 miles of highway, eight toll bridges, 17,000 miles of local streets, six public ports, five passenger ferries, and five commercial airports. Transportation in the Bay Area is diversified because of the trend toward decentralized work places. More and more people are commuting longer distances to work, putting a heavy burden on the region’s transportation network. |
| | | |
| | | Air transportation is available through a number of airports in the Bay Area. San Francisco International Airport, located in San Mateo County, is one of the most active commercial airports in the world and it is served by over 62 airlines. Furthermore, a two billion-dollar airport expansion was completed which expanded international travel capabilities. Additionally, Oakland International Airport in Alameda County, and Mineta San Jose International Airport in Santa Clara County offer facilities for international travel, air taxi, charter and cargo. |
| | | |
| | | The Bay Area Rapid Transit system (BART), a high-speed rail system with over 75 miles of track, is a major commuter transportation system which links stations in Alameda, Contra Costa, San Mateo and San Francisco counties. BART has been extended to the San Francisco International Airport, which coincided with the aforementioned airport expansion. CalTrans operates commuter trains that travel from San Jose to San Francisco. There are freight rail lines in many Bay Area communities. |
| | | |
| | | Historically, ongoing efforts to improve the roads and public transit systems in the Bay Area have lagged behind growth in the population. Traffic congestion, considered a major problem in the Bay Area, makes close in, conveniently accessed locations particularly desirable. |
| | | |
| Governmental Forces | | The Bay Area is comprised of nine separate counties. Each county has its own government, with incorporated cities within each county also having their own government. Between the city and county levels, interaction is limited. On a regional level, this concept is magnified, with limited inter-county planning. Local city and county governments within the region implement land use policies through the use of zoning laws and general plans. Support services, such as transportation, schools, health care, police, and fire protection are provided by local governments. |
| | | |
| | | California’s land use and growth controls are among the most stringent in the United States. These local land use controls include zoning, growth management systems, subdivision regulations, development fees and environmental restrictions. These policies raise the cost and reduce the volume of land development, especially in coastal metropolitan areas. |
| | |
Pathfinder Village Apartments
Fremont, California | | April 20, 2006
Page 10 |
| |
| | | |
| Education | | Within the Bay Area there are over 80 public and private colleges and universities; among them are over 30 community colleges, four California State University campuses, and two University of California campuses. |
| | | |
| Conclusion | | The nine-county San Francisco Bay Area is one of the nation’s most vital economic regions. While San Francisco remains the center of the region, the surrounding counties have developed economic centers of their own. Future projections by ABAG indicate increased growth in population and employment, albeit at a slower rate. Employment growth is expected to occur primarily in the service sector. Locational advantages, outstanding higher educational facilities, and a skilled labor force benefit the Bay Area. However, structural problems including affordable housing, transportation capacity, and water and sewer capacity, along with local slow growth initiatives, could impair the region’s competitive position. However, the economic base is well diversified, and should provide for moderate future growth in the Bay Area. |
| | | |
| | | The Bay Area’s economy has shifted towards service orientation. Agriculture, construction, and manufacturing have become less dominant while trade, finance, government, and business, professional and other services have grown in prominence. The one notable exception to this trend has been the high technology sector, particularly computer-related, and manufacturing. |
| | | |
| | | The long term future of California real estate appears good due to anticipated job growth which is expected to generate demand for additional office, industrial, and retail space. The expected increase in population indicates a strengthening housing market and growing retail demand. |
| | |
Pathfinder Village Apartments
Fremont, California | | April 20, 2006
Page 11 |
| |
NEIGHBORHOOD OVERVIEW
| | | |
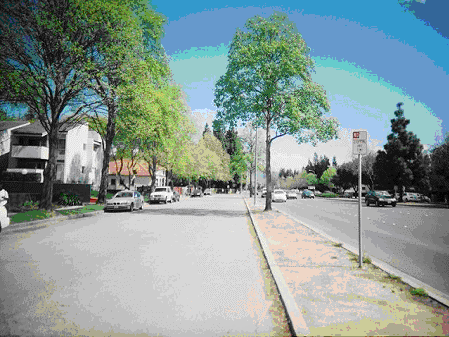
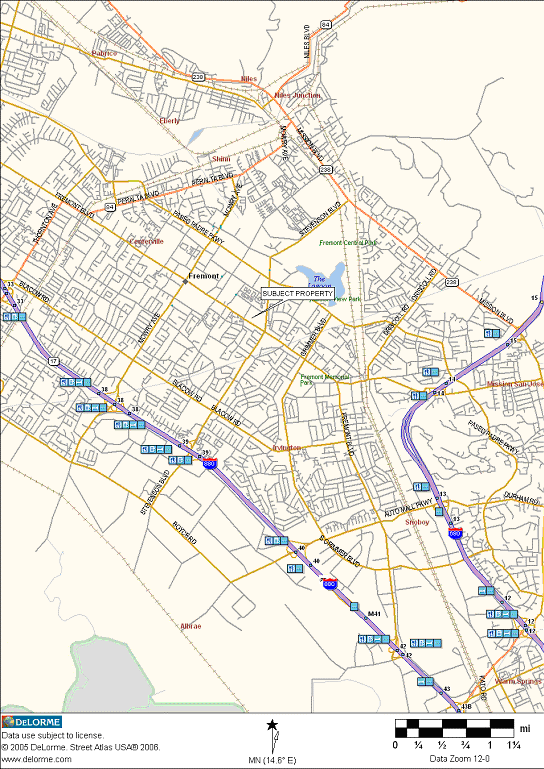
| Location: | | The subject property is located in the central sector of the City of Fremont, along the north side of Fremont Boulevard approximately 525 feet west of Stevenson Boulevard. The subject’s address is 39800 Fremont Boulevard, Fremont, California. |
| | | |
| | | Fremont is located in the Silicon Valley just north of San Jose and to the east of the San Francisco Bay, just 50 miles from San Francisco, 30 miles from Oakland and 15 miles from San Jose. Fremont is located within Alameda County. |
| | | |
| Access: | | Two major freeways provide easy access to the greater San Francisco Bay Area from Fremont. Interstate 880 is located on the western side of Fremont and provides a direct link to San Jose to the south and Oakland to the north. Interstate 680 flanks Fremont on the east and is the major traffic corridor between San Jose and the Tri-Valley area of Livermore, Dublin, and Pleasanton. |
| | | |
| | | State Highways 84, 92, and 237 also provide access to nearby communities. Highway 84 connects Fremont with the Peninsula communities of Palo Alto, Menlo Park and Mountain View across the Dumbarton Bridge (Fremont is only 15 miles from Palo Alto). Highway 92 connects Interstate 880 and Highway 101 and also connects Fremont with the Peninsula communities of San Mateo, Foster City, and Redwood City across the San Mateo-Hayward Bridge. Highway 237 connects Southern Fremont to the Silicon Valley cities of Milpitas and Mountain View. |
| | | |
| | | The Bay Area Rapid Transit (BART) provides dependable rapid transit access to much of the Bay Area. BART currently has its southernmost station in central Fremont, near the intersection of Paseo Padre Parkway and Mowry Avenue approximately one mile northwest of the subject property. |
| | | |
| | | Primary access to the subject property and neighborhood is achieved via Fremont Boulevard. Employment centers are easily accessible from the subject neighborhood due to the presence of regional transportation routes and public mass transit in the area. Traffic flow is well managed along the heavier traveled neighborhood streets with traffic signals at major intersections. Public facilities including schools and medical facilities are in close proximity. |
| | | |
| Land Use: | | The subject neighborhood is a mature and established commercial and residential district. The area realized much of its growth from the 1970s through the 1980s. Most of the apartments in the area were built in the 1970s. Approximately 95% of the land area is developed with limited land available to accommodate additional development. Multifamily |
| | |
Pathfinder Village Apartments
Fremont, California | | April 20, 2006
Page 12 |
| |
| | | |
| | | development is prevalent along Fremont Boulevard, Stevenson Boulevard and Paseo Padre Parkway. |
| | | |
| | | Fremont Boulevard and Paseo Padre Parkway are the primarily commercial corridors through the neighborhood. They are primarily developed with commercial uses including a concentration of freestanding retail and general business buildings and multifamily, all of which benefit from visibility and proximity to the regional transportation routes. The Fremont Hub Shopping Center is located approximately two blocks northwest of the subject at the intersection Fremont Boulevard and Walnut Avenue. Residential uses are located throughout the area along neighborhood roads that feed into the major collector streets. The predominate land use in the neighborhood is residential with supporting commercial uses generally located along the major thoroughfares. |
| | | | | |
| Adjacent Land Uses: | | South: | | Multifamily residential |
| | | North: | | Multifamily residential |
| | | East: | | Multifamily residential |
| | | West: | | Multifamily residential |
| | | |
| New Construction: | | Due to the limited availability of vacant land suitable for development, there has not been a significant amount of new construction in the immediate vicinity of the subject property. |
| | | |
| | | Most of the development in the area is in the form of re-development of older districts. The re-development of the Centerville and Business Districts is currently in the planning stages to become a pedestrian-scale, mixed-use, lifestyle center serving the East Bay. This 302-acre Redevelopment Project Area lies within the Centerville Business District generally at the intersection of Fremont Boulevard and Central Avenue. The restoration of the Centerville Depot, streetscape and facade improvements, and the Centerville Bill Ball Plaza are key projects. |
| | | |
| | | The City of Fremont Redevelopment Agency is dedicated to the revitalization of the historic commercial centers of Centerville, Irvington, and Niles, along with the Industrial (Baylands) Business District Redevelopment Project Areas. |
| | | |
| | | Other new projects include the Village Phase II, a 168-unit in-fill residential project that will provide affordable housing to all levels of income earners. |
| | | |
| Change in Current Use | | The neighborhood can be classified as being in the growth stage of its life cycle. As a result of its good location in the San Francisco East Bay, growth in the area is anticipated to continue, in the form of new development on vacant sites and redevelopment of underutilized sites. |
| | | |
| Conclusion | | The property is located in the central sector of Fremont within the San Francisco East Bay. The area is afforded with good accessible to other |
| | |
Pathfinder Village Apartments
Fremont, California | | April 20, 2006
Page 13 |
| |
| | | |
| | | areas of San Francisco Bay Area and employment centers. As a result of its good location, the area has proven to be a desirable residential and commercial location. The area’s accessibility to employment centers has enhanced the desirability of the neighborhood as a residential location. |
SITE ANALYSIS
| | | |
| Location | | The site is located along the north side of Fremont Boulevard, approximately 525 feet west of Stevenson Boulevard. |
| | | |
| Size | | The site is irregular in shape and consists of a total land area of 8.13 acres. |
| | | |
| Excess Land | | None |
| | | |
| Topography | | Generally level and on grade with the bounding street |
| | | |
| Site Improvements | | The 8.13-acre site is improved with a 246-unit garden-style apartment community known as the Pathfinder Village Apartments. See Description of the Improvements section of this report for details concerning site improvements. |
| | | |
| Street Improvements | | Fremont Boulevard provides primary access to the subject via curb cuts from a frontage road running along the north side of Fremont Boulevard. Access is also provided via a curb-cut along the east side Birdwell Street and the south side of Leslie Street — two secondary thoroughfares bordering the subject to the west and north. Fremont Boulevard is a six-lane, bi-directional commercial corridor which is generally oriented in a northwest/southeast direction. |
| | | |
| Desirability of Location | | Average |
| | | |
| Access to Major Arteries | | Good |
| | | |
| Access to Local Arteries | | Good |
| | | |
| Curb Appeal | | Average |
| | | |
| Ingress/Egress | | Average — Adequate road frontage along Fremont Boulevard. |
| | | |
| Visibility from Road | | Average |
| | | |
| Public Transportation | | Good |
| | | |
| Neighborhood Appearance | | Average |
| | | |
| Flood Zone Map | | According to the Federal Emergency Management Agency, the property is within Zone X, outside any special Flood Hazard Areas (Map No. 065028-0030C, Dated 02/09/2000. |
| | | |
| Easements | | The appraisers were not provided with a site survey or title documents that provide information on the existence of easements and encroachments. Other than typical access and utility easements, visual observation of the site did not reveal the existence of adverse easements or encroachments, however in the absence of a site survey and title |
| | |
Pathfinder Village Apartments
Fremont, California | | April 20, 2006
Page 14 |
| |
| | | |
| | | documents, the appraiser makes no representation as to the presence of adverse easements or encroachments. |
| | | |
| Soil Conditions | | Visual observation does not indicate any surface or subsurface soil conditions that are unusual for the area. Based on our inspection, it appears that the soil is of adequate load bearing capacity to support the subject improvements. No major foundation cracks were visible upon inspection of the subject improvements that would indicate the subsoil conditions are not stable. No nuisances or hazards were noted. |
| | | |
| Land Use Restrictions | | The appraisers are unaware of any deed restrictions which may adversely affect the utility of the subject site; however, this is not a guarantee that such restrictions do not exist. Therefore, it is recommended that a current title policy be obtained for the subject property which would disclose any land use restrictions which may exist. |
| | | |
| Utilities | | All municipal utilities (water and sewer) and private services (electric, gas, telephone) are available to the site. |
| | | |
| Police and Fire Protection | | Provided to the site by the City of Fremont |
| | | |
| Conclusion | | The subject represents a desirable site for multifamily development. |
| | | |
REAL ESTATE TAXES
| | | |
| Assessor’s Parcel No: | | 525-850-2-11 — Alameda County Assessor’s Office |
| | | |
| Ad Valorem Tax rate | | Composite Rate 1.44 per $100 of assessed value (2005-2006) |
| | | |
| Equalization Rate | | 100% |
| | | |
| Payment Due Date | | Taxes are payable in two equal installments, which become delinquent after December 10 and April 10, respectively. |
| | | |
| 2005-2006 Assessed Value | | $16,891,604 |
| | | |
| Tax Analysis: | | In California, privately held real property is typically assessed at 100 percent of full cash value (which is interpreted to mean market value of the fee simple estate) as determined by the County Assessor. Generally, a reassessment occurs only when a property is sold (or transferred) or when new construction occurs (as differentiated from replacing existing construction). Assessments for properties that were acquired before the tax year 1975-1976 were stabilized as of the tax year 1975-1976. Property taxes are limited by state law to one percent of the assessed value plus voter-approved obligations and special assessments. If no sale (or transfer) occurs or no new building takes place, assessments may no increase by more than two percent annually. |
| | |
Pathfinder Village Apartments
Fremont, California | | April 20, 2006
Page 15 |
| |
| | | | | | | | | |
| Assessor's Market Value | | 2005/2006 | | | Concluded Value | |
| |
| 525-850-2-11 | | $ | 16,891,604 | | | $ | 32,600,000 | |
| Assessed Value @ | | | 100 | % | | | 100 | % |
| | | $ | 16,891,604 | | | $ | 32,600,000 | |
| Composite Rate (per $100 A.V.) | | | 1.44 | | | | 1.44 | |
| Total Taxes | | $ | 243,239 | | | $ | 469,440 | |
| Rounded | | | | | | $ | 469,400 | |
| | | |
| Estimated Tax Liability | | $469,440, or 469,400 rounded |
| | | |
| Conclusion | | The Composite Rate includes the published tax rate and the effective tax rate due to special assessments for county and municipal water standby charges. These charges are generally based on lot area rather than assessed value. |
| | | |
| | | The taxes estimated in our analysis are for the subject property assuming a sale at the current market value. If the subject were to sell, a reassessment at that value would most likely occur, with tax increases limited to two percent annually thereafter until the property is sold again. The consequences of this reassessment have been considered in the appropriate valuation sections. |
| | | |
| | | In accordance with California’s Proposition 13, our estimate of property taxes reflects the assumption of a fee transfer of the subject property. The stabilized property taxes indicated on the summary chart are based on the concluded value by the direct capitalization analysis. |
ZONING
| | | |
| Zoning: | | The site is zoned R3 District — Multiple Family Dwellings (Medium Density) by the City of San Mateo. The purpose of this district is to promote and encourage well planned, suitable, and appropriate multiple-family developments within medium, high, and very high density land use classifications. |
| | | |
| Permitted Use | | A broad range of housing types is allowed including single-family, two-family and multifamily dwellings. Commercial, industrial, office and retail uses are not allowed. |
| | | |
| Guidelines | | The City’s Zoning Code controls the location, size, and height of structures such as buildings, garages, and fences. The Zoning Code is intended to protect city residents, their homes and businesses from conflicting activities nearby. |
| | | |
| | | The Official Website for the City of Fremont Municipal Codes Online is http://www.municode.com/resources/gateway.asp?pid=10734&sid=5 |
| | | |
| Comments: | | It appears that the existing improvements represent a use that conforms to local zoning requirements. |
| | |
Pathfinder Village Apartments
Fremont, California | | April 20, 2006
Page 16 |
| |
DESCRIPTION OF IMPROVEMENTS
The subject improvements consist of a 246-unit garden-style apartment complex known as the Pathfinder Village Apartments. The following offers a description of the improvements.
| | | |
| KTR Site Inspector: | | Jackson L. Aills |
| Date of Inspection: | | April 14, 2006 |
| Property Contact: | | On-site Manager |
| Year Built: | | 1973 |
| Number Units: | | 246 |
| Configuration/Stories: | | Garden-style complex, two and three-story residential structures. There are 28 residential |
| | | structures and one building containing the clubhouse/leasing office, fitness center and laundry |
| | | facility. Twenty-one of residential structures include below ground parking. |
| | | |
| Net Rentable Area: | | 235,780 square feet |
| | | |
| EXTERIOR | | |
| Foundations: | | Reinforced concrete slabs, on grade |
| Frame: | | Wood frame |
| Exterior Walls: | | Stucco and wood trim veneer |
| Roof: | | Pitched with asphalt single covers |
| Doors and Windows: | | Exterior entrance doors are hollow core metal. Interior doors are hollow core wood. The windows are single-pane glass set in aluminum frames. |
| HVAC: | | Ground mounted electric AC condensing units, electric heat |
| Plumbing: | | Kitchens contain sink and dishwasher. Bathrooms contain porcelain toilet and sink and bathtub/shower combinations. Hot water is provided by central gas-fired boilers. |
| Electrical: | | Property is sub-metered for electric and water. Electric and water is paid by the tenant. |
| Parking and Walkways: | | The parking areas and internal roadways are asphalt paved. The streets and parking areas have |
| | | concrete curbs. Walkways are concrete paved. There is adequate on-site parking provided, including |
| | | underground parking. |
| | | |
| INTERIOR | | |
| Walls and Ceilings: | | Walls are painted sheetrock and the gypsum ceilings are covered with a sprayed-on textured surface. |
| Floors: | | Interior floors are carpet over padding in living areas and bedrooms with sheet vinyl in the |
| | | kitchens and bathroom. |
| Kitchen Equipment: | | Built-in wood cabinets with laminate counter tops and stainless steel sink. Appliances include a |
| | | combination range/oven, microwave oven with exhaust fan, disposal, dishwasher and |
| | | refrigerator/freezer. |
| | | |
| PROJECT AMENITIES | | |
| Security: | | No |
| Swimming Pool: | | Yes (1) |
| | |
Pathfinder Village Apartments
Fremont, California | | April 20, 2006
Page 17 |
| |
| | | |
| Fitness Center: | | Yes |
| Clubroom: | | Yes |
| Tennis Court: | | No |
| On-site Management Office: | | Yes |
| Laundry Room: | | Yes (2) |
| Microwave: | | Yes |
| Compactor: | | No |
| Fireplace: | | No |
| Ceiling Fans: | | Yes |
| Cable TV: | | Yes |
| Balconies/Patios: | | Yes |
| Perimeter Fencing: | | Yes/Partial |
| Access Controlled Entry: | | No |
| Other: | | As of the date of inspection, a portion of the clubhouse/leasing office was being converted into a child development center. Landscaping is typical and includes mature trees and shrubs. Other amenities include a playground. |
The following chart illustrates the property’s unit breakdown and size.
PATHFINDER VILLAGE APARTMENTS — UNIT MIX
| | | | | | | | | | | | | |
| Unit Type | | Mix | | | Size (SF) | | | Total Area | |
| |
| 2BR/1BA | | | 51 | | | | 830 | | | | 42,330 | |
| 2BR/2BA | | | 47 | | | | 870 | | | | 40,890 | |
| 2BR/2BA | | | 44 | | | | 900 | | | | 39,600 | |
| 3BR/2BA | | | 24 | | | | 1,040 | | | | 24,960 | |
| 3BR/2BA | | | 80 | | | | 1,100 | | | | 88,000 | |
| |
| Totals/Average | | | 246 | | | | 958 | | | | 235,780 | |
It is noted that the subject offers an atypical unit mix with a large amount three-bedroom units (104) and no one-bedroom unit.
CONDITION/MAINTENANCE
| | | |
| Overall Condition: | | Average |
| Landscaping: | | Average |
| Parking: | | Adequate |
| Sidewalks/Curbs: | | Average |
| Walls/Fences: | | Average |
| Refuse Area: | | Average |
| Basement: | | N/A |
| Health Club: | | Average |
| Club Room: | | Average |
| Exterior Walls: | | Average |
| Roofs: | | Average |
| Stairs: | | Average |
| Lobby/Hallways: | | N/A |
| Entry Doors: | | Average |
| Patios/Balconies: | | Average |
| Elevators: | | N/A |
| | |
Pathfinder Village Apartments
Fremont, California | | April 20, 2006
Page 18 |
| |
| | | |
| Apartment Interiors: | | |
| Overall: | | Average |
| Kitchen Equipment: | | Average |
| Mechanical Equipment: | | Average |
| Bathroom: | | Average |
| Walls/Ceilings: | | Average |
| Layout: | | Average |
| Light and View Quality: | | Average |
| | | |
| Cosmetic Repairs: | | Our physical inspection revealed that the subject property is in average condition. |
| Deferred Maintenance: | | No material elements of deferred maintenance were noted during the appraiser’s inspection of the property. |
| Comparability: | | Similar to competing properties of the same vintage. |
| Observed Effective Age: | | 33 years (similar to the actual age of the improvements) |
| Economic Life: | | 45 years (per Marshall Valuation Service Manuel) |
| Remaining Economic Life: | | 15 years |
| General Comments: | | Based on our inspection, the subject property is considered to be of average quality construction and to be in average condition overall. It competes effectively with other properties of the same vintage. |
APARTMENT MARKET OVERVIEW
The following apartment market analysis is designed to provide the reader an understanding of the Bay Area apartment market and the local submarket within which the subject property competes. The most recent source of data available to the appraisers was theApartment Market Report for Northern California(Forecast 2006) published by Hendricks and Partners.
| | | |
| San Francisco/East Bay | | Year-over-year employment growth measured 2.2% in December and the East Bay regional population grew by 1.8% over the same period. Relatively small and undeveloped cities like Pittsburg, Dublin, and Brent-wood have seen significant increases in population and jobs in the last decade as the focus of development in the Bay Area has shifted east. |
| | | |
| | | The pending redevelopment plans for two former military bases within the East Bay provide an excellent opportunity for long-term growth within the region. Land that was formerly part of the Concord Naval Weapons Station will be transferred to the city of Concord for development. In all, the land totals about a quarter of the current land area of Concord. City leaders are already projecting that the former base area will be home to 33,000 residents and could yield as many as 15,000 new jobs. Alameda is seeing similar opportunities develop around the former Alameda Naval Air Station site. Intense redevelopment of that area along Webster Street has led to the addition of new residents and increased revenue for local business. In addition, Oakland is putting a lot of energy into reenergizing its Jack London Square area with upscale residential development, which should end up totaling approximately 10,000 units when complete. The |
| | |
Pathfinder Village Apartments
Fremont, California | | April 20, 2006
Page 19 |
| |
| | | |
| | | redevelopment and gentrification of areas around the former military bases and the prospect of increased urban amenities has raised local incomes and fuelled an influx of high-income residents into local apartment and condominium units. |
| | | |
| Economy | | Employment in the East Bay will accelerate from nearly 1.3% growth in 2005 to over 1.5% in 2006 and 2007 as the East Bay will benefit economically from two trends. The first trend is a product of geography. The East Bay region has open land and a growing population, unlike the other Bay Area regions. To illustrate, the city of Brentwood in Contra Costa County has grown from 23,000 to 40,000 residents over the last five years. In comparison, the city of Belmont in San Mateo County has grown from 25,123 residents to 25,470 residents in the same time frame. Population growth spurs employment growth in a variety of sectors like construction and household services. A second trend influencing the East Bay region economically is the relocation or addition of corporate offices from San Francisco and the South bay to be closer to their employees. These trends will compound as the East Bay population continues to grow. |
| | | |
| Supply / Demand | | Absorption — Construction totaled 361 apartment units in all of 2005. That is roughly half of the 767 apartment units built in 2004, as the strong for-sale market heavily influenced developer sentiment. Permits were issued for 3,685 multifamily units in 2005. 1,065 multifamily units were permitted in the fourth quarter. |
| | | |
| | | Permits were issued for 3,685 multifamily units in 2005. 1,065 multifamily units were permitted in the fourth quarter. There were a total of 182 net move-outs in 2005. Net absorption was influenced by a conversion of rental stock into condos. |
| | | |
| | | It is anticipated that developers will pull permits for 3,275 multifamily (apartment & condo) units in 2006, down slightly from 2005 when 3,599 multifamily units were permitted. The skew of permits is vastly different by county. In Alameda County, nearly 65% of all units permitted were multifamily in 2005. In Contra Costa County, it was nearly the exact opposite, with single-family units constituting 85% of total units permitted. These trends will continue for the near future but the skew will be towards multifamily units, especially in Alameda County because of planning trends. Construction will remain muted in the apartment sector with 1,145 units coming on-line in 2006 and 1,050 in 2007. |
| | | |
| Operations | | Vacancy — The East Bay’s average apartment vacancy rate measured 5.1% in the fourth quarter, which was down 30 basis points from the last quarter of 2004. |
| | | |
| | | Rents — Rent growth is showing signs of accelerating. Rents were up by an average of 1.6% from the year ago period, with the Alameda County submarkets leading the way. |
| | |
Pathfinder Village Apartments
Fremont, California | | April 20, 2006
Page 20 |
| |
| | | |
| | | Rent gains in 2006 and 2007 will remain muted as increased supply dampens the effect of relatively less affordable housing. In spite of vacancies increasing from 5.0% to 5.2% in 2006 and 2007, respectively, rents should increase nearly 1.7% in 2006, followed by a 2.2% increase in 2007. This is largely due to the type of households demanding apartments, and the quality of the new product becoming available. |
| | | |
| Investment Market | | The East Bay region is a fertile place for ground-up development in the outlying areas, especially around transit centers. A great deal of multifamily investment in both condos and apartments is occurring in northern Alameda County as the city of Oakland clears the way for redevelopment of many previously blighted areas. Condo conversions will continue to be popular in the East Bay as there is relatively little indication that the affordability picture for single-family homes is going to change. Given that, conversions can still represent a good return in spite of rising interest rates. |
| | | |
| Micromarket Overview | | According to Hendricks and Partners, the South/East Alameda County sub-market reported year-end 2005 average vacancy of 4.3%, down slightly from the 2004 vacancy figure of 4.8%. After reporting a slight decrease (1%) in rent growth in 2004, rents began to climb in 2005, reporting a 2.2% increase in average rent. The year-end 2005 average rent was $1,271 for the South/East Alameda County sub-market. |
| | | |
| | | The appraisers surveyed five competitive properties in the immediate vicinity of the subject property. These properties are outlined in detail in the forthcoming Economic Rent Analysis section of this report. The occupancy levels reported for these properties range from 94% to 99% as presented in the following chart. The average occupancy of the sampling surveyed equates to 97%. Due to high occupancy, concessions are rare. However, few area apartments of offers concessions typically consist of reduced or free rent over a portion of the lease term. |
SUMMARY OF COMPETITIVE OCCUPANCY LEVELS
| | | | | |
| Property Name | | Occupancy | |
| |
| Avalon Fremont | | | 98 | % |
| Pentagon | | | 99 | % |
| Treetops | | | 98 | % |
| Stevenson Place | | | 94 | % |
| Briarwood | | | 97 | % |
| |
| Totals/Average | | | 97 | % |
| |
| | | |
| Appeal to Market: | | The subject property has a tenant profile similar to other properties of similar vintage in the area. Its presentation, condition, appearance and rental rate structure are all within market parameters. No adverse conditions are evident which would effect its future competitive position. |
| | | |
| Conclusion | | The South Bay economy is entering a growth cycle after recovering from the dotcom bust. Apartment properties in the San Francisco South Bay Area have enjoyed increasing market rents and declining vacancies. With very little new inventory added, the overall vacancy factor has moved steadily downward from 2004 and early 2005 levels. Rental rates |
| | |
| Pathfinder Village Apartments | | April 30, 2006 |
| Fremont, California | | Page 21 |
| | | |
| | | have held steady over the past couple of years, but began to shown signs of improvement beginning the 1st quarter of 2005 and continue to improve. Overall, economic conditions appear to be stabilizing and poised for gradual recovery. This bodes well for apartment market conditions in the longer term. As economic conditions improve, demand for rental housing should follow suit. |
ECONOMIC RENT ANALYSIS
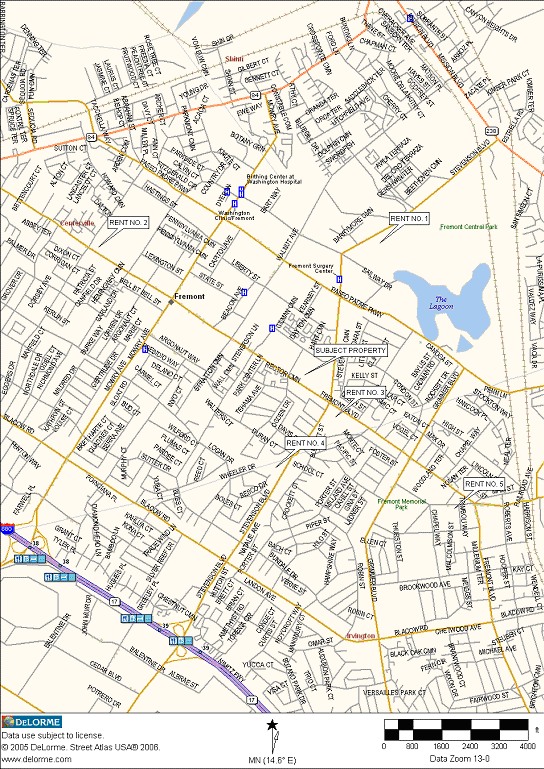
Five competitive properties follow. They are located in the influencing area of the subject property and define the range of property type and rents available. The information regarding the rent comparables was obtained through physical inspections and interviews of rental agents and property managers. The rents commanded by competitive properties in the influencing area are utilized to determine the economic rent potential for the subject property.
| | |
| Pathfinder Village Apartments | | April 30, 2006 |
| Fremont, California | | Page 22 |
| | | |
Rent Comparable #1 | | |
| | | |
| Name/Address: | | Avalon Fremont |
| | | 39939 Stevenson Commons |
| | | Fremont, CA 94538 |
| | | |
| Number of Units: | | N/A |
| | | |
| Age: | | 1992 |
| | | |
| Description: | | Garden-style apartments with two and three-story residential buildings, stucco and wood siding exterior walls and pitched roof with composition shingle cover and asphalt-paved parking. |
| | | |
| Amenities: | | Apartment features include, air conditioning, balcony, cable ready, dishwasher, fireplace, microwave, oversized closets and washer & dryer in unit. Community features include clubhouse, emergency maintenance, extra storage, fitness center, garage and/or covered parking, gated access, laundry facility, swimming pool and whirlpool/spa. |
| | | |
| Rental Data: | | |
| | | | | | | | | | | | | |
| Unit Type | | Size (SF) | | | Quoted Rent/Unit | | | Quoted Rent/SF | |
| 1BR/1BA | | | 761 | | | $ | 1,345 | | | $ | 1.77 | |
| 1BR/1BA | | | 785 | | | $ | 1,400 | | | $ | 1.78 | |
| 2BR/2BA | | | 1036 | | | $ | 1,640 | | | $ | 1.58 | |
| 2BR/2BA | | | 1056 | | | $ | 1,625 | | | $ | 1.54 | |
| 2BR/2BA | | | 1,120 | | | $ | 1,675 | | | $ | 1.50 | |
| 3BR/2BA | | | 1,369 | | | $ | 2,000 | | | $ | 1.46 | |
| Totals/Average | | | 1,021 | | | $ | 1,614 | | | $ | 1.58 | |
| | | |
| Landlord Provides: | | Sewer and trash removal |
| | | |
| Occupancy | | 98% |
| | | |
| Concessions: | | $400 to $750 off rent on selected units. |
| | | |
| Comments: | | This garden-style apartment complex offers comparable large two and three bedroom units. It is located north of subject near Paseo Padre Parkway. This comparable is superior to the subject property in terms of amenities and physical characteristics. |
| | |
| Pathfinder Village Apartments | | April 30, 2006 |
| Fremont, California | | Page 23 |
| | | | | |
Rent Comparable #2 | | | | |
| | | | | |
| Name/Address: | | Pentagon Apartments |
| | | 37950 Fremont Boulevard |
| | | Fremont, CA 94536 |
| | | | | |
| Number of Units: | | 81 | | |
| | | | | |
| Age: | | 1965 / Updated |
| | | | | |
| Description: | | Garden-style apartments with two and three-story residential buildings. Stucco exterior walls, pitched roofs with composition shingle covers and asphalt-paved parking area. |
| | | | | |
| Amenities: | | Apartment features include balcony, ceiling fan(s), fireplace, some paid utilities, community features, emergency maintenance, extra storage, fitness center, garage and/or covered parking, laundry facility and swimming pool. |
| | | | | |
| Rental Data: | | | | |
| | | | | | | | | | | | | |
| Unit Type | | Size (SF) | | | Quoted Rent/Unit | | | Quoted Rent/SF | |
| 1BR/1BA | | | 650 | | | $ | 920 | | | $ | 1.42 | |
| 2BR/1BA | | | 825 | | | $ | 1,125 | | | $ | 1.36 | |
| 2BR/2BA | | | 875 | | | $ | 1,175 | | | $ | 1.34 | |
| 3BR/2BA | | | 1,100 | | | $ | 1,350 | | | $ | 1.23 | |
| Totals/Average | | | 863 | | | $ | 1,143 | | | $ | 1.32 | |
| | | |
| Landlord Provides: | | Sewer and trash removal |
| | | |
| Occupancy: | | 99% |
| | | |
| Concessions: | | None |
| | | |
| Comments: | | This property is similar to the subject property in terms of location and amenities; although it is older, it is rated as being similar overall. |
| | |
| Pathfinder Village Apartments | | April 30, 2006 |
| Fremont, California | | Page 24 |
| | | |
Rent Comparable #3 | | |
| | | |
| Name/Address: | | Treetops Apartments |
| | | 40001 Fremont Boulevard |
| | | Fremont, CA 94538 |
| | | |
| Number of Units: | | 172 |
| | | |
| Age: | | 1978 |
| | | |
| Description: | | Garden-style apartments with two and three-story residential buildings. Wood exterior walls, pitched roofs with composition shingle covers and asphalt-paved parking area. |
| | | |
| Amenities: | | Apartment features include air conditioning, balcony, cable ready, dishwasher and oversized closets. Community features extra storage, garage and/or covered parking, laundry facility, swimming pool, and whirlpool/spa. |
| | | |
| Rental Data: | | |
| | | | | | | | | | | | | |
| Unit Type | | Size (SF) | | | Quoted Rent/Unit | | | Quoted Rent/SF | |
| 1BR/1BA Loft | | | 800 | | | $ | 1,395 | | | $ | 1.74 | |
| 2BR/1BA | | | 900 | | | $ | 1,295 | | | $ | 1.44 | |
| 2BR2BA | | | 966 | | | $ | 1,495 | | | $ | 1.55 | |
| Totals/Average | | | 889 | | | $ | 1,395 | | | $ | 1.57 | |
| | | |
| Landlord Provides: | | Sewer and trash removal |
| | | |
| Occupancy: | | 98% |
| | | |
| Concessions: | | None |
| | | |
| Comments: | | The property is located at the southwest corner of Stevenson Boulevard and Fremont Boulevard. Overall, this comparable is similar to the subject property in terms of amenities, age and condition. |
| | |
| Pathfinder Village Apartments | | April 30, 2006 |
| Fremont, California | | Page 25 |
| | | |
Rent Comparable #4 | | |
| | | |
| Address: | | Stevenson Place |
| | | 4141 Stevenson Boulevard |
| | | Fremont, CA 94538 |
| | | |
| Number of Units: | | 200 |
| | | |
| Age: | | 1973 |
| | | |
| Description: | | Garden-style apartments with two-story residential buildings, stucco and wood siding exterior walls and pitched roof with composition shingle cover and asphalt-paved parking. |
| | | |
| Amenities: | | Apartment features include balcony, cable ready, dishwasher, microwave, some paid utilities and oversized closets. Community features include emergency maintenance, extra storage, fitness center, garage and/or covered parking, high speed internet access, laundry facility, playground, swimming pool and whirlpool/spa. |
| | | |
| Rental Data: | | |
| | | | | | | | | | | | | |
| Unit Type | | Size (SF) | | | Quoted Rent/Unit | | | Quoted Rent/SF | |
| 1BR/1BA | | | 520 | | | $ | 1,100 | | | $ | 2.12 | |
| 1BR/1BA | | | 620 | | | $ | 1,250 | | | $ | 2.02 | |
| 2BR/1.5BA TH | | | 1,120 | | | $ | 1,302 | | | $ | 1.16 | |
| 2BR/2BA | | | 1,010 | | | $ | 1,288 | | | $ | 1.28 | |
| Totals/Average | | | 818 | | | $ | 1,235 | | | $ | 1.51 | |
| | | |
| Landlord Provides: | | Water, sewer and trash removal |
| | | |
| Occupancy: | | 94% |
| | | |
| Concessions: | | $500 off 1st month rent |
| | | |
| Comments: | | The property is located south of the subject on Stevenson Boulevard, about a 1/2 block south of Fremont Boulevard. This comparable is similar to the subject property in terms of location and physical characterizes; however, it is rated as being slightly inferior in terms of overall appeal. |
| | |
| Pathfinder Village Apartments | | April 30, 2006 |
| Fremont, California | | Page 26 |
| | | |
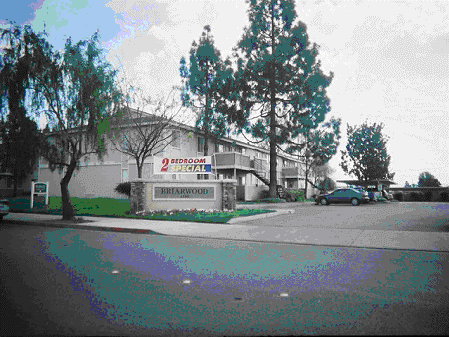
Rent Comparable #5 | | |
| | | |
| Address: | | Briarwood At Central Park |
| | | 4200 Bay Street |
| | | Fremont, CA |
| | | |
| Number of Units: | | 160 |
| | | |
| Age: | | 1979 |
| | | |
| Description: | | Garden-style apartments with two-story residential buildings, stucco and wood siding exterior walls and pitched roof with composition shingle cover and asphalt-paved parking. |
| | | |
| Amenities: | | Apartment features include air conditioning, balcony, cable ready, ceiling fan(s), dishwasher and oversized closets. Community features include clubhouse, emergency maintenance, garage and/or covered parking, high speed internet access, laundry facility and swimming pool. |
| | | |
| Rental Data: | | |
| | | | | | | | | | | | | |
| Unit Type | | Size (SF) | | | Quoted Rent/Unit | | | Quoted Rent/SF | |
| 1BR/1BA | | | 600 | | | $ | 950 | | | $ | 1.58 | |
| 1BR/1BA | | | 410 | | | $ | 830 | | | $ | 2.02 | |
| 2BR/2BA | | | 800 | | | $ | 1,150 | | | $ | 1.44 | |
| 2BR/2BA | | | 850 | | | $ | 1,215 | | | $ | 1.43 | |
| Totals/Average | | | 665 | | | $ | 1,036 | | | $ | 1.56 | |
| | | |
| Landlord Provides: | | Gas, sewer and trash removal |
| | | |
| Occupancy: | | 97% |
| | | |
| Concessions: | | None |
| | | |
| Comments: | | Overall, this comparable is slightly superior to the subject property in terms of age, amenities and overall appeal. |
| | |
| Pathfinder Village Apartments | | April 30, 2006 |
| Fremont, California | | Page 27 |
ANALYSIS
The subject property is situated in a good location along Fremont Boulevard with good access to the primary transportation arteries and employment centers. It is competitive with other properties in terms of location, condition, amenities, and unit size. As previously indicated, the subject property offers two and three-bedroom floor plans. The tables below illustrate the comparables with the most similar floor plans in relation to the subject’s floor plans.
TWO-BEDROOM FLOOR PLANS
| | | | | | | | | | | | | |
| Comparable # | | Unit Size (SF) | | | Rent/Month | | | Rent/SF | |
| | | | | | | | | | |
| Subject | | | 830 | | | $ | 1,159 | | | $ | 1.40 | |
| Subject | | | 870 | | | $ | 1,289 | | | $ | 1.48 | |
| Subject | | | 900 | | | $ | 1,299 | | | $ | 1.44 | |
| | | | | | | | | | |
| Avalon Fremont | | | 1,036 | | | $ | 1,640 | | | $ | 1.58 | |
| Avalon Fremont | | | 1,056 | | | $ | 1,625 | | | $ | 1.54 | |
| Pentagon | | | 825 | | | $ | 1,125 | | | $ | 1.36 | |
| Pentagon | | | 875 | | | $ | 1,175 | | | $ | 1.34 | |
| Treetops | | | 900 | | | $ | 1,295 | | | $ | 1.44 | |
| Treetops | | | 966 | | | $ | 1,495 | | | $ | 1.55 | |
| Stevenson Place | | | 1,120 | | | $ | 1,302 | | | $ | 1.16 | |
| Stevenson Place | | | 1,010 | | | $ | 1,288 | | | $ | 1.28 | |
| Briarwood | | | 800 | | | $ | 1,150 | | | $ | 1.44 | |
| Briarwood | | | 850 | | | $ | 1,215 | | | $ | 1.43 | |
| Subject | | | 830 | | | $ | 1,159 | | | $ | 1.40 | |
| Subject | | | 870 | | | $ | 1,289 | | | $ | 1.48 | |
| | | | | | | | | | |
THREE-BEDROOM FLOOR PLANS
| | | | | | | | | | | | | |
| Comparable # | | Unit Size (SF) | | | Rent/Month | | | Rent/SF | |
| Subject | | | 1,040 | | | $ | 1,419 | | | $ | 1.36 | |
| Subject | | | 1,100 | | | $ | 1,581 | | | $ | 1.44 | |
| | | | | | | | | | |
| Avalon Fremont* | | | 1,120 | | | $ | 1,675 | | | $ | 1.50 | |
| Avalon Fremont | | | 1,369 | | | $ | 2,000 | | | $ | 1.46 | |
| Pentagon | | | 1,100 | | | $ | 1,350 | | | $ | 1.23 | |
| Stevenson Place* | | | 1,120 | | | $ | 1,302 | | | $ | 1.16 | |
| Stevenson Place* | | | 1,010 | | | $ | 1,288 | | | $ | 1.28 | |
| | | | | | | | | | |
* Large two-bedroom unit
The subject is most similar to Pentagon, Treetops and Briarwood. These properties are rated as being generally similar to the subject. Avalon is a new property, which is superior to the subject in term of overall appeal and condition. Stevenson Place is similar to the subject; however, it is rated as being inferior to the subject in term of overall appeal. In general, the subject’s rental rates should be similar to the rents illustrated by Pentagon, Treetops and Briarwood; below the rents illustrated by Avalon and slightly above the rents illustrated by Stevenson Place.
As illustrated above, the rent for the subject’s two bedrooms floor plans are within a tolerable variance of the range of rents illustrated by Pentagon, Treetops and Briarwood, the properties rated as being most similar. Only two properties offer three-bedroom floor plans: Avalon and Pentagon. Pentagon was rated as being most similar to the subject’s three-bedroom unit type. For comparison purposes we have also included large two-bedroom unit offered by the comparable. The rental rates indicated by the selected comparable large two-bedroom units represent good indicators of market rent for the subject’s three-bedroom units.
The subject’s rental rate structure is appropriately aligned with the rents illustrated by Pentagon, Treetops and Briarwood; below the rents illustrated by Avalon and slightly above the rents illustrated by Stevenson Place. Based on a review of market rental data, the subject’s quoted rent structure appears reasonable.
| | |
| Pathfinder Village Apartments | | April 30, 2006 |
| Fremont, California | | Page 28 |
Furthermore, review of the subject’s rent roll indicates that recent leases have been executed at the quoted rates, confirming market acceptance of the quoted amounts.
Based upon the rents illustrated by the competing properties and rent actually commanded by the subject property, the following rents will be processed as the property’s economic rent potential for valuation purposes. The following table summarizes the economic rent structure estimated for the subject property.
ECONOMIC RENT POTENTIAL-PATHFINDER VILLAGE APARTMENTS
| | | | | | | | | | | | | | | | | | | | | | | | | |
| Unit Type | | Mix | | | Size (SF) | | | Total Area | | Economic Rent/Unit | | Economic Rent/SF | | | Total Rent | |
| 2BR/1BA | | | 51 | | | | 830 | | | | 42,330 | | | $ | 1,159 | | | $ | 1.40 | | | $ | 59,109 | |
| 2BR/2BA | | | 47 | | | | 870 | | | | 40,890 | | | $ | 1,289 | | | $ | 1.48 | | | $ | 60,583 | |
| 2BR/2BA | | | 44 | | | | 900 | | | | 39,600 | | | $ | 1,299 | | | $ | 1.44 | | | $ | 57,156 | |
| 3BR/2BA | | | 24 | | | | 1,040 | | | | 24,960 | | | $ | 1,419 | | | $ | 1.36 | | | $ | 34,056 | |
| 3BR/2BA | | | 80 | | | | 1,100 | | | | 88,000 | | | $ | 1,581 | | | $ | 1.44 | | | $ | 126,480 | |
| Totals/Average | | | 246 | | | | 958 | | | | 235,780 | | | $ | 1,371 | | | $ | 1.43 | | | $ | 337,384 | |
HIGHEST AND BEST USE
HIGHEST AND BEST USE AS IF VACANT
| | | |
| Surrounding Land Uses | | Predominately residential developments with multifamily to west of the subject. |
| | | |
| Physically Possible | | Being situated along a primary commercial corridor, the subject site benefits from good accessibility and visibility. Residential or commercial use would benefit from the site’s exposure and accessibility to other parts of Fremont. |
| | | |
| Legally Permissible | | Multifamily use is the intended use of the site. |
| | | |
| Financial Feasible | | Multifamily development is occurring throughout the East Bay area of San Francisco. Economic conditions in the area are strong and demand for multifamily housing appear strong as evidenced by high occupancy rates and increasing rents in exiting units and development of over 2,000 new units at this time. The preceding suggests that sufficient entrepreneurial profit incentive is being met to justify the financial feasibility of new construction. |
| | | |
| Conclusion | | New multifamily development. |
| | | |
HIGHEST AND BEST USE AS IMPROVED
|
| | | |
| Current Improvements | | 246-unit multifamily apartment complex. The existing improvements contribute significantly to overall property value indicating that the value of the improved property greatly exceeds the value of the site assuming it to be vacant. |
| | | |
| Conclusion | | Continued use of the existing improvements |
| | |
| Pathfinder Village Apartments | | April 30, 2006 |
| Fremont, California | | Page 29 |
VALUATION
There are three traditional approaches that can be employed in establishing Market Value. These approaches and their applicability to the valuation of the subject property are summarized as follows:
THE COST APPROACH
This method estimates the replacement or reproduction cost of the improvements, less the estimated depreciation (physical, functional, economic), plus the estimated market value of the land, in order to arrive at a final value indication. This approach is based on the premise that an informed purchaser would pay no more for a property than the cost of constructing a building of similar utility and condition.
The Cost Approach is a reliable indicator of value for: (a) new properties; (b) special use properties; and (c) properties where the cost of reproducing the improvement is easily and accurately quantified and there is no external or economic obsolescence. Due to the age of the improvements, they have incurred physical deterioration due to normal wear and usage. Given the inherent inaccuracies and subjectivity involved in estimating substantial degrees of physical deterioration, the cost approach is not considered a reliable, independent approach to value in this instance.
THE SALES COMPARISON APPROACH
Using this technique, the property value is indicated by comparing the subject to similar, nearby properties that have recently sold. Essentially, the procedure is to gather bona fide, recent arm’s length sales of comparable properties and compare the most important characteristics of the sales to the subject. Adjustments are then made to the comparable properties for differences such as terms of financing, date of sale, location, and physical characteristics.
Attaining data with a high degree of comparability is most important when this technique is utilized. The reliability is dependent upon the availability of comparable sales data, the verification of the sales data, the degree of comparability and extent of adjustment necessary for differences and the absence of non-typical conditions affecting the sales price. As numerous sales of properties similar to the subject have occurred in the San Francisco Bay Area, this approach has been employed in the valuation process.
THE INCOME CAPITALIZATION APPROACH
The Income Capitalization Approach is a process in which the anticipated flow of future benefits is capitalized into a value indication. The Income Capitalization Approach is widely applied in appraising income-producing properties. The reliability of this technique is dependent upon the reliability of the net income estimate and the capitalization rate. Since the subject is income producing realty and anticipated to continue to be so, this approach has been employed in the valuation of the Fee Simple Estate.
RECONCILIATION AND FINAL VALUE ESTIMATE
The final step in the Appraisal Process is the reconciliation of the value indicators into a single value estimate. In the reconciliation or correlation, the appraiser considers the relative applicability of each of the three approaches, examines the range between the value indications and places major emphasis on the approach that appears to produce the most reliable solution to the specific appraisal problem. The purpose of the appraisal, the type of property and the adequacy and reliability of the data are analyzed and appropriate weight is given to each of the approaches to value.
| | |
| Pathfinder Village Apartments | | April 30, 2006 |
| Fremont, California | | Page 30 |
INCOME CAPITALIZATION APPROACH
Investment properties are normally valued in proportion to their ability to produce income; hence, an analysis of the property in terms of its ability to provide a sufficient net annual return on invested capital is an important means of valuing any asset. Value is estimated by deducting an appropriate vacancy and collection allowance and all applicable expenses from the anticipated gross annual income to arrive at a projected net operating income which is then capitalized at an interest rate, or investment yield, commensurate with the risk inherent in the ownership of the property. Such a conversion of projected income considers competitive returns offered by alternative investments.
There are two primary income capitalization methods: Direct Capitalization, which converts a single year’s net operating income into an indication of value and the Discounted Cash Flow Analysis (DCF), which estimates the present worth through the process of discounting the forecasted net income and the reversionary sale over the course of an anticipated investment period. The Direct Capitalization technique is employed in this analysis.
DIRECT CAPITALIZATION
The basic steps in the Direct Capitalization method are as follows:
1. Calculate POTENTIAL GROSS INCOME from the dwelling units;
2. Estimate VACANCY AND CREDIT LOSS to arrive at Effective Gross Income;
3. Estimate OPERATING EXPENSES to arrive at the stabilized Net Operating Income;
4. Develop the OVERALL CAPITALIZATION RATE;
5. Divide NOI by the CAP RATE to arrive at VALUE.
Revenue:As presented in the Economic Rent Analysis section of this report, the monthly economic rent potential is estimated at $337,384. The annual gross rent potential estimated for the apartment units total $4,048,608.
Loss to Lease: Loss to lease considers a loss in income due to leases in effect, whereby effective rental rates are lower than asking, or market, rental rates. As a percentage of the property’s gross rent potential, the historical loss to lease ranges from 0.5% in 2005 to 5.8% in 2004. Based on the previous history at the subject property, we have deducted a loss to lease expense of 3.0% of the potential gross income or $121,458.
Concessions:Rent concessions in the market are prevalent in an attempt to bolster occupancy at area apartments. Concessions usually consist of reduced or free rent over a portion of the lease term. There was an increasing trend in concessions between 2003 and 2004, but has decreased since leveling off in 2005. The 2006 Budgeted amount equates to 6.2% gross rent potential. As of year-to-day 2006, concessions presented themselves at 5.2% of the property’s gross rent potential. Based on the operating history at the subject, concessions are projected at 5.0% of the estimated gross rent potential or $202,430.
Vacancy and Credit Loss:As of the date of inspection, the subject property was 98% occupied. Properties identified as income comparables within the Economic Rent Analysis section of this report illustrate occupancy levels that range from 94% to 99%. Information presented in the Apartment Market Overview section of this report indicates that the average occupancy for within the subject’s South Bay apartment submarket is approximately 95%.
| | |
Pathfinder Village Apartments
Fremont, California | | April 30, 2006
Page 31 |
| |
Based on the subject’s historical and current level of occupancy, tempered against the weighted average occupancy reported by competing properties in the influencing area and occupancy level indicated by similar vintage properties in the South Bay submarket, a vacancy factor of 5.0% is estimated for the subject property. In addition, a 1.0% allowance for credit loss is assessed. The combined vacancy and credit loss allowance equates to 6.0%.
Utility Income:Included in this category is the revenue received from tenants paying or reimbursing ownership for their share of water and sewer usage. Utility reimbursements were $475, $645 and $583 per unit in 2003, 2004 and 2005. The annualized year-to-date 2006 utility income equates to $789 per unit. Based on the historical trend and accounting of inflation, we have estimated Utility Income to be $153,750, or $625 per unit.
Other Income:Included within this category is the revenue received from such items as application fees, forfeited deposits, and late fees. As a percentage of the property’s gross rent potential, Other Income receipts range from 4.0% to 5.9%. Based on historical other income receipts, we have estimated Other Income to be 5.0% of the gross rent potential or $202,430.
Expenses:In order to project expenses for valuation purposes, the expenses historically incurred in the operation of the subject property have been reviewed. Typical operating expenses for garden apartments in the San Francisco Bay Area, as reported by IREM have been reviewed and analyzed. The following table summarizes the three-year operating history for the subject property including year-end figures for 2003, 2004 and 2005 and year-to-date figures for 2006 through March. The year-to-date 2006 figures have been annualized for analytical purposes.
SUMMARY OF OPERATING HISTORY AND BUDGET — PATHFINDER VILLAGE APARTMENTS
| | | | | | | | | | | | | | | | | | | | | | | | | | | | | | | | | | | | | |
| | | 2003 | | | 2004 | | | 2005 | | | | | | | 2006 YTD | | | | |
| Item | | Actual | | | Per Unit | | | Actual | | | Per Unit | | | Actual | | | Per Unit | | | Actual | | | Annualized | | | Per Unit | |
| Gross Rent Potential | | $ | 4,107,106 | | | $ | 16,696 | | | $ | 4,137,158 | | | $ | 16,818 | | | $ | 3,830,214 | | | $ | 15,570 | | | $ | 985,612 | | | $ | 3,942,448 | | | $ | 16,026 | |
| Loss to Lease | | | ($169,581 | ) | | | ($689 | ) | | | ($239,124 | ) | | | ($972 | ) | | | ($17,421 | ) | | | ($71 | ) | | | ($36,634 | ) | | | ($146,536 | ) | | | ($596 | ) |
| Concessions | | | ($94,803 | ) | | | ($385 | ) | | | ($282,493 | ) | | | ($1,148 | ) | | | ($259,482 | ) | | | ($1,055 | ) | | | ($51,722 | ) | | | ($206,888 | ) | | | ($841 | ) |
| Vacancy/Credit Loss | | | ($580,928 | ) | | | ($2,361 | ) | | | ($490,394 | ) | | | ($1,993 | ) | | | ($365,237 | ) | | | ($1,485 | ) | | | ($52,699 | ) | | | ($210,796 | ) | | | ($857 | ) |
| Utility Income | | $ | 116,967 | | | $ | 475 | | | $ | 158,632 | | | $ | 645 | | | $ | 143,371 | | | $ | 583 | | | $ | 48,507 | | | $ | 194,028 | | | $ | 789 | |
| Other Income | | $ | 212,684 | | | $ | 865 | | | $ | 229,445 | | | $ | 933 | | | $ | 155,000 | | | $ | 630 | | | $ | 58,081 | | | $ | 232,324 | | | $ | 944 | |
| | | | | | | | | | | | | | | | | | | | | | | | | | | | |
| Effective Gross Income | | $ | 3,591,445 | | | $ | 14,599 | | | $ | 3,513,224 | | | $ | 14,281 | | | $ | 3,486,445 | | | $ | 14,173 | | | $ | 951,145 | | | $ | 3,804,580 | | | $ | 15,466 | |
| Utilities | | $ | 188,249 | | | $ | 765 | | | $ | 188,743 | | | $ | 767 | | | $ | 198,345 | | | $ | 806 | | | $ | 56,621 | | | $ | 226,484 | | | $ | 921 | |
| Repairs & Maintenance | | $ | 380,126 | | | $ | 1,545 | | | $ | 420,605 | | | $ | 1,710 | | | $ | 486,238 | | | $ | 1,977 | | | $ | 130,343 | | | $ | 521,372 | | | $ | 2,119 | |
| Administrative | | $ | 107,512 | | | $ | 437 | | | $ | 161,540 | | | $ | 657 | | | $ | 193,147 | | | $ | 785 | | | $ | 33,697 | | | $ | 134,788 | | | $ | 548 | |
| Marketing | | $ | 78,541 | | | $ | 319 | | | $ | 79,306 | | | $ | 322 | | | $ | 82,689 | | | $ | 336 | | | $ | 19,110 | | | $ | 76,440 | | | $ | 311 | |
| Payroll | | $ | 260,089 | | | $ | 1,057 | | | $ | 361,025 | | | $ | 1,468 | | | $ | 437,764 | | | $ | 1,780 | | | $ | 96,448 | | | $ | 385,792 | | | $ | 1,568 | |
| Management | | $ | 145,841 | | | $ | 593 | | | $ | 137,736 | | | $ | 560 | | | $ | 135,146 | | | $ | 549 | | | $ | 36,555 | | | $ | 146,220 | | | $ | 594 | |
| Insurance | | $ | 134,937 | | | $ | 549 | | | $ | 134,929 | | | $ | 548 | | | $ | 134,937 | | | $ | 549 | | | $ | 36,629 | | | $ | 146,516 | | | $ | 596 | |
| Real Estate Taxes | | $ | 239,795 | | | $ | 975 | | | $ | 234,569 | | | $ | 954 | | | $ | 242,209 | | | $ | 985 | | | $ | 63,002 | | | $ | 252,008 | | | $ | 1,024 | |
| | | | | | | | | | | | | | | | | | | | | | | | | | | | |
| Total Expenses | | $ | 1,535,090 | | | $ | 6,240 | | | $ | 1,718,453 | | | $ | 6,986 | | | $ | 1,910,475 | | | $ | 7,766 | | | $ | 472,405 | | | $ | 1,889,620 | | | $ | 7,681 | |
| Net Operating Income | | $ | 2,056,355 | | | $ | 8,359 | | | $ | 1,794,771 | | | $ | 7,296 | | | $ | 1,575,970 | | | $ | 6,406 | | | $ | 478,740 | | | $ | 1,914,960 | | | $ | 7,784 | |
| | | |
| Utilities | | This expense covers the cost of electricity, water and sewer and gas usage for the property. The subject property’s 2003, 2004 and 2005 utilities expense were $765, $767 and $806 per unit, respectively. The annualized year-to-date 2006 expense equates to $921 per unit. Based on historical expenditures and trending forward for inflation, Utilities are processed at $830 per unit or $204,180. |
| | |
Pathfinder Village Apartments
Fremont, California | | April 30, 2006
Page 32 |
| |
| | | |
| Repair & Maintenance: | | This category includes general repair and maintenance items, contract services and turnover expenses. The subject’s historical repair and maintenance expense for 2003, 2004 and 2005 were $1,545, $1,710 and $1,977 per unit, respectively. The annualized year-to-date 2006 expense equates to $2,119 per unit. It is noted that the subject’s historical expense appears high comparable to industry averages. However, the subject consists of an atypical unit mix of 104 three-bedroom and 350 two-bedroom units. In addition, the subject has a history of high turnover do to the occupancy profile. After review of the subject’s historical operating figures, tempered against industry averages, the repairs and maintenance expense is estimated at $393,600, or $1,600 per unit. |
| | | |
| Administrative | | Office expenses, telephone, management unit expenses, computer maintenance and supplies, professional fees and miscellaneous expenses are covered in this category. The subject’s historical administrative expense for 2003, 2004 and 2005 were $437, $657 and $785 per unit, respectively. The annualized year-to-date 2006 expense equates to $548 per unit. The 2005 Administrative appears high comparable to industry averages. The is attributed to the non-recurring expense of temporary employment agency as well as some changes in accounting procedures. Based on 2004 and year-to-date 2006 historical amounts, Administrative expenses are projected at $123,000, or $500 per unit. |
| | | |
| Marketing | | Included in this category are all newspaper and printed advertising, payments to locator services, leasing commissions, and resident referrals. The subject’s historical marketing expense for 2003, 2004 and 2005 were $319, $322 and $336 per unit, respectively. The annualized year-to-date 2006 expense equates to $311 per unit. Marketing expenses are projected at $73,800, or $300 per unit. |
| | | |
| Payroll: | | This expense covers salaries, payroll taxes, and workers compensation insurance for on site management, leasing, and maintenance personnel. The subject’s historical payroll expense has been somewhat sporadic. The Payroll expense for 2003, 2004 and 2005 were $1,057, $1,468 and $1,780 per unit, respectively. The annualized year-to-date 2006 expense equates to $1,568 per unit. Reportedly, the increasing trend is attributed to increases in worker compensation insurance. Payroll expenses are projected at $393,600, or $1,600 per unit. |
| | | |
| Management | | A typical management fee on a property of this type is 3% to 5% of the effective gross income. The subject’s historical management fee has been based on an amount equivalent to approximately 4.3% to 4.5% of Effective Gross Income. A market-oriented fee of 4.0% is considered reasonable. Based on the preceding estimate of Effective Gross Income, the subject’s management fee is estimated to be $153,519, or $624 per unit. |
| | |
Pathfinder Village Apartments
Fremont, California | | April 30, 2006
Page 33 |
| |
| | | |
| Insurance | | This expense item covers the building and includes fire, extended coverage, vehicle, and owner’s liability. The subject’s historical insurance expense for 2003, 2004 and 2005 were $549, $548 and $549 per unit, respectively. The annualized year-to-date 2006 expense equates to $596 per unit. Insurance expenses are projected at $147,600, or $600 per unit. |
| | | |
| Taxes | | As discussed in the Real Estate Tax section, the tax burden for the subject property is estimated at $469,400, or $1,908 per unit. |
| | | |
| Reserves for Replacements | | In addition to the repairs and maintenance expenditures, the property will incur annual capital expenditures to keep it in prime condition. A reserve category is typical for multifamily property; therefore we have included reserves as an additional budget item. Reserves for replacement for a property of this vintage typically range from $200 to $400 per unit. Considering the age of the subject property, a reserve for replacement allowance aligned with the higher end of the aforementioned range of $350 per unit or $86,100 is estimated for the subject property. |
| | | |
| Total Expenses | | Total expenses have been estimated at $2,044,799, or 53% of effective income. Information provided by the Institute of Real Estate Management (IREM) indicates that expense ratios for apartment complexes in the subject’s region (Region IV) range from 41.0% to 35.6%, with an average of 47.4%, exclusive of a reserve allowance exclusive of reserves, the subject’s expense ratio equates to 51%. The total operating expenses projected for the subject property falls outside this range and aligned toward the high end of the range indicated by the Sale Comparables, which exhibit a range of expense ratios of 39% to 60%. It is noted that the subject has a history of high operating cost primarily due to its atypical unit mix and high turnover rate. |
Net Operating Income:The Net Operating Income is that amount of the income remaining after paying all operating expenses. This affords the owner capital to satisfy debt service, if any, and provide a return on owner’s equity. We have estimated the NOI to be $1,793,185. The subject’s income and expense pro forma is summarized below.
| | |
Pathfinder Village Apartments
Fremont, California | | April 30, 2006
Page 34 |
| |
VALUATION PRO FORMA
| | | | | | | | | |
| Item | | Total | | | Per Unit | |
| |
| Gross Rent Potential | | $ | 4,048,608 | | | $ | 16,458 | |
| Loss to Lease | | | ($121,458 | ) | | | ($494 | ) |
| Concessions | | | ($202,430 | ) | | | ($823 | ) |
| Vacancy/Credit Loss | | | ($242,916 | ) | | | ($987 | ) |
| Utility Income | | $ | 153,750 | | | $ | 625 | |
| Other Income | | $ | 202,430 | | | $ | 823 | |
| | | | | | | |
| Effective Gross Income | | $ | 3,837,984 | | | $ | 15,602 | |
| | | | | | | | | |
| Utilities | | $ | 204,180 | | | $ | 830 | |
| Repairs & Maintenance | | $ | 393,600 | | | $ | 1,600 | |
| Administrative | | $ | 123,000 | | | $ | 500 | |
| Marketing | | $ | 73,800 | | | $ | 300 | |
| Payroll | | $ | 393,600 | | | $ | 1,600 | |
| Management | | $ | 153,519 | | | $ | 624 | |
| Insurance | | $ | 147,600 | | | $ | 600 | |
| Real Estate Taxes | | $ | 469,400 | | | $ | 1,908 | |
| Reserves | | $ | 86,100 | | | $ | 350 | |
| | | | | | | |
| Total Expenses | | $ | 2,044,799 | | | $ | 8,312 | |
| | | | | | | | | |
| Net Operating Income | | $ | 1,793,185 | | | $ | 7,289 | |
Capitalization:Capitalization rates express relationships between net income and total value. The rate employed must be consistent with and reflective of those rates currently employed by investors active in the market place.
In order to perform this analysis, estimates of an appropriate capitalization rate must be formed. By its nature this is a judgmental process, however, selected rates should approximate the investment perimeters expected to be employed by the most probable buyer for the subject property.
Several approaches are typically followed in selecting the investment parameters; review and analysis of alternative real estate and non-real estate investments; review and analysis of published real estate investor surveys; derivation of rates from empirical market data; and use of in-house experience with similar types of investments.
| | | |
| Most Probable Buyer | | Considering the size and quality of the asset, the subject buyer would most likely attract national or regional investors. |
| | | |
| Market Extraction | | The following table summarizes the market derived overall rates. The sales are further detailed in theSales Comparison Approach. |
SUMMARY OF MARKET DERIVED OVERALL RATES
| | | | | | | | | | | | | |
| | | Sale 1 | | Sale 2 | | Sale 3 | | Sale 4 | | Sale 5 | | Sale 6 |
| |
| Name | | Casa Blanca | | Paseo Park | | Briarwood | | Valley Plaza Village | | Hacienda Gardens | | Brookside |
| Sale Date | | Feb-06 | | Dec-05 | | Jun-05 | | May-04 | | Jul-04 | | Aug-04 |
| Year Built | | 1970 | | 1986 | | 1982 | | 1985 | | 1970 | | 1974 |
| Cap Rate (OAR) | | 5.35% | | 5.82% | | 5.04% | | 6.66% | | 6.12% | | 6.16% |
| | | |
| | | The sales exhibit overall rates that range from 5.0% to 6.7%and produce an average of 5.9%. The sales represent recent transactions of late 1970s and early- to mid-1980s vintage apartment complexes that are generally similar to the subject property in terms of construction and physical |
| | |
Pathfinder Village Apartments
Fremont, California | | April 30, 2006
Page 35 |
| |
| | | |
| | | characteristics. The comparable properties are situated in San Francisco Bay Area locations that demonstrate generally similar demographic characteristics of the subject neighborhood. The capitalization rates indicated by the sales data are representative of an appropriate rate that would be applicable to the subject property. Based on the indicators exhibited by market data, a capitalization rate in the range of approximately 5.0% to 6.5% is suggested. |
| | | |
| Survey of Investors | | The most useful approach used to estimate an approximate rate of return required by the most probable buyer is to analyze the current investment parameters applied by institutional investors and advisors to real estate pension and portfolio funds when acquiring real estate. According to the First Quarter 2006 Korpacz Real Estate Investor Survey, prepared by Price Waterhouse Coopers, capitalization rates for institutional grade apartment properties range from 4.25% to 8.00% with an average of 6.7%. Capitalization rates in the San Francisco Bay Area are generally aligned with the low end of the national survey range and below the national average. |
| | | |
| | | According to NIA BT Commercial’s Apartment Market Report, Year End 2005, capitalization rates within the San Francisco Bay Area have decreased from a Year End 2004 average of 5.83% to 5.22% for the Year Ending 2005. |
| | | |
| Conclusion | | The sales exhibit overall rates that range from 5.0% to 6.7% and produce an average of 5.9%. Based on the indicators exhibited by the sales data, an appropriate cap rate for the subject property is concluded to be in the range of 5.0% to 6.0%. A rate of 5.5% is processed for valuation purposes. |
| | | |
| Valuation: | | Capitalizing the estimated Net Operating Income of $1,793,185 by a 5.5% rate results in a value conclusion of $32,600,000, rounded ($1,793,185 NOI¸ 5.5% OAR =$32,603,364). |
SALES COMPARISON APPROACH
The Sales Comparison Approach to value is the process of comparing recent sales of competitive properties. The estimated value derived via this approach represents the probable price at which the subject property would be sold by a willing seller to a willing buyer as of the date of value.
To estimate the property value by the Sales Comparison Approach, six multifamily apartment building sales, which are summarized in the following table, have been examined and analyzed. All of the sales are garden style apartments with similar physical characteristics within the San Francisco East Bay Area apartment market. The appraisal indicators exhibited by the sales data outlined in the following chart are utilized for purposes of estimating a value for the subject via the Sale Comparison Approach.
| | |
Pathfinder Village Apartments
Fremont, California | | April 30, 2006
Page 36 |
| |
The price per apartment unit has been relied upon as the unit of comparison in this approach. The comparative process involves judgment as to the similarity between the subject property and the comparable sale property with regard to a variety of factors affecting value such as location, age and condition of the structure, market conditions, rent levels, property rights conveyed, financing terms, conditions of sale, operational efficiencies and other factors.
ANALYSIS OF SALES:This approach relies on an active market. Sufficient data from the San Francisco East Bay Area exists to formulate a value via the Sales Comparison Approach. Below are six sale comparables of similar vintage garden style apartments with similar characteristics to the subject property.
| | |
Pathfinder Village Apartments
Fremont, California | | April 30, 2006
Page 37 |
| |
SUMMARY OF COMPARABLE BUILDING SALES
| | | | | | | | | | | | | |
| Sale No. | | 1 | | 2 | | 3 | | 4 | | 5 | | 6 |
| |
| Name | | Casa Blanca | | Paseo Park | | Briarwood | | Valley Plaza Village | | Hacienda Gardens | | Brookside |
| Location | | 38863 Fremont Blvd | | 37200 Paseo Padre | | 4200 Bay St | | 4411 Valley Ave | | 36000 Fremont Blvd | | 1085 Murrieta |
| | | Fremont, CA | | Fremont, CA | | Fremont, CA | | Pleasanton, CA | | Fremont, CA | | Livermore, CA |
| Sales Price | | $6,800,000 | | $19,700,000 | | $19,500,000 | | $21,150,000 | | $18,500,000 | | $19,530,000 |
| Sale Date | | Feb-06 | | Dec-05 | | Jun-05 | | May-04 | | Jul-04 | | Aug-04 |
| Year Built | | 1970 | | 1986 | | 1982 | | 1985 | | 1970 | | 1974 |
| No. of Units | | 54 | | 134 | | 160 | | 144 | | 170 | | 154 |
| Net Rentable Area (SF) | | 38,427 | | 105,900 | | 110,352 | | 130,032 | | 120,110 | | 132,494 |
| Avg. Unit Size (SF) | | 712 | | 790 | | 690 | | 903 | | 707 | | 860 |
| Occupancy | | 95% | | 95% | | 95% | | 95% | | 95% | | 81% |
| Price/SF | | $177 | | $186 | | $177 | | $163 | | $154 | | $147 |
| Price/Unit | | $125,926 | | $147,015 | | $121,875 | | $146,875 | | $108,824 | | $126,818 |
| Net Income | | $363,948 | | $1,147,235 | | $983,241 | | $1,408,670 | | $1,131,829 | | $1,202,739 |
| NOI/SF | | $9.47 | | $10.83 | | $8.91 | | $10.83 | | $9.42 | | $9.08 |
| NOI/Unit | | $6,740 | | $8,561 | | $6,145 | | $9,782 | | $6,658 | | $7,810 |
| Cap Rate (OAR) | | 5.35% | | 5.82% | | 5.04% | | 6.66% | | 6.12% | | 6.16% |
| EGIM | | 9.2 | | 9.3 | | 9.4 | | 8.6 | | 8.2 | | 8.6 |
| Expense Ratio (OER) | | 51% | | 46% | | 53% | | 42% | | 50% | | 47% |
| | |
Pathfinder Village Apartments
Fremont, California | | April 30, 2006
Page 38 |
| |
The sales indicate per unit prices ranging from $108,824 to $147,015. All of the comparables represent sales of apartments that are of similar construction componentry as the subject. All of the sales are of the same general vintage as the subject property and generally similar in terms of physical condition. Situated in throughout the San Francisco Bay Area, minor differences exist as to the specific location of each comparable and subject property.
The primary difference between the comparables and the subject are location and average unit size. The most value influencing difference between the subject and the comparable sales is the amount of net operating income generated on a per unit basis. In an attempt to quantify appropriate adjustments to the prices indicated by the comparables, we have analyzed the difference between the net operating income (NOI) per unit of the comparables relative to the NOI of the subject property. In this analysis we have adjusted the sale price of the comparables based on the percentage difference in net income. This factor takes into account the adjustments necessary for the aforementioned factors that are considered to have the most impact on value.
As discussed in the Income Approach section of the report, the NOI estimated for the subject property is $1,793,185 which equates to $7,289 per unit. The adjustments applied to the comparable sales are depicted below.
PRICE PER UNIT ANALYSIS
| | | | | | | | | | | | | | | | | | | | | |
| Sale No. | | Price/Unit | | Subject NOI/Unit | | Comparable NOI/Unit | | Adjustment Factor | | Adjusted Price/Unit |
| |
| 1 | | $ | 125,926 | | | $ | 7,289 | | | $ | 6,740 | | | | 1.08 | | | $ | 136,000 | |
| 2 | | $ | 147,015 | | | $ | 7,289 | | | $ | 8,561 | | | | 0.85 | | | $ | 124,963 | |
| 3 | | $ | 121,875 | | | $ | 7,289 | | | $ | 6,145 | | | | 1.19 | | | $ | 145,031 | |
| 4 | | $ | 146,875 | | | $ | 7,289 | | | $ | 9,782 | | | | 0.75 | | | $ | 110,156 | |
| 5 | | $ | 108,824 | | | $ | 7,289 | | | $ | 6,658 | | | | 1.09 | | | $ | 118,618 | |
| 6 | | $ | 126,818 | | | $ | 7,289 | | | $ | 7,810 | | | | 0.93 | | | $ | 117,941 | |
*Adjustment Factor = (Subject NOI per Unit / Comparable NOI per Unit)
The adjusted per unit indicators fall within a tighter range than the unadjusted per unit prices. The adjusted range of per unit prices is $110,156 to $145,031. The mean and median adjusted unit price is $125,452 and $121,791. Emphasis is placed on all of the sales due to their similarity compared to the subject in concluding to a value of $125,000 per unit for the subject property. Utilizing this per unit value estimate, the total value of the subject property is estimated at $30,750,000.
$125,000 x 246 units = $30,750,000
EGIM ANALYSIS:The sales illustrate EGIMs that range from 8.2 to 9.4. Important in selecting an appropriate EGIM is the review of corresponding operating expenses. There is an inverse relationship which generally holds among EGIMs and operating expenses. Properties which have higher expense ratios typically sell for relatively less and therefore produce a lower EGIM. The operating expense ratios for the sales range from 42% to 53%.
In selecting an appropriate EGIM, consideration must be given to the operating expense ratio estimated for the subject. Based on the income and expenses estimated for the subject property in Income Approach, the subject’s operating expense ratio is calculated at 53%. The subject’s expense ratio is aligned toward the high end of range of ratios exhibited by the sales data and most similar to the ratios exhibited by Sales Nos. 1, 3 and 5. An EGIM aligned toward the low end of the range would be considered reasonable. In consideration of the preceding, an EGIM of 9.25 is concluded.
| | |
Pathfinder Village Apartments
Fremont, California | | April 30, 2006
Page 39 |
| |
Based on the effective gross income of $3,837,984 estimated for the subject property, a value indication of $35,500,000 (rounded) is concluded.
$3,837,984 x 10.0 = $35,501,352, or $35,500,000, rounded
CONCLUSION:The noted value indicators utilizing the sales price per unit and EGIM methods are $30,750,000 and $35,500,000, respectively. Due to the similarity of the resulting value indicators, relatively equal consideration was given to both techniques when concluding to a final value via the Sales Comparison Approach of $33,100,000.
As such, the Market Value of the subject property’s Fee Simple Interest via the Sales Comparison Approach is therefore estimated at:
| | | | | |
Value via the Sales Comparison Approach | | | $33,100,000 | |
RECONCILIATION
| | | | | |
| Cost Approach | | | N/A | |
| Income Capitalization Approach | | | $32,600,000 | |
| Sales Comparison Approach | | | $33,100,000 | |
Income and Sales approaches to value were employed in the appraisal of the subject property. Buyers and sellers rarely rely on the Cost Approach to price commercial real estate. Furthermore, the age of the improvements and subjectivity involved in estimating substantial degrees of physical deterioration reduces the reliability of this approach. As such, a Cost Approach was not employed.
The value derived from the Income Capitalization Approach is well documented and market oriented. The local market is active in terms of investment sales of similar apartment complexes and sufficient sales data was available to develop a defensible value via the Sales Comparison Approach. The value derived through use of the Sales Comparison Approach supports the value concluded for the property via the Income Capitalization Approach. Due to the income producing nature of the subject property, the results of the Income Capitalization Approach are emphasized.
| | | | | |
FINAL ESTIMATE OF VALUE | | | $32,600,000 | |
| | |
Pathfinder Village Apartments
Fremont, California | | April 30, 2006
Addenda |
| |
ADDENDA
| | |
Pathfinder Village Apartments
Fremont, California | | April 30, 2006
Addenda |
| |
SUBJECT PHOTOGRAPHS
| | |
Pathfinder Village Apartments
Fremont, California | | April 30, 2006
Addenda |
| |
Clubhouse/Leasing Office
Facing Southwest along Fremont Boulevard service road
| | |
Pathfinder Village Apartments
Fremont, California | | April 30, 2006
Addenda |
| |
Interior View of Clubhouse
Rear View of Clubhouse/Leasing and Pool
| | |
Pathfinder Village Apartments
Fremont, California | | April 30, 2006
Addenda |
| |
Side View of Swimming Pool
Side View of Typical Building
| | |
Pathfinder Village Apartments
Fremont, California | | April 30, 2006
Addenda |
| |
Side View of Typical Building
Typical Building
| | |
Pathfinder Village Apartments
Fremont, California | | April 30, 2006
Addenda |
| |
Typical Building and Parking Garage
Typical Kitchen
| | |
Pathfinder Village Apartments
Fremont, California | | April 30, 2006
Addenda |
| |
Interior View of Typical Unit
Interior of Exercise Room
| | |
Pathfinder Village Apartments
Fremont, California | | April 30, 2006
Addenda |
| |
COMPARABLE RENTAL PHOTOGRAPHS
| | |
Pathfinder Village Apartments
Fremont, California | | April 30, 2006
Addenda |
| |
Rent Comparable No. 1
Rent Comparable No. 2
| | |
Pathfinder Village Apartments
Fremont, California | | April 30, 2006
Addenda |
| |
Rent Comparable No. 3
Rent Comparable No. 4
| | |
Pathfinder Village Apartments
Fremont, California | | April 30, 2006
Addenda |
| |
Rent Comparable No. 5
| | |
Pathfinder Village Apartments
Fremont, California | | April 30, 2006
Addenda |
| |
REGIONAL LOCATION MAP
| | |
Pathfinder Village Apartments
Fremont, California | | April 30, 2006
Addenda |
| |
NEIGHBORHOOD MAP
| | |
Pathfinder Village Apartments
Fremont, California | | April 30, 2006
Addenda |
| |
COMPARABLE RENTALS MAP
| | |
Pathfinder Village Apartments
Fremont, California | | April 30, 2006
Addenda |
| |
COMPARABLE SALES MAP
| | |
Pathfinder Village Apartments
Fremont, California | | April 30, 2006
Addenda |
| |
QUALIFICATIONS
| | |
Pathfinder Village Apartments
Fremont, California | | April 30, 2006
Addenda |
| |
WILLIAM L. CORBIN, MAI
EXECUTIVE VICE PRESIDENT
WILLIAM CORBIN, MAIis Executive Vice President and manager of the Western Regional Office of KTR Newmark Real Estate Services LLC, located at 10866 Wilshire Boulevard, Los Angeles, California 90046. His direct telephone number is 310/ 234-4754.
Education
| | | | | |
| | | University of California at Los Angeles, 1977 |
| | | | | Bachelor of Arts |
| | | | | Major in Economics |
| | | | | |
| | | University of Southern California, 1980 |
| | | | | Master of Business Administration |
| | | | | Concentration in Real Estate and Finance |
Designations
| | | | | |
| | | MAI Member — Appraisal Institute |
Licenses
| | | | | |
| | | California Certified General Real Estate Appraiser |
| | | Arizona Certified General Real Estate Appraiser |
Affiliations
| | | | | |
| | | National Council of Real Estate Investment Fiduciaries (NCREIF) designated representative |
| | | - Valuation sub-committee co-chairperson for Standardized Commercial Appraisal Report |
| | |
Pathfinder Village Apartments
Fremont, California | | April 30, 2006
Addenda |
| |
WILLIAM L. CORBIN, MAI
Experience
Mr. Corbin began his career with an intensive education in real estate market analysis as a consultant withRobert Charles Lesser & Co.from 1980 to 1983. With RCLCo, he performed over 75 market supply and demand, economic feasibility, and strategic planning assignments for prominent regional and national clients. During this very active construction period, nationally, Mr. Corbin had the opportunity to visit and analyze commercial real estate market conditions is over 20 major metropolitan areas in the Western and Central U.S.
As a mortgage banker from 1983 to 1992, Mr. Corbin arranged a wide variety of financing structures with institutional lenders and equity investors, including permanent loans, construction loans, and joint ventures. In total withGeorge Smith Financial Services/Grubb & Ellisand Center Financial Group, he worked with over 90 institutions and closed over 150 transactions totaling in excess of $700,000,000.
As an appraiser, Mr. Corbin has performed numerous current value narrative appraisals for national and regional institutional lenders and investors. His previous experience in commercial real estate finance gives him particular insight to the capital and investment markets and their impact on institutional real estate activity and values. He has performed a wide variety of appraisals of warehouse distribution buildings, industrial and business parks, office buildings, shopping centers, and apartments. He worked withLandauer Associatesfrom 1992 to 1995, managing the Aetna Realty Investors account for western region property appraisals.
Currently withKTR Newmarkten years, Mr. Corbin is responsible for managing the Los Angeles regional office, developing and managing institutional accounts, as well as performing direct valuation work for those clients. He also heads KTR Newmark’s national pension fund valuation practice and is the firm’s designated representative to NCREIF, a national organization of pension fund advisors that creates and implements operational policy standards for the industry. Mr. Corbin is currently the chairperson for NCREIF’s valuation sub-committee that is contributing to developing a standardized commercial appraisal report in conjunction with the Appraisal Institute that will become the valuation industry standard.
In addition to professional experience, Mr. Corbin has served as a real estate course instructor and conference collaborator for UCLA Extension
| | |
Pathfinder Village Apartments
Fremont, California | | April 30, 2006
Addenda |
| |
WILLIAM L. CORBIN, MAI
Following is a list of representative clients Mr. Corbin has performed services for:
| | | |
Clients — As Appraiser and Consultant | | |
| Aetna Realty Investors, Inc. | | Massachusetts Mutual Life |
| Bechtel Corporation | | McCullough Oil Properties |
| CALTRANS | | Mobil Land Development |
| Catellus Corp. | | Chevron Land Development |
| Philips, North America | | Home Savings of America |
| KOAR Hotel Group | | Safeway Stores |
| Copley Institutional Realty | | Santa Anita Realty |
| Estate of James Campbell | | Santa Fe Land Improvement Co. |
| Franklin Properties, Inc. | | Taft Broadcasting Co. |
| Triton Energy Corp | | Comerica Bank |
| Union Oil/Moreland Development | | Trammell Crow Company |
| Kaiser Aluminum Corp. | | Bank of New York |
| Lockheed Air Terminal, Inc. | | Majestic Realty |
| Hong Kong and Shanghai Bank Corp. | | Canadian Imperial Bank of Commerce |
| PNC Bank | | Sakura Bank |
| CALSTRS | | Newfield Enterprises |
| Heller Financial | | J. P. Morgan Mortgage Capital |
| Chase Commercial Mortgage Banking | | Lend Lease Mortgage Capital |
| Daiwa Securities America | | Whitehall Fund II |
| Lennar Partners | | AMB Institutional Realty Advisors |
| SSR Realty Advisors | | TA Associates Realty |
| Douglas, Emmett Realty Advisors | | LACERA |
| Dresdner Bank | | Henderson Global Investors |
| Prudential Mortgage Capital | | Prudential Insurance Company of America |
| TIAA-CREF | | INVESCO |
| Principal Real Estate Investors | | Cornerstone Real Estate Advisers |
| RREEF | | Deutsche Bank |
| Eurohypo Bank | | |
| | | |
Clients — As Mortgage Banker | | |
| AEtna Life & Casualty | | AFL-CIO Housing Trust |
| BALCOR | | Bank of America |
| Citicorp REIG | | Creative Artists Agency |
| Forest City Properties | | General Electric Credit |
| Heller Financial Services | | Hollywood Center Studios |
| Home Savings of America | | Industrial Bank of Japan |
| MetroBank | | Massachusetts Mutual Life |
| Principal Mutual Life | | Security Pacific National Bank |
| Societe Generale | | Textron Financial Services |
| U.S. Bancorp | | Union Bank |
| William Morris Agency | | DeAnza Group, Inc. |
| IBEW Pension Fund | | Nationwide Life |
| | |
Pathfinder Village Apartments
Fremont, California | | April 30, 2006
Addenda |
| |
STEVEN J. GOLDBERG, MAI, CCIM
SENIOR VICE PRESIDENT
STEVEN J. GOLDBERG is Manager of the Dallas Appraisal Division of KTR Newmark Real Estate Services LLC. His responsibilities include staff supervision, appraisal management, maintaining product quality, marketing and client development. In his current capacity, Mr. Goldberg oversees all valuation assignments involving real estate assets located in the Southwest region.
Mr. Goldberg has over 23 years of nationwide experience in real estate valuation, investment analysis and evaluation consultation. He has performed appraisals throughout the United States and has extensive experience in most markets situated in the Southwest and Southeast regions of the country. Mr. Goldberg’s particular area of expertise is in the appraisal and analysis of multifamily apartment projects. In addition to his expertise in the multifamily market, Mr. Goldberg has extensive experience in the appraisal of other income-producing properties including office buildings, retail properties, lodging facilities, industrial properties and mixed-use projects.
Mr. Goldberg has performed marketability, consultation and feasibility reports, has served as an expert witness and has testified in various state and federal courts. These activities have been performed on behalf of real estate investors, life insurance companies, pension funds, investment banking firms, foreign and domestic financial institutions, mortgage bankers, conduit lenders, real estate advisors, law firms and governmental agencies.
Mr. Goldberg received his Bachelor of Business Administration Degree from the University of Texas in Austin, with major concentrations in both Finance and Real Estate/Urban Land Economics. He is a designated member of the Appraisal Institute and the Commercial Investment Real Estate Institute having been awarded the MAI designation in 1989 and the CCIM designation in 1994. He has attended numerous continuing education courses and has completed the requirements under the continuing education program of the Appraisal Institute.
Mr. Goldberg is state certified as a General Real Estate Appraiser in Texas and Arizona. He is also a licensed Real Estate Broker in the State of Texas. He is affiliated with the North Texas Commercial Association of Realtors, International Council of Shopping Centers and Mortgage Bankers Association.
| | |
Pathfinder Village Apartments
Fremont, California | | April 30, 2006
Addenda |
| |
QUALIFICATIONS OF THE APPRAISER
JACKSON L. AILLS
Jackson L. Aills is certified as General Real Estate Appraiser in the State of Texas (TX-1331035-G). Mr. Aills has a Bachelor of Business Administration from the University of Mississippi and has attended numerous real estate education courses and seminars, including those offered by the Appraisal Institute.
Mr. Aills has been involved in real estate appraising since 1989. He currently holds the position of Senior Appraiser for the Dallas office of KTR Newmark Real Estate Services LLC, a New York based real estate firm.
Real estate appraisal assignments have been performed on a variety income producing properties throughout the United States. These activities have been performed on behalf of real estate investors, life insurance companies, pension funds, REITs, investment banking firms, foreign and domestic financial institutions, mortgage bankers, conduit lenders, real estate advisors and governmental agencies. The scope of his real estate assignments have included office buildings, industrial properties, multifamily projects, retail, hotels, proposed construction, special use properties, and raw land.