UNITED STATES
SECURITIES AND EXCHANGE COMMISSION
Washington, D.C. 20549
FORM N-CSR
CERTIFIED SHAREHOLDER REPORT OF REGISTERED
MANAGEMENT INVESTMENT COMPANIES
Investment Company Act file number 811-08614
Brandes Investment Trust
(Exact name of registrant as specified in charter)
11988 El Camino Real, Suite 600
San Diego, CA 92130
(Address of principal executive offices) (Zip code)
Michael Glazer
Morgan, Lewis & Bockius LLP
355 South Grand Ave., Suite 4400
Los Angeles, CA 90071-3106
(Name and address of agent for service)
800-331-2979
Registrant’s telephone number, including area code
Date of fiscal year end: September 30, 2017
Date of reporting period: September 30, 2017
Item 1. Reports to Stockholders.
ANNUAL REPORT INTERNATIONAL EQUITY FUND GLOBAL EQUITY FUND GLOBAL EQUITY INCOME FUND GLOBAL OPPORTUNITIES VALUE FUND EMERGING MARKETS VALUE FUND INTERNATIONAL SMALL CAP EQUITY FUND CORE PLUS FIXED INCOME FUND CREDIT FOCUS YIELD FUND For the year ended September 30, 2017

| 2 | ||||
| 2 | ||||
| 8 | ||||
| 14 | ||||
| 21 | ||||
| 27 | ||||
| 33 | ||||
| 39 | ||||
| 46 | ||||
| 53 | ||||
| 57 | ||||
| 57 | ||||
| 60 | ||||
| 63 | ||||
| 66 | ||||
| 70 | ||||
| 75 | ||||
| 80 | ||||
| 85 | ||||
| 90 | ||||
| 92 | ||||
| 94 | ||||
| 98 | ||||
| 108 | ||||
| 132 | ||||
| 133 | ||||
| 137 |
1
Brandes International Equity Fund
The net asset value of the Brandes International Equity Fund (Class I Shares) advanced 15.33% in the 12 months ended September 30, 2017. For the same period, the MSCI EAFE Index rose 19.10%.
Holdings in industrials helped performance, driven by U.K.-based security services provider G4S and Brazilian regional jet manufacturer Embraer. Embraer benefited from higher revenue growth, cost cuts and an improved order pipeline.
Positions in financial services also aided returns, led by South Korean Hana Financial Group, Italy’s Intesa Sanpaolo and Dutch insurer Aegon, whose shares rose on improved earnings and capital position.
Other notable contributors were French pharmaceutical firm Sanofi, oil & gas companies Eni (Italy) and Repsol (Spain), as well as South Korean steel manufacturer POSCO. From a country perspective, the Fund benefited from holdings in Switzerland and off-index allocations to emerging markets, especially Brazil and South Korea.
Meanwhile, holdings in consumer discretionary appreciated, but not as much as the benchmark, thus weighing on relative returns. Similarly, positions in information technology (IT), which were flat in the period, underperformed the benchmark’s IT allocation.
The Fund’s cash position hurt relative returns in a rising market. We continue to exercise patience and caution when evaluating opportunities. Our cash will enable us to act quickly when we uncover potentially undervalued companies.
From a country standpoint, holdings in France detracted from relative returns, as did allocation to Sweden. Notable detractors included French retailer Carrefour and media company Publicis Groupe, as well as Swedish telecommunication equipment firm Ericsson. Additionally, South Korean auto components manufacturer Hyundai Mobis, Japanese pharmaceutical firm Taisho Pharmaceutical and U.K.-based home improvement retailer Kingfisher declined.
New purchases included Intesa Sanpaolo, pharmaceutical firms AstraZeneca (United Kingdom) and Astellas Pharma (Japan), as well as British advertising agency WPP Group. The investment committee also initiated positions in Russian mobile operator Mobile TeleSystems, South African bank Barclays Africa and Mexico’s Fibra Uno.
A Fibra (Fideicomiso de Infraestructura y Bienes Raíces) is an investment vehicle in Mexico that has similarities to a real estate investment trust (REIT) in the United States.
Fibra Uno (FUNO) is a Mexican trust formed primarily to acquire, own, develop and operate a broad range of commercial real estate in Mexico, including industrial, retail and office properties. FUNO has selectively assembled a
2
Brandes International Equity Fund
diversified portfolio of high-quality, well-located, income-producing commercial properties. The trust began trading on the Mexican stock exchange in 2011 and is the first — also currently the largest — publicly listed Fibra.
Over the past few years, FUNO’s shares have been under pressure, mainly due to the peso depreciation, which negatively affected the company’s real estate value and peso-denominated rental revenues. FUNO has more U.S. dollar-denominated debt than revenues; however, from a debt servicing perspective, it has what we consider solid revenue coverage of interest expense in U.S. dollars. Moreover, FUNO has predominantly long-term debt with a fixed interest rate. Hence, we believe FUNO should be relatively resilient against rising rates.
The selloff in FUNO’s shares was magnified by the election of Donald Trump as U.S. President, creating what we considered a good entry point for investment. In our view, FUNO’s positive attributes include:
| • | Strong earnings growth prospects through a sizeable development pipeline |
| • | A solid balance sheet and a seasoned management team |
| • | An income stream which is “inflation protected” as rents are contractually tied to inflation |
| • | Attractive dividend yield |
When we purchased FUNO, the company traded not only below our conservative estimate of its net assets value, but also less than its original initial public offering (IPO) price in U.S. dollars. At the time of its IPO, FUNO was less diversified than it is today and was operating in a developing industry that was untested. Moreover, while the market seems focused on U.S. policy concerns, we appreciate that the company’s property portfolio has limited direct exposure to major exporters to the United States. We also like that management continues to demonstrate strong capital allocation, with a conservative balance sheet that should enable the company to be opportunistic, in our view, if the market conditions in Mexico weaken further.
Other activity included the divestments of Japanese imaging company Canon and Irish construction materials manufacturer CRH. The investment committee also exited the Fund’s position in TIM Participacoes (TSU), the fourth-largest Brazilian telecommunications firm by sales and the second-largest by wireless subscribers.
We first took a small position in TSU in the mid 2000’s. We were attracted by its 17% free-cash-flow yield, and the fact that the Brazilian telecommunications market was still in the early stages of growth, with wireless penetration at only 30%.
At the time, TSU’s shares were under pressure from concerns about unfavorable treatment of minority shareholders by TSU’s controlling shareholder, Telecom Italia. Through multiple transactions over the last 10 years, the company was increasingly consolidated into Telecom Italia’s Brazilian holdings. Many of the
3
Brandes International Equity Fund
transactions were value destructive for minority shareholders, although not to the extent the market originally feared, in our opinion. Despite these challenges, we believed TSU’s attractive price, combined with the potential growth in TSU’s underpenetrated market, warranted an investment.
We added to our position in TSU, notably in 2008 and 2012, when valuations became more attractive. We pared our allocation in early 2014 after the company’s share price appreciated significantly. In 2015 and 2016, the company endured a deep economic recession in Brazil, sending its share price to a level that reflected a significant discount to our estimate of intrinsic value. Accordingly, we increased our position.
In the past year, TSU enjoyed renewed investor interest due largely to improved operations, which enabled the company to grow its revenue, as well as positive industry developments and rumors of a possible acquisition. As TSU’s shares became fully valued based on our analysis, we exited our position.
Outlook
As of September 30, 2017, the Fund’s largest overweight positions were in emerging markets, France, and Italy. From an industry standpoint, the Fund held key overweights in pharmaceuticals, oil, gas & consumable fuels, and food retailing.
We maintained underweight positions to companies based in Germany and Australia, as well in the industrials, materials and real estate sectors.
Meanwhile, we have increasingly found investment opportunities in the consumer discretionary sector. As of September 30, the Fund held a higher allocation to the sector than the benchmark, after having an equal weight a year prior. The automobile and auto component industries continued to represent our most significant allocations, but more recently, we have started to find new opportunities in the media industry, as exemplified by our positions in Publicis and WPP Group.
Events across the globe this year may serve as a good reminder that macroeconomic and geopolitical factors can affect individual businesses differently. As one of the first asset managers to bring a global perspective to value investing, Brandes relies on an established research infrastructure that enables us to analyze how each company may be affected by events globally. Our analyst teams have extensive knowledge of industries worldwide, and each team member’s perspective allows us to think and invest independently from the market consensus.
Thank you for your business and continued trust.
Sincerely yours,
The Brandes International Large-Cap Investment Committee
Brandes Investment Trust
Because the values of the Fund’s investments will fluctuate with market conditions, so will the value of your investment in the Fund. You could lose
4
Brandes International Equity Fund
money on your investment in the Fund, or the Fund could underperform other investments. The values of the Fund’s investments fluctuate in response to the activities of individual companies and general stock market and economic conditions. In addition, the performance of foreign securities depends on the political and economic environments and other overall economic conditions in the countries where the Fund invests. Emerging country markets involve greater risk and volatility than more developed markets. Some emerging markets countries may have fixed or managed currencies that are not free-floating against the U.S. dollar. Certain of these currencies have experienced, and may experience in the future, substantial fluctuations or a steady devaluation relative to the U.S. dollar.
Past performance is not a guarantee of future results.
Dividend Yield: Dividends per share divided by price per share.
Free Cash Flow: Total cash flow from operations less capital expenditures.
Free Cash Flow Yield: Free cash flow per share divided by price per share.
Intrinsic Value: The actual value of a company or an asset based on an underlying perception of its true value.
The declaration and payment of shareholder dividends are solely at the discretion of the issuer and are subject to change at any time.
Please refer to the Schedule of Investments in the report for complete holdings information. Fund holdings, geographic allocations and/or sector allocations are subject to change at any time and are not considered a recommendation to buy or sell any security.
The foregoing reflects the thoughts and opinions of Brandes Investment Partners® exclusively and is subject to change without notice. Brandes Investment Partners® is a registered trademark of Brandes Investment Partners, L.P. in the United States and Canada.
Must be preceded or accompanied by a prospectus.
Index Guide
The MSCI EAFE Index with net dividends captures large and mid cap representation of developed market countries excluding the U.S. and Canada.
MSCI has not approved, reviewed or produced this report, makes no express or implied warranties or representations and is not liable whatsoever for any data in the report. You may not redistribute the MSCI data or use it as a basis for other indices or investment products.
One cannot invest directly in an index.
The Brandes International Equity Fund is distributed by ALPS Distributors, LLC.
5
Brandes International Equity Fund
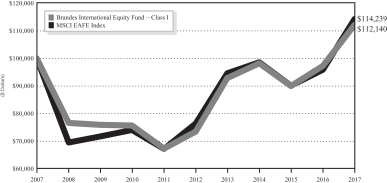
The following chart compares the value of a hypothetical $100,000 investment in the Brandes International Equity Fund – Class I from September 30, 2007 to September 30, 2017 with the value of such an investment in the MSCI EAFE (Europe, Australasia and Far East) Index for the same period.
Value of $100,000 Investment vs MSCI EAFE (Europe, Australasia and Far East) Index (Unaudited)
| Average Annual Total Return Periods Ended September 30, 2017 | ||||||||||||||||
| One Year | Five Years | Ten Years | Since Inception(1) | |||||||||||||
Brandes International Equity Fund | ||||||||||||||||
Class A* | 15.07 | % | 8.61 | % | 0.97 | % | 7.99 | % | ||||||||
Class A* (with maximum sales charge) | 8.44 | % | 7.33 | % | 0.37 | % | 7.68 | % | ||||||||
Class C* | 14.19 | % | 7.81 | % | 0.18 | % | 7.16 | % | ||||||||
Class I | 15.33 | % | 8.83 | % | 1.15 | % | 8.22 | % | ||||||||
Class R6* | 15.48 | % | 8.93 | % | 1.22 | % | 8.29 | % | ||||||||
MSCI EAFE (Europe, Australasia, and Far East) Index | 19.10 | % | 8.38 | % | 1.34 | % | 4.93 | % | ||||||||
| (1) | The inception date is January 2, 1997. |
| * | Performance shown prior to January 31, 2011 for Class A shares reflects the performance of Class I shares adjusted to reflect Class A expenses. Performance shown prior to January 31, 2013 for Class C shares reflects the performance of Class I shares adjusted to reflect Class C expenses. Performance shown prior to February 1, 2016 for Class R6 shares reflects the performance of Class I shares adjusted to reflect Class R6 expenses. |
Performance data quoted represents past performance; past performance does not indicate future results. The investment return and principal value of an investment will fluctuate so that an investor’s shares, when redeemed, may be worth more or
6
Brandes International Equity Fund
less than their original cost. Current performance of the Fund may be lower or higher than the performance quoted. Performance data current to the most recent month end may be obtained by calling 800-331-2979.
The returns shown do not reflect the deduction of taxes that a shareholder would pay on Fund distributions or the redemption of Fund shares. The Advisor has a fee waiver arrangement in place to limit the Fund’s annual operating expenses.
Sector Allocation as a Percentage of Total Investments as of
September 30, 2017 (Unaudited)
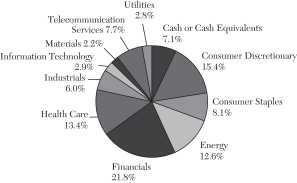
The sector classifications represented in the graph above and industry classifications represented in the Schedule of Investments are in accordance with Global Industry Classification Standard (GICS®), which was developed by and/or is the exclusive property of MSCI, Inc. and Standard & Poor Financial Services LLC.
7
Dear Fellow Investor,
The net asset value of the Brandes Global Equity Fund (Class I Shares) rose 17.48% in the 12 months ended September 30, 2017. For the same period, the MSCI World Index increased 18.17%.
A number of U.S.-based financial services holdings significantly boosted absolute performance, most notably Citigroup, Bank of America, State Street and PNC Financial Services. These firms appreciated on the back of improved earnings and the potential benefit of U.S. interest-rate hikes.
Additionally, several U.S.-based banks announced increased dividends and share repurchase authorizations following the results of the Federal Reserve’s stress tests and comprehensive capital analysis and review, which measures the capital adequacy and planning processes of the largest U.S. banks. Citigroup announced it would double its dividend and repurchase over $15 billion of its shares.
Other top contributors included South Korea-based Samsung Electronics and France-based pharmaceutical firm Sanofi.
The Fund’s most significant return detractors relative to its benchmark were Sweden-based telecommunications equipment firm Ericsson, South Korea-based auto components manufacturer Hyundai Mobis, U.K.-based pharmaceutical firm GlaxoSmithKline and U.S.-based pharmacy benefit manager Express Scripts.
Ericsson declined after reporting weaker earnings. However, the company announced plans to reduce costs to improve margins. Hyundai Mobis’ share price fell on the back of slowing Chinese demand, which was in part due to political tensions between South Korea and China.
A significant headwind to relative performance in the first nine months of calendar year 2017 had been value stocks’ underperformance versus growth stocks, as measured by the MSCI World Value Index and the MSCI World Growth Index. Although value stocks posted strong returns in the second half of 2016, they lagged growth stocks in the first nine months of 2017 by more than 800 basis points, wiping out the relative outperformance from 2016.
While the Fund generated strong absolute performance, it underperformed the broader MSCI World Index in a significantly appreciating global market. The primary drivers of underperformance included:
| • | Holdings in the health care sector |
This was led by the share-price drop in U.S.-based Express Scripts
| • | European retailers |
The Fund’s European food retailer holdings were roughly flat for the first three quarters of 2017, thus detracting from relative returns in a rising market.
8
Brandes Global Equity Fund
| • | Conservative cash position |
Although the Fund’s cash position declined slightly after the investment committee redeployed some capital, it weighed on relative returns in a rising market. We continue to exercise patience and caution when evaluating opportunities and our cash position will enable us to act quickly when we uncover potentially undervalued companies.
In a fairly busy period for buys and sells, the Fund’s Investment Committee initiated several positions, including U.K.-based Kingfisher, Imperial Brands and WPP Group, as well as U.S.-based Cardinal Healthcare and HCA Healthcare.
Kingfisher is Europe’s largest and the world’s third-largest home improvement retailer, operating in 10 countries across Europe. The company’s most important markets are the United Kingdom, France and Poland. Kingfisher has faced challenges in the aftermath of the Brexit vote and increased competition in key markets. We took advantage of Kingfisher’s share-price decline to initiate a position in the company.
An industry leader in Europe, Kingfisher has nonetheless been less profitable than many of its peers in other regions, most notably U.S. home improvement stores Home Depot and Lowes. Additionally, the company also faces long-term challenges, most significantly from increasing competition from online and other brick-and-mortar retailers.
The company has embarked on restructuring efforts in order to improve operations. The moves have shown positive results, putting the company on course to pursue its long-term goals. We believe while it is unlikely that Kingfisher will be able to match its U.S. peers in terms of profitability, it has enough room for improvement to help offset the near-term cyclical issues in the United Kingdom.
HCA Healthcare is the largest for-profit hospital operator in the United States, where it has operations across 20 states and 5% of total hospital admissions. It also has a presence in the United Kingdom. The company has been weighed down by the uncertainty surrounding U.S. health care policy and reimbursement pressures for care and services. However, it is our view that these concerns have been more than priced into HCA, which traded at 12x free cash flow as of September 30.
We believe the company is an attractive investment due to its history of strong cash flows and returns on capital. Additionally, we are attracted to the company’s stable and recurring earnings, as well as its reasonable growth prospects.
Meanwhile, the Fund’s investment committee divested several positions that reached our estimates of intrinsic value. These included Latin American telecommunication services companies TIM Participacoes and America Movil, U.S.-based Exelon and Xilinx, as well as resorts operator Genting Malaysia.
9
Brandes Global Equity Fund
Outlook
As of September 30, the Brandes Global Equity Fund exhibited more attractive valuation characteristics, in our opinion, and a higher dividend yield than the MSCI World Index.
Allocations to emerging markets, France and the United Kingdom represented the largest overweights. From an industry standpoint, key areas of exposure were in financials, pharmaceuticals, oil & gas, food retailing and automobiles.
The Fund maintained its largest underweight in the United States. On the sector level, significant under-allocations were in industrials, materials and technology.
We continued to reduce our information technology allocation, which was less than half the benchmark’s weight as of September 30. At the same time, we increasingly found value potential in the health care sector as our allocation increased to almost 19% compared to over 12% for the MSCI World Index. While we maintained a significant exposure to pharmaceuticals, the main driver of the increased allocation has been health care service companies, such as drug distributor Cardinal Health and hospital operator HCA Healthcare (see commentary above).
As market dynamics constantly present challenges and opportunities, Brandes maintains a disciplined process of stock selection based on fundamental, detailed research on companies throughout the world. We are always focused on company valuations and margin of safety — because we believe this careful approach is the most prudent way to pursue growth for the Fund over the long term.
Thank you, as always, for your business and continued trust.
Sincerely yours,
The Brandes Global Large-Cap Investment Committee
Brandes Investment Trust
Because the values of the Fund’s investments will fluctuate with market conditions, so will the value of your investment in the Fund. You could lose money on your investment in the Fund, or the Fund could underperform other investments. The values of the Fund’s investments fluctuate in response to the activities of individual companies and general stock market and economic conditions. In addition, the performance of foreign securities depends on the political and economic environments and other overall economic conditions in the countries where the Fund invests. Emerging country markets involve greater risk and volatility than more developed markets. Some emerging markets countries may have fixed or managed currencies that are not free-floating against the U.S. dollar. Certain of these currencies have experienced, and may experience in the future, substantial fluctuations or a steady devaluation relative to the U.S. dollar.
Past performance is not a guarantee of future results.
10
Brandes Global Equity Fund
Basis Point: 1/100 of 1%.
Book Value: Assets minus liabilities. Also known as shareholders’ equity.
Free Cash Flow: Total cash flow from operations less capital expenditures.
Intrinsic Value: The actual value of a company or an asset based on an underlying perception of its true value.
Margin of Safety: The discount of a security’s market price to what the firm believes is the intrinsic value of that security.
Yield: Annual income from the investment (dividend, interest, etc.) divided by the current market price of the investment.
Please refer to the Schedule of Investments in the report for complete holdings information. Fund holdings, geographic allocations and/or sector allocations are subject to change at any time and are not considered a recommendation to buy or sell any security.
The foregoing reflects the thoughts and opinions of Brandes Investment Partners® exclusively and is subject to change without notice. Brandes Investment Partners® is a registered trademark of Brandes Investment Partners, L.P. in the United States and Canada.
Must be preceded or accompanied by a prospectus.
Index Guide
The MSCI World Index with net dividends measures equity market performance of developed markets.
The MSCI World Value Index with net dividends captures large and mid cap securities across developed market countries exhibiting value style characteristics, defined using book value to price, 12-month forward earnings to price, and dividend yield.
The MSCI World Growth Index with gross dividends captures large and mid cap securities across developed market countries exhibiting growth style characteristics, defined using long-term forward earnings per share (EPS) growth rate, short-term forward EPS growth rate, current internal growth rate, long-term historical EPS growth trend, and long-term historical sales per share growth trend.
MSCI has not approved, reviewed or produced this report, makes no express or implied warranties or representations and is not liable whatsoever for any data in the report. You may not redistribute the MSCI data or use it as a basis for other indices or investment products.
One cannot invest directly in an index
The Brandes Global Equity Fund is distributed by ALPS Distributors, LLC.
11
Brandes Global Equity Fund
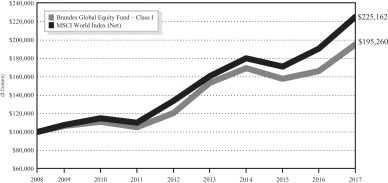
The following chart compares the value of a hypothetical $100,000 investment in the Brandes Global Equity Fund – Class I from its inception (October 6, 2008) to September 30, 2017 with the value of such an investment in the MSCI World Index for the same period.
Value of $100,000 Investment vs MSCI World Index (Unaudited)
| Average Annual Total Return Periods Ended September 30, 2017 | ||||||||||||||||
| One Year | Three Years | Five Years | Since Inception(1) | |||||||||||||
Brandes Global Equity Fund | ||||||||||||||||
Class A* | 17.20 | % | 4.61 | % | 9.85 | % | 7.50 | % | ||||||||
Class A* (with maximum sales charge) | 10.48 | % | 2.56 | % | 8.55 | % | 6.79 | % | ||||||||
Class C* | 16.31 | % | 3.84 | % | 9.04 | % | 6.67 | % | ||||||||
Class I | 17.48 | % | 4.87 | % | 10.12 | % | 7.73 | % | ||||||||
MSCI World Index | 18.17 | % | 7.69 | % | 10.99 | % | 9.46 | % | ||||||||
| (1) | The inception date is October 6, 2008. |
| * | Performance shown prior to January 31, 2011 for Class A shares reflects the performance of Class I shares adjusted to reflect Class A expenses. Performance shown prior to January 31, 2013 for Class C shares reflects the performance of Class I shares adjusted to reflect Class C expenses. |
Performance data quoted represents past performance; past performance does not indicate future results. The investment return and principal value of an investment will fluctuate so that an investor’s shares, when redeemed, may be worth more or less than their original cost. Current performance of the Fund may be lower or higher than the performance quoted. Performance data current to the most recent month end may be obtained by calling 800-331-2979.
12
Brandes Global Equity Fund
The returns shown do not reflect the deduction of taxes that a shareholder would pay on fund distributions or the redemption of fund shares. The Advisor has a fee waiver arrangement in place to limit the Fund’s annual operating expenses.
Sector Allocation as a Percentage of Total Investments as of
September 30, 2017 (Unaudited)
The sector classifications represented in the graph above and industry classifications represented in the Schedule of Investments are in accordance with Global Industry Classification Standard (GICS®), which was developed by and/or is the exclusive property of MSCI, Inc. and Standard & Poor Financial Services LLC.
13
Brandes Global Equity Income Fund
Dear Fellow Investor,
The net asset value of the Brandes Global Equity Income Fund (Class I Shares) rose 16.71% in the 12 months ended September 30, 2017. For the same period, the MSCI World Index increased 18.17%.
The Fund’s holdings in emerging markets, France and in the energy sector significantly boosted absolute performance.
Within emerging markets, notable contributors included South Korea-based Samsung Electronics, Chilean electric utility Enel Chile, as well as Brazil-based telecommunications firm Telefonica Brasil and water utility Companhia Paranaense de Energia (Copel).
In France, positive contributors included pharmaceutical firm Sanofi, luxury goods company LVMH, electrical equipment supplier Schneider Electric and utility company Engie.
Several holdings in the energy sector advanced in the third quarter, offsetting the declines from the first and second quarters of 2017, as they benefited from the rise in oil prices and improved earnings. The Fund’s energy holdings outperformed the energy sector of the MSCI World Index. Top contributors were Netherlands-based Royal Dutch Shell, Italy-based ENI, U.K.-based BP, France-based Total and U.S.-based Chevron.
Other contributors included U.S.-based PNC Financial, Western Digital (sold in the second quarter), Microsoft and Wells Fargo.
A significant headwind to relative performance in the first nine months of calendar year 2017 had been value stocks’ underperformance versus growth stocks, as measured by the MSCI World Value Index and the MSCI World Growth Index. Although value stocks posted strong returns in the second half of 2016, they lagged growth stocks in the first nine months of 2017 by more than 800 basis points, wiping out the relative outperformance from 2016.
While the Fund’s absolute performance was strong, the Fund underperformed the broader MSCI World Index in a significantly appreciating global market. The primary drivers of underperformance were:
| • | Holdings in the health care sector |
Including drug distributor Cardinal Health and pharmaceutical firm GlaxoSmithKline
| • | European retailers |
The Fund’s European food retailer holdings were roughly flat for much of the period, thus detracting from relative returns in a rising market.
| • | Conservative cash position |
Although the Fund’s cash position declined slightly after the investment committee redeployed some capital, it weighed on relative returns in a
14
Brandes Global Equity Income Fund
rising market. We continue to exercise patience and caution when evaluating opportunities and our cash position will enable us to act quickly when we uncover potentially undervalued companies.
Sweden-based telecommunications equipment firm Ericsson also weighed on performance. The company’s share price declined after reporting weaker earnings on the back of a lull in demand for wireless network equipment from carriers. However, it announced plans to reduce costs to improve margins.
We believe despite the currently weak carrier spending environment, Ericsson should see its profitability pick up if spending starts to recover from its current decline. Moreover, we hold the view that the company remains well positioned to benefit from an industry consolidation that has occurred over the last several years.
Throughout the fiscal year, the Fund’s Investment Committee initiated positions in companies exhibiting appealing valuations relative to our intrinsic value estimates and those with attractive dividend yield.
New additions included WPP Group, the world’s largest ad agency holding company by revenue. Its brands include Ogilvy & Mather, JWT, Young & Rubicam, Grey, Group M and Kantar.
In our opinion, the business model of ad agencies is attractive and resilient amid changing economic conditions, given their variable-cost nature and technological neutrality (i.e., generally limited disruption from how ads are viewed). Over the past year, organic revenue growth for the ad agency industry has slowed, in part due to tough comparisons with 2016, a year that saw elevated ad spending related to the Summer Olympics in Brazil and the U.S. presidential election.
A number of factors have contributed to a contraction in valuation multiples for the ad agency industry, including:
| • | Slowing topline growth |
| • | Reduced ad spending by consumer packaged goods companies |
| • | Concerns about evolving technological and competitive landscape |
These concerns, which we view as short term in nature and overdone in magnitude, have created several potentially undervalued investment opportunities.
Among large, publicly listed ad agency holding companies, WPP has leading exposures to potential growth from the digital space and from emerging markets. We are attracted to the company’s strong business model, healthy cash flows and steady pace of shareholder returns. Moreover, the stock’s recent underperformance has led to an appealing valuation, in our view. The company traded at just 11x forward earnings as of September 30 and had a 4.0% dividend yield.
The investment committee also purchased Switzerland-based financial firm Credit Suisse (with a dividend yield of 4.5% as of September 30).
15
Brandes Global Equity Income Fund
The second-largest bank in Switzerland, Credit Suisse possesses one of the strongest private-banking and wealth-management platforms in the world, offering leverage to wealth creation in emerging markets. We are attracted to the appealing growth potential of the company’s businesses and its improved capital position. At current valuation levels, we feel Credit Suisse’s strengths are underappreciated by the market.
Other Fund activity included the sale of Switzerland-based luxury goods firm Richemont, as well as U.S.-based computer data storage firm Western Digital and semiconductor company Xilinx. These companies’ share prices rose toward our intrinsic value estimates.
Outlook
As of September 30, the Brandes Global Equity Income Fund exhibited more appealing valuations than the benchmark, in our opinion. The Fund also had a higher dividend yield of 3.9% compared to 2.4% for the MSCI World Index.
Allocations to emerging markets, France and the United Kingdom represented the Fund’s largest overweights. From an industry standpoint, key areas of exposure were in pharmaceuticals, oil & gas, food & staples retailing, capital markets and banks.
The Fund maintained its largest underweights in the United States and Japan. On the sector level, significant under-allocations were in industrials, information technology and materials.
We continued to reduce our information technology sector allocation, which was less than half the benchmark’s weight as of September 30. After having an overweight position in technology for several years, largely in what we called “boring” or mature technology companies mostly based in the United States, the Fund is now underweight the sector. Several companies from this group have had strong share-price appreciation, moving closer to or exceeding our intrinsic value estimates. Consequently, the investment committee decided to pare or sell several of our tech holdings over the past year. While the Fund’s recent underweight has hurt relative performance, it is not surprising that we are starting to find fewer value opportunities in a sector that has performed so well.
As market dynamics constantly present challenges and opportunities, Brandes maintains a disciplined process of stock selection based on fundamental, detailed research on companies throughout the world. For the Fund, we are always focused on company valuations and margin of safety with an additional consideration for yield and the potential for dividend growth. We believe this careful approach is the most prudent way to pursue growth and income for the Fund over the long term.
Thank you for your business and continued trust.
Sincerely yours,
The Brandes Global Large-Cap Investment Committee
Brandes Investment Trust
16
Brandes Global Equity Income Fund
Because the values of the Fund’s investments will fluctuate with market conditions, so will the value of your investment in the Fund. You could lose money on your investment in the Fund, or the Fund could underperform other investments. The values of the Fund’s investments fluctuate in response to the activities of individual companies and general stock market and economic conditions. In addition, the performance of foreign securities depends on the political and economic environments and other overall economic conditions in the countries where the Fund invests. Emerging country markets involve greater risk and volatility than more developed markets. Some emerging markets countries may have fixed or managed currencies that are not free-floating against the U.S. dollar. Certain of these currencies have experienced, and may experience in the future, substantial fluctuations or a steady devaluation relative to the U.S. dollar. Growth stocks typically are more volatile than value stocks; however, value stocks have a lower expected growth rate in earnings and sales.
Past performance is not a guarantee of future results.
Basis Point: 1/100 of 1%.
Book Value: Assets minus liabilities. Also known as shareholders’ equity.
Free Cash Flow: Total cash flow from operations less capital expenditures.
Intrinsic Value: The actual value of a company or an asset based on an underlying perception of its true value.
Margin of Safety: The discount of a security’s market price to what the firm believes is the intrinsic value of that security.
Yield: Annual income from the investment (dividend, interest, etc.) divided by the current market price of the investment.
SEC 30-Day Yield (Class I Shares): 2.82% (subsidized); -12.76% (unsubsidized). This calculation is based on a 30-day period ending on the last day of the month shown. It is computed by dividing the net investment income per share earned during the period by the maximum offering price per share on the last day of the period. The yield figure reflects the dividends and interest earned during the period, after the deduction of the fund expenses. A subsidized yield takes into consideration the expenses paid by the advisor.
Please refer to the Schedule of Investments in the report for complete holdings information. Fund holdings, geographic allocations and/or sector allocations are subject to change at any time and are not considered a recommendation to buy or sell any security.
The declaration and payment of shareholder dividends are solely at the discretion of the issuer and are subject to change at any time.
17
Brandes Global Equity Income Fund
The foregoing reflects the thoughts and opinions of Brandes Investment Partners® exclusively and is subject to change without notice. Brandes Investment Partners® is a registered trademark of Brandes Investment Partners, L.P. in the United States and Canada.
Must be preceded or accompanied by a prospectus.
Index Guide
The MSCI World Index with net dividends measures equity market performance of developed markets.
The MSCI World Value Index with net dividends captures large and mid cap securities across developed market countries exhibiting value style characteristics, defined using book value to price, 12-month forward earnings to price, and dividend yield.
The MSCI World Growth Index with gross dividends captures large and mid cap securities across developed market countries exhibiting growth style characteristics, defined using long-term forward earnings per share (EPS) growth rate, short-term forward EPS growth rate, current internal growth rate, long-term historical EPS growth trend, and long-term historical sales per share growth trend.
MSCI has not approved, reviewed or produced this report, makes no express or implied warranties or representations and is not liable whatsoever for any data in the report. You may not redistribute the MSCI data or use it as a basis for other indices or investment products.
One cannot invest directly in an index.
The Brandes Global Equity Income Fund is distributed by ALPS Distributors, LLC.
18
Brandes Global Equity Income Fund
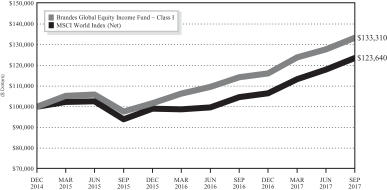
The following chart compares the value of a hypothetical $100,000 investment in the Brandes Global Equity Income Fund – Class I from its inception (December 31, 2014) to September 30, 2017 with the value of such an investment in the MSCI World Index for the same period.
Value of $100,000 Investment vs MSCI World Index (Unaudited)
| Average Annual Total Return Periods Ended September 30, 2017 | ||||||||
| One Year | Since Inception(1) | |||||||
Brandes Global Equity Income Fund | ||||||||
Class A | 18.81 | % | 11.84 | % | ||||
Class A (with maximum sales charge) | 11.96 | % | 9.46 | % | ||||
Class C | 16.01 | % | 10.19 | % | ||||
Class I | 16.71 | % | 11.03 | % | ||||
MSCI World Index | 18.17 | % | 8.03 | % | ||||
| (1) | The inception date is December 31, 2014. |
Performance data quoted represents past performance; past performance does not indicate future results. The investment return and principal value of an investment will fluctuate so that an investor’s shares, when redeemed, may be worth more or less than their original cost. Current performance of the Fund may be lower or higher than the performance quoted. Performance data current to the most recent month end may be obtained by calling 800-331-2979.
19
Brandes Global Equity Income Fund
The returns shown do not reflect the deduction of taxes that a shareholder would pay on fund distributions or the redemption of fund shares. The Advisor has a fee waiver arrangement in place to limit the Fund’s annual operating expenses.
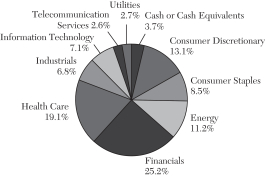
Sector Allocation as a Percentage of Total Investments as of September 30, 2017 (Unaudited)
The sector classifications represented in the graph above and industry classifications represented in the Schedule of Investments are in accordance with Global Industry Classification Standard (GICS®), which was developed by and/or is the exclusive property of MSCI, Inc. and Standard & Poor Financial Services LLC.
20
Brandes Global Opportunities Value Fund
Dear Fellow Investor,
The net asset value of the Brandes Global Opportunities Value Fund (Class I Shares) rose 16.91% in the 12 months ended September 30, 2017. For the same period, the MSCI ACWI (All Country World) Index advanced 18.65%.
Allocations to financials, especially banks, and industrials, led by holdings in machinery, helped performance significantly. The Fund also benefited from positions in health care and consumer staples. From a country standpoint, holdings in the United States, where we held a significant underweight, boosted absolute and relative returns, as did positions in Brazil.
Notable performers included U.S.-based banks Citigroup and Bank of America, as well as engine manufacturer Briggs & Stratton. Additionally, Brazilian regional jet manufacturer Embraer, South Korean Samsung, Austria-domiciled Erste Group Bank and Russian Sberbank contributed positively to returns.
Holdings in consumer discretionary appreciated, but not as much as the benchmark, thus detracting from relative returns. Similarly, positions in information technology, where we held a significant underweight, helped absolute returns but underperformed the benchmark’s sector allocation.
Moreover, the Fund’s cash position hurt performance in a rising market. The investment committee continues to exercise patience and caution when evaluating opportunities. Our cash will enable us to act quickly when we uncover potentially undervalued companies.
At the company level, notable detractors included U.K.-based real estate firm Countrywide, South Korean auto components manufacturer Hyundai Mobis, Hong Kong-based satellite operator APT Satellite Holdings and French retailer Carrefour.
New purchases included U.S.-based pharmaceuticals distributor McKesson and pharmacy benefit manager Express Scripts, Chinese telecommunication company China Mobile, Irish beverage company C&C Group, and French advertising agency Publicis Groupe.
Publicis is the world’s third-largest global advertising agency holding company. It owns many of the industry’s most valuable brands, such as Saatchi & Saatchi, Leo Burnett, Razorfish, ZenithOptimedia and Starcom MediaVest. The ad agency has historically been a well-run company with a sound balance sheet and industry-leading margins.
In our opinion, the business model of ad agencies is attractive and resilient given their variable-cost nature and technological neutrality (i.e., generally limited disruption from how ads are viewed). Over the past year, organic revenue growth for the ad agency industry has slowed, in part due to tough comparisons with 2016, a year that saw elevated ad spending related to the Summer Olympics in Brazil and the U.S. presidential election.
21
Brandes Global Opportunities Value Fund
A number of factors have contributed to a contraction in valuation multiples for the ad agency industry, including:
| • | Slowing topline growth |
| • | Reduced ad spending by fast-moving consumer goods (FMCG) companies. FMCG is composed of products that tend to have short shelf lives, such as packaged foods, beverages and toiletries. |
| • | Concerns about evolving technological and competitive landscape |
These concerns, which we view as short term in nature and overdone in magnitude, have created several potentially undervalued investment opportunities.
Market concerns for Publicis include slowing organic growth, a handful of recent account losses and its acquisition of Sapient (its largest acquisition to date), which was seen as expensive.
We believe excessive short-term pessimism centered on these recent missteps has created an attractive entry point in Publicis’ shares for long-term investors. Historically, Publicis management has displayed, in our opinion, an admirable track record of profitability, earnings growth, operational execution and successful acquisition integration. We do not view recent client losses and the potential overpayment for Sapient as evidence of permanent structural changes in the business, and we believe Publicis is well positioned to return to levels of growth in line with its peers. Given its strong free-cash-flow generation, we also expect the company will quickly de-lever its balance sheet.
During the period, the investment committee also purchased shares of Mexico-based real estate investment trust Fibra Uno and U.K.-based Kingfisher, Europe’s largest and the world’s third-largest home improvement retailer.
Kingfisher operates in 10 countries across Europe, where the company’s most important markets are the United Kingdom, France and Poland. Kingfisher has faced challenges in the aftermath of the Brexit vote (the United Kingdom’s decision to leave the European Union) and increased competition in key markets. We took advantage of Kingfisher’s share-price decline to initiate a position in the company.
An industry leader in Europe, Kingfisher has nonetheless been less profitable than many of its peers in other regions, most notably U.S. home improvement stores Home Depot and Lowes. Additionally, the company also faces long-term challenges, most significantly increasing competition from online and other brick-and-mortar retailers.
In 2008, Kingfisher appointed a new chief executive officer and began a restructuring effort to improve operations. The move has shown positive results, putting the company on course to pursue its long-term goals. We believe that while it is unlikely Kingfisher will be able to match its U.S. peers in terms of profitability, it has enough room for improvement to help offset the near-term cyclical issues in the United Kingdom.
22
Brandes Global Opportunities Value Fund
Other activity included the divestments of U.S.-based computer data storage company Western Digital and oil company Chesapeake Energy, South Korean bank KB Financial Group, and Brazilian telecommunications firm TIM Participacoes.
Outlook
As of September 30, 2017, the Fund held key overweights in real estate and consumer discretionary, and key underweights in information technology and financials.
We maintained a large underweight in the United States and a notable overweight in the United Kingdom. We also continued to find many value opportunities in emerging markets. The region accounted for about a third of the Fund as of September 30, with Brazil and South Korea representing key areas of exposure.
Events across the globe this year may serve as a good reminder that macroeconomic and geopolitical factors can affect individual businesses differently. As one of the first asset managers to bring a global perspective to value investing, Brandes relies on an established research infrastructure that enables us to analyze how each company may be affected by events globally. Our analyst teams have extensive knowledge of industries worldwide, and each team member’s perspective allows us to think and invest independently from the market consensus.
Thank you for your business and continued trust.
Sincerely yours,
The Brandes All-Cap Investment Committee
Brandes Investment Trust
Because the values of the Fund’s investments will fluctuate with market conditions, so will the value of your investment in the Fund. You could lose money on your investment in the Fund, or the Fund could underperform other investments. The values of the Fund’s investments fluctuate in response to the activities of individual companies and general stock market and economic conditions. In addition, the performance of foreign securities depends on the political and economic environments and other overall economic conditions in the countries where the Fund invests. Emerging country markets involve greater risk and volatility than more developed markets. Some emerging markets countries may have fixed or managed currencies that are not free-floating against the U.S. dollar. Certain of these currencies have experienced, and may experience in the future, substantial fluctuations or a steady devaluation relative to the U.S. dollar.
Past performance is not a guarantee of future results.
Free Cash Flow: Total cash flow from operations less capital expenditures.
23
Brandes Global Opportunities Value Fund
Please refer to the Schedule of Investments in the report for complete holdings information. Fund holdings, geographic allocations and/or sector allocations are subject to change at any time and are not considered a recommendation to buy or sell any security.
The foregoing reflects the thoughts and opinions of Brandes Investment Partners® exclusively and is subject to change without notice. Brandes Investment Partners® is a registered trademark of Brandes Investment Partners, L.P. in the United States and Canada.
Must be preceded or accompanied by a prospectus.
Index Guide
The MSCI ACWI with net dividends captures large and mid cap representation of developed and emerging markets.
MSCI has not approved, reviewed or produced this report, makes no express or implied warranties or representations and is not liable whatsoever for any data in the report. You may not redistribute the MSCI data or use it as a basis for other indices or investment products.
One cannot invest directly in an index.
The Brandes Global Opportunities Value Fund is distributed by ALPS Distributors, LLC.
24
Brandes Global Opportunities Value Fund
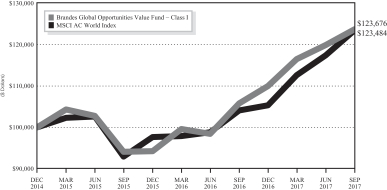
The following chart compares the value of a hypothetical $100,000 investment in the Brandes Global Opportunities Value Fund – Class I from its inception (December 31, 2014) to September 30, 2017 with the value of such an investment in the MSCI All Country World Index for the same period.
Value of $100,000 Investment vs MSCI All Country World Index (Unaudited)
| Average Annual Total Return Periods Ended September 30, 2017 | ||||||||
| One Year | Since Inception(1) | |||||||
Brandes Global Opportunities Value Fund | ||||||||
Class A | 16.66 | % | 7.95 | % | ||||
Class A (with maximum sales charge) | 9.95 | % | 5.65 | % | ||||
Class C | 15.80 | % | 7.14 | % | ||||
Class I | 16.91 | % | 8.04 | % | ||||
MSCI All Country World Index | 18.65 | % | 7.98 | % | ||||
| (1) | The inception date is December 31, 2014. |
Performance data quoted represents past performance; past performance does not indicate future results. The investment return and principal value of an investment will fluctuate so that an investor’s shares, when redeemed, may be worth more or less than their original cost. Current performance of the Fund may be lower or higher than the performance quoted. Performance data current to the most recent month end may be obtained by calling 800-331-2979.
25
Brandes Global Opportunities Value Fund
The returns shown do not reflect the deduction of taxes that a shareholder would pay on fund distributions or the redemption of fund shares. The Advisor has a fee waiver arrangement in place to limit the Fund’s annual operating expenses.
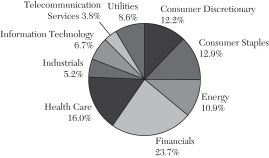
Sector Allocation as a Percentage of Total Investments as of September 30, 2017 (Unaudited)
The sector classifications represented in the graph above and industry classifications represented in the Schedule of Investments are in accordance with Global Industry Classification Standard (GICS®), which was developed by and/or is the exclusive property of MSCI, Inc. and Standard & Poor Financial Services LLC.
26
Brandes Emerging Markets Value Fund
Dear Fellow Investor,
The net asset value of the Brandes Emerging Markets Value Fund (Class I shares) increased 22.07% in the 12 months ended September 30, 2017. For the same period, the Fund’s benchmark, the MSCI Emerging Markets Index, gained 22.46%.
Holdings in financials (especially banks), industrials and consumer staples contributed positively to performance. From a country perspective, allocations to Brazil, Russia and Hong Kong helped returns. At the company level, notable contributors included banks Sberbank (Russia) and Erste Group (Austria), Brazil-based educational services provider Estacio Participacoes and South Korean technology company Samsung Electronics.
Additionally, Hong Kong-based luxury goods companies Luk Fook Holdings and Chow Tai Fook Jewellery aided performance, increasing over 70% each. These retailers benefited from the Chinese demand for luxury goods, which, after a couple of years of stagnation, has grown substantially in recent quarters amid China’s improved economic environment.
A significant underweight to information technology (IT), in which our holdings rose but not as much as those in the benchmark, hurt relative returns.
Contributions to the MSCI Emerging Markets Index’s return were extremely concentrated for the period. The top five performing stocks were IT companies and the IT sector accounted for 40% of index performance. The disproportionate contributions to the index’s return highlight, in our view, the importance of being selective when investing in emerging markets. The elevated prices — and valuations — of many emerging market IT businesses were the main reason we have been significantly underweight the sector.
Other detractors included holdings in real estate and our meaningful underweight to China, as well as positions in Turkey and South Korea.
At the security level, Turkish real estate investment trust (REIT) Emlak Konut and Chinese telecommunication services provider China Mobile weighed on performance. Moreover, South Korean automotive-related companies KIA Motors and Hyundai Mobis declined.
In a relatively busy period, the Emerging Markets Investment Committee initiated positions in financial services firms Barclays Africa (South Africa), Siam Commercial Bank (Thailand) and Prosegur Cash (Spain). Other new purchases included South Korean tobacco company KT&G Corp, Mexican REIT Fibra Uno and India-based IT services provider Tech Mahindra.
Serving approximately 12.5 million customers through more than 1,200 branches across Africa, Barclays Africa (BGA) is among the four largest banks in South Africa. U.K.-based Barclays acquired a controlling stake in BGA in 2005, and until recently, controlled over 62% of the company.
27
Brandes Emerging Markets Value Fund
A number of factors have pressured BGA’s shares and provided us with an attractive opportunity to invest, in our opinion. These headwinds included:
| • | Large overhang from ongoing divestment by Barclays: Barclays announced its divestment plans in March 2016 and subsequently sold about a 12% stake in May 2017 at a 9% discount to the last closing price prior to the sale. In order to deconsolidate BGA from a regulatory perspective, Barclays needs to reduce its current stake to below 20%. Losing Barclays’ brand and support could pose business risks and negatively affect employee morale. |
| • | South Africa’s political and economic instability: Following a major cabinet reshuffle, S&P and Fitch cut the country’s credit rating below investment grade in April 2017. |
We appreciate that BGA has a solid market share in South Africa’s banking industry, which is an oligopoly with high barriers to entry and strong competition. The company is also among the top three banks by revenue in other important markets, including Kenya, Ghana, Botswana and Zambia. Moreover, BGA’s healthy profitability and capital position, as well as its good cost control can help the company navigate its challenges, in our view. At its current price, we believe BGA offers an attractive long-term risk/reward tradeoff.
Other activities included the full sale of Brazilian wireless telecommunication services provider TIM Participacoes and real-estate developer Viver Inc E Construtora, Panamanian airline Copa Holdings, and Malaysian resorts operator Genting Malaysia.
Additionally, the investment committee exited the Fund’s position in Argentina-based Arcos Dorados, McDonald’s largest franchisee that operates in 20 countries across Latin America and the Caribbean, and counts Brazil as its biggest market.
We first added Arcos in late 2014, when its shares had fallen over 40% for the year, mainly due to weak earnings results for the second quarter of 2014. Concerns included challenged near-term cash flows resulting from economic difficulties in a number of Arcos’ end markets, aggressive expansion plans, and credit and liquidity weakness.
We believed these concerns were more than accounted for in Arcos’ share price, and that the company had great flexibility to control capital expenditures from year to year. Furthermore, Arcos had renegotiated its debt covenants with Bank of America while suspending those with McDonald’s, and had done so without incurring any penalty, which alleviated concerns about its credit and liquidity.
Over our holding period, we largely saw our investment thesis play out. Economic conditions have improved in most of Arcos’ end markets, heightened political uncertainty has dissipated and currencies have stabilized. In early 2017, the market seemed to welcome Arcos’ announcement of its 2017-2019 reinvestment and restaurant opening plans, as well as a new royalty rate schedule. The company’s balance sheet leverage also improved, in part due to asset monetization initiatives that raised over $100 million in fiscal year 2016 alone.
28
Brandes Emerging Markets Value Fund
Outlook
While the return of investor optimism and the resulting strong performance of emerging markets over the past 18+ months have driven up equity valuations, we are yet to witness material improvements in company earnings or returns on equity, leading us to believe there is still ample opportunity to uncover value.
Valuations for emerging market equities remain attractive compared to those for developed markets (as represented by the MSCI World Index). Within the asset class itself, the valuations for value stocks (as represented by the MSCI Emerging Markets Value Index) continue to look attractive to us. After a solid performance in the second half of 2016, value stocks meaningfully underperformed growth stocks (as represented by the MSCI Emerging Markets Growth Index) by 16% over the last nine months. As of September 30, 2017, value stocks traded in line with their 10-year price-to-book average, while growth stocks traded significantly above their 10-year price-to-book average.
While emerging markets’ strong performance in the last several quarters can be perceived as good news, a deeper look into the MSCI Emerging Markets Index’s performance (i.e., how concentrated its return contribution has been) reveals, in our opinion, how investors may be best served by applying an active, opportunity-focused investment approach. At Brandes, our stock selection relies on a careful, bottom-up research, instead of assigning capital based on companies’ market-capitalization sizes without regard to business fundamentals.
We remain optimistic about the prospects for the Brandes Emerging Markets Value Fund and thank you for your continued trust.
Sincerely yours,
The Brandes Emerging Markets Investment Committee
Brandes Investment Trust
Because the values of the Fund’s investments will fluctuate with market conditions, so will the value of your investment in the Fund. You could lose money on your investment in the Fund, or the Fund could underperform other investments. The values of the Fund’s investments fluctuate in response to the activities of individual companies and general stock market and economic conditions. In addition, the performance of foreign securities depends on the political and economic environments and other overall economic conditions in the countries where the Fund invests. Emerging country markets involve greater risk and volatility than more developed markets. Some emerging markets countries may have fixed or managed currencies that are not free-floating against the U.S. dollar. Certain of these currencies have experienced, and may experience in the future, substantial fluctuations or a steady devaluation relative to the U.S. dollar. Investments in small and medium capitalization companies tend to have limited liquidity and greater price volatility than large capitalization companies.
29
Brandes Emerging Markets Value Fund
Past performance is not a guarantee of future results.
Cash Flow: The amount of cash generated minus the amount of cash used by a company in a given period.
Price/Book: Price per share divided by book value per share.
Return on Equity: Net income divided by shareholder’s equity.
Please refer to the Schedule of Investments in the report for complete holdings information. Fund holdings, geographic allocations and/or sector allocations are subject to change at any time and are not considered a recommendation to buy or sell any security.
The foregoing reflects the thoughts and opinions of Brandes Investment Partners® exclusively and is subject to change without notice. Brandes Investment Partners® is a registered trademark of Brandes Investment Partners, L.P. in the United States and Canada.
Must be preceded or accompanied by a prospectus.
Index Guide
The MSCI Emerging Markets Index with net dividends captures large and mid cap representation of emerging market countries. Data prior to 2001 is gross dividend and linked to the net dividend returns.
The MSCI World Index with net dividends captures large and mid cap representation of developed markets.
The MSCI Emerging Markets Growth Index with gross dividends captures large and mid cap securities exhibiting growth style characteristics, defined using long-term forward earnings per share (EPS) growth rate, short-term forward EPS growth rate, current internal growth rate, long-term historical EPS growth trend, and long-term historical sales per share growth trend.
The MSCI Emerging Markets Value Index with gross dividends captures large and mid cap securities exhibiting value style characteristics, defined using book value to price, 12-month forward earnings to price, and dividend yield.
MSCI has not approved, reviewed or produced this report, makes no express or implied warranties or representations and is not liable whatsoever for any data in the report. You may not redistribute the MSCI data or use it as a basis for other indices or investment products.
One cannot invest directly in an index.
The Brandes Emerging Markets Value Fund is distributed by ALPS Distributors, LLC.
30
Brandes Emerging Markets Value Fund
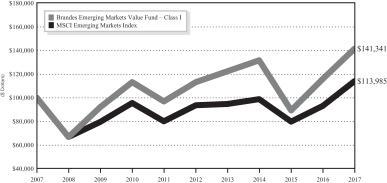
The following chart compares the value of a hypothetical $100,000 investment in the Brandes Emerging Markets Value Fund – Class I from September 30, 2007 to September 30, 2017 with the value of such an investment in the MSCI Emerging Markets Index for the same period.
Value of $100,000 Investment vs MSCI Emerging Markets Index (Unaudited)
| Average Annual Total Return Periods Ended September 30, 2017** | ||||||||||||||||
| One Year | Five Years | Ten Years | Since Inception(1) | |||||||||||||
Brandes Emerging Markets Value Fund | ||||||||||||||||
Class A | 21.78 | % | 4.30 | % | 3.27 | % | 7.87 | % | ||||||||
Class A (with maximum sales charge) | 14.77 | % | 3.07 | % | 2.66 | % | 7.56 | % | ||||||||
Class C* | 20.83 | % | 3.51 | % | 2.49 | % | 7.06 | % | ||||||||
Class I | 22.07 | % | 4.55 | % | 3.52 | % | 8.13 | % | ||||||||
Class R6* | 22.53 | % | 4.64 | % | 3.59 | % | 8.20 | % | ||||||||
MSCI Emerging Markets Index | 22.46 | % | 3.99 | % | 1.32 | % | 6.53 | % | ||||||||
| (1) | The inception date is August 20, 1996. |
| * | Performance shown prior to January 31, 2013 for Class C shares reflects the performance of Class I shares adjusted to reflect Class C expenses. Performance shown prior to July 11, 2016 for Class R6 shares reflects the performance of Class I shares adjusted to reflect Class R6 expenses. |
31
Brandes Emerging Markets Value Fund
| ** | Prior to January 31, 2011, the Advisor managed a private investment fund with an investment objective, investment policies and strategies that were, in all material respects, equivalent to those of the Brandes Emerging Markets Value Fund. The performance information shown for the Class I shares for periods before January 31, 2011 is that of the private investment fund and reflects the net expenses of the private investment fund. The performance of the private investment fund prior to January 31, 2011 is based on a calculation method that is different from the standardized calculation method prescribed by the SEC. The performance information shown for the Class A shares has been adjusted to reflect the differences in the net expense ratios between the Class I and A shares. The private investment fund was not registered under the Investment Company Act of 1940 (“1940 Act”) and was not subject to certain investment limitations, diversification requirements, and other restrictions imposed by the 1940 Act and the Internal Revenue Code of 1986, which, if applicable, may have adversely affected its performance. |
Performance data quoted represents past performance; past performance does not indicate future results. The investment return and principal value of an investment will fluctuate so that an investor’s shares, when redeemed, may be worth more or less than their original cost. Current performance of the Fund may be lower or higher than the performance quoted. Performance data current to the most recent month end may be obtained by calling 800-331-2979.
The returns shown do not reflect the deduction of taxes that a shareholder would pay on fund distributions or the redemption of fund shares. The Advisor has a fee waiver arrangement in place to limit the Fund’s annual operating expenses.
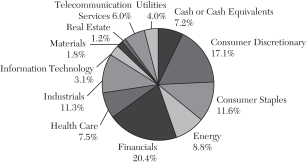
Sector Allocation as a Percentage of Total Investments as of
September 30, 2017 (Unaudited)

The sector classifications represented in the graph above and industry classifications represented in the Schedule of Investments are in accordance with Global Industry Classification Standard (GICS®), which was developed by and/or is the exclusive property of MSCI, Inc. and Standard & Poor Financial Services LLC.
32
Brandes International Small Cap Equity Fund
Dear Fellow Investor,
The net asset value of the Brandes International Small Cap Equity Fund (Class I Shares) advanced 11.54% in the 12 months ended September 30, 2017. For the same period, the S&P Developed Ex-U.S. SmallCap Index rose 20.22%.
We saw positive performance across almost every sector, with holdings in industrials and health care contributing the most on an absolute basis. From a country standpoint, holdings in Japan and Brazil were strong contributors. At the company level, top performers included Japanese power tools producer Hitachi Koki, Brazilian regional jet manufacturer Embraer, German medical equipment company Draegerwerk and Canadian wood-based panel products company Norbord.
The underperformance for the period could primarily be attributed to the Fund’s underweights to cyclical sectors, including financials, industrials and information technology. In our view, these sectors currently represent increasingly risky areas of the market as many constituents are trading at what we consider elevated multiples on potentially unsustainable earnings and free-cash-flow streams. We believe our consistent value-based approach helps our fund shareholders avoid securities with potentially poor risk/reward tradeoff. We remain committed to our price disciplined philosophy, building portfolios by focusing on both the risk and reward of each individual business.
Major detractors included U.K.-based real estate firm Countrywide, Irish beverage company C&C Group and Indian electric utility Reliance Infrastructure. Additionally, the Fund’s cash position hurt performance in a rising market. The investment committee continues to exercise patience and caution when evaluating opportunities. Our cash will enable us to act quickly when we uncover potentially undervalued companies.
The investment committee divested several holdings in Japan as the shares appreciated to our estimates of intrinsic value. These included machinery companies Toshiba Machine, Fuji Machine and Hitachi Koki, game equipment company Sega Sammy Holdings and electronic components manufacturer Hosiden. Other positions sold included Israel Discount Bank and Italy-based construction materials manufacturer Buzzi Unicem.
New purchases included Japanese food product company Toyo Suisan Kaisha and apparel company Wacoal Holdings, South Korean beverage company Lotte Chilsung and Mexican Fibra Uno.
A Fibra (Fideicomiso de Infraestructura y Bienes Raíces) is an investment vehicle that has similarities to a REIT (real estate investment trust) in the United States.
Fibra Uno (FUNO) is a Mexican trust formed primarily to acquire, own, develop and operate a broad range of commercial real estate in Mexico, including industrial, retail and office properties. FUNO has selectively assembled a diversified portfolio of high-quality, well-located, income-producing commercial
33
Brandes International Small Cap Equity Fund
properties. The trust began trading on the Mexican stock exchange in 2011 and is the first — also currently the largest — publicly listed Fibra.
Having previously held the company and currently owning one of its peers (Macquarie Mexico Real Estate Management), we are very familiar with FUNO’s business. Over the past few years, FUNO’s shares have been under pressure, mainly due to the peso depreciation, which negatively affected the company’s real estate value and peso-denominated rental revenues. FUNO has more U.S. dollar-denominated debt than revenues; however, from a debt servicing perspective, it has what we consider solid revenue coverage of interest expense in U.S. dollars. Moreover, FUNO has predominantly long-term debt (expiring in six years or later) with a fixed interest rate. Hence, we believe FUNO should be relatively resilient against rising rates.
The selloff in FUNO’s shares was magnified by the election of Donald Trump as U.S. President, creating what we viewed as a good entry point for investment. In our view, FUNO’s positive attributes include:
| • | Strong earnings growth prospects through a sizeable development pipeline |
| • | A solid balance sheet and a seasoned management team |
| • | An income stream which is “inflation protected” as rents are contractually tied to inflation |
| • | Attractive dividend yield |
When we purchased FUNO, the company traded not only below our conservative estimate of its net assets value, but also less than its original IPO (initial public offering) price in U.S. dollar terms. At the time of its IPO, FUNO was less diversified than it is today and was operating in a developing industry that was untested. Moreover, while the market seems focused on U.S. policy concerns, we appreciate that the company’s property portfolio has limited direct exposure to major exporters to the United States. We also like that management continues to demonstrate strong capital allocation, with a conservative balance sheet which should enable the company to be opportunistic, in our view, if the market conditions in Mexico weaken further.
Outlook
As of September 30, 2017, the Fund’s key exposures and overweights from a country perspective remained in Japan and the United Kingdom.
Japanese companies continued to represent the Fund’s largest country weighting. The majority of our Japanese holdings have conservative financial leverage and traded below their book value as of September 30. Moreover, Japan is one of the very few countries where we have found companies with market capitalizations lower than the cash on their balance sheets, offering what we consider a particularly attractive value proposition.
34
Brandes International Small Cap Equity Fund
We also continue to see tremendous value potential in emerging markets, which accounted for approximately 25% of the Fund as of September 30. Brazil and South Korea represented our two largest allocations in the region. We continue to uncover what we believe are undervalued opportunities in South Korean businesses, with three new positions in the period (the aforementioned Lotte Chilsung, security services firm S-1 and food products company Namyang Dairy Products).
From a sector standpoint, the Fund maintained notable overweights in consumer staples and utilities, and key underweights in industrials and materials. Over the past year, the most dramatic change in the Fund has been our growing exposure to companies in consumer staples, specifically food products, and our declining position in materials companies.
Events across the globe this year may serve as a good reminder that macroeconomic and geopolitical factors can affect individual businesses differently. As one of the first asset managers to bring a global perspective to value investing, Brandes relies on an established research infrastructure that enables us to analyze how each company may be affected by events globally. Our analyst teams have extensive knowledge of industries worldwide, and each team member’s perspective allows us to think and invest independently from the market consensus.
Thank you for your business and continued trust.
Sincerely yours,
The Brandes Small-Cap Investment Committee
Brandes Investment Trust
Because the values of the Fund’s investments will fluctuate with market conditions, so will the value of your investment in the Fund. You could lose money on your investment in the Fund, or the Fund could underperform other investments. The values of the Fund’s investments fluctuate in response to the activities of individual companies and general stock market and economic conditions. In addition, the performance of foreign securities depends on the political and economic environments and other overall economic conditions in the countries where the Fund invests. Emerging country markets involve greater risk and volatility than more developed markets. Some emerging markets countries may have fixed or managed currencies that are not free-floating against the U.S. dollar. Certain of these currencies have experienced, and may experience in the future, substantial fluctuations or a steady devaluation relative to the U.S. dollar. Investments in small and medium capitalization companies tend to have limited liquidity and greater price volatility than large capitalization companies.
Past performance is not a guarantee of future results.
Book Value: Assets minus liabilities. Also known as shareholders’ equity.
35
Brandes International Small Cap Equity Fund
Dividend Yield: Dividends per share divided by price per share.
Free Cash Flow: Total cash flow from operations less capital expenditures.
Net Assets Value: A company’s total assets minus its liabilities, divided by the number of outstanding shares.
The declaration and payment of shareholder dividends are solely at the discretion of the issuer and are subject to change at any time.
Please refer to the Schedule of Investments in the report for complete holdings information. Fund holdings, geographic allocations and/or sector allocations are subject to change at any time and are not considered a recommendation to buy or sell any security.
The foregoing reflects the thoughts and opinions of Brandes Investment Partners® exclusively and is subject to change without notice. Brandes Investment Partners® is a registered trademark of Brandes Investment Partners, L.P. in the United States and Canada.
Must be preceded or accompanied by a prospectus.
Index Guide
The S&P Developed Ex-U.S. SmallCap Index with net dividends measures the equity performance of small-capitalization companies from developed markets excluding the United States. Data prior to 2001 is gross dividend and linked to the net dividend returns.
One cannot invest directly in an index.
The Brandes International Small Cap Equity Fund is distributed by ALPS Distributors, LLC.
36
Brandes International Small Cap Equity Fund
The following chart compares the value of a hypothetical $100,000 investment in the Brandes International Small Cap Fund – Class I from September 30, 2007 to September 30, 2017 with the value of such an investment in the S&P Developed Ex-U.S. SmallCap Index for the same period.
Value of $100,000 Investment vs S&P Developed
Ex-U.S. SmallCap Index (Unaudited)
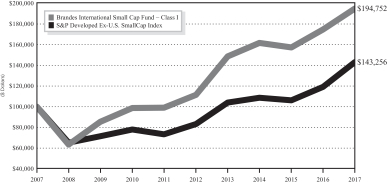
| Average Annual Total Return Periods Ended September 30, 2017** | ||||||||||||||||
| One Year | Five Years | Ten Years | Since Inception(1) | |||||||||||||
Brandes International Small Cap Fund | ||||||||||||||||
Class A | 11.29 | % | 11.52 | % | 6.64 | % | 9.99 | % | ||||||||
Class A (with maximum sales charge) | 4.89 | % | 10.21 | % | 6.01 | % | 9.68 | % | ||||||||
Class C* | 10.52 | % | 10.74 | % | 5.85 | % | 9.17 | % | ||||||||
Class I | 11.54 | % | 11.80 | % | 6.89 | % | 10.25 | % | ||||||||
Class R6* | 11.67 | % | 11.87 | % | 6.96 | % | 10.31 | % | ||||||||
S&P Developed Ex-U.S. SmallCap Index | 20.22 | % | 11.46 | % | 3.66 | % | 7.18 | % | ||||||||
| (1) | The inception date is August 19, 1996. |
| * | Performance shown prior to January 31, 2013 for Class C shares reflects the performance of Class I shares adjusted to reflect Class C expenses. Performance shown prior to June 27, 2016 for Class R6 shares reflects the performance of Class I shares adjusted to reflect Class R6 expenses. |
| ** | Prior to February 1, 2012, the Advisor managed a private investment fund with an investment objective, investment policies and strategies that were, in all material respects, equivalent to those of the Brandes International Small Cap Fund. The performance information shown for the Class I shares for periods before February 1, 2012 is that of the private investment fund and reflects the net expenses of the private investment fund. The performance of the private investment fund prior to February 1, 2012 is based on a calculation method that is different from the standardized calculation method prescribed by the SEC. The performance information shown for the Class A shares has been adjusted to reflect the differences in the net expense ratios between the Class I and A shares. The private investment fund was not registered under the Investment Company Act of 1940 (“1940 Act”) and was not subject to certain investment limitations, diversification requirements, and other restrictions imposed by the 1940 Act and the Internal Revenue Code of 1986, which, if applicable, may have adversely affected its performance. |
37
Brandes International Small Cap Equity Fund
Performance data quoted represents past performance; past performance does not indicate future results. The investment return and principal value of an investment will fluctuate so that an investor’s shares, when redeemed, may be worth more or less than their original cost. Current performance of the Fund may be lower or higher than the performance quoted. Performance data current to the most recent month end may be obtained by calling 800-331-2979.
The returns shown do not reflect the deduction of taxes that a shareholder would pay on fund distributions or the redemption of fund shares. The Advisor has a fee waiver arrangement in place to limit the Fund’s annual operating expenses.
Sector Allocation as a Percentage of Total Investments as of
September 30, 2017 (Unaudited)
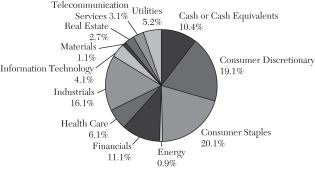
The sector classifications represented in the graph above and industry classifications represented in the Schedule of Investments are in accordance with Global Industry Classification Standard (GICS®), which was developed by and/or is the exclusive property of MSCI, Inc. and Standard & Poor Financial Services LLC.
38
Brandes Core Plus Fixed Income Fund
Dear Fellow Investor,
The Brandes Core Plus Fixed Income Fund (Class I Shares) advanced 0.71% in the 12 months ended September 30, 2017, while its benchmark, the Bloomberg Barclays U.S. Aggregate Bond Index, gained 0.07%.
Notable positive contributors were corporate holdings in banking, energy, utilities and commodity resources. The Fund also benefited from holdings in private student loan asset-backed securities.
Within the banking industry, the Fund received strong contributions from junior subordinated securities of U.S. Bank, JPMorgan and Wells Fargo. The U.S. Bank holding is a floating rate note while the JPMorgan and Wells Fargo holdings are currently fixed-rate securities, but will convert to floating rate notes if they are not called prior to one year. Bank credit profiles continue to improve, especially with short rates trending higher. These securities also benefit from the possibility that they can convert to floating rate instruments.
Among energy holdings, Fund performance was led by natural gas producers Chesapeake Energy and Range Resources, as well as pipeline operator Kinder Morgan.
Additionally, metals & mining companies Cloud Peak Energy and Royal Gold helped performance. Cloud Peak benefited from improving industry fundamentals, while Royal Gold rose amid a sharp rise in the price of gold through mid-September.
Cloud Peak is a coal miner operating in the Powder River Basin (Western United States). The company operates some of the country’s lowest-cost mines. During the fourth quarter of 2016 the company took steps to ease refinancing concerns by issuing a tender offer for its nearest term maturity (December 2019) and issuing second-lien notes maturing in 2021. The result of the tender was that Cloud Peak was able to reduce its debt maturing in 2019 from $200 million to $56 million. The company also benefited, post-U.S. presidential election, from the perception that the incoming administration would take a more favorable regulatory approach toward the coal industry.
Our telecommunication services holdings, principally Frontier Communications, modestly detracted from performance.
The Fund initiated a position in Tenet Healthcare (6.00% coupon rate, maturing October 2020 and rated Ba3/BB-). Tenet is a hospital operator that carries a good deal of leverage. We view the credit positively, however, based on our assessment of asset coverage and the severable nature of Tenet’s hospitals, acute care and consulting business assets. We have owned another Tenet bond (8% coupon rate, maturing 8/1/20) for some time. From a cost of capital and liquidity management perspective, we believed the Tenet bond would likely be called this August. In fact, during the second quarter of 2017, Tenet announced its intention to call two-thirds
39
Brandes Core Plus Fixed Income Fund
of the issue. We decided to maintain and slightly increase our weighting in Tenet, but chose to balance the risk of the maturity extension by purchasing first-lien notes that we believe offer better protection than unsecured Tenet debt.
Additionally, we added a new position in Tembec (9% coupon rate, maturing December 2019 and rated B2/B-), a Canadian paper & forest products company. Tembec recently completed multi-year efficiency projects and upgraded its facilities. The company is now focused on reducing leverage. Tembec’s capital expenditures in the last several years have resulted in greater profitability, lower maintenance outlays and higher free cash flow. During the second quarter of 2017, Tembec announced it was being acquired by another company. Based on the transaction multiple, the implied asset coverage is greater than 1.5 times, giving us some comfort should the deal fall through. When the transaction closes, we expect this issue to be called as the acquirer is a larger, more diversified and higher-rated entity, which will likely look to retire this relatively high-cost debt.
We also took advantage of the weakness in the energy sector in the second quarter of 2017 to increase our weighting in Range Resources.
Other activity included the sale of our position in Royal Gold (2.625% coupon maturing June 2019), one of the world’s largest precious metals royalty trusts. We purchased a convertible bond at a time of depressed precious metals prices in mid-2015, which consequently drove down the underlying stock price. The market viewed prospects for an upside from equity conversion as remote and Royal Gold was considered a “broken” convertible. The bond was trading almost exclusively on its bond merits with very little value given to the implied equity-conversion option.
We evaluated this specific Royal Gold issue as a straight bond, assigning no value to the embedded equity option. We believed the security was trading at an attractive yield relative to its credit fundamentals. Royal Gold effectively operated its business like a bank but with much lower leverage, and balanced with effectively exclusive exposure to a single industry. More recently, with a meaningful rally in precious metals since our purchase, our bond holding is no longer a broken convertible as the market has now assigned a significant value to the embedded option. In fact, when we sold the position, the dollar price was high enough that the straight bond was exhibiting a negative yield. While the credit risk remains quite low, the risk to the bond price has risen, given that the bond price is now driven primarily by the underlying stock price. Consequently, we decided to exit our position.
Waiting for Volatility = Waiting for Godot?
A common theme for much of the fiscal year was an unprecedented lack of volatility in the equity market and the taxable fixed-income markets. Caught in a
40
Brandes Core Plus Fixed Income Fund
period of historically low volatility, 10-year U.S. Treasury yields have been stuck in a range of 59 basis points in 2017. To put this in perspective, this has been the tightest trading range since 1965.1
The last time volatility for the 10-year Treasury yield was this low was right before the global financial crisis. What’s that old adage about the calm before the storm?
While we are not in the business of predictions and are most certainly not forecasting another global financial meltdown, the level of interest rates and the aggregate level of yield spreads in the market today give us pause — as they have for some time now. It is that last part that makes us feel a bit like the characters in the classic play Waiting for Godot.
Outlook
For much of the Fund’s fiscal year, risk markets have largely shrugged off two Fed interest-rate hikes, two historic hurricanes, an uptick in political volatility, and rising geopolitical tensions with North Korea to continue their strong performance.
As highlighted earlier, the fixed-income market remains in a low-volatility environment, which we believe has caused a great deal of complacency among investors. In our opinion, it is when markets seem complacent and fundamental valuations appear distorted due to external influences that the most prudent approach to portfolio management is to exercise caution.
Now that we are into the football season, we’d like to put a new twist on an old adage: The best offense is often a strong defense seems the most sensible positioning from our standpoint.
We did not make any material changes during the fiscal year as we believe the Fund remains defensively positioned. We favor short-maturity corporate bonds and those exhibiting strong, tangible asset coverage based on our analysis. We are underweight agency mortgage-backed securities and are managing duration toward the shorter end of our duration-controlled range. We have a higher than usual allocation to U.S. Treasuries that we will look to redeploy thoughtfully and efficiently — if and when market uncertainty and volatility cause credit fundamentals to become mispriced from our estimates of intrinsic value.
As always, thank you for your business and continued trust.
Sincerely yours,
The Brandes Fixed-Income Investment Committee
Brandes Investment Trust
Because the values of the Fund’s investments will fluctuate with market conditions, so will the value of your investment in the Fund. You could lose money on your investment in the Fund, or the Fund could underperform
| 1 | Bloomberg: Worst Bond-Market Rut in 52 Years Shows Few Signs of Break Out, 9/27/17. |
41
Brandes Core Plus Fixed Income Fund
other investments. The values of the Fund’s investments fluctuate in response to the activities of individual companies and general stock market and economic conditions. In addition, the performance of foreign securities depends on the political and economic environments and other overall economic conditions in the countries where the Fund invests. Emerging country markets involve greater risk and volatility than more developed markets. Some emerging markets countries may have fixed or managed currencies that are not free-floating against the U.S. dollar. Certain of these currencies have experienced, and may experience in the future, substantial fluctuations or a steady devaluation relative to the U.S. dollar. It is not possible to invest directly in an index.
As with most fixed income funds, the income on and value of your shares in the Fund will fluctuate along with interest rates. When interest rates rise, the market prices of the debt securities the Fund owns usually decline. When interest rates fall, the prices of these securities usually increase. Generally, the longer the Fund’s average portfolio maturity and the lower the average quality of its portfolio, the greater the price fluctuation. The price of any security owned by the Fund may also fall in response to events affecting the issuer of the security, such as its ability to continue to make principal and interest payments or its credit rating. Below investment grade debt securities are speculative and involve a greater risk of default and price change due to changes in the issuer’s creditworthiness. The market prices of these debt securities may fluctuate more than the market prices of investment grade debt securities and may decline significantly in periods of general economic difficulty.
Asset Coverage: Assets available to cover debt obligations after all other liabilities have been satisfied.
Basis Point: 1/100 of 1%.
Duration: The weighted maturity of a fixed-income investment’s cash flows, used in the estimation of the price sensitivity of fixed-income securities for a given change in interest rates.
Floating Rate Note: A debt instrument that does not have a fixed rate of interest over the life of the instrument.
Intrinsic Value: The actual value of a company or an asset based on an underlying perception of its true value.
Yield Spread: The difference in yield between two comparable securities.
Yield: Annual income from the investment (dividend, interest, etc.) divided by the current market price of the investment.
42
Brandes Core Plus Fixed Income Fund
There is no assurance that a forecast will be accurate. Because of the many variables involved, an investor should not rely on forecasts without realizing their limitations.
Bond ratings are grades given to bonds that indicate their credit quality as determined by a private independent rating service such as Standard & Poor’s or Moody’s. The service evaluates a bond issuer’s financial strength, or its ability to pay a bond’s principal and interest in a timely fashion. Ratings are expressed as letters ranging from ‘AAA’, which is the highest grade, to ‘D’, which is the lowest grade. In limited situations when the rating agency has not issued a formal rating, the Advisor will classify the security as nonrated.
Please refer to the Schedule of Investments in the report for complete holdings information. Fund holdings, geographic allocations and/or sector allocations are subject to change at any time and are not a recommendation to buy or sell any security.
The foregoing reflects the thoughts and opinions of Brandes Investment Partners® exclusively and is subject to change without notice.
Brandes Investment Partners® is a registered trademark of Brandes Investment Partners, L.P. in the United States and Canada.
Must be preceded or accompanied by a prospectus.
Index Guide
The Bloomberg Barclays U.S. Aggregate Bond Index is a broad-based benchmark that measures the investment grade, U.S. dollar-denominated, fixed-rate taxable bond market. This index is a total return index which reflects the price changes and interest of each bond in the index.
The Brandes Core Plus Fixed Income Fund is distributed by ALPS Distributors, Inc.
43
Brandes Core Plus Fixed Income Fund
The following chart compares the value of a hypothetical $100,000 investment in the Brandes Core Plus Fixed Income Fund – Class I from its inception (December 28, 2007) to September 30, 2017 with the value of such an investment in the Bloomberg Barclays U.S. Aggregate Bond Index for the same period.
Value of $100,000 Investment vs Bloomberg Barclays U.S. Aggregate Bond Index (Unaudited)
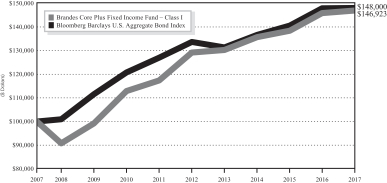
| Average Annual Total Return Periods Ended September 30, 2017 | ||||||||||||||||
| One Year | Three Years | Five Years | Since Inception(1) | |||||||||||||
Brandes Core Plus Fixed Income Fund | ||||||||||||||||
Class A* | 0.28 | % | 2.44 | % | 2.22 | % | 3.71 | % | ||||||||
Class A* (with maximum sales charge) | -3.52 | % | 1.14 | % | 1.45 | % | 3.31 | % | ||||||||
Class I | 0.71 | % | 2.70 | % | 2.61 | % | 4.02 | % | ||||||||
Bloomberg Barclays U.S. Aggregate Bond Index | 0.07 | % | 2.71 | % | 2.06 | % | 4.10 | % | ||||||||
| (1) | The inception date is December 28, 2007. |
| * | Performance shown prior to January 31, 2013 for Class A shares reflects the performance of Class I shares adjusted to reflect Class A expenses. |
Performance data quoted represents past performance; past performance does not indicate future results. The investment return and principal value of an investment will fluctuate so that an investor’s shares, when redeemed, may be worth more or less than their original cost. Current performance of the Fund may be lower or higher than the performance quoted. Performance data current to the most recent month end may be obtained by calling 800-331-2979.
44
Brandes Core Plus Fixed Income Fund
The returns shown do not reflect the deduction of taxes that a shareholder would pay on fund distributions or the redemption of Fund shares. The Advisor has a fee waiver arrangement in place to limit the Fund’s annual operating expenses.
Asset Allocation as a Percentage of Total Investments as of
September 30, 2017 (Unaudited)
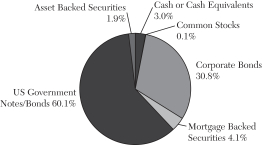
45
Brandes Credit Focus Yield Fund
Dear Fellow Investor,
The Brandes Credit Focus Yield Fund (Class I Shares) advanced 2.19% in the 12 months ended September 30, 2017, while its benchmark, the Bloomberg Barclays U.S. Intermediate Credit Bond Index, gained 1.58%.
Notable positive contributors were corporate holdings in banking, energy, utilities and commodity resources. The Fund also benefited from holdings in private student loan asset-backed securities.
Within the banking industry, the Fund received strong contributions from junior subordinated securities of U.S. Bank, JPMorgan and Wells Fargo. The U.S. Bank holding is a floating rate note while the JPMorgan and Wells Fargo holdings are currently fixed-rate securities, but will convert to floating rate notes if they are not called prior to one year. Bank credit profiles continue to improve, especially with short rates trending higher. These securities also benefit from the possibility that they can convert to floating rate instruments.
Among energy holdings, Fund performance was led by natural gas producers Chesapeake Energy and Range Resources, as well as pipeline operator Kinder Morgan.
Additionally, metals & mining companies Cloud Peak Energy and Royal Gold helped performance. Cloud Peak benefited from improving industry fundamentals, while Royal Gold rose amid a sharp rise in the price of gold through mid-September.
Cloud Peak is a coal miner operating in the Powder River Basin (Western United States). The company operates some of the country’s lowest-cost mines. During the fourth quarter of 2016 the company took steps to ease refinancing concerns by issuing a tender offer for its nearest term maturity (December 2019) and issuing second-lien notes maturing in 2021. The result of the tender was that Cloud Peak was able to reduce its debt maturing in 2019 from $200 million to $56 million. The company also benefited, post-U.S. presidential election, from the perception that the incoming administration would take a more favorable regulatory approach toward the coal industry.
Our telecommunication services holdings, principally Frontier Communications, modestly detracted from performance.
The Fund initiated a position in Tenet Healthcare (6.00% coupon rate, maturing October 2020 and rated Ba3/BB-). Tenet is a hospital operator that carries a good deal of leverage. We view the credit positively, however, based on our assessment of asset coverage and the severable nature of Tenet’s hospitals, acute care and consulting business assets. We have owned another Tenet bond (8% coupon rate, maturing 8/1/20) for some time. From a cost of capital and liquidity management perspective, we believed the Tenet bond would likely be called this August. In fact, during the second quarter of 2017, Tenet announced its intention to call two-thirds
46
Brandes Credit Focus Yield Fund
of the issue. We decided to maintain and slightly increase our weighting in Tenet, but chose to balance the risk of the maturity extension by purchasing first-lien notes that we believe offer better protection than unsecured Tenet debt.
Additionally, we added a new position in Tembec (9% coupon rate, maturing December 2019 and rated B2/B-), a Canadian paper & forest products company. Tembec recently completed multi-year efficiency projects and upgraded its facilities. The company is now focused on reducing leverage. Tembec’s capital expenditures in the last several years have resulted in greater profitability, lower maintenance outlays and higher free cash flow. During the second quarter of 2017, Tembec announced it was being acquired by another company. Based on the transaction multiple, the implied asset coverage is greater than 1.5 times, giving us some comfort should the deal fall through. When the transaction closes, we expect this issue to be called as the acquirer is a larger, more diversified and higher-rated entity, which will likely look to retire this relatively high-cost debt.
We also took advantage of the weakness in the energy sector in the second quarter of 2017 to increase our weighting in Range Resources.
Other activity included the sale of our position in Royal Gold (2.625% coupon maturing June 2019), one of the world’s largest precious metals royalty trusts. We purchased a convertible bond at a time of depressed precious metals prices in mid-2015, which consequently drove down the underlying stock price. The market viewed prospects for an upside from equity conversion as remote and Royal Gold was considered a “broken” convertible. The bond was trading almost exclusively on its bond merits with very little value given to the implied equity-conversion option.
We evaluated this specific Royal Gold issue as a straight bond, assigning no value to the embedded equity option. We believed the security was trading at an attractive yield relative to its credit fundamentals. Royal Gold effectively operated its business like a bank but with much lower leverage, and balanced with effectively exclusive exposure to a single industry. More recently, with a meaningful rally in precious metals since our purchase, our bond holding is no longer a broken convertible as the market has now assigned a significant value to the embedded option. In fact, when we sold the position, the dollar price was high enough that the straight bond was exhibiting a negative yield. While the credit risk remains quite low, the risk to the bond price has risen, given that the bond price is now driven primarily by the underlying stock price. Consequently, we decided to exit our position.
Waiting for Volatility = Waiting for Godot?
A common theme for much of the fiscal year was an unprecedented lack of volatility in the equity market and the taxable fixed-income markets. Caught in a
47
Brandes Credit Focus Yield Fund
period of historically low volatility, 10-year U.S. Treasury yields have been stuck in a range of 59 basis points in 2017. To put this in perspective, this has been the tightest trading range since 1965.1
The last time volatility for the 10-year Treasury yield was this low was right before the global financial crisis. What’s that old adage about the calm before the storm?
While we are not in the business of predictions and are most certainly not forecasting another global financial meltdown, the level of interest rates and the aggregate level of yield spreads in the market today give us pause — as they have for some time now. It is that last part that makes us feel a bit like the characters in the classic play Waiting for Godot.
Outlook
For much of the Fund’s fiscal year, risk markets have largely shrugged off two Fed interest-rate hikes, two historic hurricanes, an uptick in political volatility, and rising geopolitical tensions with North Korea to continue their strong performance.
As highlighted earlier, the fixed-income market remains in a low-volatility environment, which we believe has caused a great deal of complacency among investors. In our opinion, it is when markets seem complacent and fundamental valuations appear distorted due to external influences that the most prudent approach to portfolio management is to exercise caution.
Now that we are into the football season, we’d like to put a new twist on an old adage: The best offense is often a strong defense seems the most sensible positioning from our standpoint.
We did not make any material changes during the fiscal year as we believe the Fund remains defensively positioned. We favor short-maturity corporate bonds and those exhibiting strong, tangible asset coverage based on our analysis. We are underweight agency mortgage-backed securities and are managing duration toward the shorter end of our duration-controlled range. We have a higher than usual allocation to U.S. Treasuries that we will look to redeploy thoughtfully and efficiently — if and when market uncertainty and volatility cause credit fundamentals to become mispriced from our estimates of intrinsic value.
As always, thank you for your business and continued trust.
Sincerely yours,
The Brandes Fixed-Income Investment Committee
Brandes Investment Trust
Because the values of the Fund’s investments will fluctuate with market conditions, so will the value of your investment in the Fund. You could lose money on your investment in the Fund, or the Fund could underperform
| 1 | Bloomberg: Worst Bond-Market Rut in 52 Years Shows Few Signs of Break Out, 9/27/17. |
48
Brandes Credit Focus Yield Fund
other investments. The values of the Fund’s investments fluctuate in response to the activities of individual companies and general stock market and economic conditions. In addition, the performance of foreign securities depends on the political and economic environments and other overall economic conditions in the countries where the Fund invests. Emerging country markets involve greater risk and volatility than more developed markets. Some emerging markets countries may have fixed or managed currencies that are not free-floating against the U.S. dollar. Certain of these currencies have experienced, and may experience in the future, substantial fluctuations or a steady devaluation relative to the U.S. dollar. It is not possible to invest directly in an index.
As with most fixed income funds, the income on and value of your shares in the Fund will fluctuate along with interest rates. When interest rates rise, the market prices of the debt securities the Fund owns usually decline. When interest rates fall, the prices of these securities usually increase. Generally, the longer the Fund’s average portfolio maturity and the lower the average quality of its portfolio, the greater the price fluctuation. The price of any security owned by the Fund may also fall in response to events affecting the issuer of the security, such as its ability to continue to make principal and interest payments or its credit rating. Below investment grade debt securities are speculative and involve a greater risk of default and price change due to changes in the issuer’s creditworthiness. The market prices of these debt securities may fluctuate more than the market prices of investment grade debt securities and may decline significantly in periods of general economic difficulty.
Asset Coverage: Assets available to cover debt obligations after all other liabilities have been satisfied.
Basis Point: 1/100 of 1%.
Duration: The weighted maturity of a fixed-income investment’s cash flows, used in the estimation of the price sensitivity of fixed-income securities for a given change in interest rates.
Floating Rate Note: A debt instrument that does not have a fixed rate of interest over the life of the instrument.
Intrinsic Value: The actual value of a company or an asset based on an underlying perception of its true value.
Yield Spread: The difference in yield between two comparable securities.
Yield: Annual income from the investment (dividend, interest, etc.) divided by the current market price of the investment.
49
Brandes Credit Focus Yield Fund
There is no assurance that a forecast will be accurate. Because of the many variables involved, an investor should not rely on forecasts without realizing their limitations.
Bond ratings are grades given to bonds that indicate their credit quality as determined by a private independent rating service such as Standard & Poor’s or Moody’s. The service evaluates a bond issuer’s financial strength, or its ability to pay a bond’s principal and interest in a timely fashion. Ratings are expressed as letters ranging from ‘AAA’, which is the highest grade, to ‘D’, which is the lowest grade. In limited situations when the rating agency has not issued a formal rating, the Advisor will classify the security as nonrated.
Please refer to the Schedule of Investments in the report for complete holdings information. Fund holdings, geographic allocations and/or sector allocations are subject to change at any time and are not a recommendation to buy or sell any security.
The foregoing reflects the thoughts and opinions of Brandes Investment Partners® exclusively and is subject to change without notice.
Brandes Investment Partners® is a registered trademark of Brandes Investment Partners, L.P. in the United States and Canada.
Must be preceded or accompanied by a prospectus.
Index Guide
The Bloomberg Barclays U.S. Intermediate Credit Bond Index measures performance of U.S. dollar-denominated U.S. Treasuries, government-related and investment-grade U.S. corporate securities that have remaining maturities of greater than one year and less than ten years. This index is a total return index which reflects the price changes and interest of each bond in the index.
The Brandes Credit Focus Yield Fund is distributed by ALPS Distributors, Inc.
50
Brandes Credit Focus Yield Fund
The following chart compares the value of a hypothetical $100,000 investment in the Brandes Credit Focus Yield Fund – Class I from September 30, 2007 to September 30, 2017 with the value of such an investment in the Bloomberg Barclays U.S. Intermediate Credit Bond Index for the same period.
Value of $100,000 Investment vs Bloomberg Barclays U.S. Intermediate Credit Bond Index (Unaudited)
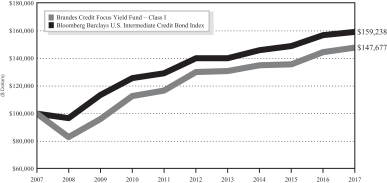
| Average Annual Total Return Periods Ended September 30, 2017** | ||||||||||||||||
| One Year | Five Years | Ten Years | Since Inception(1) | |||||||||||||
Brandes Credit Focus Yield Fund | ||||||||||||||||
Class A* | 1.94 | % | 2.29 | % | 3.70 | % | 5.37 | % | ||||||||
Class A* (with maximum sales charge) | -1.86 | % | 1.52 | % | 3.30 | % | 5.14 | % | ||||||||
Class I | 2.19 | % | 2.55 | % | 3.98 | % | 5.65 | % | ||||||||
Bloomberg Barclays U.S. Intermediate Credit Bond Index | 1.58 | % | 2.60 | % | 4.76 | % | 5.47 | % | ||||||||
| (1) | The inception date is June 29, 2000. |
| * | Performance shown prior to March 1, 2012 for Class A shares reflects the performance of Class I shares adjusted to reflect Class A expenses. |
| ** | Prior to February 1, 2012, the Advisor managed a private investment fund with an investment objective, investment policies and strategies that were, in all material respects, equivalent to those of the Brandes Credit Focus Yield Fund. The performance information shown for the Class I shares for periods before February 1, 2012 is that of the private investment fund and reflects the net expenses of the private investment fund. The performance of the private investment fund prior to February 1, 2012 is based on a calculation method that is different from the standardized calculation method prescribed by the SEC. The performance information shown for the Class A shares has been adjusted to reflect the differences in the net expense ratios between the Class I and A shares. The private investment fund was not registered under the Investment Company Act of 1940 (“1940 Act”) and was not subject to certain investment limitations, diversification requirements, and other restrictions imposed by the 1940 Act and the Internal Revenue Code of 1986, which, if applicable, may have adversely affected its performance. |
51
Brandes Credit Focus Yield Fund
Performance data quoted represents past performance; past performance does not indicate future results. The investment return and principal value of an investment will fluctuate so that an investor’s shares, when redeemed, may be worth more or less than their original cost. Current performance of the Fund may be lower or higher than the performance quoted. Performance data current to the most recent month end may be obtained by calling 800-331-2979.
The returns shown do not reflect the deduction of taxes that a shareholder would pay on Fund distributions or the redemption of Fund shares. The Advisor has a fee waiver arrangement in place to limit the Fund’s annual operating expenses.
Asset Allocation as a Percentage of Total Investments as of
September 30, 2017 (Unaudited)
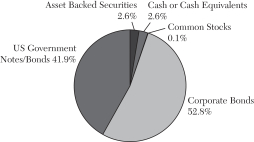
52
Brandes Investment Trust
As a shareholder of a Fund, you incur ongoing costs, including investment advisory and administrative fees and other fund expenses. The examples below are intended to help you understand your ongoing costs (in dollars) of investing in the Funds and to compare these costs with ongoing costs of investing in other mutual funds.
The examples are based on an investment of $1,000 invested at the beginning of the period and held for the entire period from April 1, 2017 to September 30, 2017 (the “Period”).
Actual Expenses
This section provides information about actual account values and actual expenses. The “Ending Account Value” shown is derived from each Fund’s actual return. You may use the information in this section, together with the amount you invested, to estimate the expenses that you paid over the period. Simply divide your account value by $1,000 (for example, an $8,600 account value divided by $1,000 = 8.6), then multiply the result by the number given for the Fund under the heading “Expenses Paid During Period” to estimate the expenses you paid on your account during this period.
| Class A | ||||||||||||||||
Fund | Beginning Account Value | Ending Account Value | Annual Expense Ratio | Expenses Paid During the Period* | ||||||||||||
International Equity Fund | $ | 1,000.00 | $ | 1,072.50 | 1.16% | $ | 6.03 | |||||||||
Global Equity Fund | $ | 1,000.00 | $ | 1,069.20 | 1.25% | $ | 6.48 | |||||||||
Global Equity Income Fund | $ | 1,000.00 | $ | 1,097.80 | 1.25% | $ | 6.57 | |||||||||
Global Opportunities Value Fund | $ | 1,000.00 | $ | 1,061.40 | 1.40% | $ | 7.23 | |||||||||
Emerging Markets Value Fund | $ | 1,000.00 | $ | 1,107.40 | 1.42% | $ | 7.50 | |||||||||
International Small Cap Fund | $ | 1,000.00 | $ | 1,034.90 | 1.29% | $ | 6.58 | |||||||||
Core Plus Fixed Income Fund | $ | 1,000.00 | $ | 1,015.80 | 0.70% | $ | 3.54 | |||||||||
Credit Focus Yield Fund | $ | 1,000.00 | $ | 1,018.20 | 0.85% | $ | 4.30 | |||||||||
| Class C | ||||||||||||||||
Fund | Beginning Account Value | Ending Account Value | Annual Expense Ratio | Expenses Paid During the Period* | ||||||||||||
International Equity Fund | $ | 1,000.00 | $ | 1,068.30 | 1.91% | $ | 9.90 | |||||||||
Global Equity Fund | $ | 1,000.00 | $ | 1,065.60 | 2.00% | $ | 10.36 | |||||||||
Global Equity Income Fund | $ | 1,000.00 | $ | 1,075.70 | 2.00% | $ | 10.41 | |||||||||
Global Opportunities Value Fund | $ | 1,000.00 | $ | 1,056.80 | 2.15% | $ | 11.09 | |||||||||
Emerging Markets Value Fund | $ | 1,000.00 | $ | 1,102.90 | 2.16% | $ | 11.39 | |||||||||
International Small Cap Fund | $ | 1,000.00 | $ | 1,031.10 | 2.04% | $ | 10.39 | |||||||||
53
Brandes Investment Trust
| Class I | ||||||||||||||||
Fund | Beginning Account Value | Ending Account Value | Annual Expense Ratio | Expenses Paid During the Period* | ||||||||||||
International Equity Fund | $ | 1,000.00 | $ | 1,074.00 | 0.95% | $ | 4.94 | |||||||||
Global Equity Fund | $ | 1,000.00 | $ | 1,070.50 | 1.00% | $ | 5.19 | |||||||||
Global Equity Income Fund | $ | 1,000.00 | $ | 1,076.00 | 1.00% | $ | 5.20 | |||||||||
Global Opportunities Value Fund | $ | 1,000.00 | $ | 1,061.60 | 1.15% | $ | 5.94 | |||||||||
Emerging Markets Value Fund | $ | 1,000.00 | $ | 1,108.60 | 1.17% | $ | 6.18 | |||||||||
International Small Cap Fund | $ | 1,000.00 | $ | 1,036.60 | 1.09% | $ | 5.56 | |||||||||
Core Plus Fixed Income Fund | $ | 1,000.00 | $ | 1,019.00 | 0.50% | $ | 2.53 | |||||||||
Credit Focus Yield Fund | $ | 1,000.00 | $ | 1,018.50 | 0.60% | $ | 3.04 | |||||||||
| Class R6 | ||||||||||||||||
Fund | Beginning Account Value | Ending Account Value | Annual Expense Ratio | Expenses Paid During the Period* | ||||||||||||
International Equity Fund | $ | 1,000.00 | $ | 1,074.10 | 0.82% | $ | 4.26 | |||||||||
Emerging Markets Value Fund | $ | 1,000.00 | $ | 1,110.00 | 1.01% | $ | 5.34 | |||||||||
International Small Cap Fund | $ | 1,000.00 | $ | 1,036.80 | 1.00% | $ | 5.11 | |||||||||
Hypothetical Example for Comparison Purposes
This section provides information about hypothetical account values and hypothetical expenses based on the Funds’ actual expense ratios and an assumed rate of return of 5% per year before expenses, which are not the Fund’s actual returns. The hypothetical account values and expenses may not be used to estimate the actual ending account balance or expenses you paid for the period. You may use this information to compare the ongoing costs of investing in the Funds and other mutual funds. To do so, compare this 5% hypothetical example with the 5% hypothetical examples that appear in the shareholder reports of the other mutual funds.
Please note that the expenses shown in the table are meant to highlight your ongoing costs only and do not reflect any transaction costs, such as sales charges (loads), redemption fees, or exchange fees. Therefore, the last column of the table is useful in comparing ongoing costs only, and will not help you determine the relative total costs of owning different funds. In addition, if these transactional costs were included, your costs would have been higher.
54
Brandes Investment Trust
| Class A | ||||||||||||||||
Fund | Beginning Account Value | Ending Account Value | Annual Expense Ratio | Expenses Paid During the Period* | ||||||||||||
International Equity Fund | $ | 1,000.00 | $ | 1,019.25 | 1.16% | $ | 5.87 | |||||||||
Global Equity Fund | $ | 1,000.00 | $ | 1,018.80 | 1.25% | $ | 6.33 | |||||||||
Global Equity Income Fund | $ | 1,000.00 | $ | 1,018.80 | 1.25% | $ | 6.33 | |||||||||
Global Opportunities Value Fund | $ | 1,000.00 | $ | 1,018.05 | 1.40% | $ | 7.08 | |||||||||
Emerging Markets Value Fund | $ | 1,000.00 | $ | 1,017.95 | 1.42% | $ | 7.18 | |||||||||
International Small Cap Fund | $ | 1,000.00 | $ | 1,018.60 | 1.29% | $ | 6.53 | |||||||||
Core Plus Fixed Income Fund | $ | 1,000.00 | $ | 1,021.56 | 0.70% | $ | 3.55 | |||||||||
Credit Focus Yield Fund | $ | 1,000.00 | $ | 1,020.81 | 0.85% | $ | 4.31 | |||||||||
| Class C | ||||||||||||||||
Fund | Beginning Account Value | Ending Account Value | Annual Expense Ratio | Expenses Paid During the Period* | ||||||||||||
International Equity Fund | $ | 1,000.00 | $ | 1,015.49 | 1.91% | $ | 9.65 | |||||||||
Global Equity Fund | $ | 1,000.00 | $ | 1,015.04 | 2.00% | $ | 10.10 | |||||||||
Global Equity Income Fund | $ | 1,000.00 | $ | 1,015.04 | 2.00% | $ | 10.10 | |||||||||
Global Opportunities Value Fund | $ | 1,000.00 | $ | 1,014.29 | 2.15% | $ | 10.86 | |||||||||
Emerging Markets Value Fund | $ | 1,000.00 | $ | 1,014.24 | 2.16% | $ | 10.91 | |||||||||
International Small Cap Fund | $ | 1,000.00 | $ | 1,014.84 | 2.04% | $ | 10.30 | |||||||||
| Class I | ||||||||||||||||
Fund | Beginning Account Value | Ending Account Value | Annual Expense Ratio | Expenses Paid During the Period* | ||||||||||||
International Equity Fund | $ | 1,000.00 | $ | 1,020.31 | 0.95% | $ | 4.81 | |||||||||
Global Equity Fund | $ | 1,000.00 | $ | 1,020.05 | 1.00% | $ | 5.06 | |||||||||
Global Equity Income Fund | $ | 1,000.00 | $ | 1,020.05 | 1.00% | $ | 5.06 | |||||||||
Global Opportunities Value Fund | $ | 1,000.00 | $ | 1,019.30 | 1.15% | $ | 5.82 | |||||||||
Emerging Markets Value Fund | $ | 1,000.00 | $ | 1,019.20 | 1.17% | $ | 5.92 | |||||||||
International Small Cap Fund | $ | 1,000.00 | $ | 1,019.60 | 1.09% | $ | 5.52 | |||||||||
Core Plus Fixed Income Fund | $ | 1,000.00 | $ | 1,022.56 | 0.50% | $ | 2.54 | |||||||||
Credit Focus Yield Fund | $ | 1,000.00 | $ | 1,022.06 | 0.60% | $ | 3.04 | |||||||||
55
Brandes Investment Trust
| Class R6 | ||||||||||||||||
Fund | Beginning Account Value | Ending Account Value | Annual Expense Ratio | Expenses Paid During the Period* | ||||||||||||
International Equity Fund | $ | 1,000.00 | $ | 1,020.96 | 0.82% | $ | 4.15 | |||||||||
Emerging Markets Value Fund | $ | 1,000.00 | $ | 1,019.94 | 1.01% | $ | 5.11 | |||||||||
International Small Cap Fund | $ | 1,000.00 | $ | 1,019.99 | 1.00% | $ | 5.06 | |||||||||
| * | Expenses are equal to the Fund’s expense ratio for the period, multiplied by the average account value over the period, multiplied by 183/365 (to reflect the one-half year period). |
56
Brandes International Equity Fund
SCHEDULE OF INVESTMENTS — September 30, 2017
| Shares | Value | |||||||
| COMMON STOCKS – 89.90% | ||||||||
| Austria – 1.03% | ||||||||
| 144,897 | Erste Group Bank AG | $ | 6,260,252 | |||||
|
| |||||||
| Brazil – 3.23% | ||||||||
| 465,977 | Embraer SA Sponsored – ADR | 10,535,740 | ||||||
| 1,901,100 | Petroleo Brasileiro SA(a) | 9,207,923 | ||||||
|
| |||||||
| 19,743,663 | ||||||||
|
| |||||||
| China – 1.51% | ||||||||
| 909,500 | China Mobile Ltd. | 9,233,204 | ||||||
|
| |||||||
| Finland – 1.41% | ||||||||
| 1,433,921 | Nokia OYJ | 8,615,670 | ||||||
|
| |||||||
| France – 15.05% | ||||||||
| 747,188 | Carrefour SA | 15,083,625 | ||||||
| 103,099 | Compagnie De Saint-Gobain SA | 6,142,609 | ||||||
| 1,014,349 | Engie SA | 17,224,978 | ||||||
| 719,850 | Orange SA | 11,786,716 | ||||||
| 134,896 | Publicis Groupe SA | 9,436,883 | ||||||
| 70,823 | Renault SA | 6,958,845 | ||||||
| 158,098 | Sanofi | 15,738,043 | ||||||
| 110,349 | Schneider Electric SE | 9,609,254 | ||||||
|
| |||||||
| 91,980,953 | ||||||||
|
| |||||||
| Hong Kong – 1.05% | ||||||||
| 7,994,000 | First Pacific Co. Ltd. | 6,391,256 | ||||||
|
| |||||||
| Ireland – 0.94% | ||||||||
| 37,407 | Willis Towers Watson Plc | 5,769,282 | ||||||
|
| |||||||
| Italy – 6.30% | ||||||||
| 1,062,914 | Eni SpA | 17,603,571 | ||||||
| 2,547,467 | Intesa Sanpaolo SpA | 9,018,774 | ||||||
| 14,064,963 | Telecom Italia Rsp | 10,585,609 | ||||||
| 1,365,052 | Telecom Italia SpA(a) | 1,280,461 | ||||||
|
| |||||||
| 38,488,415 | ||||||||
|
| |||||||
| Japan – 15.59% | ||||||||
| 712,100 | Astellas Pharma, Inc. | 9,063,284 | ||||||
| 274,700 | Dai Nippon Printing Co. Ltd. | 6,587,688 | ||||||
| 484,102 | Daiichi Sankyo Co. Ltd. | 10,924,588 | ||||||
| Shares | Value | |||||||
| 389,300 | Honda Motor Co. Ltd. | $ | 11,500,127 | |||||
| 184,300 | Mitsubishi Tanabe Pharma Corp. | 4,230,978 | ||||||
| 1,463,600 | Mitsubishi UFJ Financial Group, Inc. | 9,516,088 | ||||||
| 246,099 | MS&AD Insurance Group Holdings, Inc. | 7,930,881 | ||||||
| 760,700 | Nissan Motor Co. Ltd. | 7,535,970 | ||||||
| 258,500 | Sumitomo Mitsui Trust Holdings, Inc. | 9,337,720 | ||||||
| 123,200 | Taisho Pharmaceutical Holdings Co. Ltd. | 9,361,249 | ||||||
| 168,000 | Takeda Pharmaceutical Co. Ltd. | 9,289,718 | ||||||
|
| |||||||
| 95,278,291 | ||||||||
|
| |||||||
| Mexico – 2.47% | ||||||||
| 871,802 | Cemex SAB de CV Sponsored – ADR(a) | 7,915,962 | ||||||
| 4,262,143 | Fibra Uno Administracion SA de CV | 7,190,172 | ||||||
|
| |||||||
| 15,106,134 | ||||||||
|
| |||||||
| | Netherlands – 1.73% | |||||||
| 1,812,476 | AEGON NV | 10,564,904 | ||||||
|
| |||||||
| | Russia – 3.32% | |||||||
| 1,082,859 | Mobile TeleSystems PJSC | 5,306,123 | ||||||
| 139,363 | Oil Company LUKOIL PJSC | 7,418,491 | ||||||
| 84,652 | Oil Company LUKOIL PJSC Sponsored – ADR | 4,489,095 | ||||||
| 1,456,315 | Public Joint-Stock Co. Gazprom | 3,091,761 | ||||||
|
| |||||||
| 20,305,470 | ||||||||
|
| |||||||
| | South Africa – 0.48% | |||||||
| 286,655 | Barclays Africa Group Ltd. | 2,942,215 | ||||||
|
| |||||||
| | South Korea – 4.66% | |||||||
| 189,894 | Hana Financial Group, Inc. | 7,878,087 | ||||||
The accompanying notes are an integral part of these Schedules of Investments.
57
Brandes International Equity Fund
SCHEDULE OF INVESTMENTS — September 30, 2017 (continued)
| Shares | Value | |||||||
| 49,641 | Hyundai Mobis Co. Ltd. | $ | 10,422,517 | |||||
| 34,861 | Hyundai Motor Co. | 4,586,034 | ||||||
| 20,196 | POSCO | 5,612,155 | ||||||
|
| |||||||
| 28,498,793 | ||||||||
|
| |||||||
| | Spain – 1.73% | |||||||
| 571,084 | Repsol SA | 10,538,938 | ||||||
|
| |||||||
| | Sweden – 1.48% | |||||||
| 1,569,826 | LM Ericsson Telefon AB – Class B | 9,050,187 | ||||||
|
| |||||||
| | Switzerland – 7.09% | |||||||
| 876,095 | Credit Suisse Group AG | 13,881,372 | ||||||
| 16,049 | Swatch Group Ltd. Bearer | 6,687,885 | ||||||
| 37,669 | Swatch Group Ltd. Registered | 3,003,522 | ||||||
| 79,575 | Swiss Resources AG | 7,213,027 | ||||||
| 732,140 | UBS Group AG | 12,524,704 | ||||||
|
| |||||||
| 43,310,510 | ||||||||
|
| |||||||
| | United Kingdom – 20.83% | |||||||
| 86,832 | AstraZeneca Plc | 5,774,446 | ||||||
| 3,589,211 | Barclays Plc | 9,306,747 | ||||||
| 2,615,665 | BP Plc | 16,755,923 | ||||||
| Shares | Value | |||||||
| 992,768 | G4S Plc | $ | 3,703,885 | |||||
| 847,080 | GlaxoSmithKline Plc | 16,933,626 | ||||||
| 739,540 | HSBC Holdings Plc | 7,310,958 | ||||||
| 3,103,058 | J Sainsbury Plc | 9,893,498 | ||||||
| 2,691,048 | Kingfisher Plc | 10,774,087 | ||||||
| 2,932,093 | Marks & Spencer Group Plc | 13,882,500 | ||||||
| 5,220,064 | Tesco Plc(a) | 13,090,618 | ||||||
| 3,535,297 | Wm Morrison Supermarkets Plc | 11,089,995 | ||||||
| 472,972 | WPP Plc | 8,776,499 | ||||||
|
| |||||||
| 127,292,782 | ||||||||
|
| |||||||
| | TOTAL COMMON STOCKS | $ | 549,370,919 | |||||
|
| |||||||
| | PREFERRED STOCKS – 2.71% | | ||||||
| | Brazil – 1.40% | |||||||
| 417,300 | Telefonica Brasil SA | $ | 6,635,375 | |||||
| 120,102 | Telefonica Brasil SA Sponsored – ADR | 1,902,416 | ||||||
|
| |||||||
| 8,537,791 | ||||||||
|
| |||||||
| | Russia – 1.31% | |||||||
| 15,573,692 | Surgutneftegas OJSC | 8,008,709 | ||||||
|
| |||||||
| | TOTAL PREFERRED | $ | 16,546,500 | |||||
|
| |||||||
| Principal Amount | Value | |||||||
| REPURCHASE AGREEMENTS – 7.05% | ||||||||
State Street Bank and Trust Repurchase Agreement, | $ | 43,058,347 | $ | 43,058,347 | ||||
|
| |||||||
TOTAL REPURCHASE AGREEMENTS | $ | 43,058,347 | ||||||
|
| |||||||
Total Investments (Cost $645,385,505) – 99.66% | $ | 608,975,766 | ||||||
Other Assets in Excess of Liabilities – 0.34% | 2,075,567 | |||||||
|
| |||||||
TOTAL NET ASSETS – 100.00% | $ | 611,051,333 | ||||||
|
| |||||||
Percentages are stated as a percent of net assets.
ADR American Depositary Receipt
| (a) | Non-income producing security. |
The accompanying notes are an integral part of these Schedules of Investments.
58
Brandes International Equity Fund
SCHEDULE OF INVESTMENTS BY INDUSTRY — September 30, 2017
COMMON STOCKS | ||||
Aerospace & Defense | 1.72 | % | ||
Auto Components | 1.71 | % | ||
Automobiles | 5.00 | % | ||
Banks | 10.08 | % | ||
Building Products | 1.01 | % | ||
Capital Markets | 4.32 | % | ||
Commercial Services & Supplies | 1.68 | % | ||
Communications Equipment | 2.89 | % | ||
Construction Materials | 1.30 | % | ||
Diversified Financial Services | 1.05 | % | ||
Diversified Telecommunication Services | 3.87 | % | ||
Electrical Equipment | 1.57 | % | ||
Food & Staples Retailing | 8.04 | % | ||
Insurance | 5.15 | % | ||
Media | 2.98 | % | ||
Metals & Mining | 0.92 | % | ||
Multiline Retail | 2.27 | % | ||
Multi-Utilities | 2.82 | % | ||
Oil, Gas & Consumable Fuels | 11.30 | % | ||
Pharmaceuticals | 13.31 | % | ||
Real Estate Investment Trusts | 1.18 | % | ||
Specialty Retail | 1.76 | % | ||
Textiles, Apparel & Luxury Goods | 1.59 | % | ||
Wireless Telecommunication Services | 2.38 | % | ||
|
| |||
TOTAL COMMON STOCKS | 89.90 | % | ||
|
| |||
PREFERRED STOCKS | ||||
Diversified Telecommunication Services | 1.40 | % | ||
Oil, Gas & Consumable Fuels | 1.31 | % | ||
|
| |||
TOTAL PREFERRED STOCKS | 2.71 | % | ||
|
| |||
REPURCHASE AGREEMENTS | 7.05 | % | ||
|
| |||
TOTAL INVESTMENTS | 99.66 | % | ||
Other Assets in Excess of Liabilities | 0.34 | % | ||
|
| |||
TOTAL NET ASSETS | 100.00 | % | ||
|
| |||
The industry classifications represented in the Schedule of Investments are in accordance with Global Industry Classification Standards (GICS®), which was developed by and/or is the exclusive property of MSCI, Inc. and Standard & Poor Financial Services LLC. This information is unaudited.
The accompanying notes are an integral part of these Schedules of Investments.
59
SCHEDULE OF INVESTMENTS — September 30, 2017
| Shares | Value | |||||||
| COMMON STOCKS – 95.44% | ||||||||
| Aerospace & Defense – 2.41% | ||||||||
| 265,420 | Embraer SA | $ | 1,502,607 | |||||
| 7,378 | Embraer SA Sponsored – ADR | 166,816 | ||||||
|
| |||||||
| 1,669,423 | ||||||||
|
| |||||||
| Auto Components – 1.50% | ||||||||
| 4,950 | Hyundai Mobis Co. Ltd. | 1,039,291 | ||||||
|
| |||||||
| Automobiles – 5.66% | ||||||||
| 37,600 | Honda Motor Co. Ltd. | 1,110,724 | ||||||
| 11,771 | Hyundai Motor Co. | 1,548,499 | ||||||
| 127,000 | Nissan Motor Co. Ltd. | 1,258,141 | ||||||
|
| |||||||
| 3,917,364 | ||||||||
|
| |||||||
| Banks – 13.18% | ||||||||
| 58,097 | Bank of America Corp. | 1,472,178 | ||||||
| 228,395 | Barclays Plc | 592,223 | ||||||
| 33,346 | Citigroup, Inc. | 2,425,588 | ||||||
| 25,975 | Erste Group Bank AG | 1,122,246 | ||||||
| 87,902 | HSBC Holdings Plc | 868,983 | ||||||
| 7,941 | PNC Financial Services Group, Inc. | 1,070,209 | ||||||
| 28,404 | Wells Fargo & Co. | 1,566,481 | ||||||
|
| |||||||
| 9,117,908 | ||||||||
|
| |||||||
| Beverages – 0.75% | ||||||||
| 4,668 | PepsiCo, Inc. | 520,155 | ||||||
|
| |||||||
| Capital Markets – 8.11% | ||||||||
| 26,440 | Bank of New York Mellon Corp. | 1,401,849 | ||||||
| 100,897 | Credit Suisse Group AG | 1,598,672 | ||||||
| 11,138 | State Street Corp. | 1,064,124 | ||||||
| 90,575 | UBS Group AG | 1,549,465 | ||||||
|
| |||||||
| 5,614,110 | ||||||||
|
| |||||||
| Communications Equipment – 2.43% | ||||||||
| 148,782 | LM Ericsson Telefon AB – Class B | 857,742 | ||||||
| 137,193 | Nokia OYJ | 824,320 | ||||||
|
| |||||||
| 1,682,062 | ||||||||
|
| |||||||
| Diversified Financial Services – 1.33% | ||||||||
| 36,368 | Leucadia National Corp. | 918,292 | ||||||
|
| |||||||
| Shares | Value | |||||||
| | Diversified Telecommunication Services – 1.14% | | ||||||
| 1,045,481 | Telecom Italia Rsp | $ | 786,853 | |||||
|
| |||||||
| Electrical Equipment – 4.37% | ||||||||
| 17,086 | Emerson Electric Co. | 1,073,684 | ||||||
| 22,403 | Schneider Electric SE | 1,950,866 | ||||||
|
| |||||||
| 3,024,550 | ||||||||
|
| |||||||
| Food & Staples Retailing – 4.96% | ||||||||
| 34,285 | Carrefour SA | 692,118 | ||||||
| 297,726 | J Sainsbury Plc | 949,241 | ||||||
| 447,224 | Tesco Plc(a) | 1,121,526 | ||||||
| 212,603 | Wm Morrison Supermarkets Plc | 666,922 | ||||||
|
| |||||||
| 3,429,807 | ||||||||
|
| |||||||
| Health Care Providers & Services – 6.36% | ||||||||
| 10,199 | Cardinal Health, Inc. | 682,517 | ||||||
| 23,367 | Express Scripts Holding Co.(a) | 1,479,598 | ||||||
| 8,856 | HCA Healthcare, Inc.(a) | 704,849 | ||||||
| 9,960 | McKesson Corp. | 1,529,956 | ||||||
|
| |||||||
| 4,396,920 | ||||||||
|
| |||||||
| Insurance – 2.39% | ||||||||
| 16,667 | American International Group, Inc. | 1,023,187 | ||||||
| 6,929 | Swiss Resources AG | 628,075 | ||||||
|
| |||||||
| 1,651,262 | ||||||||
|
| |||||||
| Media – 3.02% | ||||||||
| 14,981 | Publicis Groupe SA | 1,048,022 | ||||||
| 56,266 | WPP Plc | 1,044,075 | ||||||
|
| |||||||
| 2,092,097 | ||||||||
|
| |||||||
| Multiline Retail – 1.70% | ||||||||
| 248,544 | Marks & Spencer Group Plc | 1,176,775 | ||||||
|
| |||||||
| Multi-Utilities – 2.71% | ||||||||
| 79,376 | Engie SA | 1,347,909 | ||||||
| 20,100 | Engie SA Registered Shares (Prime De Fidelite 2017) | 341,324 | ||||||
| 11,100 | Engie SA Registered Shares (Prime De Fidelite 2018) | 188,493 | ||||||
|
| |||||||
| 1,877,726 | ||||||||
|
| |||||||
The accompanying notes are an integral part of these Schedules of Investments.
60
Brandes Global Equity Fund
SCHEDULE OF INVESTMENTS — September 30, 2017 (continued)
| Shares | Value | |||||||
| Oil, Gas & Consumable Fuels – 11.14% | ||||||||
| 15,952 | Apache Corp. | $ | 730,602 | |||||
| 292,575 | BP Plc | 1,874,232 | ||||||
| 71,529 | Eni SpA | 1,184,636 | ||||||
| 24,494 | Oil Company LUKOIL PJSC Sponsored – ADR | 1,298,917 | ||||||
| 220,760 | Public Joint-Stock Co. Gazprom | 468,674 | ||||||
| 55,737 | Repsol SA | 1,028,586 | ||||||
| 20,884 | Total SA | 1,121,348 | ||||||
|
| |||||||
| 7,706,995 | ||||||||
|
| |||||||
| Pharmaceuticals – 12.58% | ||||||||
| 47,000 | Daiichi Sankyo Co. Ltd. | 1,060,635 | ||||||
| 105,356 | GlaxoSmithKline Plc | 2,106,128 | ||||||
| 21,071 | Merck & Co., Inc. | 1,349,176 | ||||||
| 52,336 | Pfizer, Inc. | 1,868,395 | ||||||
| 23,318 | Sanofi | 2,321,217 | ||||||
|
| |||||||
| 8,705,551 | ||||||||
|
| |||||||
| Software – 1.54% | ||||||||
| 14,270 | Microsoft Corp. | 1,062,972 | ||||||
|
| |||||||
| Shares | Value | |||||||
| Specialty Retail – 1.05% | ||||||||
| 182,119 | Kingfisher Plc | $ | 729,146 | |||||
|
| |||||||
| | Technology Hardware, Storage & Peripherals – 3.07% | | ||||||
| 628 | Samsung Electronics Co. Ltd. | 1,413,140 | ||||||
| 8,197 | Western Digital Corp. | 708,221 | ||||||
|
| |||||||
| 2,121,361 | ||||||||
|
| |||||||
| Tobacco – 2.59% | ||||||||
| 25,114 | Imperial Brands Plc | 1,071,884 | ||||||
| 7,830 | KT&G Corp. | 722,558 | ||||||
|
| |||||||
| 1,794,442 | ||||||||
|
| |||||||
| Wireless Telecommunication Services – 1.45% | ||||||||
| 99,000 | China Mobile Ltd. | 1,005,044 | ||||||
|
| |||||||
| | TOTAL COMMON STOCKS | $ | 66,040,106 | |||||
|
| |||||||
| Principal Amount | Value | |||||||
| REPURCHASE AGREEMENTS – 3.69% | ||||||||
State Street Bank and Trust Repurchase Agreement, | $ | 2,550,765 | $ | 2,550,765 | ||||
|
| |||||||
TOTAL REPURCHASE AGREEMENTS | $ | 2,550,765 | ||||||
|
| |||||||
Total Investments (Cost $60,498,797) – 99.13% | $ | 68,590,871 | ||||||
Other Assets in Excess of Liabilities – 0.87% | 599,203 | |||||||
|
| |||||||
TOTAL NET ASSETS – 100.00% | $ | 69,190,074 | ||||||
|
| |||||||
Percentages are stated as a percent of net assets.
| ADR | American Depositary Receipt |
| (a) | Non-income producing security. |
The accompanying notes are an integral part of these Schedules of Investments.
61
Brandes Global Equity Fund
SCHEDULE OF INVESTMENTS BY COUNTRY — September 30, 2017
COMMON STOCKS | ||||
Austria | 1.62 | % | ||
Brazil | 2.41 | % | ||
China | 1.45 | % | ||
Finland | 1.19 | % | ||
France | 13.02 | % | ||
Italy | 2.85 | % | ||
Japan | 4.96 | % | ||
Russia | 2.55 | % | ||
South Korea | 6.83 | % | ||
Spain | 1.49 | % | ||
Sweden | 1.24 | % | ||
Switzerland | 5.46 | % | ||
United Kingdom | 17.63 | % | ||
United States | 32.74 | % | ||
|
| |||
TOTAL COMMON STOCKS | 95.44 | % | ||
|
| |||
REPURCHASE AGREEMENTS | 3.69 | % | ||
|
| |||
TOTAL INVESTMENTS | 99.13 | % | ||
Other Assets in Excess of Liabilities | 0.87 | % | ||
|
| |||
TOTAL NET ASSETS | 100.00 | % | ||
|
| |||
The industry classifications represented in the Schedule of Investments are in accordance with Global Industry Classification Standards (GICS®), which was developed by and/or is the exclusive property of MSCI, Inc. and Standard & Poor Financial Services LLC. This information is unaudited.
The accompanying notes are an integral part of these Schedules of Investments.
62
Brandes Global Equity Income Fund
SCHEDULE OF INVESTMENTS — September 30, 2017
| Shares | Value | |||||||
| COMMON STOCKS – 90.02% | ||||||||
| Automobiles – 1.98% | ||||||||
| 700 | Honda Motor Co. Ltd. | $ | 20,678 | |||||
|
| |||||||
| Banks – 7.28% | ||||||||
| 377 | BB&T Corp. | 17,697 | ||||||
| 2,038 | HSBC Holdings Plc | 20,147 | ||||||
| 121 | PNC Financial Services Group, Inc. | 16,307 | ||||||
| 395 | Wells Fargo & Co. | 21,784 | ||||||
|
| |||||||
| 75,935 | ||||||||
|
| |||||||
| Beverages – 1.63% | ||||||||
| 312 | Diageo Plc | 10,260 | ||||||
| 60 | PepsiCo, Inc. | 6,686 | ||||||
|
| |||||||
| 16,946 | ||||||||
|
| |||||||
| Capital Markets – 5.91% | ||||||||
| 280 | Bank of New York Mellon Corp. | 14,846 | ||||||
| 1,123 | Credit Suisse Group AG | 17,793 | ||||||
| 1,695 | UBS Group AG | 28,996 | ||||||
|
| |||||||
| 61,635 | ||||||||
|
| |||||||
| Communications Equipment – 2.46% | ||||||||
| 2,502 | LM Ericsson Telefon AB – Class B | 14,424 | ||||||
| 1,875 | Nokia OYJ | 11,266 | ||||||
|
| |||||||
| 25,690 | ||||||||
|
| |||||||
| | Diversified Telecommunication Services – 3.77% | | ||||||
| 2,890 | Telefonica Brasil SA | 39,274 | ||||||
|
| |||||||
| Electric Utilities – 5.17% | ||||||||
| 3,400 | Companhia Paranaense de Energia | 25,002 | ||||||
| 152,328 | Enel Chile SA | 18,573 | ||||||
| 275 | Exelon Corp. | 10,359 | ||||||
|
| |||||||
| 53,934 | ||||||||
|
| |||||||
| Electrical Equipment – 5.20% | ||||||||
| 305 | Emerson Electric Co. | 19,166 | ||||||
| 403 | Schneider Electric SE | 35,094 | ||||||
|
| |||||||
| 54,260 | ||||||||
|
| |||||||
| Food & Staples Retailing – 5.63% | ||||||||
| 4,813 | J Sainsbury Plc | 15,345 | ||||||
| 6,533 | Tesco Plc(a) | 16,383 | ||||||
| 219 | Wal-Mart Stores, Inc. | 17,113 | ||||||
| Shares | Value | |||||||
| 3,159 | Wm Morrison Supermarkets Plc | $ | 9,910 | |||||
|
| |||||||
| 58,751 | ||||||||
|
| |||||||
| Health Care Providers & Services – 2.02% | ||||||||
| 315 | Cardinal Health, Inc. | 21,080 | ||||||
|
| |||||||
| Household Products – 1.00% | ||||||||
| 115 | Procter & Gamble Co. | 10,463 | ||||||
|
| |||||||
| Insurance – 1.50% | ||||||||
| 172 | Swiss Resources AG | 15,591 | ||||||
|
| |||||||
| | Media – 3.54% | | ||||||
| 228 | Publicis Groupe SA | 15,950 | ||||||
| 1,132 | WPP Plc | 21,006 | ||||||
|
| |||||||
| 36,956 | ||||||||
|
| |||||||
| | Multiline Retail – 1.61% | | ||||||
| 3,545 | Marks & Spencer Group Plc | 16,784 | ||||||
|
| |||||||
| | Multi-Utilities – 3.34% | | ||||||
| 1,648 | Engie SA | 27,985 | ||||||
| 400 | Engie SA Registered Shares (Prime De Fidelite 2018) | 6,793 | ||||||
|
| |||||||
| 34,778 | ||||||||
|
| |||||||
| | Oil, Gas & Consumable Fuels – 10.76% | | ||||||
| 4,439 | BP Plc | 28,436 | ||||||
| 77 | Chevron Corp. | 9,048 | ||||||
| 1,651 | Eni SpA | 27,343 | ||||||
| 802 | Royal Dutch Shell Plc – Class A | 24,238 | ||||||
| 430 | Total SA | 23,088 | ||||||
|
| |||||||
| 112,153 | ||||||||
|
| |||||||
| | Pharmaceuticals – 13.88% | | ||||||
| 600 | Daiichi Sankyo Co. Ltd. | 13,540 | ||||||
| 1,579 | GlaxoSmithKline Plc | 31,565 | ||||||
| 117 | Johnson & Johnson | 15,211 | ||||||
| 345 | Merck & Co., Inc. | 22,090 | ||||||
| 747 | Pfizer, Inc. | 26,668 | ||||||
| 358 | Sanofi | 35,638 | ||||||
|
| |||||||
| 144,712 | ||||||||
|
| |||||||
| | Real Estate Investment Trusts – 1.69% | | ||||||
| 10,415 | Fibra Uno Administracion SA de CV | 17,570 | ||||||
|
| |||||||
| | Software – 2.27% | | ||||||
| 318 | Microsoft Corp. | 23,688 | ||||||
|
| |||||||
The accompanying notes are an integral part of these Schedules of Investments.
63
Brandes Global Equity Income Fund
SCHEDULE OF INVESTMENTS — September 30, 2017 (continued)
| Shares | Value | |||||||
| | Specialty Retail – 1.49% | | ||||||
| 3,880 | Kingfisher Plc | $ | 15,534 | |||||
|
| |||||||
| | Textiles, Apparel & Luxury Goods – 3.42% | | ||||||
| 810 | Burberry Group Plc | 19,125 | ||||||
| 60 | LVMH Moet Hennessy Louis Vuitton SE | 16,586 | ||||||
|
| |||||||
| 35,711 | ||||||||
|
| |||||||
| | Tobacco – 4.47% | | ||||||
| 143 | British American Tobacco Plc | 8,952 | ||||||
| 507 | Imperial Brands Plc | 21,639 | ||||||
| 173 | KT&G Corp. | 15,965 | ||||||
|
| |||||||
| 46,556 | ||||||||
|
| |||||||
| | TOTAL COMMON STOCKS | $ | 938,679 | |||||
|
| |||||||
| | PREFERRED STOCKS – 9.03% | | ||||||
| | Banks – 2.42% | | ||||||
| 1,067 | Bank of America Corp., 4.000% (3M LIBOR + 0.500%, minimum of 4.000%)(b) | $ | 25,181 | |||||
|
| |||||||
| Shares | Value | |||||||
| | Capital Markets – 4.70% | | ||||||
| 1,031 | Goldman Sachs Group, Inc., 3.750% (3M LIBOR + 0.750%, minimum of 3.750%)(b) | $ | 24,528 | |||||
| 1,063 | Morgan Stanley, 4.000% (3M LIBOR + 0.700%, minimum of 4.000%)(b) | 24,513 | ||||||
|
| |||||||
| 49,041 | ||||||||
|
| |||||||
| | Technology Hardware, Storage & Peripherals – 1.91% | | ||||||
| 11 | Samsung Electronics Co. Ltd. | 19,897 | ||||||
|
| |||||||
| | TOTAL PREFERRED STOCKS | $ | 94,119 | |||||
|
| |||||||
| | Total Investments | $ | 1,032,798 | |||||
| | Other Assets in Excess of | 9,916 | ||||||
|
| |||||||
| | TOTAL NET ASSETS – 100.00% | $ | 1,042,714 | |||||
|
| |||||||
Percentages are stated as a percent of net assets.
| (a) | Non-income producing security. |
| (b) | Variable rate security. This coupon is based on a reference index and spread. |
The accompanying notes are an integral part of these Schedules of Investments.
64
Brandes Global Equity Income Fund
SCHEDULE OF INVESTMENTS BY INDUSTRY — September 30, 2017
COMMON STOCKS | ||||
Brazil | 6.16 | % | ||
Chile | 1.78 | % | ||
Finland | 1.08 | % | ||
France | 15.45 | % | ||
Italy | 2.62 | % | ||
Japan | 3.28 | % | ||
Mexico | 1.69 | % | ||
South Korea | 1.53 | % | ||
Sweden | 1.38 | % | ||
Switzerland | 5.98 | % | ||
United Kingdom | 24.87 | % | ||
United States | 24.20 | % | ||
|
| |||
TOTAL COMMON STOCKS | 90.02 | % | ||
|
| |||
PREFERRED STOCKS | ||||
South Korea | 1.91 | % | ||
United States | 7.12 | % | ||
|
| |||
TOTAL PREFERRED STOCKS | 9.03 | % | ||
|
| |||
TOTAL INVESTMENTS | 99.05 | % | ||
Other Assets in Excess of Liabilities | 0.95 | % | ||
|
| |||
TOTAL NET ASSETS | 100.00 | % | ||
|
| |||
The industry classifications represented in the Schedule of Investments are in accordance with Global Industry Classification Standards (GICS®), which was developed by and/or is the exclusive property of MSCI, Inc. and Standard & Poor Financial Services LLC. This information is unaudited.
The accompanying notes are an integral part of these Schedules of Investments.
65
Brandes Global Opportunities Value Fund
SCHEDULE OF INVESTMENTS — September 30, 2017
| Shares | Value | |||||||
| COMMON STOCKS – 87.50% | ||||||||
| Aerospace & Defense – 2.89% | ||||||||
| 40,416 | Embraer SA Sponsored – ADR | $ | 913,806 | |||||
|
| |||||||
| Auto Components – 2.46% | ||||||||
| 2,256 | Hyundai Mobis Co. Ltd. | 473,665 | ||||||
| 16,500 | Tachi-S Co. Ltd. | 305,686 | ||||||
|
| |||||||
| 779,351 | ||||||||
|
| |||||||
| Automobiles – 2.91% | ||||||||
| 15,900 | Honda Motor Co. Ltd. | 469,694 | ||||||
| 45,500 | Nissan Motor Co. Ltd. | 450,752 | ||||||
|
| |||||||
| 920,446 | ||||||||
|
| |||||||
| Banks – 6.69% | ||||||||
| 9,327 | Bank of America Corp. | 236,346 | ||||||
| 129,092 | Barclays Plc | 334,733 | ||||||
| 7,749 | Citigroup, Inc. | 563,662 | ||||||
| 8,847 | Erste Group Bank AG | 382,233 | ||||||
| 179,307 | Sberbank of Russia OJSC | 599,134 | ||||||
|
| |||||||
| 2,116,108 | ||||||||
|
| |||||||
| Beverages – 2.00% | ||||||||
| 117,419 | C&C Group Plc | 423,269 | ||||||
| 177 | Lotte Chilsung Beverage Co. Ltd. | 210,218 | ||||||
|
| |||||||
| 633,487 | ||||||||
|
| |||||||
| Capital Markets – 4.00% | ||||||||
| 34,768 | Credit Suisse Group AG | 550,885 | ||||||
| 2,502 | State Street Corp. | 239,041 | ||||||
| 27,787 | UBS Group AG | 475,352 | ||||||
|
| |||||||
| 1,265,278 | ||||||||
|
| |||||||
| Commercial Services & Supplies – 2.94% | ||||||||
| 51,121 | De La Rue Plc | 444,235 | ||||||
| 141,634 | Mitie Group Plc | 485,869 | ||||||
|
| |||||||
| 930,104 | ||||||||
|
| |||||||
| Communications Equipment – 1.05% | ||||||||
| 57,383 | LM Ericsson Telefon AB – Class B | 330,818 | ||||||
|
| |||||||
| Construction & Engineering – 0.76% | ||||||||
| 21,400 | Sanki Engineering Co. Ltd. | 240,179 | ||||||
|
| |||||||
| Shares | Value | |||||||
| Construction Materials – 0.94% | ||||||||
| 32,907 | Cemex SAB de CV Sponsored – ADR(a) | $ | 298,796 | |||||
|
| |||||||
| Diversified Financial Services – 2.11% | ||||||||
| 397,340 | First Pacific Co. Ltd. | 317,676 | ||||||
| 13,904 | Leucadia National Corp. | 351,076 | ||||||
|
| |||||||
| 668,752 | ||||||||
|
| |||||||
| | Diversified Telecommunication Services – 3.97% | | ||||||
| 72,050 | APT Satellite Holdings Ltd. | 33,760 | ||||||
| 117,693 | Magyar Telekom Telecommunications Plc | 214,289 | ||||||
| 610,512 | Telecom Italia Rsp | 459,485 | ||||||
| 40,300 | Telefonica Brasil SA | 547,657 | ||||||
|
| |||||||
| 1,255,191 | ||||||||
|
| |||||||
| Electric Utilities – 2.36% | ||||||||
| 54,100 | Companhia Paranaense de Energia | 397,831 | ||||||
| 16,320 | Reliance Infrastructure Ltd. – GDR | 348,574 | ||||||
|
| |||||||
| 746,405 | ||||||||
|
| |||||||
| Electrical Equipment – 1.84% | ||||||||
| 17,600 | Futaba Corp. | 332,278 | ||||||
| 2,868 | Schneider Electric SE | 249,747 | ||||||
|
| |||||||
| 582,025 | ||||||||
|
| |||||||
| Food & Staples Retailing – 6.50% | ||||||||
| 15,354 | Carrefour SA | 309,954 | ||||||
| 199,804 | J Sainsbury Plc | 637,036 | ||||||
| 205,415 | Tesco Plc(a) | 515,130 | ||||||
| 189,299 | Wm Morrison Supermarkets Plc | 593,818 | ||||||
|
| |||||||
| 2,055,938 | ||||||||
|
| |||||||
| Food Products – 0.95% | ||||||||
| 147,200 | Marfrig Global Foods SA(a) | 299,777 | ||||||
|
| |||||||
| Health Care Providers & Services – 2.93% | ||||||||
| 7,352 | Express Scripts Holding Co.(a) | 465,529 | ||||||
| 2,996 | McKesson Corp. | 460,215 | ||||||
|
| |||||||
| 925,744 | ||||||||
|
| |||||||
The accompanying notes are an integral part of these Schedules of Investments.
66
Brandes Global Opportunities Value Fund
SCHEDULE OF INVESTMENTS — September 30, 2017 (continued)
| Shares | Value | |||||||
| Household Durables – 2.53% | ||||||||
| 1,387,592 | Consorcio ARA SAB de CV | $ | 481,581 | |||||
| 9,600 | MDC Holdings, Inc. | 318,816 | ||||||
|
| |||||||
| 800,397 | ||||||||
|
| |||||||
| Insurance – 0.83% | ||||||||
| 1,699 | Willis Towers Watson Plc | 262,037 | ||||||
|
| |||||||
| Leisure Products – 0.96% | ||||||||
| 9,500 | Sankyo Co. Ltd. | 303,130 | ||||||
|
| |||||||
| Machinery – 2.80% | ||||||||
| 25,840 | Briggs & Stratton Corp. | 607,240 | ||||||
| 12,524 | China Yuchai International Ltd. | 278,784 | ||||||
|
| |||||||
| 886,024 | ||||||||
|
| |||||||
| Media – 0.96% | ||||||||
| 4,360 | Publicis Groupe SA | 305,011 | ||||||
|
| |||||||
| Metals & Mining – 0.91% | ||||||||
| 1,037 | POSCO | 288,166 | ||||||
|
| |||||||
| Multiline Retail – 2.64% | ||||||||
| 457,866 | Debenhams Plc | 303,702 | ||||||
| 112,163 | Marks & Spencer Group Plc | 531,055 | ||||||
|
| |||||||
| 834,757 | ||||||||
|
| |||||||
| Multi-Utilities – 1.67% | ||||||||
| 26,627 | Engie SA | 452,161 | ||||||
| 4,400 | Engie SA Registered Shares (Prime De Fidelite 2018) | 74,718 | ||||||
|
| |||||||
| 526,879 | ||||||||
|
| |||||||
| Oil, Gas & Consumable Fuels – 7.77% | ||||||||
| 81,935 | BP Plc | 524,875 | ||||||
| 58,550 | Chesapeake Energy Corp.(a) | 251,765 | ||||||
| 29,296 | �� | Eni SpA | 485,189 | |||||
| 9,696 | Oil Company LUKOIL PJSC Sponsored – ADR | 514,179 | ||||||
| 59,640 | Petroleo Brasileiro SA(a) | 288,864 | ||||||
| 94,099 | Public Joint-Stock Co. Gazprom Sponsored – ADR | 394,275 | ||||||
|
| |||||||
| 2,459,147 | ||||||||
|
| |||||||
| Shares | Value | |||||||
| Pharmaceuticals – 4.57% | ||||||||
| 31,785 | GlaxoSmithKline Plc | $ | 635,401 | |||||
| 12,300 | Kissei Pharmaceutical Co. Ltd. | 332,427 | ||||||
| 4,813 | Sanofi | 479,116 | ||||||
|
| |||||||
| 1,446,944 | ||||||||
|
| |||||||
| Real Estate Investment Trusts – 3.40% | ||||||||
| 230,344 | Fibra Uno Administracion SA de CV | 388,587 | ||||||
| 30,430 | Grivalia Properties Real Estate Investment Co. SA | 312,895 | ||||||
| 283,004 | Macquarie Mexico Real Estate Management SA de CV | 374,386 | ||||||
|
| |||||||
| 1,075,868 | ||||||||
|
| |||||||
| | Real Estate Management & Development – 3.53% | | ||||||
| 267,561 | Countrywide Plc(a) | 387,214 | ||||||
| 80,891 | LSL Property Services Plc | 254,996 | ||||||
| 25,210 | St Joe Co.(a) | 475,208 | ||||||
|
| |||||||
| 1,117,418 | ||||||||
|
| |||||||
| | Semiconductors & Semiconductor Equipment – 1.03% | | ||||||
| 6,000 | NuFlare Technology, Inc. | 324,508 | ||||||
|
| |||||||
| Specialty Retail – 1.51% | ||||||||
| 119,514 | Kingfisher Plc | 478,495 | ||||||
|
| |||||||
| | Technology Hardware, Storage & Peripherals – 1.03% | | ||||||
| 145 | Samsung Electronics Co. Ltd. | 326,282 | ||||||
|
| |||||||
| Textiles, Apparel & Luxury Goods – 1.10% | ||||||||
| 43,700 | TSI Holdings Co. Ltd. | 347,582 | ||||||
|
| |||||||
| Tobacco – 0.96% | ||||||||
| 3,304 | KT&G Corp. | 304,896 | ||||||
|
| |||||||
| Wireless Telecommunication Services – 2.00% | ||||||||
| 44,000 | China Mobile Ltd. | 446,686 | ||||||
| 806,798 | Sistema JSFC | 187,263 | ||||||
|
| |||||||
| 633,949 | ||||||||
|
| |||||||
| | TOTAL COMMON STOCKS | $ | 27,683,695 | |||||
|
| |||||||
The accompanying notes are an integral part of these Schedules of Investments.
67
Brandes Global Opportunities Value Fund
SCHEDULE OF INVESTMENTS — September 30, 2017 (continued)
| Shares | Value | |||||||
| PREFERRED STOCKS – 5.11% | ||||||||
| Automobiles – 1.96% | ||||||||
| 7,578 | Hyundai Motor Co. Ltd. NV | $ | 620,125 | |||||
|
| |||||||
| Banks – 0.99% | ||||||||
| 90,108 | Itausa – Investimentos Itau SA | 314,381 | ||||||
|
| |||||||
| Shares | Value | |||||||
| Food & Staples Retailing – 1.17% | ||||||||
| 15,600 | Companhia Brasileira de Distribuicao(a) | $ | 369,861 | |||||
|
| |||||||
| Oil, Gas & Consumable Fuels – 0.99% | ||||||||
| 610,843 | Surgutneftegas OJSC | 314,124 | ||||||
|
| |||||||
| | TOTAL PREFERRED STOCKS | $ | 1,618,491 | |||||
|
| |||||||
| Principal Amount | Value | |||||||
| REPURCHASE AGREEMENTS – 7.19% | ||||||||
State Street Bank and Trust Repurchase Agreement, | $ | 2,276,206 | $ | 2,276,206 | ||||
|
| |||||||
TOTAL REPURCHASE AGREEMENTS | $ | 2,276,206 | ||||||
|
| |||||||
Total Investments (Cost $29,135,561) – 99.80% | $ | 31,578,392 | ||||||
Other Assets in Excess of Liabilities – 0.20% | 64,471 | |||||||
|
| |||||||
TOTAL NET ASSETS – 100.00% | $ | 31,642,863 | ||||||
|
| |||||||
Percentages are stated as a percent of net assets.
ADR American Depositary Receipt
GDR Global Depositary Receipt
| (a) | Non-income producing security. |
The accompanying notes are an integral part of these Schedules of Investments.
68
Brandes Global Opportunities Value Fund
SCHEDULE OF INVESTMENTS BY COUNTRY — September 30, 2017
COMMON STOCKS | ||||
Austria | 1.21 | % | ||
Brazil | 7.74 | % | ||
China | 2.29 | % | ||
France | 5.91 | % | ||
Greece | 0.99 | % | ||
Hong Kong | 1.11 | % | ||
Hungary | 0.68 | % | ||
India | 1.10 | % | ||
Ireland | 2.17 | % | ||
Italy | 2.99 | % | ||
Japan | 9.82 | % | ||
Mexico | 4.88 | % | ||
Russia | 5.36 | % | ||
South Korea | 5.07 | % | ||
Sweden | 1.05 | % | ||
Switzerland | 3.24 | % | ||
United Kingdom | 19.35 | % | ||
United States | 12.54 | % | ||
|
| |||
TOTAL COMMON STOCKS | 87.50 | % | ||
|
| |||
PREFERRED STOCKS | ||||
Brazil | 2.16 | % | ||
Russia | 0.99 | % | ||
South Korea | 1.96 | % | ||
|
| |||
TOTAL PREFERRED STOCKS | 5.11 | % | ||
|
| |||
REPURCHASE AGREEMENTS | 7.19 | % | ||
|
| |||
TOTAL INVESTMENTS | 99.80 | % | ||
Other Assets in Excess of Liabilities | 0.20 | % | ||
|
| |||
TOTAL NET ASSETS | 100.00 | % | ||
|
| |||
The industry classifications represented in the Schedule of Investments are in accordance with Global Industry Classification Standards (GICS®), which was developed by and/or is the exclusive property of MSCI, Inc. and Standard & Poor Financial Services LLC. This information is unaudited.
The accompanying notes are an integral part of these Schedules of Investments.
69
Brandes Emerging Markets Value Fund
SCHEDULE OF INVESTMENTS — September 30, 2017
| Shares | Value | |||||||
| | COMMON STOCKS – 86.79% | | ||||||
| | Argentina – 2.60% | | ||||||
| 604,688 | Adecoagro SA(a) | $ | 6,530,630 | |||||
| 1,759,293 | YPF SA Sponsored – Class D – ADR | 39,197,048 | ||||||
|
| |||||||
| 45,727,678 | ||||||||
|
| |||||||
| | Austria – 1.45% | | ||||||
| 590,157 | Erste Group Bank AG | 25,497,639 | ||||||
|
| |||||||
| | Brazil – 11.71% | | ||||||
| 1,176,969 | AES Tiete Energia SA | 5,299,268 | ||||||
| 2,050,515 | Banco do Brasil SA | 22,627,757 | ||||||
| 800,010 | Companhia Paranaense de Energia | 5,882,965 | ||||||
| 2,227,091 | Embraer SA Sponsored – ADR | 50,354,528 | ||||||
| 4,401,100 | Estacio Participacoes SA | 43,036,189 | ||||||
| 4,944,300 | Kroton Educacional SA | 31,175,559 | ||||||
| 12,285,211 | Marfrig Global Foods SA(a) | 25,019,217 | ||||||
| 4,608,100 | Petroleo Brasileiro SA(a) | 22,319,200 | ||||||
|
| |||||||
| 205,714,683 | ||||||||
|
| |||||||
| | Chile – 2.41% | | ||||||
| 1,335,910 | Empresa Nacional de Telecomunicaciones SA | 13,816,822 | ||||||
| 51,051,761 | Enel Chile SA | 6,224,638 | ||||||
| 3,724,374 | Enel Chile SA Sponsored – ADR | 22,346,244 | ||||||
|
| |||||||
| 42,387,704 | ||||||||
|
| |||||||
| | China – 6.96% | | ||||||
| 174,645,000 | Bosideng International Holdings Ltd. | 16,178,159 | ||||||
| 5,884,900 | China Mobile Ltd. | 59,743,248 | ||||||
| Shares | Value | |||||||
| 173,073 | China Yuchai International Ltd. | $ | 3,852,605 | |||||
| 27,107,000 | Dongfeng Motor Group Co. Ltd. – Class H | 35,971,064 | ||||||
| 12,307,077 | Weiqiao Textile Co. Ltd. – Class H | 6,538,273 | ||||||
|
| |||||||
| 122,283,349 | ||||||||
|
| |||||||
| | Colombia – 1.09% | | ||||||
| 2,127,094 | Grupo Aval Acciones y Valores Grupo Sponsored – ADR | 19,080,033 | ||||||
|
| |||||||
| | Czech Republic – 0.69% | | ||||||
| 981,490 | O2 Czech Republic AS | 12,054,956 | ||||||
|
| |||||||
| | Greece – 1.58% | | ||||||
| 2,300,930 | Hellenic Telecommunications Organization SA | 27,820,015 | ||||||
|
| |||||||
| | Hong Kong – 5.91% | | ||||||
| 11,260,000 | Chow Tai Fook Jewellery Group Ltd. | 13,522,090 | ||||||
| 28,461,920 | First Pacific Co. Ltd. | 22,755,494 | ||||||
| 15,778,500 | Lifestyle China Group Ltd.(a) | 5,560,029 | ||||||
| 15,676,500 | Lifestyle International Holdings Ltd. | 21,964,784 | ||||||
| 7,754,000 | Luk Fook Holdings International Ltd. | 31,317,361 | ||||||
| 10,295,500 | Universal Medical Financial & Technical Advisory Services Co. Ltd.(c) | 8,538,779 | ||||||
|
| |||||||
| 103,658,537 | ||||||||
|
| |||||||
| | India – 5.77% | | ||||||
| 2,564,446 | Infosys Ltd. | 35,406,524 | ||||||
| 3,568,434 | Reliance Infrastructure Ltd. | 25,456,825 | ||||||
The accompanying notes are an integral part of these Schedules of Investments.
70
Brandes Emerging Markets Value Fund
SCHEDULE OF INVESTMENTS — September 30, 2017 (continued)
| Shares | Value | |||||||
| 34,348 | Reliance Infrastructure Ltd. Sponsored – GDR | $ | 733,629 | |||||
| 5,668,310 | Tech Mahindra Ltd. | 39,767,212 | ||||||
|
| |||||||
| 101,364,190 | ||||||||
|
| |||||||
| | Indonesia – 2.07% | | ||||||
| 130,976,015 | PT XL Axiata Tbk(a) | 36,368,720 | ||||||
|
| |||||||
| | Luxembourg – 0.51% | | ||||||
| 288,888 | Ternium SA Sponsored – ADR | 8,935,306 | ||||||
|
| |||||||
| | Mexico – 7.34% | | ||||||
| 4,302,049 | Cemex SAB de CV Sponsored –ADR(a) | 39,062,605 | ||||||
| 20,356,293 | Fibra Uno Administracion SA de CV | 34,340,764 | ||||||
| 17,287,809 | Fideicomiso PLA Administradora Industrial S de RL de CV | 29,762,373 | ||||||
| 16,304,539 | Macquarie Mexico Real Estate Management SA de CV | 21,569,267 | ||||||
| 10,242,449 | Urbi Desarrollos Urbanos SA de CV(a)(d) | 4,190,349 | ||||||
|
| |||||||
| 128,925,358 | ||||||||
|
| |||||||
| | Pakistan – 0.60% | | ||||||
| 7,646,760 | Nishat Mills Ltd. | 10,529,489 | ||||||
|
| |||||||
| | Panama – 1.31% | | ||||||
| 778,859 | Banco Latinoamericano de Comercio Exterior SA – Class E | 22,929,609 | ||||||
|
| |||||||
| | Russia – 11.57% | | ||||||
| 2,544,018 | MegaFon PJSC | 28,993,679 | ||||||
| 7,077,248 | Mobile TeleSystems PJSC | 34,679,258 | ||||||
| Shares | Value | |||||||
| 908,041 | Oil Company LUKOIL PJSC Sponsored – ADR | $ | 48,153,415 | |||||
| 5,318,206 | Public Joint-Stock Co. Gazprom | 11,290,567 | ||||||
| 3,939,534 | Public Joint-Stock Co. Gazprom Sponsored – ADR | 16,506,647 | ||||||
| 3,772,241 | Sberbank of Russia OJSC Sponsored – ADR | 53,829,880 | ||||||
| 31,695,179 | Sistema JSFC | 7,356,641 | ||||||
| 508,944 | Sistema JSFC Sponsored – GDR | 2,442,931 | ||||||
|
| |||||||
| 203,253,018 | ||||||||
|
| |||||||
| | South Africa – 1.96% | | ||||||
| 3,354,022 | Barclays Africa Group Ltd. | 34,425,548 | ||||||
|
| |||||||
| | South Korea – 10.31% | | ||||||
| 255,390 | Hana Financial Group, Inc. | 10,595,304 | ||||||
| 181,976 | Hyundai Mobis Co. Ltd. | 38,207,286 | ||||||
| 953,413 | KIA Motors Corp. | 26,377,906 | ||||||
| 489,993 | KT&G Corp. | 45,216,923 | ||||||
| 58,451 | POSCO | 16,242,625 | ||||||
| 16,148 | Samsung Electronics Co. Ltd. | 36,336,614 | ||||||
| 185,013 | Shinhan Financial Group Co. Ltd. | 8,177,259 | ||||||
|
| |||||||
| 181,153,917 | ||||||||
|
| |||||||
| | Spain – 1.07% | | ||||||
| 6,246,765 | Prosegur Cash SA(a)(c) | 18,789,761 | ||||||
|
| |||||||
| | Thailand – 3.57% | | ||||||
| 4,653,000 | Bangkok Bank Plc – NVDR | 26,052,933 | ||||||
| 43,883,700 | Jasmine Broadband Internet Infrastructure | 15,132,310 | ||||||
| 976,200 | Kasikornbank Plc – NVDR | 6,070,941 | ||||||
The accompanying notes are an integral part of these Schedules of Investments.
71
Brandes Emerging Markets Value Fund
SCHEDULE OF INVESTMENTS — September 30, 2017 (continued)
| Shares | Value | |||||||
| 3,353,000 | Siam Commercial Bank PCL | $ | 15,416,548 | |||||
|
| |||||||
| 62,672,732 | ||||||||
|
| |||||||
| | Turkey – 5.21% | | ||||||
| 6,190,065 | Akbank TAS | 16,335,943 | ||||||
| 46,880,368 | Emlak Konut Gayrimenkul Yatirim Ortakligi AG(a) | 35,275,663 | ||||||
| 6,223,640 | Turkiye Garanti Bankasi Anonim Sirketi | 16,909,886 | ||||||
| 13,031,246 | Turkiye Vakiflar Bankasi Turk Anonim Ortakligi | 22,941,020 | ||||||
|
| |||||||
| 91,462,512 | ||||||||
|
| |||||||
| | United Kingdom – 1.10% | | ||||||
| 8,002,860 | ITE Group Plc | 19,276,054 | ||||||
|
| |||||||
| | TOTAL COMMON STOCKS | $ | 1,524,310,808 | |||||
|
| |||||||
| | PREFERRED STOCKS – 10.95% | | ||||||
| | Brazil – 6.95% | | ||||||
| 1,950,537 | Banco Bradesco SA | 21,666,133 | ||||||
| 1,820,200 | Companhia Brasileira de Distribuicao(a) | 43,155,144 | ||||||
| 709,810 | Companhia Brasileira de Distribuicao Sponsored – Class A – ADR(a) | 16,801,203 | ||||||
| 1,510,250 | Companhia Paranaense de Energia – COPEL B | 13,375,594 | ||||||
| 2,760 | Companhia Paranaense de Energia Sponsored – Class B – ADR | 24,454 | ||||||
| Shares | Value | |||||||
| 1,123,832 | Petroleo Brasileiro Sponsored – ADR(a) | $ | 10,856,217 | |||||
| 13,500 | Telefonica Brasil SA | 214,660 | ||||||
| 1,004,568 | Telefonica Brasil SA Sponsored – ADR | 15,912,357 | ||||||
|
| |||||||
| 122,005,762 | ||||||||
|
| |||||||
| | Colombia – 0.46% | | ||||||
| 17,832,796 | Grupo Aval Acciones y Valores SA | 8,046,153 | ||||||
|
| |||||||
| | Russia – 1.54% | | ||||||
| 29,632,736 | Surgutneftegas OJSC | 15,238,516 | ||||||
| 2,304,816 | Surgutneftegas OJSC Sponsored – ADR | 11,915,899 | ||||||
|
| |||||||
| 27,154,415 | ||||||||
|
| |||||||
| | South Korea – 2.00% | | ||||||
| 428,865 | Hyundai Motor Co. Ltd. | 35,095,005 | ||||||
|
| |||||||
| | TOTAL PREFERRED | $ | 192,301,335 | |||||
|
| |||||||
| | PARTICIPATORY NOTES – 0.57% | | ||||||
| | Saudi Arabia – 0.57% | | ||||||
| 843,595 | Banque Saudi Fransi(a)(b)(e) | $ | 6,798,251 | |||||
| 453,335 | Saudi British Bank(a)(b)(e) | 3,274,892 | ||||||
|
| |||||||
| | TOTAL PARTICIPATORY | $ | 10,073,143 | |||||
|
| |||||||
The accompanying notes are an integral part of these Schedules of Investments.
72
Brandes Emerging Markets Value Fund
SCHEDULE OF INVESTMENTS — September 30, 2017 (continued)
| Principal Amount | Value | |||||||
| REPURCHASE AGREEMENTS – 1.85% | ||||||||
State Street Bank and Trust Repurchase Agreement, | $ | 32,427,807 | $ | 32,427,807 | ||||
|
| |||||||
TOTAL REPURCHASE AGREEMENTS | $ | 32,427,807 | ||||||
|
| |||||||
Total Investments (Cost $1,629,053,019) – 100.16% | $ | 1,759,113,093 | ||||||
Liabilities in Excess of Other Assets – (0.16)% | (2,798,445 | ) | ||||||
|
| |||||||
TOTAL NET ASSETS – 100.00% | $ | 1,756,314,648 | ||||||
|
| |||||||
Percentages are stated as a percent of net assets.
ADR American Depositary Receipt
GDR Global Depositary Receipt
NVDR Non-Voting Depositary Receipt
| (a) | Non-income producing security. |
| (b) | The prices for these securities were derived from an estimate of fair market value using methods approved by the Fund’s Board of Trustees. These securities represent $10,073,143 or 0.57% of the Fund’s net assets and are classified as Level 2 securities. See Note 2 in the Notes to Financial Statements. |
| (c) | Acquired in a transaction exempt from registration under Rule 144A or Section 4(a)(2) of the Securities Act of 1933. May be resold in the U.S. in transactions exempt from registration, normally to qualified institutional buyers. The total value of all such securities was $27,328,540, which represented 1.56% of the net assets of the Fund. |
| (d) | Affiliated issuer. See Note 8 in the Notes to Financial Statements. |
| (e) | Represents the underlying security of a participatory note with HSBC Bank Plc. Both Banque Saudi Fransi and Saudi British Bank have maturity dates of March 24, 2020. See Note 5 in the Notes to Financial Statements. |
The accompanying notes are an integral part of these Schedules of Investments.
73
Brandes Emerging Markets Value Fund
SCHEDULE OF INVESTMENTS BY INDUSTRY — September 30, 2017
COMMON STOCKS | ||||
Aerospace & Defense | 2.87 | % | ||
Auto Components | 2.18 | % | ||
Automobiles | 3.55 | % | ||
Banks | 17.13 | % | ||
Commercial Services & Supplies | 1.07 | % | ||
Construction Materials | 2.22 | % | ||
Diversified Consumer Services | 4.23 | % | ||
Diversified Financial Services | 1.30 | % | ||
Diversified Telecommunication Services | 2.27 | % | ||
Electric Utilities | 3.44 | % | ||
Food Products | 1.80 | % | ||
Health Care Providers & Services | 0.49 | % | ||
Household Durables | 0.24 | % | ||
Independent Power and Renewable Electricity Producers | 0.30 | % | ||
IT Services | 4.28 | % | ||
Machinery | 0.22 | % | ||
Media | 1.10 | % | ||
Metals & Mining | 1.43 | % | ||
Multiline Retail | 1.57 | % | ||
Oil, Gas & Consumable Fuels | 7.83 | % | ||
Real Estate Investment Trusts | 7.75 | % | ||
Specialty Retail | 2.55 | % | ||
Technology Hardware, Storage & Peripherals | 2.07 | % | ||
Textiles, Apparel & Luxury Goods | 1.89 | % | ||
Tobacco | 2.57 | % | ||
Wireless Telecommunication Services | 10.44 | % | ||
|
| |||
TOTAL COMMON STOCKS | 86.79 | % | ||
|
| |||
PREFERRED STOCKS | ||||
Automobiles | 2.00 | % | ||
Banks | 1.69 | % | ||
Diversified Telecommunication Services | 0.92 | % | ||
Electric Utilities | 0.77 | % | ||
Food & Staples Retailing | 3.41 | % | ||
Oil, Gas & Consumable Fuels | 2.16 | % | ||
|
| |||
TOTAL PREFERRED STOCKS | 10.95 | % | ||
|
| |||
PARTICIPATORY NOTES | ||||
Banks | 0.57 | % | ||
|
| |||
TOTAL PARTICIPATORY NOTES | 0.57 | % | ||
|
| |||
REPURCHASE AGREEMENTS | 1.85 | % | ||
|
| |||
TOTAL INVESTMENTS | 100.16 | % | ||
Liabilities in Excess of Other Assets | (0.16 | )% | ||
|
| |||
TOTAL NET ASSETS | 100.00 | % | ||
|
| |||
The industry classifications represented in the Schedule of Investments are in accordance with Global Industry Classification Standards (GICS®), which was developed by and/or is the exclusive property of MSCI, Inc. and Standard & Poor Financial Services LLC. This information is unaudited.
The accompanying notes are an integral part of these Schedules of Investments.
74
Brandes International Small Cap Equity Fund
SCHEDULE OF INVESTMENTS — September 30, 2017
| Shares | Value | |||||||
| COMMON STOCKS – 85.48% | ||||||||
| Belgium – 1.31% | ||||||||
| 521,144 | D’Ieteren SA | $ | 23,921,069 | |||||
|
| |||||||
| Brazil – 5.91% | ||||||||
| 12,661,806 | Embraer SA | 71,681,538 | ||||||
| 10,886,724 | Marfrig Global Foods SA(a) | 22,171,154 | ||||||
| 9,498,900 | Mills Estruturas e Servicos de Engenharia SA(a)(b) | 13,916,264 | ||||||
|
| |||||||
| 107,768,956 | ||||||||
|
| |||||||
| Canada – 4.64% | ||||||||
| 1,712,214 | Cameco Corp. | 16,557,109 | ||||||
| 1,597,184 | Dorel Industries, Inc. – Class B(a)(b) | 38,222,332 | ||||||
| 14,797 | E-L Financial Corp. Ltd.(a) | 10,032,668 | ||||||
| 522,036 | Norbord, Inc. | 19,877,324 | ||||||
|
| |||||||
| 84,689,433 | ||||||||
|
| |||||||
| China – 1.81% | ||||||||
| 18,931,250 | APT Satellite Holdings Ltd. | 8,870,380 | ||||||
| 49,404,500 | Sinotrans Shipping Ltd. | 14,309,874 | ||||||
| 18,429,000 | Weiqiao Textile Co. Ltd. – Class H | 9,790,613 | ||||||
|
| |||||||
| 32,970,867 | ||||||||
|
| |||||||
| France – 1.01% | ||||||||
| 191,944 | Savencia SA | 18,375,445 | ||||||
|
| |||||||
| Germany – 2.28% | ||||||||
| 156,726 | Draegerwerk AG & Co. KGaA | 13,188,620 | ||||||
| 843,653 | Rhoen-Klinikum AG | 28,407,604 | ||||||
|
| |||||||
| 41,596,224 | ||||||||
|
| |||||||
| Greece – 2.01% | ||||||||
| 1,005,596 | GR Sarantis SA | 14,725,605 | ||||||
| 2,136,124 | Grivalia Properties Real Estate Investment Co. SA | 21,964,636 | ||||||
|
| |||||||
| 36,690,241 | ||||||||
|
| |||||||
| Shares | Value | |||||||
| Hong Kong – 1.14% | ||||||||
| 10,889,500 | Dickson Concepts International Ltd. | $ | 4,314,915 | |||||
| 316,040,000 | Emperor Watch & Jewellery Ltd. | 16,476,633 | ||||||
|
| |||||||
| 20,791,548 | ||||||||
|
| |||||||
| Hungary – 1.53% | ||||||||
| 15,336,018 | Magyar Telekom Telecommunications Plc | 27,922,992 | ||||||
|
| |||||||
| India – 2.99% | ||||||||
| 2,988,135 | NIIT Technologies Ltd. | 24,853,696 | ||||||
| 4,164,040 | Reliance Infrastructure Ltd. | 29,705,814 | ||||||
|
| |||||||
| 54,559,510 | ||||||||
|
| |||||||
| Ireland – 3.30% | ||||||||
| 16,714,412 | C&C Group Plc(b) | 60,251,692 | ||||||
|
| |||||||
| Japan – 27.59% | ||||||||
| 297,500 | Bank of Nagoya Ltd. | 11,699,263 | ||||||
| 546,000 | Denki Kogyo Co. Ltd. | 13,858,378 | ||||||
| 2,301,000 | Fuji Media Holdings, Inc. | 32,776,816 | ||||||
| 1,940,800 | Funai Electric Co. Ltd.(b) | 15,174,817 | ||||||
| 961,100 | Futaba Corp. | 18,145,016 | ||||||
| 4,974,900 | Hachijuni Bank Ltd. | 31,127,492 | ||||||
| 191,700 | Hisamitsu Pharmaceutical Co., Inc. | 9,212,523 | ||||||
| 5,362,000 | Hyakugo Bank Ltd. | 23,974,258 | ||||||
| 1,208,800 | Kato Sangyo Co. Ltd. | 36,392,030 | ||||||
| 1,199,200 | Kissei Pharmaceutical Co. Ltd. | 32,410,320 | ||||||
| 2,495,900 | Komori Corp. | 31,415,532 | ||||||
| 419,000 | Nippon Seiki Co. Ltd. | 8,557,941 | ||||||
| 107,700 | Nitto Kogyo Corp. | 1,905,203 | ||||||
The accompanying notes are an integral part of these Schedules of Investments.
75
Brandes International Small Cap Equity Fund
SCHEDULE OF INVESTMENTS — September 30, 2017 (continued)
| Shares | Value | |||||||
| 311,700 | NuFlare Technology, Inc. | $ | 16,858,167 | |||||
| 282,500 | Oita Bank Ltd. | 11,722,626 | ||||||
| 499,200 | San-in Godo Bank Ltd. | 4,328,983 | ||||||
| 1,653,700 | Sanki Engineering Co. Ltd. | 18,559,986 | ||||||
| 1,218,900 | Sankyo Co. Ltd. | 38,893,143 | ||||||
| 1,666,100 | Sintokogio Ltd. | 18,036,907 | ||||||
| 1,272,700 | Tachi-S Co. Ltd. | 23,578,629 | ||||||
| 605,300 | Torii Pharmaceutical Co. Ltd. | 17,225,925 | ||||||
| 1,097,700 | Toyo Suisan Kaisha Ltd. | 40,328,005 | ||||||
| 1,908,400 | TSI Holdings Co. Ltd. | 15,179,069 | ||||||
| 283,700 | Tsutsumi Jewelry Co. Ltd. | 4,900,729 | ||||||
| 943,500 | Wacoal Holdings Corp. | 26,934,062 | ||||||
|
| |||||||
| 503,195,820 | ||||||||
|
| |||||||
| Mexico – 3.55% | ||||||||
| 43,348,757 | Consorcio ARA SAB de CV | 15,044,709 | ||||||
| 48,856,674 | Desarrolladora Homex SAB de CV(a)(b) | 2,602,470 | ||||||
| 13,695,224 | Fibra Uno Administracion SA de CV | 23,103,640 | ||||||
| 14,209,590 | Macquarie Mexico Real Estate Management SA de CV | 18,797,859 | ||||||
| 12,867,533 | Urbi Desarrollos Urbanos SA de CV(a)(b) | 5,264,312 | ||||||
|
| |||||||
| 64,812,990 | ||||||||
|
| |||||||
| Philippines – 0.61% | ||||||||
| 8,360,430 | First Philippine Holdings Corp. | 11,183,008 | ||||||
|
| |||||||
| Russia – 1.04% | ||||||||
| 81,998,430 | Sistema JSFC | 19,032,328 | ||||||
|
| |||||||
| Shares | Value | |||||||
| South Korea – 4.95% | ||||||||
| 271,006 | Binggrae Co. Ltd. | $ | 14,216,357 | |||||
| 21,603 | Lotte Chilsung Beverage Co. Ltd. | 25,657,261 | ||||||
| 142,050 | Lotte Confectionery Co. Ltd. | 20,726,634 | ||||||
| 4,394 | Namyang Dairy Products Co. Ltd. | 2,558,107 | ||||||
| 110,727 | S-1 Corp. | 8,640,637 | ||||||
| 208,685 | Samchully Co. Ltd.(b) | 18,402,397 | ||||||
|
| |||||||
| 90,201,393 | ||||||||
|
| |||||||
| Spain – 2.48% | ||||||||
| 1,075,142 | Hispania Activos Inmobiliarios SOCIMI SA | 19,378,224 | ||||||
| 2,651,804 | Lar Espana Real Estate SOCIMI SA | 25,762,710 | ||||||
|
| |||||||
| 45,140,934 | ||||||||
|
| |||||||
| United Kingdom – 17.33% | ||||||||
| 5,001,259 | Balfour Beatty Plc | 18,053,455 | ||||||
| 15,257,124 | Countrywide Plc(a)(b) | 22,080,070 | ||||||
| 3,553,084 | De La Rue Plc | 30,875,889 | ||||||
| 61,009,910 | Debenhams Plc | 40,467,800 | ||||||
| 7,262,710 | ITE Group Plc | 17,493,295 | ||||||
| 12,162,211 | J Sainsbury Plc | 38,776,848 | ||||||
| 6,965,771 | LSL Property Services Plc(b) | 21,958,509 | ||||||
| 12,427,717 | Mitie Group Plc | 42,632,713 | ||||||
| 20,750,447 | Premier Foods Plc(a) | 11,678,331 | ||||||
| 9,129,706 | Spirent Communications Plc | 11,744,433 | ||||||
| 2,959,039 | Telit Communications Plc | 6,938,934 | ||||||
| 17,015,273 | Wm Morrison Supermarkets Plc | 53,375,794 | ||||||
|
| |||||||
| 316,076,071 | ||||||||
|
| |||||||
| | TOTAL COMMON STOCKS | $ | 1,559,180,521 | |||||
|
| |||||||
The accompanying notes are an integral part of these Schedules of Investments.
76
Brandes International Small Cap Equity Fund
SCHEDULE OF INVESTMENTS — September 30, 2017 (continued)
| Shares | Value | |||||||
| PREFERRED STOCKS – 2.40% | ||||||||
| Brazil – 1.90% | ||||||||
| 3,915,449 | Companhia Paranaense de Energia – COPEL B | $ | 34,677,342 | |||||
|
| |||||||
| Germany – 0.50% | ||||||||
| 82,162 | Draegerwerk AG & Co. KGaA | 9,124,271 | ||||||
|
| |||||||
| | TOTAL PREFERRED | $ | 43,801,613 | |||||
|
| |||||||
| Principal Amount | Value | |||||||
| CORPORATE NOTES – 0.10% | ||||||||
| Mexico – 0.10% | ||||||||
Desarrolladora Homex SAB de CV Promissory Note(a)(c) | $ | 1,879,080 | $ | 1,913,263 | ||||
|
| |||||||
TOTAL CORPORATE NOTES | $ | 1,913,263 | ||||||
|
| |||||||
| REPURCHASE AGREEMENTS – 10.23% | ||||||||
State Street Bank and Trust Repurchase Agreement, | $ | 58,377,367 | $ | 58,377,367 | ||||
State Street Bank and Trust Repurchase Agreement, | 128,260,882 | 128,260,882 | ||||||
|
| |||||||
TOTAL REPURCHASE AGREEMENTS | $ | 186,638,249 | ||||||
|
| |||||||
Total Investments (Cost $1,686,263,078) – 98.21% | $ | 1,791,533,646 | ||||||
Other Assets in Excess of Liabilities – 1.79% | 32,576,054 | |||||||
|
| |||||||
TOTAL NET ASSETS – 100.00% | $ | 1,824,109,700 | ||||||
|
| |||||||
Percentages are stated as a percent of net assets.
| (a) | Non-income producing security. |
| (b) | Affiliated issuer. See Note 8 in the Notes to Financial Statements. |
| (c) | Acquired in a transaction exempt from registration under Rule 144A or Section 4(a)(2) of the Securities Act of 1933. May be resold in the U.S. in transactions exempt from registration, normally to qualified institutional buyers. The total value of all such securities was $1,913,263, which represented 0.10% of the net assets of the Fund. |
The accompanying notes are an integral part of these Schedules of Investments.
77
Brandes International Small Cap Equity Fund
SCHEDULE OF INVESTMENTS BY INDUSTRY — September 30, 2017
COMMON STOCKS | ||||
Aerospace & Defense | 3.93 | % | ||
Auto Components | 1.76 | % | ||
Banks | 4.54 | % | ||
Beverages | 4.71 | % | ||
Commercial Services & Supplies | 4.51 | % | ||
Communications Equipment | 1.78 | % | ||
Construction & Engineering | 2.01 | % | ||
Distributors | 1.31 | % | ||
Diversified Telecommunication Services | 2.02 | % | ||
Electric Utilities | 2.24 | % | ||
Electrical Equipment | 1.10 | % | ||
Food & Staples Retailing | 7.05 | % | ||
Food Products | 7.13 | % | ||
Gas Utilities | 1.01 | % | ||
Health Care Equipment & Supplies | 0.72 | % | ||
Health Care Providers & Services | 1.56 | % | ||
Household Durables | 4.18 | % | ||
Insurance | 0.55 | % | ||
Leisure Products | 2.13 | % | ||
Machinery | 2.71 | % | ||
Marine | 0.78 | % | ||
Media | 2.76 | % | ||
Multiline Retail | 2.22 | % | ||
Oil, Gas & Consumable Fuels | 0.91 | % | ||
Paper & Forest Products | 1.09 | % | ||
Personal Products | 0.81 | % | ||
Pharmaceuticals | 3.23 | % | ||
Real Estate Investment Trusts | 5.99 | % | ||
Real Estate Management & Development | 2.41 | % | ||
Semiconductors & Semiconductor Equipment | 0.92 | % | ||
Software | 1.36 | % | ||
Specialty Retail | 1.14 | % | ||
Textiles, Apparel & Luxury Goods | 3.11 | % | ||
Trading Companies & Distributors | 0.76 | % | ||
Wireless Telecommunication Services | 1.04 | % | ||
|
| |||
TOTAL COMMON STOCKS | 85.48 | % | ||
|
| |||
PREFERRED STOCKS | ||||
Electric Utilities | 1.90 | % | ||
Health Care Equipment & Supplies | 0.50 | % | ||
|
| |||
TOTAL PREFERRED STOCKS | 2.40 | % | ||
|
| |||
CORPORATE NOTES | ||||
Household Durables | 0.10 | % | ||
|
| |||
TOTAL CORPORATE NOTES | 0.10 | % | ||
|
| |||
The accompanying notes are an integral part of these Schedules of Investments.
78
Brandes International Small Cap Equity Fund
SCHEDULE OF INVESTMENTS BY INDUSTRY — September 30, 2017 (continued)
REPURCHASE AGREEMENTS | 10.23 | % | ||
|
| |||
TOTAL INVESTMENTS | 98.21 | % | ||
Other Assets in Excess of Liabilities | 1.79 | % | ||
|
| |||
TOTAL NET ASSETS | 100.00 | % | ||
|
| |||
The industry classifications represented in the Schedule of Investments are in accordance with Global Industry Classification Standards (GICS®), which was developed by and/or is the exclusive property of MSCI, Inc. and Standard & Poor Financial Services LLC. This information is unaudited.
The accompanying notes are an integral part of these Schedules of Investments.
79
Brandes Core Plus Fixed Income Fund
SCHEDULE OF INVESTMENTS — September 30, 2017
| Shares | Value | |||||||
| COMMON STOCKS – 0.01% | ||||||||
| Household Durables – 0.01% | ||||||||
Urbi Desarrollos Urbanos SA de CV(a) | 31,277 | $ | 12,796 | |||||
|
| |||||||
TOTAL COMMON STOCKS | $ | 12,796 | ||||||
|
| |||||||
| Principal Amount | Value | |||||||
| FEDERAL AND FEDERALLY SPONSORED CREDITS – 4.00% | ||||||||
| Federal Home Loan Mortgage Corporation – 2.21% | ||||||||
Pool G1-8578, 3.000%, 12/1/2030 | $ | 1,974,573 | $ | 2,030,840 | ||||
Pool G0-6018, 6.500%, 4/1/2039 | 33,695 | 37,818 | ||||||
Pool A9-3505, 4.500%, 8/1/2040 | 151,578 | 163,410 | ||||||
|
| |||||||
| 2,232,068 | ||||||||
|
| |||||||
| Federal National Mortgage Association – 1.79% | ||||||||
Pool 254631, 5.000%, 2/1/2018 | 5,304 | 5,426 | ||||||
Pool 934124, 5.500%, 7/1/2038 | 50,063 | 55,691 | ||||||
Pool MA0918, 4.000%, 12/1/2041 | 332,585 | 351,598 | ||||||
Pool AS6201, 3.500%, 11/1/2045 | 1,357,130 | 1,400,084 | ||||||
|
| |||||||
| 1,812,799 | ||||||||
|
| |||||||
TOTAL FEDERAL AND FEDERALLY SPONSORED CREDITS | $ | 4,044,867 | ||||||
|
| |||||||
| OTHER MORTGAGE RELATED SECURITIES – 0.08% | ||||||||
| Collateralized Mortgage Obligations – 0.00% | ||||||||
Wells Fargo Mortgage Backed Securities Trust | $ | 1,808 | $ | 1,715 | ||||
|
| |||||||
| Near Prime Mortgage – 0.08% | ||||||||
Bear Stearns ALT-A Trust | 81,626 | 80,497 | ||||||
|
| |||||||
TOTAL OTHER MORTGAGE RELATED SECURITIES | $ | 82,212 | ||||||
|
| |||||||
| US GOVERNMENTS – 59.89% | ||||||||
| Sovereign – 59.89% | ||||||||
United States Treasury Bond | $ | 1,925,000 | $ | 2,556,340 | ||||
United States Treasury Note | 14,161,000 | 14,270,527 | ||||||
2.000%, 2/15/2023 | 16,390,000 | 16,398,963 | ||||||
2.375%, 8/15/2024 | 24,055,000 | 24,394,213 | ||||||
2.250%, 2/15/2027 | 3,000,000 | 2,981,836 | ||||||
|
| |||||||
TOTAL US GOVERNMENTS | $ | 60,601,879 | ||||||
|
| |||||||
The accompanying notes are an integral part of these Schedules of Investments.
80
Brandes Core Plus Fixed Income Fund
SCHEDULE OF INVESTMENTS — September 30, 2017 (continued)
| Principal Amount | Value | |||||||
| ASSET BACKED SECURITIES – 1.97% | ||||||||
| Equipment – 0.03% | ||||||||
Continental Airlines 2007-1 Class A Pass Through Trust | $ | 29,466 | $ | 32,412 | ||||
|
| |||||||
| Student Loan – 1.94% | ||||||||
SLM Private Credit Student Loan Trust | 300,000 | 281,678 | ||||||
SLM Private Credit Student Loan Trust | 400,000 | 374,119 | ||||||
SLM Private Credit Student Loan Trust | 1,025,000 | 978,386 | ||||||
SLM Private Credit Student Loan Trust | 350,000 | 322,372 | ||||||
|
| |||||||
| 1,956,555 | ||||||||
|
| |||||||
TOTAL ASSET BACKED SECURITIES | $ | 1,988,967 | ||||||
|
| |||||||
| CORPORATE BONDS – 30.75% | ||||||||
| Banks & Thrifts – 7.72% | ||||||||
Bank of America Corp. | $ | 1,475,000 | $ | 1,554,578 | ||||
Citigroup, Inc. | 885,000 | 890,279 | ||||||
Fifth Third Bancorp | 175,000 | 266,067 | ||||||
Goldman Sachs Group, Inc. | 1,025,000 | 1,100,859 | ||||||
JPMorgan Chase & Co. | 2,085,000 | 2,147,550 | ||||||
USB Capital IX | 750,000 | 667,912 | ||||||
Wells Fargo & Co. | 1,150,000 | 1,184,500 | ||||||
|
| |||||||
| 7,811,745 | ||||||||
|
| |||||||
| Commercial Services & Supplies – 1.49% | ||||||||
ADT Corp. | 1,510,000 | 1,510,000 | ||||||
|
| |||||||
| Electric Utilities – 3.33% | ||||||||
Arizona Public Service Co. | 340,000 | 371,403 | ||||||
Commonwealth Edison Co. | 175,000 | 221,996 | ||||||
FirstEnergy Corp. | 1,465,000 | 1,948,930 | ||||||
The accompanying notes are an integral part of these Schedules of Investments.
81
Brandes Core Plus Fixed Income Fund
SCHEDULE OF INVESTMENTS — September 30, 2017 (continued)
| Principal Amount | Value | |||||||
Israel Electric Corp. Ltd. | $ | 420,000 | $ | 444,759 | ||||
Oncor Electric Delivery Co., LLC | 315,000 | 377,422 | ||||||
|
| |||||||
| 3,364,510 | ||||||||
|
| |||||||
| Food, Beverage & Tobacco – 1.00% | ||||||||
Pilgrim’s Pride Corp. | 25,000 | 25,531 | ||||||
Tesco Plc | 980,000 | 983,508 | ||||||
|
| |||||||
| 1,009,039 | ||||||||
|
| |||||||
| Forest Products & Paper – 0.56% | ||||||||
Tembec Industries, Inc. | 555,000 | 570,956 | ||||||
|
| |||||||
| Health Care Providers & Services – 1.46% | ||||||||
Tenet Healthcare Corp. | 1,385,000 | 1,476,008 | ||||||
|
| |||||||
| Homebuilders – 0.91% | ||||||||
PulteGroup, Inc. | 370,000 | 403,448 | ||||||
Toll Brothers Finance Corp. | 495,000 | 515,543 | ||||||
|
| |||||||
| 918,991 | ||||||||
|
| |||||||
| Independent Power and Renewable Electricity Producers – 0.26% | ||||||||
Talen Energy Supply, LLC | 255,000 | 257,550 | ||||||
|
| |||||||
| Insurance – 1.40% | ||||||||
American International Group, Inc. | 800,000 | 899,446 | ||||||
CNA Financial Corp. | 135,000 | 147,450 | ||||||
Voya Financial, Inc. | 335,000 | 373,186 | ||||||
|
| |||||||
| 1,420,082 | ||||||||
|
| |||||||
| Metals & Mining – 1.52% | ||||||||
Cloud Peak Energy Resources, LLC / Cloud Peak Energy Finance Corp. 12.000%, 11/1/2021 | 1,030,000 | 1,081,500 | ||||||
6.375%, 3/15/2024 | 540,000 | 452,250 | ||||||
|
| |||||||
| 1,533,750 | ||||||||
|
| |||||||
| Oil, Gas & Consumable Fuels – 7.47% | ||||||||
BP Capital Markets Plc | 1,115,000 | 1,121,748 | ||||||
3.506%, 3/17/2025 | 810,000 | 836,028 | ||||||
The accompanying notes are an integral part of these Schedules of Investments.
82
Brandes Core Plus Fixed Income Fund
SCHEDULE OF INVESTMENTS — September 30, 2017 (continued)
| Principal Amount | Value | |||||||
Chesapeake Energy Corp. | $ | 1,925,000 | $ | 1,939,437 | ||||
Exxon Mobil Corp. | 745,000 | 751,150 | ||||||
Kinder Morgan, Inc. | 904,000 | 946,960 | ||||||
Occidental Petroleum Corp. | 405,000 | 414,499 | ||||||
Range Resources Corp. | 1,375,000 | 1,364,688 | ||||||
Valero Energy Corp. | 170,000 | 187,167 | ||||||
|
| |||||||
| 7,561,677 | ||||||||
|
| |||||||
| Telecommunications – 3.63% | ||||||||
AT&T, Inc. | 1,480,000 | 1,494,410 | ||||||
Frontier Communications Corp. | 830,000 | 682,426 | ||||||
Sprint Communications, Inc. | 1,175,000 | 1,262,150 | ||||||
Telecom Italia Capital SA | 85,000 | 87,635 | ||||||
Telefonica Emisiones SAU | 135,000 | 147,970 | ||||||
|
| |||||||
| 3,674,591 | ||||||||
|
| |||||||
TOTAL CORPORATE BONDS | $ | 31,108,899 | ||||||
|
| |||||||
| REPURCHASE AGREEMENTS – 3.00% | ||||||||
State Street Bank and Trust Repurchase Agreement, | $ | 3,038,874 | $ | 3,038,874 | ||||
|
| |||||||
TOTAL REPURCHASE AGREEMENTS | $ | 3,038,874 | ||||||
|
| |||||||
Total Investments (Cost $99,770,995) – 99.70% | $ | 100,878,494 | ||||||
Other Assets in Excess of Liabilities – 0.30% | 308,190 | |||||||
|
| |||||||
TOTAL NET ASSETS – 100.00% | $ | 101,186,684 | ||||||
|
| |||||||
Percentages are stated as a percent of net assets.
| (a) | Non-income producing security. |
The accompanying notes are an integral part of these Schedules of Investments.
83
Brandes Core Plus Fixed Income Fund
SCHEDULE OF INVESTMENTS — September 30, 2017 (continued)
| (b) | Acquired in a transaction exempt from registration under Rule 144A or Section 4(a)(2) of the Securities Act of 1933. May be resold in the U.S. in transactions exempt from registration, normally to qualified institutional buyers. The total value of all such securities was $4,651,592, which represented 4.60% of the net assets of the Fund. |
| (c) | Variable rate security. The coupon is based on an underlying pool of loans. |
| (d) | Variable rate security. The coupon is based on a reference index and spread. |
The industry classifications represented in the Schedule of Investments are in accordance with Global Industry Classification Standards (GICS®), which was developed by and/or is the exclusive property of MSCI, Inc. and Standard & Poor Financial Services LLC. This information is unaudited.
The accompanying notes are an integral part of these Schedules of Investments.
84
Brandes Credit Focus Yield Fund
SCHEDULE OF INVESTMENTS — September 30, 2017
| Shares | Value | |||||||
| COMMON STOCKS – 0.03% | ||||||||
| Household Durables – 0.03% | ||||||||
| Urbi Desarrollos Urbanos SA de CV(a) | 23,362 | $ | 9,558 | |||||
|
| |||||||
TOTAL COMMON STOCKS | $ | 9,558 | ||||||
|
| |||||||
| Principal Amount | Value | |||||||
| US GOVERNMENTS – 41.76% | ||||||||
| Sovereign – 41.76% | ||||||||
United States Treasury Note | ||||||||
3.375%, 11/15/2019 | $ | 3,380,000 | $ | 3,512,031 | ||||
2.000%, 11/15/2021 | 3,890,000 | 3,920,087 | ||||||
2.000%, 2/15/2023 | 1,975,000 | 1,976,080 | ||||||
2.375%, 8/15/2024 | 3,525,000 | 3,574,708 | ||||||
2.250%, 2/15/2027 | 305,000 | 303,153 | ||||||
|
| |||||||
TOTAL US GOVERNMENTS | $ | 13,286,059 | ||||||
|
| |||||||
| ASSET BACKED SECURITIES – 2.64% | ||||||||
| Equipment – 0.26% | ||||||||
Continental Airlines 2007-1 Class A Pass Through Trust | $ | 73,664 | $ | 81,031 | ||||
|
| |||||||
| Student Loan – 2.38% | ||||||||
SLM Private Credit Student Loan Trust | 505,000 | 482,034 | ||||||
SLM Private Credit Student Loan Trust | 300,000 | 276,319 | ||||||
|
| |||||||
| 758,353 | ||||||||
|
| |||||||
TOTAL ASSET BACKED SECURITIES | $ | 839,384 | ||||||
|
| |||||||
| CORPORATE BONDS – 52.64% | ||||||||
| Banks & Thrifts – 12.09% | ||||||||
Bank of America Corp. | $ | 700,000 | $ | 737,766 | ||||
Citigroup, Inc. | 500,000 | 502,983 | ||||||
Fifth Third Bancorp | 65,000 | 98,825 | ||||||
Goldman Sachs Group, Inc. | 490,000 | 526,264 | ||||||
JPMorgan Chase & Co. | 1,140,000 | 1,174,200 | ||||||
USB Capital IX | 350,000 | 311,692 | ||||||
The accompanying notes are an integral part of these Schedules of Investments.
85
Brandes Credit Focus Yield Fund
SCHEDULE OF INVESTMENTS — September 30, 2017 (continued)
| Principal Amount | Value | |||||||
Wells Fargo & Co. | $ | 480,000 | $ | 494,400 | ||||
|
| |||||||
| 3,846,130 | ||||||||
|
| |||||||
| Commercial Services & Supplies – 2.34% | ||||||||
ADT Corp. | 745,000 | 745,000 | ||||||
|
| |||||||
| Computers & Peripherals – 2.35% | ||||||||
Apple, Inc. | 750,000 | 748,577 | ||||||
|
| |||||||
| Electric Utilities – 5.22% | ||||||||
Arizona Public Service Co. | 435,000 | 475,178 | ||||||
FirstEnergy Corp. | 380,000 | 505,524 | ||||||
Israel Electric Corp. Ltd. | 505,000 | 534,770 | ||||||
Oncor Electric Delivery Co., LLC | 120,000 | 143,780 | ||||||
|
| |||||||
| 1,659,252 | ||||||||
|
| |||||||
| Food, Beverage & Tobacco – 1.80% | ||||||||
Pilgrim’s Pride Corp. | 15,000 | 15,319 | ||||||
Tesco Plc | 555,000 | 556,986 | ||||||
|
| |||||||
| 572,305 | ||||||||
|
| |||||||
| Forest Products & Paper – 0.86% | ||||||||
Tembec Industries, Inc. | 265,000 | 272,619 | ||||||
|
| |||||||
| Health Care Providers & Services – 2.25% | ||||||||
Tenet Healthcare Corp. | 670,000 | 714,026 | ||||||
|
| |||||||
| Homebuilders – 1.44% | ||||||||
PulteGroup, Inc. | 205,000 | 223,532 | ||||||
Toll Brothers Finance Corp. | 225,000 | 234,337 | ||||||
|
| |||||||
| 457,869 | ||||||||
|
| |||||||
| Independent Power & Renewable Electricity Producers – 0.70% | ||||||||
Talen Energy Supply, LLC | 220,000 | 222,200 | ||||||
|
| |||||||
The accompanying notes are an integral part of these Schedules of Investments.
86
Brandes Credit Focus Yield Fund
SCHEDULE OF INVESTMENTS — September 30, 2017 (continued)
| Principal Amount | Value | |||||||
| Insurance – 3.76% | ||||||||
American International Group, Inc. | $ | 485,000 | $ | 545,289 | ||||
CNA Financial Corp. | 235,000 | 256,673 | ||||||
Voya Financial, Inc. | 355,000 | 395,465 | ||||||
|
| |||||||
| 1,197,427 | ||||||||
|
| |||||||
| Metals & Mining – 1.97% | ||||||||
Cloud Peak Energy Resources, LLC / Cloud Peak Energy Finance Corp. | ||||||||
12.000%, 11/1/2021 | 470,000 | 493,500 | ||||||
6.375%, 3/15/2024 | 160,000 | 134,000 | ||||||
|
| |||||||
| 627,500 | ||||||||
|
| |||||||
| Oil, Gas & Consumable Fuels – 12.08% | ||||||||
BP Capital Markets Plc | ||||||||
2.241%, 9/26/2018 | 475,000 | 477,874 | ||||||
3.506%, 3/17/2025 | 445,000 | 459,300 | ||||||
Chesapeake Energy Corp. | 1,010,000 | 1,017,575 | ||||||
Exxon Mobil Corp. | 435,000 | 438,591 | ||||||
Kinder Morgan, Inc. | 353,000 | 369,775 | ||||||
Occidental Petroleum Corp. | 220,000 | 225,160 | ||||||
Range Resources Corp. | 635,000 | 630,237 | ||||||
Valero Energy Corp. | 205,000 | 225,702 | ||||||
|
| |||||||
| 3,844,214 | ||||||||
|
| |||||||
| Telecommunications – 5.78% | ||||||||
AT&T, Inc. | 710,000 | 716,913 | ||||||
Frontier Communications Corp. | 385,000 | 316,547 | ||||||
Sprint Communications, Inc. | 535,000 | 574,681 | ||||||
Telecom Italia Capital SA | 140,000 | 144,340 | ||||||
Telefonica Emisiones SAU | 80,000 | 87,686 | ||||||
|
| |||||||
| 1,840,167 | ||||||||
|
| |||||||
TOTAL CORPORATE BONDS | $ | 16,747,286 | ||||||
|
| |||||||
The accompanying notes are an integral part of these Schedules of Investments.
87
Brandes Credit Focus Yield Fund
SCHEDULE OF INVESTMENTS — September 30, 2017 (continued)
| Principal Amount | Value | |||||||
| REPURCHASE AGREEMENTS – 2.54% | ||||||||
State Street Bank and Trust Repurchase Agreement, | $ | 807,133 | $ | 807,133 | ||||
|
| |||||||
TOTAL REPURCHASE AGREEMENTS | $ | 807,133 | ||||||
|
| |||||||
Total Investments (Cost $31,295,670) – 99.61% | $ | 31,689,420 | ||||||
Other Assets in Excess of Liabilities – 0.39% | 125,468 | |||||||
|
| |||||||
TOTAL NET ASSETS – 100.00% | $ | 31,814,888 | ||||||
|
| |||||||
Percentages are stated as a percent of net assets.
| (a) | Non-income producing security. |
| (b) | Acquired in a transaction exempt from registration under Rule 144A or Section 4(a)(2) of the Securities Act of 1933. May be resold in the U.S. in transactions exempt from registration, normally to qualified institutional buyers. The total value of all such securities was $2,584,612, which represented 8.12% of the net assets of the Fund. |
| (c) | Variable rate security. This coupon is based on a reference index and spread. |
The industry classifications represented in the Schedule of Investments are in accordance with Global Industry Classification Standards (GICS®), which was developed by and/or is the exclusive property of MSCI, Inc. and Standard & Poor Financial Services LLC. This information is unaudited.
The accompanying notes are an integral part of these Schedules of Investments.
88
(This Page Intentionally Left Blank.)
89
Brandes Investment Trust
STATEMENTS OF ASSETS AND LIABILITIES — September 30, 2017
| Brandes International Equity Fund | Brandes Global Equity Fund | |||||||
ASSETS | ||||||||
Investment in securities, at value(1) | ||||||||
Unaffiliated issuers | $ | 608,975,766 | $ | 68,590,871 | ||||
Affiliated issuers | — | — | ||||||
Cash | — | — | ||||||
Restricted Cash | — | — | ||||||
Foreign Currency(1) | 1,064,921 | 133,807 | ||||||
Receivables: | ||||||||
Securities sold | — | 516,830 | ||||||
Fund shares sold | 1,035,137 | 2,470 | ||||||
Dividends and interest | 1,854,812 | 124,847 | ||||||
Foreign currency spot trade | — | — | ||||||
Tax reclaims | 339,699 | 23,644 | ||||||
Due from Advisor | — | — | ||||||
Prepaid expenses and other assets | 28,186 | 16,755 | ||||||
|
|
|
| |||||
Total Assets | 613,298,521 | 69,409,224 | ||||||
|
|
|
| |||||
LIABILITIES | ||||||||
Payables: | ||||||||
Securities purchased | — | — | ||||||
Fund shares redeemed | 1,237,194 | 76,121 | ||||||
Due to Advisor | 391,833 | 32,329 | ||||||
12b-1 Fee | 17,099 | 2,603 | ||||||
Trustee Fees | 14,217 | 6,075 | ||||||
Due to Custodian | — | — | ||||||
Dividends payable | 190,309 | 1,551 | ||||||
Foreign tax witholding | 147,776 | 8,110 | ||||||
Foreign currency spot trade payable | — | 302 | ||||||
Accrued expenses | 248,760 | 92,059 | ||||||
|
|
|
| |||||
Total Liabilities | 2,247,188 | 219,150 | ||||||
|
|
|
| |||||
NET ASSETS | $ | 611,051,333 | $ | 69,190,074 | ||||
|
|
|
| |||||
COMPONENTS OF NET ASSETS | ||||||||
Paid-in capital | $ | 705,475,486 | $ | 59,788,536 | ||||
Undistributed net investment income (loss) | (3,081,120 | ) | (88,001 | ) | ||||
Accumulated net realized gain (loss) on investments and foreign currency | (54,932,540 | ) | 1,398,292 | |||||
Net unrealized appreciation (depreciation) on: | ||||||||
Investments | (36,409,739 | ) | 8,092,074 | |||||
Foreign currency | (754 | ) | (827 | ) | ||||
|
|
|
| |||||
Total Net Assets | $ | 611,051,333 | $ | 69,190,074 | ||||
|
|
|
| |||||
Net asset value, offering price and redemption proceeds per share | ||||||||
Class A Shares | ||||||||
Net Assets | $ | 31,489,293 | $ | 5,850,410 | ||||
Shares outstanding (unlimited shares authorized without par value) | 1,801,714 | 239,587 | ||||||
Offering and redemption price | $ | 17.48 | $ | 24.42 | ||||
|
|
|
| |||||
Maximum offering price per share* | $ | 18.54 | $ | 25.91 | ||||
|
|
|
| |||||
Class C Shares | ||||||||
Net Assets | $ | 17,890,365 | $ | 1,682,325 | ||||
Shares outstanding (unlimited shares authorized without par value) | 1,034,069 | 69,294 | ||||||
Offering and redemption price | $ | 17.30 | $ | 24.28 | ||||
|
|
|
| |||||
Class I Shares | ||||||||
Net Assets | $ | 523,158,201 | $ | 61,657,339 | ||||
Shares outstanding (unlimited shares authorized without par value) | 29,865,210 | 2,509,045 | ||||||
Offering and redemption price | $ | 17.52 | $ | 24.57 | ||||
|
|
|
| |||||
Class R6 Shares | ||||||||
Net Assets | $ | 38,513,474 | N/A | |||||
Shares outstanding (unlimited shares authorized without par value) | 2,193,055 | N/A | ||||||
Offering and redemption price | $ | 17.56 | N/A | |||||
|
|
|
| |||||
(1) Cost of: | ||||||||
Investments in securities | ||||||||
Unaffiliated issuers | $ | 645,385,505 | $ | 60,498,797 | ||||
Affiliated issuers | — | — | ||||||
Foreign currency | 1,065,430 | 134,583 | ||||||
| * | Includes a sales load of 5.75% for the International, Global, Global Equity Income, Global Opportunities Value, Emerging Markets Value, and International Small Cap Funds and 3.75% for the Core Plus Fixed Income and Credit Focus Yield Funds (see Note 7 of the Notes to Financial Statements). |
The accompanying notes to financial statements are an integral part of this statement.
90
Brandes Investment Trust
STATEMENTS OF ASSETS AND LIABILITIES — September 30, 2017 (continued)
Brandes | Brandes Global Opportunities Value Fund | Brandes Emerging Markets Value Fund | Brandes International Small Cap Equity Fund | Brandes Core Plus Fixed Income Fund | Brandes Credit Focus Yield Fund | |||||||||||||||||
| $ | 1,032,798 | $ | 31,578,392 | $ | 1,754,922,744 | $ | 1,593,660,783 | $ | 100,878,494 | $ | 31,689,420 | |||||||||||
| — | — | 4,190,349 | 197,872,863 | — | — | |||||||||||||||||
| 38,900 | — | — | — | — | — | |||||||||||||||||
| — | — | — | 8,697,992 | — | — | |||||||||||||||||
| 950 | 50,612 | — | 480,562 | — | — | |||||||||||||||||
| — | — | 9,108,737 | 19,237,735 | — | — | |||||||||||||||||
| — | 5,000 | 3,114,043 | 3,781,223 | 275,341 | — | |||||||||||||||||
| 4,068 | 81,075 | 2,268,333 | 6,793,865 | 728,959 | 339,409 | |||||||||||||||||
| — | — | 8,930 | 642 | — | — | |||||||||||||||||
| 225 | 4,367 | 27,834 | 357,092 | — | — | |||||||||||||||||
| 13,107 | — | — | — | — | — | |||||||||||||||||
| 2,266 | 3,971 | 47,726 | 51,002 | 11,277 | 8,563 | |||||||||||||||||
|
|
|
|
|
|
|
|
|
|
|
| |||||||||||
| 1,092,314 | 31,723,417 | 1,773,688,696 | 1,830,933,759 | 101,894,071 | 32,037,392 | |||||||||||||||||
|
|
|
|
|
|
|
|
|
|
|
| |||||||||||
| — | — | 10,768,541 | 1,331,625 | 507,750 | 152,325 | |||||||||||||||||
| — | 2,856 | 2,606,912 | 2,848,659 | 80,936 | 4,204 | |||||||||||||||||
| — | 2,280 | 1,330,639 | 1,425,771 | 18,041 | 362 | |||||||||||||||||
| 2 | 688 | 83,430 | 52,588 | 817 | 617 | |||||||||||||||||
| 1,101 | 2,341 | 36,692 | 37,704 | 5,361 | 4,203 | |||||||||||||||||
| — | — | 894,942 | — | — | — | |||||||||||||||||
| 100 | 2,663 | 916,053 | 88,977 | 8,955 | 5,050 | |||||||||||||||||
| 234 | 5,377 | 146,744 | 556,954 | — | — | |||||||||||||||||
| — | — | — | — | — | — | |||||||||||||||||
| 48,163 | 64,349 | 590,095 | 481,781 | 85,527 | 55,743 | |||||||||||||||||
|
|
|
|
|
|
|
|
|
|
|
| |||||||||||
| 49,600 | 80,554 | 17,374,048 | 6,824,059 | 707,387 | 222,504 | |||||||||||||||||
|
|
|
|
|
|
|
|
|
|
|
| |||||||||||
| $ | 1,042,714 | $ | 31,642,863 | $ | 1,756,314,648 | $ | 1,824,109,700 | $ | 101,186,684 | $ | 31,814,888 | |||||||||||
|
|
|
|
|
|
|
|
|
|
|
| |||||||||||
| $ | 892,631 | $ | 29,177,590 | $ | 1,778,963,047 | $ | 1,687,675,942 | $ | 100,232,190 | $ | 31,153,661 | |||||||||||
| 105 | (31,587 | ) | (7,415,874 | ) | (11,163,489 | ) | 3,163 | (6,587 | ) | |||||||||||||
| 22,891 | 53,987 | (145,268,010 | ) | 42,518,732 | (156,168 | ) | 274,064 | |||||||||||||||
| 127,056 | 2,442,831 | 130,060,074 | 105,270,568 | 1,107,499 | 393,750 | |||||||||||||||||
| 31 | 42 | (24,589 | ) | (192,053 | ) | — | — | |||||||||||||||
|
|
|
|
|
|
|
|
|
|
|
| |||||||||||
| $ | 1,042,714 | $ | 31,642,863 | $ | 1,756,314,648 | $ | 1,824,109,700 | $ | 101,186,684 | $ | 31,814,888 | |||||||||||
|
|
|
|
|
|
|
|
|
|
|
| |||||||||||
| $ | 128 | $ | 2,774,121 | $ | 319,241,520 | $ | 176,942,153 | $ | 3,326,590 | $ | 2,317,741 | |||||||||||
| 10 | 237,153 | 33,707,171 | 12,372,836 | 362,356 | 226,229 | |||||||||||||||||
| $ | 12.46 | $ | 11.70 | $ | 9.47 | $ | 14.30 | $ | 9.18 | $ | 10.25 | |||||||||||
|
|
|
|
|
|
|
|
|
|
|
| |||||||||||
| $ | 13.22 | $ | 12.41 | $ | 10.05 | $ | 15.17 | $ | 9.54 | $ | 10.64 | |||||||||||
|
|
|
|
|
|
|
|
|
|
|
| |||||||||||
| $ | 130 | $ | 220,476 | $ | 28,182,792 | $ | 27,248,179 | N/A | N/A | |||||||||||||
| 11 | 18,895 | 2,987,295 | 1,942,027 | N/A | — | |||||||||||||||||
| $ | 11.97 | $ | 11.67 | $ | 9.43 | $ | 14.03 | N/A | N/A | |||||||||||||
|
|
|
|
|
|
|
|
|
|
|
| |||||||||||
| $ | 1,042,456 | $ | 28,648,266 | $ | 1,311,513,499 | $ | 1,543,866,273 | $ | 97,860,094 | $ | 29,497,147 | |||||||||||
| 87,791 | 2,452,343 | 137,907,746 | 107,613,123 | 10,578,262 | 2,879,649 | |||||||||||||||||
| $ | 11.87 | $ | 11.68 | $ | 9.51 | $ | 14.35 | $ | 9.25 | $ | 10.24 | |||||||||||
|
|
|
|
|
|
|
|
|
|
|
| |||||||||||
| N/A | N/A | $ | 97,376,837 | $ | 76,053,095 | N/A | N/A | |||||||||||||||
| N/A | N/A | 10,219,407 | 5,297,460 | N/A | N/A | |||||||||||||||||
| N/A | N/A | $ | 9.53 | $ | 14.36 | N/A | N/A | |||||||||||||||
|
|
|
|
|
|
|
|
|
|
|
| |||||||||||
| $ | 905,742 | $ | 29,135,561 | $ | 1,616,850,854 | $ | 1,436,745,225 | $ | 99,770,995 | $ | 31,295,670 | |||||||||||
| — | — | 12,202,165 | 249,517,853 | — | — | |||||||||||||||||
| 954 | 50,843 | — | 9,332,684 | — | — | |||||||||||||||||
The accompanying notes to financial statements are an integral part of this statement.
91
Brandes Investment Trust
STATEMENTS OF OPERATIONS — For the Year Ended September 30, 2017
| Brandes International Equity Fund | Brandes Global Equity Fund | |||||||
INVESTMENT INCOME | ||||||||
Income | ||||||||
Dividend income | ||||||||
Unaffiliated issuers | $ | 17,880,908 | $ | 1,890,790 | ||||
Affiliated issuers | — | — | ||||||
Less: foreign taxes withheld | (1,720,018 | ) | (125,870 | ) | ||||
Interest income | 32,839 | 42,880 | ||||||
Less: Foreign taxes withheld | — | — | ||||||
Income from securities lending | 178,727 | 8,471 | ||||||
Miscellaneous Income | — | — | ||||||
|
|
|
| |||||
Total Income | 16,372,456 | 1,816,271 | ||||||
|
|
|
| |||||
Expenses | ||||||||
Advisory fees (Note 3) | 4,453,199 | 522,622 | ||||||
Custody fees | 53,508 | 8,365 | ||||||
Administration fees (Note 3) | 126,105 | 15,990 | ||||||
Insurance expense | 17,954 | 1,424 | ||||||
Legal fees | 27,295 | 4,061 | ||||||
Printing fees | 33,408 | 5,711 | ||||||
Miscellaneous | 29,494 | 5,600 | ||||||
Registration expense | 102,791 | 60,107 | ||||||
Trustee fees | 49,128 | 10,836 | ||||||
Transfer agent fees | 121,552 | 51,417 | ||||||
12b-1 Fees – Class A | 55,482 | 17,818 | ||||||
12b-1 Fees – Class C | 109,505 | 14,467 | ||||||
Shareholder Service Fees – Class C | 36,273 | 4,822 | ||||||
Shareholder Service Fees – Class E* | 225 | — | ||||||
Sub-Transfer Agency Fees – Class I | 219,090 | 28,131 | ||||||
Accounting fees | 76,517 | 57,718 | ||||||
Auditing fees | 41,939 | 38,484 | ||||||
Proxy Expense | 49,384 | 4,138 | ||||||
Tax Expense | 6,631 | — | ||||||
|
|
|
| |||||
Total expenses | 5,609,480 | 851,711 | ||||||
Expense reimbursement / waiver | (30,977 | ) | (157,097 | ) | ||||
|
|
|
| |||||
Total expenses net of reimbursement / waiver | 5,578,503 | 694,614 | ||||||
|
|
|
| |||||
Net investment income | 10,793,953 | 1,121,657 | ||||||
|
|
|
| |||||
REALIZED AND UNREALIZED GAIN (LOSS) ON INVESTMENTS | ||||||||
Net realized gain (loss) on: | ||||||||
Unaffiliated investments | 8,925,814 | 2,048,371 | ||||||
Affiliated investments | — | — | ||||||
Redemption in-kind (Note 10) | 9,829,109 | — | ||||||
Foreign currency transactions | (462,979 | ) | 3,055 | |||||
|
|
|
| |||||
Net realized gain (loss) | 18,291,944 | 2,051,426 | ||||||
|
|
|
| |||||
Net change in unrealized appreciation (depreciation) on: | ||||||||
Investments | 38,310,132 | 7,190,594 | ||||||
Foreign currency transactions | 2,308 | 341 | ||||||
|
|
|
| |||||
Net unrealized appreciation (depreciation) | 38,312,440 | 7,190,935 | ||||||
|
|
|
| |||||
Net realized and unrealized gain (loss) on investments and foreign currency transactions | 56,604,384 | 9,242,361 | ||||||
|
|
|
| |||||
Net Increase in net assets resulting from operations | $ | 67,398,337 | $ | 10,364,018 | ||||
|
|
|
| |||||
| * | Class E Shares were eliminated effective November 30, 2016 and no longer offered for sale. |
The accompanying notes to financial statements are an integral part of this statement.
92
Brandes Investment Trust
STATEMENTS OF OPERATIONS — For the Year Ended September 30, 2017 (continued)
Brandes | Brandes Global Opportunities Value Fund | Brandes Emerging Markets Value Fund | Brandes International Small Cap Equity Fund | Brandes Core Plus Fixed Income Fund | Brandes Credit Focus Yield Fund | |||||||||||||||||
| $ | 34,843 | $ | 608,588 | $ | 43,198,491 | $ | 41,071,598 | $ | 29,890 | $ | 18,837 | |||||||||||
| — | — | — | — | — | — | |||||||||||||||||
| (2,009 | ) | (49,494 | ) | (4,582,408 | ) | (3,267,433 | ) | — | — | |||||||||||||
| — | 16,364 | 38,026 | 277,655 | 2,864,415 | 1,086,955 | |||||||||||||||||
| — | — | — | (5,752 | ) | — | — | ||||||||||||||||
| — | — | — | 8,546 | — | — | |||||||||||||||||
| — | — | — | — | 43,200 | 21,465 | |||||||||||||||||
|
|
|
|
|
|
|
|
|
|
|
| |||||||||||
| 32,834 | 575,458 | 38,654,109 | 38,084,614 | 2,937,505 | 1,127,257 | |||||||||||||||||
|
|
|
|
|
|
|
|
|
|
|
| |||||||||||
| 7,599 | 197,260 | 13,646,320 | 15,473,292 | 347,605 | 156,868 | |||||||||||||||||
| 2,570 | 7,824 | 643,602 | 217,106 | 13,448 | 5,190 | |||||||||||||||||
| 1,270 | 6,600 | 325,302 | 367,070 | 23,046 | 7,520 | |||||||||||||||||
| — | 179 | 30,788 | 33,853 | 2,458 | 849 | |||||||||||||||||
| 1,786 | 2,061 | 49,221 | 60,765 | 5,703 | 2,984 | |||||||||||||||||
| 2,379 | 4,313 | 106,989 | 95,288 | 9,166 | 4,109 | |||||||||||||||||
| 2,438 | 2,654 | 42,854 | 60,232 | 5,065 | 2,801 | |||||||||||||||||
| 8,948 | 53,430 | 145,408 | 128,359 | 50,944 | 35,881 | |||||||||||||||||
| 275 | 3,492 | 125,612 | 151,682 | 8,653 | 6,203 | |||||||||||||||||
| 45,122 | 46,467 | 421,331 | 256,002 | 38,916 | 31,520 | |||||||||||||||||
| 7 | 5,981 | 818,744 | 402,823 | 6,720 | 5,873 | |||||||||||||||||
| 77 | 904 | 180,196 | 177,317 | N/A | N/A | |||||||||||||||||
| 26 | 301 | 58,516 | 58,742 | N/A | N/A | |||||||||||||||||
| N/A | N/A | N/A | N/A | 124 | N/A | |||||||||||||||||
| 468 | 9,126 | 512,845 | 687,042 | 48,289 | — | |||||||||||||||||
| 55,575 | 60,617 | 89,433 | 93,865 | 50,082 | 46,036 | |||||||||||||||||
| 31,909 | 35,333 | 41,217 | 36,128 | 37,557 | 37,465 | |||||||||||||||||
| 44 | 585 | 147,917 | 144,069 | 8,990 | 1,401 | |||||||||||||||||
| — | — | 735,506 | — | — | — | |||||||||||||||||
|
|
|
|
|
|
|
|
|
|
|
| |||||||||||
| 160,493 | 437,127 | 18,121,801 | 18,443,635 | 656,766 | 344,700 | |||||||||||||||||
| (150,841 | ) | (190,542 | ) | (256,566 | ) | (24,530 | ) | (145,725 | ) | (149,185 | ) | |||||||||||
|
|
|
|
|
|
|
|
|
|
|
| |||||||||||
| 9,652 | 246,585 | 17,865,235 | 18,419,105 | 511,041 | 195,515 | |||||||||||||||||
|
|
|
|
|
|
|
|
|
|
|
| |||||||||||
| 23,182 | 328,873 | 20,788,874 | 19,665,509 | 2,426,464 | 931,742 | |||||||||||||||||
|
|
|
|
|
|
|
|
|
|
|
| |||||||||||
| 22,900 | 480,104 | 16,151,024 | 68,220,094 | (46,369 | ) | 64,720 | ||||||||||||||||
| — | — | — | 1,564,663 | — | — | |||||||||||||||||
| — | — | — | — | — | — | |||||||||||||||||
| 16 | (15,312 | ) | (1,089,493 | ) | (655,098 | ) | — | — | ||||||||||||||
|
|
|
|
|
|
|
|
|
|
|
| |||||||||||
| 22,916 | 464,792 | 15,061,531 | 69,129,659 | (46,369 | ) | 64,720 | ||||||||||||||||
|
|
|
|
|
|
|
|
|
|
|
| |||||||||||
| 102,220 | 2,180,514 | 257,439,252 | 86,267,249 | (1,701,330 | ) | (322,477 | ) | |||||||||||||||
| (37 | ) | (400 | ) | (20,053 | ) | 3,940 | — | — | ||||||||||||||
|
|
|
|
|
|
|
|
|
|
|
| |||||||||||
| 102,183 | 2,180,114 | 257,419,199 | 86,271,189 | (1,701,330 | ) | (322,477 | ) | |||||||||||||||
|
|
|
|
|
|
|
|
|
|
|
| |||||||||||
| | 125,099 | 2,644,906 | 272,480,730 | 155,400,848 | (1,747,699 | ) | (257,757 | ) | ||||||||||||||
|
|
|
|
|
|
|
|
|
|
|
| |||||||||||
| $ | 148,281 | $ | 2,973,779 | $ | 293,269,604 | $ | 175,066,357 | $ | 678,765 | $ | 673,985 | |||||||||||
|
|
|
|
|
|
|
|
|
|
|
| |||||||||||
The accompanying notes to financial statements are an integral part of this statement.
93
Brandes Investment Trust
STATEMENT OF CHANGES IN NET ASSETS
| Brandes International Equity Fund | Brandes Global Equity Fund | |||||||||||||||
| Year Ended September 30, 2017 | Year Ended September 30, 2016 | Year Ended September 30, 2017 | Year Ended September 30, 2016 | |||||||||||||
INCREASE (DECREASE) IN NET ASSETS FROM: | ||||||||||||||||
OPERATIONS | ||||||||||||||||
Net investment income | $ | 10,793,953 | $ | 15,585,402 | $ | 1,121,657 | $ | 1,078,861 | ||||||||
Net realized gain (loss) on: | ||||||||||||||||
Investments | 8,925,814 | (3,759,302 | ) | 2,048,371 | (224,516 | ) | ||||||||||
Redemption in-kind | 9,829,109 | — | — | — | ||||||||||||
Foreign currency transactions | (462,979 | ) | (98,428 | ) | 3,055 | (20,745 | ) | |||||||||
Net unrealized appreciation on: | ||||||||||||||||
Investments | 38,310,132 | 36,944,553 | 7,190,594 | 1,898,143 | ||||||||||||
Foreign currency transactions | 2,308 | 50,697 | 341 | 1,386 | ||||||||||||
|
|
|
|
|
|
|
| |||||||||
Net increase in net assets resulting from operations | 67,398,337 | 48,722,922 | 10,364,018 | 2,733,129 | ||||||||||||
|
|
|
|
|
|
|
| |||||||||
DISTRIBUTIONS TO SHAREHOLDERS | ||||||||||||||||
From net investment income | ||||||||||||||||
Class A | (720,818 | ) | (326,735 | ) | (130,229 | ) | (83,326 | ) | ||||||||
Class C | (399,711 | ) | (217,328 | ) | (19,935 | ) | (25,407 | ) | ||||||||
Class E | — | (16,845 | ) | — | (1,382 | ) | ||||||||||
Class I | (15,155,210 | ) | (15,332,614 | ) | (1,152,966 | ) | (991,951 | ) | ||||||||
Class R6 | (1,013,114 | ) | (458,693 | ) | N/A | N/A | ||||||||||
From net realized gains | ||||||||||||||||
Class A | — | — | — | (117,360 | ) | |||||||||||
Class C | — | — | — | (144,639 | ) | |||||||||||
Class E | — | — | — | (13,647 | ) | |||||||||||
Class I | — | — | — | (2,617,644 | ) | |||||||||||
Class R6 | — | — | N/A | N/A | ||||||||||||
|
|
|
|
|
|
|
| |||||||||
Decrease in net assets from distributions | (17,288,853 | ) | (16,352,215 | ) | (1,303,130 | ) | (3,995,356 | ) | ||||||||
|
|
|
|
|
|
|
| |||||||||
CAPITAL SHARE TRANSACTIONS | ||||||||||||||||
Proceeds from shares sold | 233,467,794 | 278,842,419 | 13,561,354 | 12,290,688 | ||||||||||||
Net asset value of shares issued on reinvestment of distributions | 16,063,510 | 15,725,407 | 1,295,281 | 3,952,436 | ||||||||||||
Cost of shares redeemed | (161,323,965 | ) | (212,318,638 | ) | (8,661,825 | ) | (11,550,515 | ) | ||||||||
Cost of shares redeemed from Redemption in-kind (Note 10) | (231,178,479 | ) | — | — | — | |||||||||||
|
|
|
|
|
|
|
| |||||||||
Net increase (decrease) in net assets from capital share transactions | (142,971,140 | ) | 82,249,188 | 6,194,810 | 4,692,609 | |||||||||||
|
|
|
|
|
|
|
| |||||||||
Total increase (decrease) in net assets | (92,861,656 | ) | 114,619,895 | 15,255,698 | 3,430,382 | |||||||||||
|
|
|
|
|
|
|
| |||||||||
NET ASSETS | ||||||||||||||||
Beginning of the Period | 703,912,989 | 589,293,094 | 53,934,376 | 50,503,994 | ||||||||||||
|
|
|
|
|
|
|
| |||||||||
End of the Period | $ | 611,051,333 | $ | 703,912,989 | $ | 69,190,074 | $ | 53,934,376 | ||||||||
|
|
|
|
|
|
|
| |||||||||
Undistributed net investment income (loss) | $ | (3,081,120 | ) | $ | 3,026,620 | $ | (88,001 | ) | $ | (54,425 | ) | |||||
|
|
|
|
|
|
|
| |||||||||
The accompanying notes to financial statements are an integral part of this statement.
94
Brandes Investment Trust
STATEMENT OF CHANGES IN NET ASSETS (continued)
| Brandes Global Equity Income Fund | Brandes Global Opportunities Value Fund | |||||||||||||||
| Year Ended September 30, 2017 | Year Ended September 30, 2016 | Year Ended September 30, 2017 | Year Ended September 30, 2016 | |||||||||||||
INCREASE (DECREASE) IN NET ASSETS FROM: | ||||||||||||||||
OPERATIONS | ||||||||||||||||
Net investment income | $ | 23,182 | $ | 20,269 | $ | 328,873 | $ | 120,380 | ||||||||
Net realized gain (loss) on: | ||||||||||||||||
Investments | 22,900 | 24,436 | 480,104 | (399,349 | ) | |||||||||||
Foreign currency transactions | 16 | (291 | ) | (15,312 | ) | (2,745 | ) | |||||||||
Net unrealized appreciation (depreciation) on: | ||||||||||||||||
Investments | 102,220 | 64,664 | 2,180,514 | 680,460 | ||||||||||||
Foreign currency transactions | (37 | ) | 153 | (400 | ) | 536 | ||||||||||
|
|
|
|
|
|
|
| |||||||||
Net increase in net assets resulting from operations | 148,281 | 109,231 | 2,973,779 | 399,282 | ||||||||||||
|
|
|
|
|
|
|
| |||||||||
DISTRIBUTIONS TO SHAREHOLDERS | ||||||||||||||||
From net investment income | ||||||||||||||||
Class A | (19 | ) | (76 | ) | (35,031 | ) | (10,894 | ) | ||||||||
Class C | (158 | ) | (122 | ) | (1,185 | ) | (463 | ) | ||||||||
Class I | (22,916 | ) | (20,233 | ) | (311,011 | ) | (124,679 | ) | ||||||||
From net realized gains | ||||||||||||||||
Class A | (124 | ) | (2 | ) | — | (3,623 | ) | |||||||||
Class C | (269 | ) | (2 | ) | — | (304 | ) | |||||||||
Class I | (20,701 | ) | (12,640 | ) | — | (70,302 | ) | |||||||||
|
|
|
|
|
|
|
| |||||||||
Decrease in net assets from distributions | (44,187 | ) | (33,075 | ) | (347,227 | ) | (210,265 | ) | ||||||||
|
|
|
|
|
|
|
| |||||||||
CAPITAL SHARE TRANSACTIONS | ||||||||||||||||
Proceeds from shares sold | 51,260 | 150,238 | 24,327,543 | 6,590,086 | ||||||||||||
Net asset value of shares issued on reinvestment of distributions | 42,958 | 31,963 | 337,089 | 149,850 | ||||||||||||
Cost of shares redeemed | (18,616 | ) | — | (1,347,517 | ) | (4,571,439 | ) | |||||||||
|
|
|
|
|
|
|
| |||||||||
Net increase in net assets from capital share transactions | 75,602 | 182,201 | 23,317,115 | 2,168,497 | ||||||||||||
|
|
|
|
|
|
|
| |||||||||
Total increase in net assets | 179,696 | 258,357 | 25,943,667 | 2,357,514 | ||||||||||||
|
|
|
|
|
|
|
| |||||||||
NET ASSETS | ||||||||||||||||
Beginning of the Period | 863,018 | 604,661 | 5,699,196 | 3,341,682 | ||||||||||||
|
|
|
|
|
|
|
| |||||||||
End of the Period | $ | 1,042,714 | $ | 863,018 | $ | 31,642,863 | $ | 5,699,196 | ||||||||
|
|
|
|
|
|
|
| |||||||||
Undistributed net investment income (loss) | $ | 105 | $ | — | $ | (31,587 | ) | $ | 2,079 | |||||||
|
|
|
|
|
|
|
| |||||||||
The accompanying notes to financial statements are an integral part of this statement.
95
Brandes Investment Trust
STATEMENT OF CHANGES IN NET ASSETS (continued)
| Brandes Emerging Markets Value Fund | Brandes International Small Cap Equity Fund | |||||||||||||||
| Year Ended September 30, 2017 | Year Ended September 30, 2016 | Year Ended September 30, 2017 | Year Ended September 30, 2016 | |||||||||||||
INCREASE (DECREASE) IN NET ASSETS FROM: | ||||||||||||||||
OPERATIONS | ||||||||||||||||
Net investment income | $ | 20,788,874 | $ | 19,655,749 | $ | 19,665,509 | $ | 10,157,426 | ||||||||
Net realized gain (loss) on: | ||||||||||||||||
Investments | 16,151,024 | (125,575,989 | ) | 69,784,757 | 27,969,963 | |||||||||||
Foreign currency transactions | (1,089,493 | ) | (1,608,216 | ) | (655,098 | ) | (772,696 | ) | ||||||||
Net unrealized appreciation (depreciation) on: | ||||||||||||||||
Investments | 257,439,252 | 380,769,626 | 86,267,249 | 84,984,537 | ||||||||||||
Foreign currency transactions | (20,053 | ) | 12,415 | 3,940 | (182,673 | ) | ||||||||||
|
|
|
|
|
|
|
| |||||||||
Net increase in net assets resulting from operations | 293,269,604 | 273,253,585 | 175,066,357 | 122,156,557 | ||||||||||||
|
|
|
|
|
|
|
| |||||||||
DISTRIBUTIONS TO SHAREHOLDERS | ||||||||||||||||
From net investment income | ||||||||||||||||
Class A | (5,300,042 | ) | (3,653,585 | ) | (3,926,466 | ) | (1,623,052 | ) | ||||||||
Class C | (144,547 | ) | (95,247 | ) | (422,873 | ) | (237,168 | ) | ||||||||
Class I | (19,639,198 | ) | (10,871,960 | ) | (36,179,079 | ) | (18,992,579 | ) | ||||||||
Class R6 | (1,148,940 | ) | — | (1,360,486 | ) | (26,169 | ) | |||||||||
From net realized gains | ||||||||||||||||
Class A | — | — | (2,808,067 | ) | (1,347,940 | ) | ||||||||||
Class C | — | — | (411,540 | ) | (268,103 | ) | ||||||||||
Class I | — | — | (25,524,016 | ) | (14,618,967 | ) | ||||||||||
Class R6 | — | — | (794,405 | ) | — | |||||||||||
|
|
|
|
|
|
|
| |||||||||
Decrease in net assets from distributions | (26,232,727 | ) | (14,620,792 | ) | (71,426,932 | ) | (37,113,978 | ) | ||||||||
|
|
|
|
|
|
|
| |||||||||
CAPITAL SHARE TRANSACTIONS | ||||||||||||||||
Proceeds from shares sold | 672,663,448 | 465,356,191 | 704,614,328 | 620,532,710 | ||||||||||||
Proceeds from Transfer in-kind (Note 10) | 27,215,850 | — | — | — | ||||||||||||
Net asset value of shares issued on reinvestment of distributions | 23,465,154 | 12,848,337 | 69,455,916 | 36,267,289 | ||||||||||||
Cost of shares redeemed | (390,424,715 | ) | (619,619,751 | ) | (423,441,779 | ) | (343,843,528 | ) | ||||||||
|
|
|
|
|
|
|
| |||||||||
Net increase (decrease) in net assets from capital share transactions | 332,919,737 | (141,415,223 | ) | 350,628,465 | 312,956,471 | |||||||||||
|
|
|
|
|
|
|
| |||||||||
Total increase in net assets | 599,956,614 | 117,217,570 | 454,267,890 | 397,999,050 | ||||||||||||
|
|
|
|
|
|
|
| |||||||||
NET ASSETS | ||||||||||||||||
Beginning of the Period | 1,156,358,034 | 1,039,140,464 | 1,369,841,810 | 971,842,760 | ||||||||||||
|
|
|
|
|
|
|
| |||||||||
End of the Period | $ | 1,756,314,648 | $ | 1,156,358,034 | $ | 1,824,109,700 | $ | 1,369,841,810 | ||||||||
|
|
|
|
|
|
|
| |||||||||
Undistributed net investment income (loss) | $ | (7,415,874 | ) | $ | (882,529 | ) | $ | (11,163,489 | ) | $ | (5,517,699 | ) | ||||
|
|
|
|
|
|
|
| |||||||||
The accompanying notes to financial statements are an integral part of this statement.
96
Brandes Investment Trust
STATEMENT OF CHANGES IN NET ASSETS (continued)
| Brandes Core Plus Fixed Income Fund | Brandes Credit Focus Yield Fund | |||||||||||||||
| Year Ended September 30, 2017 | Year Ended September 30, 2016 | Year Ended September 30, 2017 | Year Ended September 30, 2016 | |||||||||||||
INCREASE (DECREASE) IN NET ASSETS FROM: | ||||||||||||||||
OPERATIONS | ||||||||||||||||
Net investment income | $ | 2,426,464 | $ | 2,115,182 | $ | 931,742 | $ | 925,834 | ||||||||
Net realized gain (loss) on: | ||||||||||||||||
Investments | (46,369 | ) | 275,403 | 64,720 | (76,678 | ) | ||||||||||
Foreign currency transactions | — | — | — | — | ||||||||||||
Net unrealized appreciation (depreciation) on: | ||||||||||||||||
Investments | (1,701,330 | ) | 2,095,921 | (322,477 | ) | 1,053,459 | ||||||||||
Foreign currency transactions | — | — | — | — | ||||||||||||
|
|
|
|
|
|
|
| |||||||||
Net increase in net assets resulting from operations | 678,765 | 4,486,506 | 673,985 | 1,902,615 | ||||||||||||
|
|
|
|
|
|
|
| |||||||||
DISTRIBUTIONS TO SHAREHOLDERS | ||||||||||||||||
From net investment income | ||||||||||||||||
Class A | (61,261 | ) | (55,764 | ) | (64,325 | ) | (59,334 | ) | ||||||||
Class E | (1,222 | ) | (15,343 | ) | N/A | N/A | ||||||||||
Class I | (2,387,103 | ) | (2,076,681 | ) | (867,411 | ) | (866,362 | ) | ||||||||
From net realized gains | ||||||||||||||||
Class A | (5,530 | ) | (1,614 | ) | (3,593 | ) | — | |||||||||
Class E | N/A | (1,430 | ) | N/A | N/A | |||||||||||
Class I | (253,423 | ) | (64,614 | ) | (44,344 | ) | — | |||||||||
|
|
|
|
|
|
|
| |||||||||
Decrease in net assets from distributions | (2,708,539 | ) | (2,215,446 | ) | (979,673 | ) | (925,696 | ) | ||||||||
|
|
|
|
|
|
|
| |||||||||
CAPITAL SHARE TRANSACTIONS | ||||||||||||||||
Proceeds from shares sold | 34,413,026 | 38,192,598 | 100,930 | 520,078 | ||||||||||||
Net asset value of shares issued on reinvestment of distributions | 2,665,584 | 2,175,810 | 941,203 | 894,878 | ||||||||||||
Cost of shares redeemed | (33,404,800 | ) | (19,193,056 | ) | (269,570 | ) | (419,739 | ) | ||||||||
|
|
|
|
|
|
|
| |||||||||
Net increase in net assets from capital share transactions | 3,673,810 | 21,175,352 | 772,563 | 995,217 | ||||||||||||
|
|
|
|
|
|
|
| |||||||||
Total increase in net assets | 1,644,036 | 23,446,412 | 466,875 | 1,972,136 | ||||||||||||
|
|
|
|
|
|
|
| |||||||||
NET ASSETS | ||||||||||||||||
Beginning of the Period | 99,542,648 | 76,096,236 | 31,348,013 | 29,375,877 | ||||||||||||
|
|
|
|
|
|
|
| |||||||||
End of the Period | $ | 101,186,684 | $ | 99,542,648 | $ | 31,814,888 | $ | 31,348,013 | ||||||||
|
|
|
|
|
|
|
| |||||||||
Undistributed net investment income (loss) | $ | 3,163 | $ | — | $ | (6,587 | ) | $ | (7,293 | ) | ||||||
|
|
|
|
|
|
|
| |||||||||
The accompanying notes to financial statements are an integral part of this statement.
97
Brandes Investment Trust
FINANCIAL HIGHLIGHTS For a capital share outstanding for the period ended:
| Net asset value, beginning of period | Net investment income(5) | Net | Total from investment operations | Dividends from net investment income | ||||||||||||||||
Brandes International Equity Fund |
| |||||||||||||||||||
Class A(8) | ||||||||||||||||||||
9/30/2017 | $ | 15.70 | 0.29 | 2.03 | 2.32 | (0.54 | ) | |||||||||||||
9/30/2016 | $ | 14.90 | 0.35 | 0.81 | 1.16 | (0.36 | ) | |||||||||||||
9/30/2015 | $ | 16.58 | 0.35 | (1.73 | ) | (1.38 | ) | (0.30 | ) | |||||||||||
9/30/2014 | $ | 16.03 | 0.33 | 0.56 | 0.89 | (0.34 | ) | |||||||||||||
9/30/2013 | $ | 13.50 | 0.34 | 3.02 | 3.36 | (0.83 | ) | |||||||||||||
Class C | ||||||||||||||||||||
9/30/2017 | $ | 15.58 | 0.17 | 2.00 | 2.17 | (0.45 | ) | |||||||||||||
9/30/2016 | $ | 14.79 | 0.23 | 0.81 | 1.04 | (0.25 | ) | |||||||||||||
9/30/2015 | $ | 16.48 | 0.24 | (1.73 | ) | (1.49 | ) | (0.20 | ) | |||||||||||
9/30/2014 | $ | 15.98 | 0.20 | 0.55 | 0.75 | (0.25 | ) | |||||||||||||
1/31/2013(3) – 9/30/2013 | $ | 14.30 | 0.15 | 1.84 | 1.99 | (0.31 | ) | |||||||||||||
Class I | ||||||||||||||||||||
9/30/2017 | $ | 15.72 | 0.33 | 2.04 | 2.37 | (0.57 | ) | |||||||||||||
9/30/2016 | $ | 14.92 | 0.38 | 0.81 | 1.19 | (0.39 | ) | |||||||||||||
9/30/2015 | $ | 16.60 | 0.35 | (1.70 | ) | (1.35 | ) | (0.33 | ) | |||||||||||
9/30/2014 | $ | 16.05 | 0.36 | 0.56 | 0.92 | (0.37 | ) | |||||||||||||
9/30/2013 | $ | 13.50 | 0.35 | 3.04 | 3.39 | (0.84 | ) | |||||||||||||
Class R6 | ||||||||||||||||||||
9/30/2017 | $ | 15.74 | 0.35 | 2.04 | 2.39 | (0.57 | ) | |||||||||||||
2/1/2016(3) – 9/30/2016 | $ | 14.41 | 0.27 | 1.39 | 1.66 | (0.33 | ) | |||||||||||||
| (1) | Not annualized. |
| (2) | Annualized. |
| (3) | Commencement of operations. |
| (4) | After fees waived and expenses absorbed or recouped by the Advisor, where applicable. |
| (5) | Net investment income per share has been calculated based on average shares outstanding during the period. |
| (6) | The total return calculation does not reflect the sales loads that may be imposed on Class A or C shares (see Note 7 of the Notes to Financial Statements). |
| (7) | The total return figure is the since inception return for the class. |
| (8) | Prior to January 31, 2013, Class A shares were know as Class S shares. |
| (9) | Includes expenses not covered by the Trust’s expense limitation agreement. See Note 3 for more information. |
The accompanying notes to financial statements are an integral part of this statement.
98
Brandes Investment Trust
FINANCIAL HIGHLIGHTS For a capital share outstanding for the period ended:
| Net asset value, end of period | Total return(6) | Net assets, end of period (millions) | Ratio of net expenses to average net assets(4) | Ratio of net investment income to average net assets(4) | Ratio of expenses (prior to reimburse- ments) to average net assets | Ratio of net investment income (prior to reimburse- ments) to average net assets | Portfolio turnover rate | |||||||||||||||||||||||
| $ | 17.48 | 15.07 | % | $ | 31.5 | 1.18 | %(9) | 1.77 | % | 1.18 | %(9) | 1.77 | % | 33.82 | % | |||||||||||||||
| $ | 15.70 | 7.90 | % | $ | 14.3 | 1.18 | % | 2.30 | % | 1.18 | % | 2.30 | % | 17.60 | % | |||||||||||||||
| $ | 14.90 | (8.47 | )% | $ | 13.1 | 1.18 | % | 2.08 | % | 1.18 | % | 2.08 | % | 27.50 | % | |||||||||||||||
| $ | 16.58 | 5.47 | % | $ | 9.0 | 1.19 | % | 1.92 | % | 1.18 | % | 1.93 | % | 39.53 | % | |||||||||||||||
| $ | 16.03 | 26.06 | % | $ | 0.7 | 1.23 | % | 2.25 | % | 1.31 | % | 2.17 | % | 19.43 | % | |||||||||||||||
| $ | 17.30 | 14.19 | % | $ | 17.9 | 1.93 | %(9) | 1.01 | % | 1.93 | %(9) | 1.01 | % | 33.82 | % | |||||||||||||||
| $ | 15.58 | 7.10 | % | $ | 13.1 | 1.93 | % | 1.55 | % | 1.93 | % | 1.55 | % | 17.60 | % | |||||||||||||||
| $ | 14.79 | (9.14 | )% | $ | 12.0 | 1.93 | % | 1.43 | % | 1.93 | % | 1.43 | % | 27.50 | % | |||||||||||||||
| $ | 16.48 | 4.64 | % | $ | 4.3 | 1.93 | % | 1.19 | % | 1.93 | % | 1.19 | % | 39.53 | % | |||||||||||||||
| $ | 15.98 | 14.17 | %(7) | $ | 0.1 | 1.95 | %(2) | 1.53 | %(2) | 1.97 | %(2) | 1.51 | %(2) | 19.43 | %(1) | |||||||||||||||
| $ | 17.52 | 15.33 | % | $ | 523.1 | 0.98 | %(9) | 1.96 | % | 0.98 | %(9) | 1.96 | % | 33.82 | % | |||||||||||||||
| $ | 15.72 | 8.10 | % | $ | 648.3 | 1.00 | % | 2.48 | % | 0.98 | % | 2.50 | % | 17.60 | % | |||||||||||||||
| $ | 14.92 | (8.30 | )% | $ | 562.5 | 1.00 | % | 2.10 | % | 0.98 | % | 2.12 | % | 27.50 | % | |||||||||||||||
| $ | 16.60 | 5.61 | % | $ | 521.9 | 1.00 | % | 2.12 | % | 0.99 | % | 2.13 | % | 39.53 | % | |||||||||||||||
| $ | 16.05 | 26.43 | % | $ | 404.4 | 1.03 | % | 2.45 | % | 1.15 | % | 2.33 | % | 19.43 | % | |||||||||||||||
| $ | 17.56 | 15.48 | % | $ | 38.5 | 0.83 | %(9) | 2.12 | % | 0.93 | %(9) | 2.02 | % | 33.82 | % | |||||||||||||||
| $ | 15.74 | 11.60 | %(7) | $ | 27.7 | 0.82 | %(2) | 2.67 | %(2) | 0.93 | %(2) | 2.56 | %(2) | 17.60 | %(1) | |||||||||||||||
The accompanying notes to financial statements are an integral part of this statement.
99
Brandes Investment Trust
FINANCIAL HIGHLIGHTS For a capital share outstanding for the period ended:
| Net asset value, beginning of period | Net investment income(5) | Net | Total from investment operations | Dividends from net investment income | Dividends from net realized gains | |||||||||||||||||||
Brandes Global Equity Fund | ||||||||||||||||||||||||
Class A(8) | ||||||||||||||||||||||||
9/30/2017 | $ | 21.21 | 0.34 | 3.28 | 3.62 | (0.41 | ) | — | ||||||||||||||||
9/30/2016 | $ | 21.85 | 0.40 | 0.67 | 1.07 | (0.42 | ) | (1.29 | ) | |||||||||||||||
9/30/2015 | $ | 25.43 | 0.27 | (1.90 | ) | (1.63 | ) | (0.33 | ) | (1.62 | ) | |||||||||||||
9/30/2014 | $ | 24.20 | 0.43 | 2.00 | 2.43 | (0.44 | ) | (0.76 | ) | |||||||||||||||
9/30/2013 | $ | 20.27 | 0.38 | 4.80 | 5.18 | (0.91 | ) | (0.34 | ) | |||||||||||||||
Class C | ||||||||||||||||||||||||
9/30/2017 | $ | 21.09 | 0.18 | 3.25 | 3.43 | (0.24 | ) | — | ||||||||||||||||
9/30/2016 | $ | 21.73 | 0.25 | 0.66 | 0.91 | (0.26 | ) | (1.29 | ) | |||||||||||||||
9/30/2015 | $ | 25.31 | 0.16 | (1.92 | ) | (1.76 | ) | (0.20 | ) | (1.62 | ) | |||||||||||||
9/30/2014 | $ | 24.14 | 0.24 | 1.99 | 2.23 | (0.30 | ) | (0.76 | ) | |||||||||||||||
1/31/2013(3) – 9/30/2013 | $ | 21.21 | 0.15 | 3.12 | 3.27 | (0.34 | ) | — | ||||||||||||||||
Class I | ||||||||||||||||||||||||
9/30/2017 | $ | 21.33 | 0.41 | 3.30 | 3.71 | (0.47 | ) | — | ||||||||||||||||
9/30/2016 | $ | 21.95 | 0.46 | 0.67 | 1.13 | (0.46 | ) | (1.29 | ) | |||||||||||||||
9/30/2015 | $ | 25.52 | 0.39 | (1.97 | ) | (1.58 | ) | (0.37 | ) | (1.62 | ) | |||||||||||||
9/30/2014 | $ | 24.26 | 0.50 | 2.00 | 2.50 | (0.48 | ) | (0.76 | ) | |||||||||||||||
9/30/2013 | $ | 20.33 | 0.43 | 4.81 | 5.24 | (0.98 | ) | (0.34 | ) | |||||||||||||||
| (1) | Not annualized. |
| (2) | Annualized. |
| (3) | Commencement of operations. |
| (4) | After fees waived and expenses absorbed or recouped by the Advisor, where applicable. |
| (5) | Net investment income per share has been calculated based on average shares outstanding during the period. |
| (6) | The total return calculation does not reflect the sales loads that may be imposed on Class A or C shares (see Note 7 of the Notes to Financial Statements). |
| (7) | The total return figure is the since inception return for the class which commenced operations on January 31, 2013. |
| (8) | Prior to January 31, 2013, Class A shares were know as Class S shares. |
| (9) | Includes expenses not covered by the Trust’s expense limitation agreement. See Note 3 for more information. |
The accompanying notes to financial statements are an integral part of this statement.
100
Brandes Investment Trust
FINANCIAL HIGHLIGHTS For a capital share outstanding for the period ended:
| Net asset value, end of period | Total return(6) | Net assets, end of period (millions) | Ratio of net expenses to average net assets(4) | Ratio of net investment income to average net assets(4) | Ratio of expenses (prior to reimburse- ments) to average net assets | Ratio of net investment income (prior to reimburse- ments) to average net assets | Portfolio turnover rate | |||||||||||||||||||||||
| $ | 24.42 | 17.20 | % | $ | 5.8 | 1.26 | %(9) | 1.52 | % | 1.45 | %(9) | 1.33 | % | 17.42 | % | |||||||||||||||
| $ | 21.21 | 5.01 | % | $ | 4.6 | 1.25 | % | 1.95 | % | 1.58 | % | 1.62 | % | 15.68 | % | |||||||||||||||
| $ | 21.85 | (6.99 | )% | $ | 1.8 | 1.25 | % | 1.15 | % | 1.66 | % | 0.74 | % | 25.06 | % | |||||||||||||||
| $ | 25.43 | 10.18 | % | $ | 1.2 | 1.25 | % | 1.67 | % | 1.71 | % | 1.21 | % | 30.33 | % | |||||||||||||||
| $ | 24.20 | 26.81 | % | $ | 0.3 | 1.25 | % | 1.72 | % | 1.97 | % | 1.00 | % | 24.37 | % | |||||||||||||||
| $ | 24.28 | 16.31 | % | $ | 1.7 | 2.01 | %(9) | 0.77 | % | 2.21 | %(9) | 0.57 | % | 17.42 | % | |||||||||||||||
| $ | 21.09 | 4.20 | % | $ | 2.0 | 2.00 | % | 1.20 | % | 2.32 | % | 0.88 | % | 15.68 | % | |||||||||||||||
| $ | 21.73 | (7.62 | )% | $ | 2.4 | 2.00 | % | 0.66 | % | 2.42 | % | 0.24 | % | 25.06 | % | |||||||||||||||
| $ | 25.31 | 9.34 | % | $ | 1.1 | 2.00 | % | 0.92 | % | 2.46 | % | 0.46 | % | 30.33 | % | |||||||||||||||
| $ | 24.14 | 15.50 | %(7) | $ | 0.1 | 2.00 | %(2) | 0.97 | %(2) | 2.71 | %(2) | 0.26 | %(2) | 24.37 | %(1) | |||||||||||||||
| $ | 24.57 | 17.48 | % | $ | 61.7 | 1.01 | %(9) | 1.77 | % | 1.26 | %(9) | 1.52 | % | 17.42 | % | |||||||||||||||
| $ | 21.33 | 5.26 | % | $ | 47.3 | 1.00 | % | 2.20 | % | 1.38 | % | 1.82 | % | 15.68 | % | |||||||||||||||
| $ | 21.95 | (6.75 | )% | $ | 46.0 | 1.00 | % | 1.61 | % | 1.47 | % | 1.14 | % | 25.06 | % | |||||||||||||||
| $ | 25.52 | 10.46 | % | $ | 45.9 | 1.00 | % | 1.93 | % | 1.53 | % | 1.40 | % | 30.33 | % | |||||||||||||||
| $ | 24.26 | 27.12 | % | $ | 39.4 | 1.00 | % | 1.96 | % | 1.75 | % | 1.21 | % | 24.37 | % | |||||||||||||||
The accompanying notes to financial statements are an integral part of this statement.
101
Brandes Investment Trust
FINANCIAL HIGHLIGHTS For a capital share outstanding for the period ended:
| Net asset value, beginning of period | Net investment income(5) | Net | Total from investment operations | Dividends from net investment income | Dividends from net realized gains | |||||||||||||||||||
Brandes Global Equity Income Fund |
| |||||||||||||||||||||||
Class A | ||||||||||||||||||||||||
9/30/2017 | $ | 10.79 | 0.24 | 1.73 | 1.97 | (0.04 | ) | (0.26 | ) | |||||||||||||||
9/30/2016 | $ | 9.62 | 0.28 | 1.35 | 1.63 | (0.26 | ) | (0.20 | ) | |||||||||||||||
12/31/2014(3) – 9/30/2015 | $ | 10.00 | 0.23 | (0.46 | ) | (0.23 | ) | (0.15 | ) | — | ||||||||||||||
Class C | ||||||||||||||||||||||||
9/30/2017 | $ | 10.72 | 0.16 | 1.50 | 1.66 | (0.15 | ) | (0.26 | ) | |||||||||||||||
9/30/2016 | $ | 9.60 | 0.20 | 1.31 | 1.51 | (0.19 | ) | (0.20 | ) | |||||||||||||||
12/31/2014(3) – 9/30/2015 | $ | 10.00 | 0.23 | (0.52 | ) | (0.29 | ) | (0.11 | ) | — | ||||||||||||||
Class I | ||||||||||||||||||||||||
9/30/2017 | $ | 10.68 | 0.27 | 1.45 | 1.72 | (0.27 | ) | (0.26 | ) | |||||||||||||||
9/30/2016 | $ | 9.57 | 0.29 | 1.30 | 1.59 | (0.28 | ) | (0.20 | ) | |||||||||||||||
12/31/2014(3) – 9/30/2015 | $ | 10.00 | 0.23 | (0.45 | ) | (0.22 | ) | (0.21 | ) | — | ||||||||||||||
Brandes Global Opportunities Value Fund |
| |||||||||||||||||||||||
Class A | ||||||||||||||||||||||||
9/30/2017 | $ | 10.17 | 0.15 | 1.53 | 1.68 | (0.15 | ) | — | ||||||||||||||||
9/30/2016 | $ | 9.36 | 0.15 | 0.96 | 1.11 | (0.21 | ) | (0.09 | ) | |||||||||||||||
12/31/2014(3) – 9/30/2015 | $ | 10.00 | 0.12 | (0.68 | ) | (0.56 | ) | (0.08 | ) | — | ||||||||||||||
Class C | ||||||||||||||||||||||||
9/30/2017 | $ | 10.15 | 0.07 | 1.53 | 1.60 | (0.08 | ) | — | ||||||||||||||||
9/30/2016 | $ | 9.33 | 0.07 | 0.98 | 1.05 | (0.14 | ) | (0.09 | ) | |||||||||||||||
12/31/2014(3) – 9/30/2015 | $ | 10.00 | 0.12 | (0.75 | ) | (0.63 | ) | (0.04 | ) | — | ||||||||||||||
Class I | ||||||||||||||||||||||||
9/30/2017 | $ | 10.15 | 0.19 | 1.52 | 1.71 | (0.18 | ) | — | ||||||||||||||||
9/30/2016 | $ | 9.33 | 0.17 | 0.97 | 1.14 | (0.23 | ) | (0.09 | ) | |||||||||||||||
12/31/2014(3) – 9/30/2015 | $ | 10.00 | 0.12 | (0.71 | ) | (0.59 | ) | (0.08 | ) | — | ||||||||||||||
| (1) | Not annualized. |
| (2) | Annualized. |
| (3) | Commencement of operations. |
| (4) | After fees waived and expenses absorbed or recouped by the Advisor, where applicable. |
| (5) | Net investment income per share has been calculated based on average shares outstanding during the period. |
| (6) | The total return calculation does not reflect the sales loads that may be imposed on Class A or C shares (see Note 7 of the Notes to Financial Statements). |
| (7) | The total return figure is the since inception return for the class which commenced operations on December 31, 2014. |
| (8) | Amount is less than $50,000. |
| (9) | Includes expenses not covered by the Trust’s expense limitation agreement. See Note 3 for more information. |
The accompanying notes to financial statements are an integral part of this statement.
102
Brandes Investment Trust
FINANCIAL HIGHLIGHTS For a capital share outstanding for the period ended:
| Net asset value, end of period | Total return(6) | Net assets, end of period (millions) | Ratio of net expenses to average net assets(2)(4) | Ratio of net investment income to average net assets(2)(4) | Ratio of expenses (prior to reimburse- ments) to average net assets(2) | Ratio of net investment income (prior to reimburse- ments) to average net assets(2) | Portfolio turnover rate | |||||||||||||||||||||||
| $ | 12.46 | 18.81 | % | $ | — | (8) | 1.27 | %(9) | 2.17 | % | 18.00 | %(9) | (14.56 | )% | 12.97 | % | ||||||||||||||
| $ | 10.79 | 17.35 | % | $ | — | (8) | 1.25 | % | 2.67 | % | 20.41 | % | (16.49 | )% | 22.38 | % | ||||||||||||||
| $ | 9.62 | (2.44 | )%(7) | $ | — | (8) | 1.25 | %(2) | 2.90 | %(2) | 570.42 | %(2) | (566.27 | )%(2) | 16.78 | %(1) | ||||||||||||||
| $ | 11.97 | 16.01 | % | $ | — | (8) | 2.00 | %(9) | 1.44 | % | 17.88 | %(9) | (14.44 | )% | 12.97 | % | ||||||||||||||
| $ | 10.72 | 16.01 | % | $ | — | (8) | 2.00 | % | 1.91 | % | 21.51 | % | (17.60 | )% | 22.38 | % | ||||||||||||||
| $ | 9.60 | (2.99 | )%(7) | $ | — | (8) | 2.00 | %(2) | 2.90 | %(2) | 572.75 | %(2) | (567.85 | )%(2) | 16.78 | %(1) | ||||||||||||||
| $ | 11.87 | 16.71 | % | $ | 1.0 | 1.00 | %(9) | 2.45 | % | 16.88 | %(9) | (13.43 | )% | 12.97 | % | |||||||||||||||
| $ | 10.68 | 16.98 | % | $ | 0.9 | 1.00 | % | 2.91 | % | 24.04 | % | (20.13 | )% | 22.38 | % | |||||||||||||||
| $ | 9.57 | (2.36 | )%(7) | $ | 0.6 | 1.00 | %(2) | 2.90 | %(2) | 37.61 | %(2) | (33.71 | )%(2) | 16.78 | %(1) | |||||||||||||||
| $ | 11.70 | 16.66 | % | $ | 2.8 | 1.40 | %(9) | 1.36 | % | 2.43 | %(9) | 0.33 | % | 11.49 | % | |||||||||||||||
| $ | 10.17 | 12.13 | % | $ | 0.6 | 1.40 | % | 1.53 | % | 4.57 | % | (1.64 | )% | 71.20 | % | |||||||||||||||
| $ | 9.36 | (5.66 | )%(7) | $ | 0.3 | 1.40 | %(2) | 1.29 | %(2) | 9.85 | %(2) | (7.16 | )%(2) | 15.12 | %(1) | |||||||||||||||
| $ | 11.67 | 15.80 | % | $ | 0.2 | 2.15 | %(9) | 0.62 | % | 3.16 | %(9) | (0.39 | )% | 11.49 | % | |||||||||||||||
| $ | 10.15 | 11.42 | % | $ | — | (8) | 2.15 | % | 0.78 | % | 5.32 | % | (2.39 | )% | 71.20 | % | ||||||||||||||
| $ | 9.33 | (6.33 | )%(7) | $ | — | (8) | 2.15 | %(2) | 1.86 | %(2) | 13.79 | %(2) | (9.78 | )%(2) | 15.12 | %(1) | ||||||||||||||
| $ | 11.68 | 16.91 | % | $ | 28.6 | 1.15 | %(9) | 1.62 | % | 2.05 | %(9) | 0.72 | % | 11.49 | % | |||||||||||||||
| $ | 10.15 | 12.45 | % | $ | 5.1 | 1.15 | % | 1.78 | % | 4.25 | % | (1.32 | )% | 71.20 | % | |||||||||||||||
| $ | 9.33 | (5.92 | )%(7) | $ | 3.0 | 1.15 | %(2) | 1.55 | %(2) | 11.77 | %(2) | (9.07 | )%(2) | 15.12 | %(1) | |||||||||||||||
The accompanying notes to financial statements are an integral part of this statement.
103
Brandes Investment Trust
FINANCIAL HIGHLIGHTS For a capital share outstanding for the period ended:
| Net asset value, beginning of period | Net investment income(5) | Net | Total from investment operations | Dividends from net investment income | Dividends from net realized gains | |||||||||||||||||||
Brandes Emerging Markets Value Fund |
| |||||||||||||||||||||||
Class A(8) | ||||||||||||||||||||||||
9/30/2017 | $ | 7.91 | 0.10 | 1.60 | 1.70 | (0.14 | ) | — | ||||||||||||||||
9/30/2016 | $ | 6.19 | 0.12 | 1.69 | 1.81 | (0.09 | ) | — | ||||||||||||||||
9/30/2015 | $ | 9.56 | 0.11 | (3.12 | ) | (3.01 | ) | (0.13 | ) | (0.23 | ) | |||||||||||||
9/30/2014 | $ | 9.23 | 0.11 | 0.53 | 0.64 | (0.10 | ) | (0.21 | ) | |||||||||||||||
9/30/2013 | $ | 8.96 | 0.11 | 0.59 | 0.70 | (0.22 | ) | (0.21 | ) | |||||||||||||||
Class C | ||||||||||||||||||||||||
9/30/2017 | $ | 7.86 | 0.05 | 1.58 | 1.63 | (0.06 | ) | — | ||||||||||||||||
9/30/2016 | $ | 6.15 | 0.07 | 1.67 | 1.74 | (0.03 | ) | — | ||||||||||||||||
9/30/2015 | $ | 9.51 | 0.05 | (3.10 | ) | (3.05 | ) | (0.08 | ) | (0.23 | ) | |||||||||||||
9/30/2014 | $ | 9.19 | 0.03 | 0.54 | 0.57 | (0.04 | ) | (0.21 | ) | |||||||||||||||
1/31/2013(3) – 9/30/2013 | $ | 9.54 | 0.02 | (0.30 | ) | (0.28 | ) | (0.07 | ) | — | ||||||||||||||
Class I | ||||||||||||||||||||||||
9/30/2017 | $ | 7.94 | 0.13 | 1.60 | 1.73 | (0.16 | ) | — | ||||||||||||||||
9/30/2016 | $ | 6.21 | 0.14 | 1.70 | 1.84 | (0.11 | ) | — | ||||||||||||||||
9/30/2015 | $ | 9.58 | 0.13 | (3.12 | ) | (2.99 | ) | (0.15 | ) | (0.23 | ) | |||||||||||||
9/30/2014 | $ | 9.24 | 0.13 | 0.54 | 0.67 | (0.12 | ) | (0.21 | ) | |||||||||||||||
9/30/2013 | $ | 8.99 | 0.13 | 0.56 | 0.69 | (0.23 | ) | (0.21 | ) | |||||||||||||||
Class R6 | ||||||||||||||||||||||||
9/30/2017 | $ | 7.93 | 0.15 | 1.62 | 1.77 | (0.17 | ) | — | ||||||||||||||||
7/11/2016(3) – 9/30/2016 | $ | 7.54 | 0.04 | 0.38 | 0.42 | (0.03 | ) | — | ||||||||||||||||
Brandes International Small Cap Fund |
| |||||||||||||||||||||||
Class A(8) |
| |||||||||||||||||||||||
9/30/2017 | $ | 13.46 | 0.14 | 1.32 | 1.46 | (0.34 | ) | (0.28 | ) | |||||||||||||||
9/30/2016 | $ | 12.58 | 0.09 | 1.22 | 1.31 | (0.23 | ) | (0.20 | ) | |||||||||||||||
9/30/2015 | $ | 13.55 | 0.04 | (0.43 | ) | (0.39 | ) | (0.17 | ) | (0.41 | ) | |||||||||||||
9/30/2014 | $ | 13.72 | 0.06 | 1.02 | 1.08 | (0.36 | ) | (0.89 | ) | |||||||||||||||
9/30/2013 | $ | 10.56 | 0.06 | 3.36 | 3.42 | (0.14 | ) | (0.12 | ) | |||||||||||||||
Class C | ||||||||||||||||||||||||
9/30/2017 | $ | 13.24 | 0.04 | 1.30 | 1.34 | (0.27 | ) | (0.28 | ) | |||||||||||||||
9/30/2016 | $ | 12.42 | 0.00 | 1.19 | 1.19 | (0.17 | ) | (0.20 | ) | |||||||||||||||
9/30/2015 | $ | 13.45 | (0.04 | ) | (0.44 | ) | (0.48 | ) | (0.14 | ) | (0.41 | ) | ||||||||||||
9/30/2014 | $ | 13.68 | (0.04 | ) | 1.02 | 0.98 | (0.32 | ) | (0.89 | ) | ||||||||||||||
1/31/2013(3) – 9/30/2013 | $ | 11.90 | (0.02 | ) | 1.83 | 1.81 | (0.03 | ) | — | |||||||||||||||
Class I | ||||||||||||||||||||||||
9/30/2017 | $ | 13.50 | 0.17 | 1.32 | 1.49 | (0.36 | ) | (0.28 | ) | |||||||||||||||
9/30/2016 | $ | 12.61 | 0.12 | 1.22 | 1.34 | (0.25 | ) | (0.20 | ) | |||||||||||||||
9/30/2015 | $ | 13.58 | 0.08 | (0.44 | ) | (0.36 | ) | (0.20 | ) | (0.41 | ) | |||||||||||||
9/30/2014 | $ | 13.74 | 0.09 | 1.03 | 1.12 | (0.39 | ) | (0.89 | ) | |||||||||||||||
9/30/2013 | $ | 10.56 | 0.09 | 3.37 | 3.46 | (0.16 | ) | (0.12 | ) | |||||||||||||||
Class R6 | ||||||||||||||||||||||||
9/30/2017 | $ | 13.50 | 0.18 | 1.33 | 1.51 | (0.37 | ) | (0.28 | ) | |||||||||||||||
6/27/2016(3) – 9/30/2016 | $ | 12.38 | 0.04 | 1.13 | 1.17 | (0.05 | ) | — | ||||||||||||||||
| (1) | Not annualized. |
| (2) | Annualized. |
| (3) | Commencement of operations. |
| (4) | After fees waived and expenses absorbed or recouped by the Advisor, where applicable. |
| (5) | Net investment income per share has been calculated based on average shares outstanding during the period. |
| (6) | The total return calculation does not reflect the sales loads that may be imposed on Class A or C shares (see Note 7 of the Notes to Financial Statements). |
| (7) | The total return figure is the since inception return for the class. |
| (8) | Prior to January 31, 2013, Class A shares were know as Class S shares. |
| (9) | Amount is less than $50,000. |
| (10) | Includes expenses not covered by the Trust’s expense limitation agreement. See Note 3 for more information. |
The accompanying notes to financial statements are an integral part of this statement.
104
Brandes Investment Trust
FINANCIAL HIGHLIGHTS For a capital share outstanding for the period ended:
| Net asset value, end of period | Total return(6) | Net assets, end of period (millions) | Ratio of net expenses to average net assets(4) | Ratio of net investment income to average net assets(4) | Ratio of expenses (prior to reimburse- ments) to average net assets | Ratio of net investment income (prior to reimburse- ments) to average net assets | Portfolio turnover rate | |||||||||||||||||||||||
| $ | 9.47 | 21.78 | % | $ | 319.2 | 1.42 | %(10) | 1.27 | % | 1.40 | %(10) | 1.29 | % | 23.67 | % | |||||||||||||||
| $ | 7.91 | 29.38 | % | $ | 305.0 | 1.37 | % | 1.74 | % | 1.39 | % | 1.72 | % | 26.48 | % | |||||||||||||||
| $ | 6.19 | (32.32 | )% | $ | 295.6 | 1.37 | % | 1.46 | % | 1.40 | % | 1.43 | % | 35.02 | % | |||||||||||||||
| $ | 9.56 | 7.09 | % | $ | 266.9 | 1.37 | % | 1.10 | % | 1.37 | % | 1.10 | % | 22.54 | % | |||||||||||||||
| $ | 9.23 | 8.09 | % | $ | 131.7 | 1.37 | % | 1.16 | % | 1.46 | % | 1.07 | % | 21.74 | % | |||||||||||||||
| $ | 9.43 | 20.83 | % | $ | 28.2 | 2.17 | %(10) | 0.52 | % | 2.14 | %(10) | 0.55 | % | 23.67 | % | |||||||||||||||
| $ | 7.86 | 28.38 | % | $ | 22.4 | 2.12 | % | 0.99 | % | 2.14 | % | 0.97 | % | 26.48 | % | |||||||||||||||
| $ | 6.15 | (32.83 | )% | $ | 18.4 | 2.12 | % | 0.62 | % | 2.14 | % | 0.60 | % | 35.02 | % | |||||||||||||||
| $ | 9.51 | 6.38 | % | $ | 25.3 | 2.12 | % | 0.35 | % | 2.13 | % | 0.34 | % | 22.54 | % | |||||||||||||||
| $ | 9.19 | (2.84 | )%(7) | $ | 5.3 | 2.12 | %(2) | 0.42 | %(2) | 2.20 | %(2) | 0.34 | %(2) | 21.74 | %(1) | |||||||||||||||
| $ | 9.51 | 22.07 | % | $ | 1,311.5 | 1.17 | %(10) | 1.51 | % | 1.20 | %(10) | 1.48 | % | 23.67 | % | |||||||||||||||
| $ | 7.94 | 29.70 | % | $ | 829.0 | 1.12 | % | 1.99 | % | 1.19 | % | 1.92 | % | 26.48 | % | |||||||||||||||
| $ | 6.21 | (32.13 | )% | $ | 725.1 | 1.12 | % | 1.58 | % | 1.19 | % | 1.51 | % | 35.02 | % | |||||||||||||||
| $ | 9.58 | 7.41 | % | $ | 1,144.3 | 1.12 | % | 1.34 | % | 1.18 | % | 1.28 | % | 22.54 | % | |||||||||||||||
| $ | 9.24 | 8.20 | % | $ | 287.7 | 1.12 | % | 1.41 | % | 1.26 | % | 1.27 | % | 21.74 | % | |||||||||||||||
| $ | 9.53 | 22.53 | % | $ | 97.4 | 1.02 | %(10) | 1.68 | % | 1.17 | %(10) | 1.53 | % | 23.67 | % | |||||||||||||||
| $ | 7.93 | 5.59 | %(7) | $ | — | (9) | 0.97 | %(2) | 2.14 | %(2) | 1.14 | %(2) | 1.97 | %(2) | 26.48 | %(1) | ||||||||||||||
| $ | 14.30 | 11.29 | % | $ | 176.9 | 1.30 | %(10) | 1.04 | % | 1.30 | %(10) | 1.04 | % | 21.37 | % | |||||||||||||||
| $ | 13.46 | 10.60 | % | $ | 121.1 | 1.32 | % | 0.71 | % | 1.31 | % | 0.72 | % | 21.00 | % | |||||||||||||||
| $ | 12.58 | (2.76 | )% | $ | 79.1 | 1.40 | % | 0.35 | % | 1.32 | % | 0.43 | % | 24.82 | % | |||||||||||||||
| $ | 13.55 | 8.36 | % | $ | 50.1 | 1.40 | % | 0.42 | % | 1.39 | % | 0.43 | % | 24.30 | % | |||||||||||||||
| $ | 13.72 | 32.98 | % | $ | 31.2 | 1.40 | % | 0.49 | % | 1.68 | % | 0.21 | % | 24.45 | % | |||||||||||||||
| $ | 14.03 | 10.52 | % | $ | 27.2 | 2.05 | %(10) | 0.29 | % | 2.05 | %(10) | 0.29 | % | 21.37 | % | |||||||||||||||
| $ | 13.24 | 9.78 | % | $ | 19.8 | 2.06 | % | (0.03 | )% | 2.06 | % | (0.03 | )% | 21.00 | % | |||||||||||||||
| $ | 12.42 | (3.49 | )% | $ | 15.1 | 2.07 | % | (0.34 | )% | 2.07 | % | (0.34 | )% | 24.82 | % | |||||||||||||||
| $ | 13.45 | 7.60 | % | $ | 12.3 | 2.14 | % | (0.32 | )% | 2.14 | % | (0.32 | )% | 24.30 | % | |||||||||||||||
| $ | 13.68 | 15.23 | %(7) | $ | 1.5 | 2.15 | %(2) | (0.25 | )%(2) | 2.40 | %(2) | (0.50 | )%(2) | 24.45 | %(1) | |||||||||||||||
| $ | 14.35 | 11.54 | % | $ | 1,543.9 | 1.10 | %(10) | 1.24 | % | 1.10 | %(10) | 1.24 | % | 21.37 | % | |||||||||||||||
| $ | 13.50 | 10.85 | % | $ | 1,212.4 | 1.13 | % | 0.90 | % | 1.11 | % | 0.92 | % | 21.00 | % | |||||||||||||||
| $ | 12.61 | (2.58 | )% | $ | 877.6 | 1.15 | % | 0.59 | % | 1.12 | % | 0.62 | % | 24.82 | % | |||||||||||||||
| $ | 13.58 | 8.67 | % | $ | 567.9 | 1.15 | % | 0.67 | % | 1.18 | % | 0.64 | % | 24.30 | % | |||||||||||||||
| $ | 13.74 | 33.41 | % | $ | 81.5 | 1.15 | % | 0.74 | % | 1.48 | % | 0.31 | % | 24.45 | % | |||||||||||||||
| $ | 14.36 | 11.67 | % | $ | 76.1 | 1.01 | %(10) | 1.33 | % | 1.05 | %(10) | 1.29 | % | 21.37 | % | |||||||||||||||
| $ | 13.50 | 9.49 | %(7) | $ | 16.5 | 1.00 | %(2) | 1.03 | %(2) | 1.06 | %(2) | 0.97 | %(2) | 21.00 | %(1) | |||||||||||||||
The accompanying notes to financial statements are an integral part of this statement.
105
Brandes Investment Trust
FINANCIAL HIGHLIGHTS For a capital share outstanding for the period ended:
| Net asset value, beginning of period | Net investment income(5) | Net realized and unrealized gain/(loss) on investments | Total from investment operations | Dividends from net investment income | Dividends from net realized gains | |||||||||||||||||||
Brandes Core Plus Fixed Income Fund |
| |||||||||||||||||||||||
Class A | ||||||||||||||||||||||||
9/30/2017 | $ | 9.39 | 0.20 | (0.18 | ) | 0.02 | (0.21 | ) | (0.02 | ) | ||||||||||||||
9/30/2016 | $ | 9.14 | 0.22 | 0.26 | 0.48 | (0.22 | ) | (0.01 | ) | |||||||||||||||
9/30/2015 | $ | 9.22 | 0.19 | (0.02 | ) | 0.17 | (0.20 | ) | (0.05 | ) | ||||||||||||||
9/30/2014 | $ | 9.16 | 0.25 | 0.06 | 0.31 | (0.24 | ) | (0.01 | ) | |||||||||||||||
1/31/2013(3) – 9/30/2013 | $ | 9.43 | 0.20 | (0.28 | ) | (0.08 | ) | (0.19 | ) | — | ||||||||||||||
Class I | ||||||||||||||||||||||||
9/30/2017 | $ | 9.44 | 0.22 | (0.16 | ) | 0.06 | (0.23 | ) | (0.02 | ) | ||||||||||||||
9/30/2016 | $ | 9.20 | 0.24 | 0.25 | 0.49 | (0.24 | ) | (0.01 | ) | |||||||||||||||
9/30/2015 | $ | 9.28 | 0.21 | (0.02 | ) | 0.19 | (0.22 | ) | (0.05 | ) | ||||||||||||||
9/30/2014 | $ | 9.19 | 0.27 | 0.10 | 0.37 | (0.27 | ) | (0.01 | ) | |||||||||||||||
9/30/2013 | $ | 9.60 | 0.32 | (0.23 | ) | 0.09 | (0.38 | ) | (0.12 | ) | ||||||||||||||
Brandes Credit Focus Yield Fund |
| |||||||||||||||||||||||
Class A(8) | ||||||||||||||||||||||||
9/30/2017 | $ | 10.35 | 0.28 | (0.08 | ) | 0.20 | (0.28 | ) | (0.02 | ) | ||||||||||||||
9/30/2016 | $ | 10.02 | 0.29 | 0.33 | 0.62 | (0.29 | ) | — | ||||||||||||||||
9/30/2015 | $ | 10.23 | 0.23 | (0.20 | ) | 0.03 | (0.23 | ) | (0.01 | ) | ||||||||||||||
9/30/2014 | $ | 10.15 | 0.21 | 0.09 | 0.30 | (0.21 | ) | (0.01 | ) | |||||||||||||||
9/30/2013 | $ | 10.39 | 0.19 | (0.17 | ) | 0.02 | (0.20 | ) | (0.06 | ) | ||||||||||||||
Class I | ||||||||||||||||||||||||
9/30/2017 | $ | 10.34 | 0.31 | (0.08 | ) | 0.23 | (0.31 | ) | (0.02 | ) | ||||||||||||||
9/30/2016 | $ | 10.02 | 0.31 | 0.32 | 0.63 | (0.31 | ) | — | ||||||||||||||||
9/30/2015 | $ | 10.23 | 0.26 | (0.20 | ) | 0.06 | (0.26 | ) | (0.01 | ) | ||||||||||||||
9/30/2014 | $ | 10.15 | 0.23 | 0.09 | 0.32 | (0.23 | ) | (0.01 | ) | |||||||||||||||
9/30/2013 | $ | 10.39 | 0.22 | (0.18 | ) | 0.04 | (0.22 | ) | (0.06 | ) | ||||||||||||||
| (1) | Not annualized. |
| (2) | Annualized. |
| (3) | Commencement of operations. |
| (4) | After fees waived and expenses absorbed or recouped by the Advisor, where applicable. |
| (5) | Net investment income per share has been calculated based on average shares outstanding during the period. |
| (6) | The total return calculation does not reflect the sales loads that may be imposed on Class A or C shares (see Note 7 of the Notes to Financial Statements). |
| (7) | The total return figure is the since inception return for the class. |
| (8) | Prior to January 31, 2013, Class A shares were know as Class S shares. |
| (9) | Effective February 1, 2016, the contractual operating expense limit was reduced from 0.95% to 0.85% for Class A and 0.70% to 0.60% for Class I. |
| (10) | Includes expenses not covered by the Trust’s expense limitation agreement. See Note 3 for more information. |
The accompanying notes to financial statements are an integral part of this statement.
106
Brandes Investment Trust
FINANCIAL HIGHLIGHTS For a capital share outstanding for the period ended:
| Net asset value, end of period | Total return(6) | Net assets, end of period (millions) | Ratio of net expenses to average net assets(4) | Ratio of net investment income to average net assets(4) | Ratio of expenses (prior to reimburse- ments) to average net assets | Ratio of net investment income (prior to reimburse- ments) to average net assets | Portfolio turnover rate | |||||||||||||||||||||||
| $ | 9.18 | 0.28 | % | $ | 3.3 | 0.71 | %(10) | 2.25 | % | 0.85 | %(10) | 2.11 | % | 35.10 | % | |||||||||||||||
| $ | 9.39 | 5.32 | % | $ | 2.0 | 0.70 | % | 2.38 | % | 0.93 | % | 2.15 | % | 35.88 | % | |||||||||||||||
| $ | 9.14 | 1.78 | % | $ | 2.1 | 0.70 | % | 2.07 | % | 1.06 | % | 1.71 | % | 11.24 | % | |||||||||||||||
| $ | 9.22 | 3.52 | % | $ | 2.1 | 0.70 | % | 2.68 | % | 1.33 | % | 2.05 | % | 18.63 | % | |||||||||||||||
| $ | 9.16 | (0.88 | )%(7) | $ | 1.4 | 0.70 | %(2) | 3.23 | %(2) | 1.45 | %(2) | 2.48 | %(2) | 33.91 | %(1) | |||||||||||||||
| $ | 9.25 | 0.71 | % | $ | 97.9 | 0.51 | %(10) | 2.45 | % | 0.66 | %(10) | 2.30 | % | 35.10 | % | |||||||||||||||
| $ | 9.44 | 5.43 | % | $ | 97.2 | 0.50 | % | 2.58 | % | 0.72 | % | 2.36 | % | 35.88 | % | |||||||||||||||
| $ | 9.20 | 2.02 | % | $ | 72.1 | 0.50 | % | 2.26 | % | 0.86 | % | 1.90 | % | 11.24 | % | |||||||||||||||
| $ | 9.28 | 4.10 | % | $ | 43.3 | 0.50 | % | 2.88 | % | 1.20 | % | 2.18 | % | 18.63 | % | |||||||||||||||
| $ | 9.19 | 0.89 | % | $ | 29.7 | 0.50 | % | 3.43 | % | 1.23 | % | 2.70 | % | 33.91 | % | |||||||||||||||
| $ | 10.25 | 1.94 | % | $ | 2.3 | 0.85 | %(10) | 2.74 | % | 1.33 | %(10) | 2.26 | % | 29.65 | % | |||||||||||||||
| $ | 10.35 | 6.33 | % | $ | 2.3 | 0.88 | %(9) | 2.90 | % | 1.35 | % | 2.43 | % | 34.14 | % | |||||||||||||||
| $ | 10.02 | 0.26 | % | $ | 2.1 | 0.95 | % | 2.28 | % | 1.53 | % | 1.70 | % | 25.50 | % | |||||||||||||||
| $ | 10.23 | 2.94 | % | $ | 2.0 | 0.95 | % | 2.02 | % | 1.50 | % | 1.47 | % | 26.17 | % | |||||||||||||||
| $ | 10.15 | 0.13 | % | $ | 4.2 | 0.95 | % | 1.84 | % | 1.61 | % | 1.18 | % | 23.05 | % | |||||||||||||||
| $ | 10.24 | 2.19 | % | $ | 29.5 | 0.60 | %(10) | 2.99 | % | 1.08 | %(10) | 2.51 | % | 29.65 | % | |||||||||||||||
| $ | 10.34 | 6.49 | % | $ | 29.0 | 0.63 | %(9) | 3.15 | % | 1.10 | % | 2.68 | % | 34.14 | % | |||||||||||||||
| $ | 10.02 | 0.58 | % | $ | 27.3 | 0.70 | % | 2.53 | % | 1.28 | % | 1.95 | % | 25.50 | % | |||||||||||||||
| $ | 10.23 | 3.20 | % | $ | 27.1 | 0.70 | % | 2.26 | % | 1.26 | % | 1.70 | % | 26.17 | % | |||||||||||||||
| $ | 10.15 | 0.40 | % | $ | 25.2 | 0.70 | % | 2.09 | % | 1.42 | % | 1.37 | % | 23.05 | % | |||||||||||||||
The accompanying notes to financial statements are an integral part of this statement.
107
Brandes Investment Trust
NOTE 1 – ORGANIZATION
The Brandes International Equity Fund (the “International Fund”), the Brandes Global Equity Fund (the “Global Fund”), the Brandes Global Equity Income Fund (the “Global Income Fund”), the Brandes Global Opportunities Value Fund (the “Global Opportunities Fund”), the Brandes Emerging Markets Value Fund (the “Emerging Markets Fund”), the Brandes International Small Cap Equity Fund (the “International Small Cap Fund”), the Brandes Core Plus Fixed Income Fund (the “Core Plus Fund”) and the Brandes Credit Focus Yield Fund (the “Credit Focus Yield Fund”) (each a “Fund” and collectively the “Funds”) are series of Brandes Investment Trust (the “Trust”). The Trust is registered under the Investment Company Act of 1940 (the “1940 Act”) as a diversified, open-end management investment company.
The International Fund, Global Fund, Global Income Fund, Global Opportunities Fund, Emerging Markets Fund, Core Plus Fund, Credit Focus Yield Fund and International Small Cap Fund began operations on January 2, 1997, October 6, 2008, December 31, 2014, December 31, 2014, January 31, 2011, December 28, 2007, January 31, 2012 and January 31, 2012, respectively. Prior to January 31, 2011 for the Emerging Markets Fund and January 31, 2012 for the International Small Cap and Credit Focus Yield Funds, these Funds’ portfolios were managed as private investment funds with investment objectives, investment policies and strategies that were, in all material respects, equivalent to those of the Emerging Markets Fund, International Small Cap Fund and Credit Focus Yield Fund, respectively.
The International Fund has four classes of shares: Class A, Class C, Class I and Class R6. The Global Fund, the Global Income Fund and Global Opportunities Fund have three classes of shares: Class A, Class C and Class I. The Emerging Markets Fund and International Small Cap Fund have four classes of shares: Class A, Class C, Class I and Class R6. The Core Plus Fund and the Credit Focus Yield Fund have two classes of shares: Class A and Class I. Prior to January 31, 2013, Class A shares were known as Class S shares for the International, Global, Emerging Markets, International Small Cap and Credit Focus Yield Funds (Class A shares have the same operating expenses as Class S shares).
The International Fund and Global Fund invest their assets primarily in equity securities of issuers with market capitalizations greater than $1 billion. The International, International Small Cap and Emerging Markets Funds invest their assets in securities of foreign companies, while the Global Fund, Global Income Fund and Global Opportunities Fund invests its assets in securities of foreign and domestic companies. The Core Plus Fund and Credit Focus Yield Fund invest predominantly in debt securities issued by U.S. and foreign companies and debt obligations issued or guaranteed by the U.S. Government and foreign governments and their agencies and instrumentalities.
108
Brandes Investment Trust
NOTES TO FINANCIAL STATEMENTS — (continued)
NOTE 2 – SIGNIFICANT ACCOUNTING POLICIES
The following is a summary of significant accounting policies consistently followed by the Funds. These policies are in conformity with generally accepted accounting principles (“GAAP”) in the United States of America.
| A. | Repurchase Agreements. Each Fund may enter into repurchase agreements with government securities dealers recognized by the Federal Reserve Board, with member banks of the Federal Reserve System or with other brokers or dealers that meet the credit guidelines established by the Board of Trustees. Each Fund will always receive and maintain, as collateral, U.S. Government securities whose market value, including accrued interest (which is recorded in the Schedules of Investments), will be at least equal to 100% of the dollar amount invested by the Fund in each agreement, and the Fund will make payment for such securities only upon physical delivery or upon evidence of book entry transfer to the account of the Fund’s custodian. To the extent that the term of any repurchase transaction exceeds one business day, the value of the collateral is marked-to-market on a daily basis to ensure the adequacy of the collateral. Before causing a Fund to enter into a repurchase agreement with any other party, the investment advisor will determine that such party does not have any apparent risk of becoming involved in bankruptcy proceedings within the time frame contemplated by the repurchase agreement. If the seller defaults and the value of the collateral declines, or if bankruptcy proceedings are commenced with respect to the seller of the security, realization of the collateral by the Fund may be delayed or limited. At September 30, 2017, the Funds’ ongoing exposure to the economic return on repurchase agreements is shown on the Schedule of Investments. |
| B. | Foreign Currency Translation and Transactions. Values of investments denominated in foreign currencies are converted into U.S. dollars using the spot market rates of exchange at the time of valuation. Purchases and sales of investments and dividend and interest income are translated into U.S. dollars using the spot market rates of exchange prevailing on the respective dates of such translations. The gain or loss resulting from changes in foreign exchange rates is included with net realized and unrealized gain or loss from investments, as appropriate. Foreign securities and currency transactions may involve certain considerations and risks not typically associated with those of domestic origin. |
Foreign securities are recorded in the financial statements after translation to U.S. dollars based on the applicable exchange rate at the end of the period. The Funds report certain foreign currency-related transactions as components of realized gains or losses for financial reporting purposes, whereas such components are treated as ordinary income for federal income tax purposes.
109
Brandes Investment Trust
NOTES TO FINANCIAL STATEMENTS — (continued)
| C. | Delayed Delivery Securities. The Funds may purchase securities on a when issued or delayed delivery basis. “When-issued” or delayed delivery refers to securities whose terms are available and for which a market exists, but that have not been issued. For a when-issued or delayed delivery transaction, no payment is made until delivery date, which is typically longer than the normal course of settlement. When a Fund enters into an agreement to purchase securities on a when-issued or delayed delivery basis, the Fund segregates cash or liquid securities, of any type or maturity, equal in value to the Fund’s commitment. Losses may arise if the market value of the underlying securities change, if the counterparty does not perform under the contract, or if the issuer does not issue the securities due to political, economic, or other factors. The Funds did not have any open commitments on delayed delivery securities as of September 30, 2017. |
| D. | Participatory Notes. The International, Global, Global Income, Global Opportunities, Emerging Markets and International Small Cap Funds may invest in participatory notes. Participatory notes are derivative securities which are designed to provide synthetic exposure to one or more underlying securities, subject to the credit risk of the issuing financial institution. |
Investments in participatory notes involve risks normally associated with a direct investment in the underlying securities. In addition, participatory notes are subject to counterparty risk, which is the risk that the broker-dealer or bank that issues the notes will not fulfill its contractual obligation to complete the transaction with the Trust. Participatory notes constitute general unsecured, unsubordinated contractual obligations of the banks or broker-dealers that issue them and generally are issued as an actual note from the financial intermediary or an equity linked warrant (commonly known as a low exercise price option). The Trust is relying on the creditworthiness of such banks or broker-dealers and has no rights under a participatory note against the issuer of the securities underlying such participatory note. The investment advisor has established guidelines for monitoring participatory note exposure for the Funds. Prior to investment in a participatory note, the investment advisor will complete an analysis of the prospective counterparties and once purchased, will continue to monitor creditworthiness on a quarterly basis. The investment advisor requires a minimum credit rating for such counterparties (as determined by rating agencies such as Moody’s, Fitch and S&P) of A.
The Funds record counterparty credit risk valuation adjustments, if material, on the participatory notes in order to appropriately reflect the credit quality of the counterparty. During the year ended September 30, 2017, the Funds did not make any counterparty credit risk valuation adjustments.
110
Brandes Investment Trust
NOTES TO FINANCIAL STATEMENTS — (continued)
The International, Global, Global Income, Global Opportunities, and International Small Cap Funds did not invest in any participatory notes at September 30, 2017. The Emerging Markets Value Fund invested in two participatory notes with HSBC Bank Plc. The average monthly market value of Banque Saudi Fransi and Saudi British Bank were $6,668,513, and $3,891,035, respectively, during the year ended September 30, 2017. As a result of the investment in participation notes, the Emerging Markets Value Fund recognized net unrealized gains of $1,053,573 and $634,559, and realized gains of $414,317 and $247,497, respectively. The market values of these securities on September 30, 2017 were $6,798,251 and $3,274,892, respectively, and can be found in the Emerging Market Value Fund’s Schedule of Investments.
| E. | Investment Transactions, Dividends and Distributions. Investment transactions are accounted for on the trade dates. Realized gains and losses are evaluated on the basis of identified costs. Dividend income and distributions to shareholders are recorded on the ex-dividend dates. Interest is recorded on an accrual basis. Withholding taxes on foreign dividends and capital gains, which are included as a component of net investment income and realized gain (loss) on investments, respectively, have been provided for in accordance with the Trust’s understanding of the applicable country’s tax rules and rates. Each Fund’s investment income, expenses, other than class specific expenses, and realized and unrealized gains and losses are allocated daily to each class of the Fund’s shares based upon the relative net asset values of outstanding shares of each class of shares at the beginning of the day (after adjusting for the current capital shares activity of the respective class). Expenses common to the Funds’ portfolios are allocated among the Funds based upon their relative net asset values or other appropriate allocation methods. The Funds amortize premiums and accrete discounts using the constant yield method. |
| F. | Concentration of Risk. As of September 30, 2017, the International, Global, Global Income, Global Opportunities, Emerging Markets and International Small Cap Funds held significant portions of their assets in foreign securities. Certain price and foreign exchange fluctuations as well as economic and political situations in the foreign jurisdictions could have an impact on the International, Global, Global Income, Global Opportunities, Emerging Markets and International Small Cap Funds’ net assets. The investment advisor monitors these off-balance sheet risks. |
| G. | Use of Estimates. The preparation of financial statements in conformity with GAAP requires management to make estimates and assumptions that affect the reported amounts of assets and liabilities at the date of the |
111
Brandes Investment Trust
NOTES TO FINANCIAL STATEMENTS — (continued)
| financial statements and the reported amounts of revenues and expenses during the reporting period. Actual results could differ from those estimates and assumptions. |
| H. | Securities Lending. The Funds may lend their portfolio securities to banks, brokers and dealers. Lending Fund securities exposes the Fund to risks such as the following: (i) the borrower may fail to return the loaned securities, (ii) the borrower may not be able to provide additional collateral, or (iii) the Fund may experience delays in recovery of the loaned securities or loss of rights in the collateral if the borrower fails financially. |
To minimize these risks, the borrower must agree to maintain collateral with the Fund’s custodian, marked to market daily, in the form of cash and/or U.S. Government obligations, in an amount at least equal to 102% (105% in the case of loans of foreign securities not denominated in U.S. dollars) of the market value of the loaned securities. As of September 30, 2017, the International Fund, Global Fund, Global Income Fund, Global Opportunities Fund, Emerging Markets Fund, International Small Cap Fund, Core Plus Fund and Credit Focus Fund did not have any securities on loan. Non-cash collateral received by the Funds may not be sold or re-pledged except to satisfy a borrower default. Therefore, non-cash collateral is not included on the Funds’ Schedule of Investments or Statement of Assets and Liabilities.
| I. | Indemnification Obligations. Under the Trust’s organizational documents, its current and former officers and trustees are indemnified against certain liabilities arising out of the performance of their duties to the Trust. The Trust has indemnified its trustees against any expenses actually and reasonably incurred by the trustees in any proceeding arising out of or in connection with the trustees’ service to the Trust. In addition, in the normal course of business, the Trust enters into contracts that contain a variety of representations and warranties and provide general indemnifications. The Funds’ maximum exposure under these arrangements is unknown as this would involve future claims that may be made against the Funds that have not yet occurred or that would be covered by other parties. |
| J. | Accounting for Uncertainty in Income Taxes. Each Fund has elected to be taxed as a “regulated investment company” and intends to distribute substantially all its taxable income to its shareholders and otherwise comply with the provisions of the Internal Revenue Code applicable to regulated investment companies. The Funds may be subject to a nondeductible excise tax calculated as a percentage of certain undistributed amounts of net investment income and net capital gains. The Funds intend to distribute their net investment income and capital gains as necessary to avoid this excise tax. Therefore, no provision for federal income taxes or excise taxes has been made. |
112
Brandes Investment Trust
NOTES TO FINANCIAL STATEMENTS — (continued)
The Trust has adopted financial reporting rules that require the Funds to analyze all open tax years, as defined by the applicable statute of limitations, for all major jurisdictions. Open tax years for the Funds are those that are open for exam by taxing authorities (2014 through 2017). As of September 30, 2017 the Trust has no examinations in progress.
Management has analyzed the Trust’s tax positions, and has concluded that no liability should be recorded related to uncertain tax positions expected to be taken on the tax return for the fiscal year-ended September 30, 2017.
The Trust identifies its major tax jurisdictions as the U.S. Government and the State of California. The Funds are not aware of any tax positions for which it is reasonably possible that the total amounts of unrecognized tax benefits will significantly change in the next twelve months.
| K. | Fair Value Measurements. The Trust has adopted GAAP accounting principles related to fair value accounting standards which establish a definition of fair value and set out a hierarchy for measuring fair value. These standards require additional disclosures about the various inputs and valuation techniques used to develop the measurements of fair value and a discussion of changes in valuation techniques and related inputs during the period. These inputs are summarized in the three broad levels listed below: |
Level 1 — Fair value measurement within Level 1 should be based on an unadjusted quoted price in an active market that the Funds have the ability to access for the asset or liability at the measurement date. Because a quoted price alone forms the basis for the measurement, the access requirement within Level 1 limits discretion in pricing the asset or liability, including in situations in which there are multiple markets for the asset or liability with different prices and no single market represents a principal market for the asset or liability. Importantly, the Financial Accounting Standards Board has indicated that when a quoted price in an active market for a security is available, that price should be used to measure fair value without regard to an entity’s intent to transact at that price.
Level 2 — Fair value measurement within Level 2 should be based on all inputs other than unadjusted quoted prices included within Level 1 that are observable for the asset or liability. Other significant observable market inputs include quoted prices for similar instruments in active markets, quoted adjusted prices in active markets, quoted prices for identical or similar instruments in markets that are not active, and model-derived valuations in which the majority of significant inputs and significant value drivers are observable in active markets.
Level 3 — Fair value measurement within Level 3 should be based on unobservable inputs in such cases where markets do not exist or are illiquid.
113
Brandes Investment Trust
NOTES TO FINANCIAL STATEMENTS — (continued)
Significant unobservable inputs include model derived valuations in which the majority of significant inputs or significant value drivers are unobservable. Unobservable inputs are those inputs that reflect the Fund’s own assumptions that market participants would use to price the asset or liability based on the best available information.
| L. | Security Valuation. Common and preferred stocks, exchange-traded funds and financial derivative instruments, such as futures contracts and options contracts that are traded on a national securities or commodities exchange, are valued at the last reported sales price at the close of regular trading on each day the exchange is open for trading, in the case of common stocks and exchange-traded funds, or, in the case of futures contracts or options contracts, the settlement price determined by the relevant exchange. Securities listed on the NASDAQ National Market System for which market quotations are readily available are valued using the NASDAQ Official Closing Price. To the extent these securities are actively traded and valuation adjustments are not applied, they are categorized as Level 1 of the fair value hierarchy. |
Equity securities traded on an exchange for which there have been no sales on the valuation date are generally valued at the mean between last bid and ask price on such day and are categorized as Level 2 of the fair value hierarchy, or are fair valued by the Valuation Committee.
Investments in registered open-end management investment companies will be valued based upon the Net Asset Values (“NAVs”) of such investments and are categorized as Level 1 of the fair value hierarchy.
Valuation adjustments may be applied to certain common and preferred stocks that are solely traded on a foreign exchange to account for the market movement between the close of the foreign market and the close of the New York Stock Exchange (“NYSE”). These securities are generally valued using pricing service providers that consider the correlation of the trading patterns of the foreign securities to the intraday trading in the U.S. markets for investments. Securities using these valuation adjustments are categorized as Level 2 of the fair value hierarchy. As of September 30, 2017, the International Fund, Global Fund, Global Income Fund, Global Opportunities Fund, Emerging Markets Fund and International Small Cap Fund had securities with market values of $477,356,375, $39,284,137, $596,044, $15,039,261, $700,039,251, and $833,957,477 that represent 78.12%, 56.78%, 57.16%, 47.53%, 39.86%, 45.72% of each Fund’s net assets, respectively, that were fair valued using these valuation adjustments.
Fixed income securities (other than repurchase agreements and demand notes) including corporate, convertible and municipal bonds and notes, U.S. government agencies, U.S. Treasury obligations, sovereign issues, bank loans, convertible preferred securities, fixed income securities
114
Brandes Investment Trust
NOTES TO FINANCIAL STATEMENTS — (continued)
purchased on a delayed delivery basis and non-U.S. bonds are normally valued on the basis of quotes obtained from brokers and dealers or independent pricing services or sources. Independent pricing services typically use information provided by market makers or estimates of market values obtained from yield data relating to investments or securities with similar characteristics. The service providers’ internal models use inputs that are observable such as, among other things, issuer details, interest rates, yield curves, prepayment speeds, credit risks/spreads, default rates and quoted prices for similar assets. Securities that use similar valuation techniques and inputs as described above are categorized as Level 2 of the fair value hierarchy.
Rights that are traded on a national securities exchange are valued at the last reported sales price at the close of regular trading on each day the exchange is open. A right is a privilege offered by a corporation to its shareholders pro rata to subscribe to a certain security at a specified price, often for a short period. Rights may or may not be transferable.
The Funds may enter into mortgage dollar roll transactions in which the Funds sell a mortgage-backed security to a counterparty and simultaneously enter into an agreement with the same counterparty to buy back a similar security on a specific future date at a predetermined price. Risks may arise due to the delayed payment date and the potential inability of counterparties to complete the transaction. Mortgage dollar rolls are accounted for as purchase and sale transactions, which may increase a Fund’s portfolio turnover rate.
Mortgage and asset-backed securities are usually issued as separate tranches, or classes, of securities within each package of underlying securities. These securities are also normally valued by pricing service providers that use broker dealer quotations or valuation estimates from their internal pricing models. The pricing models for these securities usually consider tranche level attributes, estimated cash flows and market-based yield spreads for each tranche, and current market data and incorporate packaged collateral performance, as available. Mortgage and asset-backed securities that use such valuation techniques and inputs are categorized as Level 2 of the fair value hierarchy.
Repurchase agreements and demand notes, for which neither vendor pricing nor market maker prices are available, are valued at amortized cost on the day of valuation, unless the Advisor determines that the use of amortized cost valuation on such day is not appropriate (in which case such instrument is fair valued in accordance with the fair value procedures of the Trust).
Certain securities may be fair valued in accordance with the fair valuation procedures approved by the Board of Trustees. The Valuation Committee
115
Brandes Investment Trust
NOTES TO FINANCIAL STATEMENTS — (continued)
is generally responsible for overseeing the day-to-day valuation processes and reports periodically to the Board. The Valuation Committee is authorized to make all necessary determinations of the fair value of portfolio securities and other assets for which market quotations are not readily available or if it is deemed that the prices obtained from brokers and dealers or independent pricing services are unreliable. The securities fair valued by the Valuation Committee are indicated in the Schedules of Investments and are categorized as Level 2 or Level 3 of the fair value hierarchy. Certain vendor priced securities may also be considered Level 3 if significant unobservable inputs are used by the vendors.
In using fair value pricing, each Fund attempts to establish the price that it might reasonably have expected to receive upon a sale of the security at 4:00 p.m. Eastern time. Valuing securities at fair value involves greater reliance on judgment than valuation of securities based on readily available market quotations. A Fund using fair value to price securities may value those securities higher or lower than another fund using market quotations or fair value to price the same securities. Further, there can be no assurance that the Fund could obtain the fair value assigned to a security if it were to sell the security at approximately the time at which the Fund determines its net asset value.
The following is a summary of the level inputs used, as of September 30, 2017, involving the Funds’ assets carried at fair value. The inputs used for valuing securities may not be an indication of the risk associated with investing in those securities.
Description | Level 1 | Level 2 | Level 3 | Total | ||||||||||||
Investments in Securities | ||||||||||||||||
International Fund | ||||||||||||||||
Common Stocks | ||||||||||||||||
Consumer Discretionary | $ | — | $ | 93,564,869 | $ | — | $ | 93,564,869 | ||||||||
Consumer Staples | 11,089,994 | 38,067,741 | — | 49,157,735 | ||||||||||||
Energy | 13,697,019 | 55,408,684 | — | 69,105,703 | ||||||||||||
Financials | 12,959,454 | 120,076,984 | — | 133,036,438 | ||||||||||||
Health Care | — | 81,315,932 | — | 81,315,932 | ||||||||||||
Industrials | 10,535,740 | 26,043,436 | — | 36,579,176 | ||||||||||||
Information Technology | — | 17,665,857 | — | 17,665,857 | ||||||||||||
Materials | 7,915,962 | 5,612,155 | — | 13,528,117 | ||||||||||||
Telecommunication Services | — | 38,192,114 | — | 38,192,114 | ||||||||||||
Utilities | — | 17,224,978 | — | 17,224,978 | ||||||||||||
|
|
|
|
|
|
|
| |||||||||
Total Common Stocks | 56,198,169 | 493,172,750 | — | 549,370,919 | ||||||||||||
|
|
|
|
|
|
|
| |||||||||
Preferred Stocks | ||||||||||||||||
Energy | — | 8,008,709 | — | 8,008,709 | ||||||||||||
Telecommunication Services | 8,537,791 | — | — | 8,537,791 | ||||||||||||
|
|
|
|
|
|
|
| |||||||||
Total Preferred Stocks | 8,537,791 | 8,008,709 | — | 16,546,500 | ||||||||||||
|
|
|
|
|
|
|
| |||||||||
Repurchase Agreements | — | 43,058,347 | — | 43,058,347 | ||||||||||||
|
|
|
|
|
|
|
| |||||||||
Total Investments in Securities | $ | 64,735,960 | $ | 544,239,806 | $ | — | $ | 608,975,766 | ||||||||
|
|
|
|
|
|
|
| |||||||||
116
Brandes Investment Trust
NOTES TO FINANCIAL STATEMENTS — (continued)
Description | Level 1 | Level 2 | Level 3 | Total | ||||||||||||
Global Fund | ||||||||||||||||
Common Stocks | ||||||||||||||||
Consumer Discretionary | $ | — | $ | 8,954,673 | $ | — | $ | 8,954,673 | ||||||||
Consumer Staples | 1,187,078 | 4,557,328 | — | 5,744,406 | ||||||||||||
Energy | 2,029,518 | 5,677,476 | — | 7,706,994 | ||||||||||||
Financials | 10,941,908 | 6,359,664 | — | 17,301,572 | ||||||||||||
Health Care | 7,614,491 | 5,487,980 | — | 13,102,471 | ||||||||||||
Industrials | 2,743,107 | 1,950,866 | — | 4,693,973 | ||||||||||||
Information Technology | 1,771,193 | 3,095,202 | — | 4,866,395 | ||||||||||||
Telecommunication Services | — | 1,791,896 | — | 1,791,896 | ||||||||||||
Utilities | — | 1,877,726 | — | 1,877,726 | ||||||||||||
|
|
|
|
|
|
|
| |||||||||
Total Common Stocks | 26,287,295 | 39,752,811 | — | 66,040,106 | ||||||||||||
|
|
|
|
|
|
|
| |||||||||
Repurchase Agreements | — | 2,550,765 | — | 2,550,765 | ||||||||||||
|
|
|
|
|
|
|
| |||||||||
Total Investments in Securities | $ | 26,287,295 | $ | 42,303,576 | $ | — | $ | 68,590,871 | ||||||||
|
|
|
|
|
|
|
| |||||||||
Global Equity Income | ||||||||||||||||
Common Stocks | ||||||||||||||||
Consumer Discretionary | $ | — | $ | 125,664 | $ | — | $ | 125,664 | ||||||||
Consumer Staples | 44,170 | 88,545 | — | 132,715 | ||||||||||||
Energy | 9,048 | 103,106 | — | 112,154 | ||||||||||||
Financials | 88,203 | 82,528 | — | 170,731 | ||||||||||||
Health Care | 85,049 | 80,743 | — | 165,792 | ||||||||||||
Industrials | 19,166 | 35,093 | — | 54,259 | ||||||||||||
Information Technology | 23,688 | 25,690 | — | 49,378 | ||||||||||||
Telecommunication Services | 39,274 | — | — | 39,274 | ||||||||||||
Utilities | 53,934 | 34,778 | — | 88,712 | ||||||||||||
|
|
|
|
|
|
|
| |||||||||
Total Common Stocks | 362,532 | 576,147 | — | 938,679 | ||||||||||||
|
|
|
|
|
|
|
| |||||||||
Preferred Stocks | ||||||||||||||||
Financials | 74,222 | — | — | 74,222 | ||||||||||||
Information Technology | — | 19,897 | — | 19,897 | ||||||||||||
|
|
|
|
|
|
|
| |||||||||
Total Preferred Stocks | 74,222 | 19,897 | — | 94,119 | ||||||||||||
|
|
|
|
|
|
|
| |||||||||
Total Investments in Securities | $ | 436,754 | $ | 596,044 | $ | — | $ | 1,032,798 | ||||||||
|
|
|
|
|
|
|
| |||||||||
117
Brandes Investment Trust
NOTES TO FINANCIAL STATEMENTS — (continued)
Description | Level 1 | Level 2 | Level 3 | Total | ||||||||||||
Global Opportunities Value | ||||||||||||||||
Common Stocks | ||||||||||||||||
Consumer Discretionary | $ | 1,104,098 | $ | 3,665,071 | $ | — | $ | 4,769,169 | ||||||||
Consumer Staples | 1,316,865 | 1,977,233 | — | 3,294,098 | ||||||||||||
Energy | 1,449,083 | 1,010,063 | — | 2,459,146 | ||||||||||||
Financials | 3,458,235 | 2,660,012 | — | 6,118,247 | ||||||||||||
Health Care | 925,744 | 1,446,944 | — | 2,372,688 | ||||||||||||
Industrials | 2,244,066 | 1,308,073 | — | 3,552,139 | ||||||||||||
Information Technology | — | 981,608 | — | 981,608 | ||||||||||||
Materials | 298,796 | 288,166 | — | 586,962 | ||||||||||||
Real Estate | 387,214 | — | — | 387,214 | ||||||||||||
Telecommunication Services | 547,657 | 1,341,483 | — | 1,889,140 | ||||||||||||
Utilities | 397,831 | 875,453 | — | 1,273,284 | ||||||||||||
|
|
|
|
|
|
|
| |||||||||
Total Common Stocks | 12,129,589 | 15,554,106 | — | 27,683,695 | ||||||||||||
|
|
|
|
|
|
|
| |||||||||
Preferred Stocks | ||||||||||||||||
Consumer Discretionary | — | 620,125 | — | 620,125 | ||||||||||||
Consumer Staples | 369,861 | — | — | 369,861 | ||||||||||||
Energy | — | 314,124 | — | 314,124 | ||||||||||||
Financials | 314,381 | — | — | 314,381 | ||||||||||||
|
|
|
|
|
|
|
| |||||||||
Total Preferred Stocks | 684,242 | 934,249 | — | 1,618,491 | ||||||||||||
|
|
|
|
|
|
|
| |||||||||
Repurchase Agreements | — | 2,276,206 | — | 2,276,206 | ||||||||||||
|
|
|
|
|
|
|
| |||||||||
Total Investments in Securities | $ | 12,813,831 | $ | 18,764,561 | $ | — | $ | 31,578,392 | ||||||||
|
|
|
|
|
|
|
| |||||||||
Emerging Markets Fund | ||||||||||||||||
Common Stocks | ||||||||||||||||
Consumer Discretionary | $ | 146,063,273 | $ | 157,781,319 | $ | — | $ | 303,844,592 | ||||||||
Consumer Staples | 31,549,847 | 45,216,923 | — | 76,766,770 | ||||||||||||
Energy | 126,176,310 | 11,290,567 | — | 137,466,877 | ||||||||||||
Financials | 219,271,992 | 240,454,178 | — | 459,726,170 | ||||||||||||
Health Care | — | 8,538,779 | — | 8,538,779 | ||||||||||||
Industrials | 72,996,894 | — | — | 72,996,894 | ||||||||||||
Information Technology | — | 111,510,350 | — | 111,510,350 | ||||||||||||
Materials | 47,997,911 | 16,242,625 | — | 64,240,536 | ||||||||||||
Telecommunication Services | 92,503,445 | 130,772,826 | — | 223,276,271 | ||||||||||||
Utilities | 39,753,115 | 26,190,454 | — | 65,943,569 | ||||||||||||
|
|
|
|
|
|
|
| |||||||||
Total Common Stocks | 776,312,787 | 747,998,021 | — | 1,524,310,808 | ||||||||||||
|
|
|
|
|
|
|
| |||||||||
Preferred Stocks | ||||||||||||||||
Consumer Discretionary | — | 35,095,005 | — | 35,095,005 | ||||||||||||
Consumer Staples | 59,956,348 | — | — | 59,956,348 | ||||||||||||
Energy | 22,772,116 | 15,238,516 | — | 38,010,632 | ||||||||||||
Financials | 29,712,286 | — | — | 29,712,286 | ||||||||||||
Telecommunication Services | 16,127,017 | — | — | 16,127,017 | ||||||||||||
Utilities | 13,400,047 | — | — | 13,400,047 | ||||||||||||
|
|
|
|
|
|
|
| |||||||||
Total Preferred Stocks | 141,967,814 | 50,333,521 | — | 192,301,335 | ||||||||||||
|
|
|
|
|
|
|
| |||||||||
Participatory Note | ||||||||||||||||
Financials | — | 10,073,143 | — | 10,073,143 | ||||||||||||
|
|
|
|
|
|
|
| |||||||||
Total Participatory Note | — | 10,073,143 | — | 10,073,143 | ||||||||||||
|
|
|
|
|
|
|
| |||||||||
Repurchase Agreements | — | 32,427,807 | — | 32,427,807 | ||||||||||||
|
|
|
|
|
|
|
| |||||||||
Total Investments in Securities | $ | 918,280,601 | $ | 840,832,492 | $ | — | $ | 1,759,113,093 | ||||||||
|
|
|
|
|
|
|
| |||||||||
118
Brandes Investment Trust
NOTES TO FINANCIAL STATEMENTS — (continued)
Description | Level 1 | Level 2 | Level 3 | Total | ||||||||||||
International Small Cap Fund | ||||||||||||||||
Common Stocks | ||||||||||||||||
Consumer Discretionary | $ | 128,885,530 | $ | 210,707,823 | $ | — | $ | 339,593,353 | ||||||||
Consumer Staples | 180,578,021 | 178,655,243 | — | 359,233,264 | ||||||||||||
Energy | 16,557,109 | — | — | 16,557,109 | ||||||||||||
Financials | 115,235,537 | 82,852,622 | — | 198,088,159 | ||||||||||||
Health Care | 41,596,224 | 58,848,769 | — | 100,444,993 | ||||||||||||
Industrials | 116,473,691 | 171,699,324 | — | 288,173,015 | ||||||||||||
Information Technology | 18,683,367 | 55,570,240 | — | 74,253,607 | ||||||||||||
Materials | 19,877,323 | — | — | 19,877,323 | ||||||||||||
Real Estate | 47,842,780 | — | — | 47,842,780 | ||||||||||||
Telecommunication Services | — | 55,825,699 | — | 55,825,699 | ||||||||||||
Utilities | 29,585,405 | 29,705,814 | — | 59,291,219 | ||||||||||||
|
|
|
|
|
|
|
| |||||||||
Total Common Stocks | 715,314,987 | 843,865,534 | — | 1,559,180,521 | ||||||||||||
|
|
|
|
|
|
|
| |||||||||
Preferred Stocks | ||||||||||||||||
Health Care | — | 9,124,271 | — | 9,124,271 | ||||||||||||
Utilities | 34,677,342 | — | — | 34,677,342 | ||||||||||||
|
|
|
|
|
|
|
| |||||||||
Total Preferred Stocks | 34,677,342 | 9,124,271 | — | 43,801,613 | ||||||||||||
|
|
|
|
|
|
|
| |||||||||
Corporate Notes | ||||||||||||||||
Consumer Discretionary | — | 1,913,263 | — | 1,913,263 | ||||||||||||
|
|
|
|
|
|
|
| |||||||||
Total Corporate Notes | — | 1,913,263 | — | 1,913,263 | ||||||||||||
|
|
|
|
|
|
|
| |||||||||
Repurchase Agreements | — | 186,638,249 | — | 186,638,249 | ||||||||||||
|
|
|
|
|
|
|
| |||||||||
Total Investments in Securities | $ | 749,992,329 | $ | 1,041,541,317 | $ | — | $ | 1,791,533,646 | ||||||||
|
|
|
|
|
|
|
| |||||||||
Core Plus Fund | ||||||||||||||||
Common Stock | $ | 12,796 | $ | — | $ | — | $ | 12,796 | ||||||||
Asset Backed Securities | — | 1,988,967 | — | 1,988,967 | ||||||||||||
Corporate Bonds | — | 31,108,899 | — | 31,108,899 | ||||||||||||
Government Securities | — | 60,601,879 | — | 60,601,879 | ||||||||||||
Mortgage Backed Securities | — | 4,127,079 | — | 4,127,079 | ||||||||||||
Repurchase Agreements | — | 3,038,874 | — | 3,038,874 | ||||||||||||
|
|
|
|
|
|
|
| |||||||||
Total Investments in Securities | $ | 12,796 | $ | 100,865,698 | $ | — | $ | 100,878,494 | ||||||||
|
|
|
|
|
|
|
| |||||||||
Credit Focus Yield Fund | ||||||||||||||||
Common Stock | $ | 9,558 | $ | — | $ | — | $ | 9,558 | ||||||||
Asset Backed Securities | — | 839,384 | — | 839,384 | ||||||||||||
Corporate Bonds | — | 16,747,286 | — | 16,747,286 | ||||||||||||
Government Securities | — | 13,286,059 | — | 13,286,059 | ||||||||||||
Repurchase Agreements | — | 807,133 | — | 807,133 | ||||||||||||
|
|
|
|
|
|
|
| |||||||||
Total Investments in Securities | $ | 9,558 | $ | 31,679,862 | $ | — | $ | 31,689,420 | ||||||||
|
|
|
|
|
|
|
| |||||||||
119
Brandes Investment Trust
NOTES TO FINANCIAL STATEMENTS — (continued)
Below are the transfers into or out of Levels 1 and 2 for the Funds using market values measured at the end of the reporting period:
International | Global Equity Fund | Global | Global | Emerging | International | |||||||||||||||||||
Transfers into Level 1 | $ | 11,089,995 | $ | 666,922 | $ | 9,910 | $ | 1,284,734 | $ | 146,982,222 | $ | 194,176,813 | ||||||||||||
Transfers out of Level 1 | — | — | — | (214,289 | ) | (5,560,029 | ) | (32,237,907 | ) | |||||||||||||||
|
|
|
|
|
|
|
|
|
|
|
| |||||||||||||
Net Transfers into (out of) Level 1 | $ | 11,089,995 | $ | 666,922 | $ | 9,910 | $ | 1,070,445 | $ | 141,422,193 | $ | 161,938,906 | ||||||||||||
|
|
|
|
|
|
|
|
|
|
|
| |||||||||||||
Transfers into Level 2 | $ | — | $ | — | $ | — | $ | 214,289 | $ | 5,560,029 | $ | 32,237,907 | ||||||||||||
Transfers out of Level 2 | (11,089,995 | ) | (666,922 | ) | (9,910 | ) | (1,284,734 | ) | (146,982,222 | ) | (194,176,813 | ) | ||||||||||||
|
|
|
|
|
|
|
|
|
|
|
| |||||||||||||
Net Transfers into (out of) Level 2 | $ | (11,089,995 | ) | $ | (666,922 | ) | $ | (9,910 | ) | $ | (1,070,445 | ) | $ | (141,422,193 | ) | $ | (161,938,906 | ) | ||||||
|
|
|
|
|
|
|
|
|
|
|
| |||||||||||||
There were no transfers into or out of Levels 1 or 2 during the year ended September 30, 2017 for the Core Plus and Credit Focus Yield Funds.
The transfers from Level 1 to Level 2 are due to the securities being fair valued as a result of market movements following the close of local trading and/or due to the lack of trading volume on September 30, 2017. The transfers from Level 2 to Level 1 are due to the securities no longer being fair valued as a result of trading on a stock exchange on September 30, 2017.
There were no Level 3 securities in the International, Global, Global Income, Global Opportunities, Core Plus and Credit Focus Yield Funds at the beginning or during the periods presented.
Below is a reconciliation that details the activity of securities in Level 3 in the Emerging Markets and International Small Cap Funds during the year ended September 30, 2017:
| Emerging Markets Fund | International Small Cap Fund | |||||||
Beginning Balance – October 1, 2016 | $ | 7,087,594 | $ | 9,238,517 | ||||
Purchases | — | — | ||||||
Sales | — | — | ||||||
Transfers in to level 3 | — | — | ||||||
Transfers out of level 3 | (7,087,594 | ) | (9,238,517 | ) | ||||
Realized gains (losses), net | — | — | ||||||
Change in unrealized gains (losses) | — | — | ||||||
|
|
|
| |||||
Ending Balance – September 30, 2017 | $ | — | $ | — | ||||
|
|
|
| |||||
The transfers out of Level 3 are due to the securities no longer containing unobservable inputs. These securities were trading on a stock exchange as of September 30, 2017.
120
Brandes Investment Trust
NOTES TO FINANCIAL STATEMENTS — (continued)
NOTE 3 – INVESTMENT ADVISORY FEE AND OTHER TRANSACTIONS WITH AFFILIATES
| A. | Advisor Fee. Brandes Investment Partners, L.P. (the “Advisor”) provides the Funds with investment management services under an Investment Advisory Agreement. The Advisor furnishes all investment advice, office space and certain administrative services, and provides certain personnel, needed by the Funds. As compensation for its services, the Advisor is entitled to a monthly fee. The Advisor received a monthly fee at the annual rate of 0.80% of the first $2.5 billion of average daily net assets, 0.75% on average daily net assets from $2.5 billion to $5.0 billion, and 0.70% of the average daily net assets greater than $5.0 billion, of the International Fund. The Advisor received a monthly fee at the annual rate of 0.95% of the first $2.5 billion of average daily net assets, 0.90% on average daily net assets from $2.5 billion to $5.0 billion, and 0.85% of the amount of average daily net assets greater than $5.0 billion, of the Emerging Markets Fund. The Global Fund, Global Income Fund, Global Opportunities Fund, International Small Cap Fund, Core Plus Fund and Credit Focus Yield Fund incurred a monthly fee at the annual rate of 0.80%, 0.80%, 0.95%, 0.95%, 0.35% and 0.50% based upon their average daily net assets, respectively. For the year ended September 30, 2017, the International Fund, the Global Fund, the Global Income Fund, the Global Opportunities Fund, the Emerging Markets Fund, the International Small Cap Fund, the Core Plus Fund and the Credit Focus Yield Fund incurred $4,453,199, $522,622, $7,599, $197,260, $13,646,320, $15,473,292, $347,605, and $156,868 in advisory fees, respectively. |
Certain officers and trustees of the Trust are also officers of the Advisor.
The Funds are responsible for their own operating expenses. The Advisor has contractually agreed to limit each Fund’s annual operating expenses, including repayment of previous waivers, to the following percentages of the Fund’s average daily net assets attributable to the specific classes through January 31, 2018 (the “Expense Cap Agreement”):
Fund | Class A | Class C | Class I | Class R6 | ||||||||||||
International Fund | 1.20 | % | 1.95 | % | 1.00 | % | 0.82 | % | ||||||||
Global Fund | 1.25 | % | 2.00 | % | 1.00 | % | N/A | |||||||||
Global Income Fund | 1.25 | % | 2.00 | % | 1.00 | % | N/A | |||||||||
Global Opportunities Fund | 1.40 | % | 2.15 | % | 1.15 | % | N/A | |||||||||
Emerging Markets Fund | 1.37 | % | 2.12 | % | 1.12 | % | 0.97 | % | ||||||||
International Small Cap Fund | 1.40 | % | 2.15 | % | 1.15 | % | 1.00 | % | ||||||||
Core Plus Fund | 0.70 | % | N/A | 0.50 | % | N/A | ||||||||||
Credit Focus Yield Fund | 0.85 | % | N/A | 0.60 | % | N/A | ||||||||||
The Funds may incur additional expenses not covered under the Expense Cap Agreement. These expenses include acquired fund fees and expenses,
121
Brandes Investment Trust
NOTES TO FINANCIAL STATEMENTS — (continued)
taxes, interest, broker commissions, and proxy expenses or other extraordinary expenses.
Any reimbursements of fee waivers made by the Advisor to a Fund are subject to repayment by the Fund, to the extent that the Fund is able to make the repayment within its Expense Cap Agreement. Under the Expense Cap Agreement that was in place during the period covered by this report, any such repayment must be made before the end of the third full fiscal year after the fiscal year in which the related reimbursement or waiver occurred. For the year ended September 30, 2017, the Advisor waived expenses and/or reimbursed the Funds $30,977, $157,097, $150,841, $190,542, $256,566, $24,530, $145,725, and $149,185 for the International Fund, Global Fund, Global Income Fund, Global Opportunities Fund, Emerging Markets Fund, International Small Cap Fund, Core Plus Fund and Credit Focus Yield Fund, respectively. Repayment rights expire as follows:
Fund | Potential Recovery Expiring September 30, 2018 | Potential Recovery Expiring September 30, 2019 | Potential Recovery Expiring September 30, 2020 | |||||||||
International Fund | $ | — | $ | 7,467 | $ | 30,970 | ||||||
Global Fund | 244,147 | 186,416 | 157,094 | |||||||||
Global Income Fund | 174,992 | 160,670 | 150,841 | |||||||||
Global Opportunities Fund | 215,095 | 212,240 | 190,542 | |||||||||
Emerging Markets Fund | 643,870 | 530,741 | 347,490 | |||||||||
International Small Cap Fund | — | 1,527 | 24,530 | |||||||||
Core Plus Fund | 223,222 | 180,468 | 145,644 | |||||||||
Credit Focus Yield Fund | 170,112 | 138,659 | 149,185 | |||||||||
The Advisor did not recoup any fees previously waived or reimbursed for the International Fund, Global Fund, Global Income Fund, Global Opportunities Fund, International Small Cap Fund, Core Plus Fund and Credit Focus Yield Fund. For the year ended September 30, 2017, the Advisor recouped fees previously waived or reimbursed in the amounts of:
Fund | Class A | Class C | ||||||
Emerging Markets Fund | $ | 85,121 | $ | 5,803 | ||||
| B. | Administration Fee. U.S. Bancorp Fund Services, LLC (the “Administrator”) acts as administrator for the Funds. The Administrator prepares various federal and state regulatory filings; prepares reports and materials to be supplied to the Trustees; monitors the activities of the Funds’ custodian, transfer agent and accountant; coordinates the preparation and payment of Fund expenses; and reviews the Funds’ expense accruals. For these services, the Funds pay the administrator monthly, a fee accrued daily and based on average daily net assets. The Funds may also reimburse the Administrator for such out-of-pocket expenses as incurred by |
122
Brandes Investment Trust
NOTES TO FINANCIAL STATEMENTS — (continued)
| the Administrator in the performance of its duties. The amounts paid directly to the Administrator by the Funds for administrative services are included in the Administration fees in the Statement of Operations. |
| C. | Distribution and Servicing Fees. ALPS Distributors, LLC (the “Distributor”), a registered broker-dealer, acts as the Funds’ principal underwriter in a continuous public offering of the Funds’ shares. A portion of the Funds’ distribution fees is paid by the Advisor. |
The Trust has adopted a Distribution Plan (the “Plan”) pursuant to Rule 12b-1 under the Investment Company Act of 1940 for the Funds’ Class A and C shares. The Plan is designed to reimburse the Distributor or dealers for certain promotional and other sales related costs associated with sales of such Fund shares. Unreimbursed amounts may be carried forward and paid in a subsequent year, to the extent that total expenses under the Plan do not exceed 0.25% and 0.75% of the average daily net assets of each Fund’s Class A and C shares, respectively. During the year ended September 30, 2017, the Funds paid to the Distributor and each dealer a monthly fee at the annual rate of 0.25% of the average daily net assets of Class A shares and 0.75% of the average daily net assets of Class C shares beneficially owned by the Distributor’s and each dealer’s existing brokerage clients. The 12b-1 Agreement may be continued in effect from year to year if such continuance is approved annually by the Board of Trustees of the Trust, including the vote of a majority of the Independent Trustees. For the year ended September 30, 2017, the following Funds incurred expenses pursuant to the Plan:
Fund | Class A | Class C | ||||||
International Fund | $ | 55,482 | $ | 109,505 | ||||
Global Fund | 17,818 | 14,467 | ||||||
Global Income Fund | 7 | 77 | ||||||
Global Opportunities Fund | 5,981 | 904 | ||||||
Emerging Markets Fund | 818,744 | 180,196 | ||||||
International Small Cap Fund | 402,823 | 177,317 | ||||||
Core Plus Fund | 6,720 | N/A | ||||||
Credit Focus Yield Fund | 5,873 | N/A | ||||||
The Funds have adopted a Shareholder Service Plan for class C, and have authorized sub-transfer agency fee payments for Class I, to pay to securities broker-dealers, retirement plan sponsors and administrators, banks and their affiliates, and other institutions and service professionals as shareholder servicing agent of the Funds, an annual fee for non-distribution sub-transfer agent and/or subaccounting services up to 0.25% and 0.05% of annual net assets attributable to Class C and Class I, respectively (the “Service Fees”). From October 1, 2016 until November 30, 2016, the Funds had a Shareholder Service Plan for Class E in which an annual fee of 0.25%
123
Brandes Investment Trust
NOTES TO FINANCIAL STATEMENTS — (continued)
of annual net assets were charged. For the year ended September 30, 2017, the Funds incurred the following Service Fees:
Fund | Class C | Class E* | Class I | |||||||||
International Fund | $ | 36,273 | $ | 225 | $ | 219,090 | ||||||
Global Fund | 4,822 | — | 28,131 | |||||||||
Global Income Fund | 26 | N/A | 468 | |||||||||
Global Opportunities Fund | 301 | N/A | 9,126 | |||||||||
Emerging Markets Fund | 58,516 | N/A | 512,845 | |||||||||
International Small Cap Fund | 58,742 | N/A | 687,042 | |||||||||
Core Plus Fund | N/A | 124 | 48,289 | |||||||||
Credit Focus Yield Fund | N/A | N/A | — | |||||||||
| * | Class E shares were eliminated effective November 30, 2016 and are no longer offered for sale. |
NOTE 4 – PURCHASES AND SALES OF SECURITIES
The cost of purchases and the proceeds from sales of securities, excluding short term investments, were as follows for the year ended September 30, 2017:
| U.S. Government | Other | |||||||||||||||
Fund | Purchases | Sales | Purchases | Sales | ||||||||||||
International Fund | $ | — | $ | — | $ | 170,113,981 | $ | 310,586,432 | * | |||||||
Global Fund | $ | — | $ | — | $ | 16,388,311 | $ | 10,535,970 | ||||||||
Global Income Fund | $ | — | $ | — | $ | 176,066 | $ | 120,192 | ||||||||
Global Opportunities Fund | $ | — | $ | — | $ | 23,651,638 | $ | 2,130,181 | ||||||||
Emerging Markets Fund | $ | — | $ | — | $ | 655,249,898 | * | $ | 323,774,313 | |||||||
International Small Cap Fund | $ | — | $ | — | $ | 578,929,671 | $ | 300,149,590 | ||||||||
Core Plus Fund | $ | 24,628,397 | $ | 20,787,159 | $ | 13,525,416 | $ | 12,738,111 | ||||||||
Credit Focus Yield Fund | $ | 4,291,779 | $ | 2,164,600 | $ | 6,124,467 | $ | 6,750,724 | ||||||||
| * | Includes Transfers in-kind of $27,215,850 into the Emerging Markets Fund and $231,178,479 out of the International Fund. See Note 10 for more information. |
124
Brandes Investment Trust
NOTES TO FINANCIAL STATEMENTS — (continued)
NOTE 5 – CAPITAL STOCK TRANSACTIONS
Capital stock activity for each class of shares was as follows (shares and dollar amounts in thousands):
| International Fund | Global Fund | |||||||||||||||||||||||||||||||
| Year Ended 9/30/2017 | Year Ended 9/30/2016 | Year Ended 9/30/2017 | Year Ended 9/30/2016 | |||||||||||||||||||||||||||||
| Shares | Amount | Shares | Amount | Shares | Amount | Shares | Amount | |||||||||||||||||||||||||
Shares Sold | ||||||||||||||||||||||||||||||||
Class A | 1,203 | $ | 19,919 | 353 | $ | 5,375 | 173 | $ | 3,765 | 172 | $ | 3,418 | ||||||||||||||||||||
Class C | 370 | 6,087 | 372 | 5,640 | 18 | 419 | 33 | 680 | ||||||||||||||||||||||||
Class E | — | * | — | * | — | * | 1 | — | — | — | — | |||||||||||||||||||||
Class I | 11,479 | 189,635 | 16,033 | 242,045 | 414 | 9,377 | 397 | 8,194 | ||||||||||||||||||||||||
Class R6 | 1,079 | 17,826 | 1,734 | 25,782 | N/A | N/A | N/A | N/A | ||||||||||||||||||||||||
Issued on Reinvestment of Distributions | ||||||||||||||||||||||||||||||||
Class A | 37 | 613 | 21 | 314 | 6 | 129 | 9 | 192 | ||||||||||||||||||||||||
Class C | 25 | 394 | 14 | 214 | 1 | 20 | 8 | 169 | ||||||||||||||||||||||||
Class E | — | — | 1 | 13 | — | — | 1 | 12 | ||||||||||||||||||||||||
Class I | 853 | 14,044 | 976 | 14,725 | 49 | 1,146 | 167 | 3,579 | ||||||||||||||||||||||||
Class R6 | 61 | 1,013 | 30 | 459 | N/A | N/A | N/A | N/A | ||||||||||||||||||||||||
Shares Redeemed | ||||||||||||||||||||||||||||||||
Class A | (351 | ) | (5,784 | ) | (339 | ) | (5,128 | ) | (158 | ) | (3,702 | ) | (45 | ) | (923 | ) | ||||||||||||||||
Class C | (200 | ) | (3,206 | ) | (360 | ) | (5,418 | ) | (43 | ) | (998 | ) | (59 | ) | (1,204 | ) | ||||||||||||||||
Class E | (35 | ) | (546 | ) | (78 | ) | (1,170 | ) | (3 | ) | (58 | ) | (9 | ) | (180 | ) | ||||||||||||||||
Class I | (23,699 | ) | (371,858 | ) | (13,467 | ) | (200,479 | ) | (170 | ) | (3,903 | ) | (445 | ) | (9,244 | ) | ||||||||||||||||
Class R6 | (705 | ) | (11,108 | ) | (8 | ) | (124 | ) | N/A | N/A | N/A | N/A | ||||||||||||||||||||
|
|
|
|
|
|
|
|
|
|
|
|
|
|
|
| |||||||||||||||||
Net Increase/(Decrease) Resulting from Fund Share Transactions | (9,883 | ) | $ | (142,971 | ) | 5,282 | $ | 82,249 | 287 | $ | 6,195 | 229 | $ | 4,693 | ||||||||||||||||||
|
|
|
|
|
|
|
|
|
|
|
|
|
|
|
| |||||||||||||||||
| * | Value calculated is less than 500 shares. |
| Global Income Fund | Global Opportunities Fund | |||||||||||||||||||||||||||||||
| Year Ended 9/30/2017 | Year Ended 9/30/2016 | Year Ended 9/30/2017 | Year Ended 9/30/2016 | |||||||||||||||||||||||||||||
| Shares | Amount | Shares | Amount | Shares | Amount | Shares | Amount | |||||||||||||||||||||||||
Shares Sold | ||||||||||||||||||||||||||||||||
Class A | — | $ | — | — | * | $ | 5 | 221 | $ | 2,324 | 63 | $ | 631 | |||||||||||||||||||
Class C | — | — | 1 | 10 | 27 | 293 | 1 | 5 | ||||||||||||||||||||||||
Class I | 4 | 52 | 13 | 135 | 1,988 | 21,710 | 616 | 5,953 | ||||||||||||||||||||||||
Issued on Reinvestment of Distributions | ||||||||||||||||||||||||||||||||
Class A | — | * | — | * | — | * | — | * | 3 | 35 | 2 | 15 | ||||||||||||||||||||
Class C | — | * | — | * | — | * | — | * | — | * | 1 | — | * | — | * | |||||||||||||||||
Class I | 4 | 42 | 3 | 32 | 27 | 301 | 14 | 135 | ||||||||||||||||||||||||
Shares Redeemed | ||||||||||||||||||||||||||||||||
Class A | — | * | (5 | ) | — | — | (43 | ) | (491 | ) | (40 | ) | (373 | ) | ||||||||||||||||||
Class C | (1 | ) | (12 | ) | — | — | (12 | ) | (126 | ) | — | — | ||||||||||||||||||||
Class I | — | * | (1 | ) | — | — | (64 | ) | (730 | ) | (453 | ) | (4,198 | ) | ||||||||||||||||||
|
|
|
|
|
|
|
|
|
|
|
|
|
|
|
| |||||||||||||||||
Net Increase Resulting from Fund Share Transactions | 7 | $ | 76 | 17 | $ | 182 | 2,147 | $ | 23,317 | 203 | $ | 2,168 | ||||||||||||||||||||
|
|
|
|
|
|
|
|
|
|
|
|
|
|
|
| |||||||||||||||||
| * | Value calculated is less than 500 shares/dollars. |
125
Brandes Investment Trust
NOTES TO FINANCIAL STATEMENTS — (continued)
| Emerging Markets Fund | International Small Cap Fund | |||||||||||||||||||||||||||||||
| Year Ended 9/30/2017 | Year Ended 9/30/2016 | Year Ended 9/30/2017 | Year Ended 9/30/2016 | |||||||||||||||||||||||||||||
| Shares | Amount | Shares | Amount | Shares | Amount | Shares | Amount | |||||||||||||||||||||||||
Shares Sold | ||||||||||||||||||||||||||||||||
Class A | 8,874 | $ | 74,295 | 8,735 | $ | 61,198 | 7,258 | $ | 99,175 | 6,424 | $ | 82,919 | ||||||||||||||||||||
Class C | 820 | 7,002 | 789 | 5,491 | 760 | 10,303 | 538 | 6,869 | ||||||||||||||||||||||||
Class I | 61,145 | 526,426 | 58,323 | 398,668 | 38,991 | 539,640 | 40,210 | 514,468 | ||||||||||||||||||||||||
Class R6 | 10,962 | 92,156 | — | * | — | * | 4,032 | 55,496 | 1,219 | 16,277 | ||||||||||||||||||||||
Issued on Reinvestment of Distributions | ||||||||||||||||||||||||||||||||
Class A | 521 | 4,400 | 380 | 2,816 | 478 | 6,339 | 207 | 2,664 | ||||||||||||||||||||||||
Class C | 18 | 136 | 12 | 90 | 64 | 825 | 39 | 497 | ||||||||||||||||||||||||
Class I | 2,062 | 17,780 | 1,338 | 9,942 | 4,516 | 60,137 | 2,558 | 33,082 | ||||||||||||||||||||||||
Class R6 | 129 | 1,149 | — | * | — | * | 161 | 2,155 | 1 | 24 | ||||||||||||||||||||||
Shares Redeemed | ||||||||||||||||||||||||||||||||
Class A | (14,227 | ) | (124,299 | ) | (18,300 | ) | (125,947 | ) | (4,363 | ) | (60,409 | ) | (3,920 | ) | (48,345 | ) | ||||||||||||||||
Class C | (700 | ) | (5,797 | ) | (941 | ) | (6,387 | ) | (375 | ) | (5,059 | ) | (308 | ) | (3,930 | ) | ||||||||||||||||
Class I | (29,682 | ) | (252,615 | ) | (72,001 | ) | (487,286 | ) | (25,736 | ) | (356,359 | ) | (22,518 | ) | (291,569 | ) | ||||||||||||||||
Class R6 | (872 | ) | (7,713 | ) | — | — | (116 | ) | (1,615 | ) | — | — | ||||||||||||||||||||
|
|
|
|
|
|
|
|
|
|
|
|
|
|
|
| |||||||||||||||||
Net Increase/(Decrease) Resulting from Fund Share Transactions | 39,050 | $ | 332,920 | (21,665 | ) | $ | (141,415 | ) | 25,670 | $ | 350,628 | 24,450 | $ | 312,956 | ||||||||||||||||||
|
|
|
|
|
|
|
|
|
|
|
|
|
|
|
| |||||||||||||||||
| * | Value calculated is less than 500 shares/dollars. |
| Core Plus Fund | Credit Focus Yield Fund | |||||||||||||||||||||||||||||||
| Year Ended 9/30/2017 | Year Ended 9/30/2016 | Year Ended 9/30/2017 | Year Ended 9/30/2016 | |||||||||||||||||||||||||||||
| Shares | Amount | Shares | Amount | Shares | Amount | Shares | Amount | |||||||||||||||||||||||||
Shares Sold | ||||||||||||||||||||||||||||||||
Class A | 786 | $ | 7,238 | 133 | $ | 1,202 | 3 | $ | 32 | 34 | $ | 347 | ||||||||||||||||||||
Class E | — | — | — | * | 3 | N/A | N/A | N/A | N/A | |||||||||||||||||||||||
Class I | 2,949 | 27,174 | 4,004 | 36,987 | 7 | 69 | 17 | 173 | ||||||||||||||||||||||||
Issued on Reinvestment of Distributions | ||||||||||||||||||||||||||||||||
Class A | 7 | 66 | 6 | 57 | 6 | 62 | 6 | 58 | ||||||||||||||||||||||||
Class E | — | * | 1 | 2 | 17 | N/A | N/A | N/A | N/A | |||||||||||||||||||||||
Class I | 281 | 2,599 | 228 | 2,102 | 86 | 879 | 84 | 837 | ||||||||||||||||||||||||
Shares Redeemed | ||||||||||||||||||||||||||||||||
Class A | (648 | ) | (5,938 | ) | (153 | ) | (1,402 | ) | (10 | ) | (105 | ) | (17 | ) | (170 | ) | ||||||||||||||||
Class E | (34 | ) | (316 | ) | (173 | ) | (1,564 | ) | N/A | N/A | N/A | N/A | ||||||||||||||||||||
Class I | (2,941 | ) | (27,150 | ) | (1,782 | ) | (16,227 | ) | (16 | ) | (164 | ) | (26 | ) | (250 | ) | ||||||||||||||||
|
|
|
|
|
|
|
|
|
|
|
|
|
|
|
| |||||||||||||||||
Net Increase Resulting from Fund Share Transactions | 400 | $ | 3,674 | 2,265 | $ | 21,175 | 76 | $ | 773 | 98 | $ | 995 | ||||||||||||||||||||
|
|
|
|
|
|
|
|
|
|
|
|
|
|
|
| |||||||||||||||||
| * | Value calculated is less than 500 shares/dollars. |
126
Brandes Investment Trust
NOTES TO FINANCIAL STATEMENTS — (continued)
NOTE 6 – FEDERAL INCOME TAX MATTERS
GAAP requires that certain components of net assets be reclassified between financial and tax reporting. Temporary differences do not require reclassification. Temporary and permanent differences have no effect on net assets or net asset value per share. For the year ended September 30, 2017, the Funds made the following permanent book-to-tax reclassifications primarily related to the treatment of foreign currency transactions, passive foreign investment companies, paydowns and difference between book and tax accretion methods for market premium:
| Undistributed Net Investment Income/(Loss) | Accumulated Net Realized Gain/(Loss) | Paid-In Capital | ||||||||||
International Fund | $ | 387,160 | $ | (8,783,479 | ) | $ | 8,396,319 | |||||
Global Fund | 147,897 | (147,897 | ) | — | ||||||||
Global Income Fund | 16 | (16 | ) | — | ||||||||
Global Opportunities Fund | (15,312 | ) | 15,312 | — | ||||||||
Emerging Markets Fund | (1,089,492 | ) | 1,089,493 | (1 | ) | |||||||
International Small Cap Fund | 16,577,605 | (16,577,605 | ) | — | ||||||||
Core Plus Fund | 26,285 | (26,285 | ) | — | ||||||||
Credit Focus Yield Fund | 700 | (700 | ) | — | ||||||||
As of September 30, 2017, the components of distributable earnings on a tax basis were as follows:
| International Fund | Global Fund | Global Income Fund | Global Opportunities Fund | |||||||||||||
Cost of investments for tax purposes | $ | 646,687,789 | $ | 60,591,358 | $ | 905,751 | $ | 29,429,636 | ||||||||
|
|
|
|
|
|
|
| |||||||||
Gross tax unrealized appreciation | 46,414,480 | 12,118,510 | 157,599 | 3,121,153 | ||||||||||||
Gross tax unrealized depreciation | (84,127,257 | ) | (4,118,997 | ) | (30,552 | ) | (972,397 | ) | ||||||||
|
|
|
|
|
|
|
| |||||||||
Net unrealized appreciation (depreciation) on investments and foreign currency | (37,712,023 | ) | 7,999,513 | 127,047 | 2,148,756 | |||||||||||
Distributable ordinary income | — | — | 5,991 | 238,608 | ||||||||||||
Distributable long-term capital gains | — | 1,417,146 | 17,014 | 77,867 | ||||||||||||
|
|
|
|
|
|
|
| |||||||||
Total distributable earnings | — | 1,417,146 | 23,005 | 316,475 | ||||||||||||
|
|
|
|
|
|
|
| |||||||||
Other accumulated gains/(losses) | (56,712,130 | ) | (15,121 | ) | 31 | 42 | ||||||||||
|
|
|
|
|
|
|
| |||||||||
Total accumulated earnings | $ | (94,424,153 | ) | $ | 9,401,538 | $ | 150,083 | $ | 2,465,273 | |||||||
|
|
|
|
|
|
|
| |||||||||
127
Brandes Investment Trust
NOTES TO FINANCIAL STATEMENTS — (continued)
| Emerging Markets Fund | International Small Cap Fund | Core Plus Fund | Credit Focus Yield Fund | |||||||||||||
Cost of investments for tax purposes | $ | 1,639,295,746 | $ | 1,748,225,824 | $ | 99,849,690 | $ | 31,101,098 | ||||||||
|
|
|
|
|
|
|
| |||||||||
Gross tax unrealized appreciation | 252,618,309 | 150,064,333 | 2,327,779 | 1,083,478 | ||||||||||||
Gross tax unrealized depreciation | (132,800,962 | ) | (108,669,774 | ) | (1,298,975 | ) | (495,156 | ) | ||||||||
|
|
|
|
|
|
|
| |||||||||
Net unrealized appreciation (depreciation) on investments and foreign currency | 119,817,347 | 41,394,559 | 1,028,804 | 588,322 | ||||||||||||
Distributable ordinary income | 3,058,564 | 59,169,707 | 3,163 | 72,086 | ||||||||||||
Distributable long-term capital gains | — | 36,065,154 | — | 7,406 | ||||||||||||
|
|
|
|
|
|
|
| |||||||||
Total distributable earnings | 3,058,564 | 95,234,861 | 3,163 | 79,492 | ||||||||||||
|
|
|
|
|
|
|
| |||||||||
Other accumulated gains/(losses) | (145,524,310 | ) | (195,662 | ) | (77,473 | ) | (6,587 | ) | ||||||||
|
|
|
|
|
|
|
| |||||||||
Total accumulated earnings | $ | (22,648,399 | ) | $ | 136,433,758 | $ | 954,494 | $ | 661,227 | |||||||
|
|
|
|
|
|
|
| |||||||||
The differences between book and tax basis distributable earnings are primarily related to foreign currency adjustments and the differences in classification of paydown gains and losses for tax purposes compared to book purposes. These differences are temporary.
The tax composition of dividends for the periods ended September 30, 2017 and September 30, 2016 for the Funds, were as follows:
| Ordinary Income | Long Term Capital Gains | |||||||||||||||
Fund | 2017 | 2016 | 2017 | 2016 | ||||||||||||
International Fund | $ | 17,288,853 | $ | 16,352,215 | $ | — | $ | — | ||||||||
Global Fund | 1,158,288 | 1,719,172 | 144,842 | 276,184 | ||||||||||||
Global Income Fund | 27,560 | 33,075 | 16,627 | — | ||||||||||||
Global Opportunities Fund | 347,227 | 210,265 | — | — | ||||||||||||
Emerging Markets Fund | 26,232,726 | 14,620,792 | — | — | ||||||||||||
International Small Cap Fund | 55,283,372 | 29,288,452 | 16,143,560 | 7,825,526 | ||||||||||||
Core Plus Fund | 2,708,539 | 2,147,788 | — | 67,658 | ||||||||||||
Credit Focus Yield Fund | 979,673 | 925,696 | — | — | ||||||||||||
At September 30, 2017 the Funds had capital losses expiring and capital loss carryforwards utilized as indicated below:
Fund | 2018 | Indefinite | Utilized | |||||||||
International Fund | $ | 29,067,216 | $ | 25,582,177 | $ | 8,890,861 | ||||||
Global Fund | — | — | — | |||||||||
Global Income Fund | — | — | — | |||||||||
Global Opportunities Fund | — | — | — | |||||||||
Emerging Markets Fund | — | 145,372,966 | 15,860,334 | |||||||||
International Small Cap Fund | — | — | — | |||||||||
Core Plus Fund | — | 77,473 | — | |||||||||
Credit Focus Yield Fund | — | — | — | |||||||||
At September 30, 2017, the International Fund had ordinary loss deferal of $2,348,860.
128
Brandes Investment Trust
NOTES TO FINANCIAL STATEMENTS — (continued)
NOTE 7 – OFFERING PRICE PER SHARE
The public offering price for Class A shares is the net asset value per share plus a sales charge, which varies in accordance with the amount of the purchase up to a maximum of 5.75% for the International, Global, Global Income, Global Opportunities, Emerging Markets and International Small Cap Funds, and 3.75% for the Core Plus and Credit Focus Yield Funds. A contingent deferred sales charge (“CDSC”) of 1.00% will be deducted with respect to Class A shares purchased without a sales load and redeemed within 12 months of purchase, unless waived, as discussed in the Prospectus. Any applicable CDSC will be 1.00% of the lesser of the original purchase price or the redemption value of the Class A shares redeemed. Class C shares include a 1.00% CDSC paid by redeeming shareholders within 12 months of purchase. As a result the redemption price may differ from the net asset value per share. The public offering prices for I shares are the respective net asset values. Sales charges are not an expense of the Funds and are not reflected in the financial statements of the Funds.
NOTE 8 – TRANSACTIONS WITH AFFILIATES
The following issuers were affiliated with the Emerging Markets Fund and International Small Cap Fund as defined in Section (2)(a)(3) of the 1940 Act, as these held 5% or more of the outstanding voting securities of the issuers during the year from October 1, 2016 through September 30, 2017:
Emerging Markets Fund
| Issuer Name | Share Balance At October 1, 2016 | Additions | Reductions | Share Balance At September 30, 2017 | Dividend Income | Change in Unrealized Appreciation/ Depreciation | Realized Gain/ Loss | Value At September 30, 2017 | ||||||||||||||||||||||||
Urbi Desarrollos Urbanos SA de CV | 13,688 | 10,228,761 | — | 10,242,449 | $ | — | $ | (2,854,717 | ) | $ | — | $ | 4,190,349 | |||||||||||||||||||
|
|
|
|
|
|
|
| |||||||||||||||||||||||||
| $ | — | $ | (2,854,717 | ) | $ | — | $ | 4,190,349 | ||||||||||||||||||||||||
|
|
|
|
|
|
|
| |||||||||||||||||||||||||
International Small Cap Fund
| Issuer Name | Share October 1, | Additions | Reductions | Share Balance At September 30, 2017 | Dividend Income | Change in Unrealized Appreciation/ Depreciation | Realized Gain/ Loss | Value At September 30, | ||||||||||||||||||||||||
C&C Group Plc | 8,843,235 | 7,871,177 | — | 16,714,412 | $ | 2,123,534 | $ | (7,088,513 | ) | $ | — | $ | 60,251,692 | |||||||||||||||||||
Countrywide Plc | 9,110,030 | 9,634,486 | (3,487,392 | ) | 15,257,124 | — | (14,268,306 | ) | (4,044,833 | ) | 22,080,070 | |||||||||||||||||||||
Desarrolladora Homex SAB de CV | 2,517,107 | 46,339,567 | — | 48,856,674 | — | (2,716,525 | ) | — | 2,602,470 | |||||||||||||||||||||||
Dorel Industries, Inc. | 1,122,044 | 475,140 | — | 1,597,184 | 1,609,154 | (3,511,267 | ) | — | 38,222,332 | |||||||||||||||||||||||
129
Brandes Investment Trust
NOTES TO FINANCIAL STATEMENTS — (continued)
| Issuer Name | Share October 1, | Additions | Reductions | Share Balance At September 30, 2017 | Dividend Income | Change in Unrealized Appreciation/ Depreciation | Realized Gain/Loss | Value At September 30, | ||||||||||||||||||||||||
Funai Electric Co. Ltd. | 1,632,700 | 308,100 | — | 1,940,800 | $ | 147,117 | $ | (579,277 | ) | $ | — | $ | 15,174,817 | |||||||||||||||||||
LSL Property Services Plc | 4,151,341 | 2,814,430 | — | 6,965,771 | 716,922 | 2,301,740 | — | 21,958,509 | ||||||||||||||||||||||||
Mills Estruturas e Servicos de Engenharia SA | — | 9,498,900 | — | 9,498,900 | — | 3,542,490 | — | 13,916,264 | ||||||||||||||||||||||||
Samchully Co. Ltd. | 208,685 | — | — | 208,685 | 405,769 | (676,619 | ) | — | 18,402,397 | |||||||||||||||||||||||
Syneron Medical Ltd.(1) | 1,748,885 | — | (1,748,885 | ) | — | — | — | 5,609,496 | — | |||||||||||||||||||||||
Urbi Desarrollos Urbanos SA de CV | 6,089 | 12,861,444 | — | 12,867,533 | — | (5,983,504 | ) | — | 5,264,312 | |||||||||||||||||||||||
|
|
|
|
|
|
|
| |||||||||||||||||||||||||
| $ | 5,002,496 | $ | (28,979,781 | ) | $ | 1,564,663 | $ | 197,872,863 | ||||||||||||||||||||||||
|
|
|
|
|
|
|
| |||||||||||||||||||||||||
| (1) | Issuer was not an affiliate as of September 30, 2017. |
NOTE 9 – OWNERSHIP BY AFFILIATED PARTIES
As of September 30, 2017, the Advisor, Trustees or affiliates of the Advisor beneficially owned more than 5% of shares of the Funds as follows:
| Global Fund | Global Income Fund | Global Opportunities Fund | ||||||||||||||||||
Class I | Class A | Class C | Class I | Class I | ||||||||||||||||
Shares | 1,089,227 | 10 | 11 | 67,456 | 1,165,387 | |||||||||||||||
% of Total Outstanding Shares | 43.41 | % | 100.00 | % | 100.00 | % | 76.84 | % | 47.52 | % | ||||||||||
| International Small Cap Fund | Core Plus Fund | Credit Focus Yield Fund | ||||||||||||||||||
Class I | Class I | Class I | ||||||||||||||||||
Shares | 7,079,217 | 1,405,147 | 2,744,241 | |||||||||||||||||
% of Total Outstanding Shares | 6.58 | % | 13.28 | % | 95.30 | % | ||||||||||||||
NOTE 10 – TRANSFERS IN-KIND
Effective November 30, 2016, a shareholder of the International Fund redeemed assets through an in-kind redemption. In this transaction, the Fund transferred securities with a value of $231,178,479 to the redeeming shareholder which is shown on the Statement of Changes in Net Assets. The Fund recognized a net realized gain in the amount of $9,829,109, which is reflected on the Statement of Operations.
130
Brandes Investment Trust
NOTES TO FINANCIAL STATEMENTS — (continued)
On February 28, 2017, a shareholder transferred assets through an in-kind purchase into the Emerging Markets Fund. In this transaction, the Fund received securities with the value of $27,215,850 from the shareholder.
NOTE 11 – SUBSEQUENT EVENTS
In preparing these financial statements, the Trust has evaluated events and transactions for potential recognition or disclosure through the date the financial statements were available to be issued. On October 10, 2017, the R6 class of the Core Plus Fund commenced operations. Also, the Board of Trustees, based on the recommendation of the Advisor, approved a plan of liquidation of the Credit Focus Fund providing for liquidation of the Fund on or around December 29, 2017.
131
Brandes Investment Trust
REPORT OF INDEPENDENT REGISTERED PUBLIC ACCOUNTING FIRM
To the Board of Trustees and Shareholders of Brandes Investment Trust
In our opinion, the accompanying statements of assets and liabilities, including the schedules of investments, and the related statements of operations and of changes in net assets and the financial highlights present fairly, in all material respects, the financial position of Brandes International Equity Fund, Brandes Global Equity Fund, Brandes Global Equity Income Fund, Brandes Global Opportunities Value Fund, Brandes Emerging Markets Value Fund, Brandes International Small Cap Equity Fund, Brandes Core Plus Fixed Income Fund and Brandes Credit Focus Yield Fund (eight of the series constituting the Brandes Investment Trust, hereafter referred to as the “Trust”) as of September 30, 2017, the results of each of their operations for the year then ended, the changes in each of their net assets for each of the two years in the period then ended and the financial highlights for each of the periods presented, in conformity with accounting principles generally accepted in the United States of America. These financial statements and financial highlights (hereafter referred to as “financial statements”) are the responsibility of the Trust’s management. Our responsibility is to express an opinion on these financial statements based on our audits. We conducted our audits of these financial statements in accordance with the standards of the Public Company Accounting Oversight Board (United States). Those standards require that we plan and perform the audit to obtain reasonable assurance about whether the financial statements are free of material misstatement. An audit includes examining, on a test basis, evidence supporting the amounts and disclosures in the financial statements, assessing the accounting principles used and significant estimates made by management, and evaluating the overall financial statement presentation. We believe that our audits, which included confirmation of securities as of September 30, 2017 by correspondence with the custodian and brokers, provide a reasonable basis for our opinion.
/s/ PricewaterhouseCoopers LLP
Los Angeles, California
November 20, 2017
132
Brandes Investment Trust
ADDITIONAL INFORMATION — (Unaudited)
PROXY VOTING PROCEDURES
The Advisor votes proxies relating to the Funds’ portfolio securities in accordance with procedures adopted by the Advisor. You may obtain a description of these procedures, free of charge, by calling toll-free 1-800-331-2979. This information is also available through the Securities and Exchange Commission’s website at http://www.sec.gov.
Information regarding how the Trust voted proxies relating to portfolio securities during the most recent 12-month period ended June 30 is available without charge, upon request, by calling 1-800-331-2979. This information is also available through the Securities and Exchange Commission’s website at http://www.sec.gov.
FORM N-Q DISCLOSURE
The Trust files the Fund’s complete schedule of portfolio holdings with the Securities and Exchange Commission for the first and third quarters of each fiscal year on Form N-Q. The Trust’s Form N-Q filings are available on the Securities and Exchange Commission’s website at http://www.sec.gov. The Trust’s Form N-Q filings may be reviewed and copied at the Commission’s Public Reference Room in Washington, D.C., and information on the operation of the Public Reference Room may be obtained by calling 1-800-SEC-0330. Information regarding the Trust’s Form N-Q filings is also available, without charge, by calling toll-free, 1-800-331-2979.
TAX NOTICE
For the fiscal year ended September 30, 2017, the percentage of taxable ordinary income distributions that are designated as interest related dividends under the Internal Revenue Code Section 87(k)(1)(c) for each Fund were as follows:
| PERCENTAGE | ||||
International Fund | 0.00 | % | ||
Global Fund | 0.00 | % | ||
Global Income Fund | 0.00 | % | ||
Global Opportunities Fund | 0.00 | % | ||
Emerging Markets Fund | 0.05 | % | ||
International Small Cap Fund | 0.00 | % | ||
Core Plus Fund | 100.00 | % | ||
Credit Focus Fund | 100.00 | % | ||
The percentage of ordinary distributions designated as short-term gain distributions under the Internal Revenue Code Section 871(k)(2)(c) for the fiscal year ended September 30, 2017, were as follows:
| PERCENTAGE | ||||
International Fund | 0.00 | % | ||
Global Fund | 0.00 | % | ||
Global Income Fund | 16.21 | % | ||
Global Opportunities Fund | 0.00 | % | ||
133
Brandes Investment Trust
ADDITIONAL INFORMATION — (Unaudited) (continued)
| PERCENTAGE | ||||
Emerging Markets Fund | 0.00 | % | ||
International Small Cap Fund | 24.23 | % | ||
Core Plus Fund | 9.56 | % | ||
Credit Focus Fund | 7.16 | % | ||
The distributions designated as long-term capital gain distributions for the fiscal year ended September 30, 2017, were as follows:
| DISTRIBUTION | ||||
International Fund | $ | — | ||
Global Fund | $ | 144,842 | ||
Global Income Fund | $ | 16,627 | ||
Global Opportunities Fund | $ | — | ||
Emerging Markets Fund | $ | — | ||
International Small Cap Fund | $ | 16,143,560 | ||
Core Plus Fund | $ | — | ||
Credit Focus Fund | $ | — | ||
The percentage of dividend income distributed for the fiscal year ended 30, 2017, which is designated as qualified dividend income under the Jobs and Growth Tax relief Reconciliation Act of 2003 is as follows:
| PERCENTAGE | ||||
International Fund | 100.00 | % | ||
Global Fund | 100.00 | % | ||
Global Income Fund | 98.63 | % | ||
Global Opportunities Fund | 86.42 | % | ||
Emerging Markets Fund | 98.57 | % | ||
International Small Cap Fund | 37.30 | % | ||
Core Plus Fund | 1.37 | % | ||
Credit Focus Fund | 2.04 | % | ||
The percentage of dividends paid during the fiscal year ended September 30, 2017, that qualify for the corporate dividends received deduction are as follows:
| PERCENTAGE | ||||
International Fund | 0.00 | % | ||
Global Fund | 42.88 | % | ||
Global Income Fund | 33.22 | % | ||
Global Opportunities Fund | 6.54 | % | ||
Emerging Markets Fund | 0.44 | % | ||
International Small Cap Fund | 0.00 | % | ||
Core Plus Fund | 1.37 | % | ||
Credit Focus Fund | 2.04 | % | ||
For the Year Ended September 30, 2017, the International Fund, Global Fund, Global Income Fund, Global Opportunities Fund, Emerging Markets Fund and International Small Cap Fund earned foreign source income and paid foreign taxes, as noted below, which it intends to pass through to its shareholders pursuant to Section 853 of the Internal Revenue Code, with the exception to the foreign taxes paid in the United Kingdom. The United Kingdom foreign taxes paid by the fund do not qualify to be passed through to the Fund’s shareholders.
134
Brandes Investment Trust
ADDITIONAL INFORMATION — (Unaudited) (continued)
| Gross Foreign Income | ||||||||||||||||||||||||
| International Fund | Global Fund | Global Income Fund | Global Opportunities Fund | Emerging Markets Fund | International Small Cap Fund | |||||||||||||||||||
Argentina | $ | — | $ | — | $ | — | $ | — | $ | 69,375 | $ | — | ||||||||||||
Belgium | — | — | — | — | — | 557,223 | ||||||||||||||||||
Bermuda | — | — | — | 6,849 | 155,766 | 237,048 | ||||||||||||||||||
Brazil | 536,291 | 24,199 | 3,213 | 56,886 | 5,919,708 | 2,667,628 | ||||||||||||||||||
Canada | — | — | — | — | — | 2,657,634 | ||||||||||||||||||
Cayman Islands | — | — | — | — | 2,817,999 | — | ||||||||||||||||||
Chile | — | — | 723 | — | 1,222,072 | — | ||||||||||||||||||
Colombia | — | — | — | — | 1,123,300 | — | ||||||||||||||||||
Czech Republic | — | — | — | — | 684,125 | — | ||||||||||||||||||
Finland | 241,711 | 26,083 | 356 | — | — | — | ||||||||||||||||||
France | 3,248,340 | 253,687 | 4,994 | 42,291 | — | 335,687 | ||||||||||||||||||
Germany | — | — | — | — | — | 111,726 | ||||||||||||||||||
Greece | — | — | — | 5,690 | 420,424 | 632,738 | ||||||||||||||||||
Hong Kong | 816,813 | 76,810 | — | 41,316 | 6,418,687 | 503,223 | ||||||||||||||||||
Hungary | — | — | — | 10,294 | — | 1,341,368 | ||||||||||||||||||
India | — | — | — | 6,873 | 1,513,103 | 1,169,211 | ||||||||||||||||||
Ireland | 77,432 | — | — | 3,042 | — | 2,123,534 | ||||||||||||||||||
Italy | 1,666,095 | 97,005 | 1,468 | 41,821 | — | — | ||||||||||||||||||
Japan | 2,610,588 | 120,868 | 970 | 66,954 | — | 17,032,128 | ||||||||||||||||||
Luxembourg | — | — | — | — | 600,885 | — | ||||||||||||||||||
Malaysia | — | 25,610 | — | — | 158,550 | — | ||||||||||||||||||
Mexico | 175,214 | 13,921 | 580 | 20,346 | 995,869 | 1,142,115 | ||||||||||||||||||
Netherlands | 518,947 | — | — | — | — | — | ||||||||||||||||||
Pakistan | — | — | — | — | 489,177 | — | ||||||||||||||||||
Panama | — | — | — | — | 1,027,724 | — | ||||||||||||||||||
Philippines | — | — | — | — | — | 254,616 | ||||||||||||||||||
Republic of Korea | 635,055 | 90,927 | 457 | 25,204 | 4,652,042 | 710,653 | ||||||||||||||||||
Russia | 1,256,735 | 109,976 | — | 74,411 | 9,705,185 | 1,349,453 | ||||||||||||||||||
South Africa | 105,439 | — | — | — | 1,141,701 | — | ||||||||||||||||||
Spain | 436,508 | 45,527 | — | — | — | 865,499 | ||||||||||||||||||
Sweden | 128,574 | 16,785 | 282 | 6,474 | — | — | ||||||||||||||||||
Switzerland | 1,094,035 | 145,662 | 1,810 | 30,924 | — | — | ||||||||||||||||||
Taiwan | — | — | — | — | (267,053 | ) | — | |||||||||||||||||
Thailand | — | — | — | — | 2,275,980 | — | ||||||||||||||||||
Turkey | — | — | — | 4,797 | 1,105,750 | — | ||||||||||||||||||
United Kingdom | 4,371,353 | 412,075 | 9,598 | 126,444 | 968,122 | 7,434,894 | ||||||||||||||||||
|
|
|
|
|
|
|
|
|
|
|
| |||||||||||||
| $ | 17,919,132 | $ | 1,459,134 | $ | 24,452 | $ | 570,616 | $ | 43,198,491 | $ | 41,126,379 | |||||||||||||
|
|
|
|
|
|
|
|
|
|
|
| |||||||||||||
135
Brandes Investment Trust
ADDITIONAL INFORMATION — (Unaudited) (continued)
| Foreign Tax Paid | ||||||||||||||||||||||||
| International Fund | Global Fund | Global Income Fund | Global Opportunities Fund | Emerging Markets Fund | International Small Cap Fund | |||||||||||||||||||
Belgium | $ | — | $ | — | $ | — | $ | — | $ | — | $ | 83,583 | ||||||||||||
Bermuda | — | — | — | — | — | — | ||||||||||||||||||
Brazil | 46,653 | 1,869 | 253 | 4,818 | 358,550 | 233,537 | ||||||||||||||||||
Canada | — | — | — | — | — | 398,645 | ||||||||||||||||||
Chile | — | — | 227 | — | 365,209 | — | ||||||||||||||||||
Colombia | — | — | — | — | 23,863 | — | ||||||||||||||||||
Czech Republic | — | — | — | — | 102,619 | — | ||||||||||||||||||
Finland | 36,257 | 3,912 | 53 | — | — | — | ||||||||||||||||||
France | 487,251 | 38,053 | 749 | 6,344 | — | 50,353 | ||||||||||||||||||
Germany | — | — | — | — | — | 16,759 | ||||||||||||||||||
Greece | — | — | — | — | 63,064 | 28,703 | ||||||||||||||||||
Hong Kong | 68,410 | 7,681 | — | 3,366 | 481,212 | — | ||||||||||||||||||
Italy | 249,914 | 14,551 | 220 | 6,273 | — | — | ||||||||||||||||||
Japan | 261,059 | 12,087 | 97 | 6,695 | — | 1,703,213 | ||||||||||||||||||
Mexico | 52,564 | — | 174 | 4,504 | 298,761 | 249,299 | ||||||||||||||||||
Netherlands | 77,842 | — | — | — | — | — | ||||||||||||||||||
Pakistan | — | — | — | — | 61,147 | — | ||||||||||||||||||
Philippines | — | — | — | — | — | 63,654 | ||||||||||||||||||
Republic of Korea | 106,912 | 15,003 | 75 | 4,159 | 773,155 | 117,258 | ||||||||||||||||||
Russia | 175,117 | 12,621 | — | 9,224 | 1,259,776 | 202,418 | ||||||||||||||||||
South Africa | 15,816 | 0 | — | — | 171,255 | — | ||||||||||||||||||
Spain | 65,476 | 6,829 | — | — | — | 120,011 | ||||||||||||||||||
Sweden | 19,286 | 2,518 | 42 | 971 | — | — | ||||||||||||||||||
Switzerland | 43,578 | 5,062 | 117 | — | — | — | ||||||||||||||||||
Thailand | — | — | — | — | 111,734 | — | ||||||||||||||||||
Turkey | — | — | — | 720 | 165,862 | — | ||||||||||||||||||
|
|
|
|
|
|
|
|
|
|
|
| |||||||||||||
| $ | 1,706,135 | $ | 120,186 | $ | 2,009 | $ | 47,074 | $ | 4,236,207 | $ | 3,267,433 | |||||||||||||
|
|
|
|
|
|
|
|
|
|
|
| |||||||||||||
136
Brandes Investment Trust
TRUSTEES AND OFFICERS INFORMATION — (Unaudited)
The Board of Trustees is responsible for the overall management of the Trust’s business. The Board approves all significant agreements between the Trust and persons or companies furnishing services to the Trust, including the Trust’s agreements with the Advisor, Administrator, Custodian, Distributor and Transfer Agent. The Board of Trustees delegates the day-to-day operations of the Trust to its officers and service providers, subject to the Fund investment objectives and policies and to general supervision by the Board. The Trust’s Statement of Additional Information includes additional information about the Trustees and is available, without charge, by calling 1-800-331-2979 or visiting www.brandes.com.
The Trustees and officers of the Trust, their business addresses and principal occupations during the past five years are:
Name, Address | Position(s) | Term of | Principal | Number | Other Trusteeships | |||||
Independent Trustees(2) | ||||||||||
Jean E. Carter 11988 El Camino Real, Suite 600 San Diego, CA 92130 (Born: 1957) | Trustee and Chairman | Since April 2008 | Retired. | 9 | Bridge Builder Trust | |||||
Robert M. Fitzgerald, CPA (inactive) 11988 El Camino Real, Suite 600 San Diego, CA 92130 (Born: 1952) | Trustee | Since April 2008 | Retired. | 9 | Hotchkis and Wiley Mutual Funds | |||||
Craig Wainscott, CFA 11988 El Camino Real, Suite 600 San Diego, CA 92130 (Born: 1961) | Trustee | Since February 2012 | Partner with The Paradigm Project and advisor to early-stage companies. | 9 | None | |||||
Gregory Bishop, CFA 11988 El Camino Real, Suite 600 San Diego, CA 92130 (Born: 1961) | Trustee | Since January 2017 | Retired. Previously Executive Vice President and Head of Retail Business, PIMCO Investments, from 1997 to 2014 | 9 | None | |||||
137
Brandes Investment Trust
TRUSTEES AND OFFICERS INFORMATION — (Unaudited) (continued)
Name, Address | Position(s) | Term of | Principal | Number | Other Trusteeships | |||||
“Interested” Trustees(3) | ||||||||||
Oliver Murray 11988 El Camino Real, Suite 600 San Diego, CA 92130 (Born: 1962) | Trustee | Since February 2012 | Chief Executive Officer, Brandes Investment Partners & Co.; Managing Director – PMCS of Brandes Investment Partners, L.P., the investment advisor to the Funds (the “Advisor”). | 9 | None | |||||
Jeff Busby, CFA 11988 El Camino Real, Suite 600 San Diego, CA 92130 (Born: 1961) | Trustee and President | Since July 2006 | Executive Director of the Advisor. | 9 | None | |||||
Officers of the Trust | ||||||||||
Thomas M. Quinlan 11988 El Camino Real, Suite 600 San Diego, CA 92130 (Born: 1970) | Secretary | Since June 2003 | Associate General Counsel of the Advisor. | N/A | N/A | |||||
Gary Iwamura, CPA 11988 El Camino Real, Suite 600 San Diego, CA 92130 (Born: 1956) | Treasurer | Since September 1997 | Finance Director of the Advisor. | N/A | N/A | |||||
Roberta Loubier 11988 El Camino Real, Suite 600 San Diego, CA 92130 (Born: 1971) | Chief Compliance Officer | Since September 2015 | Global Head of Compliance, Brandes Investment Partners, L.P. | N/A | N/A | |||||
| (1) | Trustees and officers of the Fund serve until their resignation, removal or retirement. |
| (2) | Not “interested persons” of the Trust as defined in the 1940 Act. |
| (3) | “Interested persons” of the Trust as defined in the 1940 Act by virtue of their positions with the Advisor. |
138
ADVISOR Brandes Investment Partners, L.P. 11988 El Camino Real, Suite 600 San Diego, CA 92130 800.331.2979 DISTRIBUTOR ALPS Distributors, Inc. 1290 Broadway, #1100 Denver, CO 80203 TRANSFER AGENT U.S. Bancorp Fund Services, LLC 615 E. Michigan Street, 3rd Floor Milwaukee, WI 53202 INDEPENDENT REGISTERED PUBLIC ACCOUNTING FIRM PricewaterhouseCoopers LLP 601 South Figueroa Street Los Angeles, CA 90017 LEGAL COUNSEL Morgan, Lewis & Bockius LLP 300 S. Grand Avenue, 22nd Floor Los Angeles, CA 90071 This report is intended for shareholders of the Brandes International Equity Fund, the Brandes Global Equity Fund, the Brandes Global Equity Income Fund, the Brandes Global Opportunities Value Fund, the Brandes Emerging Markets Value Fund, the Brandes International Small Cap Equity Fund, the Brandes Core Plus Fixed Income Fund and the Brandes Credit Focus Yield Fund and may not be used as sales literature unless preceded or accompanied by a current prospectus. Statements and other information herein are dated and are subject to change.

ANNUAL REPORT SEPARATELY MANAGED ACCOUNT RESERVETR UST For the year ended September 30, 2017

| 2 | ||||
| 9 | ||||
| 11 | ||||
| 15 | ||||
| 16 | ||||
| 17 | ||||
| 18 | ||||
| 19 | ||||
| 28 | ||||
| 29 | ||||
| 30 |
1
Brandes Separately Managed Account Reserve Trust
Dear Fellow Investor,
The Brandes Separately Managed Account Reserve Trust (SMART) advanced 3.57% in the 12 months ended September 30, 2017.
Notable positive contributors were corporate holdings in banking, energy, utilities and commodity resources. The Fund also benefited from holdings in private student loan asset backed securities.
Within the banking industry, the Fund received strong contributions from junior subordinated securities of U.S. Bank, JPMorgan and Wells Fargo. The U.S. Bank holding is a floating rate note while the JPMorgan and Wells Fargo holdings are currently fixed-rate securities, but will convert to floating rate notes if they are not called prior to one year. Bank credit profiles continue to improve, especially with short rates trending higher. These securities also benefit from the possibility that they can convert to floating rate instruments.
Among energy holdings, Fund performance was led by natural gas producers Chesapeake Energy and Range Resources, as well as pipeline operator Kinder Morgan.
Additionally, metals & mining companies Cloud Peak Energy and Royal Gold helped performance. Cloud Peak benefited from improving industry fundamentals, while Royal Gold rose amid a sharp rise in the price of gold through mid-September.
Cloud Peak is a coal miner operating in the Powder River Basin (Western United States). The company operates some of the country’s lowest-cost mines. During the fourth quarter of 2016 the company took steps to ease refinancing concerns by issuing a tender offer for its nearest term maturity (December 2019) and issuing second-lien notes maturing in 2021. The result of the tender was that Cloud Peak was able to reduce its debt maturing in 2019 from $200 million to $56 million. The company also benefited, post-U.S. presidential election, from the perception that the incoming administration would take a more favorable regulatory approach toward the coal industry.
Our telecommunication services holdings, principally Frontier Communications, modestly detracted from performance.
The Fund initiated a position in Tenet Healthcare (6.00% coupon rate, maturing October 2020 and rated Ba3/BB-). Tenet is a hospital operator that carries a good deal of leverage. We view the credit positively, however, based on our assessment of asset coverage and the severable nature of Tenet’s hospitals, acute care and consulting business assets. We have owned another Tenet bond (8% coupon rate, maturing 8/1/20) for some time. From a cost of capital and liquidity management perspective, we believed the Tenet bond would likely be called this August. In fact, during the second quarter of 2017, Tenet announced its intention to call two-thirds of the issue. We decided to maintain and slightly increase our weighting in Tenet, but chose to balance the risk of the maturity extension by purchasing first-lien notes that we believe offer better protection than unsecured Tenet debt.
2
Brandes Separately Managed Account Reserve Trust
Additionally, we added a new position in Tembec (9% coupon rate, maturing December 2019 and rated B2/B-), a Canadian paper & forest products company. Tembec recently completed multi-year efficiency projects and upgraded its facilities. The company is now focused on reducing leverage. Tembec’s capital expenditures in the last several years have resulted in greater profitability, lower maintenance outlays and higher free cash flow. During the second quarter of 2017, Tembec announced it was being acquired by another company. Based on the transaction multiple, the implied asset coverage is greater than 1.5 times, giving us some comfort should the deal fall through. When the transaction closes, we expect this issue to be called as the acquirer is a larger, more diversified and higher-rated entity, which will likely look to retire this relatively high-cost debt.
We also took advantage of the weakness in the energy sector in the second quarter of 2017 to increase our weighting in Range Resources.
Other activity included the sale of our position in Royal Gold (2.625% coupon maturing June 2019), one of the world’s largest precious metals royalty trusts. We purchased a convertible bond at a time of depressed precious metals prices in mid-2015, which consequently drove down the underlying stock price. The market viewed prospects for an upside from equity conversion as remote and Royal Gold was considered a “broken” convertible. The bond was trading almost exclusively on its bond merits with very little value given to the implied equity-conversion option.
We evaluated this specific Royal Gold issue as a straight bond, assigning no value to the embedded equity option. We believed the security was trading at an attractive yield relative to its credit fundamentals. Royal Gold effectively operated its business like a bank but with much lower leverage, and balanced with effectively exclusive exposure to a single industry. More recently, with a meaningful rally in precious metals since our purchase, our bond holding is no longer a broken convertible as the market has now assigned a significant value to the embedded option. In fact, when we sold the position, the dollar price was high enough that the straight bond was exhibiting a negative yield. While the credit risk remains quite low, the risk to the bond price has risen, given that the bond price is now driven primarily by the underlying stock price. Consequently, we decided to exit our position.
Waiting for Volatility = Waiting for Godot?
A common theme for much of the fiscal year was an unprecedented lack of volatility in the equity market and the taxable fixed-income markets. Caught in a period of historically low volatility, 10-year U.S. Treasury yields have been stuck in a range of 59 basis points in 2017. To put this in perspective, this has been the tightest trading range since 1965.1
| 1 | Bloomberg: Worst Bond-Market Rut in 52 Years Shows Few Signs of Break Out, 9/27/17. |
3
Brandes Separately Managed Account Reserve Trust
The last time volatility for the 10-year Treasury yield was this low was right before the global financial crisis. What’s that old adage about the calm before the storm?
While we are not in the business of predictions and are most certainly not forecasting another global financial meltdown, the level of interest rates and the aggregate level of yield spreads in the market today give us pause — as they have for some time now. It is that last part that makes us feel a bit like the characters in the classic play Waiting for Godot.
Outlook
For much of the Fund’s fiscal year, risk markets have largely shrugged off two Fed interest-rate hikes, two historic hurricanes, an uptick in political volatility, and rising geopolitical tensions with North Korea to continue their strong performance.
As highlighted earlier, the fixed-income market remains in a low-volatility environment, which we believe has caused a great deal of complacency among investors. In our opinion, it is when markets seem complacent and fundamental valuations appear distorted due to external influences that the most prudent approach to portfolio management is to exercise caution.
Now that we are into the football season, we’d like to put a new twist on an old adage: The best offense is often a strong defense seems the most sensible positioning from our standpoint.
We did not make any material changes during the fiscal year as we believe the Fund remains defensively positioned. We favor short-maturity corporate bonds and those exhibiting strong, tangible asset coverage based on our analysis. We are underweight agency mortgage-backed securities and are managing duration toward the shorter end of our duration-controlled range. We have a higher than usual allocation to U.S. Treasuries that we will look to redeploy thoughtfully and efficiently — if and when market uncertainty and volatility cause credit fundamentals to become mispriced from our estimates of intrinsic value.
As always, thank you for your business and continued trust.
Sincerely yours,
The Brandes Fixed-Income Investment Committee
Brandes Investment Trust
Because the values of the Fund’s investments will fluctuate with market conditions, so will the value of your investment in the Fund. You could lose money on your investment in the Fund, or the Fund could underperform other investments. The values of the Fund’s investments fluctuate in response to the activities of individual companies and general stock market and economic conditions. In addition, the performance of foreign securities depends on the political and economic environments and other overall economic conditions in the countries where the Fund invests. Emerging country markets involve greater risk and volatility than more developed
4
Brandes Separately Managed Account Reserve Trust
markets. Some emerging markets countries may have fixed or managed currencies that are not free-floating against the U.S. dollar. Certain of these currencies have experienced, and may experience in the future, substantial fluctuations or a steady devaluation relative to the U.S. dollar. It is not possible to invest directly in an index.
As with most fixed income funds, the income on and value of your shares in the Fund will fluctuate along with interest rates. When interest rates rise, the market prices of the debt securities the Fund owns usually decline. When interest rates fall, the prices of these securities usually increase. Generally, the longer the Fund’s average portfolio maturity and the lower the average quality of its portfolio, the greater the price fluctuation. The price of any security owned by the Fund may also fall in response to events affecting the issuer of the security, such as its ability to continue to make principal and interest payments or its credit rating. Below investment grade debt securities are speculative and involve a greater risk of default and price change due to changes in the issuer’s creditworthiness. The market prices of these debt securities may fluctuate more than the market prices of investment grade debt securities and may decline significantly in periods of general economic difficulty.
Asset Coverage: Assets available to cover debt obligations after all other liabilities have been satisfied.
Basis Point: 1/100 of 1%.
Duration: The weighted maturity of a fixed-income investment’s cash flows, used in the estimation of the price sensitivity of fixed-income securities for a given change in interest rates.
Floating Rate Note: A debt instrument that does not have a fixed rate of interest over the life of the instrument.
Intrinsic Value: The actual value of a company or an asset based on an underlying perception of its true value.
Yield Spread: The difference in yield between two comparable securities.
Yield: Annual income from the investment (dividend, interest, etc.) divided by the current market price of the investment.
There is no assurance that a forecast will be accurate. Because of the many variables involved, an investor should not rely on forecasts without realizing their limitations.
Bond ratings are grades given to bonds that indicate their credit quality as determined by a private independent rating service such as Standard & Poor’s or Moody’s. The service evaluates a bond issuer’s financial strength, or its ability to pay a bond’s principal and interest in a timely fashion. Ratings are expressed as
5
Brandes Separately Managed Account Reserve Trust
letters ranging from ‘AAA’, which is the highest grade, to ‘D’, which is the lowest grade. In limited situations when the rating agency has not issued a formal rating, the Advisor will classify the security as nonrated.
Please refer to the Schedule of Investments in the report for complete holdings information. Fund holdings, geographic allocations and/or sector allocations are subject to change at any time and are not a recommendation to buy or sell any security.
The foregoing reflects the thoughts and opinions of Brandes Investment Partners® exclusively and is subject to change without notice.
Brandes Investment Partners® is a registered trademark of Brandes Investment Partners, L.P. in the United States and Canada.
Must be preceded or accompanied by a prospectus.
The Brandes Separately Managed Account Reserve Trust is distributed by ALPS Distributors, Inc.
6
Brandes Separately Managed Account Reserve Trust
The following chart compares the value of a hypothetical $10,000 investment in the Separately Managed Account Reserve Trust from September 30, 2007 to September 30, 2017 with the value of such an investment in the Bloomberg Barclays U.S. Aggregate Bond Index and Bloomberg Barclays U.S. Intermediate Credit Bond Index for the same period.
Value of $10,000 Investment vs Bloomberg Barclays U.S. Aggregate Bond Index & Bloomberg Barclays U.S. Intermediate Credit Bond Index (Unaudited)

| Average Annual Total Return Periods Ended September 30, 2017 | ||||||||||||||||
| One Year | Five Years | Ten Years | Since Inception (10/3/05) | |||||||||||||
Separately Managed Account | ||||||||||||||||
Reserve Trust | 3.57 | % | 5.02 | % | 5.87 | % | 5.75 | % | ||||||||
Bloomberg Barclays U.S. Aggregate Bond Index | 0.07 | % | 2.06 | % | 4.27 | % | 4.32 | % | ||||||||
Bloomberg Barclays U.S. Intermediate Credit Bond Index | 1.58 | % | 2.60 | % | 4.76 | % | 4.67 | % | ||||||||
Performance data quoted represents past performance; past performance does not guarantee future results. The investment return and principal value of an investment will fluctuate so that an investor’s shares, when redeemed, may be worth more or less than their original cost. Current performance of the Fund may be lower or higher than the performance quoted. Performance data current to the most recent month end may be obtained by calling 800-331-2979.
7
Brandes Separately Managed Account Reserve Trust
The returns shown do not reflect the deduction of taxes that a shareholder would pay on fund distributions or the redemption of fund shares. The Advisor has a fee waiver arrangement in place to limit the Fund’s annual operating expenses.
Asset Allocation as a Percentage of Total Investments as of
September 30, 2017 (Unaudited)
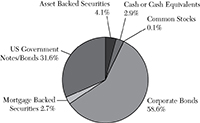
8
Brandes Separately Managed Account Reserve Trust
As a shareholder of the Fund, you incur ongoing costs, including investment advisory and administrative fees and other Fund expenses. The example below is intended to help you understand your ongoing costs (in dollars) of investing in the Fund and to compare these costs with the ongoing costs of investing in other mutual funds.
The example is based on an investment of $1,000 invested at the beginning of the period and held for the entire period from April 1, 2017 to September 30, 2017 (the “Period”).
Actual Expenses
This section provides information about actual account values and actual expenses. The “Ending Account Value” shown is derived from the Fund’s actual returns. You may use the information in this section, together with the amount you invested, to estimate the expenses that you paid over the period. Simply divide your account value by $1,000 (for example, an $8,600 account value divided by $1,000 = 8.6), then multiply the result by the number given for the Fund under the heading “Expenses Paid During Period” to estimate the expenses you paid on your account during this period.
Fund | Beginning Account Value | Ending Account Value | Annual Expense Ratio | Expenses Paid During the Period* | ||||||||||||
Separately Managed Account Reserve Trust** | $ | 1,000.00 | $ | 1,029.10 | 0.00% | $ | 0.00 | |||||||||
Hypothetical Example for Comparison Purposes
This section provides information about hypothetical account values and hypothetical expenses based on the Fund’s actual expense ratio and an assumed rate of return of 5% per year before expenses, which is not the Fund’s actual return. The hypothetical account values and expenses may not be used to estimate the actual ending account balance or expenses you paid for the period. You may use this information to compare the ongoing costs of investing in the Fund and other mutual funds. To do so, compare this 5% hypothetical example with the 5% hypothetical examples that appear in the shareholder reports of the other mutual funds.
Please note that the expenses shown in the table are meant to highlight your ongoing costs only and do not reflect any transaction costs, such as sales charges (loads), redemption fees, or exchange fees. Therefore, the last column of the table is useful in comparing ongoing costs only, and will not help you determine the relative total costs of owning different funds. In addition, if these transactional costs were included, your costs would have been higher.
9
Brandes Separately Managed Account Reserve Trust
Fund | Beginning Account Value | Ending Account Value | Annual Expense Ratio | Expenses Paid During the Period* | ||||||||||||
Separately Managed Account Reserve Trust** | $ | 1,000.00 | $ | 1,025.07 | 0.00% | $ | 0.00 | |||||||||
| * | The Fund’s expenses are equal to the Fund’s expense ratio for the period, multiplied by the average account value over the period, multiplied by 183/365 (to reflect the one half-year period). |
| ** | No expenses have been charged to the Brandes Separately Managed Account Reserve Trust (“SMART Fund”) over the period, as the SMART Fund participates in a wrap-fee program sponsored by investment advisors unaffiliated with the SMART Fund. See Note 3 to the Financial Statements. |
10
Brandes Separately Managed Account Reserve Trust
SCHEDULE OF INVESTMENTS — September 30, 2017
| Shares | Value | |||||||
| COMMON STOCKS – 0.04% | ||||||||
| Household Durables – 0.04% | ||||||||
Urbi Desarrollos Urbanos SA de CV(a) | 176,124 | $ | 72,055 | |||||
|
| |||||||
TOTAL COMMON STOCKS | $ | 72,055 | ||||||
|
| |||||||
| Principal Amount | Value | |||||||
| FEDERAL AND FEDERALLY SPONSORED CREDITS – 2.71% | ||||||||
| Federal Home Loan Mortgage Corporation – 1.56% | ||||||||
Pool G1-8578, 3.000%, 12/1/2030 | $ | 2,673,503 | $ | 2,749,686 | ||||
|
| |||||||
| Federal National Mortgage Association – 1.15% | ||||||||
Pool AS6201, 3.500%, 11/1/2045 | 1,975,338 | 2,037,858 | ||||||
|
| |||||||
TOTAL FEDERAL AND FEDERALLY SPONSORED CREDITS | $ | 4,787,544 | ||||||
|
| |||||||
| OTHER MORTGAGE RELATED SECURITIES – 0.00% | ||||||||
| Collateralized Mortgage Obligations – 0.00% | ||||||||
Wells Fargo Mortgage Backed Securities Trust | $ | 6,288 | $ | 5,963 | ||||
|
| |||||||
TOTAL OTHER MORTGAGE RELATED SECURITIES | $ | 5,963 | ||||||
|
| |||||||
| US GOVERNMENTS – 31.75% | ||||||||
| Sovereign – 31.75% | ||||||||
United States Treasury Bond | $ | 12,285,000 | $ | 16,314,096 | ||||
United States Treasury Note | ||||||||
2.000%, 2/15/2023 | 2,000,000 | 2,001,094 | ||||||
2.375%, 8/15/2024 | 26,250,000 | 26,620,166 | ||||||
2.250%, 2/15/2027 | 11,225,000 | 11,157,036 | ||||||
|
| |||||||
TOTAL US GOVERNMENTS | $ | 56,092,392 | ||||||
|
| |||||||
| ASSET BACKED SECURITIES – 4.17% | ||||||||
| Student Loan – 4.17% | ||||||||
SLM Private Credit Student Loan Trust | ||||||||
Series 2004-B, 1.750% (3M LIBOR + 0.430%), 9/15/2033(d) | $ | 1,500,000 | $ | 1,408,392 | ||||
SLM Private Credit Student Loan Trust | ||||||||
Series 2005-A, 1.630% (3M LIBOR + 0.310%), 12/15/2038(d) | 1,865,000 | 1,744,328 | ||||||
SLM Private Credit Student Loan Trust | ||||||||
Series 2006-A, 1.610% (3M LIBOR + 0.290%), 6/15/2039(d) | 4,420,000 | 4,218,990 | ||||||
|
| |||||||
TOTAL ASSET BACKED SECURITIES | $ | 7,371,710 | ||||||
|
| |||||||
The accompanying notes are an integral part of this Schedule of Investments.
11
Brandes Separately Managed Account Reserve Trust
SCHEDULE OF INVESTMENTS — September 30, 2017 (continued)
| Principal Amount | Value | |||||||
| CORPORATE BONDS – 58.92% | ||||||||
| Banks & Thrifts – 12.68% | ||||||||
Bank of America Corp. | $ | 5,270,000 | $ | 5,554,321 | ||||
Goldman Sachs Group, Inc. | 3,700,000 | 3,973,833 | ||||||
JPMorgan Chase & Co. | 6,305,000 | 6,494,150 | ||||||
USB Capital IX | 3,250,000 | 2,894,288 | ||||||
Wells Fargo & Co. | 3,380,000 | 3,481,400 | ||||||
|
| |||||||
| 22,397,992 | ||||||||
|
| |||||||
| Commercial Services & Supplies – 3.32% | ||||||||
ADT Corp. | 5,865,000 | 5,865,000 | ||||||
|
| |||||||
| Electric Utilities – 4.94% | ||||||||
FirstEnergy Corp. | 3,950,000 | 5,254,796 | ||||||
Israel Electric Corp. Ltd. | 3,275,000 | 3,468,061 | ||||||
|
| |||||||
| 8,722,857 | ||||||||
|
| |||||||
| Food, Beverage & Tobacco – 2.54% | ||||||||
Pilgrim’s Pride Corp. | 105,000 | 107,231 | ||||||
Tesco Plc | 4,365,000 | 4,380,622 | ||||||
|
| |||||||
| 4,487,853 | ||||||||
|
| |||||||
| Forest Products & Paper – 1.23% | ||||||||
Tembec Industries, Inc. | 2,110,000 | 2,170,663 | ||||||
|
| |||||||
| Health Care Providers & Services – 3.19% | ||||||||
Tenet Healthcare Corp. | 5,290,000 | 5,637,606 | ||||||
|
| |||||||
| Homebuilders – 2.00% | ||||||||
PulteGroup, Inc. | 1,615,000 | 1,760,996 | ||||||
Toll Brothers Finance Corp. | 1,710,000 | 1,780,965 | ||||||
|
| |||||||
| 3,541,961 | ||||||||
|
| |||||||
The accompanying notes are an integral part of this Schedule of Investments.
12
Brandes Separately Managed Account Reserve Trust
SCHEDULE OF INVESTMENTS — September 30, 2017 (continued)
| Principal Amount | Value | |||||||
| Insurance – 3.94% | ||||||||
American International Group, Inc. | $ | 2,785,000 | $ | 3,131,195 | ||||
CNA Financial Corp. | 1,250,000 | 1,365,281 | ||||||
Voya Financial, Inc. | 2,220,000 | 2,473,052 | ||||||
|
| |||||||
| 6,969,528 | ||||||||
|
| |||||||
| Metals & Mining – 2.91% | ||||||||
Cloud Peak Energy Resources, LLC / Cloud Peak Energy Finance Corp. | ||||||||
12.000%, 11/1/2021 | 3,570,000 | 3,748,500 | ||||||
6.375%, 3/15/2024 | 1,665,000 | 1,394,437 | ||||||
|
| |||||||
| 5,142,937 | ||||||||
|
| |||||||
| Oil, Gas & Consumable Fuels – 13.98% | ||||||||
BP Capital Markets Plc | ||||||||
2.241%, 9/26/2018 | 3,235,000 | 3,254,576 | ||||||
3.506%, 3/17/2025 | 3,375,000 | 3,483,452 | ||||||
Chesapeake Energy Corp. | 7,860,000 | 7,918,950 | ||||||
Kinder Morgan, Inc. | 1,921,000 | 2,012,291 | ||||||
Occidental Petroleum Corp. | 1,705,000 | 1,744,989 | ||||||
Range Resources Corp. | 4,840,000 | 4,803,700 | ||||||
Valero Energy Corp. | 1,340,000 | 1,475,320 | ||||||
|
| |||||||
| 24,693,278 | ||||||||
|
| |||||||
| Telecommunications – 8.19% | ||||||||
AT&T, Inc. | 5,235,000 | 5,285,969 | ||||||
Frontier Communications Corp. | 2,950,000 | 2,425,490 | ||||||
Sprint Communications, Inc. | 4,060,000 | 4,361,130 | ||||||
Telecom Italia Capital SA | 840,000 | 866,040 | ||||||
Telefonica Emisiones SAU | 1,390,000 | 1,523,549 | ||||||
|
| |||||||
| 14,462,178 | ||||||||
|
| |||||||
TOTAL CORPORATE BONDS | $ | 104,091,853 | ||||||
|
| |||||||
The accompanying notes are an integral part of this Schedule of Investments.
13
Brandes Separately Managed Account Reserve Trust
SCHEDULE OF INVESTMENTS — September 30, 2017 (continued)
| Principal Amount | Value | |||||||
| REPURCHASE AGREEMENTS – 2.94% | ||||||||
State Street Bank and Trust Repurchase Agreement, | $ | 5,186,066 | $ | 5,186,066 | ||||
|
| |||||||
TOTAL REPURCHASE AGREEMENTS | $ | 5,186,066 | ||||||
|
| |||||||
Total Investments (Cost $172,236,037) – 100.53% | $ | 177,607,583 | ||||||
Liabilities in Excess of Other Assets – (0.53%) | (934,282 | ) | ||||||
|
| |||||||
TOTAL NET ASSETS – 100.00% | $ | 176,673,301 | ||||||
|
| |||||||
Percentages are stated as a percent of net assets.
| (a) | Non-income producing security. |
| (b) | Acquired in a transaction exempt from registration under Rule 144A or Section 4(a)(2) of the Securities Act of 1933. May be resold in the U.S. in transactions exempt from registration, normally to qualified institutional buyers. The total value of all such securities was $19,291,407, which represented 10.92% of the net assets of the Fund. |
| (c) | Variable rate security. The coupon is based on an underlying pool of loans. |
| (d) | Variable rate security. The coupon is based on a reference index and spread. |
The industry classifications represented in the Schedule of Investments are in accordance with Global Industry Classification Standards (GICS®), which was developed by and/or is the exclusive property of MSCI, Inc. and Standard & Poor Financial Services LLC. This information is unaudited.
The accompanying notes are an integral part of this Schedule of Investments.
14
Brandes Separately Managed Account Reserve Trust
STATEMENT OF ASSETS AND LIABILITIES — September 30, 2017
ASSETS | ||||
Investments in securities, at cost | $ | 172,236,037 | ||
|
| |||
Investment in securities, at value | $ | 177,607,583 | ||
Cash | — | |||
Receivables: | ||||
Fund shares sold | 48,153 | |||
Interest | 1,790,316 | |||
|
| |||
Total Assets | 179,446,052 | |||
|
| |||
LIABILITIES | ||||
Payables: | ||||
Securities purchased | 2,244,123 | |||
Fund shares redeemed | 489,752 | |||
Dividends payable | 38,876 | |||
|
| |||
Total Liabilities | 2,772,751 | |||
|
| |||
NET ASSETS | $ | 176,673,301 | ||
|
| |||
COMPONENTS OF NET ASSETS | ||||
Paid-in capital | $ | 187,365,980 | ||
Undistributed net investment income | — | |||
Accumulated net realized loss on investments | (16,064,225 | ) | ||
Net unrealized appreciation on investments | 5,371,546 | |||
|
| |||
Total Net Assets | $ | 176,673,301 | ||
|
| |||
Net asset value, offering price and redemption proceeds per share | ||||
Net Assets | $ | 176,673,301 | ||
Shares outstanding (unlimited shares authorized without par value) | 19,763,296 | |||
Offering and redemption price | $ | 8.94 | ||
|
|
The accompanying notes to financial statements are an integral part of this statement.
15
Brandes Separately Managed Account Reserve Trust
STATEMENT OF OPERATIONS — For the Year Ended September 30, 2017
INVESTMENT INCOME | ||||
Income | ||||
Dividend income | $ | 154,712 | ||
Interest income | 7,014,093 | |||
Miscellaneous income | 164,147 | |||
|
| |||
Total Income | 7,332,952 | |||
|
| |||
Expenses (Note 3) | ||||
Total expenses | — | |||
|
| |||
Less reimbursement / waiver | — | |||
|
| |||
Total expenses net of reimbursement / waiver | — | |||
|
| |||
Net investment income | 7,332,952 | |||
|
| |||
REALIZED AND UNREALIZED GAIN ON INVESTMENTS: | ||||
Net realized gain on investments | 499,496 | |||
Net change in unrealized appreciation on investments | (1,974,783 | ) | ||
|
| |||
Net realized and unrealized loss on investments | (1,475,287 | ) | ||
|
| |||
Net Increase in net assets resulting from operations | $ | 5,857,665 | ||
|
|
The accompanying notes to financial statements are an integral part of this statement.
16
Brandes Separately Managed Account Reserve Trust
STATEMENT OF CHANGES IN NET ASSETS
| Year Ended September 30, 2017 | Year Ended September 30, 2016 | |||||||
INCREASE IN NET ASSETS FROM: | ||||||||
OPERATIONS | ||||||||
Net investment income | $ | 7,332,952 | $ | 8,022,463 | ||||
Net realized gain on investments | 499,496 | 1,211,845 | ||||||
Net change in unrealized appreciation on investments | (1,974,783 | ) | 5,122,568 | |||||
|
|
|
| |||||
Net increase in net assets resulting from operations | 5,857,665 | 14,356,876 | ||||||
|
|
|
| |||||
DISTRIBUTIONS TO SHAREHOLDERS | ||||||||
From net investment income | (7,366,983 | ) | (8,044,823 | ) | ||||
|
|
|
| |||||
Decrease in net assets from distributions | (7,366,983 | ) | (8,044,823 | ) | ||||
|
|
|
| |||||
CAPITAL SHARE TRANSACTIONS | ||||||||
Proceeds from shares sold | 38,320,928 | 28,073,579 | ||||||
Net asset value of shares issued on reinvestment of distributions | 7,184,193 | 7,967,120 | ||||||
Cost of shares redeemed | (31,175,046 | ) | (38,266,371 | ) | ||||
|
|
|
| |||||
Net increase/(decrease) in net assets from capital share transactions | 14,330,075 | (2,225,672 | ) | |||||
|
|
|
| |||||
Total increase in net assets | 12,820,757 | 4,086,381 | ||||||
|
|
|
| |||||
NET ASSETS | ||||||||
Beginning of the Year | 163,852,544 | 159,766,163 | ||||||
|
|
|
| |||||
End of the Year | $ | 176,673,301 | $ | 163,852,544 | ||||
|
|
|
| |||||
Undistributed net investment income | $ | — | $ | 5,772 | ||||
|
|
|
| |||||
The accompanying notes to financial statements are an integral part of this statement.
17
Brandes Separately Managed Account Reserve Trust
| Year Ended September 30, | ||||||||||||||||||||
| 2017 | 2016 | 2015 | 2014 | 2013 | ||||||||||||||||
Net asset value, beginning of period | $ | 9.02 | $ | 8.69 | $ | 9.03 | $ | 8.89 | $ | 9.01 | ||||||||||
|
|
|
|
|
|
|
|
|
| |||||||||||
Total from investment operations: | ||||||||||||||||||||
Net investment income(2) | 0.39 | 0.44 | 0.43 | 0.46 | 0.51 | |||||||||||||||
Net realized and unrealized gain/(loss) on investments | (0.08 | ) | 0.33 | (0.34 | ) | 0.16 | (0.12 | ) | ||||||||||||
|
|
|
|
|
|
|
|
|
| |||||||||||
Total from investment operations | 0.31 | 0.77 | 0.09 | 0.62 | 0.39 | |||||||||||||||
|
|
|
|
|
|
|
|
|
| |||||||||||
Less dividends and distributions: | ||||||||||||||||||||
Dividends from net investment income | (0.39 | ) | (0.44 | ) | (0.43 | ) | (0.48 | ) | (0.51 | ) | ||||||||||
|
|
|
|
|
|
|
|
|
| |||||||||||
Total dividends and distributions | (0.39 | ) | (0.44 | ) | (0.43 | ) | (0.48 | ) | (0.51 | ) | ||||||||||
|
|
|
|
|
|
|
|
|
| |||||||||||
Net asset value, end of period | $ | 8.94 | $ | 9.02 | $ | 8.69 | $ | 9.03 | $ | 8.89 | ||||||||||
|
|
|
|
|
|
|
|
|
| |||||||||||
Total return | 3.57 | % | 9.24 | % | 0.93 | % | 7.13 | % | 4.42 | % | ||||||||||
Net assets, end of period (millions) | $ | 176.7 | $ | 163.9 | $ | 159.8 | $ | 138.3 | $ | 126.3 | ||||||||||
Ratio of expenses to average net assets(1) | 0.00 | % | 0.00 | % | 0.00 | % | 0.00 | % | 0.00 | % | ||||||||||
Ratio of net investment income to average net assets(1) | 4.39 | % | 5.12 | % | 4.77 | % | 5.12 | % | 5.61 | % | ||||||||||
Portfolio turnover rate | 39.74 | % | 53.60 | % | 32.78 | % | 21.61 | % | 28.88 | % | ||||||||||
| (1) | Reflects the fact that no fees or expenses are incurred by the Fund. The Fund is an integral part of “wrap-fee” programs sponsored by investment advisers and/or broker-dealers unaffiliated with the Fund or the Advisor. Participants in these programs pay a “wrap” fee to the sponsor of the program. |
| (2) | Net investment income per share has been calculated based on average shares outstanding during the period. |
The accompanying notes to financial statements are an integral part of this statement.
18
Brandes Separately Managed Account Reserve Trust
NOTE 1 – ORGANIZATION
The Separately Managed Account Reserve Trust (the “Fund”) is a series of Brandes Investment Trust (the “Trust”). The Trust is registered under the Investment Company Act of 1940, as amended (the “1940 Act”), as a diversified, open-end management investment company. The Fund began operations on October 3, 2005. The Fund invests its assets primarily in debt securities and seeks to maximize total return.
NOTE 2 – SIGNIFICANT ACCOUNTING POLICIES
The following is a summary of significant accounting policies consistently followed by the Fund. These policies are in conformity with accounting principles (“GAAP”) generally accepted in the United States of America.
| A. | Repurchase Agreements. The Fund may enter into repurchase agreements with government securities dealers recognized by the Federal Reserve Board, with member banks of the Federal Reserve System or with other brokers or dealers that meet the credit guidelines established by the Board of Trustees. The Fund will always receive and maintain, as collateral, securities whose market value, including accrued interest (which is recorded in the Schedule of Investments), will be at least equal to 100% of the dollar amount invested by the Fund in each agreement, and the Fund will make payment for such securities only upon physical delivery or upon evidence of book entry transfer to the account of the Fund’s custodian. To the extent that the term of any repurchase transaction exceeds one business day, the value of the Fund’s collateral is marked-to-market on a daily basis to ensure the adequacy of the collateral. Before causing the Fund to enter into a repurchase agreement with any other party, the investment advisor will determine that such party does not have any apparent risk of becoming involved in bankruptcy proceedings within the time frame contemplated by the repurchase agreement. If the seller defaults and the value of the collateral declines, or if bankruptcy proceedings are commenced with respect to the seller of the security, realization of the collateral by the Fund may be delayed or limited. At September 30, 2017, the Fund’s ongoing exposure to the economic return on repurchase agreements is shown on the Schedule of Investments. |
| B. | Foreign Currency Translation and Transactions. Values of investments denominated in foreign currencies are converted into U.S. dollars using the spot market rates of exchange at the time of valuation. Purchases and sales of investments and dividend and interest income are translated into U.S. dollars using the spot market rates of exchange prevailing on the respective dates of such translations. The gain or loss resulting from changes in foreign exchange rates is included with net realized and unrealized gain or loss from investments, as appropriate. Foreign securities and currency |
19
Brandes Separately Managed Account Reserve Trust
NOTES TO FINANCIAL STATEMENTS (continued)
| transactions may involve certain considerations and risks not typically associated with those of domestic origin. |
Foreign securities are recorded in the financial statements after translation to U.S. dollars based on the applicable exchange rate at the end of the period. The Fund reports certain foreign currency-related transactions as components of realized gains or losses for financial reporting purposes, whereas such components are treated as ordinary income for federal income tax purposes.
| C. | Delayed Delivery Securities. The Fund may purchase securities on a when-issued or delayed delivery basis. “When-issued” or delayed delivery refers to securities whose terms are available and for which a market exists, but that have not been issued. For a when-issued or delayed delivery transaction, no payment is made until delivery date, which is typically longer than the normal course of settlement. When the Fund enters into an agreement to purchase securities on a when-issued or delayed delivery basis, the Fund segregates cash or liquid securities, of any type or maturity, equal in value to the Fund’s commitment. Losses may arise if the market values of the underlying securities change, if the counterparty does not perform under the contract, or if the issuer does not issue the securities due to political, economic or other factors. The Fund did not have any open commitments on delayed delivery securities as of September 30, 2017. |
| D. | Security Transactions, Dividends and Distributions. Security transactions are accounted for on the trade dates. Realized gains and losses are evaluated on the basis of identified costs. Distributions from net investment income are declared daily and paid monthly. Distributions of net realized gains, if any, are declared at least annually. Dividend income and distributions to shareholders are recorded on the ex-dividend dates. Interest is recorded on an accrual basis. The Fund amortizes premiums and accretes discounts using the constant yield method. |
| E. | Use of Estimates. The preparation of financial statements in conformity with accounting principles generally accepted in the United States of America requires management to make estimates and assumptions that affect the reported amounts of assets and liabilities and revenue and expenses and disclosure of contingent assets and liabilities and revenue and expenses at the date of the financial statements. Actual results could differ from those estimates. |
| F. | Indemnification Obligations. Under the Trust’s organizational documents, its current and former officers and trustees are indemnified against certain liabilities arising out of the performance of their duties to the Trust. The Trust has indemnified its trustees against any expenses actually and reasonably incurred by the trustees in any proceeding arising out of or in |
20
Brandes Separately Managed Account Reserve Trust
NOTES TO FINANCIAL STATEMENTS (continued)
| connection with the trustees’ service to the Trust. In addition, in the normal course of business, the Trust enters into contracts that contain a variety of representations and warranties and provide general indemnifications. The Fund’s maximum exposure under these arrangements is unknown as this would involve future claims that may be made against the Fund that have not yet occurred or that would be covered by other parties. |
| G. | Accounting for Uncertainty in Income Taxes. The Fund has elected to be taxed as a “regulated investment company” and intends to distribute substantially all its taxable income to its shareholders and otherwise comply with the provisions of the Internal Revenue Code applicable to regulated investment companies. The Fund may be subject to a nondeductible excise tax calculated as a percentage of certain undistributed amounts of net investment income and net capital gains. The Fund intends to distribute its net investment income and capital gains as necessary to avoid this excise tax. Therefore, no provision for federal income taxes or excise taxes has been made. |
The Trust has adopted financial reporting rules that require the Trust to analyze all open tax years, as defined by the applicable statute of limitations, for all major jurisdictions. Open tax years for the Fund are those that are open for exam by taxing authorities (2014 through 2017). As of September 30, 2017, the Trust has no examinations in progress.
Management has analyzed the Trust’s tax positions, and has concluded that no liability should be recorded related to uncertain tax positions expected to be taken on the tax return for the fiscal year-end September 30, 2017. The Trust identifies its major tax jurisdictions as the U.S. Government and the State of California. The Trust is not aware of any tax positions for which it is reasonably possible that the total amounts of unrecognized tax benefits will significantly change in the next twelve months.
| H. | Fair Value Measurements. The Trust has adopted GAAP accounting principles related to fair value accounting standards which establish a definition of fair value and set out a hierarchy for measuring fair value. These standards require additional disclosures about the various inputs and valuation techniques used to develop the measurements of fair value and a discussion of changes in valuation techniques and related inputs during the period. These inputs are summarized in the three broad levels listed below: |
Level 1 — Fair value measurement within Level 1 should be based on an unadjusted quoted price in an active market that the Funds have the ability to access for the asset or liability at the measurement date. Because a quoted price alone forms the basis for the measurement, the access requirement within Level 1 limits discretion in pricing the asset or liability,
21
Brandes Separately Managed Account Reserve Trust
NOTES TO FINANCIAL STATEMENTS (continued)
including in situations in which there are multiple markets for the asset or liability with different prices and no single market represents a principal market for the asset or liability. Importantly, the Financial Accounting Standards Board has indicated that when a quoted price in an active market for a security is available, that price should be used to measure fair value without regard to an entity’s intent to transact at that price.
Level 2 — Fair value measurement within Level 2 should be based on all inputs other than unadjusted quoted prices included within Level 1 that are observable for the asset or liability. Other significant observable market inputs include quoted prices for similar instruments in active markets, quoted adjusted prices in active markets, quoted prices for identical or similar instruments in markets that are not active, and model-derived valuations in which the majority of significant inputs and significant value drivers are observable in active markets.
Level 3 — Fair value measurement within Level 3 should be based on unobservable inputs in such cases where markets do not exist or are illiquid. Significant unobservable inputs include model derived valuations in which the majority of significant inputs or significant value drivers are unobservable. Unobservable inputs are those inputs that reflect the Fund’s own assumptions that market participants would use to price the asset or liability based on the best available information.
| I. | Security Valuation. Bonds and other fixed-income securities (other than repurchase agreements and demand notes) are valued using the bid price on the day of the valuation provided by an independent pricing service. |
Securities traded on a national securities exchange are valued at the last reported sale price at the close of regular trading on each day the exchange is open for trading. Securities listed on the NASDAQ National Market System for which market quotations are readily available are valued using the NASDAQ Official Closing Price. Securities traded on an exchange for which there has been no sales are valued at the mean between last bid and ask price on such day. Securities for which quotations are not readily available are valued at their respective fair values as determined in good faith pursuant to procedures adopted by the Board of Trustees.
Repurchase agreements and demand notes, for which neither vendor pricing nor market maker prices are available, are valued at amortized cost on the day of valuation, unless the Advisor determines that the use of amortized cost valuation on such day is not appropriate (in which case such instrument is fair valued in accordance with the fair value procedures of the Trust).
22
Brandes Separately Managed Account Reserve Trust
NOTES TO FINANCIAL STATEMENTS (continued)
The Trust has adopted valuation procedures that allow for fair value pricing for use in appropriate circumstances. For example, such circumstances may arise when trading in a security has been halted or suspended or a security has been delisted from a national exchange, a security has not been traded for an extended period of time, or a significant event with respect to a security occurs after the close of the market or exchange on which the security principally trades and before the time the Fund calculates its own share price. If no price, or in the Advisor’s determination no price representing fair value, is provided for a security held by the Fund by an independent pricing agent, then the security will be fair valued. Thinly traded securities and certain foreign securities may be impacted more by the use of fair valuations than other securities.
In using fair value pricing, the Fund attempts to establish the price that it might reasonably have expected to receive upon a sale of the security at 4:00 p.m. Eastern time. Valuing securities at fair value involves greater reliance on judgment than valuation of securities based on readily available market quotations. When using fair value to price securities, the Fund may value those securities higher or lower than another fund using market quotations or fair value to price the same securities. Further, there can be no assurance that the Fund could obtain the fair value assigned to a security if it were to sell the security at approximately the time at which the Fund determines its net asset value.
Foreign securities are recorded in the financial statements after translation to U.S. dollars based on the applicable exchange rate at the end of the period. The Fund reports certain foreign currency-related transactions as components of realized gains or losses for financial reporting purposes, whereas such components are treated as ordinary income for federal income tax purposes.
Fixed income securities including corporate, convertible and municipal bonds and notes, U.S. government agencies, U.S. Treasury obligations, sovereign issues, bank loans, convertible preferred securities and non-U.S. bonds are normally valued on the basis of quotes obtained from brokers and dealers or independent pricing services or sources. Independent pricing services typically use information provided by market makers or estimates of market values obtained from yield data relating to investments or securities with similar characteristics. The service providers’ internal models use inputs that are observable such as, among other things, issuer details, interest rates, yield curves, prepayment speeds, credit risks/spreads, default rates and quoted prices for similar assets. Securities that use similar valuation techniques and inputs as described above are categorized as Level 2 of the fair value hierarchy.
23
Brandes Separately Managed Account Reserve Trust
NOTES TO FINANCIAL STATEMENTS (continued)
Fixed income securities purchased on a delayed-delivery basis are typically marked to market daily until settlement at the forward settlement date.
The Fund may enter into mortgage dollar roll transactions in which the Fund sells a mortgage-backed security to a counterparty and simultaneously enters into an agreement with the same counterparty to buy back a similar security on a specific future date at a predetermined price. Risks may arise due to the delayed payment date and the potential inability of counterparties to complete the transaction. Mortgage dollar rolls are accounted for as purchase and sale transactions, which may increase the Fund’s portfolio turnover rate.
Mortgage and asset-backed securities are usually issued as separate tranches, or classes, of securities within each package of underlying securities. These securities are also normally valued by pricing service providers that use broker dealer quotations or valuation estimates from their internal pricing models. The pricing models for these securities usually consider tranche level attributes, estimated cash flows and market-based yield spreads for each tranche, current market data and packaged collateral performance, as available. Mortgage and asset-backed securities that use such valuation techniques and inputs are categorized as Level 2 of the fair value hierarchy only if there are significant observable inputs used.
Common stocks, exchange-traded fund shares and financial derivative instruments, such as futures contracts or options contracts that are traded on a national securities or commodities exchange, are valued at the last reported sales price, in the case of common stocks and exchange-traded fund shares, or, in the case of futures contracts or options contracts, the settlement price determined by the relevant exchange. To the extent these securities are actively traded and valuation adjustments are not applied, they are categorized as Level 1 of the fair value hierarchy.
Valuation adjustments may be applied to certain securities that are solely traded on a foreign exchange to account for the market movement between the close of the foreign market and the close of the New York Stock Exchange (“NYSE”). These securities are generally valued using pricing service providers that consider the correlation of the trading patterns of the foreign security to the intraday trading in the U.S. markets for investments. Securities using these valuation adjustments are categorized as Level 2 of the fair value hierarchy. None of the Fund’s securities were fair valued utilizing this method as of September 30, 2017.
Investments in registered open-end management investment companies are valued based upon the Net Asset Values (“NAVs”) of such investments and are categorized as Level 1 of the fair value hierarchy. If, on a particular day, a share price of an investment company is not readily
24
Brandes Separately Managed Account Reserve Trust
NOTES TO FINANCIAL STATEMENTS (continued)
available, such securities are fair valued in accordance with the fair value procedures of the Trust.
Certain securities may be fair valued in accordance with the fair valuation procedures approved by the Board of Trustees. The Valuation Committee is generally responsible for overseeing the day to day valuation processes and reports periodically to the Board. The Valuation Committee is authorized to make all necessary determinations of the fair value of portfolio securities and other assets for which market quotations are not readily available or if it is deemed that the prices obtained from brokers and dealers or independent pricing services are unreliable.
The following is a summary of the inputs used, as of September 30, 2017, involving the Fund’s assets carried at value. The inputs of methodology used for valuing securities may not be an indication of the risk associated with investing in those securities.
Description | Level 1 | Level 2 | Level 3 | Total | ||||||||||||
Separately Managed Account Reserve Trust | ||||||||||||||||
Common Stocks | $ | 72,055 | $ | — | $ | — | $ | 72,055 | ||||||||
Asset Backed Securities | — | 7,371,710 | — | 7,371,710 | ||||||||||||
Corporate Bonds | — | 104,091,853 | — | 104,091,853 | ||||||||||||
Government Securities | — | 56,092,392 | — | 56,092,392 | ||||||||||||
Mortgage Backed Securities | — | 4,793,507 | — | 4,793,507 | ||||||||||||
Repurchase Agreements | — | 5,186,066 | — | 5,186,066 | ||||||||||||
|
|
|
|
|
|
|
| |||||||||
Total Investments in Securities | $ | 72,055 | $ | 177,535,528 | $ | — | $ | 177,607,583 | ||||||||
|
|
|
|
|
|
|
| |||||||||
There were no transfers into or out of Levels 1 and 2 for the Fund during the reporting period.
There were no Level 3 securities in the Fund at the beginning or the end of the year ended September 30, 2017.
NOTE 3 – INVESTMENT ADVISORY FEE AND OTHER TRANSACTIONS WITH AFFILIATES
| A. | Advisor Fee. Brandes Investment Partners, L.P. (the “Advisor”) provides the Fund with investment management services under an Investment Advisory Agreement. The Advisor receives no advisory fee or other fee from the Fund. The financial statements of the Fund reflect the fact that no fees or expenses are incurred by the Fund. It should be understood, however, that the Fund is an integral part of “wrap-fee” programs sponsored by investment advisors unaffiliated with the Fund and the Advisor. Typically, participants in these programs pay a “wrap-fee” to their investment advisors. Although the Fund does not compensate the Advisor directly for its service under the Investment Advisory Agreement, the Advisor benefits from its relationships with the |
25
Brandes Separately Managed Account Reserve Trust
NOTES TO FINANCIAL STATEMENTS (continued)
| sponsors of wrap-fee programs for which the Fund is an investment option. Certain officers and Trustees of the Trust are also officers of the Advisor. |
| B. | Administration Fee. U.S. Bancorp Fund Services, LLC (the “Administrator”) acts as administrator for the Fund. The Administrator prepares various federal and state regulatory filings; prepares reports and materials to be supplied to the Trustees; monitors the activities of the Fund’s custodian, transfer agent and accountant; coordinates the preparation and payment of Fund expenses; and prepares several Fund reports. The Advisor compensates the Administrator on behalf of the Fund for the services the Administrator performs for the Fund. |
| C. | Distribution Fees. ALPS Distributors, Inc. (the “Distributor”), a registered broker-dealer, acts as the Fund’s principal underwriter in a continuous public offering of the Fund’s shares. All of the Fund’s distribution fees are paid by the Advisor. |
NOTE 4 – PURCHASES AND SALES OF SECURITIES
The cost of purchases and the proceeds from sales of securities of the Fund, excluding short-term investments, were as follows for the year ended September 30, 2017:
| U.S. Government | Other | |||||||||||||
| Purchases | Sales | Purchases | Sales | |||||||||||
| $ | 32,973,745 | $ | 13,032,574 | $ | 47,286,420 | $ | 50,444,307 | |||||||
NOTE 5 – CAPITAL STOCK TRANSACTIONS
The Fund’s capital stock activity in shares and dollars during the years ended September 30, 2017 and September 30, 2016, was as follows (shares and dollar amounts in thousands):
| Year Ended 9/30/17 | Year Ended 9/30/16 | |||||||||||||||
| Shares | Amount | Shares | Amount | |||||||||||||
Shares Sold | 4,304 | $ | 38,321 | 3,316 | $ | 28,073 | ||||||||||
Issued on Reinvestment of Distributions | 806 | 7,184 | 927 | 7,967 | ||||||||||||
Shares Redeemed | (3,505 | ) | (31,175 | ) | (4,470 | ) | (38,266 | ) | ||||||||
|
|
|
|
|
|
|
| |||||||||
Net Increase/(Decrease) Resulting from Fund Share Transactions | 1,605 | $ | 14,330 | (227 | ) | $ | (2,226 | ) | ||||||||
|
|
|
|
|
|
|
| |||||||||
NOTE 6 – FEDERAL INCOME TAX MATTERS
GAAP requires that certain components of net assets be reclassified between financial and tax reporting. Temporary differences do not require reclassification. Temporary and permanent differences have no effect on net assets or net asset value per share. For the year ended September 30, 2017, the Fund made the
26
Brandes Separately Managed Account Reserve Trust
NOTES TO FINANCIAL STATEMENTS (continued)
following permanent book-to-tax reclassifications primarily related to the treatment of paydowns and the difference between book and tax accretion methods for market premium:
| Undistributed Net Investment Income | Accumulated Net Realized Loss | Paid-In Capital | ||||||||
| $ | 28,260 | $ | 12,269,815 | $ | (12,298,075 | ) | ||||
As of September 30, 2017, the Fund’s components of distributable earnings on a tax basis were as follows:
Cost of investments for tax purposes | $ | 172,236,037 | ||
|
| |||
Gross tax unrealized appreciation | 8,580,312 | |||
Gross tax unrealized depreciation | (3,208,766 | ) | ||
|
| |||
Net unrealized appreciation on investments | 5,371,546 | |||
|
| |||
Distributable ordinary income | — | |||
Distributable long-term capital gains | — | |||
|
| |||
Total distributable earnings | — | |||
|
| |||
Other accumulated losses | (16,064,225 | ) | ||
|
| |||
Total accumulated losses | $ | (10,692,679 | ) | |
|
|
The differences between book and tax basis distributable earnings are primarily related to the differences in classification of paydown gains and losses for tax purposes compared to book purposes. The difference between book and tax basis unrealized depreciation on investments is due primarily to timing differences resulting from wash sale transactions. These differences are temporary.
As of September 30, 2017, the Fund had capital losses expiring on September 30, 2018 and 2019 in the amounts of $6,084,748 and $6,501,831, respectively. As of September 30, 2017, the Fund had a capital loss with an indefinite expiration in the amount of $3,477,646. At September 30, 2017, the Fund utilized $613,692 of capital loss carryforwards. At September 30, 2017, the Fund had $12,139,741 of capital loss carryforwards expire.
The tax compositions of dividends for the years ended September 30, 2017 and September 30, 2016 for the Fund were as follows:
| Ordinary Income | Long Term Capital Gains | Return of Capital | ||||||||||||||||||||
| 2017 | 2016 | 2017 | 2016 | 2017 | 2016 | |||||||||||||||||
| $ | 7,208,649 | $ | 8,044,823 | $ | — | $ | — | $ | 158,334 | $ | — | |||||||||||
NOTE 7 – SUBSEQUENT EVENTS
In preparing these financial statements, the Trust has evaluated events and transactions for potential recognition or disclosure through the date the financial statements were available to be issued. The Trust has concluded that there are no subsequent events to note.
27
Brandes Separately Managed Account Reserve Trust
REPORT OF INDEPENDENT REGISTERED PUBLIC ACCOUNTING FIRM
To the Board of Trustees and Shareholders of Brandes Investment Trust
In our opinion, the accompanying statement of assets and liabilities, including the schedule of investments, and the related statements of operations and of changes in net assets and the financial highlights present fairly, in all material respects, the financial position of the Brandes Separately Managed Account Reserve Trust (one of the series constituting the Brandes Investment Trust, hereafter referred to as the “Fund”) as of September 30, 2017, the results of its operations for the year then ended, the changes in its net assets for each of the two years in the period then ended and the financial highlights for each of the five years in the period then ended, in conformity with accounting principles generally accepted in the United States of America. These financial statements and financial highlights (hereafter referred to as “financial statements”) are the responsibility of the Fund’s management. Our responsibility is to express an opinion on these financial statements based on our audits. We conducted our audits of these financial statements in accordance with the standards of the Public Company Accounting Oversight Board (United States). Those standards require that we plan and perform the audit to obtain reasonable assurance about whether the financial statements are free of material misstatement. An audit includes examining, on a test basis, evidence supporting the amounts and disclosures in the financial statements, assessing the accounting principles used and significant estimates made by management, and evaluating the overall financial statement presentation. We believe that our audits, which included confirmation of securities as of September 30, 2017 by correspondence with the custodian and brokers, provide a reasonable basis for our opinion.
/s/ PricewaterhouseCoopers LLP
Los Angeles, California
November 20, 2017
28
Brandes Separately Managed Account Reserve Trust
ADDITIONAL INFORMATION — (Unaudited) (continued)
PROXY VOTING PROCEDURES
The Advisor votes proxies relating to the Funds’ portfolio securities in accordance with procedures adopted by the Advisor. You may obtain a description of these procedures, free of charge, by calling toll-free 1-800-331-2979. This information is also available through the Securities and Exchange Commission’s website at http:// www.sec.gov.
Information regarding how the Trust voted proxies relating to portfolio securities during the most recent 12-month period ended June 30 is available without charge, upon request, by calling 1-800-331-2979. This information is also available through the Securities and Exchange Commission’s website at http://www.sec.gov.
FORM N-Q DISCLOSURE
The Trust files the Fund’s complete schedule of portfolio holdings with the Securities and Exchange Commission for the first and third quarters of each fiscal year on Form N-Q. The Trust’s Form N-Q filings are available on the Securities and Exchange Commission’s website at http://www.sec.gov. The Trust’s Form N-Q filings may be reviewed and copied at the Commission’s Public Reference Room in Washington, D.C., and information on the operation of the Public Reference Room may be obtained by calling 1-800-SEC-0330. Information regarding the Trust’s Form N-Q filings is also available, without charge, by calling toll-free, 1-800-331-2979.
TAX NOTICE
For the periods ended September 30, 2017, 100.00% of the ordinary distributions paid by the SMART Fund qualify as interest related dividends under Internal Revenue Code Section 87(k)(1)(c). For the periods ended September 30, 2017, none of the ordinary distributions paid by SMART Fund, were designated as short-term gain distributions under Internal Revenue Code Section 871(k)(2)(c). Under Section 852(b)(3)(c) of the Revenue Code, the SMART Fund designated $0 as long-term capital gain dividends for the fiscal year ended September 30, 2017.
The percentage of dividend income distributed for the year ended September 30, 2017, which is designated as qualified dividend income under the Jobs and Growth Tax Relief Reconciliation Act of 2003 is 2.12% for the SMART Fund. Of the dividends paid by the SMART Fund, 2.12% qualify for the corporate dividends received deduction.
29
Brandes Separately Managed Account Reserve Trust
TRUSTEES AND OFFICERS INFORMATION — (Unaudited)
The Board of Trustees is responsible for the overall management of the Trust’s business. The Board approves all significant agreements between the Trust and persons or companies furnishing services to the Trust, including the Trust’s agreements with the Advisor, Administrator, Custodian, Distributor and Transfer Agent. The Board of Trustees delegates the day-to-day operations of the Trust to its officers and service providers, subject to the Fund investment objectives and policies and to general supervision by the Board. The Trust’s Statement of Additional Information includes additional information about the Trustees and is available, without charge, by calling 1-800-331-2979 or visiting www.brandes.com.
The Trustees and officers of the Trust, their business addresses and principal occupations during the past five years are:
Name, Address | Position(s) | Term of | Principal | Number | Other Trusteeships | |||||
Independent Trustees(2) | ||||||||||
Jean E. Carter 11988 El Camino Real, Suite 600 San Diego, CA 92130 (Born: 1957) | Trustee and Chairman | Since April 2008 | Retired. | 9 | Bridge Builder Trust | |||||
Robert M. Fitzgerald, CPA (inactive) 11988 El Camino Real, Suite 600 San Diego, CA 92130 (Born: 1952) | Trustee | Since April 2008 | Retired. | 9 | Hotchkis and Wiley Mutual Funds | |||||
Craig Wainscott, CFA 11988 El Camino Real, Suite 600 San Diego, CA 92130 (Born: 1961) | Trustee | Since February 2012 | Partner with The Paradigm Project and advisor to early-stage companies. | 9 | None | |||||
Gregory Bishop, CFA 11988 El Camino Real, Suite 600 San Diego, CA 92130 (Born: 1961) | Trustee | Since January 2017 | Retired. Previously Executive Vice President and Head of Retail Business, PIMCO Investments , from 1997 to 2014 | 9 | None | |||||
30
Brandes Separately Managed Account Reserve Trust
TRUSTEES AND OFFICERS INFORMATION — (Unaudited) (continued)
Name, Address | Position(s) | Term of | Principal | Number | Other Trusteeships | |||||
“Interested” Trustees(3) | ||||||||||
Oliver Murray 11988 El Camino Real, Suite 600 San Diego, CA 92130 (Born: 1962) | Trustee | Since February 2012 | Chief Executive Officer, Brandes Investment Partners & Co.; Managing Director – PMCS of Brandes Investment Partners, L.P., the investment advisor to the Funds (the “Advisor”). | 9 | None | |||||
Jeff Busby, CFA 11988 El Camino Real, Suite 600 San Diego, CA 92130 (Born: 1961) | Trustee and President | Since July 2006 | Executive Director of the Advisor. | 9 | None | |||||
Officers of the Trust | ||||||||||
Thomas M. Quinlan 11988 El Camino Real, Suite 600 San Diego, CA 92130 (Born: 1970) | Secretary | Since June 2003 | Associate General Counsel of the Advisor. | N/A | N/A | |||||
Gary Iwamura, CPA 11988 El Camino Real, Suite 600 San Diego, CA 92130 (Born: 1956) | Treasurer | Since September 1997 | Finance Director of the Advisor. | N/A | N/A | |||||
Roberta Loubier 11988 El Camino Real, Suite 600 San Diego, CA 92130 (Born: 1971) | Chief Compliance Officer | Since September 2015 | Global Head of Compliance, Brandes Investment Partners, L.P. | N/A | N/A | |||||
| (1) | Trustees and officers of the Fund serve until their resignation, removal or retirement. |
| (2) | Not “interested persons” of the Trust as defined in the 1940 Act. |
| (3) | “Interested persons” of the Trust as defined in the 1940 Act by virtue of their positions with the Advisor. |
31
ADVISOR Brandes Investment Partners, L.P. 11988 El Camino Real, Suite 600 San Diego, CA 92130 800.331.2979 DISTRIBUTOR ALPS Distributors, Inc. 1290 Broadway, #1100 Denver, CO 80203 TRANSFER AGENT U.S. Bancorp Fund Services, LLC 615 E. Michigan Street, 3rd Floor Milwaukee, WI 53202 INDEPENDENT REGISTERED PUBLIC ACCOUNTING FIRM PricewaterhouseCoopers LLP 601 South Figueroa Street Los Angeles, CA 90017 LEGAL COUNSEL Morgan, Lewis & Bockius LLP 300 S. Grand Avenue, 22nd Floor Los Angeles, CA 90071 This report is intended for shareholders of the Brandes Separately Managed Account Reserve Trust and may not be used as sales literature unless preceded or accompanied by a current prospectus. Statements and other information herein are dated and are subject to change.

Item 2. Code of Ethics.
The registrant has adopted a code of ethics that applies to the registrant’s principal executive officer and principal financial officer. The registrant has not made any amendments to its code of ethics during the period covered by this report. The registrant has not granted any waivers from any provisions of the code of ethics during the period covered by this report. The registrant undertakes to provide to any person without charge, upon request, a copy of such code of ethics by mail when they call the registrant at 1-800-331-2979.
Item 3. Audit Committee Financial Expert.
The registrant’s board of trustees has determined that there is at least one audit committee financial expert serving on its audit committee. Robert Fitzgerald is the “audit committee financial expert” and is considered to be “independent” as each term is defined in Item 3 of Form N-CSR.
Item 4. Principal Accountant Fees and Services.
The registrant has engaged its principal accountant to perform audit services, audit-related services, tax services and other services during the past two fiscal years. “Audit services” refers to performing an audit of the registrant’s annual financial statements or services that are normally provided by the accountant in connection with statutory and regulatory filings or engagements for those fiscal years. “Audit-related services” refers to the assurance and related services by the principal accountant that are reasonably related to the performance of the audit. “Tax services” refers to professional services rendered by the principal accountant for tax compliance, tax advice, and tax planning. The following table details the aggregate fees billed or expected to be billed for each of the last two fiscal years for audit services, audit-related services, tax services and other services by the principal accountant.
| FYE 9/30/2017 | FYE 9/30/2016 | |||||||
Audit Fees | $ | 287,970 | $ | 278,635 | ||||
Audit-Related Fees | None | None | ||||||
Tax Fees | $ | 72,198 | $ | 69,420 | ||||
All Other Fees | None | None | ||||||
The registrant’s audit committee has adopted pre-approval policies and procedures that require the audit committee to pre-approve all audit and non-audit services of the registrant, including services provided to any entity affiliated with the registrant.
All of the principal accountant’s hours spent on auditing the registrant’s financial statements were attributed to work performed by full-time permanent employees of the principal accountant. The following table indicates the non-audit fees billed or expected to be billed by the registrant’s accountant for services to the registrant and to the registrant’s investment adviser (and any entity controlling, controlled by, or under common control with the investment adviser for the last two years.
Non-Audit Related Fees | FYE 9/30/2017 | FYE 9/30/2016 | ||||||
Registrant | None | None | ||||||
Registrant’s Investment Adviser | None | None | ||||||
Item 5. Audit Committee of Listed Registrants.
Not applicable to registrants who are not listed issuers (as defined in Rule 10A-3 under the Securities Exchange Act of 1934).
Item 6. Investments.
| (a) | Schedule of Investments is included as part of the report to shareholders filed under Item 1 of this Form. |
| (b) | Not applicable. |
Item 7. Disclosure of Proxy Voting Policies and Procedures for Closed-End Management Investment Companies.
Not applicable to open-end investment companies.
Item 8. Portfolio Managers of Closed-End Management Investment Companies.
Not applicable to open-end investment companies.
Item 9. Purchases of Equity Securities by Closed-End Management Investment Company and Affiliated Purchasers.
Not applicable to open-end investment companies.
Item 10. Submission of Matters to a Vote of Security Holders.
There have been no material changes to the procedures by which shareholders may recommend nominees to the registrant’s board of trustees.
Item 11. Controls and Procedures.
| (a) | The registrant’s President and Treasurer have reviewed the Registrant’s disclosure controls and procedures (as defined in Rule 30a-3(c) under the Investment Company Act of 1940 (the “Act”)) as of a date within 90 days of the filing of this report, as required by Rule 30a-3(b) under the Act and Rules 13a-15(b) or 15d-15(b) under the Securities Exchange Act of 1934. Based on their review, such officers have concluded that the disclosure controls and procedures are effective in ensuring that information required to be disclosed in this report is appropriately recorded, processed, summarized and reported and made known to them by others within the Registrant and by the Registrant’s service provider. |
| (b) | No changes in the registrant’s internal control over financial reporting (as defined in Rule 30a-3(d) under the Act) occurred during the second fiscal quarter of the period covered by this report that materially affected, or are reasonably likely to materially affect, the registrant’s internal control over financial reporting. |
Item 12. Exhibits.
| (a) | (1) Any code of ethics or amendment thereto, that is the subject of the disclosure required by Item 2, to the extent that the registrant intends to satisfy Item 2 requirements through filing an exhibit. 1) Incorporated by reference to the registrant’s Form N-CSR filed January 7, 2005. |
(2) A separate certification for each principal executive and principal financial officer pursuant to Section 302 of the Sarbanes-Oxley Act of 2002. Filed herewith.
(3) Any written solicitation to purchase securities under Rule 23c-1 under the Act sent or given during the period covered by the report by or on behalf of the registrant to 10 or more persons. Not applicable to open-end investment companies.
| (b) | Certifications pursuant to Section 906 of the Sarbanes-Oxley Act of 2002. Furnished herewith. |
SIGNATURES
Pursuant to the requirements of the Securities Exchange Act of 1934 and the Investment Company Act of 1940, the registrant has duly caused this report to be signed on its behalf by the undersigned, thereunto duly authorized.
| (Registrant) Brandes Investment Trust |
| By (Signature and Title)* /s/ Jeff Busby |
| Jeff Busby, President and Principal Executive Officer |
| Date 11/29/17 |
Pursuant to the requirements of the Securities Exchange Act of 1934 and the Investment Company Act of 1940, this report has been signed below by the following persons on behalf of the registrant and in the capacities and on the dates indicated.
| By (Signature and Title)* /s/ Jeff Busby |
| Jeff Busby, President and Principal Executive Officer |
| Date 11/29/17 |
| By (Signature and Title)* /s/ Gary Iwamura |
| Gary Iwamura, Treasurer and Principal Financial Officer |
| Date 11/29/17 |
| * | Print the name and title of each signing officer under his or her signature. |