186th Annual Report 2003
Delivering
To our fellow shareholders,
This 186th Annual Report tells the story of the financial performance we achieved in 2003,
the ethical codes that guide our actions and how we evaluate our performance. It is about the strength that
comes from balancing priorities: Delivering results to investors, building trust with our employees and
the communities where we do business, and creating value for our customers. The pages in this report show how we are delivering.

About BMO Financial Group
BMO Financial Group (NYSE, TSX: BMO) is one of the largest financial services providers in North America. With assets of $256 billion at October 31, 2003 and 34,000 employees, BMO provides a comprehensive offering of retail banking, wealth management and investment banking products and solutions.
Canadian clients are served through our personal and commercial banking business, BMO Bank of Montreal, and BMO Nesbitt Burns, one of Canada’s largest full-service investment and wealth management firms. In the United States, clients are served through Harris Bank, a major Midwest financial services organization with a network of community banks in the Chicago area, and wealth management offices across the United States, as well as Harris Nesbitt, a leading mid-market investment bank.
We help our customers manage their financial affairs by delivering the broadest range of financial services through a single point of contact. Our financial service professionals provide access to any services our customers require across the entire enterprise. BMO Financial Group is made up of three client groups: Personal and Commercial Client Group, Private Client Group and Investment Banking Group.
Historical Strengths
On November 3, 1817, Bank of Montreal became Canada’s first chartered bank, and was the first financial institution to offer Canadians a sound domestic currency. The Bank played a major and continuing role in the development of the country, taking part in the financing of the first transcontinental railway in the 1880s. As a partner in the creation of Confederation in 1867, Bank of Montreal served as Canada’s central bank until 1935. Always with a view to expansion, Bank of Montreal was the first Canadian bank to open branches in Europe, Latin America, Asia and the United States.
| | | | | | | |
| Vision | | Growth Strategy |
| • | | To be the best financial services company, wherever we choose to compete. | | • | | Continue to invest in strengthening our core Canadian franchise while expanding selectively and substantially in the United States. |
| Values | |
| • | | We care about our customers, shareholders, communities and each other.
| | Strategic Priorities for 2004
|
| • | | We draw our strength from the diversity of our people and our businesses.
| | • | | Improve productivity.
|
| • | | We insist upon respect for everyone and encourage all to have a voice.
| | • | | Pursue U.S. acquisitions.
|
| • | | We keep our promises and stand accountable for our every action.
| | • | | Increase share of wallet and customer loyalty.
|
| • | | We share information, learn and innovate to create consistently superior customer experiences. | | • | | Maintain status as an employer of choice. |
| | | | | • | | Create a sustainable high-performance culture. |
| | | | | |
| CONTENTS | | |
| | | |
| IFC | | BMO Financial Group at a Glance |
| 1 | | Financial Highlights |
| 2 | | Chairman’s Message to Shareholders |
| 4 | | Year in Review: Delivering Results |
| 5 | | Delivering Ethical Leadership |
| 8 | | Delivering Customer Service |
| | | |
| 10 | | Financial Performance and Condition at a Glance |
| 13 | | Management’s Discussion and Analysis of Operations and Financial Condition |
| 13 | | Caution Regarding Forward-Looking Statements |
| 14 | | Financial Objectives, Targets and Measures |
| 15 | | Value Measures |
| 18 | | Enterprise-Wide Strategic Management |
| 19 | | Economic and Financial Services Developments |
| 20 | | Financial Performance Review |
| 27 | | Operating Group Review |
| 28 | | Personal and Commercial Client Group |
| 33 | | Private Client Group |
| 36 | | Investment Banking Group |
| 40 | | Corporate Support, including Technology and Solutions |
| 41 | | Financial Condition Review |
| 43 | | Enterprise-Wide Capital Management |
| 44 | | Critical Accounting Policies |
| 45 | | Enterprise-Wide Risk Management |
| 53 | | Review of 2002 Financial Performance |
| 54 | | Supplemental Information |
| | | |
| 69 | | Statement of Management’s Responsibility for Financial Information |
| 69 | | Shareholders’ Auditors’ Report |
| 70 | | Consolidated Financial Statements |
| 70 | | Consolidated Balance Sheet |
| 71 | | Consolidated Statement of Income |
| 72 | | Consolidated Statement of Changes in Shareholders’ Equity |
| 73 | | Consolidated Statement of Cash Flow |
| 74 | | Notes to Consolidated Financial Statements |
| 101 | | Bank-Owned Corporations |
| 102 | | Board of Directors and Honorary Directors |
| 103 | | Members of Management Board |
| 104 | | Glossary of Financial Terms |
| IBC | | Shareholder Information |
BMO Financial Group at a Glance
| | | | | |
| | | Business Profile | | |
|
Personal and Commercial Client Group
– Brand Names
BMO Bank of Montreal
Harris Bank | | The Personal and Commercial Client Group provides more than eight and a half million customers across Canada and in the United States with fully integrated personal and business banking solutions. These include deposit accounts, loans and credit cards, mutual fund and GIC investments, insurance products, and investments such as RRSPs, RESPs and RRIFs. Our products and services are delivered by a highly skilled team through 1,142 BMO Bank of Montreal and Harris Bank branches, telephone and online banking and a network of more than 2,290 automated banking machines. | |  |
|
Private Client Group
– Brand Names
BMO Private Client Group
BMO Harris Private Banking
BMO Nesbitt Burns
BMO InvestorLine
BMO Mutual Funds
The Harris
Harris Private Bank
Harris AdvantEdge Investing
Harrisdirect
Harris Insight Funds | | The Private Client Group offers clients a full range of wealth management products and services, including full service and direct investing, private banking and investment products. Our highly trained professionals are dedicated to serving the needs and goals of our clients to accumulate, protect and grow their financial assets. Operating as BMO Private Client Group in Canada and The Harris®1 in the United States, we have total assets under management and administration, including term deposits, of $282 billion. | |  |
|
Investment Banking Group
– Brand Names
BMO Nesbitt Burns
Harris Nesbitt | | Operating under the BMO Nesbitt Burns brand in Canada and the Harris Nesbitt®1 brand in the United States, the Investment Banking Group offers corporate, institutional and government clients complete financial services across the entire balance sheet. This includes advisory, capital-raising, investment and operating services. Supported by top-ranked research, our Investment Banking Group is a leader in mergers and acquisitions, advisory, debt and equity underwriting, institutional equity, securitization, trade finance and sales and trading services. | |  |
|
Bank of Montreal has taken a unified branding approach that links all of the organization’s together with its subsidiaries, is known as BMO®Financial Group. As such, in this document, the names BMO and BMO Financial Group mean Bank of Montreal.
BMO Financial Group at a Glance
2003 Key Initiatives
| | | |
| • | | Achieved combined Canada-U.S. revenue growth of 5.4% in an increasingly competitive environment. |
| | | In Canada: |
| • | | Improved productivity, as the expense-to-revenue ratio improved 142 basis points to 60.3%. |
| • | | Completed implementation of Pathway ConnectTM, our improved sales and service technology platform, in branches across Canada. |
| • | | Commercial Banking, our division that focuses on the needs of our upper
mid-market customers, increased its balance sheet growth by approximately double the 6% forecasted general market growth rate. |
| • | | Solidified our second-place ranking for loans of less than $5 million to small business. |
| • | | Improved and expanded our online banking service based on extensive feedback from our customers. We now offer e-mail money transfers, multiple post-dated bill payments, automated account openings and enhanced U.S.-dollar transactions. |
| | | In the United States: |
| • | | Improved productivity by 210 basis points to 76.4%. |
| • | | Opened nine new branches in Chicagoland. |
Focus for 2004
| | | |
| | | In Canada: |
| • | | Continue to focus on revenue growth and improved operational efficiency, while building our distribution capabilities. |
| • | | Improve customer loyalty in both personal and business banking segments. |
| • | | Increase our business banking market share faster than our major competitors. |
| • | | Grow our personal banking market share relative to our major competitors. |
| | | In the United States: |
| • | | Continue to expand our branch network in Chicagoland. |
| • | | Distinguish Harris Bank from our competitors by continuing to improve our community banking model. |
| | | |
| • | | Achieved net income growth of 93% and improved productivity, as the expense-to-revenue ratio improved 500 basis points despite general market uncertainty and the conservative investor climate throughout most of fiscal 2003. |
| • | | BMO InvestorLine® was ranked number one for the third consecutive time in Gómez Canada’s Direct Investing Report and for the fourth consecutive time inThe Globe and Mail’s online brokerage surveys. |
| • | | Acquired select assets of myCFO, Inc., a California-based provider of customized investment and advisory services to ultra-high net worth clients. |
| • | | Acquired Sullivan, Bruyette, Speros & Blayney Inc., a Virginia-based provider of open-access relationship-based financial planning, establishing a presence in the high-growth Washington, D.C. area. |
| • | | Achieved significant cost reductions in Harrisdirectby reducing the number of staff and optimizing call centre and branch sites. |
| | | |
| • | | Pursue opportunities that focus on deepening client relationships and building momentum in the high-growth affluent market segment. |
| • | | Focus on delivering the highest levels of service and integrated offerings to our clients by leveraging partnerships within the Private Client Group and across BMO Financial Group. |
| • | | Enhance our business models by continuing to improve productivity and invest in our high-growth businesses. |
| | | |
| • | | Improved productivity, as the expense-to-revenue ratio improved 410 basis points to 51.5%. |
| • | | Ranked number one in completed Canadian merger and acquisition transactions, with a total value in excess of $18 billion. |
| • | | Participated in 617 corporate debt and equity transactions on behalf of Canadian clients, raising $67 billion. |
| • | | Ranked Top Overall Research Team in the Brendan Wood International Survey for the 23rd consecutive year. We were also ranked first for Overall Quality of Sales Service. |
| • | | Ranking of number one for our Canadian Securitization unit in market share for asset-backed commercial paper conduit outstandings. |
| • | | Acquired Gerard Klauer Mattison, adding a solid U.S. equity research, sales and trading platform to our service offering as Harris Nesbitt Gerard. |
| • | | Expanded U.S. mid-market client base in Business Services, Consumer, Media and Entertainment, Technology and Telecom, and Health Care sectors. |
| | | |
| • | | Maintain Canadian leadership in the high-return fee businesses of mergers and acquisitions, debt and equity underwriting and securitization. |
| • | | Accelerate growth through further integration of our U.S. operations with a focus on increasing the proportion of fee-based revenue. |
| • | | Deepen and broaden relationships with target clients by leveraging the full range of our cross-border capabilities, including enhancing our product offering through the full integration of Harris Nesbitt Gerard. |
| • | | Continue a disciplined approach to cost and capital management. |
Financial Highlights
| | | | | | | | | | | | | | | | | | | | | |
| For the year ended or as at October 31, as appropriate | | 2003 | | 2002 | | 2001 | | 2000 | | 1999 |
|
| Income Statement Highlights(Canadian $ in millions) |
| Total revenue (teb) (a) | | | 9,271 | | | | 8,859 | | | | 8,863 | | | | 8,664 | | | | 7,928 | |
| Provision for credit losses | | | 455 | | | | 820 | | | | 980 | | | | 358 | | | | 320 | |
| Non-interest expense | | | 6,087 | | | | 6,030 | | | | 5,671 | | | | 5,258 | | | | 5,288 | |
| Net income | | | 1,825 | | | | 1,417 | | | | 1,471 | | | | 1,857 | | | | 1,382 | |
|
Common Share Data(Canadian $ per share) | | | | | | | | | | | | | | | | | | | | |
| Closing share price | | | 49.33 | | | | 38.10 | | | | 33.86 | | | | 35.25 | | | | 28.33 | |
| Earnings per share (b) | | | 3.44 | | | | 2.68 | | | | 2.66 | | | | 3.25 | | | | 2.34 | |
| Dividends declared per share | | | 1.34 | | | | 1.20 | | | | 1.12 | | | | 1.00 | | | | 0.94 | |
|
Primary Financial Measures(%) | | | | | | | | | | | | | | | | | | | | |
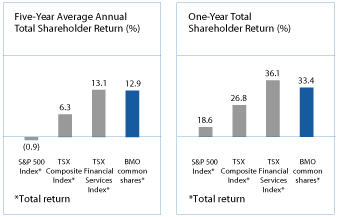
| Five-year average annual total shareholder return | | | 12.9 | | | | 7.9 | | | | 14.3 | | | | 22.9 | | | | 22.0 | |
| Earnings per share growth | | | 28.4 | | | | 0.8 | | | | (18.2 | ) | | | 38.9 | | | | 2.2 | |
| Return on equity | | | 16.4 | | | | 13.4 | | | | 13.8 | | | | 18.0 | | | | 14.1 | |
| Revenue growth | | | 4.7 | | | | — | | | | 2.3 | | | | 9.3 | | | | 9.0 | |
| Provision for credit losses as a % of average net loans and acceptances | | | 0.30 | | | | 0.56 | | | | 0.66 | | | | 0.25 | | | | 0.22 | |
| Tier 1 Capital Ratio | | | 9.55 | | | | 8.80 | | | | 8.15 | | | | 8.83 | | | | 7.72 | |
|
All ratios in this report are based on unrounded numbers.
(a) Reported on a taxable equivalent basis (teb). See pages 20 and 22.
(b) All earnings per share (EPS) measures in this report refer to diluted EPS unless otherwise specified.
| | | | | | | |
 | |  | |  | |  |
Net Income
Net income increased $408 million or 29%, driven by a lower provision for credit losses, higher business income in each of our operating groups and lower investment securities losses. | | Earnings per Share
Earnings per share increased $0.76 to a record $3.44 per share. The 28% increase exceeded our target of 10% to 15% growth. | | Return on Equity
Return on equity rose 3.0 percentage points to 16.4%. This exceeded our ROE target of 14% to 15%. | | One-Year Total Shareholder Return
The total return on an investment in BMO’s common shares in 2003 was 33.4%. This return was above the TSX Composite and S&P 500 Total Return indices (for the third straight year). |
BMO Financial Group 186th Annual Report 20031
Delivering on our promise:
Results to our investors, trust to our
stakeholders and value to our customers
Fellow shareholders,
When I accepted the responsibilities of Chairman and Chief Executive Officer four years ago, we undertook a major repositioning of BMO Financial Group to produce stronger returns for investors and a more profitable and secure future for the enterprise. Now, as we close the books on a year in which BMO achieved all financial targets, I am pleased to report that we are indeed delivering on our promise.
With rising performance in all three operating groups in 2003, BMO delivered earnings per share growth of 28.4%.
Since 1999, we have made a lot of tough choices. We have exited businesses that were low return or lacked scale, including corporate trust, global custody and our U.S. credit card business. We have dramatically reduced risk-weighted assets in our non-relationship corporate loan portfolio. And we have sold 84 slower-growth branches through innovative deals that safeguarded branches for customers and jobs for employees. At the same time, we have implemented our Canada-U.S. growth strategy with focus and consistency, making significant investments in areas such as a major new technology platform for our personal and commercial operations in Canada, and direct brokerage, private banking and personal and commercial banking acquisitions in the United States.
This major shift of our resources toward investments with high growth potential tested shareholders’ patience as we temporarily sacrificed revenues of more than $600 million per year in order to set the stage for growth. Now, this patience is being rewarded. With rising performance in all three operating groups in 2003, BMO delivered earnings per share growth of 28.4%. What is more, we raised our quarterly dividend by 16.7% during the year — a positive reflection of our confidence in sustaining earnings growth. Investors applauded our efforts, as BMO’s total shareholder return was 33% this fiscal year.
| | | |
| 2003 Target | | 2003 Performance |
|
| Achieve EPS growth of 10% to 15% | | 28.4% (see page 16) |
|
| Achieve ROE of 14% to 15% | | 16.4% (see page 17) |
|
| Maintain an annual provision for credit losses at or below the 2002 level of $820 million | | $455 million (see page 24) |
|
| Maintain a Tier 1 Capital Ratio of at least 8.0% | | 9.55% (see page 43) |
|
As we continue to transform BMO into a leading transnational financial institution operating broadly in Canada and through significant focused franchises in the United States, our growth strategy remains the same. Targeting clients who value personalized service, we are focusing our collective energies on delivering our offerings efficiently, prudently and profitably as we continue to invest in strengthening our core Canadian franchise and selectively and substantially expanding in personal and commercial, mid-market and individual investing markets in the United States.
Our number-one priority, this year as last, is to improve productivity by driving inefficiencies out of our operations.
Our number-one priority, this year as last, is to improve productivity by driving inefficiencies out of our operations and building a sustainable high-performance business culture. We improved our expense-to-revenue ratio by 240 basis points in 2003, moving up from fourth to third among Canada’s major banks in this key measure, and we already have programs well underway to improve productivity by a further 150 to 200 basis points in 2004 and in subsequent years. We will achieve this stronger performance while maintaining our
2 BMO Financial Group 186th Annual Report 2003
long-standing leadership in credit risk management — and by making the investments and taking the actions necessary to accelerate revenue growth while containing costs, therebysecuringinstead of mortgaging our future.
One way in which we are addressing the revenue side of the productivity equation is through a multi-faceted drive to improve and deepen customer loyalty in order to earn a larger share of each client’s business. This is our most significant challenge in Canada. With this challenge in mind, we have made large investments in technology and our sales force in recent years, and we are continuing to invest in the front-line people, sales tools and improved processes and incentives to serve our customers better.
Canada-U.S. growth strategy
Deliver our offerings efficiently, prudently and profitably by: |
• Continuing to invest in strengthening our core Canadian franchise |
• Selectively and substantially expanding in personal and commercial, mid-market and individual investing markets in the United States |
In the United States, one of our biggest challenges is to expand the Harris Bank branch network and grow market share despite increased competition from new market entrants. A major differentiating strength is superior customer satisfaction and loyalty. Strong customer relationships and our consistent community banking model position us well both to increase sales to existing customers and to be perceived as an acquirer of choice in our pursuit of shareholder-friendly branch expansion in Chicago, Illinois and surrounding states.
This brings me to my most important observation about the future. As illustrated in the pages that follow, BMO Financial Group is focused as never before on delivering value to our clients in a manner that earns and keeps their trust. As I wrote in this space four years ago, we have a clear guiding principle at BMO, and it goes like this: In order to get it right with customers and shareholders, we must first get it right with our people. If we provide our people with the work environment, tools and incentives required to capture the loyalty of customers, they will reward us with more business and wonderful word-of-mouth referrals — which will result in higher returns for our shareholders.
In order to get it right with customers and shareholders, we must first get it right with our people.
I was convinced back then that our success was dependent on this all-out people focus. And I am even more convinced today. I want to personally thank my 34,000 colleagues across BMO whose deep commitment and hard work contributed so significantly to our collective ability to deliver on our promise to shareholders in 2003.
Finally, as steward of Canada’s first bank, which can now look forward to a glowing transnational future, I thank you our shareholders for your support over the past few years of repositioning. On behalf of the entire BMO team, I promise that we will continue to do everything we can to earn your ongoing trust and support.
-s- Tony Comper
Tony Comper
Chairman and
Chief Executive Officer
BMO Financial Group 186th Annual Report 20033
Year in review
Delivering results by improving
productivity ratios and achieving all financial targets
Karen E. Maidment
Senior Executive Vice-President and Chief Financial Officer
BMO Financial Group
“We want to continue to be the leader in full, plain and balanced disclosure. When we are open and honest in explaining our results — both good news and bad — we earn the trust of investors over the long term. Our integrity doesn’t rely on laws, regulations or standards. It comes from the character of our people and the quality of our processes.”
$1,825 million
net income — an increase of 29%
33%
total shareholder return
$3.44
EPS — up 28%
16.4%
ROE — up from 13.4% in 2002
For fiscal 2003, we achieved all our financial targets. This along with improved productivity ratios, contributed to BMO Financial Group’s improved share price and 33% total shareholder return. Our focus on continual productivity improvement serves to align all resources for the maximum benefit of our customers and, ultimately, our shareholders. It means we spend only what is necessary to generate increased sales, while maintaining strict controls on our cost base. When our productivity ratios improve, we are on track to achieve the optimum balance between current profitability and future growth.
In 2003, all operating groups improved their cash productivity ratio by more than 150 basis points on revenue growth of 5% and an increase in expenses of just 1%.
We reported net income of $1,825 million in fiscal 2003, an increase of $408 million, or 29%, from a year ago, as earnings per share (EPS) rose 28% to $3.44. The growth in net income and EPS was primarily driven by lower provisions for credit losses ($455 million, down from $820 million), reduced net losses on investment securities and solid revenue growth.
All operating groups contributed to the $412 million or 5% increase in revenue. The Personal and Commercial Client Group continued to experience broadly based volume growth, while revenue in the Private Client Group rose on better market fundamentals and improved performance in direct and full-service investing and investment products. The Investment Banking Group’s results rose on stronger income trust origination and higher trading gains.
4 BMO Financial Group 186th Annual Report 2003
Delivering ethical leadership
by doing what’s best for people
and business
J. Blair MacAulay
Lead Director
Bank of Montreal
“Providing good governance and ethical leadership is not about any one thing; rather, it’s about ensuring that you have a comprehensive set of ethical principles, and the right team to make sure the business is run according to those principles. It means you must live up to a high and independently verifiable standard, taking nothing for granted.”
Those who lead set the example for the entire organization. At BMO Financial Group, we believe that good governance and ethical behaviour begin with our Board of Directors. It is the responsibility of the Board to ensure that each member of senior management is held accountable for his or her actions to our shareholders, customers and employees, and to the communities where we operate.
We hold our Board accountable to clear and verifiable standards. BMO has adopted a Charter of Expectations for our directors that sets out the specific responsibilities they must discharge, as well as the personal and professional attributes required of each director. To ensure accountability, the Board annually retains outside consultants to survey its effectiveness in all areas.
The Board also oversees an annual director “peer” performance review. The survey, which is conducted by an outside consultant to ensure confidentiality, requires that every director assess the contribution of each of his or her peers on measures ranging from ethics to strategic insight, financial literacy and business judgment. Comprehensive information regarding corporate governance and the role of the Board can be found in theNotice of Annual Meeting of Shareholders and Proxy Circular.
At BMO, we believe that good governance and high ethical standards must be matters of duty, care and concern for every person in our organization. We work hard to ensure that our ethical principles are living values, not abstract ideas.
To this end, all employees are provided with a framework for the conduct and ethical decision-making that are integral to their work.First Principlesis our comprehensive code of business conduct and ethics. Every director and employee is asked to read this document once a year — and sign a declaration attesting to that fact — to remind themselves of what’s expected and how to deal with the day-to-day ethical issues that arise in the workplace.
BMO Financial Group 186th Annual Report 20035
Delivering Ethical Leadership
First Principlesguides employees to ask themselves three questions before taking any course of action. Is it fair? Is it right? Is it legal? By keeping these questions front and centre in our decision-making, we ensure that honesty, integrity and well-defined ethical standards are the foundation of everything we do.
First Principles— our code of business
conduct and ethics
• Do what is fair, honest and ethical
• Respect the rights of others
• Work to the letter and spirit of the law
• Protect privacy and confidentiality
• Deal with conflicts of interest
• Conduct ourselves appropriately at all times
Accountability and disclosure
The senior management team of BMO Financial Group is personally accountable for the results we achieve and the manner in which we achieve them. Each quarter, senior executives meet with our CEO, Tony Comper, to attest that the reported results relating to their area of responsibility are true and accurate. This act of attestation cascades throughout the organization, as senior managers apply the same rigorous standards of accountability to all who report to them.
We are accountable to our regulators, shareholders, customers and employees. Because our common shares are also listed in the United States, we have put in place policies and procedures to meet the requirements of the Sarbanes-OxleyAct.
Our Chairman and CEO, Tony Comper, and our Chief Financial Officer, Karen Maidment, certify the accuracy and completeness of BMO’s financial disclosures to the Securities and Exchange Commission.
In addition toFirst Principles, we have a Code of Ethics for the Chief Executive Officer and Senior Financial Officers. We’ve also taken the extra step of appointing a governance officer whose responsibility is to oversee all issues relating to governance and ethical behaviour.
We believe that corporate reporting is about much more than compliance. It is the consistency of our efforts that builds momentum for our business, creates value for our customers and increases returns for our shareholders in a manner that earns trust.
Our employees
We endeavour to foster an equitable and supportive work environment for our employees. More than 20 years ago, we introduced our Annual Employee Survey. Every year we ask the 34,000 people who work for us to tell us how we’re doing. The responses, which are submitted anonymously, are rich with valuable feedback. This year the participation rate was over 75% — the highest ever. With this survey we have created the understanding that we will not only listen to our employees’ suggestions, we will also respond to them.
This year, for the first time, all employees were asked questions concerning our corporate values. The responses were very encouraging and have set an important benchmark for the future. Our efforts to articulate our corporate values and engage our workforce on issues like inclusiveness are led by the Chairman’s Council on the Equitable Workplace, which is in turn supported by BMO’s Diversity Advisory Councils and Affinity Groups.
These councils, of which there are eight in Canada and 16 in the United States, draw members from all levels of BMO. They perform a grassroots role by collecting and disseminating information, increasing awareness and providing advice to senior decision-makers. There are also numerous other groups across our organization that advocate for inclusion, address workplace issues and initiate change within their businesses. The groups include Aboriginal sharing circles, U.S. Affinity Groups offering mentoring and career support for African Americans, Asian Americans and Hispanics, networks of employees who are deaf, deafened or hard of hearing, and a transnational group of gay, lesbian, bisexual and transgendered employees.
BMO Financial Group has made solid progress toward our goal of developing an equitable, supportive and diverse workforce. In 1990, only 9% of BMO’s executives were women; the percentage has increased to 32.8% today. Visible minorities accounted for 12.5% of our workforce in 1991, while today they comprise 19.8%. In 1992, only 0.5% of employees were Aboriginal people, but that number has now grown to 1.3%. Similarly, people with disabilities made up 1.8% of BMO’s workforce in 1992, but now account for 3.0%. We are proud of this progress and, along with our strategy of attracting and retaining the most talented, high-performing employees, we will continue our efforts to ensure our workforce reflects the diversity of the communities in which we do business.
Executive Compensation
The compensation of our senior executives is tied directly to performance, particularly when it comes to stock options. Senior executives can exercise 33% of their options only when BMO’s share price has risen by 50% and another 34% only when the share price has risen by 100%. In this way, executives are rewarded only when all shareholders have recognized equally substantial gains.
6 BMO Financial Group 186th Annual Report 2003
Learning and development
We’re approaching the tenth anniversary of the opening of our Institute for Learning, BMO’s corporate university. Over the past decade, tens of thousands of employees have received professional training and development. The content of our programs emphasizes ethical behaviour and our corporate values, as well as practical sales and service, risk, information technology and managerial leadership skills. More than half a billion dollars has been spent in the past 10 years on employee development.
Our commitment to lifelong learning and our ability to link employee development to our strategic goals placed BMO 29th in U.S.-basedTrainingmagazine’s Top 100 North American corporations for 2003. For the second year in a row, we ranked ahead of all other Canadian corporations on the list.
Giving back to our communities
Trust is the foundation of our success. One of the most important ways we build trust is by developing strong relationships in the communities where we do business. We support our employees’ efforts as active participants in their communities — and they are very active on both sides of the border. In Canada, employees and pensioned employees have a foundation, BMO Fountain of Hope®, through which their volunteer efforts raise millions of dollars each year for charity. Because BMO covers all administration costs, 100% of the funds raised go directly to charities in communities across the country. In 2003, BMO Fountain of Hope raised $5.8 million.
BMO Financial Group takes its responsibility for good corporate citizenship very seriously, so along with supporting the extraordinary efforts of our employees, we are also highly involved in giving back to the communities we serve.
In the United States, Harris Bank has been involved with the Chicagoland community since 1882. The major focus of this involvement now is on supporting efforts to provide affordable housing for low and middle-income families. Our support for this and many other community initiatives takes the form of partnerships with local and nonprofit organizations, donations, sponsorships and community outreach.
In 2003, we contributed $36.1 million to support charities and nonprofit organizations. As one of the largest corporate donors in Canada, we contribute to large and small organizations active in areas ranging from education to health, arts and culture, to sports and athletics. Throughout, our focus is on learning. We believe this is the way to build strong communities and a secure future.
We also respond in times of need. Whether it’s supporting a major centre like Toronto in the aftermath of SARS, Western farmers affected by drought or communities ravaged by forest fires, BMO is there to lend a helping hand through donations and customer-assistance programs. Complete details and many examples of our commitment to communities in Canada can be found in our2003 Public Accountability Statement and online at www.bmo.com/community.
| | | |
| 2003 Awards | | Awarded by |
|
| Canada’s Top 100 Employers | | For the second year in a row, BMO Financial Group was named one of the Top 100 Employers in Canada byMaclean’smagazine and Mediacorp. Selected from among 51,000 companies, we were cited for our employee review process, our benefits and our ability to attract and retain employees. We were the only Canadian bank on the list. |
|
| Best 50 Corporate Citizens | | BMO Financial Group was recognized byCorporate Knightsas one of its Best 50 Corporate Citizens. BMO also received a Gold Medal for our human resources practices and a Silver Medal for our contributions to the community. |
|
| Ovation Award | | BMO’s Career Discovery intranet site was recognized for outstanding achievement in the area of employee communication by the International Association of Business Communicators. |
|
| Training Top 100 | | For the second consecutive year, U.S.-basedTrainingmagazine ranked BMO Financial Group as the top Canadian corporation in its Top 100 North American corporations for our dedication to learning and development. |
|
Canadian Human Rights Commission
Employment Equity Audit | | BMO was the first Canadian bank found to be in compliance with all 12 statutory requirements in phase one of the audit, with no undertakings ordered. |
|
BMO Financial Group 186th Annual Report 20037
Delivering personalized service and customized solutions to our clients at every
point of contact
BMO Financial Group is committed to providing highly personalized service and customized financial solutions. Whether customers access our services online, by phone, at an ABM or in person, our goal is to distinguish ourselves by how well we serve them. Every business day our network of knowledgeable and highly motivated employees works to bring this commitment to life. Our competitive strength lies in our commitment to service.
Responding to what our customers need
For our Canadian personal and commercial banking customers, we’ve undertaken initiatives to become the only bank they need. In 2003, we completed the rollout of our new sales and service technology platform. Pathway Connect helps us deliver better customer service by allowing staff fast access to relevant customer information. We’ve also launched detailed customer knowledge and decision support software that enables staff to anticipate our customers’ needs and deliver relevant personalized solutions regardless of access channel.
When it comes to delivering highly personalized financial service, Mosaik® MasterCard®2 is what it’s all about. With this credit card, customers can choose the reward program, the interest rate plan, the travel insurance options and even the card design they want. We believe that clients should have the opportunity to change their card’s features as their needs change without having to apply for a new card.
We have added 10 instore locations in Sobeys®3, Safeway®4 and A&PTM2 stores, bringing the total number of instore locations to 102. The personalized service, convenience and extended hours of our instore locations meet the needs of busy individuals and families. It’s a level of service that’s being noticed: more than 50% of those using our instore locations are new customers.
As our customers’ financial needs change and evolve, we’re working to match the right products and services to their needs. Since 2000, we’ve placed 580 financial planners in BMO Bank of Montreal branches to make it easier for our customers to reach informed decisions about their financial affairs. Providing knowledgeable professionals right in our branches is how we customize and personalize the delivery of the financial services that our customers need.
Providing a superior banking experience is about high-quality service delivered right where our customers are.
For our commercial banking customers, we’ve maintained our commitment to helping small business grow through good times and bad, in part by maintaining lending guidelines that are predictable. This reliability and consistency are important to our customers and have allowed us to double our market share within the past decade. We’re closing in on our goal of being number one in the market for loans up to $5 million.
Help provided in good times and bad
The year 2003 was a challenging one for many of our clients, as they experienced devastating fires and floods in British Columbia, “mad cow disease” (bovine spongiform encephalopathy) and drought in the Prairies, hurricane damage in the Maritimes and the economic fallout of SARS and the power blackout in Ontario. Through it all, we have provided special financial assistance programs for our customers.
8 BMO Financial Group 186th Annual Report 2003
William A. Downe
Deputy Chair, BMO Financial Group
and Chief Executive Officer, BMO Nesbitt Burns
“Each time we have contact with a customer it is an opportunity to demonstrate the best of BMO and Harris. Our staff are knowledgeable and incredibly motivated to deliver personal attention and relevant solutions. We want to be the financial resource that our clients can count on.”
Understanding community banking needs
In the United States, through Harris Bank, we’re delivering value — and it’s being recognized. The exceptional service delivered by our people in the Chicago Southeast Region prompted a number-one rating from our customers polled by a local newspaper for the third year in a row. Employees in our Harris Buffalo Grove call centre, on their own initiative, surveyed their collective language skills and now deliver service in 13 languages.
Our goal is to expand our existing branch network by 50 branches in the Chicagoland area, which has eight million people and a gross domestic product more than one third the size of Canada’s. This year we opened nine new branches, bringing the total to 153, and we will continue to aggressively pursue acquisitions and expansion. We’re growing so that we can offer our customers more choices, convenience and service.
Delivering solutions that fit
Our Private Client Group is focused on helping our clients protect and grow their financial resources. Regardless of how our wealth management clients want to do business — in person, online or both — we’re adding new products and services.
In Canada, for our direct investing clients we continue to add features such as the ability to conduct foreign exchange transactions online, as well as detailed information on options. This higher level of customer service was recognized as bothThe Globe and Mailand Gómez Canada again ranked BMO InvestorLine as the number-one online investing service, noting specifically the breadth of our investment tools and services. Through BMO Harris Private Banking, we have augmented our offering of financial planning, investment management and estate services with philanthropic planning for wealthy families and individuals.
In the United States, we have added to our well-established Harris Private Bank with the acquisition of Washington, D.C.’s Sullivan, Bruyette, Speros & Blayney. Additionally, through myCFO donor advised funds, we are able to offer a convenient vehicle for philanthropic giving.
Learning by listening
The best way to improve our service is by listening to our customers. We redesigned our web sites this year to make it easier to do business with us. Most of the improvements were in response to feedback from our customers. We believe in adjusting to our customers’ behaviour and needs, rather than expecting them to adjust to ours. We also believe in asking our clients to tell us how we’re doing. A recent survey of BMO Nesbitt Burns clients indicated very high levels of client satisfaction and highlighted additional ways we can provide even better service.
Innovative thinking works
Our Investment Banking Group serves corporate, institutional and government clients. In Canada, operating under the BMO Nesbitt Burns brand, our client base is large corporations and institutions across a broad range of industry sectors. In the United States, under the Harris Nesbitt brand, we serve middle-market and institutional clients in selected sectors. We also serve institutional and government clients in the United Kingdom, Europe and Asia.
Our commitment to service begins with knowing what our clients need and understanding intimately the business sectors in which they operate. The research we provide to our clients is widely recognized as the best. For the 23rd year in a row, Brendan Wood International has given our Canadian equity research a number-one ranking. This research helps our clients understand their options and opportunities.
In the United States, we are focused on serving middle-market public and private companies. In 2003, we acquired New York-based Gerard Klauer Mattison, now operating as Harris Nesbitt Gerard. As a result, we expanded our U.S. middle-market client base in sectors such as Business Services, Consumer, Media and Entertainment, Technology and Telecom, and Health Care. We also expanded our U.S. product offering to clients to include equity sales and trading and tripled our research coverage of U.S.-based companies to 300 from 100 companies. The acquisition of Gerard Klauer Mattison adds key products and services for investment and corporate banking clients.
Whether our customers are large, small, individual or corporate, our goal is to provide the best personalized service and customized financial solutions possible, and we’re doing it through a team of highly motivated and knowledgeable financial professionals.
BMO Financial Group 186th Annual Report 20039
FINANCIAL PERFORMANCE AND CONDITION AT A GLANCE
| | | | | |
| Our Performance* | | | | Peer Group Comparison* |
| | | | | |
| Total Shareholder Return (TSR) | |  | | Five-Year Total Shareholder
Return (TSR)(%) |
• BMO’s average five-year TSR of 12.9% improved from 7.9% a year ago and was better than the TSX and S&P Composite Indices and in line with the TSX Financial Services Index.
| | | • BMO’s average five-year TSR of 12.9% was above the North American peer group average of 9.6% but below the Canadian peer group average of 16.3%. |
• BMO’s 33.4% one-year TSR was better than the TSX and S&P Indices, but was slightly below the TSX Financial Services Index, which we outperformed by 18 percentage points in 2002. | | | • More recent relative performance is better, as BMO’s average two-year TSR and three-year TSR were both third best of the six-bank Canadian peer group. |
| | | | | |
| Further details are provided on page 15. | | | | |
| | | | | |
| Earnings per Share (EPS) Growth | |  | | Earnings per Share (EPS) Growth (%) |
• EPS rose 28% to a record $3.44 after growing 1% a year ago. Growth was driven by a lower provision for credit losses, business growth in all operating groups and lower net losses on investment securities. | | | • BMO’s EPS growth of 28.4% in 2003 was above the 17-bank North American peer group average of 14.0% but below the Canadian peer group average of 64.9%. |
• EPS growth of 28% exceeded our 2003 target of 10% to 15% growth. | | | • The Canadian peer group average growth rate was unusually high, as some members of our peer group had weak earnings in 2002. |
| Further details are provided on page 16. | | | | |
| | | | | |
| Return on Equity (ROE) | |  | | Return on Equity (ROE)(%) |
• ROE was 16.4%, up from 13.4% in 2002, and above our 2003 target of 14% to 15%.
• BMO has generated ROE of more than 13% in each of the past 14 years, and is the only major North American bank to meet this test of earnings consistency. | | | • ROE of 16.4% in 2003 was above the Canadian peer group average of 15.8% and equal to the North American peer group average. |
| | | | | |
| Further details are provided on page 17. | | | | |
| | | | | |
| Net Economic Profit (NEP) Growth | |  | | Net Economic Profit (NEP)
Growth(%) |
• NEP, a measure of economic value added, rose 92% to $703 million, after declining in 2002. | | | • NEP growth of 92% in 2003 was above the North American peer group average of 45% but below the Canadian peer group average. |
• Personal and Commercial Client Group accounted for approximately three-quarters of our NEP. Investment Banking Group accounted for approximately 50% of NEP growth. | | | • The Canadian peer group average growth rate was almost 3,000% because two members of the peer group had net economic losses in 2002. |
| | | | |
| | | | | |
| Further details are provided on page 17. | | | | |
| | | | | |
| Revenue Growth | |  | | Revenue Growth(%) |
• Revenue increased $412 million or 5% in 2003 and improved in each of our client operating groups. | | | • Revenue growth of 4.7% in 2003 was above the Canadian peer group average of 1.2% and the North American peer group average of negative 1.9%. |
• The weaker U.S. dollar lowered revenue growth in 2003 by 3 percentage points, while the incremental effect of acquired businesses increased revenue growth by 1.4 percentage points. | | | • BMO’s revenue growth was above the Canadian peer group average for the first time since 1995. |
| | | | |
| | | | | |
| Further details are provided on page 22. | | | | |
| | | | | |
Expense-to-Revenue Ratio(a)
(or Productivity Ratio) | |  | | Expense-to-Revenue Ratio(%) |
• The productivity ratio improved 240 basis points to 65.7%in 2003. | | | • BMO’s productivity ratio of 65.7% was better than the Canadian peer group average of 67.3% but above the North American peer group average of 60.0%. |
• Each of our client operating groups improved their cash productivity ratios by more than 150 basis points and increased revenues more than expenses, in both absolute and percentage terms. | | | • Improving productivity was BMO’s top priority in 2003. |
| | | | |
| | | | | |
| Further details are provided on page 25. | | | | |
| * | | Adjustments to GAAP results to derive cash and other non-GAAP results and measures, including adjusting revenue to a taxable equivalent basis (teb), are outlined on page 20. |
| (a) | | For consistency with our peer groups, the non-interest expense-to-revenue ratios for BMO and the peer groups reflected in the graphs for 1999 to 2001 include goodwill amortization. |

See page 12 for further comments on peer group comparisons.
10 BMO FINANCIAL GROUP 186TH ANNUAL REPORT 2003
| | | | | |
| Our Performance | | | | Peer Group Comparison |
| | | | | |
| Credit Risk | |  | | Provision for Credit Losses as a % of Average Net Loans and Acceptances |
• The provision for credit losses was $455 million or 30 basis points of average net loans and acceptances, down from $820 million or 56 basis points in 2002. | | | • BMO’s provision for credit losses of 0.30% of average net loans and acceptances was better than the Canadian peer group average of 0.39% and the North American peer group average of 0.95%. |
• The provision in 2003 was significantly lower than our 2003 target provision of $820 million or less. | | | • BMO’s credit loss experience remains top-tier. |
| | | | | |
| Further details are provided on pages 24 and 47. | | | | |
| | | | | |
| Impaired Loans | |  | | Gross Impaired Loans and Acceptances as a % of Equity and Allowances for Credit Losses |
• Gross impaired loans and acceptances were $1,918 million, compared with $2,337 million in 2002, and represented 12.2% of equity and allowances for credit losses, versus 15.2% a year ago. | | | • BMO’s ratio was higher than the Canadian peer group average of 11.4% and the North American peer group average of 7.6%. |
• Impaired loans and acceptances formations were $1,303 million, down from $1,945 million in 2002. | | | |
| | | | | |
| Further details are provided on page 24 and 47. | | | | |
| | | | | |
Cash and Securities-to-Total Assets
| |  | | Cash and Securities-to-Total Assets(%) |
• The cash and securities-to-total assets ratio increased to 29.1% from 24.9% in 2002 due to higher trading securities positions.
• Liquidity remains sound and continues to be supported by broad diversification of deposits. | | | • BMO’s ratio of 29.1% was below the Canadian peer group average of 31.4% and the North American peer group average of 38.2%.
• Our ratio remains higher than our minimum target ratio. |
| | | | |
| Further details are provided on page 50. | | | | |
| | | | | |
| Capital Adequacy | |  | | Tier 1 Capital Ratio(%) |
• The Tier 1 Capital Ratio was 9.55%, up from 8.80% last year. | | | • Our Tier 1 Capital Ratio of 9.55% was below the Canadian peer group average of 10.20% but above our minimum target of 8%. |
• The Total Capital Ratio was 12.09%, down from 12.23% in 2002, as we chose to redeem two subordinated debt issues to optimize our capital level.
| | | • On a U.S. basis, our Tier 1 Capital Ratio was 9.17%, above the North American peer group average of 8.75%. |
| Further details are provided on page 43. | | | | |
| | | | | |
| Credit Rating(Standard & Poor’s) | |  | | Credit Rating |
• Our credit rating, as measured by Standard & Poor’s®5 (S&P) senior debt ratings, remained at AA-, the best of Canada’s major banks, together with one of our competitors. | | | • BMO’s credit rating of AA-, as measured by S&P’s senior debt ratings, was better than the Canadian peer group average and the North American peer group average of A+. |
• S&P upgraded its ratings outlook on BMO to stable from negative in the fourth quarter of 2003. | | | |
| | | | | |
| Further details are provided on page 43. | | | | |
| | | | | |
| Credit Rating(Moody’s) | |  | | Credit Rating |
• Our credit rating, as measured by Moody’s®6 senior debt ratings, remained at Aa3, slightly below the highest-rated Canadian bank and consistent with the highest of the remaining major Canadian banks. | | | • BMO’s credit rating of Aa3, as measured by Moody’s senior debt ratings, was comparable to the Canadian and North American peer group averages. |
• Moody’s upgraded its ratings outlook on BMO to stable from negative in the second quarter of 2003. | | | |
| | | | | |
| Further details are provided on page 43. | | | | |
See page 12 for further comments on peer group comparisons.
BMO FINANCIAL GROUP 186TH ANNUAL REPORT 2003 11
CANADIAN AND NORTH AMERICAN PEER GROUP COMPARISONS
| | | | | | | | | | | | | | | | | | | | | | | | | | | | | | | | | | | | | | | | | | | | | | | | | | | | | | | | | | | | | | |
| | | | 2003 | | 2002* | | Five-Year Average |
| | | |
| |
| |
|
| | | | | | | | | | | | Cdn. | | N.A. | | N.A. | | | | | | | | | | Cdn. | | N.A. | | N.A. | | | | | | | | | | Cdn. | | N.A. | | N.A. |
| | | | BMO | | Rank | | bank | | bank | | bank | | BMO | | Rank | | bank | | bank | | bank | | BMO | | Rank | | bank | | bank | | bank |
| | | | perf. | | of six | | avg. | | avg. | | q’tile | | perf. | | of six | | avg. | | avg. | | q’tile | | perf. | | of six | | avg. | | avg. | | q’tile |
| | | |
| |
| |
| |
| |
| |
| |
| |
| |
| |
| |
| |
| |
| |
| |
|
Financial Performance Measures(%) | | | | | | | | | | | | | | | | | | | | | | | | | | | | | | | | | | | | | | | | | | | | | | | | | | | | | | | | | | | | |
| Five-year total shareholder return (TSR) | | | 12.9 | | | | 6 | | | | 16.3 | | | | 9.6 | | | | 2 | | | | 7.9 | | | | 4 | | | | 8.2 | | | | 3.3 | | | | 1 | | | | 12.9 | | | | 6 | | | | 16.3 | | | | 9.6 | | | | 2 | |
| Diluted earnings per share (EPS) growth | | | 28.4 | | | | 5 | | | | 64.9 | | | | 14.0 | | | | 2 | | | | 0.8 | | | | 2 | | | | (29.6 | ) | | | 18.2 | | | | 3 | | | | 10.4 | | | | 6 | | | | 14.3 | | | | 8.8 | | | | 4 | |
| Return on common shareholders’ equity (ROE) | | | 16.4 | | | | 5 | | | | 15.8 | | | | 16.4 | | | | 3 | | | | 13.4 | | | | 2 | | | | 9.9 | | | | 14.1 | | | | 3 | | | | 15.1 | | | | 3 | | | | 15.1 | | | | 15.9 | | | | 3 | |
| Net economic profit (NEP) growth | | | 91.8 | | | | 3 | | | | 2,997.0 | | | | 45.0 | | | | 2 | | | | (15.2 | ) | | | 2 | | | | (97.0 | ) | | | 24.5 | | | | 3 | | | | 21.9 | | | | 5 | | | | 593.2 | | | | 17.5 | | | | 3 | |
| Revenue growth | | | 4.7 | | | | 3 | | | | 1.2 | | | | (1.9 | ) | | | 3 | | | | — | | | | 3 | | | | 0.8 | | | | 6.5 | | | | 3 | | | | 5.0 | | | | 6 | | | | 7.5 | | | | 7.4 | | | | 3 | |
| Expense-to-revenue ratio | | | 65.7 | | | | 3 | | | | 67.3 | | | | 60.0 | | | | 3 | | | | 68.1 | | | | 4 | | | | 68.6 | | | | 59.9 | | | | 4 | | | | 65.4 | | | | 3 | | | | 66.6 | | | | 62.3 | | | | 3 | |
| Provision for credit losses as a % of average net loans and acceptances | | | 0.30 | | | | 2 | | | | 0.39 | | | | 0.95 | | | | 1 | | | | 0.56 | | | | 2 | | | | 0.96 | | | | 1.42 | | | | 1 | | | | 0.40 | | | | 1 | | | | 0.55 | | | | 1.00 | | | | 1 | |
| | | | | | | | |
Financial Condition Measures(%) | | | | | | | | | | | | | | | | | | | | | | | | | | | | | | | | | | | | | | | | | | | | | | | | | | | | | | | | | | | | |
| Gross impaired loans and acceptances as a % of equity and allowance for credit losses | | | 12.2 | | | | 5 | | | | 11.4 | | | | 7.6 | | | | 4 | | | | 15.2 | | | | 4 | | | | 14.6 | | | | 10.0 | | | | 4 | | | | 12.1 | | | | 3 | | | | 13.7 | | | | 8.4 | | | | 4 | |
| Cash and securities-to-total assets | | | 29.1 | | | | 6 | | | | 31.4 | | | | 38.2 | | | | 3 | | | | 24.9 | | | | 6 | | | | 28.7 | | | | 38.2 | | | | 4 | | | | 26.8 | | | | 5 | | | | 29.0 | | | | 37.0 | | | | 3 | |
| Tier 1 Capital Ratio | | | 9.55 | | | | 6 | | | | 10.20 | | | | 8.75 | | | | 1 | | | | 8.80 | | | | 4 | | | | 9.07 | | | | 8.50 | | | | 2 | | | | 8.61 | | | | 6 | | | | 8.96 | | | | 8.26 | | | | 2 | |
| Credit rating | | | | | | | | | | | | | | | | | | | | | | | | | | | | | | | | | | | | | | | | | | | | | | | | | | | | | | | | | | | | |
| | Standard & Poor’s | | AA– | | | 1 | | | | A+ | | | | A+ | | | | 1 | | | AA– | | | 1 | | | AA– | | | A+ | | | | 1 | | | AA– | | | 1 | | | AA– | | | A+ | | | | 1 | |
| | Moody’s | | Aa3 | | | 2 | | | | Aa3 | | | | Aa3 | | | | 2 | | | Aa3 | | | 2 | | | Aa3 | | Aa3 | | | 2 | | | Aa3 | | | 2 | | | Aa3 | | Aa3 | | | 2 | |
The Canadian bank peer group average is based on the performance of Canada’s six largest banks: BMO Financial Group, Canadian Imperial Bank of Commerce, National Bank of Canada, RBC Financial Group, Scotiabank and TD Bank Financial Group. The North American bank peer group average is based on the performance of North America’s 17 largest banks, consisting of all banks in North America having shareholders’ equity that is at least 75% as large as BMO’s. It includes the Canadian peer group, except National Bank of Canada, as well as Bank of America Corporation, Bank One Corporation, Citigroup, FleetBoston Financial Corporation, J.P. Morgan Chase & Co., KeyCorp, National City Corporation, The PNC Financial Services Group Inc., SunTrust Banks Inc., U.S. Bancorp, Wachovia Corporation, and Wells Fargo & Company.
Results are as at or for the years ended October 31 for Canadian banks and as at or for the years ended September 30 for U.S. banks, as appropriate.
For consistency with our peer groups, the non-interest expense-to-revenue ratios include amortization of goodwill for all banks for years prior to 2002 in the calculation of the five-year average.
* In the 2002 MD&A, performance data was based on results excluding non-recurring items. See page 20.
Canadian Peer Group Comparison
BMO’s absolute performance in 2003 was appreciably better than in 2002 on all 11 of our primary financial performance and condition measures. Our 2003 performance was better than our five-year average on 7 of 11 measures and our five-year average performance improved on 8 of 11 measures relative to the five-year average in 2002.
In 2003, our performance was above the Canadian peer group average on four of seven financial performance measures, compared with above average performance on five measures in 2002.
Notwithstanding our improved results in 2003, our rankings in the Canadian peer group deteriorated from the relatively strong rankings of a year ago. In 2002, two of our five peers experienced sharp declines in EPS while another two experienced declines of more than 18%. BMO’s EPS increased modestly in 2002 in the difficult operating environment. Our reasonably strong operating results in fiscal 2002 and the relatively weak results of some of our peers that year have affected our rankings and performance relative to the peer group averages in 2003 in certain of the growth-related performance measures.
Improving productivity was BMO’s top priority for 2003. Our expense-to-revenue ratio improved by 240 bps and our ranking climbed from fourth to third among Canadian banks. BMO’s cash productivity ratio (see page 20) improved 260 bps in 2003 to 64.5%, rising from fifth best to second best of Canada’s major banks. In 2004, we are targeting a further 150 to 200 bps improvement in cash productivity.
BMO’s provision for credit losses represented 30 bps of average net loans and acceptances, the second best of Canada’s banks. The top-ranked bank in 2003 recorded a provision representing 183 bps of average net loans and acceptances a year ago, compared with BMO’s 56 bps charge in 2002.
Our ranking declined on three of the four financial condition measures and was also below average on three of four. However, our Tier 1 Capital Ratio and cash and securities-to-total assets ratio are both above our minimum targets.
BMO’s gross impaired loans and acceptances as a percentage of equity and allowance for credit losses improved by 3 percentage points from 2002 to 12.2%, but our ranking slipped to fifth among Canadian banks. The ratio can be affected by the speed with which companies designate loans as impaired, the level of losses companies experience on their impaired loans and the timing of write-offs. BMO’s credit experience, as measured by required provisions for credit losses, remains top-tier in Canada and North America.
North American Peer Group Comparison
Our rankings in the North American peer group were better in 2003 than a year ago. Our quartile ranking improved on three of the financial performance measures, declined on one and was unchanged on the remaining three. Our performance was better than average on five of the measures in 2003 and was average on another. In 2002, our performance was better than average on two of the seven measures.
BMO’s quartile ranking improved on two of the financial condition measures and was unchanged on the remaining two. Our performance was above average on three of four measures in 2003, consistent with 2002.
12 BMO FINANCIAL GROUP 186TH ANNUAL REPORT 2003
MANAGEMENT’S DISCUSSION AND ANALYSIS OF OPERATIONS AND FINANCIAL CONDITION
BMO’s Chairman and Chief Executive Officer and Chief Financial Officer have signed a statement outlining management’s responsibility for financial information in this Annual Report. The statement, which can be found on page 69, also explains the roles of the Audit Committee and Board of Directors in respect of financial information in the Annual Report.
Management’s Discussion and Analysis of Operations and Financial Condition (MD&A) comments on BMO’s operations and financial condition for the years ended October 31, 2003 and 2002. The commentary is as of November 25, 2003, except for peer group comparisons, which are as of December 4, 2003.
| | | | | |
| Index |
|
|
|
|
|
|
|
10 | Financial Performance and Condition at a Glance | | | Financial Performance Review |
13 | Index | | 20 | Enterprise-Wide Review |
13 | Caution Regarding Forward-Looking Statements | | | Operating Group Review |
14 | Financial Objectives, Targets and Measures | | 27 | Summary |
| | 28 | Personal and Commercial Client Group |
| | Value Measures | | 33 | Private Client Group |
15 | Total Shareholder Return | | 36 | Investment Banking Group |
16 | Earnings per Share Growth | | 40 | Corporate Support, including Technology and Solutions |
17 | Return on Equity | | | |
17 | Net Economic Profit Growth | | | Financial Condition Review |
| | 41 | Balance Sheet |
18 | Enterprise-Wide Strategic Management | | 42 | Off-Balance Sheet Arrangements |
19 | Economic and Financial Services Developments | | | |
| | | | 43 | Enterprise-Wide Capital Management |
| | | | 44 | Critical Accounting Policies |
| | | | 45 | Enterprise-Wide Risk Management |
| | | | 53 | Review of 2002 Financial Performance |
| | | | 54 | Supplemental Information |
Caution Regarding Forward-Looking Statements
Bank of Montreal’s public communications often include written or oral forward-looking statements. Statements of this type are included in this Annual Report, and may be included in filings with Canadian securities regulators or the U.S. Securities and Exchange Commission, or in other communications. All such statements are made pursuant to the “safe harbor” provisions of the United States Private Securities Litigation Reform Act of 1995. Forward-looking statements may involve, but are not limited to, comments with respect to our objectives for 2004 and beyond, our strategies or future actions, our targets, expectations for our financial condition or share price, and the results of or outlook for our operations or for the Canadian and U.S. economies.
By their nature, forward-looking statements require us to make assumptions and are subject to inherent risks and uncertainties. There is significant risk that predictions and other forward-looking statements will not prove to be accurate. We caution readers of this document not to place undue reliance on our forward-looking statements as a number of factors could cause actual future results, conditions, actions or events to differ materially from the targets, expectations, estimates or intentions expressed in the forward-looking statements.
The future outcomes that relate to forward-looking statements may be influenced by many factors, including but not limited to: global capital market activities; interest rate and currency value fluctuations; the effects of war or terrorist activities; the effects of disease or illness that impact on local, national or international economies; the effects of disruptions to public infrastructure, such as transportation, communications, power or water supply disruptions; industry and worldwide economic and political conditions; regulatory and statutory developments; the effects of competition in the geographic and business areas in which we operate; management actions; and technological changes. We caution that the foregoing list of factors is not exhaustive and that when relying on forward-looking statements to make decisions with respect to Bank of Montreal, investors and others should carefully consider these factors, as well as other uncertainties and potential events, and the inherent uncertainty of forward-looking statements. Bank of Montreal does not undertake to update any forward-looking statement, whether written or oral, that may be made, from time to time, by the organization or on its behalf.
BMO FINANCIAL GROUP 186TH ANNUAL REPORT 2003 13
Management’s Discussion and Analysis of Operations and Financial Condition
FINANCIAL OBJECTIVES, TARGETS AND MEASURES
Governing Objective
To maximize the total return to BMO shareholders and generate, over time, first-quartile total shareholder return relative to our Canadian and North American peer groups.
Medium-Term Financial Performance and Condition Objectives
To grow EPS by a minimum of 10% per year over time; to increase ROE to between 18% and 19% over time; and to maintain a strong regulatory capital position, consistent with our peers.
| | | | | | | |
| 2003 Financial Targets | | 2003 Financial Performance | | Target Met | | 2004 Financial Targets |
| |
| |
| |
|
• 10% to 15% EPS1,2 growth | | • EPS2 growth of 28.4% | | ü | | • 10% to 15% EPS growth |
• ROE of 14% to 15% | | • ROE of 16.4% | | ü | | • ROE of 16% to 18% |
• Provision for credit losses of $820 million or less | | • Provision for credit losses of $455 million | | ü | | • Provision for credit losses of $500 million or less |
• Tier 1 Capital Ratio of at least 8% | | • Tier 1 Capital Ratio of 9.55% | | ü | | • Tier 1 Capital Ratio of at least 8% |
• Improve cash productivity ratio of each operating group by 150 to 200 bps2,3 | | • All groups improved more than 150 bps and BMO improved2260 bps | | ü | | • Improve cash productivity ratio by 150 bps to 200 bps |
| (1) | | All EPS figures in this MD&A refer to diluted EPS, unless indicated otherwise. |
| (2) | | In 2002, we followed a practice of reporting results and establishing targets on a basis excluding amounts categorized as non-recurring. We discontinued this practice in 2003, as explained on page 20. BMO’s EPS in 2002 was $2.68 but, excluding $62 million ($39 million after tax) of acquisition-related costs that were designated as non-recurring items in 2002, EPS was $2.76. Our 2003 EPS growth target was set in relation to EPS of $2.76 in 2002. EPS of $3.44 in 2003 increased 24.6% from 2002 EPS of $2.76, excluding non-recurring items. Excluding the impact of the acquisition-related costs in 2002, BMO’s cash productivity ratio of 64.5% in 2003 improved by 190 bps and the ratio of each operating group improved by more than 150 bps. |
| (3) | | Improved cash productivity ratio was not originally designated as a 2003 financial target. It was added as a priority focus in the first quarter of 2003. It is a non-GAAP measure and is explained on page 20. |
Financial Performance Objectives, Targets and Measures
BMO has established an overall governing objective and medium-term financial performance and condition objectives, which are outlined at the top of the page. BMO also establishes annual financial targets for certain of our performance and condition measures, which are outlined in the table above. Our success in achieving our overall governing objective of first-quartile total shareholder return is dependent on achieving our minimum medium-term financial performance and condition objectives, and on the relative performance of our peer group.
Because annual financial targets represent checkpoints in the achievement of our medium-term financial objectives, they reflect economic conditions prevailing at the time and may be higher or lower than the medium-term financial objectives in any particular year.
Our operating philosophy is to increase revenues at higher rates than general economic growth rates, while limiting expense growth rates to equal to or less than revenue growth rates, over time. We strive for efficiencies in expense management and a balance between current profitability and the need to invest for future growth. When possible, expense efficiencies partially or totally fund the costs of investing for the future. However, the relationship between revenues and expenses in any year is affected by economic conditions.
Our targets for 2004 were established in the context of our expectations for the economy in the year ahead, as detailed on page 19.
Much of the performance analysis in the MD&A occurs in the context of the primary measures BMO management uses to assess performance. The 11 primary measures are outlined in the Financial Performance and Condition at a Glance section on pages 10 and 11. Four of these measures are categorized as our value measures: Total Shareholder Return, Earnings per Share Growth, Return on Equity and Net Economic Profit Growth. These value measures, which are reviewed on pages 15 to 17, are those that measure shareholder return or most directly influence shareholder return.
The remaining seven primary measures are reviewed in the Financial Performance Review, starting on page 20, and in the Financial Condition Review, starting on page 41, and form the basis of our review of the consolidated financial statements. Pages 20 and 21 of the Financial Performance Review discuss non-GAAP measures, foreign exchange and acquired businesses, which are important factors influencing much of the results discussion in the MD&A.
Achievement of Targets in Prior Years
In 2002, we achieved three of our four financial targets; the provision for credit losses was higher than our target because of the difficult credit environment. In 2001, economic conditions were worse than anticipated when performance targets for the year were established. In 2001, we achieved three of our nine financial targets, as expense growth outstripped revenue growth and provisions for credit losses increased significantly.
14 BMO FINANCIAL GROUP 186TH ANNUAL REPORT 2003
Management’s Discussion and Analysis of Operations and Financial Condition
VALUE MEASURES
| | | | | | | |
| Highlights | | | | |
| • | | BMO investors have earned an average annual return of 12.9% over the past five years and earned 33.4% in 2003. | | • | | BMO is the only major bank in North America to earn an ROE of more than 13% for 14 consecutive years. |
| • | | We surpassed all our performance targets in 2003. | | • | | ROE of 16.4% rose from 13.4% in 2002. |
| • | | EPS increased 28% from a year ago. | | • | | The stated quarterly dividend rate increased 16.7% from a year ago. |
Total Shareholder Return
BMO’s governing objective is to maximize the total return to shareholders and generate, over time, first-quartile total shareholder return (TSR) relative to our Canadian and North American peer groups.
The five-year average annual TSR is a primary measure of shareholder value and is the most important of our financial performance and condition measures since it assesses our success in achieving our governing objective of maximizing return to shareholders. Over the past five years, shareholders have earned an average annual TSR of 12.9% on their investment in BMO’s common shares. This compares favourably with an average annual return for the TSX Composite Total Return Index of 6.3% over the same period and was in line with the return for the TSX Financial Services Total Return Index. Dividends paid over the period and appreciation in BMO’s share price are outlined in the table below. An investment of $1,000 in Bank of Montreal common shares at the beginning of fiscal 1999 would have been worth $1,832 at October 31, 2003, assuming reinvestment of dividends, for a total return of 83%. Dividends declared over the five years have increased at an average annual rate of 8.8%. In 2003, the stated quarterly dividend was raised twice, increasing 16.7% from the fourth quarter of 2002.
The average annual TSR of 12.9% for this most recent five-year period was up appreciably from the 7.9% average annual return for the five years ended October 31, 2002. The averages are affected by the yearly TSRs included in the calculations. The improvement reflected the removal of the 6.4% yearly return earned in 1998 from the averaging calculation and its replacement with the 33.4% return earned this year.
The 33.4% TSR earned in fiscal 2003 compared favourably with the 26.8% return of the TSX Composite Total Return Index. Our one-year TSR was slightly below the TSX Financial Services Total Return Index, but BMO common shares had outperformed that index by 18.3 percentage points in 2002.
Pages 10 and 12 provide further comment on shareholder return and include peer group comparisons.
Thefive-year average annual total shareholder return (TSR)represents the average annual total return earned on an investment in BMO common shares made at the beginning of a five-year period. The return includes the change in share price and assumes that dividends received were reinvested in additional common shares. The one-year TSR also assumes that dividends were reinvested in shares.
Total Shareholder Return
| | | | | | | | | | | | | | | | | | | | | | | | | |
| For the year ended October 31 | | 2003 | | 2002 | | 2001 | | 2000 | | 1999 | | 1998 |
| |
| |
| |
| |
| |
| |
|
| Closing market price per common share ($) | | | 49.33 | | | | 38.10 | | | | 33.86 | | | | 35.25 | | | | 28.33 | | | | 31.55 | |
| Dividends paid per common share ($) | | | 1.29 | | | | 1.18 | | | | 1.09 | | | | 0.99 | | | | 0.93 | | | | 0.88 | |
| Dividends paid (%) | | | 3.4 | | | | 3.5 | | | | 3.1 | | | | 3.5 | | | | 2.9 | | | | 2.9 | |
| Increase (decrease) in share price (%) | | | 29.5 | | | | 12.5 | | | | (3.9 | ) | | | 24.4 | | | | (11.4 | ) | | | 3.7 | |
| Total annual shareholder return (%) | | | 33.4 | | | | 16.2 | | | | (1.2 | ) | | | 29.0 | | | | (7.4 | ) | | | 6.4 | |
Total annual shareholder return assumes reinvestment of quarterly dividends and therefore does not equal the sum of dividend and share price returns in the table.
BMO FINANCIAL GROUP 186TH ANNUAL REPORT 2003 15
Management’s Discussion and Analysis of Operations and Financial Condition
Earnings per Share Growth
The year-over-year percentage change in earnings per share (EPS) is our primary measure for analyzing earnings growth. All references to EPS are to diluted EPS.
EPS was a record $3.44, up 28% from $2.68 in 2002. Cash EPS was $3.59, up 27% from $2.83 a year ago. EPS growth exceeded our annual target of 10% to 15% growth from a base of $2.76, which represented our 2002 EPS excluding non-recurring acquisition-related costs. EPS in 2003 grew 25% from the $2.76 base. In 2004, we are again targeting EPS growth of 10% to 15%. This target was set in the context of our economic outlook for 2004, which is outlined on page 19.
Our five-year compound average annual EPS growth rate was 8.5%, below our medium-term financial performance objective of 10%, as EPS increased from $2.29 in 1998 to $3.44 in 2003. If we achieve our minimum target of 10% EPS growth in 2004, our five-year compound average annual growth rate will be 10.1% at the end of 2004.
Net income was $1,825 million, up 29% from $1,417 million a year ago. The $408 million increase in net income and $0.76 increase in EPS were driven by lower provisions for credit losses ($253 million or $0.50 per share), higher business growth in our operating groups ($170 million or $0.34 per share) and lower net losses on investment securities ($73 million or $0.14 per share). These increases were partially offset by a higher effective tax rate (–$88 million or –$0.17 per share) and the effects of an increase in our average number of diluted common shares outstanding (–$0.05 per share). Table 2 on page 54 details net income and EPS for the past 10 years.
The business growth figures above exclude the impact of lower net investment securities losses and lower provisions for credit losses. Results of our client operating groups are substantially unaffected by changes in provisions for credit losses, since we follow an expected loss methodology in allocating annual provisions for credit losses to our client operating groups, charging or crediting the differences between the expected provisions and required provisions under GAAP to Corporate Support, as explained on page 40.
Revenue on a taxable equivalent basis, which is explained on pages 20 and 22, increased $412 million or 5% to $9,271 million. Our three client operating groups each had revenue growth of more than 4%. Personal and Commercial Client Group revenue growth was substantially attributable to higher volumes, particularly in the personal banking segment. Private Client Group revenue growth was primarily attributable to improving market fundamentals that boosted client trading activity and the market value of managed assets. Investment Banking Group benefited from lower net investment securities losses and higher equity origination fees and trading revenue. Corporate Support revenue declined, largely due to lower securitization revenues. Revenue growth is discussed on page 22.
The provision for credit losses fell $365 million to $455 million due to improved credit performance experienced over the year. The provision for credit losses is discussed on page 24.
Non-interest expenses increased $57 million or 1% to $6,087 million. There were a number of factors that increased or lowered expenses in 2003, but the net increase was primarily attributable to higher employee compensation costs due to higher performance-based compensation and higher pension costs. Non-interest expenses are discussed on page 25.
Pages 10 and 12 provide further comment on EPS growth and include peer group comparisons.
Earnings per share (EPS)is calculated by dividing net income, after deduction of preferred dividends, by the average number of common shares outstanding. Diluted EPS, which is our basis for measuring performance, adjusts for possible conversions of financial instruments into common shares if those conversions would lower EPS, and is more fully explained in Note 21 on page 96 of the financial statements.
Changes in Accounting Policies
Stock Options
As explained in Note 19 on page 93, on November 1, 2002 we changed our accounting policy for stock options granted on or after that date. Under the new policy, the fair value of stock options is expensed over their vesting period. The change resulted in a decrease in net income of $3 million.
Derivatives
As explained in Note 9 on page 82, new accounting requirements for derivatives were adopted on November 1, 2002. Under the new policy, we are required to mark all derivative positions to market unless they meet certain hedging criteria. The change did not have a material impact on our results, as we had complied with the equivalent accounting requirements when they were implemented under United States GAAP on November 1, 2000.
Foreclosed Assets
As explained in Note 4 on page 76, on May 1, 2003 we adopted new accounting requirements for property or other assets received from borrowers to satisfy their loan commitments. Under the new policy, property or other assets received from borrowers to satisfy their loan commitments is recorded at fair value. The change did not have a material impact on our consolidated financial statements.
Variable Interest Entities
(formerly Off-Balance Sheet Special Purpose Entities)
As explained in Note 8 on page 81, we will adopt new accounting requirements on the consolidation of variable interest entities (VIEs) on November 1, 2004. We are currently analyzing the potential impact these new requirements may have on our consolidated financial statements in fiscal 2005.
16 BMO FINANCIAL GROUP 186TH ANNUAL REPORT 2003
Management’s Discussion and Analysis of Operations and Financial Condition
Return on Equity
Return on equity (ROE) is another of our primary value measures. We achieved an ROE of 16.4% in 2003, up from 13.4% in 2002. BMO has now generated an ROE of more than 13% in each of the past 14 years, and is the only major North American bank to meet this test of earnings consistency. The 16.4% return was above our annual target of 14% to 15% because of higher net income earned in the year.
Table 3 on page 55 contains ROE statistics for the past 10 years. Pages 10 and 12 provide further comment on ROE and include peer group comparisons.
Return on common shareholders’ equity (ROE) is calculated as net income, less preferred dividends, as a percentage of average common shareholders’ equity. Common shareholders’ equity is comprised of common share capital, contributed surplus and retained earnings.
Net Economic Profit Growth
The last of our four primary value measures is net economic profit (NEP) growth. NEP increased 92% to $703 million, as cash net income was substantially higher in 2003 than in the previous year. All three operating groups contributed to growth in NEP. Approximately three-quarters of NEP was attributable to Personal and Commercial Client Group and the balance to Investment Banking Group. Private Client Group was very close to generating breakeven NEP, as its cash return on equity was just slightly below its cost of capital, in spite of the difficult investment climate during much of the year.
Pages 10 and 12 provide further comment on NEP growth and include peer group comparisons.
Net economic profit (NEP)growth is the percentage change year-over-year in total NEP, where NEP represents cash net income available to common shareholders, less a charge for capital. NEP is an effective measure of economic value added. NEP is a non-GAAP measure. See page 20.
Net Economic Profit($ millions, except as noted)
| | | | | | | | | | | | | | | | | | | | | |
| For the year ended October 31 | | 2003 | | | 2002 | | | 2001 | | | 2000 | | | 1999 | |
| |
| |
| |
| |
| |
|
| Net income available to common shareholders | | | 1,743 | | | | 1,338 | | | | 1,391 | | | | 1,756 | | | | 1,265 | |
| After-tax impact of the amortization of goodwill and other valuation intangibles | | | 79 | | | | 75 | | | | 101 | | | | 74 | | | | 67 | |
| | | |
| | | |
| | | |
| | | |
| | | |
| |
| Cash net income available to common shareholders | | | 1,822 | | | | 1,413 | | | | 1,492 | | | | 1,830 | | | | 1,332 | |
| Charge for capital* | | | (1,119 | ) | | | (1,045 | ) | | | (1,059 | ) | | | (1,067 | ) | | | (931 | ) |
| | | |
| | | |
| | | |
| | | |
| | | |
| |
Net economic profit | | | 703 | | | | 368 | | | | 433 | | | | 763 | | | | 401 | |
| | | |
| | | |
| | | |
| | | |
| | | |
| |
| Net economic profit growth (%) | | | 92 | | | | (15 | ) | | | (43 | ) | | | 90 | | | | (14 | ) |
| | | | | | | | | | |
| *Charge for capital | | | | | | | | | | | | | | | | | | | | |
| Average common shareholders’ equity | | | 10,646 | | | | 9,973 | | | | 10,100 | | | | 9,745 | | | | 8,976 | |
| Cost of capital (%) | | | 10.5 | | | | 10.5 | | | | 10.5 | | | | 11.0 | | | | 10.4 | |
| | | |
| | | |
| | | |
| | | |
| | | |
| |
| Charge for capital | | | (1,119 | ) | | | (1,045 | ) | | | (1,059 | ) | | | (1,067 | ) | | | (931 | ) |
| | | |
| | | |
| | | |
| | | |
| | | |
| |
BMO FINANCIAL GROUP 186TH ANNUAL REPORT 2003 17
Management’s Discussion and Analysis of Operations and Financial Condition
ENTERPRISE-WIDE STRATEGIC MANAGEMENT
Rose M. Patten
Senior Executive Vice-President, Human Resources and Head, Office of Strategic Management
“Successfully forging the links between people, strategy and performance will distinguish us as an employer of choice and a high-performance company. Our focus is on matching people to key roles and keeping them rewarded and engaged through a clear set of values to which we are all held accountable.”
Vision
To be the best financial services company, wherever we choose to compete.
Strategy and Objectives
Our strategy is to be a top-performing transnational financial institution that operates broadly in Canada and through significant focused franchises in the United States by targeting clients who value personalized service and customized solutions. We focus on delivering our products and services efficiently, prudently and profitably while investing in strengthening our core Canadian franchise and growing selectively and substantially in retail, commercial mid-market and wealth management businesses in the United States.
Our strategic objectives are to:
| • | | Be leaders in businesses with advantaged capabilities (top-tier profitability and either the leader in market growth or among the top three in market share); |
| • | | Operate efficiently and grow at market rates in our other core businesses (those that provide steady, sustainable earnings or support advantaged businesses); |
| • | | Minimize or eliminate capital utilized in non-core businesses and invest to shift our capital utilization more heavily toward retail, commercial mid-market and wealth management businesses. |
| | | | | | |
| Strategic Milestones | | Progress in 2003 |
| • | | Achieve top-tier customer loyalty among personal and commercial customers in Canada. | | • | | Commercial customer loyalty scores improved; however, relative rankings for both the personal and commercial segments remain below average. Significant initiatives designed to improve our sales and service capabilities are underway and will help drive the desired improvements in customer loyalty going forward. |
| • | | Achieve the number one market share in business banking in Canada. | | • | | Market share of business lending below $5 million increased to 19.60% from 19.48%, narrowing the gap relative to the market leader. |
| • | | Maintain leading investment banking positions in Canada and further build out our mid-market capabilities in the United States. | | • | | Ranked Top Overall Research Team for the 23rd consecutive year; advised on more Canadian mergers and acquisitions transactions and led or co-led more Canadian corporate debt transactions than any other investment bank; and acquired Gerard Klauer Mattison (an equity research, sales and trading firm) to complete Harris Nesbitt's product suite in the United States. |
| • | | Build out our franchises in the prime wealth markets in the United States. | | • | | Acquired the financial planning firm of Sullivan, Bruyette, Speros & Blayney and selected assets of myCFO to further strengthen our U.S. wealth management offering. |
| • | | Become the leading bank in the Chicagoland communities we serve. | | • | | Deposit growth of 8% versus a target of 5%, and loan growth of 25% versus a target of 15%. |
| • | | Maintain market-leading risk management capabilities. | | • | | Five-year average loan losses of 40 bps versus an average of 59 bps for our Canadian peer group competitors. |
| • | | Enhance leading positions in talent management, performance alignment, diversity and employee engagement. | | • | | For the second year in a row, named a “Top 100 Employer” (the only bank on the list) and a “Training Top 100” (the only Canadian firm on the list) and ranked in the top 10 of the “Best 50 Corporate Citizens”. |
Enterprise-Wide Strategic Management
Developing a specialized competency in strategic management has been an important priority for BMO. Strategies are developed at the line of business level and, in turn, support operating group and enterprise level strategies. The results of these efforts are presented in the Operating Group Review in the Financial Performance Review section of this MD&A.
Strategic management includes coordinating standards and activities related to establishing corporate targets and developing and updating strategies (including financial and strategic commitments). It also includes optimally employing resources, tracking and managing performance against commitments and linking compensation to performance. Operating in accordance with these strategic management standards helps ensure we focus on the highest-value strategic issues.
Strategic management governance includes regular updates of group and line of business strategies, with oversight by the Office of Strategic Management and approval by BMO’s Management Board Executive Committee and Board of Directors (where appropriate). In addition, the Board and Management Board Executive Committee meet to discuss group strategies and enterprise priorities at an annual Board Strategy Session.
18 BMO FINANCIAL GROUP 186TH ANNUAL REPORT 2003
Management’s Discussion and Analysis of Operations and Financial Condition
ECONOMIC AND FINANCIAL SERVICES DEVELOPMENTS
| | | | | | | |
| Highlights | | | | |
| • | | The Canadian economy slowed in 2003, while the U.S. economy strengthened. | | • | | The Canadian and U.S. economies are expected to strengthen in 2004. |
| • | | Interest rates in 2003 stayed near their lowest level in four decades. | | • | | Business spending should rise in 2004. |
| • | | The Canadian dollar rose sharply in 2003 relative to a generally weak U.S. dollar. | | • | | Interest rates are likely to rise moderately in 2004. |
Canadian and U.S. Economic and Financial Services Developments in 2003
After growing strongly last year, the Canadian economy weakened in 2003. Real GDP grew at a sub-par pace in the first quarter of the calendar year, contracted slightly in the second quarter, and expanded only modestly in the third. The economy faced a series of challenges in 2003, including the SARS crisis, an international ban on Canadian beef exports, a power outage in Ontario and a sharp appreciation of the Canadian dollar relative to the U.S. dollar. As a consequence, exports remained weak in the first three quarters of the year, and the attendant weakness in manufacturing dampened a recovery in investment and business lending. In contrast, consumer spending was supported by low interest rates, resulting in a pickup in personal loans. The demand for housing stayed strong, boosting growth in mortgages.
Following one of the strongest years on record, employment growth slowed in 2003. A rising jobless rate, together with a surging currency, encouraged the Bank of Canada to reduce overnight rates in the summer. With short-term rates at four-decade lows, growth in demand deposits has outpaced term deposits.
After growing slowly last year, the U.S. economy gathered strength in 2003. From a sub-par pace in the first quarter, real GDP growth picked up in the second quarter and accelerated sharply in the third. Supported by reductions in income taxes and low interest rates, consumer spending gained momentum through the year. Home sales reached record highs in the summer and auto sales remained brisk. Accordingly, residential mortgages and personal loans continued to grow strongly in 2003. Business spending, especially on productivity-enhancing computing equipment, strengthened during the year. However, business loans continued to shrink as firms used sharply higher profits to finance their spending. Despite the improved economy, however, non-farm employment remained weak. Rising joblessness and moderating inflation spurred the Federal Reserve to reduce overnight lending rates in the summer to their lowest level in 45 years. Falling interest rates and rising corporate profits spurred a rally in equity prices, which in turn led to an improvement in capital markets activity.
Economic and Financial Services Outlook for 2004
The Canadian economy is expected to strengthen in 2004. Personal spending will continue to benefit from low interest rates early in the year. Robust U.S. demand should support Canadian exports, though recent strengthening of the Canadian dollar will temper the gains. The jobless rate is expected to decline modestly. Interest rates are projected to rise gradually, starting in the summer, as the Bank of Canada reduces the substantial amount of monetary stimulus in the system. The Canadian dollar is expected to change only modestly relative to the U.S. dollar, with support from positive trade balances offset by narrowing interest rate spreads. The economic environment should support growth in mortgages and personal loans and facilitate a pickup in business loans in 2004.
Continued support from stimulative monetary and fiscal policies should sustain the U.S. recovery at a strong pace in 2004. Consumer spending is expected to remain firm, though sales of automobiles and homes will likely moderate from recent highs. Rising employment should support growth in residential mortgages and consumer credit. Business investment and borrowing are projected to grow as production increases. The economic environment should enhance credit quality. Interest rates should remain stable in the near term, though the Federal Reserve will likely begin to reduce the excess monetary stimulus in the spring.
BMO FINANCIAL GROUP 186TH ANNUAL REPORT 2003 19
Management’s Discussion and Analysis of Operations and Financial Condition
FINANCIAL PERFORMANCE REVIEW
This section provides a review of our enterprise financial performance that focuses on the Consolidated Statement of Income included in our consolidated financial statements, which begin on page 69. A review of our operating group strategies and performance follows the enterprise review.
| | | | | | | |
| Highlights | | | | |
| • | | Revenue increased $412 million or 5% in 2003 and was higher in each of our client operating groups. | | • | | The provision for credit losses declined $365 million due to improved credit performance over the year. |
| • | | Growth was attributable to improved volumes in Personal and Commercial Client Group and Private Client Group and to | | • | | Non-interest expense increased 0.9% in 2003, after growing more than 6% in both 2002 and 2001. |
| | | lower investment securities losses and higher equity origination fees and trading-related revenue in Investment Banking Group. | | • | | The expense-to-revenue ratio (or productivity ratio) improved by 240 basis points to 65.7%, as improving productivity was our top priority in the year. |
Non-GAAP Measures
BMO uses certain non-GAAP measures to assess performance. Securities regulators require that companies caution readers that earnings and other measures adjusted to a basis other than generally accepted accounting principles (GAAP) do not have standardized meanings under GAAP and are unlikely to be comparable to similar measures used by other companies.
In 2002 we indicated that management and certain other observers believe that analyzing results excluding non-recurring items can enhance analysis of financial performance. However, the Securities and Exchange Commission in the United States enacted rules in the past year that, going forward, restrict the designation of items as non-recurring. This impairs the usefulness of such measures, and as a result we have discontinued our practice of reporting results excluding non-recurring items. As such, there were no items designated as non-recurring in fiscal 2003. In 2002, $62 million ($39 million after tax) of acquisition-related costs incurred by Private Client Group were designated as non-recurring, increasing EPS in 2002 by $0.08 when stated on a basis that excludes non-recurring items. Table 26 on page 67 provides details of items that had been designated as non-recurring in 2002 and 2001, now referred to as unusual items.
Cash earnings and productivity measures may enhance comparisons between periods when there has been an acquisition, particularly because the purchase decision may not consider the amortization of intangible assets to be a relevant expense. Cash EPS measures are also useful because analysts often focus on this measure, and cash EPS is used by Thomson First Call to track third-party earnings forecasts that are frequently reported in the media. Cash measures add the after-tax amortization of goodwill and intangible assets to GAAP earnings to derive cash income (and associated EPS) and deduct the amortization of intangible assets from non-interest expenses to derive cash productivity measures.
BMO, like many banks, analyzes revenue on a taxable equivalent basis (teb). This basis includes an adjustment that increases GAAP revenues and the provision for income taxes by an amount that would increase revenues on certain tax-exempt securities to a level that would incur tax at the statutory rate.
Net economic profit is another non-GAAP measure. It represents cash earnings available to common shareholders less a charge for capital.
Non-GAAP Measures Used in the MD&A($ millions, except as noted)
| | | | | | | | | | | | | |
| | | 2003 | | | 2002 | | | 2001 | |
| | |
| |
| |
|
| Net interest income per financial statements | | | 4,899 | | | | 4,829 | | | | 4,499 | |
| Non-interest revenue per financial statements | | | 4,220 | | | | 3,924 | | | | 4,222 | |
| | | |
| | | |
| | | |
| |
| Revenue per financial statements | | | 9,119 | | | | 8,753 | | | | 8,721 | |
| Taxable equivalent basis adjustment (see page 22) | | | 152 | | | | 106 | | | | 142 | |
| | | |
| | | |
| | | |
| |
| Revenue on a taxable equivalent basis (teb) (a) | | | 9,271 | | | | 8,859 | | | | 8,863 | |
| | | |
| | | |
| | | |
| |
| Provision for income taxes | | | 688 | | | | 424 | | | | 501 | |
| Taxable equivalent basis adjustment | | | 152 | | | | 106 | | | | 142 | |
| | | |
| | | |
| | | |
| |
| Provision for income taxes (teb) | | | 840 | | | | 530 | | | | 643 | |
| | | |
| | | |
| | | |
| |
| Non-interest expenses (b) | | | 6,087 | | | | 6,030 | | | | 5,671 | |
| Amortization of intangible assets | | | (105 | ) | | | (87 | ) | | | (43 | ) |
| | | |
| | | |
| | | |
| |
| Cash expenses (c) | | | 5,982 | | | | 5,943 | | | | 5,628 | |
| | | |
| | | |
| | | |
| |
| Net income | | | 1,825 | | | | 1,417 | | | | 1,471 | |
| Amortization of goodwill and intangible assets | | | 79 | | | | 75 | | | | 101 | |
| | | |
| | | |
| | | |
| |
| Cash net income | | | 1,904 | | | | 1,492 | | | | 1,572 | |
| Preferred share dividends | | | (82 | ) | | | (79 | ) | | | (80 | ) |
| Charge for capital | | | (1,119 | ) | | | (1,045 | ) | | | (1,059 | ) |
| | | |
| | | |
| | | |
| |
| Net economic profit | | | 703 | | | | 368 | | | | 433 | |
| | | |
| | | |
| | | |
| |
| Non-interest expense-to-revenue (1) ratio ((b/a) x 100) (%) | | | 65.7 | | | | 68.1 | | | | 64.0 | |
| Cash non-interest expense-to-revenue (1) ratio ((c/a) x 100) (%) | | | 64.5 | | | | 67.1 | | | | 63.5 | |
| EPS (uses net income) ($) | | | 3.44 | | | | 2.68 | | | | 2.66 | |
| Cash EPS (uses cash net income) ($) | | | 3.59 | | | | 2.83 | | | | 2.86 | |
| | | |
| | | |
| | | |
| |
| (1) | | Also referred to as productivity and cash productivity. |
20 BMO FINANCIAL GROUP 186TH ANNUAL REPORT 2003
Management’s Discussion and Analysis of Operations and Financial Condition
Foreign Exchange
The Canadian dollar equivalents of BMO’s U.S.-dollar denominated net income, revenues, expenses, income taxes and provision for credit losses in 2003 were lowered by the weakening of the U.S. dollar. The adjacent table indicates average Canadian/U.S. dollar exchange rates in 2003 and 2002 and the impact of the lower Canadian/U.S. dollar exchange rate.
At the start of each quarter, BMO enters into hedging transactions that are expected to partially offset the pre-tax effects of exchange rate fluctuations in the quarter on our U.S.-dollar net income for that quarter. As such, these activities provide some relief from exchange rate fluctuations within a single quarter, but the sum of the hedging gains/losses for the four quarters in a year is not directly comparable to the impact of year-over-year exchange rate fluctuations on earnings for the year.
Each one-cent decrease (increase) in the Canadian/U.S. dollar exchange rate, expressed in terms of how many Canadian dollars one U.S. dollar buys, decreases (increases) BMO’s quarterly earnings by approximately $1 million before income taxes, in the absence of hedging activity.
The gain or loss from hedging transactions in future periods will be determined by both future currency fluctuations and the amount of the underlying future hedging transactions, since the transactions are entered into each quarter in relation to expected U.S.-dollar denominated net income for the next three months. The effect of currency fluctuations on our net investment in foreign operations is discussed in the Provision for Income Taxes section on page 26.
Effects of the Weaker U.S. Dollar on BMO’s 2003 Results ($ millions, except as noted)
| | | | | | |
| Canadian/U.S. dollar exchange rate (average) | | | | |
| | 2003 | | | 1.435 | |
| | 2002 | | | 1.571 | |
| | | | | |
| Reduced revenues | | | (264 | ) |
| Reduced expenses | | | 181 | |
| Reduced provision for credit losses | | | 27 | |
| Reduced income taxes | | | 11 | |
| | | | |
| |
| Reduced net income before hedging gains | | | (45 | ) |
| Hedging gains | | | 18 | |
| Income taxes thereon | | | (6 | ) |
| | | | |
| |
| Reduced net income | | | (33 | ) |
| | | | |
| |
Acquired Businesses
BMO Financial Group has selectively acquired a number of businesses over the past two years in advancing our Canada-U.S. growth strategy. These acquisitions have incremental effects on revenue and expenses that impact the year-over-year comparison of operating results. For acquisitions in 2003, the incremental effects are the revenues and expenses of those businesses that are included in results in fiscal 2003. For acquisitions that were completed in fiscal 2002, the incremental effects are the revenues and expenses of each of those businesses from the beginning of fiscal 2003 until the one-year anniversary of their respective dates of acquisition. The accompanying table outlines the acquisitions by operating group and their incremental effects on BMO’s revenue, expenses and net income for 2003, relative to 2002, to assist in analyzing changes in results in 2003.
Business Acquisitions($ millions)
| | | | | | | | | | | | | | | | | | |
| | | | Incremental effects on results for fiscal 2003 |
| | | |
|
| | | | | | | | | | | | Net | | Cash net |
| Business acquired | | Revenue | | Expense | | income | | income |
| |
| |
| |
| |
|
Private Client Group | | | | | | | | | | | | | | | | |
Sullivan, Bruyette, Speros & Blayney Inc.
Acquired January 2003 for $20 million | | | | | | | | | | | | | | | | |
Select assets of myCFO, Inc.
Acquired November 2002 for $61 million | | | | | | | | | | | | | | | | |
Morgan Stanley Individual Investor Group online accounts
Acquired May 2002 for $153 million | | | | | | | | | | | | | | | | |
Northwestern Trust and Investment Advisory Company
Acquired April 2002 for $19 million | | | | | | | | | | | | | | | | |
CSFBdirect
Acquired February 2002 for $854 million | | | | | | | | | | | | | | | | |
| | | |
| | | |
| | | |
| | | |
| |
Total Private Client Group
Purchases of $1,107 million | | | 105 | | | | 154 | | | | (31 | ) | | | (13 | ) |
| | | |
| | | |
| | | |
| | | |
| |
Investment Banking Group | | | | | | | | | | | | | | | | |
Gerard Klauer Mattison
Acquired July 2003 for $40 million | | | 17 | | | | 26 | | | | (5 | ) | | | (5 | ) |
| | | |
| | | |
| | | |
| | | |
| |
BMO Financial Group | | | | | | | | | | | | | | | | |
| Purchases of $1,147 million | | | 122 | | | | 180 | | | | (36 | ) | | | (18 | ) |
| | | |
| | | |
| | | |
| | | |
| |
BMO FINANCIAL GROUP 186TH ANNUAL REPORT 2003 21
Management’s Discussion and Analysis of Operations and Financial Condition
Revenue and Revenue Growth
Revenue on a taxable equivalent basis (see page 20) rose $412 million or 5% in 2003 to $9,271 million, driven by growth in all operating groups. After adjusting 2003 revenue for the $122 million incremental effect of acquired businesses, which is explained on page 21, revenue increased $290 million or 3%. The weaker U.S. dollar reduced revenue in 2003 by $264 million and lowered revenue growth by 3 percentage points.
BMO, like many banks, analyzes revenue on a taxable equivalent basis (teb). The teb adjustments for fiscal 2003 totalled $152 million, up from $106 million a year ago. This year, we refined our policies prospectively to include adjustments for dividend revenue from common and certain additional preferred shares, resulting in a $71 million increase in the teb adjustment in fiscal 2003, primarily in Investment Banking Group.
Personal and Commercial Client Group revenue rose on continued volume growth in both Canada and the United States, although the impact of U.S. growth was offset by the weaker U.S. currency. Canadian growth was primarily in the personal banking segment, where retail deposits, card services and residential mortgages were particularly strong. Private Client Group revenue rose on improving market fundamentals and stronger performance in direct and full-service investing and in investment products. Investment Banking Group benefited from stronger income trust origination activity and higher trading revenue. A $105 million reduction in net investment securities losses also contributed to BMO’s revenue increase.
Net Interest Income
Net interest income for the year was $5,051 million, an increase of $116 million or 2% from 2002, driven by volume growth. Average assets of $264 billion were $16 billion or 6% higher than a year ago, split equally between personal and commercial banking and Investment Banking Group. The growth occurred in spite of the weaker U.S. dollar. Asset growth in Personal and Commercial Client Group was related to active residential mortgage markets and strong credit card and consumer loans growth. Growth in Investment Banking Group assets was primarily in trading securities, as business and government loans declined due to weak demand.
Taxable equivalent basis (teb)
Revenues reflected in our MD&A are presented on a taxable equivalent basis (teb). The teb adjustment increases GAAP revenues and the provision for income taxes by an amount that would increase revenues on certain tax-exempt securities to a level that would incur tax at the statutory rate, to facilitate comparisons. The effect is disclosed on page 20 and in Table 6 on page 56.
Net interest incomeis comprised of earnings on assets, such as loans and securities, including interest and dividend income and BMO’s share of income from investments accounted for using the equity method of accounting, less interest expense paid on liabilities, such as deposits.Net interest marginis the ratio of net interest income to average assets, expressed as a percentage or in basis points.
Revenue($ millions)
| | | | | | | | | | | | | | | | | | | | | | |
| For the year ended October 31 | | 2003 | | | 2002 | | | 2001 | | | 2000 | | | 1999 | |
| |
| |
| |
| |
| |
|
| Net interest income (teb) | | | 5,051 | | | | 4,935 | | | | 4,641 | | | | 4,338 | | | | 4,417 | |
| | Year-over-year growth (%) | | | 2 | | | | 6 | | | | 7 | | | | (2 | ) | | | 6 | |
| Non-interest revenue | | | 4,220 | | | | 3,924 | | | | 4,222 | | | | 4,326 | | | | 3,511 | |
| | Year-over-year growth (%) | | | 8 | | | | (7 | ) | | | (2 | ) | | | 23 | | | | 13 | |
| | | |
| | | |
| | | |
| | | |
| | | |
| |
| Total revenue | | | 9,271 | | | | 8,859 | | | | 8,863 | | | | 8,664 | | | | 7,928 | |
| | Year-over-year growth (%) | | | 5 | | | | — | | | | 2 | | | | 9 | | | | 9 | |
| | | |
| | | |
| | | |
| | | |
| | | |
| |
Change in Net Interest Income, Average Assets and Net Interest Margin
| | | | | | | | | | | | | | | | | | | | | | | | | | | | | | | | | | | | | | | | | | | | | |
| | | Net interest income (teb) | | Average assets | | Net interest margin |
| | | ($ millions) | | Change | | ($ millions) | | Change | | (in basis points) |
| | |
| |
| |
| |
| |
|
| For the year ended October 31 | | 2003 | | | 2002 | | | $ | | | % | | | 2003 | | | 2002 | | | $ | | | % | | | 2003 | | | 2002 | | | Change | |
| |
| |
| |
| |
| |
| |
| |
| |
| |
| |
| |
|
| P&C Canada | | | 2,687 | | | | 2,479 | | | | 208 | | | | 8 | | | | 93,865 | | | | 87,190 | | | | 6,675 | | | | 8 | | | | 286 | | | | 284 | | | | 2 | |
| P&C United States | | | 632 | | | | 620 | | | | 12 | | | | 2 | | | | 16,046 | | | | 14,861 | | | | 1,185 | | | | 8 | | | | 394 | | | | 417 | | | | (23 | ) |
| | | |
| | | |
| | | |
| | | |
| | | |
| | | |
| | | |
| | | |
| | | |
| | | |
| | | |
| |
| Personal and Commercial Client Group (P&C) | | | 3,319 | | | | 3,099 | | | | 220 | | | | 7 | | | | 109,911 | | | | 102,051 | | | | 7,860 | | | | 8 | | | | 302 | | | | 304 | | | | (2 | ) |
| Private Client Group (PCG) | | | 544 | | | | 522 | | | | 22 | | | | 4 | | | | 5,282 | | | | 5,450 | | | | (168 | ) | | | (3 | ) | | | 1,030 | | | | 958 | | | | 72 | |
| Investment Banking Group (IBG) | | | 1,394 | | | | 1,480 | | | | (86 | ) | | | (6 | ) | | | 144,449 | | | | 136,487 | | | | 7,962 | | | | 6 | | | | 97 | | | | 108 | | | | (11 | ) |
| Corporate Support, including Technology and Solutions (Corp) | | | (206 | ) | | | (166 | ) | | | (40 | ) | | | (25 | ) | | | 4,324 | | | | 4,002 | | | | 322 | | | | 8 | | | nm | | nm | | nm |
| | | |
| | | |
| | | |
| | | |
| | | |
| | | |
| | | |
| | | |
| | | |
| | | |
| | | |
| |
| Total | | | 5,051 | | | | 4,935 | | | | 116 | | | | 2 | | | | 263,966 | | | | 247,990 | | | | 15,976 | | | | 6 | | | | 191 | | | | 199 | | | | (8 | ) |
| | | |
| | | |
| | | |
| | | |
| | | |
| | | |
| | | |
| | | |
| | | |
| | | |
| | | |
| |
nm — not meaningful
22 BMO FINANCIAL GROUP 186TH ANNUAL REPORT 2003
Management’s Discussion and Analysis of Operations and Financial Condition
Net interest margin averaged 1.91% and was down 8 basis points from a year earlier. Personal and Commercial Client Group average net interest margin in Canada was slightly higher in 2003, but net interest margin was declining in the latter part of 2003 due to shifts in customer preferences. The low interest rate environment and the competitive retail environment continue to pressure margin sustainability. In the United States, average net interest margin declined year-over-year as interest rates fell, but margin was increasing in the latter part of 2003 due to volume growth at higher net interest margins, supported by pricing efforts.
Private Client Group net interest income rose due to growth in fixed income products. The group’s net interest margin is higher than other groups because its personal term deposits balances are high relative to its loan balances.
Investment Banking Group net interest income fell because of lower corporate lending volumes and compressed spreads in capital markets businesses. The group’s net interest margin declined due to a reduction in higher margin corporate lending assets, higher low-margin capital markets assets and the narrowing of spreads earned on capital markets assets in the flatter yield curve environment.
Non-Interest Revenue
Non-interest revenue, which comprises all revenues other than net interest income, increased $296 million or 8% from 2002. The incremental effect of acquired businesses increased non-interest revenue by $103 million, while the impact of the weaker U.S. dollar reduced 2003 non-interest revenue by $128 million.
Securities commissions and fees rose $81 million. These fees largely consist of full-service and self-directed retail brokerage commissions within Private Client Group, which account for about three-quarters of the balance, and institutional equity trading commissions within Investment Banking Group. Fees increased in both operating groups, benefiting from higher equity market valuations and client trading volumes in the latter part of the year in Private Client Group and from Investment Banking Group’s acquisition of Gerard Klauer Mattison.
Deposit and payment service charges, which represent income earned on both retail and commercial deposit accounts, rose $24 million. The increase related to pricing initiatives, account management efficiency and volume growth in Canadian personal and commercial banking.
Lending fees decreased $13 million, continuing the trend of a year ago and indicative of weak market demand for corporate loans in Investment Banking Group.
Card fees rose $30 million on higher levels of activity, driven in part by the success of our Mosaik MasterCard.
Investment management and custodial fees decreased $11 million, reflecting the weak investment environment in the earlier part of the year, particularly in the United States.
Mutual fund revenues increased $12 million, reflecting volume growth, improved equity market valuations and the full-year inclusion of CSFBdirectin wealth management operations.
Securitization revenues decreased $85 million due to lower credit card loans securitizations and the termination of our collateralized loans securitization. Results in 2002 also reflected higher gains on sales. Securitization revenues are detailed in Note 7 on page 79 of the financial statements.
Non-Interest Revenue($ millions)
| | | | | | | | | | | | | | | | | | | | | |
| For the year ended October 31 | | 2003 | | | 2002 | | | 2001 | | | 2000 | | | 1999 | |
| |
| |
| |
| |
| |
|
| Securities commissions and fees | | | 894 | | | | 813 | | | | 742 | | | | 859 | | | | 666 | |
| Deposit and payment service charges | | | 756 | | | | 732 | | | | 670 | | | | 646 | | | | 616 | |
| Trading revenues | | | 275 | | | | 209 | | | | 490 | | | | 388 | | | | 295 | |
| Lending fees | | | 293 | | | | 306 | | | | 352 | | | | 322 | | | | 329 | |
| Card fees | | | 290 | | | | 260 | | | | 204 | | | | 216 | | | | 205 | |
| Investment management and custodial fees | | | 303 | | | | 314 | | | | 336 | | | | 373 | | | | 419 | |
| Mutual fund revenues | | | 321 | | | | 309 | | | | 251 | | | | 232 | | | | 207 | |
| Securitization revenues | | | 244 | | | | 329 | | | | 331 | | | | 343 | | | | 296 | |
| Underwriting and advisory fees | | | 268 | | | | 228 | | | | 234 | | | | 210 | | | | 175 | |
| Investment securities gains (losses) | | | (41 | ) | | | (146 | ) | | | 123 | | | | 183 | | | | (85 | ) |
| Foreign exchange, other than trading | | | 160 | | | | 151 | | | | 127 | | | | 146 | | | | 133 | |
| Insurance income | | | 124 | | | | 105 | | | | 125 | | | | 96 | | | | 73 | |
| Other revenues | | | 333 | | | | 314 | | | | 237 | | | | 312 | | | | 182 | |
| | | |
| | | |
| | | |
| | | |
| | | |
| |
| Total | | | 4,220 | | | | 3,924 | | | | 4,222 | | | | 4,326 | | | | 3,511 | |
| | | |
| | | |
| | | |
| | | |
| | | |
| |
Contribution to Non-Interest Revenue Growth(%)
| | | | | | | | | | | | | |
| For the year ended October 31 | | 2003 | | | 2002 | | | 2001 | |
| |
| |
| |
|
| Trading revenues | | | 1.7 | | | | (6.7 | ) | | | 2.4 | |
| Securitization revenues | | | (2.2 | ) | | | — | | | | (0.3 | ) |
| Securities commissions and fees | | | 2.1 | | | | 1.7 | | | | (2.7 | ) |
| Net securities gains (losses) | | | 2.7 | | | | (6.4 | ) | | | (1.4 | ) |
| Other business revenue | | | 3.3 | | | | 4.3 | | | | (0.4 | ) |
| | | |
| | | |
| | | |
| |
| Total non-interest revenue growth | | | 7.6 | | | | (7.1 | ) | | | (2.4 | ) |
| | | |
| | | |
| | | |
| |
BMO FINANCIAL GROUP 186TH ANNUAL REPORT 2003 23
Management’s Discussion and Analysis of Operations and Financial Condition
Underwriting and advisory fees increased $40 million, primarily due to higher equity underwriting fees associated with the active income trust market. Merger and acquisition fees were essentially unchanged from a year ago.
Investment securities losses were $41 million, compared with $146 million in 2002. Net losses in 2002 reflected write-downs in Investment Banking Group’s own collateralized bond obligations and in certain merchant banking positions. The net losses in 2003 occurred in the first half of the year, as net gains in the latter half reflected the strengthening economy and higher equity valuations.
Foreign exchange, other than trading, increased $9 million and insurance income grew $19 million, reflecting higher volumes.
Trading-Related Revenues
Revenues from trading-related activities totalled $508 million, compared with $391 million in 2002. Trading-related revenues included net interest income of $233 million and non-interest revenue of $275 million. Trading-related revenues are primarily dependent on the volume of activities undertaken for clients, who enter into transactions with BMO to mitigate their risks or to invest. BMO earns a spread or profit on the net sum of its client positions by profitably neutralizing, within prescribed limits, the overall risk of the net positions. BMO also assumes proprietary positions with the goal of earning trading profits. While proprietary positions expose the organization to profit or loss, the positions and their risks are closely managed and profit or loss from these activities is generally not the most significant factor affecting the level of trading-related revenues.
The $117 million increase from 2002 was attributable to higher revenue in most product areas. Prior-year revenue was affected by low volatility that limited trading opportunities. Performance in 2003 was encouraging relative to the trading environment.
Interest rate trading-related revenues benefited from strong credit derivatives performance, while revenue in 2002 was affected by a write-down of positions in Teleglobe®7. Equities trading-related revenues included $70 million of taxable equivalent basis revenue in 2003, as explained on page 22. Other trading-related revenues grew because of higher commodity derivatives trading-related revenue, including revenue on termination of positions with a counterparty that is the subject of legal action, as explained in Note 25 on page 97 of the financial statements. The Market Risk section on page 48 provides further information on trading-related revenues.
Trading-related revenuesinclude net interest income and non-interest revenue earned from on and off-balance sheet positions undertaken for trading purposes. The management of these positions typically includes marking them to market on a daily basis. Trading revenues include income (expense) and gains (losses) from both on-balance sheet instruments and off-balance sheet interest rate, foreign exchange (including spot positions), equity, commodity and credit contracts.
Interest and Non-Interest Trading-Related Revenues($ millions)
| | | | | | | | | | | | | | | | | | | | | |
| For the year ended October 31 | | 2003 | | | 2002 | | | 2001 | | | 2000 | | | 1999 | |
| |
| |
| |
| |
| |
|
| Interest rates | | | 241 | | | | 180 | | | | 241 | | | | 178 | | | | 154 | |
| Foreign exchange | | | 69 | | | | 69 | | | | 126 | | | | 112 | | | | 118 | |
| Equities | | | 86 | | | | 56 | | | | 118 | | | | 165 | | | | 50 | |
| Other | | | 112 | | | | 86 | | | | 120 | | | | (2 | ) | | | 90 | |
| | | |
| | | |
| | | |
| | | |
| | | |
| |
| Total | | | 508 | | | | 391 | | | | 605 | | | | 453 | | | | 412 | |
| | | |
| | | |
| | | |
| | | |
| | | |
| |
| Reported as: | | | | | | | | | | | | | | | | | | | | |
| Net interest income | | | 233 | | | | 182 | | | | 115 | | | | 65 | | | | 117 | |
| Non-interest revenue — trading revenues | | | 275 | | | | 209 | | | | 490 | | | | 388 | | | | 295 | |
| | | |
| | | |
| | | |
| | | |
| | | |
| |
| Total | | | 508 | | | | 391 | | | | 605 | | | | 453 | | | | 412 | |
| | | |
| | | |
| | | |
| | | |
| | | |
| |
Provision for Credit Losses
The provision for credit losses for 2003 declined $365 million to $455 million. The provision represents 0.30% of average net loans and acceptances, including securities purchased under resale agreements, down from 0.56% a year ago. The lower provision is attributable to the improved credit performance experienced over the year. BMO's target for 2004 is a provision for credit losses of $500 million or less.
Our disciplined approach to portfolio management and diversification continues to ensure there are no undue sector or industry concentrations. BMO’s regular, comprehensive quarterly review of credit portfolios ensures consistency and adequacy in our provisioning. Credit risk management is discussed on page 47.
Table 17 on page 63 details specific provisions for credit losses by product and industry sector. The provision for credit losses on consumer loans and acceptances of $141 million was relatively unchanged from a year ago. The provision for credit losses on commercial and corporate loans and acceptances was $314 million, compared with $676 million in 2002. Provisions on loans to the manufacturing, utilities (particularly electric power generation), service industries, forest products and transportation sectors accounted for most of the provisions in 2003. Provision levels in 2002 were particularly affected by the $399 million provision on loans and acceptances to companies in the troubled communications sector, particularly those in the telecom and cable sub-sectors. Provisions on loans and acceptances to communications companies declined to $7 million in 2003 due to a significant decline in new problem loans emerging in the sector in 2003, proactive management that reduced our exposure to the sector and the appropriateness of our provisioning in 2002.
Table 14 on page 61 and Table 15 on page 62 detail the changes in gross impaired loans and acceptances and in allowances for credit losses. Gross impaired loans and acceptances totalled $1,918 million in 2003, down from $2,337 million a year ago. Gross impaired loans and acceptances as a percentage of equity and allowances for credit losses improved to 12.15% from 15.16% a year ago. Gross impaired loans and acceptances formations totalled $1,303 million, down from $1,945 million in 2002.
BMO sold $288 million of non-performing loans, having a net book value of $226 million, for proceeds of $249 million during the year, while write-offs totalled $566 million, down
24 BMO FINANCIAL GROUP 186TH ANNUAL REPORT 2003
Management’s Discussion and Analysis of Operations and Financial Condition
from $884 million in 2002. Specific allowances for credit losses totalled $611 million at the end of 2003, down from $769 million in 2002. The decline in specific allowances related to improved credit quality, the lower level of impaired loans and acceptances and the lower Canadian/U.S. dollar exchange rate. The general allowance for credit losses remained unchanged from a year ago at $1,180 million. It represents 91 basis points of risk-weighted assets at year end, up from 90 basis points a year ago.
Impaired loans and acceptances, after deduction of specific allowances for credit losses, totalled $1,313 million, compared with $1,568 million at the end of last year. Impaired loans and acceptances, after deduction of specific allowances and the general allowance for credit losses, totalled $133 million, compared with $388 million at the end of last year. The reduction was largely attributable to lower net impaired loans to companies in the telecom and cable sectors. Both gross and net impaired loans and acceptances to the electric power generation sector were up from a year ago, as credit quality in this industry worsened in 2003. BMO’s impaired loans and acceptances formations rose in the fourth quarter because of the deterioration of a number of U.S.-based corporate accounts in this sector.
The net loans and acceptances exposure to Canadian cattle farming and related sectors was approximately $1.4 billion, or 1.0% of total net loans and acceptances. We have recorded specific allowances for credit losses of $3 million on the $18 million of loans to Canadian cattle farming and related sectors classified as impaired.
The net loans and acceptances exposure to cable and telecom companies was approximately $1.2 billion, or 0.8% of total net loans and acceptances at the end of the year. We have recorded specific allowances for credit losses of $85 million on the $273 million of cable and telecom industry loans classified as impaired.
The net loans and acceptances exposure to electric power generation companies was approximately $0.7 billion, or 0.5% of total net loans and acceptances. We have recorded specific allowances for credit losses of $141 million on the $391 million of electric power generation industry loans classified as impaired.

Non-Interest Expense and Expense-to-Revenue Ratio
Non-interest expense increased $57 million or 0.9% to $6,087 million. The components of the dollar increase and percentage increase are outlined in the adjacent tables. As explained on page 21, the incremental effects of businesses acquired in 2002 and 2003 increased expenses in 2003, relative to 2002, by $180 million (3.0%). As further explained on page 21, the lower Canadian/U.S. dollar exchange rate reduced costs in 2003 by $181 million (–2.9%); as such, these two factors offset each other. Higher performance-based compensation costs, associated with BMO’s 29% increase in net income, increased expenses by $93 million (1.5%), and higher pension costs increased expenses by $78 million (1.3%). Both performance-based compensation costs and pension costs are included in employee compensation in the summary expense table. The higher pension costs were primarily due to lower than expected returns on plan assets in 2002. There was a net reduction in all other expenses of $113 million (–2.0%), $72 million of which related to reduced professional fees and travel costs. There were $62 million of acquisition-related costs in 2002. Severance costs reflected in results were comparable in both years.
The expense-to-revenue ratio improved 240 basis points to 65.7% in 2003. BMO’s overall ratio in any year is affected by the relative strength of the revenues in each operating group. The expense-to-revenue ratio of each group is typically quite different because of the nature of their businesses. In 2003, all operating groups increased revenues more than expenses, in both absolute and percentage terms. As a result, all operating groups improved their expense-to-revenue ratios, also referred to as productivity ratios, by more than 150 basis points.
Theexpense-to-revenue ratio (or productivity ratio)is our primary measure of productivity. It is calculated as non-interest expense divided by total revenues (on a taxable equivalent basis), expressed as a percentage. See page 20.Thecash productivity ratiois calculated in the same manner, after reducing non-interest expenses for amortization of intangible assets. See page 20.
Non-Interest Expense($ millions)
| | | | | | | | | | | | | | | | | | | | | |
| For the year ended October 31 | | 2003 | | | 2002 | | | 2001 | | | 2000 | | | 1999 | |
| |
| |
| |
| |
| |
|
| Employee compensation | | | 3,578 | | | | 3,403 | | | | 3,212 | | | | 3,065 | | | | 2,820 | |
| Premises and equipment | | | 1,264 | | | | 1,280 | | | | 1,153 | | | | 1,071 | | | | 1,123 | |
| Communications | | | 162 | | | | 173 | | | | 194 | | | | 259 | | | | 268 | |
| Other expenses | | | 978 | | | | 1,087 | | | | 1,069 | | | | 840 | | | | 1,056 | |
| Amortization of intangible assets | | | 105 | | | | 87 | | | | 43 | | | | 23 | | | | 21 | |
| | | |
| | | |
| | | |
| | | |
| | | |
| |
| Total | | | 6,087 | | | | 6,030 | | | | 5,671 | | | | 5,258 | | | | 5,288 | |
| | | |
| | | |
| | | |
| | | |
| | | |
| |
Contribution to Non-Interest Expense Growth(%)
| | | | | | | | | | | | | |
| For the year ended October 31 | | 2003 | | | 2002 | | | 2001 | |
| |
| |
| |
|
| Performance-based compensation | | | 1.5 | | | | (0.3 | ) | | | 4.1 | |
| Currency translation effect | | | (2.9 | ) | | | 0.6 | | | | 1.1 | |
| Acquired businesses | | | 3.0 | | | | 5.5 | | | | 1.2 | |
| Pension expense | | | 1.3 | | | | 1.2 | | | | 0.8 | |
| Disposed businesses | | | (0.2 | ) | | | (0.1 | ) | | | (0.9 | ) |
| Other expenses | | | (1.8 | ) | | | (0.6 | ) | | | 1.5 | |
| | | |
| | | |
| | | |
| |
| Total non-interest expense growth | | | 0.9 | | | | 6.3 | | | | 7.8 | |
| | | |
| | | |
| | | |
| |
BMO FINANCIAL GROUP 186TH ANNUAL REPORT 2003 25
Management’s Discussion and Analysis of Operations and Financial Condition
Personal and Commercial Client Group is BMO’s largest operating group and its productivity ratio of 63.1% improved by 171 basis points from last year. There was volume-driven revenue growth in both Canada and the United States and controlled expense growth.
Private Client Group’s expense-to-revenue ratio was 87.8%, a 500 basis point improvement from a year ago. The improvement was reflected in its significantly higher earnings and was driven primarily by $60 million of business expense reduction, excluding the incremental impact of acquired businesses. The business expense reduction represented 4% of 2002 expenses, excluding acquisition-related costs. Cost containment initiatives included reducing third-party and back office and technology costs, consolidating call centre and branch sites, and reducing staff levels by 8%.
Investment Banking Group’s expense-to-revenue ratio improved by 410 basis points to 51.5%. The group lowered its expenses by 3% year-over-year.
BMO improved its cash productivity ratio in 2003 by 260 basis points to 64.5%. Examples of initiatives to enhance productivity are outlined in the Operating Group Review section that starts on page 27. BMO will continue to focus on improving productivity in 2004 and is again targeting a 150 to 200 basis point improvement in cash productivity.
Provision for Income Taxes
The provision for income taxes reflected in the Consolidated Statement of Income is based upon transactions recorded in income, regardless of when such transactions are subject to income taxes, with the exception of the repatriation of retained earnings from foreign subsidiaries, as explained in Note 20 on page 95 of the financial statements.
As explained on pages 20 and 22, BMO adjusts revenue to a taxable equivalent basis for analysis, with an offsetting adjustment to the provision for income taxes. As such, the provision for income taxes and associated tax rates are stated on a taxable equivalent basis in this MD&A.
On a taxable equivalent basis, the provision for income taxes in the Consolidated Statement of Income was $840 million in 2003, compared with $530 million in 2002. The increase was attributable to higher income and a higher effective tax rate.
On a taxable equivalent basis, the effective tax rate was 30.8% in 2003, compared with 26.4% in 2002. The year-over-year change related to the recognition of proportionately higher tax benefits in 2002, a higher portion of income derived from higher tax-rate jurisdictions in 2003 and the expanded application of our taxable equivalent basis accounting, as explained on page 22. The components of variances between the effective and statutory Canadian tax rates are outlined in Note 20 on page 95 of the financial statements.
We estimate that the tax rate in 2004 will be approximately 31.5% and consider that rate to be sustainable.
BMO hedges the foreign exchange risk arising from its net investments in foreign operations by funding the net investment in U.S. dollars. Under this program, the gain or loss on hedging and the unrealized gain or loss on translation of the net investments in foreign operations are charged or credited to retained earnings, but usually are approximately equal and offsetting. For income tax purposes, the gain or loss on hedging activities incurs an income tax charge or credit in the current period, which is charged or credited to retained earnings, while the associated unrealized gain or loss on the net investments in foreign operations does not incur income taxes until the investment is liquidated. The income tax charge/benefit arising from a hedging gain/loss is a function of fluctuations in exchange rates from period to period. The hedging gains in 2003 were subject to an income tax charge in retained earnings of $601 million. Refer to the Consolidated Statement of Changes in Shareholders’ Equity on page 72 of the financial statements for further details.
Table 7 on page 57 details the $1,761 million of total government levies and taxes incurred by BMO in 2003.
26 BMO FINANCIAL GROUP 186TH ANNUAL REPORT 2003
Management’s Discussion and Analysis of Operations and Financial Condition
REVIEW OF OPERATING GROUPS PERFORMANCE
This section includes an analysis of our operating groups financial results and descriptions of their businesses, objectives, achievements, challenges and outlooks.
Personal and Commercial Client Group (P&C)(pages 28 to 32)
Net income was $946 million in 2003, an increase of $128 million or 16% from 2002.
Private Client Group (PCG)(pages 33 to 35)
Net income was $136 million in 2003, an increase of $65 million or 93% from 2002.
Investment Banking Group (IBG)(pages 36 to 39)
Net income was $722 million in 2003, an increase of $121 million or 20% from 2002.
Corporate Support, including Technology and Solutions(page 40)
Net income was $21 million in 2003, compared with a net loss of $73 million in 2002.
Net Income, Revenue and Average Assets by Operating Group ($ millions, except as noted)
| | | | | | | | | | | | | | | | | | | | | | | | | | | | | | | | | | | | | |
| | | Personal and Commercial | | Private | | Investment |
| | | Client Group | | Client Group | | Banking Group |
| | |
| |
| |
|
| For the year | | | | | | | | | | | | | | | | | | | | | | | | | | | | | | | | | | | | |
| ended October 31 | | 2003 | | | 2002 | | | 2001 | | | 2003 | | | 2002 | | | 2001 | | | 2003 | | | 2002 | | | 2001 | |
| |
| |
| |
| |
| |
| |
| |
| |
| |
|
Net income | | | | | | | | | | | | | | | | | | | | | | | | | | | | | | | | | | | | |
| Canada | | | 781 | | | | 671 | | | | 636 | | | | 172 | | | | 133 | | | | 109 | | | | 363 | | | | 154 | | | | 155 | |
| United States | | | 98 | | | | 92 | | | | 53 | | | | (42 | ) | | | (60 | ) | | | (7 | ) | | | 270 | | | | 343 | | | | 233 | |
| Other countries | | | 67 | | | | 55 | | | | 59 | | | | 6 | | | | (2 | ) | | | 5 | | | | 89 | | | | 104 | | | | 70 | |
| | | |
| | | |
| | | |
| | | |
| | | |
| | | |
| | | |
| | | |
| | | |
| |
| Total | | | 946 | | | | 818 | | | | 748 | | | | 136 | | | | 71 | | | | 107 | | | | 722 | | | | 601 | | | | 458 | |
| Business mix (%) | | | 51.8 | | | | 57.7 | | | | 50.8 | | | | 7.5 | | | | 5.0 | | | | 7.3 | | | | 39.6 | | | | 42.4 | | | | 31.1 | |
| | | |
| | | |
| | | |
| | | |
| | | |
| | | |
| | | |
| | | |
| | | |
| |
Revenue | | | | | | | | | | | | | | | | | | | | | | | | | | | | | | | | | | | | |
| Canada | | | 3,858 | | | | 3,626 | | | | 3,538 | | | | 1,211 | | | | 1,164 | | | | 1,117 | | | | 1,206 | | | | 918 | | | | 1,074 | |
| United States | | | 828 | | | | 831 | | | | 722 | | | | 576 | | | | 499 | | | | 361 | | | | 1,290 | | | | 1,413 | | | | 1,483 | |
| Other countries | | | 84 | | | | 70 | | | | 76 | | | | 8 | | | | — | | | | 12 | | | | 160 | | | | 217 | | | | 189 | |
| | | |
| | | |
| | | |
| | | |
| | | |
| | | |
| | | |
| | | |
| | | |
| |
| Total | | | 4,770 | | | | 4,527 | | | | 4,336 | | | | 1,795 | | | | 1,663 | | | | 1,490 | | | | 2,656 | | | | 2,548 | | | | 2,746 | |
| Business mix (%) | | | 51.5 | | | | 51.1 | | | | 48.9 | | | | 19.4 | | | | 18.8 | | | | 16.8 | | | | 28.6 | | | | 28.8 | | | | 31.0 | |
| | | |
| | | |
| | | |
| | | |
| | | |
| | | |
| | | |
| | | |
| | | |
| |
Average assets | | | | | | | | | | | | | | | | | | | | | | | | | | | | | | | | | | | | |
| Canada | | | 93,561 | | | | 86,923 | | | | 81,135 | | | | 1,512 | | | | 1,612 | | | | 1,849 | | | | 76,327 | | | | 69,265 | | | | 60,095 | |
| United States | | | 16,067 | | | | 14,893 | | | | 11,363 | | | | 3,741 | | | | 3,756 | | | | 3,394 | | | | 48,551 | | | | 51,425 | | | | 59,273 | |
| Other countries | | | 283 | | | | 235 | | | | 236 | | | | 29 | | | | 82 | | | | 51 | | | | 19,571 | | | | 15,797 | | | | 19,067 | |
| | | |
| | | |
| | | |
| | | |
| | | |
| | | |
| | | |
| | | |
| | | |
| |
| Total | | | 109,911 | | | | 102,051 | | | | 92,734 | | | | 5,282 | | | | 5,450 | | | | 5,294 | | | | 144,449 | | | | 136,487 | | | | 138,435 | |
| | | |
| | | |
| | | |
| | | |
| | | |
| | | |
| | | |
| | | |
| | | |
| |
[Additional columns below]
[Continued from above table, first column(s) repeated]
| | | | | | | | | | | | | | | | | | | | | | | | | |
| | | Corporate Support, including | | Total |
| | | Technology and Solutions | | Consolidated |
| | |
| |
|
| For the year | | | | | | | | | | | | | | | | | | | | | | | | |
| ended October 31 | | 2003 | | | 2002 | | | 2001 | | | 2003 | | | 2002 | | | 2001 | |
| |
| |
| |
| |
| |
| |
|
Net income | | | | | | | | | | | | | | | | | | | | | | | | |
| Canada | | | 14 | | | | (139 | ) | | | (101 | ) | | | 1,330 | | | | 819 | | | | 799 | |
| United States | | | 18 | | | | 61 | | | | (15 | ) | | | 344 | | | | 436 | | | | 264 | |
| Other countries | | | (11 | ) | | | 5 | | | | 274 | | | | 151 | | | | 162 | | | | 408 | |
| | | |
| | | |
| | | |
| | | |
| | | |
| | | |
| |
| Total | | | 21 | | | | (73 | ) | | | 158 | | | | 1,825 | | | | 1,417 | | | | 1,471 | |
| Business mix (%) | | | 1.1 | | | | (5.1 | ) | | | 10.8 | | | | 100.0 | | | | 100.0 | | | | 100.0 | |
| | | |
| | | |
| | | |
| | | |
| | | |
| | | |
| |
Revenue | | | | | | | | | | | | | | | | | | | | | | | | |
| Canada | | | (61 | ) | | | (78 | ) | | | (47 | ) | | | 6,214 | | | | 5,630 | | | | 5,682 | |
| United States | | | 89 | | | | 186 | | | | 8 | | | | 2,783 | | | | 2,929 | | | | 2,574 | |
| Other countries | | | 22 | | | | 13 | | | | 330 | | | | 274 | | | | 300 | | | | 607 | |
| | | |
| | | |
| | | |
| | | |
| | | |
| | | |
| |
| Total | | | 50 | | | | 121 | | | | 291 | | | | 9,271 | | | | 8,859 | | | | 8,863 | |
| Business mix (%) | | | 0.5 | | | | 1.3 | | | | 3.3 | | | | 100.0 | | | | 100.0 | | | | 100.0 | |
| | | |
| | | |
| | | |
| | | |
| | | |
| | | |
| |
Average assets | | | | | | | | | | | | | | | | | | | | | | | | |
| Canada | | | (4,126 | ) | | | (5,321 | ) | | | (5,119 | ) | | | 167,274 | | | | 152,479 | | | | 137,960 | |
| United States | | | 8,399 | | | | 9,154 | | | | 11,427 | | | | 76,758 | | | | 79,228 | | | | 85,457 | |
| Other countries | | | 51 | | | | 169 | | | | 477 | | | | 19,934 | | | | 16,283 | | | | 19,831 | |
| | | |
| | | |
| | | |
| | | |
| | | |
| | | |
| |
| Total | | | 4,324 | | | | 4,002 | | | | 6,785 | | | | 263,966 | | | | 247,990 | | | | 243,248 | |
| | | |
| | | |
| | | |
| | | |
| | | |
| | | |
| |
Basis of presentation of operating results—Expenses are matched against the revenues to which they relate. Indirect expenses, such as overhead expenses and any revenue that may be associated thereto, are allocated to the operating groups using appropriate allocation formulas applied on a consistent basis. For each currency, the net income effect of funds transferred from any group with a surplus to any group with a shortfall is at market rates for the currency and appropriate term. Segmentation of assets by geographic region is based upon the geographic location of the unit responsible for managing the related assets, liabilities, revenues and expenses. Provisions for credit losses allocated to the client operating groups are based on expected losses over an economic cycle. Differences between expected loss provisions and required periodic provisions under GAAP are allocated to Corporate Support. Periodically, certain lines of business and units within them are transferred between operating groups to more closely align BMO’s organizational structure and its strategic priorities. All comparative figures are restated to give effect to the transfers. During the year, certain enhancements were reflected in transfer pricing related to our Harris Bank businesses. Concurrently with these enhancements, certain portfolios were transferred from the operating groups to Corporate Support. In addition, refinements to funding charging methods and cost allocations were implemented. All of these enhancements were largely implemented retroactively and the results of prior periods for the operating groups and Corporate Support have been restated accordingly.
BMO FINANCIAL GROUP 186TH ANNUAL REPORT 2003 27
Management’s Discussion and Analysis of Operations and Financial Condition
PERSONAL AND COMMERCIAL CLIENT GROUP
| | Robert W. Pearce
President and Chief Executive Officer, Personal and Commercial Client Group — Canada | |
| |
| | “SARS, West Nile, Mad Cow, Forest Fires, Blackouts, Hurricanes — what a year. I am particularly proud of the role our employees have played in dealing with these challenges as both concerned members of their local communities and compassionate bankers.” | |
| | | | |
| | Group Description and Strategy in Canada Personal and Commercial Client Group — Canada assists more than seven and a half million customers with their financial services needs. Our highly skilled financial service providers offer a full range of products and services through 970 BMO Bank of Montreal traditional and instore branches, telephone banking, online banking at bmo.com, and our network of more than 2,000 automated banking machines. | |
| |
| | Our goal is to be the only financial services provider our personal and commercial banking customers ever need. We will reach this goal by providing our customers with fully satisfying transactional sales and service and customized solutions that help them better manage all aspects of their financial affairs. This will help us achieve our objective of delivering strong and sustainable financial performance. |
| | | | |
| | 2003 Group Objectives and Achievements in Canada | |
| |
| | Drive revenue growth by improving customer retention and loyalty, expanding existing customer relationships and acquiring new customers. These objectives will be supported by sustaining continued improvements in our distribution capabilities. | |
| |
| | • | P&C achieved solid revenue growth of 6.6% in Canada, which represented top-tier performance relative to our major competitors in an increasingly competitive environment. | |
| |
| | Continue to drive improvements in productivity. | |
| |
| | • | Our balanced focus on revenue growth and operational effectiveness enabled us to improve our productivity ratio by 142 basis points (bps) in the year to 60.3%. We had a 250 bps improvement in the last six months relative to the same period a year ago, providing us with strong momentum for 2004. | |
| |
| | Continue to improve our customer loyalty scores and close the shortfall relative to the competition in both the personal and business banking segments. | |
| |
| | • | Our customer loyalty scores, as measured by an independent third party, did not improve for personal banking; however, business banking scores improved by 290 bps. Our loyalty scores did not improve relative to the average of our competition. This was a result of the significant change initiatives during the year designed to improve our sales and service capabilities over the long term. We believe these capabilities will help drive the desired improvements in customer loyalty next year and beyond. | |
| |
| | Leverage our position in Commercial and Business Banking to continue to build momentum in balance sheet and market share growth. | |
| |
| | • | We increased our share of business banking loans under $5 million by 12 bps to 19.60% over the past 12 months, maintaining our second-place ranking and closing the gap relative to the leader by more than 40 bps. | |
| |
| | • | Commercial Banking’s loan growth was almost double the 6% forecasted general market growth rate. | |
| |
| | Extend the services offered through our online banking channel. | |
| |
| | • | Based on extensive customer testing and feedback, we completely overhauled our online channel to provide simple, clear and intuitive access to our 36 online function and service areas. This redesign was supplemented by the introduction of e-mail money transfers, multiple and post-dated bill payments, automated account openings and enhanced U.S. dollar transaction functionality. | |
| | | | |
| | 2004 Group Objectives in Canada | |
| |
| | • | Continue to focus on revenue growth and improving operational efficiency, while building our distribution capabilities, in order to drive improvements in productivity. We are targeting to improve our cash productivity ratio by 150 to 200 bps in 2004. | |
| |
| | • | Improve customer loyalty in both the personal and business banking segments. | |
| |
| | • | Increase our business banking market share at a higher rate than our major competitors and reduce the gap relative to the market leader. | |
| |
| | �� | Increase our personal banking market share relative to our major competitors. | |
| | | | |
Business Environment and Outlook in Canada
In 2003, interest rates started to increase at the end of the second quarter; however, these increases had been reversed by the end of the year. As such, even the limited levels of relief from spread compression on retail deposits in 2003 was short-lived. Low rates, however, continued to drive exceptionally strong home sales and high consumer demand for mortgages. Continued weakness in equity markets over much of the year promoted growth in interest bearing deposits; however, the increase was significantly less than that experienced in 2002.
Looking ahead to 2004, we expect that short-term interest rates will not rise from their current historic low levels until the middle of the year. This will limit the expected benefits of spread decompression on retail deposits in the year ahead. Market growth in residential mortgages and consumer loans is expected to moderate slightly from 2003 but remain relatively strong at approximately 6%. Growth in retail and commercial deposits is expected to be healthy, albeit lower than in 2003, as the economy and equity markets improve. Growth in business investment is expected to produce commercial loan growth of more than 4%.
28 BMO FINANCIAL GROUP 186TH ANNUAL REPORT 2003
Management’s Discussion and Analysis of Operations and Financial Condition
Canadian Overview
During the year, we continued to make significant progress in strengthening our sales and service capabilities and operational effectiveness.
We completed the rollout of Pathway Connect, our new sales and service technology platform. Pathway Connect makes it easier for our staff to serve customers by reducing wait times and improving the quality of our customer interactions. Early in the year, we introduced Optimizer — our customer knowledge, workflow management and decision support software — to our Business Banking and Direct Banking sales forces. It improves our ability to offer clients relevant solutions, at the right time, consistently across all channels.
We completed the redesign of our branch sales and service organization structure as part of our multi-year plan to improve the alignment of our people with our business strategy.
Consistent with our goal of providing our customers with complete financial solutions, we increased inter-group referrals of lending, deposit and investment products with our partner, Private Client Group.
We opened 18 new branches in 2003 and announced our commitment to open 80 new instore branches over the next five years.
2004 Focus
| • | | Continue building our distribution capabilities while improving productivity. |
| • | | Roll out Optimizer to our retail banking and investment sales forces. |
| • | | Improve the effectiveness of our sales and service staff by better aligning them with our customers’ needs and the markets in which they operate. |
| • | | Invest in significant process improvements that will provide our customers with a simple, seamless and intuitive experience across and within distribution channels. In 2004, we will be laying the foundation for a single end-to-end sales and service process across distribution channels. We will do so by building on accurate and comprehensive customer data, integrated tools, automated processing and the elimination of paper-based application forms. |
| • | | Open new instore and traditional branches and improve existing branches through relocations, consolidations and renovations. |
Personal Banking Segment
Description and Strategy
Our focus for 2004 will be on providing our personal banking customers with a fully satisfying, coordinated, multi-channel transactional sales and service experience, together with customized solutions for their everyday banking, financing, investing and insurance needs.
2003 Overview
Competition increased in 2003 as the major banks shifted their focus to retail banking, while direct channel players matured and mortgage and deposit brokers continued to capture an increasing share of sales. Our response has been to continue to focus on adding value through customized solutions that address customers’ financial needs, enhancing our distribution capabilities and offering competitive products and services.
Our ability to provide customized solutions is supported by the approximately 600 financial planners and 200 investment advisors located in our branches, who specialize in investment and retirement planning. Our capabilities are being enhanced by the introduction of Optimizer to our Direct Banking sales and service staff and the completion of the Pathway Connect rollout in all our branches and call centres. During the year, we enhanced the competitiveness of our Premium Rate Savings Account by removing the tiered interest rate structure. We also introduced special mortgage rate offers and attracted more credit card business with the flexible benefits offered by Mosaik MasterCard.
Our personal banking market share, as determined by us using personal products market data as available from the Canadian Bankers Association, declined 32 bps over the 12 months ended September 30, 2003. This decline represents average performance relative to our major competitors, reflecting the competitive environment and the impact of price-based participants in our markets.
2004 Focus
| • | | Increase our personal banking market share relative to our major competitors. |
| • | | Continue to utilize our integrated sales and marketing efforts to provide relevant and timely solutions to our customers. |
| • | | Improve our use of Air Miles®8 rewards to attract new customers and improve retention. |
| • | | Aggressively attract and retain mortgage business with special rate offers on selected products and continued participation in the mortgage broker channel. |
| • | | Improve and leverage the capabilities of our instore branches as we expand our network to better serve our customers and their need for convenient, multi-channel access. |
Commercial Banking Segment
Description and Strategy
The Commercial banking segment includes both Business and Commercial Banking clients. We provide our Business Banking clients — independent business, small and medium enterprises, and lower mid-market banking — with a full range of banking products and services, including cash management and loans and deposits, through our branches and direct banking channels. For our Commercial mid-market clients, we provide a full suite of integrated advisory services and products that include senior debt financing, asset-based lending, mezzanine and private equity financing, cash management, treasury, mergers and acquisitions, and cross-border financing. Our objective is to have our experienced professional staff provide the advice and customized solutions our clients need to be successful.
BMO FINANCIAL GROUP 186TH ANNUAL REPORT 2003 29
Management’s Discussion and Analysis of Operations and Financial Condition
2003 Overview
During 2003 our customers experienced a difficult environment with such unforeseen events as SARS, a ban on Canadian beef exports, forest fires, hurricanes and a power outage in Ontario. We helped our customers face these challenges by offering special lending rates and repayment options. We also launched our Premium Rate Savings Account for business in the fourth quarter, continued to build our cash management sales force and launched new cash management products. These initiatives helped expand our Business Banking market share (loans less than $5 million) by 12 bps to 19.60% over the past 12 months. This helped us maintain our second-place ranking and narrow the gap relative to the market leader by over 40 bps, to 393 bps, advancing our longer-term goal of market leadership.
Commercial Banking continued to grow strongly, reflecting overall success in the market and an expansion strategy that included cash management. This success was reflected in our 2003 customer survey results, which showed Commercial Banking to be an industry leader, delivering high levels of personalized professional service that clients value highly.
2004 Focus
| • | | Increase market share by continuing to build BMO Bank of Montreal’s reputation as the bank for business banking. |
| • | | Continue to build our cash management sales force. |
| • | | Improve our capabilities for serving the business, personal and wealth management needs of our Independent Business customer segment. |
| • | | Build on our capabilities to serve specific professional client groups that we find attractive, designing approaches and solutions tailored to their specific needs. |
| • | | Continue to expand our Commercial Banking business through our industry-leading suite of fully integrated products and services delivered by our highly skilled account managers. |
Harris Chicagoland Banking
Frank J. Techar
President and Chief Executive Officer, Harris Bank
“I’m excited about the opportunities we have in the market and our progress over the past year. Competition is intensifying, but we’re taking it on and winning by focusing on our customers. Our community banks deliver personal service built on deep local knowledge and commitment. We’re also adding branches to an already strong distribution presence and continuing to build on the strength of the Harris brand.”
Group Description and Strategy in the United States
Harris Chicagoland Banking serves personal and business clients with a full suite of financial products and services through an effective community bank model that emphasizes local knowledge and commitment. We strive to excel at sales management disciplines, at customer service supported by a premier network of convenient, attractive branches and at leveraging the capabilities of our Investment Banking Group and Private Client Group business partners. Our strategic objective is to be the leading and most successful bank in all of our chosen markets.
2003 Group Objectives and Achievements in the United States
Continue to drive improvements in productivity.
| • | | We improved our productivity ratio by 210 bps. |
Continue to target a US$1 billion increase in retail and small business loans.
| • | | We increased loans by US$2 billion or 25% on the strength of mortgage and other consumer loan growth. We maintained strong momentum in a difficult market environment to produce growth of 11% in business banking balances. |
Grow market share in Chicagoland by expanding our distribution network through a combination of new branch openings and acquisitions.
| • | | We opened nine new branches, including seven in the fourth quarter, closed one and had 153 locations at the end of the year, surpassing our target. |
| • | | On November 24, subsequent to our year-end, we announced our intent to acquire Lakeland Community Bank in Lake County, Illinois. This US$34.6 million acquisition is expected to close by January 31, 2004 and will add US$171 million in assets and two locations to complement our existing branches in the Chicagoland area. |
2004 Group Objectives in the United States
| • | | Improve our cash productivity ratio by 150 to 200 bps. |
| • | | Continue to target a US$1 billion increase in retail and small business loans. |
| • | | Migrate to a single commercial deposit processing system to simplify customer transaction processing. |
| • | | Expand the reach of our branch banking franchise by adding 10 branch locations to our network while also pursuing in-market and out-of-market acquisitions in contiguous states and/or other high-growth markets. We are targeting 165 locations at the end of fiscal 2004, growing to 200 over the next four years. |
Business Environment and Outlook in the United States
The competitive landscape has intensified as new and existing competitors try to capture market share; many have announced significant branch expansion plans. Others are entering the market with traditional or unique distribution offers or are significantly increasing brand marketing.
The Chicagoland market is still highly fragmented, with more than 250 banks and only an estimated 27% personal and small business market share for the three largest banks combined. Although national and regional players are growing in retail and small business banking, we are committed to defending and growing our position, and therefore we expect some margin pressure
30 BMO FINANCIAL GROUP 186TH ANNUAL REPORT 2003
Management’s Discussion and Analysis of Operations and Financial Condition
in the next two to three years in our home market. In the longer term, competitive pressures should subside and profitability should improve. We expect the larger players to reap the benefits of these developments and we intend to be one of those players.
We expect that the Chicagoland market will remain quite attractive for the foreseeable future and experience growth on par with the overall economy. Demand for consumer credit should continue to generate healthy profits across most creditworthy client segments and affluent customers should continue to fuel strong, profitable growth in assets under management. Lastly, the financial needs of small business clients should expand with an economic recovery as well as continue to grow in volume and complexity, creating new opportunities.
U.S. Overview
This year was particularly satisfying. We were disciplined and focused on executing our strategy to be the leading and most successful bank in our chosen markets, and our success was reflected in both volume growth and improved productivity. Dedicated employees continue to make the difference for our one million personal and business customers. In addition, investments in the expansion of our branch network in Chicagoland position us for market share growth while providing even more convenient access for our customers.
Our loan and deposit growth in both retail and business banking exceeded our targets for the year and we believe will compare favourably to our peer group. Volumes also grew in our indirect auto lending business, both in Illinois and elsewhere, and we profited from the highest origination levels ever in our mortgage business. Through our partnership with our PCG colleagues, we enhanced our client offering by launching Harris Asset Manager, a new product that integrates our banking and brokerage capabilities. We continued to focus on driving productivity improvements that give us the flexibility to fund initiatives that enhance the customer experience.
In 2004, we will continue execution of our strategy, focusing on continued community branch expansion and making it easier for our customers to do business with us.
2004 Focus
| • | | Integrate and leverage the Lakeland Community Bank acquisition to expand our customer base in the fast-growing Lake County market. |
| • | | Increase convenient branch access by adding 10 new locations and piloting branch merchandising strategies. |
| • | | Expand our suite of business products by leveraging our new single commercial deposit processing system. |
| • | | Explore opportunities to improve operational efficiency while maintaining our focus on providing a superior community-based customer experience. |
Personal and Commercial Client Group Financial Results
Personal and Commercial Client Group net income rose $128 million or 16% to $946 million. The increase was due to higher revenue and a lower effective tax rate.
Revenue increased $243 million or 5%, driven by strong volume growth in both Canadian and U.S. operations. In Canada, the personal banking segment posted strong gains, led by increases in retail deposits, card services and residential mortgages. Revenue was substantially unchanged in the United States as the effect of strong deposit and loan growth was offset by the impact of the lower Canadian/U.S. dollar exchange rate, which reduced revenue in 2003 by $74 million. In Canada, the low interest rate environment supported consumer loan growth, and record home sales supported growth in mortgage lending. The introduction of our Mosaik MasterCard helped increase card services revenue. Revenue growth was also attributable to significant increases in inter-group referrals with Private Client Group, and was supported by our initiatives to improve our sales and service capabilities over the past year and improve our customer experience. Our commercial banking segment revenue also improved in spite of the economic events of 2003, which had a pronounced impact on the business community.
Personal and Commercial Client Group($ millions, except as noted)
| | | | | | | | | | | | | |
| As at or for the year ended October 31 | | 2003 | | | 2002 | | | 2001 | |
| |
| |
| |
|
| Net interest income (teb) | | | 3,319 | | | | 3,099 | | | | 2,973 | |
| Non-interest revenue | | | 1,451 | | | | 1,428 | | | | 1,363 | |
| | | |
| | | |
| | | |
| |
| Total revenue (teb) | | | 4,770 | | | | 4,527 | | | | 4,336 | |
| Provision for credit losses | | | 301 | | | | 280 | | | | 267 | |
| Non-interest expense | | | 3,008 | | | | 2,932 | | | | 2,795 | |
| | | |
| | | |
| | | |
| |
| Income before income taxes, non-controlling interest in subsidiaries and goodwill amortization | | | 1,461 | | | | 1,315 | | | | 1,274 | |
| Income taxes (teb) | | | 511 | | | | 495 | | | | 503 | |
| Non-controlling interest | | | 4 | | | | 2 | | | | — | |
| Amortization of goodwill, net of applicable income taxes | | | — | | | | — | | | | 23 | |
| | | |
| | | |
| | | |
| |
| Net income | | | 946 | | | | 818 | | | | 748 | |
| | | |
| | | |
| | | |
| |
| Amortization of goodwill and intangible assets (after tax) | | | 30 | | | | 32 | | | | 48 | |
| | | |
| | | |
| | | |
| |
| Cash net income | | | 976 | | | | 850 | | | | 796 | |
| | | |
| | | |
| | | |
| |
| Net economic profit | | | 524 | | | | 416 | | | | 444 | |
| Return on equity (%) | | | 23.0 | | | | 20.6 | | | | 23.8 | |
| Cash return on equity (%) | | | 23.8 | | | | 21.5 | | | | 25.5 | |
| Non-interest expense-to-revenue ratio (%) | | | 63.1 | | | | 64.8 | | | | 64.5 | |
| Cash non-interest expense-to-revenue ratio (%) | | | 62.4 | | | | 64.0 | | | | 63.9 | |
| Average net interest margin (%) | | | 3.02 | | | | 3.04 | | | | 3.21 | |
| Average common equity | | | 3,944 | | | | 3,785 | | | | 2,971 | |
| Average assets | | | 109,911 | | | | 102,051 | | | | 92,734 | |
| Total risk-weighted assets | | | 72,192 | | | | 66,795 | | | | 61,332 | |
| Average current loans | | | 104,232 | | | | 95,903 | | | | 87,405 | |
| Average deposits | | | 56,475 | | | | 54,170 | | | | 45,521 | |
| Assets under administration | | | 11,295 | | | | 14,452 | | | | 15,504 | |
| Assets under management | | | — | | | | 371 | | | | 486 | |
| Full-time equivalent staff | | | 19,499 | | | | 19,242 | | | | 19,120 | |
| | | |
| | | |
| | | |
| |
BMO FINANCIAL GROUP 186TH ANNUAL REPORT 2003 31
Management’s Discussion and Analysis of Operations and Financial Condition
Net interest margin in Canada was modestly higher than in 2002, but was declining later in the year in response to low interest rates and a competitive retail environment that drove changes in customer product preferences. Given the interest rate outlook and the competitive landscape, further margin pressures are expected for the foreseeable future. In the United States, net interest margin was down, but was improving in the fourth quarter in response to volume growth, supported by pricing efforts.
Non-interest expenses rose $76 million or 3% to $3,008 million. In Canada, expenses were up 4% as higher performance-based compensation costs, higher employee benefit costs and spending on initiatives to improve customer service more than offset the effects of initiatives to contain costs. In the United States, non-interest expenses declined 3%. The lower U.S. dollar reduced costs by $60 million. The group’s non-interest expense-to-revenue ratio improved 171 basis points to 63.1%, as both Canadian and U.S. operations achieved productivity gains.
U.S. Operations Financial Results
Net income from U.S. operations represented 10% of total Personal and Commercial Client Group net income for the year, compared with 11% for fiscal 2002. The modest change is primarily attributable to the strong growth in results of Canadian personal and commercial banking, and to the weakness of the U.S. dollar. BMO’s corporate banking operations in the United States are concentrated among mid-market corporate clients, which BMO manages and reports in our Investment Banking Group operations because of the enhanced opportunities to cross-sell products. BMO’s North American peers typically include similar businesses in their personal and commercial banking units. The table below shows the effects of including this U.S.-based mid-market business in Personal and Commercial Client Group on a pro-forma basis and provides more geographic detail on results. The table reflects the inclusion of $574 million of corporate mid-market revenue and $215 million of net income in U.S. results for the year.
If results of the U.S. mid-market banking unit were included in Personal and Commercial Client Group results, net income from U.S. operations would represent 27% of the group’s earnings in the year, compared with 10% as currently reported. Revenue, after including the U.S. mid-market banking unit, would be 26%, compared with 17% as currently reported. The non-interest expense-to-revenue ratio would be 59.6%, compared with the 63.1% currently reported.
Personal and Commercial Client Group adjusted to include U.S.-Based Mid-Market Business(Canadian $ in millions, except as noted)
| | | | | | | | | | | | | | | | | | | |
| | for the year ended October 31 | | | | | | | | | Change | | |
| |
| | | | | | | | |
| | |
| | | | 2003 | | | 2002 | | | $ | | | % | | |
| | |
| |
| |
| |
| | |
| | Canada — revenue | | | 3,942 | | | | 3,696 | | | | 246 | | | | 7 | | |
| | United States — revenue | | | 1,402 | | | | 1,418 | | | | (16 | ) | | | (1 | ) | |
| | | | |
| | | |
| | | |
| | | |
| | |
| | Total revenue (teb) | | | 5,344 | | | | 5,114 | | | | 230 | | | | 4 | | |
| | | | |
| | | |
| | | |
| | | |
| | |
| | Canada — net income | | | 848 | | | | 726 | | | | 122 | | | | 17 | |
| | United States — net income | | | 313 | | | | 288 | | | | 25 | | | | 8 | |
| | | | |
| | | |
| | | |
| | | |
| | |
| | Total net income | | | 1,161 | | | | 1,014 | | | | 147 | | | | 14 | |
| | | | |
| | | |
| | | |
| | | |
| | |
| | Canada — return on equity (%) | | | 29.6 | | | | 27.3 | | | | | | | | 2.3 | |
| | United States — return on equity (%) | | | 13.7 | | | | 11.5 | | | | | | | | 2.2 | |
| | | | |
| | | |
| | | |
| | | |
| | |
| | Total return on equity (%) | | | 22.6 | | | | 19.7 | | | | | | | | 2.9 | |
| | | | |
| | | |
| | | |
| | | |
| | |
| | Canada — non-interest expense-to-revenue ratio (%) | | | 60.3 | | | | 61.7 | | | | | | | | (1.4 | ) | |
| | United States — non-interest expense-to-revenue ratio (%) | | | 57.6 | | | | 59.1 | | | | | | | | (1.5 | ) |
| | | | |
| | | |
| | | |
| | | |
| | |
| | Total non-interest expense-to-revenue ratio (%) | | | 59.6 | | | | 61.0 | | | | | | | | (1.4 | ) | |
| | | | |
| | | |
| | | |
| | | |
| | |
| |
32 BMO FINANCIAL GROUP 186TH ANNUAL REPORT 2003
Management’s Discussion and Analysis of Operations and Financial Condition
PRIVATE CLIENT GROUP
Gilles G. Ouellette
President and Chief Executive Officer, Private Client Group, BMO Financial Group and Deputy Chair, BMO Nesbitt Burns
“We are continuously focused on satisfying the needs of our clients. We strive to provide the best, most innovative and competitive wealth management products and services, and we believe our success comes from superb execution and putting the needs of our clients first.”
Group Description and Strategy
Private Client Group (PCG) brings together all of BMO Financial Group’s wealth management businesses. Operating as BMO Private Client Group in Canada and The Harris in the United States, PCG serves a full range of North American client segments, from mainstream to ultra-high net worth, as well as select institutional market segments. We offer our clients a broad range of wealth management products and services, including full-service and direct investing, private banking and investment products, providing the tools they need to accumulate, protect and grow their financial assets. Our goal is to fully leverage our integrated North American wealth management businesses to provide clients with a full suite of advice-driven and guided offerings. PCG’s total assets under management and administration, including term deposits, were $282 billion at October 31, 2003.
2003 Group Objectives and Achievements
Enhance our offering to retail and affluent clients through sales force growth and development, technology enhancement and integrated product and marketing initiatives.
| • | | Successfully enhanced client service levels through strategic investment in building and training our experienced sales force, as evidenced by the positive results of Full Service Investing’s national client survey completed in May 2003. |
| • | | Award-winning and recognized leadership in client service: |
| | • | | BMO Investor Line was ranked number one for the third consecutive time in Gómez Canada’s Direct Investing Report and for the second straight year asThe Globe and Mail’s selections as top choice in its online brokerage ranking report and as best online broker for self-directed RRSPs. |
| | • | | Harrisdirect®1 was ranked in the top quartile in Gómez Internet Broker Scorecard Survey of 20 U.S.-based discount brokers. |
| • | | Expanded range of offerings to Private Banking’s affluent clients by leveraging the unique service offerings of recently acquired wealth management businesses. |
Expand U.S. wealth management businesses through both selective acquisitions and organic growth while building on The Harris’ strong reputation as we expand into targeted new markets.
| • | | On November 1, 2002, we acquired select assets of myCFO, Inc., a California-based provider of customized investment and advisory services to ultra-high net worth clients, providing The Harris with entry to key markets in California, Colorado and Georgia. |
| • | | On January 17, 2003, we acquired Sullivan, Bruyette, Speros & Blayney Inc. (SBSB), a Virginia-based provider of open-access relationship-based financial planning, providing our affluent clients access to non-proprietary products in a comprehensive solutions-based offering. |
Further leverage relationships within our group and with BMO partners by providing an integrated sales approach and product offering to clients.
| • | | Improved referral activity within PCG and with our retail partner, Personal and Commercial Client Group, through client-focused partnering initiatives. |
| • | | Opened a new Chicago office, bringing newly acquired SBSB’s expertise in comprehensive financial planning to high net worth clients in the Chicago area, to complement Harris Private Bank’s existing offering. |
Continue to refine our businesses to enhance productivity and align our business units to ensure consistently successful results regardless of the business environment.
| • | | Achieved net income growth of 93% and productivity improvement of 500 basis points over the prior year, despite general market uncertainty and the conservative investor climate throughout most of fiscal 2003. |
| • | | Focused on enhancing productivity through reorganizing and realigning certain business units while successfully renegotiating various third-party service agreements without compromising client service. |
| • | | Pursued initiatives across all lines of business, focusing on sales force productivity, revenue generation and cost reductions to improve results, while enhancing client service and product offerings. |
Capitalize on our acquisitions to create synergies with existing businesses in order to accelerate our future growth.
| • | | Achieved meaningful cost reductions at Harrisdirectby reducing staff positions and optimizing call centre and branch sites. |
| • | | Added 110 planners, advisors and consultants to assist our clients through the acquisitions of myCFO and SBSB. |
2004 Group Objectives
| • | | Pursue opportunities that focus on deepening client relationships and building momentum in the high-growth affluent market segment. |
| • | | Enhance our business models by continuing to improve productivity and invest in our high-growth wealth management businesses. |
| • | | Focus on delivering the highest levels of service and integrated offerings to our clients by leveraging partnerships within PCG and across BMO Financial Group. |
| • | | Improve our cash productivity ratio by 150 to 200 bps. |
Business Environment and Outlook
Private Client Group operated in a conservative investment environment in 2003. While equity markets showed signs of a recovery in the latter half of fiscal 2003, soft labour markets continued to affect investor confidence. Despite the impact of these challenges, PCG continued to balance cost management with strategic investment to support our long-term client-focused strategy. The result was stronger financial results for the year.
We anticipate 2004 GDP growth rates of more than 4% in the United States and close to 3% in Canada. This bodes well in the short term for our wealth management businesses. With the expectation of more robust economic conditions, the wealth management industry should see improvement. Higher levels of investor confidence should lead to improved client trading volumes, while stronger equity markets should increase managed asset values and related fee-based revenues, such as mutual fund and discretionary managed product fees. We believe the long-term demographic trends continue to remain attractive, indicating strong demand for wealth management services well into the future. PCG continues to be well positioned to capitalize on these short-term and long-term trends with our integrated client service offerings.
BMO FINANCIAL GROUP 186TH ANNUAL REPORT 2003 33
Management’s Discussion and Analysis of Operations and Financial Condition
Lines of Business
Full-Service Investing
Description and Strategy
Full-Service Investing is offered through BMO Nesbitt Burns. Our strategy is to become our clients’ primary investment advisor by deepening relationships, and to build and manage their wealth by providing customized solutions.
2003 Overview
More active equity markets during the latter part of the fiscal year improved Full-Service Investing’s financial results, as we increased our Canadian market share, with asset levels reaching historic highs. Our Investment Advisors continued to strengthen and enhance relationships with their clients. We made significant progress in our ongoing efforts to train, equip and support our Investment Advisors to develop the best solutions for their clients.
2004 Focus
| • | | Continue to provide our clients with best-in-class wealth advisory solutions, meeting their full range of wealth management needs and allowing us to enhance new client relationships. |
| • | | Continue to work with our BMO Financial Group partners to deepen our relationships with existing clients. |
| • | | Continue to invest in the ongoing professional development of our Investment Advisors to support them in serving clients and in attracting new clients. |
North American Direct Investing
Description and Strategy
Direct Investing, which includes BMO InvestorLine and Harrisdirect, provides a self-guided investment experience for the informed long-term investor. We work with our partners in BMO Financial Group to enhance overall client relationships.
2003 Overview
Uncertain equity markets created a cautious investor climate for a large part of the fiscal year, leading to downward pressure on market performance and client trading activity, and slowing new account growth. In light of these pressures, we continued to focus on cost management, while providing award-winning service and investment and planning tools for the self-directed investor.
2004 Focus
| • | | Continue to provide an exceptional investment experience for self-directed investors while improving productivity. This will be achieved primarily by providing investment and planning tools that enhance our clients’ ability to manage their investments. |
| • | | Further enhance awareness of advisory capabilities available to U.S. clients through Harris AdvantEdge Investing®1products and services, and expand advisory capabilities to include in-person, call centre and online delivery channels. |
| • | | Continue to deepen client relationships by optimizing the opportunities available across BMO Financial Group. |
North American Private Banking
Description and Strategy
North American Private Banking offers integrated banking, trust and investment management services to high and ultra-high net worth clients in Canada and the United States. We leverage a client-driven model to deliver a complete range of financial products through an advisory approach.
2003 Overview
North American Private Banking’s service offering was broadened with the integration of myCFO and SBSB. Despite challenging market conditions for much of fiscal 2003, our focus remained on business retention, revenue enhancement, sales force initiatives and expense management.
2004 Focus
| • | | Provide our clients with integrated wealth management services to broaden existing relationships with affluent and high net worth clients. |
| • | | Continue to focus on revenue enhancement opportunities, deepening client relationships and improving efficiency. |
| • | | Optimize opportunities available through our BMO Financial Group partners to meet our clients’ needs. |
Investment Products
Description and Strategy
Investment Products includes BMO Mutual Funds, Guardian Group of Funds, Harris Insight Funds®1 and BMO Term Investments. We assist retail and commercial clients with investment and retirement planning by providing them with well diversified investment products and solutions through multiple distribution channels. Investment Products also provides institutional money management services to external and internal clients through Jones Heward Investment Counsel and Harris Investment Management.
2003 Overview
Assets under management and term investments were substantially unchanged from the prior year. Solid mutual fund sales and our competitive product offerings offset the effects of a conservative investor climate.
2004 Focus
| • | | Continue to enhance relationships with our Canadian and U.S. clients by providing strong investment performance and excellent client service, and by leveraging the strengths of our BMO Financial Group partners. |
| • | | Further enhance the client service capabilities of our sales force through training and education, as investors continue to seek advisory capabilities. |
34 BMO FINANCIAL GROUP 186TH ANNUAL REPORT 2003
Management’s Discussion and Analysis of Operations and Financial Condition
Private Client Group Financial Results
Private Client Group net income increased $65 million or 93% to $136 million. Earnings growth was achieved primarily through effective cost containment initiatives implemented in response to challenging market conditions, with moderate revenue growth. In the first half of 2003, the group generated $58 million or 42% of its total net income for the year, including a $13 million after-tax gain on TSX common shares. Fixed income products provided relatively stable earnings with their product appeal in the conservative investor climate, while market-sensitive client trading and fee-based revenues experienced downward pressure. In the latter half of 2003, the group earned $78 million or 58% of its total net income for the year. Earnings growth was achieved through the cost containment and revenue enhancement initiatives implemented earlier in the year. In 2002, $62 million ($39 million after tax) of acquisition-related costs were designated as non-recurring for reporting purposes.
Private Client Group acquired a number of businesses over the past two years. These acquisitions have incremental effects on revenue and expenses that impact the year-over-year comparison of operating results; these effects are explained on page 21.
Revenue increased $132 million or 8% to $1,795 million. Revenue growth was $27 million or 2% after adjusting for the incremental effects of acquired businesses. Improved earnings in Investment Products and moderate improvement in fee-based and client trading revenues contributed to the growth. The lower Canadian/U.S. dollar exchange rate lowered total revenue growth by 3 percentage points.
Non-interest expenses increased $33 million or 2% to $1,576 million, due primarily to the incremental effects of acquired businesses. There was significant progress in reducing expenses, which declined $60 million or 4%, after adjusting for the incremental effects of acquired businesses and last year’s acquisition-related expenses. Cost containment initiatives included reducing third-party service and technology costs, consolidating call centre and branch sites and reducing staff positions by 8%. The expense-to-revenue ratio was improved by 500 basis points from a year ago, consistent with our focus on improving productivity. The lower Canadian/U.S. dollar exchange rate reduced total expense growth by 4 percentage points.
U.S. operations incurred a net loss of $42 million in 2003, compared with a net loss of $60 million a year ago. Revenue of $576 million improved by $77 million but declined $27 million excluding the incremental effects of acquired businesses. Revenue growth was affected by narrowing spreads earned on loan products, the impact of weak equity markets on trust and investment fees earned, and the weaker U.S. dollar. Expenses of $636 million rose $39 million. Excluding the incremental effects of acquired businesses and last year’s acquisition-related costs, expenses declined $53 million or 11%. Expenses were reduced primarily through cost containment initiatives, the realization of synergies from businesses acquired in fiscal 2002 and the effects of the lower Canadian/U.S. dollar exchange rate.
Private Client Group($ millions, except as noted)
| | | | | | | | | | | | | |
| As at or for the year ended October 31 | | 2003 | | | 2002 | | | 2001 | |
| |
| |
| |
|
| Net interest income (teb) | | | 544 | | | | 522 | | | | 516 | |
| Non-interest revenue | | | 1,251 | | | | 1,141 | | | | 974 | |
| | | |
| | | |
| | | |
| |
| Total revenue (teb) | | | 1,795 | | | | 1,663 | | | | 1,490 | |
| Provision for credit losses | | | 2 | | | | 1 | | | | 2 | |
| Non-interest expense | | | 1,576 | | | | 1,543 | | | | 1,282 | |
| | | |
| | | |
| | | |
| |
| Income before income taxes, non-controlling interest in subsidiaries and goodwill amortization | | | 217 | | | | 119 | | | | 206 | |
| Income taxes (teb) | | | 81 | | | | 48 | | | | 89 | |
| Amortization of goodwill, net of applicable income taxes | | | — | | | | — | | | | 10 | |
| | | |
| | | |
| | | |
| |
| Net income | | | 136 | | | | 71 | | | | 107 | |
| | | |
| | | |
| | | |
| |
| Amortization of goodwill and intangible assets (after tax) | | | 47 | | | | 43 | | | | 28 | |
| | | |
| | | |
| | | |
| |
| Cash net income | | | 183 | | | | 114 | | | | 135 | |
| | | |
| | | |
| | | |
| |
| Net economic profit | | | (2 | ) | | | (32 | ) | | | 45 | |
| Return on equity (%) | | | 7.6 | | | | 4.8 | | | | 12.6 | |
| Cash return on equity (%) | | | 10.4 | | | | 8.0 | | | | 16.0 | |
| Non-interest expense-to-revenue ratio (%) | | | 87.8 | | | | 92.8 | | | | 86.0 | |
| Cash non-interest expense-to-revenue ratio (%) | | | 83.5 | | | | 89.3 | | | | 84.8 | |
| Average net interest margin (%) | | | 10.30 | | | | 9.58 | | | | 9.76 | |
| Average common equity | | | 1,677 | | | | 1,322 | | | | 821 | |
| Average assets | | | 5,282 | | | | 5,450 | | | | 5,294 | |
| Total risk-weighted assets | | | 4,540 | | | | 5,184 | | | | 4,420 | |
| Average current loans | | | 2,686 | | | | 3,060 | | | | 3,478 | |
| Average deposits | | | 41,575 | | | | 39,720 | | | | 39,869 | |
| Assets under administration | | | 170,255 | | | | 160,210 | | | | 130,548 | |
| Assets under management | | | 75,900 | | | | 74,981 | | | | 72,980 | |
| Full-time equivalent staff | | | 5,436 | | | | 5,902 | | | | 5,671 | |
| | | |
| | | |
| | | |
| |
BMO FINANCIAL GROUP 186TH ANNUAL REPORT 2003 35
Management’s Discussion and Analysis of Operations and Financial Condition
INVESTMENT BANKING GROUP
Yvan J.P. Bourdeau
President and Chief Operating Officer, BMO Nesbitt Burns
“The heart of our business philosophy is focused on analyzing the needs of our clients and then providing them with complete solutions that fit their specific business requirements — from complicated M&A assignments to capital raising to treasury and operating services.”
Group Description and Strategy
Investment Banking Group (IBG) combines all of the businesses serving corporate, institutional and government clients. In Canada, operating under the BMO Nesbitt Burns brand, our client base comprises large corporations and institutions across a broad range of industry sectors. In the United States, operating under the Harris Nesbitt brand, we serve mid-market corporate and institutional clients in selected sectors. IBG also serves institutional and government clients in the United Kingdom, Europe and Asia.
We offer clients complete financial solutions across the entire balance sheet, including treasury services, cash management, foreign exchange, trade finance, corporate lending, securitization, and public and private debt and equity underwriting. The group also offers leading financial advisory services in mergers and acquisitions and restructurings, while providing investing clients with industry-leading research, sales and trading services.
Our strategy is to build a full-service, integrated North American investment and corporate bank, capitalizing on industry specialties and distinctive capabilities.
2003 Group Objectives and Achievements
Maintain Canadian leadership in the high-return fee businesses of mergers and acquisitions, equity and debt underwriting, and securitization.
| • | | Participated in 617 Canadian corporate debt and equity transactions that raised $67 billion. |
| • | | Advised on $18.5 billion of completed Canadian mergers and acquisitions, more than any other investment bank. |
| • | | Ranked Top Overall Research Team in the Brendan Wood International Survey of institutional investors for the 23rd consecutive year. We also ranked first for Overall Quality of Sales Service. |
| • | | Canadian Securitization unit ranked first in market share of asset-backed commercial paper conduit outstandings. |
Continue to build on the success of the Harris Nesbitt mid-market franchise.
| • | | Acquired Gerard Klauer Mattison, adding a U.S. equity, sales and trading platform to complete our U.S.-based investment and corporate banking offering. |
| • | | Unified all U.S.-based investment and corporate banking activities under the Harris Nesbitt brand. |
Maintain a disciplined approach to cost and capital management.
| • | | Improved our productivity ratio by 410 bps to 51.5%. |
| • | | Decreased risk-weighted assets by $4.7 billion to $50.8 billion, contributing to improving ROE from 10.6% to 14.4%. |
Selectively expand into new products and trading strategies that relate to our areas of existing expertise.
| • | | Introduced Harris Nesbitt Mezzanine Fund, a private equity fund with US$75 million in authorized capital, which expands our offering to U.S. mid-market clients. |
| • | | Tripled research coverage of U.S.-based companies from 100 to 300 companies. |
| • | | U.S. Index Arbitrage team, formed in October 2002, exceeded net income targets by more than 200%. |
Further build on our strengths in targeted high-growth sectors and markets.
| • | | Expanded Media and Communications core broadcasting business and broadened sector focus. |
| • | | Expanded U.S. mid-market client base in sectors such as Business Services, Consumer, Media and Entertainment, Technology and Telecom, and Health Care. |
| • | | Improved securitization line of business net income by 38% year-over-year. |
| • | | Harris Nesbitt Energy Group expanded its client base by approximately 40%, doubling net income year-over-year. |
2004 Group Objectives
| • | | Maintain Canadian leadership in the high-return fee businesses of mergers and acquisitions, equity and debt underwriting, and securitization. |
| • | | Accelerate growth through further integration of our U.S. operations, with a focus on increasing the proportion of fee-based revenue. |
| • | | Deepen and broaden relationships with target clients by leveraging the full range of our cross-border capabilities, including enhancing our product offering through the full integration of Harris Nesbitt Gerard. |
| • | | Continue a disciplined approach to capital and cost management, and improve our cash productivity ratio. |
Business Environment and Outlook
The depressed global economic and capital market conditions of last year persisted in early 2003. Weak business activity levels were exacerbated by geopolitical uncertainties, a weakening U.S. dollar and a less favourable environment for interest-rate-sensitive businesses. The U.S. mid-market, where competition is considerable, was hit particularly hard. This was characterized by lower than normal utilization of credit facilities and depressed investment banking activity. In this continued difficult climate, the group’s diverse business mix proved its value by maintaining solid earnings growth.
Over the past several years, IBG remained committed to our strategy of expanding further in the lucrative U.S. market. We focused on repositioning ourselves in the competitive North American financial services industry by exiting low-return businesses, expanding our capabilities in key growth areas and aggressively managing costs. During the year we also aggressively managed capital by reducing non-core corporate lending balances and risk-weighted assets by more than $2 billion and $4.7 billion, respectively. In 2003, we acquired New York-based Gerard Klauer Mattison — operating as Harris Nesbitt Gerard (HNG) — which brings a U.S. equity research, sales and trading platform to our
36 BMO FINANCIAL GROUP 186TH ANNUAL REPORT 2003
Management’s Discussion and Analysis of Operations and Financial Condition
U.S. product capability, facilitating our transition into an integrated North American investment and corporate bank. Also, the group unified its U.S. operations under the established Harris Nesbitt brand.
We remain cautiously optimistic about the near term, as industry-wide weakness in financial markets is showing signs of abating. We have advanced our key strategic initiatives and are now well positioned for accelerated growth in North America. We anticipate benefiting from slow and steady improvement in the U.S. business environment. We expect Canadian economic growth of 3.1% and U.S. economic growth of 4.4% in 2004, up from an estimated 1.7% and 3.0%, respectively, in 2003.
Lines of Business
Investment and Corporate Banking
Description and Strategy
Investment and Corporate Banking (I&CB) provides a full suite of financial products and services to our clients. Services include strategic advice on mergers and acquisitions, restructurings and recapitalizations, as well as providing valuation and fairness opinions. We provide capital-raising services through debt and equity underwriting. We also provide a full range of loan and debt products, balance sheet management solutions and cash management services. Our strategy in Canada is to continue to reinforce our leadership position in key markets and products. In the United States, we will continue to grow a high-quality, focused and profitable investment and corporate bank serving key sectors of the U.S. mid-market.
2003 Overview
Despite soft market conditions and reduced client lending and transaction volumes, I&CB achieved solid results in 2003. Strong cost containment also contributed to our performance. The full impact of improved year-over-year results was less apparent because of the stronger Canadian dollar. The acquisition of HNG complements our U.S. platform by expanding our client base and completing our product offering. All U.S. businesses are now unified under the Harris Nesbitt brand.
2004 Focus
| • | | Continue to deepen and broaden relationships with targeted clients by providing them with relevant integrated financial solutions and superior service. |
| • | | Leverage the full breadth of our expanded capabilities in Canada and the United States and in cross-border activities. |
| • | | Remain focused on improving our profitability, productivity and return on equity. |
Capital Markets
Description and Strategy
The Capital Markets line of business provides integrated debt, currency, interest rate, credit and commodity solutions to targeted wholesale, commercial and retail clients. We also provide efficient funding and liquidity management to BMO Financial Group and its clients.
2003 Overview
Capital Markets used its business diversity to generate strong net income despite difficult market conditions. Client activity improved in 2003, as spreads narrowed in a flatter yield curve environment. We benefited from our 2002 investment in U.S. debt origination and credit derivatives franchises, which contributed strong revenue growth. We also initiated a Performance Enhancement Program, which has resulted in improved cost containment and enhanced revenue diversification with an emphasis on client transactions.
2004 Focus
| • | | Deepen and expand client relationships, while broadening our product offering in growth areas such as interest rate, commodity and credit derivatives. |
| • | | Expand enterprise-wide integrated client coverage initiatives. |
| • | | Leverage the strengths of our newly integrated HNG subsidiary. |
| • | | Continue a disciplined approach to achieving our productivity and return targets. |
Equity Division
Description and Strategy
The Equity Division offers a comprehensive suite of Canadian equity products globally. These products are complemented by high-quality sales, trading and research capabilities, and an intense focus on client service. We continue to maintain and enhance our leadership position in Canada, while selectively growing our product base in the United States. Newly acquired HNG will provide the U.S. equity platform needed to deliver a full product offering to the Harris Nesbitt client base.
2003 Overview
Equity Division performance was solid despite weakness in financial markets continuing into 2003. Accelerated deal flow in the primary markets and expanded derivatives capabilities more than offset a contraction in commission revenue. For the 23rd consecutive year, the Brendan Wood International Survey ranked BMO Nesbitt Burns Top Overall Research Team. The survey also ranked us first in execution and quality of sales. Greenwich Associates also ranked us Top Overall Research Team in 2003.
2004 Focus
| • | | Enhance our product offerings through the integration of Harris Nesbitt Gerard’s research, sales and trading platform. |
| • | | Continue to focus on growth from derivatives capabilities. |
| • | | Introduce new delivery methods and formats for Equity Research. |
| • | | Create specialized sales and trading coverage teams for segments of the institutional market. |
BMO FINANCIAL GROUP 186TH ANNUAL REPORT 2003 37
Management’s Discussion and Analysis of Operations and Financial Condition
Securitization and Credit Investment Management
Description and Strategy
Securitization and Credit Investment Management (CIM) offer both issuers and investors products and services that use credit as a tool for asset management and funding alternatives. Our strategy is to use our existing capabilities to grow our highly profitable, low-capital-intensive, market-leading structured credit business and provide stable, annuity-like fee income and material ancillary business for other lines of business.
2003 Overview
Securitization and Credit Investment Management performed well in 2003, increasing fee-based revenue 16%. Securitization reaffirmed its dominant market leadership in Canada and profitable mid-market focus in the United States. This was achieved through innovation in structuring solutions and asset classes, and a broadening of alternative revenue sources. In the United Kingdom, CIM’s portfolio management skills continued to provide a competitive advantage as we increased our investor base and our assets under management to US$13 billion and delivered consistent performance.
2004 Focus
Securitization
| • | | Maintain our leadership position in Canada and remain a recognized niche player in the United States by focusing on innovative structuring solutions in new and existing market segments. |
| • | | Diversify revenue sources through accessing third-party liquidity, new asset classes and selective credit enhancement. |
CIM
| • | | Continue to increase assets under management and third-party capital in line with market growth. |
International
Description and Strategy
The International line of business provides high-quality trade finance, correspondent banking, financing and other bank services to financial institutions and corporate clients. We continue to pursue a strategy of prudently supporting our North American clients in key international markets, while providing international financial institutions with superior North American service.
2003 Overview
The year 2003 was a challenging one, as uncertain economic conditions and a weak U.S. dollar reduced the number of export and import transactions early in the year. Stronger correspondent banking business and improving conditions in the second half of the year led to satisfactory results overall in the international banking sector.
2004 Focus
| • | | Maintain our leadership in trade finance and grow our business in those markets where we have distinctive product and risk assessment capabilities. |
| • | | Continue to promote our unique Canadian and U.S. correspondent banking capabilities internationally. |
Merchant Banking
Description and Strategy
The Merchant Banking line of business operates through BMO Halyard Partners and BMO Equity Partners. We source, structure and finance private equity investments, primarily in North America. Our strategy is to produce superior returns over time by capitalizing on proprietary information flows to build and manage a portfolio of private equity investments in mid-market companies.
2003 Overview
Weakening economic conditions early in 2003 created a climate of uncertainty in financial markets and affected overall commitment levels and our performance. We strengthened our merchant banking business by restructuring our operations to better align our institutional priorities with the other IBG lines of business. An example of this is the newly created Harris Nesbitt Mezzanine Fund, which is aligned with the Harris Nesbitt mid-market strategy. At year-end, the marketplace was producing attractive returns and structures as the economy showed signs of recovery.
Increased liquidity in the high-yield market, signs of activity in the initial public offering marketplace and a slow but steady improvement in the economy are fueling increased deal activity and more exit opportunities for our direct and indirect investment portfolios.
2004 Focus
| • | | Continue to selectively pursue investments that will achieve superior returns as demand for private equity investing increases. |
| • | | Generate more investment realizations from our direct and indirect investment portfolios in the more favourable capital markets environment. |
Investment Banking Group Financial Results
Investment Banking Group net income rose $121 million or 20% to $722 million. The improvement was attributable to both higher revenue and lower expenses. Notwithstanding the improved results, difficult capital markets and uncertain North American economic conditions persisted into 2003 and client activity levels remained weak. Income was further affected by the weakening of the U.S. dollar in 2003.
Revenue increased $108 million or 4% to $2,656 million. Revenue in 2003 was reduced $127 million by the lower Canadian/U.S. dollar exchange rate, while the year-over-year comparison benefited from a $92 million reduction in net investment securities losses in 2003. A robust income trust market drove higher equity origination fees. Despite a challenging market environment, trading-related revenue was up $149 million or
38 BMO FINANCIAL GROUP 186TH ANNUAL REPORT 2003
Management’s Discussion and Analysis of Operations and Financial Condition
44%, benefiting from selective expansion into new products and trading strategies that related to our areas of expertise and the expanded application of our taxable equivalent basis accounting, as explained on page 22. Commodities derivatives trading revenue was also up sharply, due to the gain on termination of certain positions with a counterparty which, as explained in Note 25 on page 97 to the financial statements, has initiated legal action in connection with the termination. Merger and acquisition revenues were up modestly. Interest income was lower due to the narrowing of spreads earned as higher-yielding assets mature, reflecting a flatter yield curve environment. Corporate lending volumes were also lower due to the weaker business environment and our strategy of exiting non-core lending relationships.
The provision for credit losses was essentially unchanged from a year ago at $231 million. While BMO’s provisions for credit losses were down substantially from a year ago, BMO’s practice is to charge loss provisions to the client operating groups each year using an expected loss provision methodology based on the group’s share of expected credit losses over an economic cycle. Corporate Support is charged for differences between expected loss provisions charged to the client groups and provisions required under GAAP.
Non-interest expenses were $49 million or 3% lower than in 2002, despite the inclusion of expenses related to Harris Nesbitt Gerard. In 2003, the lower value of the U.S. dollar reduced expenses by $51 million. Employee costs were down from the prior year because of reductions in performance-based compensation and staffing levels. Premises and other expenses were also lower.
The acquisition of Gerard Klauer Mattison in the latter part of 2003 added $17 million to the group’s revenue and $26 million in costs.
Net income from U.S. operations represented 37% of group net income for the year, compared with 57% in 2002. The negative effects of economic uncertainty on client transaction volumes and the weakness in the U.S. dollar that persisted through 2003 contributed to the reduction. Improved performance from Canadian operations also affected U.S. operations’ share of group net income in 2003.
Our U.S. investment banking operations are primarily directed at mid-market corporations having revenues that range from US$50 million to US$1 billion. In 2003, the revenue from our mid-market portfolio represented 22% of total group revenue and 44% of our U.S. revenue. Often such activities are included in personal and commercial banking units by our North American peers. Pro-forma results, reflecting our U.S.-based mid-market business as part of Personal and Commercial Client Group, are included on page 32.
Investment Banking Group($ millions, except as noted)
| | | | | | | | | | | | | |
| As at or for the year ended October 31 | | 2003 | | | 2002 | | | 2001 | |
| |
| |
| |
|
| Net interest income (teb) | | | 1,394 | | | | 1,480 | | | | 1,445 | |
| Non-interest revenue | | | 1,262 | | | | 1,068 | | | | 1,301 | |
| | | |
| | | |
| | | |
| |
| Total revenue (teb) | | | 2,656 | | | | 2,548 | | | | 2,746 | |
| Provision for credit losses | | | 231 | | | | 227 | | | | 528 | |
| Non-interest expense | | | 1,367 | | | | 1,416 | | | | 1,507 | |
| | | |
| | | |
| | | |
| |
| Income before income taxes, non-controlling interest in subsidiaries and goodwill amortization | | | 1,058 | | | | 905 | | | | 711 | |
| Income taxes (teb) | | | 336 | | | | 304 | | | | 246 | |
| Amortization of goodwill, net of applicable income taxes | | | — | | | | — | | | | 7 | |
| | | |
| | | |
| | | |
| |
| Net income | | | 722 | | | | 601 | | | | 458 | |
| | | |
| | | |
| | | |
| |
| Amortization of goodwill and intangible assets (after tax) | | | — | | | | — | | | | 7 | |
| | | |
| | | |
| | | |
| |
| Cash net income | | | 722 | | | | 601 | | | | 465 | |
| | | |
| | | |
| | | |
| |
| Net economic profit | | | 179 | | | | 6 | | | | (67 | ) |
| Return on equity (%) | | | 14.4 | | | | 10.6 | | | | 8.9 | |
| Cash return on equity (%) | | | 14.4 | | | | 10.6 | | | | 9.0 | |
| Non-interest expense-to-revenue ratio (%) | | | 51.5 | | | | 55.6 | | | | 54.9 | |
| Cash non-interest expense-to-revenue ratio (%) | | | 51.5 | | | | 55.6 | | | | 54.9 | |
| Average net interest margin (%) | | | 0.97 | | | | 1.08 | | | | 1.04 | |
| Average common equity | | | 4,637 | | | | 5,112 | | | | 4,487 | |
| Average assets | | | 144,449 | | | | 136,487 | | | | 138,435 | |
| Total risk-weighted assets | | | 50,823 | | | | 55,493 | | | | 67,532 | |
| Average current loans | | | 43,363 | | | | 49,212 | | | | 57,441 | |
| Average deposits | | | 59,136 | | | | 57,719 | | | | 63,823 | |
| Assets under administration | | | 71,098 | | | | 71,833 | | | | 84,317 | |
| Assets under management | | | 20,013 | | | | 20,283 | | | | 16,485 | |
| Full-time equivalent staff | | | 2,197 | | | | 2,136 | | | | 2,192 | |
| | | |
| | | |
| | | |
| |
BMO FINANCIAL GROUP 186TH ANNUAL REPORT 2003 39
Management’s Discussion and Analysis of Operations and Financial Condition
CORPORATE SUPPORT, INCLUDING TECHNOLOGY AND SOLUTIONS
Group Description
Corporate Support includes the corporate units that provide expertise and governance support to BMO Financial Group in areas such as strategic planning, law, finance, internal audit, risk management, corporate communications, economics, human resources and learning. Our operating results include revenues and expenses associated with certain securitization activities, the hedging of foreign-source earnings, and activities related to the management of certain balance sheet positions and BMO’s overall asset-liability structure.
Operating results for Technology and Solutions (T&S) are included with Corporate Support for reporting purposes. However, costs of T&S services are transferred to P&C, PCG and IBG and only minor amounts are retained in T&S results. As such, results in this section largely reflect Corporate Support activities.
Financial Results
Net income was $21 million, compared with a loss of $73 million in 2002. The improvement was attributable to a lower provision for credit losses, partially offset by lower revenue and higher income taxes. The revenue decline was due to lower revenue from our securitizations and investment portfolios. Expenses were substantially unchanged, as higher performance-based compensation costs were offset by other expense reductions.
The provision for credit losses improved by $391 million due to BMO’s improved credit performance over the year. BMO uses an expected loss provisioning methodology, whereby the annual provision for credit losses charged to each of the client operating groups is based on its expected credit losses over an economic cycle. Corporate Support is charged for differences between the periodic provisions charged to the client operating groups and BMO’s required provision under GAAP.
Corporate Support, including Technology and Solutions
($ millions, except as noted)
| | | | | | | | | | | | | |
| As at or for the year ended October 31 | | 2003 | | | 2002 | | | 2001 | |
| |
| |
| |
|
| Net interest income (teb) | | | (206 | ) | | | (166 | ) | | | (293 | ) |
| Non-interest revenue | | | 256 | | | | 287 | | | | 584 | |
| | | |
| | | |
| | | |
| |
| Total revenue (teb) | | | 50 | | | | 121 | | | | 291 | |
| Provision for credit losses | | | (79 | ) | | | 312 | | | | 183 | |
| Non-interest expense | | | 136 | | | | 139 | | | | 87 | |
| | | |
| | | |
| | | |
| |
| Income before the following | | | (7 | ) | | | (330 | ) | | | 21 | |
| Income taxes (teb) | | | (88 | ) | | | (317 | ) | | | (195 | ) |
| Non-controlling interest in subsidiaries | | | 60 | | | | 60 | | | | 42 | |
| Amortization of goodwill (after tax) | | | — | | | | — | | | | 16 | |
| | | |
| | | |
| | | |
| |
| Net income (1) | | | 21 | | | | (73 | ) | | | 158 | |
| | | |
| | | |
| | | |
| |
| Full-time equivalent staff | | | 6,861 | | | | 7,288 | | | | 7,710 | |
| | | |
| | | |
| | | |
| |
| (1) | | Cash net income was $176 million in 2001. |
Technology and Solutions
Lloyd F. Darlington
President and Chief Executive Officer, Technology and Solutions and Head, E-Business
“We are delivering top-tier service in the deployment of technology and process improvement throughout BMO Financial Group. We’ve significantly reduced costs and enabled our employees to respond more efficiently and effectively to customers’ needs — ultimately increasing productivity and shareholder wealth.”
Description and Strategy
Technology and Solutions manages, maintains and governs information technology, processing, real estate and sourcing for BMO Financial Group. We focus on enterprise-wide priorities that maximize operational quality, effectiveness and efficiency to create shareholder value.
2003 Objective and Achievements
Improve profitability by applying the most efficient, effective and economical technology and processes to generate ongoing savings and increased revenues.
| • | | T&S productivity initiatives included: centralizing IT functions; standardizing work processes and infrastructure; benchmarking, measuring and rewarding performance through a Balanced Scorecard; and centralizing demand management and cost-effective sourcing. |
| • | | We completed the national rollout of Pathway Connect, BMO’s integrated sales and service retail banking technology platform, on time and under budget. |
| • | | We successfully rolled out Optimizer to our Small Business and Direct Banking sales forces. This relationship management and decision support software places customer information, account details, sales opportunities, customer solutions, contact history and service requests at the sales forces’ fingertips. It will be introduced to our retail banking sales force in 2004. |
| • | | We aligned all of BMO’s real estate operations and distribution services to enhance cost-effective coordination of physical infrastructure with enterprise-wide premises standards, and we improved governance. |
| • | | We achieved certifications in several industry-recognized programs, including: ISO 9001 certifications for Project Management, Quality Assurance/ Control and Requirements Management; certification for our progress in software development processes (SEI/CMMI); and accreditation for our Level Three maturity for IT service management. These standards significantly improve productivity and T&S customer satisfaction levels. |
2004 Objective
| • | | Continue to realize improvements in productivity, standards, efficiency and year-over-year performance in alignment with BMO’s strategy. |
40 BMO FINANCIAL GROUP 186TH ANNUAL REPORT 2003
Management’s Discussion and Analysis of Operations and Financial Condition
FINANCIAL CONDITION REVIEW
Balance Sheet
Summary Balance Sheet($ millions)
| | | | | | | | | | | | | | | | | | | | | | |
| As at October 31 | | 2003 | | | 2002 | | | 2001 | | | 2000 | | | 1999 | |
| |
| |
| |
| |
| |
|
Assets | | | | | | | | | | | | | | | | | | | | |
| Cash resources | | | 19,860 | | | | 19,305 | | | | 17,656 | | | | 18,508 | | | | 24,036 | |
| Securities | | | 54,790 | | | | 43,715 | | | | 37,676 | | | | 46,463 | | | | 43,273 | |
| Net loans and acceptances | | | 146,156 | | | | 149,596 | | | | 144,765 | | | | 142,447 | | | | 144,754 | |
| Other assets | | | 35,688 | | | | 40,248 | | | | 39,312 | | | | 25,978 | | | | 18,552 | |
| | | |
| | | |
| | | |
| | | |
| | | |
| |
| Total | | | 256,494 | | | | 252,864 | | | | 239,409 | | | | 233,396 | | | | 230,615 | |
| | | |
| | | |
| | | |
| | | |
| | | |
| |
Liabilities and Shareholders’ Equity | | | | | | | | | | | | | | | | | | | | |
| Deposits | | | 171,551 | | | | 161,838 | | | | 154,290 | | | | 156,697 | | | | 156,874 | |
| Other liabilities | | | 69,605 | | | | 75,338 | | | | 69,763 | | | | 59,847 | | | | 58,048 | |
| Subordinated debt | | | 2,856 | | | | 3,794 | | | | 4,674 | | | | 4,911 | | | | 4,712 | |
| Share capital | | | | | | | | | | | | | | | | | | | | |
| | Preferred | | | 1,446 | | | | 1,517 | | | | 1,050 | | | | 1,681 | | | | 1,668 | |
| | Common | | | 3,662 | | | | 3,459 | | | | 3,375 | | | | 3,173 | | | | 3,190 | |
| Contributed surplus | | | 3 | | | | — | | | | — | | | | — | | | | — | |
| Retained earnings | | | 7,371 | | | | 6,918 | | | | 6,257 | | | | 7,087 | | | | 6,123 | |
| | | |
| | | |
| | | |
| | | |
| | | |
| |
| Total | | | 256,494 | | | | 252,864 | | | | 239,409 | | | | 233,396 | | | | 230,615 | |
| | | |
| | | |
| | | |
| | | |
| | | |
| |
Total assets increased $3.6 billion or 1% from last year to $256.5 billion at October 31, 2003, even though the lower Canadian/U.S. dollar exchange rate reduced assets by $16.4 billion. There was an $11.1 billion increase in securities, which was partially offset by a $3.4 billion reduction in net loans and acceptances. Other assets declined $4.6 billion, primarily due to lower amounts due from clients, dealers and brokers and lower fair values of derivative financial instruments. The comparable elements in other liabilities declined by similar amounts.
Note 9 on page 83 of the financial statements provides details on fair values of derivative financial assets and liabilities.
Securities($ millions)
| | | | | | | | | | | | | | | | | | | | | |
| As at October 31 | | 2003 | | | 2002 | | | 2001 | | | 2000 | | | 1999 | |
| |
| |
| |
| |
| |
|
| Investment securities | | | 19,660 | | | | 21,271 | | | | 21,470 | | | | 24,469 | | | | 26,027 | |
| Trading securities | | | 35,119 | | | | 22,427 | | | | 16,200 | | | | 21,994 | | | | 17,246 | |
| Loan substitute securities | | | 11 | | | | 17 | | | | 6 | | | | — | | | | — | |
| | | |
| | | |
| | | |
| | | |
| | | |
| |
| Total | | | 54,790 | | | | 43,715 | | | | 37,676 | | | | 46,463 | | | | 43,273 | |
| | | |
| | | |
| | | |
| | | |
| | | |
| |
Trading securities increased $12.7 billion to $35.1 billion, as corporate equity investments grew by $9.1 billion in response to growth in equity and credit derivatives businesses and other market opportunities. Corporate debt investments increased $2.8 billion.
Investment securities decreased $1.6 billion to $19.7 billion, largely due to lower holdings of U.S. government securities. Net unrealized gains on investment securities were $312 million, compared with $321 million a year ago. Unrealized gains increased on corporate debt and equity but declined on government debt.
Note 3 on page 75 of the financial statements provides further details on securities.
Net Loans and Acceptances($ millions)
| | | | | | | | | | | | | | | | | | | | | |
| As at October 31 | | 2003 | | | 2002 | | | 2001 | | | 2000 | | | 1999 | |
| |
| |
| |
| |
| |
|
| Residential mortgages | | | 52,095 | | | | 47,569 | | | | 41,941 | | | | 39,485 | | | | 38,189 | |
| Consumer instalment and other personal loans | | | 22,103 | | | | 21,168 | | | | 19,107 | | | | 18,038 | | | | 16,912 | |
| Credit cards | | | 2,967 | | | | 2,280 | | | | 1,527 | | | | 1,407 | | | | 1,160 | |
| Businesses and governments* | | | 51,889 | | | | 57,963 | | | | 61,249 | | | | 60,176 | | | | 58,027 | |
| Acceptances | | | 5,611 | | | | 6,901 | | | | 7,936 | | | | 8,630 | | | | 6,753 | |
| Securities purchased under resale agreements | | | 13,276 | | | | 15,664 | | | | 14,954 | | | | 16,308 | | | | 25,090 | |
| | | |
| | | |
| | | |
| | | |
| | | |
| |
| Gross loans and acceptances | | | 147,941 | | | | 151,545 | | | | 146,714 | | | | 144,044 | | | | 146,131 | |
| Allowance for credit losses | | | (1,785 | ) | | | (1,949 | ) | | | (1,949 | ) | | | (1,597 | ) | | | (1,348 | ) |
| | | |
| | | |
| | | |
| | | |
| | | |
| |
| Net loans and acceptances | | | 146,156 | | | | 149,596 | | | | 144,765 | | | | 142,447 | | | | 144,783 | |
| | | |
| | | |
| | | |
| | | |
| | | |
| |
| * | | Amounts for 1999 include loan substitute securities classified as securities. |
Net loans and acceptances decreased $3.4 billion to $146.2 billion. Loans to businesses and governments declined $6.1 billion, reflecting weak demand. Related acceptances fell by $1.3 billion. Securities purchased under resale agreements fell by $2.4 billion, reflecting market opportunities and foreign exchange rates. These decreases were partially offset by a $4.5 billion increase in residential mortgages, reflecting strong market demand in the low interest rate environment. Credit cards and consumer instalment and other personal loans increased $1.6 billion in total, also reflecting healthy personal lending markets. The portfolio remains well diversified, with a higher proportion of Canadian loans due to the growth in residential mortgages in Canada in 2003 and the impact of the weaker U.S. dollar. The appreciation of the Canadian dollar, particularly in relation to the U.S. dollar, reduced allowances for credit losses related to foreign-currency-denominated loans by $119 million.
Table 10 on page 60 provides a comparative summary of loans by geographic location and product. Table 12 on page 61 provides a comparative summary of net loans in Canada by province and industry. Loan quality is discussed on page 24 and further details on loans are provided in Notes 4, 5 and 7 to the financial statements starting on page 76.
BMO FINANCIAL GROUP 186TH ANNUAL REPORT 2003 41
Management’s Discussion and Analysis of Operations and Financial Condition
Deposits($ millions)
| | | | | | | | | | | | | | | | | | | | | |
| As at October 31 | | 2003 | | | 2002 | | | 2001 | | | 2000 | | | 1999 | |
| |
| |
| |
| |
| |
|
| Banks | | | 24,755 | | | | 15,273 | | | | 20,539 | | | | 23,385 | | | | 30,398 | |
| Businesses and governments | | | 72,405 | | | | 71,411 | | | | 66,132 | | | | 69,454 | | | | 65,459 | |
| Individuals | | | 74,391 | | | | 75,154 | | | | 67,619 | | | | 63,858 | | | | 61,017 | |
| | | |
| | | |
| | | |
| | | |
| | | |
| |
| Total | | | 171,551 | | | | 161,838 | | | | 154,290 | | | | 156,697 | | | | 156,874 | |
| | | |
| | | |
| | | |
| | | |
| | | |
| |
Deposits increased $9.7 billion to $171.6 billion. Deposits by banks increased $9.5 billion and provided much of the funding for the increase in securities balances. Deposits from businesses and governments, which account for 42% of total deposits, increased $1.0 billion. Deposits from individuals, which tend to be more stable, increased by $2.3 billion in source currency. However, due to the effects of the weaker U.S. dollar, deposits from individuals declined $0.8 billion and accounted for 43% of total deposits.
Further details on the composition of deposits are provided in Note 14 on page 88 of the financial statements and in the Liquidity and Funding Risk section on page 50.
Other Liabilities
Other liabilities decreased $5.7 billion to $69.6 billion. Accounts payable, accrued interest and other items declined $2.3 billion. Derivative-related amounts declined $1.4 billion and acceptances were $1.3 billion lower.
Subordinated Debt
Subordinated debt declined $0.9 billion to $2.9 billion. The decline was largely attributable to the maturity of a debenture, a redemption prompted by the high yield relative to current market rates and our stronger capital levels, and the weaker U.S. dollar. Note 16 on page 89 of the financial statements provides details on the attributes of the debt, issues and retirements, and future maturities by year.
Shareholders’ Equity
Shareholders’ equity increased $0.6 billion to $12.5 billion. The increase was largely related to higher retained earnings and the issue of common shares. The increase in retained earnings was curtailed by higher income taxes related to hedges of net investments in foreign operations, principally our U.S. subsidiaries, which is discussed further in the Income Tax section on page 26.
BMO’s Consolidated Statement of Changes in Shareholders’ Equity on page 72 provides a summary of items that increase or reduce shareholders’ equity while Note 17 on page 90 provides details on the components of and changes in share capital. Details of our enterprise-wide capital management processes and strategies can be found on page 43.
Off-Balance Sheet Arrangements
BMO enters into a number of off-balance sheet arrangements in the normal course of operations. The discussion that follows addresses the more significant types of off-balance sheet arrangements.
Guarantees
Items that meet the accounting definition of a guarantee are considered to be off-balance sheet arrangements. These include standby letters of credit and guarantees, certain of our commitments to extend credit and certain of our derivative financial instruments. BMO enters into these agreements as a method of meeting the financial needs of our customers and receives fees for meeting those needs. Amounts included in our Consolidated Balance Sheet related to these activities, as well as the maximum amounts payable by BMO under those agreements, are outlined in Note 6 on page 78 of the financial statements.
Interests in Bank Securitization Vehicles
Periodically, we sell loans to off-balance sheet entities or trusts, either for capital management purposes or to obtain alternate sources of funding. The impact of these arrangements on BMO’s funding is outlined in the cash flow disclosure included in Note 7 on page 79 of the financial statements. As a result of securitization activities, BMO recognizes in income the gains or losses on sales to the securitization vehicles and other securitization revenues paid to us for servicing the loans sold. The impact of securitization activities on our revenues and expenses is outlined in Note 7 on page 79 of the financial statements. BMO has retained interests in these off-balance sheet entities, as we are sometimes required to purchase subordinated interests or maintain cash deposits in the entities. These retained interests serve as a source of liquidity for the vehicle. BMO can also have deferred purchase price amounts related to securitizations recorded in our balance sheet. The deferred purchase price represents the difference between the amount recognized in income upon sale of the loans to the securitization vehicle and the amount of cash received from the vehicle to date. Amounts recorded in BMO’s Consolidated Balance Sheet related to investments in securitization vehicles, deferred purchase price and cash deposits with securitization vehicles are disclosed in Note 7 on page 79 of the financial statements.
42 BMO FINANCIAL GROUP 186TH ANNUAL REPORT 2003
Management’s Discussion and Analysis of Operations and Financial Condition
ENTERPRISE-WIDE CAPITAL MANAGEMENT
Strategy and Approach
Our Capital Management Framework is designed to maintain an optimum level of capital in a cost-effective structure that: meets our target regulatory ratios; supports our internal assessments of required capital (i.e. economic capital); results in targeted credit ratings; funds our selected operating group business strategies; and builds long-term shareholder value. Our approach includes establishing limits, goals and performance measures for management of balance sheet positions, risk levels and minimum capital amounts, as well as issuing and redeeming capital instruments to obtain the most cost-effective capital structure possible. These are approved by the Board of Directors pursuant to its annual review of our capital management policy and capital plan.
At the consolidated enterprise level, our targeted capital levels are set in support of our risk appetite, while still satisfying regulatory and legal requirements. At the line of business level, performance measurement is assessed on allocated economic capital, which is based primarily on the assessment and measurement of capital at risk outlined on page 46.
Internal capital allocation ensures that we maintain a well-capitalized position to protect our stakeholders from the risks inherent in our various businesses, while still allowing the flexibility to deploy resources in high-return or strategic growth activities of our operating groups to meet or exceed established enterprise targets. Generally, BMO generates earnings that are sufficient to meet new capital requirements. As such, management’s primary challenge is achieving the most cost-effective capital structure, rather than procuring sufficient capital to fund expansion initiatives.
Dividends are generally increased in line with long-term trends in earnings per share growth, while sufficient earnings are retained to support anticipated business growth, fund strategic investments and provide continued support for depositors. BMO’s policy is to achieve a dividend payout ratio of 35% to 45% of net income available to shareholders, over time.
Performance Review
Our common shareholders’ equity exceeded our assessment of required economic capital by $636 million, an improvement of $723 million from a year ago. The components of regulatory capital and the measures we monitor are outlined in Tables 20 and 21 on page 65. The Tier 1 capital ratio, our primary measure of capital adequacy, rose to 9.55% from 8.80% a year ago. It is defined as Tier 1 capital divided by risk-weighted assets. Tier 1 capital, representing more permanent forms of capital, increased during the year to $12,337 million, as outlined in the adjacent table. Risk-weighted assets decreased during the year to $129.2 billion, as strong mortgage and personal loan growth in Personal and Commercial Client Group was more than offset by a change in the asset mix due to lower corporate lending in Investment Banking Group. Our Total Capital Ratio, which is defined as total capital divided by risk-weighted assets, declined to 12.09% from 12.23% a year ago. The decline related to reduced subordinated debt, as we chose to redeem two issues during the year to optimize our capital level. In 2004, we anticipate continuing controlled growth in risk-weighted assets and redeployment of capital to strategically advantaged businesses.
Dividends declared per common share in 2003 totalled $1.34, up from $1.20 in 2002, resulting in a 38.2% payout ratio, in keeping with our long-term goal. BMO increased its quarterly dividends twice during the year, as the quarterly dividend rose to $0.35 per share in the fourth quarter, up 16.7% from $0.30 in the fourth quarter of 2002.
On August 5, 2003, we announced our intention to repurchase up to 15 million common shares for cancellation. The bid expires on August 6, 2004. In the fourth quarter of the year, we acquired and cancelled 282,800 shares at an average cost of $43.95 per share, for a total cost of $12.4 million.
BMO’s credit rating, as measured by Standard & Poor’s (S&P) senior debt ratings, remained unchanged at AA–, the highest, along with one of our competitors, of the six major Canadian banks. Our rating, as measured by Moody’s senior debt ratings, remained unchanged at Aa3, slightly below only one of the six major Canadian banks. During the fourth quarter, S&P upgraded its ratings outlook on BMO to stable from negative. Moody’s similarly upgraded its outlook earlier in the year. These ratings represent a high-grade, high-quality rating.
Tier 1 Capital
| | | | | | | | | |
| ($ millions) | | 2003 | | | 2002 | |
| |
| |
|
| Beginning of year | | | 11,529 | | | | 11,066 | |
| Net income | | | 1,825 | | | | 1,417 | |
| Dividends | | | (748 | ) | | | (668 | ) |
| Goodwill and excess intangible assets | | | 213 | | | | (749 | ) |
| Issuance of common shares | | | 205 | | | | 84 | |
| Repurchase of common shares | | | (12 | ) | | | — | |
| Other issues and redemptions | | | — | | | | 471 | |
| Translation and other | | | (675 | ) | | | (92 | ) |
| | | |
| | | |
| |
| End of year | | | 12,337 | | | | 11,529 | |
| | | |
| | | |
| |
Risk-Weighted Assets
| | | | | | | | | | |
| ($ millions) | | 2003 | | | 2002 | |
| |
| |
|
| Beginning of year | | | 131,078 | | | | 135,768 | |
| Increases (decreases) | | | | | | | | |
| | Personal and Commercial Client Group | | | 5,397 | | | | 5,463 | |
| | Private Client Group | | | (644 | ) | | | 764 | |
| | Investment Banking Group | | | (4,670 | ) | | | (12,039 | ) |
| | Corporate Support | | | (1,998 | ) | | | 1,122 | |
| | | |
| | | |
| |
| End of year | | | 129,163 | | | | 131,078 | |
| | | |
| | | |
| |
BMO FINANCIAL GROUP 186TH ANNUAL REPORT 2003 43
Management’s Discussion and Analysis of Operations and Financial Condition
CRITICAL ACCOUNTING POLICIES
The Notes to Bank of Montreal’s October 31, 2003 consolidated financial statements outline BMO’s significant accounting policies. The policies discussed below are considered particularly important, as they require significant judgments by management. BMO has established detailed policies and control procedures that are intended to ensure these judgments are well controlled, independently reviewed and consistently applied from period to period. In addition, the policies and procedures are intended to ensure that the process for changing methodologies proceeds in an appropriate manner. We believe that our estimates for determining the valuation of our assets and liabilities are appropriate.
Allowance for Credit Losses
The allowance for credit losses adjusts the value of credit assets to reflect their estimated realizable value. In assessing their estimated realizable value, we must rely on estimates and exercise judgment regarding matters for which the ultimate outcome is unknown. These include economic factors, developments affecting companies in particular industries and specific issues with respect to single borrowers. Changes in circumstances may cause future assessments of credit risk to be materially different from current assessments, which could require an increase or decrease in the allowance for credit losses. Additional information on the process and methodology for determining the allowance for credit losses can be found in the discussion of credit risk on page 47 as well as in Note 4 on page 76 of the financial statements.
Financial Instruments Measured at Fair Value
BMO records trading securities and trading derivatives at fair value. We adjust the carrying value of investment securities to fair value when we identify a decline in value that is other than temporary. Fair value represents our estimate of the proceeds we would receive in a current transaction between willing parties. The fair value of most financial instruments is determined using quoted market prices. In situations where listed prices or quotes are not available, management must estimate fair value using discounted cash flows or option pricing models. Management’s estimates may affect the fair value and resulting gain or loss reported. Additional information about BMO’s method of determining fair value is included in Note 3 on page 75 and Note 26 on page 97 of the financial statements.
Accounting for Securitizations
When loans are securitized, we record a gain (loss) on sale. In determining the gain (loss), management must estimate future cash flows by relying on estimates of the amount of interest and fees that will be collected on the securitized assets, the yield to be paid to investors, the portion of the securitized assets that will be repaid before their scheduled maturity, expected credit losses, the fair value cost of servicing, and the rate at which to discount these expected future cash flows. Actual cash flows may differ significantly from those estimated by management. If management’s estimate of future cash flows had been different, our gains on securitization recognized in income would also have been different. Additional information about accounting for securitizations, including sensitivity analysis for key assumptions, is included in Note 7 on page 79 of the financial statements.
Pensions and Other Future Employee Benefits
Our pensions and other future employee benefits expense is calculated by our actuaries based on assumptions determined by management. If actual experience differs from the assumptions made by management, our pension and other future employee benefits expense could increase or decrease in future years as a result. Additional information regarding our accounting for pensions and other future employee benefits, including sensitivity analysis for key assumptions, is included in Note 18 on page 91 of the financial statements.
Other Than Temporary Impairment
Investment securities that are carried at cost or amortized cost or accounted for using the equity method are reviewed at each quarter-end reporting period to determine whether the fair value is below the current recorded value. When the fair value of any of our investment securities has declined below its recorded value, management is required to assess whether the decline is other than temporary. In making this assessment, we consider such factors as the type of investment, the length of time and extent to which the fair value has been less than the recorded value, the financial condition and near-term prospects of the issuer, and our intent and ability to hold the investment long enough to allow for any anticipated recovery. The decision to record a write-down, its amount and the period in which it is recorded could change if management’s assessment of the above factors were different. Additional information regarding our accounting for investment securities is included in Note 3 on page 75 of the financial statements.
Income Taxes
The provision for income taxes is calculated based on the expected tax treatment of transactions recorded in our Consolidated Statements of Income or Changes in Shareholders’ Equity. In determining our provision for income taxes, we interpret tax legislation in a variety of jurisdictions as well as make assumptions about the expected timing of the reversal of future tax assets and liabilities. If our interpretations differ from those of tax authorities or if the timing of reversals is not as anticipated, our provision for income taxes could increase or decrease in future periods. Additional information regarding our accounting for income taxes is included in Note 20 on page 95 of the financial statements.
Goodwill
Goodwill is assessed for impairment at least annually to ensure that the fair value of the business associated with the goodwill is greater than or equal to its carrying value. In determining fair value, we use valuation models that consider such factors as projected earnings, price/earnings multiples and discount rates. Management must apply judgment in the selection of the approach to determining fair value and any necessary assumptions. These judgments may affect the fair value and any resulting impairment write-down. Additional information regarding the composition of our goodwill is included in Note 12 on page 87 of the financial statements.
44 BMO FINANCIAL GROUP 186TH ANNUAL REPORT 2003
Management’s Discussion and Analysis of Operations and Financial Condition
ENTERPRISE-WIDE RISK MANAGEMENT
Ronald G. Rogers
Deputy Chair, Enterprise Risk and Portfolio Management, BMO Financial Group
“We manage our risk so that the sustainability of our performance is not in doubt. That means using the latest science and the best people so that our shareholders, customers and employees can be confident that we are using the best and most consistent approach to managing all our risks.”
BMO Financial Group has an enterprise-wide capability to recognize, understand, measure, assess and manage the risks taken across the organization. These risks are classified as credit and counterparty (including insurance), market, liquidity and funding, operational and business risk due to earnings volatility.
Our risk framework guides our risk-taking activities and ensures that they are aligned with our clients’ needs and our shareholders’ expectations. It includes the management of risks on an integrated basis as well as direct management of each individual risk type. The framework is built on the following elements: comprehensive risk governance, effective processes and models and qualified risk professionals.
Comprehensive Risk Governance
The risk governance structure ensures sound business decisions are made that balance risk and reward and drive the maximization of total shareholder return. It also ensures that revenue-generating activities are consistent with our risk appetite and standards. Our governance structure for risk-taking is outlined in the box below.
Our comprehensive risk governance structure includes a body of corporate policies approved by the Board of Directors. Risk management policies, standards and procedures are continually reviewed to ensure that they provide effective and superior governance over our risk-taking activities.
Board-approved policies and risk limits define BMO’s risk appetite. Risk limits are reviewed and approved annually by RRC for:
| • | | credit and counterparty risk — limits on country, industry, portfolio products/segments, group and single name exposures; |
| • | | market risk — limits on Market Value Exposure (MVE), Earnings Volatility (EV) and stress testing; and |
| • | | liquidity and funding risk — limits for liquid assets, liability diversification, credit and liquidity commitments, asset pledging and cash flow mismatches. |
These risk limits generally encompass both on and off-balance sheet arrangements.
Risk Review Committee of the Board of Directors (RRC)
RRC is responsible for assisting the Board in fulfilling its oversight responsibilities in relation to BMO’s identification and management of risk, adherence to internal risk management policies and procedures, and compliance with risk-related regulatory requirements.
Chairman and Chief Executive Officer (CEO)
The CEO is directly accountable to the Board for all of BMO’s risk-taking activities. Risk Management Committee and its sub-committees and Enterprise Risk and Portfolio Management support the CEO.
Risk Management Committee (RMC)
RMC, BMO’s senior risk committee, reviews and discusses significant risk issues and action plans that arise in executing the organization’s strategy. The principal counterparty risk committee was recently integrated with RMC to provide greater consistency and efficiency. RMC ensures that risk oversight and governance occur at the highest levels of management.
RMC Sub-committees
RMC sub-committees have oversight responsibility for management strategy, governance, risk measurement and contingency planning. Separate subcommittees have been established for each type of risk and for a number of legal entities within BMO in order to ensure that the risks incurred across the organization are identified, measured, monitored and reported in accordance with policy and within delegated limits.
Enterprise Risk and Portfolio Management (ERPM)
ERPM brings together all of the credit adjudication, risk management and auditing functions under the leadership of the Deputy Chair, ERPM. It ensures consistency of risk management practices and standards, and provides clear accountability for risk oversight and control and the management of transactional risk throughout the enterprise.
Corporate Risk Managementprovides enterprise-wide policy direction and oversight and ensures that risk-taking is appropriately governed, identified, assessed, measured, monitored and reported.
Risk Management Unitsdedicated to each of BMO’s operating groups ensure that risk management is applied consistently and effectively at the transactional level and throughout all levels of the organization.
BMO FINANCIAL GROUP 186TH ANNUAL REPORT 2003 45
Management’s Discussion and Analysis of Operations and Financial Condition
Individual risk committees have responsibility for establishing and monitoring comprehensive risk management limits consistent with the Board limits. Loss limits are also in place to provide an early warning mechanism to effectively address potential loss situations. In each line of business, management ensures that governance activities, management processes and controls are consistent with risk management policies and corporate standards.
Effective Processes and Models
Rigorous processes, periodically reviewed by Corporate Audit, are used across BMO to:
| • | | develop policies and limits for approval by senior governance committees; |
| • | | monitor policy compliance; |
| • | | maintain contingency plans; |
| • | | track variables continuously for changing risk conditions; and |
| • | | provide timely reports to senior management and the appropriate governance committees. |
The models used range from the very simple to those that value complex transactions or involve sophisticated portfolio and capital management methodologies. These models are used to guide strategic decisions and to assist in making daily lending, trading, underwriting, funding, investment and operational decisions. Models have also been developed to measure exposure to risk and to measure total risk on an integrated basis using capital at risk (CaR). We have strong controls over the development, implementation and application of these models, which are subject to a periodic independent model risk vetting process.
BMO also utilizes various processes and models, within risk types as appropriate and feasible, to:
| • | | assess the correlation of credit risks before authorizing new exposures; |
| • | | measure and value our portfolio exposures and calculate the related market risk exposure; |
| • | | determine the business and operational risk for each line of business; and |
| • | | project liquidity and funding risk based on expected and stressed operating conditions. |
Qualified Risk Professionals
Sound enterprise-wide risk management relies upon the competence and experience of our risk professionals to:
| • | | promote a culture that places high value on disciplined and effective risk management processes and controls; |
| • | | adhere to established risk management standards for the evaluation and acceptance of risk; and |
| • | | apply sound business judgment, using effective business models in our decision-making. |
In order to enhance our existing capabilities, a new risk education program curriculum was developed through a partnership between BMO and York University’s Schulich School of Business. This certificate program promotes the development of risk professionals by providing a comprehensive view of all aspects of risk identification and management in banking practice.
It consists of five modules, each equivalent to a full semester graduate course, and is delivered to BMO managers by the Executive Education Centre at Schulich and BMO risk executives who are subject matter experts.
Additionally, risk managers and lenders may be required to complete a progressive curriculum of credit courses through BMO’s Institute for Learning in order to achieve credit qualification for their role. These courses, together with defined job exposures, provide training and practice in sound lending that lead to the granting of appropriate lending limits to qualified professionals.
Integrated Risk Management
The management of risk is integrated with our management of capital and strategy. This ensures that risks incurred in pursuit of BMO’s strategic objectives are consistent with desired total shareholder return as well as BMO’s desired credit rating and risk levels, or risk appetite.
Two frameworks support the management of risk: change management and integrated risk management. They are designed to:
| • | | ensure that changes to the organization’s risk profile associated with new business initiatives are correctly identified and receive appropriate approvals before implementation; and |
| • | | assess the relative magnitude of risks taken and the distribution of those risks across the organization’s activities. |
Integrated risk management activities are supported by the use of capital at risk (CaR) measures, scenario analysis and stress testing.
CaR provides a single measure of risk that can be compared across business activities and risk types. It is the foundation for risk-based capital management and permits the cost of capital to be charged to the lines of business. CaR indicates, in terms of capital, the likely magnitude of losses that could occur if adverse situations arise, and allows returns to be adjusted for risks. As noted in the charts below, BMO’s largest exposure is credit risk.
46 BMO FINANCIAL GROUP 186TH ANNUAL REPORT 2003
Management’s Discussion and Analysis of Operations and Financial Condition
Scenario analysis assists in measuring the impact of extreme, but plausible, operational, political, economic and market events on our operations. Scenarios may be based on historical or hypothetical events, or a combination thereof. They are applied to all significant risk-taking activities across the organization.
We also conduct ongoing industry stress tests designed to stress BMO’s credit exposures to a specific industry or to several industries that are highly correlated. These tests provide significant insight into the sensitivity of our exposures to underlying risk characteristics of the industries under review.
New Basel Capital Accord
The Basel Committee on Banking Supervision is finalizing the development of the New Basel Capital Accord (referred to as Basel II), which is focused on regulatory capital requirements for credit and operational risk exposures.
To ensure readiness for Basel II, BMO has established an integrated enterprise-wide program. Leadership and oversight are provided by a steering committee comprising senior executives from all stakeholder groups. The Basel II program leverages existing enterprise structures for change management and business process improvement, as well as established technology strategies for data warehousing and knowledge management.
BMO views Basel II as an important step in the alignment of regulatory and economic capital requirements. Furthermore, it is consistent with both our commitment to leadership in risk management and our strategy of continual improvement in risk management and capital management processes.
Credit and Counterparty Risk
BMO incurs credit and counterparty risk primarily in its lending activities and, to a lesser extent, by holding investment securities. We employ comprehensive governance and management processes surrounding credit risk activities. These include:
| • | | corporate policies, standards and procedures governing the philosophy, principles and conduct of credit granting; |
| • | | a well-developed limit-setting and monitoring process; |
| • | | oversight by senior governance committees; |
| • | | independent Credit Risk Policy and Corporate Audit functions within ERPM; and |
| • | | a rigorous lender qualification process. |
The credit granting process is well established and effective, as evidenced by BMO’s historic loan loss experience, which compares favourably to BMO’s Canadian peer group. The process involves the use of skilled and qualified professional lenders, clear delegation of decision-making authority, personal accountability, specific borrower limits and account monitoring, and dynamic portfolio management. Credit decisions are made at a management level appropriate to the size and risk of each transaction.
Operating practices include ongoing monitoring of credit risk exposures, regular review on an account and portfolio basis and frequent portfolio and sector reporting to RMC and RRC. All borrowing accounts are reviewed regularly, with most individual commercial accounts reviewed no less than annually. Corporate Audit reviews management processes as well as a representative sample of lending transactions for adherence to sound lending principles, practices, policies and procedures. In addition, BMO carries out regular portfolio sector reviews, including comprehensive stress testing and scenario analysis.
BMO’s provisioning approach embodies disciplined loan loss management and evaluation, with prompt identification of problem loans being a key risk management objective. All problem accounts are subject to close monitoring and are reviewed no less than quarterly.
Credit and counterparty riskis the potential for loss due to the failure of a borrower, endorser, guarantor or counterparty to repay a loan or honour another predetermined financial obligation.
BMO employs two key credit measures:
| • | | Gross impaired loans and acceptances as a percentage of equity and allowances for credit losses, used to assess the condition of a portfolio by comparing the level of impaired loans to the capital and reserves available to absorb loan losses. |
| • | | Provision for credit losses as a percentage of average net loans and acceptances (including securities purchased under resale agreements) is a measure of our credit losses occurring in the year relative to the size of our portfolio. It is a measure of credit quality experience. |
At October 31, 2003, gross impaired loans as a percentage of equity and allowance for credit losses was 12.15%, down 3.01 percentage points from 15.16% at October 31, 2002. Provision for credit losses as a percentage of average net loans and acceptances (including securities purchased under resale agreements) was 0.30%, down from 0.56% a year ago.
We have a well diversified portfolio, focused in North America and comprising lending relationships with millions of clients, the majority of them consumers and small to medium-sized businesses. BMO’s credit risk governance policies ensure that an acceptable level of diversification is maintained at all times.
Note 4 on page 76 of the financial statements and Tables 10 to 18 on pages 60 to 63 provide details of BMO’s loan portfolio, impaired loans and provisions and allowances for credit losses. Portfolio diversification is shown in the graph on page 41.
BMO utilizes various models to assess the extent and correlation of risks before authorizing new exposures on large corporate credit transactions. Expected loss (EL) and unexpected loss (UL) are calculated for large individual transactions and for the portfolio as a whole. The estimates of EL and UL rely upon:
| • | | probabilities of default; |
BMO FINANCIAL GROUP 186TH ANNUAL REPORT 2003 47
Management’s Discussion and Analysis of Operations and Financial Condition
| • | | amounts of outstanding exposures at the time of default; |
| • | | differences between the book value and the market value or realizable value of loans, if default occurred; and |
| • | | effects of economic and industry cycles on asset quality and loan values. |
EL and UL are inputs that determine the capital at risk (CaR) for each of the relevant lines of business. Credit CaR measures, like all CaR measures, are based on a confidence level of 99.95% and a holding period of one year.
BMO maintains specific allowances and general allowances for credit losses. The specific allowances reduce the aggregate carrying value of credit assets that bear evidence of deterioration in credit quality to their estimated realizable amounts. The general allowance is maintained in order to absorb any impairment in the existing portfolio that cannot yet be associated with specific credit assets. The sum of these allowances must always be sufficient to reduce the book value of credit assets to their estimated realizable values.
A number of factors are considered when assessing the amount and adequacy of the general allowance. A statistical analysis of past performance is undertaken to derive the mean (EL) and volatility (UL) of loss experience. This analysis calculates historical average loss for each homogeneous portfolio segment, while other models estimate loss for portfolios of corporate credit assets that can be referenced to market data. Estimates of EL and UL are used to forecast loan loss provisions and in establishing an appropriate level of general allowance. Finally, management’s professional judgment regarding portfolio quality, business mix and economic and credit market conditions is considered. Our approach is also based on Guideline C-5, “General Allowance for Credit Risk,” issued by the Office of the Superintendent of Financial Institutions Canada.
Market Risk
BMO incurs market risk in its trading and underwriting activities and structural banking activities.
As part of our enterprise-wide risk management framework, we employ comprehensive governance and management processes surrounding market risk-taking activities. These include:
| • | | oversight by senior governance committees, including Market Risk Committee, RMC and RRC; |
| • | | independent market risk oversight functions; |
| • | | effective processes to measure market risks linked to the allocation of economic capital and the valuation of positions; |
| • | | a well-developed limit-setting and monitoring process; |
| • | | effective controls over processes and models used; and |
| • | | a framework of scenario and stress tests for worst-case events. |
BMO’s primary market risk measures are Market Value Exposure (MVE) and Earnings Volatility (EV). The aggregate market value and earnings volatility exposures at October 31, 2003 are summarized in the following table. MVE has increased modestly relative to last year, primarily due to growth in common shareholders’ equity in the structural balance sheet. EV has increased over the past year, primarily due to increased short-term positions in trading and underwriting accrual portfolios.
Aggregate MVE and EV Exposure for Trading and Underwriting and Structural Positions($ millions)*
| | | | | | | | | | | | | | | | | |
| As at October 31 | | Market value | | 12-month |
| (After-tax Canadian equivalent) | | exposure | | earnings volatility |
| |
| |
|
| | | 2003 | | | 2002 | | | 2003 | | | 2002 | |
| | |
| |
| |
| |
|
| Trading and underwriting | | | 18.0 | | | | 14.6 | | | | 33.4 | | | | 19.9 | |
| Structural | | | 311.6 | | | | 282.5 | | | | 24.8 | | | | 21.0 | |
| | | |
| | | |
| | | |
| | | |
| |
| Total | | | 329.6 | | | | 297.1 | | | | 58.2 | | | | 40.9 | |
| | | |
| | | |
| | | |
| | | |
| |
| * | | Measured at a 99% confidence level. |
Trading and Underwriting Market Risk
BMO’s trading and underwriting activities include portfolios that are marked to market daily, as well as some portfolios (such as money market assets) that are subject to accrual accounting rules under generally accepted accounting principles. For these activities, VaR measures the magnitude of BMO’s market risk.
In addition to our VaR models and measures, issuer risk is measured daily at a 99% confidence level, over specifically determined holding periods, for the respective portfolios.
Various VaR models are used to determine market risk capital at risk for each of the lines of business, and are also used to determine regulatory capital under the standards of the 1998
Market riskis the potential for a negative impact on the balance sheet and/or income statement resulting from adverse changes in the value of financial instruments as a result of changes in certain market variables. These variables include interest rates, foreign exchange rates, equity or commodity prices and their implied volatilities, as well as credit spreads, credit migration and default.
Market Value Exposure(MVE) is a measure of the adverse impact of changes in market parameters on the market value of a portfolio of assets, liabilities and off-balance sheet positions, measured at a 99% confidence level over a specified holding period. The holding period considers current market conditions and composition of the portfolios to determine how long it would take to neutralize the market risk without adversely affecting market prices. For trading and underwriting activities, MVE is comprised of VaR and Issuer Risk.
Earnings Volatility(EV) is a measure of the adverse impact of potential changes in market parameters on the projected 12-month after-tax net income of a portfolio of assets, liabilities and off-balance sheet positions, measured at a 99% confidence level.
Value at Risk(VaR) is measured for specific classes of risk in BMO’s trading and underwriting activities: interest rate, currency, equity and commodity prices and implied volatilities. This measure calculates the maximum likely loss from portfolios, over an appropriate holding period, measured at a 99% confidence level.
Issuer riskarises in BMO’s trading and underwriting portfolios, and measures the adverse impact of credit spread, credit migration and default risks on the market value of non-sovereign fixed income instruments and similar securities. Issuer risk MVE is usually measured at a 99% confidence level over an appropriate holding period.
48 BMO FINANCIAL GROUP 186TH ANNUAL REPORT 2003
Management’s Discussion and Analysis of Operations and Financial Condition
Accord. For capital calculation purposes, longer holding periods and/or higher confidence levels are used than are employed for day-to-day risk management. Models used to determine EV exposures are the same as or similar to those used to determine VaR exposures.
Market risk exposures arising from trading and underwriting activities are summarized in the following table.
Total Trading and Underwriting VaR Summary($ millions)*
| | | | | | | | | | | | | | | | | |
| For the year ended October 31, 2003 | | | | | | | | |
| (Pre-tax Canadian equivalent) | | Year-end | | Average | | High | | | Low | |
| |
| |
| |
| | |
| |
| Interest rate | | | 17.6 | | | | 16.4 | | | | 25.5 | | | | 10.8 | |
| Credit spread | | | 3.8 | | | | 4.5 | | | | 8.4 | | | | 2.0 | |
| Foreign exchange | | | 6.3 | | | | 5.0 | | | | 10.8 | | | | 2.8 | |
| Commodity | | | 0.8 | | | | 1.2 | | | | 2.6 | | | | 0.5 | |
| Equity | | | 5.1 | | | | 5.0 | | | | 14.1 | | | | 2.4 | |
| Correlation effect | | | (5.4 | ) | | | (5.5 | ) | | | na | | | | na | |
| | | |
| | | |
| | | | | | | | | |
| Total | | | 28.1 | | | | 26.6 | | | | 37.6 | | | | 18.1 | |
| | | |
| | | |
| | | |
| | | |
| |
* One-day measure using a 99% confidence level.
na — not applicable
In determining VaR, we take only partial account of the correlation and offsets that may exist between certain portfolios and classes of risk, such as equity prices and interest rates. A more conservative measure of market risk is therefore calculated than would otherwise be the case.
BMO has not experienced a loss this year that exceeded the overall VaR measure in the trading and underwriting portfolios, as can be seen in the following diagram. The $35 million of daily trading revenue reflected in the adjacent graphs substantially relates to commodity derivatives trading revenue, as explained on page 24.
We also measure exposure to concentrations of market risk, such as changes in particular interest rates, foreign exchange rates, equity or commodity prices and their related implied volatilities.
Effective controls over the revaluation of trading and underwriting portfolios and the determination of daily revenue from these activities enable us to monitor the revenue generated by each of the lines of business in relation to their business strategies and their level of market risk.
Trading revenues include amounts from all trading and underwriting activities, whether accounted for on a mark-to-market basis or an accrual basis, and also include certain fees and commissions directly related to those activities.
We monitor the application of our models to ensure that they are appropriate to the particular portfolio to which they are applied, and we take corrective action, including making adjustments to the determination of daily net trading revenues, when model limitations are identified.
We use a variety of methods to ensure the integrity of these models, including the application of backtesting against hypothetical losses. This process assumes there are no changes in the previous day’s closing positions. The process then isolates the effects of each day’s price movements against these closing positions. Models are considered to be validated by such testing if, on average, calculated hypothetical losses exceed the VaR measure only one time out of 100. Results of this testing confirm the reliability of our models.
The models used to measure market risks are effective at measuring risks under normal market conditions. In addition, we perform scenario analysis and stress testing to determine the impact of unusual and/or unexpected market changes on our portfolios. We use a comprehensive set of scenarios and stress tests, and the results are reported to RMC and RRC on a regular basis. For trading and underwriting portfolios, exposures are required to be managed within pre-set stress limits.
Structural Market Risk
Structural market risk is comprised of interest rate risk arising from our structural banking activities (loans and deposits), and foreign exchange risk arising from our foreign currency operations. BMO’s Corporate Treasury manages structural market risk in support of stable, high-quality earnings.
Structural interest rate risk arises primarily from interest rate mismatches and embedded options. Interest rate mismatches result from differences in the scheduled maturity or repricing dates of assets, liabilities and off-balance sheet items. Embedded option risk results from product features that allow customers to modify scheduled maturity or repricing dates. Embedded options include loan prepayment and deposit redemption privileges and committed rates on unadvanced mortgages. The net interest rate mismatch, representing residual assets funded by common
BMO FINANCIAL GROUP 186TH ANNUAL REPORT 2003 49
Management’s Discussion and Analysis of Operations and Financial Condition
shareholders’ equity, is maintained at a target duration of between two and three years and embedded options are managed to low risk levels. Interest rate swaps, options and securities are the primary tools utilized to manage interest rate risk.
Structural foreign exchange risk arises primarily from translation risk associated with the net investment in our U.S. operations, and from transaction risk associated with our U.S. dollar net income. Translation risk is managed by funding our net U.S. investment in U.S. dollars. Transaction risk is managed by entering into foreign exchange forward contract hedges each quarter that are expected to partially offset the effects of Canadian/ U.S. dollar exchange rate fluctuations on the quarter’s net income. The impact of exchange rate fluctuations on BMO’s 2003 net income is reviewed on page 21.
Structural MVE and EV measures both reflect holding periods of between one and three months and incorporate the impact of correlation between market variables. Structural MVE (see page 48) increased modestly over the past year due to growth in common shareholders’ equity, while EV continues to be managed to low levels.
In addition to MVE and EV, simulations, sensitivity analysis, stress testing and gap analysis, which is disclosed in Table 19 on page 64, are also used to measure and manage interest rate risk.
Structural interest rate sensitivity to an immediate parallel increase or decrease of 100 and 200 basis points is disclosed in the adjacent table. This sensitivity analysis is performed and disclosed by many financial institutions and facilitates comparison with our peer group.
Structural Interest Rate Sensitivity($ millions)*
| | | | | | | | | | | | | | | | | |
| (After-tax Canadian equivalent) | | As at October 31, 2003 | | As at October 31, 2002 |
| |
| |
|
| | | | | | | Earnings | | | | | | Earnings |
| | | Economic | | sensitivity | | Economic | | sensitivity |
| | | value | | over the next | | value | | over the next |
| | | sensitivity | | 12 months | | sensitivity | | 12 months |
| | |
| |
| |
| |
|
| 100 basis point increase | | | (202.3 | ) | | | 10.8 | | | | (152.7 | ) | | | 1.1 | |
| 100 basis point decrease | | | 142.7 | | | | (17.6 | ) | | | 123.8 | | | | (0.1 | ) |
| |
| 200 basis point increase | | | (431.8 | ) | | | 15.7 | | | | (354.1 | ) | | | (3.9 | ) |
| 200 basis point decrease | | | 181.2 | | | | (61.6 | ) | | | 180.0 | | | | (70.7 | ) |
| | | |
| | | |
| | | |
| | | |
| |
| * | | Exposures are in brackets and benefits are represented by positive amounts. |
Models used to measure structural market risk help forecast how interest rates and foreign exchange rates may change and predict how customers would likely react to the changes. These models have been developed using statistical analysis and are validated through regular model vetting and backtesting processes and ongoing dialogue with the lines of business.
For capital calculation purposes, structural market risk capital at risk is measured using a one-year holding period and a 99.95% confidence level. Structural market risk capital at risk is allocated to the lines of business.
Liquidity and Funding Risk
Managing liquidity and funding risk is essential to maintaining both depositor confidence and stability in earnings.
We manage liquidity and funding risk by ensuring that sufficient liquid assets and funding capacity are available to meet financial commitments, even in times of stress. Our liquidity and funding risk management framework includes:
| • | | oversight by senior governance committees, including the Liquidity and Funding Management Committee, RMC and RRC; |
| • | | an independent oversight group within Corporate Treasury; |
| • | | an RRC-approved limit structure to support risk management; |
| • | | effective processes and models to monitor and manage risk; |
| • | | strong controls over processes and models and their uses; |
| • | | a framework of scenario tests for stressed operating conditions; and |
| • | | contingency plans to facilitate managing through a disruption. |
Data provided in this section reflect BMO’s consolidated position. BMO subsidiaries include regulated and foreign entities and therefore, movements of funds between companies in the group are necessarily subject to the liquidity, funding and capital adequacy considerations of the subsidiaries and to tax considerations. Such considerations do not materially affect BMO’s liquidity and funding.
BMO’s liquidity and funding position remains sound and there are no trends, demands, commitments, events or uncertainties that are reasonably likely to materially impact the position.
We use two primary measures to manage liquidity and funding risk. The first measure is the cash and securities-to-total assets ratio. This measure provides an assessment of the extent to which assets can be readily converted into cash or cash substitutes to meet financial commitments, as cash resources and securities are more liquid than loans. The ratio represents the sum of cash resources and securities as a percentage of total assets. BMO’s cash and securities-to-total assets ratio at October 31, 2003 was 29.1%, up from 24.9% at October 31, 2002. The increase in the ratio was primarily attributable to growth in Canadian and U.S. dollar trading securities.
Liquidity and funding riskis the potential for loss if BMO is unable to meet financial commitments in a timely manner at reasonable prices as they fall due. Financial commitments include liabilities to depositors and suppliers, and lending and investment commitments.
Cash and securities totalled $74.7 billion at the end of the year, up from $63.0 billion in 2002, while total assets increased $3.6 billion to $256.5 billion. In the ordinary course of business, a
50 BMO FINANCIAL GROUP 186TH ANNUAL REPORT 2003
Management’s Discussion and Analysis of Operations and Financial Condition
portion of cash and securities is pledged as collateral to support trading activities and participation in clearing and payment systems, in Canada and abroad. At October 31, 2003, $18.7 billion of cash and securities had been pledged, which is in line with $18.9 billion pledged a year earlier. In addition, BMO is a party to certain agreements that could require incremental collateral under certain circumstances. These potential incremental collateral requirements are not material. Additional information on cash and securities can be found in Table 5 on page 55 and in Notes 2 and 3 on page 74 of the financial statements.
The second measure is the core deposits-to-total deposits ratio. Core deposits are more stable than other deposit sources, as they are comprised of individual customer operating and savings deposits and smaller fixed-date deposits. The ratio represents total deposits less fixed-date deposits greater than 100,000 units of any currency as a percentage of total deposits. BMO’s core deposits-to-total deposits ratio at October 31, 2003 was 57.1%, down from 59.6% in the prior year. The ratio decreased as growth in non-core deposits to fund increased holdings of trading securities outpaced growth in core deposits.
Core deposits totalled $98.0 billion at the end of the year, up from $96.5 billion in 2002, while total deposits increased $9.7 billion to $171.6 billion. Our large base of core deposits, along with our strong capital base, reduces reliance on less stable wholesale funding. Wholesale funding is largely short-term in nature and primarily supports trading and underwriting assets and investment securities.
Additional contractual information on deposits can be found in Table 24 on page 66.
Liquidity and funding could potentially be affected by off-balance sheet arrangements and other credit instruments through our obligation to fund drawdowns. These exposures are captured within our risk management framework. Off-balance sheet arrangements are discussed on page 42. Information on other credit instruments can be found in Note 5 on page 78 of the financial statements.
We continuously monitor liquidity and funding risk and actively manage the balance sheet to minimize this risk. Models are used to project liquid asset holding requirements, funding capacity and financial commitments based on stressed economic, market, political and enterprise-specific operating conditions.
Operational Risk
Operational risk is inherent in all business activities. While it can never be eliminated, it can be managed and mitigated, and in some cases insured against, to preserve and enhance shareholder value.
To achieve this goal, we have developed an Integrated Operational Risk Framework, which includes identification, measurement, analysis and monitoring, capital at risk attribution, and risk control/mitigation.
BMO manages operational risk through a comprehensive governance framework and effective controls. These include business contingency plans, event management processes, change management policies and procedures and an enterprise mergers and acquisitions framework.
BMO’s operational risk governance structure includes the Operational Risk Committee (ORC), a sub-committee of RMC. The ORC has oversight responsibility for operational risk strategy and governance. It provides advice and guidance to the lines of business on operational risk assessments, measurement and mitigation, and related monitoring and change initiatives.
Corporate Audit regularly reports on the effectiveness of operational risk internal controls and management processes to the CEO and to the Board’s Audit Committee.
Each line of business is responsible for managing its operational risk within the guidelines established by policy. Corporate Risk Management develops policy and guidelines for the management of operational risk and monitors and reports on significant enterprise issues and operational events to RMC and RRC.
Where appropriate and cost-effective, insurance is purchased to transfer components of operational risk to creditworthy insurance underwriters.
Operational risk is measured using an actuarial methodology, which combines the likelihood of an operational risk event occurring with the probable loss if it does occur, to arrive at the loss distribution. The expected and unexpected loss associated with particular operational risk events can be determined from the loss distribution. The unexpected loss is used to determine the capital at risk for each line of business and for each operational risk type. Historical loss data is used, where available, for calculating the frequency and severity of events. Where loss data is not available or is limited, loss scenarios are developed in conjunction with line of business management. To ensure that all operational risks to which a line of business is exposed are adequately captured and appropriately quantified, specialized functions such as Finance, Taxation, Legal, Compliance, Privacy, Human Resources and Systems and Information Management are also involved in the measurement process, as appropriate.
Operational riskis the potential for loss resulting from inadequate or failed internal processes or systems, human error or external events not related to credit, market or liquidity risks. Operational risk includes fiduciary risk, legal risk and business risk due to operational failure, but excludes business risks of a strategic nature such as business risk due to earnings volatility.
A tailored process and model are used to determine the operational risk for each line of business. For capital at risk calculation purposes, a 99.95% confidence level over a one-year holding period is used, which is consistent with the approaches used for other risks.
BMO’s goal is to make operational risk, like all other risks, transparent throughout the enterprise. This entails regularly reporting on:
| • | | exposures to the types of operational risk and their financial impact (expected loss, unexpected loss and stress loss); |
| • | | changes to the operational risk profile as a result of changes in the business and operating environment; and |
| • | | operational losses relative to external benchmarks. |
BMO FINANCIAL GROUP 186TH ANNUAL REPORT 2003 51
Management’s Discussion and Analysis of Operations and Financial Condition
Each component of our operational risk framework is at a different stage of development. Our approach is to continuously improve each component in a way that is useful to business and risk management while also meeting the forthcoming Basel II regulatory requirements.
Business Risk due to Earnings Volatility
BMO faces many risks that are similar to those faced by non-financial firms, principally that its profitability (and hence value) may be eroded by changes in the business environment or by failures of strategy or execution. Sources of these risks include volatile economic market activity, changing client expectations, adverse business developments and relatively ineffective responses to industry changes. Risks to BMO’s margins and volumes are categorized as business risk due to earnings volatility, and for each operating group, related capital at risk is estimated based on the volatility of earnings over a one-year horizon at a 99.95% confidence level.
Business risk due to earnings volatilitycaptures the possibility that volumes will decrease or margins will shrink with no opportunity being available to offset the revenue declines with a reduction in costs. Business risk is an enhancement of and replacement for strategic risk, introduced last year.
Environmental Risk
BMO is committed to the principle of sustainable development and, in particular, to the belief that the quality of our lives improves when economic growth is integrated with respect for the environment. We implement practices across the enterprise that reduce waste, conserve energy and recycle materials.
In providing credit to customers, we take reasonable precautions to ensure that we deal with environmentally responsible borrowers.
BMO will continue to demonstrate a willingness to work with government, industry and all relevant constituencies to support environmental issues. We are committed to open dialogue with all relevant constituencies including government, customers, employees, shareholders and the public at large.
Social and Ethical Risk
Given the nature of BMO’s business, we are committed to dealing with social and ethical risks in a responsible manner on an ongoing basis. In discharging these responsibilities, we conduct our business and operations in accordance with the highest ethical standards and in full compliance with all domestic laws and regulations in every jurisdiction in which BMO operates.
BMO is committed to truthful and ethical practices in advertising and adheres to the Canadian Code of Advertising.
BMO also champions principles of inclusion through our diverse workforce and supportive and equitable workplace.
BMO adheres to the principles of confidentiality and privacy in customer relations. We follow applicable codes of conduct and legislation that protect and respect personal information and initiate fair and timely redress of customer complaints and concerns.
Whether dealing with individuals or corporations, the reputation, integrity and character of a counterparty and/or its management are important considerations in deciding whether to conduct business with that counterparty.
In the development of foreign business, we consider ethical, political, social and economic factors in addition to other more traditional lending considerations. BMO does not knowingly lend, in North America or internationally, for purposes that support the suppression of basic individual freedom, encourage racial discrimination or national hatreds, or promote the use of violence or repression.
We also only lend to foreign customers purchasing military equipment when the purchases are consistent with Canada’s national defence policy or international treaty obligations and, when such transactions are originated in non-Canadian jurisdictions, the transactions are also in compliance with the national defence policies and international treaty obligations of the originating country.
BMO endeavours to avoid providing preferential treatment, or the appearance thereof, when entering into banking transactions with a political party, constituency association, candidate, leadership contestant or any other public official (including the individual’s family and/or related business enterprises).
We exercise the fundamental rule of good banking practice, “Know your customer,” in the course of all business dealings with customers and in the evaluation of prospective customers.
We will not knowingly conduct any type of business with customers whose money is derived from illegal activities. BMO will not complete any transaction of any type or operate any account for customers who fail to provide evidence of their identity, source of funds, or any other information we require to establish the good faith of a customer.
BMO also maintains strict conflict of interest rules for employees, officers and directors.
52 BMO FINANCIAL GROUP 186TH ANNUAL REPORT 2003
Management’s Discussion and Analysis of Operations and Financial Condition
REVIEW OF 2002 FINANCIAL PERFORMANCE
Earnings
Earnings per share rose $0.02 to $2.68 in fiscal 2002, while net income declined $54 million to $1,417 million. A $2 billion common share repurchase program completed in 2001 increased earnings on a per share basis even though net income declined. As explained on page 20, BMO had previously categorized certain revenue and expense items as non-recurring to assist in analyzing comparative results. Results in 2002 included $62 million ($36 million after tax) of acquisition-related costs that were designated as non-recurring. Results in 2001 benefited by a net $93 million in respect of items designated as nonrecurring, the most notable of which was a gain on sale of BMO’s equity investment in Bancomer. Excluding such items in both years, net income rose $78 million. Improved Personal and Commercial Client Group results, a reduced provision for credit losses, discontinued goodwill amortization and favourable tax rates and benefits drove the increase. Details of the items that had been designated as non-recurring are outlined in Table 26 on page 67.
Return on equity was 13.4% in 2002, compared with 13.8% in 2001. The reduction was attributable to the items outlined above that were designated as non-recurring items in both years as, excluding such items, return on equity increased 0.9% to 13.8%.
Revenue
Revenue declined $4 million to $8,859 million in 2002, represented by a $294 million or 6% increase in net interest income and a $298 million or 7% decline in non-interest revenue. Interest, dividend and fee income, and interest expense, which together comprise net interest income, were both much lower than in 2001 because of the low interest rate environment in 2002. However, net interest income increased in 2002 due to volume growth in personal and commercial banking in Canada and the United States. Personal and commercial banking net interest margin was down somewhat in Canada due to the continuation of the trend of spread compression in the low interest rate environment.
Non-interest revenue in 2002 benefited from the $152 million incremental effect of acquired businesses, while net income from investment securities was $269 million higher in 2001. Results in 2001 benefited by $143 million, due to the $321 million gain on sale of Bancomer, net of a write-down on investment in BMO’s own collateralized bond obligations that had been designated as non-recurring. Trading-related revenue was down sharply from a strong 2001.
Non-Interest Expenses
Non-interest expenses rose $359 million to $6,030 million in 2002. The increase was primarily attributable to the $312 million incremental effect of acquired businesses, of which $62 million was designated as non-recurring in 2002, and to $50 million of severance costs recorded in the fourth quarter. The expense-to-revenue ratio of 68.1% was up 4.1 percentage points from 2001. However, the productivity ratio of Personal and Commercial Client Group improved. The difficult capital markets environment of 2002 limited revenue growth in equity-related businesses. The gain on sale of Bancomer in 2001 and the higher level of net investment securities losses also contributed to the higher ratio.
Provision for Credit Losses
The provision for credit losses was $820 million in 2002, compared with $980 million in 2001. Provisions for losses in the then-troubled communications sector rose $270 million to $399 million, as more than half that increase was attributable to Teleglobe Inc.’s parent discontinuing financial support. Nonetheless, loss provisions on commercial loans declined $114 million from 2001.
Operating Groups Results
Personal and Commercial Client Group net income rose $70 million or 9% to $818 million in 2002. Revenue rose $191 million or 4% to $4,527 million, driven by strong volume growth in both Canadian and U.S. operations. Non-interest expenses increased $137 million or 5% to $2,932 million, rising mainly in the United States due to systems conversion and integration costs from the Joliet acquisition, volume growth, expansion initiatives and currency translation. The group’s productivity ratio improved by 300 basis points.
Private Client Group net income declined $36 million to $71 million in 2002, as results included $62 million ($39 million after tax) of acquisition-related costs that were categorized as non-recurring in 2002. Revenue increased $173 million or 12% to $1,663 million, driven by acquired businesses and strategic initiatives. Excluding acquisitions, revenue on a comparable basis was down $26 million from 2001, a modest reduction in the context of weaker equity markets and lower client trading volumes. Noninterest expenses increased $261 million or 20% to $1,543 million due to acquisitions. Excluding acquired businesses, non-interest expenses on a comparable basis were reduced $54 million from 2001 due to the success of cost management initiatives.
Investment Banking Group net income increased $143 million or 31% to $601 million in 2002. The improvement in income reflected a $301 million reduction in the provision for credit losses, which was primarily due to a change in BMO’s loan loss allocation methodology in 2002. Revenue declined $198 million to $2,548 million. Trading-related revenue fell by $204 million from a robust 2001, while investment securities losses were $142 million, compared with $205 million in 2001, as both years were affected by write-downs in BMO’s investments in its collateralized bond obligations. Weak North American market and credit environments contributed to a general downturn in investment banking fees and downward pressure on corporate lending volumes. In 2002, revenue benefited from strong restructuring activity, equity origination and a more favourable interest rate environment. Non-interest expenses were reduced $91 million or 6% to $1,416 million, largely due to a reduction in performance-based compensation and a disciplined approach to cost management.
Corporate Support incurred a net loss of $73 million in 2002, compared with net income of $158 million in 2001. Results in 2001 included the $321 million gain on sale of the investment in Bancomer. The provision for credit losses increased $129 million, while non-interest expenses rose $52 million, driven by higher pension and corporate costs, including Corporate Support’s share of severance costs. The provision for credit losses is not comparable between years as, beginning in 2002, Corporate Support was charged for differences between the periodic provisions charged to the client groups and BMO’s provision required under GAAP.
BMO FINANCIAL GROUP 186TH ANNUAL REPORT 2003 53
SUPPLEMENTAL INFORMATION
Table 1 Shareholder Value
| | | | | | | | | | | | | | | | | | | | | | | | | | | | | | | | | | | | | | | | | | |
| As at or for the year ended October 31 | | 2003 | | | 2002 | | | 2001 | | | 2000 | | | 1999 | | | 1998 | | | 1997 | | | 1996 | | | 1995 | | | 1994 | |
| |
| |
| |
| |
| |
| |
| |
| |
| |
| |
|
Market Price per Common Share ($) | | | | | | | | | | | | | | | | | | | | | | | | | | | | | | | | | | | | | | | | |
| High | | | 50.26 | | | | 40.65 | | | | 44.40 | | | | 35.80 | | | | 34.80 | | | | 43.50 | | | | 30.80 | | | | 20.83 | | | | 15.50 | | | | 15.38 | |
| Low | | | 37.79 | | | | 31.00 | | | | 32.75 | | | | 21.00 | | | | 24.68 | | | | 25.88 | | | | 19.53 | | | | 14.69 | | | | 12.06 | | | | 11.00 | |
| Close | | | 49.33 | | | | 38.10 | | | | 33.86 | | | | 35.25 | | | | 28.33 | | | | 31.55 | | | | 30.43 | | | | 20.28 | | | | 14.88 | | | | 12.56 | |
Common Dividends | | | | | | | | | | | | | | | | | | | | | | | | | | | | | | | | | | | | | | | | |
| Dividends declared per share ($) | | | 1.34 | | | | 1.20 | | | | 1.12 | | | | 1.00 | | | | 0.94 | | | | 0.88 | | | | 0.82 | | | | 0.74 | | | | 0.66 | | | | 0.60 | |
| Dividends paid per share ($) | | | 1.29 | | | | 1.18 | | | | 1.09 | | | | 0.99 | | | | 0.93 | | | | 0.88 | | | | 0.80 | | | | 0.71 | | | | 0.65 | | | | 0.59 | |
| Dividend payout ratio (%) | | | 38.2 | | | | 44.0 | | | | 40.8 | | | | 30.2 | | | | 39.6 | | | | 37.4 | | | | 35.0 | | | | 35.1 | | | | 38.2 | | | | 40.3 | |
| Dividend yield (%) | | | 2.7 | | | | 3.1 | | | | 3.3 | | | | 2.8 | | | | 3.3 | | | | 2.8 | | | | 2.9 | | | | 3.9 | | | | 4.4 | | | | 4.8 | |
Total Shareholder Return(%) | | | | | | | | | | | | | | | | | | | | | | | | | | | | | | | | | | | | | | | | |
| Five-year average annual return | | | 12.9 | | | | 7.9 | | | | 14.3 | | | | 22.9 | | | | 22.0 | | | | 23.3 | | | | 26.1 | | | | 22.2 | | | | 23.1 | | | | 14.3 | |
| One-year return | | | 33.4 | | | | 16.2 | | | | (1.2 | ) | | | 29.0 | | | | (7.4 | ) | | | 6.4 | | | | 55.0 | | | | 42.4 | | | | 24.1 | | | | (2.3 | ) |
Common Share Information | | | | | | | | | | | | | | | | | | | | | | | | | | | | | | | | | | | | | | | | |
| Number outstanding (in thousands) | | | | | | | | | | | | | | | | | | | | | | | | | | | | | | | | | | | | | | | | |
| | End of period | | | 499,632 | | | | 492,505 | | | | 489,085 | | | | 522,584 | | | | 534,064 | | | | 528,866 | | | | 522,873 | | | | 519,874 | | | | 527,369 | | | | 530,913 | |
| | Average basic | | | 496,208 | | | | 490,816 | | | | 511,286 | | | | 531,318 | | | | 531,723 | | | | 525,021 | | | | 520,819 | | | | 522,465 | | | | 531,264 | | | | 502,615 | |
| | Average diluted | | | 507,009 | | | | 499,464 | | | | 523,561 | | | | 540,815 | | | | 542,920 | | | | 542,181 | | | | 538,469 | | | | 538,271 | | | | 548,267 | | | | 512,992 | |
| Number of shareholder accounts | | | 42,880 | | | | 44,072 | | | | 45,190 | | | | 46,663 | | | | 49,369 | | | | 51,387 | | | | 53,651 | | | | 55,571 | | | | 57,187 | | | | 58,879 | |
| Book value per share ($) | | | 22.09 | | | | 21.07 | | | | 19.69 | | | | 19.63 | | | | 17.44 | | | | 16.36 | | | | 14.59 | | | | 12.94 | | | | 11.71 | | | | 10.69 | |
| Total market value of shares ($ billions) | | | 24.6 | | | | 18.8 | | | | 16.6 | | | | 18.4 | | | | 15.1 | | | | 16.7 | | | | 15.9 | | | | 10.5 | | | | 7.8 | | | | 6.7 | |
| Price-to-earnings multiple | | | 14.1 | | | | 14.0 | | | | 12.4 | | | | 10.7 | | | | 11.9 | | | | 13.4 | | | | 12.9 | | | | 9.7 | | | | 8.6 | | | | 8.3 | |
| Price-to-cash earnings multiple | | | 13.4 | | | | 13.2 | | | | 11.6 | | | | 10.2 | | | | 11.3 | | | | 12.7 | | | | 12.3 | | | | 9.1 | | | | 8.1 | | | | 8.0 | |
| Market-to-book value multiple | | | 2.23 | | | | 1.81 | | | | 1.72 | | | | 1.80 | | | | 1.62 | | | | 1.93 | | | | 2.09 | | | | 1.57 | | | | 1.27 | | | | 1.17 | |
| | | |
| | | |
| | | |
| | | |
| | | |
| | | |
| | | |
| | | |
| | | |
| | | |
| |
Table 2 Summary Income Statement and Growth Statistics($ millions, except as noted)
| | | | | | | | | | | | | | | | | | | | | | | | | | | | | | | | | | | | | | | | | | |
| For the year ended October 31 | | 2003 | | | 2002 | | | 2001 | | | 2000 | | | 1999 | | | 1998 | | | 1997 | | | 1996 | | | 1995 | | | 1994 | |
| |
| |
| |
| |
| |
| |
| |
| |
| |
| |
|
Income Statement | | | | | | | | | | | | | | | | | | | | | | | | | | | | | | | | | | | | | | | | |
| Net interest income (teb) | | | 5,051 | | | | 4,935 | | | | 4,641 | | | | 4,338 | | | | 4,417 | | | | 4,152 | | | | 4,186 | | | | 3,711 | | | | 3,564 | | | | 3,325 | |
| Non-interest revenue | | | 4,220 | | | | 3,924 | | | | 4,222 | | | | 4,326 | | | | 3,511 | | | | 3,118 | | | | 2,981 | | | | 2,516 | | | | 2,102 | | | | 1,871 | |
| | | |
| | | |
| | | |
| | | |
| | | |
| | | |
| | | |
| | | |
| | | |
| | | |
| |
| Total revenue (teb) | | | 9,271 | | | | 8,859 | | | | 8,863 | | | | 8,664 | | | | 7,928 | | | | 7,270 | | | | 7,167 | | | | 6,227 | | | | 5,666 | | | | 5,196 | |
| Provision for credit losses | | | 455 | | | | 820 | | | | 980 | | | | 358 | | | | 320 | | | | 130 | | | | 275 | | | | 225 | | | | 275 | | | | 510 | |
| Non-interest expense | | | 6,087 | | | | 6,030 | | | | 5,671 | | | | 5,258 | | | | 5,288 | | | | 4,785 | | | | 4,567 | | | | 3,913 | | | | 3,612 | | | | 3,208 | |
| | | |
| | | |
| | | |
| | | |
| | | |
| | | |
| | | |
| | | |
| | | |
| | | |
| |
| Income before provision for income taxes, non-controlling interest in subsidiaries and goodwill amortization | | | 2,729 | | | | 2,009 | | | | 2,212 | | | | 3,048 | | | | 2,320 | | | | 2,355 | | | | 2,325 | | | | 2,089 | | | | 1,779 | | | | 1,478 | |
| Income taxes (teb) | | | 840 | | | | 530 | | | | 643 | | | | 1,123 | | | | 874 | | | | 938 | | | | 954 | | | | 866 | | | | 746 | | | | 627 | |
| Non-controlling interest in subsidiaries | | | 64 | | | | 62 | | | | 42 | | | | 19 | | | | 21 | | | | 25 | | | | 25 | | | | 20 | | | | 13 | | | | 11 | |
| | | |
| | | |
| | | |
| | | |
| | | |
| | | |
| | | |
| | | |
| | | |
| | | |
| |
| Net income before goodwill amortization | | | 1,825 | | | | 1,417 | | | | 1,527 | | | | 1,906 | | | | 1,425 | | | | 1,392 | | | | 1,346 | | | | 1,203 | | | | 1,020 | | | | 840 | |
| Amortization of goodwill, net of applicable income tax | | | — | | | | — | | | | 56 | | | | 49 | | | | 43 | | | | 42 | | | | 41 | | | | 35 | | | | 34 | | | | 15 | |
| | | |
| | | |
| | | |
| | | |
| | | |
| | | |
| | | |
| | | |
| | | |
| | | |
| |
| Net income | | | 1,825 | | | | 1,417 | | | | 1,471 | | | | 1,857 | | | | 1,382 | | | | 1,350 | | | | 1,305 | | | | 1,168 | | | | 986 | | | | 825 | |
| | | |
| | | |
| | | |
| | | |
| | | |
| | | |
| | | |
| | | |
| | | |
| | | |
| |
| | Year-over-year growth (%) | | | 28.8 | | | | (3.7 | ) | | | (20.8 | ) | | | 34.4 | | | | 2.4 | | | | 3.5 | | | | 11.7 | | | | 18.4 | | | | 19.5 | | | | 16.4 | |
| | | | | | | | | | | | | | | | | | | | | | | | | | | | | | | | | | | | | | | | |
Earnings per Share($) | | | | | | | | | | | | | | | | | | | | | | | | | | | | | | | | | | | | | | | | |
| Basic | | | 3.51 | | | | 2.73 | | | | 2.72 | | | | 3.30 | | | | 2.38 | | | | 2.36 | | | | 2.35 | | | | 2.10 | | | | 1.73 | | | | 1.51 | |
| Diluted | | | 3.44 | | | | 2.68 | | | | 2.66 | | | | 3.25 | | | | 2.34 | | | | 2.29 | | | | 2.28 | | | | 2.06 | | | | 1.69 | | | | 1.49 | |
| | Year-over-year growth (%) | | | 28.4 | | | | 0.8 | | | | (18.2 | ) | | | 38.9 | | | | 2.2 | | | | 0.4 | | | | 10.7 | | | | 21.9 | | | | 13.4 | | | | 16.4 | |
Diluted Cash Earnings per Share($) | | | 3.59 | | | | 2.83 | | | | 2.86 | | | | 3.39 | | | | 2.46 | | | | 2.42 | | | | 2.42 | | | | 2.17 | | | | 1.79 | | | | 1.55 | |
| | Year-over-year growth (%) | | | 26.9 | | | | (1.0 | ) | | | (15.6 | ) | | | 37.8 | | | | 1.7 | | | | — | | | | 11.5 | | | | 21.2 | | | | 15.5 | | | | 14.8 | |
| | | |
| | | |
| | | |
| | | |
| | | |
| | | |
| | | |
| | | |
| | | |
| | | |
| |
54 BMO FINANCIAL GROUP 186TH ANNUAL REPORT 2003
Supplemental Information
Table 3 Returns on Equity and Assets($ millions, except as noted)
| | | | | | | | | | | | | | | | | | | | | | | | | | | | | | | | | | | | | | | | | | |
| For the year ended October 31 | | 2003 | | | 2002 | | | 2001 | | | 2000 | | | 1999 | | | 1998 | | | 1997 | | | 1996 | | | 1995 | | | 1994 | |
| |
| |
| |
| |
| |
| |
| |
| |
| |
| |
|
| Net income | | | 1,825 | | | | 1,417 | | | | 1,471 | | | | 1,857 | | | | 1,382 | | | | 1,350 | | | | 1,305 | | | | 1,168 | | | | 986 | | | | 825 | |
| Preferred dividends | | | 82 | | | | 79 | | | | 80 | | | | 101 | | | | 117 | | | | 112 | | | | 83 | | | | 69 | | | | 69 | | | | 69 | |
| | | |
| | | |
| | | |
| | | |
| | | |
| | | |
| | | |
| | | |
| | | |
| | | |
| |
| Net income available to common shareholders | | | 1,743 | | | | 1,338 | | | | 1,391 | | | | 1,756 | | | | 1,265 | | | | 1,238 | | | | 1,222 | | | | 1,099 | | | | 917 | | | | 756 | |
| Average common shareholders’ equity | | | 10,646 | | | | 9,973 | | | | 10,100 | | | | 9,745 | | | | 8,976 | | | | 8,128 | | | | 7,165 | | | | 6,457 | | | | 5,937 | | | | 5,088 | |
| Return on equity (%) | | | 16.4 | | | | 13.4 | | | | 13.8 | | | | 18.0 | | | | 14.1 | | | | 15.2 | | | | 17.1 | | | | 17.0 | | | | 15.4 | | | | 14.9 | |
| Cash return on equity (%) | | | 17.1 | | | | 14.2 | | | | 14.8 | | | | 18.8 | | | | 14.8 | | | | 16.1 | | | | 18.0 | | | | 17.9 | | | | 16.4 | | | | 15.5 | |
| Return on average assets (%) | | | 0.69 | | | | 0.57 | | | | 0.60 | | | | 0.79 | | | | 0.61 | | | | 0.59 | | | | 0.66 | | | | 0.74 | | | | 0.68 | | | | 0.68 | |
| Return on average assets available to common shareholders (%) | | | 0.66 | | | | 0.54 | | | | 0.57 | | | | 0.75 | | | | 0.56 | | | | 0.54 | | | | 0.62 | | | | 0.69 | | | | 0.64 | | | | 0.62 | |
| | | |
| | | |
| | | |
| | | |
| | | |
| | | |
| | | |
| | | |
| | | |
| | | |
| |
Table 4 Summary Balance Sheet($ millions)
| | | | | | | | | | | | | | | | | | | | | | | | | | | | | | | | | | | | | | | | | | |
| As at October 31 | | 2003 | | | 2002 | | | 2001 | | | 2000 | | | 1999 | | | 1998 | | | 1997 | | | 1996 | | | 1995 | | | 1994 | |
| |
| |
| |
| |
| |
| |
| |
| |
| |
| |
|
Assets | | | | | | | | | | | | | | | | | | | | | | | | | | | | | | | | | | | | | | | | |
| Cash resources | | | 19,860 | | | | 19,305 | | | | 17,656 | | | | 18,508 | | | | 24,036 | | | | 19,730 | | | | 32,245 | | | | 24,187 | | | | 20,317 | | | | 14,659 | |
| Securities | | | 54,790 | | | | 43,715 | | | | 37,676 | | | | 46,463 | | | | 43,273 | | | | 43,465 | | | | 41,789 | | | | 36,609 | | | | 33,019 | | | | 26,535 | |
| Loans and acceptances (net) | | | 146,156 | | | | 149,596 | | | | 144,765 | | | | 142,447 | | | | 144,754 | | | | 136,635 | | | | 120,512 | | | | 102,810 | | | | 92,911 | | | | 92,064 | |
| Other assets | | | 35,688 | | | | 40,248 | | | | 39,312 | | | | 25,978 | | | | 18,552 | | | | 22,760 | | | | 13,292 | | | | 6,226 | | | | 5,587 | | | | 4,917 | |
| | | |
| | | |
| | | |
| | | |
| | | |
| | | |
| | | |
| | | |
| | | |
| | | |
| |
| Total assets | | | 256,494 | | | | 252,864 | | | | 239,409 | | | | 233,396 | | | | 230,615 | | | | 222,590 | | | | 207,838 | | | | 169,832 | | | | 151,834 | | | | 138,175 | |
| | | |
| | | |
| | | |
| | | |
| | | |
| | | |
| | | |
| | | |
| | | |
| | | |
| |
Liabilities and Shareholders’ Equity | | | | | | | | | | | | | | | | | | | | | | | | | | | | | | | | | | | | | | | | |
| Deposits | | | 171,551 | | | | 161,838 | | | | 154,290 | | | | 156,697 | | | | 156,874 | | | | 143,983 | | | | 144,212 | | | | 119,262 | | | | 109,605 | | | | 98,241 | |
| Other liabilities | | | 69,605 | | | | 75,338 | | | | 69,763 | | | | 59,847 | | | | 58,048 | | | | 63,208 | | | | 50,892 | | | | 39,670 | | | | 32,602 | | | | 31,178 | |
| Subordinated debt | | | 2,856 | | | | 3,794 | | | | 4,674 | | | | 4,911 | | | | 4,712 | | | | 4,791 | | | | 3,831 | | | | 3,314 | | | | 2,595 | | | | 2,218 | |
| Share capital | | | | | | | | | | | | | | | | | | | | | | | | | | | | | | | | | | | | | | | | |
| | Preferred | | | 1,446 | | | | 1,517 | | | | 1,050 | | | | 1,681 | | | | 1,668 | | | | 1,958 | | | | 1,274 | | | | 857 | | | | 858 | | | | 860 | |
| | Common | | | 3,662 | | | | 3,459 | | | | 3,375 | | | | 3,173 | | | | 3,190 | | | | 3,095 | | | | 3,019 | | | | 2,989 | | | | 3,002 | | | | 3,002 | |
| Contributed surplus | | | 3 | | | | — | | | | — | | | | — | | | | — | | | | — | | | | — | | | | — | | | | — | | | | — | |
| Retained earnings | | | 7,371 | | | | 6,918 | | | | 6,257 | | | | 7,087 | | | | 6,123 | | | | 5,555 | | | | 4,610 | | | | 3,740 | | | | 3,172 | | | | 2,676 | |
| | | |
| | | |
| | | |
| | | |
| | | |
| | | |
| | | |
| | | |
| | | |
| | | |
| |
| Total liabilities and shareholders’ equity | | | 256,494 | | | | 252,864 | | | | 239,409 | | | | 233,396 | | | | 230,615 | | | | 222,590 | | | | 207,838 | | | | 169,832 | | | | 151,834 | | | | 138,175 | |
| | | |
| | | |
| | | |
| | | |
| | | |
| | | |
| | | |
| | | |
| | | |
| | | |
| |
Average Daily Balances | | | | | | | | | | | | | | | | | | | | | | | | | | | | | | | | | | | | | | | | |
| Loans and acceptances (net) | | | 150,784 | | | | 147,443 | | | | 147,370 | | | | 143,428 | | | | 142,440 | | | | 136,450 | | | | 117,761 | | | | 98,919 | | | | 90,927 | | | | 80,681 | |
| Assets | | | 263,966 | | | | 247,990 | | | | 243,248 | | | | 234,944 | | | | 226,714 | | | | 227,450 | | | | 196,721 | | | | 158,316 | | | | 144,115 | | | | 122,234 | |
| | | |
| | | |
| | | |
| | | |
| | | |
| | | |
| | | |
| | | |
| | | |
| | | |
| |
Table 5 Liquid Assets($ millions, except as noted)
| | | | | | | | | | | | | | | | | | | | | | | | | | | | | | | | | | | | | | | | | | |
| As at October 31 | | 2003 | | | 2002 | | | 2001 | | | 2000 | | | 1999 | | | 1998 | | | 1997 | | | 1996 | | | 1995 | | | 1994 | |
| |
| |
| |
| |
| |
| |
| |
| |
| |
| |
|
Canadian Dollar Liquid Assets | | | | | | | | | | | | | | | | | | | | | | | | | | | | | | | | | | | | | | | | |
| Deposits with other banks | | | 1,330 | | | | 1,892 | | | | 1,535 | | | | 1,814 | | | | 843 | | | | 1,080 | | | | 3,110 | | | | 2,839 | | | | 3,002 | | | | 2,790 | |
| Other cash resources | | | 1,313 | | | | 2,178 | | | | 1,296 | | | | 782 | | | | 817 | | | | 745 | | | | 702 | | | | 631 | | | | 17 | | | | 651 | |
| Securities | | | 28,790 | | | | 23,471 | | | | 16,398 | | | | 20,846 | | | | 15,942 | | | | 17,216 | | | | 22,442 | | | | 22,651 | | | | 21,245 | | | | 16,915 | |
| | | |
| | | |
| | | |
| | | |
| | | |
| | | |
| | | |
| | | |
| | | |
| | | |
| |
| Total Canadian dollar liquid assets | | | 31,433 | | | | 27,541 | | | | 19,229 | | | | 23,442 | | | | 17,602 | | | | 19,041 | | | | 26,254 | | | | 26,121 | | | | 24,264 | | | | 20,356 | |
| | | |
| | | |
| | | |
| | | |
| | | |
| | | |
| | | |
| | | |
| | | |
| | | |
| |
U.S. Dollar and Other Currencies Liquid Assets | | | | | | | | | | | | | | | | | | | | | | | | | | | | | | | | | | | | | | | | |
| Deposits with other banks | | | 16,774 | | | | 14,445 | | | | 13,431 | | | | 15,125 | | | | 21,279 | | | | 16,334 | | | | 26,946 | | | | 18,606 | | | | 16,418 | | | | 11,029 | |
| Other cash resources | | | 443 | | | | 790 | | | | 1,394 | | | | 787 | | | | 1,097 | | | | 1,571 | | | | 1,487 | | | | 2,111 | | | | 880 | | | | 189 | |
| Securities | | | 26,000 | | | | 20,244 | | | | 21,278 | | | | 25,617 | | | | 27,331 | | | | 26,249 | | | | 19,347 | | | | 13,958 | | | | 11,774 | | | | 9,620 | |
| | | |
| | | |
| | | |
| | | |
| | | |
| | | |
| | | |
| | | |
| | | |
| | | |
| |
| Total U.S. dollar and other currencies liquid assets | | | 43,217 | | | | 35,479 | | | | 36,103 | | | | 41,529 | | | | 49,707 | | | | 44,154 | | | | 47,780 | | | | 34,675 | | | | 29,072 | | | | 20,838 | |
| | | |
| | | |
| | | |
| | | |
| | | |
| | | |
| | | |
| | | |
| | | |
| | | |
| |
Total Liquid Assets(a) | | | 74,650 | | | | 63,020 | | | | 55,332 | | | | 64,971 | | | | 67,309 | | | | 63,195 | | | | 74,034 | | | | 60,796 | | | | 53,336 | | | | 41,194 | |
| Cash and securities-to-total assets (%) | | | 29.1 | | | | 24.9 | | | | 23.1 | | | | 27.8 | | | | 29.2 | | | | 28.4 | | | | 35.6 | | | | 35.8 | | | | 35.1 | | | | 29.8 | |
| Pledged assets included in total liquid assets (b) | | | 18,698 | | | | 18,859 | | | | 16,106 | | | | 17,553 | | | | 15,518 | | | NA | | | NA | | | NA | | | NA | | | NA | |
| | | |
| | | |
| | | |
| | | |
| | | |
| | | |
| | | |
| | | |
| | | |
| | | |
| |
| (a) | | Includes liquid assets pledged as security for securities sold but not yet purchased, securities sold under repurchase agreements and other secured liabilities. |
| (b) | | Includes reserves or minimum balances which some of our subsidiaries are required to maintain with central banks in their respective countries of operation. |
NA — not available
BMO FINANCIAL GROUP 186TH ANNUAL REPORT 2003 55
Supplemental Information
Table 6 Revenue and Revenue Growth($ millions, except as noted)
| | | | | | | | | | | | | | | | | | | | | | | | | | | | | | | | | | | | | | | | | | |
| For the year ended October 31 | | 2003 | | | 2002 | | | 2001 | | | 2000 | | | 1999 | | | 1998 | | | 1997 | | | 1996 | | | 1995 | | | 1994 | |
| |
| |
| |
| |
| |
| |
| |
| |
| |
| |
|
Net Interest Income | | | | | | | | | | | | | | | | | | | | | | | | | | | | | | | | | | | | | | | | |
| Net interest income as reported | | | 4,899 | | | | 4,829 | | | | 4,499 | | | | 4,204 | | | | 4,279 | | | | 4,024 | | | | 4,077 | | | | 3,603 | | | | 3,480 | | | | 3,258 | |
| Taxable equivalent basis adjustment (teb) | | | 152 | | | | 106 | | | | 142 | | | | 134 | | | | 138 | | | | 128 | | | | 109 | | | | 108 | | | | 84 | | | | 67 | |
| | | |
| | | |
| | | |
| | | |
| | | |
| | | |
| | | |
| | | |
| | | |
| | | |
| |
| Net interest income (teb) | | | 5,051 | | | | 4,935 | | | | 4,641 | | | | 4,338 | | | | 4,417 | | | | 4,152 | | | | 4,186 | | | | 3,711 | | | | 3,564 | | | | 3,325 | |
| | | |
| | | |
| | | |
| | | |
| | | |
| | | |
| | | |
| | | |
| | | |
| | | |
| |
| | Year-over-year growth (%) | | | 2.3 | | | | 6.3 | | | | 7.0 | | | | (1.8 | ) | | | 6.4 | | | | (0.8 | ) | | | 12.8 | | | | 4.1 | | | | 7.2 | | | | 3.7 | |
| | | | | | | | | | | | |
Net Interest Margin | | | | | | | | | | | | | | | | | | | | | | | | | | | | | | | | | | | | | | | | |
| Total average assets | | | 263,966 | | | | 247,990 | | | | 243,248 | | | | 234,944 | | | | 226,714 | | | | 227,450 | | | | 196,721 | | | | 158,316 | | | | 144,115 | | | | 122,234 | |
| Net interest margin (%) | | | 1.91 | | | | 1.99 | | | | 1.91 | | | | 1.85 | | | | 1.95 | | | | 1.83 | | | | 2.13 | | | | 2.34 | | | | 2.47 | | | | 2.72 | |
Canadian dollar net interest
margin (%) | | | 2.36 | | | | 2.58 | | | | 2.78 | | | | 2.70 | | | | 2.82 | | | | 2.52 | | | | 2.70 | | | | 2.94 | | | | 3.39 | | | | 3.48 | |
U.S. dollar and other currencies net
interest margin (%) | | | 1.32 | | | | 1.37 | | | | 1.15 | | | | 1.01 | | | | 1.19 | | | | 1.17 | | | | 1.48 | | | | 1.58 | | | | 1.22 | | | | 1.59 | |
| | | | | | | | | | | | |
Non-Interest Revenue | | | | | | | | | | | | | | | | | | | | | | | | | | | | | | | | | | | | | | | | |
| Securities commissions and fees (a) | | | 894 | | | | 813 | | | | 742 | | | | 859 | | | | 666 | | | | 657 | | | | 742 | | | | 614 | | | | 414 | | | | 313 | |
| Deposit and payment service charges | | | 756 | | | | 732 | | | | 670 | | | | 646 | | | | 616 | | | | 558 | | | | 508 | | | | 473 | | | | 451 | | | | 437 | |
| Trading revenues | | | 275 | | | | 209 | | | | 490 | | | | 388 | | | | 295 | | | | 40 | | | | 276 | | | | 277 | | | | 225 | | | | 226 | |
| Lending fees | | | 293 | | | | 306 | | | | 352 | | | | 322 | | | | 329 | | | | 290 | | | | 240 | | | | 194 | | | | 186 | | | | 180 | |
| Card fees | | | 290 | | | | 260 | | | | 204 | | | | 216 | | | | 205 | | | | 196 | | | | 251 | | | | 234 | | | | 230 | | | | 211 | |
| Investment management and custodial fees | | | 303 | | | | 314 | | | | 336 | | | | 373 | | | | 419 | | | | 407 | | | | 299 | | | | 221 | | | | 240 | | | | 197 | |
| Mutual fund revenues | | | 321 | | | | 309 | | | | 251 | | | | 232 | | | | 207 | | | | 199 | | | | 155 | | | | 87 | | | | 53 | | | | 56 | |
| Securitization revenues | | | 244 | | | | 329 | | | | 331 | | | | 343 | | | | 296 | | | | 158 | | | | 32 | | | | — | | | | — | | | | — | |
| Underwriting and advisory fees (a) | | | 268 | | | | 228 | | | | 234 | | | | 210 | | | | 175 | | | | 212 | | | | 177 | | | | 146 | | | | 81 | | | NA | |
| Investment securities gains (losses) | | | (41 | ) | | | (146 | ) | | | 123 | | | | 183 | | | | (85 | ) | | | 97 | | | | 52 | | | | 71 | | | | 46 | | | | 37 | |
| Foreign exchange, other than trading | | | 160 | | | | 151 | | | | 127 | | | | 146 | | | | 133 | | | | 103 | | | | 126 | | | | 120 | | | | 99 | | | | 89 | |
| Insurance income | | | 124 | | | | 105 | | | | 125 | | | | 96 | | | | 73 | | | | 62 | | | | 62 | | | | 44 | | | | 36 | | | | 51 | |
| Other revenues | | | 333 | | | | 314 | | | | 237 | | | | 312 | | | | 182 | | | | 139 | | | | 61 | | | | 35 | | | | 41 | | | | 74 | |
| | | |
| | | |
| | | |
| | | |
| | | |
| | | |
| | | |
| | | |
| | | |
| | | |
| |
| Total non-interest revenue | | | 4,220 | | | | 3,924 | | | | 4,222 | | | | 4,326 | | | | 3,511 | | | | 3,118 | | | | 2,981 | | | | 2,516 | | | | 2,102 | | | | 1,871 | |
| | | |
| | | |
| | | |
| | | |
| | | |
| | | |
| | | |
| | | |
| | | |
| | | |
| |
| | Year-over-year growth (%) | | | 7.6 | | | | (7.1 | ) | | | (2.4 | ) | | | 23.2 | | | | 12.6 | | | | 4.6 | | | | 18.5 | | | | 19.7 | | | | 12.3 | | | | 13.1 | |
| | Non-interest revenue as a % of total revenue | | | 45.5 | | | | 44.3 | | | | 47.6 | | | | 49.9 | | | | 44.3 | | | | 42.9 | | | | 41.6 | | | | 40.4 | | | | 37.1 | | | | 36.0 | |
| | | |
| | | |
| | | |
| | | |
| | | |
| | | |
| | | |
| | | |
| | | |
| | | |
| |
Total Revenue (teb) | | | 9,271 | | | | 8,859 | | | | 8,863 | | | | 8,664 | | | | 7,928 | | | | 7,270 | | | | 7,167 | | | | 6,227 | | | | 5,666 | | | | 5,196 | |
| | Year-over-year growth (%) | | | 4.7 | | | | — | | | | 2.3 | | | | 9.3 | | | | 9.0 | | | | 1.4 | | | | 15.1 | | | | 9.9 | | | | 9.0 | | | | 6.9 | |
| | | |
| | | |
| | | |
| | | |
| | | |
| | | |
| | | |
| | | |
| | | |
| | | |
| |
| (a) | | In 1994, underwriting and advisory fees are included in securities commissions and fees. |
NA — not available
56 BMO FINANCIAL GROUP 186TH ANNUAL REPORT 2003
Supplemental Information
Table 7 Non-Interest Expense and Expense-to-Revenue Ratio($ millions, except as noted)
| | | | | | | | | | | | | | | | | | | | | | | | | | | | | | | | | | | | | | | | | | | |
| For the year ended October 31 | | 2003 | | | 2002 | | | 2001 | | | 2000 | | | 1999 | | | 1998 | | | 1997 | | | 1996 | | | 1995 | | | 1994 | |
| |
| |
| |
| |
| |
| |
| |
| |
| |
| |
|
Non-Interest Expense | | | | | | | | | | | | | | | | | | | | | | | | | | | | | | | | | | | | | | | | |
| Employee compensation | | | | | | | | | | | | | | | | | | | | | | | | | | | | | | | | | | | | | | | | |
| | Salaries | | | 3,039 | | | | 2,962 | | | | 2,857 | | | | 2,800 | | | | 2,532 | | | | 2,370 | | | | 2,284 | | | | 1,972 | | | | 1,758 | | | | 1,567 | |
| | Employee benefits | | | 539 | | | | 441 | | | | 355 | | | | 265 | | | | 288 | | | | 204 | | | | 251 | | | | 238 | | | | 241 | | | | 228 | |
| | | | |
| | | |
| | | |
| | | |
| | | |
| | | |
| | | |
| | | |
| | | |
| | | |
| |
| | Total employee compensation | | | 3,578 | | | | 3,403 | | | | 3,212 | | | | 3,065 | | | | 2,820 | | | | 2,574 | | | | 2,535 | | | | 2,210 | | | | 1,999 | | | | 1,795 | |
| | | | |
| | | |
| | | |
| | | |
| | | |
| | | |
| | | |
| | | |
| | | |
| | | |
| |
| Premises and equipment | | | | | | | | | | | | | | | | | | | | | | | | | | | | | | | | | | | | | | | | |
| | Rental of real estate | | | 174 | | | | 179 | | | | 134 | | | | 130 | | | | 145 | | | | 147 | | | | 149 | | | | 139 | | | | 136 | | | | 125 | |
| | Premises, furniture and fixtures | | | 271 | | | | 286 | | | | 289 | | | | 272 | | | | 275 | | | | 256 | | | | 234 | | | | 215 | | | | 206 | | | | 188 | |
| | Property taxes | | | 52 | | | | 52 | | | | 52 | | | | 47 | | | | 52 | | | | 51 | | | | 40 | | | | 40 | | | | 41 | | | | 39 | |
| | Computers and equipment | | | 767 | | | | 763 | | | | 678 | | | | 622 | | | | 651 | | | | 518 | | | | 493 | | | | 333 | | | | 296 | | | | 248 | |
| | | | |
| | | |
| | | |
| | | |
| | | |
| | | |
| | | |
| | | |
| | | |
| | | |
| |
| | Total premises and equipment | | | 1,264 | | | | 1,280 | | | | 1,153 | | | | 1,071 | | | | 1,123 | | | | 972 | | | | 916 | | | | 727 | | | | 679 | | | | 600 | |
| | | | |
| | | |
| | | |
| | | |
| | | |
| | | |
| | | |
| | | |
| | | |
| | | |
| |
| Other expenses | | | | | | | | | | | | | | | | | | | | | | | | | | | | | | | | | | | | | | | | |
| | Communications | | | 162 | | | | 173 | | | | 194 | | | | 259 | | | | 268 | | | | 266 | | | | 246 | | | | 219 | | | | 208 | | | | 180 | |
| | Business and capital taxes | | | 106 | | | | 77 | | | | 103 | | | | 110 | | | | 129 | | | | 134 | | | | 128 | | | | 116 | | | | 110 | | | | 95 | |
| | Professional fees | | | 255 | | | | 291 | | | | 288 | | | | 335 | | | | 343 | | | | 320 | | | | 250 | | | | 173 | | | | 141 | | | | 112 | |
| | Travel and business development | | | 225 | | | | 261 | | | | 248 | | | | 236 | | | | 227 | | | | 234 | | | | 238 | | | | 199 | | | | 161 | | | | 144 | |
| | Other (a) | | | 392 | | | | 458 | | | | 430 | | | | 202 | | | | 216 | | | | 261 | | | | 226 | | | | 251 | | | | 239 | | | | 195 | |
| | | | |
| | | |
| | | |
| | | |
| | | |
| | | |
| | | |
| | | |
| | | |
| | | |
| |
| | Total other expenses | | | 1,140 | | | | 1,260 | | | | 1,263 | | | | 1,142 | | | | 1,183 | | | | 1,215 | | | | 1,088 | | | | 958 | | | | 859 | | | | 726 | |
| | | | |
| | | |
| | | |
| | | |
| | | |
| | | |
| | | |
| | | |
| | | |
| | | |
| |
| Amortization of intangible assets | | | 105 | | | | 87 | | | | 43 | | | | 23 | | | | 21 | | | | 24 | | | | 28 | | | | 18 | | | | 15 | | | | 16 | |
| Special charge | | | — | | | | — | | | | — | | | | — | | | | — | | | | — | | | | — | | | | — | | | | — | | | | 71 | |
| Business process improvement initiative charge | | | — | | | | — | | | | — | | | | — | | | | — | | | | — | | | | — | | | | — | | | | 60 | | | | — | |
| Restructuring charge | | | — | | | | — | | | | — | | | | (43 | ) | | | 141 | | | | — | | | | — | | | | — | | | | — | | | | — | |
| | | | |
| | | |
| | | |
| | | |
| | | |
| | | |
| | | |
| | | |
| | | |
| | | |
| |
Total Non-Interest Expense | | | 6,087 | | | | 6,030 | | | | 5,671 | | | | 5,258 | | | | 5,288 | | | | 4,785 | | | | 4,567 | | | | 3,913 | | | | 3,612 | | | | 3,208 | |
| | | | |
| | | |
| | | |
| | | |
| | | |
| | | |
| | | |
| | | |
| | | |
| | | |
| |
| | Year-over-year growth (%) | | | 0.9 | | | | 6.3 | | | | 7.8 | | | | (0.6 | ) | | | 10.5 | | | | 4.8 | | | | 16.7 | | | | 8.4 | | | | 12.6 | | | | 10.7 | |
| Non-interest expense-to-revenue ratio (%) | | | 65.7 | | | | 68.1 | | | | 64.0 | | | | 60.7 | | | | 66.7 | | | | 65.8 | | | | 63.7 | | | | 62.8 | | | | 63.7 | | | | 61.7 | |
| | | | | | | | | | | | | | | | | | | | | | | | | | | | | | | | | | | | | | | | | | | |
Government Levies and Taxes(b) | | | | | | | | | | | | | | | | | | | | | | | | | | | | | | | | | | | | | | | | |
| Government levies other than income taxes | | | | | | | | | | | | | | | | | | | | | | | | | | | | | | | | | | | | | | | | |
| | Payroll levies | | | 156 | | | | 150 | | | | 148 | | | | 133 | | | | 127 | | | | 128 | | | | 123 | | | | 109 | | | | 106 | | | | 95 | |
| | Property taxes | | | 52 | | | | 52 | | | | 52 | | | | 47 | | | | 52 | | | | 51 | | | | 40 | | | | 40 | | | | 41 | | | | 39 | |
| | Provincial capital taxes | | | 100 | | | | 69 | | | | 93 | | | | 100 | | | | 121 | | | | 120 | | | | 104 | | | | 89 | | | | 84 | | | | 71 | |
| | Business taxes | | | 6 | | | | 8 | | | | 10 | | | | 10 | | | | 8 | | | | 14 | | | | 24 | | | | 27 | | | | 26 | | | | 24 | |
| | Goods and services tax and sales tax | | | 158 | | | | 142 | | | | 126 | | | | 125 | | | | 118 | | | | 125 | | | | 114 | | | | 101 | | | | 88 | | | | 70 | |
| | | | |
| | | |
| | | |
| | | |
| | | |
| | | |
| | | |
| | | |
| | | |
| | | |
| |
| | Total government levies other than income taxes | | | 472 | | | | 421 | | | | 429 | | | | 415 | | | | 426 | | | | 438 | | | | 405 | | | | 366 | | | | 345 | | | | 299 | |
| | | | |
| | | |
| | | |
| | | |
| | | |
| | | |
| | | |
| | | |
| | | |
| | | |
| |
| Provision for (recovery of) income taxes reported in: | | | | | | | | | | | | | | | | | | | | | | | | | | | | | | | | | | | | | | | | |
| | Statement of income | | | | | | | | | | | | | | | | | | | | | | | | | | | | | | | | | | | | | | | | |
| | | Provision | | | 688 | | | | 424 | | | | 501 | | | | 989 | | | | 736 | | | | 810 | | | | 845 | | | | 758 | | | | 662 | | | | 560 | |
| | | Amortization of goodwill | | | — | | | | — | | | | (6 | ) | | | (5 | ) | | | (6 | ) | | | (6 | ) | | | (5 | ) | | | (1 | ) | | | — | | | | — | |
| | Statement of retained earnings | | | 601 | | | | 77 | | | | (350 | ) | | | (153 | ) | | | 158 | | | | (237 | ) | | | (92 | ) | | | 10 | | | | 9 | | | | (23 | ) |
| | | | |
| | | |
| | | |
| | | |
| | | |
| | | |
| | | |
| | | |
| | | |
| | | |
| |
| | Total income taxes | | | 1,289 | | | | 501 | | | | 145 | | | | 831 | | | | 888 | | | | 567 | | | | 748 | | | | 767 | | | | 671 | | | | 537 | |
| | | | |
| | | |
| | | |
| | | |
| | | |
| | | |
| | | |
| | | |
| | | |
| | | |
| |
Total Government Levies and Taxes | | | 1,761 | | | | 922 | | | | 574 | | | | 1,246 | | | | 1,314 | | | | 1,005 | | | | 1,153 | | | | 1,133 | | | | 1,016 | | | | 836 | |
| | | | |
| | | |
| | | |
| | | |
| | | |
| | | |
| | | |
| | | |
| | | |
| | | |
| |
| Total government levies and taxes as a % of net income before taxes and government levies | | | 59.0 | | | | 40.8 | | | | 24.0 | | | | 38.3 | | | | 51.8 | | | | 38.8 | | | | 45.2 | | | | 49.4 | | | | 51.0 | | | | 49.6 | |
| Effective tax rate (teb) | | | 30.8 | | | | 26.4 | | | | 29.1 | | | | 36.9 | | | | 37.6 | | | | 39.8 | | | | 41.0 | | | | 41.5 | | | | 41.9 | | | | 42.4 | |
| | | | |
| | | |
| | | |
| | | |
| | | |
| | | |
| | | |
| | | |
| | | |
| | | |
| |
| (a) | | Effective 2001, processing fees paid to Symcor are included in other expenses. |
| (b) | | Government levies are included in various non-interest expense categories. |
BMO FINANCIAL GROUP 186TH ANNUAL REPORT 2003 57
SUPPLEMENTAL INFORMATION
TABLE 8 Average Assets, Liabilities and Interest Rates (teb)($ millions, except as noted)
| | | | | | | | | | | | | | | | | | | | | | | | | | | | | | | | | | | | | | |
| | | | 2003 | | 2002 | | 2001 |
| | | |
| |
| |
|
| | | | | | | | Average | | Interest | | | | | | Average | | Interest | | | | | | Average | | Interest |
| | | | Average | | interest | | income/ | | Average | | interest | | income/ | | Average | | interest | | income/ |
| For the year ended October 31 | | balances | | rate (%) | | expense | | balances | | rate (%) | | expense | | balances | | rate (%) | | expense |
| |
| |
| |
| |
| |
| |
| |
| |
| |
|
Assets | | | | | | | | | | | | | | | | | | | | | | | | | | | | | | | | | | | | |
Canadian Dollar | | | | | | | | | | | | | | | | | | | | | | | | | | | | | | | | | | | | |
| Deposits with other banks | | | 1,679 | | | | 3.07 | | | | 52 | | | | 2,377 | | | | 2.81 | | | | 68 | | | | 2,165 | | | | 4.74 | | | | 104 | |
| Securities | | | 27,041 | | | | 3.45 | | | | 933 | | | | 23,441 | | | | 3.49 | | | | 817 | | | | 20,308 | | | | 5.41 | | | | 1,098 | |
| Loans | | | | | | | | | | | | | | | | | | | | | | | | | | | | | | | | | | | | |
| | Residential mortgages | | | 43,804 | | | | 5.31 | | | | 2,324 | | | | 39,710 | | | | 5.60 | | | | 2,222 | | | | 35,512 | | | | 6.50 | | | | 2,307 | |
| | Non-residential mortgages | | | 2,352 | | | | 6.40 | | | | 151 | | | | 2,272 | | | | 6.69 | | | | 151 | | | | 2,167 | | | | 7.18 | | | | 155 | |
| | Consumer instalment and other personal | | | 14,964 | | | | 6.12 | | | | 916 | | | | 14,582 | | | | 5.91 | | | | 861 | | | | 14,159 | | | | 8.01 | | | | 1,134 | |
| | Credit cards | | | 2,570 | | | | 10.78 | | | | 277 | | | | 1,635 | | | | 10.42 | | | | 170 | | | | 1,443 | | | | 10.03 | | | | 145 | |
| | Businesses and governments (a) | | | 29,158 | | | | 4.87 | | | | 1,419 | | | | 27,509 | | | | 4.52 | | | | 1,244 | | | | 27,908 | | | | 6.58 | | | | 1,836 | |
| | | |
| | | |
| | | |
| | | |
| | | |
| | | |
| | | |
| | | |
| | | |
| |
| | Total loans | | | 92,848 | | | | 5.48 | | | | 5,087 | | | | 85,708 | | | | 5.42 | | | | 4,648 | | | | 81,189 | | | | 6.87 | | | | 5,577 | |
| | | |
| | | |
| | | |
| | | |
| | | |
| | | |
| | | |
| | | |
| | | |
| |
| Other non-interest bearing assets | | | 29,877 | | | | | | | | | | | | 15,789 | | | | | | | | | | | | 9,595 | | | | | | | | | |
| | | |
| | | |
| | | |
| | | |
| | | |
| | | |
| | | |
| | | |
| | | |
| |
| Total Canadian dollar | | | 151,445 | | | | 4.01 | | | | 6,072 | | | | 127,315 | | | | 4.35 | | | | 5,533 | | | | 113,257 | | | | 5.99 | | | | 6,779 | |
| | | |
| | | |
| | | |
| | | |
| | | |
| | | |
| | | |
| | | |
| | | |
| |
U.S. Dollar and Other Currencies | | | | | | | | | | | | | | | | | | | | | | | | | | | | | | | | | | | | |
| Deposits with other banks | | | 13,720 | | | | 2.22 | | | | 304 | | | | 13,244 | | | | 3.29 | | | | 436 | | | | 15,583 | | | | 5.07 | | | | 790 | |
| Securities | | | 24,977 | | | | 3.28 | | | | 819 | | | | 19,902 | | | | 4.54 | | | | 903 | | | | 23,826 | | | | 6.13 | | | | 1,460 | |
| Loans | | | | | | | | | | | | | | | | | | | | | | | | | | | | | | | | | | | | |
| | Residential mortgages | | | 5,646 | | | | 5.03 | | | | 284 | | | | 5,307 | | | | 6.12 | | | | 325 | | | | 4,709 | | | | 6.70 | | | | 316 | |
| | Non-residential mortgages | | | 2,008 | | | | 6.35 | | | | 127 | | | | 1,977 | | | | 6.82 | | | | 135 | | | | 1,675 | | | | 8.00 | | | | 134 | |
| | Consumer instalment and other personal | | | 6,330 | | | | 5.16 | | | | 326 | | | | 5,507 | | | | 6.19 | | | | 341 | | | | 4,231 | | | | 8.13 | | | | 344 | |
| | Credit cards | | | 59 | | | | 2.88 | | | | 2 | | | | 55 | | | | 3.49 | | | | 2 | | | | 35 | | | | 4.75 | | | | 2 | |
| | Businesses and governments (a) | | | 37,424 | | | | 3.06 | | | | 1,145 | | | | 41,153 | | | | 3.81 | | | | 1,565 | | | | 47,093 | | | | 7.04 | | | | 3,317 | |
| | | |
| | | |
| | | |
| | | |
| | | |
| | | |
| | | |
| | | |
| | | |
| |
| | Total loans | | | 51,467 | | | | 3.66 | | | | 1,884 | | | | 53,999 | | | | 4.39 | | | | 2,368 | | | | 57,743 | | | | 7.12 | | | | 4,113 | |
| | | |
| | | |
| | | |
| | | |
| | | |
| | | |
| | | |
| | | |
| | | |
| |
| Other non-interest bearing assets | | | 22,357 | | | | | | | | | | | | 33,530 | | | | | | | | | | | | 32,839 | | | | | | | | | |
| | | |
| | | |
| | | |
| | | |
| | | |
| | | |
| | | |
| | | |
| | | |
| |
| Total U.S. dollar and other currencies | | | 112,521 | | | | 2.67 | | | | 3,007 | | | | 120,675 | | | | 3.07 | | | | 3,707 | | | | 129,991 | | | | 4.89 | | | | 6,363 | |
| | | |
| | | |
| | | |
| | | |
| | | |
| | | |
| | | |
| | | |
| | | |
| |
Total All Currencies | | | | | | | | | | | | | | | | | | | | | | | | | | | | | | | | | | | | |
| Total assets and interest income | | | 263,966 | | | | 3.44 | | | | 9,079 | | | | 247,990 | | | | 3.73 | | | | 9,240 | | | | 243,248 | | | | 5.40 | | | | 13,142 | |
| | | |
| | | |
| | | |
| | | |
| | | |
| | | |
| | | |
| | | |
| | | |
| |
Liabilities | | | | | | | | | | | | | | | | | | | | | | | | | | | | | | | | | | | | |
Canadian Dollar | | | | | | | | | | | | | | | | | | | | | | | | | | | | | | | | | | | | |
| Deposits | | | | | | | | | | | | | | | | | | | | | | | | | | | | | | | | | | | | |
| | Banks | | | 1,609 | | | | 2.29 | | | | 37 | | | | 1,455 | | | | 1.18 | | | | 17 | | | | 1,809 | | | | 3.88 | | | | 72 | |
| | Businesses and governments | | | 37,403 | | | | 1.10 | | | | 411 | | | | 34,955 | | | | 0.77 | | | | 268 | | | | 31,483 | | | | 3.84 | | | | 1,210 | |
| | Individuals | | | 55,037 | | | | 2.48 | | | | 1,366 | | | | 50,180 | | | | 2.62 | | | | 1,317 | | | | 46,439 | | | | 3.49 | | | | 1,620 | |
| | | |
| | | |
| | | |
| | | |
| | | |
| | | |
| | | |
| | | |
| | | |
| |
| | Total deposits | | | 94,049 | | | | 1.93 | | | | 1,814 | | | | 86,590 | | | | 1.85 | | | | 1,602 | | | | 79,731 | | | | 3.64 | | | | 2,902 | |
| Subordinated debt and other interest bearing liabilities | | | 17,350 | | | | 3.96 | | | | 687 | | | | 15,665 | | | | 4.10 | | | | 643 | | | | 14,242 | | | | 5.14 | | | | 733 | |
| Other non-interest bearing liabilities | | | 28,274 | | | | | | | | | | | | 14,038 | | | | | | | | | | | | 8,050 | | | | | | | | | |
| | | |
| | | |
| | | |
| | | |
| | | |
| | | |
| | | |
| | | |
| | | |
| |
| Total Canadian dollar | | | 139,673 | | | | 1.79 | | | | 2,501 | | | | 116,293 | | | | 1.93 | | | | 2,245 | | | | 102,023 | | | | 3.56 | | | | 3,635 | |
| | | |
| | | |
| | | |
| | | |
| | | |
| | | |
| | | |
| | | |
| | | |
| |
U.S. Dollar and Other Currencies | | | | | | | | | | | | | | | | | | | | | | | | | | | | | | | | | | | | |
| Deposits | | | | | | | | | | | | | | | | | | | | | | | | | | | | | | | | | | | | |
| | Banks | | | 20,428 | | | | 1.49 | | | | 304 | | | | 15,583 | | | | 2.17 | | | | 338 | | | | 21,448 | | | | 4.90 | | | | 1,051 | |
| | Businesses and governments | | | 31,396 | | | | 1.74 | | | | 546 | | | | 33,752 | | | | 2.20 | | | | 742 | | | | 35,663 | | | | 4.27 | | | | 1,522 | |
| | Individuals | | �� | 19,745 | | | | 1.49 | | | | 293 | | | | 20,464 | | | | 2.20 | | | | 451 | | | | 18,442 | | | | 3.84 | | | | 708 | |
| | | |
| | | |
| | | |
| | | |
| | | |
| | | |
| | | |
| | | |
| | | |
| |
| | Total deposits | | | 71,569 | | | | 1.60 | | | | 1,143 | | | | 69,799 | | | | 2.19 | | | | 1,531 | | | | 75,553 | | | | 4.34 | | | | 3,281 | |
| Subordinated debt and other interest bearing liabilities | | | 23,506 | | | | 1.63 | | | | 384 | | | | 21,782 | | | | 2.43 | | | | 529 | | | | 25,843 | | | | 6.13 | | | | 1,585 | |
| Other non-interest bearing liabilities | | | 17,092 | | | | | | | | | | | | 28,686 | | | | | | | | | | | | 28,285 | | | | | | | | | |
| | | |
| | | |
| | | |
| | | |
| | | |
| | | |
| | | |
| | | |
| | | |
| |
| Total U.S. dollar and other currencies | | | 112,167 | | | | 1.36 | | | | 1,527 | | | | 120,267 | | | | 1.71 | | | | 2,060 | | | | 129,681 | | | | 3.75 | | | | 4,866 | |
| | | |
| | | |
| | | |
| | | |
| | | |
| | | |
| | | |
| | | |
| | | |
| |
Total All Currencies | | | | | | | | | | | | | | | | | | | | | | | | | | | | | | | | | | | | |
| Total liabilities and interest expense | | | 251,840 | | | | 1.60 | | | | 4,028 | | | | 236,560 | | | | 1.82 | | | | 4,305 | | | | 231,704 | | | | 3.67 | | | | 8,501 | |
| Shareholders’ equity | | | 12,126 | | | | | | | | | | | | 11,430 | | | | | | | | | | | | 11,544 | | | | | | | | | |
| | | |
| | | |
| | | |
| | | |
| | | |
| | | |
| | | |
| | | |
| | | |
| |
Total Liabilities, Interest Expense and Shareholders’ Equity | | | 263,966 | | | | 1.53 | | | | 4,028 | | | | 247,990 | | | | 1.74 | | | | 4,305 | | | | 243,248 | | | | 3.49 | | | | 8,501 | |
| | | |
| | | |
| | | |
| | | |
| | | |
| | | |
| | | |
| | | |
| | | |
| |
| Net interest margin and net interest income | | | | | | | 1.91 | | | | 5,051 | | | | | | | | 1.99 | | | | 4,935 | | | | | | | | 1.91 | | | | 4,641 | |
| | | |
| | | |
| | | |
| | | |
| | | |
| | | |
| | | |
| | | |
| | | |
| |
| (a) | | Includes securities purchased under resale agreements. |
58 BMO FINANCIAL GROUP 186TH ANNUAL REPORT 2003
SUPPLEMENTAL INFORMATION
TABLE 9 Volume/Rate Analysis of Changes in Net Interest Income (teb)($ millions)
| | | | | | | | | | | | | | | | | | | | | | | | | | |
| | | | 2003/2002 | | 2002/2001 |
| | | | Increase (decrease) due to change in: | | Increase (decrease) due to change in: |
| | | |
| |
|
| | | | Average | | Average | | | | | | Average | | Average | | |
| For the year ended October 31 | | balance | | rate | | Total | | balance | | rate | | Total |
| |
| |
| |
| |
| |
| |
|
Assets | | | | | | | | | | | | | | | | | | | | | | | | |
Canadian Dollar | | | | | | | | | | | | | | | | | | | | | | | | |
| Deposits with other banks | | | (20 | ) | | | 4 | | | | (16 | ) | | | 11 | | | | (47 | ) | | | (36 | ) |
| Securities | | | 126 | | | | (10 | ) | | | 116 | | | | 169 | | | | (450 | ) | | | (281 | ) |
| Loans | | | | | | | | | | | | | | | | | | | | | | | | |
| | Residential mortgages | | | 229 | | | | (127 | ) | | | 102 | | | | 273 | | | | (358 | ) | | | (85 | ) |
| | Non-residential mortgages | | | 7 | | | | (7 | ) | | | — | | | | 7 | | | | (11 | ) | | | (4 | ) |
| | Consumer instalment and other personal | | | 23 | | | | 32 | | | | 55 | | | | 34 | | | | (307 | ) | | | (273 | ) |
| | Credit cards | | | 98 | | | | 9 | | | | 107 | | | | 19 | | | | 6 | | | | 25 | |
| | Businesses and governments | | | 75 | | | | 100 | | | | 175 | | | | (27 | ) | | | (565 | ) | | | (592 | ) |
| | | |
| | | |
| | | |
| | | |
| | | |
| | | |
| |
| | Total loans | | | 432 | | | | 7 | | | | 439 | | | | 306 | | | | (1,235 | ) | | | (929 | ) |
| | | |
| | | |
| | | |
| | | |
| | | |
| | | |
| |
| Other non-interest bearing assets | | | — | | | | | | | | | | | | — | | | | | | | | | |
| | | |
| | | |
| | | |
| | | |
| | | |
| | | |
| |
| Change in Canadian dollar interest income | | | 538 | | | | 1 | | | | 539 | | | | 486 | | | | (1,732 | ) | | | (1,246 | ) |
| | | |
| | | |
| | | |
| | | |
| | | |
| | | |
| |
U.S. Dollar and Other Currencies | | | | | | | | | | | | | | | | | | | | | | | | |
| Deposits with other banks | | | 15 | | | | (147 | ) | | | (132 | ) | | | (118 | ) | | | (236 | ) | | | (354 | ) |
| Securities | | | 231 | | | | (315 | ) | | | (84 | ) | | | (241 | ) | | | (316 | ) | | | (557 | ) |
| Loans | | | | | | | | | | | | | | | | | | | | | | | | |
| | Residential mortgages | | | 21 | | | | (62 | ) | | | (41 | ) | | | 40 | | | | (31 | ) | | | 9 | |
| | Non-residential mortgages | | | 1 | | | | (9 | ) | | | (8 | ) | | | 24 | | | | (23 | ) | | | 1 | |
| | Consumer instalment and other personal | | | 50 | | | | (65 | ) | | | (15 | ) | | | 104 | | | | (107 | ) | | | (3 | ) |
| | Credit cards | | | — | | | | — | | | | — | | | | 1 | | | | (1 | ) | | | — | |
| | Businesses and governments | | | (140 | ) | | | (280 | ) | | | (420 | ) | | | (419 | ) | | | (1,333 | ) | | | (1,752 | ) |
| | | |
| | | |
| | | |
| | | |
| | | |
| | | |
| |
| | Total loans | | | (68 | ) | | | (416 | ) | | | (484 | ) | | | (250 | ) | | | (1,495 | ) | | | (1,745 | ) |
| | | |
| | | |
| | | |
| | | |
| | | |
| | | |
| |
| Other non-interest bearing assets | | | — | | | | | | | | | | | | — | | | | | | | | | |
| | | |
| | | |
| | | |
| | | |
| | | |
| | | |
| |
| Change in U.S. dollar and other currencies interest income | | | 178 | | | | (878 | ) | | | (700 | ) | | | (609 | ) | | | (2,047 | ) | | | (2,656 | ) |
| | | |
| | | |
| | | |
| | | |
| | | |
| | | |
| |
Total All Currencies | | | | | | | | | | | | | | | | | | | | | | | | |
| Change in total interest income | | | 716 | | | | (877 | ) | | | (161 | ) | | | (123 | ) | | | (3,779 | ) | | | (3,902 | ) |
| | | |
| | | |
| | | |
| | | |
| | | |
| | | |
| |
Liabilities | | | | | | | | | | | | | | | | | | | | | | | | |
Canadian Dollar | | | | | | | | | | | | | | | | | | | | | | | | |
| Deposits | | | | | | | | | | | | | | | | | | | | | | | | |
| | Banks | | | 2 | | | | 18 | | | | 20 | | | | (16 | ) | | | (39 | ) | | | (55 | ) |
| | Businesses and governments | | | 19 | | | | 124 | | | | 143 | | | | 133 | | | | (1,075 | ) | | | (942 | ) |
| | Individuals | | | 128 | | | | (79 | ) | | | 49 | | | | 130 | | | | (433 | ) | | | (303 | ) |
| | | |
| | | |
| | | |
| | | |
| | | |
| | | |
| |
| | Total deposits | | | 149 | | | | 63 | | | | 212 | | | | 247 | | | | (1,547 | ) | | | (1,300 | ) |
| Subordinated debt and other interest bearing liabilities | | | 69 | | | | (25 | ) | | | 44 | | | | 73 | | | | (163 | ) | | | (90 | ) |
| Other non-interest bearing liabilities | | | — | | | | | | | | | | | | — | | | | | | | | | |
| | | |
| | | |
| | | |
| | | |
| | | |
| | | |
| |
| Change in Canadian dollar interest expense | | | 218 | | | | 38 | | | | 256 | | | | 320 | | | | (1,710 | ) | | | (1,390 | ) |
| | | |
| | | |
| | | |
| | | |
| | | |
| | | |
| |
U.S. Dollar and Other Currencies | | | | | | | | | | | | | | | | | | | | | | | | |
| Deposits | | | | | | | | | | | | | | | | | | | | | | | | |
| | Banks | | | 105 | | | | (139 | ) | | | (34 | ) | | | (287 | ) | | | (426 | ) | | | (713 | ) |
| | Businesses and governments | | | (51 | ) | | | (145 | ) | | | (196 | ) | | | (82 | ) | | | (698 | ) | | | (780 | ) |
| | Individuals | | | (16 | ) | | | (142 | ) | | | (158 | ) | | | 77 | | | | (334 | ) | | | (257 | ) |
| | | |
| | | |
| | | |
| | | |
| | | |
| | | |
| |
| | Total deposits | | | 38 | | | | (426 | ) | | | (388 | ) | | | (292 | ) | | | (1,458 | ) | | | (1,750 | ) |
| Subordinated debt and other interest bearing liabilities | | | 42 | | | | (187 | ) | | | (145 | ) | | | (249 | ) | | | (807 | ) | | | (1,056 | ) |
| Other non-interest bearing liabilities | | | — | | | | | | | | | | | | — | | | | | | | | | |
| | | |
| | | |
| | | |
| | | |
| | | |
| | | |
| |
| Change in U.S. dollar and other currencies interest expense | | | 80 | | | | (613 | ) | | | (533 | ) | | | (541 | ) | | | (2,265 | ) | | | (2,806 | ) |
| | | |
| | | |
| | | |
| | | |
| | | |
| | | |
| |
Total All Currencies | | | | | | | | | | | | | | | | | | | | | | | | |
| Change in total interest expense | | | 298 | | | | (575 | ) | | | (277 | ) | | | (221 | ) | | | (3,975 | ) | | | (4,196 | ) |
| | | |
| | | |
| | | |
| | | |
| | | |
| | | |
| |
| Change in total net interest income | | | 418 | | | | (302 | ) | | | 116 | | | | 98 | | | | 196 | | | | 294 | |
| | | |
| | | |
| | | |
| | | |
| | | |
| | | |
| |
BMO FINANCIAL GROUP 186TH ANNUAL REPORT 2003 59
Supplemental Information
Table 10 Net Loans and Acceptances — Segmented Information($ millions)
| | | | | | | | | | | | | | | | | | | | | | | | | | | | | | | | | | | | | | | | | | |
| | | | Canada (c) | | United States (c) |
| | | |
| |
|
| As at October 31 | | 2003 | | | 2002 | | | 2001 | | | 2000 | | | 1999 | | | 2003 | | | 2002 | | | 2001 | | | 2000 | | | 1999 | |
| |
| |
| |
| |
| |
| |
| |
| |
| |
| |
|
| Consumer | | | | | | | | | | | | | | | | | | | | | | | | | | | | | | | | | | | | | | | | |
| | Residential mortgages (a) | | | 43,533 | | | | 38,865 | | | | 33,741 | | | | 32,342 | | | | 31,858 | | | | 5,307 | | | | 5,469 | | | | 5,000 | | | | 4,211 | | | | 3,512 | |
| | Cards | | | 2,963 | | | | 2,275 | | | | 1,521 | | | | 1,382 | | | | 1,144 | | | | 4 | | | | 5 | | | | 6 | | | | 25 | | | | 16 | |
| | Consumer instalment and other personal loans | | | 15,589 | | | | 14,950 | | | | 14,258 | | | | 14,395 | | | | 13,900 | | | | 6,512 | | | | 6,214 | | | | 4,841 | | | | 3,638 | | | | 3,004 | |
| | | | |
| | | |
| | | |
| | | |
| | | |
| | | |
| | | |
| | | |
| | | |
| | | |
| |
| | Total consumer | | | 62,085 | | | | 56,090 | | | | 49,520 | | | | 48,119 | | | | 46,902 | | | | 11,823 | | | | 11,688 | | | | 9,847 | | | | 7,874 | | | | 6,532 | |
| | | | |
| | | |
| | | |
| | | |
| | | |
| | | |
| | | |
| | | |
| | | |
| | | |
| |
| Commercial and corporate | | | | | | | | | | | | | | | | | | | | | | | | | | | | | | | | | | | | | | | | |
| | Commercial and corporate, excluding securities purchased under resale agreements (b) | | | 33,844 | | | | 34,012 | | | | 35,847 | | | | 35,886 | | | | 25,083 | | | | 24,441 | | | | 30,287 | | | | 33,881 | | | | 31,818 | | | | 38,507 | |
| | Securities purchased under resale agreements | | | 6,288 | | | | 8,491 | | | | 8,397 | | | | 6,693 | | | | 8,523 | | | | 6,988 | | | | 7,173 | | | | 6,557 | | | | 9,615 | | | | 11,202 | |
| | | | |
| | | |
| | | |
| | | |
| | | |
| | | |
| | | |
| | | |
| | | |
| | | |
| |
| | Total commercial and corporate | | | 40,132 | | | | 42,503 | | | | 44,244 | | | | 42,579 | | | | 33,606 | | | | 31,429 | | | | 37,460 | | | | 40,438 | | | | 41,433 | | | | 49,709 | |
| | | | |
| | | |
| | | |
| | | |
| | | |
| | | |
| | | |
| | | |
| | | |
| | | |
| |
| Lesser-developed countries (LDCs) (b) | | | — | | | | — | | | | — | | | | — | | | | — | | | | — | | | | — | | | | — | | | | — | | | | — | |
| | | | |
| | | |
| | | |
| | | |
| | | |
| | | |
| | | |
| | | |
| | | |
| | | |
| |
| Total loans and acceptances, net of specific allowances | | | 102,217 | | | | 98,593 | | | | 93,764 | | | | 90,698 | | | | 80,508 | | | | 43,252 | | | | 49,148 | | | | 50,285 | | | | 49,307 | | | | 56,241 | |
| General allowance | | | (800 | ) | | | (800 | ) | | | (855 | ) | | | (930 | ) | | | (820 | ) | | | (380 | ) | | | (380 | ) | | | (325 | ) | | | (150 | ) | | | (150 | ) |
| | | | |
| | | |
| | | |
| | | |
| | | |
| | | |
| | | |
| | | |
| | | |
| | | |
| |
| Total net loans and acceptances | | | 101,417 | | | | 97,793 | | | | 92,909 | | | | 89,768 | | | | 79,688 | | | | 42,872 | | | | 48,768 | | | | 49,960 | | | | 49,157 | | | | 56,091 | |
| | | | |
| | | |
| | | |
| | | |
| | | |
| | | |
| | | |
| | | |
| | | |
| | | |
| |
[Additional columns below]
[Continued from above table, first column(s) repeated]
| | | | | | | | | | | | | | | | | | | | | | | | | | | | | | | | | | | | | | | | | | |
| | | | Other countries (c) | | Total |
| | | |
| |
|
| As at October 31 | | 2003 | | | 2002 | | | 2001 | | | 2000 | | | 1999 | | | 2003 | | | 2002 | | | 2001 | | | 2000 | | | 1999 | |
| |
| |
| |
| |
| |
| |
| |
| |
| |
| |
|
| Consumer | | | | | | | | | | | | | | | | | | | | | | | | | | | | | | | | | | | | | | | | |
| | Residential mortgages (a) | | | — | | | | — | | | | — | | | | — | | | | — | | | | 48,840 | | | | 44,334 | | | | 38,741 | | | | 36,553 | | | | 35,370 | |
| | Cards | | | — | | | | — | | | | — | | | | — | | | | — | | | | 2,967 | | | | 2,280 | | | | 1,527 | | | | 1,407 | | | | 1,160 | |
| | Consumer instalment and other personal loans | | | — | | | | — | | | | — | | | | — | | | | — | | | | 22,101 | | | | 21,164 | | | | 19,099 | | | | 18,033 | | | | 16,904 | |
| | | | |
| | | |
| | | |
| | | |
| | | |
| | | |
| | | |
| | | |
| | | |
| | | |
| |
| | Total consumer | | | — | | | | — | | | | — | | | | — | | | | — | | | | 73,908 | | | | 67,778 | | | | 59,367 | | | | 55,993 | | | | 53,434 | |
| | | | |
| | | |
| | | |
| | | |
| | | |
| | | |
| | | |
| | | |
| | | |
| | | |
| |
| Commercial and corporate | | | | | | | | | | | | | | | | | | | | | | | | | | | | | | | | | | | | | | | | |
| | Commercial and corporate, excluding securities purchased under resale agreements (b) | | | 1,867 | | | | 3,035 | | | | 1,896 | | | | 3,300 | | | | 3,434 | | | | 60,152 | | | | 67,334 | | | | 71,624 | | | | 71,004 | | | | 67,024 | |
| | Securities purchased under resale agreements | | | — | | | | — | | | | — | | | | — | | | | 5,365 | | | | 13,276 | | | | 15,664 | | | | 14,954 | | | | 16,308 | | | | 25,090 | |
| | | | |
| | | |
| | | |
| | | |
| | | |
| | | |
| | | |
| | | |
| | | |
| | | |
| |
| | Total commercial and corporate | | | 1,867 | | | | 3,035 | | | | 1,896 | | | | 3,300 | | | | 8,799 | | | | 73,428 | | | | 82,998 | | | | 86,578 | | | | 87,312 | | | | 92,114 | |
| | | | |
| | | |
| | | |
| | | |
| | | |
| | | |
| | | |
| | | |
| | | |
| | | |
| |
| Lesser-developed countries (LDCs) (b) | | | — | | | | — | | | | — | | | | 222 | | | | 205 | | | | — | | | | — | | | | — | | | | 222 | | | | 205 | |
| | | | |
| | | |
| | | |
| | | |
| | | |
| | | |
| | | |
| | | |
| | | |
| | | |
| |
| Total loans and acceptances, net of specific allowances | | | 1,867 | | | | 3,035 | | | | 1,896 | | | | 3,522 | | | | 9,004 | | | | 147,336 | | | | 150,776 | | | | 145,945 | | | | 143,527 | | | | 145,753 | |
| General allowance | | | — | | | | — | | | | — | | | | — | | | | — | | | | (1,180 | ) | | | (1,180 | ) | | | (1,180 | ) | | | (1,080 | ) | | | (970 | ) |
| | | | |
| | | |
| | | |
| | | |
| | | |
| | | |
| | | |
| | | |
| | | |
| | | |
| |
| Total net loans and acceptances | | | 1,867 | | | | 3,035 | | | | 1,896 | | | | 3,522 | | | | 9,004 | | | | 146,156 | | | | 149,596 | | | | 144,765 | | | | 142,447 | | | | 144,783 | |
| | | | |
| | | |
| | | |
| | | |
| | | |
| | | |
| | | |
| | | |
| | | |
| | | |
| |
Table 11 Net Impaired Loans and Acceptances — Segmented Information($ millions, except as noted)
| | | | | | | | | | | | | | | | | | | | | | | | | | | | | | | | | | | | | | | | | | |
| | | | Canada (c) | | United States (c) |
| | | |
| |
|
| As at October 31 | | 2003 | | | 2002 | | | 2001 | | | 2000 | | | 1999 | | | 2003 | | | 2002 | | | 2001 | | | 2000 | | | 1999 | |
| |
| |
| |
| |
| |
| |
| |
| |
| |
| |
|
| Consumer | | | | | | | | | | | | | | | | | | | | | | | | | | | | | | | | | | | | | | | | |
| | Residential mortgages | | | 137 | | | | 119 | | | | 126 | | | | 138 | | | | 129 | | | | — | | | | — | | | | — | | | | — | | | | — | |
| | Consumer instalment and other personal loans | | | 39 | | | | 39 | | | | 54 | | | | 48 | | | | 48 | | | | 5 | | | | 10 | | | | 2 | | | | — | | | | — | |
| | | | |
| | | |
| | | |
| | | |
| | | |
| | | |
| | | |
| | | |
| | | |
| | | |
| |
| | Total consumer | | | 176 | | | | 158 | | | | 180 | | | | 186 | | | | 177 | | | | 5 | | | | 10 | | | | 2 | | | | — | | | | — | |
| Commercial and corporate (b)(d) | | | 219 | | | | 378 | | | | 354 | | | | 335 | | | | 344 | | | | 766 | | | | 872 | | | | 692 | | | | 432 | | | | 135 | |
| | | | |
| | | |
| | | |
| | | |
| | | |
| | | |
| | | |
| | | |
| | | |
| | | |
| |
| Total impaired loans and acceptances, net of specific allowances for credit losses | | | 395 | | | | 536 | | | | 534 | | | | 521 | | | | 521 | | | | 771 | | | | 882 | | | | 694 | | | | 432 | | | | 135 | |
| General allowance | | | (800 | ) | | | (800 | ) | | | (855 | ) | | | (930 | ) | | | (820 | ) | | | (380 | ) | | | (380 | ) | | | (325 | ) | | | (150 | ) | | | (150 | ) |
| | | | |
| | | |
| | | |
| | | |
| | | |
| | | |
| | | |
| | | |
| | | |
| | | |
| |
| Total net impaired loans and acceptances (NIL) | | | (405 | ) | | | (264 | ) | | | (321 | ) | | | (409 | ) | | | (299 | ) | | | 391 | | | | 502 | | | | 369 | | | | 282 | | | | (15 | ) |
Condition Ratios | | | | | | | | | | | | | | | | | | | | | | | | | | | | | | | | | | | | | | | | |
| Gross impaired loans and acceptances as a % of equity and allowance for credit losses | | NA | | NA | | NA | | NA | | NA | | NA | | NA | | NA | | NA | | NA |
| NIL as a % of net loans and acceptances (e) | | | (0.40 | ) | | | (0.27 | ) | | | (0.35 | ) | | | (0.46 | ) | | | (0.38 | ) | | | 0.91 | | | | 1.03 | | | | 0.74 | | | | 0.57 | | | | (0.03 | ) |
| NIL as a % of net loans and acceptances (e) | | | | | | | | | | | | | | | | | | | | | | | | | | | | | | | | | | | | | | | | |
| | To consumer | | | 0.28 | | | | 0.28 | | | | 0.36 | | | | 0.39 | | | | 0.38 | | | | 0.04 | | | | 0.09 | | | | 0.02 | | | | — | | | | — | |
| | To commercial and corporate, excluding securities purchased under resale agreements (b) | | | 0.65 | | | | 1.11 | | | | 0.99 | | | | 0.93 | | | | 1.37 | | | | 3.13 | | | | 2.88 | | | | 2.04 | | | | 1.36 | | | | 0.35 | |
| | | | |
| | | |
| | | |
| | | |
| | | |
| | | |
| | | |
| | | |
| | | |
| | | |
| |
[Additional columns below]
[Continued from above table, first column(s) repeated]
| | | | | | | | | | | | | | | | | | | | | | | | | | | | | | | | | | | | | | | | | | |
| | | | Other countries (c) | | Total |
| | | |
| |
|
| As at October 31 | | 2003 | | | 2002 | | | 2001 | | | 2000 | | | 1999 | | | 2003 | | | 2002 | | | 2001 | | | 2000 | | | 1999 | |
| |
| |
| |
| |
| |
| |
| |
| |
| |
| |
|
| Consumer | | | | | | | | | | | | | | | | | | | | | | | | | | | | | | | | | | | | | | | | |
| | Residential mortgages | | | — | | | | — | | | | — | | | | — | | | | — | | | | 137 | | | | 119 | | | | 126 | | | | 138 | | | | 129 | |
| | Consumer instalment and other personal loans | | | — | | | | — | | | | — | | | | — | | | | — | | | | 44 | | | | 49 | | | | 56 | | | | 48 | | | | 48 | |
| | | | |
| | | |
| | | |
| | | |
| | | |
| | | |
| | | |
| | | |
| | | |
| | | |
| |
| | Total consumer | | | — | | | | — | | | | — | | | | — | | | | — | | | | 181 | | | | 168 | | | | 182 | | | | 186 | | | | 177 | |
| Commercial and corporate (b)(d) | | | 147 | | | | 150 | | | | 17 | | | | 31 | | | | 58 | | | | 1,132 | | | | 1,400 | | | | 1,063 | | | | 798 | | | | 537 | |
| | | | |
| | | |
| | | |
| | | |
| | | |
| | | |
| | | |
| | | |
| | | |
| | | |
| |
| Total impaired loans and acceptances, net of specific allowances for credit losses | | | 147 | | | | 150 | | | | 17 | | | | 31 | | | | 58 | | | | 1,313 | | | | 1,568 | | | | 1,245 | | | | 984 | | | | 714 | |
| General allowance | | | — | | | | — | | | | — | | | | — | | | | — | | | | (1,180 | ) | | | (1,180 | ) | | | (1,180 | ) | | | (1,080 | ) | | | (970 | ) |
| | | | |
| | | |
| | | |
| | | |
| | | |
| | | |
| | | |
| | | |
| | | |
| | | |
| |
| Total net impaired loans and acceptances (NIL) | | | 147 | | | | 150 | | | | 17 | | | | 31 | | | | 58 | | | | 133 | | | | 388 | | | | 65 | | | | (96 | ) | | | (256 | ) |
Condition Ratios | | | | | | | | | | | | | | | | | | | | | | | | | | | | | | | | | | | | | | | | |
| Gross impaired loans and acceptances as a % of equity and allowance for credit losses | | NA | | NA | | NA | | NA | | NA | | | 12.15 | | | | 15.16 | | | | 14.17 | | | | 10.51 | | | | 8.53 | |
| NIL as a % of net loans and acceptances (e) | | | 7.87 | | | | 4.94 | | | | 0.90 | | | | 0.88 | | | | 0.64 | | | | 0.09 | | | | 0.26 | | | | 0.05 | | | | (0.07 | ) | | | (0.18 | ) |
| NIL as a % of net loans and acceptances (e) | | | | | | | | | | | | | | | | | | | | | | | | | | | | | | | | | | | | | | | | |
| | To consumer | | | — | | | | — | | | | — | | | | — | | | | — | | | | 0.24 | | | | 0.25 | | | | 0.31 | | | | 0.33 | | | | 0.33 | |
| | To commercial and corporate, excluding securities purchased under resale agreements (b) | | | 7.87 | | | | 4.94 | | | | 0.90 | | | | 0.94 | | | | 1.69 | | | | 1.88 | | | | 2.08 | | | | 1.48 | | | | 1.12 | | | | 0.80 | |
| | | | |
| | | |
| | | |
| | | |
| | | |
| | | |
| | | |
| | | |
| | | |
| | | |
| |
Note: Footnotes refer to pages 60 and 61.
| (a) | | Excludes residential mortgages classified as commercial corporate loans (2003 — $3.3 billion, 2002 — $3.2 billion, 2001 — $3.2 billion, 2000 — $2.9 billion, 1999 — $2.8 billion). |
| (b) | | Separate disclosure of credit exposure related to LDCs has been eliminated and reclassified to its appropriate industry and region. 2001 and 2002 have been reclassified to conform with the current year presentation. There are no net impaired loans and acceptances for LDCs. |
| (c) | | There was a change in the methodology of determining the geographical distribution of credit information in fiscal 2003. For comparative purposes, 2002 credit information has been restated on the same basis. |
| (d) | | There are no impaired securities purchased under resale agreements and no related allowances. |
| (e) | | Aggregate balances are net of specific and general allowances; the consumer, commercial and corporate categories are stated net of specific allowances only. |
| (f) | | Excludes LDC reservations in excess of impaired loans of $79 million in 1999. |
| (g) | | Includes allowances of U.S. subsidiary in excess of impaired loans. |
| (h) | | Loans and acceptances returning to performing status, sales and repayments. |
| (i) | | Write-offs on designated LDCs include losses of $45 million on sales of performing assets that were charged directly against the allowance in 2000. |
| (j) | | Excludes ACL for off-balance sheet exposure of $6 million in 2003, as well as LDC reservation in excess of impaired loans of $79 million in 1999. |
NA — not available
60 BMO FINANCIAL GROUP 186TH ANNUAL REPORT 2003
Supplemental Information
Table 12 Net Loans and Acceptances — Segmented Information($ millions)
| | | | | | | | | | | | | | | | | | | | | |
| As at October 31 | | 2003 | | | 2002 | | | 2001 | | | 2000 | | | 1999 | |
| |
| |
| |
| |
| |
|
Net Loans and Acceptances by Province(c) | | | | | | | | | | | | | | | | | | | | |
| Atlantic provinces | | | 6,097 | | | | 5,767 | | | | 4,644 | | | | 4,460 | | | | 4,137 | |
| Quebec | | | 15,163 | | | | 14,409 | | | | 13,685 | | | | 14,602 | | | | 12,304 | |
| Ontario | | | 51,650 | | | | 51,045 | | | | 49,554 | | | | 43,794 | | | | 37,317 | |
| Prairie provinces | | | 13,678 | | | | 12,772 | | | | 13,365 | | | | 14,722 | | | | 13,941 | |
| British Columbia and territories | | | 15,629 | | | | 14,600 | | | | 12,516 | | | | 13,120 | | | | 12,809 | |
| | | |
| | | |
| | | |
| | | |
| | | |
| |
| Total net loans and acceptances in Canada | | | 102,217 | | | | 98,593 | | | | 93,764 | | | | 90,698 | | | | 80,508 | |
| | | |
| | | |
| | | |
| | | |
| | | |
| |
Net Commercial and Corporate Loans by Industry, excluding Securities Purchased under Resale Agreements(b) | | | | | | | | | | | | | | | | | | | | |
| Commercial mortgages | | | 7,684 | | | | 7,591 | | | | 7,352 | | | | 6,616 | | | | 6,254 | |
| Commercial real estate | | | 3,294 | | | | 3,592 | | | | 3,816 | | | | 3,100 | | | | 3,632 | |
| Construction (non-real estate) | | | 1,009 | | | | 722 | | | | 931 | | | | 1,156 | | | | 1,782 | |
| Retail trade | | | 3,276 | | | | 3,039 | | | | 3,181 | | | | 3,092 | | | | 3,217 | |
| Wholesale trade | | | 2,735 | | | | 2,884 | | | | 2,912 | | | | 2,976 | | | | 3,984 | |
| Agriculture | | | 2,597 | | | | 2,693 | | | | 2,659 | | | | 2,475 | | | | 2,772 | |
| Communications | | | 1,742 | | | | 2,724 | | | | 3,261 | | | | 3,079 | | | | 1,994 | |
| Manufacturing | | | 7,499 | | | | 8,467 | | | | 11,006 | | | | 11,290 | | | | 10,922 | |
| Mining | | | 430 | | | | 581 | | | | 745 | | | | 794 | | | | 873 | |
| Oil and gas | | | 1,913 | | | | 3,611 | | | | 4,055 | | | | 4,566 | | | | 5,090 | |
| Transportation | | | 1,143 | | | | 1,303 | | | | 1,523 | | | | 1,717 | | | | 1,121 | |
| Utilities | | | 937 | | | | 1,418 | | | | 1,590 | | | | 1,624 | | | | 1,279 | |
| Forest products | | | 698 | | | | 981 | | | | 1,177 | | | | 1,378 | | | | 1,391 | |
| Service industries | | | 6,225 | | | | 6,680 | | | | 6,658 | | | | 6,871 | | | | 6,944 | |
| Financial institutions | | | 13,974 | | | | 17,072 | | | | 16,168 | | | | 14,730 | | | | 13,598 | |
| Other | | | 4,996 | | | | 3,976 | | | | 4,590 | | | | 5,540 | | | | 2,171 | |
| | | |
| | | |
| | | |
| | | |
| | | |
| |
| Total net commercial and corporate loans, excluding securities purchased under resale agreements | | | 60,152 | | | | 67,334 | | | | 71,624 | | | | 71,004 | | | | 67,024 | |
| | | |
| | | |
| | | |
| | | |
| | | |
| |
Table 13 Net Impaired Loans and Acceptances — Segmented Information($ millions)
| | | | | | | | | | | | | | | | | | | | | |
| As at October 31 | | 2003 | | | 2002 | | | 2001 | | | 2000 | | | 1999 | |
| |
| |
| |
| |
| |
|
Net Impaired Commercial and Corporate Loans(b)(d) | | | | | | | | | | | | | | | | | | | | |
| Commercial mortgages | | | 46 | | | | 25 | | | | 39 | | | | 38 | | | | 19 | |
| Commercial real estate | | | 17 | | | | 16 | | | | 18 | | | | 26 | | | | 54 | |
| Construction (non-real estate) | | | 27 | | | | 3 | | | | 47 | | | | 6 | | | | 3 | |
| Retail trade | | | 10 | | | | 51 | | | | 120 | | | | 48 | | | | 21 | |
| Wholesale trade | | | 104 | | | | 77 | | | | 47 | | | | 12 | | | | 7 | |
| Agriculture | | | 17 | | | | 24 | | | | 10 | | | | 18 | | | | 18 | |
| Communications | | | 202 | | | | 429 | | | | 78 | | | | 19 | | | | 25 | |
| Manufacturing | | | 228 | | | | 273 | | | | 126 | | | | 81 | | | | 48 | |
| Mining | | | 63 | | | | 9 | | | | 6 | | | | — | | | | 1 | |
| Oil and gas | | | — | | | | 71 | | | | 77 | | | | 102 | | | | 145 | |
| Transportation | | | 29 | | | | 130 | | | | 167 | | | | 153 | | | | 61 | |
| Utilities | | | 252 | | | | 162 | | | | 154 | | | | 1 | | | | — | |
| Forest products | | | 32 | | | | 23 | | | | 48 | | | | 55 | | | | 5 | |
| Service industries | | | 71 | | | | 63 | | | | 102 | | | | 115 | | | | 127 | |
| Financial institutions | | | 34 | | | | 14 | | | | 25 | | | | 113 | | | | 23 | |
| Other (f)(g) | | | — | | | | 30 | | | | (1 | ) | | | 11 | | | | (20 | ) |
| | | |
| | | |
| | | |
| | | |
| | | |
| |
| Total commercial and corporate loans | | | 1,132 | | | | 1,400 | | | | 1,063 | | | | 798 | | | | 537 | |
| | | |
| | | |
| | | |
| | | |
| | | |
| |
Table 14 Changes in Impaired Loans and Acceptances($ millions)
| | | | | | | | | | | | | | | | | | | | | |
| As at or for the year ended October 31 | | 2003 | | | 2002 | | | 2001 | | | 2000 | | | 1999 | |
| |
| |
| |
| |
| |
|
| Gross impaired loans and acceptances, beginning of year | | | 2,337 | | | | 2,014 | | | | 1,501 | | | | 1,092 | | | | 824 | |
| | | |
| | | |
| | | |
| | | |
| | | |
| |
| Additions to impaired loans and acceptances | | | 1,303 | | | | 1,945 | | | | 2,041 | | | | 1,106 | | | | 1,084 | |
| Reductions in impaired loans and acceptances (h) | | | (1,156 | ) | | | (738 | ) | | | (830 | ) | | | (446 | ) | | | (623 | ) |
| | | |
| | | |
| | | |
| | | |
| | | |
| |
| Net new additions | | | 147 | | | | 1,207 | | | | 1,211 | | | | 660 | | | | 461 | |
| | | |
| | | |
| | | |
| | | |
| | | |
| |
| Write-offs | | | (566 | ) | | | (884 | ) | | | (698 | ) | | | (251 | ) | | | (193 | ) |
| | | |
| | | |
| | | |
| | | |
| | | |
| |
Gross Impaired Loans and Acceptances, End of Year | | | 1,918 | | | | 2,337 | | | | 2,014 | | | | 1,501 | | | | 1,092 | |
| | | |
| | | |
| | | |
| | | |
| | | |
| |
| Allowance for Credit Losses (ACL), beginning of year | | | 1,949 | | | | 1,949 | | | | 1,597 | | | | 1,348 | | | | 1,166 | |
| Increases — specific allowance | | | 402 | | | | 884 | | | | 950 | | | | 390 | | | | 290 | |
| Increases — general allowance | | | — | | | | — | | | | 100 | | | | 110 | | | | 85 | |
| Write-offs (i) | | | (566 | ) | | | (884 | ) | | | (698 | ) | | | (251 | ) | | | (193 | ) |
| | | |
| | | |
| | | |
| | | |
| | | |
| |
Allowance for Credit Losses(j), End of Year | | | 1,785 | | | | 1,949 | | | | 1,949 | | | | 1,597 | | | | 1,348 | |
| | | |
| | | |
| | | |
| | | |
| | | |
| |
Note: (b) (c) (d) (h) (i) (j) See page 60.
BMO FINANCIAL GROUP 186TH ANNUAL REPORT 2003 61
Supplemental Information
Table 15 Changes in Allowance for Credit Losses — Segmented Information($ millions, except as noted)
| | | | | | | | | | | | | | | | | | | | | | | | | | | | | | | | | | | | | | | | | |
| | | Canada | | United States |
| | |
| |
|
| As at October 31 | | 2003 | | | 2002 | | | 2001 | | | 2000 | | | 1999 | | | 2003 | | | 2002 | | | 2001 | | | 2000 | | | 1999 | |
| |
| |
| |
| |
| |
| |
| |
| |
| |
| |
|
| | | | | | | | | | | | | | | | | | | | | | | | | | | | | | | | | | | | | | | | | |
| Allowance for credit losses, beginning of year | | | 1,200 | | | | 1,266 | | | | 1,170 | | | | 963 | | | | 868 | | | | 700 | | | | 646 | | | | 382 | | | | 335 | | | | 268 | |
| Provision for credit losses | | | 211 | | | | 561 | | | | 402 | | | | 271 | | | | 210 | | | | 211 | | | | 255 | | | | 570 | | | | 120 | | | | 98 | |
| Transfer of allowance | | | (70 | ) | | | (231 | ) | | | 26 | | | | 68 | | | | — | | | | 5 | | | | 225 | | | | (15 | ) | | | (59 | ) | | | — | |
| Recoveries | | | 28 | | | | 28 | | | | 25 | | | | 30 | | | | 22 | | | | 60 | | | | 39 | | | | 15 | | | | 14 | | | | 25 | |
| Write-offs (a) | | | (341 | ) | | | (419 | ) | | | (361 | ) | | | (164 | ) | | | (131 | ) | | | (211 | ) | | | (465 | ) | | | (331 | ) | | | (42 | ) | | | (47 | ) |
| Other, including foreign exchange rate changes | | | (15 | ) | | | (5 | ) | | | 4 | | | | 2 | | | | (6 | ) | | | (104 | ) | | | — | | | | 25 | | | | 14 | | | | (9 | ) |
| | | |
| | | |
| | | |
| | | |
| | | |
| | | |
| | | |
| | | |
| | | |
| | | |
| |
| Allowance for credit losses, end of year | | | 1,013 | | | | 1,200 | | | | 1,266 | | | | 1,170 | | | | 963 | | | | 661 | | | | 700 | | | | 646 | | | | 382 | | | | 335 | |
| | | |
| | | |
| | | |
| | | |
| | | |
| | | |
| | | |
| | | |
| | | |
| | | |
| |
Allocation of Write-offs by Market | | | | | | | | | | | | | | | | | | | | | | | | | | | | | | | | | | | | | | | | |
| Consumer | | | (155 | ) | | | (153 | ) | | | (144 | ) | | | (129 | ) | | | (92 | ) | | | (23 | ) | | | (23 | ) | | | (13 | ) | | | (10 | ) | | | (12 | ) |
| Commercial and corporate | | | (186 | ) | | | (266 | ) | | | (217 | ) | | | (35 | ) | | | (39 | ) | | | (188 | ) | | | (442 | ) | | | (318 | ) | | | (32 | ) | | | (35 | ) |
| Lesser-developed countries | | | — | | | | — | | | | — | | | | — | | | | — | | | | — | | | | — | | | | — | | | | — | | | | — | |
Allocation of Recoveries by Market | | | | | | | | | | | | | | | | | | | | | | | | | | | | | | | | | | | | | | | | |
| Consumer | | | 26 | | | | 22 | | | | 19 | | | | 18 | | | | 17 | | | | 10 | | | | 8 | | | | 6 | | | | 5 | | | | 5 | |
| Commercial and corporate | | | 2 | | | | 6 | | | | 6 | | | | 12 | | | | 5 | | | | 50 | | | | 31 | | | | 9 | | | | 9 | | | | 20 | |
| Net write-offs as a % of average loans and acceptances | | NA | | | NA | | | NA | | | NA | | | NA | | | NA | | | NA | | | NA | | | NA | | | NA | |
| | | |
| | | |
| | | |
| | | |
| | | |
| | | |
| | | |
| | | |
| | | |
| | | |
| |
[Additional columns below]
[Continued from above table, first column(s) repeated]
| | | | | | | | | | | | | | | | | | | | | | | | | | | | | | | | | | | | | | | | | |
| | | Other countries | | Total |
| | |
| |
|
| As at October 31 | | 2003 | | | 2002 | | | 2001 | | | 2000 | | | 1999 | | | 2003 | | | 2002 | | | 2001 | | | 2000 | | | 1999 | |
| |
| |
| |
| |
| |
| |
| |
| |
| |
| |
|
| Allowance for credit losses, beginning of year | | | 49 | | | | 37 | | | | 45 | | | | 129 | | | | 136 | | | | 1,949 | | | | 1,949 | | | | 1,597 | | | | 1,427 | | | | 1,272 | |
| Provision for credit losses | | | 33 | | | | 4 | | | | 8 | | | | (33 | ) | | | 12 | | | | 455 | | | | 820 | | | | 980 | | | | 358 | | | | 320 | |
| Transfer of allowance | | | 65 | | | | 6 | | | | (11 | ) | | | (9 | ) | | | — | | | | — | | | | — | | | | — | | | | — | | | | — | |
| Recoveries | | | — | | | | 1 | | | | — | | | | — | | | | — | | | | 88 | | | | 68 | | | | 40 | | | | 44 | | | | 47 | |
| Write-offs (a) | | | (14 | ) | | | — | | | | (6 | ) | | | (45 | ) | | | (15 | ) | | | (566 | ) | | | (884 | ) | | | (698 | ) | | | (251 | ) | | | (193 | ) |
| Other, including foreign exchange rate changes | | | (16 | ) | | | 1 | | | | 1 | | | | 3 | | | | (4 | ) | | | (135 | ) | | | (4 | ) | | | 30 | | | | 19 | | | | (19 | ) |
| | | |
| | | |
| | | |
| | | |
| | | |
| | | |
| | | |
| | | |
| | | |
| | | |
| |
| Allowance for credit losses, end of year | | | 117 | | | | 49 | | | | 37 | | | | 45 | | | | 129 | | | | 1,791 | | | | 1,949 | | | | 1,949 | | | | 1,597 | | | | 1,427 | |
| | | |
| | | |
| | | |
| | | |
| | | |
| | | |
| | | |
| | | |
| | | |
| | | |
| |
Allocation of Write-offs by Market | | | | | | | | | | | | | | | | | | | | | | | | | | | | | | | | | | | | | | | | |
| Consumer | | | — | | | | — | | | | — | | | | — | | | | — | | | | (178 | ) | | | (176 | ) | | | (157 | ) | | | (139 | ) | | | (104 | ) |
| Commercial and corporate | | | (14 | ) | | | — | | | | (6 | ) | | | — | | | | — | | | | (388 | ) | | | (708 | ) | | | (541 | ) | | | (67 | ) | | | (74 | ) |
| Lesser-developed countries | | | — | | | | — | | | | — | | | | (45 | ) | | | (15 | ) | | | — | | | | — | | | | — | | | | (45 | ) | | | (15 | ) |
Allocation of Recoveries by Market | | | | | | | | | | | | | | | | | | | | | | | | | | | | | | | | | | | | | | | | |
| Consumer | | | — | | | | — | | | | — | | | | — | | | | — | | | | 36 | | | | 30 | | | | 25 | | | | 23 | | | | 22 | |
| Commercial and corporate | | | — | | | | 1 | | | | — | | | | — | | | | — | | | | 52 | | | | 38 | | | | 15 | | | | 21 | | | | 25 | |
| Net write-offs as a % of average loans and acceptances | | NA | | | NA | | | NA | | | NA | | | NA | | | | 0.3 | | | | 0.6 | | | | 0.4 | | | | 0.1 | | | | 0.1 | |
| | | |
| | | |
| | | |
| | | |
| | | |
| | | |
| | | |
| | | |
| | | |
| | | |
| |
Table 16 Allocation of Allowance for Credit Losses — Segmented Information($ millions, except as noted)
| | | | | | | | | | | | | | | | | | | | | | | | | | | | | | | | | | | | | | | | | | | |
| | | | | Canada (c) | | United States (c) |
| | | | |
| |
|
| As at October 31 | | 2003 | | | 2002 | | | 2001 | | | 2000 | | | 1999 | | | 2003 | | | 2002 | | | 2001 | | | 2000 | | | 1999 | |
| |
| |
| |
| |
| |
| |
| |
| |
| |
| |
|
| Consumer | | | | | | | | | | | | | | | | | | | | | | | | | | | | | | | | | | | | | | | | |
| | Residential mortgages | | | 5 | | | | 5 | | | | 6 | | | | 6 | | | | 4 | | | | — | | | | — | | | | — | | | | — | | | | — | |
| | Consumer instalment and other personal loans | | | 2 | | | | 4 | | | | 6 | | | | 3 | | | | 5 | | | | — | | | | — | | | | 2 | | | | 2 | | | | 3 | |
| | | | |
| | | |
| | | |
| | | |
| | | |
| | | |
| | | |
| | | |
| | | |
| | | |
| |
| | Total consumer | | | 7 | | | | 9 | | | | 12 | | | | 9 | | | | 9 | | | | — | | | | — | | | | 2 | | | | 2 | | | | 3 | |
| Commercial and corporate (b)(d) | | | 200 | | | | 391 | | | | 399 | | | | 231 | | | | 134 | | | | 281 | | | | 320 | | | | 319 | | | | 230 | | | | 182 | |
| Lesser-developed countries (d) | | | — | | | | — | | | | — | | | | — | | | | — | | | | — | | | | — | | | | — | | | | — | | | | — | |
| Off-balance sheet | | | 6 | | | | — | | | | — | | | | — | | | | — | | | | — | | | | — | | | | — | | | | — | | | | — | |
| | | | |
| | | |
| | | |
| | | |
| | | |
| | | |
| | | |
| | | |
| | | |
| | | |
| |
| Total specific allowance | | | 213 | | | | 400 | | | | 411 | | | | 240 | | | | 143 | | | | 281 | | | | 320 | | | | 321 | | | | 232 | | | | 185 | |
| General allowance | | | 800 | | | | 800 | | | | 855 | | | | 930 | | | | 820 | | | | 380 | | | | 380 | | | | 325 | | | | 150 | | | | 150 | |
| | | | |
| | | |
| | | |
| | | |
| | | |
| | | |
| | | |
| | | |
| | | |
| | | |
| |
| Allowance for credit losses | | | 1,013 | | | | 1,200 | | | | 1,266 | | | | 1,170 | | | | 963 | | | | 661 | | | | 700 | | | | 646 | | | | 382 | | | | 335 | |
| | | | |
| | | |
| | | |
| | | |
| | | |
| | | |
| | | |
| | | |
| | | |
| | | |
| |
Coverage Ratios | | | | | | | | | | | | | | | | | | | | | | | | | | | | | | | | | | | | | | | | |
| ACL as a % of gross impaired loans and acceptances (c) | | | | | | | | | | | | | | | | | | | | | | | | | | | | | | | | | | | | | | | | |
| | | Total | | | 167.3 | | | | 128.2 | | | | 134.0 | | | | 153.7 | | | | 145.0 | | | | 62.8 | | | | 58.2 | | | | 63.6 | | | | 57.5 | | | | 104.7 | |
| | | Consumer | | | 3.8 | | | | 5.4 | | | | 6.2 | | | | 4.6 | | | | 4.8 | | | | — | | | | — | | | | 50.0 | | | | 100.0 | | | | 100.0 | |
| | | Commercial and corporate (b)(d) | | | 47.7 | | | | 50.8 | | | | 53.0 | | | | 40.8 | | | | 28.0 | | | | 26.8 | | | | 26.7 | | | | 31.6 | | | | 34.8 | | | | 57.4 | |
| | | Lesser-developed countries | | na | | | na | | | na | | | na | | | na | | | na | | | na | | | na | | | na | | | na | |
| | | | |
| | | |
| | | |
| | | |
| | | |
| | | |
| | | |
| | | |
| | | |
| | | |
| |
[Additional columns below]
[Continued from above table, first column(s) repeated]
| | | | | | | | | | | | | | | | | | | | | | | | | | | | | | | | | | | | | | | | | | | |
| | | | | Other countries (c) | | Total |
| | | | |
| |
|
| As at October 31 | | 2003 | | | 2002 | | | 2001 | | | 2000 | | | 1999 | | | 2003 | | | 2002 | | | 2001 | | | 2000 | | | 1999 | |
| |
| |
| |
| |
| |
| |
| |
| |
| |
| |
|
| Consumer | | | | | | | | | | | | | | | | | | | | | | | | | | | | | | | | | | | | | | | | |
| | Residential mortgages | | | — | | | | — | | | | — | | | | — | | | | — | | | | 5 | | | | 5 | | | | 6 | | | | 6 | | | | 4 | |
| | Consumer instalment and other personal loans | | | — | | | | — | | | | — | | | | — | | | | — | | | | 2 | | | | 4 | | | | 8 | | | | 5 | | | | 8 | |
| | | | |
| | | |
| | | |
| | | |
| | | |
| | | |
| | | |
| | | |
| | | |
| | | |
| |
| | Total consumer | | | — | | | | — | | | | — | | | | — | | | | — | | | | 7 | | | | 9 | | | | 14 | | | | 11 | | | | 12 | |
| Commercial and corporate (b)(d) | | | 117 | | | | 49 | | | | 37 | | | | 45 | | | | 44 | | | | 598 | | | | 760 | | | | 755 | | | | 506 | | | | 360 | |
| Lesser-developed countries (d) | | | — | | | | — | | | | — | | | | — | | | | 85 | | | | — | | | | — | | | | — | | | | — | | | | 85 | |
| Off-balance sheet | | | — | | | | — | | | | — | | | | — | | | | — | | | | 6 | | | | — | | | | — | | | | — | | | | — | |
| | | | |
| | | |
| | | |
| | | |
| | | |
| | | |
| | | |
| | | |
| | | |
| | | |
| |
| Total specific allowance | | | 117 | | | | 49 | | | | 37 | | | | 45 | | | | 129 | | | | 611 | | | | 769 | | | | 769 | | | | 517 | | | | 457 | |
| General allowance | | | — | | | | — | | | | — | | | | — | | | | — | | | | 1,180 | | | | 1,180 | | | | 1,180 | | | | 1,080 | | | | 970 | |
| | | | |
| | | |
| | | |
| | | |
| | | |
| | | |
| | | |
| | | |
| | | |
| | | |
| |
| Allowance for credit losses | | | 117 | | | | 49 | | | | 37 | | | | 45 | | | | 129 | | | | 1,791 | | | | 1,949 | | | | 1,949 | | | | 1,597 | | | | 1,427 | |
| | | | |
| | | |
| | | |
| | | |
| | | |
| | | |
| | | |
| | | |
| | | |
| | | |
| |
Coverage Ratios | | | | | | | | | | | | | | | | | | | | | | | | | | | | | | | | | | | | | | | | |
| ACL as a % of gross impaired loans and acceptances (c) | | | | | | | | | | | | | | | | | | | | | | | | | | | | | | | | | | | | | | | | |
| | | Total | | | 44.3 | | | | 24.6 | | | | 68.5 | | | | 59.2 | | | | 131.6 | | | | 93.1 | | | | 83.4 | | | | 96.8 | | | | 106.4 | | | | 130.6 | |
| | | Consumer | | na | | | na | | | na | | | na | | | na | | | | 3.7 | | | | 5.1 | | | | 7.1 | | | | 5.6 | | | | 6.3 | |
| | | Commercial and corporate (b)(d) | | | 44.3 | | | | 24.6 | | | | 68.5 | | | | 59.2 | | | | 47.8 | | | | 34.6 | | | | 35.2 | | | | 41.5 | | | | 38.8 | | | | 40.1 | |
| | | Lesser-developed countries | | na | | | na | | | na | | | na | | | | 100.0 | | | na | | | na | | | na | | | na | | | | 100.0 | |
| | | | |
| | | |
| | | |
| | | |
| | | |
| | | |
| | | |
| | | |
| | | |
| | | |
| |
Note: Footnotes refer to pages 62 and 63.
| (a) | | Write-offs on designated LDCs include losses of $45 million on sales of performing assets that were charged directly against the allowance in 2000. |
| (b) | | There are no impaired securities purchased under resale agreements and no related allowances. |
| (c) | | There was a change in the methodology of determining the geographical distribution of credit information in fiscal 2003. For comparative purposes, 2002 credit information has been restated on the same basis. |
| (d) | | Separate disclosure of credit exposure related to LDCs has been eliminated and reclassified to its appropriate industry and region. 2001 and 2002 have been reclassified to conform with the current year presentation. |
| (e) | | There has been no provision for credit losses on securities purchased under resale agreements. |
NA — not available
na — not applicable
62 BMO FINANCIAL GROUP 186TH ANNUAL REPORT 2003
Supplemental Information
Table 17 Provision for Credit Losses — Segmented Information($ millions)
| | | | | | | | | | | | | | | | | | | | | |
| For the year ended October 31 | | 2003 | | | 2002 | | | 2001 | | | 2000 | | | 1999 | |
| |
| |
| |
| |
| |
|
Consumer | | | | | | | | | | | | | | | | | | | | |
| Residential mortgages | | | 8 | | | | 7 | | | | 6 | | | | 5 | | | | 7 | |
| Cards | | | 78 | | | | 58 | | | | 48 | | | | 35 | | | | 26 | |
| Consumer instalment and other personal loans | | | 55 | | | | 79 | | | | 74 | | | | 73 | | | | 48 | |
| | | |
| | | |
| | | |
| | | |
| | | |
| |
| Total consumer | | | 141 | | | | 144 | | | | 128 | | | | 113 | | | | 81 | |
| | | |
| | | |
| | | |
| | | |
| | | |
| |
Commercial and Corporate(d)(e) | | | | | | | | | | | | | | | | | | | | |
| Commercial mortgages | | | 1 | | | | 6 | | | | 10 | | | | (1 | ) | | | — | |
| Commercial real estate | | | (16 | ) | | | (2 | ) | | | (1 | ) | | | 1 | | | | (6 | ) |
| Construction (non-real estate) | | | 1 | | | | (23 | ) | | | 28 | | | | (2 | ) | | | 3 | |
| Retail trade | | | (7 | ) | | | 29 | | | | 74 | | | | 20 | | | | 6 | |
| Wholesale trade | | | (1 | ) | | | 19 | | | | 114 | | | | 3 | | | | 10 | |
| Agriculture | | | 5 | | | | 2 | | | | (1 | ) | | | (10 | ) | | | 2 | |
| Communications | | | 7 | | | | 399 | | | | 129 | | | | — | | | | 5 | |
| Manufacturing | | | 116 | | | | 94 | | | | 280 | | | | 81 | | | | 14 | |
| Mining | | | 10 | | | | — | | | | 5 | | | | — | | | | — | |
| Oil and gas | | | (18 | ) | | | 22 | | | | (22 | ) | | | 6 | | | | 43 | |
| Transportation | | | 29 | | | | 17 | | | | 38 | | | | 68 | | | | 8 | |
| Utilities | | | 69 | | | | 69 | | | | 17 | | | | (1 | ) | | | — | |
| Forest products | | | 37 | | | | 4 | | | | — | | | | 3 | | | | 2 | |
| Service industries | | | 58 | | | | 19 | | | | 18 | | | | 14 | | | | 46 | |
| Financial institutions | | | 2 | | | | 23 | | | | 64 | | | | (6 | ) | | | 7 | |
| Other | | | 21 | | | | (2 | ) | | | (1 | ) | | | 1 | | | | 14 | |
| | | |
| | | |
| | | |
| | | |
| | | |
| |
| Total commercial and corporate | | | 314 | | | | 676 | | | | 752 | | | | 177 | | | | 154 | |
| | | |
| | | |
| | | |
| | | |
| | | |
| |
| Net charge to earnings for general provision | | | — | | | | — | | | | 100 | | | | 110 | | | | 85 | |
| Country risk allowance (d) | | | — | | | | — | | | | — | | | | (42 | ) | | | — | |
| | | |
| | | |
| | | |
| | | |
| | | |
| |
| Total provision for credit losses | | | 455 | | | | 820 | | | | 980 | | | | 358 | | | | 320 | |
| | | |
| | | |
| | | |
| | | |
| | | |
| |
Table 18 Specific Allowance for Credit Losses — Segmented Information($ millions)
| | | | | | | | | | | | | | | | | | | | | |
| As at October 31 | | 2003 | | | 2002 | | | 2001 | | | 2000 | | | 1999 | |
| |
| |
| |
| |
| |
|
Commercial and Corporate Specific Allowance by Industry(d) | | | | | | | | | | | | | | | | | | | | |
| Commercial mortgages | | | — | | | | — | | | | 6 | | | | — | | | | 4 | |
| Commercial real estate | | | 3 | | | | 9 | | | | 12 | | | | 30 | | | | 28 | |
| Construction (non-real estate) | | | 2 | | | | 5 | | | | 31 | | | | 5 | | | | 4 | |
| Retail trade | | | 8 | | | | 18 | | | | 59 | | | | 23 | | | | 7 | |
| Wholesale trade | | | 40 | | | | 109 | | | | 80 | | | | 12 | | | | 8 | |
| Agriculture | | | 7 | | | | 14 | | | | 3 | | | | 10 | | | | 6 | |
| Communications | | | 85 | | | | 116 | | | | 60 | | | | 30 | | | | 13 | |
| Manufacturing | | | 158 | | | | 175 | | | | 300 | | | | 96 | | | | 37 | |
| Mining | | | — | | | | — | | | | — | | | | — | | | | — | |
| Oil and gas | | | 2 | | | | 20 | | | | 18 | | | | 51 | | | | 44 | |
| Transportation | | | 36 | | | | 64 | | | | 77 | | | | 77 | | | | 23 | |
| Utilities | | | 141 | | | | 87 | | | | 19 | | | | 2 | | | | 3 | |
| Forest products | | | 34 | | | | 6 | | | | 10 | | | | 19 | | | | 7 | |
| Service industries | | | 49 | | | | 44 | | | | 48 | | | | 85 | | | | 56 | |
| Financial institutions | | | 21 | | | | 29 | | | | 26 | | | | 35 | | | | 35 | |
| Other | | | 12 | | | | 64 | | | | 6 | | | | 31 | | | | 85 | |
| | | |
| | | |
| | | |
| | | |
| | | |
| |
| Total specific allowance for credit losses on commercial and corporate loans (b) | | | 598 | | | | 760 | | | | 755 | | | | 506 | | | | 360 | |
| | | |
| | | |
| | | |
| | | |
| | | |
| |
Note: (b) (d) (e) See page 62.
BMO FINANCIAL GROUP 186TH ANNUAL REPORT 2003 63
Supplemental Information
Table 19 Interest Rate Gap Position($ millions, except as noted)
| | | | | | | | | | | | | | | | | | | | | | | | | | | | | | | | | | | | | | | | | | | | | | | | | |
| | | | | | | | | | | | | | | Total | | Effective | | | | | | Effective | | | | | | Effective | | Non- | | Effective | | |
| | | 0 to 3 | | 4 to 6 | | 7 to 12 | | within | | interest | | 1 to 5 | | interest | | Over 5 | | interest | | interest | | interest | | |
| As at October 31 | | months | | months | | months | | 1 year | | rate (%) | | years | | rate (%) | | years | | rate (%) | | sensitive | | rate (%) | | Total |
| |
| |
| |
| |
| |
| |
| |
| |
|
Canadian Dollar | | | | | | | | | | | | | | | | | | | | | | | | | | | | | | | | | | | | | | | | | | | | | | | | |
Assets | | | | | | | | | | | | | | | | | | | | | | | | | | | | | | | | | | | | | | | | | | | | | | | | |
| Cash resources | | | 2,790 | | | | 108 | | | | 62 | | | | 2,960 | | | | 3.57 | | | | 329 | | | | — | | | | — | | | | — | | | | (373 | ) | | na | | | 2,916 | |
| Securities | | | 26,138 | | | | 1,047 | | | | 604 | | | | 27,789 | | | | 4.82 | | | | 748 | | | | 8.05 | | | | 100 | | | | 8.08 | | | | 153 | | | na | | | 28,790 | |
| Loans | | | 52,110 | | | | 3,732 | | | | 6,317 | | | | 62,159 | | | | 4.94 | | | | 29,729 | | | | 5.76 | | | | 2,899 | | | | 5.94 | | | | 4,747 | | | na | | | 99,534 | |
| Other | | | 30,118 | | | | 211 | | | | (686 | ) | | | 29,643 | | | na | | | | 3,374 | | | na | | | | — | | | na | | | | 983 | | | na | | | 34,000 | |
| | | |
| | | |
| | | |
| | | |
| | | |
| | | |
| | | |
| | | |
| | | |
| | | |
| | | |
| | | |
| |
| Total assets | | | 111,156 | | | | 5,098 | | | | 6,297 | | | | 122,551 | | | | | | | | 34,180 | | | | | | | | 2,999 | | | | | | | | 5,510 | | | | | | | | 165,240 | |
| | | |
| | | |
| | | |
| | | |
| | | |
| | | |
| | | |
| | | |
| | | |
| | | |
| | | |
| | | |
| |
Liabilities and Shareholders’ Equity | | | | | | | | | | | | | | | | | | | | | | | | | | | | | | | | | | | | | | | | | | | | | | | | |
| Deposits | | | 48,531 | | | | 5,940 | | | | 5,185 | | | | 59,656 | | | | 2.65 | | | | 38,943 | | | | 1.96 | | | | 1,146 | | | | 5.79 | | | | — | | | na | | | 99,745 | |
| Other | | | 43,060 | | | | 81 | | | | 242 | | | | 43,383 | | | na | | | | 1,302 | | | na | | | | 1,150 | | | na | | | | 5,509 | | | na | | | | 51,344 | |
| Subordinated debt | | | 400 | | | | — | | | | — | | | | 400 | | | | 4.35 | | | | 1,275 | | | | 7.37 | | | | 390 | | | | 9.63 | | | | — | | | na | | | 2,065 | |
| Shareholders’ equity | | | — | | | | — | | | | — | | | | — | | | na | | | | 849 | | | na | | | | 200 | | | na | | | | 11,037 | | | na | | | 12,086 | |
| | | |
| | | |
| | | |
| | | |
| | | |
| | | |
| | | |
| | | |
| | | |
| | | |
| | | |
| | | |
| |
| Total liabilities and shareholders’ equity | | | 91,991 | | | | 6,021 | | | | 5,427 | | | | 103,439 | | | | | | | | 42,369 | | | | | | | | 2,886 | | | | | | | | 16,546 | | | | | | | | 165,240 | |
| | | |
| | | |
| | | |
| | | |
| | | |
| | | |
| | | |
| | | |
| | | |
| | | |
| | | |
| | | |
| |
| On-balance sheet gap position | | | 19,165 | | | | (923 | ) | | | 870 | | | | 19,112 | | | | | | | | (8,189 | ) | | | | | | | 113 | | | | | | | | (11,036 | ) | | | | | | | — | |
| Off-balance sheet gap position | | | (18,671 | ) | | | 1,135 | | | | 1,740 | | | | (15,796 | ) | | | | | | | 15,046 | | | | | | | | 750 | | | | | | | | — | | | | | | | | — | |
| | | |
| | | |
| | | |
| | | |
| | | |
| | | |
| | | |
| | | |
| | | |
| | | |
| | | |
| | | |
| |
Total Interest Rate Gap Position | | | | | | | | | | | | | | | | | | | | | | | | | | | | | | | | | | | | | | | | | | | | | | | | |
2003 | | | 494 | | | | 212 | | | | 2,610 | | | | 3,316 | | | | | | | | 6,857 | | | | | | | | 863 | | | | | | | | (11,036 | ) | | | | | | | — | |
| 2002 | | | 441 | | | | 71 | | | | 1,048 | | | | 1,560 | | | | | | | | 7,399 | | | | | | | | 1,418 | | | | | | | | (10,377 | ) | | | | | | | — | |
| 2001 | | | 3,829 | | | | (392 | ) | | | 637 | | | | 4,074 | | | | | | | | 3,620 | | | | | | | | 1,938 | | | | | | | | (9,632 | ) | | | | | | | — | |
| 2000 | | | 2,404 | | | | 1,355 | | | | 565 | | | | 4,324 | | | | | | | | 4,801 | | | | | | | | 1,110 | | | | | | | | (10,235 | ) | | | | | | | — | |
| 1999 | | | (117 | ) | | | 1,103 | | | | (5,078 | ) | | | (4,092 | ) | | | | | | | 11,042 | | | | | | | | 2,485 | | | | | | | | (9,435 | ) | | | | | | | — | |
| | | | | | | | | | | | | | | | | | | | |
U.S. Dollar and Other Currencies | | | | | | | | | | | | | | | | | | | | | | | | | | | | | | | | | | | | | | | | | | | | | | | | |
Assets | | | | | | | | | | | | | | | | | | | | | | | | | | | | | | | | | | | | | | | | | | | | | | | | |
| Cash resources | | | 6,202 | | | | 2,238 | | | | 7,889 | | | | 16,329 | | | | 2.80 | | | | 424 | | | | — | | | | 564 | | | | 4.13 | | | | (373 | ) | | na | | | 16,944 | |
| Securities | | | 13,772 | | | | 1,380 | | | | 3,206 | | | | 18,358 | | | | 3.79 | | | | 7,029 | | | | 2.87 | | | | 595 | | | | 5.17 | | | | 18 | | | na | | | 26,000 | |
| Loans | | | 33,291 | | | | 1,550 | | | | 1,286 | | | | 36,127 | | | | 2.32 | | | | 7,585 | | | | 5.24 | | | | 2,075 | | | | 5.43 | | | | 835 | | | na | | | 46,622 | |
| Other | | | (1,624 | ) | | | 4 | | | | 752 | | | | (868 | ) | | na | | | | 3,932 | | | na | | | | 243 | | | na | | | | (1,619 | ) | | na | | | 1,688 | |
| | | |
| | | |
| | | |
| | | |
| | | |
| | | |
| | | |
| | | |
| | | |
| | | |
| | | |
| | | |
| |
| Total assets | | | 51,641 | | | | 5,172 | | | | 13,133 | | | | 69,946 | | | | | | | | 18,970 | | | | | | | | 3,477 | | | | | | | | (1,139 | ) | | | | | | | 91,254 | |
| | | |
| | | |
| | | |
| | | |
| | | |
| | | |
| | | |
| | | |
| | | |
| | | |
| | | |
| | | |
| |
Liabilities and Shareholders’ Equity | | | | | | | | | | | | | | | | | | | | | | | | | | | | | | | | | | | | | | | | | | | | | | | | |
| Deposits | | | 51,440 | | | | 4,228 | | | | 2,221 | | | | 57,889 | | | | 1.32 | | | | 12,041 | | | | 1.06 | | | | 707 | | | | 4.22 | | | | 1,169 | | | na | | | 71,806 | |
| Other | | | 19,730 | | | | 29 | | | | 11 | | | | 19,770 | | | na | | | | 509 | | | na | | | | 330 | | | na | | | | (2,348 | ) | | na | | | 18,261 | |
| Subordinated debt | | | — | | | | — | | | | — | | | | — | | | | — | | | | 791 | | | | 6.95 | | | | — | | | na | | | | — | | | na | | | 791 | |
| Shareholders’ equity | | | — | | | | — | | | | — | | | | — | | | na | | | | — | | | na | | | | 396 | | | na | | | | — | | | na | | | 396 | |
| | | |
| | | |
| | | |
| | | |
| | | |
| | | |
| | | |
| | | |
| | | |
| | | |
| | | |
| | | |
| |
| Total liabilities and shareholders’ equity | | | 71,170 | | | | 4,257 | | | | 2,232 | | | | 77,659 | | | | | | | | 13,341 | | | | | | | | 1,433 | | | | | | | | (1,179 | ) | | | | | | | 91,254 | |
| | | |
| | | |
| | | |
| | | |
| | | |
| | | |
| | | |
| | | |
| | | |
| | | |
| | | |
| | | |
| |
| On-balance sheet gap position | | | (19,529 | ) | | | 915 | | | | 10,901 | | | | (7,713 | ) | | | | | | | 5,629 | | | | | | | | 2,044 | | | | | | | | 40 | | | | | | | | — | |
| Off-balance sheet gap position | | | 4,622 | | | | (618 | ) | | | (156 | ) | | | 3,848 | | | | | | | | (3,577 | ) | | | | | | | (271 | ) | | | | | | | — | | | | | | | | — | |
| | | |
| | | |
| | | |
| | | |
| | | |
| | | |
| | | |
| | | |
| | | |
| | | |
| | | |
| | | |
| |
Total Interest Rate Gap Position | | | | | | | | | | | | | | | | | | | | | | | | | | | | | | | | | | | | | | | | | | | | | | | | |
2003 | | | (14,907 | ) | | | 297 | | | | 10,745 | | | | (3,865 | ) | | | | | | | 2,052 | | | | | | | | 1,773 | | | | | | | | 40 | | | | | | | | — | |
| 2002 | | | (8,036 | ) | | | 2,442 | | | | (1,242 | ) | | | (6,836 | ) | | | | | | | 8,536 | | | | | | | | (1,816 | ) | | | | | | | 116 | | | | | | | | — | |
| 2001 | | | (12,985 | ) | | | 1,583 | | | | 3,540 | | | | (7,862 | ) | | | | | | | 8,133 | | | | | | | | (131 | ) | | | | | | | (140 | ) | | | | | | | — | |
| 2000 | | | (10,841 | ) | | | 5,162 | | | | 838 | | | | (4,841 | ) | | | | | | | 3,834 | | | | | | | | 575 | | | | | | | | 432 | | | | | | | | — | |
| 1999 | | | (7,039 | ) | | | (7,764 | ) | | | 2,969 | | | | (11,834 | ) | | | | | | | 11,478 | | | | | | | | (57 | ) | | | | | | | 413 | | | | | | | | — | |
| | | |
| | | |
| | | |
| | | |
| | | |
| | | |
| | | |
| | | |
| | | |
| | | |
| | | |
| | | |
| |
Gap Position
The determination of the interest rate sensitivity or gap position, which is based upon the earlier of the repricing or maturity date of assets, liabilities and derivatives used to manage interest rate risk, by necessity encompasses numerous assumptions.
The gap position presented is as at October 31 of each year. It represents the position outstanding at the close of the business day and may change significantly in subsequent periods based upon customer preferences and the application of BMO’s asset and liability management policies.
The assumptions for 2003 were as follows:
Assets
Fixed term assets such as residential mortgages and consumer loans are reported using scheduled repayments and estimated prepayments based upon historical behaviour.
Trading assets are reported in the 0 to 3 months category.
Fixed rate non-maturity assets and non-interest bearing non-maturity assets are reported based upon historical balance behaviour.
Deposits/Liabilities
Interest bearing non-maturity deposits on which interest rates have historically moved in reference to a specific interest rate basis, such as prime, and on which rates are above the minimum rate committed, are reported as interest sensitive in the 0 to 3 months category. Such deposits may be sensitive to declining rates only to the extent of the minimum interest rate committed. When they no longer demonstrate correlation with market interest rate movements, they are reported in time periods based upon expected balance behaviour.
Term deposits and investment certificates are reported based upon scheduled maturity and estimated redemption based upon historical behaviour.
Fixed rate non-maturity liabilities and non-interest bearing non-maturity liabilities are reported based upon historical account balance behaviour.
Capital
Common Shareholders’ Equity is reported as non-interest sensitive.
Yields
Yields are based upon the contractual interest rate in effect for the assets or liabilities on October 31, 2003.
na — not applicable
64 BMO FINANCIAL GROUP 186TH ANNUAL REPORT 2003
Supplemental Information
Table 20 Risk-Weighted Assets($ millions, except as noted)
| | | | | | | | | | | | | | | | | | | | | | | |
| As at October 31 | | | | | | | | | | | | | | 2003 | | 2002 |
| | | | | | | |
| |
|
| | | | | | | Credit | | Risk | | Risk- | | Risk- |
| | | | | | | | | risk | | weighting | | weighted | | weighted |
| | | | | Balance | | equivalent | | % | | balance | | balance |
| | |
| |
| |
| |
| |
|
| Balance sheet items | | | | | | | | | | | | | | | | | | | | |
| | Cash resources | | | 19,860 | | | | 19,860 | | | | 0-20 | | | | 3,675 | | | | 3,689 | |
| | Securities | | | 54,790 | | | | 54,790 | | | | 0-100 | | | | 5,024 | | | | 6,771 | |
| | Mortgages | | | 56,513 | | | | 56,513 | | | | 0-100 | | | | 17,355 | | | | 15,300 | |
| | Other loans and acceptances | | | 89,643 | | | | 89,643 | | | | 0-100 | | | | 67,086 | | | | 71,268 | |
| | Other assets | | | 35,688 | | | | 35,688 | | | | 0-100 | | | | 8,997 | | | | 7,534 | |
| | | | |
| | | |
| | | | | | | |
| | | |
| |
| | Total balance sheet items | | | 256,494 | | | | 256,494 | | | | | | | | 102,137 | | | | 104,562 | |
| | | | |
| | | |
| | | | | | | |
| | | |
| |
| Off-balance sheet items | | | | | | | | | | | | | | | | | | | | |
| | Guarantees and standby letters of credit | | | 11,170 | | | | 8,849 | | | | 0-100 | | | | 7,666 | | | | 8,251 | |
| | Securities lending | | | 553 | | | | 48 | | | | 0-100 | | | | 37 | | | | 38 | |
| | Documentary and commercial letters of credit | | | 714 | | | | 143 | | | | 0-100 | | | | 74 | | | | 84 | |
| | Commitments to extend credit: | | | | | | | | | | | | | | | | | | | | |
| | | Original maturity of one year and under | | | 67,200 | | | | | | | | 0 | | | | — | | | | — | |
| | | Original maturity of over one year | | | 21,655 | | | | 10,828 | | | | 0-100 | | | | 10,596 | | | | 9,787 | |
| | Derivative financial instruments | | | 1,846,303 | | | | 18,991 | | | | 0-50 | | | | 5,503 | | | | 5,994 | |
| | | | |
| | | |
| | | | | | | |
| | | |
| |
| | Total off-balance sheet items | | | 1,947,595 | | | | 38,859 | | | | | | | | 23,876 | | | | 24,154 | |
| | | | |
| | | |
| | | | | | | |
| | | |
| |
| Total risk-weighted assets — credit risk | | | | | | | | | | | | | | | 126,013 | | | | 128,716 | |
| Total risk-weighted assets — market risk | | | | | | | | | | | | | | | 3,150 | | | | 2,362 | |
| Total risk-weighted assets | | | | | | | | | | | | | | | 129,163 | | | | 131,078 | |
| Total risk-weighted assets — U.S. basis | | | | | | | | | | | | | | | 130,140 | | | | 132,730 | |
| | | | | | | | | | | | | | | | |
| | | |
| |
Table 21 Capital Adequacy($ millions, except as noted)
| | | | | | | | | | | | | | | | | | | | | | | | | | | | | | | | | | | | | | | | | | | |
| As at October 31 | | 2003 | | | 2002 | | | 2001 | | | 2000 | | | 1999 | | | 1998 | | | 1997 | | | 1996 | | | 1995 | | | 1994 | |
| |
| |
| |
| |
| |
| |
| |
| |
| |
| |
|
| Tier 1 — Common shareholders’ | | | | | | | | | | | | | | | | | | | | | | | | | | | | | | | | | | | | | | | | |
| | | equity | | | 11,036 | | | | 10,377 | | | | 9,632 | | | | 10,260 | | | | 9,313 | | | | 8,650 | | | | 7,629 | | | | 6,729 | | | | 6,174 | | | | 5,678 | |
| | | Non-cumulative preferred shares | | | 1,446 | | | | 1,517 | | | | 1,050 | | | | 1,681 | | | | 1,668 | | | | 1,958 | | | | 1,274 | | | | 857 | | | | 858 | | | | 860 | |
| | | Innovative Tier 1 preferred shares | | | 1,150 | | | | 1,150 | | | | 1,150 | | | | 350 | | | | — | | | | — | | | | — | | | | — | | | | — | | | | — | |
| | | Non-controlling interest in subsidiaries | | | 39 | | | | 32 | | | | 32 | | | | 20 | | | | 27 | | | | 40 | | | | 80 | | | | 101 | | | | 121 | | | | 144 | |
| | | Goodwill and excess intangible assets (a) | | | (1,334 | ) | | | (1,547 | ) | | | (798 | ) | | | (447 | ) | | | (430 | ) | | | (494 | ) | | | (521 | ) | | | (557 | ) | | | (411 | ) | | | (450 | ) |
| | | |
| | | |
| | | |
| | | |
| | | |
| | | |
| | | |
| | | |
| | | |
| | | |
| |
| Tier 1 Capital | | | 12,337 | | | | 11,529 | | | | 11,066 | | | | 11,864 | | | | 10,578 | | | | 10,154 | | | | 8,462 | | | | 7,130 | | | | 6,742 | | | | 6,232 | |
| | | |
| | | |
| | | |
| | | |
| | | |
| | | |
| | | |
| | | |
| | | |
| | | |
| |
| Tier 2 — Subsidiary preferred | | | | | | | | | | | | | | | | | | | | | | | | | | | | | | | | | | | | | | | | |
| | | shares (b) | | | 320 | | | | 377 | | | | 397 | | | | — | | | | — | | | | — | | | | — | | | | — | | | | — | | | | — | |
| | | Subordinated debt | | | 1,981 | | | | 3,171 | | | | 4,133 | | | | 4,550 | | | | 4,522 | | | | 4,670 | | | | 3,582 | | | | 3,179 | | | | 2,268 | | | | 1,999 | |
| | | General allowance for credit losses (c) | | | 1,130 | | | | 1,147 | | | | 1,180 | | | | 1,007 | | | | 970 | | | | 873 | | | | 775 | | | | — | | | | — | | | | — | |
| | | |
| | | |
| | | |
| | | |
| | | |
| | | |
| | | |
| | | |
| | | |
| | | |
| |
| Tier 2 Capital | | | 3,431 | | | | 4,695 | | | | 5,710 | | | | 5,557 | | | | 5,492 | | | | 5,543 | | | | 4,357 | | | | 3,179 | | | | 2,268 | | | | 1,999 | |
| | | |
| | | |
| | | |
| | | |
| | | |
| | | |
| | | |
| | | |
| | | |
| | | |
| |
| First loss protection | | | (149 | ) | | | (192 | ) | | | (325 | ) | | | (511 | ) | | | (315 | ) | | | (323 | ) | | | (113 | ) | | | na | | | | na | | | | na | |
| Investment in non-consolidated subsidiaries/substantial investments | | | — | | | | — | | | | — | | | | (821 | ) | | | (1,010 | ) | | | (858 | ) | | | (697 | ) | | | (625 | ) | | | — | | | | — | |
| | | |
| | | |
| | | |
| | | |
| | | |
| | | |
| | | |
| | | |
| | | |
| | | |
| |
| Total capital | | | 15,619 | | | | 16,032 | | | | 16,451 | | | | 16,089 | | | | 14,745 | | | | 14,516 | | | | 12,009 | | | | 9,684 | | | | 9,010 | | | | 8,231 | |
| | | |
| | | |
| | | |
| | | |
| | | |
| | | |
| | | |
| | | |
| | | |
| | | |
| |
| Risk-weighted assets | | | 129,163 | | | | 131,078 | | | | 135,768 | | | | 134,360 | | | | 136,964 | | | | 139,782 | | | | 124,348 | | | | 106,267 | | | | 96,075 | | | | 86,589 | |
| Risk-weighted capital ratios (%) | | | | | | | | | | | | | | | | | | | | | | | | | | | | | | | | | | | | | | | | |
| | Tier 1 capital ratio | | | 9.55 | | | | 8.80 | | | | 8.15 | | | | 8.83 | | | | 7.72 | | | | 7.26 | | | | 6.80 | | | | 6.71 | | | | 7.02 | | | | 7.20 | |
| | Total capital ratio | | | 12.09 | | | | 12.23 | | | | 12.12 | | | | 11.97 | | | | 10.77 | | | | 10.38 | | | | 9.66 | | | | 9.11 | | | | 9.38 | | | | 9.51 | |
| | U.S. basis Tier 1 capital ratio | | | 9.17 | | | | 8.32 | | | | 7.87 | | | | 8.47 | | | | 7.42 | | | | 6.95 | | | | 6.35 | | | | 6.26 | | | | 6.82 | | | | 6.91 | |
| | U.S. basis total capital ratio | | | 11.60 | | | | 11.60 | | | | 11.69 | | | | 12.50 | | | | 11.34 | | | | 10.86 | | | | 9.92 | | | | 9.81 | | | | 9.97 | | | | 10.07 | |
| Assets-to-capital multiple | | | 16.4 | | | | 15.8 | | | | 14.2 | | | | 14.8 | | | | 16.3 | | | | 16.0 | | | | 18.0 | | | | 19.0 | | | | 17.6 | | | | 17.7 | |
| Equity-to-assets ratio (%) | | | 5.5 | | | | 5.3 | | | | 5.1 | | | | 5.4 | | | | 4.9 | | | | 5.0 | | | | 4.4 | | | | 4.6 | | | | 4.7 | | | | 4.8 | |
| | | |
| | | |
| | | |
| | | |
| | | |
| | | |
| | | |
| | | |
| | | |
| | | |
| |
| (a) | | In addition to goodwill, intangible assets in excess of gross Tier 1 capital are deducted from Tier 1 capital as required by OSFI guidelines. |
| (b) | | Reflects the qualification of existing preferred shares of a subsidiary as Tier 2 capital. |
| (c) | | General allowance included with the approval of OSFI beginning in 1997. OSFI approved the inclusion of the lesser of the balance of our general allowance for credit losses and a percentage of risk-weighted assets (0.875% since 2002). |
na — not applicable
BMO FINANCIAL GROUP 186TH ANNUAL REPORT 2003 65
Supplemental Information
Table 22 Average Deposits($ millions, except as noted)
| | | | | | | | | | | | | | | | | | | | | | | | | |
| | | 2003 | | 2002 | | 2001 |
| | |
| |
| |
|
| | | Average | | Average | | Average | | Average | | Average | | Average |
| | | balance | | rate paid (%) | | balance | | rate paid (%) | | balance | | rate paid (%) |
| | |
| |
| |
| |
| |
| |
|
Deposits Booked in Canada | | | | | | | | | | | | | | | | | | | | | | | | |
| Demand deposits — interest bearing | | | 7,096 | | | | 0.87 | | | | 6,646 | | | | 1.12 | | | | 6,589 | | | | 2.80 | |
| Demand deposits — non-interest bearing | | | 9,244 | | | | — | | | | 8,327 | | | | — | | | | 7,193 | | | | — | |
| Payable after notice | | | 33,392 | | | | 1.47 | | | | 32,526 | | | | 1.22 | | | | 28,807 | | | | 2.61 | |
| Payable on a fixed date | | | 57,175 | | | | 2.34 | | | | 51,670 | | | | 2.54 | | | | 49,253 | | | | 4.93 | |
| | | |
| | | |
| | | |
| | | |
| | | |
| | | |
| |
| Total deposits booked in Canada | | | 106,907 | | | | 1.77 | | | | 99,169 | | | | 1.80 | | | | 91,842 | | | | 3.66 | |
| | | | | | | | | | | | | | | | |
Deposits Booked in the U.S. and Other Countries | | | | | | | | | | | | | | | | | | | | | | | | |
| U.S. demand deposits | | | 10,700 | | | | 0.85 | | | | 11,449 | | | | 1.20 | | | | 12,635 | | | | 3.09 | |
| Other U.S. deposits payable after notice or on a fixed date | | | 32,729 | | | | 2.02 | | | | 36,007 | | | | 2.55 | | | | 34,759 | | | | 4.72 | |
| Deposits booked in other countries | | | 15,282 | | | | 2.05 | | | | 9,764 | | | | 2.83 | | | | 16,048 | | | | 4.86 | |
| | | |
| | | |
| | | |
| | | |
| | | |
| | | |
| |
Total Average Deposits | | | 165,618 | | | | 1.79 | | | | 156,389 | | | | 2.00 | | | | 155,284 | | | | 3.98 | |
| | | |
| | | |
| | | |
| | | |
| | | |
| | | |
| |
As at October 31, 2003, 2002 and 2001, deposits by foreign depositors in our Canadian bank offices amounted to $8,739 million, $8,612 million and $8,668 million, respectively. As at October 31, 2003, 2002 and 2001, total deposits payable after notice included $18,691 million, $19,581 million and $20,021 million, respectively, of chequing accounts that would have been classified as demand deposits under U.S. reporting requirements. As at October 31, 2003, 2002 and 2001, total deposits payable on a fixed date included $18,872 million, $14,953 million and $21,362 million, respectively, of federal funds purchased and commercial paper issued. These amounts would have been classified as short-term borrowings for U.S. reporting purposes.
Table 23 Unrealized Gains (Losses) on Investment Securities(a) ($ millions)
| | | | | | | | | | | | | | | | | | | | | | | | | | | | | | |
| | | | | | | | | | | | Unrealized gains (losses) |
| | | | | | | | | | | |
|
| As at October 31 | | Book value | | Fair value | | 2003 | | | 2002 | | | 2001 | | | 2000 | | | 1999 | |
| |
| |
| |
| |
| |
| |
| |
|
Government Debt and Other Securities | | | | | | | | | | | | | | | | | | | | | | | | | | | | |
| Canadian governments | | | 1,826 | | | | 1,827 | | | | 1 | | | | (2 | ) | | | (13 | ) | | | 13 | | | | 21 | |
| U.S. governments | | | 11,097 | | | | 11,231 | | | | 134 | | | | 249 | | | | 202 | | | | (84 | ) | | | (92 | ) |
| Mortgage-backed securities | | | 1,568 | | | | 1,583 | | | | 15 | | | | 29 | | | | 53 | | | | (139 | ) | | | (175 | ) |
| Corporate debt | | | 3,055 | | | | 3,144 | | | | 89 | | | | 62 | | | | 11 | | | | (117 | ) | | | (103 | ) |
| Corporate equity | | | 1,762 | | | | 1,833 | | | | 71 | | | | (19 | ) | | | 2 | | | | 101 | | | | 27 | |
| Other governments | | | 352 | | | | 354 | | | | 2 | | | | 2 | | | | 3 | | | | — | | | | 10 | |
| | | | |
| | | |
| | | |
| | | |
| | | |
| | | |
| | | |
| |
| Total government debt and other securities | | | 19,660 | | | | 19,972 | | | | 312 | | | | 321 | | | | 258 | | | | (226 | ) | | | (312 | ) |
| Grupo Financiero Bancomer | | | — | | | | — | | | | — | | | | — | | | | — | | | | 277 | | | | (226 | ) |
| Equity investment in 724 Solutions Inc. | | | — | | | | — | | | | — | | | | — | | | | (14 | ) | | | 134 | | | | — | |
| | | | |
| | | |
| | | |
| | | |
| | | |
| | | |
| | | |
| |
| Total investment securities | | | 19,660 | | | | 19,972 | | | | 312 | | | | 321 | | | | 244 | | | | 185 | | | | (538 | ) |
| | | | |
| | | |
| | | |
| | | |
| | | |
| | | |
| | | |
| |
| (a) | | Unrealized gains (losses) may be offset by related losses (gains) on liabilities or by hedge contracts. |
Table 24 Contractual Obligations($ millions)
| | | | | | | | | | | | | | | | | | | | | | | | | |
| | | Less than | | 1-3 | | 4-5 | | Over 5 | | No fixed | | |
| As at October 31 | | one year | | years | | years | | years | | maturity | | Total |
| |
| |
| |
| |
| |
| |
|
| Subordinated debt | | | 400 | | | | 396 | | | | 395 | | | | 1,665 | | | | — | | | | 2,856 | |
| Operating leases | | | 204 | | | | 310 | | | | 198 | | | | 431 | | | | — | | | | 1,143 | |
| Deposits (a) | | | 72,592 | | | | 17,188 | | | | 8,688 | | | | 1,154 | | | | 71,929 | | | | 171,551 | |
| Capital trust securities (b) | | | — | | | | — | | | | — | | | | 1,150 | | | | — | | | | 1,150 | �� |
| | | |
| | | |
| | | |
| | | |
| | | |
| | | |
| |
| Total | | | 73,196 | | | | 17,894 | | | | 9,281 | | | | 4,400 | | | | 71,929 | | | | 176,700 | |
| | | |
| | | |
| | | |
| | | |
| | | |
| | | |
| |
| (a) | | Includes fixed maturity deposits of $16.6 billion that are redeemable at the customers’ option under certain conditions. |
| (b) | | Represents Innovative Tier 1 capital instruments. |
66 BMO FINANCIAL GROUP 186TH ANNUAL REPORT 2003
Supplemental Information
Table 25 Summarized Statement of Income($ millions)
| | | | | | | | | | | | | | | | | | | | | | | | | | | | | | | | | |
| | | Oct. 31 | | July 31 | | April 30 | | Jan. 31 | | Oct. 31 | | July 31 | | April 30 | | Jan. 31 |
| | | 2003 | | 2003 | | 2003 | | 2003 | | 2002 | | 2002 | | 2002 | | 2002 |
| | |
| |
| |
| |
| |
| |
| |
| |
|
| Net interest income (teb) | | | 1,279 | | | | 1,250 | | | | 1,251 | | | | 1,271 | | | | 1,230 | | | | 1,217 | | | | 1,200 | | | | 1,288 | |
| Non-interest revenue | | | 1,132 | | | | 1,084 | | | | 957 | | | | 1,047 | | | | 1,059 | | | | 926 | | | | 1,022 | | | | 917 | |
| | | |
| | | |
| | | |
| | | |
| | | |
| | | |
| | | |
| | | |
| |
| Total revenue (teb) | | | 2,411 | | | | 2,334 | | | | 2,208 | | | | 2,318 | | | | 2,289 | | | | 2,143 | | | | 2,222 | | | | 2,205 | |
| Provision for credit losses | | | 95 | | | | 90 | | | | 120 | | | | 150 | | | | 160 | | | | 160 | | | | 320 | | | | 180 | |
| Non-interest expense | | | 1,545 | | | | 1,485 | | | | 1,484 | | | | 1,573 | | | | 1,604 | | | | 1,488 | | | | 1,476 | | | | 1,462 | |
| | | |
| | | |
| | | |
| | | |
| | | |
| | | |
| | | |
| | | |
| |
Income before provision for income taxes, non-controlling
interest in subsidiaries and goodwill amortization | | | 771 | | | | 759 | | | | 604 | | | | 595 | | | | 525 | | | | 495 | | | | 426 | | | | 563 | |
| Provision for income taxes (teb) | | | 242 | | | | 239 | | | | 179 | | | | 180 | | | | 110 | | | | 135 | | | | 110 | | | | 175 | |
| Non-controlling interest in subsidiaries | | | 16 | | | | 16 | | | | 16 | | | | 16 | | | | 17 | | | | 14 | | | | 15 | | | | 16 | |
| Amortization of goodwill, net of applicable income tax | | | — | | | | — | | | | — | | | | — | | | | — | | | | — | | | | — | | | | — | |
| | | |
| | | |
| | | |
| | | |
| | | |
| | | |
| | | |
| | | |
| |
| Net income | | | 513 | | | | 504 | | | | 409 | | | | 399 | | | | 398 | | | | 346 | | | | 301 | | | | 372 | |
| | | |
| | | |
| | | |
| | | |
| | | |
| | | |
| | | |
| | | |
| |
| Amortization of goodwill and intangible assets, net of income taxes | | | 18 | | | | 19 | | | | 20 | | | | 22 | | | | 22 | | | | 22 | | | | 15 | | | | 16 | |
| | | |
| | | |
| | | |
| | | |
| | | |
| | | |
| | | |
| | | |
| |
| Cash net income | | | 531 | | | | 523 | | | | 429 | | | | 421 | | | | 420 | | | | 368 | | | | 316 | | | | 388 | |
| | | |
| | | |
| | | |
| | | |
| | | |
| | | |
| | | |
| | | |
| |
| Taxable equivalent basis adjustment (teb) | | | 42 | | | | 27 | | | | 44 | | | | 39 | | | | 24 | | | | 26 | | | | 29 | | | | 27 | |
| Reported revenue per financial statements | | | 2,369 | | | | 2,307 | | | | 2,164 | | | | 2,279 | | | | 2,265 | | | | 2,117 | | | | 2,193 | | | | 2,178 | |
| | | |
| | | |
| | | |
| | | |
| | | |
| | | |
| | | |
| | | |
| |
[Additional columns below]
[Continued from above table, first column(s) repeated]
| | | | | | | | | | | | | |
| | | | | | | | | | | | | |
| | | 2003 | | | 2002 | | | 2001 | |
| | |
| |
| |
|
| Net interest income (teb) | | | 5,051 | | | | 4,935 | | | | 4,641 | |
| Non-interest revenue | | | 4,220 | | | | 3,924 | | | | 4,222 | |
| | | |
| | | |
| | | |
| |
| Total revenue (teb) | | | 9,271 | | | | 8,859 | | | | 8,863 | |
| Provision for credit losses | | | 455 | | | | 820 | | | | 980 | |
| Non-interest expense | | | 6,087 | | | | 6,030 | | | | 5,671 | |
| | | |
| | | |
| | | |
| |
Income before provision for income taxes, non-controlling
interest in subsidiaries and goodwill amortization | | | 2,729 | | | | 2,009 | | | | 2,212 | |
| Provision for income taxes (teb) | | | 840 | | | | 530 | | | | 643 | |
| Non-controlling interest in subsidiaries | | | 64 | | | | 62 | | | | 42 | |
| Amortization of goodwill, net of applicable income tax | | | — | | | | — | | | | 56 | |
| | | |
| | | |
| | | |
| |
| Net income | | | 1,825 | | | | 1,417 | | | | 1,471 | |
| | | |
| | | |
| | | |
| |
| Amortization of goodwill and intangible assets, net of income taxes | | | 79 | | | | 75 | | | | 101 | |
| | | |
| | | |
| | | |
| |
| Cash net income | | | 1,904 | | | | 1,492 | | | | 1,572 | |
| | | |
| | | |
| | | |
| |
| Taxable equivalent basis adjustment (teb) | | | 152 | | | | 106 | | | | 142 | |
| Reported revenue per financial statements | | | 9,119 | | | | 8,753 | | | | 8,721 | |
| | | |
| | | |
| | | |
| |
Table 26 Unusual Items($ millions)
| | | | | | | | | | | | | | | | | | | | | | | | | | | | | | | | | | |
| | | | Oct. 31 | | July 31 | | April 30 | | Jan. 31 | | Oct. 31 | | July 31 | | April 30 | | Jan. 31 |
| | | | 2003 | | 2003 | | 2003 | | 2003 | | 2002 | | 2002 | | 2002 | | 2002 |
| | | |
| |
| |
| |
| |
| |
| |
| |
|
Non-Interest Revenue | | | | | | | | | | | | | | | | | | | | | | | | | | | | | | | | |
| Gain on sales of branches | | | | | | | | | | | | | | | | | | | | | | | | | | | | | | | | |
| Gain on sale of Bancomer | | | | | | | | | | | | | | | | | | | | | | | | | | | | | | | | |
| Write-down of equity investments in CBOs | | | | | | | | | | | | | | | | | | | | | | | | | | | | | | | | |
| | | |
| | | |
| | | |
| | | |
| | | |
| | | |
| | | |
| | | |
| |
| Total non-interest revenue | | | — | | | | — | | | | — | | | | — | | | | — | | | | — | | | | — | | | | — | |
| | | | |
| | | |
| | | |
| | | |
| | | |
| | | |
| | | |
| | | |
| |
Provision for Credit Losses | | | | | | | | | | | | | | | | | | | | | | | | | | | | | | | | |
| Increase of general allowance | | | | | | | | | | | | | | | | | | | | | | | | | | | | | | | | |
| | | | |
| | | |
| | | |
| | | |
| | | |
| | | |
| | | |
| | | |
| |
| Total provision for credit losses | | | — | | | | — | | | | — | | | | — | | | | — | | | | — | | | | — | | | | — | |
| | | | |
| | | |
| | | |
| | | |
| | | |
| | | |
| | | |
| | | |
| |
Non-Interest Expense | | | | | | | | | | | | | | | | | | | | | | | | | | | | | | | | |
| Acquisition-related costs | | | | | | | | | | | | | | | | | | | 39 | | | | 23 | | | | | | | | | |
| | | | |
| | | |
| | | |
| | | |
| | | |
| | | |
| | | |
| | | |
| |
| Total non-interest expense | | | — | | | | — | | | | — | | | | — | | | | 39 | | | | 23 | | | | — | | | | — | |
| | | | |
| | | |
| | | |
| | | |
| | | |
| | | |
| | | |
| | | |
| |
| Pre-tax impact of unusual items | | | — | | | | — | | | | — | | | | — | | | | (39 | ) | | | (23 | ) | | | — | | | | — | |
| Income taxes thereon | | | | | | | | | | | | | | | | | | | (14 | ) | | | (9 | ) | | | | | | | | |
| Adjustment of future tax assets | | | | | | | | | | | | | | | | | | | | | | | | | | | | | | | | |
| | | | |
| | | |
| | | |
| | | |
| | | |
| | | |
| | | |
| | | |
| |
| After-tax unusual items | | | — | | | | — | | | | — | | | | — | | | | (25 | ) | | | (14 | ) | | | — | | | | — | |
| | | | |
| | | |
| | | |
| | | |
| | | |
| | | |
| | | |
| | | |
| |
[Additional columns below]
[Continued from above table, first column(s) repeated]
| | | | | | | | | | | | | | |
| | | | | | | | | | | | | | |
| | | | 2003 | | | 2002 | | | 2001 | |
| | | |
| |
| |
|
Non-Interest Revenue | | | | | | | | | | | | |
| Gain on sales of branches | | | — | | | | — | | | | 12 | |
| Gain on sale of Bancomer | | | — | | | | — | | | | 321 | |
| Write-down of equity investments in CBOs | | | — | | | | — | | | | (178 | ) |
| | | | |
| | | |
| | | |
| |
| Total non-interest revenue | | | — | | | | — | | | | 155 | |
| | | | |
| | | |
| | | |
| |
Provision for Credit Losses | | | | | | | | | | | | |
| Increase of general allowance | | | — | | | | — | | | | 100 | |
| | | | |
| | | |
| | | |
| |
| Total provision for credit losses | | | — | | | | — | | | | 100 | |
| | | | |
| | | |
| | | |
| |
Non-Interest Expense | | | | | | | | | | | | |
| Acquisition-related costs | | | — | | | | 62 | | | | — | |
| | | | |
| | | |
| | | |
| |
| Total non-interest expense | | | — | | | | 62 | | | | — | |
| | | | |
| | | |
| | | |
| |
| Pre-tax impact of unusual items | | | — | | | | (62 | ) | | | 55 | |
| Income taxes thereon | | | — | | | | (23 | ) | | | (63 | ) |
| Adjustment of future tax assets | | | — | | | | — | | | | 25 | |
| | | | |
| | | |
| | | |
| |
| After-tax unusual items | | | — | | | | (39 | ) | | | 93 | |
| | | | |
| | | |
| | | |
| |
BMO FINANCIAL GROUP 186TH ANNUAL REPORT 2003 67
Supplemental Information
Table 27 Quarterly Financial Measures
| | | | | | | | | | | | | | | | | | | | | | | | | | | | | | | | | | |
| | | | Oct. 31 | | July 31 | | April 30 | | Jan. 31 | | Oct. 31 | | July 31 | | April 30 | | Jan. 31 |
| | | | 2003 | | 2003 | | 2003 | | 2003 | | 2002 | | 2002 | | 2002 | | 2002 |
| | | |
| |
| |
| |
| |
| |
| |
| |
|
Information per Common Share($) | | | | | | | | | | | | | | | | | | | | | | | | | | | | | | | | |
| Dividends declared | | | 0.35 | | | | 0.33 | | | | 0.33 | | | | 0.33 | | | | 0.30 | | | | 0.30 | | | | 0.30 | | | | 0.30 | |
| Earnings | | | | | | | | | | | | | | | | | | | | | | | | | | | | | | | | |
| | Basic | | | 0.99 | | | | 0.97 | | | | 0.78 | | | | 0.77 | | | | 0.77 | | | | 0.66 | | | | 0.57 | | | | 0.73 | |
| | Diluted | | | 0.97 | | | | 0.95 | | | | 0.77 | | | | 0.75 | | | | 0.75 | | | | 0.65 | | | | 0.57 | | | | 0.71 | |
| Cash earnings | | | | | | | | | | | | | | | | | | | | | | | | | | | | | | | | |
| | Basic | | | 1.02 | | | | 1.01 | | | | 0.83 | | | | 0.81 | | | | 0.81 | | | | 0.71 | | | | 0.60 | | | | 0.76 | |
| | Diluted | | | 1.00 | | | | 0.99 | | | | 0.81 | | | | 0.79 | | | | 0.79 | | | | 0.70 | | | | 0.59 | | | | 0.75 | |
| Book value | | | 22.09 | | | | 21.92 | | | | 21.34 | | | | 21.33 | | | | 21.07 | | | | 20.74 | | | | 20.29 | | | | 20.11 | |
| Market price | | | | | | | | | | | | | | | | | | | | | | | | | | | | | | | | |
| | High | | | 50.26 | | | | 45.00 | | | | 43.39 | | | | 43.40 | | | | 40.65 | | | | 38.13 | | | | 39.60 | | | | 37.70 | |
| | Low | | | 41.88 | | | | 39.44 | | | | 39.30 | | | | 37.79 | | | | 34.15 | | | | 31.00 | | | | 34.05 | | | | 34.39 | |
| | Close | | | 49.33 | | | | 44.65 | | | | 40.10 | | | | 41.30 | | | | 38.10 | | | | 35.26 | | | | 37.68 | | | | 36.00 | |
Financial Measures(%) (a) | | | | | | | | | | | | | | | | | | | | | | | | | | | | | | | | |
| Five-year average total shareholder return | | | 12.9 | | | | 7.3 | | | | 3.8 | | | | 7.5 | | | | 7.9 | | | | 7.4 | | | | 11.6 | | | | 12.5 | |
| Diluted earnings per share growth | | | 29.3 | | | | 46.2 | | | | 35.1 | | | | 5.6 | | | | +100.0 | | | | (21.7 | ) | | | (48.2 | ) | | | (2.7 | ) |
| Diluted cash earnings per share growth | | | 26.6 | | | | 41.4 | | | | 37.3 | | | | 5.3 | | | | +100.0 | | | | (20.5 | ) | | | (48.7 | ) | | | (2.6 | ) |
| Return on equity | | | 17.9 | | | | 18.0 | | | | 15.2 | | | | 14.3 | | | | 14.6 | | | | 12.9 | | | | 11.6 | | | | 14.5 | |
| Cash return on equity | | | 18.5 | | | | 18.8 | | | | 15.9 | | | | 15.1 | | | | 15.4 | | | | 13.8 | | | | 12.2 | | | | 15.2 | |
| Net economic profit growth | | | 74.1 | | | | 100+ | | | | 100+ | | | | 6.7 | | | | +100.0 | | | | (54.6 | ) | | | (88.2 | ) | | | (21.4 | ) |
| Net income growth | | | 28.9 | | | | 45.6 | | | | 36.1 | | | | 7.1 | | | | +100.0 | | | | (22.0 | ) | | | (50.4 | ) | | | (10.5 | ) |
| Revenue growth | | | 5.4 | | | | 8.9 | | | | (0.6 | ) | | | 5.1 | | | | 17.3 | | | | (4.1 | ) | | | (10.5 | ) | | | 0.6 | |
| Non-interest expense-to-revenue ratio | | | 64.0 | | | | 63.7 | | | | 67.2 | | | | 67.9 | | | | 70.1 | | | | 69.4 | | | | 66.4 | | | | 66.3 | |
Provision for credit losses as a % of
average net loans and acceptances | | | 0.25 | | | | 0.24 | | | | 0.32 | | | | 0.39 | | | | 0.43 | | | | 0.44 | | | | 0.87 | | | | 0.49 | |
Gross impaired loans and acceptances
as a % of equity and allowance for credit losses | | | 12.15 | | | | 12.91 | | | | 14.88 | | | | 14.66 | | | | 15.16 | | | | 13.55 | | | | 14.19 | | | | 14.64 | |
| Cash and securities-to-total assets | | | 29.1 | | | | 28.6 | | | | 26.3 | | | | 25.4 | | | | 24.9 | | | | 24.2 | | | | 26.0 | | | | 25.2 | |
| Tier 1 ratio | | | 9.55 | | | | 9.21 | | | | 9.10 | | | | 9.05 | | | | 8.80 | | | | 8.72 | | | | 8.61 | | | | 8.87 | |
| Credit rating | | | | | | | | | | | | | | | | | | | | | | | | | | | | | | | | |
| | Standard & Poor’s | | AA– | | AA– | | AA– | | AA– | | AA– | | AA– | | AA– | | AA– |
| | Moody’s | | Aa3 | | Aa3 | | Aa3 | | Aa3 | | Aa3 | | Aa3 | | Aa3 | | Aa3 |
| | | |
| | | |
| | | |
| | | |
| | | |
| | | |
| | | |
| | | |
| |
[Additional columns below]
[Continued from above table, first column(s) repeated]
| | | | | | | | | | | | | | |
| | | | | | | | | | | | | | |
| | | | 2003 | | | 2002 | | | 2001 | |
| | | |
| |
| |
|
Information per Common Share($) | | | | | | | | | | | | |
| Dividends declared | | | 1.34 | | | | 1.20 | | | | 1.12 | |
| Earnings | | | | | | | | | | | | |
| | Basic | | | 3.51 | | | | 2.73 | | | | 2.72 | |
| | Diluted | | | 3.44 | | | | 2.68 | | | | 2.66 | |
| Cash earnings | | | | | | | | | | | | |
| | Basic | | | 3.67 | | | | 2.88 | | | | 2.92 | |
| | Diluted | | | 3.59 | | | | 2.83 | | | | 2.86 | |
| Book value | | | 22.09 | | | | 21.07 | | | | 19.69 | |
| Market price | | | | | | | | | | | | |
| | High | | | 50.26 | | | | 40.65 | | | | 44.40 | |
| | Low | | | 37.79 | | | | 31.00 | | | | 32.75 | |
| | Close | | | 49.33 | | | | 38.10 | | | | 33.86 | |
Financial Measures(%) (a) | | | | | | | | | | | | |
| Five-year average total shareholder return | | | 12.9 | | | | 7.9 | | | | 14.3 | |
| Diluted earnings per share growth | | | 28.4 | | | | 0.8 | | | | (18.2 | ) |
| Diluted cash earnings per share growth | | | 26.9 | | | | (1.0 | ) | | | (15.6 | ) |
| Return on equity | | | 16.4 | | | | 13.4 | | | | 13.8 | |
| Cash return on equity | | | 17.1 | | | | 14.2 | | | | 14.8 | |
| Net economic profit growth | | | 91.8 | | | | (15.2 | ) | | | (43.3 | ) |
| Net income growth | | | 28.8 | | | | (3.7 | ) | | | (20.8 | ) |
| Revenue growth | | | 4.7 | | | | — | | | | 2.3 | |
| Non-interest expense-to-revenue ratio | | | 65.7 | | | | 68.1 | | | | 64.0 | |
Provision for credit losses as a % of
average net loans and acceptances | | | 0.30 | | | | 0.56 | | | | 0.66 | |
Gross impaired loans and acceptances
as a % of equity and allowance for credit losses | | | 12.15 | | | | 15.16 | | | | 14.17 | |
| Cash and securities-to-total assets | | | 29.1 | | | | 24.9 | | | | 23.1 | |
| Tier 1 ratio | | | 9.55 | | | | 8.80 | | | | 8.15 | |
| Credit rating | | | | | | | | | | | | |
| | Standard & Poor’s | | AA– | | AA– | | AA– |
| | Moody’s | | Aa3 | | Aa3 | | Aa3 |
| | | |
| | | |
| | | |
| |
| (a) | | All quarterly ratios have been annualized. |
In the opinion of Bank of Montreal management, information that is derived from unaudited financial information, including information as at and for interim periods, includes all adjustments necessary for a fair presentation of such information. All such adjustments are of a normal and recurring nature. Financial ratios for interim periods are stated on an annualized basis where appropriate, and the ratios, as well as interim operating results, are not necessarily indicative of actual results for the full fiscal year.
Table 28 Other Statistical Information
| | | | | | | | | | | | | | | | | | | | | | |
| As at October 31 | | 2003 | | | 2002 | | | 2001 | | | 2000 | | | 1999 | |
| |
| |
| |
| |
| |
|
Other Information | | | | | | | | | | | | | | | | | | | | |
| Employees (a) | | | 33,993 | | | | 34,568 | | | | 34,693 | | | | 33,884 | | | | 33,464 | |
| Bank branches | | | 1,142 | | | | 1,134 | | | | 1,129 | | | | 1,135 | | | | 1,198 | |
| Automated banking machines (Canada) | | | 2,023 | | | | 2,000 | | | | 1,982 | | | | 1,987 | | | | 2,039 | |
Rates | | | | | | | | | | | | | | | | | | | | |
| Average Canadian prime rate (%) | | | 4.69 | | | | 4.15 | | | | 6.55 | | | | 7.05 | | | | 6.49 | |
| Average U.S. prime rate (%) | | | 4.17 | | | | 4.79 | | | | 7.68 | | | | 9.18 | | | | 8.00 | |
| Canadian/U.S. dollar exchange rates ($) | | | | | | | | | | | | | | | | | | | | |
| | High | | | 1.59 | | | | 1.61 | | | | 1.49 | | | | 1.44 | | | | 1.45 | |
| | Low | | | 1.30 | | | | 1.51 | | | | 1.59 | | | | 1.53 | | | | 1.56 | |
| | Average | | | 1.44 | | | | 1.57 | | | | 1.54 | | | | 1.48 | | | | 1.50 | |
| | End of period | | | 1.32 | | | | 1.56 | | | | 1.59 | | | | 1.52 | | | | 1.47 | |
| | | |
| | | |
| | | |
| | | |
| | | |
| |
[Additional columns below]
[Continued from above table, first column(s) repeated]
| | | | | | | | | | | | | | | | | | | | | | |
| As at October 31 | | 1998 | | | 1997 | | | 1996 | | | 1995 | | | 1994 | |
| |
| |
| |
| |
| |
|
Other Information | | | | | | | | | | | | | | | | | | | | |
| Employees (a) | | | 33,400 | | | | 34,286 | | | | 33,468 | | | | 33,341 | | | | 34,769 | |
| Bank branches | | | 1,216 | | | | 1,246 | | | | 1,296 | | | | 1,245 | | | | 1,248 | |
| Automated banking machines (Canada) | | | 2,069 | | | | 2,035 | | | | 2,017 | | | | 1,763 | | | | 1,708 | |
Rates | | | | | | | | | | | | | | | | | | | | |
| Average Canadian prime rate (%) | | | 6.44 | | | | 4.80 | | | | 6.67 | | | | 8.58 | | | | 6.42 | |
| Average U.S. prime rate (%) | | | 8.59 | | | | 8.51 | | | | 8.49 | | | | 8.89 | | | | 6.69 | |
| Canadian/U.S. dollar exchange rates ($) | | | | | | | | | | | | | | | | | | | | |
| | High | | | 1.40 | | | | 1.33 | | | | 1.34 | | | | 1.33 | | | | 1.29 | |
| | Low | | | 1.58 | | | | 1.41 | | | | 1.38 | | | | 1.42 | | | | 1.40 | |
| | Average | | | 1.46 | | | | 1.37 | | | | 1.37 | | | | 1.38 | | | | 1.36 | |
| | End of period | | | 1.54 | | | | 1.41 | | | | 1.34 | | | | 1.34 | | | | 1.35 | |
| | | |
| | | |
| | | |
| | | |
| | | |
| |
| (a) | | Reflects full-time equivalent number of employees, comprising full-time and part-time employees and adjustments for overtime hours. |
68 BMO FINANCIAL GROUP 186TH ANNUAL REPORT 2003
STATEMENT OF MANAGEMENT’S RESPONSIBILITY
FOR FINANCIAL INFORMATION
BMO’s management is responsible for presentation and preparation of the annual consolidated financial statements, Management’s Discussion and Analysis (“MD&A”) and all other information in the Annual Report.
The consolidated financial statements have been prepared in accordance with Canadian generally accepted accounting principles (“GAAP”) and the requirements of the Securities and Exchange Commission (“SEC”) in the United States, as applicable. The financial statements also comply with the provisions of the Bank Act and related regulations, including interpretations of GAAP by our regulator, the Superintendent of Financial Institutions Canada.
The MD&A has been prepared in accordance with the requirements of securities regulators including National Instrument 44-101 of the Canadian Securities Administrators as well as Item 303 of Regulation S-K of the Securities Exchange Act, and their related published requirements.
The consolidated financial statements and information in the MD&A necessarily include amounts based on informed judgments and estimates of the expected effects of current events and transactions with appropriate consideration to materiality. In addition, in preparing the financial information we must interpret the requirements described above, make determinations as to the relevancy of information to be included, and make estimates and assumptions that affect reported information. The MD&A also includes information regarding the estimated impact of current transactions and events, sources of liquidity and capital resources, operating trends, risks and uncertainties. Actual results in the future may differ materially from our present assessment of this information because future events and circumstances may not occur as expected.
The financial information presented elsewhere in the Annual Report is consistent with that in the consolidated financial statements.
In meeting our responsibility for the reliability of financial information, we maintain and rely on a comprehensive system of internal control and internal audit, including organizational and procedural controls and internal controls over financial reporting. Our system of internal control includes written communication of our policies and procedures governing corporate conduct and risk management; comprehensive business planning; effective segregation of duties; delegation of authority and personal accountability; careful selection and training of personnel; and sound and conservative accounting policies which we regularly update. This structure ensures appropriate internal control over transactions, assets and records. We also regularly audit internal controls. These controls and audits are designed to provide us with reasonable assurance that the financial records are reliable for preparing financial statements and other financial information, assets are safeguarded against unauthorized use or disposition, liabilities are recognized, and we are in compliance with all regulatory requirements.
We, as Bank of Montreal’s Chief Executive Officer and Chief Financial Officer, will certify Bank of Montreal’s annual disclosure document filed with the SEC (Form 40-F) as required by the United States Sarbanes-Oxley Act.
In order to provide their opinion on our consolidated financial statements, the Shareholders’ Auditors review our system of internal control and conduct their work to the extent that they consider appropriate.
The Board of Directors, based on recommendations from its Audit and Conduct Review Committees and its Risk Review Committee, reviews and approves the financial information contained in the Annual Report, including the MD&A, and oversees management’s responsibilities for the presentation and preparation of financial information, maintenance of appropriate internal controls, management and control of major risk areas and assessment of significant and related party transactions.
The Shareholders’ Auditors and the Bank’s Chief Auditor have full and free access to the Board of Directors and its committees to discuss audit, financial reporting and related matters.
| | | | | |
| /s/ F. Anthony Comper | | /s/ Karen E. Maidment | | |
| | | | | |
F. Anthony Comper
Chairman and
Chief Executive Officer | | Karen E. Maidment
Executive Vice-President
and Chief Financial Officer | |
Canada
November 25, 2003 |
SHAREHOLDERS’ AUDITORS’ REPORT
To the Shareholders of Bank of Montreal
We have audited the consolidated balance sheets of Bank of Montreal as at October 31, 2003 and 2002 and the related consolidated statements of income, changes in shareholders’ equity and cash flow for each of the years in the three-year period ended October 31, 2003. These financial statements are the responsibility of the Bank’s management. Our responsibility is to express an opinion on these financial statements based on our audits.
We conducted our audits in accordance with Canadian generally accepted auditing standards. Those standards require that we plan and perform an audit to obtain reasonable assurance whether the financial statements are free of material misstatement. An audit includes examining, on a test basis, evidence supporting the amounts and disclosures in the financial statements. An audit also includes assessing the accounting principles used and significant estimates made by management, as well as evaluating the overall financial statement presentation.
In our opinion, these consolidated financial statements present fairly, in all material respects, the financial position of the Bank as at October 31, 2003 and 2002 and the results of its operations and its cash flow for each of the years in the three-year period ended October 31, 2003 in accordance with Canadian generally accepted accounting principles.
| | | | | |
/s/ KPMG LLP
KPMG LLP
Chartered Accountants | | /s/ PricewaterhouseCoopers LLP
PricewaterhouseCoopers LLP
Chartered Accountants | | Canada
November 25, 2003 |
BMO FINANCIAL GROUP 186TH ANNUAL REPORT 2003 69
CONSOLIDATED BALANCE SHEET
| | | | | | | | | |
| As at October 31 (Canadian $ in millions) | | 2003 | | 2002 |
| |
| |
|
Assets | | | | | | | | |
Cash Resources(Notes 2 & 25) | | $ | 19,860 | | | $ | 19,305 | |
| | | |
| | | |
| |
Securities(Notes 3 & 25) | | | | | | | | |
| Investment (fair value $19,972 in 2003 and $21,592 in 2002) | | | 19,660 | | | | 21,271 | |
| Trading | | | 35,119 | | | | 22,427 | |
| Loan substitutes | | | 11 | | | | 17 | |
| | | |
| | | |
| |
| | | | 54,790 | | | | 43,715 | |
| | | |
| | | |
| |
Loans(Notes 4 & 7) | | | | | | | | |
| Residential mortgages | | | 52,095 | | | | 47,569 | |
| Consumer instalment and other personal | | | 22,103 | | | | 21,168 | |
| Credit cards | | | 2,967 | | | | 2,280 | |
| Businesses and governments | | | 51,889 | | | | 57,963 | |
| Securities purchased under resale agreements | | | 13,276 | | | | 15,664 | |
| | | |
| | | |
| |
| | | | 142,330 | | | | 144,644 | |
| Customers’ liability under acceptances | | | 5,611 | | | | 6,901 | |
| Allowance for credit losses | | | (1,785 | ) | | | (1,949 | ) |
| | | |
| | | |
| |
| | | | 146,156 | | | | 149,596 | |
| | | |
| | | |
| |
Other Assets | | | | | | | | |
| Derivative financial instruments (Note 9) | | | 21,216 | | | | 22,108 | |
| Premises and equipment (Note 10) | | | 2,045 | | | | 2,159 | |
| Goodwill (Note 12) | | | 1,334 | | | | 1,428 | |
| Intangible assets (Note 12) | | | 589 | | | | 773 | |
| Other (Note 13) | | | 10,504 | | | | 13,780 | |
| | | |
| | | |
| |
| | | | 35,688 | | | | 40,248 | |
| | | |
| | | |
| |
| Total Assets | | $ | 256,494 | | | $ | 252,864 | |
| | | |
| | | |
| |
Liabilities and Shareholders’ Equity | | | | | | | | |
Deposits (Note 14) | | | | | | | | |
| Banks | | $ | 24,755 | | | $ | 15,273 | |
| Businesses and governments | | | 72,405 | | | | 71,411 | |
| Individuals | | | 74,391 | | | | 75,154 | |
| | | |
| | | |
| |
| | | | 171,551 | | | | 161,838 | |
| | | |
| | | |
| |
Other Liabilities | | | | | | | | |
| Derivative financial instruments (Note 9) | | | 20,715 | | | | 22,095 | |
| Acceptances (Note 15) | | | 5,611 | | | | 6,901 | |
| Securities sold but not yet purchased (Note 15) | | | 8,255 | | | | 7,654 | |
| Securities sold under repurchase agreements (Note 15) | | | 23,765 | | | | 24,796 | |
| Other (Note 15) | | | 11,259 | | | | 13,892 | |
| | | |
| | | |
| |
| | | | 69,605 | | | | 75,338 | |
| | | |
| | | |
| |
Subordinated Debt(Note 16) | | | 2,856 | | | | 3,794 | |
| | | |
| | | |
| |
Shareholders’ Equity | | | | | | | | |
| Share capital (Note 17) | | | 5,108 | | | | 4,976 | |
| Contributed surplus (Note 19) | | | 3 | | | | — | |
| Retained earnings | | | 7,371 | | | | 6,918 | |
| | | |
| | | |
| |
| | | | 12,482 | | | | 11,894 | |
| | | |
| | | |
| |
| Total Liabilities and Shareholders’ Equity | | $ | 256,494 | | | $ | 252,864 | |
| | | |
| | | |
| |
The accompanying notes to consolidated financial statements are an integral part of this statement.
Certain comparative figures have been reclassified to conform with the current year’s presentation.
| | | | | |
/s/ F. Anthony Comper
F. Anthony Comper
Chairman and Chief Executive Officer | | /s/ Jeremy H. Reitman
Jeremy H. Reitman
Chairman, Audit Committee | | |
70 BMO FINANCIAL GROUP 186TH ANNUAL REPORT 2003
CONSOLIDATED STATEMENT OF INCOME
| | | | | | | | | | | | | |
| For the Year Ended October 31 (Canadian $ in millions, except as noted) | | 2003 | | 2002 | | 2001 |
| |
| |
| |
|
Interest, Dividend and Fee Income | | | | | | | | | | | | |
| Loans | | $ | 6,970 | | | $ | 7,017 | | | $ | 9,689 | |
| Securities (Note 3) | | | 1,601 | | | | 1,616 | | | | 2,419 | |
| Deposits with banks | | | 356 | | | | 502 | | | | 892 | |
| | | |
| | | |
| | | |
| |
| | | | 8,927 | | | | 9,135 | | | | 13,000 | |
| | | |
| | | |
| | | |
| |
Interest Expense | | | | | | | | | | | | |
| Deposits | | | 2,957 | | | | 3,134 | | | | 6,183 | |
| Subordinated debt | | | 235 | | | | 294 | | | | 351 | |
| Other liabilities | | | 836 | | | | 878 | | | | 1,967 | |
| | | |
| | | |
| | | |
| |
| | | | 4,028 | | | | 4,306 | | | | 8,501 | |
| | | |
| | | |
| | | |
| |
Net Interest Income | | | 4,899 | | | | 4,829 | | | | 4,499 | |
| Provision for credit losses | | | 455 | | | | 820 | | | | 980 | |
| | | |
| | | |
| | | |
| |
| Net Interest Income After Provision for Credit Losses | | | 4,444 | | | | 4,009 | | | | 3,519 | |
| | | |
| | | |
| | | |
| |
Non-Interest Revenue | | | | | | | | | | | | |
| Securities commissions and fees | | | 894 | | | | 813 | | | | 742 | |
| Deposit and payment service charges | | | 756 | | | | 732 | | | | 670 | |
| Trading revenues | | | 275 | | | | 209 | | | | 490 | |
| Lending fees | | | 293 | | | | 306 | | | | 352 | |
| Card fees | | | 290 | | | | 260 | | | | 204 | |
| Investment management and custodial fees | | | 303 | | | | 314 | | | | 336 | |
| Mutual fund revenues | | | 321 | | | | 309 | | | | 251 | |
| Securitization revenues (Note 7) | | | 244 | | | | 329 | | | | 331 | |
| Underwriting and advisory fees | | | 268 | | | | 228 | | | | 234 | |
| Investment securities gains (losses) (Note 3) | | | (41 | ) | | | (146 | ) | | | 123 | |
| Foreign exchange, other than trading | | | 160 | | | | 151 | | | | 127 | |
| Insurance income | | | 124 | | | | 105 | | | | 125 | |
| Other revenues | | | 333 | | | | 314 | | | | 237 | |
| | | |
| | | |
| | | |
| |
| | | | 4,220 | | | | 3,924 | | | | 4,222 | |
| | | |
| | | |
| | | |
| |
| Net Interest Income and Non-Interest Revenue | | | 8,664 | | | | 7,933 | | | | 7,741 | |
| | | |
| | | |
| | | |
| |
Non-Interest Expense | | | | | | | | | | | | |
| Employee compensation (Notes 18 & 19) | | | 3,578 | | | | 3,403 | | | | 3,212 | |
| Premises and equipment (Note 10) | | | 1,264 | | | | 1,280 | | | | 1,153 | |
| Amortization of intangible assets (Note 12) | | | 105 | | | | 87 | | | | 43 | |
| Other expenses | | | 1,140 | | | | 1,260 | | | | 1,263 | |
| | | |
| | | |
| | | |
| |
| Total Non-Interest Expense | | | 6,087 | | | | 6,030 | | | | 5,671 | |
| | | |
| | | |
| | | |
| |
Income Before Provision for Income Taxes, Non-Controlling Interest in Subsidiaries and Goodwill Amortization | | | 2,577 | | | | 1,903 | | | | 2,070 | |
| Income taxes (Note 20) | | | 688 | | | | 424 | | | | 501 | |
| | | |
| | | |
| | | |
| |
| | | | 1,889 | | | | 1,479 | | | | 1,569 | |
| Non-controlling interest in subsidiaries | | | 64 | | | | 62 | | | | 42 | |
| | | |
| | | |
| | | |
| |
Net Income Before Goodwill Amortization | | | 1,825 | | | | 1,417 | | | | 1,527 | |
| Amortization of goodwill, net of applicable income tax (Notes 12 & 20) | | | — | | | | — | | | | 56 | |
| | | |
| | | |
| | | |
| |
Net Income | | $ | 1,825 | | | $ | 1,417 | | | $ | 1,471 | |
| | | |
| | | |
| | | |
| |
| Preferred dividends | | $ | 82 | | | $ | 79 | | | $ | 80 | |
| Net income available to common shareholders | | $ | 1,743 | | | $ | 1,338 | | | $ | 1,391 | |
| Average common shares (in thousands) | | | 496,208 | | | | 490,816 | | | | 511,286 | |
| Average diluted common shares (in thousands) | | | 507,009 | | | | 499,464 | | | | 523,561 | |
| | | |
| | | |
| | | |
| |
Earnings Per Share(Canadian $) (Note 21) | | | | | | | | | | | | |
| Basic | | $ | 3.51 | | | $ | 2.73 | | | $ | 2.72 | |
| Diluted | | | 3.44 | | | | 2.68 | | | | 2.66 | |
Dividends Declared Per Common Share | | | 1.34 | | | | 1.20 | | | | 1.12 | |
| | | |
| | | |
| | | |
| |
The accompanying notes to consolidated financial statements are an integral part of this statement.
Certain comparative figures have been reclassified to conform with the current year’s presentation.
BMO FINANCIAL GROUP 186TH ANNUAL REPORT 2003 71
CONSOLIDATED STATEMENT OF CHANGES IN SHAREHOLDERS’ EQUITY
| | | | | | | | | | | | | | | | | | | | | | | | | | |
| For the Year Ended October 31 (Canadian $ in millions) | | | | | | | | | | | | | | 2003 | | 2002 | | 2001 |
| |
| |
| |
|
Preferred Shares(Note 17) | | | | | | | | | | | | | | | | | | | | | | | | |
| Balance at beginning of year | | | | | | | | | | | | | | $ | 1,517 | | | $ | 1,050 | | | $ | 1,681 | |
| Issued during the year | | | | | | | | | | | | | | | — | | | | 478 | | | | — | |
| Redeemed during the year | | | | | | | | | | | | | | | — | | | | — | | | | (633 | ) |
| Translation adjustment on shares issued in a foreign currency | | | | | | | | | | | | | | | (71 | ) | | | (11 | ) | | | 2 | |
| | | | | | | | | | | | | | | |
| | | |
| | | |
| |
| Balance at End of Year | | | | | | | | | | | | | | | 1,446 | | | | 1,517 | | | | 1,050 | |
| | | | | | | | | | | | | | | |
| | | |
| | | |
| |
| | | Number of Shares
| | | | | | | | | | | | |
| | | |
| | | | | | | | | | | | | |
| | | | 2003 | | | | 2002 | | | | 2001 | | | | | | | | | | | | | |
| | | |
| | | |
| | | |
| | | | | | | | | | | | | |
Common Shares(Note 17) | | | | | | | | | �� | | | | | | | | | | | | | | | |
| Balance at beginning of year | | | 492,504,878 | | | | 489,084,527 | | | | 522,583,894 | | | | 3,459 | | | | 3,375 | | | | 3,173 | |
| Issued under the Shareholder Dividend Reinvestment and Share Purchase Plans | | | 1,101,305 | | | | 1,204,820 | | | | 903,186 | | | | 46 | | | | 44 | | | | 35 | |
| Issued under the Stock Option Plan (Note 19) | | | 5,325,916 | | | | 1,923,115 | | | | 6,177,235 | | | | 129 | | | | 37 | | | | 114 | |
| Issued on the exchange of shares of subsidiary corporations | | | 348,518 | | | | 292,416 | | | | 1,134,765 | | | | 3 | | | | 3 | | | | 7 | |
| Issued on the acquisition of businesses (Note 11) | | | 634,551 | | | | — | | | | 10,285,447 | | | | 27 | | | | — | | | | 400 | |
| Cancellation of stock options granted on acquisition of an investment (Note 17) | | | — | | | | — | | | | — | | | | — | | | | — | | | | (22 | ) |
| Repurchased for cancellation (Note 17) | | | (282,800 | ) | | | — | | | | (52,000,000 | ) | | | (2 | ) | | | — | | | | (332 | ) |
| | | |
| | | |
| | | |
| | | |
| | | |
| | | |
| |
| Balance at End of Year | | | 499,632,368 | | | | 492,504,878 | | | | 489,084,527 | | | | 3,662 | | | | 3,459 | | | | 3,375 | |
| | | |
| | | |
| | | |
| | | |
| | | |
| | | |
| |
Contributed Surplus | | | | | | | | | | | | | | | | | | | | | | | | |
| Balance at beginning of year | | | | | | | | | | | | | | | — | | | | — | | | | — | |
| Stock option expense (Note 19) | | | | | | | | | | | | | | | 3 | | | | — | | | | — | |
| | | | | | | | | | | | | | | |
| | | |
| | | |
| |
| Balance at End of Year | | | | | | | | | | | | | | | 3 | | | | — | | | | — | |
| | | | | | | | | | | | | | | |
| | | |
| | | |
| |
Retained Earnings | | | | | | | | | | | | | | | | | | | | | | | | |
| Balance at beginning of year | | | | | | | | | | | | | | | 6,918 | | | | 6,257 | | | | 7,087 | |
| Cumulative impact of adoption of Employee Future Benefits standard, net of applicable income tax (Note 18) | | | | | | | | | | | | | | | — | | | | — | | | | (250 | ) |
| | | | | | | | | | | | | | | |
| | | |
| | | |
| |
| | | | | | | | | | | | | | | | 6,918 | | | | 6,257 | | | | 6,837 | |
| Net income | | | | | | | | | | | | | | | 1,825 | | | | 1,417 | | | | 1,471 | |
| Dividends | — Preferred shares | | | | | | | | | | | | | | | (82 | ) | | | (79 | ) | | | (80 | ) |
| | — Common shares | | | | | | | | | | | | | | | (666 | ) | | | (589 | ) | | | (568 | ) |
| Net unrealized gain (loss) on translation of net investments in foreign operations (1) | | | | | | | | | | | | | | | (614 | ) | | | (81 | ) | | | 179 | |
| Recognition of unrealized translation losses on disposition of an investment in a foreign operation (Note 3) | | | | | | | | | | | | | | | — | | | | — | | | | 99 | |
| Gain on cancellation of stock options granted on acquisition of an investment, net of applicable income tax (Note 17) | | | | | | | | | | | | | | | — | | | | — | | | | 18 | |
| Common shares repurchased for cancellation (Note 17) | | | | | | | | | | | | | | | (10 | ) | | | — | | | | (1,699 | ) |
| Share issue expense, net of applicable income tax | | | | | | | | | | | | | | | — | | | | (7 | ) | | | — | |
| | | | | | | | | | | | | | | |
| | | |
| | | |
| |
| Balance at End of Year | | | | | | | | | | | | | | | 7,371 | | | | 6,918 | | | | 6,257 | |
| | | | | | | | | | | | | | | |
| | | |
| | | |
| |
| Total Shareholders’ Equity | | | | | | | | | | | | | | $ | 12,482 | | | $ | 11,894 | | | $ | 10,682 | |
| | | | | | | | | | | | | | | |
| | | |
| | | |
| |
(1)Supplemental Disclosure of Net Unrealized Gain (Loss) on Translation of Net Investments in Foreign Operations | | | | | | | | | | | | | | | | | | | | | | | | |
| Unrealized gain (loss) on translation of net investments in foreign operations | | | | | | | | | | | | | | $ | (1,674 | ) | | $ | (200 | ) | | $ | 440 | |
| Hedging gain (loss) | | | | | | | | | | | | | | | 1,661 | | | | 200 | | | | (439 | ) |
| Net income tax benefit (expense) | | | | | | | | | | | | | | | (601 | ) | | | (81 | ) | | | 178 | |
| | | | | | | | | | | | | | | |
| | | |
| | | |
| |
| Net unrealized gain (loss) on translation of net investments in foreign operations | | | | | | | | | | | | | | $ | (614 | ) | | $ | (81 | ) | | $ | 179 | |
| | | | | | | | | | | | | | | |
| | | |
| | | |
| |
The accompanying notes to consolidated financial statements are an integral part of this statement.
72 BMO FINANCIAL GROUP 186TH ANNUAL REPORT 2003
CONSOLIDATED STATEMENT OF CASH FLOW
| | | | | | | | | | | | | | | |
| For the Year Ended October 31 (Canadian $ in millions) | | 2003 | | 2002 | | 2001 |
| |
| |
| |
|
Cash Flows from Operating Activities | | | | | | | | | | | | |
| Net income | | $ | 1,825 | | | $ | 1,417 | | | $ | 1,471 | |
| Adjustments to determine net cash flows provided by (used in) operating activities | | | | | | | | | | | | |
| | Write-down of investment securities | | | 153 | | | | 322 | | | | 284 | |
| | Net (gain) on sale of investment securities | | | (112 | ) | | | (176 | ) | | | (407 | ) |
| | Net (increase) decrease in trading securities | | | (12,692 | ) | | | (6,227 | ) | | | 5,794 | |
| | Provision for credit losses | | | 455 | | | | 820 | | | | 980 | |
| | Gain on sale of securitized loans | | | (157 | ) | | | (168 | ) | | | (82 | ) |
| | Change in derivative financial instruments | | | | | | | | | | | | |
| | | (Increase) decrease in derivative asset | | | 892 | | | | 1,207 | | | | (9,318 | ) |
| | | Increase (decrease) in derivative liability | | | (1,380 | ) | | | (1,551 | ) | | | 10,304 | |
| | Amortization of premises and equipment | | | 375 | | | | 396 | | | | 406 | |
| | Amortization of intangible assets | | | 116 | | | | 100 | | | | 56 | |
| | Amortization of goodwill (Note 12) | | | — | | | | — | | | | 62 | |
| | Future income tax expense (benefit) | | | (37 | ) | | | 283 | | | | (180 | ) |
| | Net increase (decrease) in current income taxes | | | 401 | | | | (256 | ) | | | 98 | |
| | Change in accrued interest | | | | | | | | | | | | |
| | | Decrease in interest receivable | | 87 | | | | 256 | | | | 512 | |
| | | Decrease in interest payable | | (141 | ) | | | (189 | ) | | | (250 | ) |
| | Changes in other items and accruals, net | | | 1,229 | | | | (1,366 | ) | | | 233 | |
| | | |
| | | |
| | | |
| |
| Net Cash Provided by (Used in) Operating Activities | | | (8,986 | ) | | | (5,132 | ) | | | 9,963 | |
| | | |
| | | |
| | | |
| |
Cash Flows from Financing Activities | | | | | | | | | | | | |
| Net increase (decrease) in deposits | | | 9,713 | | | | 7,548 | | | | (3,793 | ) |
| Net increase (decrease) in securities sold but not yet purchased | | | 601 | | | | 1,045 | | | | (2,744 | ) |
| Net increase (decrease) in securities sold under repurchase agreements | | | (1,031 | ) | | | 7,316 | | | | (2,499 | ) |
| Net decrease in liabilities of subsidiaries | | | (157 | ) | | | (1,313 | ) | | | (15 | ) |
| Proceeds from issuance of securities of a subsidiary | | | — | | | | — | | | | 800 | |
| Repayment of subordinated debt | | | (752 | ) | | | (850 | ) | | | (300 | ) |
| Redemption of preferred shares | | | — | | | | — | | | | (633 | ) |
| Proceeds from issuance of preferred shares | | | — | | | | 478 | | | | — | |
| Proceeds from issuance of common shares | | | 175 | | | | 81 | | | | 149 | |
| Share issue expense, net of applicable income tax | | | — | | | | (7 | ) | | | — | |
| Common shares repurchased for cancellation | | | (12 | ) | | | — | | | | (2,031 | ) |
| Dividends paid | | | (748 | ) | | | (668 | ) | | | (648 | ) |
| | | |
| | | |
| | | |
| |
| Net Cash Provided by (Used in) Financing Activities | | | 7,789 | | | | 13,630 | | | | (11,714 | ) |
| | | |
| | | |
| | | |
| |
Cash Flows from Investing Activities | | | | | | | | | | | | |
| Net (increase) decrease in interest bearing deposits with banks | | | (1,741 | ) | | | (1,407 | ) | | | 2,308 | |
| Purchase of investment securities | | | (29,348 | ) | | | (37,437 | ) | | | (35,979 | ) |
| Maturities of investment securities | | | 18,999 | | | | 27,444 | | | | 25,955 | |
| Proceeds from sales of investment securities | | | 9,298 | | | | 9,928 | | | | 13,838 | |
| Net (increase) decrease in loans, customers’ liability under acceptances and loan substitute securities | | | 760 | | | | (5,303 | ) | | | (6,000 | ) |
| Proceeds from securitization of loans | | | — | | | | 519 | | | | 2,234 | |
| Net (increase) decrease in securities purchased under resale agreements | | | 2,388 | | | | (710 | ) | | | 1,354 | |
| Proceeds from sale of land (Note 10) | | | — | | | | 122 | | | | — | |
| Premises and equipment — net purchases | | | (254 | ) | | | (384 | ) | | | (399 | ) |
| Acquisitions (Note 11) | | | (91 | ) | | | (1,028 | ) | | | (245 | ) |
| | | |
| | | |
| | | |
| |
| Net Cash Provided by (Used in) Investing Activities | | | 11 | | | | (8,256 | ) | | | 3,066 | |
| | | |
| | | |
| | | |
| |
| Net Increase (Decrease) in Cash and Cash Equivalents | | | (1,186 | ) | | | 242 | | | | 1,315 | |
| Cash and Cash Equivalents at Beginning of Year | | | 3,701 | | | | 3,459 | | | | 2,144 | |
| | | |
| | | |
| | | |
| |
| Cash and Cash Equivalents at End of Year | | $ | 2,515 | | | $ | 3,701 | | | $ | 3,459 | |
| | | |
| | | |
| | | |
| |
Represented by: | | | | | | | | | | | | |
| Cash and non-interest bearing deposits with Bank of Canada and other banks | | $ | 1,693 | | | $ | 1,257 | | | $ | 2,066 | |
| Cheques and other items in transit, net | | | 822 | | | | 2,444 | | | | 1,393 | |
| | | |
| | | |
| | | |
| |
| | | $ | 2,515 | | | $ | 3,701 | | | $ | 3,459 | |
| | | |
| | | |
| | | |
| |
Supplemental Disclosure of Cash Flow Information | | | | | | | | | | | | |
| Amount of interest paid in the year | | $ | 4,169 | | | $ | 4,495 | | | $ | 8,751 | |
| Amount of income taxes paid in the year | | $ | 324 | | | $ | 393 | | | $ | 405 | |
| | | |
| | | |
| | | |
| |
The accompanying notes to consolidated financial statements are an integral part of this statement.
Certain comparative figures have been reclassified to conform with the current year’s presentation.
BMO FINANCIAL GROUP 186TH ANNUAL REPORT 2003 73
NOTES TO CONSOLIDATED FINANCIAL STATEMENTS
Note 1 Basis of Presentation
We prepare our consolidated financial statements in accordance with Canadian generally accepted accounting principles (“GAAP”), including interpretations of GAAP by our regulator, the Superintendent of Financial Institutions Canada.
We reconcile our Canadian GAAP results to those that would result under United States GAAP. Significant differences in consolidated total assets, total liabilities or net income arising from applying United States GAAP are described in Note 27. In addition, our consolidated financial statements comply with disclosure requirements of United States GAAP, except for United States GAAP disclosures provided in our Management’s Discussion and Analysis and disclosures related to Canadian and United States GAAP differences disclosed in Note 27.
Basis of Consolidation
We conduct business through a variety of corporate structures, including subsidiaries and joint ventures. Subsidiaries are those where we exercise control through our ownership of the majority of the voting shares. Joint ventures are those where we exercise joint control through an agreement with other shareholders. All of the assets, liabilities, revenues and expenses of our subsidiaries and our proportionate share of the assets, liabilities, revenues and expenses of our joint ventures are included in our consolidated financial statements. All significant inter-company transactions and balances are eliminated.
We hold investments in companies where we exert significant influence over operating and financing decisions (those where we own between 20% and 50% of the voting shares). These are recorded at cost and are adjusted for our proportionate share of any income or loss and dividends. They are recorded as investment securities in our Consolidated Balance Sheet and our proportionate share of the net income or loss of these companies is recorded in interest, dividend and fee income, from securities, in our Consolidated Statement of Income.
We hold interests in variable interest entities that are not included in our consolidated financial statements; these are more fully described in Note 8.
Translation of Foreign Currencies
We conduct business in a variety of foreign currencies and report our consolidated financial statements in Canadian dollars. Assets and liabilities denominated in foreign currencies are translated into Canadian dollars at the exchange rate in effect at the balance sheet date. Revenues and expenses denominated in foreign currencies are translated using the average exchange rate for the year.
Unrealized gains and losses arising from translating net investments in foreign operations into Canadian dollars, net of related hedging activities and applicable income taxes, are included in retained earnings in our Consolidated Balance Sheet. When we sell or liquidate an investment in a foreign operation, the associated translation gains and losses, previously included in retained earnings, are recorded in non-interest revenue as part of the gain or loss on disposal of the investment. All other foreign currency translation gains and losses are included in foreign exchange, other than trading, in our Consolidated Statement of Income as they arise.
From time to time, we enter into foreign exchange hedge contracts to reduce our exposure to changes in the value of foreign currencies. Realized and unrealized gains and losses on the translation of foreign exchange hedge contracts are included in non-interest revenue unless they relate to a net investment in foreign operations, in which case they are included in retained earnings.
Use of Estimates
In preparing our consolidated financial statements we must make estimates and assumptions, mainly concerning values, which affect reported amounts of assets, liabilities, net income and related disclosures. The most significant assets and liabilities where we must make estimates include measurement of the allowance for credit losses, trading instruments when no prices or quotes are available, tax assets and liabilities, pension and other future employee benefits obligations, goodwill and other intangible assets, retained interests in securitization vehicles and other than temporary impairment of investment securities. If actual results differ from the estimates, the impact would be recorded in future periods.
Specific Accounting Policies
To facilitate a better understanding of our consolidated financial statements we have disclosed our significant accounting policies throughout the following notes with the related financial disclosures by major caption.
Changes in Accounting Policies
New accounting policies issued by standard setters adopted in the two previous years and current year and those that will become effective in future years are described in Notes 4, 8, 9, 12, 18, 19 and 27.
Note 2 Cash Resources
| | | | | | | | | |
| (Canadian $ in millions) | | 2003 | | 2002 |
| |
| |
|
| Cash and non-interest bearing deposits with Bank of Canada and other banks | | $ | 1,693 | | | $ | 1,257 | |
| Interest bearing deposits with banks | | | 17,345 | | | | 15,604 | |
| Cheques and other items in transit, net | | | 822 | | | | 2,444 | |
| | | |
| | | |
| |
| Total | | $ | 19,860 | | | $ | 19,305 | |
| | | |
| | | |
| |
Deposits with Banks
Deposits with banks are recorded at cost and include acceptances issued by other banks which we have purchased. Interest income earned on these deposits is recorded on an accrual basis.
Cheques and Other Items in Transit, Net
Cheques and other items in transit are recorded at cost and represent the net position of the uncleared cheques and other items in transit between us and other banks.
Cash Restrictions
We have a number of banking subsidiaries whose cash is available for use in their own business and may not be used by other related corporations.
In addition, some of our foreign operations are required to maintain reserves or minimum balances with central banks in their respective countries of operation, amounting to $377 million as at October 31, 2003 and $257 million as at October 31, 2002.
74 BMO FINANCIAL GROUP 186TH ANNUAL REPORT 2003
Notes to Consolidated Financial Statements
Note 3 Securities
Securities are divided into three types, each with a different purpose and accounting treatment. The three types of securities we hold are as follows:
Investment securitiesare comprised of equity and debt securities that we purchase with the intention of holding until maturity or until market conditions, such as a change in interest rates, provide us with a better investment opportunity. Equity securities are recorded at cost and debt securities at amortized cost. Gains and losses on disposal are calculated using the carrying amount of the securities sold.
Interest income earned, the amortization of premiums and discounts on debt securities and dividends received are recorded in our Consolidated Statement of Income in interest, dividend and fee income.
Our investments in equity securities where we exert significant influence, but not control, over a corporation are recorded at cost. This amount is adjusted for our proportionate share of the corporation’s net income or loss from the date of acquisition, and is recorded in our Consolidated Statement of Income in interest, dividend and fee income.
Investment securities are reviewed at each quarter end to determine whether the fair value is below the current recorded value. For actively traded securities, quoted market value is considered to be fair value. For privately held securities and for thinly traded securities where market quotes are not available, we use estimation techniques to determine fair value. Estimation techniques used include discounted cash flows, multiples of earnings or comparisons with other securities that are substantially the same.
When the fair value of any of our investment securities has declined below its current recorded value, we assess whether the decline is other than temporary. If the decline is considered to be other than temporary, write-downs are recorded in our Consolidated Statement of Income in investment securities gains (losses).
Trading securitiesare securities that we purchase for resale over a short period of time. We report these securities at their market value and record the mark-to-market adjustments and any gains and losses on the sale of these securities in our Consolidated Statement of Income in trading revenues.
Loan substitute securitiesare customer financings, such as distressed preferred shares, that we structure as after-tax investments to provide our customers with an interest rate advantage over what would be applicable on a conventional loan. These securities are accounted for in accordance with our accounting policy for loans, which is described in Note 4.
We did not own any securities issued by a single non-government entity where the book value, as at October 31, 2003 or 2002, was greater than 10% of our shareholders’ equity.
| | | | | | | | | | | | | | | | | | | | | | | | | | | | | | | | | | | | | | | | | | | | | | | | | | | | | | |
| (Canadian $ in millions, except as noted) | | Term to maturity | | 2003 | | | | | | 2002 |
| |
| |
| | | | | |
|
| | | | Within | | | | | | 1 to 3 | | | | | | 3 to 5 | | | | | | 5 to 10 | | | | | | Over 10 | | | | | | Total book | | | | | | Total book |
| | | | 1 year | | | | | | years | | | | | | years | | | | | | years | | | | | | years | | | | | | value | | | | | | value |
| | | |
| | | | | |
| | | | | |
| | | | | |
| | | | | |
| | | | | |
| | | | | |
|
| Investment Securities | | | | | | Yield | | | | | | Yield | | | | | | Yield | | | | | | Yield | | | | | | Yield | | | | | | Yield | | | | |
| Issued or guaranteed by: | | | | | | | % | | | | | | | | % | | | | | | | | % | | | | | | | | % | | | | | | | | % | | | | | | | | % | | | | | |
| | Canadian federal government | | $ | 1,622 | | | | 3.26 | | | $ | — | | | | — | | | $ | 203 | | | | 3.51 | | | $ | — | | | | — | | | $ | 1 | | | | 5.10 | | | $ | 1,826 | | | | 3.29 | | | $ | 1,145 | |
| | Canadian provincial and municipal governments | | | — | | | | — | | | | — | | | | — | | | | — | | | | — | | | | — | | | | — | | | | — | | | | — | | | | — | | | | — | | | | 2 | |
| | U.S. federal government | | | 2,411 | | | | 1.85 | | | | 1,386 | | | | 1.42 | | | | 1,252 | | | | 3.68 | | | | 578 | | | | 4.14 | | | | — | | | | — | | | | 5,627 | | | | 2.39 | | | | 5,707 | |
| | U.S. states, municipalities and agencies | | | 2,355 | | | | 2.28 | | | | 2,610 | | | | 2.31 | | | | 308 | | | | 6.03 | | | | 143 | | | | 6.54 | | | | 54 | | | | 7.23 | | | | 5,470 | | | | 2.67 | | | | 7,665 | |
| Other governments | | | 58 | | | | 4.09 | | | | 269 | | | | 2.67 | | | | 7 | | | | 4.95 | | | | 18 | | | | 5.31 | | | | — | | | | — | | | | 352 | | | | 3.08 | | | | 83 | |
| Mortgage-backed securities and collateralized mortgage obligations | | | — | | | | — | | | | 1,136 | | | | 2.37 | | | | — | | | | — | | | | — | | | | — | | | | 432 | | | | 5.05 | | | | 1,568 | | | | 3.11 | | | | 1,059 | |
| Corporate debt | | | 1,090 | | | | 2.49 | | | | 724 | | | | 5.21 | | | | 748 | | | | 6.93 | | | | 292 | | | | 3.77 | | | | 201 | | | | 4.45 | | | | 3,055 | | | | 4.47 | | | | 3,391 | |
| Corporate equity | | | 98 | | | | 5.11 | | | | 333 | | | | 5.86 | | | | 261 | | | | 5.43 | | | | 114 | | | | 5.32 | | | | 956 | | | | 2.00 | | | | 1,762 | | | | 3.63 | | | | 2,219 | |
| | | | |
| | | |
| | | |
| | | |
| | | |
| | | |
| | | |
| | | |
| | | |
| | | |
| | | |
| | | |
| | | |
| |
| Total investment securities | | | 7,634 | | | | 2.43 | | | | 6,458 | | | | 2.65 | | | | 2,779 | | | | 4.97 | | | | 1,145 | | | | 4.48 | | | | 1,644 | | | | 3.27 | | | | 19,660 | | | | 3.05 | | | | 21,271 | |
| | | | |
| | | |
| | | |
| | | |
| | | |
| | | |
| | | |
| | | |
| | | |
| | | |
| | | |
| | | |
| | | |
| |
Trading Securities | | | | | | | | | | | | | | | | | | | | | | | | | | | | | | | | | | | | | | | | | | | | | | | | | | | | |
| Issued or guaranteed by: | | | | | | | | | | | | | | | | | | | | | | | | | | | | | | | | | | | | | | | | | | | | | | | | | | | | |
| | Canadian federal government | | | 3,522 | | | | | | | | 1,074 | | | | | | | | 630 | | | | | | | | 306 | | | | | | | | 824 | | | | | | | | 6,356 | | | | | | | | 5,608 | |
| | Canadian provincial and municipal governments | | | 213 | | | | | | | | 212 | | | | | | | | 146 | | | | | | | | 484 | | | | | | | | 607 | | | | | | | | 1,662 | | | | | | | | 1,401 | |
| | U.S. federal government | | | 171 | | | | | | | | 51 | | | | | | | | 67 | | | | | | | | 7 | | | | | | | | 10 | | | | | | | | 306 | | | | | | | | 609 | |
| | U.S. states, municipalities and agencies | | | — | | | | | | | | — | | | | | | | | — | | | | | | | | — | | | | | | | | 30 | | | | | | | | 30 | | | | | | | | — | |
| Other governments | | | — | | | | | | | | 1 | | | | | | | | 24 | | | | | | | | 21 | | | | | | | | 5 | | | | | | | | 51 | | | | | | | | 19 | |
| Corporate debt | | | 1,792 | | | | | | | | 644 | | | | | | | | 937 | | | | | | | | 1,902 | | | | | | | | 2,495 | | | | | | | | 7,770 | | | | | | | | 4,939 | |
| Corporate equity | | | — | | | | | | | | — | | | | | | | | — | | | | | | | | — | | | | | | | | 18,944 | | | | | | | | 18,944 | | | | | | | | 9,851 | |
| | | | |
| | | | | | | |
| | | | | | | |
| | | | | | | |
| | | | | | | |
| | | | | | | |
| | | | | | | |
| |
| Total trading securities | | | 5,698 | | | | | | | | 1,982 | | | | | | | | 1,804 | | | | | | | | 2,720 | | | | | | | | 22,915 | | | | | | | | 35,119 | | | | | | | | 22,427 | |
| | | | |
| | | | | | | |
| | | | | | | |
| | | | | | | |
| | | | | | | |
| | | | | | | |
| | | | | | | |
| |
Loan Substitute Securities | | | 11 | | | | | | | | — | | | | | | | | — | | | | | | | | — | | | | | | | | — | | | | | | | | 11 | | | | | | | | 17 | |
| | | | |
| | | | | | | |
| | | | | | | |
| | | | | | | |
| | | | | | | |
| | | | | | | |
| | | | | | | |
| |
| Total securities | | $ | 13,343 | | | | | | | $ | 8,440 | | | | | | | $ | 4,583 | | | | | | | $ | 3,865 | | | | | | | $ | 24,559 | | | | | | | $ | 54,790 | | | | | | | $ | 43,715 | |
| | | | |
| | | | | | | |
| | | | | | | |
| | | | | | | |
| | | | | | | |
| | | | | | | |
| | | | | | | |
| |
Yields in the table above are calculated using the book value of the security and the contractual interest or stated dividend rates associated with each security adjusted for any amortization of premiums and discounts. Tax effects are not taken into consideration.
The term to maturity included in the table above is based on the contractual maturity date of the security. Securities with no maturity date are included in the over 10 years category.
Included in corporate equity are investments where we exert significant influence, but not control, of $124 million and $149 million as at October 31, 2003 and 2002, respectively.
BMO FINANCIAL GROUP 186TH ANNUAL REPORT 2003 75
Notes to Consolidated Financial Statements
Income from securities is included in our Consolidated Statement of Income as follows:
| | | | | | | | | | | | | | |
| (Canadian $ in millions) | | 2003 | | 2002 | | 2001 |
| |
| |
| |
|
Reported in: | | | | | | | | | | | | |
Interest, Dividend and Fee Income | | | | | | | | | | | | |
| Investment securities | | $ | 858 | | | $ | 1,156 | | | $ | 1,610 | |
| Trading securities | | | 743 | | | | 460 | | | | 809 | |
| | | |
| | | |
| | | |
| |
| | | $ | 1,601 | | | $ | 1,616 | | | $ | 2,419 | |
| | | |
| | | |
| | | |
| |
Non-Interest Revenue | | | | | | | | | | | | |
| Investment securities | | | | | | | | | | | | |
| | Gross realized gains (1) | | $ | 142 | | | $ | 232 | | | $ | 480 | |
| | Gross realized losses | | | (30 | ) | | | (56 | ) | | | (73 | ) |
| | Write-downs (2) | | | (153 | ) | | | (322 | ) | | | (284 | ) |
| | | |
| | | |
| | | |
| |
| Investment securities gains (losses) | | $ | (41 | ) | | $ | (146 | ) | | $ | 123 | |
| | | |
| | | |
| | | |
| |
| Trading securities, net realized and unrealized gains | | $ | 65 | | | $ | 10 | | | $ | 139 | |
| | | |
| | | |
| | | |
| |
| (1) | | During the year ended October 31, 2001 we sold our investment in Grupo Financiero BBVA Bancomer and realized a gain of $321 million ($272 million after tax). The gain was net of unrealized translation losses of $99 million. |
| (2) | | Included in write-downs for the years ended October 31, 2003, 2002 and 2001 were nil, $103 million and $225 million, respectively, related to our equity investments in collateralized bond obligations. |
Unrealized Gains and Losses
| | | | | | | | | | | | | | | | | | | | | | | | | | | | | | | | | | |
| (Canadian $ in millions) | | 2003 | | 2002 |
| |
| |
|
| | | | | | | Gross | | Gross | | | | | | | | | | Gross | | Gross | | |
| | | Book | | unrealized | | unrealized | | Fair | | Book | | unrealized | | unrealized | | Fair |
| | | value | | gains | | losses | | value | | value | | gains | | losses | | value |
| | |
| |
| |
| |
| |
| |
| |
| |
|
Investment Securities | | | | | | | | | | | | | | | | | | | | | | | | | | | | | | | | |
| Issued or guaranteed by: | | | | | | | | | | | | | | | | | | | | | | | | | | | | | | | | |
| | Canadian federal government | | $ | 1,826 | | | $ | 2 | | | $ | 1 | | | $ | 1,827 | | | $ | 1,145 | | | $ | — | | | $ | 2 | | | $ | 1,143 | |
| | Canadian provincial and municipal governments | | | — | | | | — | | | | — | | | | — | | | | 2 | | | | — | | | | — | | | | 2 | |
| | U.S. federal government | | | 5,627 | | | | 83 | | | | — | | | | 5,710 | | | | 5,707 | | | | 143 | | | | 1 | | | | 5,849 | |
| | U.S. states, municipalities and agencies | | | 5,470 | | | | 52 | | | | 1 | | | | 5,521 | | | | 7,665 | | | | 107 | | | | — | | | | 7,772 | |
| Other governments | | | 352 | | | | 2 | | | | — | | | | 354 | | | | 83 | | | | 2 | | | | — | | | | 85 | |
| Mortgage-backed securities and collateralized mortgage obligations | | | 1,568 | | | | 16 | | | | 1 | | | | 1,583 | | | | 1,059 | | | | 29 | | | | — | | | | 1,088 | |
| Corporate debt | | | 3,055 | | | | 101 | | | | 12 | | | | 3,144 | | | | 3,391 | | | | 119 | | | | 57 | | | | 3,453 | |
| Corporate equity | | | 1,762 | | | | 80 | | | | 9 | | | | 1,833 | | | | 2,219 | | | | 48 | | | | 67 | | | | 2,200 | |
| | | | |
| | | |
| | | |
| | | |
| | | |
| | | |
| | | |
| | | |
| |
| Total | | $ | 19,660 | | | $ | 336 | | | $ | 24 | | | $ | 19,972 | | | $ | 21,271 | | | $ | 448 | | | $ | 127 | | | $ | 21,592 | |
| | | | |
| | | |
| | | |
| | | |
| | | |
| | | |
| | | |
| | | |
| |
Note 4 Loans, Customers’ Liability under Acceptances and Allowance for Credit Losses
Loans
Loans are recorded at cost net of unearned income and unamortized discounts. Unearned income includes interest and deferred loan fees. Interest income is recorded on an accrual basis, except for impaired loans, the treatment of which is described below.
Securities purchased under resale agreements represent the amounts we will receive as a result of our commitment to resell securities that we have purchased back to the original sellers, on a specified date at a specified price. We account for these instruments as loans.
Loan Fees
The accounting treatment for loan fees varies depending on the transaction. Loan syndication fees are included in lending fees when they are earned. Loan origination, restructuring and renegotiation fees are recorded as interest income over the term of the loan. Commitment fees are recorded as interest income over the term of the loan, unless we believe the loan commitment will not be used. In the latter case, commitment fees are recorded as lending fees over the commitment period.
Customers’ Liability under Acceptances
Acceptances are short-term negotiable instruments issued by our customers to third parties, which we guarantee in exchange for a fee. Our potential liability to pay a third party on our customers’ behalf is recorded as a liability in our Consolidated Balance Sheet. Fees earned are recorded in our Consolidated Statement of Income as lending fees over the term of the acceptance.
Impaired Loans
We classify loans, except credit card loans and consumer instalment loans, as impaired when any of the following criteria are met:
| • | | we are no longer reasonably assured principal or interest will be collected on a timely basis; |
| • | | principal or interest payments become 90 days past due (unless we are actively trying to collect the loan and it is fully secured); or |
| • | | fully secured loans become 180 days past due. |
Credit card loans are classified as impaired and immediately written off when principal or interest payments become 180 days past due. Consumer instalment loans are immediately classified as impaired when the principal or interest payments are 90 days past due, and are written off when they are past due by one year, or earlier if warranted.
We do not recognize interest income on loans classified as impaired, and any interest income that is accrued is reversed against interest income.
Payments received on loans that have been classified as impaired are recorded first to recover collection costs and any previous write-offs or allowances, and then as interest income. Payments received on impaired consumer instalment loans are applied first to outstanding interest and then to the remaining principal.
A loan will be reclassified back to performing status when it is determined that there is reasonable assurance of full and timely repayment of interest and principal in accordance with the terms and conditions of the loan, and that none of the criteria for classification of the loan as impaired continue to apply.
From time to time we will restructure a loan due to the poor financial condition of the borrower. If no longer considered impaired, interest on these restructured loans is recorded on an accrual basis.
76 BMO FINANCIAL GROUP 186TH ANNUAL REPORT 2003
Notes to Consolidated Financial Statements
Allowance for Credit Losses
The allowance for credit losses recorded in our Consolidated Balance Sheet is maintained at a level which we consider to be adequate to absorb credit-related losses on our loans, customers’ liability under acceptances and other credit instruments (as discussed in Note 5). The portion related to other credit instruments and guarantees is recorded in other liabilities.
The allowance comprises the following two components:
Specific Allowances
These allowances are recorded for specific loans to reduce their book value to the amount we expect to recover. We review our loans and acceptances, other than consumer instalment and credit card loans (which are written off when certain conditions exist, as discussed under impaired loans), on an ongoing basis to assess whether any loans should be classified as impaired and whether an allowance or write-off should be recorded. Our review of problem loans is conducted at least quarterly by our account managers, who assess the ultimate collectibility and estimated recoveries on a specific loan based on all events and conditions that the manager believes are relevant to the condition of the loan. This assessment is then reviewed and concurred with by an independent credit officer.
To determine the amount we expect to recover from an impaired loan, we use the value of the estimated future cash flows discounted at the effective rate inherent in the loan. When the amounts and timing of future cash flows cannot be estimated with reasonable reliability, the expected recovery amount is estimated using either the fair value of any security underlying the loan, net of expected costs of realization and any amounts legally required to be paid to the borrower, or an observable market price for the loan. Security can vary by type of loan and may include cash, securities, real property, accounts receivable, guarantees, inventory or other capital assets.
General Allowance
We maintain a general allowance in order to cover any impairment in the existing portfolio that cannot yet be associated with specific loans. Our approach to establishing and maintaining the general allowance is based on the guideline issued by our regulator, the Superintendent of Financial Institutions Canada.
The general allowance is reviewed on a quarterly basis. A number of factors are considered when determining the appropriate level of the general allowance. A statistical analysis of past performance is undertaken to derive the mean (Expected Loss) and volatility (Unexpected Loss) of loss experience. This analysis calculates historical average losses for each homogeneous portfolio segment (e.g., mortgages), while other models estimate losses for portfolios of corporate loans and investments that can be referenced to market data. In addition, the level of allowance already in place and management’s professional judgment regarding portfolio quality, business mix and economic as well as credit market conditions are also considered.
Changes in the value of our loan portfolio due to credit-related losses are included in the provision for credit losses in our Consolidated Statement of Income.
Change in Accounting Policy
Effective May 1, 2003, property or other assets that we have received from borrowers to satisfy their loan commitments are recorded at fair value and are classified as either held for use or held for sale according to management’s intention. Prior to May 1, 2003, property or other assets that we received from borrowers to satisfy their loan commitments were classified as impaired loans and recorded at the lower of the amount we expected to recover and the outstanding balance of the loan at the time of the transfer. The impact of this change in accounting was not significant.
Loans, including customers’ liability under acceptances and allowance for credit losses by category, are as follows:
| | | | | | | | | | | | | | | | | | | | | | | | | | | | | | | | | |
| | | Gross | | Specific | | General | | Net |
| (Canadian $ in millions) | | amount (1) | | allowance | | allowance | | amount |
| |
| |
| |
| |
|
| | | 2003 | | | 2002 | | | 2003 | | | 2002 | | | 2003 | | | 2002 | | | 2003 | | | 2002 | |
| | |
| |
| |
| |
| |
| |
| |
| |
|
| Residential mortgages | | $ | 52,095 | | | $ | 47,569 | | | $ | 5 | | | $ | 5 | | | $ | 11 | | | $ | 13 | | | $ | 52,079 | | | $ | 47,551 | |
| Credit card, consumer instalment and other personal loans | | | 25,070 | | | | 23,448 | | | | 2 | | | | 4 | | | | 329 | | | | 294 | | | | 24,739 | | | | 23,150 | |
| Business and government loans | | | 51,889 | | | | 57,963 | | | | 598 | | | | 760 | | | | 800 | | | | 823 | | | | 50,491 | | | | 56,380 | |
| Securities purchased under resale agreements | | | 13,276 | | | | 15,664 | | | | — | | | | — | | | | — | | | | — | | | | 13,276 | | | | 15,664 | |
| | | |
| | | |
| | | |
| | | |
| | | |
| | | |
| | | |
| | | |
| |
| Subtotal | | | 142,330 | | | | 144,644 | | | | 605 | | | | 769 | | | | 1,140 | | | | 1,130 | | | | 140,585 | | | | 142,745 | |
| | | |
| | | |
| | | |
| | | |
| | | |
| | | |
| | | |
| | | |
| |
| Customers’ liability under acceptances | | | 5,611 | | | | 6,901 | | | | — | | | | — | | | | 40 | | | | 50 | | | | 5,571 | | | | 6,851 | |
| | | |
| | | |
| | | |
| | | |
| | | |
| | | |
| | | |
| | | |
| |
| Total | | $ | 147,941 | | | $ | 151,545 | | | $ | 605 | | | $ | 769 | | | $ | 1,180 | | | $ | 1,180 | | | $ | 146,156 | | | $ | 149,596 | |
| | | |
| | | |
| | | |
| | | |
| | | |
| | | |
| | | |
| | | |
| |
Certain comparative figures have been reclassified to conform with the current year’s presentation.
Restructured loans of $14 million were classified as performing during the year ended October 31, 2003 ($38 million in 2002). No restructured loans were written off in the year ended October 31, 2003 or in the year ended October 31, 2002. Included in loans as at October 31, 2003 are $46,220 million ($53,981 million in 2002) of loans denominated in U.S. dollars and $337 million ($598 million in 2002) of loans denominated in other foreign currencies.
| (1) | | Loans are presented net of unearned income of $56 million and $81 million as at October 31, 2003 and 2002, respectively. |
Impaired loans, including customers’ liability under acceptances and the related allowances, are as follows:
| | | | | | | | | | | | | | | | | | | | | | | | | |
| | | Gross impaired | | Specific | | Net of specific |
| (Canadian $ in millions) | | amount | | allowance | | allowance |
| |
| |
| |
|
| | | 2003 | | 2002 | | 2003 | | 2002 | | 2003 | | 2002 |
| | |
| |
| |
| |
| |
| |
|
| Residential mortgages | | $ | 142 | | | $ | 124 | | | $ | 5 | | | $ | 5 | | | $ | 137 | | | $ | 119 | |
| Consumer instalment and other personal loans | | | 46 | | | | 53 | | | | 2 | | | | 4 | | | | 44 | | | | 49 | |
| Business and government loans | | | 1,730 | | | | 2,160 | | | | 598 | | | | 760 | | | | 1,132 | | | | 1,400 | |
| | | |
| | | |
| | | |
| | | |
| | | |
| | | |
| |
| Total | | $ | 1,918 | | | $ | 2,337 | | | $ | 605 | | | $ | 769 | | | $ | 1,313 | | | $ | 1,568 | |
| | | |
| | | |
| | | |
| | | |
| | | |
| | | |
| |
Fully secured loans with past due amounts between 90 and 180 days that we have not classified as impaired totalled $50 million as at October 31, 2003 ($49 million in 2002).
Our average gross impaired loans and acceptances were $2,202 million for the year ended October 31, 2003 ($2,150 million in 2002). Our average impaired loans, net of the specific allowance, were $1,442 million for the year ended October 31, 2003 ($1,351 million in 2002).
During the years ended October 31, 2003, 2002 and 2001, we would have recorded interest income of $78 million, $172 million and $126 million, respectively, if we had not classified any loans as impaired. Cash interest income on impaired loans of $8 million, $2 million and $2 million was recognized during the years ended October 31, 2003, 2002 and 2001, respectively.
BMO FINANCIAL GROUP 186TH ANNUAL REPORT 2003 77
Notes to Consolidated Financial Statements
A continuity of our allowance for credit losses is as follows:
| | | | | | | | | | | | | | | | | | | | | | | | | | | | | | | | | | | | | |
| (Canadian $ in millions) | | Specific allowance | | General allowance | | Total |
| |
| |
| |
|
| | | 2003 | | 2002 | | 2001 | | 2003 | | 2002 | | 2001 | | 2003 | | 2002 | | 2001 |
| | |
| |
| |
| |
| |
| |
| |
| |
| |
|
| Balance at beginning of year | | $ | 769 | | | $ | 769 | | | $ | 517 | | | $ | 1,180 | | | $ | 1,180 | | | $ | 1,080 | | | $ | 1,949 | | | $ | 1,949 | | | $ | 1,597 | |
| Provision for credit losses | | | 455 | | | | 820 | | | | 880 | | | | — | | | | — | | | | 100 | | | | 455 | | | | 820 | | | | 980 | |
| Recoveries | | | 88 | | | | 68 | | | | 40 | | | | — | | | | — | | | | — | | | | 88 | | | | 68 | | | | 40 | |
| Write-offs | | | (566 | ) | | | (884 | ) | | | (698 | ) | | | — | | | | — | | | | — | | | | (566 | ) | | | (884 | ) | | | (698 | ) |
| Foreign exchange and other | | | (135 | ) | | | (4 | ) | | | 30 | | | | — | | | | — | | | | — | | | | (135 | ) | | | (4 | ) | | | 30 | |
| | | |
| | | |
| | | |
| | | |
| | | |
| | | |
| | | |
| | | |
| | | |
| |
| Balance at end of year | | $ | 611 | | | $ | 769 | | | $ | 769 | | | $ | 1,180 | | | $ | 1,180 | | | $ | 1,180 | | | $ | 1,791 | | | $ | 1,949 | | | $ | 1,949 | |
| | | |
| | | |
| | | |
| | | |
| | | |
| | | |
| | | |
| | | |
| | | |
| |
| Comprised of: Loans | | $ | 605 | | | $ | 769 | | | $ | 769 | | | $ | 1,180 | | | $ | 1,180 | | | $ | 1,180 | | | $ | 1,785 | | | $ | 1,949 | | | $ | 1,949 | |
| Other credit instruments | | | 6 | | | | — | | | | — | | | | — | | | | — | | | | — | | | | 6 | | | | — | | | | — | |
| | | |
| | | |
| | | |
| | | |
| | | |
| | | |
| | | |
| | | |
| | | |
| |
Note 5 Other Credit Instruments
We use other off-balance sheet credit instruments as a method of meeting the financial needs of our customers. Summarized below are the types of instruments that we use:
| • | | Standby letters of credit and guarantees represent our obligation to make payments to third parties on behalf of our customers if our customers are unable to make the required payments or meet other contractual requirements; |
| • | | Securities lending represents our credit exposure when we lend our securities, or our customers’ securities, to third parties should the securities borrower default on their redelivery obligation; |
| • | | Documentary and commercial letters of credit represent our agreement to honour drafts presented by a third party upon completion of specific activities; and |
| • | | Commitments to extend credit represent our commitment to our customers to grant them credit in the form of loans or other financings for specific amounts and maturities, subject to meeting certain conditions. |
The contractual amount of our other credit instruments represents the maximum undiscounted potential credit risk if the counterparty does not perform according to the terms of the contract before any amounts that could possibly be recovered under recourse or collateralization provisions. A large majority of these commitments expire without being drawn upon. As a result, the total contractual amounts are not representative of our likely credit exposure or liquidity requirements for these commitments.
The risk-weighted equivalent values of our other credit instruments are determined based on the rules for capital adequacy of the Superintendent of Financial Institutions Canada. The risk-weighted equivalent value is used in the ongoing assessment of our capital adequacy ratios.
Summarized information related to various commitments is as follows:
| | | | | | | | | | | | | | | | | | |
| (Canadian $ in millions) | | 2003 | | 2002 |
| |
| |
|
| | | Contract | | Risk-weighted | | Contract | | Risk-weighted |
| | | amount | | equivalent | | amount | | equivalent |
| | |
| |
| |
| |
|
Credit Instruments | | | | | | | | | | | | | | | | |
| Standby letters of credit and guarantees | | $ | 11,170 | | | $ | 7,666 | | | $ | 11,902 | | | $ | 8,251 | |
| Securities lending | | | 553 | | | | 37 | | | | 580 | | | | 38 | |
| Documentary and commercial letters of credit | | | 714 | | | | 74 | | | | 642 | | | | 84 | |
| Commitments to extend credit | | | | | | | | | | | | | | | | |
| | Original maturity of one year and under | | | 67,200 | | | | — | | | | 72,723 | | | | — | |
| | Original maturity of over one year | | | 21,655 | | | | 10,596 | | | | 21,765 | | | | 9,787 | |
| | | |
| | | |
| | | |
| | | |
| |
| Total | | $ | 101,292 | | | $ | 18,373 | | | $ | 107,612 | | | $ | 18,160 | |
| | | |
| | | |
| | | |
| | | |
| |
Commitments to extend credit in respect of consumer instalment and credit card loans are excluded as the lines are revocable at our discretion.
Note 6 Guarantees
Guarantees include contracts where we may be required to make payments to a counterparty, based on changes in the value of an asset, liability or equity security that the counterparty holds. In addition, contracts under which we may be required to make payments if a third party fails to perform under the terms of a contract and contracts under which we provide indirect guarantees of the indebtedness of another party are considered guarantees.
In the normal course of business we enter into a variety of guarantees, the most significant of which are as follows:
Standby Letters of Credit and Guarantees
Standby letters of credit and guarantees, as discussed in Note 5, are considered guarantees. The maximum amount payable under standby letters of credit and guarantees was $11,170 million as at October 31, 2003. Collateral requirements for standby letters of credit and guarantees are consistent with our collateral requirements for loans. In most cases, these commitments expire within three years without being drawn upon. No amount has been included in our Consolidated Balance Sheet as at October 31, 2003 related to these standby letters of credit and guarantees.
Commitments to Extend Credit
Commitments to extend credit, as discussed in Note 5, include backstop liquidity facilities. Backstop liquidity facilities are provided to asset-backed commercial paper programs administered by us and third parties, as an alternative source of financing in the event that such programs are unable to access commercial paper markets or, in limited circumstances, when predetermined performance measures of the financial assets owned by these programs are not met. The terms of the backstop liquidity facilities do not require us to advance money to these programs in the event of bankruptcy. The maximum potential payments under these backstop liquidity facilities were $36,560 million as at October 31, 2003. The facilities’ terms can be several years, but are generally no longer than one
78 BMO FINANCIAL GROUP 186TH ANNUAL REPORT 2003
Notes to Consolidated Financial Statements
year. None of the backstop liquidity facilities that we have provided have been drawn upon. No amount has been included in our Consolidated Balance Sheet as at October 31, 2003 related to these facilities.
Credit Enhancement
Credit enhancement protects investors in asset-backed commercial paper in the event that the conduit’s cash flows are insufficient to retire its commercial paper notes upon maturity. The amount and type of credit enhancement support may come from various parties, including the entity from which the assets were purchased and other acceptable providers. Each transaction within a conduit is structured with credit enhancement so that the commercial paper program will receive an investment grade rating. Where warranted, we provide partial credit enhancement facilities to transactions within asset-backed commercial paper programs administered by us to ensure a high investment grade credit rating is achieved for notes issued by the programs. These facilities can take the form of either program level letters of credit ($240 million is included in standby letters of credit and guarantees as at October 31, 2003) or backstop liquidity facilities ($996 million is included in commitments to extend credit as at October 31, 2003). The terms of these facilities are between one and three years. None of the credit enhancement facilities that we have provided have been drawn upon. No amount has been included in our Consolidated Balance Sheet as at October 31, 2003 related to these facilities.
Derivatives
Certain of our derivative instruments meet the accounting definition of a guarantee when we believe they are related to an asset, liability or equity security held by the guaranteed party at the inception of a contract.
Written credit default swaps require us to compensate a counterparty following the occurrence of a credit event in relation to a specified reference obligation, such as a bond or a loan. The maximum amount payable under credit default swaps is equal to their notional amount of $5,282 million as at October 31, 2003. The fair value of the related derivative liability as at October 31, 2003 was less than $1 million and was included in derivative financial instruments in our Consolidated Balance Sheet.
Written options include contractual agreements that convey to the purchaser the right, but not the obligation, to require us to buy a specific amount of a currency, commodity or equity at a fixed price, either at a fixed future date or at any time within a fixed future period. The maximum amount payable under these written options is equal to their notional amount of $3,941 million as at October 31, 2003. The fair value of the related derivative liability as at October 31, 2003 was $132 million and was included in derivative financial instruments in our Consolidated Balance Sheet.
Written options also include contractual agreements where we agree to pay the purchaser, based on a specified notional amount, the difference between the market interest rate and the strike price of the instrument. The maximum amount payable under these contracts is not determinable due to their nature. The fair value of the related derivative liability as at October 31, 2003 was $56 million and was included in derivative financial instruments in our Consolidated Balance Sheet.
In order to reduce our exposure to these derivatives, we enter into contracts that hedge the related risk.
Indemnification Agreements
In the normal course of operations, we enter into various agreements that provide general indemnifications. These indemnifications typically occur in connection with sales of assets, securities offerings, service contracts, membership agreements, clearing arrangements and leasing transactions. These indemnifications require us, in certain circumstances, to compensate the counterparties for various costs resulting from breaches of representations or obligations under such arrangements, or as a result of third-party claims that may be suffered by the counterparty as a consequence of the transaction. We also indemnify directors and officers, to the extent permitted by law, against certain claims that may be made against them as a result of their being, or having been, directors or officers at the request of the Bank. The terms of these indemnifications vary based on the contract, the nature of which prevents us from making a reasonable estimate of the maximum potential amount we could be required to pay to counterparties. We believe that the likelihood that we could incur significant liability under these obligations is remote. Historically, we have not made any significant payments under such indemnifications. No amount has been included in our Consolidated Balance Sheet as at October 31, 2003 related to these indemnifications.
Note 7 Asset Securitization
Periodically, we securitize loans for capital management purposes or to obtain alternate sources of funding. Securitization involves selling loans to off-balance sheet entities or trusts (securitization vehicles), which buy the loans and then issue interest bearing investor certificates.
Contracts with the securitization vehicles provide for the payment to us over time of the excess of the sum of interest and fees collected from customers, in connection with the loans that were sold, over the yield paid to investors in the securitization vehicle, less credit losses and other costs (the deferred purchase price).
When the loans are considered sold for accounting purposes, we remove them from our Consolidated Balance Sheet.
For transfers that have occurred since July 1, 2001, we account for them as sales when control over the assets is given up. We recognize securitization revenues at the time of the sale, based on our best estimate of the net present value of expected future cash flows, primarily the deferred purchase price, net of our estimate of the fair value of any servicing obligations undertaken. The deferred purchase price is recorded in our Consolidated Balance Sheet in other assets. A servicing liability is recognized only for securitizations where we do not receive compensation for servicing the transferred loans. A servicing liability is recognized in securitization revenues over the term of the transferred loan.
For all transfers prior to July 1, 2001, except the securitization of National Housing Act (“NHA”) insured mortgages, we accounted for those securitization transactions as sales when the significant risks and rewards of ownership of the loans had been transferred. For those transfers, we record securitization revenues over the life of the securitization as the deferred purchase price becomes legally payable to us. For transfers of NHA-insured mortgages, we recorded a gain or loss in securitization revenues at the date of sale, based on the estimated net present value of the deferred purchase price at that time.
For some of our securitizations, we are required to purchase subordinated interests or maintain cash amounts deposited with the securitization vehicle. This provides the securitization vehicle with a source of funds in the event that the sum of interest and fees collected on the loans is not sufficient to pay the interest owed to investors. We record these amounts in other assets in our Consolidated Balance Sheet. These interests represent our maximum exposure with respect to these securitizations. Investors have no further recourse against us in the event that cash flows from the transferred loans are inadequate to service the interest bearing investor certificates.
On a quarterly basis, we compare the carrying value of assets on our Consolidated Balance Sheet arising from our securitizations to their fair value, determined based on discounted cash flows. When we identify a decline in value, the affected carrying amount is written down to its fair value. Any write-down is recorded in our Consolidated Statement of Income as a reduction of securitization revenues.
BMO FINANCIAL GROUP 186TH ANNUAL REPORT 2003 79
Notes to Consolidated Financial Statements
The impact of securitizations on our Consolidated Statement of Income for the years ended October 31 is as follows:
| | | | | | | | | | | | | | | | | | | | | | | | | | | | | | | | | | | | | | | | | | | | | | | | | | | | | | | | | | | | | |
| | | | | | | | | | | | | | | Consumer instalment | | | | | | | | | | | | | | Business and | | |
| (Canadian $ in millions) | | Residential mortgages | | and other personal loans | | Credit card loans | | government loans | | Total |
| |
| |
| |
| |
| |
|
| | | 2003 | | 2002 | | 2001 | | 2003 | | 2002 | | 2001 | | 2003 | | 2002 | | 2001 | | 2003 | | 2002 | | 2001 | | 2003 | | 2002 | | 2001 |
| | |
| |
| |
| |
| |
| |
| |
| |
| |
| |
| |
| |
| |
| |
| |
|
| Gains on sales of loans | | $ | 39 | | | $ | 37 | | | $ | 38 | | | $ | 1 | | | $ | 14 | | | $ | 5 | | | $ | 117 | | | $ | 117 | | | $ | 39 | | | $ | — | | | $ | — | | | $ | — | | | $ | 157 | | | $ | 168 | | | $ | 82 | |
| Other securitization revenue | | | 14 | | | | 37 | | | | 58 | | | | 20 | | | | 10 | | | | — | | | | 43 | | | | 70 | | | | 172 | | | | — | | | | 39 | | | | 19 | | | | 77 | | | | 156 | | | | 249 | |
| Amortization of servicing liability | | | 10 | | | | 5 | | | | — | | | | — | | | | — | | | | — | | | | — | | | | — | | | | — | | | | — | | | | — | | | | — | | | | 10 | | | | 5 | | | | — | |
| | | |
| | | |
| | | |
| | | |
| | | |
| | | |
| | | |
| | | |
| | | |
| | | |
| | | |
| | | |
| | | |
| | | |
| | | |
| |
| Total | | $ | 63 | | | $ | 79 | | | $ | 96 | | | $ | 21 | | | $ | 24 | | | $ | 5 | | | $ | 160 | | | $ | 187 | | | $ | 211 | | | $ | — | | | $ | 39 | | | $ | 19 | | | $ | 244 | | | $ | 329 | | | $ | 331 | |
| | | |
| | | |
| | | |
| | | |
| | | |
| | | |
| | | |
| | | |
| | | |
| | | |
| | | |
| | | |
| | | |
| | | |
| | | |
| |
Cash flows received from securitization vehicles for the years ended October 31 are as follows:
| | | | | | | | | | | | | | | | | | | | | | | | | | | | | | | | | | | | | | | | | | | | | | | | | |
| | | | | | | | | | | | | | | Consumer instalment | | | | | | | | | | | | | | Business and |
| (Canadian $ in millions) | | Residential mortgages | | and other personal loans | | Credit card loans | | government loans |
| |
| |
| |
| |
|
| | | 2003 | | 2002 | | 2001 | | 2003 | | 2002 | | 2001 | | 2003 | | 2002 | | 2001 | | 2003 | | 2002 | | 2001 |
| | |
| |
| |
| |
| |
| |
| |
| |
| |
| |
| |
| |
|
| Proceeds from new securitizations | | $ | — | | | $ | — | | | $ | 1,197 | | | $ | — | | | $ | 519 | | | $ | 1,037 | | | $ | — | | | $ | — | | | $ | — | | | $ | — | | | $ | — | | | $ | — | |
| Proceeds from loans sold to revolving securitization vehicles | | | 2,662 | | | | 2,737 | | | | 2,117 | | | | 59 | | | | — | | | | — | | | | 7,351 | | | | 10,795 | | | | 11,549 | | | | — | | | | — | | | | — | |
| Servicing fees collected | | | 9 | | | | 3 | | | | 6 | | | | — | | | | — | | | | 1 | | | | 32 | | | | 47 | | | | 50 | | | | — | | | | — | | | | 2 | |
| Receipt of deferred purchase price | | | 80 | | | | 92 | | | | 83 | | | | 18 | | | | 10 | | | | — | | | | 138 | | | | 134 | | | | 136 | | | | — | | | | — | | | | 37 | |
| | | |
| | | |
| | | |
| | | |
| | | |
| | | |
| | | |
| | | |
| | | |
| | | |
| | | |
| | | |
| |
The impact of securitizations on our Consolidated Balance Sheet as at October 31 is as follows:
| | | | | | | | | | | | | | | | | | | | | | | | | | | | | | | | | | |
| | | | Residential | | Consumer instalment | | | | | | | | | | Business and |
| (Canadian $ in millions) | | mortgages | | and other personal loans | | Credit card loans | | government loans |
| |
| |
| |
| |
|
| | | 2003 | | 2002 | | 2003 | | 2002 | | 2003 | | 2002 | | 2003 | | 2002 |
| | |
| |
| |
| |
| |
| |
| |
| |
|
| Retained interests | | | | | | | | | | | | | | | | | | | | | | | | | | | | | | | | |
| | Investment in securitization vehicles | | $ | — | | | $ | — | | | $ | 45 | | | $ | 56 | | | $ | — | | | $ | — | | | $ | — | | | $ | — | |
| | Deferred purchase price | | | 102 | | | | 117 | | | | 5 | | | | 7 | | | | 14 | | | | 25 | | | | — | | | | — | |
| | Cash deposits with securitization vehicles | | | 12 | | | | 11 | | | | — | | | | — | | | | — | | | | — | | | | — | | | | 170 | |
| Servicing liability | | | 21 | | | | 14 | | | | — | | | | — | | | | — | | | | — | | | | — | | | | — | |
| | | |
| | | |
| | | |
| | | |
| | | |
| | | |
| | | |
| | | |
| |
Credit information related to our securitized loans is as follows:
| | | | | | | | | | | | | | | | | |
| (Canadian $ in millions) | | 2003 | | 2002 |
| |
| |
|
| | | Securitized | | Credit | | Securitized | | Credit |
| | | loans | | losses | | loans | | losses |
| | |
| |
| |
| |
|
| Residential mortgages | | $ | 6,066 | | | $ | 1 | | | $ | 7,241 | | | $ | — | |
| Consumer instalment and other personal loans | | | 960 | | | | 7 | | | | 1,271 | | | | 4 | |
| Credit card loans | | | 1,450 | | | | 34 | | | | 1,950 | | | | 53 | |
| Business and government loans | | | — | | | | — | | | | 402 | | | | 70 | |
| | | |
| | | |
| | | |
| | | |
| |
| Total | | $ | 8,476 | | | $ | 42 | | | $ | 10,864 | | | $ | 127 | |
| | | |
| | | |
| | | |
| | | |
| |
Our credit exposure to securitized assets as at October 31, 2003 was limited to our deferred purchase price of $121 million ($149 million in 2002), certain cash deposits of $12 million ($93 million in 2002) and investments in securitization vehicles of $45 million ($56 million in 2002).
Static pool credit losses provide a measure of the credit risk in our securitized assets. They are calculated by totalling actual and projected future credit losses and dividing the result by the original balance of each pool of assets. Static pool credit losses for the years ended October 31 are as follows:
| | | | | | | | | |
| Static Pool Credit Losses | | 2003 | | 2002 |
| |
| |
|
| Residential mortgages | | | — | | | | — | |
| Consumer instalment and other personal loans | | | 1.30% | | | | 2.19% | |
| Credit card loans | | | 2.65% | | | | 3.74% | |
| Business and government loans | | | — | | | | 2.50% | |
| | | |
| | | |
| |
The following table outlines the key economic assumptions used in measuring the deferred purchase price and the sensitivity of the current value of the deferred purchase price as at October 31, 2003 to immediate 10% and 20% adverse changes in those assumptions. The sensitivity analysis should be used with caution as it is hypothetical and changes in each key assumption may not be linear. The sensitivities in each key variable have been calculated independently of changes in the other key variables. Actual experience may result in changes in a number of key assumptions simultaneously. Changes in one factor may result in changes in another, which could amplify or reduce certain sensitivities.
| | | | | | | | | | | | | | | |
| | | | | Residential | | Consumer instalment | | Credit card |
| (Canadian $ in millions, except as noted) | | mortgages | | and other personal loans | | loans |
| |
| |
| |
|
| Deferred purchase price | | | $102 | | | | $5 | | | | $14 | |
| | | |
| | | |
| | | |
| |
| Weighted-average life (in years) | | | 2.72 | | | | 1.49 | | | | 0.16 | |
| Prepayment rate (%) | | | 16.22-21.35 | | | | 5.0-8.0 | | | | 33.0 | |
| | Impact of: 10% adverse change | | | $2.0-$0.6 | | | | $0.1 | | | | $0.04 | |
| | | 20% adverse change | | | $3.9-$1.2 | | | | $0.2 | | | | $0.09 | |
| | | |
| | | |
| | | |
| |
| Interest rate (%) | | | 0.74-2.32 | | | | 1.81-3.17 | | | | 8.78 | |
| | Impact of: 10% adverse change | | | $12.1-$3.1 | | | | $0.7 | | | | $1.5 | |
| | | 20% adverse change | | | $24.3-$6.2 | | | | $1.4 | | | | $3.0 | |
| | | |
| | | |
| | | |
| |
| Expected credit losses (%) | | | — | | | | 1.25-1.50 | | | | 2.47 | |
| | Impact of: 10% adverse change | | | $— | | | | $0.7 | | | | $0.5 | |
| | | 20% adverse change | | | $— | | | | $1.5 | | | | $0.9 | |
| | | |
| | | |
| | | |
| |
| Discount rate (%) | | | 3.20-11.79 | | | | 11.90-13.73 | | | | 11.79 | |
| | Impact of: 10% adverse change | | | $1.2-$0.1 | | | | $0.1 | | | | $— | |
| | | 20% adverse change | | | $2.4-$0.2 | | | | $0.1 | | | | $0.1 | |
| | | |
| | | |
| | | |
| |
80 BMO FINANCIAL GROUP 186TH ANNUAL REPORT 2003
Notes to Consolidated Financial Statements
Note 8 Variable Interest Entities (formerly Off-Balance Sheet Special-Purpose Entities)
Future Change in Accounting Policy
The Canadian Institute of Chartered Accountants (“CICA”) has issued a guideline on the consolidation of variable interest entities (“VIEs”). VIEs include entities where the equity invested is considered insufficient in relation to the expected variability in the operating results and fair value of the entity. Under this new guideline, we must consolidate these VIEs if the investments we hold in these entities and/or the relationships we have with them result in us being exposed to a majority of their expected losses, being able to benefit from a majority of their expected residual returns, or both, based on a calculation determined by the standard setters. Due to a deferral of the application date by the CICA, we will apply the new guideline to existing VIEs beginning on November 1, 2004 (rather than on February 1, 2004, as previously expected). The CICA is currently considering whether mutual funds and personal trusts should be considered VIEs. Our preliminary evaluation of the impact of applying the new guideline and our maximum exposure to VIEs are as follows:
Bank Securitization Vehicles
We securitize our loans either for capital management purposes or to obtain alternate sources of funding. Our maximum exposure to loss as at October 31, 2003 related to Bank securitization vehicles included cash deposits with these vehicles of $12 million and the total deferred purchase price of $116 million. We currently expect that these entities will not be consolidated when we adopt the new guideline. More information on these vehicles can be found in Note 7.
Customer Securitization Vehicles
Customer securitization vehicles (referred to as multi-seller conduits) assist our customers with the securitization of their assets to provide them with alternate sources of funding. These vehicles provide clients with access to liquidity in the commercial paper markets by allowing them to sell their assets into these vehicles, which then issue commercial paper to investors to fund the purchases. The sellers continue to service the transferred assets and absorb the first losses on the assets. We earn fees for providing structuring advice related to the securitizations as well as administrative fees for supporting the ongoing operations of these customer securitization vehicles. We currently expect that a majority of our customer securitization vehicles will be restructured prior to November 1, 2004 and therefore will not be consolidated.
We also provide credit support to these vehicles either through backstop liquidity facilities or in the form of letters of credit and other guarantees. Our maximum exposure to credit loss related to these vehicles was $390 million as at October 31, 2003.
Credit Investment Management Vehicles
Credit investment management vehicles provide investors with customized, diversified debt portfolios in a variety of asset and rating classes. We earn investment management fees for managing these portfolios. We have two types of credit investment management vehicles: our High Yield Collateralized Bond Obligation Vehicles (“CBOs”) and our High Grade Structured Investment Vehicles (“SIVs”). We are currently assessing which of these VIEs would meet the requirement for consolidation; we expect that certain of these VIEs will be restructured prior to November 1, 2004 and therefore will not be consolidated.
Our maximum exposure to loss relates to our investments to sponsor these vehicles. Our investments in CBOs were written off during the year ended October 31, 2002. Our investment in SIVs was $97 million as at October 31, 2003 ($109 million as at October 31, 2002). The change in our investment is due to the change in foreign exchange rates. These amounts are recorded as investment securities in our Consolidated Balance Sheet.
Total assets of these potential VIEs as at October 31, 2003 are as follows:
| | | | | | | | | | |
| (Canadian $ in millions) | | 2003 | | 2002 |
| |
| |
|
| Bank securitization vehicles | | $ | 7,516 | | | $ | 9,091 | |
| Customer securitization vehicles | | | 22,094 | | | | 23,163 | |
| Credit investment management vehicles | | | | | | | | |
| | SIVs | | | 17,651 | | | | 16,539 | |
| | CBOs | | | 2,156 | | | | 3,397 | |
| | | |
| | | |
| |
| Total | | $ | 49,417 | | | $ | 52,190 | |
| | | |
| | | |
| |
Included in customer securitization vehicles are Bank assets of $960 million ($1,773 million in 2002).
Compensation Trusts
We have established a trust in order to administer our employee share ownership plan. Under this plan, we match 50% of employees’ contributions when they choose to contribute a portion of their gross salary toward the purchase of our common shares. Our matching contributions are paid into trusts, which purchase our shares on the open market, for payment to employees once employees are entitled to the shares under the terms of the plan. We may be required to consolidate these trusts. However, such consolidation is not expected to have a significant impact on our consolidated financial statements, since the shares held in the trust and the related obligation to employees are expected to offset each other within shareholders’ equity in our Consolidated Balance Sheet.
Other VIEs
We are involved with other entities that may potentially be VIEs. These include investment vehicles and merchant banking investments. We continue to evaluate our involvement with potential VIEs and monitor developments which affect our current interpretation of the new guideline.
BMO FINANCIAL GROUP 186TH ANNUAL REPORT 2003 81
Notes to Consolidated Financial Statements
Note 9 Derivative Financial Instruments
Derivative financial instruments are contracts that require the exchange of, or provide the opportunity to exchange, cash flows determined by applying certain rates, indices or changes therein to notional contract amounts. Derivative transactions are conducted either directly between two counterparties in the over-the-counter market, or on regulated exchange markets.
Types of Derivatives
Swaps
Swaps are contractual agreements between two parties to exchange a series of cash flows. The various swap agreements that we enter into are as follows:
Interest rate swaps — counterparties generally exchange fixed and floating rate interest payments based on a notional value in a single currency.
Cross-currency swaps — fixed interest payments and principal amounts are exchanged in different currencies.
Cross-currency interest rate swaps — fixed and floating rate interest payments and principal amounts are exchanged in different currencies.
Commodity swaps — counterparties generally exchange fixed and floating rate payments based on a notional value in a single commodity.
Equity swaps — counterparties exchange the return on an equity security or group of equity securities.
Credit default swaps — one counterparty pays the other a fee in exchange for that other counterparty making a payment if a credit event occurs, such as bankruptcy or credit rating change.
The main risks associated with these instruments are the exposure to movements in interest rates, foreign exchange rates, credit ratings and securities or commodities prices, as applicable, and the ability of counterparties to meet the terms of the contracts.
Forwards and Futures
Forwards and futures are contractual agreements to either buy or sell a specified amount of a currency, commodity or security at a specific price and date in the future. Forwards are customized contracts transacted in the over-the-counter market. Futures are transacted in standardized amounts on regulated exchanges and are subject to daily cash margining.
Risks arise from the possible inability of over-the-counter counterparties to meet the terms of their contracts and from movements in commodities prices, securities values, interest rates and foreign exchange rates.
Options
Options are contractual agreements that convey to the buyer the right but not the obligation to either buy or sell a specified amount of a currency, commodity or security at a fixed future date or at any time within a fixed future period.
For options written by us, we receive a premium from the purchaser for accepting market risk.
For options purchased by us, a premium is paid for the right to exercise the option. Since we have no obligation to exercise the option, our primary exposure to risk is the potential credit risk if the writer of over-the-counter contracts fails to fulfill the conditions of the contract.
Caps, collars and floors are specialized types of written and purchased options. They are contractual agreements where the writer agrees to pay the purchaser, based on a specified notional amount, the agreed upon difference between the market rate and the prescribed rate of the cap, collar or floor. The writer receives a premium for selling this instrument.
Uses of Derivatives
Trading Derivatives
Trading derivatives are derivatives entered into with customers to accommodate their risk management needs, derivatives transacted to generate trading income from the Bank’s own proprietary trading positions and derivatives that do not qualify as hedges for accounting purposes.
We structure and market derivative products to customers to enable them to transfer, modify or reduce current or expected risks.
Proprietary activities include market-making, positioning and arbitrage activities. Market-making involves quoting bid and offer prices to other market participants with the intention of generating revenues based on spread and volume. Positioning activities involve managing market risk positions with the expectation of profiting from favourable movements in prices, rates or indices. Arbitrage activities involve identifying and profiting from price differentials between markets and products.
We may also take proprietary trading positions in various capital markets instruments and derivatives that, taken together, are designed to profit from anticipated changes in market factors.
Trading derivatives are marked to market. Realized and unrealized gains and losses are recorded in trading revenues. A portion of the income derived from marking derivatives to market reflects credit, model and liquidity risks, as well as administrative costs. An estimate of this amount is deferred and recognized in trading revenues over the term of the derivative contract. Unrealized gains on trading derivatives are recorded in our derivative financial instrument asset and unrealized losses are recorded in our derivative financial instrument liability.
The revenue generated by trading derivatives is included in trading revenue, details of which are provided on page 24 of our Management’s Discussion and Analysis.
Hedging Derivatives
In accordance with our risk management strategy, we enter into various derivative contracts to hedge our interest rate and foreign currency exposures.
In order for a derivative to qualify as a hedge, the hedge relationship must be designated and formally documented at its inception, detailing the particular risk management objective and strategy for the hedge and the specific asset, liability or cash flow being hedged, as well as how effectiveness is being assessed. Changes in the fair value of the derivative must be highly effective in offsetting either changes in the fair value of on-balance sheet items or changes in the amount of future cash flows. Hedge effectiveness is evaluated at the inception of the hedge relationship and on an ongoing basis, both retrospectively and prospectively, using quantitative statistical measures of correlation. If a hedge relationship is found to be no longer effective, the derivative is no longer designated as a hedge; if the designated hedged item matures or is sold, extinguished or terminated, the derivative is reclassified as trading. Subsequent changes in the fair value of hedging derivatives reclassified as trading are reported in trading revenues.
Risks Hedged
Interest Rate Risk
We manage interest rate risk through interest rate swaps and options, which are linked to and adjust the interest rate sensitivity of a specific asset, liability, firm commitment or a specific pool of transactions with similar risk characteristics.
Fair value hedges modify exposure to changes in a fixed rate instrument’s fair value caused by changes in interest rates. These hedges convert fixed rate assets and liabilities to floating rate. Our fair value hedges include hedges of fixed rate loans, securities, deposits and subordinated debt.
82 BMO FINANCIAL GROUP 186TH ANNUAL REPORT 2003
Notes to Consolidated Financial Statements
Cash flow hedges modify exposure to variability in cash flows for variable rate interest bearing instruments. Our cash flow hedges, which have a maximum term of 11 years, are primarily hedges of floating rate deposits as well as commercial and personal loans.
Swaps and options that qualify for hedge accounting are accounted for on an accrual basis. Interest income received and interest expense paid on interest rate swaps are accrued as an adjustment to the yield of the item being hedged over the term of the hedge contract. Premiums paid on purchased options are amortized to interest expense over the term of the contract. Accrued interest receivable and payable and deferred gains and losses are recorded in our derivative financial instrument asset or liability, as appropriate. Realized gains and losses from the settlement or early termination of hedge contracts or a hedging relationship are deferred and amortized over the remaining original life of the hedged item.
Foreign Currency Risk
We manage foreign currency risk through cross-currency swaps. Cross-currency swaps are marked to market with realized and unrealized gains and losses recorded in non-interest revenue, consistent with the accounting treatment for gains and losses on the hedged item.
We also periodically hedge U.S. dollar earnings through forward foreign exchange contracts to minimize fluctuations in U.S. dollar earnings. These contracts are marked to market, with realized gains and losses recorded as non-interest revenue in foreign exchange, other than trading.
Change in Accounting Policy
On November 1, 2002, we adopted the Canadian Institute of Chartered Accountants’ new accounting requirements for derivatives under which all derivatives are marked to market unless they meet the criteria for hedging. There is no impact on our results for the year ended October 31, 2003, as we changed our hedge criteria for derivatives when the equivalent requirements were implemented under United States GAAP on November 1, 2000.
Fair Value
Fair value represents point-in-time estimates that may change in subsequent reporting periods due to market conditions or other factors. Fair value for exchange-traded derivatives is considered to be quoted market rates. Fair value for over-the-counter derivatives is determined using zero coupon valuation techniques. Zero coupon curves are created using generally accepted valuation techniques from underlying instruments such as cash, bonds, futures and off-balance sheet prices observable in the market. Option implied volatilities, an input into the valuation model, are either obtained directly from market sources or calculated from market prices.
Fair values of our derivative financial instruments are as follows:
| | | | | | | | | | | | | | | | | | | | | | | | | | | | | | | | | | | | | | | | | |
| (Canadian $ in millions) | | 2003 | | 2002 |
| |
| |
|
| | | Trading | | Hedging | | Total | | Trading | | Hedging | | Total |
| | |
| |
| |
| |
| |
| |
|
| | | Gross | | Gross | | | | | | Gross | | Gross | | | | | | | | | | |
| | | assets | | liabilities | | Net | | assets | | liabilities | | Net | | Net | | Net | | Net | | Net |
| | |
| |
| |
| |
| |
| |
| |
| |
| |
| |
|
Interest Rate Contracts | | | | | | | | | | | | | | | | | | | | | | | | | | | | | | | | | | | | | | | | |
| Swaps | | $ | 11,491 | | | $ | (11,131 | ) | | $ | 360 | | | $ | 640 | | | $ | (372 | ) | | $ | 268 | | | $ | 628 | | | $ | 17 | | | $ | 348 | | | $ | 365 | |
| Forward rate agreements | | | 96 | | | | (84 | ) | | | 12 | | | | 3 | | | | (3 | ) | | | — | | | | 12 | | | | (79 | ) | | | — | | | | (79 | ) |
| Futures | | | 13 | | | | (6 | ) | | | 7 | | | | — | | | | — | | | | — | | | | 7 | | | | 15 | | | | — | | | | 15 | |
| Purchased options | | | 1,890 | | | | — | | | | 1,890 | | | | 16 | | | | — | | | | 16 | | | | 1,906 | | | | 2,515 | | | | 4 | | | | 2,519 | |
| Written options | | | — | | | | (1,694 | ) | | | (1,694 | ) | | | — | | | | — | | | | — | | | | (1,694 | ) | | | (2,138 | ) | | | — | | | | (2,138 | ) |
Foreign Exchange Contracts | | | | | | | | | | | | | | | | | | | | | | | | | | | | | | | | | | | | | | | | |
| Cross-currency swaps | | | 517 | | | | (343 | ) | | | 174 | | | | — | | | | — | | | | — | | | | 174 | | | | (117 | ) | | | — | | | | (117 | ) |
| Cross-currency interest rate swaps | | | 2,392 | | | | (1,778 | ) | | | 614 | | | | 168 | | | | (255 | ) | | | (87 | ) | | | 527 | | | | (144 | ) | | | (93 | ) | | | (237 | ) |
| Forward foreign exchange contracts | | | 2,278 | | | | (2,811 | ) | | | (533 | ) | | | 32 | | | | (35 | ) | | | (3 | ) | | | (536 | ) | | | (247 | ) | | | (10 | ) | | | (257 | ) |
| Purchased options | | | 486 | | | | — | | | | 486 | | | | — | | | | — | | | | — | | | | 486 | | | | 801 | | | | — | | | | 801 | |
| Written options | | | — | | | | (434 | ) | | | (434 | ) | | | — | | | | — | | | | — | | | | (434 | ) | | | (773 | ) | | | — | | | | (773 | ) |
Commodity Contracts | | | | | | | | | | | | | | | | | | | | | | | | | | | | | | | | | | | | | | | | |
| Swaps | | | 988 | | | | (1,028 | ) | | | (40 | ) | | | — | | | | — | | | | — | | | | (40 | ) | | | (88 | ) | | | — | | | | (88 | ) |
| Purchased options | | | 473 | | | | — | | | | 473 | | | | — | | | | — | | | | — | | | | 473 | | | | 820 | | | | — | | | | 820 | |
| Written options | | | — | | | | (476 | ) | | | (476 | ) | | | — | | | | — | | | | — | | | | (476 | ) | | | (776 | ) | | | — | | | | (776 | ) |
Equity Contracts | | | 222 | | | | (555 | ) | | | (333 | ) | | | 26 | | | | — | | | | 26 | | | | (307 | ) | | | 168 | | | | 13 | | | | 181 | |
Credit Contracts | | | 32 | | | | (35 | ) | | | (3 | ) | | | — | | | | — | | | | — | | | | (3 | ) | | | — | | | | — | | | | — | |
| | | |
| | | |
| | | |
| | | |
| | | |
| | | |
| | | |
| | | |
| | | |
| | | |
| |
| Total fair value | | $ | 20,878 | | | $ | (20,375 | ) | | $ | 503 | | | $ | 885 | | | $ | (665 | ) | | $ | 220 | | | $ | 723 | | | $ | (26 | ) | | $ | 262 | | | $ | 236 | |
| | | |
| | | |
| | | |
| | | |
| | | |
| | | |
| | | |
| | | |
| | | |
| | | |
| |
| Total book value | | $ | 20,878 | | | $ | (20,375 | ) | | $ | 503 | | | $ | 338 | | | $ | (340 | ) | | $ | (2 | ) | | $ | 501 | | | $ | (26 | ) | | $ | 8 | | | $ | (18 | ) |
| | | |
| | | |
| | | |
| | | |
| | | |
| | | |
| | | |
| | | |
| | | |
| | | |
| |
| Average fair value (1) | | $ | 22,789 | | | $ | (22,389 | ) | | $ | 400 | | | $ | 849 | | | $ | (677 | ) | | $ | 172 | | | $ | 572 | | | $ | (258 | ) | | $ | 131 | | | $ | (127 | ) |
| | | |
| | | |
| | | |
| | | |
| | | |
| | | |
| | | |
| | | |
| | | |
| | | |
| |
| (1) | | Average fair value amounts are calculated using a five-quarter rolling average. |
Assets are shown net of liabilities to customers where we have an enforceable right to offset amounts and we intend to settle contracts on a net basis.
Derivative financial instruments recorded in our Consolidated Balance Sheet are comprised as follows:
| | | | | | | | | | | | | | | | | |
| (Canadian $ in millions) | | Assets | | Liabilities |
| |
| |
|
| | | 2003 | | 2002 | | 2003 | | 2002 |
| | |
| |
| |
| |
|
| Fair value of trading derivatives | | $ | 20,878 | | | $ | 21,932 | | | $ | 20,375 | | | $ | 21,927 | |
| Book value of hedging derivatives | | | 338 | | | | 176 | | | | 340 | | | | 168 | |
| | | |
| | | |
| | | |
| | | |
| |
| Total | | $ | 21,216 | | | $ | 22,108 | | | $ | 20,715 | | | $ | 22,095 | |
| | | |
| | | |
| | | |
| | | |
| |
BMO FINANCIAL GROUP 186TH ANNUAL REPORT 2003 83
Notes to Consolidated Financial Statements
Notional Amounts
The notional amounts of our derivatives represent the amount to which a rate or price is applied in order to calculate the amount of cash that must be exchanged under the contract. Notional amounts do not represent assets or liabilities and therefore are not recorded in our Consolidated Balance Sheet.
| | | | | | | | | | | | | | | | | | | | | | | | | | |
| (Canadian $ in millions) | | 2003 | | 2002 |
| |
| |
|
| | | Trading | | Hedging | | Total | | Trading | | Hedging | | Total |
| | |
| |
| |
| |
| |
| |
|
Interest Rate Contracts | | | | | | | | | | | | | | | | | | | | | | | | |
| Over-the-counter | | | | | | | | | | | | | | | | | | | | | | | | |
| | Swaps | | $ | 681,369 | | | $ | 46,736 | | | $ | 728,105 | | | $ | 697,505 | | | $ | 50,494 | | | $ | 747,999 | |
| | Forward rate agreements | | | 274,024 | | | | 2,901 | | | | 276,925 | | | | 226,140 | | | | — | | | | 226,140 | |
| | Purchased options | | | 77,559 | | | | 3,165 | | | | 80,724 | | | | 95,860 | | | | 1,460 | | | | 97,320 | |
| | Written options | | | 116,129 | | | | — | | | | 116,129 | | | | 118,067 | | | | — | | | | 118,067 | |
| | | | |
| | | |
| | | |
| | | |
| | | |
| | | |
| |
| | | | 1,149,081 | | | | 52,802 | | | | 1,201,883 | | | | 1,137,572 | | | | 51,954 | | | | 1,189,526 | |
| | | | |
| | | |
| | | |
| | | |
| | | |
| | | |
| |
| Exchange traded | | | | | | | | | | | | | | | | | | | | | | | | |
| | Futures | | | 200,083 | | | | 228 | | | | 200,311 | | | | 158,203 | | | | — | | | | 158,203 | |
| | Purchased options | | | 76,464 | | | | — | | | | 76,464 | | | | 62,329 | | | | — | | | | 62,329 | |
| | Written options | | | 56,935 | | | | — | | | | 56,935 | | | | 54,552 | | | | — | | | | 54,552 | |
| | | | |
| | | |
| | | |
| | | |
| | | |
| | | |
| |
| | | | 333,482 | | | | 228 | | | | 333,710 | | | | 275,084 | | | | — | | | | 275,084 | |
| | | | |
| | | |
| | | |
| | | |
| | | |
| | | |
| |
| Total interest rate contracts | | | 1,482,563 | | | | 53,030 | | | | 1,535,593 | | | | 1,412,656 | | | | 51,954 | | | | 1,464,610 | |
| | | | |
| | | |
| | | |
| | | |
| | | |
| | | |
| |
Foreign Exchange Contracts | | | | | | | | | | | | | | | | | | | | | | | | |
| Over-the-counter | | | | | | | | | | | | | | | | | | | | | | | | |
| | Cross-currency swaps | | | 17,935 | | | | — | | | | 17,935 | | | | 18,348 | | | | — | | | | 18,348 | |
| | Cross-currency interest rate swaps | | | 38,659 | | | | 5,932 | | | | 44,591 | | | | 39,156 | | | | 5,511 | | | | 44,667 | |
| | Forward foreign exchange contracts | | | 105,812 | | | | 14,211 | | | | 120,023 | | | | 143,396 | | | | 8,050 | | | | 151,446 | |
| | Purchased options | | | 28,136 | | | | — | | | | 28,136 | | | | 87,766 | | | | — | | | | 87,766 | |
| | Written options | | | 28,636 | | | | — | | | | 28,636 | | | | 93,413 | | | | — | | | | 93,413 | |
| | | | |
| | | |
| | | |
| | | |
| | | |
| | | |
| |
| | | | 219,178 | | | | 20,143 | | | | 239,321 | | | | 382,079 | | | | 13,561 | | | | 395,640 | |
| | | | |
| | | |
| | | |
| | | |
| | | |
| | | |
| |
| Exchange traded | | | | | | | | | | | | | | | | | | | | | | | | |
| | Futures | | | 756 | | | | — | | | | 756 | | | | 663 | | | | — | | | | 663 | |
| | Purchased options | | | 2,234 | | | | — | | | | 2,234 | | | | 2,934 | | | | — | | | | 2,934 | |
| | Written options | | | 1,631 | | | | — | | | | 1,631 | | | | 841 | | | | — | | | | 841 | |
| | | | |
| | | |
| | | |
| | | |
| | | |
| | | |
| |
| | | | 4,621 | | | | — | | | | 4,621 | | | | 4,438 | | | | — | | | | 4,438 | |
| | | | |
| | | |
| | | |
| | | |
| | | |
| | | |
| |
| Total foreign exchange contracts | | | 223,799 | | | | 20,143 | | | | 243,942 | | | | 386,517 | | | | 13,561 | | | | 400,078 | |
| | | | |
| | | |
| | | |
| | | |
| | | |
| | | |
| |
Commodity Contracts | | | | | | | | | | | | | | | | | | | | | | | | |
| Over-the-counter | | | | | | | | | | | | | | | | | | | | | | | | |
| | Swaps | | | 16,338 | | | | — | | | | 16,338 | | | | 16,956 | | | | — | | | | 16,956 | |
| | Purchased options | | | 7,464 | | | | — | | | | 7,464 | | | | 10,262 | | | | — | | | | 10,262 | |
| | Written options | | | 7,111 | | | | — | | | | 7,111 | | | | 9,767 | | | | — | | | | 9,767 | |
| | | | |
| | | |
| | | |
| | | |
| | | |
| | | |
| |
| | | | 30,913 | | | | — | | | | 30,913 | | | | 36,985 | | | | — | | | | 36,985 | |
| | | | |
| | | |
| | | |
| | | |
| | | |
| | | |
| |
| Exchange traded | | | | | | | | | | | | | | | | | | | | | | | | |
| | Futures | | | 1,844 | | | | — | | | | 1,844 | | | | 891 | | | | — | | | | 891 | |
| | Purchased options | | | 757 | | | | — | | | | 757 | | | | 432 | | | | — | | | | 432 | |
| | Written options | | | 1,024 | | | | — | | | | 1,024 | | | | 536 | | | | — | | | | 536 | |
| | | | |
| | | |
| | | |
| | | |
| | | |
| | | |
| |
| | | | 3,625 | | | | — | | | | 3,625 | | | | 1,859 | | | | — | | | | 1,859 | |
| | | | |
| | | |
| | | |
| | | |
| | | |
| | | |
| |
| Total commodity contracts | | | 34,538 | | | | — | | | | 34,538 | | | | 38,844 | | | | — | | | | 38,844 | |
| | | | |
| | | |
| | | |
| | | |
| | | |
| | | |
| |
Equity Contracts | | | | | | | | | | | | | | | | | | | | | | | | |
| Over-the-counter | | | 20,595 | | | | — | | | | 20,595 | | | | 12,117 | | | | — | | | | 12,117 | |
| Exchange traded | | | 5,291 | | | | — | | | | 5,291 | | | | 1,692 | | | | — | | | | 1,692 | |
| | | | |
| | | |
| | | |
| | | |
| | | |
| | | |
| |
| Total equity contracts | | | 25,886 | | | | — | | | | 25,886 | | | | 13,809 | | | | — | | | | 13,809 | |
| | | | |
| | | |
| | | |
| | | |
| | | |
| | | |
| |
Credit Contracts | | | | | | | | | | | | | | | | | | | | | | | | |
| Over-the-counter | | | 11,809 | | | | — | | | | 11,809 | | | | 1,691 | | | | 399 | | | | 2,090 | |
| | | | |
| | | |
| | | |
| | | |
| | | |
| | | |
| |
| Total | | $ | 1,778,595 | | | $ | 73,173 | | | $ | 1,851,768 | | | $ | 1,853,517 | | | $ | 65,914 | | | $ | 1,919,431 | |
| | | | |
| | | |
| | | |
| | | |
| | | |
| | | |
| |
Included in the notional amounts is $48 million as at October 31, 2003 and $743 million as at October 31, 2002 related to the Managed Futures Certificates of Deposit Program. Risk exposures represented by the assets in this program are traded on behalf of customers with all gains and losses accruing to them.
84 BMO FINANCIAL GROUP 186TH ANNUAL REPORT 2003
Notes to Consolidated Financial Statements
Derivative-Related Credit Risk
Over-the-counter derivative instruments are subject to credit risk. Credit risk arises from the possibility that counterparties may default on their obligations to the Bank. The credit risk associated with derivatives is normally a small fraction of the notional amount of the derivative instrument. Derivative contracts generally expose us to potential credit loss if changes in market rates affect a counterparty’s position unfavourably and the counterparty defaults on payment. Accordingly, the credit risk is represented by the positive fair value of the derivative instrument. We strive to limit credit risk by dealing with counterparties that we believe are creditworthy, and we manage our credit risk for derivatives using the same credit risk process that is applied to loans and other credit assets.
We also pursue opportunities to reduce our exposure to credit losses on derivative instruments. These opportunities include entering into master netting arrangements with counterparties. The credit risk associated with favourable contracts is eliminated by master netting arrangements, to the extent that unfavourable contracts with the same counterparty cannot be settled before favourable contracts.
Exchange-traded derivatives have no potential for credit exposure as they are settled net with the exchange.
Terms used in the credit risk table below are as follows:
Replacement costrepresents the cost of replacing all contracts that have a positive fair value, using current market rates. It represents in effect the unrealized gains on our derivative instruments. Replacement costs disclosed below represent the net of the asset and liability to a specific counterparty where we have a legally enforceable right to offset the amount owed to us with the amount owed by us and we intend either to settle on a net basis or to realize the asset and settle the liability simultaneously.
Credit risk equivalentrepresents the total replacement cost plus an amount representing the potential future credit exposure, as outlined in the Capital Adequacy Guideline of the Superintendent of Financial Institutions Canada.
Risk-weighted balancerepresents the credit risk equivalent, weighted based on the creditworthiness of the counterparty, as prescribed by the Superintendent of Financial Institutions Canada.
| | | | | | | | | | | | | | | | | | | | | | | | | |
| (Canadian $ in millions) | | 2003 | | 2002 |
| |
| |
|
| | | Replacement | | Credit risk | | Risk-weighted | | Replacement | | Credit risk | | Risk-weighted |
| | | cost | | equivalent | | balance | | cost | | equivalent | | balance |
| | |
| |
| |
| |
| |
| |
|
Interest Rate Contracts | | | | | | | | | | | | | | | | | | | | | | | | |
| Swaps | | $ | 12,131 | | | $ | 15,685 | | | $ | 3,777 | | | $ | 15,195 | | | $ | 18,768 | | | $ | 4,675 | |
| Forward rate agreements | | | 99 | | | | 147 | | | | 29 | | | | 211 | | | | 244 | | | | 49 | |
| Purchased options | | | 1,879 | | | | 2,273 | | | | 541 | | | | 2,470 | | | | 2,939 | | | | 774 | |
| | | |
| | | |
| | | |
| | | |
| | | |
| | | |
| |
| Total interest rate contracts | | | 14,109 | | | | 18,105 | | | | 4,347 | | | | 17,876 | | | | 21,951 | | | | 5,498 | |
| | | |
| | | |
| | | |
| | | |
| | | |
| | | |
| |
Foreign Exchange Contracts | | | | | | | | | | | | | | | | | | | | | | | | |
| Cross-currency swaps | | | 517 | | | | 1,136 | | | | 383 | | | | 287 | | | | 1,324 | | | | 461 | |
| Cross-currency interest rate swaps | | | 2,560 | | | | 4,650 | | | | 860 | | | | 817 | | | | 2,845 | | | | 551 | |
| Forward foreign exchange contracts | | | 2,310 | | | | 3,611 | | | | 1,027 | | | | 1,493 | | | | 3,094 | | | | 868 | |
| Purchased options | | | 469 | | | | 759 | | | | 202 | | | | 775 | | | | 1,694 | | | | 406 | |
| | | |
| | | |
| | | |
| | | |
| | | |
| | | |
| |
| Total foreign exchange contracts | | | 5,856 | | | | 10,156 | | | | 2,472 | | | | 3,372 | | | | 8,957 | | | | 2,286 | |
| | | |
| | | |
| | | |
| | | |
| | | |
| | | |
| |
Commodity Contracts | | | | | | | | | | | | | | | | | | | | | | | | |
| Swaps | | | 988 | | | | 2,762 | | | | 1,107 | | | | 860 | | | | 2,829 | | | | 1,230 | |
| Purchased options | | | 423 | | | | 1,270 | | | | 556 | | | | 738 | | | | 2,731 | | | | 1,125 | |
| | | |
| | | |
| | | |
| | | |
| | | |
| | | |
| |
| Total commodity contracts | | | 1,411 | | | | 4,032 | | | | 1,663 | | | | 1,598 | | | | 5,560 | | | | 2,355 | |
| | | |
| | | |
| | | |
| | | |
| | | |
| | | |
| |
Equity Contracts | | | 248 | | | | 1,542 | | | | 607 | | | | 277 | | | | 1,021 | | | | 425 | |
| | | |
| | | |
| | | |
| | | |
| | | |
| | | |
| |
Credit Contracts | | | 32 | | | | 500 | | | | 104 | | | | 6 | | | | 126 | | | | 26 | |
| | | |
| | | |
| | | |
| | | |
| | | |
| | | |
| |
| Total derivatives | | | 21,656 | | | | 34,335 | | | | 9,193 | | | | 23,129 | | | | 37,615 | | | | 10,590 | |
| | | |
| | | |
| | | |
| | | |
| | | |
| | | |
| |
| Impact of master netting agreements | | | (11,512 | ) | | | (15,345 | ) | | | (3,690 | ) | | | (12,105 | ) | | | (17,714 | ) | | | (4,596 | ) |
| | | |
| | | |
| | | |
| | | |
| | | |
| | | |
| |
| Total | | $ | 10,144 | | | $ | 18,990 | | | $ | 5,503 | | | $ | 11,024 | | | $ | 19,901 | | | $ | 5,994 | |
| | | |
| | | |
| | | |
| | | |
| | | |
| | | |
| |
Included in the total are unrealized gains on hedging derivatives which we include in the Consolidated Balance Sheet on an accrual rather than mark-to-market basis. The excess of market value over book value for these items was $547 million as at October 31, 2003 and $774 million as at October 31, 2002.
Transactions are conducted with counterparties in various geographic locations and industries. Set out below is the replacement cost of contracts (before the impact of master netting agreements) from customers located in the following countries, based on country of ultimate risk:
| | | | | | | | | | | | | | | | | |
| (Canadian $ in millions, except as noted) | | 2003 | | 2002 |
| |
| |
|
| Canada | | $ | 5,769 | | | | 27% | | | $ | 4,362 | | | | 19% | |
| United States | | | 8,922 | | | | 41 | | | | 10,789 | | | | 47 | |
| Other countries | | | 6,965 | | | | 32 | | | | 7,978 | | | | 34 | |
| | | |
| | | |
| | | |
| | | |
| |
| Total | | $ | 21,656 | | | | 100% | | | $ | 23,129 | | | | 100% | |
| | | |
| | | |
| | | |
| | | |
| |
BMO FINANCIAL GROUP 186TH ANNUAL REPORT 2003 85
Notes to Consolidated Financial Statements
Transactions are conducted with various counterparties. Set out below is the replacement cost of contracts from customers in the following industries:
| | | | | | | | | | | | | | | | | | | | | | | | | | | | | | | | | | | | | | | | | |
| | | Interest rate | | Foreign exchange | | Commodity | | Equity | | Credit |
| (Canadian $ in millions) | | contracts | | contracts | | contracts | | contracts | | contracts |
| |
| |
| |
| |
| |
|
| | | 2003 | | 2002 | | 2003 | | 2002 | | 2003 | | 2002 | | 2003 | | 2002 | | 2003 | | 2002 |
| | |
| |
| |
| |
| |
| |
| |
| |
| |
| |
|
| Financial institutions | | $ | 12,315 | | | $ | 15,324 | | | $ | 3,463 | | | $ | 2,496 | | | $ | 463 | | | $ | 842 | | | $ | 118 | | | $ | 115 | | | $ | 30 | | | $ | 6 | |
| Other | | | 1,794 | | | | 2,552 | | | | 2,393 | | | | 876 | | | | 948 | | | | 756 | | | | 130 | | | | 162 | | | | 2 | | | | — | |
| | | |
| | | |
| | | |
| | | |
| | | |
| | | |
| | | |
| | | |
| | | |
| | | |
| |
| Total | | $ | 14,109 | | | $ | 17,876 | | | $ | 5,856 | | | $ | 3,372 | | | $ | 1,411 | | | $ | 1,598 | | | $ | 248 | | | $ | 277 | | | $ | 32 | | | $ | 6 | |
| | | |
| | | |
| | | |
| | | |
| | | |
| | | |
| | | |
| | | |
| | | |
| | | |
| |
Term to Maturity
Our derivative contracts have varying maturity dates. The remaining contractual term to maturity for the notional amounts of our derivative contracts is set out below:
| | | | | | | | | | | | | | | | | | | | | | | | | | | | | |
| (Canadian $ in millions) | | Term to maturity | | 2003 | | 2002 |
| |
| |
| |
|
| | | | | | | | | | | | | | | | | | | | | | | Total | | Total |
| | | Within | | 1 to 3 | | 3 to 5 | | 5 to 10 | | Over 10 | | notional | | notional |
| | | 1 year | | years | | years | | years | | years | | amount | | amount |
| | |
| |
| |
| |
| |
| |
| |
|
Interest Rate Contracts | | | | | | | | | | | | | | | | | | | | | | | | | | | | |
| Swaps | | $ | 272,604 | | | $ | 223,173 | | | $ | 107,782 | | | $ | 103,424 | | | $ | 21,122 | | | $ | 728,105 | | | $ | 747,999 | |
| Forward rate agreements, futures and options | | | 645,029 | | | | 105,141 | | | | 19,018 | | | | 36,925 | | | | 1,375 | | | | 807,488 | | | | 716,611 | |
| | | |
| | | |
| | | |
| | | |
| | | |
| | | |
| | | |
| |
| Total interest rate contracts | | | 917,633 | | | | 328,314 | | | | 126,800 | | | | 140,349 | | | | 22,497 | | | | 1,535,593 | | | | 1,464,610 | |
| | | |
| | | |
| | | |
| | | |
| | | |
| | | |
| | | |
| |
Foreign Exchange Contracts | | | | | | | | | | | | | | | | | | | | | | | | | | | | |
| Cross-currency swaps | | | 9,774 | | | | 1,783 | | | | 1,841 | | | | 3,303 | | | | 1,234 | | | | 17,935 | | | | 18,348 | |
| Cross-currency interest rate swaps | | | 12,061 | | | | 11,206 | | | | 7,986 | | | | 11,619 | | | | 1,719 | | | | 44,591 | | | | 44,667 | |
| Forward foreign exchange contracts, futures and options | | | 174,675 | | | | 5,759 | | | | 938 | | | | 24 | | | | 20 | | | | 181,416 | | | | 337,063 | |
| | | |
| | | |
| | | |
| | | |
| | | |
| | | |
| | | |
| |
| Total foreign exchange contracts | | | 196,510 | | | | 18,748 | | | | 10,765 | | | | 14,946 | | | | 2,973 | | | | 243,942 | | | | 400,078 | |
| | | |
| | | |
| | | |
| | | |
| | | |
| | | |
| | | |
| |
Commodity Contracts | | | | | | | | | | | | | | | | | | | | | | | | | | | | |
| Swaps | | | 10,911 | | | | 4,505 | | | | 824 | | | | 98 | | | | — | | | | 16,338 | | | | 16,956 | |
| Futures and options | | | 14,976 | | | | 3,181 | | | | 43 | | | | — | | | | — | | | | 18,200 | | | | 21,888 | |
| | | |
| | | |
| | | |
| | | |
| | | |
| | | |
| | | |
| |
| Total commodity contracts | | | 25,887 | | | | 7,686 | | | | 867 | | | | 98 | | | | — | | | | 34,538 | | | | 38,844 | |
| | | |
| | | |
| | | |
| | | |
| | | |
| | | |
| | | |
| |
Total Equity Contracts | | | 19,233 | | | | 3,018 | | | | 2,393 | | | | 716 | | | | 526 | | | | 25,886 | | | | 13,809 | |
| | | |
| | | |
| | | |
| | | |
| | | |
| | | |
| | | |
| |
Total Credit Contracts | | | 2,051 | | | | 3,833 | | | | 5,175 | | | | 573 | | | | 177 | | | | 11,809 | | | | 2,090 | |
| | | |
| | | |
| | | |
| | | |
| | | |
| | | |
| | | |
| |
| Total | | $ | 1,161,314 | | | $ | 361,599 | | | $ | 146,000 | | | $ | 156,682 | | | $ | 26,173 | | | $ | 1,851,768 | | | $ | 1,919,431 | |
| | | |
| | | |
| | | |
| | | |
| | | |
| | | |
| | | |
| |
Note 10 Premises and Equipment
We record all premises and equipment at cost. Buildings, computer and other equipment and leasehold improvements are amortized on a straight-line basis over their estimated useful lives. The maximum estimated useful lives we use to amortize our assets are:
| | | |
| Buildings | | 40 years |
| Computer equipment | | 5 years |
| Other equipment | | 10 years |
| Leasehold improvements | | Lease term plus first renewal period
to a maximum of 10 years |
Gains and losses on disposal are included in other revenues in our Consolidated Statement of Income.
| | | | | | | | | | | | | | | | | |
| (Canadian $ in millions) | | 2003 | | 2002 |
| |
| |
|
| | | | | | | Accumulated | | Carrying | | Carrying |
| | | Cost | | amortization | | value | | value |
| | |
| |
| |
| |
|
| Land | | $ | 251 | | | $ | — | | | $ | 251 | | | $ | 269 | |
| Buildings | | | 1,254 | | | | 612 | | | | 642 | | | | 701 | |
| Computer and other equipment | | | 2,737 | | | | 1,814 | | | | 923 | | | | 950 | |
| Leasehold improvements | | | 546 | | | | 317 | | | | 229 | | | | 239 | |
| | | |
| | | |
| | | |
| | | |
| |
| Total | | $ | 4,788 | | | $ | 2,743 | | | $ | 2,045 | | | $ | 2,159 | |
| | | |
| | | |
| | | |
| | | |
| |
Amortization expense for the years ended October 31, 2003, 2002 and 2001 amounted to $375 million, $396 million and $406 million, respectively.
On September 12, 2002, we sold our 25% undivided interest in the land located at King and Bay Streets in Toronto for cash proceeds of $122 million. The gain on sale of $112 million ($87 million after tax) was deferred and will be recorded as a reduction in rental expense over the term of our leases in the building, which expire between 2013 and 2023.
We write down premises and equipment to fair value when the related undiscounted cash flows are not expected to allow for recovery of the carrying value. Fair value of long-lived assets is determined by discounting the expected related cash flows. There were no write-downs of long-lived assets due to impairment during the years ended October 31, 2003 and 2002.
Lease Commitments
We have entered into a number of non-cancellable leases for premises and equipment. Our total contractual rental commitments outstanding as at October 31, 2003 are $1,143 million. The commitments for each of the next five years are $204 million for 2004, $175 million for 2005, $135 million for 2006, $112 million for 2007, $86 million for 2008 and $431 million thereafter. Included in these amounts are the commitments related to 681 leased Bank branch locations as at October 31, 2003. Net rent expense for premises and equipment reported in our Consolidated Statement of Income was $222 million, $223 million and $175 million for the years ended October 31, 2003, 2002 and 2001, respectively.
86 BMO FINANCIAL GROUP 186TH ANNUAL REPORT 2003
Notes to Consolidated Financial Statements
Note 11 Acquisitions
We account for acquisitions of businesses using the purchase method. This involves allocating the purchase price paid for a business to the assets acquired, including identifiable intangible assets, and the liabilities assumed, based on their fair values at the date of acquisition. Any excess is then recorded as goodwill.
We account for acquisitions of assets at the fair value of assets acquired, including identifiable intangible assets.
Gerard Klauer Mattison & Co., Inc.
On July 3, 2003, we completed the acquisition of all outstanding voting shares of Gerard Klauer Mattison & Co., Inc. (“GKM”), a New York-based mid-market investment banking firm. The results of GKM’s operations have been included in our consolidated financial statements since that date. The acquisition establishes an equity research, sales and trading platform with offices in New York, Boston, Chicago, San Francisco and Los Angeles. The purchase price of $40 million consisted of cash consideration of $18 million and 504,221 of our common shares valued at $22 million. The number of common shares issued was determined pursuant to a formula in the acquisition agreement. Goodwill related to this acquisition is not deductible for tax purposes. GKM is part of our Investment Banking Group. In addition, we placed 130,330 of our common shares valued at $5 million in escrow, to be paid to key employees of GKM who have become employees of the Bank. This amount has been recorded as other assets in our Consolidated Balance Sheet and will be recorded as employee compensation expense over three years.
myCFO, Inc.
On November 1, 2002, we completed the acquisition of certain assets of myCFO, Inc., a California-based provider of customized investment and wealth management services to high net worth individuals and families, for total cash consideration of $61 million. The results of myCFO, Inc.’s operations have been included in our consolidated financial statements since that date. The acquisition of myCFO, Inc. provides the Bank with entry into key markets in California, Colorado and Georgia. As part of this acquisition, we acquired a customer relationship intangible asset, which will be amortized on a straight-line basis over 14 years, a technology intangible asset valued at $6 million, which will be amortized on a straight-line basis over five years, and a brand intangible asset valued at $1 million, which has an indefinite life. Goodwill related to this acquisition is deductible for tax purposes. myCFO, Inc. is part of our Private Client Group.
Morgan Stanley Online Accounts
On July 26, 2002, we completed the acquisition of Morgan Stanley Individual Investor Group’s online client accounts for total cash consideration of $153 million. The online client accounts asset is included in our customer relationship intangible assets and will be amortized on an accelerated basis over 15 years.
CSFBdirect, Inc.
On February 4, 2002, we completed the acquisition of all outstanding voting shares of CSFBdirect, Inc., a New Jersey-based direct investing firm previously owned by Credit Suisse First Boston, for total cash consideration of $854 million. The results of CSFBdirect, Inc.’s operations have been included in our consolidated financial statements since that date. The acquisition of CSFBdirect, Inc. significantly increases our U.S. client base and provides a national franchise for our existing integrated wealth management business in the United States. As part of this acquisition, we acquired a customer relationship intangible asset, which will be amortized on an accelerated basis over 15 years, and a covenant not to compete, which will be amortized over five years on a straight-line basis.
The estimated fair values of the assets acquired and the liabilities assumed at the date of acquisition are as follows:
| | | | | | | | | | | | | | | | | | |
| (Canadian $ in millions) | | 2003 | | 2002 |
| |
| |
|
| | | | | | | | | | | Morgan Stanley | | |
| | | GKM | | myCFO, Inc. | | client accounts | | CSFBdirect, Inc. |
| | |
| |
| |
| |
|
| Cash resources | | $ | 1 | | | $ | — | | | $ | — | | | $ | 51 | |
| Securities | | | 2 | | | | — | | | | — | | | | — | |
| Premises and equipment | | | 7 | | | | 7 | | | | — | | | | 10 | |
| Other assets | | | | | | | | | | | | | | | | |
| | Customer relationship intangible assets | | | 15 | | | | 9 | | | | 153 | | | | 200 | |
| | Other intangible assets | | | — | | | | 7 | | | | — | | | | 9 | |
| | Goodwill | | | 15 | | | | 43 | | | | — | | | | 597 | |
| | Other | | | 41 | | | | 5 | | | | — | | | | 6 | |
| | | |
| | | |
| | | |
| | | |
| |
| Other assets | | | 71 | | | | 64 | | | | 153 | | | | 812 | |
| | | |
| | | |
| | | |
| | | |
| |
| Total assets | | | 81 | | | | 71 | | | | 153 | | | | 873 | |
| | | |
| | | |
| | | |
| | | |
| |
| Liabilities | | | 41 | | | | 10 | | | | — | | | | 19 | |
| | | |
| | | |
| | | |
| | | |
| |
| Purchase price | | $ | 40 | | | $ | 61 | | | $ | 153 | | | $ | 854 | |
| | | |
| | | |
| | | |
| | | |
| |
The allocation of the purchase price for GKM continues to be subject to refinement as we complete the valuation of the assets acquired and liabilities assumed.
Note 12 Goodwill and Intangible Assets
Goodwill
When we acquire a subsidiary, joint venture or investment securities where we exert significant influence, we determine the fair value of the net tangible and intangible assets acquired and compare the total to the amount that we paid for the investments. Any excess of the amount paid over the fair value of those net assets is considered to be goodwill. Goodwill is tested at least annually for impairment to ensure that its fair value is greater than or equal to carrying value. Any excess of carrying value over fair value is charged to income in the period in which impairment is determined.
Change in Accounting Policy
We ceased amortizing goodwill beginning on November 1, 2001. Prior to that date we amortized goodwill arising from any acquisition made before July 1, 2001 over its useful life. Amortization of goodwill was recorded net of applicable income tax in our Consolidated Statement of Income. Goodwill amortization of $56 million, net of income tax benefits of $6 million, was included in income for the year ended October 31, 2001. Had goodwill not been amortized in the year ended October 31, 2001, both basic and diluted earnings per share for that year would have increased by $0.11.
BMO FINANCIAL GROUP 186TH ANNUAL REPORT 2003 87
Notes to Consolidated Financial Statements
Goodwill associated with our acquisitions during the year ended October 31, 2003 is allocated to our operating groups as illustrated in the following table:
| | | | | | | | | | | | | | | | | | | | | |
| | | | | | | | | | | | | | | Corporate | | |
| | | | | | | | | | | | | | | Support, | | |
| | | Personal and | | | | | | | | | | including | | |
| | | Commercial | | Private | | Investment | | Technology | | |
| (Canadian $ in millions) | | Client Group | | Client Group | | Banking Group | | and Solutions | | Total |
| |
| |
| |
| |
| |
|
| Goodwill at beginning of year | | $ | 455 | | | $ | 912 | | | $ | 58 | | | $ | 3 | | | $ | 1,428 | |
| Acquisitions during the year | | | — | | | | 58 | | | | 15 | | | | — | | | | 73 | |
| Effects of foreign exchange and other | | | (51 | ) | | | (116 | ) | | | — | | | | — | | | | (167 | ) |
| | | |
| | | |
| | | |
| | | |
| | | |
| |
| Goodwill at end of year | | $ | 404 | | | $ | 854 | | | $ | 73 | | | $ | 3 | | | $ | 1,334 | |
| | | |
| | | |
| | | |
| | | |
| | | |
| |
There were no write-downs of goodwill due to impairment during the years ended October 31, 2003 and 2002.
Intangible Assets
Intangible assets related to our acquisitions are recorded at their fair value at the acquisition date. Intangible assets by category are as follows:
| | | | | | | | | | | | | | | | | |
| (Canadian $ in millions) | | 2003 | | 2002 |
| |
| |
|
| | | | | | | Accumulated | | Carrying | | Carrying |
| | | Cost | | amortization | | value | | value |
| | |
| |
| |
| |
|
| Customer relationships | | $ | 519 | | | $ | 145 | | | $ | 374 | | | $ | 489 | |
| Core deposits | | | 173 | | | | 82 | | | | 91 | | | | 126 | |
| Branch distribution network | | | 195 | | | | 94 | | | | 101 | | | | 134 | |
| Other | | | 33 | | | | 10 | | | | 23 | | | | 24 | |
| | | |
| | | |
| | | |
| | | |
| |
| Total | | $ | 920 | | | $ | 331 | | | $ | 589 | | | $ | 773 | |
| | | |
| | | |
| | | |
| | | |
| |
Intangible assets with a finite life are amortized to income over the period during which we believe the assets will benefit us on either a straight-line or an accelerated basis, depending on the specific asset purchased, over a period not to exceed 15 years.
We write down intangible assets with a finite life to fair value when the related undiscounted cash flows are not expected to allow for recovery of the carrying value. Fair value of intangibles is determined by discounting the expected related cash flows. There were no write-downs of intangible assets due to impairment during the years ended October 31, 2003 and 2002.
Intangible assets with an indefinite life are not subject to amortization; they are tested at least annually for impairment to ensure that their fair value is greater than or equal to carrying value. Any excess of carrying value over fair value is charged to income in the period in which impairment is determined. We had $1 million and nil of intangible assets with an indefinite life as at October 31, 2003 and 2002, respectively.
The total estimated amortization expense relating to intangible assets for each of the next five years is $100 million for 2004, $93 million for 2005, $84 million for 2006, $78 million for 2007 and $66 million for 2008.
Note 13 Other Assets
| | | | | | | | | |
| (Canadian $ in millions) | | 2003 | | 2002 |
| |
| |
|
| Accounts receivable, prepaid expenses and other items | | $ | 4,666 | | | $ | 4,295 | |
| Accrued interest receivable | | | 636 | | | | 723 | |
| Due from clients, dealers and brokers | | | 3,885 | | | | 7,645 | |
| Pension asset (Note 18) | | | 1,171 | | | | 1,008 | |
| Future income taxes (Note 20) | | | 146 | | | | 109 | |
| | | |
| | | |
| |
| Total | | $ | 10,504 | | | $ | 13,780 | |
| | | |
| | | |
| |
Note 14 Deposits
| | | | | | | | | | | | | | | | | | | | | | | | | | | | | | | | | | | | | | | | | | |
| | | | Demand deposits | | | | | | |
| | | |
| | Payable | | Payable on | | |
| (Canadian $ in millions) | | Interest bearing | | Non-interest bearing | | after notice | | a fixed date | | Total |
| |
| |
| |
| |
| |
|
| | | 2003 | | 2002 | | 2003 | | 2002 | | 2003 | | 2002 | | 2003 | | 2002 | | 2003 | | 2002 |
| | |
| |
| |
| |
| |
| |
| |
| |
| |
| |
|
| Deposits by: | | | | | | | | | | | | | | | | | | | | | | | | | | | | | | | | | | | | | | | | |
| | Banks | | $ | 299 | | | $ | 210 | | | $ | 410 | | | $ | 363 | | | $ | 93 | | | $ | 188 | | | $ | 23,953 | | | $ | 14,512 | | | $ | 24,755 | | | $ | 15,273 | |
| | Businesses and governments | | | 5,422 | | | | 4,659 | | | | 9,536 | | | | 9,008 | | | | 17,288 | | | | 16,028 | | | | 40,159 | | | | 41,716 | | | | 72,405 | | | | 71,411 | |
| | Individuals | | | 2,512 | | | | 2,450 | | | | 3,728 | | | | 3,346 | | | | 32,641 | | | | 32,949 | | | | 35,510 | | | | 36,409 | | | | 74,391 | | | | 75,154 | |
| | | | |
| | | |
| | | |
| | | |
| | | |
| | | |
| | | |
| | | �� |
| | | |
| | | |
| |
| Total | | $ | 8,233 | | | $ | 7,319 | | | $ | 13,674 | | | $ | 12,717 | | | $ | 50,022 | | | $ | 49,165 | | | $ | 99,622 | | | $ | 92,637 | | | $ | 171,551 | | | $ | 161,838 | |
| | | | |
| | | |
| | | |
| | | |
| | | |
| | | |
| | | |
| | | |
| | | |
| | | |
| |
| Booked in: | | | | | | | | | | | | | | | | | | | | | | | | | | | | | | | | | | | | | | | | |
| | Canada | | $ | 7,442 | | | $ | 6,561 | | | $ | 10,187 | | | $ | 8,941 | | | $ | 34,449 | | | $ | 32,671 | | | $ | 63,656 | | | $ | 54,799 | | | $ | 115,734 | | | $ | 102,972 | |
| | United States | | | 696 | | | | 730 | | | | 3,481 | | | | 3,766 | | | | 15,042 | | | | 16,102 | | | | 18,732 | | | | 28,595 | | | | 37,951 | | | | 49,193 | |
| | Other countries | | | 95 | | | | 28 | | | | 6 | | | | 10 | | | | 531 | | | | 392 | | | | 17,234 | | | | 9,243 | | | | 17,866 | | | | 9,673 | |
| | | | |
| | | |
| | | |
| | | |
| | | |
| | | |
| | | |
| | | |
| | | |
| | | |
| |
| Total | | $ | 8,233 | | | $ | 7,319 | | | $ | 13,674 | | | $ | 12,717 | | | $ | 50,022 | | | $ | 49,165 | | | $ | 99,622 | | | $ | 92,637 | | | $ | 171,551 | | | $ | 161,838 | |
| | | | |
| | | |
| | | |
| | | |
| | | |
| | | |
| | | |
| | | |
| | | |
| | | |
| |
Demand deposits are comprised primarily of our customers’ chequing accounts, some of which we pay interest on. Our customers need not notify us prior to withdrawing money from their chequing accounts.
Deposits payable after notice are comprised primarily of our customers’ savings accounts, on which we pay interest.
Deposits payable on a fixed date are comprised primarily of various investment instruments purchased by our customers to earn interest over a fixed period, such as term deposits and guaranteed investment certificates. The terms of these deposits can vary from one day to 10 years.
88 BMO FINANCIAL GROUP 186TH ANNUAL REPORT 2003
Notes to Consolidated Financial Statements
Deposits include federal funds purchased, which are overnight borrowings of other banks’ excess reserve funds at a United States Federal Reserve Bank. As at October 31, 2003, we had purchased $4,481 million of federal funds and $4,096 million as at October 31, 2002.
Deposits include commercial paper totalling $179 million as at October 31, 2003 and $597 million as at October 31, 2002.
Included in our deposits payable on a fixed date as at October 31, 2003 are $73,532 million of individual deposits greater than one hundred thousand dollars, of which $40,687 million were booked in Canada and $32,845 million were booked outside Canada. We had $65,304 million of such deposits as at October 31, 2002, of which $31,529 million were booked in Canada and $33,775 million were booked outside Canada. Of these deposits booked in Canada as at October 31, 2003, the amount maturing within three months was $27,356 million, between three and six months was $1,996 million, between six and 12 months was $3,208 million and over 12 months was $8,127 million. As at October 31, 2002, the amount maturing within three months was $20,054 million, between three and six months was $1,642 million, between six and 12 months was $3,708 million and over 12 months was $6,125 million.
Note 15 Other Liabilities
Acceptances
Acceptances represent a form of negotiable short-term debt that is issued by our customers and which we guarantee for a fee. We have an offsetting claim, equal to the amount of the acceptances, against our customers when the instruments mature. The amount due under acceptances is recorded as a liability and our corresponding claim is recorded as a loan in our Consolidated Balance Sheet.
Securities Sold but not yet Purchased
Securities sold but not yet purchased represent our obligation to deliver securities which we did not own at the time of sale. These obligations are recorded at their market value. Adjustments to the market value as at the balance sheet date and gains and losses on the settlement of these obligations are recorded in interest, dividend and fee income, from securities, in our Consolidated Statement of Income.
Securities Sold under Repurchase Agreements
Securities sold under repurchase agreements represent short-term funding transactions where we sell securities that we already own and simultaneously commit to repurchase the same securities at a specified price on a specified date in the future. These securities are recorded at their original cost. The interest expense related to these liabilities is recorded on an accrual basis.
| | | | | | | | | |
| (Canadian $ in millions) | | 2003 | | 2002 |
| |
| |
|
| Acceptances | | $ | 5,611 | | | $ | 6,901 | |
| Securities sold but not yet purchased | | | 8,255 | | | | 7,654 | |
| Securities sold under repurchase agreements | | | 23,765 | | | | 24,796 | |
| | | |
| | | |
| |
| | | $ | 37,631 | | | $ | 39,351 | |
| | | |
| | | |
| |
| Accounts payable, accrued expenses and other items | | | 8,184 | | | | 10,479 | |
| Accrued interest payable | | | 984 | | | | 1,125 | |
| Non-controlling interest in subsidiaries | | | 1,518 | | | | 1,571 | |
| Liabilities of subsidiaries, other than deposits | | | 11 | | | | 168 | |
| Pension liability (Note 18) | | | 59 | | | | 72 | |
| Other employee future benefits liability (Note 18) | | | 503 | | | | 477 | |
| | | |
| | | |
| |
| Other | | $ | 11,259 | | | $ | 13,892 | |
| | | |
| | | |
| |
| Total | | $ | 48,890 | | | $ | 53,243 | |
| | | |
| | | |
| |
Included in liabilities of subsidiaries, other than deposits as at October 31, 2002 were other short-term borrowings totalling $156 million.
Included in non-controlling interest in subsidiaries as at October 31, 2003 and 2002 are capital trust securities totalling $1,150 million that form part of our Tier 1 regulatory capital.
Note 16 Subordinated Debt
Subordinated debt represents our direct unsecured obligations to our debt holders and forms part of our regulatory capital. The rights of the holders of our notes and debentures are subordinate to the claims of depositors and certain other creditors. We require approval from the Superintendent of Financial Institutions Canada before we can redeem any part of our subordinated debt.
During the year ended October 31, 2003, we redeemed our Floating Rate, Series B1 Subordinated Notes of US$350 million. Our Series 17 Debentures of $250 million matured during the year. During the year ended October 31, 2002, we redeemed our Series 24 Debentures of $250 million and our Series A Medium-Term Notes of $450 million. Our Series 14 Debentures of $150 million matured during the year. There were no gains or losses on redemption.
The term to maturity and repayments of our subordinated debt required over the next five years and thereafter are as follows:
| | | | | | | | | | | | | | | | | | | | | | | | | | | | | | | | | | | | | | | | | | | | | | |
| (Canadian $ in millions, | | | | | | | | | | Interest | | Redeemable | | | | | | | | | | | | | | | | | | | | | | Over | | |
| except as noted) | | Face value | | Maturity date | | rate (%) | | at our option | | 1 year | | 2 years | | 3 years | | 4 years | | 5 years | | 5 years | | Total |
| |
| |
| |
| |
| |
| |
| |
| |
| |
| |
| |
|
| Series 12 | | $ | 140 | | | December 2008
| | | 10.85 | | | December 1998
| | $ | — | | | $ | — | | | $ | — | | | $ | — | | | $ | — | | | $ | 140 | | | $ | 140 | |
| Series 16 | | $ | 100 | | | February 2017
| | | 10.00 | | | February 2012
| | | — | | | | — | | | | — | | | | — | | | | — | | | | 100 | | | | 100 | |
| Series 18 | | $ | 250 | | | September 2010
| | | 8.80 | | | September 2005
| | | — | | | | — | | | | — | | | | — | | | | — | | | | 250 | | | | 250 | |
| Series 19 | | $ | 125 | | | March 2011
| | | 7.40 | | | March 2006
| | | — | | | | — | | | | — | | | | — | | | | — | | | | 125 | | | | 125 | |
| Series 20 | | $ | 150 | | | December
2025 to 2040
| | | 8.25 | | | | — | | | | — | | | | — | | | | — | | | | — | | | | — | | | | 150 | | | | 150 | |
| Series 21 | | $ | 300 | | | May 2011
| | | 8.15 | | | May 2006
| | | — | | | | — | | | | — | | | | — | | | | — | | | | 300 | | | | 300 | |
| Series 22 | | $ | 150 | | | July 2012
| | | 7.92 | | | July 2007
| | | — | | | | — | | | | — | | | | — | | | | — | | | | 150 | | | | 150 | |
| 6.10% Notes | | US$300
| | | September 2005
| | | 6.10 | | | September 1998 (1)
| | | — | | | | 396 | | | | — | | | | — | | | | — | | | | — | | | | 396 | |
| 7.80% Notes | | US$300
| | | April 2007
| | | 7.80 | | | April 2000 (1)
| | | — | | | | — | | | | — | | | | 395 | | | | — | | | | — | | | | 395 | |
| Series A Medium- | | | | | | | | | | | | | | | | | | | | | | | | | | | | | | | | | | | | | | | | |
| | Term Notes | | | | | | | | | | | | | | | | | | | | | | | | | | | | | | | | | | | | | | | | |
| | 2nd Tranche | | $ | 150 | | | February 2013
| | | 5.75 | | | February 2008
| | | — | | | | — | | | | — | | | | — | | | | — | | | | 150 | | | | 150 | |
| | 3rd Tranche | | $ | 400 | | | December 2008
| | | 5.65 | | | December 2003 (2)
| | | 400 | | | | — | | | | — | | | | — | | | | — | | | | — | | | | 400 | |
| Series B Medium- | | | | | |
| | | | | |
| | | | | | | | | | | | | | | | | | | | | | | | | | | | |
| | Term Notes | | $ | 300 | | | June 2010
| | | 6.60 | | | June 2005
| | | — | | | | — | | | | — | | | | — | | | | — | | | | 300 | | | | 300 | |
| | | | | | | | | | | | | | | | | | | |
| | | |
| | | |
| | | |
| | | |
| | | |
| | | |
| |
| Total | | | | | | | | | | | | | | | | | | $ | 400 | | | $ | 396 | | | $ | — | | | $ | 395 | | | $ | — | | | $ | 1,665 | | | $ | 2,856 | |
| | | | | | | | | | | | | | | | | | | |
| | | |
| | | |
| | | |
| | | |
| | | |
| | | |
| |
| (1) | | Redeemable at our option only if certain tax events occur. |
| (2) | | On October 29, 2003, we announced that we will redeem our Series A Medium-Term Notes, due December 2008, on December 1, 2003. |
BMO FINANCIAL GROUP 186TH ANNUAL REPORT 2003 89
Notes to Consolidated Financial Statements
Note 17 Share Capital
Outstanding
| | | | | | | | | | | | | | | | | | | | | | | | | | | | | | | | | | | | | |
| (Canadian $ in millions, except as noted) | | 2003 | | 2002 | | 2001 |
| |
| |
| |
|
| | | | | | | | | | | Dividends | | | | | | | | | | Dividends | | | | | | | | | | Dividends |
| | | Number | | | | | | declared | | Number | | | | | | declared | | Number | | | | | | declared |
| | | of shares | | Amount | | per share | | of shares | | Amount | | per share | | of shares | | Amount | | per share |
| | |
| |
| |
| |
| |
| |
| |
| |
| |
|
Preferred Shares | | | | | | | | | | | | | | | | | | | | | | | | | | | | | | | | | | | | |
| Class B — Series 1 | | | — | | | $ | — | | | $ | — | | | | — | | | $ | — | | | $ | — | | | | — | | | $ | — | | | $ | 0.57 | |
| Class B — Series 2 | | | — | | | | — | | | | — | | | | — | | | | — | | | | — | | | | — | | | | — | | | US$ | 1.28 | |
| Class B — Series 3 | | | 16,000,000 | | | | 400 | | | | 1.39 | | | | 16,000,000 | | | | 400 | | | | 1.39 | | | | 16,000,000 | | | | 400 | | | | 1.39 | |
| Class B — Series 4 | | | 8,000,000 | | | | 200 | | | | 1.20 | | | | 8,000,000 | | | | 200 | | | | 1.20 | | | | 8,000,000 | | | | 200 | | | | 1.20 | |
| Class B — Series 5 | | | 8,000,000 | | | | 200 | | | | 1.33 | | | | 8,000,000 | | | | 200 | | | | 1.33 | | | | 8,000,000 | | | | 200 | | | | 1.33 | |
| Class B — Series 6 | | | 10,000,000 | | | | 250 | | | | 1.19 | | | | 10,000,000 | | | | 250 | | | | 1.19 | | | | 10,000,000 | | | | 250 | | | | 1.19 | |
| Class B — Series 10 | | | 12,000,000 | | | | 396 | | | US$ | 1.49 | | | | 12,000,000 | | | | 467 | | | US$1.39 | | | | — | | | | — | | | | — | |
| | | |
| | | |
| | | |
| | | |
| | | |
| | | |
| | | |
| | | |
| | | |
| |
| | | | | | | | 1,446 | | | | | | | | | | | | 1,517 | | | | | | | | | | | | 1,050 | | | | | |
Common Shares | | | 499,632,368 | | | | 3,662 | | | | 1.34 | | | | 492,504,878 | | | | 3,459 | | | | 1.20 | | | | 489,084,527 | | | | 3,375 | | | | 1.12 | |
| | | |
| | | |
| | | |
| | | |
| | | |
| | | |
| | | |
| | | |
| | | |
| |
| Total outstanding share capital | | | | | | $ | 5,108 | | | | | | | | | | | $ | 4,976 | | | | | | | | | | | $ | 4,425 | | | | | |
| | | | | | | |
| | | | | | | | | | | |
| | | | | | | | | | | |
| | | | | |
Preferred Shares
We are authorized by our shareholders to issue an unlimited number of Class A Preferred shares and Class B Preferred shares without par value, in series, for unlimited consideration. Class B Preferred shares may be issued in a foreign currency.
During the year ended October 31, 2002, we issued 12,000,000 5.95% Non-Cumulative Class B Preferred shares, Series 10, at a price of US$25.00 per share, representing an aggregate issue price of US$300 million.
During the year ended October 31, 2001, we redeemed all of our Class B — Series 1 Preferred shares for $25.00 per share or $250 million, and all of our Class B — Series 2 Preferred shares for US$25.00 per share or US$250 million.
Preferred Share Rights and Privileges
Class B — Series 3 shares are redeemable at our option starting August 25, 2004 for $25.00 cash per share, plus a premium if we redeem the shares before August 25, 2006, or an equivalent value of our common shares, and are convertible at the shareholder’s option starting May 25, 2007 into our common shares; however, we have the right to pay $25.00 cash per share instead. The shares carry a non-cumulative quarterly dividend of $0.346875 per share.
Class B — Series 4 shares are redeemable at our option starting August 25, 2005 for $25.00 cash per share, plus a premium if we redeem the shares before August 25, 2007, or an equivalent value of our common shares, and are convertible at the shareholder’s option starting May 25, 2008 into our common shares; however, we have the right to pay $25.00 cash per share instead. The shares carry a non-cumulative quarterly dividend of $0.30 per share.
Class B — Series 5 shares are redeemable at our option starting February 25, 2013 for $25.00 cash per share, and are not convertible. The shares carry a non-cumulative quarterly dividend of $0.33125 per share.
Class B — Series 6 shares are redeemable at our option starting November 25, 2005 for $25.00 cash per share, plus a premium if we redeem the shares before November 25, 2007, or an equivalent value of our common shares, and are convertible at the shareholder’s option starting November 25, 2008 into our common shares; however, we have the right to pay $25.00 cash per share instead. The shares carry a non-cumulative quarterly dividend of $0.296875 per share.
Class B — Series 10 shares are redeemable at our option starting February 25, 2012 for US$25.00 cash per share, and are convertible at our option starting February 25, 2012 into our common shares. The shares carry a non-cumulative quarterly dividend of US$0.371875 per share.
Common Shares
We are authorized by our shareholders to issue an unlimited number of our common shares, without par value, for unlimited consideration. Our common shares are not redeemable or convertible. Dividends are declared by us on a quarterly basis and the amount can vary from quarter to quarter.
On August 8, 2003, we commenced a normal course issuer bid, effective for one year. Under this bid, we may repurchase up to 15,000,000 common shares, approximately 3% of our outstanding common shares. During the year ended October 31, 2003, we repurchased 282,800 shares at an average cost of $43.95 per share, totalling $12 million. During the year ended October 31, 2001, we repurchased 52,000,000 shares at an average cost of $39.06 per share, totalling $2,031 million, under a normal course issuer bid that began that year.
During the year ended October 31, 2001, we paid a stock dividend of one common share, with no value, for each outstanding common share. The stock dividend had the same effect as a two-for-one stock split. All common share balances have been restated to reflect this stock dividend.
Issuances Exchangeable into Common Shares
In 1996 we granted options to Grupo Financiero BBVA Bancomer to purchase up to 19,914,570 of our common shares as part of the consideration paid for our investment in Grupo Financiero BBVA Bancomer. These options were cancelled on December 18, 2000. As a result, the $22 million option value that was included in share capital in 1996 was reversed and an after-tax gain of $18 million was recorded directly in retained earnings when the options were cancelled.
One of our subsidiaries, Bank of Montreal Securities Canada Limited (“BMSCL”), has issued various classes of non-voting shares that can be exchanged at the option of the holder for our common shares, based on a formula. If all of these BMSCL shares had been converted into our common shares, up to 771,212 and 1,119,751 of our common shares would have been needed to complete the exchange as at October 31, 2003 and 2002, respectively.
Share Redemption and Dividend Restrictions
The Superintendent of Financial Institutions Canada must approve any plan to redeem any of our preferred share issues for cash.
We are prohibited from declaring dividends on our preferred or common shares when we would be, as a result of paying such a dividend, in contravention of the capital adequacy, liquidity or any other regulatory directives issued under the Bank Act. In addition, common share dividends cannot be paid unless all dividends declared and payable on our preferred shares have been paid or sufficient funds have been set aside to do so.
In addition, we have agreed that if BMO Capital Trust, one of our subsidiaries, fails to pay any required distribution on its capital trust securities, we will not declare dividends of any kind on any of our preferred or common shares.
90 BMO FINANCIAL GROUP 186TH ANNUAL REPORT 2003
Notes to Consolidated Financial Statements
Potential Share Issuances
As at October 31, 2003, we had reserved 7,026,019 common shares for potential issue in respect of our Shareholder Dividend Reinvestment and Share Purchase Plans and 5,490,987 common shares in respect of the exchange of certain shares of BMSCL. We also have reserved 41,146,052 common shares for the potential exercise of stock options, as further described in Note 19.
Note 18 Employee Compensation — Employee Future Benefits
Pensions and Other Employee Future Benefit Plans
We have a number of arrangements in Canada, the United States and the United Kingdom that provide pension and other employee future benefits to our retired and current employees. Pension arrangements include statutory pension plans as well as supplemental arrangements, which provide pension benefits in excess of statutory limits. Generally, we provide retirement benefits based on employees’ years of service and average earnings at the time of retirement and do not require employees to make contributions. Voluntary contributions can be made by employees. Other employee future benefits, including health and dental care benefits and life insurance, are provided for current and retired employees.
Pension and Other Employee Future Benefit Liabilities
We have two benefit liabilities: one for our pension benefits and one for other employee future benefits. These benefit liabilities represent the amount of pension and other employee future benefits that our employees and retirees have earned as at year end.
Our actuaries perform regular valuations of our benefit liabilities for pension and other employee future benefits as at each year end, based on management’s assumptions about discount rates, salary growth, retirement age, mortality and health care cost trend rates. The discount rate is determined by management with reference to market conditions at year end. Other assumptions are determined with reference to long-term expectations.
Components of the change in our benefit liabilities year over year and our pension expense are as follows:
Benefits earned by employeesrepresent benefits earned in the current year. They are determined with reference to the current workforce and the amount of benefits to which they will be entitled upon retirement, based on the provisions of our benefits plans.
Interest cost on the benefit liabilitiesrepresents the increase in the liability that results from the passage of time.
Actuarial gains or lossesmay arise in two ways. First, each year our actuaries recalculate the benefit liabilities and compare them to those estimated as at the prior year end. Any differences that result from changes in assumptions or from plan experience being different from what was expected by management at the previous year end are considered actuarial gains or losses. Secondly, actuarial gains and losses arise when there are differences between expected and actual returns on plan assets.
At the beginning of each year, we determine whether the unrecognized actuarial (gain) loss is more than 10% of the greater of our plan asset or benefit liability balances. Any unrecognized actuarial (gain) loss in excess of this 10% threshold is recognized in expense over the remaining service period of active employees. Amounts below the 10% threshold are not amortized.
Plan amendmentsare changes in our benefit liabilities as a result of changes to provisions of the plans. These amounts are recognized in expense over the remaining service period of active employees.
Expected return on assetsrepresents management’s best estimate of the long-term rate of return on assets applied to the fair value of plan assets. Differences between expected and actual return on assets are included in our actuarial gain or loss balance, as described above.
Settlementsoccur when pension plan participants are paid an amount out of the plan and as a result we no longer have a liability to provide them with plan payments in the future.
Pension and Other Employee Future Benefit Assets
Assets are set aside to satisfy our pension obligation related to statutory pension plans. A retirement compensation arrangement was set up in 2001 to partially fund supplemental pension arrangements in Canada. Retirement benefits for the other supplemental plans are paid out of operations. Our other employee future benefit liability in the United States is partially funded; and our other employee future benefit liability in Canada is unfunded.
Change in Accounting Policy
On November 1, 2000 we adopted a new accounting policy for pension and other employee future benefit plans. The impact of adopting the new standard was recorded as a decrease of $250 million (net of tax of $171 million) in opening retained earnings.
Pension and Other Employee Future Benefit Expenses
Pension and other employee future benefit expenses are determined as follows:
| | | | | | | | | | | | | | | | | | | | | | | | | |
| (Canadian $ in millions, except as noted) | | Pension benefit plans | | Other employee future benefit plans |
| |
| |
|
| | | 2003 | | 2002 | | 2001 | | 2003 | | 2002 | | 2001 |
| | |
| |
| |
| |
| |
| |
|
Annual Benefits Expense | | | | | | | | | | | | | | | | | | | | | | | | |
| Benefits earned by employees | | $ | 111 | | | $ | 105 | | | $ | 93 | | | $ | 17 | | | $ | 13 | | | $ | 13 | |
| Interest cost on accrued benefit liability | | | 196 | | | | 191 | | | | 177 | | | | 38 | | | | 35 | | | | 32 | |
| Actuarial loss recognized in expense (1) | | | 62 | | | | 27 | | | | — | | | | — | | | | 3 | | | | 1 | |
| Amortization of plan amendment costs | | | 3 | | | | 2 | | | | 1 | | | | — | | | | — | | | | — | |
| Amortization of transition amount | | | — | | | | — | | | | (1 | ) | | | — | | | | — | | | | — | |
| Loss realized on settlement of a portion of the benefit liability | | | 4 | | | | — | | | | — | | | | — | | | | — | | | | — | |
| Expected return on plan assets | | | (217 | ) | | | (235 | ) | | | (252 | ) | | | (4 | ) | | | (5 | ) | | | (5 | ) |
| | | |
| | | |
| | | |
| | | |
| | | |
| | | |
| |
| Annual benefits expense | | | 159 | | | | 90 | | | | 18 | | | | 51 | | | | 46 | | | | 41 | |
| Other (includes Canada, Quebec and defined contribution pension plans expense) | | | 54 | | | | 45 | | | | 49 | | | | — | | | | — | | | | — | |
| | | |
| | | |
| | | |
| | | |
| | | |
| | | |
| |
| Total annual pension and other employee future benefit expenses | | $ | 213 | | | $ | 135 | | | $ | 67 | | | $ | 51 | | | $ | 46 | | | $ | 41 | |
| | | |
| | | |
| | | |
| | | |
| | | |
| | | |
| |
Weighted-average assumptions used to determine benefits expense: | | | | | | | | | | | | | | | | | | | | | | | | |
| Discount rate at beginning of year | | | 6.5% | | | | 6.7% | | | | 8.1% | | | | 6.7% | | | | 6.6% | | | | 6.6% | |
| Expected long-term rate of return on plan assets | | | 6.9% | | | | 7.5% | | | | 8.2% | | | | 8.0% | | | | 8.0% | | | | 8.0% | |
| Assumed overall health care cost trend rate | | | na | | | | na | | | | na | | | | 5.3% | | | | 5.6% | | | | 5.9% | |
| | | |
| | | |
| | | |
| | | |
| | | |
| | | |
| |
na — not applicable
BMO FINANCIAL GROUP 186TH ANNUAL REPORT 2003 91
Notes to Consolidated Financial Statements
Summaries of the changes in estimated financial positions of our pension benefit plans and other employee future benefit plans are as follows:
| | | | | | | | | | | | | | | | | | | | | | | | | |
| (Canadian $ in millions, except as noted) | | Pension benefit plans | | Other employee future benefit plans |
| |
| |
|
| | | 2003 | | 2002 | | 2001 | | 2003 | | 2002 | | 2001 |
| | |
| |
| |
| |
| |
| |
|
Benefit liability | | | | | | | | | | | | | | | | | | | | | | | | |
| Benefit liability at beginning of year | | $ | 3,157 | | | $ | 2,903 | | | $ | 2,211 | | | $ | 595 | | | $ | 537 | | | $ | — | |
| Adjustment to adopt change in accounting standard | | | — | | | | — | | | | 402 | | | | — | | | | — | | | | 490 | |
| Benefits earned by employees | | | 111 | | | | 105 | | | | 93 | | | | 17 | | | | 13 | | | | 13 | |
| Interest cost on benefit liability | | | 196 | | | | 191 | | | | 177 | | | | 38 | | | | 35 | | | | 32 | |
| Benefits paid to pensioners and employees | | | (195 | ) | | | (167 | ) | | | (151 | ) | | | (25 | ) | | | (23 | ) | | | (18 | ) |
| Voluntary employee contributions | | | 5 | | | | 5 | | | | 6 | | | | — | | | | — | | | | — | |
| Actuarial loss (1) | | | 159 | | | | 119 | | | | 117 | | | | 170 | | | | 34 | | | | 17 | |
| Plan amendments | | | — | | | | 15 | | | | 24 | | | | (66 | ) | | | — | | | | — | |
| Reduction in liability due to partial settlement | | | (15 | ) | | | — | | | | — | | | | — | | | | — | | | | — | |
| Other, primarily foreign exchange | | | (118 | ) | | | (14 | ) | | | 24 | | | | (18 | ) | | | (1 | ) | | | 3 | |
| | | |
| | | |
| | | |
| | | |
| | | |
| | | |
| |
| Benefit liability at end of year | | $ | 3,300 | | | $ | 3,157 | | | $ | 2,903 | | | $ | 711 | | | $ | 595 | | | $ | 537 | |
| | | |
| | | |
| | | |
| | | |
| | | |
| | | |
| |
Weighted-average assumptions used to determine the benefit liability: | | | | | | | | | | | | | | | | | | | | | | | | |
| Discount rate at end of year | | | 6.2% | | | | 6.5% | | | | 6.7% | | | | 6.4% | | | | 6.7% | | | | 6.6% | |
| Rate of compensation increase | | | 4.2% | | | | 4.1% | | | | 4.2% | | | | 4.1% | | | | 3.7% | | | | 4.2% | |
| Assumed overall health care cost trend rate | | | na | | | | na | | | | na | | | | 8.4% | | | | 5.3% | | | | 5.6% | |
| | | |
| | | |
| | | |
| | | |
| | | |
| | | |
| |
Fair value of plan assets | | | | | | | | | | | | | | | | | | | | | | | | |
| Fair value of plan assets at beginning of year | | $ | 2,912 | | | $ | 2,816 | | | $ | 3,103 | | | $ | 55 | | | $ | 54 | | | $ | — | |
| Transition adjustment to reflect prior funding by U.S. subsidiary | | | — | | | | — | | | | — | | | | — | | | | — | | | | 50 | |
| Actual return on plan assets | | | 223 | | | | (188 | ) | | | (285 | ) | | | 10 | | | | (3 | ) | | | (3 | ) |
| Bank contributions | | | 333 | | | | 454 | | | | 122 | | | | 25 | | | | 27 | | | | 5 | |
| Voluntary employee contributions | | | 5 | | | | 5 | | | | 6 | | | | — | | | | — | | | | — | |
| Benefits paid to pensioners and employees | | | (195 | ) | | | (167 | ) | | | (151 | ) | | | (25 | ) | | | (23 | ) | | | — | |
| Assets paid to participants to settle their pension | | | (17 | ) | | | — | | | | — | | | | — | | | | — | | | | — | |
| Other, primarily foreign exchange | | | (70 | ) | | | (8 | ) | | | 21 | | | | (10 | ) | | | — | | | | 2 | |
| | | |
| | | |
| | | |
| | | |
| | | |
| | | |
| |
| Fair value of plan assets at end of year (2) | | $ | 3,191 | | | $ | 2,912 | | | $ | 2,816 | | | $ | 55 | | | $ | 55 | | | $ | 54 | |
| | | |
| | | |
| | | |
| | | |
| | | |
| | | |
| |
| Plan funded status (3) | | $ | (109 | ) | | $ | (245 | ) | | $ | (87 | ) | | $ | (656 | ) | | $ | (540 | ) | | $ | (483 | ) |
| Unrecognized actuarial loss (1) | | | 1,192 | | | | 1,148 | | | | 633 | | | | 219 | | | | 63 | | | | 25 | |
| Unrecognized cost (benefit) of plan amendments (4) | | | 29 | | | | 33 | | | | 20 | | | | (66 | ) | | | — | | | | — | |
| | | |
| | | |
| | | |
| | | |
| | | |
| | | |
| |
| Net benefit asset (liability) at end of year | | $ | 1,112 | | | $ | 936 | | | $ | 566 | | | $ | (503 | ) | | $ | (477 | ) | | $ | (458 | ) |
| | | |
| | | |
| | | |
| | | |
| | | |
| | | |
| |
Recorded in: | | | | | | | | | | | | | | | | | | | | | | | | |
| Other assets | | $ | 1,171 | | | $ | 1,008 | | | $ | 669 | | | $ | — | | | $ | — | | | $ | — | |
| Other liabilities | | | (59 | ) | | | (72 | ) | | | (103 | ) | | | (503 | ) | | | (477 | ) | | | (458 | ) |
| | | |
| | | |
| | | |
| | | |
| | | |
| | | |
| |
| Net benefit asset (liability) at end of year | | $ | 1,112 | | | $ | 936 | | | $ | 566 | | | $ | (503 | ) | | $ | (477 | ) | | $ | (458 | ) |
| | | |
| | | |
| | | |
| | | |
| | | |
| | | |
| |
The plans paid $4 million for the year ended October 31, 2003 ($5 million in 2002; $4 million in 2001) to us and certain of our subsidiaries for investment management, record-keeping, custodial and administrative services rendered on the same terms that we offer these services to our customers. The plans did not hold any of our shares directly as at October 31, 2003, 2002 and 2001.
na — not applicable
| (1) | | A continuity of our actuarial (gains) losses is as follows: |
| | | | | | | | | | | | | | | | | | | | | | | | | | |
| (Canadian $ in millions) | | Pension benefit plans | | Other employee future benefit plans |
| |
| |
|
| | | 2003 | | 2002 | | 2001 | | 2003 | | 2002 | | 2001 |
| | |
| |
| |
| |
| |
| |
|
| Unrecognized actuarial (gain) loss at beginning of year | | $ | 1,148 | | | $ | 633 | | | $ | (543 | ) | | $ | 63 | | | $ | 25 | | | $ | — | |
| | Adoption of new accounting standard on November 1, 2000 | | | — | | | | — | | | | 523 | | | | — | | | | — | | | | — | |
| | Loss on the benefit liability arising from changes in assumptions | | | 159 | | | | 119 | | | | 117 | | | | 170 | | | | 34 | | | | 17 | |
| | (Excess) shortfall of actual return on plan assets compared to expected return | | | (6 | ) | | | 423 | | | | 537 | | | | (6 | ) | | | 8 | | | | 8 | |
| | Recognition in expense of a portion of the unrecognized actuarial loss | | | (62 | ) | | | (27 | ) | | | — | | | | — | | | | (3 | ) | | | (1 | ) |
| | Impact of foreign exchange and other | | | (47 | ) | | | — | | | | (1 | ) | | | (8 | ) | | | (1 | ) | | | 1 | |
| | | |
| | | |
| | | |
| | | |
| | | |
| | | |
| |
| Unrecognized actuarial loss at end of year | | $ | 1,192 | | | $ | 1,148 | | | $ | 633 | | | $ | 219 | | | $ | 63 | | | $ | 25 | |
| | | |
| | | |
| | | |
| | | |
| | | |
| | | |
| |
| (2) | | Fair value of plan assets at year end are comprised of: |
| | | | | | | | | | | | | | | | | | | | | | | | | |
| | | Pension benefit plans | | Other employee future benefit plans |
| | |
| |
|
| | | 2003 | | 2002 | | 2001 | | 2003 | | 2002 | | 2001 |
| | |
| |
| |
| |
| |
| |
|
| Equities | | | 45% | | | | 53% | | | | 60% | | | | 61% | | | | 65% | | | | 64% | |
| Fixed income investments | | | 42% | | | | 39% | | | | 35% | | | | 30% | | | | 30% | | | | 36% | |
| Other | | | 13% | | | | 8% | | | | 5% | | | | 9% | | | | 5% | | | | — | |
| | | |
| | | |
| | | |
| | | |
| | | |
| | | |
| |
92 BMO FINANCIAL GROUP 186TH ANNUAL REPORT 2003
Notes to Consolidated Financial Statements
| (3) | | The benefit liability and the fair value of plan assets in respect of plans that are not fully funded are as follows: |
| | | | | | | | | | | | | | | | | | | | | | | | | |
| (Canadian $ in millions) | | Pension benefit plans | | Other employee future benefit plans |
| |
| |
|
| | | 2003 | | 2002 | | 2001 | | 2003 | | 2002 | | 2001 |
| | |
| |
| |
| |
| |
| |
|
| | | | | | | | | | | | | | | | | | | | | | | | | |
| Accrued benefit liability | | $ | 883 | | | $ | 926 | | | $ | 763 | | | $ | 711 | | | $ | 595 | | | $ | 537 | |
| Fair value of plan assets | | | 544 | | | | 572 | | | | 596 | | | | 55 | | | | 55 | | | | 54 | |
| | | |
| | | |
| | | |
| | | |
| | | |
| | | |
| |
| Unfunded benefit liability | | $ | 339 | | | $ | 354 | | | $ | 167 | | | $ | 656 | | | $ | 540 | | | $ | 483 | |
| | | |
| | | |
| | | |
| | | |
| | | |
| | | |
| |
| (4) | | A continuity of the unrecognized cost (benefit) of plan amendments is as follows: |
| | | | | | | | | | | | | | | | | | | | | | | | | | |
| (Canadian $ in millions) | | Pension benefit plans | | Other employee future benefit plans |
| |
| |
|
| | | 2003 | | 2002 | | 2001 | | 2003 | | 2002 | | 2001 |
| | |
| |
| |
| |
| |
| |
|
| Unrecognized cost of plan amendments at beginning of year | | $ | 33 | | | $ | 20 | | | $ | 78 | | | $ | — | | | $ | — | | | $ | — | |
| | Adoption of new accounting standard on November 1, 2000 | | | — | | | | — | | | | (83 | ) | | | — | | | | — | | | | — | |
| | Cost (benefit) of plan amendments initiated during the year | | | — | | | | 15 | | | | 24 | | | | (66 | ) | | | — | | | | — | |
| | Recognition in expense of a portion of the unrecognized cost of plan amendments | | | (3 | ) | | | (2 | ) | | | (1 | ) | | | — | | | | — | | | | — | |
| | Impact of foreign exchange | | | (1 | ) | | | — | | | | 2 | | | | — | | | | — | | | | — | |
| | | |
| | | |
| | | |
| | | |
| | | |
| | | |
| |
| Unrecognized cost (benefit) of plan amendments at end of year | | $ | 29 | | | $ | 33 | | | $ | 20 | | | $ | (66 | ) | | $ | — | | | $ | — | |
| | | |
| | | |
| | | |
| | | |
| | | |
| | | |
| |
Sensitivity of Assumptions
Key weighted-average economic assumptions used in measuring the pension benefit liability, the other employee future benefits liability and related expenses are outlined in the adjoining table. The sensitivity analysis provided in the table should be used with caution as it is hypothetical and changes in each key assumption may not be linear. The sensitivities in each key variable have been calculated independently of changes in other key variables.
Actual experience may result in changes in a number of key assumptions simultaneously. Changes in one factor may result in changes in another, which could amplify or reduce certain sensitivities.
| | | | | | | | | | | | | | | | | | | |
| | | | | | | | | | | | | Other employee |
| | | | | Pension | | future benefits |
| | | | |
| |
|
| | | | | Benefit | | Benefits | | Benefit | | Benefits |
| (Canadian $ in millions, except as noted) | | liability | | expense | | liability | | expense |
| |
| |
| |
| |
|
| Expected rate of return on assets (%) | | | na | | | | 6.9 | | | | na | | | | — | |
| | Impact of: | 1% increase | | | na | | | $ | (31 | ) | | | na | | | $ | — | |
| | | 1% decrease | | | na | | | $ | 31 | | | | na | | | $ | — | |
| | | |
| | | |
| | | |
| | | |
| |
| Discount rate (%) | | | 6.2 | | | | 6.5 | | | | 6.4 | | | | 6.7 | |
| | Impact of: | 1% increase | | $ | (368 | ) | | $ | (13 | ) | | $ | (91 | ) | | $ | (4 | ) |
| | | 1% decrease | | $ | 450 | | | $ | 16 | | | $ | 115 | | | $ | 4 | |
| | | |
| | | |
| | | |
| | | |
| |
| Rate of compensation increase (%) | | | 4.2 | | | | 4.1 | | | | 4.1 | | | | 3.7 | |
| | Impact of: | .25% increase | | $ | 26 | | | $ | 3 | | | $ | 1 | | | $ | — | |
| | | .25% decrease | | $ | (24 | ) | | $ | (3 | ) | | $ | (1 | ) | | $ | — | |
| | | |
| | | |
| | | |
| | | |
| |
| Assumed overall health care cost trend (%) | | | na | | | | na | | | | 8.4 | (1) | | | 5.3 | (2) |
| | Impact of: | 1% increase | | | na | | | | na | | | $ | 91 | | | $ | 8 | |
| | | 1% decrease | | | na | | | | na | | | $ | (73 | ) | | $ | (6 | ) |
| | | |
| | | |
| | | |
| | | |
| |
| (1) | | Trending to 4.5% in 2013 and remaining at that level thereafter. |
| (2) | | Trending to 4.3% in 2005 and remaining at that level thereafter. |
Note 19 Employee Compensation — Stock-Based Compensation
Stock Option Plan
We maintain a Stock Option Plan for designated officers and employees. The options granted under the plan from 1995 to 1999 vest five fiscal years from November 1 of the year in which the options were granted to the officer or employee, if we have met certain performance targets. The options granted since 1999 vest 25% per year over a four-year period starting from their grant date. A portion of the options granted since 1999 are subject to performance targets. All options expire 10 years from the date they are granted.
Prior to November 1, 2002, when stock options were granted, no compensation expense was recorded. When stock options were exercised, we included the amount of the proceeds in share capital.
The following table summarizes information about our stock option plan:
| | | | | | | | | | | | | | | | | | | | | | | | | |
| (Canadian $, except as noted) | | 2003 | | 2002 | | 2001 |
| |
| |
| |
|
| | | Number | | Weighted- | | Number | | Weighted- | | Number | | Weighted- |
| | | of stock | | average | | of stock | | average | | of stock | | average |
| | | options | | exercise price | | options | | exercise price | | options | | exercise price |
| | |
| |
| |
| |
| |
| |
|
| Outstanding at beginning of year | | | 38,374,627 | | | $ | 30.21 | | | | 32,997,743 | | | $ | 28.31 | | | | 33,548,918 | | | $ | 18.64 | |
| Granted | | | 2,244,800 | | | | 40.90 | | | | 7,485,500 | | | | 35.70 | | | | 6,774,750 | | | | 38.45 | |
| Exercised | | | 5,325,916 | | | | 23.45 | | | | 1,923,115 | | | | 18.87 | | | | 6,177,235 | | | | 17.72 | |
| Forfeited/cancelled | | | 81,071 | | | | 34.00 | | | | 185,501 | | | | 31.63 | | | | 1,148,690 | | | | 28.31 | |
| | | |
| | | |
| | | |
| | | |
| | | |
| | | |
| |
| Outstanding at end of year | | | 35,212,440 | | | | 31.89 | | | | 38,374,627 | | | | 30.21 | | | | 32,997,743 | | | | 28.31 | |
| Exercisable at end of year | | | 13,337,147 | | | | 28.29 | | | | 11,955,097 | | | | 23.95 | | | | 7,443,288 | | | | 21.92 | |
| Available for grant | | | 6,080,612 | | | | | | | | 3,097,341 | | | | | | | | 10,342,140 | | | | | |
| Outstanding stock options as a % of outstanding shares | | | 7.05% | | | | | | | | 7.79% | | | | | | | | 6.75% | | | | | |
| | | |
| | | | | | | |
| | | | | | | |
| | | | | |
No stock options expired during the years ended October 31, 2003, 2002 and 2001.
BMO FINANCIAL GROUP 186TH ANNUAL REPORT 2003 93
Notes to Consolidated Financial Statements
Options outstanding and options exercisable as at October 31, 2003 by range of exercise price are as follows:
| | | | | | | | | | | | | | | | | | | | | |
| (Canadian $, except as noted) | | Options outstanding | | Options exercisable |
| |
| |
|
| | | | | | | Weighted- | | | | | | |
| | | | | | | average | | | | | | |
| | | Number | | remaining | | Weighted- | | Number | | Weighted- |
| | | of stock | | contractual life | | average | | of stock | | average |
| Range of exercise prices | | options | | (years) | | exercise price | | options | | exercise price |
| |
| |
| |
| |
| |
|
| $20.00 and less | | | 2,966,049 | | | | 2.6 | | | $ | 18.12 | | | | 2,966,049 | | | $ | 18.12 | |
| $20.01 to $30.00 | | | 6,325,249 | | | | 6.0 | | | $ | 25.60 | | | | 3,957,706 | | | $ | 25.60 | |
| $30.01 to $35.00 | | | 9,894,467 | | | | 4.8 | | | $ | 30.85 | | | | 3,458,248 | | | $ | 32.09 | |
| $35.01 to $42.62 | | | 15,888,875 | | | | 7.7 | | | $ | 37.52 | | | | 2,859,344 | | | $ | 37.47 | |
| $42.63 and over | | | 137,800 | | | | 5.5 | | | $ | 42.87 | | | | 95,800 | | | $ | 42.70 | |
| | | |
| | | |
| | | |
| | | |
| | | |
| |
Change in Accounting Policy
On November 1, 2002, we changed our accounting for stock options granted on or after that date. Under the new policy, we determine the fair value of stock options on their grant date and record this amount as compensation expense over the period that the stock options vest, with a corresponding increase to contributed surplus. When these stock options are exercised, we record the amount of proceeds, together with the amount recorded in contributed surplus, in share capital. Employee compensation expense increased and net income decreased by $3 million in fiscal 2003 as a result of this change in accounting policy.
We determine the fair value of options granted using the Rolle-Geske Option Pricing Model. The weighted-average fair value of options granted during the years ended October 31, 2003, 2002 and 2001 was $7.85, $7.02 and $8.17, respectively. The following weighted-average assumptions were used to determine the fair value of options on the date of grant:
| | | | | | | | | | | | | |
| | | 2003 | | 2002 | | 2001 |
| | |
| |
| |
|
| Expected dividend yield | | | 3.2% | | | | 3.6% | | | | 2.9% | |
| Expected share price volatility | | | 23.4% | | | | 23.4% | | | | 22.1% | |
| Risk-free rate of return | | | 4.8% | | | | 5.5% | | | | 6.1% | |
| Expected period until exercise | | 7.1 years | | | 7.0 years | | | 7.0 years | |
| | | |
| | | |
| | | |
| |
We will not record any compensation expense for stock options granted in prior years. When these stock options are exercised, we will include the amount of proceeds in share capital. The impact on our net income and earnings per share if we had recorded employee compensation expense in the current and prior years based on the fair value of all of our outstanding stock options on their grant date is as follows:
| | | | | | | | | | | | | | |
| (Canadian $ in millions, except as noted) | | 2003 | | 2002 | | 2001 |
| |
| |
| |
|
| Stock option expense included in employee compensation expense | | $ | 3 | | | $ | — | | | $ | — | |
| | | |
| | | |
| | | |
| |
| Net income, as reported | | $ | 1,825 | | | $ | 1,417 | | | $ | 1,471 | |
| Additional expense that would have been recorded if we had expensed all outstanding stock options granted before November 1, 2002 | | | 43 | | | | 47 | | | | 40 | |
| | | |
| | | |
| | | |
| |
| Pro forma net income | | $ | 1,782 | | | $ | 1,370 | | | $ | 1,431 | |
| | | |
| | | |
| | | |
| |
| Earnings per share (Canadian $) | | | | | | | | | | | | |
| | Basic, as reported | | $ | 3.51 | | | $ | 2.73 | | | $ | 2.72 | |
| | Basic, pro forma | | | 3.43 | | | | 2.63 | | | | 2.64 | |
| | Diluted, as reported | | | 3.44 | | | | 2.68 | | | | 2.66 | |
| | Diluted, pro forma | | | 3.35 | | | | 2.59 | | | | 2.59 | |
| | | |
| | | |
| | | |
| |
Other Stock-Based Compensation Plans
Share Purchase Plan
We offer our employees the option of contributing a portion of their gross salary toward the purchase of our common shares. For employee contributions up to 6% of gross pay, we match 50% of the contribution.
We account for our contribution as employee compensation expense when it is contributed to the plan.
Employee compensation expense related to this plan for the years ended October 31, 2003, 2002 and 2001 was $29 million, $26 million and $26 million, respectively.
Mid-Term Incentive Program
We offer a mid-term incentive program for executives and certain senior employees. Under this program, a cash bonus is paid at the end of each three-year period. The amount of the bonus is adjusted to reflect dividends and changes in the market value of our common shares. For executives and the majority of senior employee grants, a portion of the bonus also varies based on performance targets driven by annualized total shareholder return compared with that of our competitors.
Employee compensation expense for this program is recorded over the three-year performance cycle for the program. The amount of compensation expense is adjusted over the three-year performance cycle to reflect the current market value of our common shares and our total shareholder return relative to those of our competitors.
During fiscal 2003 we entered into an agreement with a third party to assume our obligation related to the fiscal 2003 mid-term incentive program in exchange for a cash payment of $105 million. A similar agreement was entered into in fiscal 2002 related to the fiscal 2002 mid-term incentive program for a payment of $58 million. These amounts will be recorded as employee compensation expense over the three-year performance cycle of the plan on a straight-line basis. Any future payments required under these plans will be the responsibility of the third party.
Employee compensation expense related to this program for the years ended October 31, 2003, 2002 and 2001 was $97 million, $47 million and $51 million, respectively.
Deferred Bonus Plans
We offer deferred bonus plans for certain senior executives and certain key employees in our Investment Banking and Private Client Groups. Under these plans, payment of annual bonuses can be deferred as stock units of our common shares. The amount of deferred bonus is adjusted to reflect dividends and changes in the market value of our common shares.
Depending on the plan, deferred bonuses can be paid upon retirement, resignation, evenly at the end of each year over the three years following the year in which the bonus is earned, or in a lump sum at the end of the three-year period. The bonus may be paid in cash, common shares or a combination of both.
Employee compensation expense for these plans is recorded in the year the bonus is earned. Changes in the amount of the bonus payable as a result of dividends and share price movements are recorded as employee compensation expense in the period of the change.
We have entered into derivative instruments in order to hedge our exposure to these plans. Changes in the fair value of these derivatives are recorded as employee compensation expense in the period in which they arise.
Employee compensation expense related to these plans for the years ended October 31, 2003, 2002 and 2001 was $26 million, $18 million and $25 million, respectively, net of the impact of hedging.
94 BMO FINANCIAL GROUP 186TH ANNUAL REPORT 2003
Notes to Consolidated Financial Statements
Note 20 Income Taxes
We report our provision for income taxes in our Consolidated Statement of Income based upon transactions recorded in our consolidated financial statements regardless of when they are recognized for income tax purposes, with the exception noted below for repatriation of retained earnings from our foreign subsidiaries.
In addition, we record income tax expense or benefit directly in retained earnings for the tax effects of those items recorded in shareholders’ equity.
The net future income tax asset included in other assets is the cumulative amount of tax applicable to temporary differences between the accounting and tax values of our assets and liabilities. Future income tax assets and liabilities are measured at the tax rates expected to apply when these differences reverse. Changes in future income tax assets and liabilities related to a change in tax rates are recorded in income in the period of the tax rate change.
We expect that we will realize our future income tax assets in the normal course of our operations.
Components of Future Income Tax Balances
| | | | | | | | | |
| (Canadian $ in millions) | | 2003 | | 2002 |
| |
| |
|
Future Income Tax Assets | | | | | | | | |
| Allowance for credit losses | | $ | 500 | | | $ | 508 | |
| Employee future benefits | | | 159 | | | | 165 | |
| Deferred compensation benefits | | | 148 | | | | 140 | |
| Other | | | 136 | | | | 119 | |
| | | |
| | | |
| |
| Total future income tax assets | | | 943 | | | | 932 | |
| | | |
| | | |
| |
Future Income Tax Liabilities | | | | | | | | |
| Premises and equipment | | | (307 | ) | | | (394 | ) |
| Pension | | | (360 | ) | | | (290 | ) |
| Amortization of intangibles | | | (80 | ) | | | (81 | ) |
| Other | | | (50 | ) | | | (58 | ) |
| | | |
| | | |
| |
| Total future income tax liabilities | | | (797 | ) | | | (823 | ) |
| | | |
| | | |
| |
| Net future income tax asset | | $ | 146 | | | $ | 109 | |
| | | |
| | | |
| |
Provision for Income Taxes
| | | | | | | | | | | | | | | |
| (Canadian $ in millions) | | 2003 | | 2002 | | 2001 |
| |
| |
| |
|
Consolidated Statement of Income | | | | | | | | | | | | |
| Provision for income taxes | | $ | 688 | | | $ | 424 | | | $ | 501 | |
| Income tax (benefit) related to amortization of goodwill | | | — | | | | — | | | | (6 | ) |
Shareholders’ Equity | | | | | | | | | | | | |
| Income tax expense (benefit) related to: | | | | | | | | | | | | |
| | Foreign currency gains (losses) on translation of net investments in foreign operations | | | 601 | | | | 81 | | | | (178 | ) |
| | Other | | | — | | | | (4 | ) | | | (172 | ) |
| | | |
| | | |
| | | |
| |
| Total | | $ | 1,289 | | | $ | 501 | | | $ | 145 | |
| | | |
| | | |
| | | |
| |
Components of Total Income Taxes | | | | | | | | | | | | |
| Canada: | Current income taxes | | | | | | | | | | | | |
| | | Federal | | $ | 752 | | | $ | 207 | | | $ | 95 | |
| | | Provincial | | | 294 | | | | 46 | | | | 32 | |
| | | |
| | | |
| | | |
| |
| | | | 1,046 | | | | 253 | | | | 127 | |
| | | |
| | | |
| | | |
| |
| Canada: | Future income taxes | | | | | | | | | | | | |
| | | Federal | | | 7 | | | | 132 | | | | (108 | ) |
| | | Provincial | | | 2 | | | | 44 | | | | (36 | ) |
| | | |
| | | |
| | | |
| |
| | | | 9 | | | | 176 | | | | (144 | ) |
| | | |
| | | |
| | | |
| |
| Total Canadian | | | 1,055 | | | | 429 | | | | (17 | ) |
| | | |
| | | |
| | | |
| |
| Foreign: | Current income taxes | | | 280 | | | | (35 | ) | | | 198 | |
| | Future income taxes | | | (46 | ) | | | 107 | | | | (36 | ) |
| | | |
| | | |
| | | |
| |
| Total foreign | | | 234 | | | | 72 | | | | 162 | |
| | | |
| | | |
| | | |
| |
| Total | | $ | 1,289 | | | $ | 501 | | | $ | 145 | |
| | | |
| | | |
| | | |
| |
Set out below is a reconciliation of our statutory tax rates and income tax that would be payable at these rates to the effective income tax rates and provision for income taxes that we have recorded in our Consolidated Statement of Income:
| | | | | | | | | | | | | | | | | | | | | | | | | | |
| (Canadian $ in millions, except as noted) | | 2003 | | 2002 | | 2001 |
| |
| |
| |
|
| Combined Canadian federal and provincial income taxes at the statutory tax rate | | $ | 935 | | | | 36.2% | | | $ | 727 | | | | 38.3% | | | $ | 848 | | | | 41.0% | |
| Increase (decrease) resulting from: | | | | | | | | | | | | | | | | | | | | | | | | |
| | Tax-exempt income | | | (112 | ) | | | (4.4 | ) | | | (99 | ) | | | (5.2 | ) | | | (93 | ) | | | (4.5 | ) |
| | Foreign operations subject to different tax rates | | | (153 | ) | | | (5.9 | ) | | | (197 | ) | | | (10.3 | ) | | | (161 | ) | | | (7.8 | ) |
| | Non-taxable portion of gain on sale of investment in Bancomer | | | — | | | | — | | | | — | | | | — | | | | (83 | ) | | | (4.0 | ) |
| | Large corporations tax | | | 7 | | | | 0.3 | | | | 15 | | | | 0.8 | | | | 15 | | | | 0.7 | |
| | Change in tax rate for future income taxes | | | 10 | | | | 0.4 | | | | 9 | | | | 0.4 | | | | 38 | | | | 1.9 | |
| | Intangible assets not deductible for tax purposes | | | 14 | | | | 0.6 | | | | 16 | | | | 0.8 | | | | 11 | | | | 0.5 | |
| | Other | | | (13 | ) | | | (0.5 | ) | | | (47 | ) | | | (2.5 | ) | | | (74 | ) | | | (3.6 | ) |
| | | |
| | | |
| | | |
| | | |
| | | |
| | | |
| |
| Provision for income taxes and effective tax rate | | $ | 688 | | | | 26.7% | | | $ | 424 | | | | 22.3% | | | $ | 501 | | | | 24.2% | |
| | | |
| | | |
| | | |
| | | |
| | | |
| | | |
| |
Income which we earn in foreign countries through our branches or subsidiaries is generally subject to tax in those countries. We are also subject to Canadian taxation on the income earned in our foreign branches. Canada allows a credit for foreign taxes paid on this income. Upon repatriation of earnings from certain foreign subsidiaries, we would be required to pay tax on certain of these earnings. As repatriation of such earnings is not planned in the foreseeable future, we have not recorded the related future income tax liability. Canadian and foreign taxes that would be payable if all of our foreign subsidiaries’ earnings were repatriated as at October 31, 2003, 2002 and 2001 are estimated to be $490 million, $530 million and $501 million, respectively.
BMO FINANCIAL GROUP 186TH ANNUAL REPORT 2003 95
Notes to Consolidated Financial Statements
Note 21 Earnings Per Share
Basic Earnings per Share
Our basic earnings per share is calculated by dividing our net income, after deducting total preferred share dividends, by the daily average number of fully paid common shares outstanding throughout the year.
Basic earnings per share
| | | | | | | | | | | | | |
| (Canadian $ in millions, except as noted) | | 2003 | | 2002 | | 2001 |
| |
| |
| |
|
| Net income before goodwill amortization | | $ | 1,825 | | | $ | 1,417 | | | $ | 1,527 | |
| Dividends on preferred shares | | | (82 | ) | | | (79 | ) | | | (80 | ) |
| | | |
| | | |
| | | |
| |
| Net income before goodwill amortization available to common shareholders | | | 1,743 | | | | 1,338 | | | | 1,447 | |
| Amortization of goodwill | | | — | | | | — | | | | (56 | ) |
| | | |
| | | |
| | | |
| |
| Net income available to common shareholders | | $ | 1,743 | | | $ | 1,338 | | | $ | 1,391 | |
| | | |
| | | |
| | | |
| |
| Average number of common shares outstanding (in thousands) | | | 496,208 | | | | 490,816 | | | | 511,286 | |
| | | |
| | | |
| | | |
| |
| (Canadian $) | | | | | | | | | | | | |
| Basic earnings per share before goodwill amortization | | $ | 3.51 | | | $ | 2.73 | | | $ | 2.83 | |
| Basic earnings per share | | | 3.51 | | | | 2.73 | | | | 2.72 | |
| | | |
| | | |
| | | |
| |
Diluted Earnings per Share
Diluted earnings per share represents what our earnings per share would have been if any instruments convertible into common shares had been converted into common shares during the year.
Convertible Shares
We increase net income before goodwill amortization by dividends paid on convertible shares as these dividends would not have been paid if the shares had been converted at the beginning of the year. Similarly, we increase the average number of common shares outstanding by the number of shares that would have been issued had the conversion taken place at the beginning of the year.
Our Series 3, 4, 6 and 10 Class B Preferred shares, in certain circumstances, are convertible into common shares. These conversions are not included in the calculation of diluted earnings per share as we have the option to settle in cash instead of common shares.
Employee Stock Options
We increase the average number of common shares outstanding by the number of shares that would have been issued if all stock options with a strike price below the average share price for the year had been exercised. We also decrease the average number of common shares outstanding by the number of our common shares that we could have repurchased if we had used the proceeds from the exercise of stock options to repurchase them on the open market at the average share price for the year. We do not adjust for stock options with a strike price above the average share price for the year because including them would increase our earnings per share, not dilute it.
Diluted earnings per share
| | | | | | | | | | | | | |
| (Canadian $ in millions, except as noted) | | 2003 | | 2002 | | 2001 |
| |
| |
| |
|
| Net income before goodwill amortization available to common shareholders | | $ | 1,743 | | | $ | 1,338 | | | $ | 1,447 | |
| Dividends on convertible shares | | | 1 | | | | 1 | | | | 2 | |
| | | |
| | | |
| | | |
| |
| Net income before goodwill amortization adjusted for dilution effect | | | 1,744 | | | | 1,339 | | | | 1,449 | |
| Amortization of goodwill | | | — | | | | — | | | | (56 | ) |
| | | |
| | | |
| | | |
| |
| Net income adjusted for dilution effect | | $ | 1,744 | | | $ | 1,339 | | | $ | 1,393 | |
| | | |
| | | |
| | | |
| |
| Average number of common shares outstanding (in thousands) | | | 496,208 | | | | 490,816 | | | | 511,286 | |
| Convertible shares | | | 996 | | | | 1,278 | | | | 2,213 | |
| Stock options potentially exercisable (1) | | | 36,608 | | | | 30,575 | | | | 31,742 | |
| Shares potentially repurchased (2) | | | (26,803 | ) | | | (23,205 | ) | | | (21,680 | ) |
| | | |
| | | |
| | | |
| |
| Average diluted number of common shares outstanding (in thousands) | | | 507,009 | | | | 499,464 | | | | 523,561 | |
| | | |
| | | |
| | | |
| |
| (Canadian $) | | | | | | | | | | | | |
| Diluted earnings per share before goodwill amortization | | $ | 3.44 | | | $ | 2.68 | | | $ | 2.77 | |
| Diluted earnings per share | | | 3.44 | | | | 2.68 | | | | 2.66 | |
| | | |
| | | |
| | | |
| |
| (1) | | In computing diluted earnings per share, we excluded average stock options outstanding of 455,282, 7,884,526 and 1,763,506 with weighted-average exercise prices of $41.21, $38.11 and $38.70 for the years ended October 31, 2003, 2002 and 2001, respectively. |
| (2) | | The number of shares potentially repurchased is determined by computing a weighted average of the number of shares potentially repurchased in each quarter. |
Note 22 Operating and Geographic Segmentation
We conduct our business through operating segments, each of which has a distinct market and product mandate. Our Personal and Commercial Client Group provides financial services to personal and commercial customers; our Private Client Group provides wealth management services; and our Investment Banking Group offers corporate, institutional and government clients comprehensive financial services including advisory, investment and operating services.
In addition, Corporate Support, including Technology and Solutions, provides enterprise-wide services including overall technology support and risk management.
Information concerning these operating segments, including disclosure of their revenues, expenses, net income, average assets, loans and deposits, is presented in the tables on pages 27, 31, 35, 39 and 40 of our Management’s Discussion and Analysis.
Note 23 Related Party Transactions
We provide banking services to our joint ventures and equity-accounted investments on the same terms that we offer to our customers.
Effective September 1, 1999, new loans and mortgages to executive officers were no longer available at preferred rates, other than mortgages for Bank-initiated transfers and credit card loans to employees; a select suite of customer loan and mortgage products is now offered to employees at rates normally accorded to preferred customers. Existing loans and mortgages at preferred rates will be phased out by September 1, 2004.
Prior to September 1, 1999, loans to executive officers for personal purposes, principally for consumer purchases, home improvements and sundry investments, were made available at an interest rate of one-half of the Bank’s prime rate to a maximum of $25,000. Loans in excess of this amount were available at prime rate.
The interest earned on these loans is recorded in interest, dividend and fee income in our Consolidated Statement of Income.
The amounts outstanding under these preferred rate loan agreements are:
| | | | | | | | | |
| (Canadian $ in millions) | | 2003 | | 2002 |
| |
| |
|
| Mortgage loans | | $ | 155 | | | $ | 223 | |
| Personal loans | | | 73 | | | | 106 | |
| | | |
| | | |
| |
| Total | | $ | 228 | | | $ | 329 | |
| | | |
| | | |
| |
Beginning in fiscal 2002, we introduced a stock option plan for non-officer directors, the terms of which are the same as the plans for designated officers and employees described in Note 19. During the fiscal year 2003, we granted 42,000 stock options at an exercise price of $43.25 per share. During 2002, we issued 105,000 stock options at an exercise price of $36.01 per share.
The Bank’s Board of Directors have a plan which requires directors to be paid at least 50% of their annual retainer in the form of either common shares of the Bank (purchased on the open market) or deferred share units. Directors may elect to take 100% of their
96 BMO FINANCIAL GROUP 186TH ANNUAL REPORT 2003
Notes to Consolidated Financial Statements
annual retainer and other fees in this form. Deferred share units allocated under the plan are adjusted to reflect dividends and changes in the market value of our common shares. The value of these deferred share units will be paid when the director resigns from the Bank’s Board of Directors. Expenses related to these deferred share units were $2 million, $2 million and $1 million for the years ended October 31, 2003, 2002 and 2001, respectively, and were included in other expenses in our Consolidated Statement of Income.
Note 24 Risk Management
Our business necessitates the management of several categories of risk, including credit, market, liquidity and operational risks. Certain information about our exposure to these risks is set out in Notes 3, 4, 9 and 26. A summary of our interest rate gap position and effective interest rates on our financial instrument assets and liabilities is set out on page 64 of our Management’s Discussion and Analysis.
Note 25 Contingent Liabilities
During the year, claims were made against the Bank in relation to the termination of certain derivative positions. Based upon information presently available, counsel for Bank of Montreal is not in a position to express an opinion as to the likely outcome of any of these actions. Management is of the view that the Bank has strong defences to these claims, including offsetting counterclaims.
BMO Nesbitt Burns Inc., an indirect subsidiary of Bank of Montreal, has been named as a defendant in several class and individual actions in Canada and a class action in the United States brought on behalf of shareholders of Bre-X Minerals Ltd. (“Bre-X”). Other defendants named in one or more of these actions include Bre-X, officers and directors of Bre-X, a mining consulting firm retained by Bre-X, Bre-X’s financial advisor, brokerage firms which sold Bre-X common stock, and a major gold production company. These actions are largely based on allegations of negligence, negligent or fraudulent misrepresentation and a breach of theU.S. Securities Exchange Act of 1934(United States only), in connection with the sale of Bre-X securities. Two of the proposed class actions in Canada have been dismissed as to BMO Nesbitt Burns Inc. All of the other actions are at a preliminary stage. Based upon information presently available, counsel for BMO Nesbitt Burns Inc. is not in a position to express an opinion as to the likely outcome of any of these actions. Management is of the view that BMO Nesbitt Burns Inc. has strong defences and will vigorously defend against all such actions.
In the bankruptcy of Adelphia Communications Corporation (“Adelphia”), the Official Committees of Unsecured Creditors and Equity Holders have applied for leave to file Complaints against the Bank, Harris Nesbitt Corp., and approximately 380 financial institutions. The Complaints allege various causes of action arising out of the relationship between the Bank and its subsidiary, Adelphia and various of its subsidiaries, and the Rigas family and certain entities owned or controlled by that family. Proceedings relating to these Complaints are in the initial stages and counsel is not in a position to express an opinion on the possible outcome. Management is of the view that the Bank and Harris Nesbitt Corp. have strong defences to these Complaints.
The Bank and its subsidiaries are party to other legal proceedings in the ordinary course of their businesses. Management does not expect the outcome of any of these other proceedings, individually or in the aggregate, to have a material adverse effect on the consolidated financial position or results of the Bank’s operations.
In the normal course of our business, we pledge assets as security for various liabilities that we incur. The following tables summarize our pledged assets, to whom they are pledged and in relation to what activity:
| | | | | | | | | | |
| (Canadian $ in millions) | | 2003 | | 2002 |
| |
| |
|
| Cash resources | | $ | 10 | | | $ | 78 | |
| Securities | | | | | | | | |
| | Issued or guaranteed by Canada | | | 4,799 | | | | 5,606 | |
| | Issued or guaranteed by a Canadian province, municipality or school corporation | | | 1,457 | | | | 886 | |
| | Other securities | | | 12,055 | | | | 12,032 | |
| Other assets | | | 18,204 | | | | 18,816 | |
| | | |
| | | |
| |
| Total assets pledged | | $ | 36,525 | | | $ | 37,418 | |
| | | |
| | | |
| |
Excludes restricted cash resources disclosed in Note 2.
| | | | | | | | | |
| (Canadian $ in millions) | | 2003 | | 2002 |
| |
| |
|
Assets pledged to: | | | | | | | | |
| Clearing systems, payment systems and depositories | | $ | 1,096 | | | $ | 1,509 | |
Assets pledged in relation to: | | | | | | | | |
| Obligations related to securities sold under repurchase agreements | | | 23,748 | | | | 24,324 | |
| Securities borrowing and lending | | | 8,997 | | | | 8,810 | |
| Derivatives transactions | | | 1,052 | | | | 695 | |
| Other | | | 1,632 | | | | 2,080 | |
| | | |
| | | |
| |
| Total | | $ | 36,525 | | | $ | 37,418 | |
| | | |
| | | |
| |
Excludes cash pledged with central banks disclosed as restricted cash in Note 2.
Note 26 Fair Value of Financial Instruments
As a financial institution, we record trading assets at market values and non-trading assets and liabilities at their original amortized cost less allowances or write-downs for impairment. Fair value is subjective in nature, requiring a variety of valuation techniques and assumptions. The values are based upon the estimated amounts for individual assets and liabilities and do not include an estimate of the fair value of any of the legal entities or underlying operations that comprise our business.
Fair value amounts disclosed represent point-in-time estimates that may change in subsequent reporting periods due to market conditions or other factors. Fair value generally represents our estimate of the amounts we could exchange the financial instruments for with third parties who were interested in acquiring the instruments. In most cases, however, the financial instruments are not typically exchangeable or exchanged and therefore it is difficult to determine their fair value. In those cases, we have estimated fair value assuming that we will not sell the assets or liabilities, taking into account only changes in interest rates and credit risk that have occurred since we acquired them or entered into a contract. These calculations represent management’s best estimates based on a range of methodologies and assumptions; since they involve uncertainties, the results may not be realized in an actual sale or immediate settlement of the instruments.
Interest rate changes are the main cause of changes in the fair value of our financial instruments.
Premises and equipment, goodwill and intangible assets are not financial instruments and have been excluded from our estimate of fair value. The net amounts excluded totalled $3,968 million as at October 31, 2003 and $4,360 million as at October 31, 2002.
Determination of Fair Value
Fair value is assumed to equal book value for acceptance assets and liabilities, securities sold but not yet purchased and securities sold under repurchase agreements due to the short-term nature of these assets and liabilities. Fair value is also assumed to equal book value for our cash resources, other assets and other liabilities.
BMO FINANCIAL GROUP 186TH ANNUAL REPORT 2003 97
Notes to Consolidated Financial Statements
Loans
In determining the fair value of our loans, we incorporate the following assumptions:
| • | | For fixed rate performing loans, we discount the remaining contractual cash flows at market interest rates currently charged for loans with similar terms and risks. |
| • | | For floating rate performing loans, changes in interest rates have minimal impact on fair value since loans reprice to market frequently. On that basis, fair value is assumed to equal book value. |
The adjusted amount of our loan balances determined based on the above assumptions is further reduced by the allowance for credit losses to determine the fair value of our loan portfolio.
Deposits
In determining the fair value of our deposits, we incorporate the following assumptions:
| • | | For fixed rate, fixed maturity deposits, we discount the remaining contractual cash flows for these deposits at market interest rates currently offered for deposits with similar terms and risks. |
| • | | For floating rate, fixed maturity deposits, changes in interest rates have minimal impact on fair value since deposits reprice to market frequently. On that basis, fair value is assumed to equal book value. |
| • | | For deposits with no defined maturities, we consider fair value to equal book value based on book value being equivalent to the amount payable on the reporting date. |
Subordinated Debt
The fair value of our subordinated debt is determined by referring to current market prices for similar debt instruments.
Set out below is a comparison of the amounts which would be reported if all of our financial instrument assets and liabilities were reported at their fair values (assets and liabilities that are not financial instruments are excluded from this table):
| | | | | | | | | | | | | | | | | | | | | | | | | | | | | | | | | |
| (Canadian $ in millions) | | 2003 | | 2002 |
| |
| |
|
| | | | | | | Fair value | | Fair value | | Fair value | | | | | | Fair value | | Fair value | | Fair value |
| | | Book | | of assets and | | of hedging | | over (under) | | Book | | of assets and | | of hedging | | over (under) |
| | | value | | liabilities | | derivatives (1) | | book value | | value | | liabilities | | derivatives (1) | | book value |
| | |
| |
| |
| |
| |
| |
| |
| |
|
Assets | | | | | | | | | | | | | | | | | | | | | | | | | | | | | | | | |
| Cash resources | | $ | 19,860 | | | $ | 19,860 | | | $ | — | | | $ | — | | | $ | 19,305 | | | $ | 19,305 | | | $ | — | | | $ | — | |
| Securities (Note 3) | | | 54,790 | | | | 55,102 | | | | (170 | ) | | | 142 | | | | 43,715 | | | | 44,036 | | | | (344 | ) | | | (23 | ) |
| Loans and customers’ liability under acceptances, net of the allowance for credit losses | | | 146,156 | | | | 146,686 | | | | 9 | | | | 539 | | | | 149,596 | | | | 149,872 | | | | 48 | | | | 324 | |
| Derivative financial instruments — trading (Note 9) | | | 20,878 | | | | 20,878 | | | | — | | | | — | | | | 21,932 | | | | 21,932 | | | | — | | | | — | |
| Other assets | | | 10,504 | | | | 10,504 | | | | — | | | | — | | | | 13,780 | | | | 13,780 | | | | — | | | | — | |
| | | |
| | | |
| | | |
| | | |
| | | |
| | | |
| | | |
| | | |
| |
| | | $ | 252,188 | | | $ | 253,030 | | | $ | (161 | ) | | $ | 681 | | | $ | 248,328 | | | $ | 248,925 | | | $ | (296 | ) | | $ | 301 | |
| | | |
| | | |
| | | |
| | | |
| | | |
| | | |
| | | |
| | | |
| |
Liabilities | | | | | | | | | | | | | | | | | | | | | | | | | | | | | | | | |
| Deposits | | $ | 171,551 | | | $ | 172,431 | | | $ | (389 | ) | | $ | 491 | | | $ | 161,838 | | | $ | 162,628 | | | $ | (546 | ) | | $ | 244 | |
| Derivative financial instruments — trading (Note 9) | | | 20,375 | | | | 20,375 | | | | — | | | | — | | | | 21,927 | | | | 21,927 | | | | — | | | | — | |
| Acceptances | | | 5,611 | | | | 5,611 | | | | — | | | | — | | | | 6,901 | | | | 6,901 | | | | — | | | | — | |
| Securities sold but not yet purchased | | | 8,255 | | | | 8,255 | | | | — | | | | — | | | | 7,654 | | | | 7,654 | | | | — | | | | — | |
| Securities sold under repurchase agreements | | | 23,765 | | | | 23,765 | | | | — | | | | — | | | | 24,796 | | | | 24,796 | | | | — | | | | — | |
| Other liabilities | | | 11,259 | | | | 11,259 | | | | — | | | | — | | | | 13,892 | | | | 13,892 | | | | — | | | | — | |
| Subordinated debt | | | 2,856 | | | | 3,165 | | | | 6 | | | | 315 | | | | 3,794 | | | | 4,145 | | | | (4 | ) | | | 347 | |
| | | |
| | | |
| | | |
| | | |
| | | |
| | | |
| | | |
| | | |
| |
| | | $ | 243,672 | | | $ | 244,861 | | | $ | (383 | ) | | $ | 806 | | | $ | 240,802 | | | $ | 241,943 | | | $ | (550 | ) | | $ | 591 | |
| | | |
| | | |
| | | |
| | | |
| | | |
| | | |
| | | |
| | | |
| |
| Total | | | | | | | | | | | | | | $ | (125 | ) | | | | | | | | | | | | | | $ | (290 | ) |
| | | | | | | | | | | | | | | |
| | | | | | | | | | | | | | | |
| |
Certain comparative figures have been reclassified to conform with the current year’s presentation.
Note 27 Reconciliation of Canadian and United States Generally Accepted Accounting Principles
We prepare our consolidated financial statements in accordance with GAAP in Canada, including interpretations of GAAP by our regulator, the Superintendent of Financial Institutions Canada. Set out below are the significant differences which would result if United States GAAP were applied in the preparation of our consolidated financial statements.
Condensed Consolidated Balance Sheet
| | | | | | | | | | | | | | | | | | | | | | | | | |
| As at October 31 (Canadian $ in millions) | | 2003 | | 2002 |
| |
| |
|
| | | Canadian | | Increase | | United States | | Canadian | | Increase | | United States |
| | | GAAP | | (Decrease) | | GAAP | | GAAP | | (Decrease) | | GAAP |
| | |
| |
| |
| |
| |
| |
|
Assets | | | | | | | | | | | | | | | | | | | | | | | | |
| Cash Resources | | $ | 19,860 | | | $ | — | | | $ | 19,860 | | | $ | 19,305 | | | $ | — | | | $ | 19,305 | |
| Securities | | | 54,790 | | | | 1,558 | (5) | | | 56,348 | | | | 43,715 | | | | 2,779 | (5) | | | 46,494 | |
| Loans and customers’ liability under acceptances, net of the allowance for credit losses | | | 146,156 | | | | (4 | ) | | | 146,152 | | | | 149,596 | | | | 3 | | | | 149,599 | |
| Other Assets | | | 35,688 | | | | 32 | | | | 35,720 | | | | 40,248 | | | | 256 | | | | 40,504 | |
| | | |
| | | |
| | | |
| | | |
| | | |
| | | |
| |
| Total Assets | | $ | 256,494 | | | $ | 1,586 | | | $ | 258,080 | | | $ | 252,864 | | | $ | 3,038 | | | $ | 255,902 | |
| | | |
| | | |
| | | |
| | | |
| | | |
| | | |
| |
Liabilities and Shareholders’ Equity | | | | | | | | | | | | | | | | | | | | | | | | |
| Deposits | | $ | 171,551 | | | $ | (14 | ) | | $ | 171,537 | | | $ | 161,838 | | | $ | 66 | | | $ | 161,904 | |
| Other Liabilities | | | 69,605 | | | | 1,232 | (5) | | | 70,837 | | | | 75,338 | | | | 2,582 | (5) | | | 77,920 | |
| Subordinated Debt | | | 2,856 | | | | 58 | | | | 2,914 | | | | 3,794 | | | | 87 | | | | 3,881 | |
| Shareholders’ Equity (1) | | | 12,482 | | | | 310 | (6) | | | 12,792 | | | | 11,894 | | | | 303 | (6) | | | 12,197 | |
| | | |
| | | |
| | | |
| | | |
| | | |
| | | |
| |
| Total Liabilities and Shareholders’ Equity | | $ | 256,494 | | | $ | 1,586 | | | $ | 258,080 | | | $ | 252,864 | | | $ | 3,038 | | | $ | 255,902 | |
| | | |
| | | |
| | | |
| | | |
| | | |
| | | |
| |
Certain comparative figures have been reclassified to conform with the current year’s presentation.
98 BMO FINANCIAL GROUP 186TH ANNUAL REPORT 2003
Notes to Consolidated Financial Statements
Condensed Consolidated Statement of Income
| | | | | | | | | | | | | | | | | | | | | | | | | | | | | | | | | | | | | | |
| (Canadian $ in millions, except per share amounts) | | | | | |
| For the Year Ended October 31 | | 2003 | | 2002 | | 2001 |
| |
| |
| |
|
| | | Canadian | | Increase | | United States | | Canadian | | Increase | | United States | | Canadian | | Increase | | United States |
| | | GAAP | | (Decrease) | | GAAP | | GAAP | | (Decrease) | | GAAP | | GAAP | | (Decrease) | | GAAP |
| | |
| |
| |
| |
| |
| |
| |
| |
| |
|
| Interest, Dividend and Fee Income | | $ | 8,927 | | | $ | — | | | $ | 8,927 | | | $ | 9,135 | | | $ | — | | | $ | 9,135 | | | $ | 13,000 | | | $ | — | | | $ | 13,000 | |
| Interest Expense | | | 4,028 | | | | — | | | | 4,028 | | | | 4,306 | | | | — | | | | 4,306 | | | | 8,501 | | | | — | | | | 8,501 | |
| | | |
| | | |
| | | |
| | | |
| | | |
| | | |
| | | |
| | | |
| | | |
| |
| Net Interest Income | | | 4,899 | | | | — | | | | 4,899 | | | | 4,829 | | | | — | | | | 4,829 | | | | 4,499 | | | | — | | | | 4,499 | |
| Provision for credit losses | | | 455 | | | | — | | | | 455 | | | | 820 | | | | — | | | | 820 | | | | 980 | | | | — | | | | 980 | |
| | | |
| | | |
| | | |
| | | |
| | | |
| | | |
| | | |
| | | |
| | | |
| |
| Net Interest Income After Provision for Credit Losses | | | 4,444 | | | | — | | | | 4,444 | | | | 4,009 | | | | — | | | | 4,009 | | | | 3,519 | | | | — | | | | 3,519 | |
| Non-Interest Revenue | | | 4,220 | | | | (47 | )(2) | | | 4,173 | | | | 3,924 | | | | (77 | )(2) | | | 3,847 | | | | 4,222 | | | | 45 | (2) | | | 4,267 | |
| �� | | |
| | | |
| | | |
| | | |
| | | |
| | | |
| | | |
| | | |
| | | |
| |
| Net Interest Income and Non-Interest Revenue | | | 8,664 | | | | (47 | ) | | | 8,617 | | | | 7,933 | | | | (77 | ) | | | 7,856 | | | | 7,741 | | | | 45 | | | | 7,786 | |
| Total Non-Interest Expense | | | 6,087 | | | | (1 | )(3) | | | 6,086 | | | | 6,030 | | | | 1 | (3) | | | 6,031 | | | | 5,671 | | | | 56 | (3) | | | 5,727 | |
| | | |
| | | |
| | | |
| | | |
| | | |
| | | |
| | | |
| | | |
| | | |
| |
| Income Before Provision for Income Taxes, Non-Controlling Interest in Subsidiaries and Goodwill Amortization | | | 2,577 | | | | (46 | ) | | | 2,531 | | | | 1,903 | | | | (78 | ) | | | 1,825 | | | | 2,070 | | | | (11 | ) | | | 2,059 | |
| Income taxes | | | 688 | | | | (3 | )(4) | | | 685 | | | | 424 | | | | (21 | )(4) | | | 403 | | | | 501 | | | | 1 | (4) | | | 502 | |
| | | |
| | | |
| | | |
| | | |
| | | |
| | | |
| | | |
| | | |
| | | |
| |
| | | | 1,889 | | | | (43 | ) | | | 1,846 | | | | 1,479 | | | | (57 | ) | | | 1,422 | | | | 1,569 | | | | (12 | ) | | | 1,557 | |
| Non-controlling interest in subsidiaries | | | 64 | | | | — | | | | 64 | | | | 62 | | | | — | | | | 62 | | | | 42 | | | | — | | | | 42 | |
| | | |
| | | |
| | | |
| | | |
| | | |
| | | |
| | | |
| | | |
| | | |
| |
| Net Income Before Goodwill Amortization | | | 1,825 | | | | (43 | ) | | | 1,782 | | | | 1,417 | | | | (57 | ) | | | 1,360 | | | | 1,527 | | | | (12 | ) | | | 1,515 | |
| Amortization of goodwill, net of applicable income tax | | | — | | | | — | | | | — | | | | — | | | | — | | | | — | | | | 56 | | | | (56 | )(3[iv]) | | — | |
| | | |
| | | |
| | | |
| | | |
| | | |
| | | |
| | | |
| | | |
| | | |
| |
| Net Income | | $ | 1,825 | | | $ | (43 | ) | | $ | 1,782 | | | $ | 1,417 | | | $ | (57 | ) | | $ | 1,360 | | | $ | 1,471 | | | $ | 44 | | | $ | 1,515 | |
| | | |
| | | |
| | | |
| | | |
| | | |
| | | |
| | | |
| | | |
| | | |
| |
| Earnings Per Share | — Basic | | $ | 3.51 | | | $ | (0.08 | ) | | $ | 3.43 | | | $ | 2.73 | | | $ | (0.12 | ) | | $ | 2.61 | | | $ | 2.72 | | | $ | 0.09 | | | $ | 2.81 | |
| | — Diluted | | | 3.44 | | | | (0.09 | ) | | | 3.35 | | | | 2.68 | | | | (0.11 | ) | | | 2.57 | | | | 2.66 | | | | 0.09 | | | | 2.75 | |
| | | |
| | | |
| | | |
| | | |
| | | |
| | | |
| | | |
| | | |
| | | |
| |
Consolidated Statement of Comprehensive Income
| | | | | | | | | | | | | | |
| (Canadian $ in millions) | | | | | | |
| For the Year Ended October 31 | | 2003 | | 2002 | | 2001 |
| |
| |
| |
|
| Net income (under United States GAAP) | | $ | 1,782 | | | $ | 1,360 | | | $ | 1,515 | |
| | | |
| | | |
| | | |
| |
| Other Comprehensive Income, net of tax: | | | | | | | | | | | | |
| | Unrealized gain (loss) on translation of net investments in foreign operations, net of hedging activities (a) | | | (597 | ) | | | (79 | ) | | | 179 | |
| | Unrealized translation losses on disposition of an investment in a foreign operation | | | — | | | | — | | | | 18 | |
| | Unrealized holding gains (losses) on available for sale securities, net of hedging activities (b) | | | 76 | | | | (45 | ) | | | 3 | |
| | Realized (gains) losses and write-downs on available for sale securities recognized in net income (c) | | | (25 | ) | | | 94 | | | | (57 | ) |
| | Net transition adjustment gain on derivatives designated as cash flow hedges (d) | | | — | | | | — | | | | 13 | |
| | Unrealized gains (losses) on derivatives designated as cash flow hedges (e) | | | (37 | ) | | | (22 | ) | | | 258 | |
| | Net (gains) losses on derivatives designated as cash flow hedges recognized in net income (f) | | | 21 | | | | 15 | | | | (22 | ) |
| | Minimum pension liability (g) | | | (45 | ) | | | — | | | | — | |
| | | |
| | | |
| | | |
| |
| Total Other Comprehensive Income (Loss) | | | (607 | ) | | | (37 | ) | | | 392 | |
| | | |
| | | |
| | | |
| |
| Comprehensive Income | | $ | 1,175 | | | $ | 1,323 | | | $ | 1,907 | |
| | | |
| | | |
| | | |
| |
| (a) | | Net of income taxes of $601 million ($81 million in 2002, $178 million in 2001). |
| (b) | | Net of income taxes of $37 million ($30 million in 2002, $2 million in 2001). |
| (c) | | Net of income taxes of $14 million ($59 million in 2002, $41 million in 2001). |
| (d) | | Net of income taxes of nil (nil in 2002, $9 million in 2001). |
| (e) | | Net of income taxes of $19 million ($14 million in 2002, $182 million in 2001). |
| (f) | | Net of income taxes of $12 million ($9 million in 2002, $16 million in 2001). |
| (g) | | Net of income taxes of $30 million. |
| (1) | | Accumulated other comprehensive income is recorded as a separate component included in shareholders’ equity under United States GAAP. Canadian GAAP does not have other comprehensive income. |
The accumulated balances related to each component of other comprehensive income, net of tax, are as follows:
| | | | | | | | | |
| (Canadian $ in millions) | | 2003 | | 2002 |
| |
| |
|
| Unrealized gain (loss) on translation of net investments in foreign operations, net of hedging activities | | $ | (176 | ) | | $ | 421 | |
| Net unrealized gains on available for sale securities (i) | | | 129 | | | | 78 | |
| Unrealized gains on derivatives designated as cash flow hedges (ii) | | | 226 | | | | 242 | |
| Minimum pension liability (iii) | | | (45 | ) | | | — | |
| | | |
| | | |
| |
| Total Accumulated Other Comprehensive Income | | $ | 134 | | | $ | 741 | |
| | | |
| | | |
| |
| (i) | | Under United States GAAP, we have designated as available for sale securities all of our investment securities, other than investment securities accounted for using the equity method. Available for sale securities are carried at fair value, with any unrealized gains or losses recorded in other comprehensive income. Under Canadian GAAP, investment securities are carried at cost or at amortized cost. |
| (ii) | | Under United States GAAP, derivatives designated as cash flow hedges are carried at fair value, with any unrealized gains or losses recorded in other comprehensive income, to the extent the hedge is effective. Under Canadian GAAP, derivatives designated as cash flow hedges are accounted for on the accrual basis, with gains or losses deferred and recorded in income on the same basis as the underlying hedged item. |
| (iii) | | Under United States GAAP, we must recognize an additional pension liability equal to the excess of the pension obligation, calculated without taking salary increases into account, over the unrecognized cost of plan amendments. This excess is recognized in other comprehensive income. Under Canadian GAAP, there is no similar requirement. |
BMO FINANCIAL GROUP 186TH ANNUAL REPORT 2003 99
Notes to Consolidated Financial Statements
(2) The impact of applying United States GAAP to total non-interest revenue is as follows:
| | | | | | | | | | | | | |
| (Canadian $ in millions) | | 2003 | | 2002 | | 2001 |
| |
| |
| |
|
| Increase (decrease) | | | | | | | | | | | | |
| Securitization revenues (i) | | $ | (44 | ) | | $ | (40 | ) | | $ | (17 | ) |
| Derivative accounting (ii) | | | (3 | ) | | | (37 | ) | | | (19 | ) |
| Foreign currency translation (iii) | | | — | | | | — | | | | 81 | |
| | | |
| | | |
| | | |
| |
| Total | | $ | (47 | ) | | $ | (77 | ) | | $ | 45 | |
| | | |
| | | |
| | | |
| |
(i) Under United States GAAP, gains on all securitized assets are recorded at the date of the securitization. Under Canadian GAAP, prior to July 1, 2001, gains on sales of NHA-insured mortgages were recorded at the date of the securitization and gains on sales of other loans securitized were recorded over the life of the loans securitized. Effective July 1, 2001, we adopted a new Canadian accounting standard on securitizations that eliminates this difference between Canadian and United States GAAP. There will continue to be an adjustment to our Consolidated Statement of Income until the gains related to loans securitized prior to July 1, 2001 have all been recorded in income.
(ii) Under United States GAAP, we adopted a new accounting standard on derivatives and hedging effective November 1, 2000. Under this new standard, all derivatives are recorded at fair value in our Consolidated Balance Sheet. Changes in the fair value of derivatives that are not hedges are recorded in our Consolidated Statement of Income as they arise. If the derivative is a hedge, depending on the nature of the hedge, a change in the fair value of the derivative is either offset in our Consolidated Statement of Income against the change in the fair value of the hedged asset, liability or firm commitment, or is recorded in other comprehensive income until the hedged item is recorded in our Consolidated Statement of Income. If the change in the fair value of the derivative is not completely offset by the change in the fair value of the item it is hedging, the difference is recorded immediately in our Consolidated Statement of Income.
When we adopted this new United States accounting standard on November 1, 2000, it increased consolidated assets by $163 million, increased consolidated liabilities by $149 million, increased other comprehensive income by $13 million and increased net income by $1 million. Because the transition adjustment was not material to our consolidated net income, the adjustment to net income was included in non-interest revenue on a before-tax basis rather than shown separately as the cumulative effect of an accounting change.
Under Canadian GAAP, hedging derivatives are accounted for on an accrual basis, with gains or losses deferred and recorded in income on the same basis as the underlying hedged item.
(iii) During the year ended October 31, 2001, we sold our investment in Grupo Financiero BBVA Bancomer and recognized translation losses of $99 million in non-interest income under Canadian GAAP. Under United States GAAP, we recognized translation losses of $18 million, net of the $81 million previously recognized in net income in the years ended October 31, 1999, 1998 and 1997.
(3) The impact of applying United States GAAP to total non-interest expense is as follows:
| | | | | | | | | | | | | |
| (Canadian $ in millions) | | 2003 | | 2002 | | 2001 |
| |
| |
| |
|
| Increase (decrease) | | | | | | | | | | | | |
| Stock options (i) | | $ | 43 | | | $ | 47 | | | $ | 40 | |
| Software development costs (ii) | | | (39 | ) | | | (40 | ) | | | (44 | ) |
| Pension and related benefits (iii) | | | 2 | | | | 4 | | | | 8 | |
| Amortization of goodwill (iv) | | | — | | | | — | | | | 62 | |
| Amortization of goodwill and other assets (v) | | | (7 | ) | | | (10 | ) | | | (10 | ) |
| | | |
| | | |
| | | |
| |
| Total | | $ | (1 | ) | | $ | 1 | | | $ | 56 | |
| | | |
| | | |
| | | |
| |
(i) Under United States GAAP, the fair value of stock options granted is recorded as compensation expense over the period that the options vest. Prior to November 1, 2002 (under Canadian GAAP), we included the amount of proceeds in shareholders’ equity when the options were exercised and did not recognize any compensation expense. Effective November 1, 2002, we adopted a new Canadian accounting standard on stock-based compensation that eliminated this difference for stock options granted after November 1, 2002. As a result, there will continue to be an adjustment to our Consolidated Statement of Income until stock option expense has been fully recognized for stock options granted prior to fiscal 2002 under United States GAAP.
(ii) Under United States GAAP, certain costs of internally developed software are required to be capitalized and amortized over the expected useful life of the software. Under Canadian GAAP, only certain external costs of internally developed software are capitalized and amortized over the expected useful life of the software.
(iii) Under United States GAAP, both pension and other future employee benefits are recorded in our Consolidated Statement of Income in the period services are provided by our employees. The related obligations are valued using current market rates. Under Canadian GAAP, prior to November 1, 2000, pension benefits were recorded in our Consolidated Statement of Income in the period services were provided by our employees, with the corresponding obligation valued using management’s best estimate of the long-term rate of return on assets, while other future employee benefits were expensed as incurred. Effective November 1, 2000, we adopted a new Canadian accounting standard on pension and other future employee benefits that eliminates this difference between Canadian and United States GAAP. When we adopted this new standard, we accounted for the change in accounting as a charge to retained earnings. As a result, there will continue to be an adjustment to our Consolidated Statement of Income until amounts previously deferred under United States GAAP have been fully amortized to income.
(iv) Effective November 1, 2001, we adopted a new accounting standard on goodwill that is identical under Canadian and United States GAAP. Previously, we presented goodwill amortization expense, net of tax, on a separate line in our Consolidated Statement of Income under Canadian GAAP. That presentation was not permitted under United States GAAP.
(v) Under United States GAAP, our acquisition of Suburban Bank Corp. would have been accounted for using the pooling of interests method. Under Canadian GAAP, we accounted for this acquisition using the purchase method, which resulted in the recognition and amortization of goodwill and other intangible assets associated with the acquisition. Effective November 1, 2001, goodwill is no longer amortized to income under either United States or Canadian GAAP.
(4) In addition to the tax impact of differences outlined above, under United States GAAP, tax rate changes do not impact the measurement of our future income tax balances until they are passed into law. Under Canadian GAAP, tax rate changes are reflected in the measurement of our future income tax balances when they are substantively enacted.
(5) Under United States GAAP, non-cash collateral received in security lending transactions that we are permitted by contract to sell or repledge is recorded as an asset in our Consolidated Balance Sheet and a corresponding liability is recorded for the obligation to return the collateral. Under Canadian GAAP, such collateral and the related obligation are not recorded in our Consolidated Balance Sheet. As a result of this difference, securities and other liabilities have been increased by $1,220 million and $2,399 million for the years ended October 31, 2003 and 2002, respectively.
(6) Includes cumulative adjustment to shareholders’ equity arising from current and prior years’ GAAP differences.
100 BMO FINANCIAL GROUP 186TH ANNUAL REPORT 2003
Future Changes in United States Accounting Policies
Under United States GAAP, we will be required to adopt a new accounting standard on the consolidation of variable interest entities (“VIEs”) effective January 31, 2004. Under this new standard, we must consolidate the financial results of VIEs if the investments we hold in these entities and/or the relationships we have with them result in us being exposed to a majority of their expected losses, being able to benefit from a majority of their expected residual returns, or both, based on a calculation determined by the standard setters. A similar new standard is being adopted for Canadian GAAP purposes, as disclosed in Note 8. Standard setters in the United States are currently considering whether mutual funds and personal trusts should be considered VIEs.
BANK-OWNED CORPORATIONS
| | | | | | | | | | | | | | | |
| | | | | | | | | | | | | Book value of common |
| | | | | | | | | | | | | and preferred shares |
| Corporations in which the Bank owns more than | | | | | | Percent of voting shares | | owned by the Bank |
| 50% of the issued and outstanding voting shares | | Head office | | owned by the Bank | | (Cdn $ in millions) |
| |
| |
| |
|
| Bank of Montreal Assessoria e Serviços Ltda. | | Rio de Janeiro, Brazil
| | | 100 | | | | — | |
| Bank of Montreal Capital Markets (Holdings) Limited | | London, England
| | | 100 | | | | 87 | |
| | BMO Nesbitt Burns Limited (U.K.) | | London, England
| | | 100 | | | | | |
| Bank of Montreal Finance Ltd. | | Toronto, Canada
| | | 50.01 | | | | 23 | |
| Bank of Montreal Global Capital Solutions Ltd. | | Calgary, Canada
| | | 100 | | | | 14 | |
| Bank of Montreal Holding Inc. | | Calgary, Canada
| | | 100 | | | | 13,888 | |
| | Bank of Montreal Insurance (Barbados) Limited | | Bridgetown, Barbados
| | | 100 | | | | | |
| | Bank of Montreal Securities Canada Limited | | Toronto, Canada
| | | 100 | | | | | |
| | | BMO Nesbitt Burns Corporation Limited and subsidiaries | | Montreal, Canada
| | | 100 | | | | | |
| | BMO Holding Finance, LLC | | Wilmington, United States
| | | 100 | | | | | |
| | BMO Investments Limited and subsidiaries | | Hamilton, Bermuda
| | | 100 | | | | | |
| | BMO Nesbitt Burns Trading Corp. S.A. | | Münsbach, Luxembourg
| | | 100 | | | | | |
| | BMO Service Inc. | | Calgary, Canada
| | | 100 | | | | | |
| Bank of Montreal Ireland plc | | Dublin, Ireland
| | | 100 | | | | 1,235 | |
| Bank of Montreal Mortgage Corporation | | Calgary, Canada
| | | 100 | | | | 1,995 | |
| Bankmont Financial Corp. | | Wilmington, United States
| | | 100 | | | | 5,221 | |
| | BMO Financial, Inc. | | Wilmington, United States
| | | 100 | | | | | |
| | BMO Global Capital Solutions, Inc. | | Wilmington, United States
| | | 100 | | | | | |
| | BMO Nesbitt Burns Equity Group (U.S.), Inc. and subsidiaries | | Chicago, United States
| | | 100 | | | | | |
| | BMO Nesbitt Burns Financing, Inc. | | Chicago, United States
| | | 100 | | | | | |
| | EFS (U.S.), Inc. and subsidiaries | | Chicago, United States
| | | 100 | | | | | |
| | Harris Bancorp Insurance Services, Inc. | | Chicago, United States
| | | 100 | | | | | |
| | Harris Bankcorp, Inc. and subsidiaries | | Chicago, United States
| | | 100 | | | | | |
| | Harris Investor Services, LLC | | Wilmington, United States
| | | 100 | | | | | |
| | Harris Nesbitt Corp. | | Chicago, United States
| | | 100 | | | | | |
| | Harris Nesbitt Gerard, Inc. | | Wilmington, United States
| | | 100 | | | | | |
| | Harris RIA Holdings, Inc. and subsidiaries | | Wilmington, United States
| | | 100 | | | | | |
| BMO Capital Corporation | | Toronto, Canada
| | | 100 | | | | 66 | |
| BMO Investments Inc. | | Toronto, Canada
| | | 100 | | | | 69 | |
| BMO InvestorLine Inc. | | Toronto, Canada
| | | 100 | | | | 42 | |
| BMO Ireland Finance Company | | Dublin, Ireland
| | | 100 | | | | 570 | |
| BMO Life Insurance Company | | Toronto, Canada
| | | 100 | | | | 18 | |
| BMO Nesbitt Burns Equity Partners Inc. | | Toronto, Canada
| | | 100 | | | | 73 | |
| BMO (N.S.) Holdings Co. | | Halifax, Canada
| | | 100 | | | | 1,209 | |
| | BMO (U.S.) Finance, LLC | | Wilmington, United States
| | | 100 | | | | | |
| BMO Trust Company | | Toronto, Canada
| | | 100 | | | | 18 | |
| dealerAccess Inc. | | Wilmington, United States
| | | 100 | | | | — | |
| | dealerAccess Canada Inc. | | Toronto, Canada
| | | 100 | | | | | |
| Guardian Group of Funds Ltd. | | Toronto, Canada
| | | 100 | | | | 191 | |
| MyChoice Inc. | | Toronto, Canada
| | | 80 | | | | — | |
|
The above is a list of all our directly held corporations, as well as their directly held corporations, and thereby includes all of our major operating companies. The book values of the corporations shown represent the total common and preferred equity value of our holdings.
We own 100% of the outstanding non-voting shares of subsidiaries except for Bank of Montreal Securities Canada Limited, of which we own 96.94% of the outstanding non-voting shares.
BMO FINANCIAL GROUP 186TH ANNUAL REPORT 2003 101
B O A R D O F D I R E C T O R S
| | | | | | | |
Stephen E. Bachand
Ponte Vedra Beach, Florida
Corporate Director and
Chief Executive Officer
Canadian Tire Corporation,
Limited
David R. Beatty, O.B.E.
Toronto, Ontario
Chairman and
Chief Executive Officer
Beatinvest Limited
Robert Chevrier, F.C.A.
Montreal, Quebec
President
Société de gestion Roche Inc.
F. Anthony Comper
Toronto, Ontario
Chairman and
Chief Executive Officer
BMO Financial Group | | Ronald H. Farmer
Markham, Ontario
Managing Director
Mosaic Capital Partners
Toronto
David A. Galloway
Toronto, Ontario
Corporate Director and
former President and
Chief Executive Officer
Torstar Corporation
Eva Lee Kwok
Vancouver, British Columbia
Chair and Chief
Executive Officer
Amara International
Investment Corp.
J. Blair MacAulay
Oakville, Ontario
of Counsel
Fraser Milner Casgrain LLP
Toronto | | The Honourable
Frank McKenna, P.C., Q.C.
Cap Pelé, New Brunswick
Counsel, McInnes Cooper
Moncton
Bruce H. Mitchell
Toronto, Ontario
Chairman and
Chief Executive Officer
Permian Industries Limited
Philip S. Orsino, F.C.A.
Caledon, Ontario
President and
Chief Executive Officer
Masonite International
Corporation
Mississauga
J. Robert S. Prichard, O.C., O.Ont.
Toronto, Ontario
President and
Chief Executive Officer
Torstar Corporation | | Jeremy H. Reitman
Montreal, Quebec
President
Reitmans (Canada) Limited
Joseph L. Rotman, O.C., LL.D.
Toronto, Ontario
Chairman and
Chief Executive Officer
Roy-L Capital Corporation
Guylaine Saucier, C.M., F.C.A.
Montreal, Quebec
Corporate Director
Nancy C. Southern
Calgary, Alberta
President and
Chief Executive Officer
ATCO Ltd. and
Canadian Utilities Limited |
H O N O R A R Y D I R E C T O R S
| | | | | | | |
Charles F. Baird
Bethesda, MD, U.S.A.
Ralph M. Barford
Toronto, ON
Matthew W. Barrett, O.C., LL.D.
London, ENG
Peter J.G. Bentley, O.C., LL.D.
Vancouver, BC
Claire P. Bertrand
Montreal, QC
Frederick S. Burbidge, O.C.
Frelighsburg, QC | | Pierre Côté, C.M.
Quebec City, QC
C. William Daniel, O.C., LL.D.
Toronto, ON
Nathanael V. Davis
Osterville, MA, U.S.A.
Graham R. Dawson
Vancouver, BC
Louis A. Desrochers, C.M., c.r.
Edmonton, AB
A. John Ellis, O.C., LL.D., O.R.S.
Vancouver, BC
John F. Fraser, O.C., LL.D.
Winnipeg, MB | | Thomas M. Galt
Toronto, ON
J. Peter Gordon, O.C.
Burlington, ON
Richard M. Ivey, C.C., Q.C.
London, ON
Senator Betty Kennedy, O.C., LL.D.
Campbellville, ON
Ronald N. Mannix
Calgary, AB
Robert H. McKercher, Q.C.
Saskatoon, SK | | Eric H. Molson
Montreal, QC
William D. Mulholland, LL.D.
Georgetown, ON
Jerry E.A. Nickerson
North Sydney, NS
Lucien G. Rolland, O.C.
Montreal, QC
Mary Alice Stuart, C.M., O.ONT., LL.D.
Toronto, ON
Lorne C. Webster, C.M.
Montreal, QC |
102 BMO FINANCIAL GROUP 186TH ANNUAL REPORT 2003
M E M B E R S O F M A N A G E M E N T B O A R D
as at December 1, 2003
| | | | | | | |
F. Anthony Comper*
Chairman and
Chief Executive Officer
William A. Downe*
Deputy Chair
BMO Financial Group and
Chief Executive Officer
BMO Nesbitt Burns and
Head, Investment Banking Group
Investment Banking Group
Yvan J.P. Bourdeau*
President and
Chief Operating Officer
BMO Nesbitt Burns
Ellen M. Costello
Vice-Chair, BMO Nesbitt Burns
Branch Manager, New York
David R. Hyma
Vice-Chair, BMO Nesbitt Burns
and Head, Capital Markets
Marnie J. Kinsley
Executive Managing Director
and Co-Head
Cash Management Services
L. Jacques Ménard
Chairman, BMO Nesbitt Burns
and President, BMO Financial
Group, Quebec
Tom V. Milroy
Vice-Chair, BMO Nesbitt Burns
and Global Head, Investment and
Corporate Banking
Eric C. Tripp
Vice-Chair, BMO Nesbitt Burns
and Head, Equity Division | | Private Client Group
Gilles G. Ouellette*
President and
Chief Executive Officer
Barry M. Cooper
Chairman and
Chief Executive Officer
Jones Heward and
Head, Mutual Fund Investments
Sherry S. Cooper
Executive Vice-President
and Global Economic Strategist
Dean Manjuris
Head, Full Service Brokerage
Line of Business and President
and Director Private Client
Division BMO Nesbitt Burns
Graham T. Parsons
Executive Vice-President
Global Private Banking
William E. Thonn
Executive Vice-President
BMO Harris Private Banking
Harris Bankcorp, Inc.
Franklin J. Techar*
President and
Chief Executive Officer
Harris Bankcorp, Inc. and
Harris Trust & Savings Bank
(Chicago)
Edward W. Lyman, Jr.
Vice-Chair
| |
Robert W. Pearce*
President and
Chief Executive Officer
Personal and Commercial
Client Group
Personal and Commercial
Client Group
Maurice A.D. Hudon
Senior Executive
Vice-President
Group Development
Kathleen M. O’Neill
Executive Vice-President
Product and Service
Development and
Head, Small Business Banking
Pamela J. Robertson
Executive Vice-President
Sales and Service
Customer Delivery
Robert J. Tetley
Executive Vice-President
Distribution Services
Ronald G. Rogers*
Deputy Chair
Enterprise Risk & Portfolio
Management Group
Enterprise Risk & Portfolio
Management Group
Neil R. Macmillan
Executive Vice-President
and Senior Risk Officer
Investment Banking Group
Michel G. Maila
Executive Vice-President
and Head, Market and
Operational Risk Management
Robert L. McGlashan
Executive Vice-President
and Head, Corporate Risk
Management
Colin D. Smith
Executive Vice-President
and Senior Risk Officer
Personal and Commercial
Client Group and
Private Client Group
| |
Lloyd F. Darlington*
President and
Chief Executive Officer
Technology and Solutions
and Head, E-Business
Technology and Solutions
Barry K. Gilmour
Deputy Group Head and
Chief Operating Officer
Karen E. Maidment*
Senior Executive
Vice-President and
Chief Financial Officer
Finance, Corporate and Legal
Timothy J. O’Neill
Executive Vice-President
and Chief Economist
Ronald B. Sirkis
Executive Vice-President
General Counsel & Taxation
Penelope F. Somerville
Executive Vice-President
and Treasurer
Rose M. Patten*
Senior Executive Vice-President
Human Resources and
Head, Office of Strategic
Management
Human Resources and Office
of Strategic Management
Joan T. Dea†
Senior Vice-President
Strategy, Office of Strategic
Management |
| * | | Members of Management Board Executive Committee |
| † | | Secretary of Management Board Executive Committee |
BMO FINANCIAL GROUP 186TH ANNUAL REPORT 2003 103
GLOSSARY OF FINANCIAL TERMS
Allowance for Credit Losses
Represents an amount deemed adequate by management to absorb credit-related losses on loans and acceptances and other credit instruments. Allowances for credit losses can be specific or general and are recorded on the balance sheet as a deduction from loans and acceptances or, as it relates to credit instruments, in other liabilities.
Assets under Administration and under Management
Assets administered or managed by a financial institution that are beneficially owned by clients and therefore not reported on the balance sheet of the administering or managing financial institution.
Average Earning Assets
Represents the daily or monthly average balance of deposits with other banks and loans and securities, over a one-year period.
Bankers’Acceptances (BAs)
Bills of exchange or negotiable instruments drawn by a borrower for payment at maturity and accepted by a bank. BAs constitute a guarantee of payment by the bank and can be traded in the money market. The bank earns a “stamping fee” for providing this guarantee.
Basis Point
One one-hundredth of a percentage point.
Derivatives
Contracts whose value is “derived” from interest or foreign exchange rates, or equity or commodity prices. Use of derivatives allows for the transfer, modification or reduction of current or expected risks from changes in rates and prices and can also be used for trading.
Hedging
A risk management technique used to neutralize or manage interest rate, foreign currency, equity, commodity or credit exposures arising from normal banking activities.
Impaired Loans
Loans for which there is no longer reasonable assurance of the timely collection of principal or interest.
Innovative Tier 1 Capital
OSFI allows banks to issue instruments that qualify as “Innovative” Tier 1 capital. In order to qualify, these instruments have to be issued indirectly through a special-purpose entity, be permanent in nature and free of any fixed charges. The bank has to absorb any losses arising on these Innovative Tier 1 instruments and account for them as non-controlling interests. Innovative Tier 1 capital cannot comprise more than 15% of net Tier 1 capital and the sum of innovative Tier 1 capital and non-cumulative perpetual preferred shares cannot exceed 25% of net Tier 1 capital.
Mark-to-Market
Represents valuation at market rates, as of the balance sheet date, of securities and derivatives held for trading purposes.
Notional Amount
The principal used to calculate interest and other payments under derivative contracts. The principal amount does not change hands under the terms of a derivative contract, except in the case of cross-currency swaps.
Off-Balance Sheet Financial Instruments
Assets or liabilities that are not recorded on the balance sheet but have the potential to produce positive or negative cash flows in the future. A variety of products offered to clients can be classified as off-balance sheet and they fall into two broad categories: (i) credit-related arrangements, which provide clients with liquidity protection, and (ii) derivatives for hedging.
Provision for Credit Losses
A charge to income that represents an amount deemed adequate by management to fully provide for impairment in loans and acceptances and other credit instruments, given the composition of the portfolios, the probability of default, the economic environment and the allowance for credit losses already established.
Regulatory Capital Ratios
The percentage of risk-weighted assets supported by capital, as defined by OSFI under the framework of risk-based capital standards developed by the Bank for International Settlements. These ratios are labelled Tier 1 and Tier 2. Tier 1 capital is considered to be more permanent, consisting of common shares together with any qualifying non-cumulative preferred shares, less unamortized goodwill. Tier 2 capital consists of other preferred shares, subordinated debentures and the general allowance, within prescribed limits. The assets-to-capital multiple is defined as assets plus guarantees and letters of credit (or adjusted assets) divided by total capital.
Securities Purchased under Resale Agreements
Result from transactions that involve the purchase of a security, normally a government bond, with the commitment by the buyer to resell the security to the original seller at a specified price on a specified date in the future. They represent low-cost, low-risk loans.
Securities Sold under Repurchase Agreements
Result from transactions in which a security is sold with the commitment by the seller to repurchase the security at a specified price on a specified date in the future. They provide low-cost funding.
| | | | | | |
| Other Definitions | | Page |
| |
|
| Cash Productivity Ratio | | | 25 | |
| Earnings per Share (EPS) | | | 16 | |
| Expense-to-Revenue Ratio (or Productivity Ratio) | | | 25 | |
| Forwards and Futures | | | 82 | |
| General Allowance | | | 77 | |
| Net Economic Profit | | | 17 | |
| Net Interest Income | | | 22 | |
| Net Interest Margin | | | 22 | |
| Options | | | 82 | |
| Productivity Ratio (see Expense-to- Revenue Ratio) | | | | |
| Return on Equity (ROE) | | | 17 | |
| Specific Allowances | | | 77 | |
| Swaps | | | 82 | |
| Taxable Equivalent Basis | | | 22 | |
| Tier 1 Capital Ratio (see Regulatory Capital Ratios) | | | | |
| Total Capital Ratio (see Regulatory Capital Ratios) | | | | |
| Total Shareholder Return (TSR) | | | 15 | |
| Trading-Related Revenues | | | 24 | |
| | | | | |
Risk-Related Definitions | | | | |
| Business Risk Due to Earnings Volatility | | | 52 | |
| Capital at Risk (CaR) | | | 46 | |
| Credit and Counterparty Risk | | | 47 | |
| Earnings Volatility (EV) | | | 48 | |
| Environmental Risk | | | 52 | |
| Issuer Risk | | | 48 | |
| Liquidity and Funding Risk | | | 50 | |
| Market Risk | | | 48 | |
| Market Value Exposure (MVE) | | | 48 | |
| Operational Risk | | | 51 | |
| Social and Ethical Risk | | | 52 | |
| Value at Risk (VaR) | | | 48 | |
104 BMO FINANCIAL GROUP 186TH ANNUAL REPORT 2003
SHAREHOLDER INFORMATION
Common Share Trading Information during Fiscal 2003
| | | | | | | | | | | | | | | | | | | | | |
| | | | | | | Year-end price | | | | | | | | | | Total volume of |
| Primary stock exchanges | | Ticker | | October 31, 2003 | | High | | Low | | shares traded |
| |
| |
| |
| |
| |
|
| Toronto | | BMO | | $ | 49.33 | | | $ | 50.26 | | | $ | 37.79 | | | 315.1 million |
| New York | | BMO | | US$ | 37.44 | | | US$ | 38.43 | | | US$ | 23.95 | | | 11.8 million |
Dividends per Share Declared during Fiscal Year
| | | | | | | | | | | | | | | | | | | | | | | | | | | | | |
| | | | | | | Shares outstanding | | | | | | | | | | |
| Issue/Class | | Ticker | | at October 31, 2003 | | 2003 | | 2002 | | 2001 | | 2000 | | 1999 |
| |
| |
| |
| |
| |
| |
| |
|
| Common (a) | | BMO | | | 499,632,368 | | | $ | 1.34 | | | $ | 1.20 | | | $ | 1.12 | | | $ | 1.00 | | | $ | 0.94 | |
| Preferred Class A | | | | | | | | | | | | | | | | | | | �� | | | | | | | | | |
| Series 4 (b) | | | | | | | — | | | | — | | | | — | | | $ | — | | | $ | — | | | $ | 1.87 | |
| Series 5 (c) | | | | | | | — | | | | — | | | | — | | | $ | — | | | $ | — | | | $ | 522.26 | |
| Preferred Class B | | | | | | | | | | | | | | | | | | | | | | | | | | | | |
| Series 1 (d) | | | | | | | — | | | | — | | | | — | | | $ | 0.57 | | | $ | 2.25 | | | $ | 2.25 | |
| Series 2 (e) | | | | | | | — | | | | — | | | | — | | | US$ | 1.28 | | | US$ | 1.69 | | | US$ | 1.69 | |
| Series 3 | | BMO F | | | 16,000,000 | | | $ | 1.39 | | | $ | 1.39 | | | $ | 1.39 | | | $ | 1.39 | | | $ | 1.39 | |
| Series 4 (f) | | BMO G | | | 8,000,000 | | | $ | 1.20 | | | $ | 1.20 | | | $ | 1.20 | | | $ | 1.20 | | | $ | 1.20 | |
| Series 5 (f) | | BMO H | | | 8,000,000 | | | $ | 1.33 | | | $ | 1.33 | | | $ | 1.33 | | | $ | 1.33 | | | $ | 1.33 | |
| Series 6 (f) | | BMO I | | | 10,000,000 | | | $ | 1.19 | | | $ | 1.19 | | | $ | 1.19 | | | $ | 1.19 | | | $ | 1.19 | |
| Series 10 (g) | | BMO V | | | 12,000,000 | | | US$ | 1.49 | | | US$ | 1.39 | | | | — | | | | — | | | | — | |
| (a) | | Common share dividends have been restated to reflect the two-for-one stock distribution completed in March 2001. |
| (b) | | The Class A Preferred Shares Series 4 were redeemed on September 24, 1999. |
| (c) | | The Class A Preferred Shares Series 5 were redeemed on December 5, 1998. |
| (d) | | The Class B Preferred Shares Series 1 were redeemed on February 26, 2001. |
| (e) | | The Class B Preferred Shares Series 2 were redeemed on August 27, 2001. |
| (f) | | The Class B Preferred Shares were issued in February 1998 for Series 4 and 5, and in May 1998 for Series 6. |
| (g) | | The Class B Preferred Shares Series 10 were issued in December 2001. |
2004 Dividend Dates
Subject to approval by the Board of Directors.
| | | | | |
| Common and preferred shares record dates | | Preferred shares payment dates | | Common shares payment dates |
| |
| |
|
February 6
May 7
August 6
November 5 | | February 25
May 25
August 25
November 25 | | February 26
May 28
August 30
November 29 |
The Bank Act prohibits a bank from paying or declaring a dividend if it is or would thereby be in contravention of capital adequacy regulations.
Currently this limitation does not restrict the payment of dividends on Bank of Montreal’s common or preferred shares. |
Shareholder Administration
Computershare Trust Company of Canada, with transfer facilities in the cities of Halifax, Montreal, Toronto, Winnipeg, Calgary and Vancouver, serves as transfer agent and registrar for common and preferred shares. In addition, Computershare Investor Services PLC and Computershare Trust Company of New York serve as transfer agents and registrars for common shares in London, England and New York, respectively.
For dividend information, change in share registration or address, lost certificates, estate transfers, or to advise of duplicate mailings, please call Bank of Montreal’s Transfer Agent and Registrar at 1-800-340-5021 (Canada and the United States), or at (514) 982-7800 (international), or write to Computershare Trust Company of Canada, 100 University Avenue, 9th Floor, Toronto, Ontario M5J 2Y1, e-mail to caregistryinfo@computershare.com, or fax 1-888-453-0330 (Canada and the United States) or (416) 263-9394 (international).
For all other shareholder inquiries, please write to Shareholder Services at the Corporate Secretary’s Department, 21st Floor, 1 First Canadian Place, Toronto, Ontario M5X 1A1, e-mail to corp.secretary@bmo.com, call (416) 867-6785, or fax (416) 867-6793.
Market for Securities of Bank of Montreal
The common shares of Bank of Montreal are listed on the Toronto and New York stock exchanges. The preferred shares of Bank of Montreal are listed on the Toronto Stock Exchange.
Shareholder Dividend Reinvestment and Share Purchase Plan
The Shareholder Dividend Reinvestment and Share Purchase Plan provides a means for holders of record of common and preferred shares to reinvest cash dividends in common shares of Bank of Montreal without the payment of any commissions or service charges.
Shareholders of Bank of Montreal may also purchase additional common shares of Bank of Montreal by making optional cash payments of up to $40,000 per fiscal year. Full details of the plan are available from Computershare Trust Company of Canada or Shareholder Services.
Direct Dividend Deposit
Shareholders may choose to have dividends deposited directly to an account in any financial institution in Canada that provides electronic funds transfer facilities.
Institutional Investors and Research Analysts
Institutional investors or research analysts who would like to obtain financial information should write to the Senior Vice-President, Investor Relations, 18th Floor, 1 First Canadian Place, Toronto, Ontario M5X 1A1, e-mail to investor.relations@bmo.com, call (416) 867-6656, or fax (416) 867-3367. Alternatively, please visit our web site at www.bmo.com/investorrelations.
General Information
For general inquiries about company news and initiatives, or to obtain additional copies of the Annual Report, please contact the Corporate Communications Department, 302 Bay Street, 10th Floor, Toronto, Ontario M5X 1A1, or visit our web site at www.bmo.com. (On peut obtenir sur demande un exemplaire en français.)
Annual Meeting
The Annual Meeting of Shareholders will be held on Tuesday, February 24, 2004 at 9:30 a.m. (Eastern Standard Time) at The Carlu, 444 Yonge Street, 7th Floor, Toronto, Ontario, Canada.
Fees Paid to Shareholders’ Auditors
For fees paid to Shareholders’ Auditors, see page 5 of the Proxy Circular for the Annual Meeting of Shareholders, which will be held on February 24, 2004.
www.bmo.com/annualreport2003
Corporate Information
This BMO Financial Group 2003 Annual Report is available for viewing/printing on our web site at www.bmo.com. For a printed copy, please contact:
Corporate Communications Department
BMO Financial Group
302 Bay Street, 10th Floor
Toronto, Ontario M5X1A1
(On peut obtenir sur demande un exemplaire en français.)
General Information
For general inquiries about company news and initiatives please contact our Corporate Communications Department. BMO Financial Group’s news releases are available on our web site at www.bmo.com.
Shareholder Inquiries
For dividend information, change in share registration or address, lost certificates, estate transfers, or to advise of duplicate mailings, please call Bank of Montreal’s Transfer Agent and Registrar at 1-800-340-5021 (Canada and the United States), or at (514) 982-7800 (international), or write to:
Computershare Trust Company of Canada
100 University Avenue, 9th Floor
Toronto, Ontario M5J 2Y1
Annual Meeting
The Annual Meeting of Shareholders will be held on Tuesday, February 24, 2004 at 9:30 a.m. (Eastern Standard Time) at The Carlu, 444 Yonge Street, 7th Floor, Toronto,Ontario, Canada.
| TM/® | | Trade-mark/registered trade-mark of Bank of Montreal |
| ®* “ | | Nesbitt Burns” is a registered trade-mark of BMO Nesbitt Burns Corporation Limited |
| TM1/®1 | | Trade-mark/registered trade-mark of Harris Trust and Savings Bank |
| ®2 | | Registered trade-mark of MasterCard International Incorporated |
| ®3 | | Registered trade-mark of Sobeys Capital Incorporated |
| ®4 | | Registered trade-mark of Canada Safeway Limited |
| TM2 | | Trade-mark of The Great Atlantic & Pacific Company of Canada, Limited |
| ®5 | | Registered trade-mark of Standard & Poor’s Corporation |
| ®6 | | Registered trade-mark of Moody’s Investors Service, Inc. |
| ®7 | | Registered trade-mark of Teleglobe Canada Limited |
| ®8 | | Registered trade-mark of Air Miles International Trading B.V. |