2005 Financial Highlights
| | | | | | | | | | | | | | | | | | | | | |
| For the year ended October 31 | | 2005 Target | | | | | | | 2005 | | | 2004 | | | 2003 | |
| |
Income Statement Highlights(Canadian $ in millions) | | | | | | | | | | | | | |
Total revenue (teb)(a) (c) | | | | | | | | | | | 9,958 | | | | 9,488 | | | | 9,149 | |
| Provision for (recovery of) credit losses | | | | | | | | | | | 179 | | | | (103 | ) | | | 455 | |
| Non-interest expense | | | | | | | | | | | 6,327 | | | | 6,157 | | | | 6,087 | |
| Net income | | | | | | | | | | | 2,400 | | | | 2,306 | | | | 1,781 | |
| |
Common Share Data($) (b) | | | | | | | | | | | | | | | | | | | | |
| Earnings per share | | | | | | | | | | | 4.64 | | | | 4.42 | | | | 3.44 | |
Cash earnings per share(c) | | | | | | | | | | | 4.79 | | | | 4.57 | | | | 3.59 | |
| |
Key Financial Measures(%) (b) | | | | | | | | | | | | | | | | | | | | |
| Five-year average annual total shareholder return | | | | | | | | | | | 13.8 | | | | 18.9 | | | | 12.9 | |
Earnings per share growth(b) | | | | | | | ü | | | | 5 | | | | 29 | | | | 28 | |
– on a targeted basis(c) | | | 3%-8%(d) | | | | ü | | | | 9 | | | na | | na |
| Return on equity | | | 17%-18% | | | | ü | | | | 18.8 | | | | 19.4 | | | | 16.4 | |
Revenue growth (teb)(c) | | | | | | | | | | | 5.0 | | | | 3.7 | | | | 4.7 | |
Cash productivity ratio (teb)(c) | | | | | | | | | | | 62.6 | | | | 63.8 | | | | 65.4 | |
| – targeted improvement (bps) | | 150-200 bps | | | | û | | | | 120 | | | | 160 | | | | 260 | |
| Provision for credit losses as a % of average net loans and acceptances | | | | | | | | | | | 0.11 | | | | (0.07 | ) | | | 0.30 | |
– targeted specific provision($ millions) | | | £ $400 | | | | ü | | | | 219 | | | | 67 | | | | 455 | |
| Tier 1 Capital Ratio | | | > 8% | | | | ü | | | | 10.25 | | | | 9.81 | | | | 9.55 | |
| |
| All ratios in this report are based on unrounded numbers. |
| |
| (a) | | All revenues in this report, except in the Consolidated Financial Statements, are reported on a taxable equivalent basis (teb). See pages 35 and 37. |
| |
| (b) | | All earnings per share (EPS) measures in this report refer to diluted EPS, unless otherwise specified. |
| |
| (c) | | This is a non-GAAP measure. See page 35. |
| |
| (d) | | Targeted EPS growth from a base of $4.21 (excluding changes in the general allowance). |
| |
| na – not applicable |
2005 Awards and
Recognition Highlights | | Excellence in Corporate Reporting | Excellence in Communicating to Investors | Leading
Corporate Governance |
One of Canada’s Most Respected Corporations
BMO Financial Group ranked 7th onThe Globe and Mail’s Top 25 of Canada’s Most Respected Corporationslist, up from 9th in 2003 and 20th in 2002. Excellence in Diversity
BMO Financial Group President and CEO Tony Comper was namedDiversity Leader of the Yearat the International Quality & Productivity Center’s (IQPC) 2005 Diversity Excellence Awards. IQPC also awarded BMO itsBest in Class Diversity Program Award. Best Private Bank
For the second year in a row,Euromoneymagazine has selected BMO Harris Private Banking as the best private bank in Canada. | BMO Board Ranked #1
In its fifth annual survey,Canadian Businessmagazine ranked BMO Financial Group’s Board of Directors first among Canada’s Top 25 boards. Best Corporate Citizen
BMO was named Canada’s Best Corporate Citizen of the Year byCorporate Knights. The top-50 ranking is based on performance indicators, including executive gender diversity, tax generation and executive retention rate as well as board independence and diversity. | The Canadian Institute of Chartered Accountants’ annual Corporate Reporting Awards gave us the Award of Excellence in the financial institutions category and gave BMO an Honourable Mention for Excellence in Electronic Disclosure. Excellence in Security Management
BMO was the first company in Canada to be awarded certification from the British Standards Institution for meeting the highest international standard for operating an Information Security Management System. Sustainability:
Best in Class
BMO Financial Group was chosen to be among the first Canadian companies listed on the newly createdDow Jones Sustainability North America Index, modelled on the benchmarkDow Jones Sustainability World Index.
| IR Magazine Canadagave BMO its “Best Communications with the Retail Market” award, recognizing the BMO Investor Relations web site for its quality, ease of navigation and presentation of information to the retail investor. Leader in Equity Research
For the 25th consecutive year, BMO Nesbitt Burns was ranked the top Equity Research Group by Canada’s leading institutional investors in the 2005 Brendan Wood International Survey. | The Globe and Mail’sReport on Businessannual review of corporate governance practices ranked BMO second overall among 209 Canadian reporting issuers. Top Online Brokerage
BMO InvestorLine® ranked #1 inThe Globe and Mail’s annual review of Canada’s online brokerage firms for the fourth consecutive year. Employer of Choice
BMO was named one of Canada’s Top 100 Employers byMaclean’smagazine and Mediacorp for the fourth consecutive year and was the only major Canadian bank to be named to this prestigious list. BMO Financial Group also ranked 16th overall inTraining magazine’s Top 100 North American corporations in 2005 and was the top Canadian company on the list. |
BMO Financial Group at a Glance
| | | | | | | | | | | |
| | | | | | | | | |
| | Established in 1817 as Bank of Montreal, BMO Financial Group (TSX, NYSE: BMO) is a highly diversified financial services organization. With total assets of $298 billion at October 31, 2005 and more than 34,000 employees, BMO provides a broad range of retail banking, wealth management and investment banking products and solutions. We serve our clients through three customer groups. | | | Personal and Commercial Client Group
Personal and Commercial Client Group (P&C) provides more than eight and a half million customers across Canada and the United States with fully integrated personal and commercial banking solutions. These include deposit accounts, loans and credit cards, insurance products and personal investment products. Our products and services are delivered by a highly skilled team of professionals through 1,180 BMO Bank of Montreal and Harris branches, through telephone and online banking at bmo.com and harrisbank.com, and through a network of almost 2,500 automated banking machines.
| | |  | |
| | | | | | | | | |
| | | | | | | 2005 Key Initiatives | | | Focus for 2006 | |
| | | | | | | | | |
| | Canadian Operations
We serve Canadian clients through BMO Bank of Montreal®, our personal and commercial banking business, and BMO Nesbitt Burns®*, one of Canada’s leading full-service investment and wealth management firms. | |  | | | • Achieved strong net income growth of 23.1%. • Achieved strong balance sheet growth, with deposit growth of 7% and average loans and acceptances growth of 7.9% including the effects of securitizations. • Improved cash productivity by 310 basis points to 57.3%. • Applied more discipline to our sales management through initiatives such as integrating financial planners into our delivery model and aligning desired customer experience with employee performance measurement and incentives. • Upgraded technology to streamline workflow and improve the quality of our customer information, allowing us to better recognize and meet the needs of our customers. • Continued to distinguish ourselves in commercial banking as reflected by the second-largest market share in business lending. | | | • Enhance the quality of sales and service delivery to build lasting relationships through exceptional service, leading to revenue growth, increased market share and improved customer loyalty. • Simplify processes and enhance technology for front-line sales and service representatives, increasing capacity and effectiveness to improve customer service. • Continue our track record of improving our cash productivity ratio. • Invest further in our distribution network, including the replacement of our ABM network. • Continue expanding programs and offers to meet our customers’ financial needs.
| |
| | | | | | | | | |
| | | | | | | | | | | |
| | | | | | | | | |
| | U.S. Operations
In the United States, clients are served through Harris, a major U.S. Midwest financial services organization with a network of community banks in the Chicago area and wealth management offices across the United States, as well as Harris Nesbitt®1, a leading mid-market investment and corporate bank. | |  | | | • Achieved U.S.-dollar net income growth of 22.5%. • Improved cash productivity by 150 basis points, driven by higher revenues and continued expense management. • Increased average total loans and acceptances by 19% to US$15.9 billion. • Opened eight new branches in Chicagoland and acquired Mercantile Bancorp with 19 branches in Northwest Indiana, increasing Harris’ Community Banking network to 195 locations. • Consolidated 26 bank charters into one national bank charter at the end of May 2005 with no disruption to customer service. • Our Net Promoter Score, a measure of the intensity of our customers’ loyalty, rose from 26% in 2003 to 34% in 2005 – triple the network average. | | | • Improve our financial performance, focusing on revenue growth. • Continue to build our branch network in Chicagoland by opening five new branches and exploring acquisition opportunities in the Midwest. • Continue to refine our customer experience to provide the high customer service levels of a community bank. • Invest in our strategic infrastructure by refreshing the branch technology platform.
| |
| | | | | | | | | |
| | | | | | | | | | |
| | | | | | | | | |
| Private Client Group | | | | | | Investment Banking Group | | | |
| | | | | | | | | |
| Private Client Group (PCG) offers clients a full range of wealth management products and services, including full-service and direct investing, private banking and investment products. Our highly trained professionals are dedicated to serving the needs and goals of our clients to accumulate, protect and grow their financial assets. Private Client Group serves clients through BMO Bank of Montreal and Harris branches, as well as through stand-alone BMO InvestorLine, BMO Nesbitt Burns and BMO Harris Private Banking offices in Canada, and through Harris Private Bank offices in key U.S. centres, including family office services and customized investment services to the ultra affluent. | | | 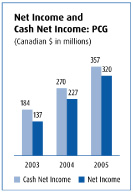 | | | Investment Banking Group (IBG) combines all of our businesses serving corporate, institutional and government clients. In Canada, operating under the BMO Nesbitt Burns brand, our client base comprises large corporations and institutions across a broad range of industry sectors. In the United States, operating under the Harris Nesbitt brand, we serve corporate and institutional clients in selected sectors. Investment Banking Group offers clients complete financial solutions across the entire balance sheet, including public and private debt and equity underwriting, corporate lending, securitization, cash management, risk management and trade finance. We also offer leading financial advisory services in mergers and acquisitions and restructurings, and we provide investing clients with industry-leading research, sales and trading services. | | | 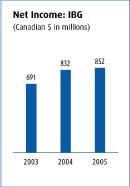 |
| | | | | | | | | | |
| | | | | | | | | | |
| | | | | | | | | | |
| 2005 Key Initiatives | | | Focus for 2006 | | | 2005 Key Initiatives | | | Focus for 2006 |
| | | | | | | | | | |
| | | | | | | | | | |
| | | | | | | | | | |
• BMO Nesbitt Burns introduced the Architect Program – the first of its kind in Canada – to provide clients with customized portfolios that combine separately managed accounts, mutual funds, exchange-traded funds, and alternative investment products in a single account. • BMO Harris Private Banking was named the best private bank in Canada byEuromoney magazine for the second consecutive year. • BMO Harris Private Banking introduced the enCircle®program, an innovative solution for mature clients, offering a range of services from bill payments and investment management to estate planning and home health-care education. • BMO InvestorLine was chosen byThe Globe and Mailas best online broker for the fourth consecutive year, its 14th top ranking in the past five years. • BMO Mutual Funds and Guardian Group of Funds outperformed the mutual fund industry, with annual net sales exceeding the industry average. • BMO Term Investments introduced the BMO Dividend Fund Linked GIC, the first of its kind offered by any of Canada’s major banks.
| | | • Continue to leverage our leadership position in client service and award-winning offerings, and increase our share of our existing clients’ investable assets. • Continue to improve performance through sales force productivity and operational efficiencies. | | | • Participated in 513 Canadian corporate debt and equity transactions that raised a total of $69 billion. • Advised on $21 billion of completed Canadian mergers and acquisitions. • Ranked the top Equity Research Group for the 25th consecutive year in the Brendan Wood International Survey of institutional investors, and ranked first for Overall Quality of Trader Service. • Ranked first overall in the 2004 StarMine Canadian Analysts’ survey. • Canadian Securitization unit ranked first in market share of asset-backed commercial paper conduit outstandings. • Expanded Real Estate investment and corporate banking practice. • Introduced Canadian mutual fund and equity linked notes, establishing a strong presence and setting the pace as the largest and fastest-growing issuer in Canada in 2005. | | | • Continue to reinforce our leading position. • Continue to broaden and deepen relationships with prospects and clients. |
| | | | | | | | | | |
| | | | | | | | | | |
| Group Initiatives | | | Group Focus | | | Group Initiatives | | | Group Focus |
| | | | | | | | | | |
• Focused management of non-revenue based costs helped achieve relatively low expense growth of 1% compared to strong revenue growth of 10%, while product refinement and streamlined operations contributed to net income growth of 41%. • Cash productivity ratio improved by 580 basis points in 2005 – for a total of 1570 basis points in the past three years – driven by revenue growth and sustainable cost containment initiatives. | | | • Deepen client relationships and enhance our product offerings. • Drive revenue growth by expanding our sales force in key businesses. • Continue to improve our cash productivity ratio through revenue growth and expense management initiatives. | | | • Acquired a local currency Chinese Renminbi banking licence in Guangzhou – the only Canadian bank to do so. • Became the first Canadian bank to be granted a licence to sell derivatives in China. • The only Canadian bank in a group of ten banks selected to act as market-makers for foreign exchange trading in China. • Ranked #2 in the world for Canadian dollar foreign exchange byFX Week. • Launched eFXpedite®, an online foreign exchange trading system enabling users to access real-time foreign exchange prices and execute trades on the spot.
| | | • Continue focus on integrated coverage to bring the best solutions to our clients. • Implement high-value initiatives that build on both existing expertise and businesses, and new business ideas. • Continuously improve the profitability of client relationships. • Improve our cash productivity ratio. |
| | | | | | | | | | |
• Harris Private Bank enhanced its investment capabilities by expanding the range of alternative investments and third party managers, providing solutions for a broader client base. • Harris Private Bank was ranked among the top ten private banks in the U.S. market byEuromoneymagazine. • Sold Harrisdirect, allowing the redeployment of capital to higher-return businesses. • Introduced a successful new referral program that exceeded expectations. | | | • Accelerate growth in the United States by increasing our share of our existing clients’ investable assets and leveraging the Bank’s U.S. expansion strategy. • Improve performance through sales force productivity and operational efficiencies. | | | • Undertook a major initiative to improve our overall client coverage, capitalize on top-line growth opportunities and win more business from IBG clients. • Expanded and upgraded Harris Nesbitt’s pool of expertise with a number of key senior-level hires, including heads of Healthcare, Financial Institutions and Consumer and Leisure Groups. • Expanded Mergers and Acquisitions, Equity Capital Markets, Commodity Derivatives and Equity Research and Sales Groups. | | | • Refine sector focus to match our product and service capabilities to high-growth opportunities in the United States. • Develop U.S. investor strategy to accelerate growth. |
Every day, BMO’s Board, leadership
team and employees are driving us closer
to achieving our vision. It is, simply, to
be the top-performing financial services
company in North America.
| | | | | |
n Advancing our strategic priorities | | page 2 |
n Delivering consistently to our shareholders | | page 4 |
n Providing exceptional customer service | | page 10 |
n Focusing on our strength in credit risk management | | page 16 |
n Leading in corporate governance | | page 17 |
n Valuing every employee | | page 20 |
n Helping our communities | | page 21 |
n Caring about the environment | | page 22 |
| | | | | | | | | | | | | | | | |
| | | | | | |
| | Contents | | | | | | | | | | | | | | |
| | | | | | |
| | | | | | |
| | BMO Financial Group at a Glance/Financial Highlights | | Inside Front Cover | | | Financial Performance and Condition at a Glance | | page 24 | |
| | | | | | |
| | | | | | |
| | 2005 Awards and Recognition Highlights | | Inside Front Cover | | | Supplemental Information | | page 79 | |
| | | | | | |
| | | | | | |
| | Vision and Priorities Overview | | page 2 | | | Consolidated Financial Statements | | page 92 | |
| | | | | | |
| | | | | | |
| | Chairman’s Message to Shareholders | | page 4 | | | Notes to Consolidated Financial Statements | | page 96 | |
| | | | | | |
| | | | | | |
| | Chief Executive Officer’s Message to Shareholders | | page 5 | | | Members of Management Board | | page 135 | |
| | | | | | |
| | | | | | |
| | Financial Review | | page 8 | | | Glossary of Financial Terms | | page 136 | |
| | | | | | |
| | | | | | |
| | Management’s Discussion and Analysis | | page 23 | | | Shareholder Information | | Inside Back Cover | |
| | | | | | |
| | | | | | |
Bank of Montreal uses a unified branding approach that links all of the organization’s member companies. Bank of Montreal, together with its subsidiaries, is known as BMO®Financial Group. As such, in this document, the names BMO and BMO Financial Group mean Bank of Montreal, together with its subsidiaries.
| | | |
| BMO Financial Group 188th Annual Report 2005 | | 1 |
Vision and Priorities Overview
We will achieve our vision with an
unwavering focus on our strategic priorities
Being the best means becoming the top-performing financial services company in North America. It’s a bold vision – one we will strive to achieve by building on our enduring strengths and by advancing our growth strategy. Every day.
Our Enduring Strengths
| | | | | |
Long-Term Shareholder Return
At the end of 2005, the five-year annual Total Shareholder Return on BMO common shares was 13.8%.
Excellence in Credit Risk Management
BMO has a proven ability to deliver strong returns at acceptable levels of risk. Our philosophy is to manage risk in a way that is disciplined and consistent – an approach that works for our business and our clients in both good times and bad.
Commercial Leadership in Canada and the United States
Our commercial business is a growth engine for BMO in both Canada and the United States. Particularly, we view our ability to serve our customers on both sides of the border as a unique advantage. | | Canada’s First Bank
Our core established business in Canada, focused on meeting the banking, investment and insurance needs of individual Canadians and businesses, is the financial backbone of BMO Financial Group.
Canadian Leader in U.S. Banking
Harris is one of the top three banks serving the Chicagoland area. Our strong personal and commercial presence in the U.S. Midwest continues to distinguish us as the Canadian leader in U.S. banking.
Technological Strength
BMO has a history of delivering innovative technology solutions to provide consistent, reliable and secure financial services that our customers trust. We are recognized for adopting best practices and achieving the highest standards for our products and services. | | Commitment to Productivity Improvement
Productivity improvement is an important measure of BMO’s long-term financial health. Our strategy is to continue making progress in containing costs while at the same time investing strategically to boost revenues.
Our People
Our people understand the importance of customer loyalty. They understand that it is their job to make BMO the only bank our customers will ever need.
Leadership in Corporate Governance
BMO continues to be a recognized leader in corporate governance. We were named Best Corporate Citizen for 2005 byCorporate Knightsand received a #1 ranking inCanadian Businessmagazine’s annual corporate governance survey. |
| | | |
| 2 | | BMO Financial Group 188th Annual Report 2005 |
| | | | | | | | | | | | |
| | | |
| | 2005 Targets | | | 2005 Performance | | | Targets for 2006 | |
| | | | | | | | | | | | |
| | 3%to8%EPS growth from a base of $4.21 (excluding changes in the general allowance) | | | ü | | | 9.0% to $4.59
4 See page 33 | | | 5%to10%EPS growth from a base of $4.59 (excluding changes in the general allowance) | |
| | | | | | | | | | | | |
| | ROE of17%to18% | | | ü | | | 18.8%
4 See page 34 | | | ROE of17%to19% | |
| | | | | | | | | | | | |
| | Specific provision for credit losses of$400 millionor less | | | ü | | | $219 million
4 See page 40 | | | Specific provision for credit losses of$400 millionor less | |
| | | | | | | | | | | | |
| | Tier 1 Capital Ratio of at least8.0% | | | ü | | | 10.25%
4 See page 59 | | | Tier 1 Capital Ratio of at least8.0% | |
| | | | | | | | | | | | |
| | Improve cash productivity ratio by150to200 bps | | | û | | | 120 bps improvement
4 See page 41 | | | Improve cash productivity ratio by100to150 bps | |
| | | | | | | | | | | | |
| | | | | | |
| | | |
| | Strategic Priorities | |
| | | | | | |
| | Achieve financial targetswith a particular focus on revenue growth to improve productivity.
4 See pages 5, 8, 9 and 28
| | |  | |
| | | | | | |
| | Drive revenue growthby providing a superior client experience, earning a larger share of customers’ business.
4 See pages 7, 8, 28 and 45
| | |  | |
| | | | | | |
| | Continue to improve U.S. performance.
4 See pages 5, 28 and 47
| | |  | |
| | | | | | |
| | Accelerate growth in the United Statesboth organically and through acquisitions.
4 See pages 7, 28 and 47
| | |  | |
| | | | | | |
| | Grow net income in Canadathrough operational efficiency and improved market share, accelerating our growth in commercial banking and wealth management.
4 See pages 8, 28 and 45
| | |  | |
| | | | | | |
| | Build a high-performance organizationby developing our people, living our values and being an employer of choice.
4 See pages 20 and 28
| | |  | |
| | | | | | |
| | Maintain our world-class foundationof leading governance, sound risk management, productive systems and excellent after-sales service.
4 See pages 16,17, 28 and 67
| | |  | |
| | | | | | |
| | | |
| BMO Financial Group 188th Annual Report 2005 | | 3 |
Chairman’s Message to Fellow Shareholders
Building shareholder value continued to be BMO’s primary objective in 2005
In what proved to be a challenging year for the North American financial services sector, BMO focused on actions that will create value for our shareholders by executing our business strategy and maintaining focus on our foundational strengths which include sound corporate governance and strong credit risk management.
| | | |
| | David A. Galloway
Chairman |
| | | |
| | | “All of us associated with BMO are proud of our leadership position in corporate governance and recognize that this key foundational strength adds tremendous value to our company.” |
Consistent performance has long been a hallmark of BMO and something I believe all shareholders can be proud of. In 2005, the company faced tough financial targets as a result of strong performance the previous year. The previous year’s results were enhanced by loan losses being at an all time low. It is especially pleasing, therefore, to congratulate Tony Comper and the management team, as well as each BMO employee, for the successes that they achieved during the year.
The Board remained highly engaged and vigilant as BMO continued to operate in an ever more complex and tightly regulated financial services sector. The company’s proven strengths have never been more important, and I am very proud of the Board’s work on behalf of all stakeholders in ensuring the integrity of internal controls and processes and the effectiveness of compliance with external requirements. As the company moves closer to Basel II and proceeds with our efforts to give effect to the provisions of theSarbanes-Oxley Act, the Board will continue to make this a priority.
All of us associated with BMO are proud of our leadership position in corporate governance and recognize that this key foundational strength adds tremendous value to our company. Most recently, we were ranked number one among the top 25 Boards in Canada, according to a survey byCanadian Business magazine. While this is gratifying and a tribute to the calibre of my fellow Board members, we can only be satisfied to win awards when they accompany
good operational performance and enhanced shareholder value.
Each of our Board Committees had a full agenda over the course of the year, and we were successful in achieving our key priorities. I am particularly proud of the work that was done on strategy as we continue to focus on evolving trends and the opportunities we see ahead. During the year, top talent development, including succession planning across executive ranks, remained very much a focus. I am confident that BMO’s attention to nurturing and developing talent will serve shareholders well now and into the future.
I would like to take this opportunity to express my thanks to the Board members for their contribution and dedication. I also extend a special thank you to departing Board member Frank McKenna. Former premier of New Brunswick and now Canada’s ambassador to the United States, Frank served on our Board for eight years. He was an absolutely outstanding director and his contributions have been superb. All of us wish him well.
On behalf of our Board of Directors, we look forward to continuing to serve our fellow shareholders as we focus on our role in helping to make BMO the top-performing North American financial services provider.
-s- DAVID A. GALLOWAY
David A. Galloway
Chairman
| | | |
| 4 | | BMO Financial Group 188th Annual Report 2005 |
Chief Executive Officer’s Message to Fellow Shareholders
Intense customer focus, unlimited growth potential
Every day and in every way, my colleagues and I are aligning our hopes and ambitions for business success with our customers’ financial hopes and ambitions.
| | | |
Tony Comper
President and Chief Executive Officer | |  |
| | | |
| “Investors look to BMO for relatively high returns at relatively low risk.” | | |
As the customer stories featured in this report so vividly illustrate, at BMO Financial Group we are dedicated to the proposition that the surest route to strong returns for our shareholders is to deliver, first and foremost, truly exceptional service to our customers – exceeding their expectations and meeting more of their needs. This intense focus on developing lasting customer relationships requires disciplined execution of every task by every colleague every day.
Investors look to BMO for relatively high returns at relatively low risk. Stable, consistent and reliable returns. We are working hard to live up to our reputation, building on the distinctive BMO strengths highlighted in this report, notably credit and commercial leadership and our unparalleled U.S. operations.
We increased earnings per share by 9% in 2005 (excluding changes in the general allowance), bringing BMO’s three-year annual EPS growth rate to an outstanding 20%. Return on equity was 18.8%. We also raised dividends twice as the value of dividends declared rose 16% from 2004 to $1.85 per share. Overall we surpassed four of our five financial targets for the year (see page 3), falling short on our aggressive productivity target while still delivering the second-best productivity ratio in our Canadian peer group. We have improved the cash productivity ratio by a total of 540 basis points over the past three years, creating a strong culture of cost discipline that will serve BMO well for years to come.
We are also aware that revenue growth is the primary driver of shareholder value creation for top-performing companies, and we are determined to continue to improve productivity in 2006 through a stronger emphasis on increasing revenues. While preserving BMO’s hard-won achievements in productivity improvement, we will seek opportunities to accelerate revenue growth both organically and through acquisitions.
Our financial targets for the year ahead (see next page) reflect the management team’s continuing confidence in BMO’s enterprise growth strategy, which is to grow our core Canadian businesses and accelerate our expansion in the United States. The targets also reflect our assessment of economic and market conditions in 2006. An ongoing challenge for BMO and our entire industry is the narrowing of the spread between lending and borrowing rates. Nonetheless, our domestic bank has done a good job of maintaining margins and we are encouraged by the favourable relative performance of our Canadian personal and commercial and private client businesses. In the United States, where relative performance was also very good after factoring out the impact of acquisition costs, we continue our hunt for personal and commercial acquisitions that will accelerate progress toward our goal to transform Harris into a “super-regional” player as the leading personal and commercial bank in the U.S. Midwest.
| | | |
| BMO Financial Group 188th Annual Report 2005 | | 5 |
Chief Executive Officer’s Message to Fellow Shareholders
We are not content to see ourselves as one of the big Canadian banks with a niche play in the U.S. market. We want to be acknowledged as #1 in the markets where we have chosen to compete. And we want to be seen for what we are: the most successful Canadian bank in the United States.
Management is confident in the strategic course we have set. In its five-year global ranking of large cap financial services companies published in May 2005, The Boston Consulting Group ranks BMOsecond in the world with an average Risk-adjusted Relative Total Shareholder Return of 12.9%. We believe our consistent and disciplined approach, in combination with BMO’s differentiating strengths, will enable us to continue to outperform globally, propelling BMO closer to our long-term vision to become the top-performing financial services organization in North America.
BMO has led the Canadian banking industry in credit performance in 14 of the past 15 years. The only exception was 2001, when our advanced credit culture led us to be early recognizers of emerging problems that hit our peers’ results harder the following year. We believe this strength will increasingly differentiate BMO as the credit cycle progresses and investors
recognize the value of our ability to maintain consistent underwriting standards through good and bad times. There is good alignment of BMO values with the values and needs of our customers. They know they can count on BMO.
While we are using our credit expertise to drive growth in all our businesses, we believe it will be particularly helpful in extending our existing leadership in commercial banking in North America. Even in an increasingly competitive Canadian market where others are re-focusing on their personal and commercial businesses, BMO’s relationship-building approach has enabled us to gain and maintain a market leadership position over time. And we are a leading commercial player in our chosen U.S. markets, through both Harris’ increasing business banking operations in the greater Chicago area and Harris Nesbitt’s well-entrenched mid-market client base in the Midwest.
| | | | | | | |
9.0%
Earnings per Share Growth
(excluding changes in the general allowance)
| | | 10.25%
Tier 1 Capital Ratio
| | | Targets for 2006
5%to10%EPS growth from a base
of $4.59 (excluding changes in the
general allowance)
ROE of17%to19%
|
18.8%
Return on Equity
$219million
Specific Provision for Credit Losses | | | 120basis points
Improvement in
Cash Productivity Ratio | | | Specific provision for credit losses
of$400 millionor less
Tier 1 Capital Ratio of at least8.0%
Improve our cash productivity ratio
by100to150 bps |
| | | |
| 6 | | BMO Financial Group 188th Annual Report 2005 |
BMO’s most important differentiating strength is the quality of our people, whose expertise, dedication and sheer enthusiasm are unsurpassed in our industry. It is great to see my colleagues rising to the challenge of creating a peak-condition, higher-performing organization.
Given all the work under way to meet more of our customers’ needs, our commercial clients provide an excellent pipeline to expand our personal banking and wealth management businesses. And we are gathering evidence of a new growth opportunity: seamless solutions for customers with financial interests in both Canada and the United States. None of our competitors is as well positioned as we are to fill this growing need.
A singular strength in this regard is our well-established, integrated U.S. operations. Including our acquisition of Harris in 1984, we have invested $2.4 billion in U.S. retail acquisitions, transforming a handful of private Chicago banks into a community banking network of nearly 200 branches in the Chicago area and Northwest Indiana. A highlight of 2005 was the successful consolidation of the Harris bank charters into one national charter with no disruption to customer service – the latest in a series of major investments to create a highly efficient back office while maintaining the best of the Harris community banking heritage. These investments, plus the invaluable experience we have gained from our acquisitions to date, position us well to increase revenues while managing costs as we continue the expansion of our Harris personal and commercial operations beyond the Chicago area and Northwest Indiana in the Midwest. We are now aiming to double our network to 350 to 400 branches over the next five years.
What will it take for Harris to become the leading personal and commercial bank in the U.S. Midwest? We need to grow faster from a core business perspective
than our competitors, lead the market in customer service scores, continue to improve productivity and profitability, and acquire suitable properties as they become available. And this is what we intend to do. We are not content to see ourselves as one of the big Canadian banks with a niche play in the U.S. market. We want to be acknowledged as #1 in the markets where we have chosen to compete. And we want to be seen for what we are: the most successful Canadian bank in the United States.
In my message to shareholders last year I explained that we have set our sights on becoming our industry’s top performer because we should (we need to reach for the top in order to get there); and because we can. I continue to believe that BMO’s most important differentiating strength is the quality of our people, whose expertise, dedication and sheer enthusiasm are unsurpassed in our industry. It is great to see my colleagues rising to the challenge of creating a peak-condition, higher-performing organization.
Despite the growing complexity of financial services – perhaps because of it – our fundamental job has never been simpler. We come to work each day to help our customers achieve their financial hopes and ambitions. If we keep this top of mind, there is no limit to BMO’s potential for growth.
/s/ Tony Comper
Tony Comper
President and Chief Executive Officer
| | | |
| BMO Financial Group 188th Annual Report 2005 | | 7 |
2005 Financial Review
In more challenging times, we continue to perform well
In 2005, BMO once again achieved record results. We attribute our success to our focus every day on revenue growth, continued productivity improvement and superior credit management.
| | | | | |
| | |  | | Karen Maidment
Senior Executive Vice-President and Chief Financial Officer |
| | | | | “Over the past five years, shareholders have earned an average annual total return of nearly 14%.” |
Every day at BMO Financial Group, our goal is to ensure that we grow and protect the long-term value of our shareholders’ investments. While in 2005 we produced a total shareholder return for the year of 4%, over the past five years shareholders have earned an average annual total return of nearly 14%. This compared to the S&P/TSX Composite average annual total return of 3% over the same period. Net Economic Profit (NEP), another key value measure, remained high at $1,120 million, just below last year’s record level, despite higher capital, as each operating group’s NEP rose.
We surpassed four of the five financial targets we set for the year, including targets for earnings growth and return on
| | | | | | | | | | | | | | | | | | | | | | | | | | | | | | | | | |
| | | |
| | 2005 Canadian Bank Scorecard(%) | |
| | | |
| | | | | BMO | | | | RBC | | | | CIBC | | | | Scotia | | | | TD | | | | National | | |
| | | | | | | | | | | | | | | | | | | | | |
| | Average annual total shareholder return (5-year) | | | | 13.8 | | | | | 14.8 | | | | | 11.9 | | | | | 18.1 | | | | | 9.1 | | | | | 22.5 | | |
| | | | | | | | | | | | | | | | | | | | | |
| | EPS growth | | | | 5.0 | | | | | 21.3 | | | | | (108.3 | ) | | | | 11.7 | | | | | (5.6 | ) | | | | 21.0 | | |
| | | | | | | | | | | | | | | | | | | | | |
| | Return on equity | | | | 18.8 | | | | | 18.0 | | | | | (1.6 | ) | | | | 20.9 | | | | | 15.3 | | | | | 20.7 | | |
| | | | | | | | | | | | | | | | | | | | | |
| | Net economic profit growth2 | | | | (0.3 | ) | | | | 30.3 | | | | | (162.2 | ) | | | | 16.3 | | | | | (29.7 | ) | | | | 31.9 | | |
| | | | | | | | | | | | | | | | | | | | | |
| | Revenue growth1,2 | | | | 5.0 | | | | | 6.1 | | | | | 6.2 | | | | | 4.2 | | | | | 11.7 | | | | | 5.5 | | |
| | | | | | | | | | | | | | | | | | | | | |
| | Cash productivity ratio2 | | | | 62.6 | | | | | 68.2 | | | | | 85.5 | | | | | 56.1 | | | | | 67.4 | | | | | 64.9 | | |
| | | | | | | | | | | | | | | | | | | | | |
| | PCL as a % of average net loans and acceptances | | | | 0.11 | | | | | 0.20 | | | | | 0.43 | | | | | 0.12 | | | | | 0.03 | | | | | 0.06 | | |
| | | | | | | | | | | | | | | | | | | | | |
| | o BMO equal to or better than other bank (17/35) | |
| | o BMO worse than other bank (18/35) | |
| | | |
| | |
| 1. | | On a taxable equivalent basis.
|
| |
| 2. | | Non-GAAP measure. See page 35. |
equity. Our productivity ratio improved significantly by 120 basis points, but was short of our target in a challenging revenue environment. We earned record net income of $2,400 million for the fiscal year, an increase of $94 million or 4% from our extremely successful result in 2004. Our earnings per share (EPS) rose 5% to $4.64, representing an annual compound EPS growth rate of 20% over the last three years, and cash EPS was $4.79, also up 5%.
Operating Groups
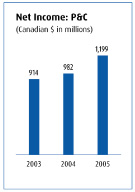
Each of our client operating groups delivered record results with our retail and business banking and wealth management businesses contributing significantly to our success. Our Personal and Commercial Client Group (P&C) earned net income of $1,199 million, up $217 million or 22% from a year ago. Our Private Client Group (PCG), meanwhile, earned net income of $320 million, up $93 million or 41%. Investment Banking Group (IBG) earned net income of $852 million, up $20 million or 3% from 2004.
Increased Revenue
Revenue continued to grow, increasing $470 million or 5% to $9,958 million. There was strong growth in P&C, which benefited from higher product volumes, insurance and card fee revenues. There was also growth in PCG full-service investing, mutual fund and term investment product revenues. Not surprisingly, revenue declined in IBG as increased trading revenues and advisory fees were more than offset by reduced revenues from interest-rate-sensitive businesses, which were adversely affected by a flatter yield curve and competitive market conditions.
| | | |
| 8 | | BMO Financial Group 188th Annual Report 2005 |
Productivity Improvement
Improving cash productivity, particularly through top-line revenue growth, is a key component of enhanced shareholder value and continues to be a top priority at BMO. Over the last three years, we have improved our productivity ratio by 540 basis points – while continuing to invest in our business. In 2005, our cash productivity ratio was 62.6%, a 120 basis point improvement from 2004. Both P&C and PCG made significant improvements in productivity, driven by strong revenue growth, but IBG’s productivity worsened in the challenging interest rate environment described above. Although we fell short of our target to improve our productivity ratio by 150 to 200 basis points in 2005, we remain encouraged by our significant and steady progress in recent years.
Credit Risk Management
In 2005, provisions for credit losses increased by $282 million, mostly due to lower reversals and recoveries and a lower reduction in the general allowance this year. The provision in 2005 was $179 million, consisting of $219 million of specific provisions and a $40 million reduction in the general allowance for credit losses. Although in marked contrast to a $103 million net recovery of credit losses in 2004, which included specific provisions of $67 million and a $170 million reduction in the general allowance, our provisions in 2005 were actually lower than the targets we established at the beginning of the year when we anticipated a weaker credit environment. BMO’s top-tier credit management continues to distinguish us from our peers.
Foreign Exchange
Although the Canadian dollar continued to strengthen in 2005, we managed the effects of foreign exchange fluctuations effectively, holding the negative impact on our bottom line to $42 million.
Capital
In 2005, our Tier 1 Capital Ratio increased to 10.25%, up from 9.81% a year ago and well above our target. It’s a result that mirrors our strong earnings, particularly in the fourth quarter
| | | | | | |
| | | | | | |
| | | |
| | 2005 Economic Climate:
Weathering the Storms | |
| | | |
| | | | | | |
| | | | | | |
| | Flatter Yield Curve
The flattening of the yield curve –the narrowing gap between long and short-term interest rates –caused some investors to worry about a potential market slowdown. The flatter curve also had a significant impact on our industry, resulting in lower net interest margins which reduced revenue growth, particularly in wholesale businesses.
Dollars Up and Down
In Canada, exporters were negatively affected as the Canadian dollar rose to its highest levels in 13 years. Meanwhile, businesses and consumers in the United States grappled with the downside of a falling dollar.
Soaring Oil Prices
Canadians and Americans also found themselves coping with higher prices for gasoline, home heating oil and natural gas as energy prices soared. Although oil production and refining operations located along the U.S. Gulf Coast did not suffer the full force of hurricanes Katrina and Rita, | | | there’s no question that the damage caused by the great storms put upward pressure on already high oil and natural gas prices.
Consumer Confidence
As the year moved into the third quarter, it’s perhaps not surprising that the combination of currency fluctuations, higher commodity prices and natural disasters caused a drop in consumer confidence on both sides of the border.
Fundamental Strength
In spite of these developments, the Canadian and American economies remained fundamentally strong. In 2005, the U.S. economy is estimated to have expanded at an above-potential pace while the Canadian economy recorded a respectable, albeit more moderate advance. Meanwhile, on both sides of the border, consumers continued to spend and take advantage of the still-low interest rate environment to buy homes and other goods. For its part, business ramped up investment spending. | |
| | | | | | |
| | | | | | |
of the year when our net income increased by 20%, and also reflects the sale of Harrisdirect.
We have the right strategy to grow our business and best serve our shareholders. BMO’s differentiating strengths, our focus on growing revenues to improve our productivity as well as our strong capital base position us well for the future.
| | | | | | | |
$2,400
million
Net income – up 4%
$4.64
Earnings per share – up 5% | | | $9,958
million
Revenue (teb) – up 5%
13.8%
Average annual total shareholder return (5-year) | | | 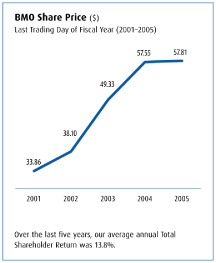 |
| | | |
| BMO Financial Group 188th Annual Report 2005 | | 9 |
In Canada
“BMO’s people took the time to understand
our business and our industry.”
We are committed to helping our clients across Canada succeed.
This means tailoring financial solutions that meet all of their individual financial needs and providing exceptional service that can help them achieve every goal, every dream.
Client Profile: Gienow Windows and Doors Income Fund
Taking the time to understand
When a group of Calgary businessmen, including Dave Munro and Dennis Zentner, purchased Gienow Building Products Ltd. in 1983, their vision was to transform the local window and door manufacturer into a leading national company. It’s a goal they have realized. Today, Gienow employs 1,400 people, boasts manufacturing and distribution facilities from British Columbia to Quebec, and sells its products across Canada as well as in the United States, Europe and Asia.
BMO has been a partner in Gienow’s journey. Says Neil Runions, Senior Manager, Corporate Finance Division at BMO Bank of Montreal, “Although our relationship with Gienow is relatively new, it has proven to be significant.” BMO has helped the company obtain the financing it needed to grow its business both organically and through acquisitions, and has provided tailored cash management services. In 2001, BMO Bank of Montreal provided senior debt financing to Gienow, enabling the company to consolidate its presence in Western Canada. More recently, the Bank led a loan syndication to expand Gienow’s credit facilities and BMO Nesbitt Burns co-led a syndication that assisted Gienow in its conversion to an income fund. Capital raised through Gienow’s initial public offering in 2004, combined with loan facilities, made it possible for the company to acquire Farley Windows of Alexandria, Ontario in 2004 and Chantecler Windows and Doors Inc.
of Gatineau, Quebec in 2005, giving Gienow a firm foothold in Eastern Canada.
“BMO’s people took the time to understand our business and our industry,” explains Dave Munro, President and CEO at Gienow. “Representatives from across the BMO organization came together, looked at our financial needs and came back with a solution that recognized our success and reflected our growth strategy and vision. We feel that BMO is part of our team.”
“BMO looked at our financial needs and came back with a solution that recognized our success and reflected our growth strategy and vision.”
Dave Munro, President and CEO
Gienow Windows and Doors Income Fund
Commercial banking clients since 2001
| | | | | |
#2 | | $34billion | | 1,900 |
| BMO has the second largest market share in business lending in Canada. | | BMO participated in 268 corporate equity transactions that raised $34 billion for Canadian companies. | | Across Canada, we have a total of 1,900 investment professionals located in BMO branches and offices – a reflection of BMO’s commitment to providing our customers with the depth and breadth of financial products and services they need. |
| | | |
| 10 | | BMO Financial Group 188th Annual Report 2005 |
Dave Munro, President and CEO, Gienow Windows and Doors Income Fund
| | | | | |
| | | Left to right:
David Farmer, Vice President and Underwriter Corporate Finance Loan Syndications, BMO Bank of Montreal
Debra Puckett, Business Development Leader,
Cash Management BMO Bank of Montreal
Neil Runions, Senior Manager, Corporate Finance Division, BMO Bank of Montreal | |  |
| | | |
| BMO Financial Group 188th Annual Report 2005 | | 11 |
In the United States
“Harris is a bank that stands for continuity and trust in our community.”
Through organic growth and acquisition, and by providing every customer every day a range and depth of products and services, Harris is well on the way toward achieving our goal of becoming the leading Midwest personal and commercial bank in the United States.
Client Profile: Namasté Laboratories
Looking out for our interests
In 1998, shortly after the sale of a family business, Chicagoan Gary Gardner turned to Harris to help him manage his financial affairs. He sought the services of Harris Private Bank to oversee his personal accounts as well as those belonging to his wife, Denise, and their two college-aged sons. He also looked to Harris to provide lending and cash management services for a new business venture, Namasté Laboratories, which develops and markets natural organic hair, skin and body renewal products to the multicultural market.
Why Harris? “That’s easy,” says Gardner. “There is so much change going on in the financial services industry in the U.S. Midwest. Amid all the flux, Harris is a bank that stands for continuity and trust in our community.”
Seven years later, Gardner remains more than pleased by his choice.“Harris is a strong partner,” he says.“It provided the support we needed when Namasté was developing its business. And it continues to look out for our interests as we expand. Just recently, for instance, Joe Dillon and his Harris relationship team encouraged us to take advantage of an interest rate risk management strategy that would protect our term loan against any future interest rate hikes. It’s already proven to be good advice.”
Gardner is equally happy with his private banking service. “I particularly appreciate that Mike Stanton and his colleagues at Harris Private Bank have taken the time to help my sons learn about matters ranging from portfolio management to buying a car,” he says. “It’s very important to me that they have a knowledge and understanding of financial matters. After all, the family business will be theirs one day.”
“I particularly appreciate that
Harris Private Bank has taken the
time to help my sons learn about
matters ranging from portfolio
management to buying a car.”
Gary Gardner, President
Namasté Laboratories
Commercial banking clients since 1998
| | | | | |
195branches | | 89% | | #1 |
| | | | | |
Harris’ community banking network has grown to
195 branches offering personal and business clients
a full suite of financial products and services. | | Harris retains 89% of its business banking customers, compared to the industry average of 83%. | | Harris is tied for first in both the small and
micro-business segments and is among
the Top 3 in the commercial mid-market
segment in Chicagoland. |
| | | |
| 12 | | BMO Financial Group 188th Annual Report 2005 |
Right:Gary Gardner,President, Namasté Laboratories with model and stylist
| | | | | |
| | | Left to right:
Joe Dillon,Market Manager, Harris
Nellie Tomicich, Assistant Vice President, Cash Management Specialist, Harris
Mike Stanton,Managing
Director, Harris Private Bank | |  |
| | | |
| BMO Financial Group 188th Annual Report 2005 | | 13 |
Cross Border
“We liked the all-encompassing nature of BMO’s offering on both sides of the border.”
Every day, BMO is winning business thanks to our unique and proven ability to provide integrated North American solutions that help our Canadian and American clients expand their operations across our shared border.
Client Profile: Sanimal Inc.
Sharing our excitement and our future
In the summer of 2004, the executive team at Sanimal Inc. agreed to acquire Wisconsin-based Anamax Group of Companies. Sanimal, a family-owned business, is the largest animal rendering company in eastern Canada, employing over 900 people.
As the deal was being completed in January 2005, Martin Couture, President, Sanimal Inc. received a telephone call. It was Richard Nadeau,Vice-President Corporate Finance at BMO Bank of Montreal. “When we learned of Sanimal’s plans, we thought that given our scope and expertise in both Canada and the United States, BMO had much to offer,” says Nadeau.
After an initial meeting with BMO, Sanimal’s leadership team agreed. “We liked the all-encompassing nature of BMO’s offering on both sides of the border,” says Sanimal CFO Claude Saulnier. He was also pleased to see at the table Brian Moeller, Managing Director, Food Group at Harris Nesbitt in Chicago and a well-known expert in the rendering industry.
It was the beginning of a lasting relationship. Over the next several months, BMO put together a North American solution for Sanimal that included a private placement arranged by Harris Nesbitt’s New York office as well as senior debt financing packaged jointly by BMO Bank of Montreal in Montreal and Harris Nesbitt in Chicago. Sanimal, which had been the client of
a competitor for 25 years, also transferred its cash management business on both sides of the border to BMO Bank of Montreal. At the same time, the company’s principals chose to transfer their personal accounts to BMO Harris Private Banking.
“It was not an easy decision to change our financial services provider,” says Couture. “But BMO’s offer was simply better. Just as important is that BMO’s people share our excitement and enthusiasm about our plans and future. Our company wants to continue to expand in the United States. We believe BMO is a partner with the expertise, professionalism and will to help us realize our goal.”
“BMO’s people share our excitement and enthusiasm about our plans and future.”
Martin Couture, President
Sanimal Inc.
Commercial banking clients since 2005
| | | | | | | |
$1.4 | | billion
(US)
| | 50years | | 1stfor customers |
| | | | | |
| Harris has become one of the leading commercial banks in the Chicago area, adding US$1.4 billion in business banking loans and US$900 million in business banking deposits between 2001 and 2005. | | BMO’s more than 50 years of expertise in the food and agricultural business in the United States is well recognized. | | In 2005, our Personal and Commercial Client Group established its first Chicago-based unit to coordinate organization-wide capabilities for customers needing banking services on both sides of the border. |
| | | |
| 14 | | BMO Financial Group 188th Annual Report 2005 |
Left to right (all from Sanimal Inc.):Claude Saulnier,Vice-President Finance;André Couture, Chairman;
Julie Couture,Board Member;Martin Couture,President
| | | | | |
| | | Left to right:
Brian Moeller,Managing Director, Food Group, Harris Nesbitt
Luc Bernier,Senior Manager, Corporate Finance Division, Personal and Commercial Client Group, BMO Bank of Montreal
Amy Lauterjung, Director, U.S. Debt Products Group, Harris Nesbitt
Richard Nadeau,Vice-President, Corporate Finance Division, Personal and Commercial Client Group, BMO Financial Group
Norman Shaffer, Managing Director, U.S. Debt Product Group, Harris Nesbitt | |  |
| | | |
| BMO Financial Group 188th Annual Report 2005 | | 15 |
Credit Risk Management
Leadership in
Credit Risk Management
Our record of excellence in credit risk management
is a fundamental strength that benefits both our
customers and our shareholders.
At BMO, a disciplined, consistent and prudent approach to credit risk is a core value. We don’t follow the pack to embrace the latest favourite sector or product, nor do we change our lending criteria according to whether the economy is growing or slowing. All significant commercial and corporate lending proposals are thoroughly investigated and analysed and credit decisions are made by experienced, well-trained and fully qualified personnel supported by time-tested policies and procedures. As a result of our industry-leading credit loss history and our transparency in credit reporting, we are a recognized leader in credit risk management.
A Better Deal for our Clients
What does BMO’s disciplined, consistent and prudent approach to credit risk management mean to our clients?
It means that they can rely on us in good times and, more importantly, in bad times. Our focus on consistency means we maintain the same underwriting standards throughout the credit cycle, whereas many lenders tighten their standards in response to deteriorating loan portfolios. It’s a fact that lenders who have opened the vaults too wide in bullish times often retrench when the economy contracts. It’s a pattern that can be unsettling at the least, and at the worst, disastrous for clients.
BMO’s approach is rather to deal with tough times by doing what we reasonably can to maintain valued relationships with our clients. Across Canada, members of our risk management groups have the mandate, training and resources necessary to work closely with customers to provide meaningful solutions tailored to their situations and needs.
A case in point involves our partnership with Canadian cattle ranchers following the crisis that developed when an Alberta cow tested positive for Bovine Spongiform Encephalopathy (BSE) in 2003. It was an event that prompted countries including the United States and Japan to close their borders to Canadian cattle. Reasoning that this difficult situation was beyond our customers’ ability to contend with on their own, we introduced BMO Bank of Montreal’sBSE Disaster Assistance Program, which allowed customers dealing with hundreds of thousands of dollars in lost income to defer principal payments on their loans until conditions improved.
As expected, conditions did improve. Last summer, the United States reopened its border to young Canadian cattle and our clients were back in business. And that, after all, is the point.
Better Results for Shareholders
What does our credit risk management approach mean for our shareholders? It’s simple. We gain market share without increased risks as the credit cycle deteriorates while many of our peers tighten their credit standards.
It also means better returns. Excellence in managing credit risk assets enables us to provide more predictable and consistent returns over time than our peers. Over the past 15 years BMO’s average credit loss was 36% below the average of its Canadian peer group. In 14 of those 15 years BMO’s credit losses were better than the average of its peer group. The one exception was 2001 when BMO recognized early losses associated with the telecom industry.
This early recognition of credit losses is a hallmark of our leading credit disclosures: we are vigilant in recognizing deterioration in credit assets and continually seek to provide the most meaningful information for shareholders and investors to enable them to accurately assess our credit quality. In 2004 we were the first Canadian bank to distinguish new specific provisions from reversals and recoveries in our specific provision for credit losses. This information assists investors in understanding emerging losses. Similarly, our disclosure of new impaired loans provides a leading indicator of potential future loss.
| | | |
| 16 | | BMO Financial Group 188th Annual Report 2005 |
Corporate Governance
Corporate Governance
Through our steadfast commitment to sound
principles of corporate governance, we strive
to retain the trust of every shareholder.
BMO Financial Group has a long-standing tradition as a leader in corporate governance. As we move forward, we strive to remain at the forefront of best practices.
Board Leadership, Independence and Accountability
Sound governance and ethical behaviour begin with our Board of Directors, which represents and is accountable to our shareholders and also sets the standard of good governance for the entire enterprise. The Board’s Governance and Nominating Committee is responsible for shaping our corporate governance policies and practices. The committee keeps abreast of developments in the world of corporate governance and oversees our compliance. When appropriate, it recommends new practices to the Board that will keep us at the forefront of best practices.
At BMO we believe that having independent directors –including our chairman – helps the Board operate autonomously and ensures that we are accountable to all our stakeholders. All our directors, with the exception of the CEO, are currently independent. Chairman David Galloway ensures that the Board operates independently of management and that directors have access to an independent leader.
Mr. Galloway is anex-officio member of all Board committees of which he is not a member. In that role he is able to manage the affairs of the Board, assisting the committees and the Board to function effectively and meet their responsibilities.
Annual Director and Committee Reviews
The effectiveness of the Board’s operations is monitored by annual evaluations of the Board, its committees and each director. The director evaluations are carried out through a “peer” performance review – one of the first of its kind in Canada –
| | | |
| | | |
| | | |
| | Recognition for Excellence in Disclosure
and Corporate Governance | |
| | | |
| | | |
| | | |
| | In 2005,Canadian Businessmagazine named BMO’s Board of Directors “Best Board in Canada.” BMO scored 99 out of a possible 100 points in the survey, which assessed companies on the basis of accountability, board independence, disclosure, three-year total return and three-year return vs. the S&P/TSX. | |
| | | |
| | | |
| | | |
| | The Globe and Mail’sReport on Businessannual review of corporate governance practices ranked BMO second overall among 209 Canadian reporting issuers. | |
| | | |
| | | |
| | | |
| | The Canadian Institute of Chartered Accountants’ annual Corporate Reporting Awards gave us the Award of Excellence in the financial institutions category and gave BMO an Honourable Mention for Excellence in Electronic Disclosure. | |
| | | |
| | | |
| | | |
| | Enterprise.com, a Europe-based researcher and publisher that conducts an annual review of corporate annual reports, has ranked each of our last six Annual Reports among the world’s top 30. Our last Annual Report was ranked 20th best in the world and our “Financial and Performance Reporting” was ranked No.1. | |
| | | |
| | | |
| | | |
| | I.R. Global Rankings recognized our investor relations web site for its timely and accurate disclosure of information for investors. | |
| | | |
| | | |
Board of Directors
The Board of Directors, either directly or through Board committees, is responsible for the management or supervision of management of the business and affairs of the Bank with the objective of enhancing shareholder value. Our Board is comprised of 14 independent directors and one management director, the President and CEO Tony Comper.
| | | | | |

Robert M. AstleyWaterloo, ON Corporate Director and former President and Chief Executive Officer Clarica Life Insurance Company and former President Sun Life Financial Canada | | 
Stephen E. Bachand
Ponte Vedra Beach, FL
Corporate Director and retired President and Chief Executive Officer Canadian Tire Corporation, Limited | | 
David R. Beatty, O.B.E.
Toronto, ON
Chairman and Chief Executive Officer Beatinvest Limited |
| | | |
| BMO Financial Group 188th Annual Report 2005 | | 17 |
Corporate Governance
Corporate Governance at BMO Financial Group
For more details regarding corporate governance at BMO, please see the following documents, which are posted on our web site – www.bmo.com.
Notice of Annual Meeting of Shareholders and Proxy Circular– Shareholders are invited to attend our Annual Meeting on March 2, 2006 at 9:30 a.m. in Calgary, Alberta or view a webcast of the event. Details of the webcast are available on our web site.
Corporate Governance– Our web site contains information on our corporate governance practices, including our code of conduct, titledFirst Principles, ourDirector Independence Standardsand Board and Committee Charters.
Proxy Circular– Our Proxy Circular contains information on each of the directors, Board Committee reports and a complete discussion of our corporate governance practices.
BMO Corporate Social Responsibility Report including ourPublic Accountability Statement– This annual report documents our corporate citizenship activities throughout the year. The 2005 report will be released in February 2006.
Each of the above documents is available in print to any shareholder upon request.
which is a comprehensive survey that requires all directors to assess the contribution of each of their peers on measures ranging from ethics to strategic insight, financial literacy and business judgment.
Governance Beyond Compliance
The Board of Directors serves as an example to our entire organization by affirming that sound corporate governance means not just abiding by the rules but also embracing the spirit of those rules. In fact, some of our corporate governance practices go beyond the requirements of the law.
We are committed to building on our success in the area of corporate governance, so that we remain at the forefront of best practices. At BMO, we recognize that our governance standards must respond to changes in our organization, stakeholder expectations, regulatory requirements and evolving best practices.
Continuously Enhancing Disclosure
BMO considers disclosure to be an essential component of effective corporate governance. To a large extent, the success of the multitude of regulatory requirements, voluntary best practices and an organization’s own culture of integrity is determined by the degree to which all stakeholders of the organization are able to truly understand its operations, goals and values as well as the extent of its assets in comparison to its liabilities.
Our efforts to continuously enhance public disclosure have made us an innovator in this area. Our Board encourages, and management actively seeks, ways to provide more information, clarity and insight to our stakeholders. A hallmark of our annual report is our financial performance scorecard, which made us a pioneer in financial disclosure. The scorecard is a report and comparison of eleven important financial measures including shareholder return, return on equity, earnings per share growth, productivity and credit performance. We disclose our performance on these measures relative to Canada’s major banks and our North American peer group.
We believe that assessing performance relative to our competition puts results in an appropriate context for our stakeholders and provides further clarity. BMO has disclosed these comparatives every year since it started the practice in 1992,

| | | |
| 18 | | BMO Financial Group 188th Annual Report 2005 |
reporting in good years and in bad. We believe that when we are open and honest in explaining results we earn the trust of stakeholders over the long term.
Stock Exchange Guidelines
As a Canadian reporting issuer with securities listed on the Toronto Stock Exchange (TSX) and the New York Stock Exchange (NYSE), our corporate governance practices meet, and in some cases exceed, the applicable guidelines adopted by the Canadian Securities Administrators (CSA), the rules of the U.S. Securities and Exchange Commission (SEC) which give effect to the provisions of theSarbanes-Oxley Actand the NYSE standards. Our governance practices differ significantly in only one respect from those required of U.S. domestic issuers under the NYSE standards. The NYSE standards require shareholder approval of all equity compensation plans and any material revisions to such plans, regardless of whether the securities to be delivered under such plans are newly issued or purchased on the open market, subject to a few limited exceptions. The TSX rules only require shareholder approval of equity compensation plans that involve newly issued securities, subject to a few limited exceptions. The TSX rules require that equity compensation plans that do not provide for a fixed maximum number of securities to be issued must have a rolling maximum number of securities to be issued based on a fixed percentage of the issuer’s outstanding securities and must be approved by shareholders every three years. If the plan provides a procedure for its amendment, the TSX rules require shareholder approval of amendments only where the amendment involves a reduction in the exercise price or an extension of the term of options held by insiders.
Honorary Directors
| | | |
Charles F. Baird | | J. Peter Gordon, O.C. |
| Skillman, NJ, U.S.A. | | Burlington, ON |
Ralph M. Barford | | Richard M. Ivey, C.C., Q.C. |
| Toronto, ON | | London, ON |
Matthew W. Barrett, O.C., LL.D. | | Senator Betty Kennedy, O.C., LL.D. |
| London, ENG | | Campbellville, ON |
Peter J. G. Bentley, O.C., LL.D. | | J. Blair MacAulay |
| Vancouver, BC | | Oakville, ON |
Claire P. Bertrand | | Ronald N. Mannix, O.C. |
| Montreal, QC | | Calgary, AB |
Frederick S. Burbidge, O.C. | | The Honourable Frank McKenna |
| Frelighsburg, QC | | Cap Pelé, NB |
Pierre Côté, C.M. | | Robert H. McKercher, Q.C. |
| Quebec City, QC | | Saskatoon, SK |
C. William Daniel, O.C., LL.D. | | Eric H. Molson |
| Toronto, ON | | Montreal, QC |
Graham R. Dawson | | William D. Mulholland, LL.D. |
| Vancouver, BC | | Georgetown, ON |
Louis A. Desrochers, C.M., c.r. | | Jerry E. A. Nickerson |
| Edmonton, AB | | North Sydney, NS |
A. John Ellis, O.C., LL.D., O.R.S. | | Lucien G. Rolland, O.C. |
| Vancouver, BC | | Montreal, QC |
John F. Fraser, O.C., LL.D. | | Joseph L. Rotman, O.C., LL.D. |
| Winnipeg, MB | | Toronto, ON |
Thomas M. Galt | | Mary Alice Stuart, C.M., O.Ont., LL.D. |
Toronto, ON
| | Toronto, ON |

| | | |
| BMO Financial Group 188th Annual Report 2005 | | 19 |
Employees
Ours is a culture that embraces diversity, delivers opportunity and demands respect for all
We are committed to ensuring a workplace where the voice of every colleague is listened to and encouraged.

| | | | | | |
| | | | | | |
| | 2005 Awards | | | Awarded by | |
| | | | | | |
| | Canada’s Top 100
Employers | | | BMO was named one of Canada’s Top 100 Employers byMaclean’smagazine and Mediacorp Inc. for the fourth consecutive year. Once again, BMO was the only major Canadian bank included on this prestigious list. | |
| | | | | | |
| | Best in Class
Diversity Program Award | | | BMO was recognized by International Quality & Productivity Center for having a successful diversity program, which demonstrates best practices and has key leadership support. | |
| | | | | | |
| | Diversity Leader of
the Year Award | | | Tony Comper, President and CEO of BMO Financial Group, was recognized by International Quality & Productivity Center for his leadership in initiating and implementing successful diversity programs that are integrated throughout the organization. | |
| | | | | | |
| | Training Top 100 | | | BMO Financial Group ranked 16th overall inTrainingmagazine’s Top 100 North American corporations in 2005. For the fourth consecutive year, BMO was the top Canadian company on the list. | |
| | | | | | |
| | Award of Excellence:
Corporate Category | | | The Canadian Race Relations Foundation recognized BMO Financial Group for excellence and innovation in race relations practice in Canada. | |
| | | | | | |
| | Most Innovative
Recruiting & Staffing
Program/Initiative
| | | BMO Financial Group Bank-wide Student Training Program was recognized with a Recruiting & Staffing Best in Class Award from International Quality & Productivity Center. | |
| | | | | | |
| | Diamond Club | | | BMO was recognized by the Canadian Paraplegic Association for outstanding corporate philanthropy and service. | |
| | | | | | |
At BMO, we are proud of our reputation as an employer of choice. It attests to the emphasis we place on
getting it rightwith our employees, which helps enhance our ability to attract and retain top people and fosters top performance. Getting it right with our employees helps them get it right with our customers.
Listening to Our People: Annual Employee Survey
Getting it right involves an ongoing dialogue. For more than 20 years, we have sought out – and listened to – the views of our people through our Annual Employee Survey (AES). The AES provides vital information about our employees’ experiences and opinions. It is an essential part of our journey to be the top-performing financial services company in North America and a vital tool in honing our customer service practices.
The results of our 2005 AES were encouraging. The participation rate of 88% was the highest ever. Meanwhile, our Enterprise Engagement Index, which represents the strength of our overall relationship with employees, is at its highest point since the index was introduced in 2001.
Diversity: An Ongoing Commitment
BMO’s commitment to ensuring a diverse culture remains strong. In 1990, we launched groundbreaking task forces on the advancement of women, visible minorities, people with disabilities and Aboriginal employees. The reports helped generate fact-based diversity and workplace equity goals and led directly to the development of numerous tools and programs designed to recognize, monitor, and eliminate barriers to advancement.
We are proud of our diversity achievements. But we are not satisfied. We recently introduced an initiative designed to build on our current leadership position and set our diversity strategy for the next 10 years. EntitledAbove & Beyond, the program will ensure that we maintain and strengthen our international recognition for diversity and equity.
| | | |
| 20 | | BMO Financial Group 188th Annual Report 2005 |
Community
A tradition of giving back to our communities
Every day, we are helping to make our communities stronger, happier places to live and work.
BMO is one of Canada’s most generous corporate benefactors. Through our donations and sponsorship programs, we contribute to causes that include education, health, arts and culture, community development and sports and athletics. Our efforts are augmented by our people, thousands of whom give substantial amounts of their time, energy and income to support their communities.
Physicians for the North
Providing excellent health care to every Canadian is a societal responsibility – and a challenge. With both these truths in mind, we announced our support for two innovative programs developed to train physicians for practice in northern and rural communities. In British Columbia, BMO committed $150,000 over five years to support theNorthern Medical Programs Trustat the University of Northern British Columbia in Prince George. It is expected by 2015 that 150 students will have graduated from this program. In Ontario, we have pledged $100,000 over four years to establish theBMO Financial Group Bursary Fundat Northern Ontario School of Medicine (NOSM). With main campuses located in Thunder Bay and Sudbury, NOSM is the first new medical school in Canada in more than 30 years.
Supporting the Arts
BMO Financial Group is the founding sponsor of theElinore and Lou Siminovitch Prize in Theatre, which this year was awarded to playwright John Mighton at a gala celebration in Toronto. He was awarded a $100,000 prize, the largest in Canadian theatre.
In Times of Need
BMO Financial Group provided support to people and regions affected by the many environmental disasters during the past year. For example, BMO donated funds to help Red Cross Provincial Disaster Response Team relief efforts for flood victims in south and central Alberta. BMO and its U.S. subsidiary Harris
Focus on Learning
BMO remains particularly focused on supporting programs that encourage learning. As part of our continuing investment in learning, BMO committed $8.2 million in new funding over the next 10 years to 25 colleges and universities across Canada.
| § | | $750,000 to create an endowment to supportBMO Financial Group Leadership Scholarshipsat the University of Manitoba. |
| |
| § | | $1.3 million to create theBMO Financial Group Scholarship Programto help fund entrance scholarships for top students in need at the University of Waterloo. |
| |
| § | | $1.5 million to University of Western Ontario to establishBMO Financial Group Graduate Scholarshipsfor Master’s and Doctoral students. |
| |
| § | | $250,000 forBMO Financial Group Graduate Student Research Scholarships at the University of Prince Edward Island. |
| |
| § | | $500,000 for Seneca College to establish theBMO Customer Contact Centre Labfor professional development and hands-on training. |
| |
| § | | $525,000 gift to Laval University and their entrepreneurship centre,Entrepreneuriat Laval. |
In addition, BMO Nesbitt Burns raised $1.6 million forEquity through Education, a diversity initiative that provides financial assistance to students.
provided donations to relief efforts along the U.S. Gulf Coast following the destruction from Hurricane Katrina. In addition, BMO and HarrisTM1employees volunteered their time and support. We also donated funds to Canadian Red Cross relief efforts in Southeast and South Asia in the aftermath of the Tsunami tragedy, and to aid victims of a devastating earthquake in South Asia.
Learning to Skate
Canadians love to skate and BMO is intent on supporting the tradition. We are major sponsors of the Canadian National Figure Skating Team as well as presenter of CanSkate®2, Skate Canada’s national learn-to-skate program. Over the past year, we presented BMO Financial Group CanSkate Champions Medals to more than 4,000 young people from across the country.
For more examples of our commitment to our communities, please see ourCorporate Social Responsibility Reportincluding ourPublic Accountability Statementonline at www.bmo.com/community.
| | | | | |
$37.9million | | $9million | |  |
In 2005,BMO contributed $37.9 millionin corporate donations, sponsorships and events, supporting communities, charities and not-for-profit organizations in Canada and the United States. | | Each year, thousands of BMO and Harris employees give generously of their time and money to support their communities. In 2005,our employees raised a record $7.9 millionthrough BMO Fountain of Hope, a national charitable foundation managed by BMO Financial Group employees and over US$1 million through the United Way in Chicagoland. | |
| | | |
| BMO Financial Group 188th Annual Report 2005 | | 21 |
Environment
Committed to sustainable development
Every day, we insist that respect for the environment be a living part of our culture.
At BMO, we believe that the quality of our lives improves when economic growth is integrated with respect for the environment. By supporting and abiding by the principles of sustainable development, we act in the best interests of our shareholders, customers, employees, communities and our future.
Environmental Framework
BMO’s Environmental Policy and Principles provide the framework by which we address our commitment to both the protection of the environment and the principles of sustainable development. As guided by our principles, we pledge to:
| § | | Promote environmental stewardship across our business. |
| |
| § | | Respect, protect and act to serve the environment around us. |
| |
| § | | Engage our employees in our environmental management programs. |
| |
| § | | Provide credit to borrowers in a manner that respects environmental management. |
| |
| § | | Take responsibility for our environmental performance. |
| |
| § | | Work with others to protect and preserve our environment. |
Energy Audit Progress
During the past year, in partnership with property managers and a third-party energy consultant, we completed energy audits of the nine major office towers and specialty buildings BMO owns across Canada. Moving forward, we have begun to assess the results and prioritize opportunities to improve energy efficiency.
FTSE4Good
Again this year, BMO was included in theFTSE4Good Index. Launched by theFinancial Timesand the London Stock Exchange, the Index recognizes the performance of companies that meet globally recognized corporate responsibility standards according to the criteria of environmental sustainability, social issues and stakeholder relations and human rights.
Dow Jones Sustainability North America Index
BMO Financial Group was chosen to be among the first Canadian companies listed on the newly createdDow Jones Sustainability North America Index(DJSI North America). Modelled on the benchmarkDow Jones Sustainability World Index, DJSI North America recognizes the region’s top companies in terms of economic, environmental and social sustainability principles and practices.
Equator Principles
In September 2005, BMO became a signatory to theEquator Principles, a voluntary set of environmental and social guidelines for project financing adopted by leading banks. TheEquator Principleswere established in 2002 by the International Finance Corporation, a member of the World Bank Group that promotes sustainable, private sector investment in developing countries as a way to reduce poverty and improve people’s lives.
United Nations Environment Program
BMO Financial Group is a signatory to theUNEP Statement by Financial Institutions on the Environment and Sustainable Development. As a signatory, we acknowledge globally recognized principles of environmental protection and sustainable development.
Carbon Disclosure Project
In 2005, we also became a signatory to theCarbon Disclosure Project, a coordinating secretariat for a coalition of the world’s largest institutional investors. Members of the Project voluntarily disclose investment-relevant information concerning greenhouse gas emissions.
For more on BMO and the Environment, see our web site at www.bmo.com/community.
| | | | | |
| |  | |  |
| | | | | |
Dow Jones Sustainability
North America Index | | FTSE4Good Index Series | | The Equator Principles |
| | | |
| 22 | | BMO Financial Group 188th Annual Report 2005 |
Management’s Discussion and Analysis
BMO’s President and Chief Executive Officer and Chief Financial Officer have signed a statement outlining management’s responsibility for financial information in this Annual Report. The statement, which can be found on page 91, also explains the roles of the Audit Committee and Board of Directors in respect of financial information in the Annual Report.
Management’s Discussion and Analysis (MD&A) comments on BMO’s operations and financial condition for the years ended October 31, 2005 and 2004. The commentary is as of November 29, 2005, except for peer group comparisons, which are as of December 8, 2005. Unless otherwise indicated, all amounts are in Canadian dollars and have been derived from financial statements prepared in accordance with Canadian generally accepted accounting principles (GAAP).
Certain prior year data has been reclassified to conform with the current year’s presentation, including reclassifications arising from transfers of certain businesses between operating groups. In addition, Note 20 on page 119 of the financial statements details the impact on previously reported amounts arising from a change in accounting policy that was adopted on a retroactive basis.
| | | | | | |
| | | | | | |
| | | Index | | | |
| | | | | | |
23 | | Index | | | |
24 | | Financial Performance and Condition at a Glance | | ß | Financial Performance and Condition at a Glanceprovides a snapshot of our results on 11 key financial performance and condition measures used by management to monitor performance relative to our peer groups.
Who We Areprovides an overview of BMO Financial Group, outlines our 2005 and 2006 targets and explains the links between our annual targets and our overall vision.
Enterprise-Wide Strategyoutlines our enterprise strategy and our progress in relation to our 2005 strategic priorities.
Caution Regarding Forward-Looking Statementswarns readers about the limitations and inherent risks and uncertainties of forward-looking information.
Factors That May Affect Future Resultsoutlines certain industry and company-specific factors that investors should ensure they consider when assessing BMO’s earnings prospects.
Economic Developmentsincludes commentary on the impact of economic developments on our businesses in 2005 and expectations for the economy in 2006.
Value Measuresreviews financial performance on the four key measures that assess or most directly influence shareholder return. |
27 | | Who We Are | | ß |
| | | | | |
28 | | Enterprise-Wide Strategy | | ß |
29 | | Caution Regarding
Forward-Looking Statements | | ß |
29 | | Factors That May Affect Future Results | | ß |
31 | | Economic Developments | | |
| | | | | ß |
| | | Value Measures | | |
32 | | Total Shareholder Return | | ß |
33 | | Earnings per Share Growth | | |
34 | | Return on Equity | | |
34 | | Net Economic Profit Growth | | |
| | | | | |
35 | | 2005 Financial Performance Review | | ß | 2005 Financial Performance Reviewprovides a detailed review of BMO’s consolidated financial performance by major income statement category. It also includes explanations of the use of non-GAAP measures and the impacts of changes in foreign exchange rates and acquired businesses.
Operating Group Reviewoutlines the visions and strategies of our operating groups and the major business risks they face, along with the strengths and competencies that help them execute their strategies in support of their visions. It also includes a summary of their achievements in 2005, their priorities for 2006 and a review of their financial performance for the year. |
| | | | | |
| | | Operating Group Review | | ß |
43 | | Summary | | |
44 | | Personal and Commercial Client Group | | |
50 | | Private Client Group | | |
53 | | Investment Banking Group | | |
56 | | Corporate Support, including Technology and Solutions | | |
| | | | | | |
| | | Financial Condition Review | | ß | Financial Condition Reviewdiscusses our assets and liabilities by major balance sheet category. It reviews our capital adequacy and our approach to ensuring we optimize our capital position to support our business strategies and maximize returns to shareholders. It also discusses off-balance sheet arrangements and financial instruments. |
57 | | Balance Sheet | | |
59 | | Enterprise-Wide Capital Management | | |
61 | | Off-Balance Sheet Arrangements | | |
62 | | Financial Instruments | | |
| | | | | | |
| | | Accounting Matters and Disclosure Controls | | ß | Accounting Matters and Disclosure Controlsreviews critical accounting estimates and changes in accounting policies in 2005 and for future periods. It also discusses our evaluation of disclosure controls and procedures and internal controls over financial reporting. |
63 | | Critical Accounting Estimates | | |
65 | | Changes in Accounting Policies in 2005 | | |
66 | | Future Changes in Accounting Policies | | |
66 | | Disclosure Controls and Procedures | | |
67 | | Enterprise-Wide Risk Management | | ß | Enterprise-Wide Risk Managementoutlines our approach to managing the key financial and related risks we face. |
| | | | | | |
75 | | Review of Fourth Quarter Performance, Quarterly Earnings Trends and 2004 Financial Performance Review | | ß | These reviews comment on results for periods of relevance other than fiscal 2005. |
| | | | | | |
79 | | Supplemental Information | | ß | Supplemental Informationpresents many useful financial tables and provides more historical detail. |
Our continuous disclosure materials, including our interim filings, annual MD&A and audited consolidated financial statements, our Annual Information Form and the Notice of Annual Meeting of Shareholders and Proxy Circular are available on our web site at www.bmo.com, on the Canadian Securities Administrators’ web site at www.sedar.com and on the EDGAR section of the SEC’s web site at www.sec.gov. BMO’s CEO and CFO each certify the appropriateness and fairness of BMO’s annual and interim financial statements and MD&A and Annual Information Form, and have reported on the effectiveness of BMO’s disclosure controls and procedures.
| | | |
| BMO Financial Group 188th Annual Report 2005 | | 23 |
Financial Performance and Condition at a Glance
| | | | | | | |
| Our Performance | | | | | | Peer Group Comparison |
| | | | | | | |
Total Shareholder Return (TSR) • BMO’s average annual five-year TSR of 13.8% declined from 18.9% a year ago, but is consistent with returns from the financial services industry and better than the broader market indices. • BMO’s one-year TSR of 3.7% in 2005 lowered our five-year TSR, but follows returns of 33% and 20% in the two prior years.
Further details are provided on page 32. | | |  | | | Five-Year TSR(%)
• BMO’s average annual five-year TSR of 13.8% was below the Canadian peer group average of 15.4% but substantially above the North American peer group average of 10.1%. • Performance declined from a year ago on this measure because of the exclusion of the strong returns in 2000. |
| | | | | | | |
Earnings per Share (EPS) Growth • EPS rose 5% to a record $4.64, after having grown strongly in 2003 and 2004. The increase was driven by business growth and a lower effective tax rate, partially offset by higher provisions for credit losses due to lower reversals and recoveries. • EPS grew 9% excluding changes in the general allowance for credit losses in 2005 and 2004, exceeding our 2005 target of 3% to 8% growth on this basis.
Further details are provided on page 33. | | |  | | | EPS Growth(%)
• BMO’s EPS growth of 5.0% in 2005 was above the Canadian peer group average of –8.2% but below the North American peer group average of 12.3%. • Litigation provisions recorded by some of our peers in 2004 and 2005 significantly reduced the Canadian peer group average in 2005 but increased the North American peer group average. |
| | | | | | | |
Return on Equity (ROE) • ROE of 18.8% was down from 19.4% in 2004, but was the second highest in the past 20 years and above our 2005 target of 17% to 18%.
Further details are provided on page 32. | | |  | | | ROE(%)
• ROE of 18.8% in 2005 was well above the Canadian peer group average of 15.8% and the North American peer group average of 15.6%. • BMO has earned ROE of more than 13% in each of the past 16 years, the only major North American bank to do so. |
| | | | | | | |
Net Economic Profit (NEP) Growth • NEP, a measure of added economic value, remained high in 2005, declining marginally because of increased capital after growing 92% in 2003 and 60% in 2004. • Each of the client operating groups generated higher NEP in 2005 but these increases were offset by lower NEP in Corporate Support primarily due to higher provisions for credit losses.
Further details are provided on page 34. | | |  | | | NEP Growth(%)
• NEP growth of –0.3% in 2005 was well above the Canadian peer group average of –27% but well below the North American peer group average of 16%, in large part due to the effect of litigation provisions of certain of our peers. |
| | | | | | | |
Revenue Growth • Revenue* increased $470 million or 5% in 2005. There was strong growth in Personal and Commercial Client Group and Private Client Group and in the fee-based businesses in Investment Banking Group. • The weaker U.S. dollar lowered revenue growth by 2.2 percentage points.
Further details are provided on page 37. | | |  | | | Revenue Growth(%)
• Revenue growth of 5.0% in 2005 was below the Canadian peer group average of 6.6% and the strong North American peer group average of 12.9%. • BMO’s revenue growth improved in 2005 and had outpaced the Canadian peer group average in 2003 and 2004. |
| | | | | | | |
Expense-to-Revenue (Productivity) Ratio • The productivity ratio improved 140 basis points to 63.5% in 2005. The cash productivity ratio improved 120 basis points to 62.6%, following 420 basis points of total improvement in the two prior years. We had targeted an improvement of 150 to 200 basis points in the cash productivity ratio in 2005.
Further details are provided on page 41. | | |  | | | Expense-to-Revenue Ratio(%)
• BMO’s productivity ratio of 63.5% was better than the Canadian peer group average of 69.5% but above the North American peer group average of 60.5%. The impact of litigation provisions of certain peers increased our advantage over the average Canadian peer. • BMO’s productivity ratio remains second best of the Canadian peer group. |
| | | | | | | |
*Revenue and income taxes in the MD&A are reported on a taxable equivalent basis.
See pages 35, 37 and 42. | | |  | | | See page 26 for further comments on peer group comparisons.
Certain prior year data has been restated.
See Note 1 on page 26. |
| | | |
| 24 | | BMO Financial Group 188th Annual Report 2005 |
| | | | | | | |
| Our Performance | | | | | | Peer Group Comparison |
| | | | | | | |
| Credit Losses • The provision for credit losses increased $282 million. Specific provisions were $152 million higher, driven by lower reversals and recoveries, and the reduction in the general allowance was $130 million lower. • The provision represented 11 basis points of average net loans and acceptances, up from –7 basis points in 2004.
Further details are provided on pages 40 and 69. | | |  | | | Provision for Credit Losses as a % of Average Net Loans and Acceptances
• BMO’s provision for credit losses of 0.11% of average net loans and acceptances was better than the Canadian peer group average of 0.17% and the North American peer group average of 0.56%. •BMO’s credit loss experience has been better than the Canadian peer group average in 14 of the past 15 years. |
| | | | | | | |
Impaired Loans
• Gross impaired loans and acceptances totalled $804 million, compared with $1,119 million in 2004, representing 4.9% of equity and allowances for credit losses versus 7.5% a year ago. • Formations of new impaired loans and acceptances, a key driver of credit provisions, totalled $423 million, down from $607 million in 2004 and $1,303 million in 2003.
Further details are provided on pages 40 and 69. | | |  | | | Gross Impaired Loans and Acceptances as a % of Equity and Allowances for Credit Losses
•BMO’s ratio of 4.9% was marginally better than the Canadian peer group average of 5.0% but worse than the North American peer group average of 3.0%. • BMO’s ratio has approximated the Canadian average but has been higher than the North American average in recent years. |
| | | | | | | |
Liquidity Ratio• Cash and securities as a percentage of total assets was largely consistent with 2004 at 26.2%. • Liquidity remains sound and continues to be supported by broad diversification of deposits. Further details are provided on pages 72 and 73. | | |  | | | Cash and Securities as a % of Total Assets
• BMO’s liquidity ratio of 26.2% was below the Canadian peer group average of 32.0% and the North American peer group average of 30.8%. •Our liquidity ratio was higher than a year ago and remains at an acceptable level. |
| | | | | | | |
Capital Adequacy• The Tier 1 Capital Ratio was 10.25%, up from 9.81% last year and above our minimum target of 8.0%. • The Total Capital Ratio was 11.76%, up from 11.31% in 2004. • BMO has $3.4 billion of excess capital relative to our targeted Tier 1 Capital Ratio. Further details are provided on pages 59 and 60. | | |  | | | Tier 1 Capital Ratio(%)
•Our Tier 1 Capital Ratio at 10.25% was the highest in recent years and above the Canadian peer group average of 9.95%. •On a U.S. regulatory basis, our Tier 1 Capital Ratio was 9.96% and was above the North American peer group average of 8.33%. |
| | | | | | | |
Credit Rating(Standard & Poor’s)• Our credit rating, as measured by Standard & Poor’s®3 (S&P) senior debt ratings, remained at AA–, matching two competitors and exceeding the rating of the three other major Canadian banks. • The S&P ratings outlook on BMO remains stable. | | |  | | | Credit Rating(Standard & Poor’s)
• BMO’s credit rating of AA–, as measured by S&P’s senior debt ratings, was in the upper half of the Canadian peer group, with two of the banks in our peer group rated as highly as BMO and three rated lower. BMO’s rating was consistent with the median rating of the North American peer group. |
| Further details are provided on page 60. | | | | | | |
| | | | | | | |
Credit Rating(Moody’s)• Our credit rating, as measured by Moody’s®4 senior debt ratings, remained at Aa3, slightly below the highest-rated Canadian bank and consistent with the highest-rated of the other major Canadian banks. • The Moody’s ratings outlook on BMO remains stable.
Further details are provided on page 60. | | |  | | | Credit Rating(Moody’s)
•BMO’s credit rating of Aa3, as measured by Moody’s senior debt ratings, was comparable to the median of the Canadian peer group but slightly higher than the North American peer group median. |
| | | | | | | |
| | | | | | | |
| | | |  | | | See page 26 for further comments on peer group comparisons.
Certain prior year data has been restated.
See Note 1 on page 26. |
| | | | | | | |
| | | | | | | |
| | | |
| BMO Financial Group 188th Annual Report 2005 | | 25 |
Canadian and North American Peer Group Comparisons
| | | | | | | | | | | | | | | | | | | | | | | | | | | | | | | | | | | | | | | | | | | | | | | | | | | | | | | | | | | | | |
| | | | | | | | | | | | | | | | | | | | | | | | | | | | | | | | | | | | | | 2004 | | | | | | | | | | | Five-Year Average | |
| | | | | | | | | | | | | | | | | | 2005 | | | | | | | | | | | | | | | (Note 1) | | | | | | | | | | | | | | | | | (Note 1) | |
| |
| | | | | | | | | | | Cdn. | | | N.A. | | | N.A. | | | | | | | | | | | Cdn. | | | N.A. | | | N.A. | | | | | | | | | | | Cdn. | | | N.A. | | | N.A. | |
| | | | | | | Rank | | | bank | | | bank | | | bank | | | | | | | Rank | | | bank | | | bank | | | bank | | | | | | | Rank | | | bank | | | bank | | | bank | |
| | | BMO | | | of six | | | avg. | | | avg. | | | q'tile | | | BMO | | | of six | | | avg. | | | avg. | | | q'tile | | | BMO | | | of six | | | avg. | | | avg. | | | q'tile | |
| |
Financial Performance Measures (%) | | | | | | | | | | | | | | | | | | | | | | | | | | | | | | | | | | | | | | | | | | | | | | | | | | | | | | | | | | | | |
| Five-year total shareholder return (TSR) | | | 13.8 | | | | 4 | | | | 15.4 | | | | 10.1 | | | | 1 | | | | 18.9 | | | | 4 | | | | 20.1 | | | | 12.0 | | | | 1 | | | | 13.8 | | | | 4 | | | | 15.4 | | | | 10.1 | | | | 1 | |
| Diluted earnings per share (EPS) growth | | | 5.0 | | | | 4 | | | | (8.2 | ) | | | 12.3 | | | | 3 | | | | 28.5 | | | | 2 | | | | 22.2 | | | | 9.8 | | | | 1 | | | | 7.4 | | | | 5 | | | | 5.2 | | | | 7.5 | | | | 3 | |
| Return on common shareholders’ equity (ROE) | | | 18.8 | | | | 3 | | | | 15.8 | | | | 15.6 | | | | 2 | | | | 19.4 | | | | 2 | | | | 18.3 | | | | 16.2 | | | | 2 | | | | 16.4 | | | | 4 | | | | 15.0 | | | | 15.3 | | | | 2 | |
| Net economic profit (NEP) growth | | | (0.3 | ) | | | 4 | | | | (26.8 | ) | | | 16.1 | | | | 3 | | | | 59.6 | | | | 2 | | | | 55.5 | | | | 12.4 | | | | 1 | | | | 8.0 | | | | 5 | | | | 4.6 | | | | 4.0 | | | | 3 | |
| Revenue growth | | | 5.0 | | | | 5 | | | | 6.6 | | | | 12.9 | | | | 3 | | | | 3.7 | | | | 3 | | | | 3.3 | | | | 11.4 | | | | 3 | | | | 3.0 | | | | 5 | | | | 3.7 | | | | 7.1 | | | | 3 | |
| Expense-to-revenue (productivity) ratio | | | 63.5 | | | | 2 | | | | 69.5 | | | | 60.5 | | | | 3 | | | | 64.9 | | | | 2 | | | | 67.2 | | | | 63.1 | | | | 3 | | | | 65.9 | | | | 3 | | | | 68.1 | | | | 62.1 | | | | 3 | |
| Provision for credit losses as a % of average net loans and acceptances | | | 0.11 | | | | 3 | | | | 0.17 | | | | 0.56 | | | | 1 | | | | (0.07 | ) | | | 2 | | | | 0.11 | | | | 0.54 | | | | 1 | | | | 0.31 | | | | 1 | | | | 0.46 | | | | 0.86 | | | | 1 | |
Financial Condition Measures (%) | | | | | | | | | | | | | | | | | | | | | | | | | | | | | | | | | | | | | | | | | | | | | | | | | | | | | | | | | | | | |
| Gross impaired loans and acceptances as a % of equity and allowances for credit losses | | | 4.9 | | | | 4 | | | | 5.0 | | | | 3.0 | | | | 4 | | | | 7.5 | | | | 3 | | | | 7.3 | | | | 4.3 | | | | 4 | | | | 12.0 | | | | 5 | | | | 10.7 | | | | 6.7 | | | | 4 | |
| Liquidity ratio | | | 26.2 | | | | 6 | | | | 32.0 | | | | 30.8 | | | | 3 | | | | 25.8 | | | | 6 | | | | 30.6 | | | | 31.0 | | | | 3 | | | | 25.8 | | | | 6 | | | | 30.2 | | | | 30.0 | | | | 3 | |
| Tier 1 Capital Ratio | | | 10.25 | | | | 2 | | | | 9.95 | | | | 8.33 | | | | 1 | | | | 9.81 | | | | 4 | | | | 10.40 | | | | 8.40 | | | | 1 | | | | 9.31 | | | | 5 | | | | 9.68 | | | | 8.12 | | | | 1 | |
| Credit rating – Standard & Poor’s | | AA– | | | 1 | | | AA– | | AA– | | | 1 | | | AA– | | | 1 | | | AA– | | | A+ | | | | 1 | | | AA– | | | 1 | | | AA– | | | A+ | | | | 1 | |
| – Moody’s | | Aa3 | | | 2 | | | Aa3 | | Aa2 | | | 2 | | | Aa3 | | | 2 | | | Aa3 | | Aa3 | | | 2 | | | Aa3 | | | 2 | | | Aa3 | | Aa3 | | | 2 | |
| |
The Canadian peer group averages are based on the performance of Canada’s six largest banks: BMO Financial Group, Canadian Imperial Bank of Commerce, National Bank of Canada, RBC Financial Group, Scotiabank and TD Bank Financial Group. The North American peer group averages are based on the performance of North America’s largest banks, consisting of 15 banks in North America having shareholders’ equity that is at least 75% as large as BMO’s. It includes the Canadian peer group, except National Bank of Canada, as well as Bank of America Corporation, Citigroup, J.P. Morgan Chase & Co., KeyCorp, National City Corporation, The PNC Financial Services Group Inc., SunTrust Banks Inc., U.S. Bancorp, Wachovia Corporation, and Wells Fargo & Company.
Results are as at or for the years ended October 31 for Canadian banks and as at or for the years ended September 30 for U.S. banks, as appropriate.
For consistency with our peer groups, the non-interest expense-to-revenue ratios include amortization of goodwill for all banks for 2001 in the calculation of the five-year average.
Note 1. Certain BMO and peer group prior year data has been restated to conform with the current year’s basis of presentation.
Canadian Peer Group Comparison
BMO’s performance in 2005 improved from 2004 on 5 of our 11 key financial performance and condition measures, and was unchanged on another. These measures are considered key because we monitor our performance on them relative to our peer groups. In 2004, our performance improved on 7 of the 11 measures and was unchanged on another.
Significant litigation provisions recorded by certain of our Canadian peers affected the Canadian peer group averages in 2005. Although some of our Canadian peers also recorded litigation or restructuring provisions in 2004, the impact on the average of peer group performance measures was much more pronounced in 2005.
In 2005, our performance was better than the Canadian peer group average on 5 of 7 financial performance measures, compared with above-average performance on 6 measures in 2004. Our rankings in 2005 were unchanged on 2 of the 7 financial performance measures but declined somewhat on the others. Improving productivity was again BMO’s top priority for 2005. Our expense-to-revenue (productivity) ratio improved 140 bps in 2005 and remains the second best of our Canadian peer group. BMO’s cash productivity ratio (see page 35) improved 120 bps to 62.6% in 2005, building on the significant improvement of the past two years, during which the cash productivity ratio improved 420 basis points. This ratio also remains the second best of Canada’s major banks. In 2006, a top priority is to focus on revenue growth to achieve a further 100 to 150 basis point improvement in our cash productivity ratio.
We were better than average on 2 of the 4 financial condition measures in 2005, average on 1 and below average on 1. Our ranking improved on 1 measure, deteriorated on 1 and was unchanged on the other 2.
In our Management’s Discussion and Analysis in 2004, we indicated that we expected provisions for credit losses to increase from the unusually low levels of 2004 and that as a result, certain of our performance growth measures in 2005 might be less robust than in 2004. Our provisions did increase significantly in 2005 and our rankings have declined somewhat from 2004.
Our 2005 performance was better than our five-year average performance on 7 of 11 measures and was consistent with our average on another 2. Our five-year average results were better than the comparable Canadian peer group average on 5 of 7 financial performance measures but were below average on 3 of 4 financial condition measures.
North American Peer Group Comparison
Our 2005 rankings in the North American peer group slipped from the strong rankings of a year ago. North American peer group performance in 2004 was affected by two of the largest banks recording multi-billion-dollar provisions for litigation and other settlement costs associated with certain high-profile insolvencies. This improved BMO’s 2004 North American rankings and comparative performance but lowered our rankings and relative growth performance measures in 2005.
Our quartile ranking was unchanged on all 4 financial condition measures and on 5 of the 7 financial performance measures, but declined on the remaining 2. Our performance was better than average on 3 of 7 financial performance measures in 2005, compared with above-average performance on 5 measures in 2004. Our financial condition was better than average on 1 of 4 measures in 2005 and average on another.
Our five-year average performance was better than the North American peer group average on 4 of 7 financial performance measures and on 2 of 4 financial condition measures.
| | | |
| 26 | | BMO Financial Group 188th Annual Report 2005 |
Who We Are
BMO Financial Group is one of the largest financial services providers in North America, offering comprehensive retail banking, wealth management and investment banking products, services and solutions. Canadian clients are served through BMO Bank of Montreal, our personal and commercial banking business, and BMO Nesbitt Burns, one of Canada’s leading full-service investment and wealth management firms. In the United States, clients are served through Harris, a major Midwest financial services organization with a network of community banks in the Chicago area and wealth management offices across the United States, as well as Harris Nesbitt, a leading mid-market investment and corporate bank. Our financial services professionals can provide access to any service our customers require across the entire enterprise. BMO Financial Group comprises three client operating groups: Personal and Commercial Client Group, Private Client Group and Investment Banking Group.
Our Financial Targets
BMO’s overall governing objective, medium-term financial objectives and annual targets for selected important financial performance measures are set out in the adjacent chart. Although our success in achieving our overall governing objective is dependent on the relative performance of our peer group, we believe that we will deliver first-quartile total shareholder return by meeting our medium-term financial objectives of increasing EPS by an average of at least 10% per year over time and by earning an average annual ROE of 18% to 19% over time. Annual financial targets represent checkpoints in the achievement of our medium-term objectives, but they also reflect economic conditions prevailing at the time and may be influenced by results in base years used for comparison purposes. As such, in any particular year, our annual financial targets are likely to be higher or lower than our medium-term financial objectives.
Our operating philosophy is to increase revenues at rates higher than general economic growth rates, while limiting expense growth to improve our productivity ratio, over time. In achieving efficiencies in expense management, we balance current profitability with the need to invest for future growth. When possible, expense efficiencies partially or totally fund the costs of investing for the future.
In 2005, we achieved four of our five financial targets. In 2004, as in 2003, we achieved all five of our financial targets. In 2005, EPS increased by 5.0% (9.0% excluding changes in the general allowance in 2005 and 2004). In the two prior years, EPS grew by 28% and 29%, substantially above our medium-term financial objective of 10% growth. In those years, our cash productivity ratio improved by a total of 420 basis points. Our annual EPS target for 2005 was lower than in preceding years, in part due to the high growth rates achieved in 2003 and 2004, when provisions for credit losses were declining. However, our productivity improvement target for 2005 was unchanged from the two prior years despite the progress made in 2003 and 2004. Although the cash productivity
Our Vision
To be the top-performing financial services company in North America.
Our Governing Objective
To maximize the total return to BMO shareholders and generate, over time, first-quartile total shareholder return relative to our Canadian and North American peer groups.
Our Medium-Term Financial Objectives
To increase EPS by a minimum of 10% per year over time; to earn average annual ROE of between 18% and 19% over time; and to maintain a strong regulatory capital position, consistent with our peers.
| | | | | | | | | | | |
| | 2005 Financial | | | 2005 Financial | | | Target | | | 2006 Financial | |
| | Targets | | | Performance | | | Met | | | Targets | |
| | • 3% to 8% EPS growth from a base of $4.21 (excluding changes in the general allowance) | | | • EPS growth of 9.0%, on this basis, from $4.21 to $4.59 | | | ü | | | • 5% to 10% EPS growth from a base of $4.59* (excluding changes in the general allowance) | |
| | • ROE of 17% to 18% | | | • ROE of 18.8% | | | ü | | | • ROE of 17% to 19% | |
| | • Specific provision for credit losses of $400 million or less | | | • Specific provision for credit losses of $219 million | | | ü | | | • Specific provision for credit losses of $400 million or less | |
| | • Tier 1 Capital Ratio of at least 8.0% | | | • Tier 1 Capital Ratio of 10.25% | | | ü | | | • Tier 1 Capital Ratio of at least 8.0% | |
| | • Improve cash productivity ratio by 150 to 200 bps | | | • Cash productivity
ratio improved
by 120 bps | | | û | | | • Improve cash productivity ratio by 100 to 150 bps | |
| |
*As explained on page 66, we expect that in 2006 we will be required to retroactively adopt new accounting rules for determining EPS, lowering EPS for 2005 by approximately $0.06 per common share. On adoption, the $4.59 base will be adjusted accordingly.
ratio improved by 120 basis points in 2005, the rate of improvement was below our target because of weak results in Investment Banking Group’s interest-rate-sensitive businesses and our continuing to invest in our businesses to achieve future earnings growth.
Our targets for 2006 have been established in the context of our expectations for the economy in the year ahead, as detailed on page 31.
The “Our Financial Targets” section above and the following “Enterprise-Wide Strategy” and “Economic Developments” sections of this Annual Report contain certain forward-looking statements. By their nature, forward-looking statements require us to make assumptions and are subject to inherent risks and uncertainties. Please refer to the Caution Regarding Forward-Looking Statements on page 29 of this Annual Report for a discussion of such risks and uncertainties and the material factors and assumptions related to the statements set forth in such sections.
| | | |
| BMO Financial Group 188th Annual Report 2005 | | 27 |
Enterprise-Wide Strategy
[PHOTO]
Rose M. Patten
Senior Executive Vice-President,
Human Resources and
Office of Strategic Management
Vision
To be the top-performing financial services company in North America.
Enterprise Strategy
| • | | Increase profits in our broad-based Canadian franchise and accelerate our U.S. expansion through disciplined organic growth and acquisitions; build deep, lasting relationships with |
| | | our clients in all of our businesses by delivering exceptional service; consistently improve our productivity while providing a superior customer experience by focusing on what matters to them, by aggressively pursuing revenue growth opportunities and by streamlining our processes and eliminating bureaucracy. |
| • | | In Canada, improve service to our personal and commercial banking customers to strengthen our relationships, gain market share in the rapidly growing high net worth market and increase our share of our clients’ investment banking business. |
| • | | In the United States, become the leading personal and commercial bank in the Midwest. We will strive to accelerate banking growth, capture wealth management opportunities within the Chicagoland market and deepen our penetration of mid-market investment banking business sectors. |
We will leverage our foundational strengths in executing our
strategy by:
| • | | Building a high-performance organization by effectively developing our people and their capabilities. |
| • | | Developing, implementing and maintaining high-quality, low-cost business systems. |
| • | | Applying our credit management expertise to find creative solutions for clients. |
| • | | Maintaining excellence in governance and risk management. |
Progress in Relation to our 2005 Strategic Priorities
Achieve financial targets with a particular focus on productivity:
| § | | Annual financial targets for EPS growth, ROE, credit losses and Tier 1 capital were achieved. Cash productivity improved by 120 basis points but was below target because of weaker than expected performance in interest-rate-sensitive businesses in Investment Banking Group. |
Drive revenue growth:
| § | | Our Personal and Commercial Client Group and Private Client Group drove BMO’s revenue growth of 5.0% (7.2% excluding the impact of the weaker U.S. dollar). |
Grow net income in Canada:
| § | | Our Personal and Commercial Client Group and Private Client Group grew earnings in Canada by 23% and 29%, respectively. BMO’s overall earnings in Canada were relatively unchanged at $1,678 million, as growth was limited by higher provisions for credit losses in Corporate Support. |
Continue to improve U.S. performance:
| § | | U.S. revenues increased US$148 million or 7.4% and net income improved by US$62 million or 19%, as both loan and deposit growth contributed to higher volumes. |
Accelerate growth in the United States:
| § | | U.S. net income as a percentage of North American net income grew 1.4 percentage points to 21.9%. |
| § | | Acquired businesses contributed US$63 million to revenue growth, and organic revenue growth was US$85 million. |
| § | | We acquired Mercantile Bancorp, Inc., agreed to purchase Edville Bankcorp, Inc. and its subsidiary Villa Park Trust and Savings Bank and sold Harrisdirectllc, our online brokerage platform. |
Build a high-performance organization:
| § | | For the fourth year in a row, BMO was the only major Canadian bank to be included in the prestigious list of Canada’s “Top 100 Employers.” BMO was also the top-ranked Canadian firm in the “Training Top 100.” |
Maintain our world-class foundational strengths:
| § | | We continued to implement enterprise-wide service quality initiatives that will contribute significantly to superior customer experiences and after-sales service. |
| § | | The successful consolidation of 26 of our U.S. bank charters into one charter, Harris N.A., provides customers with more convenient access and improved service. |
Priorities for 2006
| • | | Achieve our financial targets, with a particular focus on revenue growth to improve productivity. |
| § | | Drive revenue growth by providing a superior client experience and earning a larger share of customers’ business. |
| § | | Continue to improve U.S. performance. |
| § | | Accelerate growth in the United States, both organically and through acquisitions. |
| § | | Grow net income in Canada through operational efficiency and improved market share, accelerating our growth in commercial banking and wealth management. |
| § | | Build a high-performance organization by developing our people, living our values and being an employer of choice. |
| § | | Maintain our world-class foundation of leading governance, sound risk management, productive systems and excellent after-sales service. |
| | | |
| 28 | | BMO Financial Group 188th Annual Report 2005 |
Caution Regarding Forward-Looking Statements
Bank of Montreal’s public communications often include written or oral forward-looking statements. Statements of this type are included in this Annual Report, and may be included in other filings with Canadian securities regulators or the U.S. Securities and Exchange Commission, or in other communications. All such statements are made pursuant to the “safe harbor” provisions of the United States Private Securities Litigation Reform Act of 1995 and of any applicable Canadian securities legislation. Forward-looking statements may include, but are not limited to, comments with respect to our objectives and priorities for 2006 and beyond, our strategies or future actions, our targets, expectations for our financial condition or share price, and the results of or outlook for our operations or for the Canadian and U.S. economies.
By their nature, forward-looking statements require us to make assumptions and are subject to inherent risks and uncertainties. There is significant risk that predictions, forecasts, conclusions or projections will not prove to be accurate, that our assumptions may not be correct and that actual results may differ materially from such predictions, forecasts, conclusions or projections. We caution readers of this Annual Report not to place undue reliance on our forward-looking statements as a number of factors could cause actual future results, conditions, actions or events to differ materially from the targets, expectations, estimates or intentions expressed in the forward-looking statements.
The future outcomes that relate to forward-looking statements may be influenced by many factors, including but not limited to: general economic conditions in the countries in which we operate; currency value fluctuations; changes in monetary policy; the degree of competition in the geographic and business areas in which we operate; changes in laws; judicial or regulatory proceedings; the accuracy and completeness of the information we obtain with respect to our customers and counterparties; our ability to execute our strategic plans and to complete and integrate acquisitions; critical accounting estimates; operational and infrastructure risks; general political conditions; global capital market activities; the possible effects on our business of war or terrorist activities; disease or illness that affects local, national or international economies; disruptions to public infrastructure, such as transportation, communications, power or water supply; and technological changes.
We caution that the foregoing list is not exhaustive of all possible factors. Other factors could adversely affect our results. For more information, please see the discussion below concerning the effect certain key factors could have on actual results. When relying on forward-looking statements to make decisions with respect to Bank of Montreal, investors and others should carefully consider these factors, as well as other uncertainties and potential events, and the inherent uncertainty of forward-looking statements. Bank of Montreal does not undertake to update any forward-looking statement, whether written or oral, that may be made from time to time by the organization or on its behalf.
Assumptions about the performance of the Canadian and U.S. economies in 2006 and how that will affect our businesses are material factors we consider when setting our strategic priorities and objectives, and in determining our financial targets, including provision for credit losses. Key assumptions include our assumption that the Canadian and U.S. economies will expand at a healthy pace in 2006 and that inflation will remain low. We also have assumed that interest rates will increase gradually in both countries in 2006 and that the Canadian dollar will hold onto its recent gains in value. In determining our expectations for economic growth, both broadly and in the financial services sector, we primarily consider historical economic data provided by the Canadian and U.S. governments and their agencies. Tax laws in the countries in which we operate, primarily Canada and the United States, are material factors we consider when determining our sustainable effective tax rate.
Factors That May Affect Future Results
As noted in the above Caution Regarding Forward-Looking Statements, all forward-looking statements and information, by their nature, are subject to inherent risks and uncertainties, general and specific, which may cause our actual results to differ materially from the expectations expressed in the forward-looking statements. Some of these risks and uncertainties are discussed in this section.
General Economic and Business Conditions in the Countries in which We Conduct Business
We conduct business in Canada, the United States and other countries. Factors such as interest rates, foreign exchange rates, consumer spending, business investment, government spending, the health of capital markets, the rate of inflation and the threat of terrorism affect the business and economic environments in which we operate. Therefore, the amount of business we conduct in a specific geographic region and the local economic and business conditions may have an effect on our revenues and earnings. For example, a regional economic decline may result in an increase in credit losses, a decrease in loan growth and reduced capital markets activity.
Currency Rates
The Canadian dollar equivalent of our revenues and expenses denominated in currencies other than the Canadian dollar is subject to fluctuations in the value of the Canadian dollar relative to such currencies. Such fluctuations may affect our overall business and financial results. Our most significant exposure is to fluctuation in the value of the Canadian dollar relative to the U.S. dollar due to the size of our operations in the United States. The recent increase in value of the Canadian dollar relative to the U.S. dollar has affected our results in the past two years. Further appreciation of the Canadian dollar relative to the U.S. dollar would reduce the translated value
of U.S.-dollar-denominated revenues, expenses and earnings relative to prior periods. Refer to the Foreign Exchange section on page 36 and the discussion of Market Risk on pages 70 to 72 for a more complete discussion of our foreign exchange risk exposures.
Monetary Policy
Bond and money market expectations about inflation and central bank monetary policy have an impact on the level of interest rates. Changes in market expectations and monetary policy are difficult to anticipate and predict. Fluctuations in interest rates that result from these changes can have an impact on our earnings. Refer to the discussion of Market Risk on pages 70 to 72 for a more complete discussion of our interest rate risk exposures.
Level of Competition
The level of competition among financial services companies is high. Furthermore, non-financial companies are increasingly offering services traditionally provided by banks. Customer loyalty and retention can be influenced by a number of factors, including service levels, prices for products or services, our reputation and the actions of our competitors. Loss of market share would adversely affect our earnings.
Changes in Laws and Regulations
Regulations are in place to protect our clients, investors and the public interest. Changes in laws and regulations, including how they are interpreted and enforced, could adversely affect our earnings by allowing more competition for our products and services and by increasing the costs of compliance. In addition, our failure to comply with laws and regulations could result in sanctions and financial penalties that could adversely affect our reputation and earnings.
| | | |
| BMO Financial Group 188th Annual Report 2005 | | 29 |
Judicial or Regulatory Judgments and Legal Proceedings
We take what we believe to be reasonable measures designed to ensure compliance with the laws and regulations of the jurisdictions in which we conduct business. However, there can be no assurance that we will always be in compliance or be deemed to be in compliance. As a result, it is possible that we could receive a judicial or regulatory judgment or decision which results in fines, damages or other costs that would have a negative impact on earnings and damage our reputation. We are also subject to litigation arising in the ordinary course of our business. The unfavourable resolution of any litigation could have a material adverse effect on our financial results. Damage to our reputation could also result, harming our future business prospects. Information about legal proceedings we currently face is provided in Note 27 on page 128 of the financial statements.
Accuracy and Completeness of Customer
and Counterparty Information
When deciding to extend credit or enter into other transactions with customers and counterparties, we may rely on information provided by or on behalf of those customers and counterparties, including audited financial statements and other financial information. We also may rely on representations made by customers and counterparties that the information they provide is accurate and complete. Our financial results could be adversely affected if the financial statements and other financial information provided by customers and counterparties are materially misleading.
Execution of Strategic Plans
Our financial performance is influenced by our ability to execute strategic plans developed by management. If these strategic plans do not meet with success or there is a change in strategic plans, our earnings could grow more slowly or decline.
Acquisitions
We perform thorough due diligence before completing an acquisition. However, it is possible that we might make an acquisition that does not achieve our financial or strategic objectives. High integration costs and failure to realize expected cost savings could adversely affect our earnings after an acquisition. Our post-acquisition performance is also contingent on retaining the clients and key employees of acquired companies, and there can be no assurance that we will always succeed in doing so.
Critical Accounting Estimates
We prepare our financial statements in accordance with Canadian generally accepted accounting principles (GAAP). The application of GAAP requires that management make significant judgments and estimates that can affect when certain assets, liabilities, revenues and expenses are recorded in our financial statements and their recorded values. In making these estimates and judgments, we rely on the best information available at the time. However, it is possible that circumstances may change or that new information may become available. Our financial results would be affected in the period in which the new circumstances or information became apparent, and the amount of the impact could be significant. More information is included in the discussion of Critical Accounting Estimates on page 63.
Operational and Infrastructure Risks
We are exposed to many types of operational risk that affect all large corporations. Such risks include the risk of fraud by employees or others, unauthorized transactions by employees, and operational or human error. We also face the risk that computer or telecommunications systems could fail, despite our efforts to maintain these systems in good working order. Given the high volume of transactions we process on a daily basis, certain errors may be repeated or compounded before they are discovered and successfully rectified. Shortcomings or failures of our internal processes, employees or systems, including any of our financial, accounting or other data processing systems, could lead to financial loss and damage our reputation. In addition, despite the contingency plans we have in place, our ability to conduct business may be adversely affected by a disruption in the infrastructure that supports our operations and the communities in which we do business.
Other Factors
Other factors beyond our control that may affect our future results are noted in the Caution Regarding Forward-Looking Statements on page 29. Additional factors, including credit and counterparty, market, liquidity and funding, operational, business reputation and other risks, are discussed in the Enterprise-Wide Risk Management section starting on page 67.
We caution that the preceding discussion of factors that may affect future results is not exhaustive. When relying on forward-looking statements to make decisions with respect to BMO, investors and others should carefully consider these factors, as well as other uncertainties, potential events and industry and company-specific factors that may adversely affect future results. We do not undertake to update any forward-looking statements, written or oral, that may be made from time to time by us or on our behalf.
| | | |
| 30 | | BMO Financial Group 188th Annual Report 2005 |
Economic Developments
Canadian and U.S. Economic and Financial Services
Developments in 2005
The Canadian economy continued to grow at a moderate pace in 2005, with support from low interest rates offset by the negative effects of a strong Canadian dollar. Consumer spending remained healthy, sustaining growth in personal loans. Housing markets continued to be buoyant, with record-high home sales, low interest rates and rising prices boosting residential construction and mortgage growth. Business investment again strengthened, promoting a pickup in business loans. Canada’s unemployment rate fell in 2005 as a result of solid job growth. Despite rising energy costs, the inflation rate stayed low; however, the Bank of Canada began raising overnight rates in September to prevent cost pressures from building. With rising commodity prices shoring up corporate profits in some sectors, Canadian equity markets rose sharply in 2005, providing some support to BMO’s brokerage businesses and underwriting activities.
The U.S. economy continued to grow at a healthy rate in 2005, though growth moderated from 2004 as severe hurricanes took a toll on the economies of several Gulf Coast states in the fall. Supported by low long-term interest rates and rising house prices, personal consumption remained strong despite much higher energy costs. Home sales again reached record highs in the summer, sustaining robust demand for residential mortgages, while business spending grew briskly throughout the year, spurring a pickup in business loans. Improved job growth pushed the unemployment rate to a four-year low in the summer. Meanwhile, as in 2004, the Federal Reserve raised short-term interest rates to remove excess monetary stimulus in the economy.
Economic and Financial Services Outlook for 2006
The Canadian economy is expected to grow more strongly in 2006 as the negative impact of the strong Canadian dollar dissipates. Personal spending should continue to benefit from low, albeit rising interest rates, while business investment should remain strong amid increased confidence in the economy’s expansion. The Bank of Canada is expected to continue its recent practice of gradually raising interest rates toward more normal levels. An expected moderation in commodity prices should prevent the Canadian dollar from rising further against the U.S. dollar. A more robust economic expansion in 2006 will support further growth in residential mortgages, personal loans and business lending, though higher interest rates will temper the gains. The improved economic climate should also underpin fee-based investment banking activities.
The U.S. economy is expected to again grow at a solid pace in 2006, fuelled in part by rebuilding activities along the Gulf Coast in the wake of severe hurricanes in 2005. Nationwide, business investment in productivity-enhancing capital equipment should stay strong, supporting further growth in business loans. Interest rates are forecast to rise modestly in 2006, reducing housing affordability and thereby lessening housing market activity and residential mortgage demand.
| | | |
| BMO Financial Group 188th Annual Report 2005 | | 31 |
Value Measures
Highlights
| § | | We surpassed four of our five performance targets in 2005, after meeting or surpassing all five in 2004 and 2003. |
| § | | Total Shareholder Return (TSR) – BMO investors have earned an average annual return of 13.8% over the past five years and earned 3.7% in 2005, after three consecutive years of double-digit returns. |
| § | | Earnings per share (EPS) growth – EPS increased 5% to a record $4.64 in 2005, but increased 9% excluding changes in the general allowance for credit losses. EPS increased 28% and 29% in the two prior years, for a three-year average annual compound growth rate of 20%. |
| § | | Net income increased 4.1% to $2,400 million. The $94 million increase in net income was attributable to the $155 million (6.8%) impact of business growth and the $122 million (5.3%) impact of a lower effective tax rate, |
| | | offset in part by the $183 million (–8.0%) after-tax impact of a $282 million increase in provisions for credit losses. |
| § | | Return on Equity (ROE) – BMO’s ROE was 18.8% in 2005, the second-highest in the past 20 years, and BMO is the only major bank in North America to earn an ROE of more than 13% for 16 consecutive years. |
| § | | Net Economic Profit (NEP) Growth – NEP was high in 2005, just below the record levels of 2004, despite higher capital, as each of the client operating groups contributed higher NEP. |
| § | | The quarterly dividend on our common shares was raised twice during the year, increasing by a total of 11% from a year ago to $0.49 per share, after increasing 26% in 2004. |
Total Shareholder Return
BMO’s governing objective is to maximize the total return to our shareholders and generate, over time, first-quartile total shareholder return (TSR) relative to our Canadian and North American peer groups.
The five-year average annual TSR is a key measure of shareholder value and is the most important of our financial performance and condition measures, since it assesses our success in achieving our governing objective of maximizing return to shareholders. Over the past five years, shareholders have earned an average annual TSR of 13.8% on their investment in BMO’s common shares. This compares favourably with an average annual return for the S&P/TSX Composite Total Return Index of 3.3% over the same period and was consistent with the return for the S&P/TSX Financial Services Total Return Index. Dividends paid over the period and appreciation in BMO’s share price are outlined in the table below. An investment of $1,000 in Bank of Montreal common shares made at the beginning of fiscal 2001 would have been worth $1,907 at October 31, 2005, assuming reinvestment of dividends, for a total return of 91%. Dividends paid over the five-year period have increased at an average annual compound rate of 13%. In 2005, the stated quarterly dividend on our common shares was raised twice, increasing by a total of 11% from the fourth quarter of 2004 to $0.49 per share. Dividends paid on each common share increased 20% in 2005 to $1.80.
The average annual TSR of 13.8% for this most recent five-year period declined from the 18.9% average annual return for the five years ended October 31, 2004. The averages are affected by the one-year TSRs included in the calculations. The deterioration reflected the removal of the 29% return earned in 2000 from the averaging calculation and its replacement with the 3.7% return earned this year.
Thefive-year average annual total shareholder return (TSR) represents the average annual total return earned on an investment in BMO common shares made at the beginning of a five-year period. The return includes the change in share price and assumes that dividends received were reinvested in additional common shares. The one-year TSR also assumes that dividends were reinvested in shares.
The 3.7% TSR earned in fiscal 2005 was lower than the returns on comparable market indices, after three consecutive years of strong returns. The S&P/TSX Composite Total Return Index was boosted by particularly strong returns in the energy sector.
Pages 24 and 26 provide further comment on total shareholder return and include peer group comparisons.
Total Shareholder Return
| | | | | | | | | | | | | | | | | | | | | | | | | |
| | | | | | | | | | | | | | | | | | Five-year | |
| For the year ended October 31 | | 2005 | | | 2004 | | | 2003 | | | 2002 | | | 2001 | | | CAGR | (1) |
| |
| Closing market price per common share ($) | 57.81 | | | | 57.55 | | | | 49.33 | | | | 38.10 | | | | 33.86 | | | | 10.4 | % |
| Dividends paid ($ per share) | | | 1.80 | | | | 1.50 | | | | 1.29 | | | | 1.18 | | | | 1.09 | | | | 12.7 | % |
| Dividends paid (%) | | | 3.1 | | | | 3.0 | | | | 3.4 | | | | 3.5 | | | | 3.1 | | | | | |
| Increase (decrease) in share price (%) | | | 0.5 | | | | 16.7 | | | | 29.5 | | | | 12.5 | | | | (3.9 | ) | | | | |
| Total annual shareholder return (%) | | | 3.7 | | | | 20.0 | | | | 33.4 | | | | 16.2 | | | | (1.2 | ) | | | | |
| |
| | |
| Total annual shareholder return assumes reinvestment of quarterly dividends and therefore does not equal the sum of dividend and share price returns in the table. |
| |
| (1) Compound annual growth rate (CAGR). |
| | | |
| 32 | | BMO Financial Group 188th Annual Report 2005 |
Earnings per Share Growth
The year-over-year percentage change in earnings per share (EPS) is our key measure for analyzing earnings growth. All references to EPS are to diluted EPS, unless indicated otherwise.
EPS was a record $4.64, up 5% from a then-record $4.42 in 2004. Cash EPS was $4.79, up 5% from $4.57 a year ago. Excluding a $40 million reduction in the general allowance for credit losses in 2005 and a $170 million reduction in 2004, EPS rose 9% from $4.21 to $4.59. The 9% growth rate exceeded our annual target of 3% to 8% from a base of $4.21. In 2006, we are targeting EPS growth of 5% to 10% from this base of $4.59, excluding any change in the general allowance. Our EPS growth target for 2006 is higher than our 2005 growth target because we anticipate improved operating performance and because, although we expect an increased level of specific provisions for credit losses, that increase is less pronounced than the increase we expected when we set our 2005 targets. Our targets for 2006 have also been established in the context of our expectations for the economy, as outlined in our economic outlook for 2006 on page 31.
Our five-year compound average annual EPS growth rate was 7%, below our medium-term financial objective of 10%, as EPS increased to $4.64 in 2005 from $3.25 in 2000. In 2000, certain asset sales produced a large gain on sale that inflated our EPS relative to our normal earning capacity. Our four-year compound average annual EPS growth rate was 15%.
Net income was $2,400 million, up 4.1% from $2,306 million a year ago. The $94 million increase in net income was attributable to the $155 million (6.8%) impact of business growth and the $122 million (5.3%) impact of a lower effective tax rate, offset in part by the $183 million (–8.0%) after-tax impact of a $282 million increase in provisions for credit losses.
All of our client operating groups earned record net income and two of the three significantly improved their productivity in 2005. Personal and Commercial Client Group (P&C) net income rose $217 million or 22% from a year ago; excluding significant items that increased earnings, which are discussed in the operating group review on page 49, P&C’s net income for 2005 rose $167 million or 16%. The improvement was driven by strong volume growth and effective cost management, partially offset by lower net interest margin in the United States.
Private Client Group (PCG) net income was up $93 million or 41%. PCG’s results also benefited from certain items, including gains on the sales of Harrisdirectand an investment in TSX common shares, which are explained in the operating group review on page 52. Adjusted for the impact of those items, net income increased $59 million or 26% from the then-record results in 2004. Investment Banking Group (IBG) net income rose $20 million or 3%. IBG’s results also benefited from significant items, which are explained in the operating group review on page 55. Excluding those items in both years, IBG’s net income declined $40 million due to lower earnings in interest-rate-sensitive businesses. Earnings in Corporate Support fell $236 million, primarily due to higher provisions for credit losses, largely recorded in Corporate Support under BMO’s expected loss provisioning methodology, which is explained in the operating group review on page 57.
Earnings per share (EPS)is calculated by dividing net income, after deduction of preferred dividends, by the average number of common shares outstanding. Diluted EPS, which is our basis for measuring performance, adjusts for possible conversions of financial instruments into common shares if those conversions would lower EPS, and is more fully explained in Note 24 on page 125 of the financial statements.
Revenue on a taxable equivalent basis, which is explained on pages 35 and 37, increased $470 million or 5% to $9,958 million. Revenue grew in two of the three client operating groups, as P&C revenues increased 7%, PCG revenues increased 10% and IBG revenues declined modestly. In P&C Canada, there was strong volume growth across most products, including revenue from the sale of term investment products, mutual funds and securitization activities. In the United States, higher revenues were due to robust consumer and small business loan growth and acquisitions, partially offset by the impact of lower net interest margin. In PCG, successful revenue-generating initiatives and favourable market conditions drove higher non-interest revenue in the full-service investing and mutual fund businesses, while improved margins drove improved revenues in term investment products. The sales of Harrisdirectand TSX shares contributed $74 million to revenue growth.
IBG revenues declined as increased non-interest revenue, particularly in trading revenues and revenue recognized on restructuring variable interest entities (VIEs), was offset by reduced net interest income in a challenging interest rate environment. Revenue was reduced $213 million by the weaker U.S. dollar. Total revenue growth is discussed further on page 37.
There was a provision for credit losses of $179 million, consisting of $219 million of specific provisions and a $40 million reduction in the general allowance for credit losses. A year ago, there was a net recovery of credit losses of $103 million, consisting of $67 million of specific provisions and a $170 million reduction in the general allowance. The provision for credit losses is discussed further on page 40.
Non-interest expense increased $170 million or 3% to $6,327 million. Expenses were affected by higher performance-based compensation costs, in line with improved results in particular businesses, and the impact of acquired businesses, partially offset by the effects of the weaker U.S. dollar. Non-interest expense is discussed further on page 41.
| | | |
| BMO Financial Group 188th Annual Report 2005 | | 33 |
Return on Equity
Return on equity (ROE) is another key value measure. We achieved an ROE of 18.8% in 2005, down from 19.4% in 2004. The decline was attributable to a $0.9 billion increase in average common shareholders’ equity, as net income available to common shareholders rose by $95 million. BMO has now generated an ROE of more than 13% in each of the past 16 years, and is the only major North American bank to meet this test of earnings consistency. The 18.8% return was above our annual target of 17% to 18% because of higher net income earned in the year, but was consistent with our medium-term financial objective of achieving an average annual 18% to 19% ROE, over time.
Table 3 on page 80 includes ROE statistics for the past 10 years. Pages 24 and 26 provide further comment on ROE and include peer group comparisons.
Net Economic Profit Growth
The last of our four key value measures is net economic profit (NEP) growth. NEP of $1,120 million was relatively unchanged from 2004. Higher cash net income was offset by a higher charge for capital in 2005 than in the previous year, as our average capital rose strongly in 2005. The consistently high NEP earned in 2005 follows record NEP earned in 2004, resulting in growth of –0.3% in 2005. This follows growth of 92% and 60% in 2003 and 2004, respectively. Each of the three client operating groups earned significantly higher NEP than in the previous year, but this growth was offset by the impact of higher provisions for credit losses charged to Corporate Support in 2005. Pages 24 and 26 provide further comment on NEP growth and include peer group comparisons.
Net Economic Profit($ millions, except as noted)
| | | | | | | | | | | | | | | | | | | | | |
| For the year ended October 31 | | 2005 | | | 2004 | | | 2003 | | | 2002 | | | 2001 | |
| |
| Net income available to common shareholders | | | 2,370 | | | | 2,275 | | | | 1,743 | | | | 1,338 | | | | 1,391 | |
| After-tax impact of the amortization of goodwill and other valuation intangibles | | | 74 | | | | 78 | | | | 79 | | | | 75 | | | | 101 | |
| |
| Cash net income available to common shareholders | | | 2,444 | | | | 2,353 | | | | 1,822 | | | | 1,413 | | | | 1,492 | |
Charge for capital* | | | (1,324 | ) | | | (1,230 | ) | | | (1,119 | ) | | | (1,045 | ) | | | (1,059 | ) |
| |
Net economic profit | | | 1,120 | | | | 1,123 | | | | 703 | | | | 368 | | | | 433 | |
| |
| | | | | | | | | | | | | | | | | | | | | |
| Net economic profit growth (%) | | | (0.3 | ) | | | 60 | | | | 92 | | | | (15 | ) | | | (43 | ) |
| | | | | | | | | | | | | | | | | | | | | |
*Charge for capital | | | | | | | | | | | | | | | | | | | | |
| Average common shareholders’ equity | | | 12,609 | | | | 11,720 | | | | 10,646 | | | | 9,973 | | | | 10,100 | |
| Cost of capital (%) | | | 10.5 | | | | 10.5 | | | | 10.5 | | | | 10.5 | | | | 10.5 | |
| |
| Charge for capital | | | (1,324 | ) | | | (1,230 | ) | | | (1,119 | ) | | | (1,045 | ) | | | (1,059 | ) |
| |
| | | |
| 34 | | BMO Financial Group 188th Annual Report 2005 |
2005 Financial Performance Review
This section provides a review of our enterprise financial performance for 2005 that focuses on the Consolidated Statement of Income included in our consolidated financial statements, which begin on page 92. A summary of the enterprise financial performance for 2004 is outlined on page 78. A review of our operating groups’ strategies and performance follows the enterprise review.
Highlights
| § | | Revenue increased $470 million or 5% in 2005. |
| |
| § | | Revenue growth was attributable to improved product volumes in Personal and Commercial Client Group and the benefits of revenue-generating initiatives and improved market fundamentals in Private Client Group. Higher trading revenues and advisory fees in Investment Banking Group were offset by reduced revenue from interest-rate-sensitive businesses. |
| |
| § | | The provision for credit losses was $282 million higher than a year ago but, at $179 million, was the second-lowest since 1998 (2004 was the lowest). Specific provisions for credit losses increased $152 million, due to lower recoveries and reversals, and the reduction in the general allowance was $130 million lower. |
| § | | Non-interest expense increased 3% in 2005, growing at a lower rate than revenues. The increase was driven by acquired businesses and higher performance-based compensation, consistent with Private Client Group’s improved performance and Investment Banking Group’s improved results in fee-based businesses. |
| |
| § | | The expense-to-revenue ratio (or productivity ratio) improved by 140 basis points to 63.5%. The cash productivity ratio improved by 120 basis points to 62.6%, following total improvement of 420 basis points in the two prior years. |
Non-GAAP Measures
BMO uses both GAAP and non-GAAP measures to assess performance. Securities regulators require that companies caution readers that earnings and other measures adjusted to a basis other than generally accepted accounting principles (GAAP) do not have standardized meanings under GAAP and are unlikely to be comparable to similar measures used by other companies.
Cash earnings and productivity measures may enhance comparisons between periods when there has been an acquisition, particularly because the purchase decision may not consider the amortization of intangible assets to be a relevant expense. Cash EPS measures are also useful because analysts often focus on this measure, and cash EPS is used by Thomson First Call to track third-party earnings estimates that are frequently reported in the media. Cash measures add the after-tax amortization of intangible assets to GAAP earnings to derive cash net income (and associated EPS) and deduct the amortization of intangible assets from non-interest expense to derive cash productivity measures.
BMO, like many banks, analyzes revenue, and ratios computed using revenue, on a taxable equivalent basis (teb). This basis includes an adjustment that increases GAAP revenues and the GAAP provision for income taxes by an amount that would raise revenues on certain tax-exempt securities to a level equivalent to amounts that would incur tax at the statutory rate. The effective income tax rate is also analyzed on a taxable equivalent basis for consistency in approach.
Net economic profit is another non-GAAP measure. It represents cash earnings available to common shareholders less a charge for capital, and is considered an effective measure of added economic value.
GAAP and Related Non-GAAP Measures Used in the MD&A
($ millions, except as noted)
| | | | | | | | | | | | | |
| | | 2005 | | | 2004 | | | 2003 | |
| |
| Net interest income per financial statements (a) | | | 4,787 | | | | 4,798 | | | | 4,777 | |
| Non-interest revenue | | | 5,052 | | | | 4,551 | | | | 4,220 | |
| |
| Revenue per financial statements (b) | | | 9,839 | | | | 9,349 | | | | 8,997 | |
| |
| Taxable equivalent basis (teb) adjustment (c) (see page 37) | | | 119 | | | | 139 | | | | 152 | |
| |
| Net interest income (teb) (a+c) (d) (1) | | | 4,906 | | | | 4,937 | | | | 4,929 | |
| Non-interest revenue | | | 5,052 | | | | 4,551 | | | | 4,220 | |
| |
| Revenue (teb) (e) (1) | | | 9,958 | | | | 9,488 | | | | 9,149 | |
| |
| | | | | | | | | | | | | |
| Provision for income taxes per financial statements | | | 875 | | | | 972 | | | | 652 | |
| Taxable equivalent basis (teb) adjustment | | | 119 | | | | 139 | | | | 152 | |
| |
| Provision for income taxes (teb) (1) | | | 994 | | | | 1,111 | | | | 804 | |
| |
| | | | | | | | | | | | | |
| Non-interest expense (f) | | | 6,327 | | | | 6,157 | | | | 6,087 | |
| Amortization of intangible assets | | | (94 | ) | | | (104 | ) | | | (105 | ) |
| |
| Cash-based expense (g) (1) | | | 6,233 | | | | 6,053 | | | | 5,982 | |
| |
| Net income | | | 2,400 | | | | 2,306 | | | | 1,781 | |
| Amortization of intangible assets (net of income tax) | | | 74 | | | | 78 | | | | 79 | |
| |
| Cash net income (1) | | | 2,474 | | | | 2,384 | | | | 1,860 | |
| Preferred share dividends | | | (30 | ) | | | (31 | ) | | | (38 | ) |
| Charge for capital (1) | | | (1,324 | ) | | | (1,230 | ) | | | (1,119 | ) |
| |
| Net economic profit (1) | | | 1,120 | | | | 1,123 | | | | 703 | |
| |
| | | | | | | | | | | | | |
| Non-interest expense-to-revenue ratio (2) (%) ((f/b) x 100) | | | 64.3 | | | | 65.9 | | | | 67.7 | |
| Non-interest expense-to-revenue (teb) ratio (1) (2) (%) ((f/e) x 100) | | | 63.5 | | | | 64.9 | | | | 66.5 | |
| Cash non-interest expense-to-revenue (teb) ratio (1) (2) (%) ((g/e) x 100) | | | 62.6 | | | | 63.8 | | | | 65.4 | |
| Net interest margin annualized (%) ((a/average assets) x 100) | | | 1.58 | | | | 1.78 | | | | 1.81 | |
| Net interest margin (teb) annualized (1) (%) ((d/average assets) x 100) | | | 1.62 | | | | 1.83 | | | | 1.87 | |
| EPS (uses net income) ($) | | | 4.64 | | | | 4.42 | | | | 3.44 | |
| Cash EPS (1) (uses cash net income) ($) | | | 4.79 | | | | 4.57 | | | | 3.59 | |
| |
| | |
| (1) | | These are non-GAAP amounts or non-GAAP measures. |
| |
| (2) | | Also referred to as productivity ratio and cash productivity ratio. |
| | | |
| BMO Financial Group 188th Annual Report 2005 | | 35 |
Foreign Exchange
The Canadian dollar equivalents of BMO’s U.S.-dollar-denominated net income, revenues, expenses, income taxes and provision for credit losses in 2005 and 2004 were lowered relative to the preceding year by the weakening of the U.S. dollar. The adjacent table indicates average Canadian/U.S. dollar exchange rates in 2005, 2004 and 2003 and the impact of lower rates.
At the start of each quarter, BMO enters into hedging transactions that are designed to partially offset the pre-tax effects of exchange rate fluctuations in the quarter on our expected U.S.-dollar-denominated net income for that quarter. As such, these activities partially mitigate the impact of exchange rate fluctuations within a single quarter, but the sum of the hedging gains/losses for the four quarters in a year is not directly comparable to the impact of year-over-year exchange rate fluctuations on earnings for the year.
Each one-cent decrease (increase) in the Canadian/U.S. dollar exchange rate, expressed in terms of how many Canadian dollars one U.S. dollar buys, decreases (increases) BMO’s quarterly earnings by approximately $1.5 million before income taxes, in the absence of hedging activity.
The gain or loss from hedging transactions in future periods will be determined by both future exchange rate fluctuations
Effects of the Weaker U.S. Dollar on BMO’s Results
($ millions, except as noted)
| | | | | | | | | |
| | | 2005 | | | 2004 | |
| | | vs. | | | vs. | |
| | | 2004 | | | 2003 | |
| |
| Canadian/U.S. dollar exchange rate (average) | | | | | | | | |
| 2005 | | | 1.214 | | | | | |
| 2004 | | | 1.313 | | | | 1.313 | |
| 2003 | | | | | | | 1.435 | |
| | | | | | | | | |
| Reduced revenues | | | (213 | ) | | | (243 | ) |
| Reduced expenses | | | 145 | | | | 177 | |
| Reduced provision for credit losses | | | 1 | | | | 11 | |
| Reduced income taxes | | | 19 | | | | 15 | |
| |
| Reduced net income before hedging gains | | | (48 | ) | | | (40 | ) |
| Hedging gains | | | 10 | | | | 8 | |
| Income taxes thereon | | | (4 | ) | | | (3 | ) |
| |
| Reduced net income | | | (42 | ) | | | (35 | ) |
| |
and the amount of the underlying future hedging transactions, since the transactions are entered into each quarter in relation to expected U.S.-dollar-denominated net income for the next three months. The effect of exchange rate fluctuations on our net investment in foreign operations is discussed in the Provision for Income Taxes section on page 42.
Acquired Businesses
BMO Financial Group has selectively acquired a number of businesses in advancing our North American growth strategy. These acquisitions have incremental effects on revenue and expenses that affect the year-over-year comparison of operating results. The adjacent table outlines acquisitions by operating group that had an incremental effect on BMO’s revenue, expenses and net income for 2005 relative to 2004, and for 2004 relative to 2003, to assist in analyzing changes in results.
For the acquisition completed in fiscal 2005, the incremental effects are the revenues and expenses of that business that are included in results in fiscal 2005. For acquisitions completed in fiscal 2004, the incremental effects on results in 2005 are the revenues and expenses of those businesses from the beginning of fiscal 2005 until the one-year anniversary of their respective dates of acquisition.
For 2004 acquisitions, the incremental effects on results for 2004 relative to 2003 are the revenues and expenses of those businesses that are included in results in fiscal 2004, and for acquisitions completed in fiscal 2003, the incremental effects on results in 2004 are the revenues and expenses of those businesses from the beginning of fiscal 2004 until the one-year anniversary of their respective dates of acquisition.
Impact of Business Acquisitions on
Year-over-Year Comparisons($ millions)
| | | | | | | | | | | | | | | | | | | | | |
| | | | | | | Increase (decrease) in: | |
| | | | | | | | | | | | | | | Net | | | Cash net | |
| Business acquired | | | | | | Revenue | | | Expense | | | income | | | income | |
| |
| Personal and Commercial Client Group | | | | | | | | | | | | | | | | |
| Mercantile Bancorp, Inc. | | | | | | | | | | | | | | | | |
| Acquired December 2004 for $194 million | | | | | | | | | | | | | | | | |
| New Lenox State Bank | | | | | | | | | | | | | | | | |
| Acquired June 2004 for $314 million | | | | | | | | | | | | | | | | |
| Lakeland Community Bank | | | | | | | | | | | | | | | | |
| Acquired March 2004 for $49 million | | | | | | | | | | | | | | | | |
| Total purchases of $557 million | | | | | | | | | | | | | | | | |
| Incremental effects on results for: | | | 2005 | | | | 75 | | | | 51 | | | | 13 | | | | 17 | |
| | | | 2004 | | | | 20 | | | | 15 | | | | 3 | | | | 4 | |
| |
Private Client Group | | | | | | | | | | | | | | | | |
| Sullivan, Bruyette, Speros & Blayney Inc. | | | | | | | | | | | | | | | | |
| Acquired January 2003 for $20 million | | | | | | | | | | | | | | | | |
| Incremental effects on results for: | | | 2005 | | | | – | | | | – | | | | – | | | | – | |
| | | | 2004 | | | | 2 | | | | 4 | | | | (2 | ) | | | (2 | ) |
| |
| Investment Banking Group | | | | | | | | | | | | | | | | |
| Gerard Klauer Mattison* | | | | | | | | | | | | | | | | |
| Acquired July 2003 for $40 million | | | | | | | | | | | | | | | | |
| Incremental effects on results for: | | | 2005 | | | | – | | | | – | | | | – | | | | – | |
| | | | 2004 | | | | 69 | | | | 87 | | | | (11 | ) | | | (10 | ) |
| |
BMO Financial Group | | | | | | | | | | | | | | | | |
| Purchases of $617 million | | | | | | | | | | | | | | | | |
| Incremental effects on results for: | | | 2005 | | | | 75 | | | | 51 | | | | 13 | | | | 17 | |
| | | | 2004 | | | | 91 | | | | 106 | | | | (10 | ) | | | (8 | ) |
| |
*Renamed Harris Nesbitt Gerard
| | | |
| 36 | | BMO Financial Group 188th Annual Report 2005 |
Revenue
Revenue on a taxable equivalent basis (see page 35) rose $470 million or 5.0% in 2005 to $9,958 million, driven by growth in Personal and Commercial Client Group and Private Client Group. The weaker U.S. dollar lowered revenue growth in each of the operating groups and reduced BMO’s overall revenue growth by $213 million or 2.2 percentage points, while the incremental effects of acquired businesses added $75 million or 0.8 percentage points to revenue growth. The $470 million increase was entirely due to increased non-interest revenue, as higher net interest income in Personal and Commercial Client Group and Private Client Group was offset by a decline in Investment Banking Group.
BMO, like many banks, analyzes revenue on a taxable equivalent basis (teb). The teb adjustments for fiscal 2005 totalled $119 million, down from $139 million a year ago.
There was strong revenue growth in Personal and Commercial Client Group, driven by higher product volumes, insurance income and card fees. Private Client Group revenue also increased, as successful revenue-generating initiatives and improved market fundamentals drove higher full-service investing, mutual fund and term investment product revenues, which more than offset lower direct investing revenues. Investment Banking Group revenue declined as increased trading revenues and advisory fees were more than offset by reduced revenue from interest-rate-sensitive businesses. Those businesses were adversely affected by rising short-term interest rates and the resulting flatter yield curve and by competitive market conditions. Corporate Support revenue also declined, due primarily to lower net investment securities gains.
Net Interest Income
Net interest income for the year was $4,906 million, a reduction of $31 million from 2004. The incremental effects of acquired businesses increased net interest income by $58 million, while the impact of the weaker U.S. dollar reduced net interest income by $87 million. A significant decline in Investment Banking Group’s net interest income offset strong growth in the other operating groups. There was strong volume growth as average assets increased by $33 billion. Overall net interest margin was lower, as only Private Client Group benefited from improved margins.
On November 1, 2004, we commenced the consolidation of certain of our customer securitization vehicles, pursuant to the adoption of the Canadian Institute of Chartered Accountants’
Taxable equivalent basis (teb)
Revenues reflected in our MD&A are presented on a taxable equivalent basis (teb). The teb adjustment increases GAAP revenues and the provision for income taxes by an amount that would increase revenues on certain tax-exempt securities to a level that would incur tax at the statutory rate, to facilitate comparisons. The effect is disclosed on page 35 and in Table 10 on page 82.
Net interest incomeis comprised of earnings on assets, such as loans and securities, including interest and dividend income and BMO’s share of income from investments accounted for using the equity method of accounting, less interest expense paid on liabilities, such as deposits.
Net interest marginis the ratio of net interest income to average assets, expressed as a percentage or in basis points.
Revenue($ millions)
| | | | | | | | | | | | | | | | | | | | | |
| For the year ended October 31 | | 2005 | | | 2004 | | | 2003 | | | 2002 | | | 2001 | |
| |
| Net interest income (teb) | | | 4,906 | | | | 4,937 | | | | 4,929 | | | | 4,812 | | | | 4,527 | |
| Year-over-year growth (%) | | | (0.6 | ) | | | 0.2 | | | | 2.4 | | | | 6.3 | | | | 6.6 | |
| Non-interest revenue | | | 5,052 | | | | 4,551 | | | | 4,220 | | | | 3,924 | | | | 4,222 | |
| Year-over-year growth (%) | | | 11.0 | | | | 7.8 | | | | 7.6 | | | | (7.1 | ) | | | (2.4 | ) |
| |
| Total revenue (teb) | | | 9,958 | | | | 9,488 | | | | 9,149 | | | | 8,736 | | | | 8,749 | |
| Year-over-year growth (%) | | | 5.0 | | | | 3.7 | | | | 4.7 | | | | (0.1 | ) | | | 2.1 | |
| |
Change in Net Interest Income, Average Assets and Net Interest Margin
| | | | | | | | | | | | | | | | | | | | | | | | | | | | | | | | | | | | | | | | | | | | | |
| | | Net interest income (teb) | | | Average assets | | | Net interest margin | |
| | | ($ millions) | | | Change | | | ($ millions) | | | Change | | | (in basis points) | |
| For the year ended October 31 | | 2005 | | | 2004 | | | $ | | | % | | | 2005 | | | 2004 | | | $ | | | % | | | 2005 | | | 2004 | | | Change | |
| |
| P&C Canada | | | 2,829 | | | | 2,674 | | | | 155 | | | | 6 | | | | 105,963 | | | | 99,231 | | | | 6,732 | | | | 7 | | | | 267 | | | | 269 | | | | (2 | ) |
| P&C Chicagoland Banking | | | 732 | | | | 678 | | | | 54 | | | | 8 | | | | 21,055 | | | | 17,895 | | | | 3,160 | | | | 18 | | | | 348 | | | | 379 | | | | (31 | ) |
| |
| Personal and Commercial Client Group (P&C) | | | 3,561 | | | | 3,352 | | | | 209 | | | | 6 | | | | 127,018 | | | | 117,126 | | | | 9,892 | | | | 8 | | | | 280 | | | | 286 | | | | (6 | ) |
| Private Client Group (PCG) | | | 577 | | | | 533 | | | | 44 | | | | 9 | | | | 7,061 | | | | 7,145 | | | | (84 | ) | | | (1 | ) | | | 819 | | | | 746 | | | | 73 | |
| Investment Banking Group (IBG) | | | 965 | | | | 1,260 | | | | (295 | ) | | | (23 | ) | | | 163,848 | | | | 141,691 | | | | 22,157 | | | | 16 | | | | 59 | | | | 89 | | | | (30 | ) |
| Corporate Support, including Technology and Solutions | | | (197 | ) | | | (208 | ) | | | 11 | | | | 5 | | | | 5,233 | | | | 3,830 | | | | 1,403 | | | | 37 | | | | nm | | | | nm | | | | nm | |
| |
| Total | | | 4,906 | | | | 4,937 | | | | (31 | ) | | | (1 | ) | | | 303,160 | | | | 269,792 | | | | 33,368 | | | | 12 | | | | 162 | | | | 183 | | | | (21 | ) |
| |
nm – not meaningful
| | | |
| BMO Financial Group 188th Annual Report 2005 | | 37 |
(CICA’s) new accounting requirement on the consolidation of VIEs. This lowered net interest margin in the first and second quarters of 2005 relative to comparable periods as it resulted in the inclusion of approximately $21 billion of average assets in BMO’s balance sheet. On April 29, 2005, we completed the restructuring of these VIEs; consequently, the VIE assets were no longer included in BMO’s balance sheet as of that date. BMO’s net interest margin in the first and second quarters was approximately 12 basis points lower and for fiscal 2005 was approximately 6 basis points lower than it would have been if we had not been required to consolidate VIE assets in those periods. Investment Banking Group’s net interest margin was approximately 9 basis points lower than it would have been in the first and second quarters and approximately 4.5 basis points lower for the year.
There was strong volume growth in Personal and Commercial Client Group in both Canada and the United States. In Canada, there was volume growth in all major products, with a modest decline in net interest margin. A continuation of the shift in customer preferences toward lower-spread products, such as residential mortgages and lines of credit, and the competitive marketplace pressured margins. In the United States, there was robust consumer and small business loan growth, with a more pronounced reduction in net interest margin, due to competitive pressures on loan pricing and the impact of lower investment rates earned on longer-term liabilities. Private Client Group assets declined modestly, but net interest income was up strongly because of improved margins in term investment products. The group’s net interest margin is significantly higher than other groups, as the net interest margin calculation represents net interest income as a percentage of total assets. The group’s primary source of net interest income is term investment products, which are liabilities. Investment Banking Group’s average assets increased $22 billion, of which half related to the VIE assets recorded in BMO’s balance sheet in the first six months of the year. The remaining increase was largely due to higher levels of low-margin assets, driven by client demand in the capital markets businesses. The group’s net interest margin declined sharply due to the funding of trading positions, lower spreads on corporate loans in the competitive rate environment in the United States and lower spreads in interest-rate-sensitive businesses in the rising interest rate environment.
Non-Interest Revenue
Non-interest revenue, which comprises all revenues other than net interest income, increased $501 million or 11% from 2004. The incremental effects of acquired businesses increased non-interest revenue by $17 million, while the impact of the weaker U.S. dollar reduced 2005 non-interest revenue by $126 million.
Securities commissions and fees were up 4%. These fees consist largely of full-service and self-directed retail brokerage commissions within Private Client Group, which account for about three-quarters of the balance, and institutional equity trading commissions within Investment Banking Group. Fees increased in both operating groups, a result of higher equity market valuations and higher client trading volumes.
Non-Interest Revenue($ millions)
| | | | | | | | | | | | | | | | | | | | | |
| | | | | | | | | | | | | | | Change from 2004 | |
| For the year ended October 31 | | 2005 | | | 2004 | | | 2003 | | | $ | | | % | |
| |
| Securities commissions and fees | | | 1,092 | | | | 1,055 | | | | 894 | | | | 37 | | | | 4 | |
| Deposit and payment service charges | | | 734 | | | | 746 | | | | 756 | | | | (12 | ) | | | (2 | ) |
| Trading revenues | | | 413 | | | | 200 | | | | 275 | | | | 213 | | | | +100 | |
| Lending fees | | | 313 | | | | 317 | | | | 293 | | | | (4 | ) | | | (1 | ) |
| Card fees | | | 334 | | | | 261 | | | | 290 | | | | 73 | | | | 28 | |
| Investment management and custodial fees | | | 305 | | | | 307 | | | | 303 | | | | (2 | ) | | | (1 | ) |
| Mutual fund revenues | | | 437 | | | | 378 | | | | 321 | | | | 59 | | | | 16 | |
| Securitization revenues | | | 113 | | | | 177 | | | | 244 | | | | (64 | ) | | | (36 | ) |
| Underwriting and advisory fees | | | 357 | | | | 343 | | | | 268 | | | | 14 | | | | 4 | |
| Investment securities gains (losses) | | | 165 | | | | 175 | | | | (41 | ) | | | (10 | ) | | | (6 | ) |
| Foreign exchange, other than trading | | | 180 | | | | 177 | | | | 160 | | | | 3 | | | | 2 | |
| Insurance income | | | 162 | | | | 139 | | | | 124 | | | | 23 | | | | 17 | |
| Other | | | 447 | | | | 276 | | | | 333 | | | | 171 | | | | 62 | |
| |
| Total | | | 5,052 | | | | 4,551 | | | | 4,220 | | | | 501 | | | | 11 | |
| |
| | | |
| 38 | | BMO Financial Group 188th Annual Report 2005 |
Deposit and payment service charges, which represent income earned on retail, commercial and corporate deposit accounts, declined $12 million due to lower income from Investment Banking Group’s cash management services.
Lending fees fell $4 million, as $11 million of lending fees earned by Investment Banking Group were recorded as other revenue during the period we consolidated the VIEs.
Card fees rose $73 million or 28%. Further refinements made to the methodology used to determine the liability associated with our customer loyalty rewards program resulted in a $40 million reduction in credit card fees in 2005. In 2004, we recorded $65 million of adjustments to credit card fees to increase the recorded liability because of rising reward redemption rates. Otherwise, the increase in card fees was driven in part by the continued success of our Mosaik®MasterCard®5and by the maturity of a portion of our credit card loans securitization.
Investment management and custodial fees were relatively unchanged, as they were again affected by the weaker U.S. dollar.
Mutual fund revenues increased $59 million or 16%, after having increased 18% in 2004, again reflecting volume growth and improved equity market valuations.
Securitization revenues decreased $64 million or 36%, primarily due to lower gains on sales and the maturity of the credit card loans securitizations. Securitization revenues are detailed in Note 7 on page 103 of the financial statements.
Underwriting and advisory fees increased $14 million. Merger and acquisition fees were sharply higher in a strong market, while equity and debt underwriting fees were both down slightly relative to strong activity in 2004.
Investment securities gains were $165 million, compared with net gains of $175 million in 2004. In 2005, net investment securities gains were increased $50 million by gains recognized on a change in accounting for merchant banking investments and $50 million by a gain on sale of TSX common shares. There were $11 million of write-downs in 2005, compared with $63 million in 2004. Investment securities gains in 2004 were offset in part by a $58 million reduction in net interest income related to losses on unwinding hedges associated with investment securities that were sold. Unrealized gains on investment securities declined $89 million to –$3 million, partially due to realized gains in 2005.
Foreign exchange, other than trading, was relatively unchanged.
Insurance income increased 17%, continuing its strong growth from a year ago.
Other revenue increased $171 million due primarily to $44 million of revenue recognized on restructuring VIEs, a $29 million gain on sale of the First Canadian Centre®Calgary tower and the $49 million gain on sale of Harrisdirect.
Table 10 on page 82 provides further detail on revenue and revenue growth.
Trading-related revenuesinclude net interest income and non-interest revenue earned from on and off-balance sheet positions undertaken for trading purposes. The management of these positions typically includes marking them to market on a daily basis. Trading revenues include income (expense) and gains (losses) from both on-balance sheet instruments and off-balance sheet interest rate, foreign exchange (including spot positions), equity, commodity and credit contracts.
Interest and Non-Interest Trading-Related Revenues($ millions)
| | | | | | | | | | | | | | | | | | | | | |
| | | | | | | | | | | | | | | Change from 2004 | |
| For the year ended October 31 | | 2005 | | | 2004 | | | 2003 | | | $ | | | % | |
| |
| Interest rates | | | 247 | | | | 204 | | | | 241 | | | | 43 | | | | 21 | |
| Foreign exchange | | | 89 | | | | 85 | | | | 69 | | | | 4 | | | | 5 | |
| Equities | | | 145 | | | | 152 | | | | 86 | | | | (7 | ) | | | (5 | ) |
| Other | | | 107 | | | | 31 | | | | 112 | | | | 76 | | | | +100 | |
| |
| Total | | | 588 | | | | 472 | | | | 508 | | | | 116 | | | | 25 | |
| |
| | | | | | | | | | | | | | | | | | | | | |
| Reported as: | | | | | | | | | | | | | | | | | | | | |
| Net interest income | | | 175 | | | | 272 | | | | 233 | | | | (97 | ) | | | (36 | ) |
| Non-interest revenue – trading revenues | | | 413 | | | | 200 | | | | 275 | | | | 213 | | | | +100 | |
| |
| Total | | | 588 | | | | 472 | | | | 508 | | | | 116 | | | | 25 | |
| |
Trading-Related Revenues
Trading-related revenues are primarily dependent on the volume of activities undertaken for clients, who enter into transactions with BMO to mitigate their risks or to invest. BMO earns a spread or profit on the net sum of its client positions by profitably neutralizing, within prescribed limits, the overall risk of the net positions. BMO also assumes proprietary positions with the goal of earning trading profits. While proprietary positions expose the organization to profit or loss, the positions and their risks are closely managed and profit or loss from these activities is generally not the most significant factor affecting the level of trading-related revenues.
Trading-related revenues were very strong in 2005, particularly in the fourth quarter. Trading-related revenues include both net interest income and non-interest revenue. Net interest trading-related revenues were slightly negative in the fourth quarter of 2005 as the associated funding costs of the assets exceeded interest earned on them. Many of our trading assets are non-interest bearing and, net of associated funding costs, most trading revenue in 2005 consisted of mark-to-market gains, which are included in non-interest trading revenues.
Revenues from trading-related activities totalled $588 million, compared with $472 million in 2004. Trading-related revenues included net interest income of $175 million and non-interest revenue of $413 million. The $116 million increase in interest and non-interest trading-related revenues from 2004 was largely attributable to commodity derivative and interest rate trading revenues. Commodities trading revenue, which is included in Other trading revenues in the table above, was up appreciably due to high volatility and active markets. Interest rate trading revenues increased due to increased client demand, while equity trading revenues declined from the strong levels of 2004. Foreign exchange trading revenues rose modestly. The Market Risk section on page 70 provides further information on trading-related revenues.
| | | |
| BMO Financial Group 188th Annual Report 2005 | | 39 |
Provision for Credit Losses
Favourable credit conditions continued in 2005, resulting in BMO recording a $179 million provision for credit losses, consisting of $219 million of specific provisions partially offset by a $40 million reduction in the general allowance for credit losses. This compares with a net recovery of $103 million in 2004, comprised of specific provisions of $67 million and a $170 million reduction in the general allowance. Reversals and recoveries were particularly high in 2004.
As illustrated in the adjoining table, in this current credit cycle, specific provisions for credit losses peaked in the 2001–2002 period, declined sharply in 2003 and 2004, and returned to a more moderate but still low level in 2005. The $152 million increase in specific provisions in 2005 was primarily attributable to reduced levels of reversals of previous allowances and recoveries of past write-offs, which together declined by $254 million to $189 million in 2005. This reduction more than offset a $102 million decline in new specific provisions, which totalled $408 million in 2005.
Lower levels of reversals and recoveries in 2005 were expected at this point in the credit cycle. The relatively high level of reversals and recoveries in 2004 was largely due to the success of our effective loan realization practices, including strong cash collections and loan sales. Sales of gross impaired loans were facilitated by higher levels of impaired loans from which to effect sales, as well as a receptive secondary market. In 2004, sales of gross impaired loans totalled $440 million with resulting reversals and recoveries totalling $71 million. This contrasts with sales of $102 million and resulting reversals and recoveries of $22 million in 2005.
The most significant factor influencing the provision for credit losses is the level of formations of new impaired loans – identified as additions to impaired loans and acceptances in the Changes in Gross Impaired Loans and Acceptances table. As with specific provisions, these formations peaked in the 2001–2002 period at about $2 billion per year, steadily declining thereafter to a current low of $423 million in 2005. Partially as a result, at October 31, 2005, gross impaired loans and acceptances totalled $804 million, the lowest level in seven years, with notable reductions occurring in the telecom and power generation sectors over the past two years.
At October 31, 2005, the allowance for credit losses totalled $1,128 million, compared with $1,308 million a year earlier. The decline was attributable to improved credit quality in the performing loan portfolio and lower levels of impaired loans and acceptances. The general allowance, which totalled $959 million at year-end, remains adequate, representing 64 basis points of risk-weighted assets. In addition, BMO uses credit default swaps to mitigate credit exposures. At October 31, 2005, the notional value of these instruments totalled $1,274 million, compared with $830 million a year earlier.
BMO’s loan book continues to be comprised largely of more stable consumer and commercial portfolios, which, excluding securities borrowed or purchased under resale agreements, represented 86.7% of the loan portfolio at year-end, compared with 86.3% in 2004. Moreover, BMO currently has no material exposures at risk to industry sectors considered to be of most concern in today’s economy. These include the airline, automotive, forestry, feedstock, chemicals and petroleum-based products sectors. Nonetheless, we remain attentive to those factors that could affect credit quality in the consumer and
corporate and commercial portfolios. These include continuing high energy costs, the impact on export sectors of the sharp appreciation of the Canadian dollar relative to the U.S. dollar and the potential impact of rising interest rates. Credit risk management is discussed further on page 69.
Looking forward, we expect the credit environment to remain stable in 2006, with potential weakness developing in the latter part of the year. This outlook is based on our expectations of continuing low corporate default rates, low levels of impaired loan formations and stable economic conditions across North America. Accordingly, we expect the 2006 provision for credit losses to be $400 million or less, with the increase over the current year largely related to the credit cycle and an expectation of increasing levels of new specific provisions and somewhat lower levels of reversals and recoveries.
Provision for (Recovery of) Credit Losses (PCL)($ millions, except as noted)
| | | | | | | | | | | | | | | | | | | | | | | | | |
| For the year ended October 31 | | 2005 | | | 2004 | | | 2003 | | | 2002 | | | 2001 | | | 2000 | |
| |
| New specific provisions | | | 408 | | | | 510 | | | | 846 | | | | 1,063 | | | | 1,023 | | | | 458 | |
| Reversals of previous allowances | | | (122 | ) | | | (312 | ) | | | (303 | ) | | | (175 | ) | | | (103 | ) | | | (124 | ) |
| Recoveries of prior write-offs | | | (67 | ) | | | (131 | ) | | | (88 | ) | | | (68 | ) | | | (40 | ) | | | (44 | ) |
| |
| Specific provisions for credit losses | | | 219 | | | | 67 | | | | 455 | | | | 820 | | | | 880 | | | | 290 | |
| Increase in (reduction of): | | | | | | | | | | | | | | | | | | | | | | | | |
| General allowance | | | (40 | ) | | | (170 | ) | | | – | | | | – | | | | 100 | | | | 110 | |
| Country risk allowance | | | – | | | | – | | | | – | | | | – | | | | – | | | | (42 | ) |
| |
| Provision for (recovery of) credit losses | | | 179 | | | | (103 | ) | | | 455 | | | | 820 | | | | 980 | | | | 358 | |
| |
| PCL as a % of average net loans and acceptances | | | 0.11 | % | | | (0.07 | )% | | | 0.30 | % | | | 0.56 | % | | | 0.66 | % | | | 0.25 | % |
| |
Changes in Gross Impaired Loans (GIL) and Acceptances
($ millions, except as noted)
| | | | | | | | | | | | | | | | | | | | | | | | | |
| | | 2005 | | | 2004 | | | 2003 | | | 2002 | | | 2001 | | | 2000 | |
| |
| GIL, beginning of year | | | 1,119 | | | | 1,918 | | | | 2,337 | | | | 2,014 | | | | 1,501 | | | | 1,092 | |
| Additions to impaired loans and acceptances | 423 | | | | 607 | | | | 1,303 | | | | 1,945 | | | | 2,041 | | | | 1,106 | |
| Reductions in impaired loans and acceptances | (319 | ) | | | (936 | ) | | | (1,156 | ) | | | (738 | ) | | | (830 | ) | | | (446 | ) |
| Write-offs | | | (419 | ) | | | (470 | ) | | | (566 | ) | | | (884 | ) | | | (698 | ) | | | (251 | ) |
| |
| GIL, end of year | | | 804 | | | | 1,119 | | | | 1,918 | | | | 2,337 | | | | 2,014 | | | | 1,501 | |
| |
| | | | | | | | | | | | | | | | | | | | | | | | | |
| GIL as a % of gross loans and acceptances | | | 0.46 | % | | | 0.71 | % | | | 1.30 | % | | | 1.54 | % | | | 1.37 | % | | | 1.04 | % |
| |
| | | |
| 40 | | BMO Financial Group 188th Annual Report 2005 |
Non-Interest Expense
Non-interest expense increased $170 million or 2.8% to $6,327 million. In 2004, non-interest expense had risen $70 million or 1.1%. The factors affecting the low levels of expense growth in the past two years are quite similar in nature and in their impact. The dollar and percentage changes in expenses by category are outlined in the Non-Interest Expense table. The factors contributing to the 2.8% increase in 2005 are set out in the Contribution to Non-Interest Expense Growth table.
As explained on page 36, the incremental effects of businesses acquired in 2005 and 2004 increased expenses in 2005 relative to 2004 by $51 million (0.8%). As further explained on page 36, the lower Canadian/U.S. dollar exchange rate reduced costs in 2005 by $145 million (–2.4%). Higher performance-based compensation costs increased expenses by $124 million (2.0%). This latter increase was primarily in Private Client Group, in line with its significantly higher revenues and earnings, and in Investment Banking Group, where fee-based revenues, which typically have relatively higher variable costs, were strong relative to 2004. Revenues in interest-rate-sensitive businesses, which typically have relatively lower variable costs, were down appreciably in 2005. Other expenses in 2005 include a $25 million litigation charge, higher mutual fund trailer fees, increased marketing costs and higher capital taxes.
Productivity
The expense-to-revenue ratio (productivity ratio) improved 140 basis points to 63.5% in 2005. BMO’s overall ratio in any year is affected by the relative strength of the revenues in each operating group. The expense-to-revenue ratio of each group is typically quite different because of the nature of their businesses. In 2005, both Personal and Commercial Client Group and Private Client Group increased revenues more than expenses, in both absolute and percentage terms, thereby improving their expense-to-revenue ratios.
Personal and Commercial Client Group is BMO’s largest operating group and its productivity ratio of 60.2% improved by 290 basis points from last year, surpassing its target. Productivity improved in both Canada and the United States but the improvement was more pronounced in Canada. U.S. results were affected by expenses of $20 million to integrate acquired businesses and consolidate bank charters.
Private Client Group’s expense-to-revenue ratio was 74.6%, a 670 basis point improvement from a year ago, but would have improved 380 basis points excluding $74 million of gains on asset sales. As in 2004, the improvement was reflected in significantly higher earnings. The group has been successful with revenue-generating initiatives, aided by an overall improvement in market conditions, and surpassed its productivity target in 2005.
Investment Banking Group’s expense-to-revenue ratio deteriorated by 310 basis points to 53.9%. Revenue declined while expenses rose, as reduced revenues were primarily concentrated in businesses with relatively lower variable costs. Although the group’s productivity ratio deteriorated, it was the second best of its Canadian peer group in 2005.
We improved our overall cash productivity ratio in 2005 by 120 basis points to 62.6%, building on the significant improvements of the past two years, during which the cash productivity ratio improved by 420 basis points. However, we fell short of
Theexpense-to-revenue ratio (or productivity ratio)is our key measure of productivity. It is calculated as non-interest expense divided by total revenues (on a taxable equivalent basis), expressed as a percentage. See page 35.
Thecash productivity ratiois calculated in the same manner, after removing the amortization of intangible assets from non-interest expenses. See page 35. |
our annual target of improving enterprise-wide productivity by 150 to 200 basis points, as we continued to invest in our businesses to achieve future earnings growth.
Examples of initiatives to enhance productivity are outlined in the 2005 Review of Operating Groups Performance that starts on page 43. In 2006, a top BMO priority is to focus on revenue growth to improve productivity, as we are targeting a 100 to 150 basis point improvement in the cash productivity ratio.
Table 11 on page 83 provides further detail on expenses and expense growth.
Non-Interest Expense($ millions)
| | | | | | | | | | | | | | | | | | | | | |
| | | | | | | | | | | | | | | Change | |
| | | | | | | | | | | | | | | from 2004 | |
| For the year ended October 31 | | 2005 | | | 2004 | | | 2003 | | | $ | | | % | |
| |
| Performance-based compensation | | | 1,272 | | | | 1,148 | | | | 1,058 | | | | 124 | | | | 11 | |
| Other employee compensation | | | 2,474 | | | | 2,484 | | | | 2,520 | | | | (10 | ) | | | – | |
| |
| Total employee compensation | | | 3,746 | | | | 3,632 | | | | 3,578 | | | | 114 | | | | 3 | |
| Premises and equipment | | | 1,264 | | | | 1,252 | | | | 1,264 | | | | 12 | | | | 1 | |
| Communications | | | 122 | | | | 138 | | | | 162 | | | | (16 | ) | | | (12 | ) |
| Other | | | 1,101 | | | | 1,031 | | | | 978 | | | | 70 | | | | 7 | |
| Amortization of intangible assets | | | 94 | | | | 104 | | | | 105 | | | | (10 | ) | | | (10 | ) |
| |
| Total | | | 6,327 | | | | 6,157 | | | | 6,087 | | | | 170 | | | | 3 | |
| |
Contribution to Non-Interest Expense Growth(%)
| | | | | | | | | | | | | |
| For the year ended October 31 | | 2005 | | | 2004 | | | 2003 | |
| |
| Acquired businesses | | | 0.8 | | | | 1.7 | | | | 3.0 | |
| Currency translation effect | | | (2.4 | ) | | | (2.9 | ) | | | (2.9 | ) |
| Performance-based compensation | | | 2.0 | | | | 1.5 | | | | 1.5 | |
| Pension expense | | | (0.2 | ) | | | 0.5 | | | | 1.3 | |
Other* | | | 2.6 | | | | 0.3 | | | | (2.0 | ) |
| |
| Total non-interest expense growth | | | 2.8 | | | | 1.1 | | | | 0.9 | |
| |
*Other includes the offset of the impact of currency translation on performance-based compensation and pension expense.

| | | |
| BMO Financial Group 188th Annual Report 2005 | | 41 |
Provision for Income Taxes
The provision for income taxes reflected in the Consolidated Statement of Income is based upon transactions recorded in income, regardless of when such transactions are subject to taxation by tax authorities, with the exception of the repatriation of retained earnings from foreign subsidiaries, as outlined in Note 23 on page 124 of the financial statements.
As explained on pages 35 and 37, BMO adjusts revenue to a taxable equivalent basis for analysis, with an offsetting adjustment to the provision for income taxes. As such, unless indicated otherwise, the provision for income taxes and associated tax rates are stated on a taxable equivalent basis in this MD&A.
The provision for income taxes in the Consolidated Statement of Income was $994 million, compared with $1,111 million in 2004. In 2005, there were $66 million of recoveries of prior years’ income taxes, a high tax rate on the gain on sale of Harrisdirect, primarily due to tax elections, and $29 million of non-taxable revenue on restructuring VIEs. In 2004, there was a $19 million increase to the provision for future income tax liabilities related to U.S. real estate. The effective tax rate in 2005 was 28.8% (30.5% excluding the aforementioned items). This compares with an effective tax rate of 32.4% in 2004 (31.8% excluding the $19 million increase to the future income tax liabilities). In 2005, there was a higher proportion of income from lower tax rate jurisdictions. The components of variances between the effective and statutory Canadian tax rates are outlined in Note 23 on page 125 of the financial statements.
Excluding any special adjustments, we estimate that the effective tax rate in 2006 should be 30% to 31% and consider that rate to be sustainable.
BMO hedges the foreign exchange risk arising from our net investment in our U.S. operations by funding the net investment in U.S. dollars. Under this program, the gain or loss on hedging and the unrealized gain or loss on translation of the net investment in U.S. operations are charged or credited to retained earnings, but usually are approximately equal and offsetting. For income tax purposes, the gain or loss on hedging activities incurs an income tax charge or credit in the current period, which is charged or credited to retained earnings; however, the associated unrealized gain or loss on the net investment in U.S. operations does not incur income taxes until the investment is liquidated. The income tax charge/benefit arising from a hedging gain/loss is a function of fluctuations in exchange rates from period to period. The $297 million gain on hedging our net investment in U.S. operations in 2005 was subject to an income tax charge in retained earnings of $101 million, compared with a $710 million gain on hedging and a $254 million income tax charge in 2004. Refer to the Consolidated Statement of Changes in Shareholders’ Equity on page 94 of the financial statements for further details.
Table 11 on page 83 details the $1,407 million of total government levies and taxes incurred by BMO in 2005.
Non-Controlling Interest in Subsidiaries
Non-controlling interest in subsidiaries increased $41 million to $58 million in 2005, largely due to the issuance of $1,050 million of BMO BOaTS, comprised of $600 million Series D issued
in late fiscal 2004 and $450 million Series E issued in late fiscal 2005. Note 18 on page 116 of the financial statements provides more detail on non-controlling interest in subsidiaries.
Transactions with Related Parties
In the ordinary course of business, we provide banking services to our joint ventures and equity-accounted investees on the same terms that we offer to our customers. A select suite of customer loan and mortgage products is offered to our employees at rates normally accorded to our preferred customers. We also offer employees a subsidy on annual credit card fees.
Preferred rate loan agreements are discussed in Note 26 on page 128 of the financial statements. There were no amounts advanced under these preferred rate loan agreements in 2005.
The foregoing “Provision for Credit Losses”, “Non-Interest Expense” and “Provision for Income Taxes” sections and the following “2005 Review of Operating Groups Performance” section of this Annual Report contain certain forward-looking statements, in particular regarding our outlook for certain aspects of the Canadian and U.S. business environments in 2006, our productivity ratio, effective income tax rates and our strategies and priorities for 2006. By their nature, forward-looking statements require us to make assumptions and are subject to inherent risks and uncertainties. Please refer to the Caution Regarding Forward-Looking Statements on page 29 of this Annual Report for a discussion of such risks and uncertainties and the material factors and assumptions related to the statements set forth in such sections.
| | | |
| 42 | | BMO Financial Group 188th Annual Report 2005 |
2005 Review of Operating Groups Performance
[PHOTO]
William A. Downe
Deputy Chair, BMO Financial Group Chief Executive Officer, BMO Nesbitt Burns and Head, Investment Banking Group
This section includes an analysis of our operating groups financial results and descriptions of their businesses, visions, strategies, strengths, challenges, achievements and outlooks.
Personal and Commercial Client Group (P&C)(pages 44 to 49)
Net income was $1,199 million in 2005, an increase of $217 million or 22% from 2004.
Private Client Group (PCG)(pages 50 to 52)
Net income was $320 million in 2005, an increase of $93 million or 41% from 2004.
Investment Banking Group (IBG)(pages 53 to 55)
Net income was $852 million in 2005, an increase of $20 million or 3% from 2004.
Corporate Support, including Technology and Solutions(pages 56 to 57)
Net income was $29 million in 2005, compared with net income of $265 million in 2004.
The basis for the allocation of results geographically and among operating groups is outlined in Note 25 on page 127 of the financial statements. Certain prior year data has been restated, as explained on page 23.
Contributions to Revenue, Expenses, Net Income and Average Assets by Operating Group and by Location($ millions, except as noted)
| | | | | | | | | | | | | | | | | | | | | | | | | | | | | | | | | | | | | | | | | | | | | | | | | | | | | | | | | | | | | |
| | | Personal and | | | | | | | | | Corporate Support, | | | | |
| | | Commercial | | | Private | | | Investment | | | including Technology | | | Total | |
| | | Client Group | | | Client Group | | | Banking Group | | | and Solutions | | | Consolidated | |
| For the year ended | | | | | | | | | | | | | | | | | | | | | | | | | | | | | | | | | | | | | | | | | | | | | |
| October 31 | | 2005 | | | 2004 | | | 2003 | | | 2005 | | | 2004 | | | 2003 | | | 2005 | | | 2004 | | | 2003 | | | 2005 | | | 2004 | | | 2003 | | | 2005 | | | 2004 | | | 2003 | |
| |
| Operating Groups Contribution to BMO’s Performance(%) | | | | | | | | | | | | | | | | | | | | | | | | | | | | |
| Revenue | | | 52.4 | | | | 51.4 | | | | 52.2 | | | | 20.4 | | | | 19.5 | | | | 19.0 | | | | 27.5 | | | | 29.2 | | | | 28.3 | | | | (0.3 | ) | | | (0.1 | ) | | | 0.5 | | | | 100 | | | | 100 | | | | 100 | |
| Expenses | | | 49.7 | | | | 50.0 | | | | 50.4 | | | | 24.0 | | | | 24.4 | | | | 24.8 | | | | 23.3 | | | | 22.8 | | | | 22.1 | | | | 3.0 | | | | 2.8 | | | | 2.7 | | | | 100 | | | | 100 | | | | 100 | |
| Net income | | | 50.0 | | | | 42.6 | | | | 51.3 | | | | 13.3 | | | | 9.8 | | | | 7.7 | | | | 35.5 | | | | 36.1 | | | | 38.8 | | | | 1.2 | | | | 11.5 | | | | 2.2 | | | | 100 | | | | 100 | | | | 100 | |
| Average assets | | | 41.9 | | | | 43.4 | | | | 40.9 | | | | 2.3 | | | | 2.6 | | | | 2.7 | | | | 54.0 | | | | 52.5 | | | | 54.7 | | | | 1.8 | | | | 1.5 | | | | 1.7 | | | | 100 | | | | 100 | | | | 100 | |
| |
Total Revenue | | | | | | | | | | | | | | | | | | | | | | | | | | | | | | | | | | | | | | | | | | | | | | | | | | | | | | | | | | | | |
| Canada | | | 4,217 | | | | 3,934 | | | | 3,873 | | | | 1,486 | | | | 1,282 | | | | 1,154 | | | | 1,368 | | | | 1,349 | | | | 1,160 | | | | (23 | ) | | | (34 | ) | | | (86 | ) | | | 7,048 | | | | 6,531 | | | | 6,101 | |
| United States | | | 897 | | | | 852 | | | | 822 | | | | 543 | | | | 559 | | | | 572 | | | | 1,260 | | | | 1,284 | | | | 1,289 | | | | (89 | ) | | | (57 | ) | | | 113 | | | | 2,611 | | | | 2,638 | | | | 2,796 | |
| Other countries | | | 102 | | | | 91 | | | | 84 | | | | 7 | | | | 10 | | | | 8 | | | | 113 | | | | 135 | | | | 139 | | | | 77 | | | | 83 | | | | 21 | | | | 299 | | | | 319 | | | | 252 | |
| |
| Total | | | 5,216 | | | | 4,877 | | | | 4,779 | | | | 2,036 | | | | 1,851 | | | | 1,734 | | | | 2,741 | | | | 2,768 | | | | 2,588 | | | | (35 | ) | | | (8 | ) | | | 48 | | | | 9,958 | | | | 9,488 | | | | 9,149 | |
| |
Total Expenses | | | | | | | | | | | | | | | | | | | | | | | | | | | | | | | | | | | | | | | | | | | | | | | | | | | | | | | | | | | | |
| Canada | | | 2,470 | | | | 2,417 | | | | 2,435 | | | | 1,013 | | | | 919 | | | | 872 | | | | 747 | | | | 627 | | | | 616 | | | | 114 | | | | 99 | | | | 70 | | | | 4,344 | | | | 4,062 | | | | 3,993 | |
| United States | | | 659 | | | | 637 | | | | 633 | | | | 506 | | | | 583 | | | | 636 | | | | 628 | | | | 678 | | | | 635 | | | | 62 | | | | 62 | | | | 85 | | | | 1,855 | | | | 1,960 | | | | 1,989 | |
| Other countries | | | 13 | | | | 23 | | | | 2 | | | | 1 | | | | 2 | | | | 2 | | | | 102 | | | | 100 | | | | 94 | | | | 12 | | | | 10 | | | | 7 | | | | 128 | | | | 135 | | | | 105 | |
| |
| Total | | | 3,142 | | | | 3,077 | | | | 3,070 | | | | 1,520 | | | | 1,504 | | | | 1,510 | | | | 1,477 | | | | 1,405 | | | | 1,345 | | | | 188 | | | | 171 | | | | 162 | | | | 6,327 | | | | 6,157 | | | | 6,087 | |
| |
Net Income | | | | | | | | | | | | | | | | | | | | | | | | | | | | | | | | | | | | | | | | | | | | | | | | | | | | | | | | | | | | |
| Canada | | | 963 | | | | 816 | | | | 753 | | | | 305 | | | | 237 | | | | 175 | | | | 433 | | | | 445 | | | | 332 | | | | (23 | ) | | | 175 | | | | 14 | | | | 1,678 | | | | 1,673 | | | | 1,274 | |
| United States | | | 125 | | | | 110 | | | | 94 | | | | 10 | | | | (17 | ) | | | (44 | ) | | | 346 | | | | 333 | | | | 273 | | | | (9 | ) | | | 4 | | | | 35 | | | | 472 | | | | 430 | | | | 358 | |
| Other countries | | | 111 | | | | 56 | | | | 67 | | | | 5 | | | | 7 | | | | 6 | | | | 73 | | | | 54 | | | | 86 | | | | 61 | | | | 86 | | | | (10 | ) | | | 250 | | | | 203 | | | | 149 | |
| |
| Total | | | 1,199 | | | | 982 | | | | 914 | | | | 320 | | | | 227 | | | | 137 | | | | 852 | | | | 832 | | | | 691 | | | | 29 | | | | 265 | | | | 39 | | | | 2,400 | | | | 2,306 | | | | 1,781 | |
| |
Average Assets | | | | | | | | | | | | | | | | | | | | | | | | | | | | | | | | | | | | | | | | | | | | | | | | | | | | | | | | | | | | |
| Canada | | | 105,517 | | | | 98,787 | | | | 91,717 | | | | 3,708 | | | | 3,465 | | | | 3,245 | | | | 94,255 | | | | 78,555 | | | | 76,433 | | | | (1,530 | ) | | | (3,397 | ) | | | (3,968 | ) | | | 201,950 | | | | 177,410 | | | | 167,427 | |
| United States | | | 21,055 | | | | 17,895 | | | | 16,046 | | | | 3,345 | | | | 3,671 | | | | 3,741 | | | | 45,402 | | | | 40,000 | | | | 48,431 | | | | 5,819 | | | | 7,177 | | | | 8,404 | | | | 75,621 | | | | 68,743 | | | | 76,622 | |
| Other countries | | | 446 | | | | 444 | | | | 283 | | | | 8 | | | | 9 | | | | 29 | | | | 24,191 | | | | 23,136 | | | | 19,554 | | | | 944 | | | | 50 | | | | 51 | | | | 25,589 | | | | 23,639 | | | | 19,917 | |
| |
| Total | | | 127,018 | | | | 117,126 | | | | 108,046 | | | | 7,061 | | | | 7,145 | | | | 7,015 | | | | 163,848 | | | | 141,691 | | | | 144,418 | | | | 5,233 | | | | 3,830 | | | | 4,487 | | | | 303,160 | | | | 269,792 | | | | 263,966 | |
| |
| | | |
| BMO Financial Group 188th Annual Report 2005 | | 43 |
Personal and Commercial Client Group – Canada
[PHOTO]
Robert W. Pearce
President and Chief Executive Officer, Personal and Commercial Client Group – Canada
Group Description
Personal and Commercial Client Group Canada (P&C Canada), working together with BMO’s other groups, serves the financial needs of more than seven and a half million Canadians. We offer a full range of products and services through almost 1,000 BMO Bank of Montreal traditional and instore branches, telephone banking, online banking at bmo.com, licensed insurance agents and our network of almost 2,000 automated banking machines.
Our personal and commercial banking business is among the five largest in Canada. BMO is well positioned in an increasingly competitive environment where Canadians can choose from among the products and services of traditional banks, credit unions and trust companies as well as other competitors such as direct banks, mortgage and deposit brokers, financial planners and mutual fund companies.
Vision
Our goal is to be the only financial services provider our personal and commercial customers will ever need. This goal will be reached by providing exceptional transactional sales and service, and by delivering a customer service experience that is proactive and advice-based. Our comprehensive and customized products and services will continue to help our customers better manage all aspects of their financial affairs.
Strategies
| § | | Continuously invest to provide innovative products, pricing and offerings to serve our personal and independent business banking customers. Designated bankers will be assigned to customers to provide them with proactive advice, support and solutions to help them better manage their payment, financing and investing needs. |
| |
| § | | Continue to be a leading provider of financial services to the commercial marketplace by providing a full suite of products and services, tailored to customer needs, through knowledgeable and experienced relationship managers. |
| |
| § | | Invest in technology and simplify sales and fulfilment processes to improve our customer service experience, increase frontline capacity and improve operational and sales effectiveness. |
| |
| § | | Continue investing to upgrade and expand our distribution network. |
Our Lines of Business
Personal Financial Servicesprovides solutions for customers’ everyday banking, financing, investing, credit card and insurance needs. We serve more than 20% of Canadian households. Our national, fully coordinated, multi-channel distribution system offers customers convenience and choice in where, when and how they do their banking.
Commercial Financial Servicesprovides our business clients – independent businesses, small and medium-sized enterprises and mid-market banking clients – with a full range of banking products and services. Our specialized relationship managers deliver a full suite of integrated commercial and capital markets products and financial advisory services.
Strengths
| § | | Strong competitive position in Commercial Banking, reflected in a number two position in business banking market share. |
| |
| § | | A full range of everyday banking and payment capabilities, including our unique Mosaik MasterCard credit card offering and exclusive customer loyalty programs. Mosaik MasterCard is the only credit card to provide an exclusive preferred redemption offer with WestJet Airlines Ltd. |
| |
| § | | Superior risk management capabilities that allow our customers to rely on us to deliver consistent financing solutions in all economic conditions. |
| |
| § | | Solid customer data management capabilities and tailored offerings that provide customers with an effective referral program. |
| |
| § | | Strong position in the electronic transaction processing market through Moneris®6 Solutions, our joint venture with RBC Financial Group®7, which has more than a 40% share of the Canadian market. |
| |
| § | | Top-tier organizational and managerial effectiveness. Higher employee engagement and satisfaction scores in our annual employee surveys confirm our success in attracting and retaining employees. |
| § | | Reliable technology platform that facilitates efficient sales and service across all channels. |
Challenges
| § | | Customer alternatives expanded as competitors continue to focus on improving their personal and commercial banking market position. |
| |
| § | | Continued pressure on margins due to growing price-based competition. |
| |
| § | | Increasing competition to hire and retain highly qualified employees. |
| |
| § | | Heightened regulatory compliance and scrutiny that place greater demands on our resources. |
| | | | | | | | | | | | | |
| Key Performance Drivers(%) | | 2005 | | | 2004 | | | 2003 | |
| |
| Personal deposit growth | | | 4.4 | | | | 6.1 | | | | 8.3 | |
| Commercial deposit growth | | | 11.1 | | | | 14.2 | | | | 8.7 | |
Personal loan growth* | | | 9.2 | | | | 8.5 | | | | 7.7 | |
Commercial loan growth* | | | 4.3 | | | | 3.1 | | | | 4.7 | |
| Cash productivity ratio | | | 57.3 | | | | 60.4 | | | | 61.4 | |
| Revenue growth | | | 7.3 | | | | 1.7 | | | | 7.0 | |
Employee engagement index** | | | 72 | | | | 70 | | | | 68 | |
| | |
| * | | Includes acceptances and securitized loans. |
| |
| ** | | Source: BMO’s Annual Employee Survey, conducted by Burke Inc., an independent research company. |
| | | |
| 44 | | BMO Financial Group 188th Annual Report 2005 |
2005 Group Objectives and Achievements
Continue to focus on revenue growth while building our distribution capabilities.
| § | | Revenue grew by a solid 7.3%. Despite competitive pressures, our focus on increasing revenues resulted in both strong balance sheet growth and effective spread management. Loans and acceptances, after adding back the effects of securitizations, increased $7.8 billion or 7.9% and personal and commercial deposits grew $2.8 billion or 7.0% from 2004. |
Improve our cash productivity ratio by at least 150 bps.
| § | | Our cash productivity ratio improved for the third consecutive year, declining by 310 basis points from 2004, driven by both revenue growth and expense management. |
Improve customer loyalty in both the personal and commercial banking segments.
| § | | Our customer loyalty scores, as measured by independent research firms, declined in personal banking and were unchanged in commercial banking in 2005. Improving customer loyalty remains a key focus in 2006 and beyond as we invest in sales force growth and improve our ability to offer relevant, flexible solutions to help our customers better manage their financial affairs. |
Maintain our personal banking market share and increase our business banking market share relative to our major competitors.
| § | | Our personal banking market share declined in the first half of 2005 but we were successful in maintaining market share in the second half of the year. Market share declined 7 basis points to 13.04%(1). Our business banking market share increased 7 basis points to 18.82%(1), reflecting our continued strong capabilities in this market as demonstrated by our number two market position. |
| | |
| (1) | | Market share has been restated to account for competitor restatements. |
Introduce further enhancements to our sales and service delivery model to better meet the needs of our customers.
| § | | We applied more discipline to our sales management through initiatives such as integrating financial planners into our delivery model and aligning desired customer experience with employee performance measurement and incentives. We also upgraded our technology to streamline workflow and improve the quality of our customer information, allowing us to better recognize and meet the needs of our customers. |
Everyday Priorities for 2006
| § | | Enhance the quality of sales and service delivery to build lasting relationships through exceptional service, leading to revenue growth, increased market share and improved customer loyalty. |
| |
| § | | Simplify processes and enhance technology for front-line sales and service representatives, increasing capacity and effectiveness to improve customer service. |
| § | | Continue our track record of improving our cash productivity ratio. |
| |
| § | | Invest further in our distribution network, including the replacement of our ABM network. |
| |
| § | | Continue expanding programs and offers to meet all of our customers’ financial needs. |
| | | |
| BMO Financial Group 188th Annual Report 2005 | | 45 |
Personal and Commercial Client Group – Chicagoland Banking
[PHOTO]
Frank J. Techar
President and Chief Executive Officer, Harris Bankcorp
Group Description
P&C Chicagoland Banking serves personal and business clients with a full suite of financial products and services. This is done through a community banking model that emphasizes local knowledge and commitment. We focus on customer service, supported by an effective distribution network, disciplined sales management and a premier network of convenient, attractive branches.
Vision
Our goal is to be the leading personal and commercial bank in the U.S. Midwest. Our community banking strategy leverages strong local leaders and a deeply embedded focus on our customers across a full spectrum of products and services, delivered through a convenient and expanding distribution network. This approach underlies our successful growth in the highly competitive and fragmented Chicagoland market and provides us with a strategic advantage for entering new markets.
Strategies
| § | Develop deep and lasting relationships with our customers by helping them achieve their financial goals and providing exceptional customer service. |
| |
| § | Consolidate our leadership position in the Chicagoland market and significantly increase our presence in other Midwestern states. |
| |
| § | Invest in enhancing our technology infrastructure to support growth. |
Our Lines of Business
Chicagoland Bankingoffers a full range of consumer and business loan and deposit products, including deposit and investment
services, mortgages, consumer credit, business lending, cash management and other banking services.
Strengths
| § | | A rich heritage of more than 120 years in the Chicago area, with the established Harris brand and a strong customer service orientation. |
| |
| § | | 176 premier branch locations in communities in the Chicago area and 19 locations in Northwest Indiana. |
| |
| § | | Deep relationships with local communities, businesses and their leaders that have been forged over many years. |
| |
| § | | A community banking business model focused on our customers, with competitive product offerings and strong sales management and marketing capabilities. |
| |
| § | | Opportunity to leverage the capabilities and scale of BMO Financial Group. |
Challenges
| § | | High level of fragmentation and competition in the Chicagoland market. |
| |
| § | | Expansion opportunities in Chicagoland market limited by the rising costs of new branches and the premiums that quality acquisitions command. |
| |
| § | | Continuing pressure on net interest margins. |
| |
| § | | Significant investments required in our technology infrastructure to support growth. |
| | | | | | | | | | | | | |
| Key Performance Drivers | | 2005 | | | 2004 | | | 2003 | |
| |
| Average deposit growth (%) | | | 9.3 | | | | 5.0 | | | | 6.8 | |
| Average loan growth (%) | | | 22.2 | | | | 19.0 | | | | 25.0 | |
| Cash productivity ratio (%) | | | 69.9 | | | | 71.4 | | | | 74.2 | |
| Number of branches | | | 195 | | | | 168 | | | | 153 | |
Employee engagement index* | | | 71 | | | | 65 | | | | 65 | |
| Secure customer index | | | 42 | | | | n/m | | | | 37 | |
Net promoter score** | | | 34 | | | | n/m | | | | 26 | |
| | |
| * | | Source: BMO’s Annual Employee Survey, conducted by Burke Inc., an independent research company. |
| |
| ** | | A measure of the intensity of customer loyalty. |
| |
| | | n/m – not measured |
| | | |
| 46 | | BMO Financial Group 188th Annual Report 2005 |
2005 Group Objectives and Achievements
Improve our cash productivity by at least 150 bps.
| § | | The cash productivity ratio improved 150 basis points, driven by higher revenues from acquisitions and organic volume growth as well as continued expense management. We improved productivity while funding key initiatives such as acquisitions and the expansion of our branch network. |
Expand our branch network by opening five new
branches and continuing to pursue acquisitions in
Chicago, surrounding states and other high-growth
markets. We targeted 192 locations by the end of
fiscal 2005, with a goal of 200 branches in Chicago
by 2007.
| § | | We opened eight new branches in Chicagoland and acquired Mercantile Bancorp with its 19 branches in Northwest |
| | | Indiana, expanding the Harris Community Banking network to 195 locations and surpassing our target for 2005. We remain on target to reach 200 locations in Chicagoland and 20 in Northwest Indiana by 2007. Our plan is to use our existing infrastructure and integration capabilities to expand the network to 350 to 400 branches over the next five years. |
Provide more seamless customer service and achieve
cost efficiencies through the consolidation of our
bank charter structure.
| § | | Our charter consolidation took place at the end of May 2005 and was an outstanding success, with no disruption to customer service. We anticipate financial benefits will start to accrue in 2006 as system modifications and business processes become fully integrated. |
Everyday Priorities for 2006
| § | | Focus on revenue growth to improve our productivity. |
| |
| § | | Continue to build our branch network in Chicagoland by opening five new branches and exploring acquisition opportunities in the Midwest. |
| § | | Continue to refine our customer experience to provide the high customer service levels of a community bank. |
| |
| § | | Invest in our strategic infrastructure by refreshing the branch technology platform. |
| | | |
| BMO Financial Group 188th Annual Report 2005 | | 47 |
Canadian Business Environment and Outlook
The personal and commercial banking environment benefited from favourable economic conditions in 2005, although intense competition and low interest rates maintained pressure on margins. Attractive borrowing costs and rising employment sustained very strong demand for new homes and kept upward pressure on housing prices as residential mortgage volumes continued to grow. Similarly, consumer loan growth maintained strong momentum, also driven by low interest rates and rising demand for household goods. Commercial loans continued to grow in 2005, as rising capacity utilization and high commodity prices spurred investment and very strong corporate cash flow stimulated healthy growth in business deposits.
Looking to 2006, we believe overall economic conditions should remain supportive, although growth in both loans and deposits is likely to moderate. We expect that gradually rising interest rates will likely take some of the buoyancy out of the housing market. As such, both mortgage and consumer loan growth are expected to moderate but remain strong. On the commercial side, we expect a continuation of our customers’ need to modernize and expand capacity, supporting continued strong growth in business loans. However, we expect that strengthening investment and slower growth in cash flow are likely to significantly soften growth in business deposits.
U.S. Business Environment and Outlook
Chicago’s financial services market is one of the most fragmented in the United States, with more than 250 banks. Harris and the two other largest banks have together held 25% to 30% of the personal and commercial deposit market since 1997. New banks nonetheless continue to enter this market, and many others have begun to roll out significant branch expansions. Others are attempting to capture market share with unique distribution, cut-rate pricing or significantly increased brand marketing.
Chicagoland remains a hotly contested market because of the growth opportunities it presents. While the region has attracted some significant competitors, we plan to continue to expand our business, and therefore expect further margin pressure over the next year. In the longer term, competitive pressures should subside and profitability should improve, allowing the larger players, such as Harris, to reap the benefits of these developments.
We continue to expect the Chicagoland market to grow at a rate consistent with the overall growth in the U.S. economy. Demand for consumer credit should continue to generate healthy profits. In addition, the banking needs of small business clients should increase with an expanding economy, resulting in growth in the volume and complexity of demand for financial services and the creation of new opportunities.
In 2006, we will continue to emphasize expansion in the U.S. Midwest through a combination of organic growth and acquisitions. We will strive to improve our efficiency by focusing on revenue growth and, by building our business around enduring client relationships, continue to enhance our reputation as a high-quality, client-focused bank.
U.S. Operations Financial Results
Net income from U.S. operations represented 10% of total Personal and Commercial Client Group net income for the year, compared with 11% for fiscal 2004. BMO’s corporate banking operations in the United States are concentrated among mid-market corporate clients, which BMO manages and reports in our Investment Banking Group operations because of the enhanced opportunities to cross-sell products. BMO’s North American peers typically include similar businesses in their personal and commercial banking units. The table below shows the effects of including this U.S.-based mid-market business in Personal and Commercial Client Group on a pro-forma basis and provides more geographic detail on results. The table reflects the inclusion of $432 million ($545 million in 2004) of corporate mid-market revenue and $131 million ($197 million in 2004) of net income in U.S. results for the year. Overall revenues and net income of the mid-market banking unit declined from 2004 due to lower spreads in both corporate banking loans and cash management services. Corporate banking assets continue to grow, while deposits have declined in cash management.
If results of the U.S. mid-market banking unit were included in Personal and Commercial Client Group results, net income from U.S. operations would represent 19% of the group’s earnings in the year, compared with 10% as currently reported. U.S.-based revenues, after including the U.S. mid-market banking unit, would be 24% of the group’s revenue, compared with 17% as currently reported. The non-interest expense-to-revenue ratio would be 58.8%, compared with 60.2% as currently reported.
Personal and Commercial Client Group adjusted
to include U.S.-based Mid-Market Business
| | | | | | | | | | | | | | | | | | | | | |
| (Canadian $ in millions, except as noted) | | | | | | | | | | | | | | Change | |
| | | | | | | | | | | | | | | from 2004 | |
| | | | | | | | | | | | | | | | |
| For the year ended October 31 | | 2005 | | | 2004 | | | 2003 | | | $ | | | % | |
| |
| Canada – revenue | | | 4,319 | | | | 4,025 | | | | 3,957 | | | | 294 | | | | 7 | |
| United States – revenue | | | 1,329 | | | | 1,397 | | | | 1,396 | | | | (68 | ) | | | (5 | ) |
| |
| Total revenue (teb) | | | 5,648 | | | | 5,422 | | | | 5,353 | | | | 226 | | | | 4 | |
| |
| | | | | | | | | | | | | | | | | | | | | |
| Canada – net income | | | 1,074 | | | | 872 | | | | 820 | | | | 202 | | | | 23 | |
| United States – net income | | | 256 | | | | 307 | | | | 309 | | | | (51 | ) | | | (17 | ) |
| |
| Total net income | | | 1,330 | | | | 1,179 | | | | 1,129 | | | | 151 | | | | 13 | |
| |
| | | | | | | | | | | | | | | | | | | | | |
| Canada – return on equity (%) | | | 28.6 | | | | 28.9 | | | | 29.4 | | | | | | | | (0.3 | ) |
| United States – return on equity (%) | | | 10.5 | | | | 17.3 | | | | 13.8 | | | | | | | | (6.8 | ) |
| |
| Total return on equity (%) | | | 21.6 | | | | 24.7 | | | | 22.6 | | | | | | | | (3.1 | ) |
| |
| | | | | | | | | | | | | | | | | | | | | |
| Canada – non-interest expense-to-revenue ratio (%) | | | 57.5 | | | | 60.6 | | | | 61.6 | | | | | | | | (3.1 | ) |
| United States – non-interest expense-to-revenue ratio (%) | | | 62.9 | | | | 58.4 | | | | 58.0 | | | | | | | | 4.5 | |
| |
| Total non-interest expense-to-revenue ratio (%) | | | 58.8 | | | | 60.0 | | | | 60.7 | | | | | | | | (1.2 | ) |
| |
| | | |
| 48 | | BMO Financial Group 188th Annual Report 2005 |
Personal and Commercial Client Group Financial Results
Personal and Commercial Client Group net income rose $217 million or 22% from the record results of a year ago to $1,199 million. The improvement was driven by strong volume growth and effective cost management, partially offset by lower net interest margin in the United States. P&C Canada’s net income in 2005 included a $34 million recovery of prior years’ income taxes and a $40 million ($26 million after tax) reduction in credit card fees. This reduction was due to further refinements made to the methodology used to determine the liability associated with our customer loyalty rewards program. In 2004, we recorded $65 million ($42 million after tax) of adjustments to credit card fees to increase the recorded liability because of rising reward redemption rates. Excluding the foregoing adjustments, net income for 2005 rose $167 million or 16%.
Revenue increased $339 million or 7% to $5,216 million. In Canada, there was strong volume growth across most products, including revenue from the sale of term investment products and mutual funds as well as securitization activities. The lower card fees adjustment in 2005 also contributed to revenue growth. These factors were partially offset by a small decline in P&C Canada’s net interest margin. In the United States, higher revenues were due to robust consumer and small business loan growth and acquisitions, partially offset by the impact of lower net interest margin. The weaker U.S. dollar lowered revenue growth by $73 million, but this effect was offset by acquisitions, which contributed $75 million to revenue growth.
In Canada, revenue growth in the personal banking segment was led by the sale of term and mutual fund products, and strong mortgage and loan growth and insurance income, partially offset by lower net interest margin. In the commercial banking segment, revenue growth was attributable to improved loan volumes, particularly strong deposit growth and improved net interest margin.
The group’s net interest margin fell 6 basis points, with a more pronounced decline in the United States. In Canada, net interest margin was reduced by the continuing shift in customer preferences toward lower-spread products and by the effects of the competitive low interest rate environment. In the United States, net interest margin fell 31 basis points due to competitive pressures on loan pricing and the impact of lower investment rates earned on longer-term liabilities. These factors were mitigated by growth in higher-spread business loans and growth and pricing actions in certain deposits categories. In addition, since asset balances comprise the denominator in the net interest margin calculation, and since P&C Chicagoland Banking’s loan growth has exceeded its deposit growth over time, its net interest margin has been negatively affected.
Non-interest expense increased $65 million or 2% to $3,142 million, due to continued investment in our distribution network in Canada and to acquisitions in the United States. The incremental impact of acquired businesses contributed $51 million to expense growth. This was offset by the $53 million effect of the weaker U.S. dollar. However, our U.S. business also incurred approximately $20 million of costs to integrate new businesses and effect the consolidation of 26 community bank charters into a single charter. This effort is expected to contribute significantly to superior customer experiences and to produce cost savings in 2006 and beyond.
Personal and Commercial Client Group($ millions, except as noted)
| | | | | | | | | | | | | | | | | | | | | |
| Total Reported | | | | | | | | | | | | | | Change from 2004 | |
| As at or for the year ended October 31 | | 2005 | | | 2004 | | | 2003 | | | $ | | | % | |
| |
| Net interest income (teb) | | | 3,561 | | | | 3,352 | | | | 3,230 | | | | 209 | | | | 6 | |
| Non-interest revenue | | | 1,655 | | | | 1,525 | | | | 1,549 | | | | 130 | | | | 9 | |
| |
| Total revenue (teb) | | | 5,216 | | | | 4,877 | | | | 4,779 | | | | 339 | | | | 7 | |
| Provision for credit losses | | | 299 | | | | 299 | | | | 298 | | | | – | | | | -- | |
| Non-interest expense | | | 3,142 | | | | 3,077 | | | | 3,070 | | | | 65 | | | | 2 | |
| |
| Income before income taxes and non-controlling interest in subsidiaries | | | 1,775 | | | | 1,501 | | | | 1,411 | | | | 274 | | | | 18 | |
| Income taxes (teb) | | | 576 | | | | 518 | | | | 493 | | | | 58 | | | | 11 | |
| Non-controlling interest in subsidiaries | | | – | | | | 1 | | | | 4 | | | | (1 | ) | | | (100 | ) |
| |
| Net income | | | 1,199 | | | | 982 | | | | 914 | | | | 217 | | | | 22 | |
| |
| Amortization of intangible assets (after tax) | | | 34 | | | | 33 | | | | 30 | | | | 1 | | | | 6 | |
| |
| Cash net income | | | 1,233 | | | | 1,015 | | | | 944 | | | | 218 | | | | 22 | |
| |
| Net economic profit | | | 667 | | | | 592 | | | | 520 | | | | 75 | | | | 13 | |
| Return on equity (%) | | | 22.7 | | | | 24.8 | | | | 23.0 | | | | | | | | (2.1 | ) |
| Cash return on equity (%) | | | 23.3 | | | | 25.6 | | | | 23.8 | | | | | | | | (2.3 | ) |
| Non-interest expense-to-revenue ratio (%) | | | 60.2 | | | | 63.1 | | | | 64.2 | | | | | | | | (2.9 | ) |
| Cash non-interest expense-to-revenue ratio (%) | | | 59.4 | | | | 62.3 | | | | 63.6 | | | | | | | | (2.9 | ) |
| Average net interest margin (%) | | | 2.80 | | | | 2.86 | | | | 2.99 | | | | | | | | (0.06 | ) |
| Average common equity | | | 5,191 | | | | 3,912 | | | | 3,920 | | | | 1,279 | | | | 33 | |
| Average assets | | | 127,018 | | | | 117,126 | | | | 108,046 | | | | 9,892 | | | | 8 | |
| Risk-weighted assets | | | 85,012 | | | | 76,842 | | | | 71,010 | | | | 8,170 | | | | 11 | |
| Average loans and acceptances | | | 121,240 | | | | 112,693 | | | | 104,286 | | | | 8,547 | | | | 8 | |
| Average deposits | | | 61,200 | | | | 58,210 | | | | 55,620 | | | | 2,990 | | | | 5 | |
| Assets under administration | | | 11,415 | | | | 10,955 | | | | 11,295 | | | | 460 | | | | 4 | |
| Full-time equivalent staff | | | 18,641 | | | | 18,130 | | | | 17,931 | | | | 511 | | | | 3 | |
| |
| |
| P&C Canada Reported | | | | | | | | | | | | | | Change from 2004 | |
| For the year ended October 31 | | 2005 | | | 2004 | | | 2003 | | | $ | | | % | |
| |
| Total revenue (teb) | | | 4,319 | | | | 4,025 | | | | 3,957 | | | | 294 | | | | 7 | |
| Provision for credit losses | | | 269 | | | | 271 | | | | 271 | | | | (2 | ) | | | (1 | ) |
| Non-interest expense | | | 2,483 | | | | 2,440 | | | | 2,437 | | | | 43 | | | | 2 | |
| Net income | | | 1,074 | | | | 872 | | | | 820 | | | | 202 | | | | 23 | |
| |
| Non-interest expense-to-revenue ratio (%) | | | 57.5 | | | | 60.6 | | | | 61.6 | | | | | | | | (3.1 | ) |
| Average net interest margin (%) | | | 2.67 | | | | 2.69 | | | | 2.83 | | | | | | | | (0.02 | ) |
| Average assets | | | 105,963 | | | | 99,231 | | | | 92,000 | | | | 6,732 | | | | 7 | |
| Average deposits | | | 42,554 | | | | 39,764 | | | | 36,427 | | | | 2,790 | | | | 7 | |
| |
| |
| P&C Chicagoland Banking Reported | | | | | | | | | | | | | | Change from 2004 | |
| For the year ended October 31 | | 2005 | | | 2004 | | | 2003 | | | $ | | | % | |
| |
| Total revenue (teb) | | | 897 | | | | 852 | | | | 822 | | | | 45 | | | | 5 | |
| Provision for credit losses | | | 30 | | | | 28 | | | | 27 | | | | 2 | | | | 7 | |
| Non-interest expense | | | 659 | | | | 637 | | | | 633 | | | | 22 | | | | 3 | |
| Net income | | | 125 | | | | 110 | | | | 94 | | | | 15 | | | | 13 | |
| |
| Non-interest expense-to-revenue ratio (%) | | | 73.4 | | | | 74.8 | | | | 77.0 | | | | | | | | (1.4 | ) |
| Average net interest margin (%) | | | 3.48 | | | | 3.79 | | | | 3.91 | | | | | | | | (0.31 | ) |
| Average assets | | | 21,055 | | | | 17,895 | | | | 16,046 | | | | 3,160 | | | | 18 | |
| Average deposits | | | 18,646 | | | | 18,446 | | | | 19,193 | | | | 200 | | | | 1 | |
| |
The group’s productivity ratio improved 290 basis points to 60.2%. This progress follows a 110 basis point improvement in 2004, as revenue growth outpaced expense growth in both periods. The productivity improvement was more pronounced in Canada, as the improvement in the U.S. productivity ratio was lessened by the expenses associated with integrating acquired businesses and consolidating bank charters.
| | | |
| BMO Financial Group 188th Annual Report 2005 | | 49 |
Private Client Group
[PHOTO]
Gilles G. Ouellette
President and Chief Executive Officer, Private Client Group, BMO Financial Group and Deputy Chair, BMO Nesbitt Burns
Group Description
Private Client Group (PCG) brings together all of BMO Financial Group’s wealth management businesses. Operating under the BMO brand in Canada and Harris in the United States, PCG serves a full range of North American client segments, from mainstream to ultra-high net worth, as well as select institutional market segments. We offer our clients a broad range of wealth management products and services, including full-service and direct investing, private banking and investment products.
Vision
To be a leader in providing wealth management solutions in select North American markets, helping our clients to accumulate, protect and grow their assets.
Strategies
| § | | Build deep and lasting client relationships by delivering exceptional client service and award-winning offerings. |
| |
| § | | Leverage our leadership positions to accelerate growth in existing Canadian and U.S. markets. |
| |
| § | | Introduce wealth management offerings in select new markets where we have a competitive advantage. |
| |
| § | | Continue to improve the profitability of our businesses. |
Our Lines of Business
Full-Service Investingoffers a comprehensive range of investment and wealth advisory services through BMO Nesbitt Burns. We are focused on delivering highest-quality services and customized advice to our clients.
North American Direct Investingoperates as BMO InvestorLine in Canada and, until its sale in October 2005, operated as Harrisdirectin the United States. We provide a self-guided investment experience for the knowledgeable self-directed investor. Our innovative solutions help our clients through a disciplined approach to investing.
North American Private Bankingoperates as BMO Harris Private Banking in Canada and Harris Private BankTM1in the United States. We offer integrated trust, investment
management, banking and financial planning services to high and ultra-high net worth clients. Using a client-centred advisory approach, we deliver solutions through a complete range of financial products and services.
Investment Productsincludes BMO Mutual Funds, Guardian Group of Funds, Harris Insight Funds®1and BMO Term Investments. We assist retail and commercial clients with investment and retirement planning by providing well-diversified investment products and solutions through multiple distribution channels. Investment Products also provides institutional money management services to external and internal clients through Jones Heward Investment Counsel and Harris Investment Management.
Strengths
| § | | Award-winning product offerings and industry-recognized leadership in client service. |
| |
| § | | Strategic foothold in selected high-growth wealth markets in the United States with physical presence in U.S. markets covering more than 20% of households that have more than one million dollars in investable assets. |
| |
| § | | Access to BMO’s broad client base in Canada and the United States. |
| |
| § | | Prestige, recognition and trust of the BMO, BMO Nesbitt Burns and Guardian brands in Canada and the Harris brand in the United States. |
Challenges
| § | | Sustaining revenue growth in changing economic and political landscapes that affect market conditions and investor confidence levels. |
| |
| § | | Accelerating organic growth and improving profitability in the United States. |
| |
| § | | Driving further enhancements in our operational efficiencies in both Canada and the United States. |
| | | | | | | | | | | | | | | |
| | | |
| | Key Performance Drivers | | 2005 | | | 2004 | | | 2003 | | |
| | | |
| | Increase in assets under management (%) (1) | | | 10.9 | | | | 9.8 | | | | 11.7 | | |
| | Increase in assets under management and administration and term deposits (%) (1) (2) | | | 8.6 | | | | 4.1 | | | | 14.7 | | |
| | Revenue per full-time employee ($ thousands) (3) | | | 417 | | | | 380 | | | | 333 | | |
| | Direct brokerage average daily trades | | | 21,564 | | | | 21,518 | | | | 18,367 | | |
| | | |
| | |
| (1) | | Excludes the impact of changes in the Canadian/U.S. dollar exchange rate. |
| |
| (2) | | Excludes the 2004 exit of sub-custodial assets having minimal revenue and the 2005 impact of the sale of Harrisdirect. |
| |
| (3) | | Excluding $74 million of gains on asset sales in 2005. |
| | | |
| 50 | | BMO Financial Group 188th Annual Report 2005 |
2005 Group Objectives and Achievements
Continue to enhance client offerings and deepen client relationships.
| § | | BMO Nesbitt Burns introduced the Architect Program, a unified managed account program that creates customized portfolios for clients, combining separately managed accounts, mutual funds, exchange-traded funds and alternative investment products into a single account. This program is the first of its kind in Canada. |
| |
| § | | Award-winning leadership in client services: |
| | – | | BMO InvestorLine wasThe Globe and Mail’s choice as best online broker for the fourth consecutive year. |
| |
| | – | | BMO Harris Private Banking was selected Best Private Bank in Canada inEuromoney Magazine’s 2005 Global Survey of private banking services for the second consecutive year. |
| |
| | – | | Harris Private Bank was ranked among the top 10 private banks in the U.S. market inEuromoney Magazine’s 2005 Global Survey. |
Optimize our business model through specific revenue-generating initiatives and ongoing expense management.
| § | | Focused management of non-revenue-based costs resulted in low expense growth of 1% in contrast to strong revenue growth of 10% (6% excluding asset sales). |
| |
| § | | Refined product offerings and streamlined operations, which contributed to net income growth of 41% (26% excluding asset sales). |
| § | | Sold Harrisdirect, allowing BMO to redeploy capital to higher-return businesses. |
| |
| § | | BMO Mutual Funds and Guardian Group of Funds outperformed the mutual fund industry with annual net sales exceeding the industry average. |
| |
| § | | BMO Term Investments introduced the BMO Dividend Fund Linked GIC, the first GIC of its kind offered by a major Canadian bank. |
| |
| § | | BMO Harris Private Banking introduced the enCircle program that offers a range of solutions to mature clients, from bill payments and investment management to estate planning and home health-care education. |
Continue to focus on the effectiveness of our sales force.
| § | | In Canada, maintained momentum of referral activity within PCG and between PCG and our retail partner, Personal and Commercial Client Group (P&C). Referral activity with P&C increased by nearly one-third over last year. |
| |
| § | | In the United States, introduced a successful new referral program that exceeded management’s expectations. |
Improve our cash productivity ratio by at least 150 bps.
| § | | Cash productivity ratio improved by 580 basis points, bringing the three-year improvement in the cash productivity ratio to 1,570 basis points. |
Other Achievements
| § | | The BMO Dividend Fund was named the 2004 Canadian Dividend Fund of the year at the 2005 Canadian Investment Awards. |
| |
| § | | Fullgoal Fund Management Company Ltd. was granted a licence to manage corporate pension plan assets in China. Fullgoal is one of only 29 mutual fund companies and one of only three foreign financial institution joint ventures currently licensed to manage such plans. |
| § | | BMO Nesbitt Burns established two new partnerships with professional service providers to offer complex estate planning and tax advisory services. |
| |
| § | | Guardian Group of Funds has nearly tripled its assets and BMO Mutual Funds has increased its assets by over 54% from 2001, while total industry assets grew 30% over the same period. |
Everyday Priorities for 2006
| § | | Deepen client relationships and enhance our product offerings. |
| |
| § | | Drive revenue growth by expanding our sales force in key businesses and continuing to improve sales force productivity. |
| § | | Accelerate U.S. growth by increasing our share of our existing clients’ investable assets and by leveraging BMO’s U.S. expansion strategy. |
| |
| § | | Continue to improve our cash productivity ratio through revenue growth and expense management initiatives. |
| | | |
| BMO Financial Group 188th Annual Report 2005 | | 51 |
Business Environment and Outlook
Overall, the investment climate in 2005 was favourable, characterized by steady improvement in equity markets over the prior year driven in part by higher oil prices. As a result, client trading activity increased moderately from 2004. The favourable environment also translated into strong growth in managed assets, which increased fee-based revenue for the year. A slight improvement in the interest rate environment produced a moderate increase in the net interest margin on term investments.
The impact of natural disasters and higher energy prices slowed U.S. economic growth in 2005. In 2006, we anticipate healthy GDP growth in Canada and the United States. The Federal Reserve raised interest rates throughout 2005 and the Bank of Canada began raising interest rates later in the year; both are expected to continue raising rates early in 2006. Equity markets are expected to remain solid, which should translate into continued growth in managed asset balances. Long-term trends remain favourable for wealth management services and should result in continued growth.
Private Client Group Financial Results
Private Client Group net income reached a record $320 million, an increase of $93 million or 41% over 2004. Higher earnings were achieved primarily through strong growth in operating revenues along with the effects of ongoing expense management initiatives. Results also benefited from the gain on sale of Harrisdirect, the group’s U.S. direct investing operation, of $49 million ($18 million after tax) and the gain on sale of TSX common shares of $25 million ($16 million after tax). Adjusting for the impact of the foregoing items, net income would have increased $59 million or 26% from the then-record results of 2004.
Revenue grew $185 million or 10% to $2,036 million. Successful revenue-generating initiatives and favourable market conditions drove higher non-interest revenue in full-service investing and the mutual fund businesses. Net interest income increased due in part to improved net interest margin on term investment products, compensating for relatively flat demand. Revenue included $74 million of gains on asset sales, but the weaker U.S. dollar reduced revenue growth by $47 million, particularly in our direct investing and private banking businesses.
Non-interest expense increased $16 million or 1% to $1,520 million. The marginal increase in expenses contrasted favourably with the 11% growth in non-interest revenue (5% growth excluding the gain on asset sales). Expenses in the prior year included $20 million of severance and other business optimization costs. The group’s productivity ratio improved 670 basis points from a year ago, but improved 380 basis points excluding the gain on asset sales. The weaker U.S. dollar reduced expenses by $39 million or 2.6%.
Private Client Group($ millions, except as noted)
| | | | | | | | | | | | | | | | | | | | | |
| Reported | | | | | | | | | | | | | | Change from 2004 | |
| As at or for the year ended October 31 | | 2005 | | | 2004 | | | 2003 | | | $ | | | % | |
| |
| Net interest income (teb) | | | 577 | | | | 533 | | | | 559 | | | | 44 | | | | 9 | |
| Non-interest revenue | | | 1,459 | | | | 1,318 | | | | 1,175 | | | | 141 | | | | 11 | |
| |
| Total revenue (teb) | | | 2,036 | | | | 1,851 | | | | 1,734 | | | | 185 | | | | 10 | |
| Provision for credit losses | | | 4 | | | | 5 | | | | 6 | | | | (1 | ) | | | (14 | ) |
| Non-interest expense | | | 1,520 | | | | 1,504 | | | | 1,510 | | | | 16 | | | | 1 | |
| |
| Income before income taxes | | | 512 | | | | 342 | | | | 218 | | | | 170 | | | | 50 | |
| Income taxes (teb) | | | 192 | | | | 115 | | | | 81 | | | | 77 | | | | 68 | |
| |
| Net income | | | 320 | | | | 227 | | | | 137 | | | | 93 | | | | 41 | |
| |
| | | | | | | | | | | | | | | | | | | | | |
| Amortization of intangible assets (after tax) | | | 37 | | | | 43 | | | | 47 | | | | (6 | ) | | | (13 | ) |
| |
| Cash net income | | | 357 | | | | 270 | | | | 184 | | | | 87 | | | | 32 | |
| |
| Net economic profit | | | 188 | | | | 104 | | | | 4 | | | | 84 | | | | 81 | |
| Return on equity (%) | | | 20.0 | | | | 14.4 | | | | 7.9 | | | | | | | | 5.6 | |
| Cash return on equity (%) | | | 22.4 | | | | 17.2 | | | | 10.7 | | | | | | | | 5.2 | |
| Non-interest expense-to-revenue ratio (%) | | | 74.6 | | | | 81.3 | | | | 87.1 | | | | | | | | (6.7 | ) |
| Cash non-interest expense-to-revenue ratio (%) | | | 72.1 | | | | 77.9 | | | | 82.7 | | | | | | | | (5.8 | ) |
| Average net interest margin (%) | | | 8.19 | | | | 7.46 | | | | 7.97 | | | | | | | | 0.73 | |
| Average common equity | | | 1,582 | | | | 1,557 | | | | 1,689 | | | | 25 | | | | 2 | |
| Average assets | | | 7,061 | | | | 7,145 | | | | 7,015 | | | | (84 | ) | | | (1 | ) |
| Risk-weighted assets | | | 4,326 | | | | 5,518 | | | | 5,691 | | | | (1,192 | ) | | | (22 | ) |
| Average loans and acceptances | | | 4,907 | | | | 4,682 | | | | 4,428 | | | | 225 | | | | 5 | |
| Average deposits | | | 42,666 | | | | 43,003 | | | | 42,429 | | | | (337 | ) | | | (1 | ) |
| Assets under administration | | | 134,093 | | | | 156,650 | | | | 170,255 | | | | (22,557 | ) | | | (14 | ) |
| Assets under management | | | 87,382 | | | | 79,939 | | | | 75,900 | | | | 7,443 | | | | 9 | |
| Full-time equivalent staff | | | 4,645 | | | | 4,757 | | | | 4,968 | | | | (112 | ) | | | (2 | ) |
| |
| | | | | | | | | | | | | | | | | | | | | |
| U.S. Business Select Financial Data (US$ millions) | | | Change from 2004 | |
| For the year ended October 31 | | 2005 | | | 2004 | | | 2003 | | | $ | | | % | |
| |
| Total revenue | | | 448 | | | | 425 | | | | 399 | | | | 23 | | | | 5 | |
| Non-interest expense | | | 417 | | | | 443 | | | | 443 | | | | (26 | ) | | | (6 | ) |
| Net income | | | 10 | | | | (11 | ) | | | (30 | ) | | | 21 | | | | +100 | |
| Cash net income | | | 39 | | | | 20 | | | | 1 | | | | 19 | | | | 95 | |
| Average assets | | | 2,754 | | | | 2,796 | | | | 2,612 | | | | (42 | ) | | | (2 | ) |
| |
All amounts in the paragraphs that follow are stated in U.S. dollars.
Net income from U.S. operations was $10 million, an improvement of $21 million from 2004, including the $15 million after-tax gain on the sale of Harrisdirect. Revenue of $448 million increased $23 million, but declined by $18 million excluding the $41 million gain on sale of Harrisdirect, as lower commission rates in direct investing more than offset fee-based revenue growth in the group’s other U.S. businesses. Non-interest expense decreased $26 million due to lower revenue-based costs and the benefit of ongoing expense management initiatives. The prior year included $10 million of severance and other business optimization costs.
On October 6, 2005, BMO announced the completion of the sale of its U.S. direct investing operation, Harrisdirect, to E*TRADE Financial Corporation. Harrisdirect’s contribution to PCG’s 2005 results included: $209 million of revenue, $200 million of non-interest expense, $4 million of net loss and $23 million of cash net income in fiscal 2005. The foregoing amounts include the $41 million gain and associated $15 million after-tax gain on sale. Included in the gain was a $25 million cost for the estimated reimbursement by Harrisdirectof mutual fund program fees related to our Harris Insight Funds.
| | | |
| 52 | | BMO Financial Group 188th Annual Report 2005 |
Investment Banking Group
[PHOTO]
Yvan J.P. Bourdeau
President and Chief Operating Officer, BMO Nesbitt Burns
Group Description
Investment Banking Group (IBG) combines all of the businesses serving corporate, institutional and government clients. In Canada, operating under the BMO Nesbitt Burns brand, our client base comprises large corporations and institutions across a broad range of industry sectors. In the United States, operating under the Harris Nesbitt brand, we serve corporate and institutional clients in selected sectors. IBG also serves institutional and government clients in the United Kingdom, Europe and Asia.
We offer clients complete financial solutions across the entire balance sheet, including public and private debt and equity underwriting, corporate lending, securitization, cash management, foreign exchange and trade finance. The group also offers leading financial advisory services in mergers and acquisitions and restructurings, while providing investing clients with industry-leading research, sales and trading services.
Vision
To be recognized by clients and shareholders as the best and most disciplined integrated North American investment and corporate bank in our markets.
Strategies
| § | | Continue to reinforce our leading positions in Canada. |
| |
| § | | Accelerate growth in the United States. |
| |
| § | | Continuously improve the profitability of client relationships. |
Our Lines of Business
Investment and Corporate Bankingprovides a full suite of financial products and services to our clients. Services include strategic advice on mergers and acquisitions, restructurings and recapitalizations, as well as providing valuation and fairness opinions. We provide capital-raising services through debt and equity underwriting. We also provide a full range of loan and debt products, balance sheet management solutions and cash management services.
Capital Marketsprovides integrated debt, currency, interest rate, credit and commodity solutions to targeted wholesale, commercial and retail clients. We also provide efficient funding and liquidity management to BMO Financial Group and its clients.
Securitization and Credit Investment Management offers issuers and investors products and services that use credit as a tool for asset management and funding alternatives.
Equity Divisionoffers a comprehensive suite of Canadian equity products globally. These products are delivered through our top-tier research, sales and trading capabilities, and are tailored to our clients’ needs. We continue to maintain and enhance our leadership position in Canada, while selectively expanding our product base in the United States.
TheInternationalline of business provides trade finance and risk mitigation services to North American corporate and commercial clients in support of their international business activities. We also offer a wide range of banking and other operating services to international and domestic financial institutions.
Merchant Bankingoperates through BMO Halyard Partners and BMO Equity Partners. We source, structure and finance private equity investments, primarily in North America.
Strengths
| § | | Well-established franchise with a leadership position in certain industries and products and a reputation for quality advice. |
| |
| § | | Top-tier Canadian equity research, sales and trading capabilities. |
| |
| § | | Largest presence of any Canadian investment and corporate bank in the U.S. Midwest. |
| |
| § | | Cross-border capabilities with the ability to leverage North American expertise. |
Challenges
| § | | Mature Canadian market. |
| |
| § | | Highly competitive U.S. investment banking market. |
| |
| § | | Competitive credit environment. |
| |
| § | | Rising interest rates and flattening yield curve. |
| | | | | | | | | | | | | | | |
| | | |
| | Key Performance Drivers | | 2005 | | | 2004 | | | 2003 | | |
| | | |
| | Equity value block trading ranking | | | #4 | | | | #1 | | | | #1 | | |
| | Equity research ranking (Brendan Wood International) | | | #1 | | | | #1 | | | | #1 | | |
| | Canadian securitization* ranking | | | #1 | | | | #1 | | | | #1 | | |
| | | |
*Asset-backed commercial paper conduit outstandings as at September 30.
| | | |
| BMO Financial Group 188th Annual Report 2005 | | 53 |
2005 Group Objectives and Achievements
Improve client alignment to realize all revenue opportunities.
| § | | Implemented an integrated sector and product coverage model to improve penetration of the U.S. client base. |
Optimize risk-taking to maximize returns.
| § | | Implemented a number of initiatives to align risk management activities. |
| |
| § | | Clearly established our risk parameters and tolerances to align with business growth strategies. |
Drive new product development.
| § | | Implemented a new product approval process to increase speed to market of new product initiatives. |
| |
| § | | Formed a structured equity derivatives group to focus on the creation and marketing of equity derivative products and solutions (including retail equity-linked |
| | | notes) for institutions, corporations and high net worth individuals across North America. |
| |
| § | | Launched eFXpedite, an online foreign exchange trading system that lets customers execute trades over the Internet and access foreign exchange prices in real time. |
Improve our cash productivity ratio by at least 150 bps.
| § | | Our cash productivity ratio deteriorated by 320 basis points due primarily to below-target revenue growth and a shift in revenue mix whereby growth occurred in businesses with higher variable costs. Investment Banking Group’s productivity ratio was ranked second in its Canadian peer group for 2005. |
Other Achievements
| § | | Record net income in 2005. |
| |
| § | | Expanded and upgraded IBG’s U.S. talent through a number of key hires in our mergers and acquisitions, commodity derivatives, and equity research and sales groups in the United States. |
| |
| § | | Ranked Top Overall Equity Research team in Canada in the Brendan Wood International Survey for the 25th consecutive year. |
| § | | Expanded our real estate investment and corporate banking group within Canada. This broadens and deepens our ability to provide a full range of products and services to public and private real estate companies and to major pension funds with real estate portfolios. |
| |
| § | | First and only Canadian bank to be awarded a local currency banking licence in Guangzhou, China. |
Everyday Priorities for 2006
| § | | Continue focus on integrated coverage to bring the best solutions to our clients. |
| |
| § | | Refine sector focus to match product and service capabilities in the United States to high-growth opportunities. |
| § | | Develop U.S. investor strategy to accelerate growth of this business. |
| |
| § | | Improve our cash productivity ratio. |
| |
| § | | Implement high-value initiatives that build on both existing expertise and businesses and new business ideas. |
Business Environment and Outlook
Market conditions were mixed in 2005, characterized by high price volatility in the energy sector, favourable capital markets activity, a weak U.S. dollar, moderate economic growth, rising short-term interest rates primarily in the United States and the resulting flatter yield curve. This contributed to improvements in trading revenues, merger and acquisition activity and securities trading commissions. The less than favourable interest rate environment compressed spreads in our interest-rate-sensitive businesses and the weak U.S. dollar lowered revenues. Commercial and industrial loan demand continued to strengthen in 2005 in both Canada and the United States. The group continued to experience a very competitive environment in the United States, where margins have been under pressure.
Looking forward, further customer consolidation and new trading technologies are expected to continue to put downward pressure on equity trading commissions. We expect that rising short-term interest rates and the resulting flattening of the yield curve will continue to challenge our interest-rate-sensitive businesses, although the rate changes in the United States should be more modest than in 2005. Loan growth is expected to continue to increase after several years of
| | | |
| 54 | | BMO Financial Group 188th Annual Report 2005 |
decline, although pricing will remain competitive, particularly in the United States. Increasing our fee-based and advisory revenues continues to be a focus in 2006 but will depend on the general business climate, inflationary pressure and the impact of record energy prices.
Investment Banking Group Financial Results
Investment Banking Group net income rose $20 million to a record $852 million. Performance in both 2005 and 2004 was affected by significant items. Results in 2005 included a $44 million ($37 million after tax) gain recognized on restructuring VIEs and a $32 million recovery of prior years’ income taxes. Results in 2004 included the $38 million after-tax impact of amounts recovered on a loan that had previously been written off and $44 million ($29 million after tax) of interest expense on the unwinding of hedge contracts associated with fixed income investment securities that were sold. Adjusting for the foregoing items in both periods, net income would have decreased by $40 million. In 2005, net investment securities gains were increased by the $50 million impact of gains recognized on a change in accounting for merchant banking investments and by the group’s $25 million share of the gain on sale of TSX common shares; however, net gains were also high in 2004, and increased by only $4 million to $143 million in 2005.
Revenue in fiscal 2005 declined $27 million or 1% to $2,741 million. The weaker U.S. dollar lowered revenue by $110 million or 4%. Improved non-interest revenues were more than offset by reduced net interest income. Higher non-interest revenue was largely due to the revenue recognized on restructuring VIEs and significantly higher trading revenue. Commodities trading revenue was up appreciably due to high volatility and active markets. Interest rate trading revenues were up strongly and foreign exchange trading revenues also rose, while equity trading revenues declined. Merger and acquisition fees were sharply higher in a strong market and commission revenues also improved. Equity and debt underwriting fees were both down slightly relative to a strong 2004. Net interest income declined due to compressed spreads in our interest-rate-sensitive businesses. This was largely due to the rising short-term interest rate environment, the flatter yield curve, lower spreads on corporate loans and our strategy of reducing non-core assets. Higher funding costs of our increased commodity and equity trading businesses also contributed to the decline in net interest income.
The provision for credit losses was $98 million in fiscal 2005, compared with $138 million in 2004. The reduction was due to lower expected credit losses. Results in 2004 included a $39 million recovery on a loan that was previously written off. BMO generally charges the client operating groups with expected credit losses, as explained on page 57; however, IBG was credited with this recovery in 2004 because the loss on the loan in 2001 was not subject to our expected loss provisioning methodology at the time.
Non-interest expense was $1,477 million, up $72 million or 5%, due primarily to higher performance-based compensation. The group’s fee-based revenues, which typically have relatively higher variable costs, were strong relative to 2004. Revenues in interest-rate-sensitive businesses, which typically have relatively lower variable costs, were down appreciably in 2005. The weaker U.S. dollar reduced expenses by $45 million or 3%.
Investment Banking Group
($ millions, except as noted)
| | | | | | | | | | | | | | | | | | | | | |
| Reported | | | | | | | | | | | | | | Change from 2004 | |
| As at or for the year ended October 31 | | 2005 | | | 2004 | | | 2003 | | | $ | | | % | |
| |
| Net interest income (teb) | | | 965 | | | | 1,260 | | | | 1,344 | | | | (295 | ) | | | (23 | ) |
| Non-interest revenue | | | 1,776 | | | | 1,508 | | | | 1,244 | | | | 268 | | | | 18 | |
| |
| Total revenue (teb) | | | 2,741 | | | | 2,768 | | | | 2,588 | | | | (27 | ) | | | (1 | ) |
| Provision for credit losses | | | 98 | | | | 138 | | | | 231 | | | | (40 | ) | | | (29 | ) |
| Non-interest expense | | | 1,477 | | | | 1,405 | | | | 1,345 | | | | 72 | | | | 5 | |
| |
| Income before income taxes | | | 1,166 | | | | 1,225 | | | | 1,012 | | | | (59 | ) | | | (5 | ) |
| Income taxes (teb) | | | 314 | | | | 393 | | | | 321 | | | | (79 | ) | | | (20 | ) |
| |
| Net income | | | 852 | | | | 832 | | | | 691 | | | | 20 | | | | 3 | |
| |
| | | | | | | | | | | | | | | | | | | | | |
| Amortization of intangible assets (after tax) | | | 2 | | | | 1 | | | | 1 | | | | 1 | | | | 55 | |
| |
| Cash net income | | | 854 | | | | 833 | | | | 692 | | | | 21 | | | | 2 | |
| |
| Net economic profit | | | 417 | | | | 358 | | | | 187 | | | | 59 | | | | 16 | |
| Return on equity (%) | | | 21.0 | | | | 18.6 | | | | 14.6 | | | | | | | | 2.4 | |
| Cash return on equity (%) | | | 21.0 | | | | 18.7 | | | | 14.6 | | | | | | | | 2.3 | |
| Non-interest expense-to-revenue ratio (%) | | | 53.9 | | | | 50.8 | | | | 52.0 | | | | | | | | 3.1 | |
| Cash non-interest expense-to-revenue ratio (%) | | | 53.9 | | | | 50.7 | | | | 52.0 | | | | | | | | 3.2 | |
| Average net interest margin (%) | | | 0.59 | | | | 0.89 | | | | 0.93 | | | | | | | | (0.3 | ) |
| Average common equity | | | 3,967 | | | | 4,382 | | | | 4,637 | | | | (415 | ) | | | (9 | ) |
| Average assets | | | 163,848 | | | | 141,691 | | | | 144,418 | | | | 22,157 | | | | 16 | |
| Risk-weighted assets | | | 57,685 | | | | 50,814 | | | | 50,823 | | | | 6,871 | | | | 14 | |
| Average loans and acceptances | | | 48,349 | | | | 43,454 | | | | 48,225 | | | | 4,895 | | | | 11 | |
| Average deposits | | | 71,883 | | | | 67,369 | | | | 59,136 | | | | 4,514 | | | | 7 | |
| Assets under administration | | | 57,694 | | | | 58,026 | | | | 71,098 | | | | (332 | ) | | | (1 | ) |
| Assets under management | | | 21,871 | | | | 18,761 | | | | 20,013 | | | | 3,110 | | | | 17 | |
| Full-time equivalent staff | | | 2,156 | | | | 2,129 | | | | 2,141 | | | | 27 | | | | 1 | |
| |
| |
| U.S. Business Select Financial Data (US$ millions) | Change from 2004 | |
| For the year ended October 31 | | 2005 | | | 2004 | | | 2003 | | | $ | | | % | |
| |
| Total revenue | | | 1,037 | | | | 977 | | | | 901 | | | | 60 | | | | 6 | |
| Non-interest expense | | | 519 | | | | 518 | | | | 444 | | | | 1 | | | | – | |
| Net income | | | 284 | | | | 251 | | | | 190 | | | | 33 | | | | 13 | |
| Average assets | | | 37,484 | | | | 30,440 | | | | 33,747 | | | | 7,044 | | | | 23 | |
| |
The group’s productivity ratio deteriorated 310 basis points to 53.9%. The aforementioned shift in the business mix favouring businesses with relatively higher variable costs affected the productivity ratio in 2005. Although the group’s productivity ratio deteriorated, it was the second best of its Canadian peer group in 2005.
Net income from U.S. operations represented 41% of the group’s net income in 2005, comparable to 40% in 2004. Our U.S. investment banking operations are primarily directed at mid-market corporations having revenues that range from US$50 million to US$1 billion. Overall revenues and net income of the mid-market banking unit declined from 2004 due to lower spreads in both corporate banking loans and cash management services. Corporate banking assets continue to grow, while deposits have declined in cash management. In 2005, the revenue from our mid-market portfolio represented 16% of total group revenue and 34% of our U.S. revenue. Often, such activities are included in personal and commercial banking units by our North American peers. Pro-forma results, reflecting our U.S.-based mid-market business as part of Personal and Commercial Client Group, are included in that group’s section of the MD&A on page 48.
| | | |
| BMO Financial Group 188th Annual Report 2005 | | 55 |
Corporate Support, including Technology and Solutions
[PHOTO]
Lloyd F. Darlington
President and Chief Executive Officer, Technology and Solutions
Group Description
Technology and Solutions manages, maintains and provides governance over information technology, operations services, real estate and sourcing for BMO Financial Group. We focus on enterprise-wide priorities that improve service quality and efficiency to deliver an excellent customer experience.
Technology and Solutions
Vision
To be a critical contributor in propelling BMO to be the top-performing financial services organization in North America.
2005 Group Objectives and Achievements
Continue to realize improvements in service quality and efficiency in alignment with BMO’s strategy.
| § | | Created a single Product Operations organization by unifying groups from across the enterprise to support all of BMO’s customer-facing lines of business. Product Operations focuses on providing excellent customer service, and has deployed a quality program to improve service and productivity. |
| |
| § | | Supported Harris Bank in consolidating more than 80 different processing systems across 26 bank charters to form one charter, Harris N.A. The result is a more powerful technology infrastructure that streamlines interactions between branches and employees, and provides customers with improved access to service and greater flexibility in product choices. |
| |
| § | | Became the first Canadian organization to be assessed at Level 3 of the Software Engineering Institute’s CMMI software engineering model. This is a testament to our commitment to deliver the highest-quality business solutions in the most efficient and cost-effective manner. |
| |
| § | | Became the first organization in Canada to be awarded BS7799 certification by the British Standards Institution for meeting the highest international standard for operating an information security management system. This accolade recognizes best practices for personnel |
| | | security, physical and environmental security, communications and operations management, business continuity and compliance. |
| |
| § | | Judged “best-in-class” for procurement practices relative to our Canadian financial services peers in an Assessment of Excellence in Procurement benchmarking study conducted by an independent agency. |
| |
| § | | Aggressively reduced BMO’s premises costs by reducing our use of office space by more than 300,000 square feet, in part through the sale and leaseback of BMO’s holdings in Chicago and Calgary. |
| |
| § | | Entered into an agreement with Bell Canada to implement an Internet Protocol Communications network to service our 1,100 branches across Canada. This will enhance our customers’ experience and deliver improved network reliability, scalability and cost efficiencies. |
| |
| § | | Construction of the Barrie Computer Centre on track for occupancy in the summer of 2006. The centre will provide BMO with a highly efficient processing infrastructure that will enhance our contingency capabilities and existing data centre facilities to support BMO customers worldwide. |
| |
| § | | Maintained high levels of service availability and kept operating expenses at 2004 levels despite significant growth in transaction volumes. |
Everyday Priorities for 2006
| • | | Build on our successes by delivering key technology and sourcing initiatives and processing and real estate efficiencies, |
| | | and by continuing to realize improvements in service quality and efficiency in alignment with BMO’s strategy. |
| | | |
| 56 | | BMO Financial Group 188th Annual Report 2005 |
Corporate Support
Group Description
Corporate Support includes the corporate units that provide expertise and governance support to BMO Financial Group in areas such as strategic planning, law, finance, internal audit, risk management, corporate communications, economics, human resources and learning. Our operating results include revenues and expenses associated with certain securitization activities, the hedging of foreign-source earnings, and activities related to the management of certain balance sheet positions and BMO’s overall asset-liability structure.
Operating results for Technology and Solutions (T&S) are included with Corporate Support for reporting purposes. However, costs of T&S services are transferred to the three client operating groups, and only minor amounts are retained in T&S results. As such, results in this section largely reflect Corporate Support activities.
Financial Results
Corporate Support net income for the year was $29 million, compared with $265 million in 2004. The decline was driven by a significantly higher provision for credit losses, as well as reductions in net gains on investment securities and foreign exchange translation. Results in 2005 included a gain of $29 million ($19 million after tax) on the sale of First Canadian Centre in Calgary.
BMO’s practice is to charge loss provisions to the client operating groups each year, using an expected loss provisioning methodology based on each group’s share of expected credit losses over an economic cycle. Corporate Support is generally charged (or credited) with differences between expected loss provisions charged to the client operating groups and provisions
required under GAAP. However, in 2004 IBG was credited with a $39 million recovery on a loan because the loss on the loan in 2001 was not subject to our expected loss provisioning methodology at the time.
Corporate Support, including Technology and Solutions
($ millions, except as noted)
| | | | | | | | | | | | | | | | | | | | | |
| Reported | | | | | | | | | | | | | | Change
from 2004 | |
| As at or for the year ended October 31 | | 2005 | | | 2004 | | | 2003 | | | $ | | | % | |
| |
| Net interest income (teb) | | | (197 | ) | | | (208 | ) | | | (204 | ) | | | 11 | | | | 5 | |
| Non-interest revenue | | | 162 | | | | 200 | | | | 252 | | | | (38 | ) | | | (20 | ) |
| |
| Total revenue (teb) | | | (35 | ) | | | (8 | ) | | | 48 | | | | (27 | ) | | | (+100 | ) |
| Provision for credit losses | | | (222 | ) | | | (545 | ) | | | (80 | ) | | | 323 | | | | 59 | |
| Non-interest expense | | | 188 | | | | 171 | | | | 162 | | | | 17 | | | | 10 | |
| |
| Income before income taxes and non-controlling interest in subsidiaries | | | (1 | ) | | | 366 | | | | (34 | ) | | | (367 | ) | | | (+100 | ) |
| Income taxes (teb) | | | (88 | ) | | | 85 | | | | (91 | ) | | | (173 | ) | | | (+100 | ) |
| Non-controlling interest | | | 58 | | | | 16 | | | | 18 | | | | 42 | | | | +100 | |
| |
| Net income | | | 29 | | | | 265 | | | | 39 | | | | (236 | ) | | | (89 | ) |
| |
| | | | | | | | | | | | | | | | | | | | | |
| Full-time equivalent staff | | | 8,343 | | | | 8,577 | | | | 8,953 | | | | (234 | ) | | | (3 | ) |
| |
| | | | | | | | | | | | | | | | | | | | | |
| U.S. Business Select Financial Data (US$ millions) | | | Change
from 2004 | |
| For the year ended October 31 | | 2005 | | | 2004 | | | 2003 | | | $ | | | % | |
| |
| Total revenue | | | (73 | ) | | | (49 | ) | | | 80 | | | | (24 | ) | | | (49 | ) |
| Provision for (recovery of) credit losses | | | (74 | ) | | | (99 | ) | | | (8 | ) | | | 25 | | | | 25 | |
| Non-interest expense | | | 50 | | | | 46 | | | | 58 | | | | 4 | | | | 9 | |
| Net income | | | (12 | ) | | | (3 | ) | | | 27 | | | | (9 | ) | | | (+100 | ) |
| Average assets | | | 4,800 | | | | 5,458 | | | | 5,856 | | | | (658 | ) | | | (12 | ) |
| |
Financial Condition Review
Summary Balance Sheet($ millions)
| | | | | | | | | | | | | | | | | | | | | |
| As at October 31 | | 2005 | | | 2004 | | | 2003 | | | 2002 | | | 2001 | |
| |
Assets | | | | | | | | | | | | | | | | | | | | |
| Cash resources | | | 20,721 | | | | 18,045 | | | | 19,860 | | | | 19,305 | | | | 17,656 | |
| Securities | | | 57,256 | | | | 50,472 | | | | 54,790 | | | | 43,715 | | | | 37,676 | |
| Net loans and acceptances | | | 174,337 | | | | 156,248 | | | | 146,156 | | | | 149,596 | | | | 144,765 | |
| Other assets | | | 45,218 | | | | 40,429 | | | | 35,688 | | | | 40,248 | | | | 39,312 | |
| |
| | | | 297,532 | | | | 265,194 | | | | 256,494 | | | | 252,864 | | | | 239,409 | |
| |
Liabilities and Shareholders’ Equity | | | | | | | | | | | | | | | | | | | | |
| Deposits | | | 193,793 | | | | 175,190 | | | | 171,551 | | | | 161,838 | | | | 154,290 | |
| Other liabilities | | | 85,804 | | | | 73,270 | | | | 68,455 | | | | 74,188 | | | | 68,613 | |
| Subordinated debt | | | 2,469 | | | | 2,395 | | | | 2,856 | | | | 3,794 | | | | 4,674 | |
| Preferred share liability | | | 450 | | | | 450 | | | | 850 | | | | 850 | | | | 850 | |
| Capital trust securities | | | 1,150 | | | | 1,150 | | | | 1,150 | | | | 1,150 | | | | 1,150 | |
| Shareholders’ equity | | | 13,866 | | | | 12,739 | | | | 11,632 | | | | 11,044 | | | | 9,842 | |
| |
| | | | 297,532 | | | | 265,194 | | | | 256,494 | | | | 252,864 | | | | 239,409 | |
| |
Total assets increased $32.3 billion or 12% from last year to $297.5 billion at October 31, 2005. There was a $6.8 billion increase in securities, an $18.1 billion increase in net loans and acceptances, a $4.8 billion increase in other assets and a $2.7 billion increase in cash resources.
Total liabilities and shareholders’ equity increased $32.3 billion or 12%. There was an $18.6 billion increase in deposits, a $12.5 billion increase in other liabilities and a $1.1 billion increase in shareholders’ equity.
| | | |
| BMO Financial Group 188th Annual Report 2005 | | 57 |
Securities($ millions)
| | | | | | | | | | | | | | | | | | | | | |
| As at October 31 | | 2005 | | | 2004 | | | 2003 | | | 2002 | | | 2001 | |
| |
| Investment securities | | | 12,936 | | | | 15,017 | | | | 19,660 | | | | 21,271 | | | | 21,470 | |
| Trading securities | | | 44,309 | | | | 35,444 | | | | 35,119 | | | | 22,427 | | | | 16,200 | |
| Loan substitute securities | | | 11 | | | | 11 | | | | 11 | | | | 17 | | | | 6 | |
| |
| | | | 57,256 | | | | 50,472 | | | | 54,790 | | | | 43,715 | | | | 37,676 | |
| |
Investment securities decreased $2.1 billion to $12.9 billion due to maturing U.S. government securities that were not replaced in the rising interest rate environment. Trading securities increased $8.9 billion to $44.3 billion due to an increase in corporate debt securities related to growth in our credit derivatives business and an increase in holdings of Government of Canada issued paper. Note 3 on page 97 of the financial statements provides further details on securities.
Net Loans and Acceptances($ millions)
| | | | | | | | | | | | | | | | | | | | | |
| As at October 31 | | 2005 | | | 2004 | | | 2003 | | | 2002 | | | 2001 | |
| |
| Residential mortgages | | | 60,871 | | | | 56,444 | | | | 52,095 | | | | 47,569 | | | | 41,941 | |
| Consumer instalment and other personal loans | | | 27,929 | | | | 24,887 | | | | 22,103 | | | | 21,168 | | | | 19,107 | |
| Credit cards | | | 4,648 | | | | 3,702 | | | | 2,967 | | | | 2,280 | | | | 1,527 | |
| Businesses and governments | | | 47,803 | | | | 44,559 | | | | 44,167 | | | | 49,670 | | | | 53,944 | |
| Acceptances | | | 5,934 | | | | 5,355 | | | | 5,611 | | | | 6,901 | | | | 7,936 | |
| Securities borrowed or purchased under resale agreements | | | 28,280 | | | | 22,609 | | | | 20,998 | | | | 23,957 | | | | 22,259 | |
| |
| Gross loans and acceptances | | | 175,465 | | | | 157,556 | | | | 147,941 | | | | 151,545 | | | | 146,714 | |
| Allowance for credit losses | | | (1,128 | ) | | | (1,308 | ) | | | (1,785 | ) | | | (1,949 | ) | | | (1,949 | ) |
| |
| Net loans and acceptances | | | 174,337 | | | | 156,248 | | | | 146,156 | | | | 149,596 | | | | 144,765 | |
| |
Net loans and acceptances increased $18.1 billion to $174.3 billion. Residential mortgages increased $4.4 billion, reflecting strong market demand in the low interest rate environment. Credit cards and consumer instalment and other personal loans increased $4.0 billion in total, also reflecting healthy personal lending markets. The consumer portfolio remains well diversified, with a slightly higher proportion of U.S. loans than in 2004 due to strong organic loan growth in P&C Chicagoland Banking and the acquisition of Mercantile Bancorp. There was also strong growth in residential mortgages, consumer instalment and credit card loans in Canada in 2005. Loans to businesses and governments and related acceptances increased $3.8 billion, reflecting stronger demand. Securities borrowed or purchased under resale agreements increased $5.7 billion. The increase was due to higher interest rates and a steeper yield curve for these instruments, which are very short-term loans that are managed in conjunction with similarly short-term securities lent or sold under repurchase agreements and securities sold but not yet purchased.
Table 14 on page 86 provides a comparative summary of loans by geographic location and product. Table 16 on page 87 provides a comparative summary of net loans in Canada by province and industry. Loan quality is discussed on pages 40 and 69 and further details on loans are provided in Notes 4, 5 and 7 to the financial statements starting on page 100.
Other Assets
Other assets increased $4.8 billion to $45.2 billion, primarily due to higher values of commodity derivative financial instruments. Higher energy prices caused contract values to rise and the increased volatility promoted greater client activity.
Deposits($ millions)
| | | | | | | | | | | | | | | | | | | | | |
| As at October 31 | | 2005 | | | 2004 | | | 2003 | | | 2002 | | | 2001 | |
| |
| Banks | | | 25,473 | | | | 20,654 | | | | 24,755 | | | | 15,273 | | | | 20,539 | |
| Businesses and governments | | | 92,437 | | | | 79,614 | | | | 72,405 | | | | 71,411 | | | | 66,132 | |
| Individuals | | | 75,883 | | | | 74,922 | | | | 74,391 | | | | 75,154 | | | | 67,619 | |
| |
| | | | 193,793 | | | | 175,190 | | | | 171,551 | | | | 161,838 | | | | 154,290 | |
| |
Deposits increased $18.6 billion to $193.8 billion. Deposits from businesses and governments, which account for 48% of total deposits, increased $12.8 billion and deposits from individuals, which account for 39% of total deposits, increased $1.0 billion. The increase in deposits was used to fund growth in loans and securities. Deposits by banks, which account for 13% of total deposits, increased $4.8 billion. The increase reflects the growth in deposits with other banks due to trading activity. The weakness of the U.S. dollar and other currencies reduced deposit growth by $2.8 billion.
Further details on the composition of deposits are provided in Note 15 on page 114 of the financial statements and in the Liquidity and Funding Risk section on page 72.
| | | |
| 58 | | BMO Financial Group 188th Annual Report 2005 |
Other Liabilities
Other liabilities increased $12.5 billion to $85.8 billion. Derivative-related liabilities increased $4.9 billion due to the same factors that drove the increase in derivative-related assets. Securities lent or sold under repurchase agreements increased $1.3 billion, while there was a $5.7 billion increase in securities sold but not yet purchased. Further details on the composition of other liabilities are provided in Note 16 on page 114 of the financial statements.
Subordinated Debt
Subordinated debt increased $0.1 billion to $2.5 billion. There were three redemptions or maturities and two new
issues in 2005, as detailed in Note 17 on page 115 of the financial statements.
Shareholders’ Equity
Shareholders’ equity increased $1.1 billion to $13.9 billion. The increase was largely related to higher retained earnings.
BMO’s Consolidated Statement of Changes in Shareholders’ Equity on page 94 provides a summary of items that increase or reduce shareholders’ equity, while Note 20 on page 118 of the financial statements provides details on the components of and changes in share capital. Details of our enterprise-wide capital management practices and strategies can be found below.
Enterprise-Wide Capital Management
Strategy and Approach
Our Capital Management Framework is designed to maintain an optimum level of capital in a cost-effective structure that: meets our target regulatory ratios; supports our internal assessments of required capital; results in targeted credit ratings; funds our operating groups’ business strategies; and builds long-term shareholder value. Our approach includes establishing limits, goals and performance measures for management of balance sheet positions, risk levels and minimum capital amounts, as well as issuing and redeeming capital instruments to obtain the most cost-effective capital structure possible. These are approved by the Board of Directors pursuant to its annual review of our capital management corporate policy and capital plan.
At the consolidated enterprise level, our targeted capital levels are set in support of our risk tolerance, while still satisfying regulatory and legal requirements. At the line of business level, performance measurement is assessed relative to allocated capital, which is based primarily on the assessment and measurement of the line’s capital at risk requirements, as outlined on page 68, and regulatory capital requirements. By allocating capital to operating units and measuring their performance with respect to the capital necessary to support the risks in their business, we maximize our risk-adjusted returns. We also ensure that we maintain a well-capitalized position to protect our stakeholders from the risks inherent in our various businesses, while still allowing the flexibility to deploy resources in the high-return or strategic growth activities of our operating groups in order to meet or exceed established enterprise targets.
Generally, BMO generates earnings that are sufficient to meet new capital requirements. As such, management’s primary challenge is achieving the most cost-effective capital structure, rather than procuring sufficient capital to fund expansion initiatives.
Dividends are generally increased in line with long-term trends in earnings per share growth, while sufficient earnings are retained to support anticipated business growth, fund strategic investments and provide continued support for depositors. BMO’s policy is to have a dividend payout ratio of 35% to 45% of net income available to common shareholders, over time.
TheTier 1 Capital Ratiois our key measure of capital adequacy. It is defined as Tier 1 capital divided by risk-weighted assets.
Performance Review
The Tier 1 Capital Ratio rose to 10.25% from 9.81% a year ago. Tier 1 capital, representing more permanent forms of capital, increased $2.0 billion during the year to $15.5 billion, as outlined in the table on page 60. Net income, the BMO BOaTS®Series E issuance and a lower deduction for goodwill following the sale of Harrisdirectwere the primary drivers of the increase. At year-end, we had $3.4 billion of excess Tier 1 capital relative to our minimum targeted Tier 1 Capital Ratio of 8.0%, an increase of $0.9 billion from a year ago. The components of regulatory capital and the measures we monitor are outlined in Tables 23 and 24 on page 90.
Our Total Capital Ratio, which is defined as total regulatory capital divided by risk-weighted assets, rose to 11.76% from 11.31% a year ago. The increase was driven by net income, the BMO BOaTS Series E and subordinated debt issuances and a lower deduction for goodwill following the sale of Harrisdirect, partially offset by redemptions of subordinated debt during the year. Both our Tier 1 and Total Capital Ratios remain well above the minimum regulatory targets of 7% and 10%, respectively.
Risk-weighted assets increased $13.5 billion to $151 billion, due primarily to strong personal and commercial mortgage and loan growth in Personal and Commercial Client Group in both Canada and the United States, including the impact of the Mercantile Bancorp, Inc. acquisition, and loan and commitment growth in Investment Banking Group. In 2006, we anticipate continuing controlled growth in risk-weighted assets and deployment of capital to strategically advantaged businesses.
The assets-to-capital multiple is calculated by dividing total assets, including specified off-balance sheet items net of other specified deductions, by total regulatory capital. BMO’s assets-to-capital multiple improved to 16.4 from 17.0 in 2004, due primarily to growth in capital. The multiple remains well below the maximum of 23.0 permitted by our regulator.
| | | |
| BMO Financial Group 188th Annual Report 2005 | | 59 |
On November 1, 2004, we commenced consolidating certain VIEs as a result of new accounting rules issued by the CICA. On April 29, 2005, we completed the restructuring of the VIEs and approximately $21 billion of assets and liabilities relating to VIEs were no longer included in BMO’s balance sheet as of that date. The consolidation had no impact on our Tier 1 and Total Capital Ratios as the Office of the Superintendent of Financial Institutions Canada (OSFI), on an interim basis, had permitted the exclusion of VIE assets from the determination of these capital ratios. The consolidation contributed to an increase in our assets-to-capital multiple in the first quarter of the year.
As part of our efforts to maintain an appropriate capital structure, we issued $450 million of Trust Capital Securities, Series E (BOaTS), and a total of $1 billion of Series C Medium-Term Notes, Tranches 1 and 2. We redeemed our $300 million Series B Medium-Term Notes as well as our $250 million Debentures, Series 18, and our US$300 million 6.10% Notes matured during the year.
Dividends declared per common share in 2005 totalled $1.85, up from $1.59 in 2004. This represented a 39% payout ratio, which was in the middle of our longer-range goal of paying out between 35% and 45%. BMO increased its quarterly dividend twice during the year, as the quarterly dividend rose to $0.49 per share in the fourth quarter, up 11.4% from $0.44 in the fourth quarter of 2004. At year-end, BMO’s common shares provided a 3.39% annual dividend yield based on the closing share price.
On September 1, 2005, BMO announced a new normal course issuer bid, commencing September 7, 2005 and ending September 5, 2006, under which BMO may repurchase for cancellation up to 15 million common shares. Under our previous 12-month normal course issuer bid, which expired on August 6, 2005, 7,520,900 shares were repurchased at a total cost of $417.5 million. In 2005, BMO repurchased a total of 6,958,000 shares under our common share repurchase programs at a cost of $390 million. The repurchases offset the 6,280,000 shares that were issued during 2005 due to the exercise of stock options, exchangeable shares and the dividend reinvestment plan.
BMO’s credit rating, as measured by Standard & Poor’s (S&P) senior debt ratings, remained unchanged at AA–, the highest, along with two of our competitors, of the six major Canadian banks. Our rating, as measured by Moody’s senior debt ratings, was unchanged at Aa3, slightly below only one of the six major Canadian banks. Both agencies maintained a stable ratings outlook during the year. These ratings represent a high-grade, high-quality rating.
As described on page 68 in the Enterprise-Wide Risk Management section of the MD&A, the Basel II framework has been finalized. In parallel with the process of developing the risk management models and systems to calculate regulatory capital, we will review our process for assessing overall capital adequacy in relation to our risk profile. This assessment will be subject to review by our regulator, OSFI.
Tier 1 Capital($ millions)
| | | | | | | | | |
| | | 2005 | | | 2004 | |
| |
| Beginning of year | | | 13,471 | | | | 12,337 | |
| Net income | | | 2,400 | | | | 2,306 | |
| Dividends | | | (955 | ) | | | (828 | ) |
| Goodwill and excess intangible assets | | | 416 | | | | (173 | ) |
| Issuance of common shares | | | 219 | | | | 242 | |
| Repurchase of common shares | | | (390 | ) | | | (333 | ) |
| Other issues net of redemptions | | | 447 | | | | 195 | |
| Translation and other | | | (154 | ) | | | (275 | ) |
| |
| End of year | | | 15,454 | | | | 13,471 | |
| |
Risk-Weighted Assets($ millions)
| | | | | | | | | |
| | | 2005 | | | 2004 | |
| |
| Beginning of year | | | 137,323 | | | | 129,163 | |
| Increases (decreases) | | | | | | | | |
| Personal and Commercial Client Group | | | 8,170 | | | | 5,832 | |
| Private Client Group | | | (1,192 | ) | | | (173 | ) |
| Investment Banking Group | | | 6,871 | | | | (9 | ) |
| Corporate Support | | | (353 | ) | | | 2,510 | |
| |
| End of year | | | 150,819 | | | | 137,323 | |
| |
Outstanding Shares and Securities Convertible into Common Shares
| | | | | | | | | | | | | | | | | |
| | | Number of shares | | | Dividends declared per share | |
| As of November 29, 2005 | | or dollar amount | | | 2005 | | | 2004 | | | 2003 | |
| |
Common shares | | | 500,119,000 | | | $ | 1.85 | | | $ | 1.59 | | | $ | 1.34 | |
Class B Preferred Shares | | | | | | | | | | | | | | | | |
| Series 5 | | $ | 200,000,000 | | | $ | 1.33 | | | $ | 1.33 | | | $ | 1.33 | |
Convertible into common shares: | | | | | | | | | | | | | | | | |
Class B Preferred Shares (1) | | | | | | | | | | | | | | | | |
| Series 4 | | $ | 200,000,000 | | | $ | 1.20 | | | $ | 1.20 | | | $ | 1.20 | |
| Series 6 | | $ | 250,000,000 | | | $ | 1.19 | | | $ | 1.19 | | | $ | 1.19 | |
| Series 10 | | US$ | 300,000,000 | | | US$ | 1.49 | | | US$ | 1.49 | | | US$ | 1.49 | |
Stock options | | | | | | | | | | | | | | | | |
| – vested | | | 21,365,000 | | | | | | | | | | | | | |
| – non-vested | | | 5,289,000 | | | | | | | | | | | | | |
| |
| | |
| (1) | | Convertible preferred shares may be exchanged for common shares in future years on a pro-rata basis based on 95% of the average trading price of common shares for 20 days ending four days prior to the exchange date. |
Note 20 on page 118 of the financial statements includes details on share capital.
| | | |
| 60 | | BMO Financial Group 188th Annual Report 2005 |
Off-Balance Sheet Arrangements
BMO enters into a number of off-balance sheet arrangements in the normal course of operations. The discussion that follows addresses the more significant types of off-balance sheet arrangements.
Credit Instruments
In order to meet the financing needs of our clients, we use a variety of off-balance sheet credit instruments. These include guarantees and standby letters of credit, which represent our obligation to make payments to third parties on behalf of a customer if the customer is unable to make the required payment or meet other contractual requirements. We also engage in securities lending where we lend either our securities or our customers’ securities to third parties. This exposes us to credit risk, as a third party may not return the securities as agreed. We also write documentary and commercial letters of credit, which represent our agreement to honour drafts presented by a third party upon completion of specified activities. Commitments to extend credit are off-balance sheet arrangements that represent our commitment to customers to grant them credit in the form of loans or other financings for specific amounts and maturities, subject to meeting certain conditions.
There are a significant number of instruments outstanding at any time. Our customers are broadly diversified and we do not anticipate events or conditions that would lead a significant number of our customers to fail to perform in accordance with the terms of the contracts. We use our credit adjudication process in deciding whether to enter into these agreements, just as we do when extending credit in the form of a loan. We monitor off-balance sheet instruments to ensure that there are no undue concentrations in any geographic region or industry.
The maximum amount payable by BMO in relation to these instruments was approximately $110 billion at October 31, 2005 ($100 billion at October 31, 2004). However, this amount is not representative of our likely credit exposure or liquidity requirements for these instruments as it does not take into account any amounts that could possibly be recovered under recourse or collateralization provisions. In addition, a large majority of these commitments expire without being drawn upon. Further information on these instruments can be found in Note 5 on page 102 of the financial statements.
Derivatives
Derivative financial instruments are contracts that require the exchange of, or provide the opportunity to exchange, cash flows determined by applying certain rates, indices or changes therein to notional contract amounts.
We structure and market derivative products to customers to enable them to transfer, modify or reduce current or expected risks. We may also take proprietary trading positions in various capital markets instruments and derivatives that, taken together, are designed to profit from anticipated changes in market factors. We also use derivatives as hedges of our own positions.
We enter into derivatives contracts with many different counterparties. Note 9 on page 111 of the financial statements details the classification of our counterparties by industry for each category of derivative contract. The geographic locations in which our counterparties operate are detailed on page 110 of the financial statements.
The amount that we are required to pay, if any, under a derivative contract depends on the nature of the derivative. For instance, if we enter into an interest rate swap that requires us to pay a fixed interest rate and the counterparty to pay a floating interest rate, the amount that we would be required to pay would depend on the difference between the fixed and floating rates. If the floating rate is higher than the fixed rate, the counterparty would be required to pay us the difference between the floating and fixed rates applied to the notional amount of the swap. However, if the fixed rate exceeds the floating rate, we would be required to pay the counterparty the difference.
In most cases, we act as an intermediary. As a result, for each derivative liability we usually have an offsetting derivative asset. Therefore, at any point in time, our net derivative assets together with associated capital markets instruments are not significant.
Trading derivatives are fully recognized on our Consolidated Balance Sheet at their fair values. These trading derivatives represent over 97% of our total outstanding derivatives, based on notional amounts.
Only our interest rate hedging derivatives represent off-balance sheet items, since these derivatives are not recorded at fair value on our Consolidated Balance Sheet. We follow accrual accounting for these derivatives, since they are expected to be highly effective in hedging certain risks associated with on-balance sheet financial instruments or future cash flows. Any ineffectiveness in a hedging derivative is recognized in income over the term of the derivative contract. The fair value of our hedging derivatives was an asset of $316 million and a liability of $160 million at October 31, 2005 ($867 million and $462 million at October 31, 2004).
In the event we terminated any of our trading or hedging derivatives contracts, we would be required to settle with the respective derivative counterparty at the current fair value of the derivative.
Variable Interest Entities (VIEs)
Customer Securitization Vehicles
Customer securitization vehicles (referred to as multi-seller conduits) assist our customers with the securitization of their assets to provide them with alternate sources of funding. These vehicles provide clients with access to liquidity in the commercial paper markets by allowing them to sell their assets into these vehicles, which then issue commercial paper to investors to fund the vehicles’ purchases of the assets. The customers continue to service the transferred assets and are first to absorb any losses on the assets. We earn fees for providing structuring advice related to the securitizations, as well as liquidity, distribution and administrative fees for supporting the ongoing operations of the vehicles. For the years ended October 31, 2005 and 2004, these fees totalled approximately $84 million and $96 million, respectively.
In general, investors in the commercial paper have recourse only to the assets of the related VIE, unless BMO has provided credit support for the investors or entered into a derivative transaction involving the VIE. We provide liquidity and credit
| | | |
| BMO Financial Group 188th Annual Report 2005 | | 61 |
support to these vehicles either through backstop liquidity facilities or in the form of letters of credit and other guarantees. The total contractual amount of this support was $28,125 million as at October 31, 2005, of which only $567 million related to credit support ($27,019 million and $400 million, respectively, at October 31, 2004). None of these facilities were drawn upon at year-end.
BMO sometimes enters into derivatives contracts with these vehicles to enable them to manage their exposures to interest rate and foreign exchange rate fluctuations. The fair value of such contracts at October 31, 2005 was $6 million, which was recorded as a derivative asset in our Consolidated Balance Sheet ($52 million at October 31, 2004).
In the event we chose to or were required to terminate our relationship with a customer securitization vehicle, we would be obligated to hold any derivatives until their maturity. We would no longer receive structuring fees and might no longer receive liquidity, distribution and administrative fees.
Interests in Bank Securitization Vehicles
Periodically, we sell loans to off-balance sheet entities or trusts, either for capital management purposes or to obtain alternate sources of funding. Gains on sales to the securitization vehicles as well as revenues paid to us for servicing the loans sold are recognized in income. The impact of securitization activities on our revenues and expenses is outlined in Note 7 on page 104 of the financial statements.
BMO has retained interests in these off-balance sheet entities, as we are sometimes required to purchase subordinated interests or maintain cash deposits in the entities to provide credit support for the vehicle. Retained interests recorded as assets in our Consolidated Balance Sheet as at October 31, 2005 and 2004 were $39 million. In the event that there are defaults in the assets held by the vehicles, retained interests may not be recoverable and would then be written down. During the year ended October 31, 2005, we wrote down retained interests in securitization vehicles by a total of $3 million ($19 million in 2004).
In addition to retained interests at October 31, 2005 and 2004, BMO has recorded $216 million and $143 million, respectively, of deferred purchase price amounts related to securitizations in our Consolidated Balance Sheet. This represents the amount of gain on sales to securitization vehicles that has not been received in cash. Further information on the impact of securitization activities on the Consolidated Balance Sheet is outlined in Note 7 on page 104 of the financial statements.
We provide further liquidity to our securitization vehicles in the form of standby letters of credit and guarantees for up to 100% of the asset value transferred. The contractual amount of standby letters of credit and guarantees to VIEs at October 31, 2005 and 2004 was $5,000 million and $3,750 million, respectively. This amount comprised part of other credit instruments outlined in Note 5 on page 102 of the financial statements. No amounts were drawn upon at year-end.
In the event we chose to terminate our relationship with a bank securitization vehicle, we would be required to settle any associated derivatives at their fair value. Any deferred purchase price recorded on the balance sheet would continue to be collected from the trust over time; however, no additional loans would be sold to the trust.
Credit Investment Management Vehicles
Credit investment management vehicles provide investors with investment opportunities in customized, diversified debt portfolios in a variety of asset and rating classes. We earned investment management fees of $31 million in 2005 and 2004 for managing these portfolios.
We hold an interest in High Grade Structured Investment Vehicles (SIVs). Our exposure to loss relates to both our investments to sponsor these vehicles and to derivative contracts we have entered into with the vehicles. Our investment in SIVs was $146 million as at October 31, 2005 ($128 million at October 31, 2004) and was recorded as investment securities in our Consolidated Balance Sheet. The fair value of our derivative contracts outstanding with the SIVs as at October 31, 2005 was recorded in our Consolidated Balance Sheet as a derivative liability of $24 million ($37 million derivative asset at October 31, 2004). In order to ensure that these vehicles receive an investment grade rating, we provide liquidity support to the vehicles through standby letters of credit and/or commitments to extend credit. The total contractual amount of these standby letters of credit and commitments to extend credit as at October 31, 2005 and 2004 was $189 million and $200 million, respectively. This amount comprised part of other credit instruments outlined in Note 5 on page 102 of the financial statements. No amounts were drawn upon at year-end.
In the event we chose to terminate our relationship with a vehicle, outstanding derivatives would be settled at their fair value and we would no longer receive administrative fees from the vehicle. We would also sell our investment in the SIV at fair value, which might differ from its carrying value.
Financial Instruments
As a financial institution, most of BMO’s balance sheet is comprised of financial instruments and the majority of our net income results from gains, losses, income and expenses related to financial instruments. As a result, this MD&A is largely concerned with how we use financial instruments to earn income and manage risks.
Our use of financial instruments exposes us to credit and counterparty risk and various market risks, including equity price risk, interest rate risk and foreign currency risk.
A discussion of how we manage these and other risks as well as structural interest rate sensitivities can be found in the Enterprise-Wide Risk Management section on pages 67 to 74 of this MD&A.
Further information on how we determine the fair value of financial instruments is included in the Financial Instruments Measured at Fair Value discussion in the Critical Accounting Estimates section of the MD&A that follows.
| | | |
| 62 | | BMO Financial Group 188th Annual Report 2005 |
Critical Accounting Estimates
The Notes to BMO’s October 31, 2005 consolidated financial statements outline our significant accounting estimates. The accounting estimates discussed below are considered particularly important, as they require significant judgments by management. Management has established detailed policies and control procedures that are intended to ensure these judgments are well controlled, independently reviewed and consistently applied from period to period. We believe that our estimates for determining the valuation of BMO’s assets and liabilities are appropriate.
Allowance for Credit Losses
The allowance for credit losses adjusts the value of credit assets to reflect their estimated realizable value. In assessing their estimated realizable value, we must rely on estimates and exercise judgment regarding matters for which the ultimate outcome is unknown. These include economic factors, developments affecting companies in particular industries and specific issues with respect to single borrowers. Changes in circumstances may cause future assessments of credit risk to be materially different from current assessments, which could require an increase or decrease in the allowance for credit losses.
One of our key performance measures is the provision for credit losses as a percentage of average net loans and acceptances (including securities borrowed or purchased under resale agreements). Over the past 10 years, the ratio has ranged from a high of 0.66% in 2001 to a low of (0.07%) in 2004. This ratio varies with changes in the economy and credit conditions. If we applied these high and low ratios to average net loans and acceptances (including securities borrowed or purchased under resale agreements) in 2005, our provision for credit losses would range from a provision of $1,119 million to a net recovery of $119 million. Our provision for credit losses in 2005 was $179 million.
Additional information on the process and methodology for determining the allowance for credit losses can be found in the discussion of credit risk on page 69 as well as in Note 4 on page 100 of the financial statements.
Financial Instruments Measured at Fair Value
BMO records trading securities as well as trading derivatives at their fair value. Fair value represents our estimate of the proceeds we would receive, or would have to pay in the case of a derivative liability, in a current transaction between willing parties.
The extent of our use of quoted market prices and internal models in the valuation of trading securities, derivative assets and derivative liabilities at October 31, 2005 was as follows:
| | | | | | | | | | | | | | |
| | | | | | | | Derivative financial | |
| | | | Trading | | | instruments | |
| | | | securities | | | Asset | | | Liability | |
| | |
| | Valued using quoted market prices | | | 99 | % | | | 11 | % | | | 13 | % |
| | Valued using internal models* | | | 1 | | | | 89 | | | | 87 | |
| | |
| | Total | | | 100 | % | | | 100 | % | | | 100 | % |
| | |
*Almost all models are based on observable market data.
The fair values of most trading securities and exchange-traded derivatives are determined from quoted market prices. Most over-the-counter derivatives are valued using models that utilize observable market data. For example, the fair value of interest rate swaps is determined using yield curves developed from observable market interest rates.
Valuation models use general assumptions and market data and therefore do not reflect the specific risks and other factors that would affect a particular instrument’s fair value. As a result, we incorporate certain adjustments when using internal models to establish fair values. These fair value adjustments take into account the estimated impact of credit risk, liquidity risk, valuation considerations, administrative costs and closeout costs. For example, the credit risk adjustment incorporates credit risk into our determination of fair values by taking into account factors such as the counterparty’s credit rating, the duration of the instrument and changes in credit spreads. A group independent of the trading lines of business, Valuation Product Control (VPC), verifies the fair values at which instruments are recorded. For instruments that are valued using models, VPC identifies situations where adjustments must be made to the model estimates to arrive at fair value.
The methodologies used for calculating these adjustments are reviewed at least annually to ensure that they remain appropriate. Significant changes in methodologies are rare and are made only when we feel that the change will result in better estimates of fair value.
Valuation Adjustments
| | | | | | | | | |
| As at October 31 ($ millions) | | 2005 | | | 2004 | |
| |
| Credit risk | | | 63 | | | | 39 | |
| Liquidity risk | | | 19 | | | | 11 | |
| Administrative costs | | | 17 | | | | 17 | |
| Other | | | 5 | | | | 10 | |
| |
| | | | 104 | | | | 77 | |
| |
There were no significant changes in methodologies for calculating the fair value adjustments during 2005 and 2004. The increase in the adjustment for credit risk was due to the 26% increase in the fair value of derivative assets relative to 2004 as well as increased credit spreads. The increase in the adjustment for liquidity risk was due primarily to some unusually long-dated instruments.
Additional information concerning our method of determining fair value is included in Note 3 on page 97, Note 9 on page 106 and Note 29 on page 130 of the financial statements.
Accounting for Securitizations
When loans are securitized, we record a gain or loss on sale. In determining the gain or loss, management must estimate the net present value of expected future cash flows by relying on estimates of the amount of interest and fees that will be collected on the securitized assets, the yield to be paid to investors, the portion of the securitized assets that will be repaid before their scheduled maturity, expected credit losses, the fair value cost of servicing, and the rate at which to discount these
| | | |
| BMO Financial Group 188th Annual Report 2005 | | 63 |
estimated future cash flows. Actual cash flows may differ significantly from those estimated by management. If management’s estimate of future cash flows were different, our gains on securitization recognized in income would also be different. The rate used to discount expected future cash flows is the estimate that most affects the gain on securitization. A 10% decrease in interest rates would have resulted in a decrease of less than $14 million in the amount of the deferred purchase price recorded in our Consolidated Balance Sheet.
Additional information concerning accounting for securitizations, including sensitivity analysis for key assumptions, is included in Note 7 on page 103 of the financial statements.
Pensions and Other Employee Future Benefits
BMO’s pensions and other employee future benefits expense is calculated by our actuaries using assumptions determined by management. If actual experience differs from the assumptions used, pension and other employee future benefits expense could increase or decrease in future years. The expected rate of return on plan assets is the management estimate that most affects the calculation of pension expense. Our expected rate of return on plan assets is determined using the plan’s target asset allocation and estimated rates of return for each asset class. Estimated rates of return are based on expected returns from fixed income securities, which take into consideration bond yields. An equity risk premium is then applied to estimate expected equity returns. Expected returns from other asset classes are established to reflect the risks of these asset classes relative to fixed income and equity assets. With all other assumptions held constant, a 1 percentage point decline in the expected rate of return on plan assets would result in an increase in pension expense for 2005 of approximately $33 million. The impact of changes in expected rates of return on plan assets is not significant for our other employee future benefits expense since there is only a small amount of assets held in these plans.
Pension and other employee future benefits expense and obligations are also sensitive to changes in discount rates. For our Canadian plans, which represent 80% of BMO’s pension obligations, we determine a discount rate at each year-end using market rates applicable to high-quality debt instruments with cash flows that match the timing and amount of expected benefit payments.
Additional information regarding our accounting for pensions and other employee future benefits, including sensitivity analysis for key assumptions, is included in Note 22 on page 121 of the financial statements.
Other Than Temporary Impairment
Investment securities that are carried at cost or amortized cost or accounted for using the equity method are reviewed at each quarter-end reporting period to determine whether the fair value is below the current carrying value. When the fair value of any of our investment securities has declined below its carrying value, management is required to assess whether the decline is other than temporary. In making this assessment, we consider such factors as the type of investment, the length of time and extent
to which the fair value has been below the carrying value, the financial condition and near-term prospects of the issuer, and our intent and ability to hold the investment long enough to allow for any anticipated recovery. The decision to record a write-down, its amount and the period in which it is recorded could change if management’s assessment of those factors were different. We do not record impairment write-downs on debt securities when impairment is due to changes in interest rates, since we expect to realize the full value of the investments by holding them to maturity. Most of BMO’s investment securities are issued or guaranteed by Canadian or U.S. governments. At the end of 2005, there were total unrealized losses of $37 million on government securities for which the carrying value of the investment exceeded fair value. Of this amount, $7 million related to securities for which the carrying value had exceeded fair value for 12 months or more. In most cases, these unrealized losses resulted from increases in interest rates, not from deterioration in the creditworthiness of the issuer.
We also have investments in corporate debt and equity securities, mortgage-backed securities and collateralized mortgage obligations. Quoted market value is considered to be fair value for actively traded securities. For securities where market quotes are not available, we use estimation techniques to determine fair value. These techniques include discounted cash flows for debt securities and, for equity securities, multiples of earnings or comparisons with other securities with similar characteristics. At the end of 2005, there were total unrealized losses of $18 million on corporate debt and equity securities, mortgage-backed securities and collateralized mortgage obligations for which the carrying value exceeded fair value and an impairment write-down had not been recorded. Of this amount, $1 million related to securities for which the carrying value had exceeded fair value for 12 months or more.
Additional information regarding our accounting for investment securities is included in Note 3 on page 97 of the financial statements.
Customer Loyalty Program
We record the liability related to our credit card customer loyalty program when our customers become entitled to redeem the rewards. In determining the liability, we estimate the expected future redemption rate and apply the cost of expected redemptions. Our estimate of the expected redemption rate is based on a statistical analysis of past customer behaviour. Changes in actual future redemption rates may cause future assessments of the liability to be different from the current assessment, resulting in an increase or decrease in the liability. Changes in redemption rates can result from factors such as shifts in customer behaviour, types of rewards offered and general economic conditions. If our estimate of the future redemption rate increased by 5 percentage points, the annual impact on our card fee revenue would be a decrease of approximately $10 million.
Additional information regarding our accounting for our customer loyalty program is included in Note 16 on page 115 of the financial statements.
| | | |
| 64 | | BMO Financial Group 188th Annual Report 2005 |
Income Taxes
The provision for income taxes is calculated based on the expected tax treatment of transactions recorded in our Consolidated Statements of Income or Changes in Shareholders’ Equity. In determining the provision for income taxes, we interpret tax legislation in a variety of jurisdictions and make assumptions about the expected timing of the reversal of future tax assets and liabilities. If our interpretations differ from those of tax authorities or if the timing of reversals is not as anticipated, our provision for income taxes could increase or decrease in future periods. The amount of any such increase or decrease cannot be reasonably estimated.
Additional information regarding our accounting for income taxes is included in Note 23 on page 124 of the financial statements.
Goodwill
Goodwill is assessed for impairment at least annually. This assessment includes a comparison of the carrying value and
fair value of each group of businesses having goodwill to ensure that the fair value of the group is greater than its carrying value. If the carrying value exceeds the fair value of the group, a more detailed goodwill impairment assessment would have to be undertaken. In determining fair value, we use valuation models such as analysis of discounted cash flows, price-to-earnings ratios and other multiples. Management must exercise judgment and make assumptions in determining fair value, and different judgments and assumptions could affect the determination of fair value and any resulting impairment write-down. At October 31, 2005, the estimated fair value of each of our groups of businesses was greater than the carrying value and the fair value estimate for any of our groups of businesses would have to decline by more than 20% before a detailed impairment assessment would be triggered.
Additional information regarding the composition of BMO’s goodwill is included in Note 13 on page 113 of the financial statements.
Changes in Accounting Policies in 2005
Variable Interest Entities
We adopted the Canadian Institute of Chartered Accountants’ (CICA’s) guideline on the consolidation of variable interest entities (VIEs) on November 1, 2004. VIEs include entities where the equity invested is considered insufficient to finance the entity’s activities. Under this guideline, we consolidate VIEs if the investments we hold in these entities or the relationships we have with them result in us being exposed to a majority of their expected losses or being able to benefit from a majority of their expected residual returns, based on a calculation outlined by the standard setters.
Under the new rules, we consolidated our customer securitization vehicles from November 1, 2004 to April 29, 2005. These VIEs are set up to assist our customers with the securitization of their assets in order to provide them with an alternate source of funding. As at April 29, 2005, we restructured our interest in the VIEs and were no longer required to consolidate the VIEs. The impact of consolidating the VIEs was a $37 million increase in net income, representing the reversal of the unamortized mark-to-market losses on hedging derivatives held by the VIEs. Additional information on these VIEs can be found in Note 8 on page 105 of the financial statements.
Liabilities and Equity
We adopted the CICA’s new accounting requirements on the classification of financial instruments as liabilities or equity on November 1, 2004. The new rules require that preferred shares and capital trust securities that are ultimately convertible into a variable number of common shares at the holders’ option be classified as liabilities. Under the new rules, $1,150 million of our capital trust securities were reclassified from non-controlling interest in subsidiaries to debt in our Consolidated Balance Sheet. The return paid to capital trust securities holders is recorded as interest expense rather than as non-controlling interest in subsidiaries in our Consolidated Statement of Income. Under the new rules, we also reclassified $450 million of our Class B Preferred shares, Series 4 and 6, as debt. As a result, dividends on these shares are recorded as interest expense. Prior periods were restated to reflect the change in classification. Our regulator, OSFI, continues to consider all of our reclassified instruments to be Tier 1 capital. Additional information regarding the accounting change is included in Note 20 on page 119 of the financial statements.
Merchant Banking Investments
We adopted the CICA’s new accounting requirements for merchant banking subsidiaries on November 1, 2004. These subsidiaries now account for their investments at fair value, with changes in fair value recorded in net income. Previously, they accounted for their investments at cost. The change in accounting increased investment securities gains by $50 million in our Consolidated Statement of Income, including the initial adjustment to fair value upon adoption. Prior periods were not restated. Additional information regarding the accounting change is included in Note 3 on page 98 of the financial statements.
| | | |
| BMO Financial Group 188th Annual Report 2005 | | 65 |
Future Changes in Accounting Policies
Financial Instruments and Comprehensive Income
The CICA has issued new accounting rules on financial instruments, hedges and comprehensive income that will require BMO to account for most of our investment securities and all of our derivative financial instruments at fair value. When we adopt the new rules on November 1, 2006, we will remeasure certain investment securities and certain derivative financial instruments at fair value, and report a new section of shareholders’ equity called comprehensive income. The impact of recording these assets and liabilities at fair value will be recognized in opening equity and results for prior periods will not be restated. We cannot currently determine the impact that these rules will have on our consolidated financial statements, as this will be dependent on the fair values of those financial instruments in the future.
Earnings per Share
The CICA has issued new rules that will require BMO to include the potential conversion of certain of our preferred shares and capital trust securities to common shares in the calculation of diluted earnings per share. The effective date has not been finalized; however, we expect to adopt these new rules in the year ended October 31, 2006. Diluted earnings per share of prior periods will be restated upon adoption. Under the new standard, our diluted earnings per share for the years ended October 31, 2005, 2004 and 2003 would be reduced by approximately $0.06, $0.09 and $0.11, respectively.
Disclosure Controls and Procedures and Internal Controls over Financial Reporting
Disclosure controls and procedures are designed to provide reasonable assurance that all relevant information is gathered and reported to senior management, including the CEO and CFO, on a timely basis so that appropriate decisions can be made regarding public disclosure.
An evaluation of the effectiveness of the design and operation of our disclosure controls and procedures was conducted as of October 31, 2005, by and under the supervision of Bank of Montreal’s management, including the CEO and CFO. Based on this evaluation, the CEO and CFO have concluded that our disclosure controls and procedures, as defined in Multilateral Instrument 52-109, Certification of Disclosure in Issuers’ Annual and Interim Filings, and in Rule 13a-15(e) under theSecurities Exchange Act of 1934(the Exchange Act), are effective to ensure that information required to be disclosed in reports that we file or submit under Canadian securities legislation and the Exchange Act is recorded, processed, summarized and reported within the time periods specified in those rules and forms.
Internal controls over financial reporting are designed to provide reasonable assurance regarding the reliability of our financial reporting and compliance with Canadian generally accepted accounting principles in our financial statements.
Bank of Montreal’s management has evaluated whether there were changes in our internal controls over financial reporting during the year ended October 31, 2005 that have materially affected, or are reasonably likely to materially affect, our internal controls over financial reporting. No such changes were identified through management’s evaluation or any other means.
For the year ending October 31, 2006, we expect to comply with Section 404 of theSarbanes-Oxley Act, which requires that we issue a report on management’s assessment of the effectiveness of our internal controls over financial reporting and that management’s assessment be independently audited by the shareholders’ auditors.
| | | |
| 66 | | BMO Financial Group 188th Annual Report 2005 |
Enterprise-Wide Risk Management
[PHOTO]
Robert McGlashan
Executive Vice-President and Chief Risk Officer, Enterprise Risk and Portfolio Management, BMO Financial Group
BMO Financial Group has an enterprise-wide approach to the recognition, measurement, assessment and management of risks faced across the organization. These risks are classified as credit and counterparty, market, liquidity and funding, operational and business risk.
BMO’s risk framework guides our risk-taking activities and ensures that they are aligned with client needs, shareholder expectations and regulatory requirements. The framework provides for not only the direct management of each individual risk type but also the management of risks on an integrated basis. It consists of comprehensive risk governance, effective processes and models, and qualified risk professionals.
Comprehensive Risk Governance
BMO’s risk governance structure promotes making sound business decisions by balancing risk and reward. It promotes revenue-generating activities consistent with our risk tolerance and standards and drives the maximization of long-term shareholder return.
Our comprehensive risk governance structure (see box below) includes a body of corporate policies approved by the Board of Directors. These, along with subordinate risk
management corporate policies and corporate standards and procedures, are reviewed on an ongoing basis to ensure that they provide effective and superior governance over our risk-taking activities. In each line of business, management ensures that governance activities, controls and management processes are consistent with our risk management corporate policies and corporate standards.
Risk limits, which define BMO’s risk tolerance, are reviewed and approved annually by the Risk Review Committee of the Board for:
| § | | credit and counterparty risk – limits on country, industry, portfolio/product segments, group and single name exposures; |
|
| § | | market risk – limits on Market Value Exposure (MVE), Earnings Volatility (EV) and stress testing; and |
|
| § | | liquidity and funding risk – limits on minimum levels of liquid assets, liability diversification, credit and liquidity commitments, asset pledging and cash flow mismatches. |
These risk limits generally encompass both on and off-balance sheet arrangements.
Individual governance committees establish and monitor comprehensive risk management limits consistent with the Board-approved limits. Loss limits are also in place, providing an early warning mechanism to effectively address potential loss situations.
Effective Processes and Models
Rigorous processes, periodically reviewed by Corporate Audit Division, are used across BMO to:
| § | | develop policies and limits for approval by senior management governance committees; |
|
| § | | monitor policy compliance; |
|
| § | | maintain contingency plans; |
|
| § | | track variables for changing risk conditions; and |
|
| § | | provide timely reports to senior management and the appropriate governance committees. |
Models used range from the very simple to those that value complex transactions or involve sophisticated portfolio and capital management methodologies. These models are used to guide strategic decisions and to assist in making daily lending, trading, underwriting, funding, investment and operational decisions. Models have also been developed to measure exposure to risk and to measure total risk on an integrated basis,
Risk Review Committee of the Board of Directors (RRC)assists the Board in fulfilling its oversight responsibilities in relation to BMO’s identification and management of risk, adherence to internal risk management policies and procedures, and compliance with risk-related regulatory requirements.
The President and Chief Executive Officer (CEO)is directly accountable to the Board for all of BMO’s risk-taking activities. Risk Management Committee and its sub-committees as well as Enterprise Risk and Portfolio Management support the CEO.
Risk Management Committee (RMC), BMO’s senior risk committee, reviews and discusses significant risk issues and action plans that arise in executing the organization’s strategy. RMC ensures that risk oversight and governance occur at the highest levels of management.
RMC Sub-committeeshave oversight responsibility for management strategy, governance, risk measurement and contingency planning. RMC and its sub-committees ensure that the risks incurred across the organization are consistent with strategy and are identified, measured, monitored and reported in accordance with policy and within delegated limits.
Enterprise Risk and Portfolio Management (ER&PM)encompasses credit adjudication and oversight as well as the management and oversight of the operational and market risk functions. It ensures consistency of risk management practices and standards throughout the enterprise. ER&PM facilitates a disciplined approach to risk-taking through the execution of transactional and portfolio management, policy formulation, risk reporting, modelling, vetting and risk education responsibilities. This ensures corporate objectives are met while risks taken are consistent with BMO’s risk tolerance.
| | | |
| BMO Financial Group 188th Annual Report 2005 | | 67 |
using capital at risk (CaR). We have strong controls over the development, implementation and application of these models, which are subject to a periodic independent model risk vetting process.
BMO also utilizes various processes and models within risk types to:
| § | | assess the correlation of credit risks before authorizing new exposures; |
|
| § | | measure and value portfolio exposures and calculate related market risk exposure; |
|
| § | | measure the business and operational risk for each line of business; and |
|
| § | | estimate liquidity and funding risk based on expected and stressed operating conditions. |
Qualified Risk Professionals
Sound enterprise-wide risk management relies upon the competence and experience of our risk professionals to:
| § | | promote a culture that places high value on disciplined and effective risk management processes and controls; |
|
| § | | ensure adherence to established risk management standards for the evaluation and acceptance of risk; and |
|
| § | | apply sound business judgment, using effective business models in decision-making. |
To enhance existing risk management capabilities, managers and lenders are offered a progressive curriculum of credit risk courses by BMO’s Institute for Learning. These courses, together with defined job exposures, provide training and practice in sound credit risk management as a prerequisite to the granting of appropriate discretionary lending limits to qualified professionals.
Integrated Risk Management
The management of risk is integrated with our management of capital and strategy. This ensures that risks incurred in pursuit of BMO’s strategic objectives are consistent with desired total shareholder return as well as BMO’s desired credit rating and risk tolerance.
BMO’s risk management is supported by the Initiative Decisioning Process model, which ensures that changes to the organization’s risk profile associated with new business initiatives are correctly identified and receive appropriate approvals before the initiatives are implemented. Risk management is also supported by processes which use capital at risk measures, scenario analysis and stress testing to assess the relative magnitude of risks taken and the distribution of those risks across the organization’s activities.
CaR provides a single enterprise-wide measure of risk that can be compared across business activities and risk types.
It is the foundation for risk-based capital management and permits the cost of capital to be charged to the lines of business. CaR indicates, in terms of capital, the likely magnitude of economic losses that could occur if adverse situations arise and allows returns to be adjusted for risks. CaR is calculated for various types of risk – Credit, Market (trading and non-trading), Operational and Business – where measures are based on a time horizon of one year.
As noted in the charts below, BMO’s largest exposure in 2005 by type of risk was credit risk. Operational risk capital has increased from 2004 as a result of the inclusion of the Basel II Standardized Approach into the internal economic capital measure.
Stress testing and scenario analysis assist in measuring the impact of extreme, but plausible, operational, political, economic and market events on our operations. Scenarios may be based on historical or hypothetical events, a combination thereof, or significant economic developments such as a rapid increase in either the value of the Canadian dollar or energy costs. These tests and analyses are applied to all significant risk-taking activities across the organization.
We also conduct ongoing industry stress testing and scenario analysis designed to stress BMO’s credit exposures to a specific industry or to several industries that are highly correlated. These tests attempt to gauge the effect of various scenarios on default probabilities and loss rates in the portfolio under review. This provides significant insight into the sensitivity of our exposures to underlying risk characteristics of the industries under review.
Basel II (International Convergence of Capital Measurement and
Capital Standards: A Revised Framework)
The final Basel II Framework was issued by the Basel Committee on Banking Supervision in June 2004. The Framework was developed to strengthen the soundness and stability of the international banking system, promote the adoption of stronger risk management practices and develop more risk-sensitive capital requirements. The Framework allows banks to choose from several increasingly risk-sensitive approaches to the calculation of credit and operational risk regulatory capital requirements and promotes the use of a bank’s own internal estimates.
OSFI’s implementation date for Basel II is November 1, 2007. OSFI has issued a Draft Revised Capital Adequacy Requirements (CAR) Guideline that incorporates the Framework’s principles.
| | | |
| 68 | | BMO Financial Group 188th Annual Report 2005 |
BMO is implementing an Advanced Internal Ratings-Based Approach for credit risk regulatory capital calculations and adopting a Standardized Approach for operational risk capital calculations. BMO has an integrated enterprise-wide program
for managing the implementation of Basel II. Leadership and oversight are provided by an Executive Steering Committee.
BMO views Basel II as an important step in the alignment of regulatory and economic capital requirements.
Credit and Counterparty Risk
BMO incurs credit and counterparty risk primarily in its lending activities, including the sale of Treasury and other risk management products and, to a lesser extent, in its holding of investment securities. Effective credit risk management begins with BMO’s experienced and skilled professional lending and credit risk officers, who together operate in a dual control structure to authorize credit risk transactions. These individuals are subject to a rigorous lender qualification process, and operate in a disciplined environment with clear delegation of decision-making authority, including established lending limits. Credit decision-making is conducted at the management level appropriate to the size and risk of each transaction in accordance with comprehensive corporate policies, standards and procedures governing the conduct of credit risk activities.
Operating practices include the ongoing monitoring of credit risk exposures and regular portfolio and sector reporting to the Board and senior management committees. Performing accounts are reviewed on a regular basis, with most commercial and corporate accounts reviewed at least annually. The frequency of reviews is increased proportionally in accordance with the likelihood and size of potential credit loss. Corporate Audit Division reviews management processes and controls and samples credit transactions for adherence to credit terms and conditions. In addition, BMO carries out regular portfolio sector reviews, including stress testing and scenario analysis based on current, emerging or prospective risks.
For the consumer and small business portfolios, credit risk models and decision systems are developed using established statistical techniques and expert systems for underwriting and monitoring purposes. Adjudication models, behavioural scorecards, decision trees and expert knowledge are combined to produce optimal credit decisions in an automated environment. The characteristics of both the borrower and the loan, along with past portfolio experience, are used to predict the credit performance of new accounts. Past performance is also used to predict the likely future behaviour of existing accounts for ongoing credit risk management.
For the commercial and corporate portfolios, BMO utilizes an enterprise-wide risk rating framework that applies to all our sovereign, bank, corporate and commercial counterparties. We believe the framework to be consistent with the principles of Basel II under which future minimum regulatory capital requirements for credit risk will be determined. One key element of this framework is the assignment of appropriate borrower risk ratings to help quantify potential credit risk.
Under the risk rating framework, a counterparty’s default probability over a one-year time horizon is assessed using methodologies and rating criteria tailored to the specific risk characteristics of the counterparty. A borrower risk rating is derived from this assessment. Counterparties migrate between ratings as our assessment of their probability of
Credit and counterparty riskis the potential for loss due to the failure of a borrower, endorser, guarantor or counterparty to repay a loan or honour another predetermined financial obligation. This is the most significant measurable risk that BMO faces.
default changes. Losses are estimated based on the proportion of the exposure that will be lost if a counterparty default occurs, through an analysis of transaction-specific factors such as the nature and terms of the loan, collateral held and the seniority of our claim.
We also employ a disciplined approach to provisioning and loan loss evaluation, with prompt identification of problem loans being a key risk management objective. BMO maintains both specific and general allowances for credit losses. Specific allowances reduce the aggregate carrying value of credit assets where there is evidence of deterioration in credit quality. The general allowance is maintained to absorb probable credit losses in the existing portfolios for which specific provisions cannot yet be identified. The sum of these allowances must always be sufficient to reduce the book value of credit assets to their estimated realizable value.
BMO increasingly uses credit derivative products to enhance the management of its portfolio of credit risk assets, in particular its corporate loan book. In 2005, we were active in the use of single-name credit default swaps to mitigate the credit risk related to specific client credit exposures, and we used structured credit default swaps to mitigate identified sectoral risk concentrations. BMO is not an active seller of credit protection by way of credit default swaps.
BMO’s credit risk governance policies ensure that an acceptable level of diversification is maintained at all times. For large corporate transactions, we utilize expected loss models to assess the extent and correlation of risks before authorizing new exposures. At year-end, our credit assets consisted of a well-diversified portfolio comprised of millions of clients, the majority of them consumers and small to medium-sized businesses. Note 4 on page 100 of the financial statements and Tables 14 to 22 on pages 86 to 89 provide details of BMO’s loan portfolio, impaired loans and provisions and allowances for credit losses. Portfolio diversification is shown in the graph on page 58.
Our credit risk management processes are both well-established and effective. In 14 of the past 15 years, BMO’s specific credit losses relative to loans and acceptances, including securities borrowed or purchased under resale agreements, were the lowest of our Canadian peer group. Over this 15-year period, BMO’s average loss rate was 38 basis points, compared with an average of 59 basis points for our largest peers. The favourable results were achieved in consumer loans, as well as corporate and commercial loans.
| | | |
| BMO Financial Group 188th Annual Report 2005 | | 69 |
Market Risk
BMO incurs market risk in its trading and underwriting activities and structural banking activities.
As part of our enterprise-wide risk management framework, we employ comprehensive governance and management processes surrounding market risk-taking activities. These include:
| § | | oversight by senior governance committees, including Market Risk Committee (MRC), RMC and RRC; |
|
| § | | independent market risk oversight functions; |
|
| § | | effective processes to measure market risks linked to the allocation of economic capital and the valuation of positions; |
|
| § | | a well-developed limit-setting and monitoring process; |
|
| § | | effective controls over processes and models used; and |
|
| § | | a framework of scenario and stress tests for worst-case events. |
BMO’s primary market risk measures are Market Value Exposure (MVE) and Earnings Volatility (EV). The aggregate market value and earnings volatility exposures at October 31, 2005 are summarized in the following table. MVE has decreased over the past year due to a reduction in the structural duration, reflecting normal variability within the target structural duration range. EV exposure has decreased relative to last year due to the implementation in the first quarter of fiscal 2005 of a one-day correlated EV model for accrual portfolios in trading and underwriting.
Aggregate MVE and EV for Trading and Underwriting and
Structural Positions($ millions)*
| | | | | | | | | | | | | | | | | | |
| | As at October 31 | | Market value | | | 12-month | |
| | (After-tax Canadian equivalent) | exposure | earnings volatility | |
| | | | 2005 | | | 2004 | | | 2005 | | | 2004 | |
| | |
| | Trading and underwriting | | | 11.6 | | | | 10.0 | | | | 9.1 | | | | 18.0 | |
| | Structural | | | 326.3 | | | | 340.2 | | | | 28.1 | | | | 28.0 | |
| | |
| | Total | | | 337.9 | | | | 350.2 | | | | 37.2 | | | | 46.0 | |
| | |
*Measured at a 99% confidence level.
Trading and Underwriting Market Risk
BMO’s trading and underwriting activities include portfolios that are marked to market daily, as well as some portfolios (such as money market assets) that are subject to accrual accounting rules under generally accepted accounting principles. For these activities, Value at Risk (VaR) measures the magnitude of BMO’s market risk.
We implemented our Comprehensive Value at Risk model for market risk management and reporting of exposures in the mark-to-market trading and underwriting portfolios during fiscal 2004. The model better reflects the correlations between the different classes of market risk and incorporates methodology improvements for more complex trading products. At year-end, the Comprehensive VaR model had not yet been approved for use in calculating regulatory capital.
Various VaR models are used to determine market risk capital at risk for each of the lines of business and to determine regulatory capital. For capital calculation purposes, longer holding periods and/or higher confidence levels are used than are employed for day-to-day risk management. Models used to determine EV exposures are the same as or similar to those used to determine VaR exposures.
Market risk is the potential for a negative impact on the balance sheet and/or income statement resulting from adverse changes in the value of financial instruments as a result of changes in certain market variables. These variables include interest rates, foreign exchange rates, equity or commodity prices and their implied volatilities, as well as credit spreads, credit migration and default.
Market Value Exposure(MVE) is a measure of the adverse impact of changes in market parameters on the market value of a portfolio of assets, liabilities and off-balance sheet positions, measured at a 99% confidence level over a specified holding period. The holding period considers current market conditions and composition of the portfolios to determine how long it would take to neutralize the market risk without adversely affecting market prices. For trading and underwriting activities, MVE is comprised of VaR and Issuer Risk.
Earnings Volatility(EV) is a measure of the adverse impact of potential changes in market parameters on the projected 12-month after-tax net income of a portfolio of assets, liabilities and off-balance sheet positions, measured at a 99% confidence level over a specified holding period.
Value at Risk(VaR) is measured for specific classes of risk in BMO’s trading and underwriting activities: interest rate, foreign exchange, equity and commodity prices and implied volatilities. This measure calculates the maximum likely loss from portfolios over an appropriate holding period, measured at a 99% confidence level.
Issuer Risk (or Credit Spread)arises in BMO’s trading and underwriting portfolios, and measures the adverse impact of credit spread, credit migration and default risks on the market value of non-sovereign fixed income instruments and similar securities. Issuer Risk is measured at a 99% confidence level over an appropriate holding period.
Market risk exposures arising from trading and underwriting activities are summarized in the following table.
Total Trading and Underwriting MVE Summary($ millions)*
| | | | | | | | | | | | | | | | | | |
| | For the year ended October 31, 2005 | | | | | | | | | | | | |
| | (Pre-tax Canadian equivalent) | | Year-end | | | Average | | | High | | | Low | |
| | |
| | Commodity VaR | | | 3.2 | | | | 4.2 | | | | 13.0 | | | | 1.0 | |
| | Equity VaR | | | 3.8 | | | | 4.9 | | | | 7.1 | | | | 2.8 | |
| | Foreign exchange VaR | | | 0.4 | | | | 0.6 | | | | 2.2 | | | | 0.1 | |
| | Interest rate VaR (mark-to-market) | | | 3.8 | | | | 4.4 | | | | 8.9 | | | | 2.5 | |
| | Correlation | | | (5.5 | ) | | | (6.6 | ) | | | (10.2 | ) | | | (3.7 | ) |
| | |
| | Comprehensive VaR | | | 5.7 | | | | 7.5 | | | | 14.7 | | | | 4.0 | |
| | Interest rate VaR (accrual) | | | 8.0 | | | | 8.5 | | | | 12.3 | | | | 5.6 | |
| | Issuer Risk | | | 4.1 | | | | 3.9 | | | | 5.6 | | | | 2.7 | |
| | |
| | Total MVE | | | 17.8 | | | | 19.9 | | | | 27.4 | | | | 14.1 | |
| | |
| | | | | | | | | | | | | | | | | | |
| | For the year ended October 31, 2004 | | | | | | | | | | | | |
| | (Pre-tax Canadian equivalent) | | | Year-end | | | | Average | | | | High | | | | Low | |
| | |
| | Commodity VaR | | | 1.1 | | | | 1.3 | | | | 3.3 | | | | 0.5 | |
| | Equity VaR | | | 3.9 | | | | 4.4 | | | | 13.1 | | | | 2.3 | |
| | Foreign exchange VaR | | | 0.5 | | | | 1.4 | | | | 3.8 | | | | 0.1 | |
| | Interest rate VaR (mark-to-market) | | | 3.8 | | | | 5.2 | | | | 11.2 | | | | 3.4 | |
| | Correlation | | | (4.6 | ) | | | (5.4 | ) | | | (8.8 | ) | | | (1.4 | ) |
| | |
| | Comprehensive VaR | | | 4.7 | | | | 6.9 | | | | 14.9 | | | | 4.2 | |
| | Interest rate VaR (accrual) | | | 6.3 | | | | 7.5 | | | | 11.9 | | | | 4.3 | |
| | Issuer Risk | | | 4.0 | | | | 4.5 | | | | 7.0 | | | | 2.9 | |
| | |
| | Total MVE | | | 15.0 | | | | 18.9 | | | | 28.4 | | | | 14.1 | |
| | |
| |
| * | One-day measure using a 99% confidence level. |
| | | |
| 70 | | BMO Financial Group 188th Annual Report 2005 |
There were no losses in fiscal 2005 in the trading and underwriting portfolios that exceeded the overall MVE measure.
We also measure exposure to concentrations of market risk, such as changes in particular interest rates, foreign exchange rates, equity or commodity prices and their related implied volatilities.
Effective controls over the revaluation of trading and underwriting portfolios and the determination of daily revenue from these activities enable us to monitor the revenue generated by each of the lines of business in relation to their business strategies and their level of market risk.
The distribution of our daily net revenue for the portfolios reflects the broad diversification of risk in our trading activities, designed to reduce the volatility of daily net revenues.
Trading revenues include amounts from all trading and underwriting activities, whether accounted for on a mark-to-market basis or an accrual basis, as well as certain fees and commissions directly related to those activities.
We monitor the application of our models to ensure that they are appropriate to the particular portfolio to which they are applied, and we take corrective action, including making adjustments to the determination of daily net trading revenues, when model limitations are identified.
We use a variety of methods to ensure the integrity of these models, including the application of backtesting against hypothetical losses. This process assumes there are no changes in the previous day’s closing positions. The process then isolates the effects of each day’s price movements against these closing
positions. Models are considered to be validated by such testing if, on average, calculated hypothetical losses exceed the MVE measure only one time out of 100. Results of this testing confirm the reliability of our models.
The models used to measure market risks are effective at measuring risks under normal market conditions. In addition, we perform scenario analysis and stress testing to determine the impact of unusual and/or unexpected market changes on our portfolios. We use a comprehensive set of scenarios and stress tests, and the results are reported to MRC, RMC and RRC on a regular basis.
Structural Market Risk
Structural market risk is comprised of interest rate risk arising from our banking activities (loans and deposits) and foreign exchange risk arising from our foreign currency operations. Structural market risk is managed by BMO’s Corporate Treasury in support of stable, high-quality earnings.
Structural interest rate risk arises primarily from interest rate mismatches and embedded options. Interest rate mismatches result from differences in the scheduled maturity or repricing dates of assets, liabilities and off-balance sheet items. Embedded option risk results from product features that allow customers to modify scheduled maturity or repricing dates. Embedded options include loan prepayment and deposit redemption privileges and committed rates on unadvanced mortgages. The net interest rate mismatch, representing residual assets funded by common shareholders’ equity, is maintained at a target duration of between two and three years and embedded options are managed to low risk levels. The interest rate mismatch is primarily managed with interest rate swaps and securities. Embedded option exposures are managed by purchasing options or through a dynamic hedging process.
Structural foreign exchange risk arises primarily from translation risk associated with the net investment in our U.S. operations, and from transaction risk associated with our U.S-dollar net income. Translation risk is managed by funding our net U.S. investment in U.S. dollars. Transaction risk is managed by entering into foreign exchange forward contract hedges each quarter that are expected to partially offset the effects of Canadian/U.S. dollar exchange rate fluctuations on the quarter’s net income. The impact of exchange rate fluctuations on BMO’s 2005 net income is reviewed on page 36.
Structural MVE and EV measures both reflect holding periods of between one and three months and incorporate the impact of correlation between market variables. Structural MVE (see page 70) has decreased over the past year due to a reduction in duration, reflecting normal variability within the target duration range. EV continues to be managed to low levels.
In addition to MVE and EV, we also use simulations, sensitivity analysis, stress testing and gap analysis, which is disclosed in the table on page 72, to measure and manage interest rate risk.
Structural interest rate sensitivity to an immediate parallel increase or decrease of 100 and 200 basis points is disclosed in the adjacent table. This sensitivity analysis is performed and disclosed by many financial institutions and facilitates comparison with our peer group.
| | | |
| BMO Financial Group 188th Annual Report 2005 | | 71 |
Models used to measure structural market risk help forecast how interest rates and foreign exchange rates may change and predict how customers would likely react to the changes. These models have been developed using statistical analysis and are validated through regular model vetting and backtesting processes and ongoing dialogue with the lines of business. Models used to predict consumer behaviour are also used in support of product pricing and performance measurement.
Structural Interest Rate Sensitivity($ millions)*
| | | | | | | | | | | | | | | | | | |
| | (After-tax Canadian equivalent) | As at October 31, 2005 | As at October 31, 2004 | |
| | |
| | | | | | | | Earnings | | | | | | | Earnings | |
| | | | Economic | | | sensitivity | | | Economic | | | sensitivity | |
| | | | value | | | over the next | | | value | | | over the next | |
| | | | sensitivity | | | 12 months | | | sensitivity | | | 12 months | |
| | |
| | 100 basis point increase | | | (228.8 | ) | | | 25.1 | | | | (224.3 | ) | | | 9.2 | |
| | 100 basis point decrease | | | 191.9 | | | | (22.4 | ) | | | 183.7 | | | | (20.2 | ) |
| |
| | 200 basis point increase | | | (478.0 | ) | | | 44.1 | | | | (470.4 | ) | | | 22.2 | |
| | 200 basis point decrease | | | 347.3 | | | | (45.8 | ) | | | 332.3 | | | | (62.9 | ) |
| | |
| |
| * | Exposures are in brackets and benefits are represented by positive |
| | amounts. |
Liquidity and Funding Risk
Managing liquidity and funding risk is essential to maintaining both depositor confidence and stability in earnings.
It is BMO’s policy to ensure that sufficient liquid assets and funding capacity are available to meet financial commitments, even in times of stress.
Our liquidity and funding risk management framework includes:
| § | | oversight by senior governance committees, including the Liquidity and Funding Management Committee, RMC and RRC; |
|
| § | | an independent oversight group within Corporate Treasury; |
|
| § | | an RRC-approved limit structure to support risk management; |
|
| § | | effective processes and models to monitor and manage risk; |
|
| § | | strong controls over processes and models and their uses; |
|
| § | | a framework of scenario tests for stressed operating conditions; and |
|
| § | | contingency plans to facilitate managing through a disruption. |
Data provided in this section reflect BMO’s consolidated position. BMO subsidiaries include regulated and foreign entities, and therefore movements of funds between companies in the corporate group are subject to the liquidity, funding and capital adequacy considerations of the subsidiaries as well as tax considerations. Such matters do not materially affect BMO’s liquidity and funding.
BMO’s liquidity and funding position remains sound and there are no trends, demands, commitments, events or uncertainties that are reasonably likely to materially affect the position.
We actively manage liquidity and funding risk globally by holding liquid assets in excess of an established minimum level at all times. Liquid assets include unencumbered, high credit-quality assets that are marketable, can be pledged as security for borrowings, or mature in a time frame that meets our liquidity and funding requirements. Liquidity and funding requirements consist of expected and potential cash outflows. These arise from obligations to repay deposits that are withdrawn or not renewed, and from the need to fund asset growth, strategic investments, drawdowns on credit and liquidity facilities and purchases of collateral for pledging. Liquidity and funding requirements are assessed under expected and stressed economic, market, political and enterprise-specific environments, which determines the minimum amount of liquid assets to be held at all times.
Liquidity and funding riskis the potential for loss if BMO is unable to meet financial commitments in a timely manner at reasonable prices as they fall due. Financial commitments include liabilities to depositors and suppliers, and lending, investment and pledging commitments.
In addition, we use two primary measures to evaluate liquidity and funding risk. The first measure is the liquidity ratio. This ratio provides an assessment of the extent to which assets can be readily converted into cash or cash substitutes to meet financial commitments, as cash resources and securities are more liquid than loans. It represents the sum of cash resources and securities as a percentage of total assets. BMO’s liquidity ratio at October 31, 2005 was 26.2%, up from 25.8% at October 31, 2004. The increase in the ratio was primarily attributable to growth in securities associated with trading activities.
Cash and securities totalled $78.0 billion at the end of the year, up from $68.5 billion in 2004, while total assets increased $32.3 billion to $297.5 billion.
Liquidity provided by cash and securities is supplemented by securities purchased under resale agreements, which also can be readily converted into cash or cash substitutes to meet financial commitments. Securities purchased under resale agreements totalled $20.7 billion at the end of the year, up from $17.1 billion in 2004.
In the ordinary course of business, a portion of cash, securities and securities purchased under resale agreements is pledged as collateral to support trading activities and participation in clearing and payment systems, in Canada and abroad. At October 31, 2005, $27.8 billion of cash and securities and $13.3 billion of securities purchased under resale agreements had been pledged, compared with $18.8 billion and $13.7 billion, respectively, in 2004. These changes were primarily driven by trading activities. In addition, BMO is a party to certain agreements that could require incremental collateral under certain circumstances. These potential incremental collateral requirements are not material. Additional information on cash and securities can be found in Table 5 on page 80 and in Notes 2 and 3 on page 97 of the financial statements.
The second measure is the core deposits-to-total deposits ratio. This measure provides an assessment of the stability of BMO’s deposit base, as core deposits are more stable than other deposit sources. Core deposits are comprised of individual
| | | |
| 72 | | BMO Financial Group 188th Annual Report 2005 |
customer operating and savings deposits and smaller fixed-date deposits, which generally are less responsive to changes in the market environment than larger institutional deposits. The ratio represents total deposits less fixed-date deposits greater than 100,000 units of any currency as a percentage of total deposits. BMO’s core deposits-to-total deposits ratio at October 31, 2005 was 51.1%, down from 58.2% in the prior year.
The ratio decreased primarily due to an increase in non-core deposits that supported growth in loans and securities. Wholesale funding used to support loan growth was primarily longer term in order to better match the maturity of loans.
Core deposits totalled $99.0 billion at the end of the year, down from $101.9 billion in 2004, while total deposits increased $18.6 billion to $193.8 billion.
Our large base of core deposits, along with our strong capital base, reduces reliance on less stable wholesale funding. Wholesale funding is largely short-term in nature and primarily supports trading and underwriting assets and investment securities. Wholesale funding is diversified by customer, type, market, maturity term, currency and geography. Information on deposit maturities can be found in Table 8 on page 81.
Liquidity and funding could potentially be affected by off-balance sheet arrangements and other credit instruments through our obligation to fund drawdowns. These exposures are captured within our risk management framework. Off-balance sheet arrangements are discussed on page 61, and information on other credit instruments can be found in Note 5 on page 102 of the financial statements.
Operational Risk
Operational risk is inherent in all business activities. Operational risk can never be entirely eliminated; however, shareholder value can be preserved and enhanced by managing, mitigating and, in some cases, insuring against operational risk.
To achieve this goal, we have developed, using regulatory guidelines, an Operational Risk Framework, which includes identification, measurement, analysis, monitoring, capital at risk attribution and risk control/mitigation elements. A variety of underlying processes and controls have been developed as part of this framework. These include risk and control self-assessments, business contingency plans, event management, change management, outsourcing management, and acquisition and integration management.
BMO’s operational risk governance structure includes the Operational Risk Committee (ORC), a sub-committee of RMC. ORC has oversight responsibility for operational risk strategy and governance. It provides advice and guidance to the lines of business on operational risk assessments, measurement and mitigation, and related monitoring and change initiatives.
BMO’s goal is to make operational risk, like all other risks, transparent throughout the enterprise. Therefore, this framework includes regular reporting of relevant operational risk management activities and processes to senior line and corporate management, ORC, RMC and the Board of Directors.
Each line of business is responsible for using the aforementioned framework processes and control programs to manage its operational risk within the guidelines established by corporate policy and standards. To ensure that all operational risks to which a line of business is exposed are adequately managed, specialized functions are also involved in the management of risks as appropriate, including Finance, Taxation, Legal, Compliance, Privacy, Human Resources, and Systems and Information Management.
Operational riskis the potential for loss resulting from inadequate or failed internal processes or systems, human error or external events not related to credit, market or liquidity risks.
We purchase insurance in such amounts and in such areas as will provide protection against unexpected material loss and where insurance is required by law, regulatory requirement or contractual agreement.
BMO has adopted an operational risk capital measure consistent with the Basel II Standardized Approach and a separate measure for Business Risk due to Operational Failure. We continue to improve our measurement capabilities by reviewing internal and external operational loss data, key risk indicators and operational risk scenarios as a means to better understand and measure risk.
Corporate Audit regularly reports to the CEO and to the Board’s Audit Committee on the effectiveness of internal controls for operational risk management processes.
The various processes included in the operational risk framework are at different stages of development. Our approach is to continuously improve each in a way that supports business activities while also meeting external requirements.
Business Risk due to Operational Failure
Business Risk due to Operational Failure is the risk of losses or reductions in revenue arising from the indirect effects of operational risks, including reputation risk. BMO attributes economic capital for this risk to the business units using a scenario-based model and reports this capital as a component of operational risk capital.
| | | |
| BMO Financial Group 188th Annual Report 2005 | | 73 |
Business Risk due to Earnings Volatility
Business risk due to earnings volatility measures the risk that volumes will decrease or margins will shrink with no opportunity being available to offset the revenue declines with a reduction in costs. BMO faces many risks that are similar to those faced by non-financial firms, principally that our profitability, and hence value, may be eroded
by changes in the business environment or by failures of strategy or execution. Sources of these risks include volatile economic market activity, changing client expectations, adverse business developments and relatively ineffective responses to industry changes. Risks to BMO’s margins and volumes are categorized as business risk due to earnings volatility.
Corporate Responsibility and Sustainability
BMO has an ongoing commitment to responsible, ethical and sustainable corporate behaviour. It is our responsibility as a public corporation to conduct our business in such a way as to deliver value to our shareholders while also benefiting society and protecting our environment. We measure success in all we do by applying the principles of excellence, accountability, transparency and integrity.
At BMO, Corporate Responsibility and Sustainability objectives are integrated into long-term strategic decision-making. BMO’s strategies address our interactions and overall relationship with all of our stakeholders, including customers, employees, owners and investors, governments, suppliers, competitors and environmental interests.
Trust is a key element in BMO’s ongoing success. Shareholders trust BMO to provide responsible and successful stewardship of their financial investments. Clients trust BMO to help them achieve their financial goals. Our employees and the communities in which we operate trust our commitments to contribute to their continued well-being and success. Finally, governments trust our respect for the standards required of our industry.
BMO maintains a comprehensive code of conduct –FirstPrinciples, Our Code of Business Conduct and Ethics– and has established specific behavioural standards through FirstPrinciples and related policies, standards and guidelines. This policy applies to all activities undertaken by both BMO’s Board of Directors and our employees. Policy requirements cannot be compromised by virtue of third-party outsourcing or joint venture arrangements.
Corporate Responsibility and Sustainability is not a project or an initiative – it is a way of doing business. Behaving responsibly in the pursuit of our corporate goals protects our reputation and is necessary to ensure the long-term sustainability of the enterprise.
Our annual Corporate Social Responsibility Report, including our Public Accountability Statement, documents how BMO Financial Group plays a role in the growth, success and well-being of the citizens and communities of the countries in which we operate.
A focus on Corporate Responsibility and Sustainability is an essential element in reputation risk management, as stakeholders are interested not only in financial performance but also in how that performance is achieved.
Reputation riskis the risk of negative impacts resulting from the deterioration of BMO’s reputation with key stakeholders. These impacts include revenue loss, reductions in our customer or client base and declines in BMO’s share price.
Reputation Risk
BMO’s reputation is one of our most valuable assets. Key to effectively building and maintaining BMO’s reputation is fostering a business culture that:
| § | | incorporates integrity and ethical conduct as core values; and |
|
| § | | promotes a conviction that every business decision must reflect the enterprise’s core ethical values. |
The potential for damage to our corporate reputation exists in every business decision. Therefore, we believe that active, ongoing and effective management of reputation risk is best achieved through integration of explicit assessments of reputation risk into strategy development, operational implementation, transactional decision-making and risk management and control processes.
It is the responsibility of all employees to conduct themselves in such a way as to maintain and build BMO’s reputation. The Reputation Risk Management Committee considers potential reputation risks to the enterprise and specifically reviews complex credits and structured financings as required.
Environmental Risk
BMO is committed to the principles of sustainable development and, in particular, to the belief that the quality of our lives improves when economic growth is integrated with respect for the environment.
We implement practices across the enterprise to reduce waste, conserve energy and recycle materials, and take reasonable precautions to ensure that we deal with environmentally responsible customers in the course of our credit-granting activities.
BMO is willing to work with governments, industries and all relevant constituencies to address environmental issues and challenges, and has shown such willingness through the adoption and incorporation of environmental best practices into our decision-making policies and processes. This is evidenced by actions such as BMO being a signatory to the United Nations Environmental Programme Statement by Financial Institutions on the Environment and Sustainable Development and to the Carbon Disclosure Project, as well as adoption of The Equator Principles.
| | | |
| 74 | | BMO Financial Group 188th Annual Report 2005 |
Review of Fourth Quarter Performance
Net income in the fourth quarter of 2005 was a record $657 million, an increase of $106 million or 20% from the fourth quarter a year ago. Results for the fourth quarter and comparative quarters are outlined on page 77. Each of our client operating groups produced strong increases in net income, with business volumes up year-over-year. Operating results were up strongly, notwithstanding higher provisions for credit losses, even after excluding certain significant items that increased earnings.
Net income was increased by the $43 million after-tax net impact of the following significant items:
| § | | A $49 million ($18 million after tax) gain on the sale of Harrisdirect recorded in Private Client Group; |
| |
| § | | A $50 million ($32 million after tax) gain on the sale of common shares of the TSX, split equally between Private Client Group and Investment Banking Group; |
| |
| § | | A $29 million ($19 million after tax) gain on the sale of our Calgary office tower recorded in Corporate Support; and |
| |
| § | | A $40 million ($26 million after tax) adjustment that reduced Personal and Commercial Client Group’s card fees revenue as a result of further refinements made to the methodology used to determine the liability associated with our customer loyalty rewards program. |
Net income in the fourth quarter of 2004 was increased by the $24 million after-tax net impact of:
| § | | A $50 million ($33 million after tax) reduction in the general allowance for credit losses reflected in Corporate Support; and |
| |
| § | | A $14 million ($9 million after tax) adjustment that reduced Personal and Commercial Client Group’s card fees revenue because of rising reward redemption rates associated with our customer loyalty rewards program. |
Personal and Commercial Client Group net income in the fourth quarter rose $38 million or 14% from a year ago, driven by higher volumes in both Canada and the United States, stable margins in Canada and a lower effective tax rate. These factors were partially offset by lower card fees as a result of the foregoing loyalty rewards program adjustments. In the United States, higher volumes were attributable to acquisitions and loan growth. Private Client Group earnings increased $54 million or 103%. The increase was partly attributable to gains on the sale of Harrisdirect and TSX shares, while approximately $20 million or 38% was due to business growth and the benefit of ongoing expense management. Investment Banking Group net income increased $34 million or 18%, in large part due to increased capital markets activities and its gain on the sale of TSX common shares.
Revenue for the quarter increased $371 million or 16% from a year ago to $2,650 million. Adjusted for the impact of the weaker U.S. dollar, revenue increased $423 million or 19%. Personal and Commercial Client Group revenue increased $73 million due to higher volumes, partially offset by lower card fees and lower net interest margin in the United States. Acquired businesses in the United States contributed $13 million to revenue growth. Private Client Group revenue increased $128 million on growth in operating revenues across all of
the group’s lines of business, together with the gain of $74 million on its aforementioned asset sales. Revenue increased $103 million or 17% in Investment Banking Group due to increases in trading revenues, merger and acquisition fees and securities trading commissions. There were also increases in corporate loan volumes and investment securities gains, due to the $25 million gain on the sale of TSX common shares.
Net interest income was $1,224 million, an increase of $18 million from a year ago. Average assets were $43 billion higher, of which approximately two-thirds was attributable to growth of low-margin client-driven trading assets in Investment Banking Group and the remainder to Canadian and U.S. personal and commercial banking products. Net interest margin was 24 basis points lower than a year ago. Net interest margin increased in Canadian personal and commercial banking but continues to be affected by the shift in customer product preferences toward lower-spread products and increased competition in the sustained low interest rate environment. Net interest margin declined in U.S. retail and business banking due to competitive pressures limiting our ability to pass on higher short-term rates to loan customers, and to lower rates earned on longer-term deposits. Loan growth in excess of deposit growth also contributed to the decline. Investment Banking Group net interest margin declined due to lower trading net interest income, lower spreads on corporate loans in the competitive loan pricing environment in the United States and lower spreads in interest-rate-sensitive businesses in the rising interest rate environment.
Non-interest revenue was $1,426 million, an increase of $353 million or 33% from the fourth quarter of 2004. The increase was due in part to the gains on sales outlined above. There were significant increases in trading revenues due to high volatility in the energy sector and improved results in interest rate and equity trading. Net investment securities gains were up $42 million, primarily due to the $50 million gain on sale of TSX shares. There was also growth in mutual fund fees, securities commissions, and merger and acquisition fees. Securitization revenues declined as a portion of our credit card loan securitizations matured in the first quarter of 2005.
Non-interest expense was $1,636 million, an increase of $143 million from a year ago, in part due to a $119 million increase in performance-based compensation costs. This latter increase was due to improved results and Investment Banking Group’s reduction of performance-based costs in 2004, in line with results in that period. Expense growth was mitigated by the $33 million impact of the weaker U.S. dollar.
In the fourth quarter of 2005, the provision for credit losses totalled $57 million, compared with a $13 million net recovery in the fourth quarter of 2004. There were $37 million of specific provisions in the fourth quarter of 2004 and a $50 million reduction in the general allowance. The increase in specific provisions was attributable to lower levels of reversals and recoveries. There was no reduction in the general allowance in the fourth quarter of 2005.
| | | |
| BMO Financial Group 188th Annual Report 2005 | | 75 |
Quarterly Earnings Trends
BMO’s quarterly earnings, revenue and expense are modestly affected by seasonal factors. Since our second fiscal quarter has 89 days (90 days in a leap year) and other quarters have 92 days, second-quarter results are lower relative to other quarters because there are 3% fewer calendar days, and thus fewer business days. The months of July (third quarter) and August (fourth quarter) are typically characterized by lower levels of capital markets activity, which has an effect on results in Private Client Group and Investment Banking Group. The December holiday season also contributes to a slowdown in some activities; however, credit card purchases are particularly robust in that first-quarter period, as well as in the back-to-school period that falls in our fourth quarter.
Results and statistics for the past eight quarters are outlined on page 77. Quarterly provisions for credit losses have generally started to trend upward, affecting performance. In addition, quarterly results sometimes include significant items that affect the level of earnings and trend analysis. The net impact of such items increased earnings somewhat in the first and second quarters of 2004 and, to a greater degree, in the third quarter of 2004. The first, second and fourth quarters of 2005 were also affected by significant items. BMO’s pattern of growing earnings in consecutive quarters was interrupted in the fourth quarter of 2004 and into 2005, largely because of provisioning trends and significant items affecting quarterly results. The weakening of the U.S. dollar has dampened revenue and expense growth over the past two years but has had a more modest impact on net income, in part due to our practice of hedging our currency exposure, which is explained on page 36.
Personal and Commercial Client Group earnings, broadly speaking, have been increasing steadily, excluding the impact of significant items. Strong volume growth with moderate increases in expenses has been partially offset by declining net interest margins due to shifts in customer preferences toward lower-spread products and competitive pressures in the low interest rate environment. The reduction in net interest margin has been more pronounced in P&C Chicagoland Banking because of competitive pressures on loan pricing and lower rates earned on longer-term liabilities. The net interest margin has also been affected by loan growth in excess of deposit growth. The group’s results in the second and fourth quarters
of 2004 and the fourth quarter of 2005 were affected by adjustments to credit card fees.
Private Client Group’s results have benefited from steady growth in fee-based and managed asset businesses, improved net interest margin on term investment products and continued expense management, while also being subject to the variability of client trading activity. In 2005, the group’s strengthening results were driven by improved performance in full-service investing, term investments and the mutual fund business. Performance in the fourth quarter of 2005 benefited from the inclusion of a combined $74 million of revenue ($34 million after tax) from the sales of Harrisdirect and the group’s share of BMO’s investment in TSX common shares.
Investment Banking Group results are more volatile than our other businesses because they are dependent in part on the level of capital markets activity. The group’s net income was particularly high in the first and second quarters of 2004 because of extremely favourable capital markets conditions, and was high in the third quarter of 2004 because of very favourable credit performance, including high recoveries of principal and interest on loans that were previously written off. In 2005, the strong first quarter was aided by a $32 million recovery of prior years’ income taxes and the $30 million ($20 million after tax) impact of adopting a change in accounting for merchant banking investments, while the second quarter benefited from $44 million ($37 million after tax) of revenue recognized on restructuring VIEs. Results in 2005 were affected by the interest rate environment, including the impact of rising short-term interest rates in the United States. Particularly strong trading revenue benefited results in the fourth quarter.
BMO’s provisions for credit losses declined during 2004 as we moved into a particularly favourable span of the credit cycle. Provisions were especially low in the third quarter of 2004 as we recorded high levels of reversals of previous allowances and recoveries of earlier write-offs. These reversals and recoveries were a significant component of the high net income in Corporate Support in that quarter. In fact, the favourable credit performance in the third quarter of 2004 was so pronounced that in the third quarter of 2005, BMO’s earnings decreased from the comparable quarter in the prior year, the only such occurrence in the past three fiscal years.
| | | |
| 76 | | BMO Financial Group 188th Annual Report 2005 |
Summarized Statement of Income and Quarterly Financial Measures
| | | | | | | | | | | | | | | | | | | | | | | | | | | | | | | | | | | | | | | | | | | | | |
| | | Oct. 31 | | | July 31 | | | April 30 | | | Jan. 31 | | | Oct. 31 | | | July 31 | | | April 30 | | | Jan. 31 | | | | | | | | | | |
| ($ millions) | | 2005 | | | 2005 | | | 2005 | | | 2005 | | | 2004 | | | 2004 | | | 2004 | | | 2004 | | | 2005 | | | 2004 | | | 2003 | |
| |
| Net interest income (teb) | | | 1,224 | | | | 1,244 | | | | 1,212 | | | | 1,226 | | | | 1,206 | | | | 1,272 | | | | 1,194 | | | | 1,265 | | | | 4,906 | | | | 4,937 | | | | 4,929 | |
| Non-interest revenue | | | 1,426 | | | | 1,197 | | | | 1,216 | | | | 1,213 | | | | 1,073 | | | | 1,121 | | | | 1,251 | | | | 1,106 | | | | 5,052 | | | | 4,551 | | | | 4,220 | |
| |
| Total revenue (teb) | | | 2,650 | | | | 2,441 | | | | 2,428 | | | | 2,439 | | | | 2,279 | | | | 2,393 | | | | 2,445 | | | | 2,371 | | | | 9,958 | | | | 9,488 | | | | 9,149 | |
| Provision for credit losses – specific | | | 57 | | | | 73 | | | | 46 | | | | 43 | | | | 37 | | | | (70 | ) | | | 45 | | | | 55 | | | | 219 | | | | 67 | | | | 455 | |
| Provision for credit losses – general | | | – | | | | – | | | | (40 | ) | | | – | | | | (50 | ) | | | (40 | ) | | | (40 | ) | | | (40 | ) | | | (40 | ) | | | (170 | ) | | | – | |
| Non-interest expense | | | 1,636 | | | | 1,579 | | | | 1,579 | | | | 1,533 | | | | 1,493 | | | | 1,538 | | | | 1,565 | | | | 1,561 | | | | 6,327 | | | | 6,157 | | | | 6,087 | |
| |
| Income before provision for income taxes and non-controlling interest in subsidiaries | | | 957 | | | | 789 | | | | 843 | | | | 863 | | | | 799 | | | | 965 | | | | 875 | | | | 795 | | | | 3,452 | | | | 3,434 | | | | 2,607 | |
| Provision for income taxes (teb) | | | 284 | | | | 234 | | | | 229 | | | | 247 | | | | 243 | | | | 318 | | | | 280 | | | | 270 | | | | 994 | | | | 1,111 | | | | 804 | |
| Non-controlling interest in subsidiaries | | | 16 | | | | 14 | | | | 14 | | | | 14 | | | | 5 | | | | 4 | | | | 4 | | | | 4 | | | | 58 | | | | 17 | | | | 22 | |
| |
| Net income | | | 657 | | | | 541 | | | | 600 | | | | 602 | | | | 551 | | | | 643 | | | | 591 | | | | 521 | | | | 2,400 | | | | 2,306 | | | | 1,781 | |
| |
| Amortization of intangible assets, net of income taxes | | | 17 | | | | 17 | | | | 21 | | | | 19 | | | | 19 | | | | 21 | | | | 19 | | | | 19 | | | | 74 | | | | 78 | | | | 79 | |
| |
| Cash net income | | | 674 | | | | 558 | | | | 621 | | | | 621 | | | | 570 | | | | 664 | | | | 610 | | | | 540 | | | | 2,474 | | | | 2,384 | | | | 1,860 | |
| |
| Taxable equivalent basis adjustment (teb) | | | 30 | | | | 30 | | | | 31 | | | | 28 | | | | 30 | | | | 32 | | | | 39 | | | | 38 | | | | 119 | | | | 139 | | | | 152 | |
| Reported revenue per financial statements | | | 2,620 | | | | 2,411 | | | | 2,397 | | | | 2,411 | | | | 2,249 | | | | 2,361 | | | | 2,406 | | | | 2,333 | | | | 9,839 | | | | 9,349 | | | | 8,997 | |
| Operating group net income: | | | | | | | | | | | | | | | | | | | | | | | | | | | | | | | | | | | | | | | | | | | | |
| Personal and Commercial Client Group | | | 305 | | | | 307 | | | | 293 | | | | 294 | | | | 267 | | | | 268 | | | | 206 | | | | 241 | | | | 1,199 | | | | 982 | | | | 914 | |
| Private Client Group | | | 107 | | | | 63 | | | | 77 | | | | 73 | | | | 53 | | | | 58 | | | | 63 | | | | 53 | | | | 320 | | | | 227 | | | | 137 | |
| Investment Banking Group | | | 225 | | | | 184 | | | | 206 | | | | 237 | | | | 191 | | | | 230 | | | | 206 | | | | 205 | | | | 852 | | | | 832 | | | | 691 | |
| Corporate Support, including T&S | | | 20 | | | | (13 | ) | | | 24 | | | | (2 | ) | | | 40 | | | | 87 | | | | 116 | | | | 22 | | | | 29 | | | | 265 | | | | 39 | |
| |
| BMO Financial Group net income | | | 657 | | | | 541 | | | | 600 | | | | 602 | | | | 551 | | | | 643 | | | | 591 | | | | 521 | | | | 2,400 | | | | 2,306 | | | | 1,781 | |
| |
Information per Common Share($) | | | | | | | | | | | | | | | | | | | | | | | | | | | | | | | | | | | | | | | | | | | | |
| Dividends declared | | | 0.49 | | | | 0.46 | | | | 0.46 | | | | 0.44 | | | | 0.44 | | | | 0.40 | | | | 0.40 | | | | 0.35 | | | | 1.85 | | | | 1.59 | | | | 1.34 | |
| Earnings | | | | | | | | | | | | | | | | | | | | | | | | | | | | | | | | | | | | | | | | | | | | |
| Basic | | | 1.30 | | | | 1.07 | | | | 1.19 | | | | 1.18 | | | | 1.08 | | | | 1.27 | | | | 1.16 | | | | 1.02 | | | | 4.74 | | | | 4.53 | | | | 3.51 | |
| Diluted | | | 1.27 | | | | 1.05 | | | | 1.16 | | | | 1.16 | | | | 1.06 | | | | 1.24 | | | | 1.12 | | | | 1.00 | | | | 4.64 | | | | 4.42 | | | | 3.44 | |
| Cash earnings | | | | | | | | | | | | | | | | | | | | | | | | | | | | | | | | | | | | | | | | | | | | |
| Basic | | | 1.34 | | | | 1.10 | | | | 1.23 | | | | 1.22 | | | | 1.13 | | | | 1.30 | | | | 1.20 | | | | 1.06 | | | | 4.89 | | | | 4.69 | | | | 3.67 | |
| Diluted | | | 1.31 | | | | 1.08 | | | | 1.21 | | | | 1.19 | | | | 1.10 | | | | 1.27 | | | | 1.17 | | | | 1.03 | | | | 4.79 | | | | 4.57 | | | | 3.59 | |
| Book value | | | 26.53 | | | | 26.00 | | | | 25.60 | | | | 24.93 | | | | 24.24 | | | | 24.31 | | | | 23.82 | | | | 22.87 | | | | 26.53 | | | | 24.24 | | | | 22.09 | |
| Market price | | | | | | | | | | | | | | | | | | | | | | | | | | | | | | | | | | | | | | | | | | | | |
| High | | | 62.44 | | | | 62.05 | | | | 57.13 | | | | 58.59 | | | | 59.63 | | | | 55.50 | | | | 58.74 | | | | 59.65 | | | | 62.44 | | | | 59.65 | | | | 50.26 | |
| Low | | | 56.00 | | | | 55.04 | | | | 53.05 | | | | 54.38 | | | | 52.05 | | | | 49.50 | | | | 50.88 | | | | 49.28 | | | | 53.05 | | | | 49.28 | | | | 37.79 | |
| Close | | | 57.81 | | | | 61.10 | | | | 56.65 | | | | 55.28 | | | | 57.55 | | | | 55.40 | | | | 51.90 | | | | 57.79 | | | | 57.81 | | | | 57.55 | | | | 49.33 | |
Financial Measures(%) | | | | | | | | | | | | | | | | | | | | | | | | | | | | | | | | | | | | | | | | | | | | |
| Five-year average annual total shareholder return | | | 13.8 | | | | 17.4 | | | | 19.6 | | | | 21.8 | | | | 18.9 | | | | 18.7 | | | | 14.8 | | | | 15.2 | | | | 13.8 | | | | 18.9 | | | | 12.9 | |
| Dividend yield | | | 3.4 | | | | 3.0 | | | | 3.2 | | | | 3.2 | | | | 3.1 | | | | 2.9 | | | | 3.1 | | | | 2.4 | | | | 3.2 | | | | 2.8 | | | | 2.7 | |
| Diluted earnings per share growth | | | 19.8 | | | | (15.3 | ) | | | 3.6 | | | | 16.0 | | | | 9.3 | | | | 30.5 | | | | 45.5 | | | | 33.3 | | | | 5.0 | | | | 28.5 | | | | 28.4 | |
| Diluted cash earnings per share growth | | | 19.1 | | | | (15.0 | ) | | | 3.4 | | | | 15.5 | | | | 10.0 | | | | 28.3 | | | | 44.4 | | | | 30.4 | | | | 4.8 | | | | 27.3 | | | | 26.9 | |
| Return on equity | | | 19.8 | | | | 16.5 | | | | 19.5 | | | | 19.4 | | | | 17.8 | | | | 21.0 | | | | 20.4 | | | | 18.3 | | | | 18.8 | | | | 19.4 | | | | 16.4 | |
| Cash return on equity | | | 20.3 | | | | 17.1 | | | | 20.2 | | | | 20.0 | | | | 18.5 | | | | 21.7 | | | | 21.1 | | | | 19.0 | | | | 19.4 | | | | 20.1 | | | | 17.1 | |
| Net economic profit growth | | | 31.8 | | | | (37.4 | ) | | | (2.1 | ) | | | 22.0 | | | | 10.3 | | | | 53.7 | | | | 100+ | | | | 94.9 | | | | (0.3 | ) | | | 59.6 | | | | 91.8 | |
| Net income growth | | | 19.5 | | | | (16.0 | ) | | | 1.6 | | | | 15.4 | | | | 9.5 | | | | 30.6 | | | | 48.1 | | | | 34.5 | | | | 4.1 | | | | 29.4 | | | | 29.7 | |
| Revenue growth | | | 16.5 | | | | 2.1 | | | | (0.4 | ) | | | 3.4 | | | | (3.9 | ) | | | 3.8 | | | | 12.7 | | | | 3.8 | | | | 5.2 | | | | 3.9 | | | | 4.2 | |
| Revenue growth (teb) | | | 16.3 | | | | 2.0 | | | | (0.7 | ) | | | 2.9 | | | | (4.3 | ) | | | 4.0 | | | | 12.2 | | | | 3.7 | | | | 5.0 | | | | 3.7 | | | | 4.7 | |
| Net interest margin | | | 1.54 | | | | 1.61 | | | | 1.56 | | | | 1.61 | | | | 1.77 | | | | 1.82 | | | | 1.70 | | | | 1.82 | | | | 1.58 | | | | 1.78 | | | | 1.81 | |
| Net interest margin (teb) | | | 1.58 | | | | 1.65 | | | | 1.60 | | | | 1.64 | | | | 1.82 | | | | 1.87 | | | | 1.75 | | | | 1.88 | | | | 1.62 | | | | 1.83 | | | | 1.87 | |
| Non-interest expense-to-revenue ratio | | | 62.4 | | | | 65.5 | | | | 65.9 | | | | 63.6 | | | | 66.4 | | | | 65.2 | | | | 65.0 | | | | 66.9 | | | | 64.3 | | | | 65.9 | | | | 67.7 | |
| Non-interest expense-to-revenue ratio (teb) | | | 61.7 | | | | 64.7 | | | | 65.0 | | | | 62.9 | | | | 65.5 | | | | 64.3 | | | | 64.0 | | | | 65.9 | | | | 63.5 | | | | 64.9 | | | | 66.5 | |
| Cash non-interest expense-to-revenue ratio (teb) | | | 60.9 | | | | 63.8 | | | | 64.0 | | | | 61.9 | | | | 64.4 | | | | 63.2 | | | | 62.9 | | | | 64.7 | | | | 62.6 | | | | 63.8 | | | | 65.4 | |
| Provision for credit losses as a % of average net loans and acceptances | | | 0.13 | | | | 0.17 | | | | 0.01 | | | | 0.11 | | | | (0.03 | ) | | | (0.28 | ) | | | 0.01 | | | | 0.04 | | | | 0.11 | | | | (0.07 | ) | | | 0.30 | |
| Canadian/U.S. dollar average exchange rate ($) | | | 1.177 | | | | 1.235 | | | | 1.234 | | | | 1.210 | | | | 1.264 | | | | 1.342 | | | | 1.339 | | | | 1.307 | | | | 1.214 | | | | 1.313 | | | | 1.435 | |
| Gross impaired loans and acceptances as a % of equity and allowance for credit losses | | | 4.91 | | | | 5.92 | | | | 6.77 | | | | 7.10 | | | | 7.47 | | | | 8.90 | | | | 10.28 | | | | 12.58 | | | | 4.91 | | | | 7.47 | | | | 13.91 | |
| Cash and securities-to-total assets | | | 26.2 | | | | 26.8 | | | | 27.6 | | | | 25.0 | | | | 25.8 | | | | 27.3 | | | | 29.2 | | | | 29.1 | | | | 26.2 | | | | 25.8 | | | | 29.1 | |
| Tier 1 Capital Ratio | | | 10.25 | | | | 9.39 | | | | 9.38 | | | | 9.72 | | | | 9.81 | | | | 9.44 | | | | 9.67 | | | | 9.65 | | | | 10.25 | | | | 9.81 | | | | 9.55 | |
| |
In the opinion of Bank of Montreal management, information that is derived from unaudited financial information, including information as at and for interim periods, includes all adjustments necessary for a fair presentation of such information. All such adjustments are of a normal and recurring nature. Financial ratios for interim periods are stated on an annualized basis where appropriate, and all growth rates represent year-over-year growth. Ratios, as well as interim operating results, are not necessarily indicative of actual results for the full fiscal year.
| | | |
| BMO Financial Group 188th Annual Report 2005 | | 77 |
2004 Financial Performance Review
Earnings
Net income increased $525 million or 29% to $2,306 million in fiscal 2004 and earnings per share rose $0.98 or 29% to a then-record $4.42. Two-thirds of the increase was attributable to improved credit performance and the balance to strong operating group results. All three client operating groups improved their productivity and earned record net income in 2004. Return on equity was 19.4%, up from 16.4% in 2003.
Revenue
Revenue on a taxable equivalent basis rose $339 million or 3.7% in 2004 to $9,488 million, driven by growth in all operating groups. The weaker U.S. dollar reduced revenue growth in each of the operating groups and lowered BMO’s overall revenue growth by $243 million or 2.7 percentage points, while the incremental effects of acquired businesses added $91 million or 1.0 percentage points to revenue growth. The $339 million increase in revenue was almost entirely due to increased non-interest revenue, as higher net interest income in personal and commercial banking was largely offset by declines in Investment Banking Group and Private Client Group.
Provision for Credit Losses
There was a net recovery of credit losses of $103 million in 2004, consisting of $67 million of specific provisions and a $170 million reduction of the general allowance for credit losses. In 2003, results reflected specific provisions of $455 million with no change in the general allowance. The lower provision in 2004 was attributable to improved credit performance experienced over the year. New impaired loan formations were at half the levels of 2003 and at only a third of the levels of 2001 and 2002. As such, new specific provisions in 2004 totalled approximately half the amounts in the 2001 to 2002 period and, in addition, reversals and recoveries were high. Provisions in 2004 were lower than at any other point in the credit cycle.
Non-Interest Expense
Non-interest expense increased $70 million or 1.1% to $6,157 million, reflecting effective cost management. The incremental effects of acquired businesses increased expenses by $106 million (1.7%) while the weaker U.S. dollar reduced costs by $177 million (–2.9%). Higher performance-based compensation costs, associated with BMO’s 29% increase in net income, increased expenses by $90 million (1.5%) and higher pension costs increased expenses by $30 million (0.5%). Other expenses increased by only $21 million or 0.3%, as a change in accounting policy to capitalize costs of certain internally developed software in 2004 reduced expenses by $47 million.
Operating Groups Results
Personal and Commercial Client Group net income rose $68 million or 7% to $982 million, due to higher revenue, cost containment and a lower effective tax rate. Revenue increased $98 million or 2%, driven by strong volume growth in both Canadian and U.S. operations and the $20 million impact of U.S. acquisitions. The growth rate was mitigated by the $82 million impact of the weaker U.S. dollar, lower net interest margin and a $65 million ($42 million after tax) card fees adjustment. Excluding this adjustment, net income rose $110 million or 12%. Non-interest expense rose $7 million to $3,077 million, as the weaker U.S. dollar reduced costs by $58 million.
Private Client Group net income reached a then-record $227 million in 2004, an increase of $90 million or 7%. Revenue grew $117 million or 7% to $1,851 million. Revenue-generating initiatives and improved market conditions drove higher commission and fee-based revenue growth, particularly in full-service investing and the mutual fund businesses. Net interest income declined as the low interest rate environment affected net interest margin in term investment products. Non-interest expense fell $6 million to $1,504 million, contrasting favourably with growth of 12% in non-interest revenue and reflecting the group’s success in reducing non-revenue-based expenses. The weaker U.S. dollar reduced revenue growth by $48 million and expense growth by $53 million.
Investment Banking Group net income rose $141 million or 20% to a then-record $832 million, driven by higher revenue and a lower provision for credit losses. Revenue increased $180 million or 7%. There was a $189 million improvement in net investment securities gains, which was partially offset by $44 million of interest expense related to unwinding hedges associated with certain of the securities that were sold. The inclusion of Harris Nesbitt Gerard (HNG) results for the full year added $69 million of commissions and fees while equity and debt underwriting fees rose strongly. Interest income was affected by lower corporate loan balances and by compressed spreads in interest-rate-sensitive businesses, due to rising short-term interest rates. There was lower trading revenue, as commodity and interest rate trading revenue declined, while equity trading revenue increased. The weaker U.S. dollar reduced revenue by $124 million. The provision for credit losses declined $93 million due to an improved credit environment and a $39 million recovery on a loan that was previously written off. Non-interest expense increased $60 million or 4% as the $87 million incremental impact of the inclusion of HNG expenses and an increase in performance-based compensation were partially offset by the $58 million impact of the weaker U.S. dollar.
Corporate Support net income was $265 million, compared with $39 million in 2003. The improvement was attributable to a significantly lower provision for credit losses and higher net gains on investment securities and foreign exchange. These were partially offset by reduced net investment earnings in the lower interest rate environment and proportionately lower income tax benefits.
| | | |
| 78 | | BMO Financial Group 188th Annual Report 2005 |
Supplemental Information
Table 14Shareholder Value
| | | | | | | | | | | | | | | | | | | | | | | | | | | | | | | | | | | | | | | | | |
| As at or for the year ended October 31 | | 2005 | | | 2004 | | | 2003 | | | 2002 | | | 2001 | | | 2000 | | | 1999 | | | 1998 | | | 1997 | | | 1996 | |
| |
Market Price per Common Share ($) | | | | | | | | | | | | | | | | | | | | | | | | | | | | | | | | | | | | | | | | |
| High | | | 62.44 | | | | 59.65 | | | | 50.26 | | | | 40.65 | | | | 44.40 | | | | 35.80 | | | | 34.80 | | | | 43.50 | | | | 30.80 | | | | 20.83 | |
| Low | | | 53.05 | | | | 49.28 | | | | 37.79 | | | | 31.00 | | | | 32.75 | | | | 21.00 | | | | 24.68 | | | | 25.88 | | | | 19.53 | | | | 14.69 | |
| Close | | | 57.81 | | | | 57.55 | | | | 49.33 | | | | 38.10 | | | | 33.86 | | | | 35.25 | | | | 28.33 | | | | 31.55 | | | | 30.43 | | | | 20.28 | |
| | | | | | | | | | | | | | | | | | | | | | | | | | | | | | | | | | | | | | | | | |
Common Share Dividends | | | | | | | | | | | | | | | | | | | | | | | | | | | | | | | | | | | | | | | | |
| Dividends declared per share ($) | | | 1.85 | | | | 1.59 | | | | 1.34 | | | | 1.20 | | | | 1.12 | | | | 1.00 | | | | 0.94 | | | | 0.88 | | | | 0.82 | | | | 0.74 | |
| Dividends paid per share ($) | | | 1.80 | | | | 1.50 | | | | 1.29 | | | | 1.18 | | | | 1.09 | | | | 0.99 | | | | 0.93 | | | | 0.88 | | | | 0.80 | | | | 0.71 | |
| Dividend payout ratio (%) | | | 39.0 | | | | 35.0 | | | | 38.2 | | | | 44.0 | | | | 40.8 | | | | 30.2 | | | | 39.6 | | | | 37.4 | | | | 35.0 | | | | 35.1 | |
| Dividend yield (%) | | | 3.2 | | | | 2.8 | | | | 2.7 | | | | 3.1 | | | | 3.3 | | | | 2.8 | | | | 3.3 | | | | 2.8 | | | | 2.9 | | | | 3.9 | |
| | | | | | | | | | | | | | | | | | | | | | | | | | | | | | | | | | | | | | | | | |
Total Shareholder Return (%) | | | | | | | | | | | | | | | | | | | | | | | | | | | | | | | | | | | | | | | | |
| Five-year average annual return | | | 13.8 | | | | 18.9 | | | | 12.9 | | | | 7.9 | | | | 14.3 | | | | 22.9 | | | | 22.0 | | | | 23.3 | | | | 26.1 | | | | 22.2 | |
| One-year return | | | 3.7 | | | | 20.0 | | | | 33.4 | | | | 16.2 | | | | (1.2 | ) | | | 29.0 | | | | (7.4 | ) | | | 6.4 | | | | 55.0 | | | | 42.4 | |
| | | | | | | | | | | | | | | | | | | | | | | | | | | | | | | | | | | | | | | | | |
Common Share Information | | | | | | | | | | | | | | | | | | | | | | | | | | | | | | | | | | | | | | | | |
| Number outstanding (in thousands) | | | | | | | | | | | | | | | | | | | | | | | | | | | | | | | | | | | | | | | | |
| End of period | | | 500,219 | | | | 500,897 | | | | 499,632 | | | | 492,505 | | | | 489,085 | | | | 522,584 | | | | 534,064 | | | | 528,866 | | | | 522,873 | | | | 519,874 | |
| Average basic | | | 500,060 | | | | 501,656 | | | | 496,208 | | | | 490,816 | | | | 511,286 | | | | 531,318 | | | | 531,723 | | | | 525,021 | | | | 520,819 | | | | 522,465 | |
| Average diluted | | | 510,736 | | | | 515,045 | | | | 507,009 | | | | 499,464 | | | | 523,561 | | | | 540,815 | | | | 542,920 | | | | 542,181 | | | | 538,469 | | | | 538,271 | |
| Number of shareholder accounts | | | 40,104 | | | | 41,438 | | | | 42,880 | | | | 44,072 | | | | 45,190 | | | | 46,663 | | | | 49,369 | | | | 51,387 | | | | 53,651 | | | | 55,571 | |
| Book value per share ($) | | | 26.53 | | | | 24.24 | | | | 22.09 | | | | 21.07 | | | | 19.69 | | | | 19.63 | | | | 17.44 | | | | 16.36 | | | | 14.59 | | | | 12.94 | |
| Total market value of shares ($ billions) | | | 28.9 | | | | 28.8 | | | | 24.6 | | | | 18.8 | | | | 16.6 | | | | 18.4 | | | | 15.1 | | | | 16.7 | | | | 15.9 | | | | 10.5 | |
| Price-to-earnings multiple (based on diluted EPS) | | | 12.5 | | | | 13.0 | | | | 14.3 | | | | 14.2 | | | | 12.7 | | | | 10.8 | | | | 12.1 | | | | 13.8 | | | | 13.3 | | | | 9.8 | |
| Price-to-cash earnings multiple (based on diluted cash EPS) | | | 12.1 | | | | 12.6 | | | | 13.7 | | | | 13.5 | | | | 11.8 | | | | 10.4 | | | | 11.5 | | | | 13.0 | | | | 12.6 | | | | 9.3 | |
| Market-to-book value multiple | | | 2.18 | | | | 2.37 | | | | 2.23 | | | | 1.81 | | | | 1.72 | | | | 1.80 | | | | 1.62 | | | | 1.93 | | | | 2.09 | | | | 1.57 | |
| |
Table 24Summary Income Statement and Growth Statistics($ millions, except as noted)
| | | | | | | | | | | | | | | | | | | | | | | | | | | | | |
| | | | | | | | | | | | | | | | | | | | | | | 5-year | | | 10-year | |
| For the year ended October 31 | | 2005 | | | 2004 | | | 2003 | | | 2002 | | | 2001 | | | CAGR | (2) | | CAGR | (2) |
| |
Income Statement | | | | | | | | | | | | | | | | | | | | | | | | | | | | |
| Net interest income (teb) (1) | | | 4,906 | | | | 4,937 | | | | 4,929 | | | | 4,812 | | | | 4,527 | | | | 2.9 | | | | 3.2 | |
| Non-interest revenue | | | 5,052 | | | | 4,551 | | | | 4,220 | | | | 3,924 | | | | 4,222 | | | | 3.1 | | | | 9.2 | |
| |
| Total revenue (teb) (1) | | | 9,958 | | | | 9,488 | | | | 9,149 | | | | 8,736 | | | | 8,749 | | | | 3.0 | | | | 5.8 | |
| Provision for credit losses | | | 179 | | | | (103 | ) | | | 455 | | | | 820 | | | | 980 | | | | (13.0 | ) | | | (4.2 | ) |
| Non-interest expense | | | 6,327 | | | | 6,157 | | | | 6,087 | | | | 6,030 | | | | 5,671 | | | | 3.8 | | | | 5.8 | |
| |
| Income before provision for income taxes, non-controlling interest in subsidiaries and goodwill amortization | | | 3,452 | | | | 3,434 | | | | 2,607 | | | | 1,886 | | | | 2,098 | | | | 3.2 | | | | 6.9 | |
| Income taxes (teb) (1) | | | 994 | | | | 1,111 | | | | 804 | | | | 493 | | | | 621 | | | | (2.4 | ) | | | 2.9 | |
| Non-controlling interest in subsidiaries | | | 58 | | | | 17 | | | | 22 | | | | 20 | | | | 19 | | | | 26.9 | | | | 16.5 | |
| |
| Net income before goodwill amortization | | | 2,400 | | | | 2,306 | | | | 1,781 | | | | 1,373 | | | | 1,458 | | | | 5.7 | | | | 8.9 | |
| Amortization of goodwill, net of applicable income tax | | | – | | | | – | | | | – | | | | – | | | | 56 | | | | nm | | | | nm | |
| |
| Net income | | | 2,400 | | | | 2,306 | | | | 1,781 | | | | 1,373 | | | | 1,402 | | | | 6.3 | | | | 9.3 | |
| |
| Year-over-year growth (%) | | | 4.1 | | | | 29.4 | | | | 29.7 | | | | (2.1 | ) | | | (20.6 | ) | | | na | | | | na | |
| | | | | | | | | | | | | | | | | | | | | | | | | | | | | |
Earnings per Share (EPS)($) | | | | | | | | | | | | | | | | | | | | | | | | | | | | |
| Basic | | | 4.74 | | | | 4.53 | | | | 3.51 | | | | 2.73 | | | | 2.72 | | | | 7.5 | | | | 10.6 | |
| Diluted | | | 4.64 | | | | 4.42 | | | | 3.44 | | | | 2.68 | | | | 2.66 | | | | 7.4 | | | | 10.6 | |
| Year-over-year growth (%) | | | 5.0 | | | | 28.5 | | | | 28.4 | | | | 0.8 | | | | (18.2 | ) | | | (33.7 | ) | | | (9.4 | ) |
| | | | | | | | | | | | | | | | | | | | | | | | | | | | | |
Diluted Cash Earnings per Share (Cash EPS)($) (1) | | | 4.79 | | | | 4.57 | | | | 3.59 | | | | 2.83 | | | | 2.86 | | | | 7.2 | | | | 10.3 | |
| Year-over-year growth (%) | | | 4.8 | | | | 27.3 | | | | 26.9 | | | | (1.0 | ) | | | (15.6 | ) | | | na | | | | na | |
| |
| | |
| (1) Refer to the Non-GAAP Measures section on page 35. |
| |
| (2) Compound annual growth rate (CAGR) expressed as a percentage. |
| |
| nm – not meaningful |
| |
| na – not applicable |
| | | |
| BMO Financial Group 188th Annual Report 2005 | | 79 |
Table 34Returns on Equity and Assets($ millions, except as noted)
| | | | | | | | | | | | | | | | | | | | | | | | | | | | | | | | | | | | | | | | | |
| For the year ended October 31 | | 2005 | | | 2004 | | | 2003 | | | 2002 | | | 2001 | | | 2000 | | | 1999 | | | 1998 | | | 1997 | | | 1996 | |
| |
| Net income | | | 2,400 | | | | 2,306 | | | | 1,781 | | | | 1,373 | | | | 1,402 | | | | 1,766 | | | | 1,290 | | | | 1,260 | | | | 1,240 | | | | 1,118 | |
| Preferred dividends | | | 30 | | | | 31 | | | | 38 | | | | 35 | | | | 11 | | | | 10 | | | | 25 | | | | 22 | | | | 18 | | | | 19 | |
| |
| Net income available to common shareholders | | | 2,370 | | | | 2,275 | | | | 1,743 | | | | 1,338 | | | | 1,391 | | | | 1,756 | | | | 1,265 | | | | 1,238 | | | | 1,222 | | | | 1,099 | |
| Average common shareholders’ equity | | | 12,609 | | | | 11,720 | | | | 10,646 | | | | 9,973 | | | | 10,100 | | | | 9,745 | | | | 8,976 | | | | 8,128 | | | | 7,165 | | | | 6,457 | |
| | | | | | | | | | | | | | | | | | | | | | | | | | | | | | | | | | | | | | | | | |
| Return on equity (%) | | | 18.8 | | | | 19.4 | | | | 16.4 | | | | 13.4 | | | | 13.8 | | | | 18.0 | | | | 14.1 | | | | 15.2 | | | | 17.1 | | | | 17.0 | |
| Cash return on equity (%) | | | 19.4 | | | | 20.1 | | | | 17.1 | | | | 14.2 | | | | 14.8 | | | | 18.8 | | | | 14.8 | | | | 16.1 | | | | 18.0 | | | | 17.9 | |
| Return on average assets (%) | 0.79 | | | | 0.85 | | | | 0.67 | | | | 0.55 | | | | 0.58 | | | | 0.75 | | | | 0.57 | | | | 0.55 | | | | 0.63 | | | | 0.71 | |
| Return on average assets available to common shareholders (%) | | | 0.78 | | | | 0.84 | | | | 0.66 | | | | 0.54 | | | | 0.57 | | | | 0.75 | | | | 0.56 | | | | 0.54 | | | | 0.62 | | | | 0.69 | |
| |
Table 44Summary Balance Sheet($ millions)
| | | | | | | | | | | | | | | | | | | | | |
| As at October 31 | | 2005 | | | 2004 | | | 2003 | | | 2002 | | | 2001 | |
| |
Assets | | | | | | | | | | | | | | | | | | | | |
| Cash resources | | | 20,721 | | | | 18,045 | | | | 19,860 | | | | 19,305 | | | | 17,656 | |
| Securities | | | 57,256 | | | | 50,472 | | | | 54,790 | | | | 43,715 | | | | 37,676 | |
| Net loans and acceptances | | | 174,337 | | | | 156,248 | | | | 146,156 | | | | 149,596 | | | | 144,765 | |
| Other assets | | | 45,218 | | | | 40,429 | | | | 35,688 | | | | 40,248 | | | | 39,312 | |
| |
| Total assets | | | 297,532 | | | | 265,194 | | | | 256,494 | | | | 252,864 | | | | 239,409 | |
| |
Liabilities and Shareholders’ Equity | | | | | | | | | | | | | | | | | | | | |
| Deposits | | | 193,793 | | | | 175,190 | | | | 171,551 | | | | 161,838 | | | | 154,290 | |
| Other liabilities | | | 85,804 | | | | 73,270 | | | | 68,455 | | | | 74,188 | | | | 68,613 | |
| Subordinated debt | | | 2,469 | | | | 2,395 | | | | 2,856 | | | | 3,794 | | | | 4,674 | |
| Preferred share liability | | | 450 | | | | 450 | | | | 850 | | | | 850 | | | | 850 | |
| Capital trust securities | | | 1,150 | | | | 1,150 | | | | 1,150 | | | | 1,150 | | | | 1,150 | |
| Share capital | | | | | | | | | | | | | | | | | | | | |
| Preferred | | | 596 | | | | 596 | | | | 596 | | | | 667 | | | | 200 | |
| Common | | | 4,022 | | | | 3,857 | | | | 3,662 | | | | 3,459 | | | | 3,375 | |
| Contributed surplus | | | 20 | | | | 10 | | | | 3 | | | | – | | | | – | |
| Net unrealized foreign exchange gain (loss) | | | (612 | ) | | | (497 | ) | | | (195 | ) | | | 419 | | | | 500 | |
| Retained earnings | | | 9,840 | | | | 8,773 | | | | 7,566 | | | | 6,499 | | | | 5,757 | |
| |
| Total liabilities and shareholders’ equity | | | 297,532 | | | | 265,194 | | | | 256,494 | | | | 252,864 | | | | 239,409 | |
| |
Average Daily Balances | | | | | | | | | | | | | | | | | | | | |
| Net loans and acceptances | | | 169,523 | | | | 154,863 | | | | 150,784 | | | | 147,443 | | | | 147,370 | |
| Assets | | | 303,160 | | | | 269,792 | | | | 263,966 | | | | 247,990 | | | | 243,248 | |
| |
Table 54Liquid Assets($ millions, except as noted)
| | | | | | | | | | | | | | | | | | | | | |
| As at October 31 | | 2005 | | | 2004 | | | 2003 | | | 2002 | | | 2001 | |
| |
Canadian Dollar Liquid Assets | | | | | | | | | | | | | | | | | | | | |
| Deposits with other banks | | | 1,855 | | | | 2,270 | | | | 1,330 | | | | 1,892 | | | | 1,535 | |
| Other cash resources | | | 586 | | | | (5 | ) | | | 1,313 | | | | 2,178 | | | | 1,296 | |
| Securities | | | 28,945 | | | | 26,006 | | | | 28,790 | | | | 23,471 | | | | 16,398 | |
| |
| Total Canadian dollar liquid assets | | | 31,386 | | | | 28,271 | | | | 31,433 | | | | 27,541 | | | | 19,229 | |
| |
U.S. Dollar and Other Currencies Liquid Assets | | | | | | | | | | | | | | | | | | | | |
| Deposits with other banks | | | 17,232 | | | | 14,256 | | | | 16,774 | | | | 14,445 | | | | 13,431 | |
| Other cash resources | | | 1,048 | | | | 1,524 | | | | 443 | | | | 790 | | | | 1,394 | |
| Securities | | | 28,311 | | | | 24,466 | | | | 26,000 | | | | 20,244 | | | | 21,278 | |
| |
| Total U.S. dollar and other currencies liquid assets | | | 46,591 | | | | 40,246 | | | | 43,217 | | | | 35,479 | | | | 36,103 | |
| |
Total Liquid Assets (1) | | | 77,977 | | | | 68,517 | | | | 74,650 | | | | 63,020 | | | | 55,332 | |
| Cash and securities-to-total assets (%) | | | 26.2 | | | | 25.8 | | | | 29.1 | | | | 24.9 | | | | 23.1 | |
| Pledged assets included in total liquid assets (2) | | | 27,760 | | | | 18,812 | | | | 18,698 | | | | 18,859 | | | | 16,106 | |
| |
| | |
| (1) | Includes liquid assets pledged as security for securities sold but not yet purchased, securities lent or sold under repurchase agreements and other secured liabilities. |
| |
| (2) | Includes reserves or minimum balances which some of our subsidiaries are required to maintain with central banks in their respective countries of operation. |
| | | |
| 80 | | BMO Financial Group 188th Annual Report 2005 |
Table 64Average Deposits($ millions, except as noted)
| | | | | | | | | | | | | | | | | | | | | | | | | |
| | | 2005 | | | 2004 | | | 2003 | |
| | | Average | | | Average | | | Average | | | Average | | | Average | | | Average | |
| | | balance | | | rate paid (%) | | | balance | | | rate paid (%) | | | balance | | | rate paid (%) | |
| |
Deposits Booked in Canada | | | | | | | | | | | | | | | | | | | | | | | | |
| Demand deposits – interest bearing | | | 7,933 | | | | 1.14 | | | | 7,717 | | | | 0.69 | | | | 7,096 | | | | 0.87 | |
| Demand deposits – non-interest bearing | | | 10,861 | | | | – | | | | 10,000 | | | | – | | | | 9,244 | | | | – | |
| Payable after notice | | | 37,287 | | | | 1.39 | | | | 36,187 | | | | 1.26 | | | | 33,392 | | | | 1.47 | |
| Payable on a fixed date | | | 68,019 | | | | 2.33 | | | | 64,413 | | | | 2.07 | | | | 57,175 | | | | 2.34 | |
| |
| Total deposits booked in Canada | | | 124,100 | | | | 1.77 | | | | 118,317 | | | | 1.56 | | | | 106,907 | | | | 1.77 | |
| | | | | | | | | | | | | | | | | | | | | | | | | |
Deposits Booked in the United States and Other Countries | | | | | | | | | | | | | | | | | | | | | | | | |
| U.S. demand deposits | | | 9,930 | | | | 1.56 | | | | 10,174 | | | | 0.75 | | | | 10,700 | | | | 0.85 | |
| Other U.S. deposits payable after notice or on a fixed date | | | 31,051 | | | | 2.21 | | | | 29,372 | | | | 1.40 | | | | 32,729 | | | | 2.02 | |
| Deposits booked in other countries | | | 21,607 | | | | 3.08 | | | | 20,077 | | | | 2.05 | | | | 15,282 | | | | 2.05 | |
| |
Total Average Deposits | | | 186,688 | | | | 1.98 | | | | 177,940 | | | | 1.54 | | | | 165,618 | | | | 1.79 | |
| |
As at October 31, 2005, 2004 and 2003: deposits by foreign depositors in our Canadian bank offices amounted to $9,515 million, $9,838 million and $8,739 million, respectively; total deposits payable after notice included $18,766 million, $19,225 million and $18,691 million, respectively, of chequing accounts that would have been classified as demand deposits under U.S. reporting requirements; and
total deposits payable on a fixed date included $21,477 million, $19,542 million and $18,872 million, respectively, of federal funds purchased and commercial paper issued. These amounts would have been classified as short-term borrowings for U.S. reporting purposes.
Table 74Unrealized Gains (Losses) on Investment Securities($ millions)
| | | | | | | | | | | | | | | | | | | | | | | | | | | | | |
| | | | | | | | | | | Unrealized gains (losses) (1) | |
| As at October 31 | | Book value | | | Fair value | | | 2005 | | | 2004 | | | 2003 | | | 2002 | | | 2001 | |
| |
Government Debt and Other Securities | | | | | | | | | | | | | | | | | | | | | | | | | | | | |
| Canadian governments | | | 22 | | | | 22 | | | | – | | | | – | | | | 1 | | | | (2 | ) | | | (13 | ) |
| U.S. governments | | | 7,508 | | | | 7,485 | | | | (23 | ) | | | – | | | | 134 | | | | 249 | | | | 202 | |
| Mortgage-backed securities | | | 686 | | | | 679 | | | | (7 | ) | | | 4 | | | | 15 | | | | 29 | | | | 53 | |
| Corporate debt | | | 2,301 | | | | 2,307 | | | | 6 | | | | 21 | | | | 89 | | | | 62 | | | | 11 | |
| Corporate equity | | | 2,296 | | | | 2,316 | | | | 20 | | | | 60 | | | | 71 | | | | (19 | ) | | | (12 | ) |
| Other governments | | | 123 | | | | 124 | | | | 1 | | | | 1 | | | | 2 | | | | 2 | | | | 3 | |
| |
| Total investment securities | | | 12,936 | | | | 12,933 | | | | (3 | ) | | | 86 | | | | 312 | | | | 321 | | | | 244 | |
| |
| |
| (1) | Unrealized gains (losses) may be offset by related losses (gains) on liabilities or by hedge contracts. |
Table 84Contractual Obligations($ millions)
| | | | | | | | | | | | | | | | | | | | | | | | | |
| | | Less than | | | 1-3 | | | 4-5 | | | Over 5 | | | No fixed | | | | |
| As at October 31, 2005 | | one year | | | years | | | years | | | years | | | maturity | | | Total | |
| |
| Subordinated debt | | | – | | | | 354 | | | | 140 | | | | 1,975 | | | | – | | | | 2,469 | |
| Operating leases | | | 202 | | | | 330 | | | | 239 | | | | 693 | | | | – | | | | 1,464 | |
| Deposits (1) | | | 91,779 | | | | 18,399 | | | | 4,695 | | | | 2,358 | | | | 76,562 | | | | 193,793 | |
| Capital trust securities (2) | | | – | | | | – | | | | – | | | | 2,192 | | | | – | | | | 2,192 | |
| |
| Total | | | 91,981 | | | | 19,083 | | | | 5,074 | | | | 7,218 | | | | 76,562 | | | | 199,918 | |
| |
| |
| (1) | Includes fixed maturity deposits of $18.2 billion that are redeemable at the customers’ option under certain conditions. |
| |
| (2) | Represents Innovative Tier 1 capital instruments. |
| | | |
| BMO Financial Group 188th Annual Report 2005 | | 81 |
Table 94Other Statistical Information
| | | | | | | | | | | | | | | | | | | | | | | | | | | | | | | | | | | | | | | | | |
| As at October 31 | | 2005 | | | 2004 | | | 2003 | | | 2002 | | | 2001 | | | 2000 | | | 1999 | | | 1998 | | | 1997 | | | 1996 | |
| |
Other Information | | | | | | | | | | | | | | | | | | | | | | | | | | | | | | | | | | | | | | | | |
| Employees (1) | | | 33,785 | | | | 33,593 | | | | 33,993 | | | | 34,568 | | | | 34,693 | | | | 33,884 | | | | 33,464 | | | | 33,400 | | | | 34,286 | | | | 33,468 | |
| Bank branches | | | 1,180 | | | | 1,174 | | | | 1,142 | | | | 1,134 | | | | 1,129 | | | | 1,135 | | | | 1,198 | | | | 1,216 | | | | 1,246 | | | | 1,296 | |
| Automated banking machines (Canada) | | | 1,952 | | | | 1,993 | | | | 2,023 | | | | 2,000 | | | | 1,982 | | | | 1,987 | | | | 2,039 | | | | 2,069 | | | | 2,035 | | | | 2,017 | |
| | | | | | | | | | | | | | | | | | | | | | | | | | | | | | | | | | | | | | | | | |
Rates | | | | | | | | | | | | | | | | | | | | | | | | | | | | | | | | | | | | | | | | |
| Average Canadian prime rate (%) | | | 4.30 | | | | 4.05 | | | | 4.69 | | | | 4.15 | | | | 6.55 | | | | 7.05 | | | | 6.49 | | | | 6.44 | | | | 4.80 | | | | 6.67 | |
| Average U.S. prime rate (%) | 5.85 | | | | 4.17 | | | | 4.17 | | | | 4.79 | | | | 7.68 | | | | 9.18 | | | | 8.00 | | | | 8.59 | | | | 8.51 | | | | 8.49 | |
| Canadian/U.S. dollar exchange rates ($) | | | | | | | | | | | | | | | | | | | | | | | | | | | | | | | | | | | | | | | | |
| High | | | 1.27 | | | | 1.40 | | | | 1.59 | | | | 1.61 | | | | 1.49 | | | | 1.44 | | | | 1.45 | | | | 1.40 | | | | 1.33 | | | | 1.34 | |
| Low | | | 1.16 | | | | 1.22 | | | | 1.30 | | | | 1.51 | | | | 1.59 | | | | 1.53 | | | | 1.56 | | | | 1.58 | | | | 1.41 | | | | 1.38 | |
| Average | | | 1.22 | | | | 1.32 | | | | 1.44 | | | | 1.57 | | | | 1.54 | | | | 1.48 | | | | 1.50 | | | | 1.46 | | | | 1.37 | | | | 1.37 | |
| End of period | | | 1.18 | | | | 1.22 | | | | 1.32 | | | | 1.56 | | | | 1.59 | | | | 1.52 | | | | 1.47 | | | | 1.54 | | | | 1.41 | | | | 1.34 | |
| |
| | |
| (1) | | Reflects full-time equivalent number of employees, comprising full-time and part-time employees and adjustments for overtime hours. |
Table 104Revenue and Revenue Growth($ millions, except as noted)
| | | | | | | | | | | | | | | | | | | | | | | | | | | | | |
| | | | | | | | | | | | | | | | | | | | | | | 5-year | | | 10-year | |
| For the year ended October 31 | | 2005 | | | 2004 | | | 2003 | | | 2002 | | | 2001 | | | CAGR | | | CAGR | |
| |
Net Interest Income | | | | | | | | | | | | | | | | | | | | | | | | | | | | |
| Net interest income as reported | | | 4,787 | | | | 4,798 | | | | 4,777 | | | | 4,706 | | | | 4,385 | | | | 3.1 | | | | 3.2 | |
| Taxable equivalent basis adjustment (teb) | | | 119 | | | | 139 | | | | 152 | | | | 106 | | | | 142 | | | | (2.4 | ) | | | 3.5 | |
| |
| Net interest income (teb) | | | 4,906 | | | | 4,937 | | | | 4,929 | | | | 4,812 | | | | 4,527 | | | | 2.9 | | | | 3.2 | |
| |
| Year-over-year growth (%) | | | (0.6 | ) | | | 0.2 | | | | 2.4 | | | | 6.3 | | | | 6.6 | | | | na | | | | na | |
| | | | | | | | | | | | | | | | | | | | | | | | | | | | | |
Net Interest Margin | | | | | | | | | | | | | | | | | | | | | | | | | | | | |
| Total average assets | | | 303,160 | | | | 269,792 | | | | 263,966 | | | | 247,990 | | | | 243,248 | | | | 5.2 | | | | 7.7 | |
| Net interest margin (as reported) (%) | 1.58 | | | | 1.78 | | | | 1.81 | | | | 1.90 | | | | 1.80 | | | | na | | | | na | |
| Net interest margin (teb) (%) | | | 1.62 | | | | 1.83 | | | | 1.87 | | | | 1.94 | | | | 1.86 | | | | na | | | | na | |
| Canadian dollar net interest margin (teb) (%) | | | 1.87 | | | | 2.09 | | | | 2.28 | | | | 2.49 | | | | 2.68 | | | | na | | | | na | |
| U.S. dollar and other currencies net interest margin (teb) (%) | | | 1.10 | | | | 1.37 | | | | 1.32 | | | | 1.37 | | | | 1.15 | | | | na | | | | na | |
| | | | | | | | | | | | | | | | | | | | | | | | | | | | | |
Non-Interest Revenue | | | | | | | | | | | | | | | | | | | | | | | | | | | | |
| Securities commissions and fees | | | 1,092 | | | | 1,055 | | | | 894 | | | | 813 | | | | 742 | | | | 4.9 | | | | 13.3 | |
| Deposit and payment service charges | | | 734 | | | | 746 | | | | 756 | | | | 732 | | | | 670 | | | | 2.6 | | | | 5.0 | |
| Trading revenues | | | 413 | | | | 200 | | | | 275 | | | | 209 | | | | 490 | | | | 1.3 | | | | 6.3 | |
| Lending fees | | | 313 | | | | 317 | | | | 293 | | | | 306 | | | | 352 | | | | (0.6 | ) | | | 5.3 | |
| Card fees | | | 334 | | | | 261 | | | | 290 | | | | 260 | | | | 204 | | | | 9.1 | | | | 3.8 | |
| Investment management and custodial fees | | | 305 | | | | 307 | | | | 303 | | | | 314 | | | | 336 | | | | (4.0 | ) | | | 2.4 | |
| Mutual fund revenues | | | 437 | | | | 378 | | | | 321 | | | | 309 | | | | 251 | | | | 13.6 | | | | 23.6 | |
| Securitization revenues | | | 113 | | | | 177 | | | | 244 | | | | 329 | | | | 331 | | | | (20.0 | ) | | | NA | |
| Underwriting and advisory fees | | | 357 | | | | 343 | | | | 268 | | | | 228 | | | | 234 | | | | 11.2 | | | | NA | |
| Investment securities gains (losses) | | | 165 | | | | 175 | | | | (41 | ) | | | (146 | ) | | | 123 | | | | (2.2 | ) | | | 13.6 | |
| Foreign exchange, other than trading | | | 180 | | | | 177 | | | | 160 | | | | 151 | | | | 127 | | | | 4.2 | | | | 6.1 | |
| Insurance income | | | 162 | | | | 139 | | | | 124 | | | | 105 | | | | 125 | | | | 11.1 | | | | 16.4 | |
| Other revenues | | | 447 | | | | 276 | | | | 333 | | | | 314 | | | | 237 | | | | (11.7 | ) | | | 15.0 | |
| |
| Total non-interest revenue | | | 5,052 | | | | 4,551 | | | | 4,220 | | | | 3,924 | | | | 4,222 | | | | 3.1 | | | | 9.2 | |
| |
| Year-over-year growth (%) | | | 11.0 | | | | 7.8 | | | | 7.6 | | | | (7.1 | ) | | | (2.4 | ) | | | na | | | | na | |
| Non-interest revenue as a % of total revenue (teb) | | | 50.7 | | | | 48.0 | | | | 46.1 | | | | 44.9 | | | | 48.3 | | | | na | | | | na | |
| |
Total Revenue (as reported) | | | 9,839 | | | | 9,349 | | | | 8,997 | | | | 8,630 | | | | 8,607 | | | | 3.1 | | | | 5.8 | |
Total Revenue (teb) | | | 9,958 | | | | 9,488 | | | | 9,149 | | | | 8,736 | | | | 8,749 | | | | 3.0 | | | | 5.8 | |
| Year-over-year growth (teb) (%) | 5.0 | | | | 3.7 | | | | 4.7 | | | | (0.1 | ) | | | 2.1 | | | | na | | | | na | |
| |
| | |
| NA – not available |
| |
| na – not applicable |
| |
| |
| | | |
| 82 | | BMO Financial Group 188th Annual Report 2005 |
Table 114Non-Interest Expense and Expense-to-Revenue Ratio($ millions, except as noted)
| | | | | | | | | | | | | | | | | | | | | | | | | | | | | |
| | | | | | | | | | | | | | | | | | | | | | | 5-year | | | 10-year | |
| For the year ended October 31 | | 2005 | | | 2004 | | | 2003 | | | 2002 | | | 2001 | | | CAGR | | | CAGR | |
| |
Non-Interest Expense | | | | | | | | | | | | | | | | | | | | | | | | | | | | |
| Employee compensation | | | | | | | | | | | | | | | | | | | | | | | | | | | | |
| Salaries | | | 1,903 | | | | 1,901 | | | | 1,981 | | | | 2,021 | | | | 1,883 | | | | 1.1 | | | | 0.8 | |
| Performance-based compensation | | | 1,272 | | | | 1,148 | | | | 1,058 | | | | 941 | | | | 974 | | | | 5.0 | | | | NA | |
| Employee benefits | | | 571 | | | | 583 | | | | 539 | | | | 441 | | | | 355 | | | | 16.6 | | | | 9.0 | |
| |
| Total employee compensation | | | 3,746 | | | | 3,632 | | | | 3,578 | | | | 3,403 | | | | 3,212 | | | | 4.1 | | | | 6.5 | |
| |
| Premises and equipment | | | | | | | | | | | | | | | | | | | | | | | | | | | | |
| Rental of real estate | | | 198 | | | | 182 | | | | 174 | | | | 179 | | | | 134 | | | | 8.7 | | | | 3.8 | |
| Premises, furniture and fixtures | | | 253 | | | | 263 | | | | 271 | | | | 286 | | | | 289 | | | | (1.4 | ) | | | 2.1 | |
| Property taxes | | | 45 | | | | 52 | | | | 52 | | | | 52 | | | | 52 | | | | (0.9 | ) | | | 0.8 | |
| Computers and equipment | | | 768 | | | | 755 | | | | 767 | | | | 763 | | | | 678 | | | | 4.3 | | | | 10.0 | |
| |
| Total premises and equipment | | | 1,264 | | | | 1,252 | | | | 1,264 | | | | 1,280 | | | | 1,153 | | | | 3.4 | | | | 6.4 | |
| |
| Other expenses | | | | | | | | | | | | | | | | | | | | | | | | | | | | |
| Communications | | | 122 | | | | 138 | | | | 162 | | | | 173 | | | | 194 | | | | (14.1 | ) | | | (5.2 | ) |
| Business and capital taxes | | | 107 | | | | 99 | | | | 106 | | | | 77 | | | | 103 | | | | (0.7 | ) | | | (0.3 | ) |
| Professional fees | | | 243 | | | | 262 | | | | 255 | | | | 291 | | | | 288 | | | | (6.2 | ) | | | 5.6 | |
| Travel and business development | | | 247 | | | | 239 | | | | 225 | | | | 261 | | | | 248 | | | | 0.9 | | | | 4.4 | |
| Other | | | 504 | | | | 431 | | | | 392 | | | | 458 | | | | 430 | | | | 20.2 | | | | 7.7 | |
| |
| Total other expenses | | | 1,223 | | | | 1,169 | | | | 1,140 | | | | 1,260 | | | | 1,263 | | | | 1.4 | | | | 3.6 | |
| |
| Amortization of intangible assets | | | 94 | | | | 104 | | | | 105 | | | | 87 | | | | 43 | | | | 32.1 | | | | 20.5 | |
| |
Total Non-Interest Expense | | | 6,327 | | | | 6,157 | | | | 6,087 | | | | 6,030 | | | | 5,671 | | | | 3.8 | | | | 5.8 | |
| |
| Year-over-year growth (%) | | | 2.8 | | | | 1.1 | | | | 0.9 | | | | 6.3 | | | | 7.8 | | | | na | | | | na | |
| Non-interest expense-to-revenue ratio (%) | | | 63.5 | | | | 64.9 | | | | 66.5 | | | | 69.0 | | | | 64.8 | | | | na | | | | na | |
| | | | | | | | | | | | | | | | | | | | | | | | | | | | | |
Government Levies and Taxes (1) | | | | | | | | | | | | | | | | | | | | | | | | | | | | |
| Government levies other than income taxes | | | | | | | | | | | | | | | | | | | | | | | | | | | | |
| Payroll levies | | | 152 | | | | 163 | | | | 156 | | | | 150 | | | | 148 | | | | 2.7 | | | | 3.7 | |
| Property taxes | | | 45 | | | | 52 | | | | 52 | | | | 52 | | | | 52 | | | | (0.9 | ) | | | 0.8 | |
| Provincial capital taxes | | | 100 | | | | 91 | | | | 100 | | | | 69 | | | | 93 | | | | (0.1 | ) | | | 1.7 | |
| Business taxes | | | 7 | | | | 8 | | | | 6 | | | | 8 | | | | 10 | | | | (7.0 | ) | | | (12.1 | ) |
| Goods and services tax and sales tax | | | 127 | | | | 149 | | | | 158 | | | | 142 | | | | 126 | | | | 0.2 | | | | 3.7 | |
| |
| Total government levies other than income taxes | | | 431 | | | | 463 | | | | 472 | | | | 421 | | | | 429 | | | | 0.7 | | | | 2.2 | |
| |
| Provision for (recovery of) income taxes reported in: | | | | | | | | | | | | | | | | | | | | | | | | | | | | |
| Statement of income | | | | | | | | | | | | | | | | | | | | | | | | | | | | |
| Provision | | | 875 | | | | 972 | | | | 652 | | | | 387 | | | | 479 | | | | (2.4 | ) | | | 2.8 | |
| Amortization of goodwill | | | – | | | | – | | | | – | | | | – | | | | (6 | ) | | | nm | | | | nm | |
| Statement of retained earnings | | | 101 | | | | 246 | | | | 601 | | | | 77 | | | | (350 | ) | | | nm | | | | nm | |
| |
| Total income taxes | | | 976 | | | | 1,218 | | | | 1,253 | | | | 464 | | | | 123 | | | | 3.3 | | | | 3.8 | |
| |
Total Government Levies and Taxes | | | 1,407 | | | | 1,681 | | | | 1,725 | | | | 885 | | | | 552 | | | | 2.4 | | | | 3.3 | |
| |
| Total government levies and taxes as a % of net income before taxes and government levies | | | 37.9 | | | | 44.9 | | | | 59.4 | | | | 40.6 | | | | 24.0 | | | | na | | | | na | |
| Effective tax rate (teb) | | | 28.8 | | | | 32.4 | | | | 30.8 | | | | 26.2 | | | | 29.6 | | | | na | | | | na | |
| |
| | |
| (1) | | Government levies are included in various non-interest expense categories. |
| |
| NA – not available |
| |
| na – not applicable |
| |
| nm – not meaningful |
| | | |
| BMO Financial Group 188th Annual Report 2005 | | 83 |
Table 124Average Assets, Liabilities and Interest Rates (teb)($ millions, except as noted)
| | | | | | �� | | | | | | | | | | | | | | | | | | | | | | | | | | | | | | | |
| | | 2005 | | | 2004 | | | 2003 | |
| | | | | | | Average | | | Interest | | | | | | | Average | | | Interest | | | | | | | Average | | | Interest | |
| | | Average | | | interest | | | income/ | | | Average | | | interest | | | income/ | | | Average | | | interest | | | income/ | |
| For the year ended October 31 | | balances | | | rate (%) | | | expense | | | balances | | | rate (%) | | | expense | | | balances | | | rate (%) | | | expense | |
| |
Assets | | | | | | | | | | | | | | | | | | | | | | | | | | | | | | | | | | | | |
Canadian Dollar | | | | | | | | | | | | | | | | | | | | | | | | | | | | | | | | | | | | |
| Deposits with other banks | | | 1,908 | | | | 2.65 | | | | 51 | | | | 1,682 | | | | 2.50 | | | | 42 | | | | 1,679 | | | | 3.07 | | | | 52 | |
| Securities | | | 29,967 | | | | 3.79 | | | | 1,136 | | | | 28,924 | | | | 3.25 | | | | 940 | | | | 27,041 | | | | 3.45 | | | | 933 | |
| Loans | | | | | | | | | | | | | | | | | | | | | | | | | | | | | | | | | | | | |
| Residential mortgages | | | 51,954 | | | | 4.58 | | | | 2,379 | | | | 48,592 | | | | 4.90 | | | | 2,380 | | | | 43,804 | | | | 5.31 | | | | 2,324 | |
| Non-residential mortgages | | | 2,483 | | | | 5.78 | | | | 144 | | | | 2,439 | | | | 6.27 | | | | 153 | | | | 2,352 | | | | 6.40 | | | | 151 | |
| Consumer instalment and other personal | | | 17,494 | | | | 5.49 | | | | 960 | | | | 15,863 | | | | 5.34 | | | | 847 | | | | 14,964 | | | | 6.12 | | | | 916 | |
| Credit cards | | | 4,244 | | | | 10.80 | | | | 458 | | | | 3,288 | | | | 10.63 | | | | 349 | | | | 2,570 | | | | 10.78 | | | | 277 | |
| Businesses and governments (1) | | | 43,248 | | | | 3.63 | | | | 1,570 | | | | 33,002 | | | | 4.02 | | | | 1,326 | | | | 29,158 | | | | 4.87 | | | | 1,419 | |
| |
| Total loans | | | 119,423 | | | | 4.61 | | | | 5,511 | | | | 103,184 | | | | 4.90 | | | | 5,055 | | | | 92,848 | | | | 5.48 | | | | 5,087 | |
| |
| Other non-interest bearing assets | | | 52,942 | | | | | | | | | | | | 39,313 | | | | | | | | | | | | 29,877 | | | | | | | | | |
| |
| Total Canadian dollar | | | 204,240 | | | | 3.28 | | | | 6,698 | | | | 173,103 | | | | 3.49 | | | | 6,037 | | | | 151,445 | | | | 4.01 | | | | 6,072 | |
| |
U.S. Dollar and Other Currencies | | | | | | | | | | | | | | | | | | | | | | | | | | | | | | | | | | | | |
| Deposits with other banks | | | 16,555 | | | | 3.35 | | | | 555 | | | | 17,408 | | | | 2.28 | | | | 396 | | | | 13,720 | | | | 2.22 | | | | 304 | |
| Securities | | | 28,790 | | | | 2.82 | | | | 813 | | | | 26,070 | | | | 2.59 | | | | 675 | | | | 24,977 | | | | 3.28 | | | | 819 | |
| Loans | | | | | | | | | | | | | | | | | | | | | | | | | | | | | | | | | | | | |
| Residential mortgages | | | 6,092 | | | | 4.64 | | | | 283 | | | | 5,848 | | | | 4.54 | | | | 266 | | | | 5,646 | | | | 5.03 | | | | 284 | |
| Non-residential mortgages | | | 2,521 | | | | 5.92 | | | | 149 | | | | 2,158 | | | | 5.63 | | | | 122 | | | | 2,008 | | | | 6.35 | | | | 127 | |
| Consumer instalment and other personal | | | 8,679 | | | | 4.87 | | | | 423 | | | | 7,352 | | | | 4.45 | | | | 327 | | | | 6,330 | | | | 5.16 | | | | 326 | |
| Credit cards | | | 21 | | | | 5.44 | | | | 1 | | | | 24 | | | | 4.89 | | | | 1 | | | | 59 | | | | 2.88 | | | | 2 | |
| Businesses and governments (1) | | | 27,277 | | | | 4.99 | | | | 1,362 | | | | 30,781 | | | | 3.16 | | | | 973 | | | | 37,424 | | | | 3.06 | | | | 1,145 | |
| |
| Total loans | | | 44,590 | | | | 4.97 | | | | 2,218 | | | | 46,163 | | | | 3.66 | | | | 1,689 | | | | 51,467 | | | | 3.66 | | | | 1,884 | |
| |
| Other non-interest bearing assets | | | 8,985 | | | | | | | | | | | | 7,048 | | | | | | | | | | | | 22,357 | | | | | | | | | |
| |
| Total U.S. dollar and other currencies | | | 98,920 | | | | 3.63 | | | | 3,586 | | | | 96,689 | | | | 2.85 | | | | 2,760 | | | | 112,521 | | | | 2.67 | | | | 3,007 | |
| |
Total All Currencies | | | | | | | | | | | | | | | | | | | | | | | | | | | | | | | | | | | | |
| Total assets and interest income | | | 303,160 | | | | 3.39 | | | | 10,284 | | | | 269,792 | | | | 3.26 | | | | 8,797 | | | | 263,966 | | | | 3.44 | | | | 9,079 | |
| |
Liabilities | | | | | | | | | | | | | | | | | | | | | | | | | | | | | | | | | | | | |
Canadian Dollar | | | | | | | | | | | | | | | | | | | | | | | | | | | | | | | | | | | | |
| Deposits | | | | | | | | | | | | | | | | | | | | | | | | | | | | | | | | | | | | |
| Banks | | | 2,752 | | | | 2.00 | | | | 55 | | | | 1,737 | | | | 1.70 | | | | 30 | | | | 1,609 | | | | 2.29 | | | | 37 | |
| Businesses and governments | | | 49,975 | | | | 1.05 | | | | 524 | | | | 45,200 | | | | 0.83 | | | | 376 | | | | 37,403 | | | | 1.10 | | | | 411 | |
| Individuals | | | 57,471 | | | | 2.07 | | | | 1,193 | | | | 56,783 | | | | 2.18 | | | | 1,238 | | | | 55,037 | | | | 2.48 | | | | 1,365 | |
| |
| Total deposits | | | 110,198 | | | | 1.61 | | | | 1,772 | | | | 103,720 | | | | 1.58 | | | | 1,644 | | | | 94,049 | | | | 1.93 | | | | 1,813 | |
| Subordinated debt and other interest bearing liabilities | | | 32,435 | | | | 3.42 | | | | 1,109 | | | | 19,599 | | | | 3.99 | | | | 781 | | | | 17,350 | | | | 4.67 | | | | 810 | |
| Other non-interest bearing liabilities | | | 48,795 | | | | | | | | | | | | 37,049 | | | | | | | | | | | | 28,274 | | | | | | | | | |
| |
| Total Canadian dollar | | | 191,428 | | | | 1.50 | | | | 2,881 | | | | 160,368 | | | | 1.51 | | | | 2,425 | | | | 139,673 | | | | 1.88 | | | | 2,623 | |
| |
U.S. Dollar and Other Currencies | | | | | | | | | | | | | | | | | | | | | | | | | | | | | | | | | | | | |
| Deposits | | | | | | | | | | | | | | | | | | | | | | | | | | | | | | | | | | | | |
| Banks | | | 21,975 | | | | 2.93 | | | | 644 | | | | 22,539 | | | | 1.53 | | | | 345 | | | | 20,428 | | | | 1.49 | | | | 304 | |
| Businesses and governments | | | 36,365 | | | | 2.70 | | | | 984 | | | | 33,353 | | | | 1.67 | | | | 556 | | | | 31,396 | | | | 1.74 | | | | 546 | |
| Individuals | | | 18,150 | | | | 1.67 | | | | 304 | | | | 18,328 | | | | 1.09 | | | | 199 | | | | 19,745 | | | | 1.49 | | | | 293 | |
| |
| Total deposits | | | 76,490 | | | | 2.53 | | | | 1,932 | | | | 74,220 | | | | 1.48 | | | | 1,100 | | | | 71,569 | | | | 1.60 | | | | 1,143 | |
| Subordinated debt and other interest bearing liabilities | | | 16,319 | | | | 3.47 | | | | 565 | | | | 19,042 | | | | 1.76 | | | | 335 | | | | 23,506 | | | | 1.63 | | | | 384 | |
| Other non-interest bearing liabilities | | | 5,746 | | | | | | | | | | | | 3,033 | | | | | | | | | | | | 17,092 | | | | | | | | | |
| |
| Total U.S. dollar and other currencies | | | 98,555 | | | | 2.53 | | | | 2,497 | | | | 96,295 | | | | 1.49 | | | | 1,435 | | | | 112,167 | | | | 1.36 | | | | 1,527 | |
| |
Total All Currencies | | | | | | | | | | | | | | | | | | | | | | | | | | | | | | | | | | | | |
| Total liabilities and interest expense | | | 289,983 | | | | 1.85 | | | | 5,378 | | | | 256,663 | | | | 1.50 | | | | 3,860 | | | | 251,840 | | | | 1.65 | | | | 4,150 | |
| Shareholders’ equity | | | 13,177 | | | | | | | | | | | | 13,129 | | | | | | | | | | | | 12,126 | | | | | | | | | |
| |
Total Liabilities, Interest Expense and Shareholders’ Equity | | | 303,160 | | | | 1.77 | | | | 5,378 | | | | 269,792 | | | | 1.43 | | | | 3,860 | | | | 263,966 | | | | 1.57 | | | | 4,150 | |
| |
| Net interest margin and net interest income | | | | | | | 1.62 | | | | 4,906 | | | | | | | | 1.83 | | | | 4,937 | | | | | | | | 1.87 | | | | 4,929 | |
| |
| |
| (1) | Includes securities borrowed or purchased under resale agreements. |
| | | |
| 84 | | BMO Financial Group 188th Annual Report 2005 |
Table 134Volume/Rate Analysis of Changes in Net Interest Income (teb)($ millions)
| | | | | | | | | | | | | | | | | | | | | | | | | |
| | | 2005/2004 | | | 2004/2003 | |
| | | Increase (decrease) due to change in | | | Increase (decrease) due to change in | |
| | | Average | | | Average | | | | | | | Average | | | Average | | | | |
| For the year ended October 31 | | balance | | | rate | | | Total | | | balance | | | rate | | | Total | |
| |
| |
Assets | | | | | | | | | | | | | | | | | | | | | | | | |
Canadian Dollar | | | | | | | | | | | | | | | | | | | | | | | | |
| Deposits with other banks | | | 6 | | | | 3 | | | | 9 | | | | – | | | | (10 | ) | | | (10 | ) |
| Securities | | | 33 | | | | 163 | | | | 196 | | | | 66 | | | | (59 | ) | | | 7 | |
| Loans | | | | | | | | | | | | | | | | | | | | | | | | |
| Residential mortgages | | | 164 | | | | (165 | ) | | | (1 | ) | | | 254 | | | | (198 | ) | | | 56 | |
| Non-residential mortgages | | | 3 | | | | (12 | ) | | | (9 | ) | | | 5 | | | | (3 | ) | | | 2 | |
| Consumer instalment and other personal | | | 87 | | | | 26 | | | | 113 | | | | 55 | | | | (124 | ) | | | (69 | ) |
| Credit cards | | | 102 | | | | 7 | | | | 109 | | | | 77 | | | | (5 | ) | | | 72 | |
| Businesses and governments | | | 412 | | | | (168 | ) | | | 244 | | | | 187 | | | | (280 | ) | | | (93 | ) |
| |
| Total loans | | | 768 | | | | (312 | ) | | | 456 | | | | 578 | | | | (610 | ) | | | (32 | ) |
| |
| Other non-interest bearing assets | | | – | | | | – | | | | – | | | | – | | | | – | | | | – | |
| |
| Change in Canadian dollar interest income | | | 807 | | | | (146 | ) | | | 661 | | | | 644 | | | | (679 | ) | | | (35 | ) |
| |
U.S. Dollar and Other Currencies | | | | | | | | | | | | | | | | | | | | | | | | |
| Deposits with other banks | | | (19 | ) | | | 178 | | | | 159 | | | | 81 | | | | 11 | | | | 92 | |
| Securities | | | 70 | | | | 68 | | | | 138 | | | | 36 | | | | (180 | ) | | | (144 | ) |
| Loans | | | | | | | | | | | | | | | | | | | | | | | | |
| Residential mortgages | | | 11 | | | | 6 | | | | 17 | | | | 11 | | | | (29 | ) | | | (18 | ) |
| Non-residential mortgages | | | 20 | | | | 7 | | | | 27 | | | | 10 | | | | (15 | ) | | | (5 | ) |
| Consumer instalment and other personal | | | 59 | | | | 37 | | | | 96 | | | | 53 | | | | (52 | ) | | | 1 | |
| Credit cards | | | – | | | | – | | | | – | | | | (1 | ) | | | – | | | | (1 | ) |
| Businesses and governments | | | (111 | ) | | | 500 | | | | 389 | | | | (204 | ) | | | 32 | | | | (172 | ) |
| |
| Total loans | | | (21 | ) | | | 550 | | | | 529 | | | | (131 | ) | | | (64 | ) | | | (195 | ) |
| |
| Other non-interest bearing assets | | | – | | | | – | | | | – | | | | – | | | | – | | | | – | |
| |
| Change in U.S. dollar and other currencies interest income | | | 30 | | | | 796 | | | | 826 | | | | (14 | ) | | | (233 | ) | | | (247 | ) |
| |
Total All Currencies | | | | | | | | | | | | | | | | | | | | | | | | |
| Change in total interest income | | | 837 | | | | 650 | | | | 1,487 | | | | 630 | | | | (912 | ) | | | (282 | ) |
| |
Liabilities | | | | | | | | | | | | | | | | | | | | | | | | |
Canadian Dollar | | | | | | | | | | | | | | | | | | | | | | | | |
| Deposits | | | | | | | | | | | | | | | | | | | | | | | | |
| Banks | | | 17 | | | | 8 | | | | 25 | | | | 3 | | | | (10 | ) | | | (7 | ) |
| Businesses and governments | | | 39 | | | | 109 | | | | 148 | | | | 86 | | | | (121 | ) | | | (35 | ) |
| Individuals | | | 16 | | | | (61 | ) | | | (45 | ) | | | 43 | | | | (170 | ) | | | (127 | ) |
| |
| Total deposits | | | 72 | | | | 56 | | | | 128 | | | | 132 | | | | (301 | ) | | | (169 | ) |
| Subordinated debt and other interest bearing liabilities | | | 512 | | | | (184 | ) | | | 328 | | | | 105 | | | | (134 | ) | | | (29 | ) |
| Other non-interest bearing liabilities | | | – | | | | – | | | | – | | | | – | | | | – | | | | – | |
| |
| Change in Canadian dollar interest expense | | | 584 | | | | (128 | ) | | | 456 | | | | 237 | | | | (435 | ) | | | (198 | ) |
| |
U.S. Dollar and Other Currencies | | | | | | | | | | | | | | | | | | | | | | | | |
| Deposits | | | | | | | | | | | | | | | | | | | | | | | | |
| Banks | | | (8 | ) | | | 307 | | | | 299 | | | | 31 | | | | 10 | | | | 41 | |
| Businesses and governments | | | 51 | | | | 377 | | | | 428 | | | | 34 | | | | (24 | ) | | | 10 | |
| Individuals | | | (2 | ) | | | 107 | | | | 105 | | | | (21 | ) | | | (73 | ) | | | (94 | ) |
| |
| Total deposits | | | 41 | | | | 791 | | | | 832 | | | | 44 | | | | (87 | ) | | | (43 | ) |
| Other interest bearing liabilities | | | (49 | ) | | | 279 | | | | 230 | | | | (73 | ) | | | 24 | | | | (49 | ) |
| Other non-interest bearing liabilities | | | – | | | | – | | | | – | | | | – | | | | – | | | | – | |
| |
| Change in U.S. dollar and other currencies interest expense | | | (8 | ) | | | 1,070 | | | | 1,062 | | | | (29 | ) | | | (63 | ) | | | (92 | ) |
| |
Total All Currencies | | | | | | | | | | | | | | | | | | | | | | | | |
| Change in total interest expense | | | 576 | | | | 942 | | | | 1,518 | | | | 208 | | | | (498 | ) | | | (290 | ) |
| |
| Change in total net interest income | | | 261 | | | | (292 | ) | | | (31 | ) | | | 422 | | | | (414 | ) | | | 8 | |
| |
| | | |
| BMO Financial Group 188th Annual Report 2005 | | 85 |
Table 144Net Loans and Acceptances – Segmented Information($ millions, except as noted)
| | | | | | | | | | | | | | | | | | | | | | | | | | | | | | | | | | | | | | | | | | | | | | | | | | | | | | | | | | | | | | | | | | | | | | | | | | | | | | | | | |
| | | Canada | | | United States | | | Other countries | | | Total | |
| As at October 31 | | 2005 | | | 2004 | | | 2003 | | | 2002 | | | 2001 | | | 2005 | | | 2004 | | | 2003 | | | 2002 | | | 2001 | | | 2005 | | | 2004 | | | 2003 | | | 2002 | | | 2001 | | | 2005 | | | 2004 | | | 2003 | | | 2002 | | | 2001 | |
| |
| Consumer |
| Residential mortgages (1) | | | 51,481 | | | | 47,533 | | | | 43,533 | | | | 38,865 | | | | 33,741 | | | | 6,274 | | | | 5,728 | | | | 5,307 | | | | 5,469 | | | | 5,000 | | | | – | | | | – | | | | – | | | | – | | | | – | | | | 57,755 | | | | 53,261 | | | | 48,840 | | | | 44,334 | | | | 38,741 | |
| Cards | | | 4,648 | | | | 3,698 | | | | 2,963 | | | | 2,275 | | | | 1,521 | | | | – | | | | 4 | | | | 4 | | | | 5 | | | | 6 | | | | – | | | | – | | | | – | | | | – | | | | – | | | | 4,648 | | | | 3,702 | | | | 2,967 | | | | 2,280 | | | | 1,527 | |
| Consumer instalment and other personal loans | | | 18,683 | | | | 16,971 | | | | 15,589 | | | | 14,950 | | | | 14,258 | | | | 9,245 | | | | 7,914 | | | | 6,512 | | | | 6,214 | | | | 4,841 | | | | – | | | | – | | | | – | | | | – | | | | – | | | | 27,928 | | | | 24,885 | | | | 22,101 | | | | 21,164 | | | | 19,099 | |
| |
| Total consumer | | | 74,812 | | | | 68,202 | | | | 62,085 | | | | 56,090 | | | | 49,520 | | | | 15,519 | | | | 13,646 | | | | 11,823 | | | | 11,688 | | | | 9,847 | | | | – | | | | – | | | | – | | | | – | | | | – | | | | 90,331 | | | | 81,848 | | | | 73,908 | | | | 67,778 | | | | 59,367 | |
| |
| Commercial and corporate | | | | | | | | | | | | | | | | | | | | | | | | | | | | | | | | | | | | | | | | | | | | | | | | | | | | | | | | | | | | | | | | | | | | | | | | | | | | | | | | |
| Commercial and corporate, excluding securities borrowed or purchased under resale agreements | | | 37,097 | | | | 35,300 | | | | 33,844 | | | | 34,012 | | | | 35,847 | | | | 17,600 | | | | 15,778 | | | | 16,719 | | | | 21,994 | | | | 26,576 | | | | 1,988 | | | | 1,723 | | | | 1,867 | | | | 3,035 | | | | 1,896 | | | | 56,685 | | | | 52,801 | | | | 52,430 | | | | 59,041 | | | | 64,319 | |
| Securities borrowed or purchased under resale agreements | | | 16,178 | | | | 13,233 | | | | 6,288 | | | | 8,491 | | | | 8,397 | | | | 12,102 | | | | 9,376 | | | | 14,710 | | | | 15,466 | | | | 13,862 | | | | – | | | | – | | | | – | | | | – | | | | – | | | | 28,280 | | | | 22,609 | | | | 20,998 | | | | 23,957 | | | | 22,259 | |
| |
| Total commercial and corporate | | | 53,275 | | | | 48,533 | | | | 40,132 | | | | 42,503 | | | | 44,244 | | | | 29,702 | | | | 25,154 | | | | 31,429 | | | | 37,460 | | | | 40,438 | | | | 1,988 | | | | 1,723 | | | | 1,867 | | | | 3,035 | | | | 1,896 | | | | 84,965 | | | | 75,410 | | | | 73,428 | | | | 82,998 | | | | 86,578 | |
| |
| Total loans and acceptances, net of specific allowances | | | 128,087 | | | | 116,735 | | | | 102,217 | | | | 98,593 | | | | 93,764 | | | | 45,221 | | | | 38,800 | | | | 43,252 | | | | 49,148 | | | | 50,285 | | | | 1,988 | | | | 1,723 | | | | 1,867 | | | | 3,035 | | | | 1,896 | | | | 175,296 | | | | 157,258 | | | | 147,336 | | | | 150,776 | | | | 145,945 | |
| General allowance | | | (590 | ) | | | (630 | ) | | | (800 | ) | | | (800 | ) | | | (855 | ) | | | (369 | ) | | | (380 | ) | | | (380 | ) | | | (380 | ) | | | (325 | ) | | | – | | | | – | | | | – | | | | – | | | | – | | | | (959 | ) | | | (1,010 | ) | | | (1,180 | ) | | | (1,180 | ) | | | (1,180 | ) |
| |
| Total net loans and acceptances | | | 127,497 | | | | 116,105 | | | | 101,417 | | | | 97,793 | | | | 92,909 | | | | 44,852 | | | | 38,420 | | | | 42,872 | | | | 48,768 | | | | 49,960 | | | | 1,988 | | | | 1,723 | | | | 1,867 | | | | 3,035 | | | | 1,896 | | | | 174,337 | | | | 156,248 | | | | 146,156 | | | | 149,596 | | | | 144,765 | |
| |
Table 154Net Impaired Loans and Acceptances – Segmented Information($ millions, except as noted)
| | | | | | | | | | | | | | | | | | | | | | | | | | | | | | | | | | | | | | | | | | | | | | | | | | | | | | | | | | | | | | | | | | | | | | | | | | | | | | | | | |
| | | Canada | | | United States | | | Other countries | | | Total | |
| As at October 31 | | 2005 | | | 2004 | | | 2003 | | | 2002 | | | 2001 | | | 2005 | | | 2004 | | | 2003 | | | 2002 | | | 2001 | | | 2005 | | | 2004 | | | 2003 | | | 2002 | | | 2001 | | | 2005 | | | 2004 | | | 2003 | | | 2002 | | | 2001 | |
| |
| Consumer |
| Residential mortgages | | | 87 | | | | 120 | | | | 137 | | | | 119 | | | | 126 | | | | – | | | | – | | | | – | | | | – | | | | – | | | | – | | | | – | | | | – | | | | – | | | | – | | | | 87 | | | | 120 | | | | 137 | | | | 119 | | | | 126 | |
| Consumer instalment and other personal loans | | | 33 | | | | 30 | | | | 39 | | | | 39 | | | | 54 | | | | 5 | | | | 5 | | | | 5 | | | | 10 | | | | 2 | | | | – | | | | – | | | | – | | | | – | | | | – | | | | 38 | | | | 35 | | | | 44 | | | | 49 | | | | 56 | |
| |
| Total consumer | | | 120 | | | | 150 | | | | 176 | | | | 158 | | | | 180 | | | | 5 | | | | 5 | | | | 5 | | | | 10 | | | | 2 | | | | – | | | | – | | | | – | | | | – | | | | – | | | | 125 | | | | 155 | | | | 181 | | | | 168 | | | | 182 | |
| Commercial and corporate | | | 166 | | | | 183 | | | | 219 | | | | 378 | | | | 354 | | | | 326 | | | | 421 | | | | 766 | | | | 872 | | | | 692 | | | | 18 | | | | 62 | | | | 147 | | | | 150 | | | | 17 | | | | 510 | | | | 666 | | | | 1,132 | | | | 1,400 | | | | 1,063 | |
| |
| Total impaired loans and acceptances, net of specific allowances for credit losses | | | 286 | | | | 333 | | | | 395 | | | | 536 | | | | 534 | | | | 331 | | | | 426 | | | | 771 | | | | 882 | | | | 694 | | | | 18 | | | | 62 | | | | 147 | | | | 150 | | | | 17 | | | | 635 | | | | 821 | | | | 1,313 | | | | 1,568 | | | | 1,245 | |
| General allowance | | | (590 | ) | | | (630 | ) | | | (800 | ) | | | (800 | ) | | | (855 | ) | | | (369 | ) | | | (380 | ) | | | (380 | ) | | | (380 | ) | | | (325 | ) | | | – | | | | – | | | | – | | | | – | | | | – | | | | (959 | ) | | | (1,010 | ) | | | (1,180 | ) | | | (1,180 | ) | | | (1,180 | ) |
| |
| Total net impaired loans and acceptances (NIL) | | | (304 | ) | | | (297 | ) | | | (405 | ) | | | (264 | ) | | | (321 | ) | | | (38 | ) | | | 46 | | | | 391 | | | | 502 | | | | 369 | | | | 18 | | | | 62 | | | | 147 | | | | 150 | | | | 17 | | | | (324 | ) | | | (189 | ) | | | 133 | | | | 388 | | | | 65 | |
| | | | | | | | | | | | | | | | | | | | | | | | | | | | | | | | | | | | | | | | | | | | | | | | | | | | | | | | | | | | | | | | | | | | | | | | | | | | | | | | | |
Condition Ratios | | | | | | | | | | | | | | | | | | | | | | | | | | | | | | | | | | | | | | | | | | | | | | | | | | | | | | | | | | | | | | | | | | | | | | | | | | | | | | | | |
| Gross impaired loans and acceptances as a % of equity and allowance for credit losses | | | NA | | | | NA | | | | NA | | | | NA | | | | NA | | | | NA | | | | NA | | | | NA | | | | NA | | | | NA | | | | NA | | | | NA | | | | NA | | | | NA | | | | NA | | | | 4.91 | | | | 6.75 | | | | 12.15 | | | | 15.16 | | | | 14.17 | |
| NIL as a % of net loans and acceptances (2) | | | (0.24 | ) | | | (0.26 | ) | | | (0.40 | ) | | | (0.27 | ) | | | (0.35 | ) | | | (0.08 | ) | | | 0.12 | | | | 0.91 | | | | 1.03 | | | | 0.74 | | | | 0.91 | | | | 3.60 | | | | 7.87 | | | | 4.94 | | | | 0.90 | | | | (0.19 | ) | | | (0.12 | ) | | | 0.09 | | | | 0.26 | | | | 0.05 | |
NIL as a % of net loans and acceptances (2)
To consumer | | | 0.16 | | | | 0.22 | | | | 0.28 | | | | 0.28 | | | | 0.36 | | | | 0.03 | | | | 0.04 | | | | 0.04 | | | | 0.09 | | | | 0.02 | | | | – | | | | – | | | | – | | | | – | | | | – | | | | 0.14 | | | | 0.19 | | | | 0.24 | | | | 0.25 | | | | 0.31 | |
| To commercial and corporate, excluding securities borrowed or purchased under resale agreements | | | 0.45 | | | | 0.52 | | | | 0.65 | | | | 1.11 | | | | 0.99 | | | | 1.85 | | | | 2.67 | | | | 4.58 | | | | 3.96 | | | | 2.60 | | | | 0.91 | | | | 3.60 | | | | 7.87 | | | | 4.94 | | | | 0.90 | | | | 0.90 | | | | 1.26 | | | | 2.16 | | | | 2.37 | | | | 1.65 | |
| |
| | |
| (1) | | Excludes residential mortgages classified as commercial corporate loans (2005 – $3.1 billion, 2004 – $3.2 billion, 2003 – $3.3 billion, 2002 – $3.2 billion, 2001 – $3.2 billion). |
| |
| (2) | | Aggregate balances are net of specific and general allowances; the consumer, commercial and corporate categories are stated net of specific allowances only. |
| | |
| (3) | | Loans and acceptances returning to performing status, sales and repayments. |
| |
| (4) | | Excludes ACL for off-balance sheet exposure of $6 million in 2003. |
| |
| NA – not available |
| | | |
| 86 | | BMO Financial Group 188th Annual Report 2005 |
Table 164Net Loans and Acceptances – Segmented Information($ millions)
| | | | | | | | | | | | | | | | | | | | | |
| As at October 31 | | 2005 | | | 2004 | | | 2003 | | | 2002 | | | 2001 | |
| |
Net Loans and Acceptances by Province | | | | | | | | | | | | | | | | | | | | |
| Atlantic provinces | | | 5,839 | | | | 5,934 | | | | 6,097 | | | | 5,767 | | | | 4,644 | |
| Quebec | | | 16,695 | | | | 15,707 | | | | 15,163 | | | | 14,409 | | | | 13,685 | |
| Ontario | | | 72,314 | | | | 63,509 | | | | 51,650 | | | | 51,045 | | | | 49,554 | |
| Prairie provinces | | | 16,829 | | | | 16,094 | | | | 13,678 | | | | 12,772 | | | | 13,365 | |
| British Columbia and territories | | | 16,410 | | | | 15,491 | | | | 15,629 | | | | 14,600 | | | | 12,516 | |
| |
| Total net loans and acceptances in Canada | | | 128,087 | | | | 116,735 | | | | 102,217 | | | | 98,593 | | | | 93,764 | |
| |
Net Commercial and Corporate Loans by Industry, excluding Securities Borrowed or Purchased under Resale Agreements | | | | | | | | | | | | | | | | | | | | |
| Commercial mortgages | | | 8,246 | | | | 7,954 | | | | 7,684 | | | | 7,591 | | | | 7,352 | |
| Commercial real estate | | | 4,242 | | | | 3,517 | | | | 3,294 | | | | 3,592 | | | | 3,816 | |
| Construction (non-real estate) | | | 936 | | | | 939 | | | | 1,009 | | | | 722 | | | | 931 | |
| Retail trade | | | 3,494 | | | | 3,242 | | | | 3,276 | | | | 3,039 | | | | 3,181 | |
| Wholesale trade | | | 2,804 | | | | 2,558 | | | | 2,735 | | | | 2,884 | | | | 2,912 | |
| Agriculture | | | 2,842 | | | | 2,536 | | | | 2,597 | | | | 2,693 | | | | 2,659 | |
| Communications | | | 1,179 | | | | 1,415 | | | | 1,742 | | | | 2,724 | | | | 3,261 | |
| Manufacturing | | | 6,977 | | | | 6,495 | | | | 7,499 | | | | 8,467 | | | | 11,006 | |
| Mining | | | 375 | | | | 290 | | | | 430 | | | | 581 | | | | 745 | |
| Oil and gas | | | 2,829 | | | | 2,863 | | | | 1,913 | | | | 3,611 | | | | 4,055 | |
| Transportation | | | 932 | | | | 951 | | | | 1,143 | | | | 1,303 | | | | 1,523 | |
| Utilities | | | 916 | | | | 771 | | | | 937 | | | | 1,418 | | | | 1,590 | |
| Forest products | | | 644 | | | | 544 | | | | 698 | | | | 981 | | | | 1,177 | |
| Service industries | | | 7,043 | | | | 6,451 | | | | 6,225 | | | | 6,680 | | | | 6,658 | |
| Financial institutions | | | 6,348 | | | | 5,875 | | | | 6,252 | | | | 8,779 | | | | 8,863 | |
| Other | | | 6,878 | | | | 6,400 | | | | 4,996 | | | | 3,976 | | | | 4,590 | |
| |
| | | | 56,685 | | | | 52,801 | | | | 52,430 | | | | 59,041 | | | | 64,319 | |
| |
Table 174Net Impaired Loans and Acceptances – Segmented Information($ millions)
| | | | | | | | | | | | | | | | | | | | | |
| As at October 31 | | 2005 | | | 2004 | | | 2003 | | | 2002 | | | 2001 | |
| |
Net Impaired Commercial and Corporate Loans | | | | | | | | | | | | | | | | | | | | |
| Commercial mortgages | | | 36 | | | | 32 | | | | 46 | | | | 25 | | | | 39 | |
| Commercial real estate | | | 22 | | | | 36 | | | | 17 | | | | 16 | | | | 18 | |
| Construction (non-real estate) | | | 7 | | | | 17 | | | | 27 | | | | 3 | | | | 47 | |
| Retail trade | | | 39 | | | | 37 | | | | 10 | | | | 51 | | | | 120 | |
| Wholesale trade | | | 24 | | | | 19 | | | | 104 | | | | 77 | | | | 47 | |
| Agriculture | | | 15 | | | | 18 | | | | 17 | | | | 24 | | | | 10 | |
| Communications | | | 116 | | | | 149 | | | | 202 | | | | 429 | | | | 78 | |
| Manufacturing | | | 117 | | | | 123 | | | | 228 | | | | 273 | | | | 126 | |
| Mining | | | – | | | | – | | | | 63 | | | | 9 | | | | 6 | |
| Oil and gas | | | 1 | | | | – | | | | – | | | | 71 | | | | 77 | |
| Transportation | | | 18 | | | | 28 | | | | 29 | | | | 130 | | | | 167 | |
| Utilities | | | 24 | | | | 75 | | | | 252 | | | | 162 | | | | 154 | |
| Forest products | | | 5 | | | | 5 | | | | 32 | | | | 23 | | | | 48 | |
| Service industries | | | 54 | | | | 68 | | | | 71 | | | | 63 | | | | 102 | |
| Financial institutions | | | 11 | | | | 23 | | | | 34 | | | | 14 | | | | 25 | |
| Other | | | 21 | | | | 36 | | | | – | | | | 30 | | | | (1 | ) |
| |
| | | | 510 | | | | 666 | | | | 1,132 | | | | 1,400 | | | | 1,063 | |
| |
Table 184Changes in Impaired Loans and Acceptances($ millions)
| | | | | | | | | | | | | | | | | | | | | |
| As at October 31 | | 2005 | | | 2004 | | | 2003 | | | 2002 | | | 2001 | |
| |
| Gross impaired loans and acceptances, beginning of year | | | 1,119 | | | | 1,918 | | | | 2,337 | �� | | | 2,014 | | | | 1,501 | |
| Additions to impaired loans and acceptances | | | 423 | | | | 607 | | | | 1,303 | | | | 1,945 | | | | 2,041 | |
| Reductions in impaired loans and acceptances (3) | | | (319 | ) | | | (936 | ) | | | (1,156 | ) | | | (738 | ) | | | (830 | ) |
| Write-offs | | | (419 | ) | | | (470 | ) | | | (566 | ) | | | (884 | ) | | | (698 | ) |
| |
Gross Impaired Loans and Acceptances, End of Year | | | 804 | | | | 1,119 | | | | 1,918 | | | | 2,337 | | | | 2,014 | |
| |
| Allowance for Credit Losses (ACL), beginning of year | | | 1,308 | | | | 1,785 | | | | 1,949 | | | | 1,949 | | | | 1,597 | |
| Increases – specific allowance | | | 290 | | | | 163 | | | | 402 | | | | 884 | | | | 950 | |
| Increases – general allowance | | | (51 | ) | | | (170 | ) | | | – | | | | – | | | | 100 | |
| Write-offs | | | (419 | ) | | | (470 | ) | | | (566 | ) | | | (884 | ) | | | (698 | ) |
| |
Allowance for Credit Losses (4), End of Year | | | 1,128 | | | | 1,308 | | | | 1,785 | | | | 1,949 | | | | 1,949 | |
| |
| | | |
| BMO Financial Group 188th Annual Report 2005 | | 87 |
Table 194Changes in Allowance for Credit Losses – Segmented Information($ millions, except as noted)
| | | | | | | | | | | | | | | | | | | | | | | | | | | | | | | | | | | | | | | | | | | | | | | | | | | | | | | | | | | | | | | | | | | | | | | | | | | | | | | | | |
| | | Canada | | | United States | | | Other countries | | | Total | |
| As at October 31 | | 2005 | | | 2004 | | | 2003 | | | 2002 | | | 2001 | | | 2005 | | | 2004 | | | 2003 | | | 2002 | | | 2001 | | | 2005 | | | 2004 | | | 2003 | | | 2002 | | | 2001 | | | 2005 | | | 2004 | | | 2003 | | | 2002 | | | 2001 | |
| |
| Allowance for credit losses (ACL), beginning of year | | | 762 | | | | 1,013 | | | | 1,200 | | | | 1,266 | | | | 1,170 | | | | 514 | | | | 661 | | | | 700 | | | | 646 | | | | 382 | | | | 32 | | | | 117 | | | | 49 | | | | 37 | | | | 45 | | | | 1,308 | | | | 1,791 | | | | 1,949 | | | | 1,949 | | | | 1,597 | |
| Provision for credit losses | | | 192 | | | | (1 | ) | | | 211 | | | | 561 | | | | 402 | | | | 14 | | | | (46 | ) | | | 211 | | | | 255 | | | | 570 | | | | (27 | ) | | | (56 | ) | | | 33 | | | | 4 | | | | 8 | | | | 179 | | | | (103 | ) | | | 455 | | | | 820 | | | | 980 | |
| Transfer of allowance | | | – | | | | – | | | | (70 | ) | | | (231 | ) | | | 26 | | | | – | | | | – | | | | 5 | | | | 225 | | | | (15 | ) | | | – | | | | – | | | | 65 | | | | 6 | | | | (11 | ) | | | – | | | | – | | | | – | | | | – | | | | – | |
| Recoveries | | | 37 | | | | 35 | | | | 28 | | | | 28 | | | | 25 | | | | 30 | | | | 94 | | | | 60 | | | | 39 | | | | 15 | | | | – | | | | 2 | | | | – | | | | 1 | | | | – | | | | 67 | | | | 131 | | | | 88 | | | | 68 | | | | 40 | |
| Write-offs | | | (303 | ) | | | (283 | ) | | | (341 | ) | | | (419 | ) | | | (361 | ) | | | (116 | ) | | | (157 | ) | | | (211 | ) | | | (465 | ) | | | (331 | ) | | | – | | | | (30 | ) | | | (14 | ) | | | – | | | | (6 | ) | | | (419 | ) | | | (470 | ) | | | (566 | ) | | | (884 | ) | | | (698 | ) |
| Other, including foreign exchange rate changes | | | (1 | ) | | | (2 | ) | | | (15 | ) | | | (5 | ) | | | 4 | | | | (7 | ) | | | (38 | ) | | | (104 | ) | | | – | | | | 25 | | | | 1 | | | | (1 | ) | | | (16 | ) | | | 1 | | | | 1 | | | | (7 | ) | | | (41 | ) | | | (135 | ) | | | (4 | ) | | | 30 | |
| |
| Allowance for credit losses, end of year | | | 687 | | | | 762 | | | | 1,013 | | | | 1,200 | | | | 1,266 | | | | 435 | | | | 514 | | | | 661 | | | | 700 | | | | 646 | | | | 6 | | | | 32 | | | | 117 | | | | 49 | | | | 37 | | | | 1,128 | | | | 1,308 | | | | 1,791 | | | | 1,949 | | | | 1,949 | |
| |
Allocation of Write-offs by Market | | | | | | | | | | | | | | | | | | | | | | | | | | | | | | | | | | | | | | | | | | | | | | | | | | | | | | | | | | | | | | | | | | | | | | | | | | | | | | | | |
| Consumer | | | (219 | ) | | | (185 | ) | | | (155 | ) | | | (153 | ) | | | (144 | ) | | | (27 | ) | | | (21 | ) | | | (23 | ) | | | (23 | ) | | | (13 | ) | | | – | | | | – | | | | – | | | | – | | | | – | | | | (246 | ) | | | (206 | ) | | | (178 | ) | | | (176 | ) | | | (157 | ) |
| Commercial and corporate | | | (84 | ) | | | (98 | ) | | | (186 | ) | | | (266 | ) | | | (217 | ) | | | (89 | ) | | | (136 | ) | | | (188 | ) | | | (442 | ) | | | (318 | ) | | | – | | | | (30 | ) | | | (14 | ) | | | – | | | | (6 | ) | | | (173 | ) | | | (264 | ) | | | (388 | ) | | | (708 | ) | | | (541 | ) |
Allocation of Recoveries by Market | | | | | | | | | | | | | | | | | | | | | | | | | | | | | | | | | | | | | | | | | | | | | | | | | | | | | | | | | | | | | | | | | | | | | | | | | | | | | | | | |
| Consumer | | | 33 | | | | 29 | | | | 26 | | | | 22 | | | | 19 | | | | 16 | | | | 12 | | | | 10 | | | | 8 | | | | 6 | | | | – | | | | – | | | | – | | | | – | | | | – | | | | 49 | | | | 41 | | | | 36 | | | | 30 | | | | 25 | |
| Commercial and corporate | | | 4 | | | | 6 | | | | 2 | | | | 6 | | | | 6 | | | | 14 | | | | 82 | | | | 50 | | | | 31 | | | | 9 | | | | – | | | | 2 | | | | – | | | | 1 | | | | – | | | | 18 | | | | 90 | | | | 52 | | | | 38 | | | | 15 | |
| Net write-offs as a % of average loans and acceptances | | | NA | | | | NA | | | | NA | | | | NA | | | | NA | | | | NA | | | | NA | | | | NA | | | | NA | | | | NA | | | | NA | | | | NA | | | | NA | | | | NA | | | | NA | | | | 0.2 | | | | 0.2 | | | | 0.3 | | | | 0.6 | | | | 0.4 | |
| |
Table 204Allocation of Allowance for Credit Losses – Segmented Information($ millions, except as noted)
| | | | | | | | | | | | | | | | | | | | | | | | | | | | | | | | | | | | | | | | | | | | | | | | | | | | | | | | | | | | | | | | | | | | | | | | | | | | | | | | | |
| | | Canada | | | United States | | | Other countries | | | Total | |
| As at October 31 | | 2005 | | | 2004 | | | 2003 | | | 2002 | | | 2001 | | | 2005 | | | 2004 | | | 2003 | | | 2002 | | | 2001 | | | 2005 | | | 2004 | | | 2003 | | | 2002 | | | 2001 | | | 2005 | | | 2004 | | | 2003 | | | 2002 | | | 2001 | |
| |
| Consumer | | | | | | | | | | | | | | | | | | | | | | | | | | | | | | | | | | | | | | | | | | | | | | | | | | | | | | | | | | | | | | | | | | | | | | | | | | | | | | | | |
| Residential mortgages | | | 5 | | | | 5 | | | | 5 | | | | 5 | | | | 6 | | | | – | | | | – | | | | – | | | | – | | | | – | | | | – | | | | – | | | | – | | | | – | | | | – | | | | 5 | | | | 5 | | | | 5 | | | | 5 | | | | 6 | |
| Consumer instalment and other personal loans | | | 1 | | | | 2 | | | | 2 | | | | 4 | | | | 6 | | | | – | | | | – | | | | – | | | | – | | | | 2 | | | | – | | | | – | | | | – | | | | – | | | | – | | | | 1 | | | | 2 | | | | 2 | | | | 4 | | | | 8 | |
| |
| Total consumer | | | 6 | | | | 7 | | | | 7 | | | | 9 | | | | 12 | | | | – | | | | – | | | | – | | | | – | | | | 2 | | | | – | | | | – | | | | – | | | | – | | | | – | | | | 6 | | | | 7 | | | | 7 | | | | 9 | | | | 14 | |
| Commercial and corporate | | | 91 | | | | 125 | | | | 200 | | | | 391 | | | | 399 | | | | 66 | | | | 134 | | | | 281 | | | | 320 | | | | 319 | | | | 6 | | | | 32 | | | | 117 | | | | 49 | | | | 37 | | | | 163 | | | | 291 | | | | 598 | | | | 760 | | | | 755 | |
| Off-balance sheet | | | – | | | | – | | | | 6 | | | | – | | | | – | | | | – | | | | – | | | | – | | | | – | | | | – | | | | – | | | | – | | | | – | | | | – | | | | – | | | | – | | | | – | | | | 6 | | | | – | | | | – | |
| |
| Total specific allowance | | | 97 | | | | 132 | | | | 213 | | | | 400 | | | | 411 | | | | 66 | | | | 134 | | | | 281 | | | | 320 | | | | 321 | | | | 6 | | | | 32 | | | | 117 | | | | 49 | | | | 37 | | | | 169 | | | | 298 | | | | 611 | | | | 769 | | | | 769 | |
| General allowance | | | 590 | | | | 630 | | | | 800 | | | | 800 | | | | 855 | | | | 369 | | | | 380 | | | | 380 | | | | 380 | | | | 325 | | | | – | | | | – | | | | – | | | | – | | | | – | | | | 959 | | | | 1,010 | | | | 1,180 | | | | 1,180 | | | | 1,180 | |
| |
| Allowance for credit losses | | | 687 | | | | 762 | | | | 1,013 | | | | 1,200 | | | | 1,266 | | | | 435 | | | | 514 | | | | 661 | | | | 700 | | | | 646 | | | | 6 | | | | 32 | | | | 117 | | | | 49 | | | | 37 | | | | 1,128 | | | | 1,308 | | | | 1,791 | | | | 1,949 | | | | 1,949 | |
| |
Coverage Ratios | | | | | | | | | | | | | | | | | | | | | | | | | | | | | | | | | | | | | | | | | | | | | | | | | | | | | | | | | | | | | | | | | | | | | | | | | | | | | | | | |
| ACL as a % of gross impaired loans and acceptances | | | | | | | | | | | | | | | | | | | | | | | | | | | | | | | | | | | | | | | | | | | | | | | | | | | | | | | | | | | | | | | | | | | | | | | | | | | | | | | | |
| Total | | | 179.4 | | | | 163.9 | | | | 167.3 | | | | 128.2 | | | | 134.0 | | | | 109.6 | | | | 91.8 | | | | 62.8 | | | | 58.2 | | | | 63.6 | | | | 25.0 | | | | 34.0 | | | | 44.3 | | | | 24.6 | | | | 68.5 | | | | 140.2 | | | | 116.9 | | | | 93.1 | | | | 83.4 | | | | 96.8 | |
| Consumer | | | 4.8 | | | | 4.5 | | | | 3.8 | | | | 5.4 | | | | 6.2 | | | | – | | | | – | | | | – | | | | – | | | | 50.0 | | | | na | | | | na | | | | na | | | | na | | | | na | | | | 4.6 | | | | 4.3 | | | | 3.7 | | | | 5.1 | | | | 7.1 | |
| Commercial and corporate | | | 35.4 | | | | 40.6 | | | | 47.7 | | | | 50.8 | | | | 53.0 | | | | 35.4 | | | | 24.1 | | | | 26.8 | | | | 26.7 | | | | 31.6 | | | | 25.0 | | | | 34.0 | | | | 44.3 | | | | 24.6 | | | | 68.5 | | | | 24.2 | | | | 30.4 | | | | 34.6 | | | | 35.2 | | | | 41.5 | |
| |
| | |
| NA – not available |
| |
| na – not applicable |
| | | |
| 88 | | BMO Financial Group 188th Annual Report 2005 |
Table 214Provision for Credit Losses – Segmented Information($ millions)
| | | | | | | | | | | | | | | | | | | | | |
| For the year ended October 31 | | 2005 | | | 2004 | | | 2003 | | | 2002 | | | 2001 | |
| |
Consumer | | | | | | | | | | | | | | | | | | | | |
| Residential mortgages | | | 3 | | | | 3 | | | | 8 | | | | 7 | | | | 6 | |
| Cards | | | 141 | | | | 106 | | | | 78 | | | | 58 | | | | 48 | |
| Consumer instalment and other personal loans | | | 53 | | | | 60 | | | | 55 | | | | 79 | | | | 74 | |
| |
| | | | 197 | | | | 169 | | | | 141 | | | | 144 | | | | 128 | |
| |
Commercial and Corporate (1) | | | | | | | | | | | | | | | | | | | | |
| Commercial mortgages | | | 4 | | | | 2 | | | | 1 | | | | 6 | | | | 10 | |
| Commercial real estate | | | 2 | | | | 6 | | | | (16 | ) | | | (2 | ) | | | (1 | ) |
| Construction (non-real estate) | | | 9 | | | | 9 | | | | 1 | | | | (23 | ) | | | 28 | |
| Retail trade | | | 15 | | | | 2 | | | | (7 | ) | | | 29 | | | | 74 | |
| Wholesale trade | | | 13 | | | | 9 | | | | (1 | ) | | | 19 | | | | 114 | |
| Agriculture | | | 4 | | | | 20 | | | | 5 | | | | 2 | | | | (1 | ) |
| Communications | | | (34 | ) | | | (12 | ) | | | 7 | | | | 399 | | | | 129 | |
| Manufacturing | | | 23 | | | | (37 | ) | | | 116 | | | | 94 | | | | 280 | |
| Mining | | | – | | | | (1 | ) | | | 10 | | | | – | | | | 5 | |
| Oil and gas | | | – | | | | (4 | ) | | | (18 | ) | | | 22 | | | | (22 | ) |
| Transportation | | | 13 | | | | (17 | ) | | | 29 | | | | 17 | | | | 38 | |
| Utilities | | | (26 | ) | | | (87 | ) | | | 69 | | | | 69 | | | | 17 | |
| Forest products | | | – | | | | (7 | ) | | | 37 | | | | 4 | | | | – | |
| Service industries | | | 5 | | | | 13 | | | | 58 | | | | 19 | | | | 18 | |
| Financial institutions | | | (1 | ) | | | 13 | | | | 2 | | | | 23 | | | | 64 | |
| Other | | | (5 | ) | | | (11 | ) | | | 21 | | | | (2 | ) | | | (1 | ) |
| |
| | | | 22 | | | | (102 | ) | | | 314 | | | | 676 | | | | 752 | |
| |
| Total specific provisions | | | 219 | | | | 67 | | | | 455 | | | | 820 | | | | 880 | |
| Change in general allowance | | | (40 | ) | | | (170 | ) | | | – | | | | – | | | | 100 | |
| |
| Total provision for credit losses | | | 179 | | | | (103 | ) | | | 455 | | | | 820 | | | | 980 | |
| |
| |
| (1) | There has been no provision for credit losses on securities borrowed or purchased under resale agreements. |
Table 224Specific Allowance for Credit Losses – Segmented Information($ millions)
| | | | | | | | | | | | | | | | | | | | | |
| As at October 31 | | 2005 | | | 2004 | | | 2003 | | | 2002 | | | 2001 | |
| |
Commercial and Corporate Specific Allowance by Industry | | | | | | | | | | | | | | | | | | | | |
| Commercial mortgages | | | – | | | | – | | | | – | | | | – | | | | 6 | |
| Commercial real estate | | | 6 | | | | 4 | | | | 3 | | | | 9 | | | | 12 | |
| Construction (non-real estate) | | | 4 | | | | 20 | | | | 2 | | | | 5 | | | | 31 | |
| Retail trade | | | 18 | | | | 7 | | | | 8 | | | | 18 | | | | 59 | |
| Wholesale trade | | | 20 | | | | 14 | | | | 40 | | | | 109 | | | | 80 | |
| Agriculture | | | 13 | | | | 12 | | | | 7 | | | | 14 | | | | 3 | |
| Communications | | | 2 | | | | 46 | | | | 85 | | | | 116 | | | | 60 | |
| Manufacturing | | | 53 | | | | 79 | | | | 158 | | | | 175 | | | | 300 | |
| Mining | | | – | | | | – | | | | – | | | | – | | | | – | |
| Oil and gas | | | 1 | | | | – | | | | 2 | | | | 20 | | | | 18 | |
| Transportation | | | 3 | | | | 6 | | | | 36 | | | | 64 | | | | 77 | |
| Utilities | | | – | | | | 46 | | | | 141 | | | | 87 | | | | 19 | |
| Forest products | | | 2 | | | | 8 | | | | 34 | | | | 6 | | | | 10 | |
| Service industries | | | 26 | | | | 23 | | | | 49 | | | | 44 | | | | 48 | |
| Financial institutions | | | 7 | | | | 10 | | | | 21 | | | | 29 | | | | 26 | |
| Other | | | 8 | | | | 16 | | | | 12 | | | | 64 | | | | 6 | |
| |
| Total specific allowance for credit losses on commercial and corporate loans | | | 163 | | | | 291 | | | | 598 | | | | 760 | | | | 755 | |
| |
| | | |
| BMO Financial Group 188th Annual Report 2005 | | 89 |
Table 234Capital Adequacy($ millions, except as noted)
| | | | | | | | | | | | | | | | | | | | | |
| As at October 31 | | 2005 | | | 2004 | | | 2003 | | | 2002 | | | 2001 | |
| |
| Tier 1 capital | | | | | | | | | | | | | | | | | | | | |
| Common shareholders’ equity | | | 13,270 | | | | 12,143 | | | | 11,036 | | | | 10,377 | | | | 9,632 | |
| Non-cumulative preferred shares (1) | | | 1,046 | | | | 1,046 | | | | 1,446 | | | | 1,517 | | | | 1,050 | |
| Innovative Tier 1 capital instruments (BOaTS) (1) | | | 2,192 | | | | 1,745 | | | | 1,150 | | | | 1,150 | | | | 1,150 | |
| Non-controlling interest in subsidiaries | | | 37 | | | | 44 | | | | 39 | | | | 32 | | | | 32 | |
| Goodwill and excess intangible assets (2) | | | (1,091 | ) | | | (1,507 | ) | | | (1,334 | ) | | | (1,547 | ) | | | (798 | ) |
| |
| Total Tier 1 capital | | | 15,454 | | | | 13,471 | | | | 12,337 | | | | 11,529 | | | | 11,066 | |
| |
| Tier 2 capital | | | | | | | | | | | | | | | | | | | | |
| Preferred shares of a subsidiary (3) | | | 287 | | | | 296 | | | | 320 | | | | 377 | | | | 397 | |
| Subordinated debt | | | 2,130 | | | | 1,783 | | | | 1,981 | | | | 3,171 | | | | 4,133 | |
| General allowance for credit losses (4) | | | 958 | | | | 1,010 | | | | 1,130 | | | | 1,147 | | | | 1,180 | |
| |
| Total Tier 2 capital | | | 3,375 | | | | 3,089 | | | | 3,431 | | | | 4,695 | | | | 5,710 | |
| |
| First loss protection | | | (123 | ) | | | (128 | ) | | | (149 | ) | | | (192 | ) | | | (325 | ) |
| Investment in non-consolidated subsidiaries/substantial investments | | | (963 | ) | | | (901 | ) | | | – | | | | – | | | | – | |
| |
| Total capital | | | 17,743 | | | | 15,531 | | | | 15,619 | | | | 16,032 | | | | 16,451 | |
| |
| Risk-weighted assets | | | 150,819 | | | | 137,323 | | | | 129,163 | | | | 131,078 | | | | 135,768 | |
| Capital ratios (%) | | | | | | | | | | | | | | | | | | | | |
| Tier 1 Capital Ratio | | | 10.25 | | | | 9.81 | | | | 9.55 | | | | 8.80 | | | | 8.15 | |
| Total Capital Ratio | | | 11.76 | | | | 11.31 | | | | 12.09 | | | | 12.23 | | | | 12.12 | |
| U.S. basis Tier 1 Capital Ratio | | | 9.96 | | | | 9.44 | | | | 9.17 | | | | 8.32 | | | | 7.87 | |
| U.S. basis Total Capital Ratio | | | 11.96 | | | | 11.45 | | | | 11.60 | | | | 11.60 | | | | 11.69 | |
| Assets-to-capital multiple | | | 16.4 | | | | 17.0 | | | | 16.4 | | | | 15.8 | | | | 14.2 | |
| Equity-to-assets ratio (%) | | | 4.7 | | | | 4.8 | | | | 4.5 | | | | 4.4 | | | | 4.1 | |
| |
| | |
| (1) | | Non-cumulative preferred shares and Innovative Tier 1 capital instruments include amounts that were reclassified to liabilities on the consolidated balance sheet, but are eligible for inclusion in the capital calculation for regulatory purposes. |
| |
| (2) | | In addition to goodwill, intangible assets in excess of 5% of gross Tier 1 capital are deducted from Tier 1 capital as required by OSFI guidelines. |
| | |
| (3) | | Reflects the qualification of preferred shares of a subsidiary as Tier 2 capital. |
| |
| (4) | | OSFI permits the inclusion of the lesser of the balance of our general allowance for credit losses and a percentage of risk-weighted assets (0.875% since 2002). |
Table 24Risk-Weighted Assets($ millions, except as noted)
| | | | | | | | | | | | | | | | | | | | | |
| As at October 31 | | 2005 | | | 2004 | |
| | | | | | | Credit | | | Risk | | | Risk- | | | Risk- | |
| | | | | | | risk | | | weighting | | | weighted | | | weighted | |
| | | Balance | | | equivalent | | | (%) | | | balance | | | balance | |
| |
| Balance sheet items | | | | | | | | | | | | | | | | | | | | |
| Cash resources | | | 20,721 | | | | 20,721 | | | | 0–20 | | | | 3,945 | | | | 3,426 | |
| Securities | | | 57,256 | | | | 57,256 | | | | 0–100 | | | | 4,237 | | | | 4,722 | |
| Mortgages | | | 65,986 | | | | 65,986 | | | | 0–100 | | | | 22,997 | | | | 20,117 | |
| Other loans and acceptances | | | 108,351 | | | | 108,351 | | | | 0–100 | | | | 76,368 | | | | 69,188 | |
| Other assets | | | 45,218 | | | | 45,218 | | | | 0–100 | | | | 7,706 | | | | 9,084 | |
| |
| Total balance sheet items | | | 297,532 | | | | 297,532 | | | | | | | | 115,253 | | | | 106,537 | |
| |
| Off-balance sheet items | | | | | | | | | | | | | | | | | | | | |
| Guarantees and standby letters of credit | | | 12,755 | | | | 10,984 | | | | 0–100 | | | | 8,695 | | | | 9,379 | |
| Securities lending | | | 810 | | | | 256 | | | | 0–100 | | | | 51 | | | | 20 | |
| Documentary and commercial letters of credit | | | 974 | | | | 195 | | | | 0–100 | | | | 87 | | | | 75 | |
| Commitments to extend credit: | | | | | | | | | | | | | | | | | | | | |
| Original maturity of one year and under | | | 70,695 | | | | – | | | | 0 | | | | – | | | | – | |
| Original maturity of over one year | | | 24,411 | | | | 12,206 | | | | 0–100 | | | | 11,909 | | | | 9,103 | |
| Derivative financial instruments | | | 2,001,552 | | | | 27,083 | | | | 0–50 | | | | 8,666 | | | | 6,886 | |
| |
| Total off-balance sheet items | | | 2,111,197 | | | | 50,724 | | | | | | | | 29,408 | | | | 25,463 | |
| |
| Total risk-weighted assets – credit risk | | | | | | | | | | | | | | | 144,661 | | | | 132,000 | |
| Total risk-weighted assets – market risk | | | | | | | | | | | | | | | 6,158 | | | | 5,323 | |
| Total risk-weighted assets | | | | | | | | | | | | | | | 150,819 | | | | 137,323 | |
| Total risk-weighted assets – U.S. basis | | | | | | | | | | | | | | | 154,224 | | | | 139,159 | |
| |
| | | |
| 90 | | BMO Financial Group 188th Annual Report 2005 |
Statement of Management’s Responsibility for Financial Information
Bank of Montreal’s management is responsible for presentation and preparation of the annual consolidated financial statements, Management’s Discussion and Analysis (“MD&A”) and all other information in the Annual Report.
The consolidated financial statements have been prepared in accordance with Canadian generally accepted accounting principles (“GAAP”) and the requirements of the Securities and Exchange Commission (“SEC”) in the United States, as applicable. The financial statements also comply with the provisions of theBank Act and related regulations, including interpretations of GAAP by our regulator, the Superintendent of Financial Institutions Canada.
The MD&A has been prepared in accordance with the requirements of securities regulators including National Instrument 51-102 of the Canadian Securities Administrators (“CSA”) as well as Item 303 of Regulation S-K of theSecurities Exchange Act, and their related published requirements.
The consolidated financial statements and information in the MD&A necessarily include amounts based on informed judgments and estimates of the expected effects of current events and transactions with appropriate consideration to materiality. In addition, in preparing the financial information we must interpret the requirements described above, make determinations as to the relevancy of information to be included, and make estimates and assumptions that affect reported information. The MD&A also includes information regarding the impact of current transactions and events, sources of liquidity and capital resources, operating trends, risks and uncertainties. Actual results in the future may differ materially from our present assessment of this information because future events and circumstances may not occur as expected.
The financial information presented elsewhere in the Annual Report is consistent with that in the consolidated financial statements.
In meeting our responsibility for the reliability of financial information, we maintain and rely on a comprehensive system of internal controls and internal audit, including organizational and
procedural controls and internal controls over financial reporting. Our system of internal control includes written communication of our policies and procedures governing corporate conduct and risk management; comprehensive business planning; effective segregation of duties; delegation of authority and personal accountability; careful selection and training of personnel; and accounting policies which we regularly update. This structure ensures appropriate internal control over transactions, assets and records. We also regularly audit internal controls. These controls and audits are designed to provide us with reasonable assurance that the financial records are reliable for preparing financial statements and other financial information, assets are safeguarded against unauthorized use or disposition, liabilities are recognized, and we are in compliance with all regulatory requirements.
We, as Bank of Montreal’s Chief Executive Officer and Chief Financial Officer, will certify the Bank of Montreal’s annual filings with the CSA and the SEC as required in Canada by Multilateral Instrument 52-109 (Certification of Disclosure in Issuers’ Annual and Interim Filings) and in the United States by theSarbanes-Oxley Act.
In order to provide their opinion on our consolidated financial statements, the Shareholders’Auditors review our system of internal controls and conduct their work to the extent that they consider appropriate.
The Board of Directors, based on recommendations from its Audit and Conduct Review Committees and its Risk Review Committee, reviews and approves the financial information contained in the Annual Report, including the MD&A, and oversees management’s responsibilities for the presentation and preparation of financial information, maintenance of appropriate internal controls, management and control of major risk areas and assessment of significant and related party transactions.
The Shareholders’ Auditors and the Bank’s Chief Auditor have full and free access to the Board of Directors and its committees to discuss audit, financial reporting and related matters.
| | | | | |
/s/ F. Anthony Comper | | /s/ Karen E. Maidment | | Canada |
| President and Chief Executive Officer | | Senior Executive Vice-President
and Chief Financial Officer | | November 29, 2005 |
Shareholders’ Auditors’ Report
To the Shareholders of Bank of Montreal
We have audited the consolidated balance sheets of Bank of Montreal as at October 31, 2005 and 2004 and the consolidated statements of income, changes in shareholders’ equity and cash flows for each of the years in the two-year period ended October 31, 2005. These financial statements are the responsibility of the Bank’s management. Our responsibility is to express an opinion on these financial statements based on our audits.
We conducted our audits in accordance with Canadian generally accepted auditing standards. Those standards require that we plan and perform an audit to obtain reasonable assurance whether the financial statements are free of material misstatement. An audit includes examining, on a test basis, evidence supporting the amounts and disclosures in the financial statements. An audit also includes assessing the accounting principles used and significant estimates made by management, as well as evaluating the overall financial statement presentation.
In our opinion, these consolidated financial statements present fairly, in all material respects, the financial position of Bank of Montreal as at October 31, 2005 and 2004 and the results of its operations and its cash flows for each of the years in the two-year period ended October 31, 2005 in accordance with Canadian generally accepted accounting principles.
The consolidated statements of income, changes in shareholders’ equity and cash flows for the year ended October 31, 2003, prior to an adjustment for changes in the Bank’s accounting policy relating to the reclassification of financial instruments as liabilities and equity as described in Note 20 to the consolidated financial statements, were audited by KPMG LLP and PricewaterhouseCoopers LLP, who expressed an opinion without reservation on those statements in the shareholders’ auditors’ report dated November 25, 2003. We have audited the adjustments to the consolidated statements of income, changes in shareholders’ equity and cash flows for the year ended October 31, 2003 and, in our opinion, such adjustments, in all material respects, are appropriate and have been properly applied.
| | | |
/s/ KPMG LLP | | Canada |
| Chartered Accountants | | November 29, 2005 |
| | | |
| BMO Financial Group 188th Annual Report 2005 | | 91 |
Consolidated Balance Sheet
| | | | | | | | | |
| As at October 31 (Canadian $ in millions) | | 2005 | | | 2004 | |
| |
| | | | | | | Restated | |
Assets | | | | | (see Note 20) | |
Cash Resources(Notes 2 and 27) | | $ | 20,721 | | | $ | 18,045 | |
| |
Securities(Notes 3 and 27) | | | | | | | | |
| Investment (fair value $12,933 in 2005 and $15,103 in 2004) | | | 12,936 | | | | 15,017 | |
| Trading | | | 44,309 | | | | 35,444 | |
| Loan substitutes | | | 11 | | | | 11 | |
| |
| | | | 57,256 | | | | 50,472 | |
| |
Loans(Notes 4 and 7) | | | | | | | | |
| Residential mortgages | | | 60,871 | | | | 56,444 | |
| Consumer instalment and other personal | | | 27,929 | | | | 24,887 | |
| Credit cards | | | 4,648 | | | | 3,702 | |
| Businesses and governments | | | 47,803 | | | | 44,559 | |
| Securities borrowed or purchased under resale agreements | | | 28,280 | | | | 22,609 | |
| |
| | | | 169,531 | | | | 152,201 | |
| Customers’ liability under acceptances (Note 4) | | | 5,934 | | | | 5,355 | |
| Allowance for credit losses (Note 4) | | | (1,128 | ) | | | (1,308 | ) |
| |
| | | | 174,337 | | | | 156,248 | |
| |
Other Assets | | | | | | | | |
| Derivative financial instruments (Note 9) | | | 31,517 | | | | 25,448 | |
| Premises and equipment (Note 10) | | | 1,847 | | | | 2,020 | |
| Goodwill (Note 13) | | | 1,091 | | | | 1,507 | |
| Intangible assets (Note 13) | | | 196 | | | | 480 | |
| Other (Note 14) | | | 10,567 | | | | 10,974 | |
| |
| | | | 45,218 | | | | 40,429 | |
| |
| Total Assets | | $ | 297,532 | | | $ | 265,194 | |
| |
Liabilities and Shareholders’ Equity | | | | | | | | |
Deposits(Note 15) | | | | | | | | |
| Banks | | $ | 25,473 | | | $ | 20,654 | |
| Businesses and governments | | | 92,437 | | | | 79,614 | |
| Individuals | | | 75,883 | | | | 74,922 | |
| |
| | | | 193,793 | | | | 175,190 | |
| |
Other Liabilities | | | | | | | | |
| Derivative financial instruments (Note 9) | | | 28,868 | | | | 23,973 | |
| Acceptances (Note 16) | | | 5,934 | | | | 5,355 | |
| Securities sold but not yet purchased (Note 16) | | | 16,142 | | | | 10,441 | |
| Securities lent or sold under repurchase agreements (Note 16) | | | 22,657 | | | | 21,345 | |
| Other (Note 16) | | | 12,203 | | | | 12,156 | |
| |
| | | | 85,804 | | | | 73,270 | |
| |
Subordinated Debt(Note 17) | | | 2,469 | | | | 2,395 | |
| |
Preferred Share Liability(Note 20) | | | 450 | | | | 450 | |
| |
Capital Trust Securities(Note 18) | | | 1,150 | | | | 1,150 | |
| |
Shareholders’ Equity | | | | | | | | |
| Share capital (Note 20) | | | 4,618 | | | | 4,453 | |
| Contributed surplus (Note 21) | | | 20 | | | | 10 | |
| Net unrealized foreign exchange loss | | | (612 | ) | | | (497 | ) |
| Retained earnings | | | 9,840 | | | | 8,773 | |
| |
| | | | 13,866 | | | | 12,739 | |
| |
| Total Liabilities and Shareholders’ Equity | | $ | 297,532 | | | $ | 265,194 | |
| |
The accompanying notes to consolidated financial statements are an integral part of these statements.
Certain comparative figures have been reclassified to conform with the current year’s presentation.
| | | |
| /s/ F. Anthony Comper | | /s/ Jeremy H. Reitman |
F. Anthony Comper | | Jeremy H. Reitman |
| President and Chief Executive Officer | | Chairman, Audit Committee |
| | | |
| 92 | | BMO Financial Group 188th Annual Report 2005 |
Consolidated Statement of Income
| | | | | | | | | | | | | |
| For the Year Ended October 31 (Canadian $ in millions, except as noted) | | 2005 | | | 2004 | | | 2003 | |
| |
Interest, Dividend and Fee Income | | | | | | Restated (see Note 20) | |
| Loans | | $ | 7,728 | | | $ | 6,743 | | | $ | 6,970 | |
| Securities (Note 3) | | | 1,830 | | | | 1,476 | | | | 1,601 | |
| Deposits with banks | | | 606 | | | | 438 | | | | 356 | |
| |
| | | | 10,164 | | | | 8,657 | | | | 8,927 | |
| |
Interest Expense | | | | | | | | | | | | |
| Deposits | | | 3,703 | | | | 2,744 | | | | 2,957 | |
| Subordinated debt | | | 202 | | | | 193 | | | | 235 | |
| Preferred shares and capital trust securities (Notes 18 and 20) | | | 97 | | | | 124 | | | | 122 | |
| Other liabilities | | | 1,375 | | | | 798 | | | | 836 | |
| |
| | | | 5,377 | | | | 3,859 | | | | 4,150 | |
| |
Net Interest Income | | | 4,787 | | | | 4,798 | | | | 4,777 | |
| Provision for credit losses (Note 4) | | | 179 | | | | (103 | ) | | | 455 | |
| |
| Net Interest Income After Provision for Credit Losses | | | 4,608 | | | | 4,901 | | | | 4,322 | |
| |
Non-Interest Revenue | | | | | | | | | | | | |
| Securities commissions and fees | | | 1,092 | | | | 1,055 | | | | 894 | |
| Deposit and payment service charges | | | 734 | | | | 746 | | | | 756 | |
| Trading revenues | | | 413 | | | | 200 | | | | 275 | |
| Lending fees | | | 313 | | | | 317 | | | | 293 | |
| Card fees | | | 334 | | | | 261 | | | | 290 | |
| Investment management and custodial fees | | | 305 | | | | 307 | | | | 303 | |
| Mutual fund revenues | | | 437 | | | | 378 | | | | 321 | |
| Securitization revenues (Note 7) | | | 113 | | | | 177 | | | | 244 | |
| Underwriting and advisory fees | | | 357 | | | | 343 | | | | 268 | |
| Investment securities gains (losses) (Note 3) | | | 165 | | | | 175 | | | | (41 | ) |
| Foreign exchange, other than trading | | | 180 | | | | 177 | | | | 160 | |
| Insurance income | | | 162 | | | | 139 | | | | 124 | |
| Other | | | 447 | | | | 276 | | | | 333 | |
| |
| | | | 5,052 | | | | 4,551 | | | | 4,220 | |
| |
| Net Interest Income and Non-Interest Revenue | | | 9,660 | | | | 9,452 | | | | 8,542 | |
| |
Non-Interest Expense | | | | | | | | | | | | |
| Employee compensation (Notes 21 and 22) | | | 3,746 | | | | 3,632 | | | | 3,578 | |
| Premises and equipment (Note 10) | | | 1,264 | | | | 1,252 | | | | 1,264 | |
| Amortization of intangible assets (Note 13) | | | 94 | | | | 104 | | | | 105 | |
| Travel and business development | | | 247 | | | | 239 | | | | 225 | |
| Communications | | | 122 | | | | 138 | | | | 162 | |
| Business and capital taxes | | | 107 | | | | 99 | | | | 106 | |
| Professional fees | | | 243 | | | | 262 | | | | 255 | |
| Other | | | 504 | | | | 431 | | | | 392 | |
| |
| Total Non-Interest Expense | | | 6,327 | | | | 6,157 | | | | 6,087 | |
| |
Income Before Provision for Income Taxes and Non-Controlling Interest in Subsidiaries | | | 3,333 | | | | 3,295 | | | | 2,455 | |
| Income taxes (Note 23) | | | 875 | | | | 972 | | | | 652 | |
| |
| | | | 2,458 | | | | 2,323 | | | | 1,803 | |
| Non-controlling interest in subsidiaries (Notes 16 and 18) | | | 58 | | | | 17 | | | | 22 | |
| |
Net Income | | $ | 2,400 | | | $ | 2,306 | | | $ | 1,781 | |
| |
| Preferred share dividends (Note 20) | | $ | 30 | | | $ | 31 | | | $ | 38 | |
| Net income available to common shareholders | | $ | 2,370 | | | $ | 2,275 | | | $ | 1,743 | |
| Average common shares (in thousands) | | | 500,060 | | | | 501,656 | | | | 496,208 | |
| Average diluted common shares (in thousands) | | | 510,736 | | | | 515,045 | | | | 507,009 | |
| |
Earnings Per Share(Canadian $) (Note 24) | | | | | | | | | | | | |
| Basic | | $ | 4.74 | | | $ | 4.53 | | | $ | 3.51 | |
| Diluted | | | 4.64 | | | | 4.42 | | | | 3.44 | |
Dividends Declared Per Common Share | | | 1.85 | | | | 1.59 | | | | 1.34 | |
| |
The accompanying notes to consolidated financial statements are an integral part of these statements.
Certain comparative figures have been reclassified to conform with the current year’s presentation.
| | | |
| BMO Financial Group 188th Annual Report 2005 | | 93 |
Consolidated Statement of Changes in Shareholders’ Equity
| | | | | | | | | | | | | | | | | | | | | | | | | |
| For the Year Ended October 31 (Canadian $ in millions, except as noted) | | | | | | | | | 2005 | | | 2004 | | | 2003 | |
| |
| Preferred Shares(Note 20) | | | | | | | | | | | | | | | | Restated (see Note 20) | |
| Balance at beginning of year | | | | | | | | | | | | | | $ | 596 | | | $ | 596 | | | $ | 1,517 | |
| Impact of adopting new accounting requirements for liabilities and equity (Note 20) | | | – | | | | – | | | | (850 | ) |
| |
| Balance at beginning of year (as restated) | | | 596 | | | | 596 | | | | 667 | |
| Translation adjustment on shares issued in a foreign currency | | | – | | | | – | | | | (71 | ) |
| |
| Balance at End of Year | | | | | | | | | | | | | | | 596 | | | | 596 | | | | 596 | |
| |
| | | | | | | | | | | | | | | | | | | | | | | | | |
| | | Number of Shares | | | | | | | | | | | | | |
| | | 2005 | | | 2004 | | | 2003 | | | | | | | | | | | | | |
| | | | | | | | | | | | | | | | |
Common Shares(Note 20) | | | | | | | | | | | | | | | | | | | | | | | | |
| Balance at beginning of year | | | 500,896,857 | | | | 499,632,368 | | | | 492,504,878 | | | | 3,857 | | | | 3,662 | | | | 3,459 | |
| Issued under the Shareholder Dividend Reinvestment and Share Purchase Plan (Note 20) | | | 1,258,463 | | | | 1,120,931 | | | | 1,101,305 | | | | 71 | | | | 60 | | | | 46 | |
| Issued under the Stock Option Plan (Note 21) | | | 4,736,826 | | | | 6,239,301 | | | | 5,325,916 | | | | 146 | | | | 180 | | | | 129 | |
| Issued on the exchange of shares of a subsidiary corporation (Note 20) | | | 284,722 | | | | 124,757 | | | | 348,518 | | | | 2 | | | | 2 | | | | 3 | |
| Issued on the acquisition of a business (Note 20) | | | – | | | | – | | | | 634,551 | | | | – | | | | – | | | | 27 | |
| Repurchased for cancellation (Note 20) | | | (6,957,800 | ) | | | (6,220,500 | ) | | | (282,800 | ) | | | (54 | ) | | | (47 | ) | | | (2 | ) |
| |
| Balance at End of Year | | | 500,219,068 | | | | 500,896,857 | | | | 499,632,368 | | | | 4,022 | | | | 3,857 | | | | 3,662 | |
| |
Contributed Surplus | | | | | | | | | | | | | | | | | | | | | | | | |
| Balance at beginning of year | | | | | | | | | | | | | | | 10 | | | | 3 | | | | – | |
| Stock option expense (Note 21) | | | | | | | | | | | | | | | 10 | | | | 7 | | | | 3 | |
| Gain on treasury shares, net of applicable income taxes (Note 1) | | | | | | | | | | | | | | – | | | | 15 | | | | – | |
| Common shares repurchased for cancellation (Note 20) | | | | | | | | | | | | | | | – | | | | (15 | ) | | | – | |
| |
| Balance at End of Year | | | | | | | | | | | | | | | 20 | | | | 10 | | | | 3 | |
| |
Net Unrealized Foreign Exchange Gain (Loss) | | | | | | | | | | | | | | | | | | | | | | | | |
| Balance at beginning of year | | | | | | | | | | | | | | | (497 | ) | | | (195 | ) | | | 419 | |
| Unrealized loss on translation of net investments in foreign operations | | | | | | | | | | | | (311 | ) | | | (758 | ) | | | (1,674 | ) |
| Hedging gain | | | | | | | | | | | | | | | 297 | | | | 710 | | | | 1,661 | |
| Income taxes | | | | | | | | | | | | | | | (101 | ) | | | (254 | ) | | | (601 | ) |
| |
| Balance at End of Year | | | | | | | | | | | | | | | (612 | ) | | | (497 | ) | | | (195 | ) |
| |
Retained Earnings | | | | | | | | | | | | | | | | | | | | | | | | |
| Balance at beginning of year | | | | | | | | | | | | | | | 8,773 | | | | 7,566 | | | | 6,499 | |
Cumulative impact of adopting new accounting requirements for Variable Interest Entities,
net of applicable income taxes (Note 8) | | | (42 | ) | | | – | | | | – | |
| Net income | | | | | | | | | | | | | | | 2,400 | | | | 2,306 | | | | 1,781 | |
| Dividends – Preferred shares (Note 20) | | | | | | | | | | | | | | | (30 | ) | | | (31 | ) | | | (38 | ) |
| – Common shares (Note 20) | | | | | | | | | | | | | | | (925 | ) | | | (797 | ) | | | (666 | ) |
| Common shares repurchased for cancellation (Note 20) | | | | | | | | | | | | | | | (336 | ) | | | (271 | ) | | | (10 | ) |
| |
| Balance at End of Year | | | | | | | | | | | | | | | 9,840 | | | | 8,773 | | | | 7,566 | |
| |
| Total Shareholders’ Equity | | | | | | | | | | | | | | $ | 13,866 | | | $ | 12,739 | | | $ | 11,632 | |
| |
The accompanying notes to consolidated financial statements are an integral part of these statements.
| | | |
| 94 | | BMO Financial Group 188th Annual Report 2005 |
Consolidated Statement of Cash Flows
| | | | | | | | | | | | | |
| For the Year Ended October 31 (Canadian $ in millions) | | 2005 | | | 2004 | | | 2003 | |
| |
Cash Flows from Operating Activities | | | | | | Restated (see Note 20) | |
| Net income | | $ | 2,400 | | | $ | 2,306 | | | $ | 1,781 | |
| Adjustments to determine net cash flows provided by (used in) operating activities | | | | | | | | | | | | |
| Write-down of investment securities | | | 11 | | | | 63 | | | | 153 | |
| Net gain on investment securities | | | (176 | ) | | | (238 | ) | | | (112 | ) |
| Net (increase) in trading securities | | | (8,865 | ) | | | (449 | ) | | | (12,692 | ) |
| Provision for credit losses | | | 179 | | | | (103 | ) | | | 455 | |
| Gain on sale of securitized loans | | | (82 | ) | | | (127 | ) | | | (157 | ) |
| Change in derivative financial instruments – (Increase) decrease in derivative asset | | | (6,069 | ) | | | (4,232 | ) | | | 892 | |
| – Increase (decrease) in derivative liability | | | 4,895 | | | | 3,258 | | | | (1,380 | ) |
| Amortization of premises and equipment | | | 377 | | | | 365 | | | | 375 | |
| Amortization of intangible assets | | | 94 | | | | 104 | | | | 116 | |
| Future income tax expense (benefit) | | | 91 | | | | 157 | | | | (37 | ) |
| Net increase (decrease) in current income taxes | | | (369 | ) | | | (1,096 | ) | | | 401 | |
| Change in accrued interest – (Increase) decrease in interest receivable | | | (230 | ) | | | (30 | ) | | | 87 | |
| – Increase (decrease) in interest payable | | | 155 | | | | 7 | | | | (141 | ) |
| Changes in other items and accruals, net | | | 1,382 | | | | 2,287 | | | | 986 | |
Gain on sale of Harrisdirectllc (Note 12) | | | (49 | ) | | | – | | | | – | |
| Gain on sales of land and buildings (Note 10) | | | (29 | ) | | | – | | | | – | |
| |
| Net Cash Provided by (Used in) Operating Activities | | | (6,285 | ) | | | 2,272 | | | | (9,273 | ) |
| |
Cash Flows from Financing Activities | | | | | | | | | | | | |
| Net increase in deposits | | | 17,851 | | | | 2,205 | | | | 9,713 | |
| Net increase in securities sold but not yet purchased | | | 5,701 | | | | 2,186 | | | | 601 | |
| Net increase (decrease) in securities lent or sold under repurchase agreements | | | 1,312 | | | | (2,722 | ) | | | (788 | ) |
| Net increase (decrease) in liabilities of subsidiaries | | | (231 | ) | | | 491 | | | | (157 | ) |
| Proceeds from issuance of securities of a subsidiary | | | 447 | | | | 595 | | | | – | |
| Repayment of subordinated debt (Note 17) | | | (899 | ) | | | (400 | ) | | | (752 | ) |
| Proceeds from issuance of subordinated debt (Note 17) | | | 1,000 | | | | – | | | | – | |
| Redemption of preferred share liability | | | – | | | | (400 | ) | | | – | |
| Proceeds from issuance of common shares | | | 217 | | | | 240 | | | | 175 | |
| Proceeds from sales of treasury shares | | | – | | | | 149 | | | | – | |
| Common shares repurchased for cancellation (Note 20) | | | (390 | ) | | | (333 | ) | | | (12 | ) |
| Dividends paid | | | (955 | ) | | | (829 | ) | | | (704 | ) |
| |
| Net Cash Provided by Financing Activities | | | 24,053 | | | | 1,182 | | | | 8,076 | |
| |
Cash Flows from Investing Activities | | | | | | | | | | | | |
| Net (increase) decrease in interest bearing deposits with banks | | | (2,885 | ) | | | 1,974 | | | | (1,741 | ) |
| Purchases of investment securities | | | (14,600 | ) | | | (24,773 | ) | | | (29,348 | ) |
| Maturities of investment securities | | | 8,335 | | | | 12,699 | | | | 18,999 | |
| Proceeds from sales of investment securities | | | 8,246 | | | | 16,334 | | | | 9,298 | |
| Net (increase) decrease in loans, customers’ liability under acceptances and loan substitute securities | | | (15,025 | ) | | | (8,678 | ) | | | 189 | |
| Proceeds from securitization of loans | | | 3,130 | | | | 1,382 | | | | – | |
| Net (increase) decrease in securities borrowed or purchased under resale agreements | | | (5,671 | ) | | | (1,611 | ) | | | 2,959 | |
| Proceeds from sales of land and buildings (Note 10) | | | 347 | | | | – | | | | – | |
| Premises and equipment – net purchases | | | (472 | ) | | | (305 | ) | | | (254 | ) |
| Acquisitions (Note 11) | | | (194 | ) | | | (385 | ) | | | (91 | ) |
Proceeds from sale of Harrisdirectllc (Note 12) | | | 827 | | | | – | | | | – | |
| |
| Net Cash Provided by (Used in) Investing Activities | | | (17,962 | ) | | | (3,363 | ) | | | 11 | |
| |
| Net Increase (Decrease) in Cash and Cash Equivalents | | | (194 | ) | | | 91 | | | | (1,186 | ) |
| Cash and Cash Equivalents at Beginning of Year | | | 2,606 | | | | 2,515 | | | | 3,701 | |
| |
| Cash and Cash Equivalents at End of Year | | $ | 2,412 | | | $ | 2,606 | | | $ | 2,515 | |
| |
Represented by: | | | | | | | | | | | | |
| Cash and non-interest bearing deposits with Bank of Canada and other banks | | $ | 1,309 | | | $ | 1,558 | | | $ | 1,693 | |
| Cheques and other items in transit, net | | | 1,103 | | | | 1,048 | | | | 822 | |
| |
| | | $ | 2,412 | | | $ | 2,606 | | | $ | 2,515 | |
| |
Supplemental Disclosure of Cash Flow Information | | | | | | | | | | | | |
| Amount of interest paid in the year | | $ | 5,222 | | | $ | 3,852 | | | $ | 4,291 | |
| Amount of income taxes paid in the year | | $ | 1,065 | | | $ | 1,947 | | | $ | 324 | |
| |
The accompanying notes to consolidated financial statements are an integral part of these statements.
Certain comparative figures have been reclassified to conform with the current year’s presentation.
| | | |
| BMO Financial Group 188th Annual Report 2005 | | 95 |
Notes to Consolidated Financial Statements
Note 1 4 Basis of Presentation
We prepare our consolidated financial statements in accordance with Canadian generally accepted accounting principles (“GAAP”), including interpretations of GAAP by our regulator, the Superintendent of Financial Institutions Canada.
We reconcile our Canadian GAAP results to those that would result under United States GAAP. Significant differences in consolidated total assets, total liabilities or net income arising from applying United States GAAP are described in Note 29. In addition, our consolidated financial statements comply with applicable disclosure requirements of United States GAAP, except we do not provide disclosures related to the Canadian and United States GAAP differences described in Note 29.
Basis of Consolidation
We conduct business through a variety of corporate structures, including subsidiaries and joint ventures. Subsidiaries are those where we exercise control through our ownership of the majority of the voting shares. Joint ventures are those where we exercise joint control through an agreement with other shareholders. All of the assets, liabilities, revenues and expenses of our subsidiaries and our proportionate share of the assets, liabilities, revenues and expenses of our joint ventures are included in our consolidated financial statements. All significant inter-company transactions and balances are eliminated.
We hold investments in companies where we exert significant influence over operating, investing and financing decisions (those where we own between 20% and 50% of the voting shares). These are recorded at cost and are adjusted for our proportionate share of any net income or loss and dividends. They are recorded as investment securities in our Consolidated Balance Sheet and our proportionate share of the net income or loss of these companies is recorded in interest, dividend and fee income – securities, in our Consolidated Statement of Income.
We hold interests in variable interest entities that are not included in our consolidated financial statements; these are more fully described in Note 8.
Translation of Foreign Currencies
We conduct business in a variety of foreign currencies and report our consolidated financial statements in Canadian dollars. Assets and liabilities denominated in foreign currencies are translated into Canadian dollars at the exchange rate in effect at the balance sheet date. Revenues and expenses denominated in foreign currencies are translated using the average exchange rate for the year.
Unrealized gains and losses arising from translating net investments in foreign operations into Canadian dollars, net of related hedging activities and applicable income taxes, are included in shareholders’ equity as net unrealized foreign exchange gain (loss). When we sell or liquidate an investment in a foreign operation, the associated translation gains and losses, previously included in shareholders’ equity as net unrealized foreign exchange gain (loss), are recorded in non-interest revenue as part of the gain or loss on disposal of the investment. All other foreign currency translation gains and losses are included in foreign exchange, other than trading, in our Consolidated Statement of Income as they arise.
From time to time, we enter into foreign exchange hedge contracts to reduce our exposure to changes in the value of foreign currencies. Realized and unrealized gains and losses on the translation of foreign exchange hedge contracts are included in foreign exchange, other than trading, in our Consolidated Statement of Income.
Specific Accounting Policies
To facilitate a better understanding of our consolidated financial statements, we have disclosed our significant accounting policies throughout the following notes with the related financial disclosures by major caption:
| | | | | | |
| Note | | Topic | | Page | |
| |
| |
| 1 | | Basis of Presentation | | | 96 | |
| 2 | | Cash Resources | | | 97 | |
| 3 | | Securities | | | 97 | |
| 4 | | Loans, Customers’ Liability under Acceptances and
Allowance for Credit Losses | | | 100 | |
| 5 | | Other Credit Instruments | | | 102 | |
| 6 | | Guarantees | | | 102 | |
| 7 | | Asset Securitization | | | 103 | |
| 8 | | Variable Interest Entities | | | 105 | |
| 9 | | Derivative Financial Instruments | | | 106 | |
| 10 | | Premises and Equipment | | | 111 | |
| 11 | | Acquisitions | | | 112 | |
| 12 | | Sale of Harrisdirect llc | | | 113 | |
| 13 | | Goodwill and Intangible Assets | | | 113 | |
| 14 | | Other Assets | | | 114 | |
| 15 | | Deposits | | | 114 | |
| 16 | | Other Liabilities | | | 114 | |
| 17 | | Subordinated Debt | | | 115 | |
| 18 | | Capital Trust Securities | | | 116 | |
| 19 | | Interest Rate Risk | | | 116 | |
| 20 | | Share Capital | | | 118 | |
| 21 | | Employee Compensation – Stock-Based Compensation | | | 119 | |
| 22 | | Employee Compensation – Employee Future Benefits | | | 121 | |
| 23 | | Income Taxes | | | 124 | |
| 24 | | Earnings Per Share | | | 125 | |
| 25 | | Operating and Geographic Segmentation | | | 126 | |
| 26 | | Related Party Transactions | | | 128 | |
| 27 | | Contingent Liabilities | | | 128 | |
| 28 | | Fair Value of Financial Instruments | | | 129 | |
| 29 | | Reconciliation of Canadian and United States
Generally Accepted Accounting Principles | | | 130 | |
| |
Changes in Accounting Policy
Changes in accounting policy that resulted from changes by Canadian standard setters in the current year are disclosed as follows: Merchant banking investments – Note 3; variable interest entities – Note 8; and liabilities and equity – Notes 18 and 20. United States GAAP changes are described in Note 29. Changes in accounting policy in the two previous years are as follows:
Sources of GAAP
Effective November 1, 2003, we adopted new accounting requirements of the Canadian Institute of Chartered Accountants (“CICA”) that provide guidance on sources to consult when selecting accounting policies on matters not covered explicitly in Canadian accounting standards. As a result of these new requirements, we made the following changes to our accounting policies effective November 1, 2003:
(a) Mortgage Prepayment Fees
Mortgage prepayment fees are recognized in income when the related mortgages are prepaid or renegotiated at market rates. Prior to November 1, 2003, mortgage prepayment fees were deferred and amortized to income over the average remaining term of the related mortgages. In adopting this new policy we recorded in income an initial adjustment related to the balance of deferred mortgage prepayment fees as at November 1, 2003 of $42 million before income taxes.
(b) Treasury Shares
Purchases and sales of Bank of Montreal shares by subsidiaries are recorded in shareholders’ equity, with any gain included in contributed surplus. Prior to November 1, 2003, these shares were recorded as trading securities at market value, with related dividends and realized and unrealized gains and losses included in trading revenues.
| | | |
| 96 | | BMO Financial Group 188th Annual Report 2005 |
(c) Software Development Costs
Costs of internally developed software are capitalized and amortized over the estimated useful life of the software (up to five years). Prior to November 1, 2003, only amounts paid to third parties related to internally developed software were capitalized and amortized over the estimated useful life of the software.
(d) Preferred Shares
We are no longer changing the rate at which our U.S. dollar denominated preferred shares are translated into Canadian dollars. Prior to November 1, 2003, we adjusted the carrying value of these shares in shareholders’ equity to reflect changes in the exchange rate.
The impact of these changes in accounting policy on our Consolidated Statement of Income for 2004 as compared to the policies followed in 2003 was as follows:
| | | | | |
| (Canadian $ in millions, except as noted) | | | | |
| For the Year Ended October 31, 2004 | | | | |
| |
| Increase (Decrease) to Income Before Provision for Income Taxes | | | | |
| Interest, Dividend and Fee Income – Loans (a) | | $ | 48 | |
| Non-Interest Revenue – Trading revenues (b) | | | (26 | ) |
| Non-Interest Expense – Employee compensation (c) | | | 51 | |
| Non-Interest Expense – Premises and equipment (c) | | | (4 | ) |
| Non-Interest Revenue – Foreign exchange, other than trading (d) | | | 3 | |
| |
| Income Before Provision for Income Taxes | | | 72 | |
| Income taxes | | | (25 | ) |
| |
| Net Income | | $ | 47 | |
| |
| Earnings Per Share (Canadian $) | | | | |
| Basic | | $ | 0.09 | |
| Diluted | | | 0.09 | |
| |
Future Changes in Accounting Policy
The CICA has issued new accounting requirements for financial instruments, hedges and other comprehensive income. When we adopt the new requirements on November 1, 2006, we will report a new section of shareholders’ equity called other comprehensive income. The new section will include gains and losses related to the mark-to-market of investment securities and cash flow hedges as well as the net unrealized foreign exchange gain that is currently included in shareholders’ equity. The change in accounting policy as it relates to investment securities and derivatives is described in Notes 3 and 9, respectively. There will be no change in accounting policy for unrealized foreign exchange gains in shareholders’ equity.
The impact of remeasuring certain investment securities and derivative financial instruments at fair value on November 1, 2006 will be recognized in opening retained earnings. Results for prior periods will not be restated. We cannot currently determine the impact that these changes in accounting policy will have on our consolidated financial statements once adopted, as this will be dependent on the fair values of the related financial instruments in the future.
See Note 24 for a discussion of the new accounting rules regarding earnings per share.
Use of Estimates
In preparing our consolidated financial statements we must make estimates and assumptions, mainly concerning fair values, which affect reported amounts of assets, liabilities, net income and related disclosures. The most significant assets and liabilities where we must make estimates include measurement of other than temporary impairment – Note 3; allowance for credit losses – Note 4; accounting for securitizations – Note 7; financial instruments measured at fair value – Note 9; goodwill – Note 13; customer loyalty programs – Note 16; pension and other employee future benefits – Note 22; income taxes – Note 23; and contingent liabilities – Note 27. If actual results differ from the estimates, the impact would be recorded in future periods.
Note 2 4 Cash Resources
| | | | | | | | | |
| (Canadian $ in millions) | | 2005 | | | 2004 | |
| |
| Cash and non-interest bearing deposits with Bank of Canada and other banks | | $ | 1,309 | | | $ | 1,558 | |
| Interest bearing deposits with banks | | | 18,309 | | | | 15,439 | |
| Cheques and other items in transit, net | | | 1,103 | | | | 1,048 | |
| |
| Total | | $ | 20,721 | | | $ | 18,045 | |
| |
Deposits with Banks
Deposits with banks are recorded at cost and include acceptances we have purchased that were issued by other banks. Interest income earned on these deposits is recorded on an accrual basis.
Cheques and Other Items in Transit, Net
Cheques and other items in transit are recorded at cost and represent the net position of the uncleared cheques and other items in transit between us and other banks.
Cash Restrictions
Some of our foreign operations are required to maintain reserves or minimum balances with central banks in their respective countries of operation, amounting to $449 million as at October 31, 2005 ($494 million in 2004).
Note 3 4 Securities
Securities are divided into four types, each with a different purpose and accounting treatment. The four types of securities we hold are as follows:
Investment securitiesare comprised of equity and debt securities that we purchase with the intention of holding until maturity or until market conditions, such as a change in interest rates, provide us with a better investment opportunity. With the exception of merchant banking investments, equity securities are recorded at cost and debt securities at amortized cost, after any write-down for impairment. Gains and losses on disposal are calculated using the carrying amount of the securities sold.
Interest income earned, the amortization of premiums and discounts on debt securities and dividends received on equity securities are recorded in our Consolidated Statement of Income in interest, dividend and fee income.
Investment securities are reviewed at each quarter end to determine whether the fair value is below carrying value. When the fair value of any of our investment securities has declined below its carrying value, we assess whether the decline is other than temporary.
Impairment is evaluated taking into consideration a number of factors, and their relative significance varies from case to case. Factors considered include the length of time and extent to which fair value has been below carrying value, the financial condition and near-term prospects of the issuer, and our ability and intent to hold the investment for a period of time sufficient to allow for any anticipated recovery. If the decline is considered to be other than temporary, a write-down is recorded in our Consolidated Statement of Income in investment securities gains (losses).
| | | |
| BMO Financial Group 188th Annual Report 2005 | | 97 |
At October 31, 2005, we had total investments with a book value of $7,903 million ($8,612 million as at October 31, 2004) where fair value was below book value by $55 million ($43 million as at October 31, 2004). The majority of unrealized losses in our investment portfolio resulted from increases in market interest rates and not from deterioration in the creditworthiness of the issuers. Management has determined that the unrealized losses are temporary in nature.
Merchant banking investmentsare securities held by our merchant banking subsidiaries. These subsidiaries account for their investments at fair value, with changes in fair value recorded in our Consolidated Statement of Income in investment securities gains (losses) as they occur. See change in accounting policy.
Merchant banking investments are classified as investment securities in our Consolidated Balance Sheet.
Trading securitiesare securities that we purchase for resale over a short period of time. We report these securities at their market value and record the mark-to-market adjustments and any gains and losses on the sale of these securities in our Consolidated Statement of Income in trading revenues.
Loan substitute securitiesare customer financings, such as distressed preferred shares, that we structure as after-tax investments to provide our customers with an interest rate advantage over what would be applicable on a conventional loan. These securities are accounted for in accordance with our accounting policy for loans, which is described in Note 4.
We did not own any securities issued by a single non-government entity where the book value, as at October 31, 2005 or 2004, was greater than 10% of our shareholders’ equity.
Included in corporate equity are investments where we exert significant influence, but not control, of $966 million and $546 million as at October 31, 2005 and 2004, respectively.
Fair Value
For traded securities, quoted market value is considered to be fair value. For securities where market quotes are not available, we use estimation techniques to determine fair value. Estimation techniques used include discounted cash flows, multiples of earnings or comparisons with other securities that are substantially the same.
Change in Accounting Policy
On November 1, 2004, we adopted the CICA’s new accounting requirements applicable to our merchant banking subsidiaries. The new rules require these subsidiaries to account for their investments at fair value with changes in fair value recorded in net income. Previously, these subsidiaries accounted for their investments at cost. The difference between cost and fair value has been recognized in the current period. The impact on our Consolidated Statement of Income, including the initial adjustment to fair value on November 1, 2004, was an increase of $50 million in non-interest revenue – investment securities gains (losses), an increase in income taxes of $18 million and an increase in net income of $32 million for the year ended October 31, 2005. The impact on our Consolidated Balance Sheet was an increase of $50 million in investment securities as at October 31, 2005.
| | | | | | | | | | | | | | | | | | | | | | | | | | | | | | | | | | | | | | | | | | | | | | | | | | | | | |
| (Canadian $ in millions, except as noted) | | Term to maturity | | | | | | | 2005 | | | | | | | 2004 | |
| | | Within 1 | | | | | | | 1 to 3 | | | | | | | 3 to 5 | | | | | | | 5 to 10 | | | | | | | Over 10 | | | | | | | Total book | | | | | | | Total book | |
| | | year | | | | | | | years | | | | | | | years | | | | | | | years | | | | | | | years | | | | | | | value | | | | | | | value | |
| |
Investment Securities | | | | | | Yield | | | | | | | Yield | | | | | | | Yield | | | | | | | Yield | | | | | | | Yield | | | | | | | Yield | | | | | |
| Issued or guaranteed by: | | | | | | | % | | | | | | | | % | | | | | | | | % | | | | | | | | % | | | | | | | | % | | | | | | | | % | | | | | |
| Canadian federal government | | $ | 18 | | | | 3.04 | | | $ | – | | | | – | | | $ | – | | | | – | | | $ | – | | | | – | | | $ | 1 | | | | 4.39 | | | $ | 19 | | | | 3.11 | | | $ | 211 | |
| Canadian provincial and municipal governments | | | 2 | | | | 3.30 | | | | – | | | | – | | | | – | | | | – | | | | – | | | | – | | | | 1 | | | | 4.97 | | | | 3 | | | | 3.86 | | | | – | |
| U.S. federal government | | | 775 | | | | 2.52 | | | | 661 | | | | 3.65 | | | | 29 | | | | 3.24 | | | | – | | | | – | | | | – | | | | – | | | | 1,465 | | | | 3.04 | | | | 3,066 | |
| U.S. states, municipalities and agencies | | | 2,245 | | | | 2.70 | | | | 2,959 | | | | 3.84 | | | | 772 | | | | 2.09 | | | | 11 | | | | 3.70 | | | | 56 | | | | 4.96 | | | | 6,043 | | | | 3.20 | | | | 5,191 | |
| Other governments | | | 46 | | | | 3.80 | | | | 36 | | | | 3.66 | | | | 40 | | | | 4.55 | | | | 1 | | | | 4.24 | | | | – | | | | – | | | | 123 | | | | 4.01 | | | | 315 | |
| Mortgage-backed securities and collateralized mortgage obligations | | | – | | | | – | | | | 1 | | | | 3.20 | | | | 167 | | | | 3.91 | | | | 303 | | | | 4.15 | | | | 215 | | | | 4.58 | | | | 686 | | | | 4.22 | | | | 1,365 | |
| Corporate debt | | | 1,364 | | | | 2.95 | | | | 603 | | | | 4.29 | | | | 205 | | | | 2.05 | | | | 43 | | | | 4.51 | | | | 86 | | | | 0.28 | | | | 2,301 | | | | 3.15 | | | | 2,885 | |
| Corporate equity | | | 121 | | | | 5.49 | | | | 213 | | | | 5.47 | | | | 199 | | | | 5.55 | | | | 158 | | | | 4.75 | | | | 1,605 | | | | 0.66 | | | | 2,296 | | | | 2.07 | | | | 1,984 | |
| |
| Total investment securities | | | 4,571 | | | | 2.83 | | | | 4,473 | | | | 3.95 | | | | 1,412 | | | | 2.88 | | | | 516 | | | | 4.35 | | | | 1,964 | | | | 1.20 | | | | 12,936 | | | | 3.04 | | | | 15,017 | |
| |
Trading Securities | | | | | | | | | | | | | | | | | | | | | | | | | | | | | | | | | | | | | | | | | | | | | | | | | | | | |
| Issued or guaranteed by: | | | | | | | | | | | | | | | | | | | | | | | | | | | | | | | | | | | | | | | | | | | | | | | | | | | | |
| Canadian federal government | | | 3,178 | | | | | | | | 1,518 | | | | | | | | 1,971 | | | | | | | | 1,012 | | | | | | | | 1,900 | | | | | | | | 9,579 | | | | | | | | 6,170 | |
| Canadian provincial and municipal governments | | | 425 | | | | | | | | 267 | | | | | | | | 145 | | | | | | | | 539 | | | | | | | | 1,177 | | | | | | | | 2,553 | | | | | | | | 2,288 | |
| U.S. federal government | | | 57 | | | | | | | | 559 | | | | | | | | 127 | | | | | | | | 32 | | | | | | | | 301 | | | | | | | | 1,076 | | | | | | | | 910 | |
| U.S. states, municipalities and agencies | | | – | | | | | | | | – | | | | | | | | – | | | | | | | | – | | | | | | | | 152 | | | | | | | | 152 | | | | | | | | 97 | |
| Other governments | | | – | | | | | | | | – | | | | | | | | – | | | | | | | | 23 | | | | | | | | – | | | | | | | | 23 | | | | | | | | 11 | |
| Corporate debt | | | 1,670 | | | | | | | | 1,441 | | | | | | | | 1,289 | | | | | | | | 1,252 | | | | | | | | 8,718 | | | | | | | | 14,370 | | | | | | | | 9,518 | |
| Corporate equity | | | – | | | | | | | | – | | | | | | | | – | | | | | | | | 1 | | | | | | | | 16,555 | | | | | | | | 16,556 | | | | | | | | 16,450 | |
| |
| Total trading securities | | | 5,330 | | | | | | | | 3,785 | | | | | | | | 3,532 | | | | | | | | 2,859 | | | | | | | | 28,803 | | | | | | | | 44,309 | | | | | | | | 35,444 | |
| |
Loan Substitute Securities | | | – | | | | | | | | 11 | | | | | | | | – | | | | | | | | – | | | | | | | | – | | | | | | | | 11 | | | | | | | | 11 | |
| |
| Total securities | | $ | 9,901 | | | | | | | $ | 8,269 | | | | | | | $ | 4,944 | | | | | | | $ | 3,375 | | | | | | | $ | 30,767 | | | | | | | $ | 57,256 | | | | | | | $ | 50,472 | |
| |
Total by Currency (in Canadian $ equivalent) | | | | | | | | | | | | | | | | | | | | | | | | | | | | | | | | | | | | | | | | | | | | | | | | | | | | |
| Canadian dollar | | | 4,843 | | | | | | | | 2,916 | | | | | | | | 3,087 | | | | | | | | 2,050 | | | | | | | | 16,050 | | | | | | | | 28,946 | | | | | | | | 26,006 | |
| U.S. dollar | | | 4,439 | | | | | | | | 4,929 | | | | | | | | 1,713 | | | | | | | | 1,171 | | | | | | | | 14,643 | | | | | | | | 26,895 | | | | | | | | 22,536 | |
| Other currencies | | | 619 | | | | | | | | 424 | | | | | | | | 144 | | | | | | | | 154 | | | | | | | | 74 | | | | | | | | 1,415 | | | | | | | | 1,930 | |
| |
| Total securities | | $ | 9,901 | | | | | | | $ | 8,269 | | | | | | | $ | 4,944 | | | | | | | $ | 3,375 | | | | | | | $ | 30,767 | | | | | | | $ | 57,256 | | | | | | | $ | 50,472 | |
| |
Yields in the table above are calculated using the book value of the security and the contractual interest or stated dividend rates associated with each security adjusted for any amortization of premiums and discounts. Tax effects are not taken into consideration.
The term to maturity included in the table above is based on the contractual maturity date of the security. The term to maturity of mortgage-backed securities and collateralized mortgage obligations is based on average expected maturities. Actual maturities could differ as issuers may have the right to call or prepay obligations. Securities with no maturity date are included in the over 10 years category.
| | | |
| 98 | | BMO Financial Group 188th Annual Report 2005 |
Future Change in Accounting Policy
As discussed in Note 1, we will adopt the CICA’s new accounting requirements that will impact our accounting policy for investment securities other than merchant banking investments beginning November 1, 2006. The new rules will require us to classify these securities as held-to-maturity or available-for-sale. Available-for-sale securities will be measured at fair value with gains and losses recorded in a new section of shareholders’ equity called other comprehensive income. There will be no change in accounting for held-to-maturity securities.
The impact of remeasuring available-for-sale securities at fair value on November 1, 2006 will be recognized in opening retained earnings. Results for prior periods will not be restated. We cannot currently determine the impact that this change in accounting policy will have on our consolidated financial statements once adopted, as this will be dependent on the fair values of our available-for-sale securities in the future.
| | | | | | | | | | | | | | | | | | | | | | | | | | | | | | | | | |
| Unrealized Gains and Losses | | | | | | |
| (Canadian $ in millions) | | 2005 | | | 2004 | |
| | | | | | | Gross | | | Gross | | | | | | | | | | Gross | | | Gross | | | | |
| | | Book | | | unrealized | | | unrealized | | | Fair | | | Book | | | unrealized | | | unrealized | | | Fair | |
| | | value | | | gains | | | losses | | | value | | | value | | | gains | | | losses | | | value | |
| |
Investment Securities | | | | | | | | | | | | | | | | | | | | | | | | | | | | | | | | |
| Issued or guaranteed by: | | | | | | | | | | | | | | | | | | | | | | | | | | | | | | | | |
| Canadian federal government | | $ | 19 | | | $ | – | | | $ | – | | | $ | 19 | | | $ | 211 | | | $ | – | | | $ | – | | | $ | 211 | |
| Canadian provincial and municipal governments | | | 3 | | | | – | | | | – | | | | 3 | | | | – | | | | – | | | | – | | | | – | |
| U.S. federal government | | | 1,465 | | | | 1 | | | | 7 | | | | 1,459 | | | | 3,066 | | | | 2 | | | | 10 | | | | 3,058 | |
| U.S. states, municipalities and agencies | | | 6,043 | | | | 13 | | | | 30 | | | | 6,026 | | | | 5,191 | | | | 21 | | | | 13 | | | | 5,199 | |
| Other governments | | | 123 | | | | 2 | | | | 1 | | | | 124 | | | | 315 | | | | 2 | | | | 1 | | | | 316 | |
| Mortgage-backed securities and collateralized mortgage obligations | | | 686 | | | | 3 | | | | 10 | | | | 679 | | | | 1,365 | | | | 8 | | | | 4 | | | | 1,369 | |
| Corporate debt | | | 2,301 | | | | 11 | | | | 5 | | | | 2,307 | | | | 2,885 | | | | 32 | | | | 11 | | | | 2,906 | |
| Corporate equity | | | 2,296 | | | | 22 | | | | 2 | | | | 2,316 | | | | 1,984 | | | | 64 | | | | 4 | | | | 2,044 | |
| |
| Total | | $ | 12,936 | | | $ | 52 | | | $ | 55 | | | $ | 12,933 | | | $ | 15,017 | | | $ | 129 | | | $ | 43 | | | $ | 15,103 | |
| |
| | | | | | | | | | | | | | | | | | | | | | | | | | | | | | | | | |
| | | Investments in | | | | | | | | | | | Investments in | | | | |
| Unrealized Losses | | an unrealized | | | | | | | | | | | an unrealized | | | | |
| (Canadian $ in millions) | | loss position for | | | | | | | 2005 | | | loss position for | | | 2004 | |
| | | Less than | | | 12 months | | | | | | | | | | | Less than | | | 12 months | | | | |
| | | 12 months | | | or longer | | | Total | | | 12 months | | | or longer | | | Total | |
| | | Gross | | | Gross | | | Gross | | | | | | | Gross | | | Gross | | | Gross | | | | |
| | | unrealized | | | unrealized | | | unrealized | | | Fair | | | unrealized | | | unrealized | | | unrealized | | | Fair | |
| | | losses | | | losses | | | losses | | | value | | | losses | | | losses | | | losses | | | value | |
| |
Investment Securities | | | | | | | | | | | | | | | | | | | | | | | | | | | | | | | | |
| Issued or guaranteed by: | | | | | | | | | | | | | | | | | | | | | | | | | | | | | | | | |
| Canadian federal government | | $ | – | | | $ | – | | | $ | – | | | $ | – | | | $ | – | | | $ | – | | | $ | – | | | $ | 25 | |
| U.S. federal government | | | 5 | | | | 2 | | | | 7 | | | | 1,334 | | | | 8 | | | | 2 | | | | 10 | | | | 2,527 | |
| U.S. states, municipalities and agencies | | | 25 | | | | 5 | | | | 30 | | | | 4,992 | | | | 8 | | | | 5 | | | | 13 | | | | 3,588 | |
| Other governments | | | – | | | | – | | | | – | | | | 30 | | | | 1 | | | | �� | | | | 1 | | | | 177 | |
| Mortgage-backed securities and collateralized mortgage obligations | | | 10 | | | | – | | | | 10 | | | | 535 | | | | 4 | | | | – | | | | 4 | | | | 685 | |
| Corporate debt | | | 5 | | | | – | | | | 5 | | | | 847 | | | | 9 | | | | 2 | | | | 11 | | | | 1,506 | |
| Corporate equity | | | 2 | | | | 1 | | | | 3 | | | | 110 | | | | 4 | | | | – | | | | 4 | | | | 61 | |
| |
| Total | | $ | 47 | | | $ | 8 | | | $ | 55 | | | $ | 7,848 | | | $ | 34 | | | $ | 9 | | | $ | 43 | | | $ | 8,569 | |
| |
Income from securities is included in our Consolidated Statement of Income as follows:
| | | | | | | | | | | | | |
| (Canadian $ in millions) | | 2005 | | | 2004 | | | 2003 | |
| |
Reported in: | | | | | | | | | | | | |
Interest, Dividend and Fee Income | | | | | | | | | | | | |
| Investment securities | | $ | 490 | | | $ | 595 | | | $ | 858 | |
| Trading securities | | | 1,340 | | | | 881 | | | | 743 | |
| |
| | | $ | 1,830 | | | $ | 1,476 | | | $ | 1,601 | |
| |
Non-Interest Revenue | | | | | | | | | | | | |
Investment securities
Gross realized gains | | $ | 142 | | | $ | 242 | | | $ | 142 | |
| Gross realized losses | | | (16 | ) | | | (4 | ) | | | (30 | ) |
| Merchant banking securities – net unrealized gains | | | 50 | | | | – | | | | – | |
| Write-downs | | | (11 | ) | | | (63 | ) | | | (153 | ) |
| |
| Investment securities gains (losses) | | $ | 165 | | | $ | 175 | | | $ | (41 | ) |
| |
| Trading securities, net realized and unrealized gains | | $ | 222 | | | $ | 60 | | | $ | 65 | |
| |
| Total income from securities | | $ | 2,217 | | | $ | 1,711 | | | $ | 1,625 | |
| |
| | | |
| BMO Financial Group 188th Annual Report 2005 | | 99 |
Note 4 4 Loans, Customers’ Liability under Acceptances and Allowance for Credit Losses
Loans
Loans are recorded at cost net of unearned income and unamortized discounts. Unearned income includes prepaid interest and deferred loan fees. Interest income is recorded on an accrual basis, except for impaired loans, the treatment of which is described below.
Securities borrowed or purchased under resale agreements represent the amounts we will receive as a result of our commitment to resell securities that we have purchased back to the original seller, on a specified date at a specified price. We account for these instruments as loans.
Loan Fees
The accounting treatment for loan fees varies depending on the transaction. Loan origination, restructuring and renegotiation fees are recorded as interest income over the term of the loan. Commitment fees are recorded as interest income over the term of the loan, unless we believe the loan commitment will not be used. In the latter case, commitment fees are recorded as lending fees over the commitment period. Loan syndication fees are included in lending fees as the syndication is completed, unless the yield on any loans we retain is less than that of other comparable lenders involved in the financing. In the latter case, an appropriate portion of the syndication fee is deferred and amortized to interest income over the term of the loan.
Customers’ Liability under Acceptances
Acceptances represent a form of negotiable short-term debt that is issued by our customers and which we guarantee for a fee. We have offsetting claims, equal to the amount of the acceptances, against our customers when the instruments mature. The amount due under acceptances is recorded as a liability and our corresponding claim is recorded as a loan in our Consolidated Balance Sheet.
Impaired Loans
We classify residential mortgages as impaired when payment is contractually 90 days past due, or one year past due if guaranteed by the Government of Canada. Credit card loans are classified as impaired and immediately written off when principal or interest payments are 180 days past due. Consumer instalment and other personal loans are classified as impaired when principal or interest payments are 90 days past due, and are normally written off when they are one year past due.
Corporate and commercial loans are classified as impaired when we are no longer reasonably assured that principal or interest will be collected on a timely basis, or when payments are 90 days past due, or for fully secured loans, when payments are 180 days past due.
We do not recognize interest income on loans classified as impaired, and any interest income that is accrued and unpaid is reversed against interest income.
Payments received on loans that have been classified as impaired are recorded first to recover collection costs, principal and any previous write-offs or allowances, and then as interest income. Payments received on impaired consumer instalment loans are applied first to outstanding interest and then to the remaining principal.
A loan will be reclassified back to performing status when it is determined that there is reasonable assurance of full and timely repayment of interest and principal in accordance with the terms and conditions of the loan, and that none of the criteria for classification of the loan as impaired continue to apply.
From time to time we will restructure a loan due to the poor financial condition of the borrower. If no longer considered impaired, interest on these restructured loans is recorded on an accrual basis.
Allowance for Credit Losses
The allowance for credit losses recorded in our Consolidated Balance Sheet is maintained at a level which we consider adequate to absorb credit-related losses on our loans, customers’ liability under acceptances and other credit instruments (as discussed in Note 5). The portion related to other credit instruments is recorded in other liabilities in our Consolidated Balance Sheet.
The allowance comprises the following two components:
Specific Allowances
These allowances are recorded for specific loans to reduce their book value to the amount we expect to recover. We review our loans and acceptances, other than consumer instalment and credit card loans (which are written off when certain conditions exist, as discussed under impaired loans), on an ongoing basis to assess whether any loans should be classified as impaired and whether an allowance or write-off should be recorded. Our review of problem loans is conducted at least quarterly by our account managers, who assess the ultimate collectibility and estimated recoveries on a specific loan based on all events and conditions that the manager believes are relevant to the condition of the loan. This assessment is then reviewed and concurred with by an independent credit officer.
To determine the amount we expect to recover from an impaired loan, we use the value of the estimated future cash flows discounted at the effective rate inherent in the loan. When the amounts and timing of future cash flows cannot be estimated with reasonable reliability, the expected recovery amount is estimated using either the fair value of any security underlying the loan, net of expected costs of realization and any amounts legally required to be paid to the borrower, or an observable market price for the loan. Security can vary by type of loan and may include cash, securities, real property, accounts receivable, guarantees, inventory or other capital assets.
General Allowance
We maintain a general allowance in order to cover any impairment in the existing portfolio that cannot yet be associated with specific loans. Our approach to establishing and maintaining the general allowance is based on the guideline issued by our regulator, the Superintendent of Financial Institutions Canada.
The general allowance is reviewed on a quarterly basis. A number of factors are considered when determining the appropriate level of the general allowance. A statistical analysis of past performance is undertaken to derive the mean (Expected Loss) and volatility (Unexpected Loss) of loss experience.
This analysis calculates historical average losses for each homogeneous portfolio segment (e.g., mortgages), while other models estimate losses for portfolios of corporate loans that can be referenced to market data. In addition, the level of allowance already in place and management’s professional judgment regarding portfolio quality, business mix and economic as well as credit market conditions are also considered.
Provision for Credit Losses
Changes in the value of our loan portfolio due to credit-related losses or recoveries of amounts previously provided for or written off are included in the provision for credit losses in our Consolidated Statement of Income.
Foreclosed Assets
Property or other assets that we have received from borrowers to satisfy their loan commitments are recorded at fair value and are classified as either held for use or held for sale according to management’s intention. Fair value is determined based on market prices where available. Otherwise, fair value is determined using other methods, such as analysis of discounted cash flows or market prices for similar assets.
| | | |
| 100 | | BMO Financial Group 188th Annual Report 2005 |
Loans, including customers’ liability under acceptances and allowance for credit losses by category, are as follows:
| | | | | | | | | | | | | | | | | | | | | | | | | | | | | | | | | |
| | | | Gross | | | Specific | | | General | | | Net | |
| (Canadian $ in millions) | | | amount | | | allowance | | | allowance | | | amount | |
| | | 2005 | | | 2004 | | | 2005 | | | 2004 | | | 2005 | | | 2004 | | | 2005 | | | 2004 | |
| |
| Residential mortgages | | $ | 60,871 | | | $ | 56,444 | | | $ | 5 | | | $ | 5 | | | $ | 15 | | | $ | 13 | | | $ | 60,851 | | | $ | 56,426 | |
| Credit card, consumer instalment and other personal loans | | | 32,577 | | | | 28,589 | | | | 1 | | | | 2 | | | | 444 | | | | 360 | | | | 32,132 | | | | 28,227 | |
| Business and government loans | | | 47,803 | | | | 44,559 | | | | 163 | | | | 291 | | | | 473 | | | | 595 | | | | 47,167 | | | | 43,673 | |
| Securities borrowed or purchased under resale agreements | | | 28,280 | | | | 22,609 | | | | – | | | | – | | | | – | | | | – | | | | 28,280 | | | | 22,609 | |
| |
| Subtotal | | | 169,531 | | | | 152,201 | | | | 169 | | | | 298 | | | | 932 | | | | 968 | | | | 168,430 | | | | 150,935 | |
| |
| Customers’ liability under acceptances | | | 5,934 | | | | 5,355 | | | | – | | | | – | | | | 27 | | | | 42 | | | | 5,907 | | | | 5,313 | |
| |
| Total | | $ | 175,465 | | | $ | 157,556 | | | $ | 169 | | | $ | 298 | | | $ | 959 | | | $ | 1,010 | | | $ | 174,337 | | | $ | 156,248 | |
| |
By geographic region(1): | | | | | | | | | | | | | | | | | | | | | | | | | | | | | | | | |
| Canada | | $ | 128,184 | | | $ | 116,867 | | | $ | 97 | | | $ | 132 | | | $ | 590 | | | $ | 630 | | | $ | 127,497 | | | $ | 116,105 | |
| United States | | | 45,287 | | | | 38,934 | | | | 66 | | | | 134 | | | | 369 | | | | 380 | | | | 44,852 | | | | 38,420 | |
| Other countries | | | 1,994 | | | | 1,755 | | | | 6 | | | | 32 | | | | – | | | | – | | | | 1,988 | | | | 1,723 | |
| |
| Total | | $ | 175,465 | | | $ | 157,556 | | | $ | 169 | | | $ | 298 | | | $ | 959 | | | $ | 1,010 | | | $ | 174,337 | | | $ | 156,248 | |
| |
(1) Geographic region is based upon the country of ultimate risk.
Loans are presented net of unearned income of $158 million and $45 million as at October 31, 2005 and 2004, respectively.
Restructured loans of $2 million were classified as performing during the year ended October 31, 2005 ($23 million in 2004). No restructured loans were written off in the years ended October 31, 2005 and 2004.
Included in loans as at October 31, 2005 are $47,828 million ($41,571 million in 2004) of loans denominated in U.S. dollars and $265 million ($312 million in 2004) of loans denominated in other foreign currencies.
Impaired loans, including customers’ liability under acceptances and the related allowances, are as follows:
| | | | | | | | | | | | | | | | | | | | | | | | | |
| | | | Gross impaired | | | Specific | | | Net of specific | |
| (Canadian $ in millions) | | | amount | | | allowance | | | allowance | |
| | | 2005 | | | 2004 | | | 2005 | | | 2004 | | | 2005 | | | 2004 | |
| |
| Residential mortgages | | $ | 92 | | | $ | 125 | | | $ | 5 | | | $ | 5 | | | $ | 87 | | | $ | 120 | |
| Consumer instalment and other personal loans | | | 39 | | | | 37 | | | | 1 | | | | 2 | | | | 38 | | | | 35 | |
| Business and government loans | | | 673 | | | | 957 | | | | 163 | | | | 291 | | | | 510 | | | | 666 | |
| |
| Total | | $ | 804 | | | $ | 1,119 | | | $ | 169 | | | $ | 298 | | | $ | 635 | | | $ | 821 | |
| |
By geographic region(1): | | | | | | | | | | | | | | | | | | | | | | | | |
| Canada | | $ | 383 | | | $ | 465 | | | $ | 97 | | | $ | 132 | | | $ | 286 | | | $ | 333 | |
| United States | | | 397 | | | | 560 | | | | 66 | | | | 134 | | | | 331 | | | | 426 | |
| Other countries | | | 24 | | | | 94 | | | | 6 | | | | 32 | | | | 18 | | | | 62 | |
| |
| Total | | $ | 804 | | | $ | 1,119 | | | $ | 169 | | | $ | 298 | | | $ | 635 | | | $ | 821 | |
| |
(1) Geographic region is based upon the country of ultimate risk.
Fully secured loans with past due amounts between 90 and 180 days that we have not classified as impaired totalled $51 million and $95 million as at October 31, 2005 and 2004, respectively.
No impaired loans were foreclosed during the year ended October 31, 2005. Impaired loans foreclosed during the year ended October 31, 2004 totalled $20 million, which resulted in the reversal of $4 million of the allowance for credit losses.
Our average gross impaired loans and acceptances were $1,011 million for the year ended October 31, 2005 ($1,530 million in 2004). Our average impaired loans, net of the specific allowance, were $738 million for the year ended October 31, 2005 ($1,002 million in 2004).
During the years ended October 31, 2005, 2004 and 2003, we would have recorded additional interest income of $65 million, $68 million and $78 million, respectively, if we had not classified any loans as impaired. Cash interest income on impaired loans of $nil, $1 million and $8 million was recognized during the years ended October 31, 2005, 2004 and 2003, respectively.
Concentration of Credit Risk
We are exposed to credit risk from the possibility that counterparties may default on their financial obligations to us. Credit risk arises predominantly with respect to loans, over-the-counter derivatives and other credit instruments.
Concentrations of credit risk exist if a number of clients are engaged in similar activities, are located in the same geographic region or have similar economic characteristics such that their ability to meet contractual obligations could be similarly affected by changes in economic, political or other conditions. Concentrations of credit risk indicate a related sensitivity of our performance to developments affecting a particular counterparty, industry or geographic location.
Information about our credit risk exposure is provided above in the classification of our loan assets both by type of loan and by geographic region.
| | | |
| BMO Financial Group 188th Annual Report 2005 | | 101 |
A continuity of our allowance for credit losses is as follows:
| | | | | | | | | | | | | | | | | | | | | | | | | | | | | | | | | | | | | | | |
| (Canadian $ in millions) | | | Specific allowance | | | General allowance | | | Total | |
| | | | | 2005 | | | 2004 | | | 2003 | | | 2005 | | | 2004 | | | 2003 | | | 2005 | | | 2004 | | | 2003 | |
| |
| Balance at beginning of year | | $ | 298 | | | $ | 611 | | | $ | 769 | | | $ | 1,010 | | | $ | 1,180 | | | $ | 1,180 | | | $ | 1,308 | | | $ | 1,791 | | | $ | 1,949 | |
| Provision for credit losses | | | 219 | | | | 67 | | | | 455 | | | | (40 | ) | | | (170 | ) | | | – | | | | 179 | | | | (103 | ) | | | 455 | |
| Recoveries | | | 67 | | | | 131 | | | | 88 | | | | – | | | | – | | | | – | | | | 67 | | | | 131 | | | | 88 | |
| Write-offs | | | (419 | ) | | | (470 | ) | | | (566 | ) | | | – | | | | – | | | | – | | | | (419 | ) | | | (470 | ) | | | (566 | ) |
| Foreign exchange and other | | | 4 | | | | (41 | ) | | | (135 | ) | | | (11 | ) | | | – | | | | – | | | | (7 | ) | | | (41 | ) | | | (135 | ) |
| |
| Balance at end of year | | $ | 169 | | | $ | 298 | | | $ | 611 | | | $ | 959 | | | $ | 1,010 | | | $ | 1,180 | | | $ | 1,128 | | | $ | 1,308 | | | $ | 1,791 | |
| |
| Comprised of: | | Loans | | $ | 169 | | | $ | 298 | | | $ | 605 | | | $ | 959 | | | $ | 1,010 | | | $ | 1,180 | | | $ | 1,128 | | | $ | 1,308 | | | $ | 1,785 | |
| | | Other credit instruments | | | – | | | | – | | | | 6 | | | | – | | | | – | | | | – | | | | – | | | | – | | | | 6 | |
| |
Note 5 4 Other Credit Instruments
We use other off-balance sheet credit instruments as a method of meeting the financial needs of our customers. Summarized below are the types of instruments that we use:
| § | | Standby letters of credit and guarantees represent our obligation to make payments to third parties on behalf of our customers if our customers are unable to make the required payments or meet other contractual requirements; |
| |
| § | | Securities lending represents our credit exposure when we lend our securities, or our customers’ securities, to third parties should the securities borrower default on its redelivery obligation; |
| |
| § | | Documentary and commercial letters of credit represent our agreement to honour drafts presented by a third party upon completion of specific activities; and |
| |
| § | | Commitments to extend credit represent our commitment to our customers to grant them credit in the form of loans or other financings for specific amounts and maturities, subject to meeting certain conditions. |
The contractual amount of our other credit instruments represents the maximum undiscounted potential credit risk if the counterparty does not perform according to the terms of the contract, before possible recoveries under recourse and collateral provisions. Collateral requirements for these instruments are consistent with collateral requirements for loans. A large majority of these commitments expire without being drawn upon. As a result, the total contractual amounts may not be representative of our likely credit exposure or liquidity requirements for these commitments.
The risk-weighted equivalent values of our other credit instruments are determined based on the rules for capital adequacy of the Superintendent of Financial Institutions Canada. The risk-weighted equivalent value is used in the ongoing assessment of our capital adequacy ratios.
Summarized information related to various commitments is as follows:
| | | | | | | | | | | | | | | | | | | |
| (Canadian $ in millions) | | | | 2005 | | | 2004 | |
| | | | | Contract | | Risk-weighted | | | Contract | | Risk-weighted | |
| | | | | amount | | equivalent | | | amount | | equivalent | |
| |
| Credit Instruments | | | | | | | | | | | | | | | | |
| Standby letters of credit and guarantees | | $ | 12,755 | | | $ | 8,695 | | | $ | 13,042 | | | $ | 9,379 | |
| Securities lending | | | 810 | | | | 51 | | | | 548 | | | | 20 | |
| Documentary and commercial letters of credit | | | 974 | | | | 87 | | | | 706 | | | | 75 | |
| Commitments to extend credit | | – Original maturity of one year and under | | | 70,695 | | | | – | | | | 66,826 | | | | – | |
| | | – Original maturity of over one year | | | 24,411 | | | | 11,909 | | | | 18,830 | | | | 9,103 | |
| |
| Total | | | | $ | 109,645 | | | $ | 20,742 | | | $ | 99,952 | | | $ | 18,577 | |
| |
Commitments to extend credit in respect of consumer instalment and credit card loans are excluded as the lines are revocable at our discretion.
Note 6 4 Guarantees
Guarantees include contracts where we may be required to make payments to a counterparty based on changes in the value of an asset, liability or equity security that the counterparty holds. In addition, contracts under which we may be required to make payments if a third party fails to perform under the terms of a contract and contracts under which we provide indirect guarantees of the indebtedness of another party are considered guarantees.
In the normal course of business we enter into a variety of guarantees, the most significant of which are as follows:
Standby Letters of Credit and Guarantees
Standby letters of credit and guarantees, as discussed in Note 5, are considered guarantees. The maximum amount payable under standby letters of credit and guarantees was $12,755 million as at October 31, 2005 ($13,042 million in 2004). Collateral requirements for standby letters of credit and guarantees are consistent with our collateral requirements for loans. In most cases, these commitments expire within three years without being drawn upon.
No amount was included in our Consolidated Balance Sheet as at October 31, 2005 and 2004 related to these standby letters of credit and guarantees.
| | | |
| 102 | | BMO Financial Group 188th Annual Report 2005 |
Backstop Liquidity Facilities
Commitments to extend credit, as discussed in Note 5, include backstop liquidity facilities. Backstop liquidity facilities are provided to asset-backed commercial paper programs administered by either us or third parties as an alternative source of financing in the event that such programs are unable to access commercial paper markets or, in limited circumstances, when predetermined performance measures of the financial assets owned by these programs are not met. The terms of the backstop liquidity facilities do not require us to advance money to these programs in the event of bankruptcy. Where warranted, we provide partial credit enhancement facilities to transactions within asset-backed commercial paper programs administered by us to ensure a high investment grade credit rating is achieved for notes issued by the programs. The maximum potential payments under these backstop liquidity facilities were $38,491 million as at October 31, 2005 ($36,769 million in 2004). Of these amounts $3,331 million as at October 31, 2005 related to credit enhancement facilities ($1,503 million in 2004). Credit enhancement was also provided in the form of program letters of credit; $192 million and $199 million were included in standby letters of credit and guarantees as at October 31, 2005 and 2004, respectively. The facilities’ terms are generally no longer than one year, but can be several years. None of the backstop liquidity facilities or credit enhancement facilities that we have provided have been drawn upon.
No amount was included in our Consolidated Balance Sheet as at October 31, 2005 and 2004 related to these facilities.
Derivatives
Certain of our derivative instruments meet the accounting definition of a guarantee when we believe they are related to an asset, liability or equity security held by the guaranteed party at the inception of a contract.
Written credit default swaps require us to compensate a counterparty following the occurrence of a credit event in relation to a specified reference obligation, such as a bond or a loan. The maximum amount payable under credit default swaps was equal to their notional amount of $17,940 million as at October 31, 2005 ($11,360 million in 2004). The terms of these contracts range from three months to 10 years. The fair value of the related derivative liabilities included in derivative financial instruments in our Consolidated Balance Sheet was $37 million as at October 31, 2005 ($15 million in 2004).
Written options include contractual agreements that convey to the purchaser the right, but not the obligation, to require us to buy a specific amount of a currency, commodity or equity at a fixed price, either at a fixed future date or at any time within a fixed future period. The maximum amount payable under these written options cannot be reasonably estimated due to the nature of these contracts. The terms of these contracts range from one month to eight years. The fair value of the related derivative liabilities included in derivative financial instruments in our Consolidated Balance Sheet was $606 million as at October 31, 2005 ($118 million in 2004).
Written options also include contractual agreements where we agree to pay the purchaser, based on a specified notional amount, the difference between the market interest rate and the strike price of the instrument. The maximum amount payable under these contracts is not determinable due to their nature. The terms of these contracts range from one month to 25 years. The fair value of the related derivative liabilities included in derivative financial instruments in our Consolidated Balance Sheet was $158 million as at October 31, 2005 ($63 million in 2004).
In order to reduce our exposure to these derivatives, we enter into contracts that hedge the related risks.
Indemnification Agreements
In the normal course of operations, we enter into various agreements that provide general indemnifications. These indemnifications typically occur in connection with sales of assets, securities offerings, service contracts, membership agreements, clearing arrangements and leasing transactions. These indemnifications require us, in certain circumstances, to compensate the counterparties for various costs resulting from breaches of representations or obligations under such arrangements, or as a result of third-party claims that may be suffered by the counterparty as a consequence of the transaction. The terms of these indemnifications vary based on the contract, the nature of which prevents us from making a reasonable estimate of the maximum potential amount we could be required to pay to counterparties. We believe that the likelihood that we could incur significant liability under these obligations is remote. Historically, we have not made any significant payments under such indemnifications.
No material amount was included in our Consolidated Balance Sheet as at October 31, 2005 and 2004 related to these indemnifications.
Note 7 4 Asset Securitization
Periodically, we securitize loans for capital management purposes or to obtain alternate sources of funding. Securitization involves selling loans to off-balance sheet entities or trusts (securitization vehicles), which buy the loans and then issue interest bearing investor certificates.
Contracts with the securitization vehicles provide for the payment to us over time of the excess of the sum of interest and fees collected from customers, in connection with the loans that were sold, over the yield paid to investors in the securitization vehicle, less credit losses and other costs (the “deferred purchase price”).
When the loans are considered sold for accounting purposes, we remove them from our Consolidated Balance Sheet.
We account for transfers to securitization vehicles as sales when control over the loans is given up. We recognize securitization revenues at the time of the sale, based on our best estimate of the net present value of expected future cash flows, primarily the deferred purchase price, net of our estimate of the fair value of any servicing obligations undertaken. The deferred purchase price is recorded in our Consolidated Balance Sheet in other assets. A servicing liability is recognized only for securitizations where we do not receive compensation for servicing the transferred loans.
It is recorded in our Consolidated Balance Sheet in other liabilities. A servicing liability is recorded in securitization revenues over the term of the transferred loan.
For some of our securitizations, we are required to purchase subordinated interests or maintain cash amounts deposited with the securitization vehicle. This provides the securitization vehicle with a source of funds in the event that the sum of interest and fees collected on the loans is not sufficient to pay the interest owed to investors. We record these amounts in other assets in our Consolidated Balance Sheet. These interests, together with our deferred purchase price, represent our exposure with respect to these securitizations. Investors have no further recourse against us in the event that cash flows from the transferred loans are inadequate to service the interest related to the investor certificates.
On a quarterly basis, we compare the carrying value of assets on our Consolidated Balance Sheet arising from our securitizations to their fair value, determined based on discounted cash flows. When we identify a decline in value, the affected carrying value amount is written down to its fair value. Any write-down is recorded in our Consolidated Statement of Income as a reduction in securitization revenues.
| | | |
| BMO Financial Group 188th Annual Report 2005 | | 103 |
During the year ended October 31, 2005, we securitized residential mortgages totalling $3,137 million ($1,390 million in 2004) for total cash proceeds of $3,130 million ($1,382 million in 2004) and recognized a gain of $30 million ($17 million in 2004). The key weighted-average assumptions used to value the deferred purchase price for these securitizations were as follows:
| | | | | | | | | |
| | | 2005 | | 2004 |
| |
| Weighted-average term (years) | | | | 4.7 | | | | 4.7 |
| Prepayment rate | | | | 10.97% | | | | 11.26% |
| Interest rate | | | | 4.76% | | | | 4.29% |
| Discount rate | | | | 3.41% | | | | 5.79% |
| |
There are no expected credit losses as the mortgages are guaranteed by third parties. We retained responsibility for servicing these mortgages. We recorded deferred purchase price of $123 million ($49 million in 2004) and servicing liability of $24 million ($11 million in 2004) in our Consolidated Balance Sheet when these loans were securitized.
During the year ended October 31, 2005, $800 million ($400 million in 2004) of our credit card loan securitizations matured.
The impact of securitizations on our Consolidated Statement of Income for the three years ended October 31 was as follows:
| | | | | | | | | | | | | | | | | | | | | | | | | | | | | | | | | | | | | | | | | | | | | | | | | |
| | | | | | | | | | | | | | | Consumer instalment | | | | | | | |
| (Canadian $ in millions) | | Residential mortgages | | | and other personal loans | | | Credit card loans | | | Total | |
| | | 2005 | | | 2004 | | | 2003 | | | 2005 | | | 2004 | | | 2003 | | | 2005 | | | 2004 | | | 2003 | | | 2005 | | | 2004 | | | 2003 | |
| |
| Gain on sales of loans from new securitizations | | $ | 30 | | | $ | 17 | | | $ | – | | | $ | – | | | $ | – | | | $ | – | | | $ | – | | | $ | – | | | $ | – | | | $ | 30 | | | $ | 17 | | | $ | – | |
| Gain on sales of new loans sold to existing securitization vehicles | | | 32 | | | | 37 | | | | 39 | | | | – | | | | 1 | | | | 1 | | | | 20 | | | | 72 | | | | 117 | | | | 52 | | | | 110 | | | | 157 | |
| Other securitization revenue | | | 3 | | | | 8 | | | | 14 | | | | 4 | | | | (2 | ) | | | 20 | | | | 1 | | | | 28 | | | | 43 | | | | 8 | | | | 34 | | | | 77 | |
| Amortization of servicing liability | | | 23 | | | | 16 | | | | 10 | | | | – | | | | – | | | | – | | | | – | | | | – | | | | – | | | | 23 | | | | 16 | | | | 10 | |
| |
| Total | | $ | 88 | | | $ | 78 | | | $ | 63 | | | $ | 4 | | | $ | (1 | ) | | $ | 21 | | | $ | 21 | | | $ | 100 | | | $ | 160 | | | $ | 113 | | | $ | 177 | | | $ | 244 | |
| |
Cash flows received from securitization vehicles for the three years ended October 31 were as follows:
| | | | | | | | | | | | | | | | | | | | | | | | | | | | | | | | | | | | | | | | | | | | | | | | | |
| | | | | | | | | | | | | | | Consumer instalment | | | | | | | |
| (Canadian $ in millions) | | Residential mortgages | | | and other personal loans | | | Credit card loans | | | Total | |
| | | 2005 | | | 2004 | | | 2003 | | | 2005 | | | 2004 | | | 2003 | | | 2005 | | | 2004 | | | 2003 | | | 2005 | | | 2004 | | | 2003 | |
| |
| Proceeds from new securitizations | | $ | 3,130 | | | $ | 1,382 | | | $ | – | | | $ | – | | | $ | – | | | $ | – | | | $ | – | | | $ | – | | | $ | – | | | $ | 3,130 | | | $ | 1,382 | | | $ | – | |
| Proceeds from collections reinvested in existing securitization vehicles | | | 1,895 | | | | 2,667 | | | | 2,662 | | | | – | | | | 54 | | | | 59 | | | | 1,343 | | | | 4,941 | | | | 7,351 | | | | 3,238 | | | | 7,662 | | | | 10,072 | |
| Servicing fees collected | | | 8 | | | | 4 | | | | 9 | | | | – | | | | – | | | | – | | | | 6 | | | | 21 | | | | 32 | | | | 14 | | | | 25 | | | | 41 | |
| Receipt of deferred purchase price | | | 88 | | | | 78 | | | | 80 | | | | – | | | | 5 | | | | 18 | | | | 20 | | | | 85 | | | | 138 | | | | 108 | | | | 168 | | | | 236 | |
| |
The impact of securitizations on our Consolidated Balance Sheet as at October 31, 2005 and 2004 was as follows:
| | | | | | | | | | | | | | | | | | | | | | | | | | | | | | | | | |
| | | | | | | | | | | Consumer instalment | | | | | | | |
| (Canadian $ in millions) | | Residential mortgages | | | and other personal loans | | | Credit card loans | | | Total | |
| | | 2005 | | | 2004 | | | 2005 | | | 2004 | | | 2005 | | | 2004 | | | 2005 | | | 2004 | |
| |
| Retained interests Investment in securitization vehicles | | $ | – | | | $ | – | | | $ | 27 | | | $ | 27 | | | $ | – | | | $ | – | | | $ | 27 | | | $ | 27 | |
| Deferred purchase price | | | 213 | | | | 134 | | | | – | | | | – | | | | 4 | | | | 9 | | | | 217 | | | | 143 | |
| Cash deposits with securitization vehicles | | | 12 | | | | 12 | | | | – | | | | – | | | | – | | | | – | | | | 12 | | | | 12 | |
| Servicing liability | | | 50 | | | | 34 | | | | – | | | | – | | | | – | | | | – | | | | 50 | | | | 34 | |
| |
Credit Information
Information related to principal amounts, impaired amounts and net credit losses for all loans reported and securitized is as follows:
| | | | | | | | | | | | | | | | | | | | | | | | | |
| (Canadian $ in millions) | | 2005 | | | 2004 | |
| | | Total | | | Impaired | | | Net | | | Total | | | Impaired | | | Net | |
| | | loans | | | loans | | | write-offs | (1) | | loans | | | loans | | | write-offs | (1) |
| |
| Residential mortgages | | $ | 69,801 | | | $ | 103 | | | $ | 4 | | | $ | 63,227 | | | $ | 132 | | | $ | 4 | |
| Consumer instalment and other personal loans | | | 28,118 | | | | 31 | | | | 69 | | | | 25,494 | | | | 28 | | | | 78 | |
| Credit card loans | | | 4,898 | | | | 8 | | | | 147 | | | | 4,752 | | | | 11 | | | | 120 | |
| Business and government loans | | | 47,803 | | | | 673 | | | | 155 | | | | 44,559 | | | | 957 | | | | 174 | |
| Securities borrowed or purchased under resale agreements | | | 28,280 | | | | – | | | | – | | | | 22,609 | | | | – | | | | – | |
| |
| Total loans | | | 178,900 | | | | 815 | | | | 375 | | | | 160,641 | | | | 1,128 | | | | 376 | |
| Less loans securitized: | | | | | | | | | | | | | | | | | | | | | | | | |
| Residential mortgages | | | 8,930 | | | | 18 | | | | – | | | | 6,783 | | | | 7 | | | | 1 | |
| Consumer instalment and other personal loans | | | 189 | | | | – | | | | 17 | | | | 607 | | | | 1 | | | | 13 | |
| Credit card loans | | | 250 | | | | 1 | | | | 6 | | | | 1,050 | | | | 1 | | | | 23 | |
| |
| Total loans reported in the Consolidated Balance Sheet | | $ | 169,531 | | | $ | 796 | | | $ | 352 | | | $ | 152,201 | | | $ | 1,119 | | | $ | 339 | |
| |
(1) Net write-offs represent write-offs in the current year net of recoveries on loans previously written off.
| | | |
| 104 | | BMO Financial Group 188th Annual Report 2005 |
Our credit exposure to securitized assets as at October 31, 2005 was limited to our deferred purchase price of $217 million ($143 million in 2004), certain cash deposits of $12 million ($12 million in 2004) and investments in securitization vehicles of $27 million ($27 million in 2004).
Static pool credit losses provide a measure of the credit risk in our securitized assets. They are calculated by totalling actual and projected future credit losses and dividing the result by the original balance of each pool of assets. Static pool credit losses for the two years ended October 31 were as follows:
| | | | | | | | | |
| | | 2005 | | | 2004 | |
| |
| Residential mortgages | | | – | | | | – | |
| Consumer instalment and other personal loans | | | 3.13 | % | | | 3.18 | % |
| Credit card loans | | | 0.43 | % | | | 1.84 | % |
| |
Sensitivity Analysis
The following table outlines the key economic assumptions used in measuring the deferred purchase price and the sensitivity of the current value of the deferred purchase price as at October 31, 2005 to immediate 10% and 20% adverse changes in those assumptions. The sensitivity analysis should be used with caution as it is hypothetical and changes in each key assumption may not be linear. The sensitivities in each key variable have been calculated independently of changes in the other key variables. Actual experience may result
in changes in a number of key assumptions simultaneously. Changes in one factor may result in changes in another, which could amplify or reduce certain sensitivities.
| | | | | | | | | | | | | |
| | | | | | | Consumer | | | | |
| | | | | | | instalment | | | | |
| | | | | | | and other | | | | |
| (Canadian $ in millions, | | Residential | | | personal | | | Credit card | |
| except as noted) | | mortgages | | | loans | | | loans | |
| |
| Carrying value of deferred purchase price | | $ | 213 | | | $ | – | | | $ | 4 | |
| |
| Fair value of deferred purchase price | | $ | 226 | | | $ | – | | | $ | 4 | |
| |
Weighted average life(in years) | | | 3.44 | | | | 0.43 | | | | 0.19 | |
| Prepayment rate (%) | | | 8.0–29.57 | | | | 4.0 | | | | 99.83 | |
| Impact of:10% adverse change ($) | | | 2.1–3.0 | | | | – | | | | 0.36 | |
| 20% adverse change ($) | | | 4.2–5.8 | | | | – | | | | 0.66 | |
| |
| Interest rate (%) | | | 0.49–2.28 | | | | – | | | | 9.77 | |
| Impact of:10% adverse change ($) | | | 8.4–13.5 | | | | – | | | | 0.4 | |
| 20% adverse change ($) | | | 16.8–26.9 | | | | – | | | | 0.8 | |
| |
| Expected credit losses (%) | | | 0–0.1 | | | | 9.09–22.31 | | | | 1.82 | |
| Impact of:10% adverse change ($) | | | 0.1–0 | | | | – | | | | 0.1 | |
| 20% adverse change ($) | | | 0.2–0 | | | | – | | | | 0.2 | |
| |
| Discount rate (%) | | | 3.8–10.62 | | | | 10.62 | | | | 10.62 | |
| Impact of:10% adverse change ($) | | | 0.95–0.8 | | | | – | | | | – | |
| 20% adverse change ($) | | | 1.9–1.6 | | | | – | | | | – | |
| |
Note 8 4 Variable Interest Entities
Change in Accounting Policy
On November 1, 2004, we adopted the CICA’s new accounting requirements on the consolidation of variable interest entities (“VIEs”). VIEs include entities where the equity is considered insufficient to finance the entity’s activities or for which the equity holders do not have a controlling financial interest. The new rules require that we consolidate VIEs if the investments we hold in these entities and/or the relationships we have with them result in us being exposed to the majority of their expected losses, being able to benefit from a majority of their expected residual returns, or both, based on a calculation determined by standard setters. As discussed further below, we consolidated our customer securitization vehicles as at November 1, 2004. Results for prior periods were not restated for this change. On April 29, 2005, we completed the restructuring of our customer securitization vehicles. As a result of the restructuring, we are no longer exposed to the majority of their expected losses or able to benefit from a majority of their residual returns, and the vehicles have been deconsolidated.
Customer Securitization Vehicles
Customer securitization vehicles (also referred to as multi-seller conduits) assist our customers with the securitization of their assets to provide them with alternate sources of funding. These vehicles provide clients with access to financing in the commercial paper markets by allowing them to sell their assets into these vehicles, which then issue commercial paper to investors to fund the purchases. The seller continues to service the transferred assets. If there are losses on the assets, the seller is the first to take the loss. We do not sell assets to or service the assets held by these customer securitization vehicles. We earn fees for providing structuring advice related to the securitizations as well as administrative fees for supporting the ongoing operations of customer securitization vehicles.
In general, investors in the commercial paper have recourse only to the assets of the related VIE and do not have recourse to us,
unless we have provided credit support for the investors or entered into a derivative transaction involving the VIE.
We provide liquidity and credit support to these vehicles either through backstop liquidity facilities or in the form of letters of credit and other guarantees. The total contractual amount of this support was $28,125 million as at October 31, 2005 ($27,019 million in 2004). Of these amounts, $567 million as at October 31, 2005 ($400 million in 2004) related to credit support. None of these facilities were drawn upon as at October 31, 2005 and 2004.
Derivative contracts entered into with these vehicles enable the vehicles to manage their exposures to interest and foreign exchange rate fluctuations. The fair value of our derivatives outstanding with these VIEs and recorded in our Consolidated Balance Sheet was a derivative asset of $6 million as at October 31, 2005 ($52 million in 2004).
Beginning November 1, 2004, we consolidated our customer securitization vehicles. The impact of consolidation on our Consolidated Balance Sheet as at November 1, 2004 was an increase in other assets of $21,160 million, a decrease in derivative financial instrument assets of $67 million, an increase in other liabilities of $21,150 million, a decrease in derivative financial instrument liabilities of $15 million and a decrease in opening retained earnings of $42 million.
The impact on opening retained earnings arose because interest rate swaps held by our VIEs to hedge their exposure to interest rate risk did not qualify for hedge accounting prior to consolidation. As a result, the mark-to-market adjustments on those derivatives from their inception to November 1, 2004 would have been recognized in income. Since the new rules require us to reflect the results of the consolidated VIEs as if they had always been consolidated, without restatement of prior periods, the amount of mark-to-market losses prior to November 1, 2004 was recognized through our opening retained earnings. This adjustment was being amortized to income over the remaining life of the swaps. These derivatives qualified for hedge accounting after we started consolidating the VIEs.
| | | |
| BMO Financial Group 188th Annual Report 2005 | | 105 |
Notes to Consolidated Financial Statements
On April 29, 2005, we completed the restructuring of our customer securitization vehicle VIEs by either terminating or changing the terms of our swaps with the VIEs and amending some of the rights of noteholders in the VIEs. As a result they no longer meet the criteria for consolidation. The impact on our Consolidated Statement of Income of deconsolidating these entities on April 29, 2005 was an increase in non-interest revenue – other of $44 million, an increase in income taxes of $7 million and an increase in net income of $37 million, representing the reversal of the unamortized mark-to-market losses on swaps that had been charged against opening retained earnings.
We have significant variable interests in certain other VIEs that we are not required to consolidate. Our involvement with non-consolidated VIEs is summarized as follows:
Bank Securitization Vehicles
We use bank securitization vehicles to securitize our loans either for capital management purposes or to obtain alternate sources of funding. The structure of these vehicles limits the types of activities they can undertake and the types of assets they can hold, and they have limited decision-making authority. We are not required to consolidate our bank securitization vehicles under the CICA requirements. More information on our rights and obligations related to these vehicles can be found in Note 7. In addition to the interests described in Note 7, we also provide liquidity support to our securitization vehicles in the form of standby letters of credit and guarantees for up to 100% of the asset value transferred. The total contract amount of standby letters of credit and guarantees was $5,000 million and $3,750 million as at October 31, 2005 and 2004, respectively. No amount was drawn at October 31, 2005 and 2004.
Credit Investment Management Vehicles
Credit investment management vehicles provide investment opportunities in customized, diversified debt portfolios in a variety of asset and rating classes. We earn investment management fees for managing these portfolios. Until 2004, we had two types of credit investment management vehicles: High Yield Collateralized Bond Obligation Vehicles (“CBOs”) and High Grade Structured Investment Vehicles (“SIVs”).
During the year ended October 31, 2004, we sold our investment in the CBOs with minimal impact on net income. We were also replaced as asset manager. As a result, we no longer have interests in the CBOs.
We continue to hold our interest in the SIVs and act as asset manager. Assets held by the SIVs totalled $21,886 million as at October 31, 2005 ($19,502 million in 2004).
Our exposure to loss relates to our investments in these vehicles, derivative contracts we have entered into with the vehicles and the liquidity support we provide through standby letters of credit and/or commitments to extend credit. Our investment in the SIVs, which was recorded as investment securities on our Consolidated Balance Sheet, was $146 million as at October 31, 2005 ($128 million in 2004). The fair value of our derivative contracts outstanding with the SIVs and recorded on our Consolidated Balance Sheet was a derivative liability of $24 million as at October 31, 2005 ($37 million derivative asset in 2004). The total contract amount of letters of credit and commitments to extend credit was $189 million as at October 31, 2005 ($200 million in 2004); no amounts were drawn at October 31, 2005 and 2004. We are not required to consolidate these SIVs under the CICA requirements.
Compensation Trusts
We have established trusts in order to administer our employee share ownership plan. Under this plan, we match 50% of employees’ contributions when they choose to contribute a portion of their gross salary toward the purchase of our common shares. Our matching contributions are paid into trusts, which purchase our shares on the open market for payment to employees once employees are entitled to the shares under the terms of the plan. We are not required to consolidate these compensation trusts under the CICA requirements.
Other VIEs
We are involved with other entities that may potentially be VIEs. This involvement can include, for example, acting as a derivatives counterparty, liquidity provider, investor, fund manager or trustee. These activities do not cause us to be exposed to a majority of the expected losses of these VIEs or allow us to benefit from a majority of their expected residual returns. As a result, we are not required to consolidate these VIEs under the CICA requirements. Transactions with these VIEs are conducted at market rates, and individual credit or investment decisions are based upon the analysis of the specific VIE, taking into consideration the quality of underlying assets. We record and report these transactions in the same manner as other transactions. For example, derivative contracts are recorded in accordance with our derivatives accounting policy as outlined in Note 9. Liquidity facilities are described in Note 6.
Note 9 4 Derivative Financial Instruments
Derivative financial instruments are contracts that require the exchange of, or provide the opportunity to exchange, cash flows determined by applying certain rates, indices or changes therein to notional contract amounts. Derivative transactions are conducted either directly between two counterparties in the over-the-counter market or on regulated exchange markets.
Types of Derivatives
Swaps
Swaps are contractual agreements between two parties to exchange a series of cash flows. The various swap agreements that we enter into are as follows:
Interest rate swaps – counterparties generally exchange fixed and floating rate interest payments based on a notional value in a single currency.
Cross-currency swaps – fixed rate interest payments and principal amounts are exchanged in different currencies.
Cross-currency interest rate swaps – fixed and floating rate interest payments and principal amounts are exchanged in different currencies.
Commodity swaps – counterparties generally exchange fixed and floating rate payments based on a notional value of a single commodity.
Equity swaps – counterparties exchange the return on an equity security or a group of equity securities for the return based on a fixed or floating interest rate or the return on another equity security or a group of equity securities.
Credit default swaps – one counterparty pays the other a fee in exchange for that other counterparty agreeing to make a payment if a credit event occurs, such as bankruptcy or a credit rating change.
The main risks associated with these instruments are related to our exposure to movements in interest rates, foreign exchange rates, credit ratings, securities values or commodities prices, as applicable, and the possible inability of counterparties to meet the terms of the contracts.
| | | |
| 106 | | BMO Financial Group 188th Annual Report 2005 |
Forwards and Futures
Forwards and futures are contractual agreements to either buy or sell a specified amount of a currency, commodity or security at a specific price and date in the future. Forwards are customized contracts transacted in the over-the-counter market. Futures are transacted in standardized amounts on regulated exchanges and are subject to daily cash margining.
The main risks associated with these instruments arise from the possible inability of over-the-counter counterparties to meet the terms of the contracts and from movements in commodities prices, securities values, interest rates and foreign exchange rates, as applicable.
Options
Options are contractual agreements that convey to the buyer the right but not the obligation to either buy or sell a specified amount of a currency, commodity or security at a fixed future date or at any time within a fixed future period.
For options written by us, we receive a premium from the purchaser for accepting market risk.
For options purchased by us, we pay a premium for the right to exercise the option. Since we have no obligation to exercise the option, our primary exposure to risk is the potential credit risk if the writer of an over-the-counter contract fails to fulfill the conditions of the contract.
Caps, collars and floors are specialized types of written and purchased options. They are contractual agreements where the writer agrees to pay the purchaser, based on a specified notional amount, the difference between the market rate and the prescribed rate of the cap, collar or floor. The writer receives a premium for selling this instrument.
Uses of Derivatives
Trading Derivatives
Trading derivatives are derivatives entered into with customers to accommodate their risk management needs, derivatives transacted to generate trading income from our own proprietary trading positions and certain derivatives that do not qualify as hedges for accounting purposes (“economic hedges”).
We structure and market derivative products to customers to enable them to transfer, modify or reduce current or expected risks.
Proprietary activities include market-making, positioning and arbitrage activities. Market-making involves quoting bid and offer prices to other market participants with the intention of generating revenues based on spread and volume. Positioning activities involve managing market risk positions with the expectation of profiting from favourable movements in prices, rates or indices. Arbitrage activities involve identifying and profiting from price differentials between markets and products.
We may also take proprietary trading positions in various capital markets instruments and derivatives that, taken together, are designed to profit from anticipated changes in market factors.
Trading derivatives are marked to market. Realized and unrealized gains and losses are recorded in trading revenues in our Consolidated Statement of Income. Unrealized gains on trading derivatives are recorded as derivative financial instrument assets and unrealized losses are recorded as derivative financial instrument liabilities in our Consolidated Balance Sheet.
Hedging Derivatives
In accordance with our risk management strategy, we enter into various derivative contracts to hedge our interest rate and foreign currency exposures.
Risks Hedged
Interest Rate Risk
We manage interest rate risk through interest rate swaps and options, which are linked to and adjust the interest rate sensitivity of a specific asset, liability, firm commitment or a specific pool of transactions with similar risk characteristics.
Fair value hedges modify exposure to changes in a fixed rate instrument’s fair value caused by changes in interest rates.
These hedges convert fixed rate assets and liabilities to floating rate. Our fair value hedges include hedges of fixed rate loans, securities, deposits and subordinated debt.
Cash flow hedges modify exposure to variability in cash flows for variable rate interest bearing instruments. Our cash flow hedges, which have a maximum term of 12 years, are primarily hedges of floating rate deposits as well as commercial and personal loans.
In order for an interest rate derivative to qualify as a hedge, the hedge relationship must be designated and formally documented at its inception, detailing the particular risk management objective and strategy for the hedge and the specific asset, liability or cash flow being hedged, as well as how effectiveness is being assessed. Changes in the fair value of the derivative must be highly effective in offsetting either changes in the fair value of on-balance sheet items or changes in the amount of future cash flows. Hedge effectiveness is evaluated at the inception of the hedge relationship and on an ongoing basis, both retrospectively and prospectively, primarily using quantitative statistical measures of correlation. If a hedge relationship is found to be no longer effective, or if the designated hedged item matures or is sold, extinguished or terminated, the derivative is reclassified as trading. Subsequent changes in the fair value of hedging derivatives reclassified as trading are reported in trading revenues.
Swaps and options that qualify for hedge accounting are accounted for on an accrual basis. Interest income received and interest expense paid on interest rate swaps are accrued and recorded as an adjustment to the yield of the item being hedged over the term of the hedge contract. Premiums paid on purchased options are amortized to interest expense over the term of the contract. Accrued interest receivable and payable and deferred gains and losses are recorded as derivative financial instrument assets or liabilities in our Consolidated Balance Sheet, as appropriate. Realized gains and losses from the settlement or early termination of hedge contracts or a hedging relationship are deferred and amortized over the remaining original life of the hedged item.
Foreign Currency Risk
We manage foreign currency risk through cross-currency swaps. Cross-currency swaps are marked to market, with realized and unrealized gains and losses recorded in non-interest revenue, consistent with the accounting treatment for gains and losses on the economically hedged item.
We also periodically hedge U.S. dollar earnings through forward foreign exchange contracts to minimize fluctuations in our Canadian dollar earnings due to the translation of our U.S. dollar earnings. These contracts are marked to market, with gains and losses recorded as non-interest revenue in foreign exchange, other than trading.
Future Change in Accounting Policy
As discussed in Note 1, we will adopt the CICA’s new accounting requirements that will change our accounting policy for hedging derivatives beginning November 1, 2006. The requirements for identification, designation and documentation of hedging relationships are unchanged.
The new rules will require us to record all of our hedging derivatives at fair value. Changes in the fair value of hedging derivatives will be either offset in our Consolidated Statement of Income against the changes in the fair value of the risk being hedged, or recorded in a new section of shareholders’ equity called other comprehensive income. If the change in fair value of the derivative is not completely offset by the change in fair value of the item it is hedging, the difference will be recorded immediately in our Consolidated Statement of Income.
The impact of remeasuring our hedging derivatives at fair value on November 1, 2006 will be recognized in opening retained earnings. Results for prior periods will not be restated. We cannot currently determine the impact that these changes in accounting policy will have on our consolidated financial statements once adopted, as this will be dependent on the fair values of our hedging derivatives in the future.
| | | |
| BMO Financial Group 188th Annual Report 2005 | | 107 |
Fair Value
Fair value represents point-in-time estimates that may change in subsequent reporting periods due to market conditions or other factors. Fair value for exchange-traded derivatives is considered to be the price quoted on derivatives exchanges. Fair value for over-the-counter derivatives is determined using zero coupon valuation techniques further adjusted for credit, model and liquidity risks as
well as administration costs. Zero coupon curves are created using generally accepted valuation techniques from underlying instruments such as cash, bonds and futures observable in the market. Option implied volatilities, an input into the valuation model, are either obtained directly from market sources or calculated from market prices.
Fair values of our derivative financial instruments are as follows:
| | | | | | | | | | | | | | | | | | | | | | | | | |
| (Canadian $ in millions) | | | | | | | | | | 2005 | | | | | | | | | | | 2004 | | |
| |
| | | Gross | | | Gross | | | | | | | Gross | | | Gross | | | | |
| | | assets | | | liabilities | | | Net | | | assets | | | liabilities | | | Net | |
| |
Trading | | | | | | | | | | | | | | | | | | | | | | | | |
Interest Rate Contracts | | | | | | | | | | | | | | | | | | | | | | | | |
| Swaps | | $ | 8,431 | | | $ | (8,820 | ) | | $ | (389 | ) | | $ | 10,655 | | | $ | (10,485 | ) | | $ | 170 | |
| Forward rate agreements | | | 101 | | | | (89 | ) | | | 12 | | | | 105 | | | | (109 | ) | | | (4 | ) |
| Futures | | | 1 | | | | (5 | ) | | | (4 | ) | | | 4 | | | | (10 | ) | | | (6 | ) |
| Purchased options | | | 1,504 | | | | (4 | ) | | | 1,500 | | | | 1,548 | | | | (2 | ) | | | 1,546 | |
| Written options | | | – | | | | (1,290 | ) | | | (1,290 | ) | | | – | | | | (1,295 | ) | | | (1,295 | ) |
Foreign Exchange Contracts | | | | | | | | | | | | | | | | | | | | | | | | |
| Cross-currency swaps | | | 1,342 | | | | (831 | ) | | | 511 | | | | 940 | | | | (622 | ) | | | 318 | |
| Cross-currency interest rate swaps | | | 2,779 | | | | (2,431 | ) | | | 348 | | | | 3,341 | | | | (2,677 | ) | | | 664 | |
| Forward foreign exchange contracts | | | 743 | | | | (1,212 | ) | | | (469 | ) | | | 2,028 | | | | (3,023 | ) | | | (995 | ) |
| Purchased options | | | 99 | | | | – | | | | 99 | | | | 157 | | | | – | | | | 157 | |
| Written options | | | – | | | | (91 | ) | | | (91 | ) | | | – | | | | (156 | ) | | | (156 | ) |
Commodity Contracts | | | | | | | | | | | | | | | | | | | | | | | | |
| Swaps | | | 6,221 | | | | (5,539 | ) | | | 682 | | | | 3,514 | | | | (2,979 | ) | | | 535 | |
| Futures | | | 121 | | | | – | | | | 121 | | | | – | | | | – | | | | – | |
| Purchased options | | | 8,895 | | | | – | | | | 8,895 | | | | 2,156 | | | | – | | | | 2,156 | |
| Written options | | | – | | | | (8,087 | ) | | | (8,087 | ) | | | – | | | | (1,994 | ) | | | (1,994 | ) |
Equity Contracts | | | 485 | | | | (301 | ) | | | 184 | | | | 391 | | | | (300 | ) | | | 91 | |
Credit Contracts | | | 129 | | | | (129 | ) | | | – | | | | 75 | | | | (89 | ) | | | (14 | ) |
| |
| Total fair value – trading derivatives | | $ | 30,851 | | | $ | (28,829 | ) | | $ | 2,022 | | | $ | 24,914 | | | $ | (23,741 | ) | | $ | 1,173 | |
| |
| Total book value – trading derivatives | | $ | 30,851 | | | $ | (28,829 | ) | | $ | 2,022 | | | $ | 24,914 | | | $ | (23,741 | ) | | $ | 1,173 | |
| |
Average fair value (1) | | $ | 25,184 | | | $ | (24,169 | ) | | $ | 1,015 | | | $ | 21,556 | | | $ | (20,637 | ) | | $ | 919 | |
| |
Hedging | | | | | | | | | | | | | | | | | | | | | | | | |
Interest Rate Contracts | | | | | | | | | | | | | | | | | | | | | | | | |
| Swaps | | $ | 293 | | | $ | (158 | ) | | $ | 135 | | | $ | 437 | | | $ | (284 | ) | | $ | 153 | |
| Forward rate agreements | | | – | | | | – | | | | – | | | | 1 | | | | (1 | ) | | | – | |
| Purchased options | | | 23 | | | | – | | | | 23 | | | | 20 | | | | – | | | | 20 | |
| Written options | | | – | | | | (2 | ) | | | (2 | ) | | | – | | | | – | | | | – | |
Foreign Exchange Contracts | | | | | | | | | | | | | | | | | | | | | | | | |
| Cross-currency interest rate swaps | | | 461 | | | | (6 | ) | | | 455 | | | | 394 | | | | (118 | ) | | | 276 | |
| Forward foreign exchange contracts | | | 131 | | | | (6 | ) | | | 125 | | | | 15 | | | | (59 | ) | | | (44 | ) |
| |
Total fair value – hedging derivatives (2) | | $ | 908 | | | $ | (172 | ) | | $ | 736 | | | $ | 867 | | | $ | (462 | ) | | $ | 405 | |
| |
| Total book value – hedging derivatives | | $ | 666 | | | $ | (39 | ) | | $ | 627 | | | $ | 534 | | | $ | (232 | ) | | $ | 302 | |
| |
Average fair value (1) | | $ | 1,019 | | | $ | (320 | ) | | $ | 699 | | | $ | 850 | | | $ | (558 | ) | | $ | 292 | |
| |
| (1) | | Average fair value amounts are calculated using a five-quarter rolling average. |
| |
| (2) | | The fair value of hedging derivatives wholly or partially offsets the changes in fair values of the related on-balance sheet financial instruments. |
Assets are shown net of liabilities to customers where we have an enforceable right to offset amounts and we intend to settle contracts on a net basis.
Derivative financial instruments recorded in our Consolidated Balance Sheet are as follows:
| | | | | | | | | | | | | | | | | |
| (Canadian $ in millions) | | | Assets | | | Liabilities | |
| |
| | | 2005 | | | 2004 | | | 2005 | | | 2004 | |
| |
| Fair value of trading derivatives | | $ | 30,851 | | | $ | 24,914 | | | $ | 28,829 | | | $ | 23,741 | |
| Book value of hedging derivatives | | | 666 | | | | 534 | | | | 39 | | | | 232 | |
| |
| Total | | $ | 31,517 | | | $ | 25,448 | | | $ | 28,868 | | | $ | 23,973 | |
| |
| | | |
| 108 | | BMO Financial Group 188th Annual Report 2005 |
Notional Amounts
The notional amounts of our derivatives represent the amount to which a rate or price is applied in order to calculate the amount of
cash that must be exchanged under the contract. Notional amounts do not represent assets or liabilities and therefore are not recorded in our Consolidated Balance Sheet.
| | | | | | | | | | | | | | | | | | | | | | | | | |
| (Canadian $ in millions) | | 2005 | | | 2004 | |
| |
| | | Trading | | | Hedging | | | Total | | | Trading | | | Hedging | | | Total | |
| |
Interest Rate Contracts | | | | | | | | | | | | | | | | | | | | | | | | |
| Over-the-counter | | | | | | | | | | | | | | | | | | | | | | | | |
| Swaps | | $ | 717,849 | | | $ | 31,650 | | | $ | 749,499 | | | $ | 680,570 | | | $ | 36,424 | | | $ | 716,994 | |
| Forward rate agreements | | | 218,475 | | | | – | | | | 218,475 | | | | 307,047 | | | | 1,401 | | | | 308,448 | |
| Purchased options | | | 97,190 | | | | 5,923 | | | | 103,113 | | | | 75,784 | | | | 6,341 | | | | 82,125 | |
| Written options | | | 125,123 | | | | 40 | | | | 125,163 | | | | 97,476 | | | | – | | | | 97,476 | |
| |
| | | | 1,158,637 | | | | 37,613 | | | | 1,196,250 | | | | 1,160,877 | | | | 44,166 | | | | 1,205,043 | |
| |
| Exchange-traded | | | | | | | | | | | | | | | | | | | | | | | | |
| Futures | | | 181,506 | | | | – | | | | 181,506 | | | | 171,961 | | | | 1,554 | | | | 173,515 | |
| Purchased options | | | 76,481 | | | | – | | | | 76,481 | | | | 36,408 | | | | – | | | | 36,408 | |
| Written options | | | 57,850 | | | | – | | | | 57,850 | | | | 21,284 | | | | – | | | | 21,284 | |
| |
| | | | 315,837 | | | | – | | | | 315,837 | | | | 229,653 | | | | 1,554 | | | | 231,207 | |
| |
| Total interest rate contracts | | | 1,474,474 | | | | 37,613 | | | | 1,512,087 | | | | 1,390,530 | | | | 45,720 | | | | 1,436,250 | |
| |
Foreign Exchange Contracts | | | | | | | | | | | | | | | | | | | | | | | | |
| Over-the-counter | | | | | | | | | | | | | | | | | | | | | | | | |
| Cross-currency swaps | | | 9,644 | | | | – | | | | 9,644 | | | | 9,635 | | | | – | | | | 9,635 | |
| Cross-currency interest rate swaps | | | 55,334 | | | | 3,300 | | | | 58,634 | | | | 45,577 | | | | 4,276 | | | | 49,853 | |
| Forward foreign exchange contracts | | | 91,819 | | | | 3,183 | | | | 95,002 | | | | 87,855 | | | | 8,804 | | | | 96,659 | |
| Purchased options | | | 5,790 | | | | – | | | | 5,790 | | | | 5,865 | | | | – | | | | 5,865 | |
| Written options | | | 6,306 | | | | – | | | | 6,306 | | | | 6,950 | | | | – | | | | 6,950 | |
| |
| | | | 168,893 | | | | 6,483 | | | | 175,376 | | | | 155,882 | | | | 13,080 | | | | 168,962 | |
| |
| Exchange-traded | | | | | | | | | | | | | | | | | | | | | | | | |
| Futures | | | 4,015 | | | | – | | | | 4,015 | | | | 886 | | | | – | | | | 886 | |
| Purchased options | | | 2,016 | | | | – | | | | 2,016 | | | | 2,063 | | | | – | | | | 2,063 | |
| Written options | | | 675 | | | | – | | | | 675 | | | | 283 | | | | – | | | | 283 | |
| |
| | | | 6,706 | | | | – | | | | 6,706 | | | | 3,232 | | | | – | | | | 3,232 | |
| |
| Total foreign exchange contracts | | | 175,599 | | | | 6,483 | | | | 182,082 | | | | 159,114 | | | | 13,080 | | | | 172,194 | |
| |
Commodity Contracts | | | | | | | | | | | | | | | | | | | | | | | | |
| Over-the-counter | | | | | | | | | | | | | | | | | | | | | | | | |
| Swaps | | | 41,977 | | | | – | | | | 41,977 | | | | 26,455 | | | | – | | | | 26,455 | |
| Purchased options | | | 46,746 | | | | – | | | | 46,746 | | | | 19,028 | | | | – | | | | 19,028 | |
| Written options | | | 47,619 | | | | – | | | | 47,619 | | | | 19,087 | | | | – | | | | 19,087 | |
| |
| | | | 136,342 | | | | – | | | | 136,342 | | | | 64,570 | | | | – | | | | 64,570 | |
| |
| Exchange-traded | | | | | | | | | | | | | | | | | | | | | | | | |
| Futures | | | 24,329 | | | | – | | | | 24,329 | | | | 2,771 | | | | – | | | | 2,771 | |
| Purchased options | | | 38,140 | | | | – | | | | 38,140 | | | | 1,409 | | | | – | | | | 1,409 | |
| Written options | | | 40,610 | | | | – | | | | 40,610 | | | | 1,563 | | | | – | | | | 1,563 | |
| |
| | | | 103,079 | | | | – | | | | 103,079 | | | | 5,743 | | | | – | | | | 5,743 | |
| |
| Total commodity contracts | | | 239,421 | | | | – | | | | 239,421 | | | | 70,313 | | | | – | | | | 70,313 | |
| |
Equity Contracts | | | | | | | | | | | | | | | | | | | | | | | | |
| Over-the-counter | | | 19,969 | | | | – | | | | 19,969 | | | | 19,384 | | | | – | | | | 19,384 | |
| Exchange-traded | | | 8,212 | | | | – | | | | 8,212 | | | | 5,342 | | | | – | | | | 5,342 | |
| |
| Total equity contracts | | | 28,181 | | | | – | | | | 28,181 | | | | 24,726 | | | | – | | | | 24,726 | |
| |
Credit Contracts | | | | | | | | | | | | | | | | | | | | | | | | |
| Over-the-counter | | | 39,781 | | | | – | | | | 39,781 | | | | 26,447 | | | | – | | | | 26,447 | |
| |
| Total | | $ | 1,957,456 | | | $ | 44,096 | | | $ | 2,001,552 | | | $ | 1,671,130 | | | $ | 58,800 | | | $ | 1,729,930 | |
| |
Included in the notional amounts is $796 million as at October 31, 2005 ($1,039 million in 2004) related to the Managed Futures Certificates of Deposit Program. Risk exposures represented by the assets in this program are traded on behalf of customers, with all gains and losses accruing to them.
| | | |
| BMO Financial Group 188th Annual Report 2005 | | 109 |
Derivative-Related Credit Risk
Over-the-counter derivative instruments are subject to credit risk. Credit risk arises from the possibility that counterparties may default on their obligations. The credit risk associated with derivatives is normally a small fraction of the notional amount of the derivative instrument. Derivative contracts generally expose us to potential credit loss if changes in market rates affect a counterparty’s position unfavourably and the counterparty defaults on payment. The credit risk is represented by the positive fair value of the derivative instrument. We strive to limit credit risk by dealing with counterparties that we believe are creditworthy, and we manage our credit risk for derivatives using the same credit risk process that is applied to loans and other credit assets.
We also pursue opportunities to reduce our exposure to credit losses on derivative instruments, including entering into master netting agreements with counterparties. The credit risk associated with favourable contracts is eliminated by master netting agreements, to the extent that unfavourable contracts with the same counterparty cannot be settled before favourable contracts.
Exchange-traded derivatives have no potential for credit exposure as they are settled net with each exchange.
Terms used in the credit risk table below are as follows:
Replacement costrepresents the cost of replacing all contracts that have a positive fair value, using current market rates. It represents in effect the unrealized gains on our derivative instruments. Replacement costs disclosed below represent the net of the asset and liability to a specific counterparty where we have a legally enforceable right to offset the amount owed to us with the amount owed by us and we intend either to settle on a net basis or to realize the asset and settle the liability simultaneously.
Credit risk equivalentrepresents the total replacement cost plus an amount representing the potential future credit exposure, as outlined in the Capital Adequacy Guideline of the Superintendent of Financial Institutions Canada.
Risk-weighted balancerepresents the credit risk equivalent, weighted based on the creditworthiness of the counterparty, as prescribed by the Superintendent of Financial Institutions Canada.
| | | | | | | | | | | | | | | | | | | | | | | | | |
| (Canadian $ in millions) | | 2005 | | | 2004 | |
| |
| | | Replacement | | | Credit risk | | | Risk-weighted | | | Replacement | | | Credit risk | | | Risk-weighted | |
| | | cost | | | equivalent | | | balance | | | cost | | | equivalent | | | balance | |
| |
Interest Rate Contracts | | | | | | | | | | | | | | | | | | | | | | | | |
| Swaps | | $ | 8,724 | | | $ | 12,955 | | | $ | 2,995 | | | $ | 11,092 | | | $ | 14,994 | | | $ | 3,541 | |
| Forward rate agreements | | | 101 | | | | 160 | | | | 33 | | | | 106 | | | | 196 | | | | 40 | |
| Purchased options | | | 1,501 | | | | 1,844 | | | | 414 | | | | 1,556 | | | | 1,941 | | | | 441 | |
| |
| Total interest rate contracts | | | 10,326 | | | | 14,959 | | | | 3,442 | | | | 12,754 | | | | 17,131 | | | | 4,022 | |
| |
Foreign Exchange Contracts | | | | | | | | | | | | | | | | | | | | | | | | |
| Cross-currency swaps | | | 1,342 | | | | 1,911 | | | | 574 | | | | 940 | | | | 1,513 | | | | 457 | |
| Cross-currency interest rate swaps | | | 3,240 | | | | 6,142 | | | | 1,068 | | | | 3,735 | | | | 6,165 | | | | 1,124 | |
| Forward foreign exchange contracts | | | 874 | | | | 1,997 | | | | 586 | | | | 2,043 | | | | 3,275 | | | | 951 | |
| Purchased options | | | 88 | | | | 159 | | | | 58 | | | | 145 | | | | 224 | | | | 80 | |
| |
| Total foreign exchange contracts | | | 5,544 | | | | 10,209 | | | | 2,286 | | | | 6,863 | | | | 11,177 | | | | 2,612 | |
| |
Commodity Contracts | | | | | | | | | | | | | | | | | | | | | | | | |
| Swaps | | | 6,221 | | | | 11,969 | | | | 4,706 | | | | 3,514 | | | | 6,941 | | | | 2,673 | |
| Purchased options | | | 6,311 | | | | 11,123 | | | | 4,465 | | | | 2,047 | | | | 4,006 | | | | 1,361 | |
| |
| Total commodity contracts | | | 12,532 | | | | 23,092 | | | | 9,171 | | | | 5,561 | | | | 10,947 | | | | 4,034 | |
| |
Equity Contracts | | | 328 | | | | 1,776 | | | | 604 | | | | 391 | | | | 1,649 | | | | 669 | |
| |
Credit Contracts | | | 129 | | | | 1,740 | | | | 377 | | | | 75 | | | | 1,195 | | | | 254 | |
| |
| Total derivatives | | | 28,859 | | | | 51,776 | | | | 15,880 | | | | 25,644 | | | | 42,099 | | | | 11,591 | |
| |
| Impact of master netting agreements | | | (19,832 | ) | | | (24,693 | ) | | | (7,214 | ) | | | (13,455 | ) | | | (18,352 | ) | | | (4,705 | ) |
| |
| Total | | $ | 9,027 | | | $ | 27,083 | | | $ | 8,666 | | | $ | 12,189 | | | $ | 23,747 | | | $ | 6,886 | |
| |
Included in the total derivatives are unrealized gains on hedging derivatives, which we include in the Consolidated Balance Sheet on an accrual rather than a mark-to-market basis. The excess of market value over book value for these items was $242 million as at October 31, 2005 ($333 million in 2004). Total derivatives does not include exchange-traded derivatives with a positive fair value of $2,900 million as at October 31, 2005 ($137 million in 2004).
Transactions are conducted with counterparties in various geographic locations and industries. Set out below is the replacement cost of contracts (before the impact of master netting agreements) with customers located in the following countries, based on country of ultimate risk:
| | | | | | | | | | | | | | | | | |
| (Canadian $ in millions, except as noted) | | 2005 | | | 2004 | |
| |
| Canada | | $ | 7,852 | | | | 27 | % | | $ | 7,611 | | | | 30 | % |
| United States | | | 14,187 | | | | 49 | | | | 11,088 | | | | 43 | |
Other countries(1) | | | 6,820 | | | | 24 | | | | 6,945 | | | | 27 | |
| |
| Total | | $ | 28,859 | | | | 100 | % | | $ | 25,644 | | | | 100 | % |
| |
(1) No other country represented 10% or more of our replacement cost in either 2005 or 2004.
| | | |
| 110 | | BMO Financial Group 188th Annual Report 2005 |
Transactions are conducted with various counterparties. Set out below is the replacement cost of contracts (before the impact of master netting agreements) with customers in the following industries:
| | | | | | | | | | | | | | | | | | | | | | | | | | | | | | | | | | | | | | | | | |
| | | Interest rate | | | Foreign exchange | | | Commodity | | | Equity | | | Credit | |
| (Canadian $ in millions) | | contracts | | | contracts | | | contracts | | | contracts | | | contracts | |
| |
| | | 2005 | | | 2004 | | | 2005 | | | 2004 | | | 2005 | | | 2004 | | | 2005 | | | 2004 | | | 2005 | | | 2004 | |
| |
| Financial institutions | | $ | 8,852 | | | $ | 11,213 | | | $ | 2,021 | | | $ | 3,770 | | | $ | 3,880 | | | $ | 1,939 | | | $ | 163 | | | $ | 105 | | | $ | 125 | | | $ | 73 | |
| Natural resources | | | 29 | | | | 12 | | | | 98 | | | | 134 | | | | 8,119 | | | | 3,471 | | | | – | | | | – | | | | – | | | | – | |
| Other | | | 1,445 | | | | 1,529 | | | | 3,425 | | | | 2,959 | | | | 533 | | | | 151 | | | | 165 | | | | 286 | | | | 4 | | | | 2 | |
| |
| Total | | $ | 10,326 | | | $ | 12,754 | | | $ | 5,544 | | | $ | 6,863 | | | $ | 12,532 | | | $ | 5,561 | | | $ | 328 | | | $ | 391 | | | $ | 129 | | | $ | 75 | |
| |
Term to Maturity
Our derivative contracts have varying maturity dates. The remaining contractual term to maturity for the notional amounts of our derivative contracts is set out below:
| | | | | | | | | | | | | | | | | | | | | | | | | | | | | |
| (Canadian $ in millions) | | Term to maturity | | | 2005 | | | 2004 | |
| |
| | | | | | | | | | | | | | | | | | | | | | | Total | | | Total | |
| | | Within | | | 1 to 3 | | | 3 to 5 | | | 5 to 10 | | | Over 10 | | | notional | | | notional | |
| | | 1 year | | | years | | | years | | | years | | | years | | | amount | | | amount | |
| |
Interest Rate Contracts | | | | | | | | | | | | | | | | | | | | | | | | | | | | |
| Swaps | | $ | 216,186 | | | $ | 230,576 | | | $ | 140,808 | | | $ | 130,795 | | | $ | 31,134 | | | $ | 749,499 | | | $ | 716,994 | |
| Forward rate agreements, futures and options | | | 551,355 | | | | 150,248 | | | | 31,843 | | | | 25,630 | | | | 3,512 | | | | 762,588 | | | | 719,256 | |
| |
| Total interest rate contracts | | | 767,541 | | | | 380,824 | | | | 172,651 | | | | 156,425 | | | | 34,646 | | | | 1,512,087 | | | | 1,436,250 | |
| |
Foreign Exchange Contracts | | | | | | | | | | | | | | | | | | | | | | | | | | | | |
| Cross-currency swaps | | | 1,259 | | | | 1,852 | | | | 1,048 | | | | 3,135 | | | | 2,350 | | | | 9,644 | | | | 9,635 | |
| Cross-currency interest rate swaps | | | 11,347 | | | | 18,848 | | | | 12,132 | | | | 13,216 | | | | 3,091 | | | | 58,634 | | | | 49,853 | |
| Forward foreign exchange contracts, futures and options | | | 105,711 | | | | 6,153 | | | | 1,427 | | | | 497 | | | | 16 | | | | 113,804 | | | | 112,706 | |
| |
| Total foreign exchange contracts | | | 118,317 | | | | 26,853 | | | | 14,607 | | | | 16,848 | | | | 5,457 | | | | 182,082 | | | | 172,194 | |
| |
Commodity Contracts | | | | | | | | | | | | | | | | | | | | | | | | | | | | |
| Swaps | | | 25,556 | | | | 14,445 | | | | 1,744 | | | | 232 | | | | – | | | | 41,977 | | | | 26,455 | |
| Futures and options | | | 151,068 | | | | 44,313 | | | | 2,040 | | | | 23 | | | | – | | | | 197,444 | | | | 43,858 | |
| |
| Total commodity contracts | | | 176,624 | | | | 58,758 | | | | 3,784 | | | | 255 | | | | – | | | | 239,421 | | | | 70,313 | |
| |
Equity Contracts | | | 20,619 | | | | 2,037 | | | | 1,809 | | | | 2,850 | | | | 866 | | | | 28,181 | | | | 24,726 | |
| |
Credit Contracts | | | 5,310 | | | | 9,048 | | | | 21,366 | | | | 4,017 | | | | 40 | | | | 39,781 | | | | 26,447 | |
| |
| Total | | $ | 1,088,411 | | | $ | 477,520 | | | $ | 214,217 | | | $ | 180,395 | | | $ | 41,009 | | | $ | 2,001,552 | | | $ | 1,729,930 | |
| |
Note 10 4 Premises and Equipment
We record all premises and equipment at cost less accumulated amortization except for land, which is recorded at cost. Buildings, computer equipment and software, other equipment and leasehold improvements are amortized on a straight-line basis over their estimated useful lives. The maximum estimated useful lives we use to amortize our assets are:
| | | | | |
| |
| Buildings | | 40 years |
| Computer equipment and software | | 15 years |
| Other equipment | | 10 years |
| Leasehold improvements | | Lease term to a maximum of 10 years |
| |
| | | | | | | | | | | | | | | | | |
| (Canadian $ in millions) | | | | | | | | | | 2005 | | | 2004 | |
| |
| | | | | | Accumulated | | Carrying | | | Carrying | |
| | | Cost | | amortization | | value | | | value | |
| |
| Land | | $ | 179 | | | $ | – | | | $ | 179 | | | $ | 271 | |
| Buildings | | | 1,063 | | | | 545 | | | | 518 | | | | 620 | |
| Computer equipment and software | | | 2,366 | | | | 1,676 | | | | 690 | | | | 676 | |
| Other equipment | | | 679 | | | | 455 | | | | 224 | | | | 247 | |
| Leasehold improvements | | | 577 | | | | 341 | | | | 236 | | | | 206 | |
| |
| Total | | $ | 4,864 | | | $ | 3,017 | | | $ | 1,847 | | | $ | 2,020 | |
| |
Amortization expense for the years ended October 31, 2005, 2004 and 2003 amounted to $377 million, $365 million and $375 million, respectively.
Gains and losses on disposal are included in non-interest revenue – other in our Consolidated Statement of Income.
On September 23, 2005, we sold the office tower located at 350 – 7th Avenue South West in Calgary. The gain on sale was $58 million before tax, of which $29 million was recorded in the Consolidated Statement of Income. The remaining $29 million was deferred and will be recorded as a reduction in rental expense over the terms of our leases in the building, which expire between 2015 and 2025. The deferred gain as at October 31, 2005 was $29 million.
On March 1, 2005, we sold the land and building located at 111 West Monroe Street in Chicago and concurrently entered into lease agreements at market rates for approximately 50% of the building. The gain on sale of $5 million was deferred and will be recorded as a reduction in rental expense over the terms of our leases in the building,which expire between 2013 and 2035. The deferred gain as at October 31, 2005 was $5 million.
We test premises and equipment for impairment when events or changes in circumstances indicate that their carrying value may not be recoverable. We write them down to fair value when the related undiscounted cash flows are not expected to allow for recovery of the carrying value. There were no write-downs of premises and equipment due to impairment during the years ended October 31, 2005, 2004 and 2003.
| | | |
| BMO Financial Group 188th Annual Report 2005 | | 111 |
Notes to Consolidated Financial Statements
Lease Commitments
We have entered into a number of non-cancellable leases for premises and equipment. Our total contractual rental commitments as at October 31, 2005 were $1,464 million. The commitments for each of the next five years and thereafter are $202 million for 2006, $181 million for 2007, $149 million for 2008, $130 million for 2009, $109 million for 2010 and $693 million thereafter. Included in
these amounts are the commitments related to 697 leased branch locations as at October 31, 2005.
Net rent expense for premises and equipment reported in our Consolidated Statement of Income was $245 million, $227 million and $222 million for the years ended October 31, 2005, 2004 and 2003, respectively.
Note 11 4 Acquisitions
We account for acquisitions of businesses using the purchase method. This involves allocating the purchase price paid for a business to the assets acquired, including identifiable intangible assets, and the liabilities assumed, based on their fair values at the date of acquisition. Any excess is then recorded as goodwill.
Our acquisitions in 2005 and 2004 form part of our Retail and Commercial Banking reporting unit within the Personal and Commercial Client Group.
Mercantile Bancorp, Inc.
On December 30, 2004, we completed the acquisition of Indiana-based Mercantile Bancorp, Inc., a community bank, for total cash consideration of $194 million. As part of this transaction, we also acquired a small real estate company, Lake Commercial Corp. (collectively “MBI”). The results of MBI’s operations have been included in our consolidated financial statements since that date. The acquisition of MBI provides us with the opportunity to expand our community banking services into Northwest Indiana. As part of this acquisition, we acquired a core deposit intangible asset, which will be amortized on an accelerated basis over 10 years. Goodwill related to this acquisition is not deductible for tax purposes.
New Lenox State Bank
On June 1, 2004, we completed the acquisition of all outstanding voting shares of New Lenox State Bank (“NLSB”), a full-service community bank in Will County, Illinois, for total cash consideration of $314 million. The results of NLSB’s operations have been included in our consolidated financial statements since that date. The acquisition of NLSB is part of our expansion in and around the Will County, Illinois market. As part of this acquisition, we acquired a core deposit intangible asset, which will be amortized on an accelerated basis over 10 years. Goodwill related to this acquisition is deductible for tax purposes.
Lakeland Community Bank
On March 1, 2004, we completed the acquisition of all outstanding voting shares of Lakeland Community Bank (“LCB”), a full-service community bank in Lake County, Illinois, for total cash consideration of $49 million. The results of LCB’s operations have been included in our consolidated financial statements since that date. The acquisition of LCB is part of our further expansion in and around the Chicago, Illinois market. As part of this acquisition, we acquired a core deposit intangible asset, which will be amortized on an accelerated basis over 10 years. Goodwill related to this acquisition is not deductible for tax purposes.
The estimated fair values of the assets acquired and the liabilities assumed at the dates of acquisition are as follows:
| | | | | | | | | | | | | | | | | |
| | | 2005 | | | 2004 | |
| |
| (Canadian $ in millions) | | MBI | | | NLSB | | | LCB | | | Other | |
| |
| Cash resources | | $ | 111 | | | $ | 111 | | | $ | 13 | | | $ | – | |
| Securities | | | 166 | | | | 393 | | | | 31 | | | | – | |
| Loans | | | 620 | | | | 774 | | | | 181 | | | | – | |
| Premises and equipment | | | 18 | | | | 32 | | | | 3 | | | | – | |
| Goodwill | | | 91 | | | | 193 | | | | 28 | | | | 14 | |
| Core deposit intangible asset | | | 15 | | | | 30 | | | | 2 | | | | – | |
| Other intangible assets | | | – | | | | – | | | | – | | | | 8 | |
| Other assets | | | 25 | | | | 48 | | | | 2 | | | | – | |
| |
| Total assets | | | 1,046 | | | | 1,581 | | | | 260 | | | | 22 | |
| |
| Deposits | | | 752 | | | | 1,225 | | | | 209 | | | | – | |
| Other liabilities | | | 100 | | | | 42 | | | | 2 | | | | – | |
| |
| Total liabilities | | | 852 | | | | 1,267 | | | | 211 | | | | – | |
| |
| Purchase price | | $ | 194 | | | $ | 314 | | | $ | 49 | | | $ | 22 | |
| |
Future Acquisition
Villa Park Trust and Savings Bank
On July 7, 2005, we announced the acquisition of Chicago-based Villa Park Trust and Savings Bank (“Villa Park”), a community bank, for total cash consideration of approximately $81 million.
The acquisition of Villa Park is expected to close in December 2005. The acquisition of Villa Park will provide us with the opportunity to expand our banking services in the Chicago, Illinois market. The results of Villa Park’s operations will be included in our consolidated financial statements as of the date of acquisition.
| | | |
| 112 | | BMO Financial Group 188th Annual Report 2005 |
Note 12 4 Sale of HarrisdirectLLC
On October 6, 2005, we sold our interest in our U.S. direct investing operations HarrisdirectLLC to E*Trade Financial Corporation for cash proceeds of $827 million (US$700 million). The gain of $49 million was recorded in non-interest revenue – other in our Consolidated Statement of Income ($18 million, after tax). Included in the gain is $29 million (US$25 million) representing the estimated reimbursement by HarrisdirectLLC of mutual fund program fees related to our Harris Insight Funds. Certain costs associated with the transaction have not been finalized; if actual costs differ from the estimates, the impact would be recorded in future periods.
We have provided the purchaser standard indemnifications as part of the purchase and sale agreement.
Our Consolidated Statement of Income includes the results of HarrisdirectLLC, including the gain on sale in 2005, as follows:
| | | | | | | | | | | | | |
| (Canadian $ in millions) | | 2005 | | | 2004 | | | 2003 | |
| |
| Net Interest Income | | $ | 68 | | | $ | 66 | | | $ | 67 | |
| Non-Interest Revenue | | | 184 | | | | 179 | | | | 191 | |
| |
| | | | 252 | | | | 245 | | | | 258 | |
| Non-Interest Expense | | | 243 | | | | 271 | | | | 297 | |
| Income taxes | | | 14 | | | | (11 | ) | | | (12 | ) |
| |
| Net Loss | | $ | (5 | ) | | $ | (15 | ) | | $ | (27 | ) |
| |
Note 13 4 Goodwill and Intangible Assets
Goodwill
When we acquire a subsidiary, joint venture or investment securities where we exert significant influence, we allocate the purchase price paid to the assets acquired, including identifiable intangible assets, and the liabilities assumed. Any excess of the amount paid over the fair value of those net assets is considered to be goodwill.
Goodwill is not amortized; however, it is tested at least annually for impairment. The impairment test consists of allocating goodwill to our reporting units (groups of businesses with similar
characteristics) and then comparing the book value of the reporting units, including goodwill, to their fair values. We determine fair value using discounted cash flows or price-to-earnings or other multiples, whichever is most appropriate under the circumstances. The excess of carrying value of goodwill over fair value of goodwill, if any, is recorded as an impairment charge in the period in which impairment is determined.
There were no write-downs of goodwill due to impairment during the years ended October 31, 2005, 2004 and 2003.
A continuity of our goodwill by reporting unit, within our operating groups, for the years ended October 31, 2005 and 2004 is as follows:
| | | | | | | | | | | | | | | | | | | | | | | | | | | | | | | | | |
| | | Personal and | | | | | | | | | | | | | | | | | | | | | | | | |
| | | Commercial | | | | | | | | | | | | | | Private | | | Investment | | | | | | | |
| (Canadian $ in millions) | | Client Group | | | | | | | | | | | | | | Client Group | | | Banking Group | | | Other | | | Total | |
| |
| | | Retail and | | | | | | Retail | | | | | | | | | | | | | | | | | | |
| | | Commercial | | Client | | | Investment | | | Private | | | | | | | Investment | | | Technology | | | | | |
| | | Banking | | Investing | | | Products | | | Banking | | | Total | | | Banking | | | and Solutions | | | | | |
| | | | | | | | | | | | |
| Goodwill as at October 31, 2003 | | $ | 404 | | $ | 593 | | | $ | 187 | | | $ | 74 | | | $ | 854 | | | $ | 73 | | | $ | 3 | | | $ | 1,334 | |
| Acquisitions during the year | | | 233 | | | – | | | | – | | | | – | | | | – | | | | 2 | | | | – | | | | 235 | |
Other(1) | | | (49 | ) | | (40 | ) | | | – | | | | – | | | | (40 | ) | | | 27 | | | | – | | | | (62 | ) |
| | | | | | | | | | | | |
| Goodwill as at October 31, 2004 | | | 588 | | | 553 | | | | 187 | | | | 74 | | | | 814 | | | | 102 | | | | 3 | | | | 1,507 | |
| Acquisitions during the year | | | 91 | | | – | | | | – | | | | – | | | | – | | | | – | | | | – | | | | 91 | |
Sale of HarrisdirectLLC | | | – | | | (471 | ) | | | – | | | | – | | | | (471 | ) | | | – | | | | – | | | | (471 | ) |
Other(1) | | | (18 | ) | | (14 | ) | | | – | | | | (2 | ) | | | (16 | ) | | | (2 | ) | | | – | | | | (36 | ) |
| | | | | | | | | | | | |
| Goodwill as at October 31, 2005 | | $ | 661 | (2) | $ | 68 | (3) | | $ | 187 | (4) | | $ | 72 | (5) | | $ | 327 | | | $ | 100 | (6) | | $ | 3 | | | $ | 1,091 | |
| |
| | |
| (1) | | Other changes in goodwill include the effects of translating goodwill denominated in foreign currencies into Canadian dollars, purchase accounting adjustments related to prior year purchases and certain other reclassifications. |
| |
| (2) | | Relates primarily to New Lenox State Bank, First National Bank of Joliet, Household Bank branches, Moneris Solutions Corporation and Mercantile Bancorp, Inc. |
| | |
| (3) | | Relates to BMO Nesbitt Burns Corporation Limited. |
| |
| (4) | | Relates to Guardian Group of Funds Ltd. |
| |
| (5) | | Relates primarily to myCFO, Inc. |
| |
| (6) | | Relates to Gerard Klauer Mattison & Co., Inc. and BMO Nesbitt Burns Corporation Limited. |
Intangible Assets
Intangible assets related to our acquisitions are recorded at their fair value at the acquisition date. Intangible assets by category are as follows:
| | | | | | | | | | | | | | | | | |
| (Canadian $ in millions) | | 2005 | | | 2004 | |
| |
| | | | | | | Accumulated | | | Carrying | | | Carrying | |
| | | Cost | | | amortization | | | value | | | value | |
| |
| Customer relationships | | $ | 76 | | | | $ 42 | | | $ | 34 | | | $ | 287 | |
| Core deposits | | | 202 | | | | 116 | | | | 86 | | | | 95 | |
| Branch distribution networks | | | 174 | | | | 108 | | | | 66 | | | | 81 | |
| Other | | | 24 | | | | 14 | | | | 10 | | | | 17 | |
| |
| Total | | $ | 476 | | | | $280 | | | $ | 196 | | | $ | 480 | |
| |
As a result of the sale of HarrisdirectLLC, intangible assets were reduced by $194 million.
Intangible assets with a finite life are amortized to income over the period during which we believe the assets will benefit us on either a straight-line or an accelerated basis, depending on the specific asset, over a period not to exceed 15 years.
We test intangible assets with a finite life for impairment when events or changes in circumstances indicate that their carrying value may not be recoverable. We write them down to fair value when the related undiscounted cash flows are not expected to allow for recovery of the carrying value. There were no write-downs of intangible assets due to impairment during the years ended October 31, 2005, 2004 and 2003.
The total estimated amortization expense relating to intangible assets for each of the next five years is $44 million for 2006, $42 million for 2007, $35 million for 2008, $30 million for 2009 and $18 million for 2010.
| | | |
| BMO Financial Group 188th Annual Report 2005 | | 113 |
Notes to Consolidated Financial Statements
Note 14 4 Other Assets
| | | | | | | | | |
| (Canadian $ in millions) | | 2005 | | | 2004 | |
| |
| Accounts receivable, prepaid expenses and other items | | $ | 4,973 | | | $ | 5,405 | |
| Accrued interest receivable | | | 896 | | | | 666 | |
| Due from clients, dealers and brokers | | | 3,521 | | | | 3,748 | |
Pension asset(Note 22) | | | 1,177 | | | | 1,155 | |
| |
| Total | | $ | 10,567 | | | $ | 10,974 | |
| |
Note 15 4 Deposits
| | | | | | | | | | | | | | | | | | | | | | | | | | | | | | | | | | | | | | | | | |
| | | | Demand deposits | | | Payable | | | Payable on | | | | |
| (Canadian $ in millions) | | | Interest bearing | | | Non-interest bearing | | | after notice | | | a fixed date | | | Total | |
| |
| | | 2005 | | | 2004 | | | 2005 | | | 2004 | | | 2005 | | | 2004 | | | 2005 | | | 2004 | | | 2005 | | | 2004 | |
| |
| Deposits by: | | | | | | | | | | | | | | | | | | | | | | | | | | | | | | | | | | | | | | | | |
| Banks | | $ | 368 | | | $ | 356 | | | $ | 352 | | | $ | 408 | | | $ | 670 | | | $ | 329 | | | $ | 24,083 | | | $ | 19,561 | | | $ | 25,473 | | | $ | 20,654 | |
| Businesses and governments | | | 5,499 | | | | 5,570 | | | | 11,284 | | | | 10,380 | | | | 15,521 | | | | 18,621 | | | | 60,133 | | | | 45,043 | | | | 92,437 | | | | 79,614 | |
| Individuals | | | 3,459 | | | | 3,495 | | | | 4,740 | | | | 4,189 | | | | 34,669 | | | | 33,797 | | | | 33,015 | | | | 33,441 | | | | 75,883 | | | | 74,922 | |
| |
| Total | | $ | 9,326 | | | $ | 9,421 | | | $ | 16,376 | | | $ | 14,977 | | | $ | 50,860 | | | $ | 52,747 | | | $ | 117,231 | | | $ | 98,045 | | | $ | 193,793 | | | $ | 175,190 | |
| |
| Booked in: | | | | | | | | | | | | | | | | | | | | | | | | | | | | | | | | | | | | | | | | |
| Canada | | $ | 8,079 | | | $ | 7,947 | | | $ | 12,001 | | | $ | 10,894 | | | $ | 35,691 | | | $ | 37,182 | | | $ | 71,211 | | | $ | 63,876 | | | $ | 126,982 | | | $ | 119,899 | |
| United States | | | 1,128 | | | | 1,408 | | | | 4,168 | | | | 4,072 | | | | 14,631 | | | | 14,798 | | | | 25,026 | | | | 18,039 | | | | 44,953 | | | | 38,317 | |
| Other countries | | | 119 | | | | 66 | | | | 207 | | | | 11 | | | | 538 | | | | 767 | | | | 20,994 | | | | 16,130 | | | | 21,858 | | | | 16,974 | |
| |
| Total | | $ | 9,326 | | | $ | 9,421 | | | $ | 16,376 | | | $ | 14,977 | | | $ | 50,860 | | | $ | 52,747 | | | $ | 117,231 | | | $ | 98,045 | | | $ | 193,793 | | | $ | 175,190 | |
| |
Included in deposits as at October 31, 2005 and 2004 are $74,038 million and $61,982 million of deposits denominated in U.S. dollars, and $6,297 million and $6,761 million of deposits denominated in other foreign currencies.
Demand deposits are comprised primarily of our customers’ chequing accounts, some of which we pay interest on. Our customers need not notify us prior to withdrawing money from their chequing accounts.
Deposits payable after notice are comprised primarily of our customers’ savings accounts, on which we pay interest.
Deposits payable on a fixed date are comprised primarily of various investment instruments purchased by our customers to earn interest over a fixed period, such as term deposits and guaranteed investment certificates. The terms of these deposits can vary from one day to 10 years.
Deposits payable on a fixed date include federal funds purchased, which are overnight borrowings of other banks’ excess reserve funds at a United States Federal Reserve Bank. As at October 31, 2005, we had purchased $4,396 million of federal funds ($3,165 million in 2004).
Deposits payable on a fixed date include commercial paper totalling $604 million as at October 31, 2005 ($335 million in 2004).
Included in our deposits payable on a fixed date as at October 31, 2005 were $94,840 million of individual deposits greater than one hundred thousand dollars, of which $49,912 million were booked in Canada, $23,933 million were booked in the United States and $20,995 million were booked in other countries. We had $73,273 million of such deposits as at October 31, 2004, of which $41,453 million were booked in Canada, $15,689 million were booked in the United States and $16,131 million were booked in other countries. Of these deposits booked in Canada as at October 31, 2005, the amount maturing within three months was $31,541 million, between three and six months was $1,767 million, between six and 12 months was $5,341 million and over 12 months was $11,263 million. As at October 31, 2004, the amount maturing within three months was $26,592 million, between three and six months was $1,309 million, between six and 12 months was $2,491 million and over 12 months was $11,061 million.
Note 16 4 Other Liabilities
| | | | | | | | | |
| (Canadian $ in millions) | | 2005 | | | 2004 | |
| |
| Acceptances | | $ | 5,934 | | | $ | 5,355 | |
| Securities sold but not yet purchased | | | 16,142 | | | | 10,441 | |
| Securities lent or sold under repurchase agreements | | | 22,657 | | | | 21,345 | |
| |
| | | $ | 44,733 | | | $ | 37,141 | |
| |
Acceptances
Acceptances represent a form of negotiable short-term debt that is issued by our customers and which we guarantee for a fee. We have an offsetting claim, equal to the amount of the acceptances, against our customers when the instruments mature. The amount due under acceptances is recorded as a liability and our corresponding claim is recorded as a loan in our Consolidated Balance Sheet.
| | | |
| 114 | | BMO Financial Group 188th Annual Report 2005 |
Securities Sold but not yet Purchased
Securities sold but not yet purchased represent our obligation to deliver securities which we do not own at the time of sale. These obligations are recorded at their market value. Adjustments to the market value as at the balance sheet date and gains and losses on the settlement of these obligations are recorded in trading revenues in our Consolidated Statement of Income.
Securities Lent or Sold under Repurchase Agreements
Securities lent or sold under repurchase agreements represent short-term funding transactions where we sell securities that we already own and simultaneously commit to repurchase the same securities at a specified price on a specified date in the future. The obligation to repurchase these securities is recorded at the amount owing. The interest expense related to these liabilities is recorded on an accrual basis.
| | | | | | | | | |
| (Canadian $ in millions) | | 2005 | | | 2004 | |
| |
Other | | | | | | | | |
| Accounts payable, accrued expenses and other items | | $ | 8,812 | | | $ | 9,161 | |
| Accrued interest payable | | | 1,146 | | | | 991 | |
| Non-controlling interest in subsidiaries | | | 1,374 | | | | 944 | |
| Liabilities of subsidiaries, other than deposits | | | 271 | | | | 502 | |
Pension liability(Note 22) | | | 18 | | | | 18 | |
Other employee future benefits liability(Note 22) | | | 582 | | | | 540 | |
| |
| Total | | $ | 12,203 | | | $ | 12,156 | |
| |
Included in non-controlling interest in subsidiaries as at October 31, 2005 were capital trust securities totalling $1,042 million ($595 million in 2004) that form part of our Tier 1 regulatory capital (see Note 18).
Change in Accounting Policy
See Note 20 for discussion of a change in accounting policy affecting our capital trust securities included in non-controlling interest in subsidiaries, which was effective November 1, 2004.
Customer Loyalty Program
We record the liability associated with our credit card customer loyalty program rewards in the period in which our customers become entitled to redeem the rewards. We estimate the liability using the expected future redemption rate and apply the cost of expected redemptions. Our estimate of the expected redemption rate is based on statistical analysis of past customer behaviour. The costs of our loyalty program are recorded as a reduction in non-interest revenue – card fees in the Consolidated Statement of Income. The liability is included in other liabilities in the Consolidated Balance Sheet.
Change in Accounting Estimate
During the years ended October 31, 2005 and 2004, we increased the estimate of the liability associated with our credit card customer loyalty program. The change in estimate during fiscal 2005 was due to further refinements made to the methodology used to determine the liability. The change in estimate during 2004 was due to rising reward redemption rates. The impact of this change on our Consolidated Statement of Income for the year ended October 31, 2005 was a reduction in non-interest revenue – card fees of $40 million, a decrease in income taxes of $14 million and a decrease in net income of $26 million ($65 million, $23 million and $42 million, respectively, for the year ended October 31, 2004).
Note 17 4 Subordinated Debt
Subordinated debt represents our direct unsecured obligations, in the form of notes and debentures, to our debt holders and forms part of our regulatory capital. The rights of the holders of our notes and debentures are subordinate to the claims of depositors and certain other creditors. We require approval from the Superintendent of Financial Institutions Canada before we can redeem any part of our subordinated debt.
During the year ended October 31, 2005, we issued Series C Medium-Term Notes, Tranches 1 and 2, totalling $1 billion. We redeemed our $300 million Series B Medium-Term Notes and our $250 million Series 18 Debentures, and our US$300 million 6.10% Notes matured. During the year ended October 31, 2004, we redeemed our $400 million Series A Medium-Term, 3rd Tranche Notes. There were no gains or losses on any of our redemptions.
The term to maturity and repayments of our subordinated debt required over the next five years and thereafter are as follows:
| | | | | | | | | | | | | | | | | | | | | | | | | | | | | | | | | | | | | | | |
| | | | | | | | | | | | | Redeemable | | | | | | | | | | | | | | | | | | | | |
| (Canadian $ in millions, | | | | | | | | Interest | | | at our option | | | | | | | | | | | | | | | | Over | | | 2005 | | | 2004 | |
| except as noted) | | Face value | | | Maturity date | | rate (%) | | | beginning in | | 1 year | | 2 years | | | 3 years | | 4 years | | | 5 years | | 5 years | | | Total | | | Total | |
| |
| Debentures Series 12 | | $ | 140 | | | December 2008 | | | 10.85 | | | December 1998 | | $– | | $ | – | | | $– | | $ | 140 | | | $– | | $ | – | | | $ | 140 | | | $ | 140 | |
| Debentures Series 16 | | $ | 100 | | | February 2017 | | | 10.00 | | | February 2012 | | – | | | – | | | – | | | – | | | – | | | 100 | | | | 100 | | | | 100 | |
| Debentures Series 18 | | $ | 250 | | | September 2010 | | | 8.80 | | | redeemed | | – | | | – | | | – | | | – | | | – | | | – | | | | – | | | | 250 | |
| Debentures Series 19 | | $ | 125 | | | March 2011 | | | 7.40 | | | March 2006 | | – | | | – | | | – | | | – | | | – | | | 125 | | | | 125 | | | | 125 | |
| Debentures Series 20 | | $ | 150 | | | December 2025 to 2040 | | | 8.25 | | | not redeemable | | – | | | – | | | – | | | – | | | – | | | 150 | | | | 150 | | | | 150 | |
| Debentures Series 21 | | $ | 300 | | | May 2011 | | | 8.15 | | | May 2006 | | – | | | – | | | – | | | – | | | – | | | 300 | | | | 300 | | | | 300 | |
| Debentures Series 22 | | $ | 150 | | | July 2012 | | | 7.92 | | | July 2007 | | – | | | – | | | – | | | – | | | – | | | 150 | | | | 150 | | | | 150 | |
| 6.10% Notes | | US$ | 300 | | | September 2005 | | | 6.10 | | | September 1998(1) | | – | | | – | | | – | | | – | | | – | | | – | | | | – | | | | 365 | |
| 7.80% Notes | | US$ | 300 | | | April 2007 | | | 7.80 | | | April 2000(1) | | – | | | 354 | | | – | | | – | | | – | | | – | | | | 354 | | | | 365 | |
| Series A Medium-Term Notes | | | | | | | | | | | | | | | | | | | | | | | | | | | | | | | | | | | | | | |
| 2nd Tranche | | $ | 150 | | | February 2013 | | | 5.75 | | | February 2008 | | – | | | – | | | – | | | – | | | – | | | 150 | | | | 150 | | | | 150 | |
| Series B Medium-Term Notes | | $ | 300 | | | June 2010 | | | 6.60 | | | redeemed | | – | | | – | | | – | | | – | | | – | | | – | | | | – | | | | 300 | |
| Series C Medium-Term Notes | | | | | | | | | | | | | | | | | | | | | | | | | | | | | | | | | | | | | | |
| 1st Tranche | | $ | 500 | | | January 2015 | | | 4.00 | | | January 2010(2) | | – | | | – | | | – | | | – | | | – | | | 500 | | | | 500 | | | | – | |
| 2nd Tranche | | $ | 500 | | | April 2020 | | | 4.87 | | | April 2015(3) | | – | | | – | | | – | | | – | | | – | | | 500 | | | | 500 | | | | – | |
| |
| Total | | | | | | | | | | | | | | $– | | $ | 354 | | | $– | | $ | 140 | | | $– | | $ | 1,975 | | | $ | 2,469 | | | $ | 2,395 | |
| |
| | |
| (1) | | Redeemable at our option only if certain tax events occur. |
| |
| (2) | | Redeemable at the greater of par and the Canada Yield Price prior to January 21, 2010, and redeemable at par commencing January 21, 2010. |
| | |
| (3) | | Redeemable at the greater of par and the Canada Yield Price prior to April 22, 2015, and redeemable at par commencing April 22, 2015. |
| | | |
| BMO Financial Group 188th Annual Report 2005 | | 115 |
Notes to Consolidated Financial Statements
Note 184Capital Trust Securities
We issue BMO Capital Trust Securities (“BOaTS”) through our consolidated subsidiary BMO Capital Trust (the “Trust”). The proceeds of the BOaTS are used to purchase mortgages. Upon consolidation, the BOaTS are reported in our Consolidated Balance Sheet either as non-controlling interest in subsidiaries or as other liabilities, depending on the terms of the BOaTS. Holders of the
BOaTS are entitled to receive semi-annual non-cumulative fixed cash distributions as long as the Bank declares dividends on its preferred shares, or if no such shares are outstanding, on its common shares in accordance with ordinary Bank dividend practice. The terms of the BOaTS are as follows:
| | | | | | | | | | | | | | | | | | | |
| | | | | | | | | | | | | | |
| | | | | | | | | Redemption date | | Conversion date | | | | | | | | |
| (Canadian $ in millions, | | | | Distribution per | | | At the option | | At the option | | Principal amount |
| except Distribution) | | Distribution dates | | BMO BOaTS | | | of the Trust | | of the holder | | 2005 | | | 2004 | |
| |
Other Liabilities | | | | | | | | | | | | | | | | | | |
| Series A | | June 30, December 31 | | $ | 34.52 | | | December 31, 2005 | | December 31, 2010 | | $ | 350 | | | $ | 350 | |
| Series B | | June 30, December 31 | | | 33.24 | | | June 30, 2006 | | June 30, 2011 | | | 400 | | | | 400 | |
| Series C | | June 30, December 31 | | | 33.43 | | | December 31, 2006 | | June 30, 2012 | | | 400 | | | | 400 | |
| |
| | | | | | | | | | | | | | 1,150 | | | | 1,150 | |
| |
Non-Controlling Interest | | | | | | | | | | | | | | | | | | |
| Series D | | June 30, December 31 | | $ | 27.37 | (1) | | December 31, 2009 | | | | | 600 | | | | 600 | |
| Series E | | June 30, December 31 | | | 23.17 | (2) | | December 31, 2010 | | | | | 450 | | | | – | |
| |
| | | | | | | | | | | | | | 1,050 | | | | 600 | |
| |
| Total Capital Trust Securities | | | | | | | | | | | | $ | 2,200 | | | $ | 1,750 | |
| |
| | |
| (1) | | After December 31, 2014, the distribution will be at the Bankers’ Acceptance Rate plus 1.5%. |
| | |
| (2) | | After December 31, 2015, the distribution will be at the Bankers’ Acceptance Rate plus 1.5%. |
Redemption by the Trust
On or after the redemption dates indicated above, and subject to the prior approval of the Superintendent of Financial Institutions Canada, the Trust may redeem the BOaTS in whole without the consent of the holders.
Conversion by the Holder
On or after the conversion dates indicated above, the BOaTS Series A, B and C may be exchanged for the Bank’s Class B Preferred shares Series 7, 8 and 9, respectively, at the option of the holder.
Automatic Exchange
The BOaTS Series A, B, C, D and E will be automatically exchanged for 40 of the Bank’s Class B Preferred shares Series 7, 8, 9, 11 and 12, respectively, without the consent of the holder on the occurrence of specific events such as a wind-up of Bank of Montreal, a regulatory requirement to increase capital and violations of regulatory capital requirements.
Change in Accounting Policy
On November 1, 2004, we adopted the CICA’s new accounting requirements on the classification of financial instruments as liabilities or equity. The new rules require that our capital trust securities, which are ultimately convertible into a variable number of our common shares at the holders’ option, be classified as liabilities. We reclassified $1,150 million of our capital trust securities, Series A, B and C, previously recorded as non-controlling interest in subsidiaries in other liabilities, to capital trust securities. The distributions made on those capital trust securities are now recorded as interest expense.
We have restated prior years’ consolidated financial statements to be consistent with the new presentation. See Note 20 for the impact of this change in accounting policy on our consolidated financial statements.
Note 194Interest Rate Risk
We earn interest on interest bearing assets and we pay interest on interest bearing liabilities. We also have off-balance sheet financial instruments whose values are sensitive to changes in interest rates. To the extent that we have assets, liabilities and financial instruments maturing or repricing at different points in time, we are exposed to interest rate risk.
Interest Rate Gap Position
The determination of the interest rate sensitivity or gap position by necessity encompasses numerous assumptions. It is based on the earlier of the repricing or maturity date of assets, liabilities and derivatives used to manage interest rate risk.
The gap position presented is as at October 31 of each year. It represents the position outstanding at the close of the business day and may change significantly in subsequent periods based on customer behaviours and the application of our asset and liability management policies.
The assumptions for 2005 were as follows:
Assets
Fixed term assets, such as residential mortgage loans and consumer loans, are reported based upon the scheduled repayments and estimated prepayments that reflect expected borrower behaviour.
Trading and underwriting (mark-to-market) assets and interest bearing assets on which the customer interest rate changes with the prime rate or other short-term market rates are reported in the zero to three months category.
Fixed rate and non-interest bearing assets with no defined maturity are reported based upon expected account balance behaviour.
Deposits/Liabilities
Fixed rate liabilities, such as investment certificates, are reported at scheduled maturity with estimated redemptions that reflect expected depositor behaviour.
| | | |
| 116 | | BMO Financial Group 188th Annual Report 2005 |
Interest bearing deposits on which the customer interest rate changes with the prime rate or other short-term market rates are reported in the zero to three months category.
Fixed rate and non-interest bearing liabilities with no defined maturity are reported based upon expected account balance behaviour.
Capital
Common shareholders’ equity is reported as non-interest sensitive.
Yields
Yields are based upon the contractual interest rates in effect for the assets or liabilities on October 31, 2005.
| | | | | | | | | | | | | | | | | | | | | | | | | | | | | | | | | | | | | | | | | | | | | |
| Interest Rate Gap Position |
| (Canadian $ in millions) |
| | | | | | | | | | | | | | | Total | | | Effective | | | | | | | Effective | | | | | | | Effective | | | Non- | | | | |
| | | 0 to 3 | | | 4 to 6 | | | 7 to 12 | | | within | | | interest | | | 1 to 5 | | | interest | | | Over 5 | | | interest | | | interest | | | | |
| As at October 31 | | months | | | months | | | months | | | 1 year | | | rate (%) | | | years | | | rate (%) | | | years | | | rate (%) | | | sensitive | | | Total | |
| |
Canadian Dollar | | | | | | | | | | | | | | | | | | | | | | | | | | | | | | | | | | | | | | | | | | | | |
Assets | | | | | | | | | | | | | | | | | | | | | | | | | | | | | | | | | | | | | | | | | | | | |
| Cash resources | | $ | 2,238 | | | $ | 292 | | | $ | – | | | $ | 2,530 | | | | 3.09 | | | $ | 294 | | | | – | | | $ | – | | | | – | | | $ | (154 | ) | | $ | 2,670 | |
| Securities | | | 27,599 | | | | 72 | | | | 252 | | | | 27,923 | | | | 3.07 | | | | 785 | | | | 6.82 | | | | 68 | | | | 5.10 | | | | 169 | | | | 28,945 | |
| Securities borrowed or purchased under resale agreements | | | 16,084 | | | | 78 | | | | – | | | | 16,162 | | | | 2.96 | | | | – | | | | – | | | | – | | | | – | | | | – | | | | 16,162 | |
| Loans | | | 59,317 | | | | 3,461 | | | | 5,962 | | | | 68,740 | | | | 5.00 | | | | 32,580 | | | | 5.60 | | | | 2,731 | | | | 5.45 | | | | 5,891 | | | | 109,942 | |
| Other assets | | | 34,277 | | | | 253 | | | | 507 | | | | 35,037 | | | | na | | | | 4,056 | | | | na | | | | – | | | | na | | | | – | | | | 39,093 | |
| |
| Total assets | | | 139,515 | | | | 4,156 | | | | 6,721 | | | | 150,392 | | | | | | | | 37,715 | | | | | | | | 2,799 | | | | | | | | 5,906 | | | | 196,812 | |
| |
Liabilities and Shareholders’ Equity | | | | | | | | | | | | | | | | | | | | | | | | | | | | | | | | | | | | | | | | | | | | |
| Deposits | | | 59,794 | | | | 4,744 | | | | 8,278 | | | | 72,816 | | | | 2.18 | | | | 38,658 | | | | 2.24 | | | | 1,985 | | | | 4.65 | | | | – | | | | 113,459 | |
| Securities sold but not yet purchased | | | 15,323 | | | | – | | | | – | | | | 15,323 | | | | 3.00 | | | | – | | | | – | | | | – | | | | – | | | | – | | | | 15,323 | |
| Securities lent or sold under repurchase agreements | | | 8,877 | | | | – | | | | – | | | | 8,877 | | | | 2.93 | | | | – | | | | – | | | | – | | | | – | | | | – | | | | 8,877 | |
| Other liabilities | | | 32,828 | | | | 114 | | | | 227 | | | | 33,169 | | | | na | | | | 1,817 | | | | na | | | | 1,050 | | | | na | | | | 5,891 | | | | 41,927 | |
| Subordinated debt | | | – | | | | 125 | | | | 300 | | | | 425 | | | | 7.93 | | | | 1,740 | | | | 5.70 | | | | 1,550 | | | | 6.46 | | | | – | | | | 3,715 | |
| Shareholders’ equity | | | 26 | | | | – | | | | – | | | | 26 | | | | na | | | | – | | | | na | | | | 200 | | | | na | | | | 13,285 | | | | 13,511 | |
| |
| Total liabilities and shareholders’ equity | | | 116,848 | | | | 4,983 | | | | 8,805 | | | | 130,636 | | | | | | | | 42,215 | | | | | | | | 4,785 | | | | | | | | 19,176 | | | | 196,812 | |
| |
| On-balance sheet gap position | | | 22,667 | | | | (827 | ) | | | (2,084 | ) | | | 19,756 | | | | | | | | (4,500 | ) | | | | | | | (1,986 | ) | | | | | | | (13,270 | ) | | | – | |
| Off-balance sheet gap position | | | (18,731 | ) | | | 1,728 | | | | 1,705 | | | | (15,298 | ) | | | | | | | 11,523 | | | | | | | | 3,775 | | | | | | | | – | | | | – | |
| |
Total Canadian dollar interest rate gap position | | | | | | | | | | | | | | | | | | | | | | | | | | | | | | | | | | | | | | | | | | | | |
2005 | | $ | 3,936 | | | $ | 901 | | | $ | (379 | ) | | $ | 4,458 | | | | | | | $ | 7,023 | | | | | | | $ | 1,789 | | | | | | | $ | (13,270 | ) | | $ | – | |
| 2004 | | | 2,379 | | | | 990 | | | | 772 | | | | 4,141 | | | | | | | | 7,030 | | | | | | | | 972 | | | | | | | | (12,143 | ) | | | – | |
| |
| | | | | | | | | | | | | | | | | | | | | | | | | | | | | | | | | | | | | | | | | | | | | |
U.S. Dollar and Other Currencies | | | | | | | | | | | | | | | | | | | | | | | | | | | | | | | | | | | | | | | | | | | | |
Assets | | | | | | | | | | | | | | | | | | | | | | | | | | | | | | | | | | | | | | | | | | | | |
| Cash resources | | $ | 9,898 | | | $ | 4,618 | | | $ | 3,292 | | | $ | 17,808 | | | | 1.38 | | | $ | (122 | ) | | | 3.55 | | | $ | – | | | | – | | | $ | 365 | | | $ | 18,051 | |
| Securities | | | 20,400 | | | | 1,195 | | | | 1,785 | | | | 23,380 | | | | 0.37 | | | | 4,582 | | | | 0.28 | | | | 298 | | | | 0.98 | | | | 51 | | | | 28,311 | |
| Securities borrowed or purchased under resale agreements | | | 11,446 | | | | – | | | | 672 | | | | 12,118 | | | | 0.61 | | | | – | | | | – | | | | – | | | | – | | | | – | | | | 12,118 | |
| Loans | | | 22,635 | | | | 1,016 | | | | 1,725 | | | | 25,376 | | | | 0.94 | | | | 8,812 | | | | 0.70 | | | | 1,329 | | | | 0.07 | | | | 598 | | | | 36,115 | |
| Other assets | | | 1,514 | | | | 236 | | | | 413 | | | | 2,163 | | | na | | | | 3,959 | | | | na | | | | – | | | | na | | | | 3 | | | | 6,125 | |
| |
| Total assets | | | 65,893 | | | | 7,065 | | | | 7,887 | | | | 80,845 | | | | | | | | 17,231 | | | | | | | | 1,627 | | | | | | | | 1,017 | | | | 100,720 | |
| |
Liabilities and Shareholders’ Equity | | | | | | | | | | | | | | | | | | | | | | | | | | | | | | | | | | | | | | | | | | | | |
| Deposits | | | 60,564 | | | | 3,308 | | | | 2,526 | | | | 66,398 | | | | 2.69 | | | | 13,733 | | | | 0.33 | | | | 170 | | | | 0.16 | | | | 33 | | | | 80,334 | |
| Securities sold but not yet purchased | | | 819 | | | | – | | | | – | | | | 819 | | | | 3.61 | | | | – | | | | – | | | | – | | | | – | | | | – | | | | 819 | |
| Securities lent or sold under repurchase agreements | | | 13,778 | | | | 1 | | | | 1 | | | | 13,780 | | | | 0.53 | | | | – | | | | – | | | | – | | | | – | | | | – | | | | 13,780 | |
| Other liabilities | | | 3,795 | | | | (101 | ) | | | 44 | | | | 3,738 | | | | na | | | | 742 | | | | na | | | | – | | | | na | | | | 598 | | | | 5,078 | |
| Subordinated debt | | | – | | | | – | | | | – | | | | – | | | | – | | | | 354 | | | | 7.80 | | | | – | | | | – | | | | – | | | | 354 | |
| Shareholders’ equity | | | – | | | | – | | | | – | | | | – | | | | na | | | | – | | | | na | | | | 355 | | | | na | | | | – | | | | 355 | |
| |
| Total liabilities and shareholders’ equity | | | 78,956 | | | | 3,208 | | | | 2,571 | | | | 84,735 | | | | | | | | 14,829 | | | | | | | | 525 | | | | | | | | 631 | | | | 100,720 | |
| |
| On-balance sheet gap position | | | (13,063 | ) | | | 3,857 | | | | 5,316 | | | | (3,890 | ) | | | | | | | 2,402 | | | | | | | | 1,102 | | | | | | | | 386 | | | | – | |
| Off-balance sheet gap position | | | 1,177 | | | | (109 | ) | | | (260 | ) | | | 808 | | | | | | | | (99 | ) | | | | | | | (709 | ) | | | | | | | – | | | | – | |
| |
Total U.S. dollar and other currencies interest rate gap position | | | | | | | | | | | | | | | | | | | | | | | | | | | | | | | | | | | | | | | | | | | | |
2005 | | $ | (11,886 | ) | | $ | 3,748 | | | $ | 5,056 | | | $ | (3,082 | ) | | | | | | $ | 2,303 | | | | | | | $ | 393 | | | | | | | $ | 386 | | | $ | – | |
| 2004 | | | (13,227 | ) | | | 3,526 | | | | 4,650 | | | | (5,051 | ) | | | | | | | 2,082 | | | | | | | | 2,802 | | | | | | | | 167 | | | | – | |
| |
| | | |
| BMO Financial Group 188th Annual Report 2005 | | 117 |
Notes to Consolidated Financial Statements
Note 204Share Capital
| | | | | | | | | | | | | | | | | | | | | | | | | | | | | | | | | | | | | |
| Outstanding | | | | | | | | | |
| (Canadian $ in millions, except as noted) | | 2005 | | | 2004 | | | 2003 | |
| | | | | | | | | | | Dividends | | | | | | | | | | | Dividends | | | | | | | | | | | Dividends | |
| | | Number | | | | | | | declared | | | Number | | | | | | | declared | | | Number | | | | | | | Declared | |
| | | of shares | | | Amount | | | per share | | | of shares | | | Amount | | | per share | | | of shares | | | Amount | | | per share | |
| |
Preferred Shares – Classified as Liabilities | | | | | | | | | | | | | | | | | | | | | | | | | | | | | | | | | | | |
| Class B – Series 3 | | – | | | $ | – | | | $ | – | | | | – | | | $ | – | | | $ | 1.18 | | | | 16,000,000 | | | $ | 400 | | | $ | 1.39 | |
| Class B – Series 4 | | 8,000,000 | | | | 200 | | | | 1.20 | | | | 8,000,000 | | | | 200 | | | | 1.20 | | | | 8,000,000 | | | | 200 | | | | 1.20 | |
| Class B – Series 6 | | 10,000,000 | | | | 250 | | | | 1.19 | | | | 10,000,000 | | | | 250 | | | | 1.19 | | | | 10,000,000 | | | | 250 | | | | 1.19 | |
| |
Preferred Shares – Classified as Liabilities | | | | | | 450 | | | | | | | | | | | | 450 | | | | | | | | | | | | 850 | | | | | |
| |
| | | | | | | | | | | | | | | | | | | | | | | | | | | | | | | | | | | | | |
Preferred Shares – Classified as Equity | | | | | | | | | | | | | | | | | | | | | | | | | | | | | | | | | | | | |
| Class B – Series 5 | | 8,000,000 | | | $ | 200 | | | $ | 1.33 | | | | 8,000,000 | | | $ | 200 | | | $ | 1.33 | | | | 8,000,000 | | | $ | 200 | | | $ | 1.33 | |
| Class B – Series 10 | | | 12,000,000 | | | | 396 | | US | $ | 1.49 | | | | 12,000,000 | | | | 396 | | US | $ | 1.49 | | | | 12,000,000 | | | | 396 | | US | $ | 1.49 | |
| |
Preferred Shares – Classified as Equity | | | | | | | 596 | | | | | | | | | | | | 596 | | | | | | | | | | | | 596 | | | | | |
| |
Common Shares | | | 500,219,068 | | | | 4,022 | | | $ | 1.85 | | | | 500,896,857 | | | | 3,857 | | | $ | 1.59 | | | | 499,632,368 | | | | 3,662 | | | $ | 1.34 | |
| |
| Share Capital | | | | | | $ | 4,618 | | | | | | | | | | | $ | 4,453 | | | | | | | | | | | $ | 4,258 | | | | | |
| |
Preferred Shares
We are authorized by our shareholders to issue an unlimited number of Class A Preferred shares and Class B Preferred shares without par value, in series, for unlimited consideration. Class B Preferred shares may be issued in a foreign currency.
During the year ended October 31, 2004, we redeemed all of our Class B Preferred shares, Series 3, at a price of $25.50 per share plus any declared and unpaid dividends. The excess of the redemption price over carrying value of $8 million was charged to retained earnings in preferred share dividends.
Preferred Share Rights and Privileges
Class B – Series 4 shares are redeemable at our option starting August 25, 2005 for $25.00 cash per share, plus a premium if we redeem the shares before August 25, 2007, or an equivalent value of our common shares. They are convertible at the shareholder’s option starting May 25, 2008 into our common shares; however, we have the right to pay $25.00 cash per share instead. The shares carry a non-cumulative quarterly dividend of $0.30 per share.
Class B – Series 5 shares are redeemable at our option starting February 25, 2013 for $25.00 cash per share, and are not convertible. The shares carry a non-cumulative quarterly dividend of $0.33125 per share.
Class B – Series 6 shares are redeemable at our option starting November 25, 2005 for $25.00 cash per share, plus a premium if we redeem the shares before November 25, 2007, or an equivalent value of our common shares. They are convertible at the shareholder’s option starting November 25, 2008 into our common shares; however, we have the right to pay $25.00 cash per share instead. The shares carry a non-cumulative quarterly dividend of $0.296875 per share.
Class B – Series 10 shares are redeemable at our option starting February 25, 2012 for US$25.00 cash per share, and are convertible at our option starting February 25, 2012 into our common shares. The shares carry a non-cumulative quarterly dividend of US$0.371875 per share.
Common Shares
We are authorized by our shareholders to issue an unlimited number of our common shares, without par value, for unlimited consideration. Our common shares are not redeemable or convertible. Dividends are declared by us on a quarterly basis and the amount can vary from quarter to quarter.
Normal Course Issuer Bid
On September 7, 2005, we commenced a normal course issuer bid, effective for one year. Under this bid, we may repurchase up to 15,000,000 common shares, approximately 3% of our outstanding common shares.
We participated in a normal course issuer bid during the period from August 10, 2004 to August 6, 2005, under which we were able to repurchase up to 15,000,000 common shares, approximately 3% of our then outstanding common shares.
During the year ended October 31, 2005, we repurchased 6,957,800 shares at an average cost of $56.04 per share, totalling $390 million. During the year ended October 31, 2004, we repurchased 6,220,500 shares at an average cost of $53.63 per share, totalling $333 million.
Issuances Exchangeable into Common Shares
One of our subsidiaries, Bank of Montreal Securities Canada Limited (“BMSCL”), has issued various classes of non-voting shares that can be exchanged at the option of the holder for our common shares, based on a formula. If all of these BMSCL shares had been converted into our common shares, up to 361,397, 646,383 and 771,212 of our common shares would have been needed to complete the exchange as at October 31, 2005, 2004 and 2003, respectively.
Share Redemption and Dividend Restrictions
The Superintendent of Financial Institutions Canada must approve any plan to redeem any of our preferred share issues for cash.
We are prohibited from declaring dividends on our preferred or common shares when we would be, as a result of paying such a dividend, in contravention of the capital adequacy, liquidity or any other regulatory directives issued under theBank Act. In addition, common share dividends cannot be paid unless all dividends declared and payable on our preferred shares have been paid or sufficient funds have been set aside to do so.
In addition, we have agreed that if BMO Capital Trust, one of our subsidiaries, fails to pay any required distribution on its capital trust securities, we will not declare dividends of any kind on any of our preferred or common shares for a period of time following the Trust’s failure to pay the required distribution (as defined in the capital trust securities’ prospectuses) unless the Trust first pays such distribution to the holders of capital trust securities (see Note 18).
Shareholder Dividend Reinvestment and Share Purchase Plan
We offer a dividend reinvestment and share purchase plan for our shareholders. Participation in the plan is optional. Under the terms of the plan, cash dividends on common shares are reinvested to purchase additional common shares. Shareholders also have the
| | | |
| 118 | | BMO Financial Group 188th Annual Report 2005 |
opportunity to make optional cash payments to acquire additional common shares. We may issue these common shares at an average of the closing prices of the Bank’s common shares on the Toronto Stock Exchange based on the five trading days prior to the last business day of the month or we may purchase them on the open market at market price. During the year, we issued a total of 1,258,463 common shares (1,120,931 in 2004) under the plan.
Potential Share Issuances
As at October 31, 2005, we had reserved 4,646,625 common shares for potential issuance in respect of our Shareholder Dividend Reinvestment and Share Purchase Plan and 5,081,508 common shares in respect of the exchange of certain shares of BMSCL. We also have reserved 30,169,925 common shares for the potential exercise of stock options, as further described in Note 21.
Issued on the Acquisition of a Business
In 2003, 634,551 common shares at a value of $27 million were issued in connection with the acquisition of Gerard Klauer Mattison & Co., Inc.
Change in Accounting Policy
On November 1, 2004, we adopted the CICA’s new accounting requirements on the classification of financial instruments as liabilities or equity. The new rules require that our preferred shares and capital trust securities, which are ultimately convertible into a variable number of our common shares at the holders’ option, be classified as liabilities. We reclassified $450 million of our Class B Preferred shares Series 4 and 6 from share capital to preferred share liability. In addition, we also reclassified $1,150 million of our capital trust securities, Series A, B and C, previously recorded as
non-controlling interest in subsidiaries in other liabilities, to capital trust securities. The dividends declared on those preferred shares as well as the distributions made on those capital trust securities are now recorded as interest expense. This change did not impact earnings per share or net income available to common shareholders since preferred share dividends are deducted from net income in determining those measures.
We have restated prior years’ consolidated financial statements to be consistent with the new presentation. The impact of this change in accounting policy on our consolidated financial statements for the current and prior years is as follows:
| | | | | | | | | | | | | |
| (Canadian $ in millions) | | 2005 | | | 2004 | | | 2003 | |
| |
| Increase (decrease) | | | | | | | | | | | | |
Consolidated Statement of Income | | | | | | | | | | | | |
| Interest Expense – Preferred shares and capital trust securities | | $ | (97 | ) | | $ | (124 | ) | | $ | (122 | ) |
| Non-controlling interest in subsidiaries | | | 42 | | | | 43 | | | | 42 | |
| Income taxes | | | 37 | | | | 36 | | | | 36 | |
| |
| Net Income | | | (18 | ) | | | (45 | ) | | | (44 | ) |
| Preferred share dividends | | | 18 | | | | 45 | | | | 44 | |
| |
| Net income available to common shareholders | | $ | – | | | $ | – | | | $ | – | |
| |
| | | | | | | | | | | | | |
| Increase (decrease) | | | | | | | | | | | | |
Consolidated Balance Sheet | | | | | | | | | | | | |
| Preferred Share Liability | | $ | 450 | | | $ | 450 | | | $ | 850 | |
| Capital Trust Securities | | | 1,150 | | | | 1,150 | | | | 1,150 | |
| Other Liabilities | | | (1,150 | ) | | | (1,150 | ) | | | (1,150 | ) |
| Share capital | | | (450 | ) | | | (450 | ) | | | (850 | ) |
| |
Note 214Employee Compensation – Stock-Based Compensation
Stock Option Plan
We maintain a Stock Option Plan for designated officers, employees and directors. The options granted under the plan from 1995 to 1999 all vest five fiscal years from November 1 of the year in which the options were granted to the officer or employee, if we have met
certain performance targets. The options granted since 1999 vest 25% per year over a four-year period starting from their grant date. A portion of the options granted since 1999 can only be exercised once certain performance targets are met. All options expire 10 years from the date they are granted.
The following table summarizes information about our Stock Option Plan:
| | | | | | | | | | | | | | | | | | | | | | | | | |
| (Canadian $, except as noted) | | 2005 | | | 2004 | | | 2003 | |
| | | Number | | | Weighted- | | | Number | | | Weighted- | | | Number | | | Weighted- | |
| | | of stock | | | average | | | of stock | | | average | | | of stock | | | average | |
| | | options | | | exercise price | | | options | | | exercise price | | | options | | | exercise price | |
| |
| Outstanding at beginning of year | | | 30,442,060 | | | $ | 33.87 | | | | 35,212,440 | | | $ | 31.89 | | | | 38,374,627 | | | $ | 30.21 | |
| Granted | | | 1,471,764 | | | | 56.60 | | | | 1,645,900 | | | | 53.93 | | | | 2,244,800 | | | | 40.90 | |
| Exercised | | | 4,736,826 | | | | 29.30 | | | | 6,239,301 | | | | 27.77 | | | | 5,325,916 | | | | 23.45 | |
| Forfeited/cancelled | | | 257,649 | | | | 36.77 | | | | 176,979 | | | | 35.22 | | | | 81,071 | | | | 34.00 | |
| |
| Outstanding at end of year | | | 26,919,349 | | | | 35.86 | | | | 30,442,060 | | | | 33.87 | | | | 35,212,440 | | | | 31.89 | |
| Exercisable at end of year | | | 20,016,144 | | | | 32.68 | | | | 21,102,433 | | | | 30.94 | | | | 13,337,147 | | | | 28.29 | |
| Available for grant | | | 3,397,576 | | | | | | | | 4,611,691 | | | | | | | | 6,080,612 | | | | | |
| Outstanding stock options as a % of outstanding shares | | | 5.38% | | | | | | | | 6.08% | | | | | | | | 7.05% | | | | | |
| |
| | |
| No stock options expired during the years ended October 31, 2005, 2004 and 2003. |
Options outstanding and options exercisable as at October 31, 2005 by range of exercise price are as follows:
| | | | | | | | | | | | | | | | | | | | | |
| (Canadian $, except as noted) | | | | | | Options outstanding | | | Options exercisable | |
| | | | | | | Weighted- | | | | | | | | | | |
| | | | | | | average | | | | | | | | | | |
| | | Number | | | remaining | | | Weighted- | | | Number | | | Weighted- | |
| | | of stock | | | contractual life | | | average | | | of stock | | | average | |
| Range of exercise prices | | options | | | (years) | | | exercise price | | | options | | | exercise price | |
| |
| $15.50 to $20.00 | | | 690,304 | | | | 0.8 | | | $ | 19.18 | | | | 690,304 | | | $ | 19.18 | |
| $20.01 to $30.00 | | | 4,280,516 | | | | 4.0 | | | $ | 25.60 | | | | 4,280,516 | | | $ | 25.60 | |
| $30.01 to $40.00 | | | 16,665,861 | | | | 4.7 | | | $ | 34.99 | | | | 14,182,457 | | | $ | 34.78 | |
| $40.01 to $56.60 | | | 5,282,668 | | | | 7.7 | | | $ | 49.10 | | | | 862,867 | | | $ | 44.03 | |
| |
| | | |
| BMO Financial Group 188th Annual Report 2005 | | 119 |
Notes to Consolidated Financial Statements
Change in Accounting Policy
On November 1, 2002, we changed our accounting policy for stock options granted on or after that date. Under the new policy, we determine the fair value of stock options on their grant date and record this amount as compensation expense over the period that the stock options vest, with a corresponding increase to contributed surplus. When these stock options are exercised, we record the amount of proceeds, together with the amount recorded in contributed surplus, in share capital.
We determine the fair value of options granted using a trinomial option pricing model. The weighted-average fair value of options granted during the years ended October 31, 2005, 2004 and 2003 was $10.34, $10.63 and $7.85, respectively. The following weighted-average assumptions were used to determine the fair value of options on the date of grant:
| | | | | | | | | | | | | |
| | | 2005 | | | 2004 | | | 2003 | |
| |
| Expected dividend yield | | | 3.1 | % | | | 2.6 | % | | | 3.2 | % |
| Expected share price volatility | | | 22.8 | % | | | 23.2 | % | | | 23.4 | % |
| Risk-free rate of return | | | 4.2 | % | | | 4.8 | % | | | 4.8 | % |
| Expected period until exercise | | 7.1 years | | 7.1 years | | 7.1 years |
| |
| | |
| Changes to the input assumptions can result in materially different fair value estimates. |
We do not record any compensation expense for stock options granted in prior years. When these stock options are exercised, we include the amount of proceeds in share capital. The impact on our net income and earnings per share if we had always recorded stock option expense based on the fair value of all of our outstanding stock options on their grant date is as follows:
| | | | | | | | | | | | | |
| (Canadian $ in millions, except as noted) | | 2005 | | | 2004 | | | 2003 | |
| |
| Stock option expense included in employee compensation expense | | $ | 10 | | | $ | 7 | | | $ | 3 | |
| |
| Net income, as reported | | $ | 2,400 | | | $ | 2,306 | | | $ | 1,781 | |
| Additional expense that would have been recorded if we had expensed the fair value of all outstanding stock options granted before November 1, 2002 | | | 11 | | | | 29 | | | | 43 | |
| |
| Net income, pro forma | | $ | 2,389 | | | $ | 2,277 | | | $ | 1,738 | |
| |
| Earnings per share (Canadian $) | | | | | | | | | | | | |
| Basic, as reported | | $ | 4.74 | | | $ | 4.53 | | | $ | 3.51 | |
| Basic, pro forma | | | 4.72 | | | | 4.48 | | | | 3.43 | |
| Diluted, as reported | | | 4.64 | | | | 4.42 | | | | 3.44 | |
| Diluted, pro forma | | | 4.62 | | | | 4.36 | | | | 3.35 | |
| |
Other Stock-Based Compensation Plans
Share Purchase Plan
We offer our employees the option of contributing a portion of their gross salary toward the purchase of our common shares. For employee contributions up to 6% of their individual gross salaries, we match 50% of their contributions. The shares in the employee share purchase plan are purchased on the open market and are considered outstanding for purposes of computing earnings per share. The dividends earned on Bank common shares held by the employee share purchase plan are used to purchase additional common shares on the open market.
We account for our contribution as employee compensation expense when it is contributed to the plan.
Employee compensation expense related to this plan for the years ended October 31, 2005, 2004 and 2003 was $33 million, $32 million and $29 million, respectively. There were 12,184,377, 11,445,595 and 10,676,918 common shares outstanding held in this plan for the years ended October 31, 2005, 2004 and 2003, respectively.
Mid-Term Incentive Plans
We offer mid-term incentive plans for executives and certain senior employees. Depending on the plan, these pay either a single cash payment at the end of the three-year period of the plan, or three annual cash payments in each of the three years of the plan. The amount of the incentive payment is adjusted to reflect dividends and changes in the market value of our common shares. For the majority of executives and some senior employee grants, a portion of the incentive payment also varies based on performance targets driven by annualized total shareholder return compared with that of our competitors.
We entered into agreements with third parties to assume most of our obligations related to these plans in exchange for cash payments of $187 million, $173 million and $105 million in the years ended October 31, 2005, 2004 and 2003, respectively. Amounts paid under these agreements were recorded in the Consolidated Balance Sheet in other assets and are recorded as employee compensation expense evenly over the period until payment to employees. We no longer have any liability related to these plans because any future payments required will be the responsibility of the third parties. The amount deferred and recorded in other assets in our Consolidated Balance Sheet totalled $142 million and $133 million as at October 31, 2005 and 2004, respectively.
For the remaining obligations relating to plans for which we have not entered into agreements with third parties, the amount of compensation expense is amortized over the period until payment to employees to reflect the current market value of our common shares and our total shareholder return compared with that of our competitors.
Employee compensation expense related to these plans for the years ended October 31, 2005, 2004 and 2003 was $169 million, $143 million and $97 million, respectively.
Deferred Bonus Plans
We offer deferred bonus plans for certain senior executives and certain key employees in our Investment Banking and Private Client Groups. Under these plans, payment of annual incentive payments and/or commissions can be deferred as stock units of our common shares. The amount of deferred incentive payments and/or commissions is adjusted to reflect dividends and changes in the market value of our common shares.
Depending on the plan, deferred incentive payments can be paid either upon retirement/resignation, over the three-year period of the plan or at the end of the three-year period of the plan. The deferred incentive payments can be paid in cash, shares or a combination of both.
Employee compensation expense for these plans is recorded in the year the incentive payment and/or commission is earned. Changes in the amount of the incentive payment payable as a result of dividends and share price movements are recorded as employee compensation expense in the period of the change.
We have entered into derivative instruments in order to hedge our exposure to these plans. Changes in the fair value of these derivatives are recorded as employee compensation expense in the period in which they arise.
Liabilities related to these plans were recorded in other liabilities in our Consolidated Balance Sheet and totalled $177 million and $218 million as at October 31, 2005 and 2004, respectively.
Employee compensation expense related to these plans for the years ended October 31, 2005, 2004 and 2003 was $4 million, $4 million and $26 million, respectively, net of the impact of hedging.
| | | |
| 120 | | BMO Financial Group 188th Annual Report 2005 |
Note 224Employee Compensation – Employee Future Benefits
Pension and Other Employee Future Benefit Plans
We have a number of arrangements in Canada, the United States and the United Kingdom that provide pension and other employee future benefits to our retired and current employees.
Pension arrangements include defined benefit statutory pension plans as well as supplemental arrangements, which provide pension benefits in excess of statutory limits. Generally, under these plans we provide retirement benefits based on an employee’s years of service and average annual earnings over a period of time prior to retirement. We are responsible for ensuring that the statutory pension plans have sufficient assets to pay the pension benefits upon retirement of employees. Voluntary contributions can be made by employees but are not required.
We also provide defined contribution pension plans to employees in some of our subsidiaries. Under these plans, we are responsible for contributing a predetermined amount to a participant’s retirement savings, based on a percentage of that employee’s salary. We recognize the cost of our defined contribution pension plans in employee compensation expense as the employees work for us.
We also provide other employee future benefits, including health and dental care benefits and life insurance for current and retired employees.
Pension and Other Employee Future Benefit Liabilities
We have two types of benefit liabilities: our defined benefit pension liabilities and our other employee future benefit liabilities. These benefit liabilities represent the amount of pension and other employee future benefits that our employees and retirees have earned as at year end.
Our actuaries perform valuations of our benefit liabilities for pension and other employee future benefits as at October 31 of each year for our Canadian plans (September 30 for our U.S. plans), using the projected benefit method prorated on service, based on management’s assumptions about discount rates, salary growth, retirement age, mortality and health care cost trend rates. The discount rate is determined by management with reference to market conditions at year end. Other assumptions are determined with reference to long-term expectations.
Components of the change in our benefit liabilities year over year and our pension and other employee future benefit expense are as follows:
Benefits earned by employeesrepresent benefits earned in the current year. They are determined with reference to the current workforce and the amount of benefits to which they will be entitled upon retirement, based on the provisions of our benefit plans.
Interest cost on the benefit liabilitiesrepresents the increase in the liability that results from the passage of time.
Actuarial gains or lossesmay arise in two ways. First, each year our actuaries recalculate the benefit liabilities and compare them to those estimated as at the prior year end. Any differences that result from changes in assumptions or from plan experience being different from what was expected by management at the previous year end are considered actuarial gains or losses.
Secondly, actuarial gains and losses arise when there are differences between expected and actual returns on plan assets.
At the beginning of each year, we determine whether the unrecognized actuarial gain or loss is more than 10% of the greater of our plan asset or benefit liability balances. Any unrecognized actuarial gain or loss in excess of this 10% threshold is recognized in expense over the remaining service period of active employees. Amounts below the 10% threshold are not recognized in income.
Plan amendmentsare changes in our benefit liabilities as a result of changes to provisions of the plans. These amounts are recognized in expense over the remaining service period of active employees.
Expected return on assetsrepresents management’s best estimate of the long-term rate of return on plan assets applied to the fair value of plan assets. We establish our estimate of the expected rate of return on plan assets based on the fund’s target asset allocation and estimated rates of return for each asset class. Estimated rates of return are based on expected returns from fixed income securities, which take into consideration bond yields. An equity risk premium is then applied to estimate equity returns. Returns from other asset classes are set to reflect the relative risks of these classes as compared to fixed income and equity assets. Differences between expected and actual return on assets are included in our actuarial gain or loss balance, as described above.
Settlementsoccur when benefit liabilities for plan participants are settled, usually through lump sum cash payments, and as a result we no longer have a liability to provide them with benefit payments in the future.
Funding of Pension and Other Employee Future Benefit Plans
We make cash contributions to our statutory pension plans. The actual and target asset allocations are set out on the following page. The investment policy for the main Canadian pension plan assets is to have a diversified mix of quality investments that is expected to provide a superior real rate of return over the long term, while limiting performance volatility. We also have a retirement compensation arrangement that partially funds supplemental pension benefits in Canada. However, pension payments related to this plan are paid directly by the Bank. Retirement benefits for our supplemental plans in the United States are also paid directly by the Bank. Our other employee future benefit liability in the United States is partially funded; and our other employee future benefit liability in Canada is unfunded. Benefits in connection with our other employee future benefit plans are paid directly by the Bank.
We measure the fair value of plan assets as at October 31 for our Canadian plans (September 30 for our U.S. plans). In addition to actuarial valuations for accounting purposes, we are required to prepare valuations for determining our pension contributions (our “funding valuation”). The most recent funding valuation for our main Canadian plan was performed as at October 31, 2005. We are required to file funding valuations for that plan with the Office of the Superintendent of Financial Institutions Canada at least every three years. An annual funding valuation is required for our U.S. statutory plan. The most recent valuation was performed as at January 1, 2005.
The benefit liability and the fair value of plan assets in respect of plans that are not fully funded are as follows:
| | | | | | | | | | | | | | | | | | | | | | | | | |
| (Canadian $ in millions) | | Pension benefit plans | | | Other employee future benefit plans | |
| | | 2005 | | | 2004 | | | 2003 | | | 2005 | | | 2004 | | | 2003 | |
| |
| Accrued benefit liability | | $ | 959 | | | $ | 865 | | | $ | 883 | | | $ | 852 | | | $ | 741 | | | $ | 711 | |
| Fair value of plan assets | | | 693 | | | | 607 | | | | 544 | | | | 66 | | | | 58 | | | | 55 | |
| |
| Unfunded benefit liability | | $ | 266 | | | $ | 258 | | | $ | 339 | | | $ | 786 | | | $ | 683 | | | $ | 656 | |
| |
| | | |
| BMO Financial Group 188th Annual Report 2005 | | 121 |
Notes to Consolidated Financial Statements
Asset Allocations
Plan assets are rebalanced within ranges around target allocations. Allocations as at the end of each year and the target allocations for October 31 are as follows:
| | | | | | | | | | | | | | | | | | | | | | | | | | | | | | | | | |
| | | Funded pension benefit plans (1) | | | Funded other employee future benefit plans | |
| | | Target | | | Actual | | | Actual | | | Actual | | | Target | | | Actual | | | Actual | | | Actual | |
| | | 2005 | | | 2005 | | | 2004 | | | 2003 | | | 2005 | | | 2005 | | | 2004 | | | 2003 | |
| |
| Equities | | | 51 | % | | | 50 | % | | | 47 | % | | | 45 | % | | | 65 | % | | | 67 | % | | | 70 | % | | | 61 | % |
| Fixed income investments | | | 35 | % | | | 38 | % | | | 40 | % | | | 42 | % | | | 35 | % | | | 33 | % | | | 30 | % | | | 30 | % |
| Other | | | 14 | % | | | 12 | % | | | 13 | % | | | 13 | % | | | – | | | | – | | | | – | | | | 9 | % |
| |
| | |
| (1) Excludes the Canadian supplementary plan whose assets are fully invested in fixed income investments. |
Pension and Other Employee Future Benefit Expenses
Pension and other employee future benefit expenses are determined as follows:
| | | | | | | | | | | | | | | | | | | | | | | | | |
| (Canadian $ in millions, except as noted) | | Pension benefit plans | | | Other employee future benefit plans | |
| | | 2005 | | | 2004 | | | 2003 | | | 2005 | | | 2004 | | | 2003 | |
| |
Annual Benefits Expense | | | | | | | | | | | | | | | | | | | | | | | | |
| Benefits earned by employees | | $ | 127 | | | $ | 120 | | | $ | 111 | | | $ | 17 | | | $ | 16 | | | $ | 17 | |
| Interest cost on accrued benefit liability | | | 205 | | | | 201 | | | | 196 | | | | 46 | | | | 44 | | | | 38 | |
| Actuarial loss recognized in expense | | | 69 | | | | 77 | | | | 62 | | | | 10 | | | | 10 | | | | – | |
| Amortization of plan amendment costs | | | 4 | | | | 2 | | | | 3 | | | | (7 | ) | | | (7 | ) | | | – | |
| Loss realized on settlement of a portion of the benefit liability | | | – | | | | – | | | | 4 | | | | – | | | | – | | | | – | |
| Expected return on plan assets | | | (230 | ) | | | (213 | ) | | | (217 | ) | | | (5 | ) | | | (4 | ) | | | (4 | ) |
| |
| Annual benefits expense | | | 175 | | | | 187 | | | | 159 | | | | 61 | | | | 59 | | | | 51 | |
| Canada and Quebec pension plan expense | | | 45 | | | | 45 | | | | 44 | | | | – | | | | – | | | | – | |
| Defined contribution expense | | | 11 | | | | 11 | | | | 10 | | | | – | | | | – | | | | – | |
| |
| Total annual pension and other employee future benefit expenses recognized in the Consolidated Statement of Income | | $ | 231 | | | $ | 243 | | | $ | 213 | | | $ | 61 | | | $ | 59 | | | $ | 51 | |
| |
| | | | | | | | | | | | | | | | | | | | | | | | | |
The impact on annual benefits expense if we had recognized all costs and expenses as they arose | | | | | | | | | | | | | | | | | | | | | | | | |
| Total annual pension and other employee future benefit expenses recognized in the Consolidated Statement of Income | | $ | 231 | | | $ | 243 | | | $ | 213 | | | $ | 61 | | | $ | 59 | | | $ | 51 | |
| (Excess) of actual returns over expected returns on plan assets | | | (141 | ) | | | (118 | ) | | | (6 | ) | | | (5 | ) | | | (4 | ) | | | (6 | ) |
| (Excess) shortfall of actuarial (gains) losses amortized over actuarial (gains) losses arising | | | 320 | | | | 1 | | | | 97 | | | | 59 | | | | (10 | ) | | | 170 | |
| (Excess) shortfall of plan amendment costs amortized over plan amendment costs arising | | | 11 | | | | 17 | | | | (3 | ) | | | 7 | | | | 7 | | | | (66 | ) |
| |
| Total pro forma annual pension and other employee future benefit costs if we had recognized all costs and benefits during the year | | $ | 421 | | | $ | 143 | | | $ | 301 | | | $ | 122 | | | $ | 52 | | | $ | 149 | |
| |
| | | | | | | | | | | | | | | | | | | | | | | | | |
Weighted-average assumptions used to determine benefit expenses | | | | | | | | | | | | | | | | | | | | | | | | |
| Estimated average service period of active employees (in years) | | | 10 | | | | 10 | | | | 11 | | | | 12 | | | | 13 | | | | 14 | |
| Discount rate at beginning of year | | | 6.0% | | | | 6.2% | | | | 6.5% | | | | 6.2% | | | | 6.4% | | | | 6.7% | |
| Expected long-term rate of return on plan assets | | | 6.7% | | | | 6.7% | | | | 6.9% | | | | 8.0% | | | | 8.0% | | | | 8.0% | |
| Rate of compensation increase | | | 3.9% | | | | 4.0% | | | | 4.2% | | | | 3.9% | | | | 4.1% | | | | 3.7% | |
| Assumed overall health care cost trend rate | | | na | | | | na | | | | na | | | | 8.0% | (1) | | | 8.4% | (1) | | | 5.3% | (2) |
| |
| | |
| (1) Trending to 4.5% in 2013 and remaining at that level thereafter. |
| |
| (2) Trending to 4.4% in 2013 and remaining at that level thereafter. |
| |
| na – not applicable |
| | | |
| 122 | | BMO Financial Group 188th Annual Report 2005 |
Changes in the estimated financial positions of our pension benefit plans and other employee future benefit plans are as follows:
| | | | | | | | | | | | | | | | | | | | | | | | | |
| (Canadian $ in millions, except as noted) | | Pension benefit plans | | | Other employee future benefit plans | |
| | | 2005 | | | 2004 | | | 2003 | | | 2005 | | | 2004 | | | 2003 | |
| |
Benefit liability | | | | | | | | | | | | | | | | | | | | | | | | |
| Benefit liability at beginning of year | | $ | 3,479 | | | $ | 3,300 | | | $ | 3,157 | | | $ | 741 | | | $ | 711 | | | $ | 595 | |
| Benefits earned by employees | | | 127 | | | | 120 | | | | 111 | | | | 17 | | | | 16 | | | | 17 | |
| Interest cost on benefit liability | | | 205 | | | | 201 | | | | 196 | | | | 46 | | | | 44 | | | | 38 | |
| Benefits paid to pensioners and employees | | | (185 | ) | | | (190 | ) | | | (195 | ) | | | (19 | ) | | | (23 | ) | | | (25 | ) |
| Voluntary employee contributions | | | 6 | | | | 5 | | | | 5 | | | | – | | | | – | | | | – | |
| Loss on the benefit liability arising from changes in assumptions (a) | | | 389 | | | | 78 | | | | 159 | | | | 69 | | | | – | | | | 170 | |
| Plan amendments | | | 15 | | | | 19 | | | | – | | | | – | | | | – | | | | (66 | ) |
| Reduction in liability due to partial settlement | | | – | | | | – | | | | (15 | ) | | | – | | | | – | | | | – | |
| Other, primarily foreign exchange | | | (23 | ) | | | (54 | ) | | | (118 | ) | | | (2 | ) | | | (7 | ) | | | (18 | ) |
| |
| Benefit liability at end of year | | $ | 4,013 | | | $ | 3,479 | | | $ | 3,300 | | | $ | 852 | | | $ | 741 | | | $ | 711 | |
| |
Weighted-average assumptions used to determine the benefit liability | | | | | | | | | | | | | | | | | | | | |
| Discount rate at end of year | | | 5.3 | % | | | 6.0 | % | | | 6.2 | % | | | 5.5 | % | | | 6.2 | % | | | 6.4 | % |
| Rate of compensation increase | | | 3.8 | % | | | 3.9 | % | | | 4.2 | % | | | 3.8 | % | | | 3.9 | % | | | 4.1 | % |
| Assumed overall health care cost trend rate | | na | | | na | | | na | | | | 7.7 | % | (1) | | 8.2 | %(2) | | | 8.4 | %(1) |
| |
Fair value of plan assets | | | | | | | | | | | | | | | | | | | | | | | | |
| Fair value of plan assets at beginning of year | | $ | 3,511 | | | $ | 3,191 | | | $ | 2,912 | | | $ | 58 | | | $ | 55 | | | $ | 55 | |
| Actual return on plan assets | | | 371 | | | | 331 | | | | 223 | | | | 10 | | | | 8 | | | | 10 | |
| Bank contributions | | | 192 | | | | 208 | | | | 333 | | | | 19 | | | | 23 | | | | 25 | |
| Voluntary employee contributions | | | 6 | | | | 5 | | | | 5 | | | | – | | | | – | | | | – | |
| Benefits paid to pensioners and employees | | | (185 | ) | | | (190 | ) | | | (195 | ) | | | (19 | ) | | | (23 | ) | | | (25 | ) |
| Amounts paid to participants to settle their pension | | | – | | | | – | | | | (17 | ) | | | – | | | | – | | | | – | |
| Other, primarily foreign exchange | | | (14 | ) | | | (34 | ) | | | (70 | ) | | | (2 | ) | | | (5 | ) | | | (10 | ) |
| |
| Fair value of plan assets at end of year | | $ | 3,881 | | | $ | 3,511 | | | $ | 3,191 | | | $ | 66 | | | $ | 58 | | | $ | 55 | |
| |
Plan funded status | | $ | (132 | ) | | $ | 32 | | | $ | (109 | ) | | $ | (786 | ) | | $ | (683 | ) | | $ | (656 | ) |
| Unrecognized actuarial loss (a) | | | 1,234 | | | | 1,059 | | | | 1,192 | | | | 256 | | | | 202 | | | | 219 | |
| Unrecognized cost (benefit) of plan amendments (b) | | | 57 | | | | 46 | | | | 29 | | | | (52 | ) | | | (59 | ) | | | (66 | ) |
| |
Net benefit asset (liability) at end of year | | $ | 1,159 | | | $ | 1,137 | | | $ | 1,112 | | | $ | (582 | ) | | $ | (540 | ) | | $ | (503 | ) |
| |
| | | | | | | | | | | | | | | | | | | | | | | | | |
Recorded in: | | | | | | | | | | | | | | | | | | | | | | | | |
| Other assets | | $ | 1,177 | | | $ | 1,155 | | | $ | 1,171 | | | $ | – | | | $ | – | | | $ | – | |
| Other liabilities | | | (18 | ) | | | (18 | ) | | | (59 | ) | | | (582 | ) | | | (540 | ) | | | (503 | ) |
| |
| Net benefit asset (liability) at end of year | | $ | 1,159 | | | $ | 1,137 | | | $ | 1,112 | | | $ | (582 | ) | | $ | (540 | ) | | $ | (503 | ) |
| |
The plans paid $3 million for the year ended October 31, 2005 ($4 million in 2004; $4 million in 2003) to us and certain of our subsidiaries for investment management, record-keeping, custodial and administrative services rendered on the same terms that we offer these services to our customers. The plans did not hold any of our shares directly as at October 31, 2005, 2004 and 2003.
(1) Trending to 4.5% in 2013 and remaining at that level thereafter.
(2) Trending to 4.4% in 2013 and remaining at that level thereafter.
na – not applicable
(a) A continuity of our actuarial (gains) losses is as follows:
| | | | | | | | | | | | | | | | | | | | | | | | | |
| (Canadian $ in millions) | | Pension benefit plans | | | Other employee future benefit plans | |
| | | 2005 | | | 2004 | | | 2003 | | | 2005 | | | 2004 | | | 2003 | |
| |
| Unrecognized actuarial loss at beginning of year | | $ | 1,059 | | | $ | 1,192 | | | $ | 1,148 | | | $ | 202 | | | $ | 219 | | | $ | 63 | |
| Loss on the benefit liability arising from changes in assumptions | | | 389 | | | | 78 | | | | 159 | | | | 69 | | | | – | | | | 170 | |
| (Excess) shortfall of actual returns over expected returns on plan assets | | | (141 | ) | | | (118 | ) | | | (6 | ) | | | (5 | ) | | | 4 | | | | (6 | ) |
| Recognition in expense of a portion of the unrecognized actuarial loss | | | (69 | ) | | | (77 | ) | | | (62 | ) | | | (10 | ) | | | (10 | ) | | | – | |
| Impact of foreign exchange and other | | | (4 | ) | | | (16 | ) | | | (47 | ) | | | – | | | | (11 | ) | | | (8 | ) |
| |
| Unrecognized actuarial loss at end of year | | $ | 1,234 | | | $ | 1,059 | | | $ | 1,192 | | | $ | 256 | | | $ | 202 | | | $ | 219 | |
| |
(b) A continuity of the unrecognized cost (benefit) of plan amendments is as follows:
| | | | | | | | | | | | | | | | | | | | | | | | | |
| (Canadian $ in millions) | | Pension benefit plans | | | Other employee future benefit plans | |
| | | 2005 | | | 2004 | | | 2003 | | | 2005 | | | 2004 | | | 2003 | |
| |
| Unrecognized cost (benefit) of plan amendments at beginning of year | | $ | 46 | | | $ | 29 | | | $ | 33 | | | $ | (59 | ) | | $ | (66 | ) | | $ | – | |
| Cost (benefit) of plan amendments initiated during the year | | | 15 | | | | 19 | | | | – | | | | – | | | | – | | | | (66 | ) |
| Recognition in expense of a portion of the unrecognized cost (benefit) of plan amendments | | | (4 | ) | | | (2 | ) | | | (3 | ) | | | 7 | | | | 7 | | | | – | |
| Impact of foreign exchange | | | – | | | | – | | | | (1 | ) | | | – | | | | – | | | | – | |
| |
| Unrecognized cost (benefit) of plan amendments at end of year | | $ | 57 | | | $ | 46 | | | $ | 29 | | | $ | (52 | ) | | $ | (59 | ) | | $ | (66 | ) |
| |
| | | |
| BMO Financial Group 188th Annual Report 2005 | | 123 |
Notes to Consolidated Financial Statements
Sensitivity of Assumptions
Key weighted-average economic assumptions used in measuring the pension benefit liability, the other employee future benefit liability and related expenses are outlined in the adjoining table. The sensitivity analysis provided in the table should be used with caution as it is hypothetical and changes in each key assumption may not be linear. The sensitivities in each key variable have been calculated independently of changes in other key variables.
Actual experience may result in changes in a number of key assumptions simultaneously. Changes in one factor may result in changes in another, which could amplify or reduce certain sensitivities.
| | | | | | | | | | | | | | | | | |
| | | | | | | | | | | Other employee | |
| | | Pension | | future benefits | |
| | | Benefit | | | Benefit | | | Benefit | | | Benefit | |
| (Canadian $ in millions, except as noted) | | liability | | | expense | | | liability | | | expense | |
| |
| Discount rate (%) | | | 5.3 | | | | 6.0 | | | | 5.5 | | | | 6.2 | |
| Impact of: 1% increase ($) | | | (501 | ) | | | (13 | ) | | | (117 | ) | | | (3 | ) |
| 1% decrease ($) | | | 625 | | | | 16 | | | | 150 | | | | 3 | |
| |
| Rate of compensation increase (%) | | | 3.8 | | | | 3.9 | | | | 3.8 | | | | 3.9 | |
| Impact of: 0.25% increase ($) | | | 24 | | | | 2 | | | | 1 | | | | – | |
| 0.25% decrease ($) | | | (26 | ) | | | (2 | ) | | | (1 | ) | | | – | |
| |
| Expected rate of return on assets (%) | | | na | | | | 6.7 | | | | na | | | | 8.0 | |
| Impact of: 1% increase ($) | | | na | | | | (33 | ) | | | na | | | | (1 | ) |
| 1% decrease ($) | | | na | | | | 33 | | | | na | | | | 1 | |
| |
| Assumed overall health care cost trend (%) | | | na | | | | na | | | | 7.7 | (1) | | | 8.0 | (2) |
| Impact of: 1% increase ($) | | | na | | | | na | | | | 129 | | | | 10 | |
| 1% decrease ($) | | | na | | | | na | | | | (104 | ) | | | (9 | ) |
| |
(1) Trending to 4.5% in 2013 and remaining at that level thereafter.
(2) Trending to 4.4% in 2013 and remaining at that level thereafter.
na – not applicable
Cash Flows
Cash payments made by the Bank during the year in connection with our employee future benefit plans are as follows:
| | | | | | | | | | | | | | | | | | | | | | | | | |
| (Canadian $ in millions) | | Pension benefit plans | | | Other employee future benefit plans | |
| | | 2005 | | | 2004 | | | 2003 | | | 2005 | | | 2004 | | | 2003 | |
| |
| Contributions to defined benefit plans | | $ | 177 | | | $ | 189 | | | $ | 325 | | | $ | – | | | $ | – | | | $ | – | |
| Contributions to defined contribution plans | | | 11 | | | | 11 | | | | 10 | | | | – | | | | – | | | | – | |
| Benefits paid directly to pensioners by the Bank | | | 15 | | | | 19 | | | | 8 | | | | 19 | | | | 23 | | | | 25 | |
| |
| Total | | $ | 203 | | | $ | 219 | | | $ | 343 | | | $ | 19 | | | $ | 23 | | | $ | 25 | |
| |
Our best estimate of the amounts we expect to contribute for the year ending October 31, 2006 is $182 million to our pension plans and $37 million to our other employee future benefit plans.
Estimated Future Benefit Payments
Estimated future benefit payments in the next five years and thereafter are as follows:
| | | | | | | | | |
| | | Pension | | | Other employee | |
| (Canadian $ in millions) | | benefit plans | | | future benefit plans | |
| |
| 2006 | | $ | 195 | | | $ | 37 | |
| 2007 | | | 206 | | | | 35 | |
| 2008 | | | 218 | | | | 39 | |
| 2009 | | | 232 | | | | 39 | |
| 2010 | | | 244 | | | | 41 | |
| 2011–2015 | | | 1,426 | | | | 255 | |
| |
Note 234Income Taxes
We report our provision for income taxes in our Consolidated Statement of Income based upon transactions recorded in our consolidated financial statements regardless of when they are recognized for income tax purposes, with the exception noted below for repatriation of retained earnings from our foreign subsidiaries.
In addition, we record income tax expense or benefit directly in shareholders’ equity when the taxes relate to amounts recorded in shareholders’ equity. For example, income tax expense on hedging gains related to our net investment in foreign operations is recorded in shareholders’ equity as part of net unrealized foreign exchange gain (loss).
The future income tax balances included in our Consolidated Balance Sheet in other assets of $24 million and other liabilities of $126 million are the cumulative amount of tax applicable to temporary differences between the accounting and tax values of our assets and liabilities. Future income tax assets and liabilities are measured at the tax rates expected to apply when these differences reverse. Changes in future income tax assets and liabilities related to a change in tax rates are recorded in income in the period of the tax rate change.
We expect that we will realize our future income tax assets in the normal course of our operations.
| | | |
| 124 | | BMO Financial Group 188th Annual Report 2005 |
| | | | | | | | | |
| Components of Future Income Tax Balances | | | | |
| (Canadian $ in millions) | | 2005 | | | 2004 | |
| |
Future Income Tax Assets | | | | | | | | |
| Allowance for credit losses | | $ | 427 | | | $ | 431 | |
| Employee future benefits | | | 198 | | | | 184 | |
| Deferred compensation benefits | | | 175 | | | | 148 | |
| Other | | | 18 | | | | 111 | |
| |
| Total future income tax assets | | $ | 818 | | | $ | 874 | |
| |
Future Income Tax Liabilities | | | | | | | | |
| Premises and equipment | | $ | (342 | ) | | $ | (316 | ) |
| Pension | | | (414 | ) | | | (410 | ) |
| Intangible assets | | | (104 | ) | | | (112 | ) |
| Other | | | (60 | ) | | | (47 | ) |
| |
| Total future income tax liabilities | | $ | (920 | ) | | $ | (885 | ) |
| |
Income which we earn in foreign countries through our branches or subsidiaries is generally subject to tax in those countries. We are also subject to Canadian taxation on the income earned in our foreign branches. Canada allows a credit for foreign taxes paid on this income. Upon repatriation of earnings from certain foreign subsidiaries, we would be required to pay tax on certain of these earnings. As repatriation of such earnings is not planned in the foreseeable future, we have not recorded the related future income tax liability. Canadian and foreign taxes that would be payable, at existing tax rates, if all of our foreign subsidiaries’ earnings were repatriated as at October 31, 2005, 2004 and 2003 are estimated to be $532 million, $495 million and $490 million, respectively.
| | | | | | | | | | | | | |
| Provision for Income Taxes | | | | | | | | | |
| (Canadian $ in millions) | | 2005 | | | 2004 | | | 2003 | |
| |
Consolidated Statement of Income | | | | | | | | | | | | |
| Provision for income taxes – Current | | $ | 784 | | | $ | 823 | | | $ | 689 | |
| – Future | | | 91 | | | | 149 | | | | (37 | ) |
| |
| | | | 875 | | | | 972 | | | | 652 | |
Shareholders’ Equity | | | | | | | | | | | | |
| Income tax expense related to: | | | | | | | | | | | | |
| Foreign currency gains on translation of net investments in foreign operations | | | 101 | | | | 254 | | | | 601 | |
| Other | | | – | | | | 9 | | | | – | |
| |
| Total | | $ | 976 | | | $ | 1,235 | | | $ | 1,253 | |
| |
Components of Total Provision for Income Taxes | | | | | | | | | | | | |
| Canada: Current income taxes | | | | | | | | | | | | |
| Federal | | $ | 430 | | | $ | 578 | | | $ | 725 | |
| Provincial | | | 227 | | | | 264 | | | | 285 | |
| |
| | | | 657 | | | | 842 | | | | 1,010 | |
| |
| Canada: Future income taxes | | | | | | | | | | | | |
| Federal | | | 35 | | | | 88 | | | | 7 | |
| Provincial | | | 9 | | | | 39 | | | | 2 | |
| |
| | | | 44 | | | | 127 | | | | 9 | |
| |
| Total Canadian | | | 701 | | | | 969 | | | | 1,019 | |
| |
| Foreign: Current income taxes | | | 228 | | | | 236 | | | | 280 | |
| Future income taxes | | | 47 | | | | 30 | | | | (46 | ) |
| |
| Total foreign | | | 275 | | | | 266 | | | | 234 | |
| |
| Total | | $ | 976 | | | $ | 1,235 | | | $ | 1,253 | |
| |
Set out below is a reconciliation of our statutory tax rates and income tax that would be payable at these rates to the effective income tax rates and provision for income taxes that we have recorded in our Consolidated Statement of Income:
| | | | | | | | | | | | | | | | | | | | | | | | | |
| (Canadian $ in millions, except as noted) | | | | | | 2005 | | | | | | | 2004 | | | | | | | 2003 | |
| |
| Combined Canadian federal and provincial income taxes at the statutory tax rate | | $ | 1,160 | | | | 34.8 | % | | $ | 1,152 | | | | 35.0 | % | | $ | 890 | | | | 36.2 | % |
| Increase (decrease) resulting from: | | | | | | | | | | | | | | | | | | | | | | | | |
| Tax-exempt income | | | (88 | ) | | | (2.7 | ) | | | (95 | ) | | | (2.9 | ) | | | (112 | ) | | | (4.6 | ) |
| Foreign operations subject to different tax rates | | | (211 | ) | | | (6.3 | ) | | | (96 | ) | | | (3.0 | ) | | | (153 | ) | | | (6.2 | ) |
| Large corporations tax | | | 4 | | | | 0.1 | | | | 5 | | | | 0.1 | | | | 7 | | | | 0.3 | |
| Change in tax rate for future income taxes | | | – | | | | – | | | | (11 | ) | | | (0.2 | ) | | | 10 | | | | 0.4 | |
| Intangible assets not deductible for tax purposes | | | 13 | | | | 0.5 | | | | 14 | | | | 0.4 | | | | 14 | | | | 0.6 | |
| Other | | | (3 | ) | | | (0.1 | ) | | | 3 | | | | 0.1 | | | | (4 | ) | | | (0.1 | ) |
| |
| Provision for income taxes and effective tax rate | | $ | 875 | | | | 26.3 | % | | $ | 972 | | | | 29.5 | % | | $ | 652 | | | | 26.6 | % |
| |
Note 244Earnings Per Share
Basic Earnings per Share
Our basic earnings per share is calculated by dividing our net income, after deducting total preferred share dividends, by the daily average number of fully paid common shares outstanding throughout the year.
| | | | | | | | | | | | | |
| Basic earnings per share | | | | | | | | | |
| (Canadian $ in millions, except as noted) | | 2005 | | | 2004 | | | 2003 | |
| |
| Net income | | $ | 2,400 | | | $ | 2,306 | | | $ | 1,781 | |
| Dividends on preferred shares | | | (30 | ) | | | (31 | ) | | | (38 | ) |
| |
| Net income available to common shareholders | | $ | 2,370 | | | $ | 2,275 | | | $ | 1,743 | |
| |
| Average number of common shares outstanding (in thousands) | | | 500,060 | | | | 501,656 | | | | 496,208 | |
| |
| (Canadian $) | | | | | | | | | | | | |
| Basic earnings per share | | $ | 4.74 | | | $ | 4.53 | | | $ | 3.51 | |
| |
Diluted Earnings per Share
Diluted earnings per share represents what our earnings per share would have been if instruments convertible into common shares that had the impact of reducing our earnings per share had been converted either at the beginning of the year for instruments that were outstanding all year or from the date of issue for instruments issued during the year.
Convertible Shares
In determining diluted earnings per share, we increase net income available to common shareholders by dividends paid on convertible shares as these dividends would not have been paid if the shares had been converted at the beginning of the year. Similarly, we increase the average number of common shares outstanding by the number of shares that would have been issued had the conversion taken place at the beginning of the year.
| | | |
| BMO Financial Group 188th Annual Report 2005 | | 125 |
Our Series 4, 6 and 10 Class B Preferred shares, in certain circumstances, are convertible into common shares. These conversions are not included in the calculation of diluted earnings per share as we have the option to settle the conversion in cash instead of common shares.
Employee Stock Options
In determining diluted earnings per share, we increase the average number of common shares outstanding by the number of shares that would have been issued if all stock options with a strike price below the average share price for the year had been exercised. When performance targets have not been met, those are excluded from the calculation. We also decrease the average number of common shares outstanding by the number of our common shares that we could have repurchased if we had used the proceeds from the exercise of stock options to repurchase them on the open market at the average share price for the year. We do not adjust for stock options with a strike price above the average share price for the year because including them would increase our earnings per share, not dilute it.
| | | | | | | | | | | | | |
| Diluted earnings per share | | | | | | | | | |
| (Canadian $ in millions, except as noted) | | 2005 | | | 2004 | | | 2003 | |
| |
| Net income available to common shareholders | | $ | 2,370 | | | $ | 2,275 | | | $ | 1,743 | |
| Dividends on convertible shares | | | – | | | | 1 | | | | 1 | |
| |
| Net income adjusted for dilution effect | | $ | 2,370 | | | $ | 2,276 | | | $ | 1,744 | |
| |
Average number of common shares outstanding(in thousands) | | | 500,060 | | | | 501,656 | | | | 496,208 | |
| |
| Convertible shares | | | 361 | | | | 683 | | | | 996 | |
Stock options potentially exercisable (1) | | | 25,424 | | | | 32,057 | | | | 36,608 | |
Common shares potentially repurchased (2) | | | (15,109 | ) | | | (19,351 | ) | | | (26,803 | ) |
| |
Average diluted number of common shares outstanding (in thousands) | | | 510,736 | | | | 515,045 | | | | 507,009 | |
| |
| (Canadian $) | | | | | | | | | | | | |
| Diluted earnings per share | | $ | 4.64 | | | $ | 4.42 | | | $ | 3.44 | |
| |
| | |
| (1) | | In computing diluted earnings per share we excluded average stock options outstanding of 410,265, 679,510 and 455,282 with weighted-average exercise prices of $56.60, $53.93 and $41.21 for the years ended October 31, 2005, 2004 and 2003, respectively. |
| |
| (2) | | The number of shares potentially repurchased is determined by computing a weighted average of the number of shares potentially repurchased. |
Future Change in Accounting Policy
The CICA has issued new rules that will require us to include the potential conversion of certain of our preferred shares and capital trust securities to common shares in the calculation of diluted earnings per share. The effective date has not been finalized; however, we expect to adopt these new rules in the year ended October 31, 2006. Diluted earnings per share of prior periods will be restated upon adoption. Under the new standard our diluted earnings per share for the years ended October 31, 2005, 2004 and 2003 would be reduced by approximately $0.06, $0.09 and $0.11, respectively.
Note 254Operating and Geographic Segmentation
Operating Groups
We conduct our business through operating groups, each of which has a distinct mandate. We determine operating groups based on our management structure and therefore our groups and results attributed to our groups may not be comparable with those of other financial services companies. We evaluate the performance of our groups using measures such as net income, return on equity, net economic profit and non-interest expense-to-revenue (productivity) ratio.
Personal and Commercial Client Group
Personal and Commercial Client Group (“P&C”) offers a full range of products and services to personal and business clients in Canada and the United States through branches and direct banking channels such as telephone banking, online banking and a network of automated banking machines.
Private Client Group
Private Client Group (“PCG”) brings together all of our wealth management businesses. Operating primarily in Canada and the United States, PCG serves a full range of North American client segments, from mainstream to ultra-high net worth, as well as select institutional market segments. PCG offers its clients a broad range of wealth management products and services, including full-service and direct investing, private banking and investment products, providing the tools they need to accumulate, protect and grow their financial assets.
Investment Banking Group
Investment Banking Group (“IBG”) combines all of our businesses serving corporate, institutional and government clients. In Canada, its client base comprises large corporations and institutions across a broad range of industry sectors. In the United States, it serves middle-market and institutional clients in selected sectors. IBG also serves institutional and government clients in the United Kingdom, Europe and Asia. It offers clients complete financial solutions across the entire balance sheet, including public and private debt
and equity underwriting, cash management, corporate lending, securitization, foreign exchange and trade finance. The group also offers financial advisory services in mergers and acquisitions and restructurings, while providing investing clients with research, sales and trading services.
Corporate Support
Corporate Support includes Technology and Solutions (“T&S”) and the Corporate units that provide expertise and governance support in areas such as strategic planning, law, finance, internal audit, risk management, corporate communications, economics, corporate marketing, human resources and learning. Operating results for Corporate Support include revenues and expenses associated with certain securitization activities, the hedging of foreign-source earnings and activities related to the management of certain balance sheet positions and our overall asset liability structure.
T&S manages, maintains and provides governance over information technology, real estate, operations services and sourcing for the Bank. The unit focuses on enterprise-wide priorities that improve quality and efficiency.
Operating results for T&S are included with Corporate Support for reporting purposes. However, costs of T&S services are transferred to P&C, PCG and IBG and only minor amounts are retained in T&S’s results. As such, results for Corporate Support largely reflect operating results of Corporate units.
Corporate Support also includes residual revenues and expenses representing the differences between actual amounts earned or incurred and the amounts allocated to operating groups.
Basis of Presentation
The results of these operating groups are based on our internal financial reporting systems. The accounting policies used in these groups are generally consistent with those followed in the preparation of the consolidated financial statements as disclosed in Note 1 and throughout the consolidated financial statements.
| | | |
| 126 | | BMO Financial Group 188th Annual Report 2005 |
Notable accounting measurement differences are the taxable equivalent basis adjustment and the provision for credit losses, as described below.
Taxable Equivalent Basis
We analyze net interest income on a taxable equivalent basis (“teb”). This basis includes an adjustment which increases GAAP revenues and the GAAP provision for income taxes by an amount that would raise revenues on certain tax-exempt securities to a level that would incur tax at the statutory rate.
Analysis on a teb basis neutralizes the impact of investing in tax-exempt or tax-advantaged securities rather than fully taxable securities with higher yields. It reduces distortions in net interest income related to the choice of tax-advantaged and taxable investments.
Provisions for Credit Losses
Provisions for credit losses are generally allocated to each group based on expected losses for that group over an economic cycle. Differences between expected loss provisions and provisions required under GAAP are included in Corporate Support.
Inter-Group Allocations
Various estimates and allocation methodologies are used in the preparation of the operating groups’ financial information. We allocate expenses directly related to earning revenue to the groups that earned the related revenue. Expenses not directly related to earning revenue, such as overhead expenses, are allocated to operating groups using allocation formulas applied on a consistent basis. Operating group net interest income reflects internal funding charges and credits on the groups’assets,liabilities and capital,at market rates,taking into account relevant terms and currency considerations. The offset of the net impact of these charges and credits is reflected in Corporate Support.
Geographic Information
We operate primarily in Canada and the United States but also have operations in the United Kingdom, Europe, the Caribbean and Asia, which are grouped in Other Countries. We allocate our results by geographic region based on the location of the unit responsible for managing the related assets, liabilities, revenues and expenses, except for the consolidated provision for credit losses, which is allocated based upon the country of ultimate risk.
Our results and average assets, allocated by operating group and geographic region, are as follows:
| | | | | | | | | | | | | | | | | | | | | | | | | | | | | | | | | | | | | | | | | |
| | | | | | | | | | | | | | | | | | | | | | | Teb | | | | | | | | | | | | | | |
| | | | | | | | | | | | | | | Corporate | | | Total | | | adjust- | | | Total | | | | | | | United | | | Other | |
| (Canadian $ in millions) | | P&C | | | PCG | | | IBG | | | Support | (1) | | (teb basis) | | | ments | | | (GAAP basis) | | | Canada | | | States | | | Countries | |
| |
2005 | | | | | | | | | | | | | | | | | | | | | | | | | | | | | | | | | | | | | | | | |
| Net interest income | | $ | 3,561 | | | $ | 577 | | | $ | 965 | | | $ | (197 | ) | | $ | 4,906 | | | $ | (119 | ) | | $ | 4,787 | | | $ | 3,504 | | | $ | 1,266 | | | $ | 136 | |
| Non-interest revenue | | | 1,655 | | | | 1,459 | | | | 1,776 | | | | 162 | | | | 5,052 | | | | – | | | | 5,052 | | | | 3,544 | | | | 1,345 | | | | 163 | |
| |
| Total Revenue | | | 5,216 | | | | 2,036 | | | | 2,741 | | | | (35 | ) | | | 9,958 | | | | (119 | ) | | | 9,839 | | | | 7,048 | | | | 2,611 | | | | 299 | |
| Provision for credit losses | | | 299 | | | | 4 | | | | 98 | | | | (222 | ) | | | 179 | | | | – | | | | 179 | | | | 192 | | | | 14 | | | | (27 | ) |
| Non-interest expense | | | 3,142 | | | | 1,520 | | | | 1,477 | | | | 188 | | | | 6,327 | | | | – | | | | 6,327 | | | | 4,344 | | | | 1,855 | | | | 128 | |
| |
| Income before taxes and non-controlling interest in subsidiaries | | | 1,775 | | | | 512 | | | | 1,166 | | | | (1 | ) | | | 3,452 | | | | (119 | ) | | | 3,333 | | | | 2,512 | | | | 742 | | | | 198 | |
| Income taxes | | | 576 | | | | 192 | | | | 314 | | | | (88 | ) | | | 994 | | | | (119 | ) | | | 875 | | | | 798 | | | | 248 | | | | (52 | ) |
| Non-controlling interest in subsidiaries | | | – | | | | – | | | | – | | | | 58 | | | | 58 | | | | – | | | | 58 | | | | 36 | | | | 22 | | | | – | |
| |
| Net Income | | $ | 1,199 | | | $ | 320 | | | $ | 852 | | | $ | 29 | | | $ | 2,400 | | | $ | – | | | $ | 2,400 | | | $ | 1,678 | | | $ | 472 | | | $ | 250 | |
| |
| Average Assets | | $ | 127,018 | | | $ | 7,061 | | | $ | 163,848 | | | $ | 5,233 | | | $ | 303,160 | | | $ | – | | | $ | 303,160 | | | $ | 201,950 | | | $ | 75,621 | | | $ | 25,589 | |
| |
2004(Restated) | | | | | | | | | | | | | | | | | | | | | | | | | | | | | | | | | | | | | | | | |
| Net interest income | | $ | 3,352 | | | $ | 533 | | | $ | 1,260 | | | $ | (208 | ) | | $ | 4,937 | | | $ | (139 | ) | | $ | 4,798 | | | $ | 3,331 | | | $ | 1,438 | | | $ | 168 | |
| Non-interest revenue | | | 1,525 | | | | 1,318 | | | | 1,508 | | | | 200 | | | | 4,551 | | | | – | | | | 4,551 | | | | 3,200 | | | | 1,200 | | | | 151 | |
| |
| Total Revenue | | | 4,877 | | | | 1,851 | | | | 2,768 | | | | (8 | ) | | | 9,488 | | | | (139 | ) | | | 9,349 | | | | 6,531 | | | | 2,638 | | | | 319 | |
| Provision for credit losses | | | 299 | | | | 5 | | | | 138 | | | | (545 | ) | | | (103 | ) | | | – | | | | (103 | ) | | | (1 | ) | | | (46 | ) | | | (56 | ) |
| Non-interest expense | | | 3,077 | | | | 1,504 | | | | 1,405 | | | | 171 | | | | 6,157 | | | | – | | | | 6,157 | | | | 4,062 | | | | 1,960 | | | | 135 | |
| |
| Income before taxes and non-controlling interest in subsidiaries | | | 1,501 | | | | 342 | | | | 1,225 | | | | 366 | | | | 3,434 | | | | (139 | ) | | | 3,295 | | | | 2,470 | | | | 724 | | | | 240 | |
| Income taxes | | | 518 | | | | 115 | | | | 393 | | | | 85 | | | | 1,111 | | | | (139 | ) | | | 972 | | | | 795 | | | | 279 | | | | 37 | |
| Non-controlling interest in subsidiaries | | | 1 | | | | – | | | | – | | | | 16 | | | | 17 | | | | – | | | | 17 | | | | 2 | | | | 15 | | | | – | |
| |
| Net Income | | $ | 982 | | | $ | 227 | | | $ | 832 | | | $ | 265 | | | $ | 2,306 | | | $ | – | | | $ | 2,306 | | | $ | 1,673 | | | $ | 430 | | | $ | 203 | |
| |
| Average Assets | | $ | 117,126 | | | $ | 7,145 | | | $ | 141,691 | | | $ | 3,830 | | | $ | 269,792 | | | $ | – | | | $ | 269,792 | | | $ | 177,410 | | | $ | 68,743 | | | $ | 23,639 | |
| |
2003(Restated) | | | | | | | | | | | | | | | | | | | | | | | | | | | | | | | | | | | | | | | | |
| Net interest income | | $ | 3,230 | | | $ | 559 | | | $ | 1,344 | | | $ | (204 | ) | | $ | 4,929 | | | $ | (152 | ) | | $ | 4,777 | | | $ | 3,168 | | | $ | 1,612 | | | $ | 149 | |
| Non-interest revenue | | | 1,549 | | | | 1,175 | | | | 1,244 | | | | 252 | | | | 4,220 | | | | – | | | | 4,220 | | | | 2,914 | | | | 1,184 | | | | 122 | |
| |
| Total Revenue | | | 4,779 | | | | 1,734 | | | | 2,588 | | | | 48 | | | | 9,149 | | | | (152 | ) | | | 8,997 | | | | 6,082 | | | | 2,796 | | | | 271 | |
| Provision for credit losses | | | 298 | | | | 6 | | | | 231 | | | | (80 | ) | | | 455 | | | | – | | | | 455 | | | | 211 | | | | 211 | | | | 33 | |
| Non-interest expense | | | 3,070 | | | | 1,510 | | | | 1,345 | | | | 162 | | | | 6,087 | | | | – | | | | 6,087 | | | | 3,993 | | | | 1,989 | | | | 105 | |
| |
| Income before taxes and non-controlling interest in subsidiaries | | | 1,411 | | | | 218 | | | | 1,012 | | | | (34 | ) | | | 2,607 | | | | (152 | ) | | | 2,455 | | | | 1,878 | | | | 596 | | | | 133 | |
| Income taxes | | | 493 | | | | 81 | | | | 321 | | | | (91 | ) | | | 804 | | | | (152 | ) | | | 652 | | | | 598 | | | | 222 | | | | (16 | ) |
| Non-controlling interest in subsidiaries | | | 4 | | | | – | | | | – | | | | 18 | | | | 22 | | | | – | | | | 22 | | | | 6 | | | | 16 | | | | – | |
| |
| Net Income | | $ | 914 | | | $ | 137 | | | $ | 691 | | | $ | 39 | | | $ | 1,781 | | | $ | – | | | $ | 1,781 | | | $ | 1,274 | | | $ | 358 | | | $ | 149 | |
| |
| Average Assets | | $ | 108,046 | | | $ | 7,015 | | | $ | 144,418 | | | $ | 4,487 | | | $ | 263,966 | | | $ | – | | | $ | 263,966 | | | $ | 167,427 | | | $ | 76,622 | | | $ | 19,917 | |
| |
| | |
| (1) | | Corporate Support includes Technology and Solutions. |
Prior years have been restated to give effect to the current year’s organization structure and presentation changes.
| | | |
| BMO Financial Group 188th Annual Report 2005 | | 127 |
Notes to Consolidated Financial Statements
Note 26 4 Related Party Transactions
We provide banking services to our joint ventures and equity-accounted investees on the same terms that we offer to our customers.
Effective September 1, 1999, new loans and mortgages to executive officers were no longer available at preferred rates, other than mortgages related to transfers we initiate. A select suite of customer loan and mortgage products is now offered to employees at rates normally accorded to preferred customers. We also offer employees a fee-based subsidy on annual credit card fees.
Prior to September 1, 1999, loans to executive officers for personal purposes, principally for consumer purchases, home improvements and sundry investments, were made available at an interest rate of one-half of our prime rate and up to a maximum loan amount of $25,000. Loans in excess of this amount were available at prime rate.
The amounts outstanding under these preferred rate loan agreements are as follows:
| | | | | | | | | |
| (Canadian $ in millions) | | 2005 | | | 2004 | |
| |
| Mortgage loans | | $ | 82 | | | $ | 80 | |
| Personal loans | | | – | | | | 66 | |
| |
| Total | | $ | 82 | | | $ | 146 | |
| |
The interest earned on these loans is recorded in interest, dividend and fee income in our Consolidated Statement of Income.
Board of Directors Compensation
Stock Option Plan
In fiscal 2002, we introduced a stock option plan for non-officer directors, the terms of which are the same as the plan for designated
officers and employees described in Note 21. During the fiscal year 2003, we granted 42,000 stock options at an exercise price of $43.25 per share. The granting of options under the Non-Officer Director Stock Option Plan was discontinued effective November 1, 2003.
Stock option expense for this plan is calculated in the same manner as employee stock option expense. It was included in other expenses in our Consolidated Statement of Income and was less than $1 million for the years ended October 31, 2005, 2004 and 2003, respectively.
Deferred Share Units
Our Board of Directors is required to take 100% of their annual retainers and other fees in the form of either our common shares (purchased on the open market) or deferred share units until such time as the directors’ shareholdings are greater than six times their annual retainers as directors. After this threshold is reached, the directors are required to take at least 50% of their annual retainers in this form.
Deferred share units allocated under this deferred share unit plan are adjusted to reflect dividends and changes in the market value of our common shares. The value of these deferred share units will be paid upon termination of service as a director. The expense for this plan was included in other expenses in our Consolidated Statement of Income and totalled $3 million, $3 million and $2 million for the years ended October 31, 2005, 2004 and 2003, respectively.
We provide certain banking services to entities which are affiliated with our directors. These services are on the same terms as we offer to our customers.
Note 27 4 Contingent Liabilities
(a) Legal Proceedings
In the bankruptcy of Adelphia Communications Corporation (“Adelphia”), the Official Committees of Unsecured Creditors and Equity Security Holders have been given leave to pursue claims against Bank of Montreal, its indirect subsidiary Harris Nesbitt Corp., and approximately 380 other financial institutions. The Complaints allege various federal statutory and common law claims and seek an unspecified amount of damages and punitive damages and equitable relief. Also in the bankruptcy proceeding, Adelphia and Bank of Montreal have entered into a tolling agreement with respect to the time within which Adelphia may bring an adversary proceeding against Bank of Montreal seeking return of certain payments received by Bank of Montreal, claiming that such payments were voidable preferences.
In addition, Harris Nesbitt Corp. is one of many underwriters named, in addition to the Bank and other financial institutions, in several civil actions, including a class action, brought by investors in Adelphia securities. All seek unspecified damages. The court in the class action recently dismissed without prejudice all federal securities law claims against Bank of Montreal and Harris Nesbitt Corp. but a common law claim against Bank of Montreal and a securities law claim against the lead underwriters remain. The parties in the class action presently are engaged in mediation to try to resolve these matters.
In addition, Bank of Montreal and Harris Nesbitt Corp. have been named as defendants in actions brought by an individual and certain trusts in which that individual, directly or indirectly, maintains an interest, and by a corporation and certain of its affiliates, all of whom or which acquired Adelphia common stock in exchange for certain of their businesses. The complaints assert claims under various state statutes and the common law and claim unspecified actual and punitive damages.
There remains the possibility that other or additional claims related to Adelphia’s bankruptcy might be asserted by one or more interested parties.
As these matters are all in the early stages, we are unable to determine the eventual outcome of these matters but management believes that the Bank and Harris Nesbitt Corp. have strong defences to these claims and will vigorously defend against all such actions.
BMO Nesbitt Burns Inc., an indirect subsidiary of Bank of Montreal, has been named as a defendant in several class and individual actions in Canada and a class action in the United States brought on behalf of shareholders of Bre-X Minerals Ltd. (“Bre-X”). Other defendants named in one or more of these actions include Bre-X, officers and directors of Bre-X, a mining consulting firm retained by Bre-X, Bre-X’s financial advisor, brokerage firms which sold Bre-X common stock, and a major gold production company. These actions are largely based on allegations of negligence, negligent or fraudulent misrepresentation and a breach of theU.S. Securities Exchange Act of 1934(United States only), in connection with the sale of Bre-X securities. Two of the proposed class actions in Canada have been dismissed as to BMO Nesbitt Burns Inc. The proposed U.S. class action was dismissed in October 2005.
During 2004, claims were made against us in relation to the termination of certain derivative positions. These claims were settled in 2005.
The Bank and its subsidiaries are party to other legal proceedings in the ordinary course of their businesses. Management does not expect the outcome of any of these other proceedings, individually or in the aggregate, to have a material adverse effect on the consolidated financial position or results of the Bank’s operations.
| | | |
| 128 | | BMO Financial Group 188th Annual Report 2005 |
(b) Pledged Assets
In the normal course of our business, we pledge assets as security for various liabilities that we incur. The following tables summarize our pledged assets, to whom they are pledged and in relation to what activity:
| | | | | | | | | |
| (Canadian $ in millions) | | 2005 | | | 2004 | |
| |
| Cash resources | | $ | 9 | | | $ | 2 | |
| Securities | | | | | | | | |
| Issued or guaranteed by Canada | | | 8,734 | | | | 5,227 | |
| Issued or guaranteed by a Canadian province, municipality or school corporation | | | 1,779 | | | | 1,668 | |
| Other securities | | | 16,789 | | | | 11,421 | |
| Other assets | | | 16,764 | | | | 21,559 | |
| |
| Total assets pledged | | $ | 44,075 | | | $ | 39,877 | |
| |
Excludes restricted cash resources disclosed in Note 2.
| | | | | | | | | |
| (Canadian $ in millions) | | 2005 | | | 2004 | |
| |
Assets pledged to: | | | | | | | | |
| Clearing systems, payment systems and depositories | | $ | 1,735 | | | $ | 1,253 | |
Assets pledged in relation to: | | | | | | | | |
| Obligations related to securities lent or sold under repurchase agreements | | | 20,275 | | | | 20,865 | |
| Securities borrowing and lending | | | 12,472 | | | | 11,229 | |
| Derivatives transactions | | | 2,209 | | | | 1,121 | |
| Other | | | 7,384 | | | | 5,409 | |
| |
| Total | | $ | 44,075 | | | $ | 39,877 | |
| |
Excludes cash pledged with central banks disclosed as restricted cash in Note 2.
Note 28 4 Fair Value of Financial Instruments
We record trading assets and liabilities at market values and non-trading assets and liabilities at their original amortized cost less allowances or write-downs for impairment. Fair value is subjective in nature, requiring a variety of valuation techniques and assumptions. The values are based upon the estimated amounts for individual assets and liabilities and do not include an estimate of the fair value of any of the legal entities or underlying operations that comprise our business.
Fair value amounts disclosed represent point-in-time estimates that may change in subsequent reporting periods due to market conditions or other factors. Fair value represents our estimate of the amounts for which we could exchange the financial instruments with willing third parties who were interested in acquiring the instruments. In most cases, however, the financial instruments are not typically exchangeable or exchanged and therefore it is difficult to determine their fair value. In those cases, we have estimated fair value taking into account only changes in interest rates and credit risk that have occurred since we acquired them or entered into the underlying contract. These calculations represent management’s best estimates based on a range of methodologies and assumptions; since they involve uncertainties, the fair values may not be realized in an actual sale or immediate settlement of the instruments.
Interest rate changes are the main cause of changes in the fair value of our financial instruments.
Items that are not financial instruments, such as premises and equipment, goodwill and intangible assets, have been excluded from our estimate of fair value. The assets excluded totalled $3,134 million as at October 31, 2005 ($4,007 million in 2004).
Financial Instruments Whose Book Value Approximates Fair Value
Fair value is assumed to equal book value for acceptance-related assets and liabilities, securities sold but not yet purchased and securities lent or sold under repurchase agreements, due to the short-term nature of these assets and liabilities. Fair value is also assumed to equal book value for our cash resources, certain other assets and certain other liabilities.
Loans
In determining the fair value of our loans, we incorporate the following assumptions:
| § | | For fixed rate performing loans, we discount the remaining contractual cash flows, adjusted for estimated prepayment, at market interest rates currently offered for loans with similar terms. |
| |
| § | | For floating rate performing loans, changes in interest rates have minimal impact on fair value since loans reprice to market frequently. On that basis, fair value is assumed to equal carrying value. |
The value of our loan balances determined based on the above assumptions is further reduced by the allowance for credit losses to determine the fair value of our loan portfolio.
Securities
The fair value of our securities, both trading and investment, by instrument type and the methods used to determine fair value are provided in Note 3.
Derivative Financial Instruments
The methods used to determine the fair value of derivative financial instruments are provided in Note 9.
Deposits
In determining the fair value of our deposits, we incorporate the following assumptions:
| § | | For fixed rate, fixed maturity deposits, we discount the remaining contractual cash flows for these deposits, adjusted for expected redemptions, at market interest rates currently offered for deposits with similar terms and risks. |
| |
| § | | For floating rate, fixed maturity deposits, changes in interest rates have minimal impact on fair value since deposits reprice to market frequently. On that basis, fair value is assumed to equal book value. |
| |
| § | | For deposits with no defined maturities, we consider fair value to equal book value based on book value being equivalent to the amount payable on the reporting date. |
Subordinated Debt
The fair value of our subordinated debt is determined by referring to current market prices for similar debt instruments.
Set out in the following table are the amounts which would be reported if all of our financial instrument assets and liabilities were reported at their fair values, adjusted for the impact of derivatives that hedge changes in fair value.
| | | |
| BMO Financial Group 188th Annual Report 2005 | | 129 |
| | | | | | | | | | | | | | | | | | | | | | | | | | | | | | | | | |
| (Canadian $ in millions) | | 2005 | | | 2004 | |
| | | | | | | | | | | Fair value | | | Fair value | | | | | | | | | | | Fair value | | | Fair value | |
| | | Book | | | Fair | | | of hedging | | | over (under) | | | Book | | | Fair | | | of hedging | | | over (under) | |
| | | value | | | value | | | derivatives | (1) | | book value | | | value | | | value | | | derivatives | (1) | | book value | |
| |
Assets | | | | | | | | | | | | | | | | | | | | | | | | | | | | | | | | |
| Cash resources | | $ | 20,721 | | | $ | 20,721 | | | $ | – | | | $ | – | | | $ | 18,045 | | | $ | 18,045 | | | $ | – | | | $ | – | |
| Securities | | | 57,256 | | | | 57,253 | | | | 15 | | | | 12 | | | | 50,472 | | | | 50,558 | | | | (48 | ) | | | 38 | |
| Loans and customers’ liability under acceptances, net of the allowance for credit losses | | | 174,337 | | | | 174,838 | | | | (31 | ) | | | 470 | | | | 156,248 | | | | 156,407 | | | | (37 | ) | | | 122 | |
| Derivative financial instruments – trading | | | 30,851 | | | | 30,851 | | | | – | | | | – | | | | 24,914 | | | | 24,914 | | | | – | | | | – | |
| Other assets | | | 10,567 | | | | 10,567 | | | | – | | | | – | | | | 10,974 | | | | 10,974 | | | | – | | | | – | |
| |
| | | $ | 293,732 | | | $ | 294,230 | | | $ | (16 | ) | | $ | 482 | | | $ | 260,653 | | | $ | 260,898 | | | $ | (85 | ) | | $ | 160 | |
| |
Liabilities | | | | | | | | | | | | | | | | | | | | | | | | | | | | | | | | |
| Deposits | | $ | 193,793 | | | $ | 194,288 | | | $ | (122 | ) | | $ | 373 | | | $ | 175,190 | | | $ | 175,710 | | | $ | (196 | ) | | $ | 324 | |
| Derivative financial instruments – trading | | | 28,829 | | | | 28,829 | | | | – | | | | – | | | | 23,741 | | | | 23,741 | | | | – | | | | – | |
| Acceptances | | | 5,934 | | | | 5,934 | | | | – | | | | – | | | | 5,355 | | | | 5,355 | | | | – | | | | – | |
| Securities sold but not yet purchased | | | 16,142 | | | | 16,142 | | | | – | | | | – | | | | 10,441 | | | | 10,441 | | | | – | | | | – | |
| Securities lent or sold under repurchase agreements | | | 22,657 | | | | 22,657 | | | | – | | | | – | | | | 20,865 | | | | 20,865 | | | | – | | | | – | |
| Other liabilities | | | 12,203 | | | | 12,203 | | | | – | | | | – | | | | 12,636 | | | | 12,636 | | | | – | | | | – | |
| Subordinated debt | | | 2,469 | | | | 2,637 | | | | (3 | ) | | | 165 | | | | 2,395 | | | | 2,630 | | | | 8 | | | | 243 | |
| Preferred share liability | | | 450 | | | | 465 | | | | – | | | | 15 | | | | 450 | | | | 475 | | | | – | | | | 25 | |
| Capital trust securities | | | 1,150 | | | | 1,240 | | | | – | | | | 90 | | | | 1,150 | | | | 1,269 | | | | – | | | | 119 | |
| |
| | | $ | 283,627 | | | $ | 284,395 | | | $ | (125 | ) | | $ | 643 | | | $ | 252,223 | | | $ | 253,122 | | | $ | (188 | ) | | $ | 711 | |
| |
| Total | | | | | | | | | | | | | | $ | (161 | ) | | | | | | | | | | | | | | $ | (551 | ) |
| |
(1) Refer to Note 9.
Note 29 4 Reconciliation of Canadian and United States Generally Accepted Accounting Principles
We prepare our consolidated financial statements in accordance with GAAP in Canada, including interpretations of GAAP by our regulator, the Superintendent of Financial Institutions Canada.
We have included the significant differences which would result if United States GAAP were applied in the preparation of
our Consolidated Statement of Income, Consolidated Balance Sheet and Consolidated Statement of Comprehensive Income. We have not included our Consolidated Statement of Cash Flows as the differences are immaterial.
| | | | | | | | | | | | | | | |
| Condensed Consolidated Statement of Income | | | | | | | | | |
| For the Year Ended October 31 (Canadian $ in millions, except per share amounts) | | 2005 | | | 2004 | | | 2003 | |
| |
| Net income, as reported under Canadian GAAP | | $ | 2,400 | | | $ | 2,306 | | | $ | 1,781 | |
| Adjustments to arrive at United States GAAP: | | | | | | | | | | | | |
| Net Interest Income | | | | | | | | | | | | |
Liabilities and equity(k) | | | 97 | | | | 124 | | | | 123 | |
Variable interest entities(a) | | | – | | | | 38 | | | | – | |
Mortgage prepayment fees(b) | | | – | | | | (42 | ) | | | – | |
| Non-Interest Revenue | | | | | | | | | | | | |
Merchant banking(l) | | | (83 | ) | | | – | | | | – | |
Variable interest entities(a) | | | (13 | ) | | | 104 | | | | – | |
Securitizations(c) | | | – | | | | (3 | ) | | | (44 | ) |
Derivatives(d) | | | (66 | ) | | | (5 | ) | | | (3 | ) |
| Non-Interest Expense | | | | | | | | | | | | |
Variable interest entities(a) | | | – | | | | (7 | ) | | | – | |
Stock options(e) | | | (11 | ) | | | (29 | ) | | | (43 | ) |
Software development costs(f) | | | (42 | ) | | | (42 | ) | | | 39 | |
Pension and related benefits(g) | | | 2 | | | | 5 | | | | (2 | ) |
Goodwill and other assets(h) | | | 5 | | | | 6 | | | | 7 | |
| Income taxes and net change in income taxes(i) (including adjustments due to items listed above) | | | 66 | | | | (60 | ) | | | (34 | ) |
| Non-controlling interest in subsidiaries | | | (79 | ) | | | (43 | ) | | | (42 | ) |
| Cumulative impact of an accounting change(a) | | | – | | | | (111 | ) | | | – | |
| |
| Net income based on United States GAAP | | $ | 2,276 | | | $ | 2,241 | | | $ | 1,782 | |
| |
| Earnings per share: basic | | – Canadian GAAP net income | | $ | 4.74 | | | $ | 4.53 | | | $ | 3.51 | |
| | | – United States GAAP net income before cumulative impact of an accounting change | | | 4.49 | | | | 4.54 | | | | 3.43 | |
| | | – Cumulative impact of an accounting change | | | – | | | | (0.23 | ) | | | – | |
| | | – United States GAAP net income | | | 4.49 | | | | 4.31 | | | | 3.43 | |
| |
| Earnings per share: diluted | | – Canadian GAAP net income | | $ | 4.64 | | | $ | 4.42 | | | $ | 3.44 | |
| | | – United States GAAP net income before cumulative impact of an accounting change | | | 4.40 | | | | 4.42 | | | | 3.35 | |
| | | – Cumulative impact of an accounting change | | | – | | | | (0.22 | ) | | | – | |
| | | – United States GAAP net income | | | 4.40 | | | | 4.20 | | | | 3.35 | |
| |
Certain comparative figures have been reclassified to conform with the current year’s presentation.
| | | |
| 130 | | BMO Financial Group 188th Annual Report 2005 |
| | | | | | | | | | | | | | | | | | | | | | | | | |
| Condensed Consolidated Balance Sheet | | | | | | | | | | | | |
| As at October 31 (Canadian $ in millions) | | 2005 | | | 2004 | |
| | | Canadian | | | Increase | | | United States | | | Canadian | | | Increase | | | United States | |
| | | GAAP | | | (Decrease) | | | GAAP | | | GAAP | | | (Decrease) | | | GAAP | |
| |
Assets | | | | | | | | | | | | | | | | | | | | | | | | |
Cash resources(a) | | $ | 20,721 | | | $ | – | | | $ | 20,721 | | | $ | 18,045 | | | $ | 28 | | | $ | 18,073 | |
| Securities | | | | | | | | | | | | | | | | | | | | | | | | |
Investment and loan substitutes(n) | | | 12,947 | | | | (12,947 | ) | | | – | | | | 15,028 | | | | (15,028 | ) | | | – | |
| Trading | | | 44,309 | | | | – | | | | 44,309 | | | | 35,444 | | | | – | | | | 35,444 | |
Available for sale(d,j,n) | | | – | | | | 14,102 | | | | 14,102 | | | | – | | | | 15,873 | | | | 15,873 | |
Loans and customers’ liability under acceptances, net of the allowance for credit losses(a,d) | | | 174,337 | | | | (15 | ) | | | 174,322 | | | | 156,248 | | | | 20,796 | | | | 177,044 | |
Derivative financial instruments(a,d) | | | 31,517 | | | | 391 | | | | 31,908 | | | | 25,448 | | | | 327 | | | | 25,775 | |
Premises and equipment(f) | | | 1,847 | | | | 79 | | | | 1,926 | | | | 2,020 | | | | 127 | | | | 2,147 | |
Goodwill(h) | | | 1,091 | | | | (41 | ) | | | 1,050 | | | | 1,507 | | | | (43 | ) | | | 1,464 | |
Intangible assets(h) | | | 196 | | | | (21 | ) | | | 175 | | | | 480 | | | | (26 | ) | | | 454 | |
Other assets(a,d,g,n) | | | 10,567 | | | | 658 | | | | 11,225 | | | | 10,974 | | | | 163 | | | | 11,137 | |
| |
| Total Assets | | $ | 297,532 | | | $ | 2,206 | | | $ | 299,738 | | | $ | 265,194 | | | $ | 22,217 | | | $ | 287,411 | |
| |
| | | | | | | | | | | | | | | | | | | | | | | | | |
Liabilities and Shareholders’ Equity | | | | | | | | | | | | | | | | | | | | | | | | |
| Deposits | | $ | 193,793 | | | $ | 53 | | | $ | 193,846 | | | $ | 175,190 | | | $ | 4 | | | $ | 175,194 | |
Derivative financial instruments(a,d) | | | 28,868 | | | | 62 | | | | 28,930 | | | | 23,973 | | | | (13 | ) | | | 23,960 | |
| Acceptances | | | 5,934 | | | | – | | | | 5,934 | | | | 5,355 | | | | – | | | | 5,355 | |
| Securities sold but not yet purchased | | | 16,142 | | | | – | | | | 16,142 | | | | 10,441 | | | | – | | | | 10,441 | |
| Securities lent or sold under repurchase agreements | | | 22,657 | | | | – | | | | 22,657 | | | | 21,345 | | | | – | | | | 21,345 | |
Other liabilities(d,j,k) | | | 12,203 | | | | 3,220 | | | | 15,423 | | | | 12,156 | | | | 23,179 | | | | 35,335 | |
Subordinated debt(d) | | | 2,469 | | | | (40 | ) | | | 2,429 | | | | 2,395 | | | | 9 | | | | 2,404 | |
Preferred share liability(k) | | | 450 | | | | (450 | ) | | | – | | | | 450 | | | | (450 | ) | | | – | |
Capital trust securities(k) | | | 1,150 | | | | (1,150 | ) | | | – | | | | 1,150 | | | | (1,150 | ) | | | – | |
Shareholders’ equity(d,m) | | | 13,866 | | | | 511 | | | | 14,377 | | | | 12,739 | | | | 638 | (1) | | | 13,377 | |
| |
| Total Liabilities and Shareholders’ Equity | | $ | 297,532 | | | $ | 2,206 | | | $ | 299,738 | | | $ | 265,194 | | | $ | 22,217 | | | $ | 287,411 | |
| |
(1) Includes cumulative adjustment to shareholders’equity arising from current and prior years’ GAAP differences.
Certain comparative figures have been reclassified to conform with the current year’s presentation.
| | | | | | | | | | | | | |
| Consolidated Statement of Comprehensive Income | | | | | | | | | |
| For the Year Ended October 31 (Canadian $ in millions) | | 2005 | | | 2004 | | | 2003 | |
| |
| Net income (under United States GAAP) | | $ | 2,276 | | | $ | 2,241 | | | $ | 1,782 | |
| |
| Other Comprehensive Income, net of income taxes: | | | | | | | | | | | | |
Unrealized loss on translation of net investments in foreign operations, net of hedging activities(1) | | | (114 | ) | | | (295 | ) | | | (597 | ) |
Unrealized holding gains (losses) on available-for-sale securities, net of hedging activities(2) | | | 99 | | | | (4 | ) | | | 76 | |
Realized (gains) and write-downs on available-for-sale securities recognized in net income(3) | | | (107 | ) | | | (114 | ) | | | (25 | ) |
Unrealized losses on derivatives designated as cash flow hedges(4) | | | (49 | ) | | | (205 | ) | | | (37 | ) |
Net gains on derivatives designated as cash flow hedges recognized in net income(5) | | | 5 | | | | 253 | | | | 21 | |
Minimum pension liability(6) | | | 12 | | | | (5 | ) | | | (45 | ) |
| |
| Total Other Comprehensive Loss | | | (154 | ) | | | (370 | ) | | | (607 | ) |
| |
| Comprehensive Income | | $ | 2,122 | | | $ | 1,871 | | | $ | 1,175 | |
| |
(1) Net of income taxes of $102 million ($254 million in 2004; $601 million in 2003).
(2) Net of income taxes of $53 million ($2 million in 2004; $37 million in 2003).
(3) Net of income taxes of $58 million ($64 million in 2004; $14 million in 2003).
(4) Net of income taxes of $26 million ($110 million in 2004; $19 million in 2003).
(5) Net of income taxes of $41 million ($209 million in 2004; $12 million in 2003).
(6) Net of income taxes of $26 million ($3 million in 2004; $30 million in 2003).
(a) Variable Interest Entities
Under United States GAAP, we adopted a new accounting standard on the consolidation of variable interest entities (“VIEs”) effective January 31, 2004. Under this new standard, we consolidate the financial results of VIEs if the investments we hold in these entities and/or the relationships we have with them result in us being exposed to a majority of their expected losses, being able to benefit from a majority of their expected residual returns, or both, based on a calculation determined by the standard setters.
When we adopted this new U.S. accounting standard on January 31, 2004, it resulted in the consolidation of our multi-seller conduits. We recorded a one-time transition adjustment of $111 million related to unrealized losses on interest rate swaps held by our VIEs to hedge their exposure to interest rate risk in the Consolidated Statement of Income, as the cumulative effect
of an accounting change. These derivative instruments had been accounted for as hedging derivatives under Canadian GAAP but did not meet the detailed hedge accounting requirements under United States GAAP in prior periods. As a result, although they are effective as economic hedges, they are required to be marked to market under United States GAAP. The liability associated with these unrealized losses will reverse, with a corresponding increase in net income, over the remaining terms of the swaps for United States GAAP reporting.
The impact of the new standard on our Consolidated Balance Sheet as at October 31, 2004 was an increase in cash resources of $28 million, an increase in loans of $20,805 million, a decrease in derivative assets of $51 million, an increase in other assets of $25 million, a decrease in derivative liabilities of $13 million, an increase in other liabilities of $20,849 million and a decrease in shareholders’ equity of $29 million.
| | | |
| BMO Financial Group 188th Annual Report 2005 | | 131 |
Notes to Consolidated Financial Statements
On April 29, 2005, we restructured our multi-seller conduits by either terminating or changing the terms of our swaps with the VIEs and amending some of the rights of note holders in the VIEs. As a result, they no longer meet the criteria for consolidation. The impact of deconsolidating these VIEs was an increase in non-interest revenue of $13 million representing the reversal of unamortized mark-to-market losses on swaps.
(b) Mortgage Prepayment Fees
Under United States GAAP, mortgage prepayment fees are recognized in income when the related mortgage is prepaid or renegotiated at market rates. Prior to November 1, 2003 these fees were deferred and amortized to income over the average remaining term of the related mortgages under Canadian GAAP.
Effective November 1, 2003, we adopted a new Canadian accounting standard on sources of GAAP that eliminated this difference and resulted in recording in income, for Canadian GAAP purposes, the balance of deferred mortgage prepayment fees as at November 1, 2003 of $42 million before income taxes. This amount was already recognized in net income under United States GAAP.
(c) Securitizations
Under United States GAAP, gains on all of our securitizations are recorded at the date of the securitization. Under Canadian GAAP, prior to July 1, 2001, gains on sales of NHA-insured mortgages were recorded at the date of the securitization and gains on sales of other loans securitized were deferred and recorded over the life of the loans securitized. Effective July 1, 2001, we adopted a new Canadian accounting standard on securitizations that eliminated this difference for securitizations that took place after July 1, 2001. There was an adjustment to our Consolidated Statement of Income until the deferred gains related to loans securitized prior to July 1, 2001 were recorded in income.
(d) Derivatives
Under United States GAAP, hedging derivatives are recorded at fair value in our Consolidated Balance Sheet. Changes in the fair value of hedging derivatives are either offset in our Consolidated Statement of Income against the change in the fair value of the hedged asset, liability or firm commitment, or are recorded in other comprehensive income until the hedged item is recorded in our Consolidated Statement of Income. If the change in the fair value of the derivative is not completely offset by the change in the fair value of the item it is hedging, the difference is recorded immediately in our Consolidated Statement of Income.
Under Canadian GAAP, hedging derivatives are accounted for on an accrual basis, with gains or losses deferred and recorded in income on the same basis as the underlying hedged item.
(e) Stock Options
Under United States GAAP, the fair value of stock options on their grant date is recorded as compensation expense over the period that the options vest. Under Canadian GAAP, prior to November 1, 2002, we included the amount of proceeds in shareholders’ equity when the options were exercised and did not recognize any compensation expense. Effective November 1, 2002, we adopted a new Canadian accounting standard on stock-based compensation that eliminated this difference for stock options granted on or after November 1, 2002. As a result, there will continue to be an adjustment to our Consolidated Statement of Income until stock option expense has been fully recognized for stock options granted prior to November 1, 2002 under United States GAAP.
(f) Software Development Costs
Under United States GAAP, costs of internally developed software are required to be capitalized and amortized over the
expected useful life of the software. Under Canadian GAAP, prior to November 1, 2003, only costs paid to third parties related to internally developed software were capitalized and amortized over the expected useful life of the software. Effective November 1, 2003, we adopted a new Canadian accounting standard on sources of GAAP that eliminated this difference for software development costs incurred after October 31, 2003. There will continue to be an adjustment to our Consolidated Statement of Income until software development costs capitalized prior to fiscal 2004 are fully amortized.
(g) Pension and Related Benefits
Under United States GAAP, both pension and other employee future benefits are recorded in our Consolidated Statement of Income in the period services are provided by our employees. The related obligations are valued using current market rates. Under Canadian GAAP, prior to November 1, 2000, pension benefits were recorded in our Consolidated Statement of Income in the period services were provided by our employees, with the corresponding obligation valued using management’s best estimate of the long-term rate of return on assets, while other employee future benefits were expensed as incurred. Effective November 1, 2000, we adopted a new Canadian accounting standard on pension and other employee future benefits that eliminated the difference between Canadian and United States GAAP. When we adopted this new standard, we accounted for the change in accounting as a charge to retained earnings. As a result, there will continue to be an adjustment to our Consolidated Statement of Income until amounts previously deferred under United States GAAP have been fully amortized to income.
(h) Goodwill and Other Assets
Under United States GAAP, our acquisition of Suburban Bancorp, Inc. in 1994 would have been accounted for using the pooling of interests method. Under Canadian GAAP, we accounted for this acquisition using the purchase method, which resulted in the recognition and amortization of goodwill and other intangible assets associated with the acquisition. Effective November 1, 2001, goodwill is no longer amortized to income under either United States or Canadian GAAP. The remaining difference relates to the amortization of intangible assets under Canadian GAAP.
(i) Income Taxes
In addition to the tax impact of differences outlined above, under United States GAAP, tax rate changes do not impact the measurement of our future income tax balances until they are passed into law. Under Canadian GAAP, tax rate changes are recorded in income in the period of change.
(j) Non-Cash Collateral
Under United States GAAP, non-cash collateral received in security lending transactions that we are permitted by contract to sell or re-pledge is recorded as an asset in our Consolidated Balance Sheet and a corresponding liability is recorded for the obligation to return the collateral. Under Canadian GAAP, such collateral and the related obligation are not recorded in our Consolidated Balance Sheet. As a result of this difference, available for sale securities and other liabilities have been increased by $2,191 million and $1,289 million for the years ended October 31, 2005 and 2004, respectively.
(k) Liabilities and Equity
Under United States GAAP, certain of our preferred shares and capital trust securities are classified as equity and non-controlling interest, respectively. Under Canadian GAAP, as both instruments are ultimately convertible into a variable number of our common shares at the holders’ option, they are classified as liabilities. Prior year Canadian GAAP financial statements have been restated.
| | | |
| 132 | | BMO Financial Group 188th Annual Report 2005 |
(l) Merchant Banking Investments
Under United States GAAP, our merchant banking subsidiaries account for their investments at cost or under the equity method. Under Canadian GAAP, these subsidiaries account for their investments at fair value with changes in fair value recorded in income as they occur.
(m) Shareholders’ Equity
Accumulated other comprehensive income is recorded as a separate component of shareholders’ equity under United States GAAP. Canadian GAAP does not permit presentation of other comprehensive income.
The accumulated balances related to each component of other comprehensive income, net of income taxes, are as follows:
| | | | | | | | | |
| (Canadian $ in millions) | | 2005 | | | 2004 | |
| |
| Unrealized loss on translation of net investments in foreign operations, net of hedging activities | | $ | (585 | ) | | $ | (471 | ) |
| Net unrealized gains on available-for-sale securities (n) | | | 3 | | | | 11 | |
| Unrealized gains on derivatives designated as cash flow hedges (d) | | | 230 | | | | 274 | |
| Minimum pension liability (o) | | | (38 | ) | | | (50 | ) |
| |
| Total Accumulated Other Comprehensive Loss | | $ | (390 | ) | | $ | (236 | ) |
| |
(n) Available-for-Sale Securities
Under United States GAAP, we have designated as available-for-sale all of our investment securities and loan substitute securities, other than investments in corporate equity where we exert significant influence but not control. Available-for-sale securities are carried at fair value, with any unrealized gains or losses recorded in other comprehensive income. Under Canadian GAAP, investment securities are carried at cost, amortized cost or adjusted cost. Investments in corporate equity where we exert significant influence but not control are classified in other assets under United States GAAP.
(o) Minimum Pension Liability
Under United States GAAP, we must recognize an additional pension liability in cases where the pension obligation, calculated without taking salary increases into account, exceeds the fair value of pension assets at year end. The amount of the minimum pension liability is recognized in other comprehensive income. The pension obligation, calculated without taking salary increases into account, was $3,582 million and $3,087 million as at October 31, 2005 and 2004, respectively. Under Canadian GAAP, there is no similar requirement.
| | | |
| BMO Financial Group 188th Annual Report 2005 | | 133 |
Bank-Owned Corporations
| | | | | | | | | |
| | | | | | | Book value of common and | |
| Corporations in which the Bank owns more than | | | | | | preferred shares owned by the Bank | |
| 50% of the issued and outstanding voting shares | | Head office | | (Canadian $ in millions) | |
| |
| 4197569 Canada Inc. | | Toronto, Canada | | | – | |
| Bank of Montreal Assessoria e Serviços Ltda. | | Rio de Janeiro, Brazil | | | – | |
| Bank of Montreal Capital Markets (Holdings) Limited | | London, England | | | 88 | |
| BMO Nesbitt Burns Limited (U.K.) | | London, England | | | | |
| Bank of Montreal Finance Ltd. | | Toronto, Canada | | | 30 | |
| Bank of Montreal Global Capital Solutions Ltd. | | Calgary, Canada | | | 13 | |
| Bank of Montreal Holding Inc. | | Calgary, Canada | | | 15,642 | |
| Bank of Montreal Holding Enterprise Inc. | | Toronto, Canada | | | | |
| Bank of Montreal Holding Investments Inc. | | Calgary, Canada | | | | |
| Bank of Montreal Securities Canada Limited | | Toronto, Canada | | | | |
| BMO Nesbitt Burns Corporation Limited | | Montreal, Canada | | | | |
| BMO Nesbitt Burns Inc. and subsidiaries | | Toronto, Canada | | | | |
| BMO Holding Finance, LLC | | Wilmington, United States | | | | |
| BMO Investments Limited | | Hamilton, Bermuda | | | | |
| Bank of Montreal (Barbados) Limited | | St. Michael, Barbados | | | | |
| Bank of Montreal Insurance (Barbados) Limited | | Bridgetown, Barbados | | | | |
| Bank of Montreal Trust Company (C.I.) Limited | | Guernsey, Channel Islands | | | | |
| BMO Nesbitt Burns Trading Corp. S.A. | | Münsbach, Luxembourg | | | | |
| BMO Service Inc. | | Calgary, Canada | | | | |
| Bank of Montreal Ireland plc | | Dublin, Ireland | | | 1,186 | |
| Bank of Montreal Mortgage Corporation | | Calgary, Canada | | | 1,997 | |
| BMO Capital Corporation | | Toronto, Canada | | | 67 | |
| BMO GP Inc. | | Toronto, Canada | | | – | |
| BMO Investments Inc. | | Toronto, Canada | | | 83 | |
| BMO InvestorLine Inc. | | Toronto, Canada | | | 25 | |
| BMO Ireland Finance Company | | Dublin, Ireland | | | 530 | |
| BMO Life Insurance Company | | Toronto, Canada | | | 38 | |
| BMO Nesbitt Burns Equity Partners Inc. | | Toronto, Canada | | | 82 | |
| BMO (NS) Investment Company | | Halifax, Canada | | | 1,651 | |
| BMO (US) Funding, LLC | | Chicago, United States | | | | |
| BMO Trust Company | | Toronto, Canada | | | 355 | |
| Guardian Group of Funds Ltd. | | Toronto, Canada | | | | |
| BMO (US) Lending, LLC | | Chicago, United States | | | 17 | |
| Harris Financial Corp. | | Wilmington, United States | | | 5,225 | |
| BMO Financial, Inc. | | Wilmington, United States | | | | |
| BMO Global Capital Solutions, Inc. | | Wilmington, United States | | | | |
| BMO Nesbitt Burns Equity Group (U.S.), Inc. and | | | | | | |
| subsidiaries | | Chicago, United States | | | | |
| EFS (U.S.), Inc. and subsidiary | | Chicago, United States | | | | |
| Harris Bancorp Insurance Services, Inc. | | Chicago, United States | | | | |
| Harris Bankcorp, Inc. | | Chicago, United States | | | | |
| Harris Central N.A. | | Roselle, United States | | | | |
| Harris Investment Management, Inc. and subsidiary | | Chicago, United States | | | | |
| Harris Life Insurance Company | | Scottsdale, United States | | | | |
| Harris National Association and subsidiaries | | Chicago, United States | | | | |
| Harris Trade Services Limited | | Hong Kong, China | | | | |
| Mercantile National Bank of Indiana | | Hammond, United States | | | | |
| NLSB Bank | | New Lenox, United States | | | | |
| The Harris Bank N.A. | | Scottsdale, United States | | | | |
| Harris Nesbitt Corp. | | Chicago, United States | | | | |
| Harris Nesbitt Financing, Inc. | | Chicago, United States | | | | |
| Harris RIA Holdings, Inc. and subsidiaries | | Wilmington, United States | | | | |
| MyChoice Inc. | | Toronto, Canada | | | – | |
| |
The above is a list of all our directly held corporations, as well as their directly held corporations, and thereby includes all of our major operating companies. The book values of the corporations shown represent the total common and preferred equity value of our holdings.
We own 100% of the voting shares of the above corporations except for Bank of Montreal Finance Ltd., of which we own 50.01% and MyChoice Inc., of which we own 80%.
We own 100% of the outstanding non-voting shares of subsidiaries except for Bank of Montreal Securities Canada Limited, of which we own 97.45% of the outstanding non-voting shares.
| | | |
| 134 | | BMO Financial Group 188th Annual Report 2005 |
Members of Management Board
F. Anthony Comper*
President and
Chief Executive Officer
William A. Downe*
Deputy Chair
BMO Financial Group and
Chief Executive Officer
BMO Nesbitt Burns and Head
Investment Banking Group
Sherry S.Cooper
Executive Vice-President
and Global Economic
Strategist
Susan M. Payne
Senior Vice-President and
Head of Marketing and
Client Strategy and
Executive Vice-President
and Managing Director
BMO Nesbitt Burns
Investment Banking Group
Yvan J.P. Bourdeau*
President and
Chief Operating Officer
BMO Nesbitt Burns
Ellen M.Costello
Vice-Chair, Harris Nesbitt
New York and Head
Securitization and Credit
Investment Management
Marnie J.Kinsley
Executive Managing Director
and Head of Cash
Management Services
L. Jacques Ménard
Chairman, BMO Nesbitt Burns
and President, BMO Financial
Group, Quebec
Frederick J. Mifflin
Vice-Chair, BMO Nesbitt Burns
and Deputy Head, I&CB
Tom V.Milroy
Vice-Chair, BMO Nesbitt Burns
Eric C.Tripp
Vice-Chair, BMO Nesbitt Burns
and Head of Capital Markets
Private Client Group
Gilles G. Ouellette*
President and
Chief Executive Officer
Barry M.Cooper
Chairman and
Chief Executive Officer
Jones Heward and
Head, Mutual Fund
Investments
Dean Manjuris
Head, Full Service Brokerage
Line of Business and
President and Director
Private Client Division
BMO Nesbitt Burns
Graham T. Parsons
Executive Vice-President
Global Private Banking
Wally Gabler III**
Head of Sales & Distribution
Personal and Commercial
Client Group and
Executive Vice-President
and Director
Private Client Division
BMO Nesbitt Burns
Harris Bankcorp, Inc.
Franklin J.Techar*
President and
Chief Executive Officer
Harris Bankcorp, Inc.
Yasmin T. Bates
Executive Vice-President
Chicagoland – South Division
Timothy S. Crane
Executive Vice-President
Chicagoland – North Division
Sandra L. Hanington
Executive Vice-President
Product Management
and Segment Management
and Marketing
Peter B. McNitt
Executive Vice-President
Business Banking Division
Charles R. Tonge
Vice-Chair
Personal and Commercial
Client Group
Robert W. Pearce*
President and
Chief Executive Officer
Personal and Commercial
Client Group
Maurice A.D. Hudon
Senior Executive
Vice-President
and Head of National Office
Pamela J. Robertson
Executive Vice-President
Neil L. Glasberg**
Senior Vice-President
BMO Bank of Montreal Direct
Francois M.P. Hudon**
Senior Vice-President
Quebec and Atlantic Divisions
Jacqueline Irvine
Senior Vice-President
Personal & Commercial
Development
James B.Kelsey**
Senior Vice-President
Corporate Finance Division
Ted R. McCarron**
Senior Vice-President
Prairies Division
Richard D. Rudderham**
Senior Vice-President
British Columbia Division
Carol K.Snider**
Senior Vice-President
Ontario Division
Finance, Corporate and Legal,
Enterprise Risk & Portfolio
Management Group
Karen E. Maidment*
Senior Executive
Vice-President and
Chief Financial Officer
Neil R. Macmillan
Executive Vice-President
and Senior Risk Officer
Investment Banking Group
Robert L. McGlashan
Executive Vice-President
and Chief Risk Officer
Wendy Millar
Executive Vice-President
and Senior Risk Officer
Personal and Commercial
Client Group and Private
Client Group
Penelope F. Somerville
Executive Vice-President
and Senior Market
Risk Officer
Thomas E. Flynn
Executive Vice-President
Finance and Treasurer
Ronald B. Sirkis
Executive Vice-President
General Counsel & Taxation
Pierre O. Greffe
Senior Vice-President, Finance
Technology and Solutions
Lloyd F. Darlington*
President and
Chief Executive Officer
Technology and Solutions
Barry K. Gilmour
Deputy Group Head and
Chief Operating Officer
Karen L. Metrakos
Senior Vice-President
Operations
David J. Revell
Senior Vice-President
Corporate Technology
Development
Michael J. Thornburrow
Senior Vice-President
Corporate Real Estate and
Strategic Sourcing
Human Resources and Office
of Strategic Management
Rose M. Patten*
Senior Executive
Vice-President
Human Resources and Office
of Strategic Management
Neil J.F. Conway
Senior Vice-President
and Deputy Head
Human Resources
Deborah L. Lucas
Senior Vice-President
Performance Alignment
and Compensation
Joan T. Dea†
Senior Vice-President
Strategy and Performance
Enhancement, Office of
Strategic Management
| | |
| | | As of December 1, 2005 |
| |
| * | | Members of Management Board Executive Committee |
| |
| ** | | Rotating Members of the Management Board |
| |
| † | | Secretary of Management Board Executive Committee |
| | | |
| BMO Financial Group 188th Annual Report 2005 | | 135 |
Glossary of Financial Terms
Allowance for Credit Losses
Represents an amount deemed adequate by management to absorb credit-related losses on loans and acceptances and other credit instruments. Allowances for credit losses can be specific or general and are recorded on the balance sheet as a deduction from loans and acceptances or, as it relates to credit instruments, as other liabilities.
Assets under Administration and under Management
Assets administered or managed by a financial institution that are beneficially owned by clients and therefore not reported on the balance sheet of the administering or managing financial institution.
Average Earning Assets
Represents the daily or monthly average balance of deposits with other banks and loans and securities, over a one-year period.
Bankers’ Acceptances (BAs)
Bills of exchange or negotiable instruments drawn by a borrower for payment at maturity and accepted by a bank. BAs constitute a guarantee of payment by the bank and can be traded in the money market. The bank earns a “stamping fee” for providing this guarantee.
Basis Point
One one-hundredth of a percentage point.
Derivatives
Contracts whose value is “derived” from movements in interest or foreign exchange rates, or equity or commodity prices. Derivatives allow for the transfer, modification or reduction of current or expected risks from changes in rates and prices.
Hedging
A risk management technique used to neutralize or manage interest rate, foreign currency, equity, commodity or credit exposures arising from normal banking activities.
Impaired Loans
Loans for which there is no longer reasonable assurance of the timely collection of principal or interest.
Innovative Tier 1 Capital
OSFI allows banks to issue instruments that qualify as “Innovative” Tier 1 capital. In order to qualify, these instruments have to be issued indirectly through a special purpose entity, be permanent in nature and free of any fixed charges and accounted for as non-controlling interests. Innovative Tier 1 capital cannot comprise more than 15% of net Tier 1 capital and the sum of innovative Tier 1 capital and non-cumulative perpetual preferred shares cannot exceed 25% of net Tier 1 capital.
Mark-to-Market
Represents valuation of securities and derivatives held for trading purposes at market rates as of the balance sheet date, where required by accounting rules.
Notional Amount
The principal used to calculate interest and other payments under derivative contracts. The principal amount does not change hands under the terms of a derivative contract, except in the case of cross-currency swaps.
Provision for Credit Losses
A charge to income that represents an amount deemed adequate by management to fully provide for impairment in loans and acceptances and other credit instruments, given the composition of the portfolios, the probability of default, the economic environment and the allowance for credit losses already established.
Regulatory Capital Ratios
The percentage of risk-weighted assets supported by capital, as defined by OSFI under the framework of risk-based capital standards developed by the Bank for International Settlements. These ratios are labeled Tier 1 and Total. Tier 1 capital is considered to be more permanent, consisting of common shares together with any qualifying non-cumulative preferred shares, less unamortized goodwill. Tier 2 capital consists of other preferred shares, subordinated debentures and the general allowance, within prescribed limits. The assets-to-capital multiple is defined as assets plus guarantees and letters of credit, net of specified deductions (or adjusted assets), divided by total capital.
Securities Borrowed or
Purchased under Resale Agreements
Low-cost, low-risk loans, often supported by the pledge of cash collateral, which arise from transactions that involve the borrowing or purchase of securities.
Securities Lent or
Sold under Repurchase
Agreements
Low-cost, low-risk liabilities, often supported by cash collateral, which arise from transactions that involve the lending or sale of securities.
| | | | | |
Other Definitions | | Page |
| Cash Productivity Ratio | | | 41 | |
| Earnings per Share (EPS) | | | 33 | |
| Expense-to-Revenue Ratio (or Productivity Ratio) | | | 41 | |
| Forwards and Futures | | | 107 | |
| General Allowance | | | 100 | |
| Net Economic Profit (NEP) | | | 34 | |
| Net Interest Income | | | 37 | |
| Net Interest Margin | | | 37 | |
| Off-Balance Sheet Arrangements | | | 61 | |
| Options | | | 107 | |
| Productivity Ratio (see Expense-to-Revenue Ratio) | | | | |
| Return on Equity (ROE) | | | 34 | |
| Specific Allowances | | | 100 | |
| Swaps | | | 106 | |
| Taxable Equivalent Basis | | | 37 | |
| Tier 1 Capital Ratio (see Regulatory Capital Ratios) | | | | |
| Total Capital Ratio (see Regulatory Capital Ratios) | | | | |
| Total Shareholder Return (TSR) | | | 32 | |
| Trading-Related Revenues | | | 39 | |
| Variable interest Entities | | | 61 | |
| | | | | |
Risk-Related Definitions | | | | |
| Business Risk Due to Earnings Volatility | | | 74 | |
| Capital at Risk (CaR) | | | 68 | |
| Credit and Counterparty Risk | | | 69 | |
| Earnings Volatility (EV) | | | 70 | |
| Environmental Risk | | | 74 | |
| Issuer Risk | | | 70 | |
| Liquidity and Funding Risk | | | 72 | |
| Market Risk | | | 70 | |
| Market Value Exposure (MVE) | | | 70 | |
| Operational Risk | | | 73 | |
| Reputation Risk | | | 74 | |
| Value at Risk (VaR) | | | 70 | |
| | | |
| 136 | | BMO Financial Group 188th Annual Report 2005 |
Shareholder Information
Common Share Trading Information during Fiscal 2005
| | | | | | | | | | | | | | | | | | | | | |
| | | | | | | Year-end price | | | | | | | | | | | Total volume of | |
| Primary stock exchanges | | Ticker | | | October 31, 2005 | | | High | | | Low | | | shares traded | |
| |
| Toronto | | BMO | | | $57.81 | | | $ | 62.44 | | | $ | 53.05 | | | 324.7 million |
| New York | | BMO | | | US$49.02 | | | US$ | 51.62 | | | US$ | 42.88 | | | 8.4 million |
| |
Dividends per Share Declared during Fiscal Year
| | | | | | | | | | | | | | | | | | | | | | | | | | | | | |
| | | | | | | Shares outstanding | | | | | | | | | | | | | | | | |
| Issue/Class | | Ticker | | | at October 31, 2005 | | | 2005 | | | 2004 | | | 2003 | | | 2002 | | | 2001 | |
| |
| Common (a) | | BMO | | | 500,219,068 | | | $ | 1.85 | | | $ | 1.59 | | | $ | 1.34 | | | $ | 1.20 | | | $ | 1.12 | |
Preferred Class B | | | | | | | | | | | | | | | | | | | | | | | | | | | | |
| Series 1 (b) | | | | | | | – | | | | – | | | | | | | | – | | | | – | | | $ | 0.57 | |
| Series 2 (c) | | | | | | | – | | | | – | | | | | | | | – | | | | – | | | US$ | 1.28 | |
| Series 3 (d) | | BMO F | | | – | | | | – | | | $ | 1.18 | | | $ | 1.39 | | | $ | 1.39 | | | $ | 1.39 | |
| Series 4 (e) | | BMO G | | | 8,000,000 | | | $ | 1.20 | | | $ | 1.20 | | | $ | 1.20 | | | $ | 1.20 | | | $ | 1.20 | |
| Series 5 (e) | | BMO H | | | 8,000,000 | | | $ | 1.33 | | | $ | 1.33 | | | $ | 1.33 | | | $ | 1.33 | | | $ | 1.33 | |
| Series 6 (e) | | BMO I | | | 10,000,000 | | | $ | 1.19 | | | $ | 1.19 | | | $ | 1.19 | | | $ | 1.19 | | | $ | 1.19 | |
| Series 10 (f) | | BMO V | | | 12,000,000 | | | US$ | 1.49 | | | US$ | 1.49 | | | US$ | 1.49 | | | US$ | 1.39 | | | | – | |
| |
| | |
| (a) | | Common share dividends have been restated to reflect the two-for-one stock distribution completed in March 2001. |
| |
| (b) | | The Class B Preferred Shares Series 1 were redeemed on February 26, 2001. |
| |
| (c) | | The Class B Preferred Shares Series 2 were redeemed on August 27, 2001. |
| |
| (d) | | The Class B Preferred Shares Series 3 were redeemed on September 30, 2004. |
| |
| (e) | | The Class B Preferred Shares were issued in February 1998 for Series 4 and 5, and in May 1998 for Series 6. |
| |
| (f) | | The Class B Preferred Shares Series 10 were issued in December 2001. |
2006 Dividend Dates
Subject to approval by the Board of Directors.
| | | | | |
| Common and preferred shares record dates | | Preferred shares payment dates | | Common shares payment dates |
| |
| February 3 | | February 27 | | February 27 |
| May 5 | | May 25 | | May 30 |
| August 4 | | August 25 | | August 30 |
| November 3 | | November 27 | | November 29 |
| |
|
| TheBank Actprohibits a bank from paying or declaring a dividend if it is or would thereby be in contravention of capital adequacy regulations. Currently this limitation does not restrict the payment of dividends on Bank of Montreal’s common or preferred shares. |
| | | |
Shareholder Administration
Computershare Trust Company of Canada, with transfer facilities in the cities of Halifax, Montreal, Toronto, Winnipeg, Calgary and Vancouver, serves as transfer agent and registrar for common and preferred shares. In addition, Computershare Investor Services PLC and Computershare Trust Company of New York serve as transfer agents and registrars for common shares in London, England and New York, respectively. | | For dividend information, change in share registration or address, lost certificates, estate transfers, or to advise of duplicate mailings, please call Bank of Montreal’s Transfer Agent and Registrar at
1-800-340-5021 (Canada and the United States), or at (514) 982-7800 (international), or write to Computershare Trust Company of Canada, 100 University Avenue, 9th Floor, Toronto, Ontario M5J 2Y1, e-mail to service@computershare.com, or fax
1-888-453-0330 (Canada and the United States) or (416) 263-9394 (international).
For all other shareholder inquiries, please write to Shareholder Services at the Corporate Secretary’s Department, 21st Floor, 1 First Canadian Place, Toronto, Ontario M5X 1A1, e-mail to corp.secretary@bmo.com, call (416) 867-6785, or fax (416) 867-6793. |
Market for Securities of Bank of Montreal
The common shares of Bank of Montreal are listed on the Toronto and New York stock exchanges. The preferred shares of Bank of Montreal are listed on the Toronto Stock Exchange.
Shareholder Dividend Reinvestment and Share Purchase Plan
The Shareholder Dividend Reinvestment and Share Purchase Plan provides a means for holders of record of common shares to reinvest cash dividends in common shares of Bank of Montreal without the payment of any commissions or service charges.
Shareholders of Bank of Montreal may also purchase additional common shares of Bank of Montreal in amounts up to $40,000 per fiscal year. Full details of the plan are available from Computer-share Trust Company of Canada or Shareholder Services.
Direct Dividend Deposit
Shareholders may choose to have dividends deposited directly to an account in any financial institution in Canada or the United States that provides electronic funds transfer facilities.
General Information
For general inquiries about company news and initiatives, or to obtain additional copies of the Annual Report, please contact the Corporate Communications Department, 302 Bay Street, 10th Floor, Toronto, Ontario M5X 1A1, or visit our web site at www.bmo.com. (On peut obtenir sur demande un exemplaire en français.)
Annual Meeting
The Annual Meeting of Shareholders will be held on Thursday, March 2, 2006 at 9:30 a.m. (Mountain Standard Time) at the Calgary TELUS Convention Centre, Calgary, Alberta, Canada.
Fees Paid to Shareholders’ Auditors
For fees paid to Shareholders’ Auditors, see page 5 of the Proxy Circular for the Annual Meeting of Shareholders, which will be held on March 2, 2006.
www.bmo.com/annualreport2005
| | | |
| | Online Information
BMO Financial Group is committed to open and full financial disclosure and best practices in corporate governance. We invite you to visit our web site atwww.bmo.com/investorrelations to find out more about our organization, our governance practices, our continuous disclosure materials including our Quarterly Financial Releases, our Annual Information Form as well as our Notice of Annual Meeting of Shareholders and Proxy Circular. Filings are accessible on the Canadian Securities Administrators’www.sedar.com, and on the EDGAR section of the SEC’s web site atwww.sec.gov. |
| | | |
Corporate Information
This BMO Financial Group 2005 Annual Report is available for viewing/printing on our web site at www.bmo.com. For a printed copy, please contact:
Corporate Communications Department
BMO Financial Group
302 Bay Street, 10th Floor
Toronto, Ontario M5X 1A1
(On peut obtenir sur demande un exemplaire en français.)
General Information
For general inquiries about company news and initiatives please contact our Corporate Communications Department. BMO Financial Group’s web site at www.bmo.com.
Shareholder Inquiries
For dividend information, change in share registration or address, lost certificates, estate transfers, or to advise of duplicate mailings, | | please call Bank of Montreal’s Transfer Agent and Registrar at
1-800-340-5021 (Canada and the United States), or at
(514) 982-7800 (international), or write to:
Computershare Trust Company of Canada
100 University Avenue, 9th Floor
Toronto, Ontario M5J 2Y1
Annual Meeting
The Annual Meeting of Shareholders will be held on Thursday, March 2, 2006 at 9:30 a.m. (Mountain Standard Time) at the Calgary TELUS Convention Centre, Calgary, Alberta, Canada.
Institutional Investors and Research Analysts
Institutional investors or research analysts who would likenews releases are available on our to obtain financial information should write to the Senior Vice-President, Investor Relations, 18th Floor, 1 First Canadian Place, Toronto, Ontario M5X 1A1, e-mail to investor.relations@bmo.com, call (416) 867-6656, or fax (416) 867-3367. Alternatively, please visit our web site at www.bmo.com/investorrelations. |
| | | | | | | |
| ® | | Registered trademark of Bank of Montreal | | ®4 | | Registered trademark of MISQuality Management Corp. |
| ®* | | “Nesbitt Burns” is a registered trademark of BMO Nesbitt Burns Corporation Limited | | ®5 | | Registered trademark of MasterCard International Incorporated |
| TM1/®1 | | Trademark/registered trademark of Harris Trust and Savings Bank | | ®6 | | Registered trademark of Moneris Solutions Corporation |
| ®2 | | Registered trademark of Skate Canada | | ®7 | | Registered trademark of Royal Bank of Canada |
| ®3 | | Registered trademark of The McGraw-Hill Companies, Inc. | | | | |