0000927972 tsr:benchmarkXIUSA04G7X_1324Member 2017-09-30 0000927972 tsr:bench202411014234_1297Member 2014-10-01 2024-09-30 0000927972 tsr:benchmarkXIUSA04G92_1271Member 2014-09-30 0000927972 tsr:benchmarkXIUSA000KP_1288Member 2022-09-30 0000927972 tsr:C000010480Member 2023-10-01 2024-09-30 0000927972 tsr:C000241049Member tsr:bench202411044292_1334Member 2024-09-30
UNITED STATES
SECURITIES AND EXCHANGE COMMISSION
Washington, D.C. 20549
FORM N-CSR
CERTIFIED SHAREHOLDER REPORT OF REGISTERED
MANAGEMENT INVESTMENT COMPANIES
| Investment Company Act file number | 811-08690 |
| |
| MassMutual Premier Funds |
| (Exact name of registrant as specified in charter) |
| 1295 State Street, Springfield, MA | 01111 |
| (Address of principal executive offices) | (Zip code) |
| | |
| Douglas Steele |
| 1295 State Street, Springfield, MA 01111 |
| (Name and address of agent for service) |
| |
| | | |
| Registrant’s telephone number, including area code: | (413) 744-1000 | |
| Date of fiscal year end: | 09/30/2024 | |
| | | |
| Date of reporting period: | 09/30/2024 | |
Item 1. Reports to Stockholders.
| (a) | The Reports to Stockholders are attached herewith. |
| | |
MassMutual U.S. Government Money Market Fund | |
| Class R5 | MKSXX |
| Annual Shareholder Report | September 30, 2024 |
This annual shareholder report contains important information about the MassMutual U.S. Government Money Market Fund (the “Fund”) for the period of October 1, 2023 to September 30, 2024. You can find additional information about the Fund at https://www.massmutual.com/product-performance/mutual-funds. You can also request this information by contacting us at 1-888-309-3539 or by sending an email request to fundinfo@massmutual.com.
This report describes changes to the Fund that occurred during the reporting period.
WHAT WERE THE FUND COSTS FOR THE LAST YEAR?
This example shows the expenses you would have paid over the past year, based on a hypothetical $10,000 investment. This table reflects any applicable waivers or expense limitations.
| | |
Class Name | Costs of a $10,000 investment | Costs paid as a percentage of a $10,000 investment |
| Class R5 | $54 | 0.53% |
HOW DID THE FUND PERFORM?
Global bond markets were broadly, and strongly, positive for the trailing one-year period. During the period, central banks responded to lower inflation data and began to lower policy interest rates, which was favorable for bond prices and returns. Macroeconomic sentiment centered, particularly more recently, on a soft-landing scenario in the U.S., providing a supportive credit risk environment. During the period, narrowing credit spreads were a positive return driver in the global bond market, in addition to the response to lower bond market yields. This resulted in broad gains across varied market sectors, including government bonds, investment grade and high yield corporate securities, mortgage- and asset-backed instruments, and emerging market issues.
Top contributors to the Fund’s performance relative to the FTSE 3 Month US T Bill Index:
• U.S. Agency discount notes which were the most heavily weighted asset type
• U.S. Treasury bills which were the next most heavily weighted asset type
Top detractors to the Fund’s performance relative to the FTSE 3 Month US T Bill Index:
• A low weighted average maturity given a flat yield curve for money market assets
• Daily repurchase agreement assets used for daily liquidity requirements
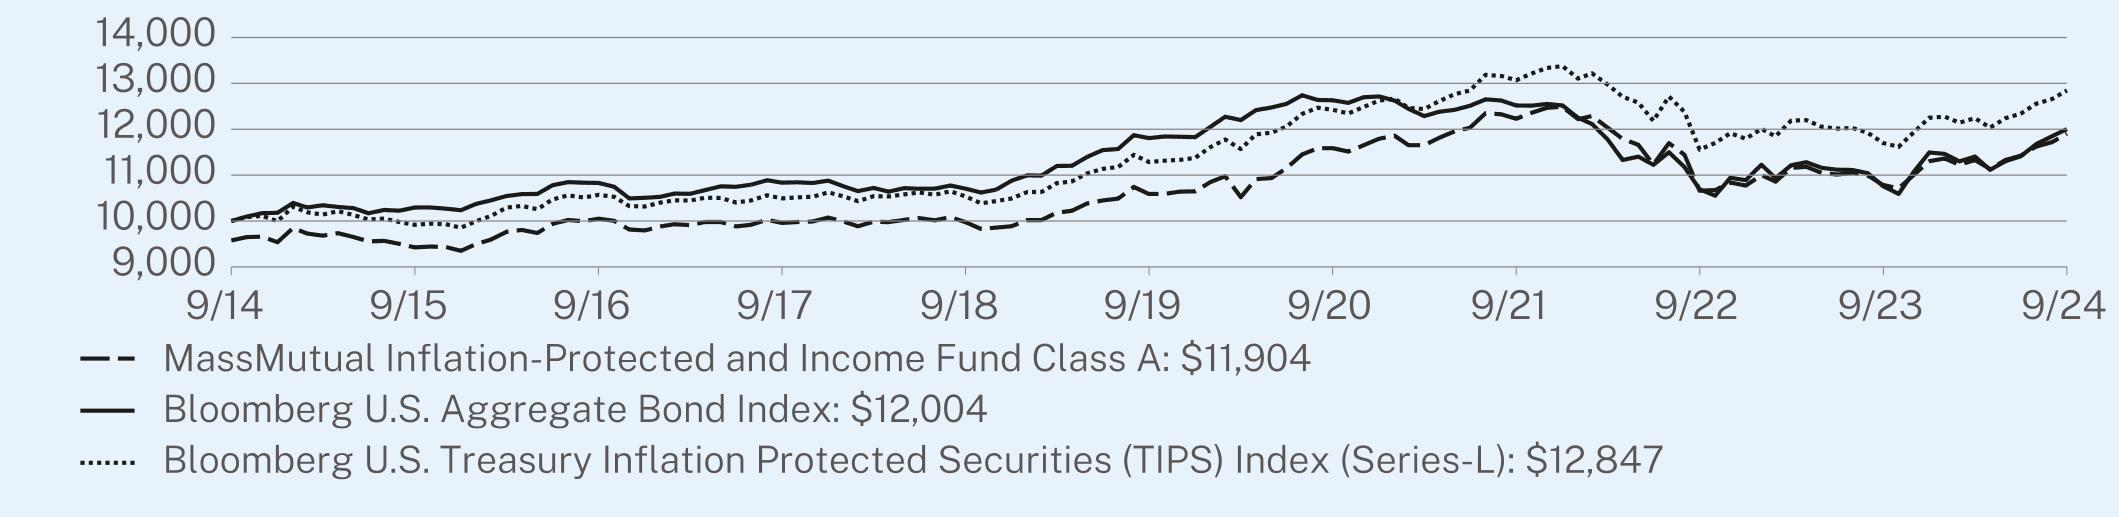
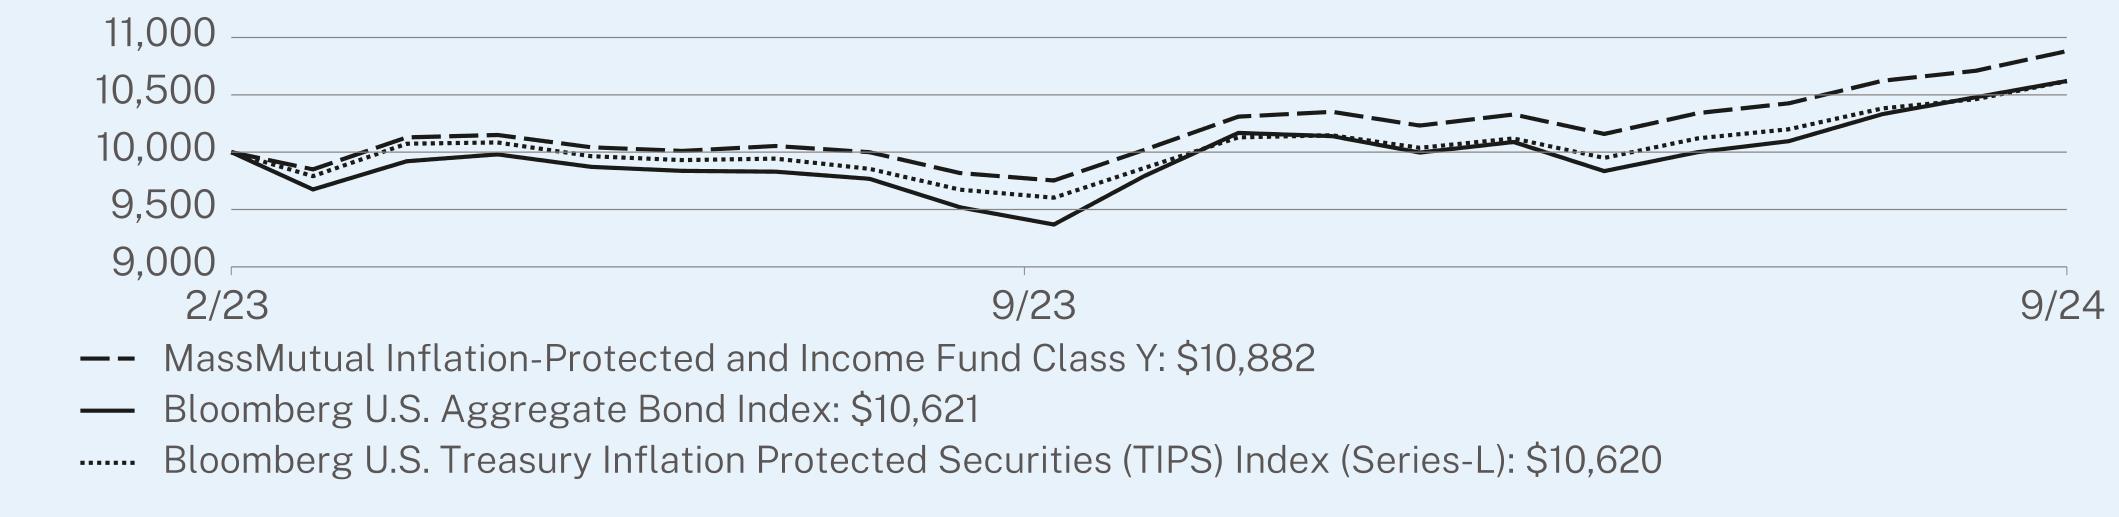
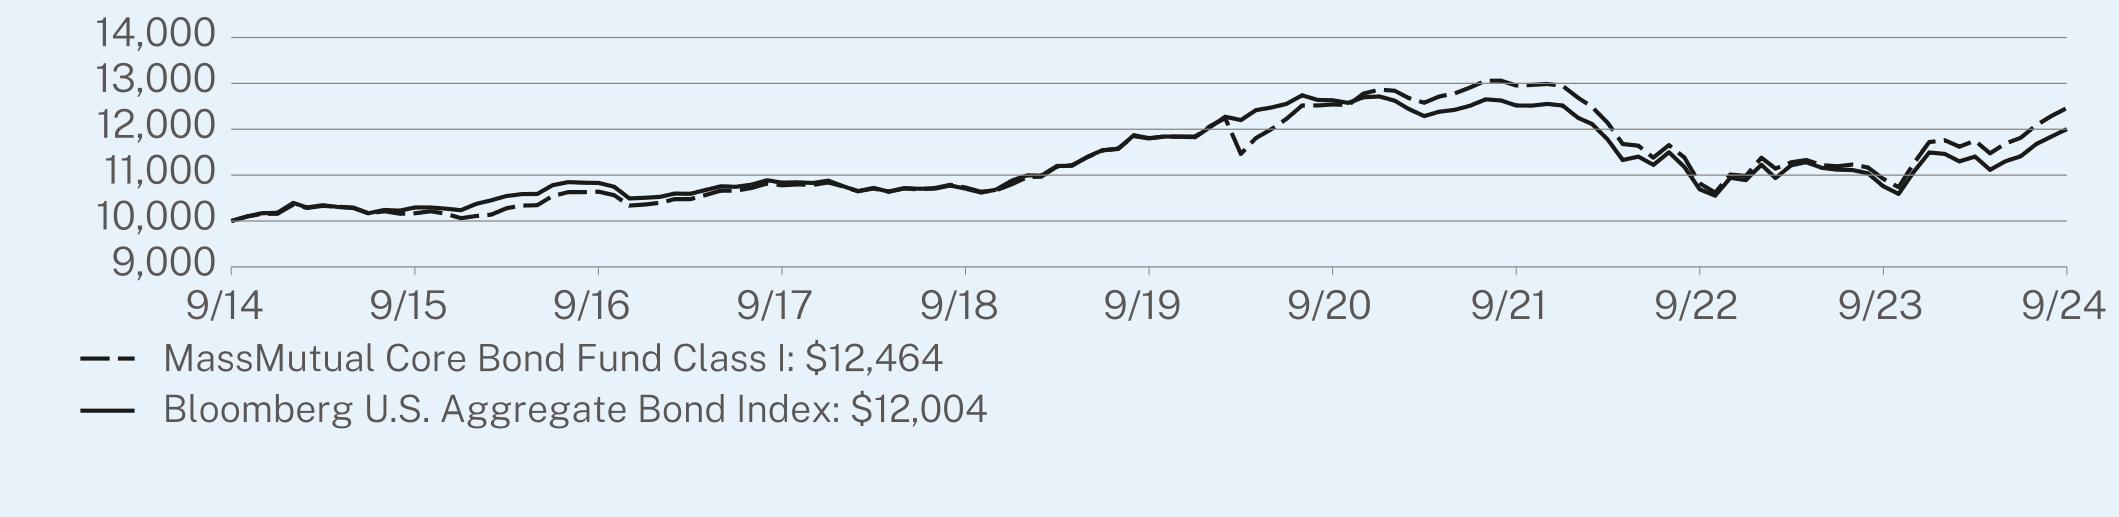
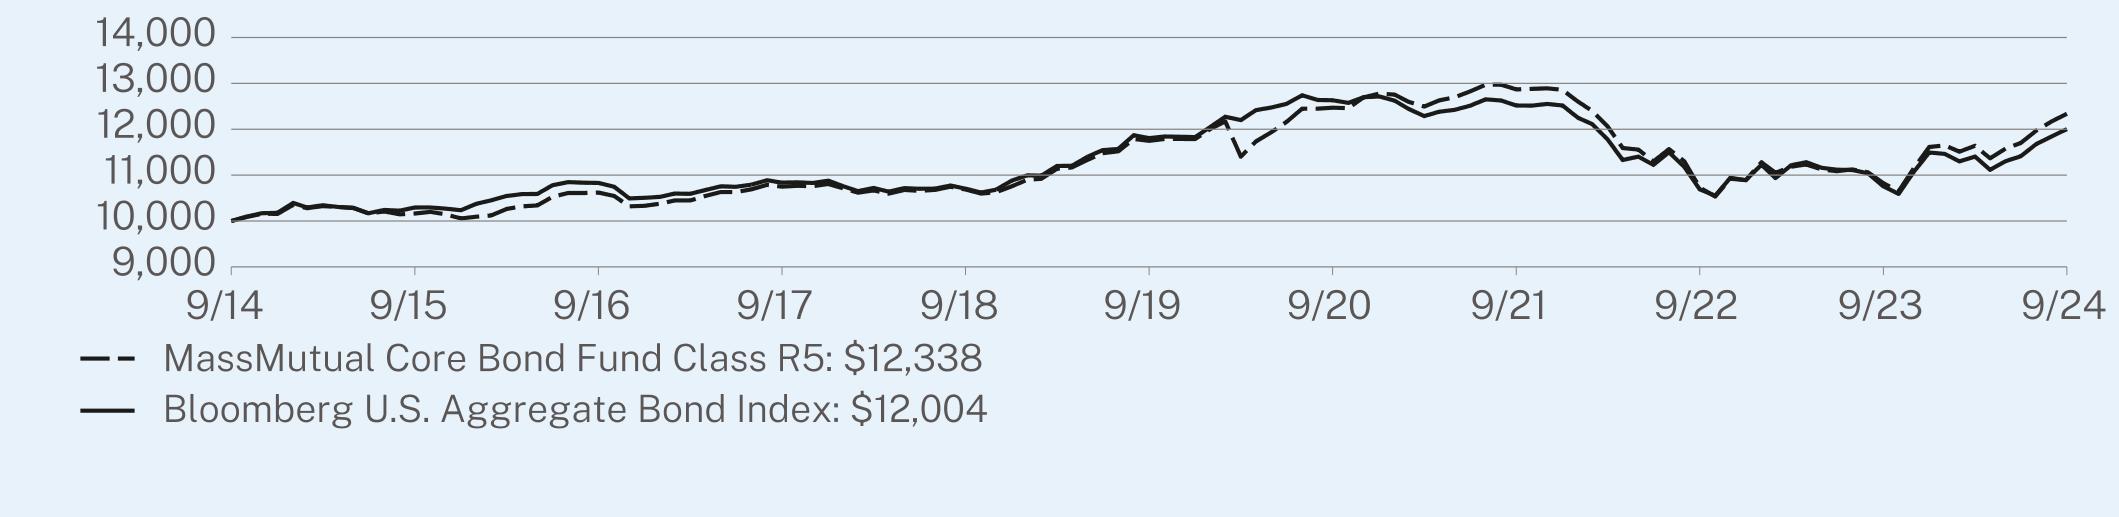
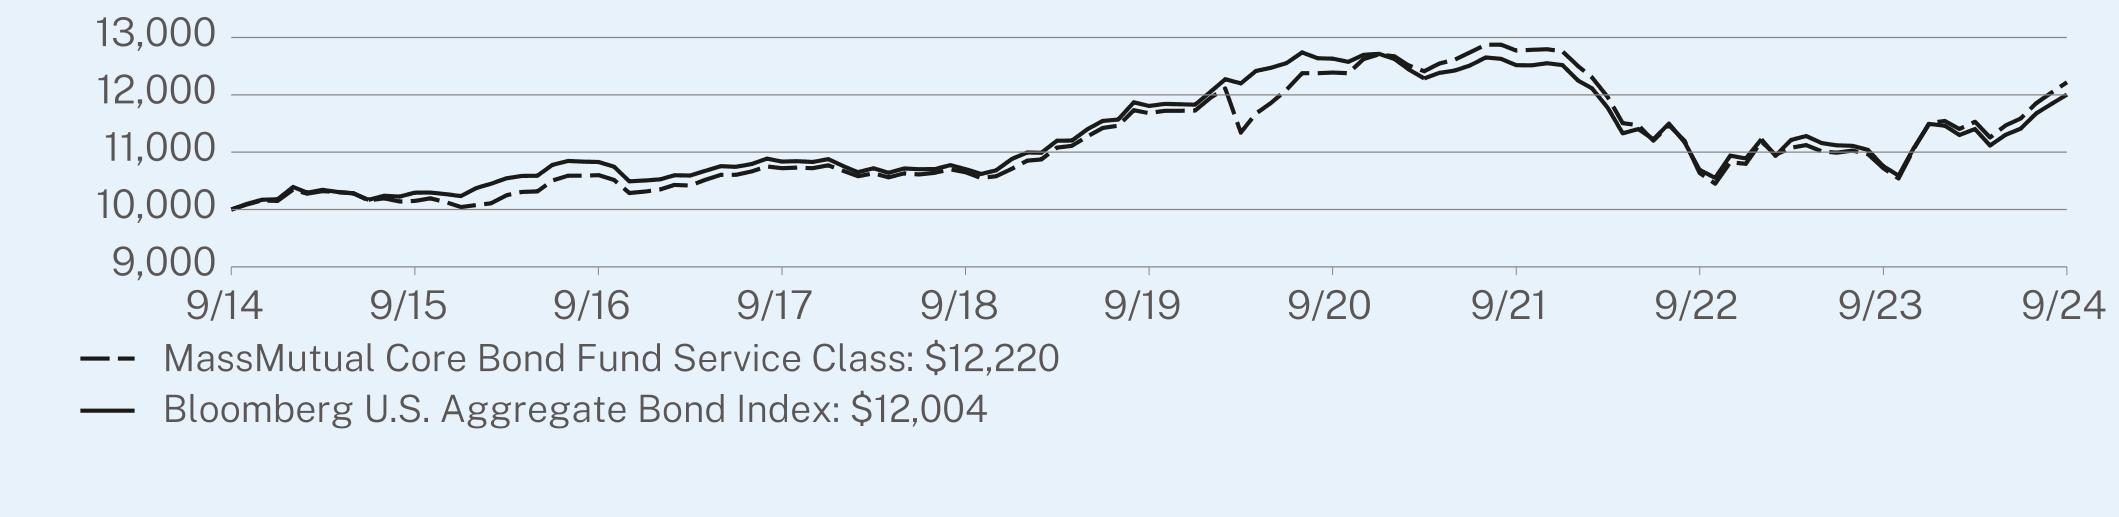
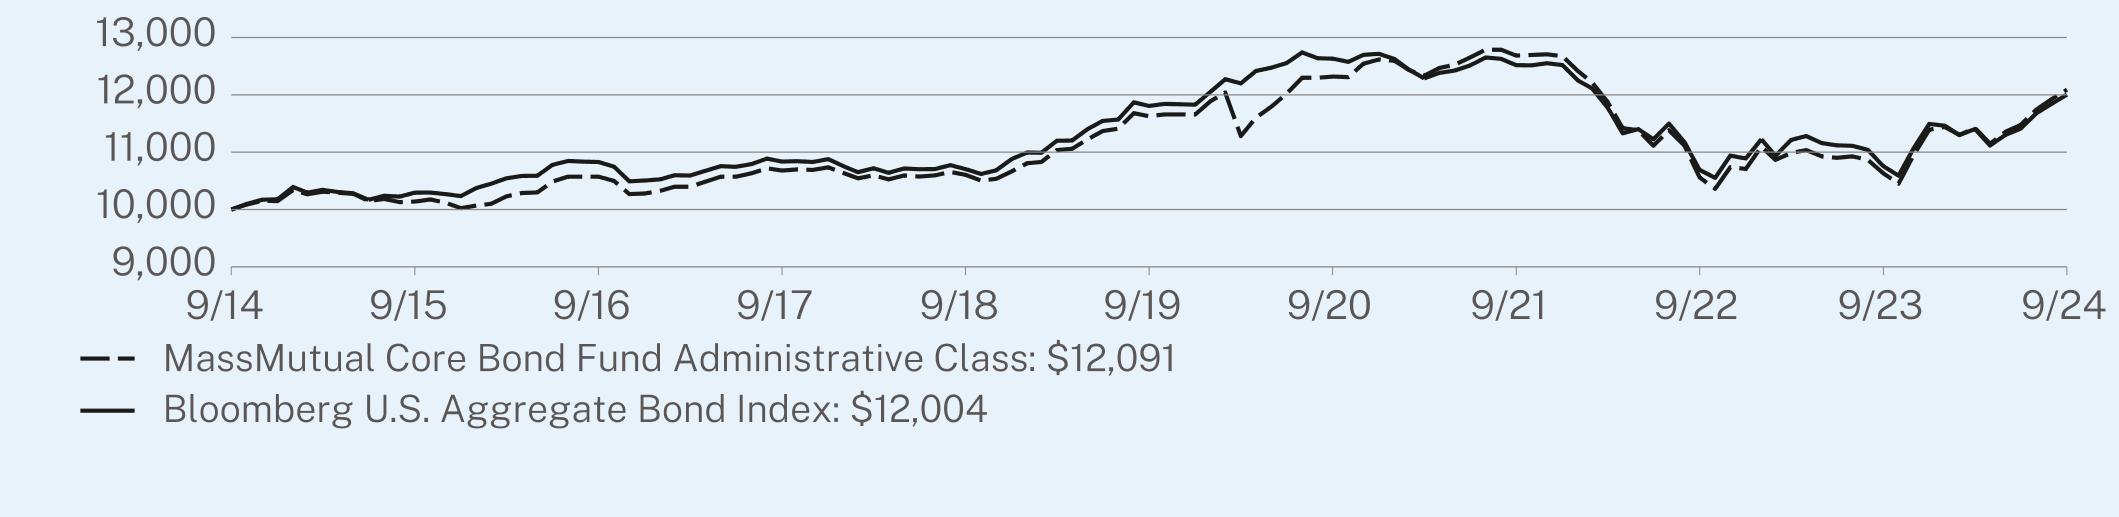
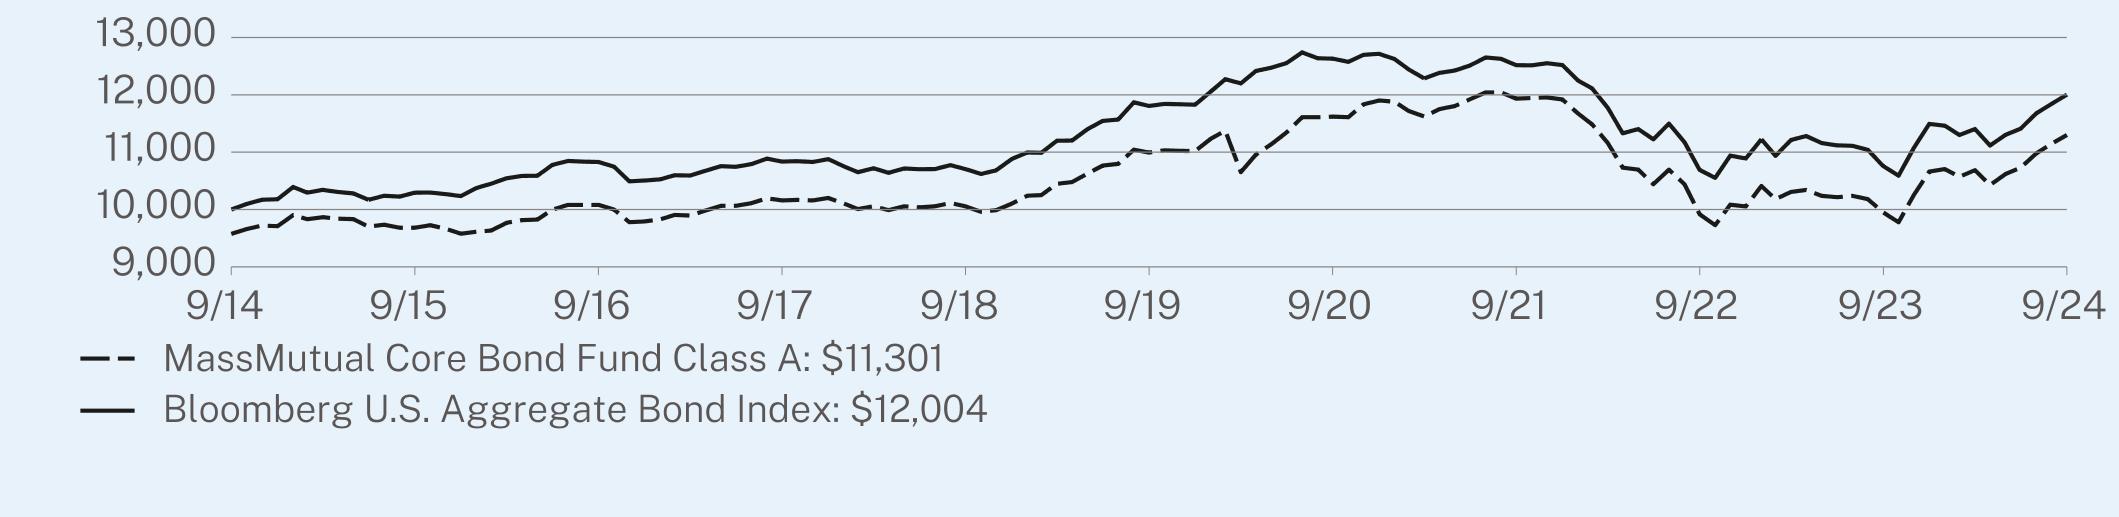
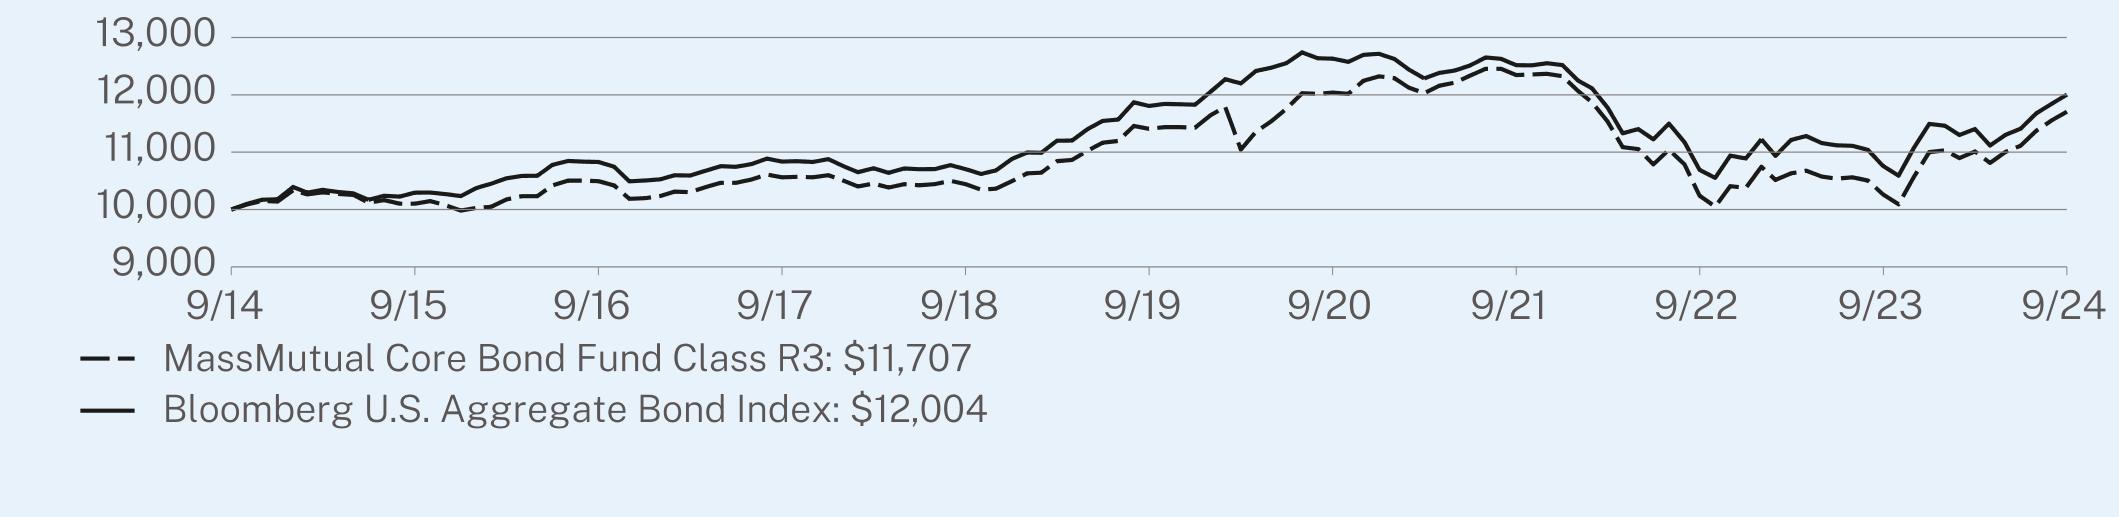
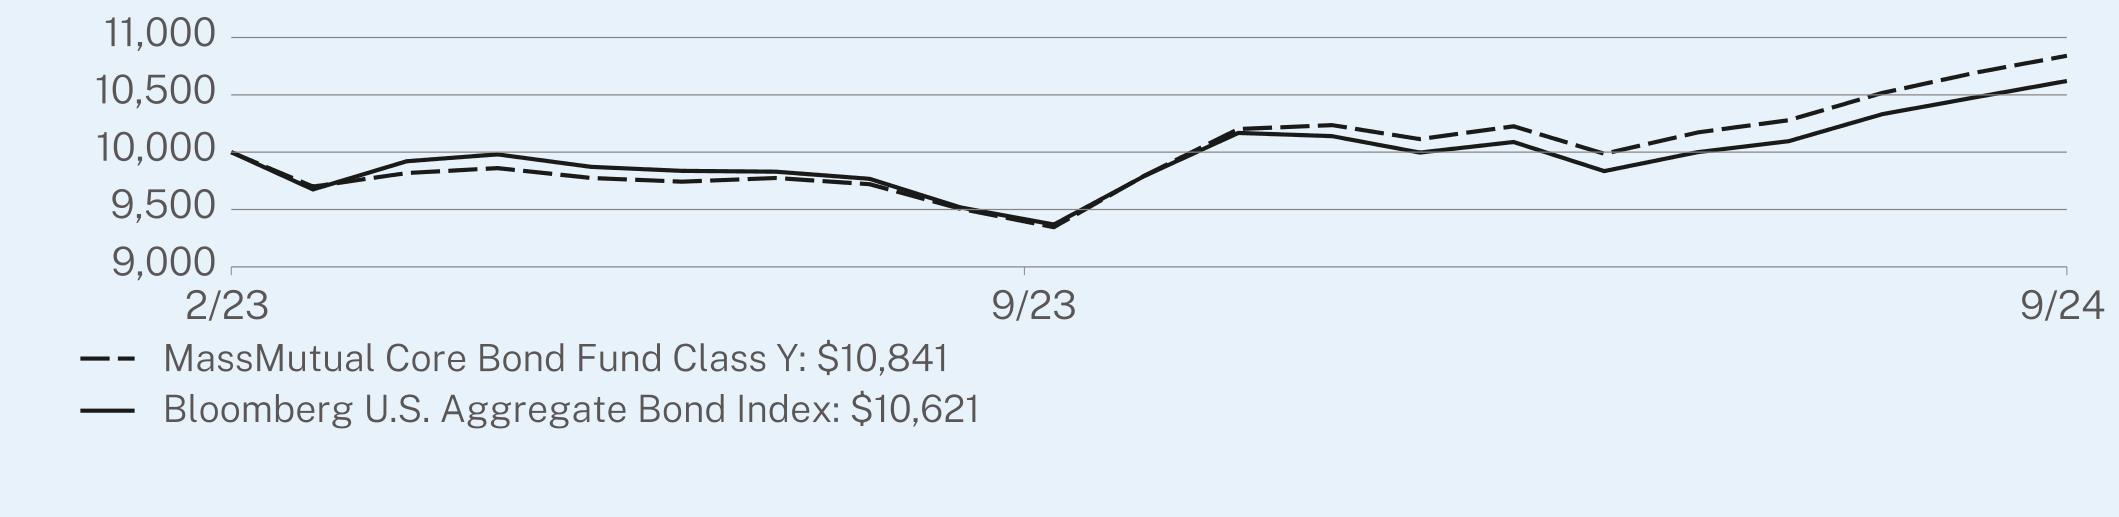
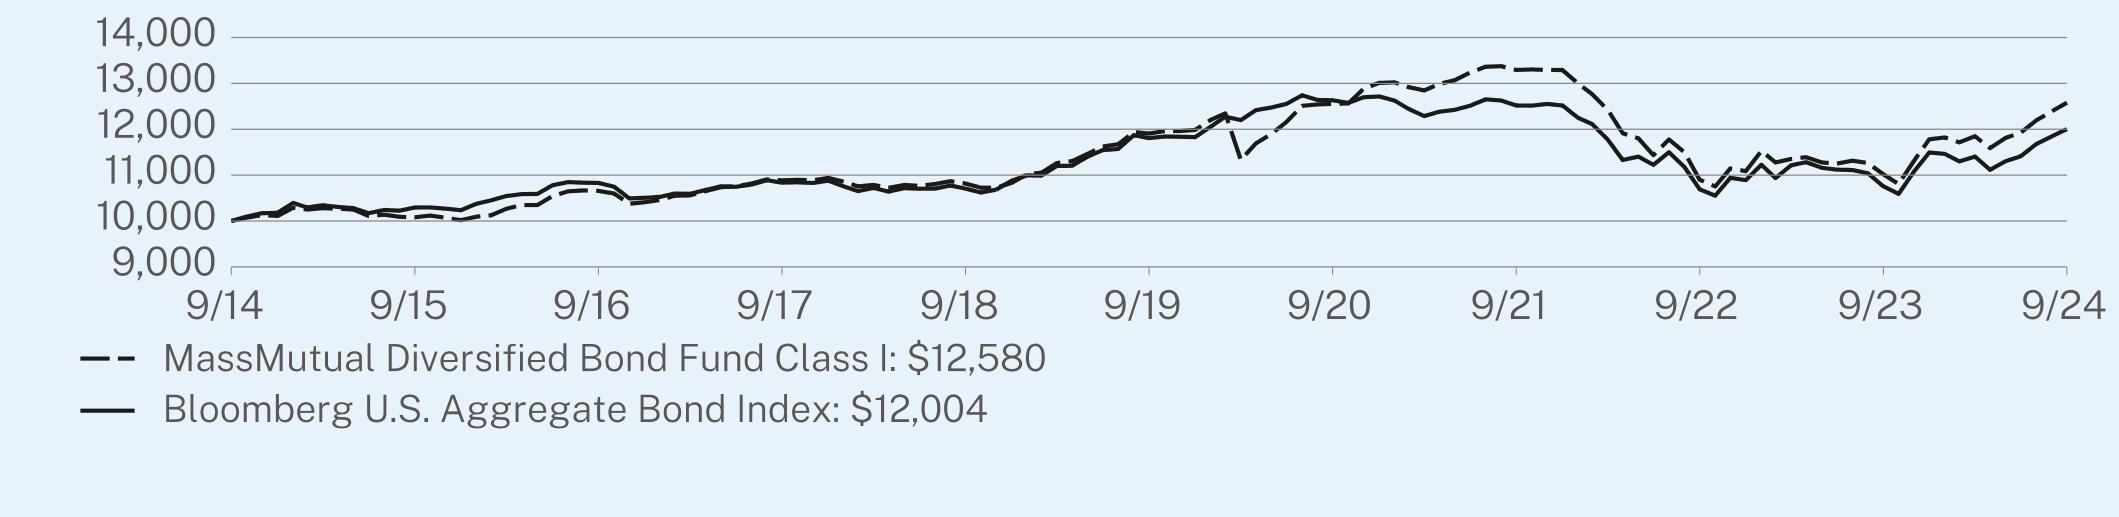
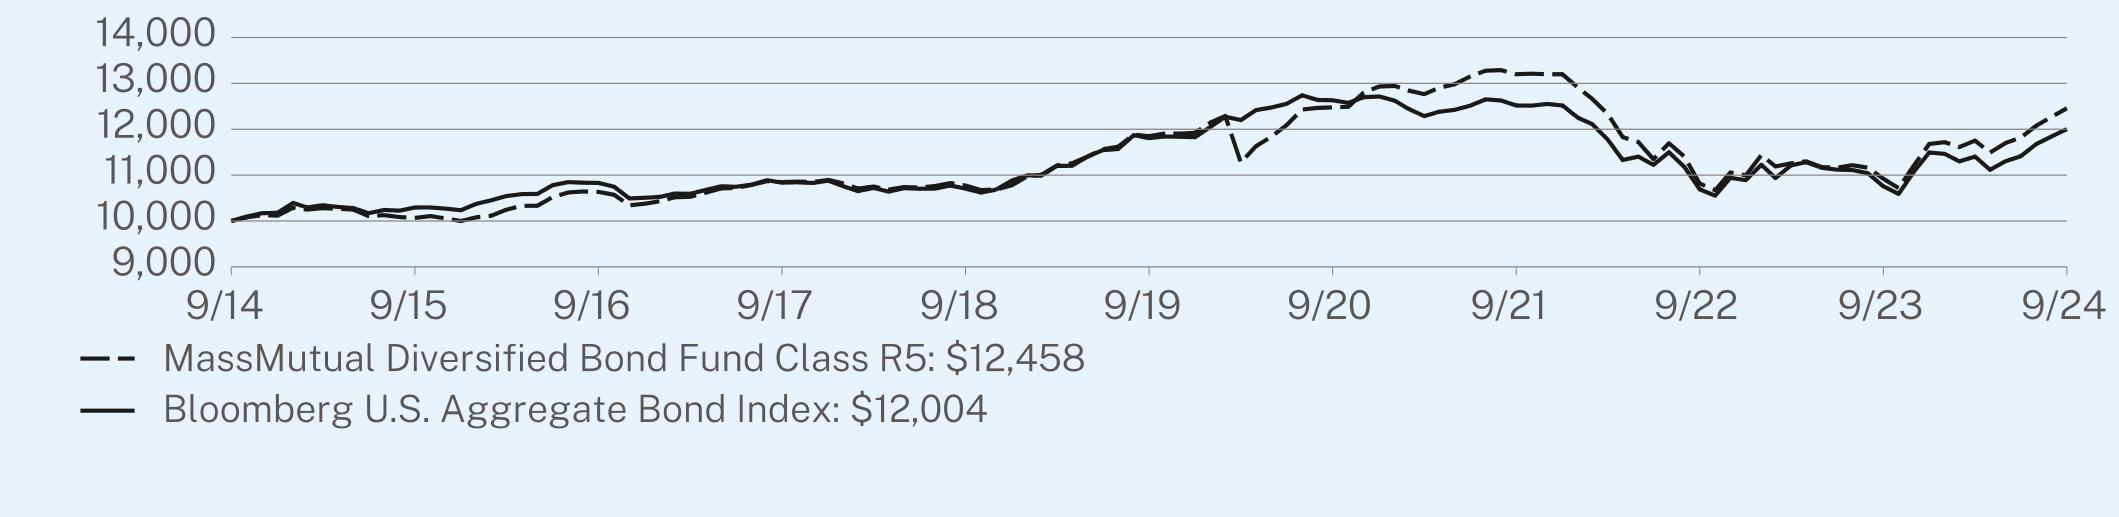
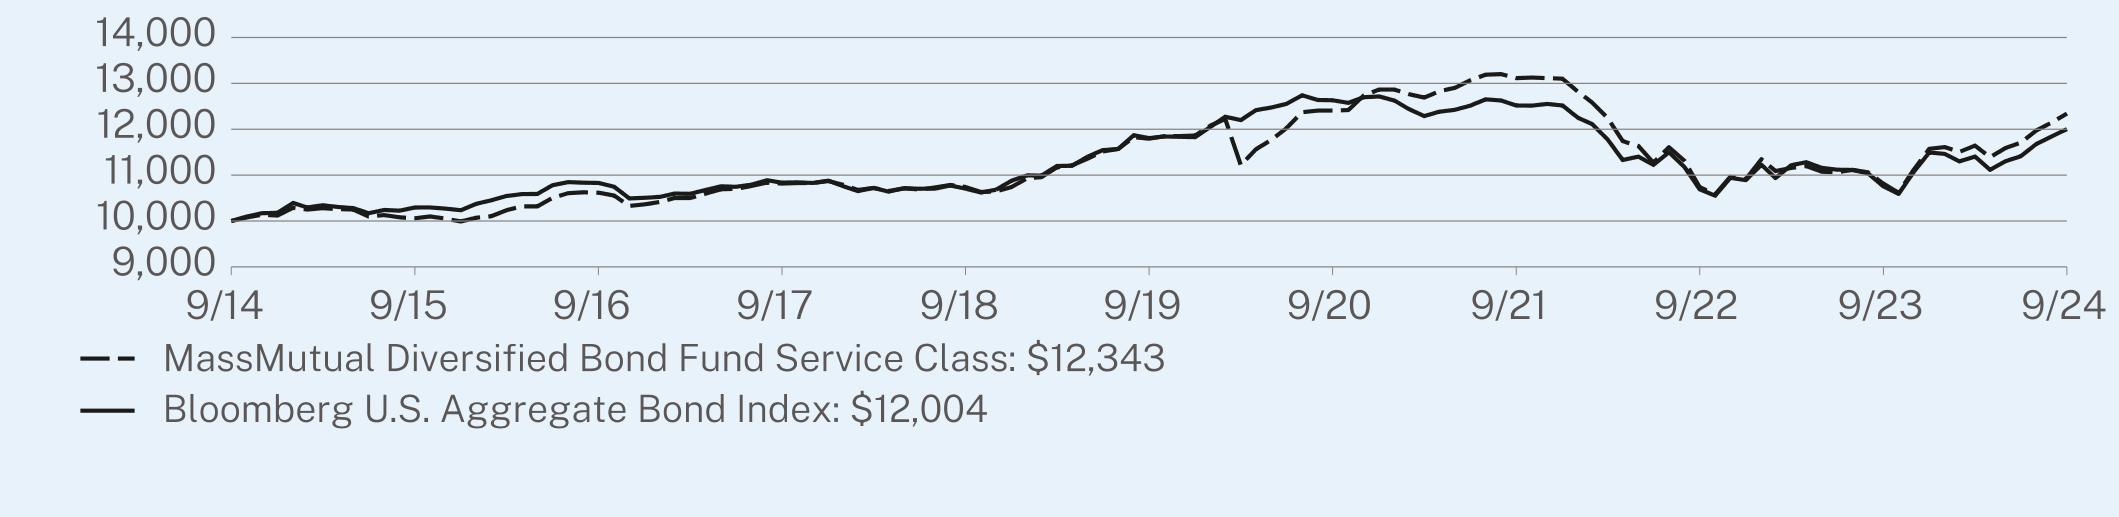
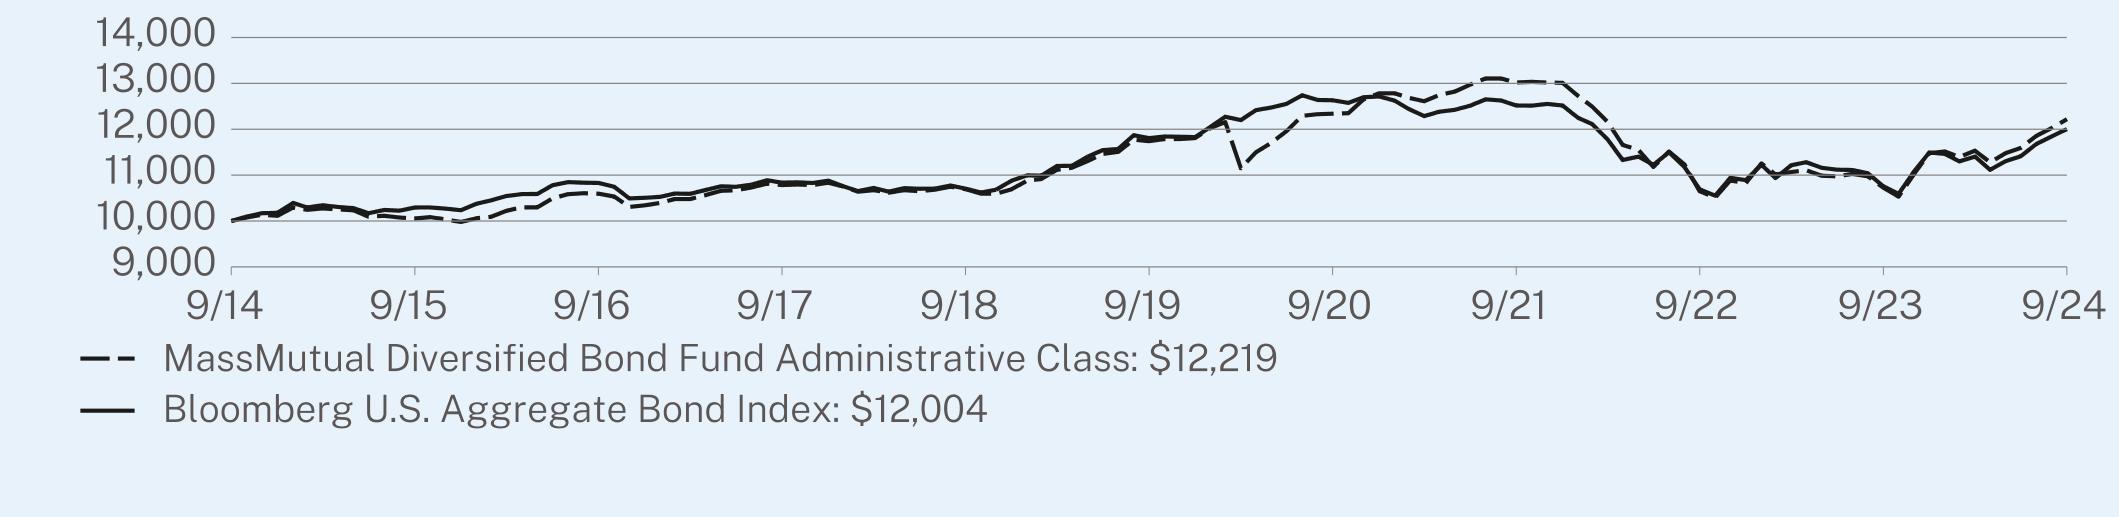
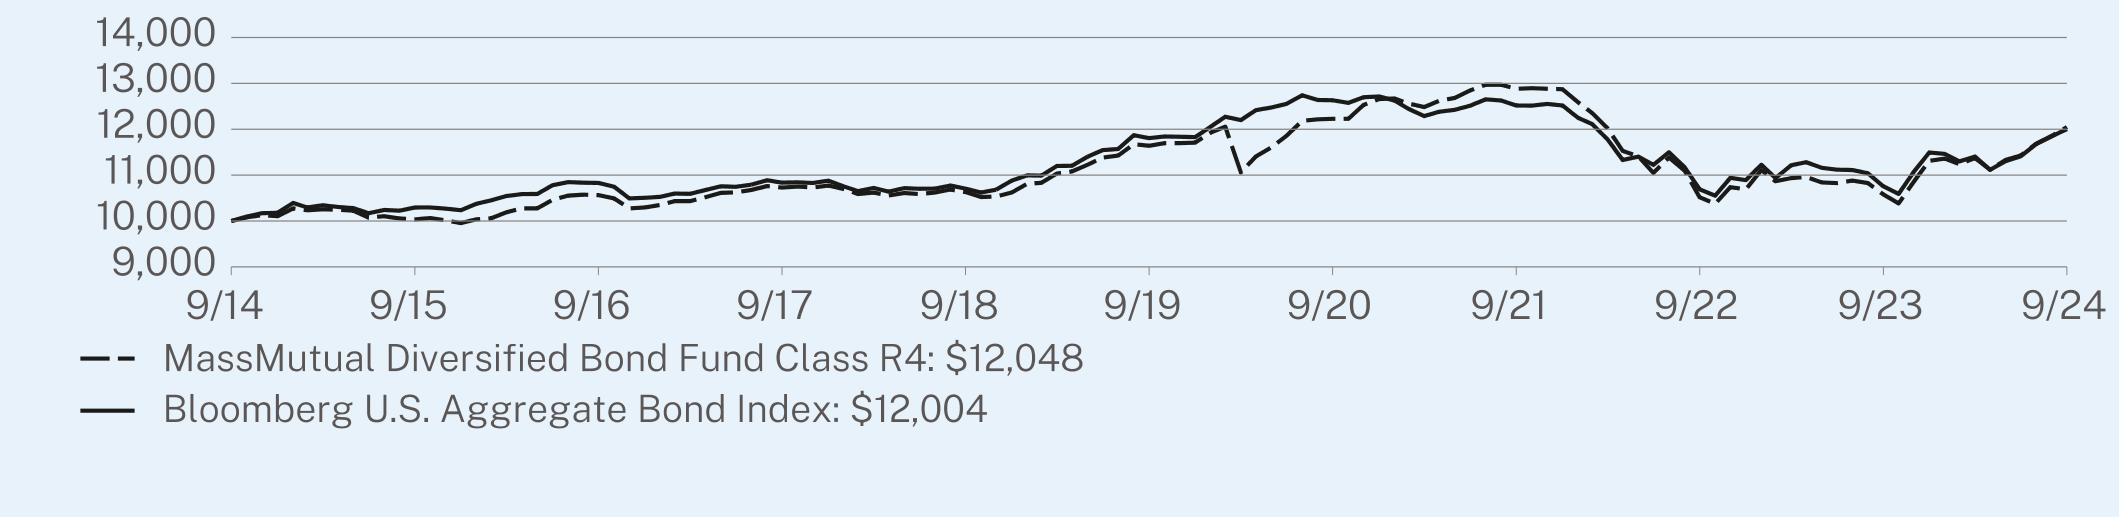
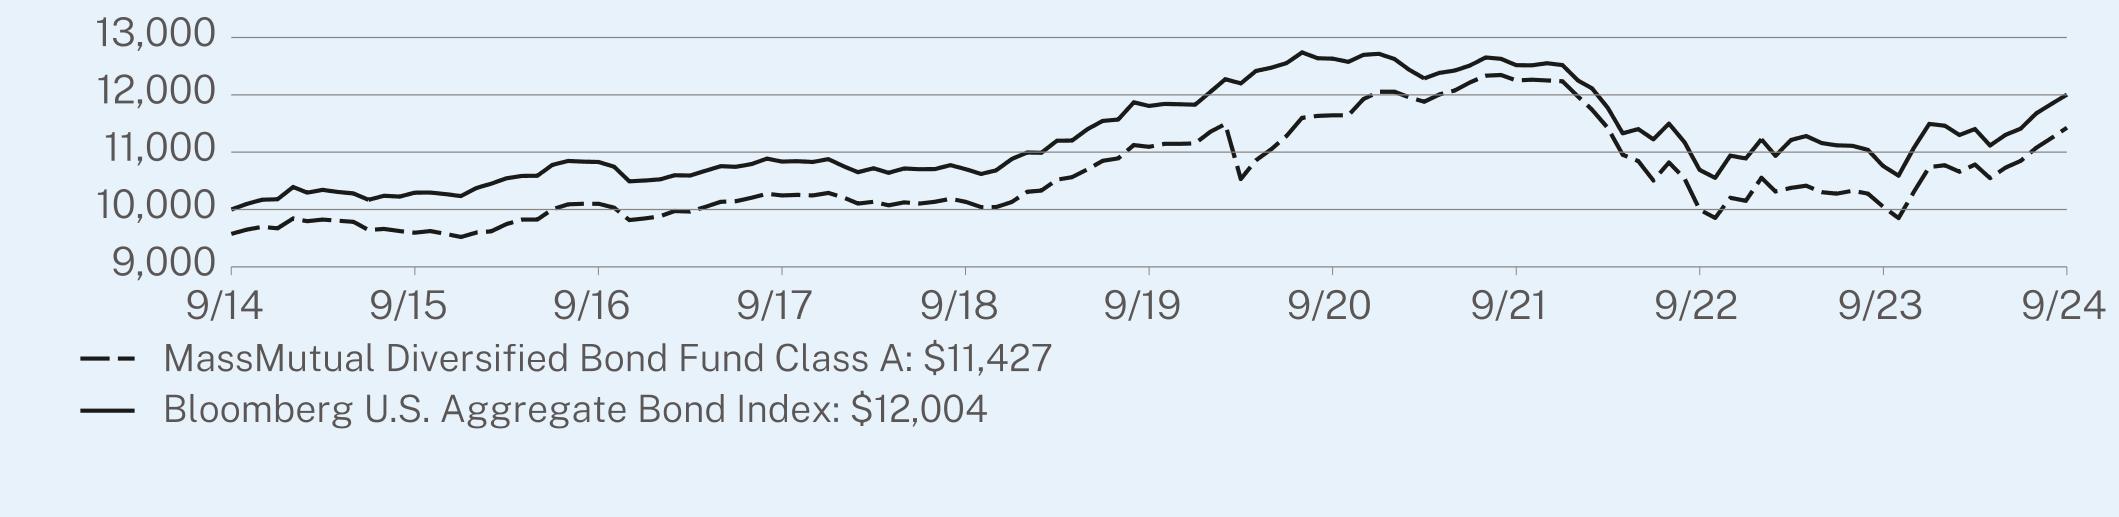
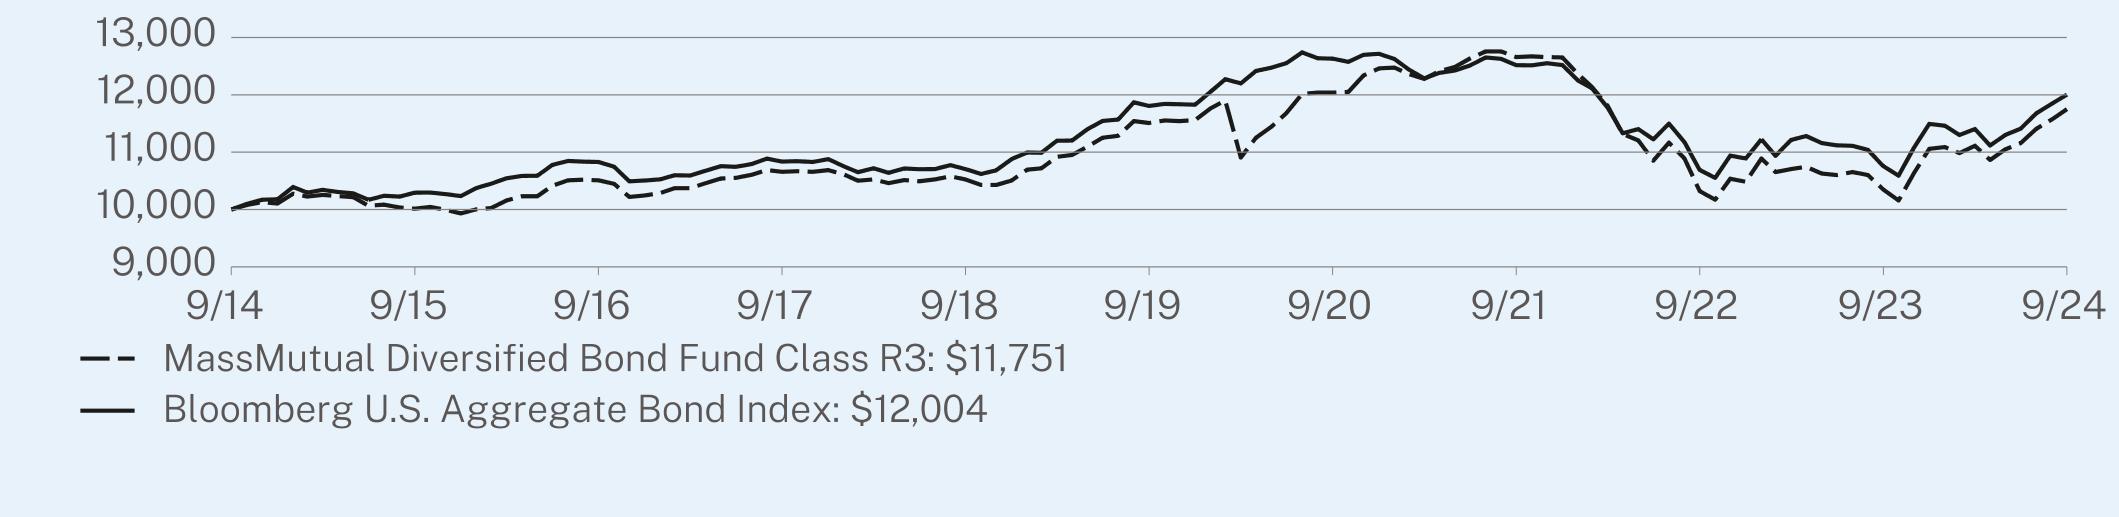
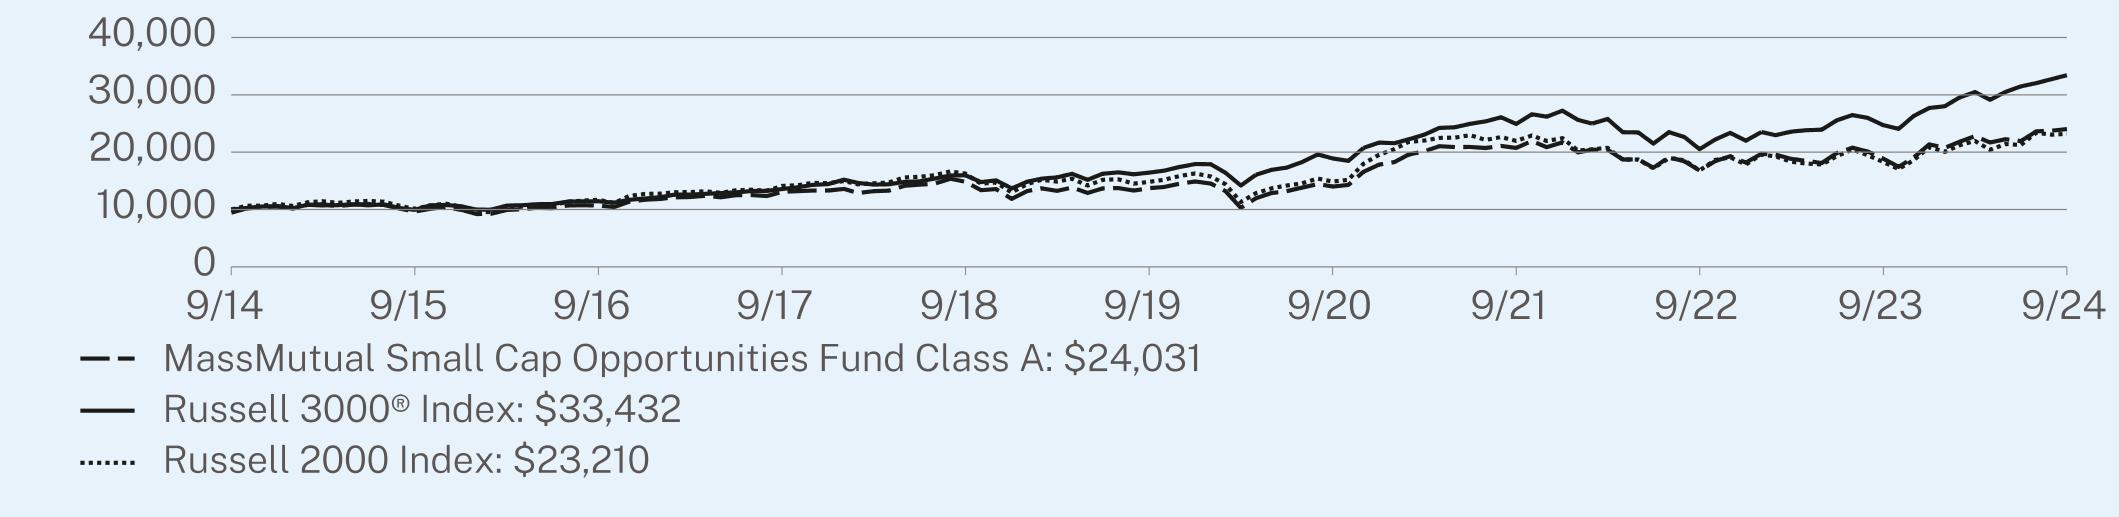
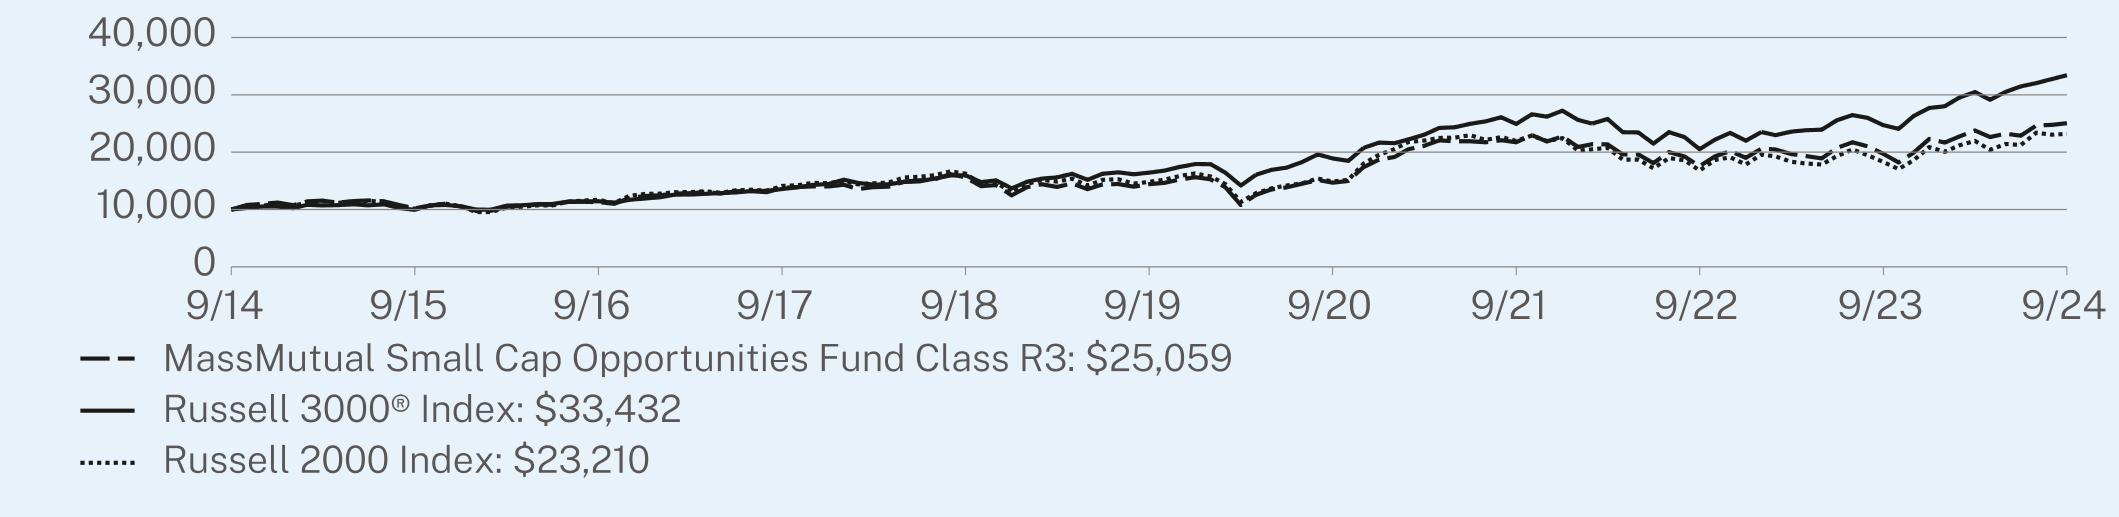
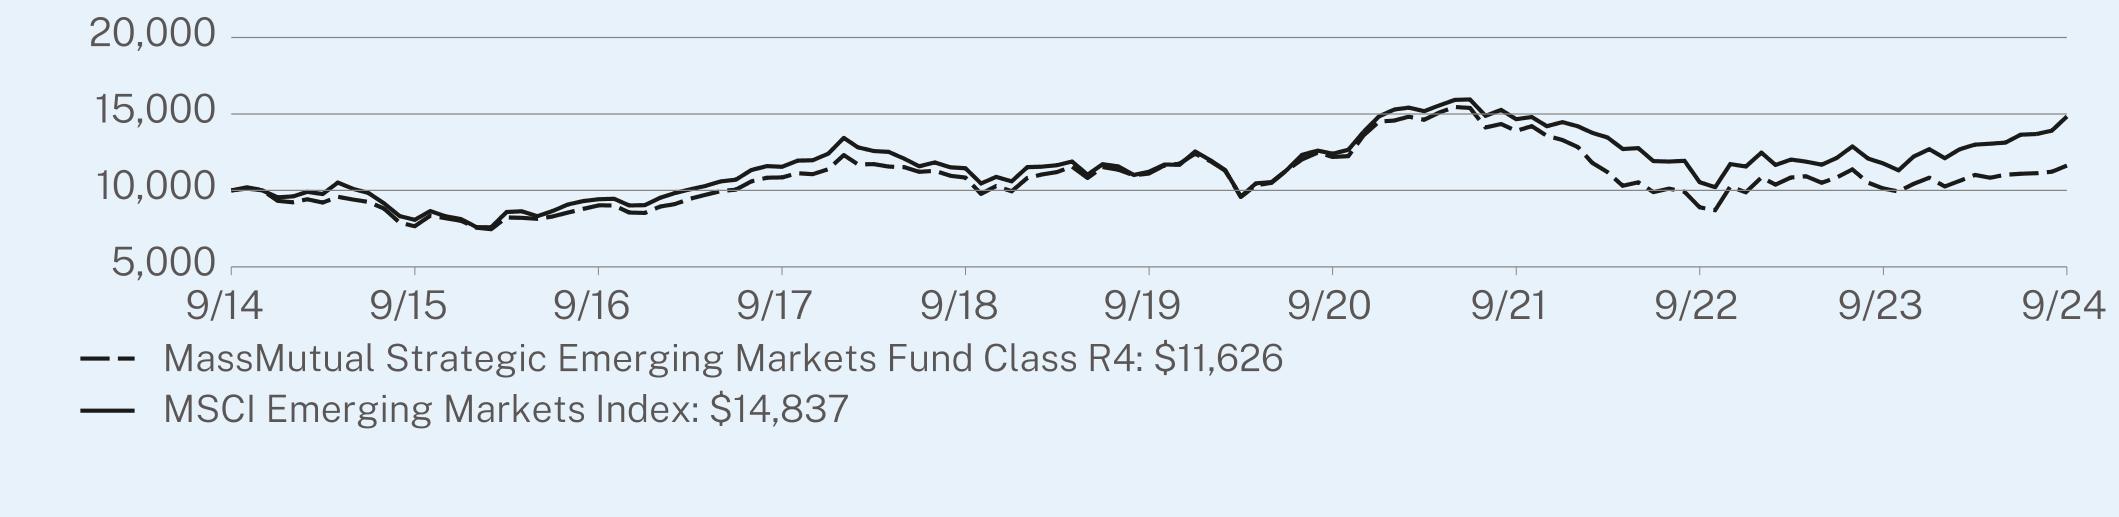
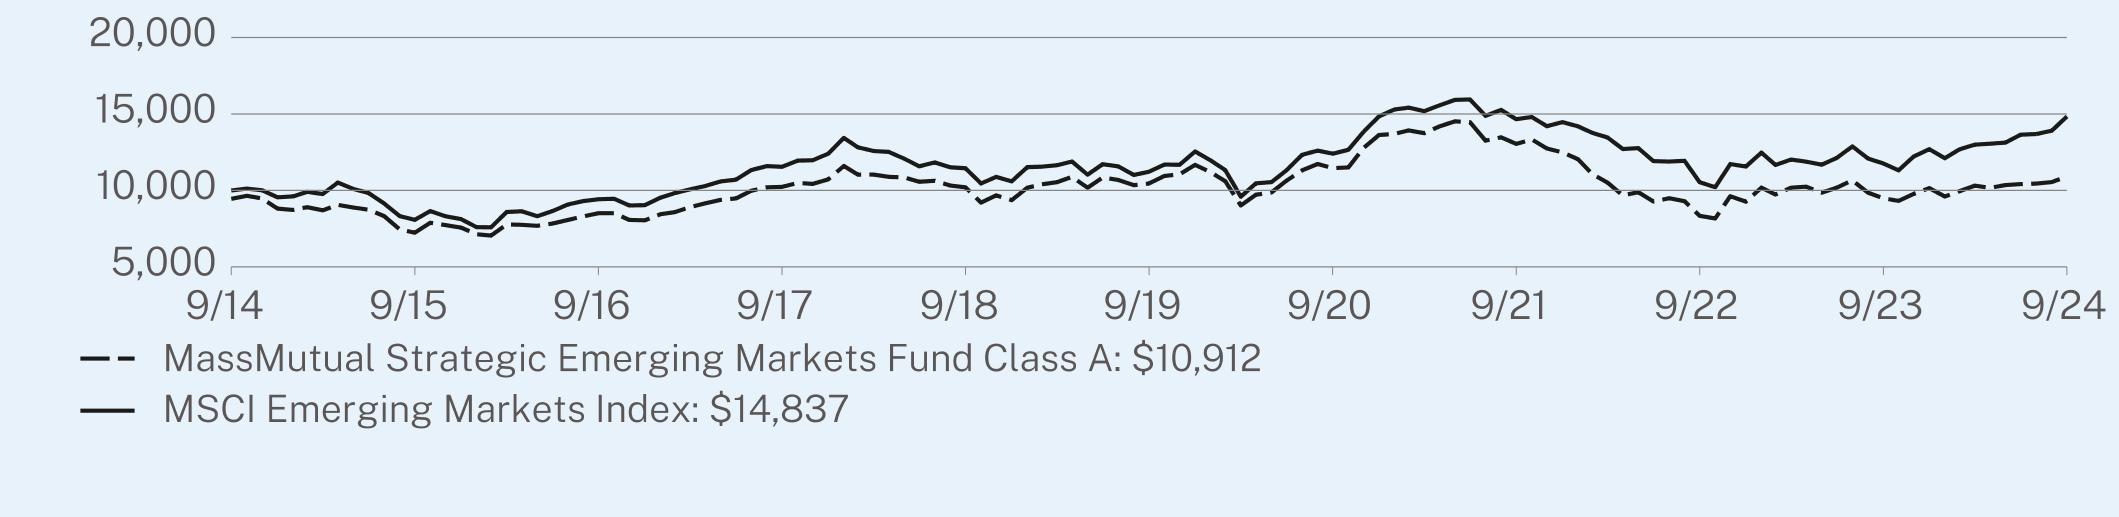
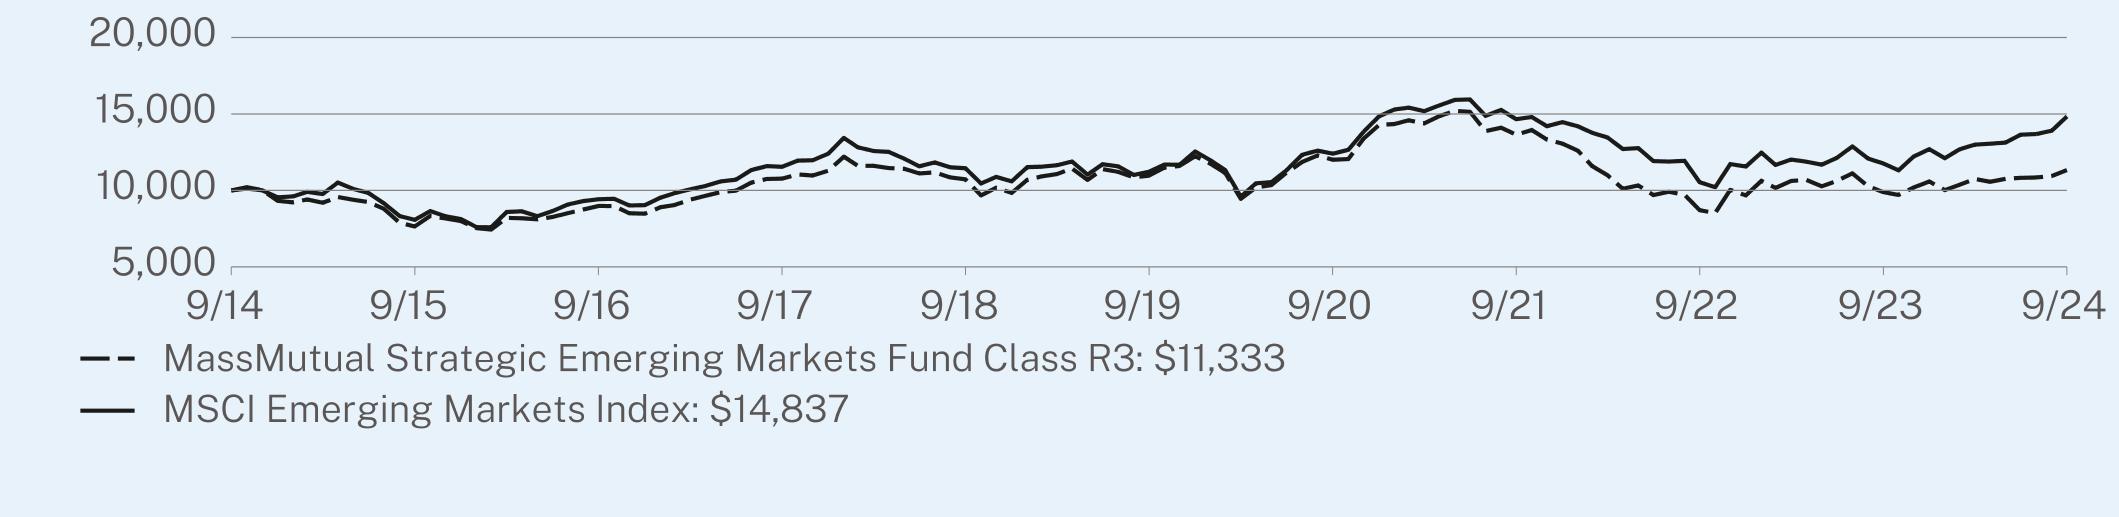
Performance shown is past performance and does not guarantee future results. The graph and table below do not reflect the deduction of taxes that a shareholder would pay on Fund distributions or redemption of Fund shares. The graph and table below assume reinvestment of dividends and capital gain distributions.
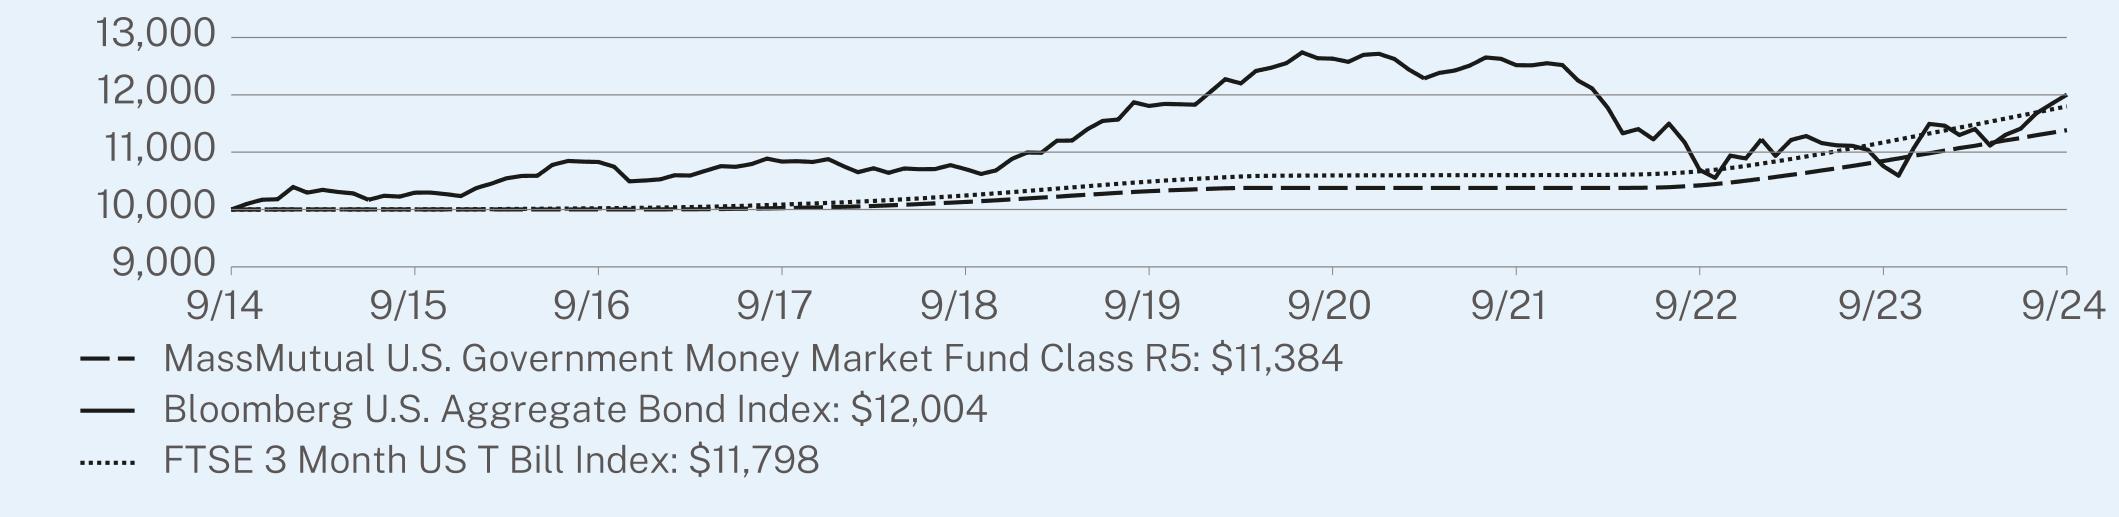
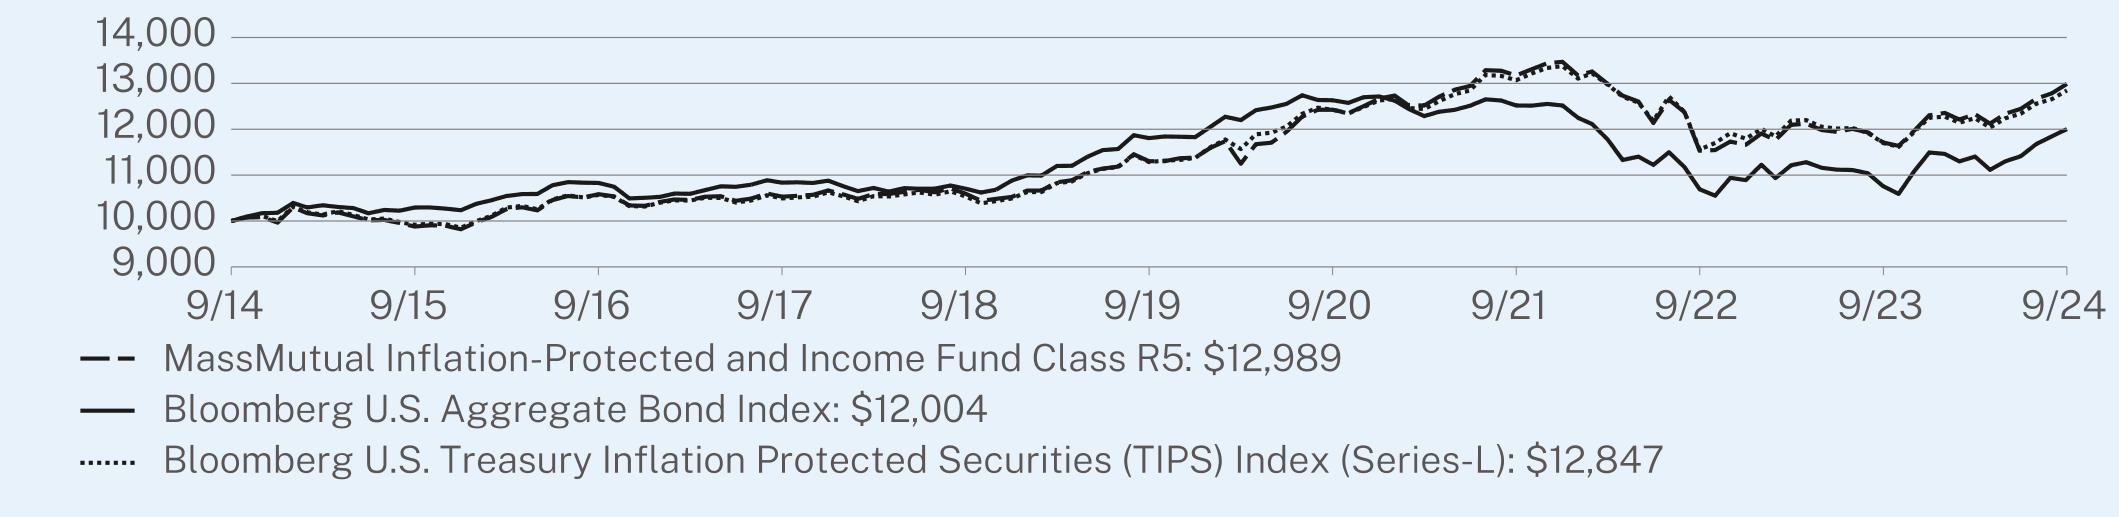
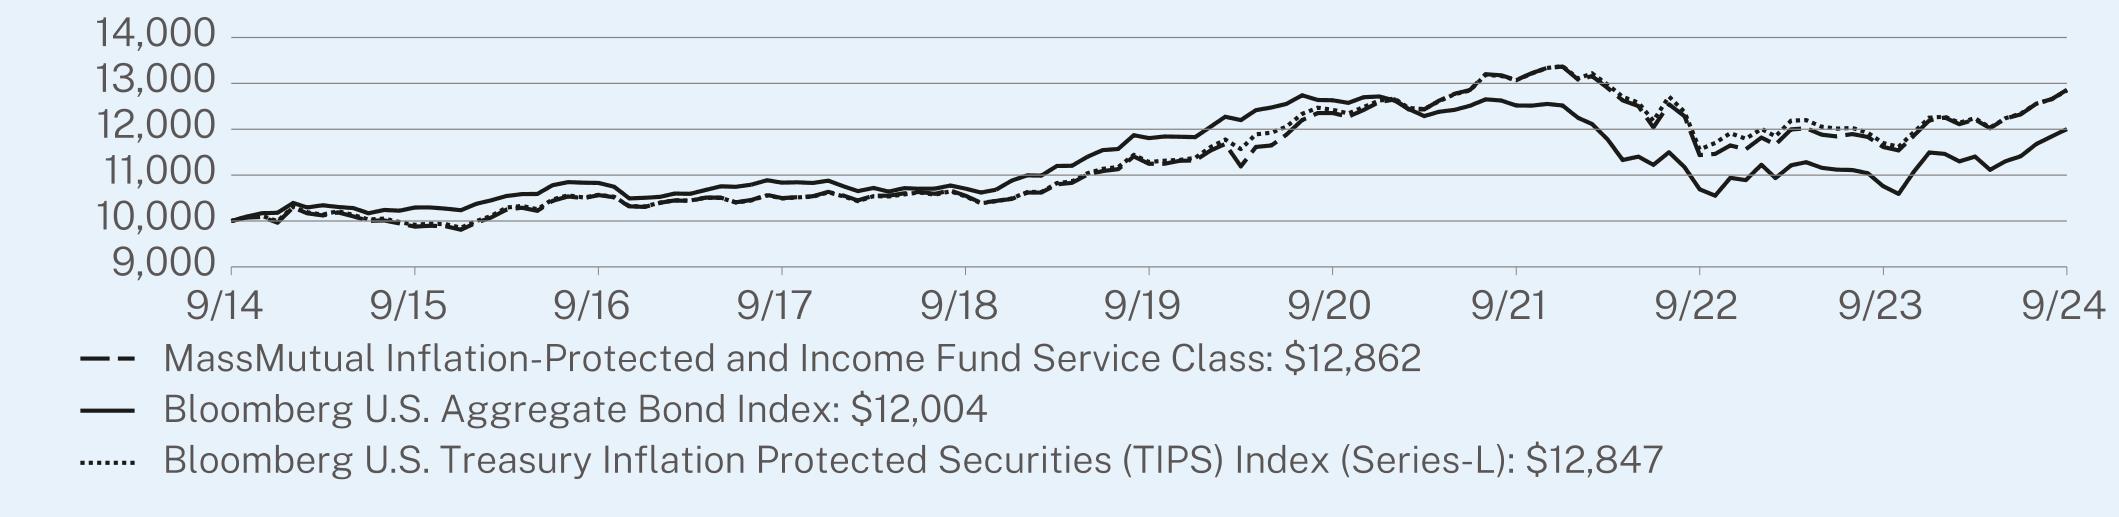
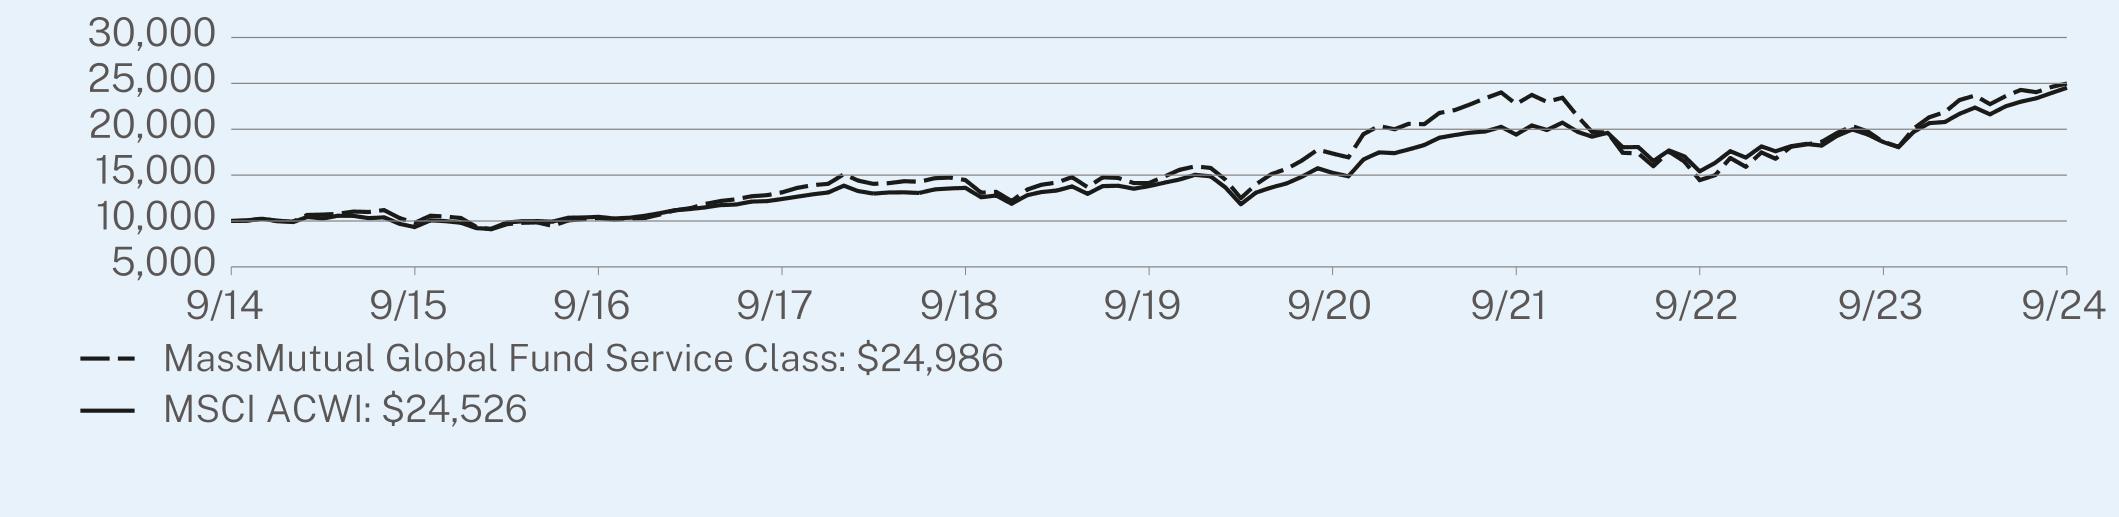
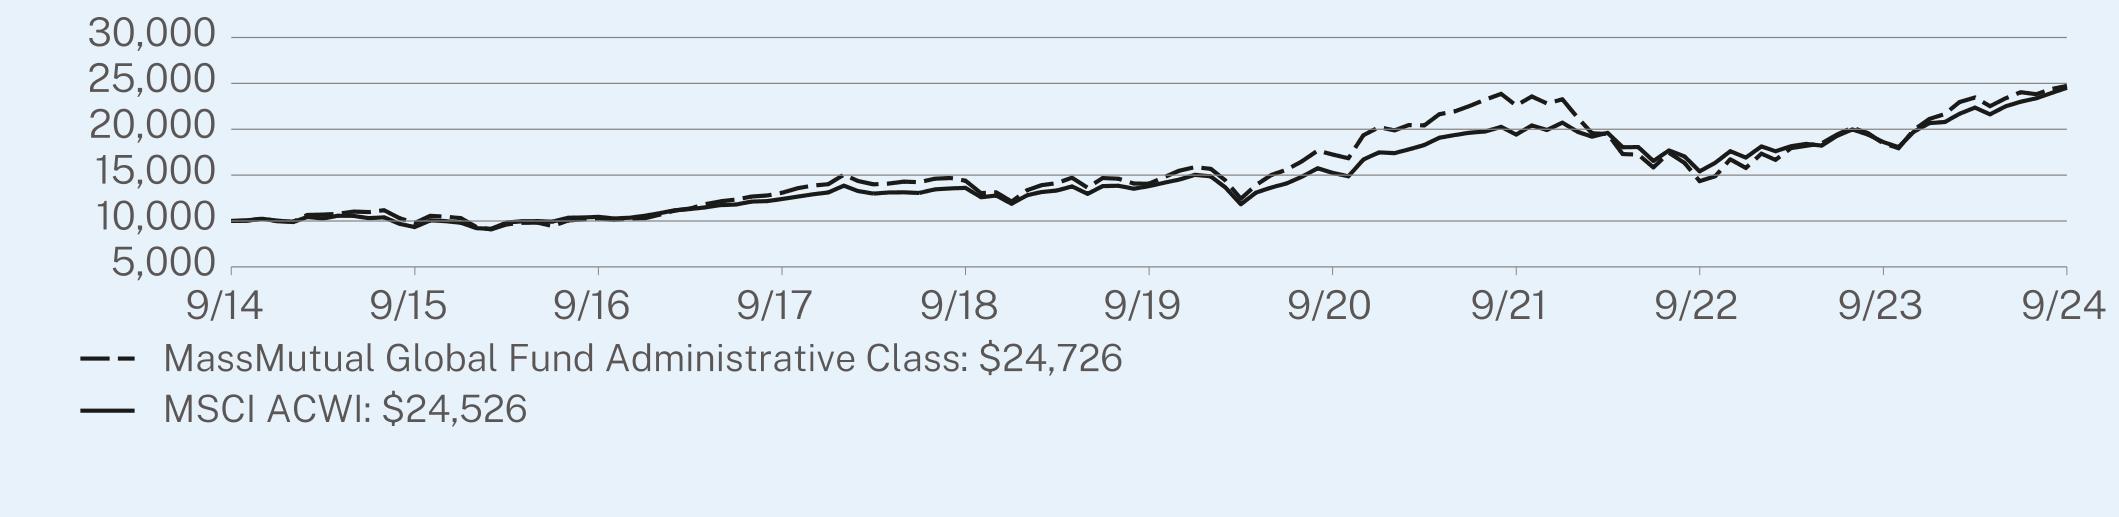
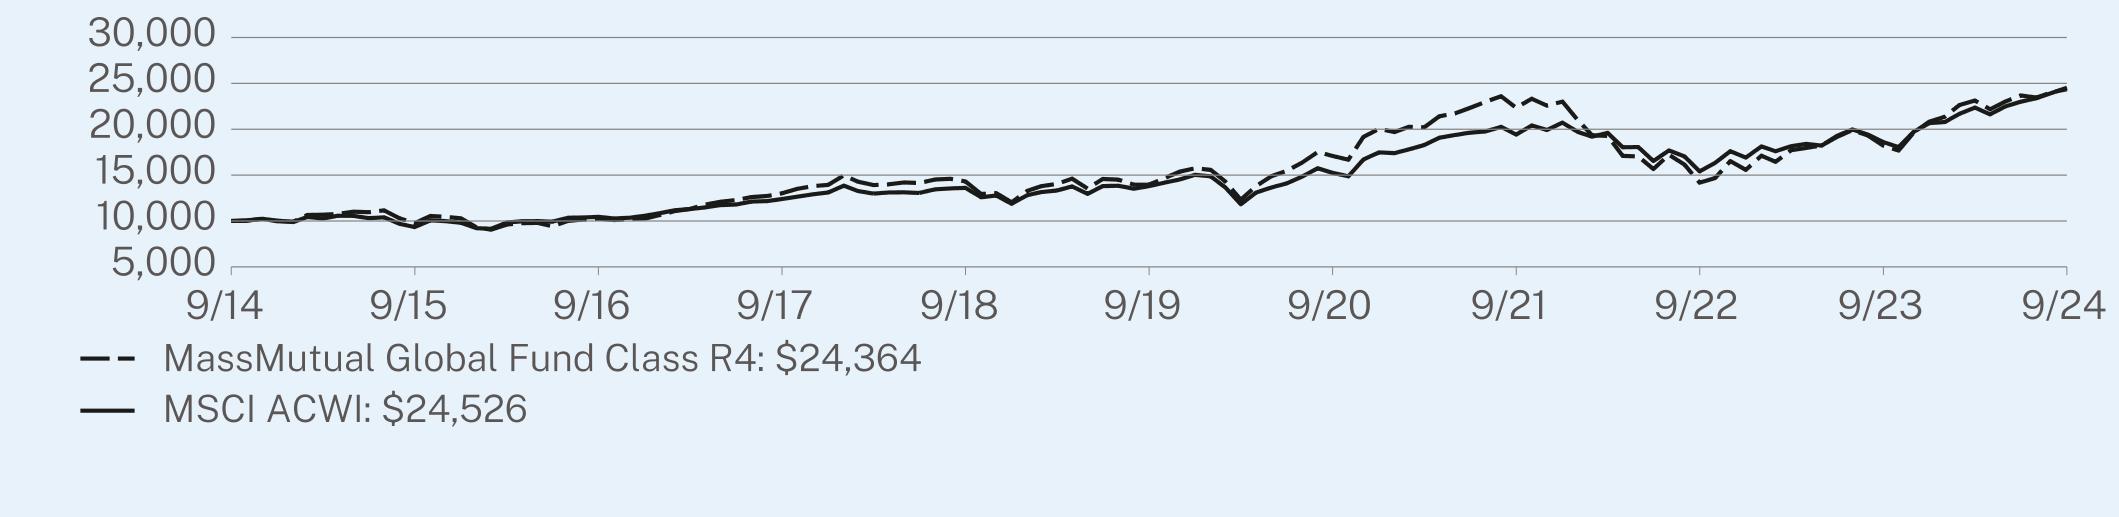
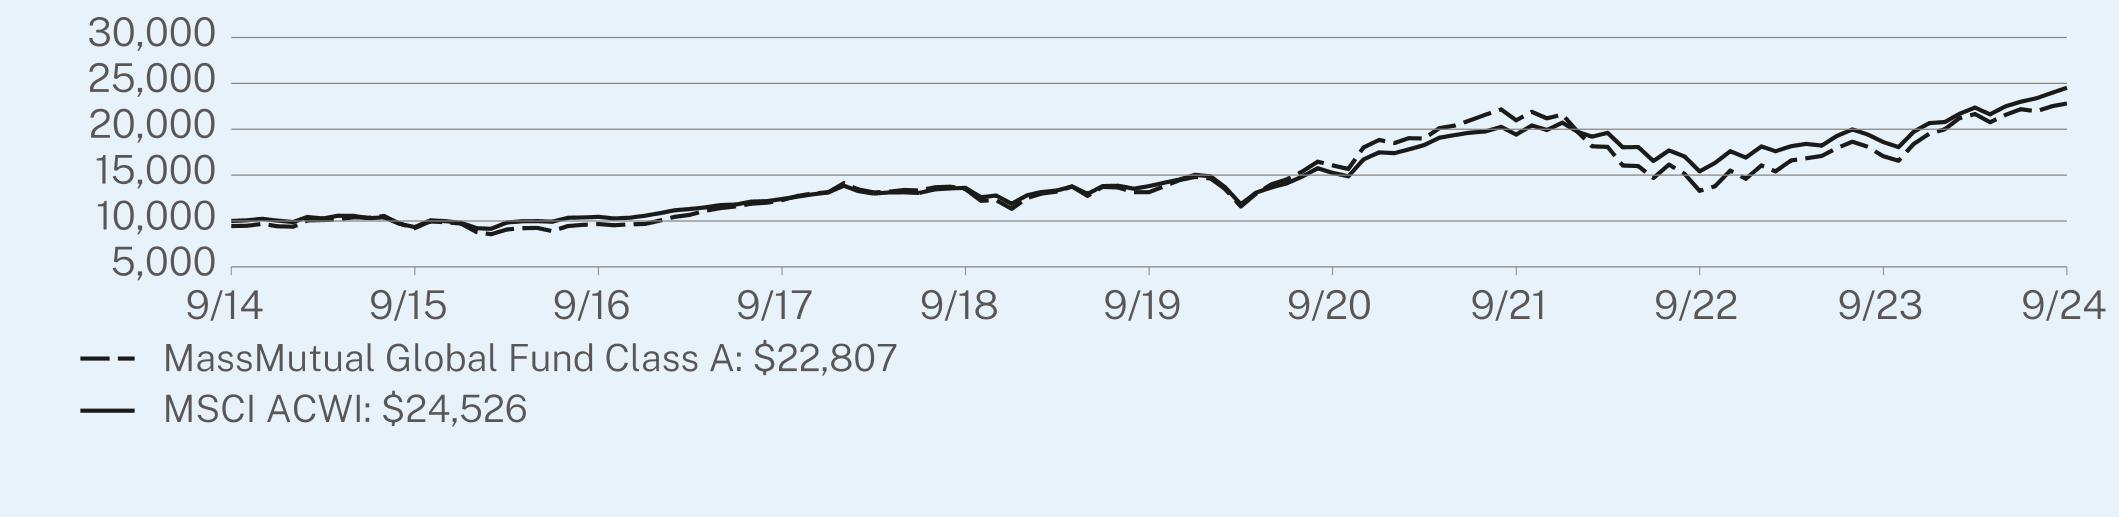
GROWTH OF A HYPOTHETICAL $10,000 INVESTMENT (October 1, 2014 through September 30, 2024)
This graph shows the performance of a hypothetical $10,000 investment in the share class noted over a ten-year period or since inception, if shorter, as compared to the performance of a broad-based securities market index, and, if applicable, one or more indexes that MML Investment Advisers, LLC believes more closely reflects the market segments in which the Fund invests or is a better comparison for the Fund’s investment strategy. This graph includes the deduction of the maximum applicable sales charge, if any.
| MM202912-309770 | PAGE 1 | TSR-AR-ITGN1 |
The index or indexes shown above are unmanaged, cannot be purchased directly, and, with the exception of any peer group index, do not incur expenses.
AVERAGE ANNUAL TOTAL RETURNS (%) (as of September 30, 2024)
| | | |
| | 1 Year | 5 Year | 10 Year |
Class R5 - without sales charge | 4.96 | 1.98 | 1.30 |
Bloomberg U.S. Aggregate Bond Index1 | 11.57 | 0.33 | 1.84 |
FTSE 3 Month US T Bill Index | 5.63 | 2.38 | 1.67 |
| 1 | Effective July 24, 2024, the Bloomberg U.S. Aggregate Bond Index replaced the FTSE 3 Month US T Bill Index as a broad measure of market performance in accordance with new regulatory disclosure requirements. The Fund continues to use the FTSE 3 Month US T Bill Index as a supplemental benchmark that MML Investment Advisers, LLC believes more closely reflects the market segments in which the Fund invests. |
The Fund’s name, investment objective, and investment strategy changed on May 1, 2016 when the Fund changed from a money market fund to a government money market fund. Performance results shown were achieved when the Fund could invest in types of securities that it is no longer able to hold. Future performance of the Fund may be lower as a result.
Performance results reflect any applicable waivers or expense limitations in effect during these periods, without which performance would have been lower. The investment return and principal value of shares of the Fund fluctuate, so your shares, when sold, may be worth more or less than their original cost. Current performance of the Fund may be lower or higher than the performance quoted. Performance data current to the most recent month-end may be obtained at https://www.massmutual.com/product-performance/mutual-funds or by calling 1-888-309-3539 or by sending an email request to fundinfo@massmutual.com.
WHAT ARE SOME KEY FUND STATISTICS? (as of September 30, 2024)
| |
Total Net Assets (Millions) | $173.6 |
Total Number of Portfolio Holdings (includes derivative positions, if any) | 10 |
Total Advisory Fees Paid During the Reporting Period | $634,458 |
WHAT DID THE FUND INVEST IN? (as of September 30, 2024)
Derivative values, if any, are excluded from the table(s) below.
| |
Portfolio Characteristics
(% of Total Investments) | |
Discount Notes | 68.0% |
U.S. Treasury Bills | 17.7% |
Repurchase Agreement | 14.3% |
| MM202912-309770 | PAGE 2 | TSR-AR-ITGN1 |
HOW HAS THE FUND CHANGED?
The following is a summary of certain changes to the Fund since October 1, 2023. For more complete information, you may review the Fund’s prospectus, including any applicable supplements, at https://www.massmutual.com/product-performance/mutual-funds or upon request at 1-888-309-3539 or fundinfo@massmutual.com.
Effective February 1, 2024, MML Investment Advisers, LLC has agreed to cap the fees and expenses of the Fund (other than extraordinary legal and other expenses, Acquired Fund Fees and Expenses, interest expense, expenses related to borrowings, securities lending, leverage, taxes, and brokerage, short sale dividend and loan expense, or other non-recurring or unusual expenses such as organizational expenses and shareholder meeting expenses, as applicable) through January 31, 2025, to the extent that Total Annual Fund Operating Expenses after Expense Reimbursement would otherwise exceed 0.54% for Class R5.
| |
| WHERE CAN I FIND ADDITIONAL INFORMATION ABOUT THE FUND? |
For additional information about the Fund, including its prospectus, financial information, holdings, and proxy voting information, scan the QR code or visit https://www.massmutual.com/product-performance/mutual-funds. |
| MM202912-309770 | PAGE 3 | TSR-AR-ITGN1 |
100001000110001100241013210319103771037710421108461138410000102941082910836107051180712632125181069110760120041000010002100221008710245104871059410600106671116911798
| | |
MassMutual Short-Duration Bond Fund | |
| Class I | MSTZX |
| Annual Shareholder Report | September 30, 2024 |
This annual shareholder report contains important information about the MassMutual Short-Duration Bond Fund (the “Fund”) for the period of October 1, 2023 to September 30, 2024. You can find additional information about the Fund at https://www.massmutual.com/product-performance/mutual-funds. You can also request this information by contacting us at 1-888-309-3539 or by sending an email request to fundinfo@massmutual.com.
This report describes changes to the Fund that occurred during the reporting period.
WHAT WERE THE FUND COSTS FOR THE LAST YEAR?
This example shows the expenses you would have paid over the past year, based on a hypothetical $10,000 investment. This table reflects any applicable waivers or expense limitations.
| | |
Class Name | Costs of a $10,000 investment | Costs paid as a percentage of a $10,000 investment |
| Class I | $46 | 0.44% |
HOW DID THE FUND PERFORM?
Global bond markets were broadly, and strongly, positive for the trailing one-year period. During the period, central banks responded to lower inflation data and began to lower policy interest rates, which was favorable for bond prices and returns. Macroeconomic sentiment centered, particularly more recently, on a soft-landing scenario in the U.S., providing a supportive credit risk environment. During the period, narrowing credit spreads were a positive return driver in the global bond market, in addition to the response to lower bond market yields. This resulted in broad gains across varied market sectors, including government bonds, investment grade and high yield corporate securities, mortgage- and asset-backed instruments, and emerging market issues.
Top contributors to the Fund’s performance relative to the Bloomberg U.S. Aggregate 1-3 Year Bond Index:
• The corporate credit exposure, mainly investment grade, was favorable from issue selection
• The securitized asset exposure (MBS, ABS, and CMBS) were also positive contributors from selection and allocation effects
Top detractors to the Fund’s performance relative to the Bloomberg U.S. Aggregate 1-3 Year Bond Index:
• U.S. Treasury by virtue of the Fund being underweight and the sector gaining from lower interest rates
• Derivatives exposure mainly from U.S. Treasury futures to manage Fund duration
Performance shown is past performance and does not guarantee future results. The graph and table below do not reflect the deduction of taxes that a shareholder would pay on Fund distributions or redemption of Fund shares. The graph and table below assume reinvestment of dividends and capital gain distributions.
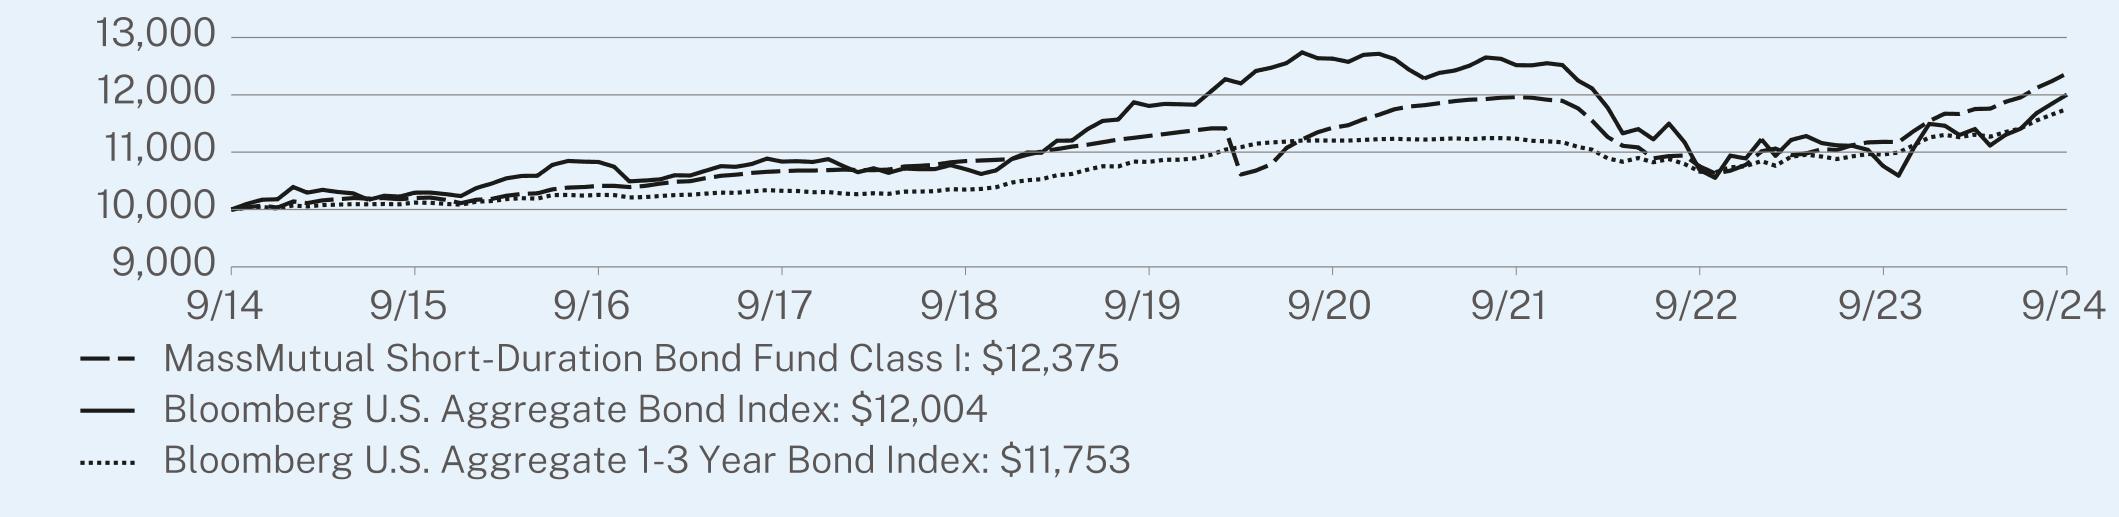
GROWTH OF A HYPOTHETICAL $10,000 INVESTMENT (October 1, 2014 through September 30, 2024)
This graph shows the performance of a hypothetical $10,000 investment in the share class noted over a ten-year period or since inception, if shorter, as compared to the performance of a broad-based securities market index, and, if applicable, one or more indexes that MML Investment Advisers, LLC believes more closely reflects the market segments in which the Fund invests or is a better comparison for the Fund’s investment strategy. This graph includes the deduction of the maximum applicable sales charge, if any.
| MM202912-309770 | PAGE 1 | TSR-AR-ITGS6 |
The index or indexes shown above are unmanaged, cannot be purchased directly, and, with the exception of any peer group index, do not incur expenses.
AVERAGE ANNUAL TOTAL RETURNS (%) (as of September 30, 2024)
| | | |
| | 1 Year | 5 Year | 10 Year |
Class I - without sales charge | 10.69 | 1.86 | 2.15 |
Bloomberg U.S. Aggregate Bond Index1 | 11.57 | 0.33 | 1.84 |
Bloomberg U.S. Aggregate 1-3 Year Bond Index | 7.23 | 1.65 | 1.63 |
| 1 | Effective July 24, 2024, the Bloomberg U.S. Aggregate Bond Index replaced the Bloomberg U.S. Aggregate 1-3 Year Bond Index as a broad measure of market performance in accordance with new regulatory disclosure requirements. The Fund continues to use the Bloomberg U.S. Aggregate 1-3 Year Bond Index as a supplemental benchmark that MML Investment Advisers, LLC believes more closely reflects the market segments in which the Fund invests. |
Performance results reflect any applicable waivers or expense limitations in effect during these periods, without which performance would have been lower. The investment return and principal value of shares of the Fund fluctuate, so your shares, when sold, may be worth more or less than their original cost. Current performance of the Fund may be lower or higher than the performance quoted. Performance data current to the most recent month-end may be obtained at https://www.massmutual.com/product-performance/mutual-funds or by calling 1-888-309-3539 or by sending an email request to fundinfo@massmutual.com.
WHAT ARE SOME KEY FUND STATISTICS? (as of September 30, 2024)
| |
Total Net Assets (Millions) | $157.1 |
Total Number of Portfolio Holdings (includes derivative positions, if any) | 202 |
Total Advisory Fees Paid During the Reporting Period | $617,178 |
Portfolio Turnover Rate | 34% |
WHAT DID THE FUND INVEST IN? (as of September 30, 2024)
Derivative values, if any, are excluded from the table(s) below.
| |
Portfolio Characteristics
(% of Total Investments) | |
Corporate Debt | 45.6% |
Non-U.S. Government Agency Obligations | 39.1% |
Commercial Paper | 12.7% |
Repurchase Agreement | 2.1% |
Investment of Cash Collateral from Securities Loaned | 0.5% |
U.S. Government Agency Obligations and Instrumentalities | 0.0% |
| MM202912-309770 | PAGE 2 | TSR-AR-ITGS6 |
HOW HAS THE FUND CHANGED?
The following is a summary of certain changes to the Fund since October 1, 2023. For more complete information, you may review the Fund’s prospectus, including any applicable supplements, at https://www.massmutual.com/product-performance/mutual-funds or upon request at 1-888-309-3539 or fundinfo@massmutual.com.
Effective February 1, 2024, the maximum front-end sales charge on Class L shares of the Fund increased from 2.00% to 2.50%; and the maximum contingent deferred sales charge on Class L and Class C shares of the Fund increased from 0.50% to 1.00%.
Effective February 1, 2024, the annual rate for administrative services for Class A shares of the Fund was reduced from 0.30% to 0.25%.
Prior to February 1, 2024, MML Investment Advisers, LLC had agreed to cap the fees and expenses of the Fund (other than extraordinary legal and other expenses, Acquired Fund Fees and Expenses, interest expense, expenses related to borrowings, securities lending, leverage, taxes, and brokerage, short sale dividend and loan expense, or other non-recurring or unusual expenses such as organizational expenses and shareholder meeting expenses, as applicable) through January 31, 2024, to the extent that Total Annual Fund Operating Expenses after Expense Reimbursement would otherwise exceed 0.40% for Classes I and Y, and 0.65% and 0.90% for Classes L and C, respectively.
On February 1, 2024, this agreement was replaced by a new agreement with MML Investment Advisers, LLC to cap the fees and expenses of the Fund (other than extraordinary legal and other expenses, Acquired Fund Fees and Expenses, interest expense, expenses related to borrowings, securities lending, leverage, taxes, and brokerage, short sale dividend and loan expense, or other non-recurring or unusual expenses such as organizational expenses and shareholder meeting expenses, as applicable) through January 31, 2025, to the extent that Total Annual Fund Operating Expenses after Expense Reimbursement would otherwise exceed 0.46%, 0.56%, 0.66%, 0.76%, 0.91%, 0.96%, 1.16%, 0.51%, 0.76%, and 1.01% for Classes I, R5, Service, Administrative, R4, A, R3, Y, L, and C, respectively.
Effective February 1, 2024, the Fund’s Principal Investment Strategies were updated to reflect that the Fund’s subadvisers intend for the Fund’s portfolio dollar-weighted average duration generally to match (within 10%) the average duration of the Bloomberg U.S. Aggregate 1-3 Year Bond Index.
| |
| WHERE CAN I FIND ADDITIONAL INFORMATION ABOUT THE FUND? |
For additional information about the Fund, including its prospectus, financial information, holdings, and proxy voting information, scan the QR code or visit https://www.massmutual.com/product-performance/mutual-funds. |
| MM202912-309770 | PAGE 3 | TSR-AR-ITGS6 |
100001020010412106691084511284114261196210754111801237510000102941082910836107051180712632125181069110760120041000010121102551032610348108311120311236106611096011753
| | |
MassMutual Short-Duration Bond Fund | |
| Class R5 | MSTDX |
| Annual Shareholder Report | September 30, 2024 |
This annual shareholder report contains important information about the MassMutual Short-Duration Bond Fund (the “Fund”) for the period of October 1, 2023 to September 30, 2024. You can find additional information about the Fund at https://www.massmutual.com/product-performance/mutual-funds. You can also request this information by contacting us at 1-888-309-3539 or by sending an email request to fundinfo@massmutual.com.
This report describes changes to the Fund that occurred during the reporting period.
WHAT WERE THE FUND COSTS FOR THE LAST YEAR?
This example shows the expenses you would have paid over the past year, based on a hypothetical $10,000 investment. This table reflects any applicable waivers or expense limitations.
| | |
Class Name | Costs of a $10,000 investment | Costs paid as a percentage of a $10,000 investment |
| Class R5 | $64 | 0.61% |
HOW DID THE FUND PERFORM?
Global bond markets were broadly, and strongly, positive for the trailing one-year period. During the period, central banks responded to lower inflation data and began to lower policy interest rates, which was favorable for bond prices and returns. Macroeconomic sentiment centered, particularly more recently, on a soft-landing scenario in the U.S., providing a supportive credit risk environment. During the period, narrowing credit spreads were a positive return driver in the global bond market, in addition to the response to lower bond market yields. This resulted in broad gains across varied market sectors, including government bonds, investment grade and high yield corporate securities, mortgage- and asset-backed instruments, and emerging market issues.
Top contributors to the Fund’s performance relative to the Bloomberg U.S. Aggregate 1-3 Year Bond Index:
• The corporate credit exposure, mainly investment grade, was favorable from issue selection
• The securitized asset exposure (MBS, ABS, and CMBS) were also positive contributors from selection and allocation effects
Top detractors to the Fund’s performance relative to the Bloomberg U.S. Aggregate 1-3 Year Bond Index:
• U.S. Treasury by virtue of the Fund being underweight and the sector gaining from lower interest rates
• Derivatives exposure mainly from U.S. Treasury futures to manage Fund duration
Performance shown is past performance and does not guarantee future results. The graph and table below do not reflect the deduction of taxes that a shareholder would pay on Fund distributions or redemption of Fund shares. The graph and table below assume reinvestment of dividends and capital gain distributions.
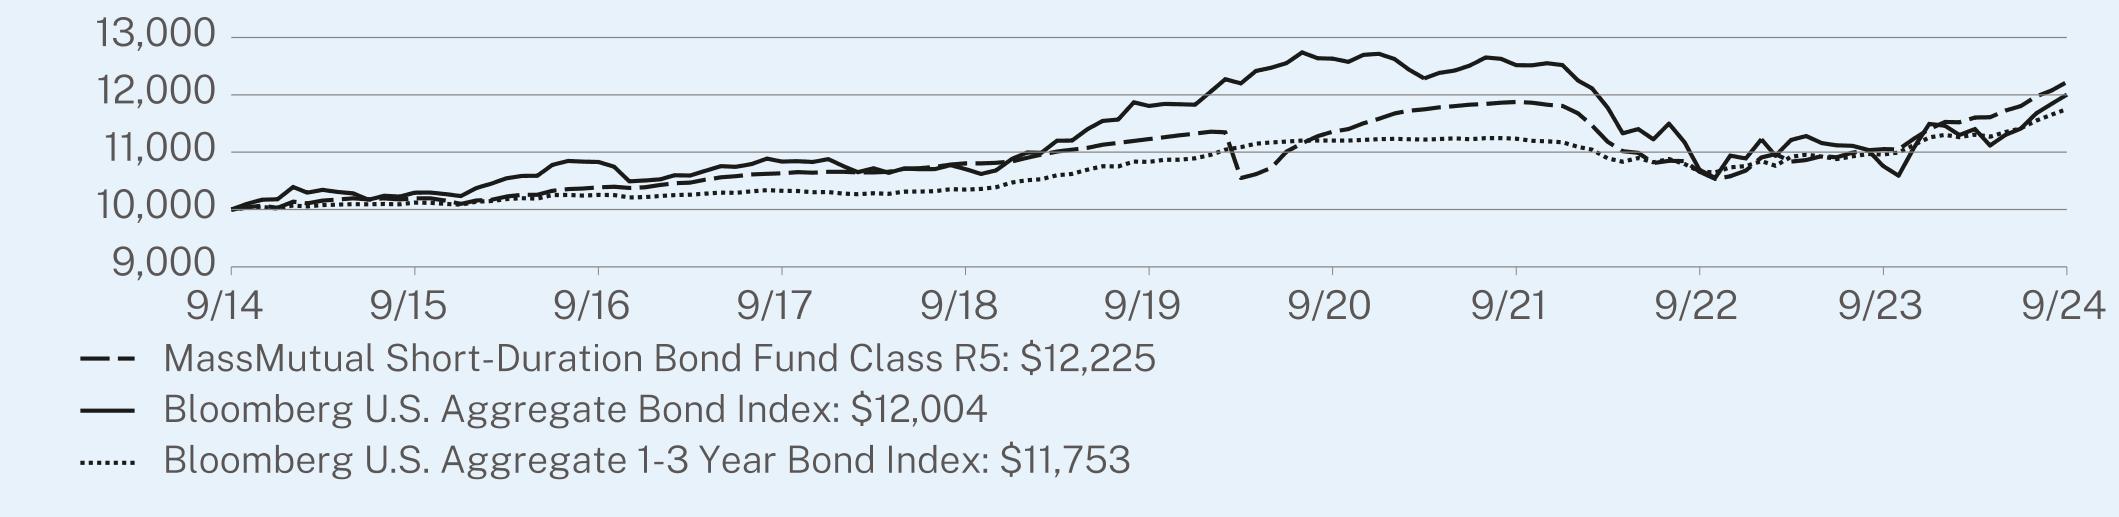
GROWTH OF A HYPOTHETICAL $10,000 INVESTMENT (October 1, 2014 through September 30, 2024)
This graph shows the performance of a hypothetical $10,000 investment in the share class noted over a ten-year period or since inception, if shorter, as compared to the performance of a broad-based securities market index, and, if applicable, one or more indexes that MML Investment Advisers, LLC believes more closely reflects the market segments in which the Fund invests or is a better comparison for the Fund’s investment strategy. This graph includes the deduction of the maximum applicable sales charge, if any.
| MM202912-309770 | PAGE 1 | TSR-AR-ITGS1 |
The index or indexes shown above are unmanaged, cannot be purchased directly, and, with the exception of any peer group index, do not incur expenses.
AVERAGE ANNUAL TOTAL RETURNS (%) (as of September 30, 2024)
| | | |
| | 1 Year | 5 Year | 10 Year |
Class R5 - without sales charge | 10.60 | 1.72 | 2.03 |
Bloomberg U.S. Aggregate Bond Index1 | 11.57 | 0.33 | 1.84 |
Bloomberg U.S. Aggregate 1-3 Year Bond Index | 7.23 | 1.65 | 1.63 |
| 1 | Effective July 24, 2024, the Bloomberg U.S. Aggregate Bond Index replaced the Bloomberg U.S. Aggregate 1-3 Year Bond Index as a broad measure of market performance in accordance with new regulatory disclosure requirements. The Fund continues to use the Bloomberg U.S. Aggregate 1-3 Year Bond Index as a supplemental benchmark that MML Investment Advisers, LLC believes more closely reflects the market segments in which the Fund invests. |
Performance results reflect any applicable waivers or expense limitations in effect during these periods, without which performance would have been lower. The investment return and principal value of shares of the Fund fluctuate, so your shares, when sold, may be worth more or less than their original cost. Current performance of the Fund may be lower or higher than the performance quoted. Performance data current to the most recent month-end may be obtained at https://www.massmutual.com/product-performance/mutual-funds or by calling 1-888-309-3539 or by sending an email request to fundinfo@massmutual.com.
WHAT ARE SOME KEY FUND STATISTICS? (as of September 30, 2024)
| |
Total Net Assets (Millions) | $157.1 |
Total Number of Portfolio Holdings (includes derivative positions, if any) | 202 |
Total Advisory Fees Paid During the Reporting Period | $617,178 |
Portfolio Turnover Rate | 34% |
WHAT DID THE FUND INVEST IN? (as of September 30, 2024)
Derivative values, if any, are excluded from the table(s) below.
| |
Portfolio Characteristics
(% of Total Investments) | |
Corporate Debt | 45.6% |
Non-U.S. Government Agency Obligations | 39.1% |
Commercial Paper | 12.7% |
Repurchase Agreement | 2.1% |
Investment of Cash Collateral from Securities Loaned | 0.5% |
U.S. Government Agency Obligations and Instrumentalities | 0.0% |
| MM202912-309770 | PAGE 2 | TSR-AR-ITGS1 |
HOW HAS THE FUND CHANGED?
The following is a summary of certain changes to the Fund since October 1, 2023. For more complete information, you may review the Fund’s prospectus, including any applicable supplements, at https://www.massmutual.com/product-performance/mutual-funds or upon request at 1-888-309-3539 or fundinfo@massmutual.com.
Effective February 1, 2024, the maximum front-end sales charge on Class L shares of the Fund increased from 2.00% to 2.50%; and the maximum contingent deferred sales charge on Class L and Class C shares of the Fund increased from 0.50% to 1.00%.
Effective February 1, 2024, the annual rate for administrative services for Class A shares of the Fund was reduced from 0.30% to 0.25%.
Prior to February 1, 2024, MML Investment Advisers, LLC had agreed to cap the fees and expenses of the Fund (other than extraordinary legal and other expenses, Acquired Fund Fees and Expenses, interest expense, expenses related to borrowings, securities lending, leverage, taxes, and brokerage, short sale dividend and loan expense, or other non-recurring or unusual expenses such as organizational expenses and shareholder meeting expenses, as applicable) through January 31, 2024, to the extent that Total Annual Fund Operating Expenses after Expense Reimbursement would otherwise exceed 0.40% for Classes I and Y, and 0.65% and 0.90% for Classes L and C, respectively.
On February 1, 2024, this agreement was replaced by a new agreement with MML Investment Advisers, LLC to cap the fees and expenses of the Fund (other than extraordinary legal and other expenses, Acquired Fund Fees and Expenses, interest expense, expenses related to borrowings, securities lending, leverage, taxes, and brokerage, short sale dividend and loan expense, or other non-recurring or unusual expenses such as organizational expenses and shareholder meeting expenses, as applicable) through January 31, 2025, to the extent that Total Annual Fund Operating Expenses after Expense Reimbursement would otherwise exceed 0.46%, 0.56%, 0.66%, 0.76%, 0.91%, 0.96%, 1.16%, 0.51%, 0.76%, and 1.01% for Classes I, R5, Service, Administrative, R4, A, R3, Y, L, and C, respectively.
Effective February 1, 2024, the Fund’s Principal Investment Strategies were updated to reflect that the Fund’s subadvisers intend for the Fund’s portfolio dollar-weighted average duration generally to match (within 10%) the average duration of the Bloomberg U.S. Aggregate 1-3 Year Bond Index.
| |
| WHERE CAN I FIND ADDITIONAL INFORMATION ABOUT THE FUND? |
For additional information about the Fund, including its prospectus, financial information, holdings, and proxy voting information, scan the QR code or visit https://www.massmutual.com/product-performance/mutual-funds. |
| MM202912-309770 | PAGE 3 | TSR-AR-ITGS1 |
100001019510387106321080511228113581187610658110531222510000102941082910836107051180712632125181069110760120041000010121102551032610348108311120311236106611096011753
| | |
MassMutual Short-Duration Bond Fund | |
| Service Class | MSBYX |
| Annual Shareholder Report | September 30, 2024 |
This annual shareholder report contains important information about the MassMutual Short-Duration Bond Fund (the “Fund”) for the period of October 1, 2023 to September 30, 2024. You can find additional information about the Fund at https://www.massmutual.com/product-performance/mutual-funds. You can also request this information by contacting us at 1-888-309-3539 or by sending an email request to fundinfo@massmutual.com.
This report describes changes to the Fund that occurred during the reporting period.
WHAT WERE THE FUND COSTS FOR THE LAST YEAR?
This example shows the expenses you would have paid over the past year, based on a hypothetical $10,000 investment. This table reflects any applicable waivers or expense limitations.
| | |
Class Name | Costs of a $10,000 investment | Costs paid as a percentage of a $10,000 investment |
| Service Class | $75 | 0.71% |
HOW DID THE FUND PERFORM?
Global bond markets were broadly, and strongly, positive for the trailing one-year period. During the period, central banks responded to lower inflation data and began to lower policy interest rates, which was favorable for bond prices and returns. Macroeconomic sentiment centered, particularly more recently, on a soft-landing scenario in the U.S., providing a supportive credit risk environment. During the period, narrowing credit spreads were a positive return driver in the global bond market, in addition to the response to lower bond market yields. This resulted in broad gains across varied market sectors, including government bonds, investment grade and high yield corporate securities, mortgage- and asset-backed instruments, and emerging market issues.
Top contributors to the Fund’s performance relative to the Bloomberg U.S. Aggregate 1-3 Year Bond Index:
• The corporate credit exposure, mainly investment grade, was favorable from issue selection
• The securitized asset exposure (MBS, ABS, and CMBS) were also positive contributors from selection and allocation effects
Top detractors to the Fund’s performance relative to the Bloomberg U.S. Aggregate 1-3 Year Bond Index:
• U.S. Treasury by virtue of the Fund being underweight and the sector gaining from lower interest rates
• Derivatives exposure mainly from U.S. Treasury futures to manage Fund duration
Performance shown is past performance and does not guarantee future results. The graph and table below do not reflect the deduction of taxes that a shareholder would pay on Fund distributions or redemption of Fund shares. The graph and table below assume reinvestment of dividends and capital gain distributions.
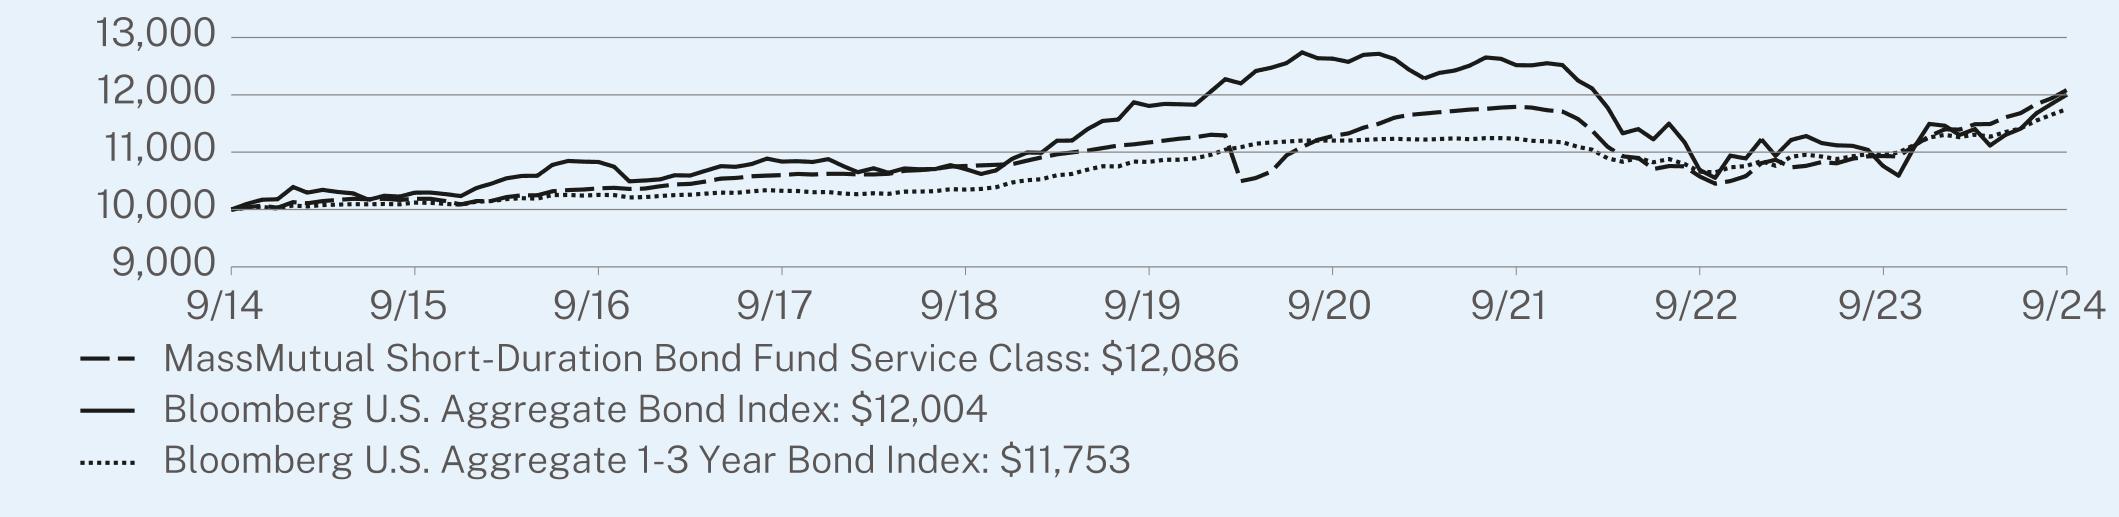
GROWTH OF A HYPOTHETICAL $10,000 INVESTMENT (October 1, 2014 through September 30, 2024)
This graph shows the performance of a hypothetical $10,000 investment in the share class noted over a ten-year period or since inception, if shorter, as compared to the performance of a broad-based securities market index, and, if applicable, one or more indexes that MML Investment Advisers, LLC believes more closely reflects the market segments in which the Fund invests or is a better comparison for the Fund’s investment strategy. This graph includes the deduction of the maximum applicable sales charge, if any.
| MM202912-309770 | PAGE 1 | TSR-AR-ITGS3 |
The index or indexes shown above are unmanaged, cannot be purchased directly, and, with the exception of any peer group index, do not incur expenses.
AVERAGE ANNUAL TOTAL RETURNS (%) (as of September 30, 2024)
| | | |
| | 1 Year | 5 Year | 10 Year |
Service Class - without sales charge | 10.55 | 1.59 | 1.91 |
Bloomberg U.S. Aggregate Bond Index1 | 11.57 | 0.33 | 1.84 |
Bloomberg U.S. Aggregate 1-3 Year Bond Index | 7.23 | 1.65 | 1.63 |
| 1 | Effective July 24, 2024, the Bloomberg U.S. Aggregate Bond Index replaced the Bloomberg U.S. Aggregate 1-3 Year Bond Index as a broad measure of market performance in accordance with new regulatory disclosure requirements. The Fund continues to use the Bloomberg U.S. Aggregate 1-3 Year Bond Index as a supplemental benchmark that MML Investment Advisers, LLC believes more closely reflects the market segments in which the Fund invests. |
Performance results reflect any applicable waivers or expense limitations in effect during these periods, without which performance would have been lower. The investment return and principal value of shares of the Fund fluctuate, so your shares, when sold, may be worth more or less than their original cost. Current performance of the Fund may be lower or higher than the performance quoted. Performance data current to the most recent month-end may be obtained at https://www.massmutual.com/product-performance/mutual-funds or by calling 1-888-309-3539 or by sending an email request to fundinfo@massmutual.com.
WHAT ARE SOME KEY FUND STATISTICS? (as of September 30, 2024)
| |
Total Net Assets (Millions) | $157.1 |
Total Number of Portfolio Holdings (includes derivative positions, if any) | 202 |
Total Advisory Fees Paid During the Reporting Period | $617,178 |
Portfolio Turnover Rate | 34% |
WHAT DID THE FUND INVEST IN? (as of September 30, 2024)
Derivative values, if any, are excluded from the table(s) below.
| |
Portfolio Characteristics
(% of Total Investments) | |
Corporate Debt | 45.6% |
Non-U.S. Government Agency Obligations | 39.1% |
Commercial Paper | 12.7% |
Repurchase Agreement | 2.1% |
Investment of Cash Collateral from Securities Loaned | 0.5% |
U.S. Government Agency Obligations and Instrumentalities | 0.0% |
| MM202912-309770 | PAGE 2 | TSR-AR-ITGS3 |
HOW HAS THE FUND CHANGED?
The following is a summary of certain changes to the Fund since October 1, 2023. For more complete information, you may review the Fund’s prospectus, including any applicable supplements, at https://www.massmutual.com/product-performance/mutual-funds or upon request at 1-888-309-3539 or fundinfo@massmutual.com.
Effective February 1, 2024, the maximum front-end sales charge on Class L shares of the Fund increased from 2.00% to 2.50%; and the maximum contingent deferred sales charge on Class L and Class C shares of the Fund increased from 0.50% to 1.00%.
Effective February 1, 2024, the annual rate for administrative services for Class A shares of the Fund was reduced from 0.30% to 0.25%.
Prior to February 1, 2024, MML Investment Advisers, LLC had agreed to cap the fees and expenses of the Fund (other than extraordinary legal and other expenses, Acquired Fund Fees and Expenses, interest expense, expenses related to borrowings, securities lending, leverage, taxes, and brokerage, short sale dividend and loan expense, or other non-recurring or unusual expenses such as organizational expenses and shareholder meeting expenses, as applicable) through January 31, 2024, to the extent that Total Annual Fund Operating Expenses after Expense Reimbursement would otherwise exceed 0.40% for Classes I and Y, and 0.65% and 0.90% for Classes L and C, respectively.
On February 1, 2024, this agreement was replaced by a new agreement with MML Investment Advisers, LLC to cap the fees and expenses of the Fund (other than extraordinary legal and other expenses, Acquired Fund Fees and Expenses, interest expense, expenses related to borrowings, securities lending, leverage, taxes, and brokerage, short sale dividend and loan expense, or other non-recurring or unusual expenses such as organizational expenses and shareholder meeting expenses, as applicable) through January 31, 2025, to the extent that Total Annual Fund Operating Expenses after Expense Reimbursement would otherwise exceed 0.46%, 0.56%, 0.66%, 0.76%, 0.91%, 0.96%, 1.16%, 0.51%, 0.76%, and 1.01% for Classes I, R5, Service, Administrative, R4, A, R3, Y, L, and C, respectively.
Effective February 1, 2024, the Fund’s Principal Investment Strategies were updated to reflect that the Fund’s subadvisers intend for the Fund’s portfolio dollar-weighted average duration generally to match (within 10%) the average duration of the Bloomberg U.S. Aggregate 1-3 Year Bond Index.
| |
| WHERE CAN I FIND ADDITIONAL INFORMATION ABOUT THE FUND? |
For additional information about the Fund, including its prospectus, financial information, holdings, and proxy voting information, scan the QR code or visit https://www.massmutual.com/product-performance/mutual-funds. |
| MM202912-309770 | PAGE 3 | TSR-AR-ITGS3 |
100001018710369106011075911170112821179110577109331208610000102941082910836107051180712632125181069110760120041000010121102551032610348108311120311236106611096011753
| | |
MassMutual Short-Duration Bond Fund | |
| Administrative Class | MSTLX |
| Annual Shareholder Report | September 30, 2024 |
This annual shareholder report contains important information about the MassMutual Short-Duration Bond Fund (the “Fund”) for the period of October 1, 2023 to September 30, 2024. You can find additional information about the Fund at https://www.massmutual.com/product-performance/mutual-funds. You can also request this information by contacting us at 1-888-309-3539 or by sending an email request to fundinfo@massmutual.com.
This report describes changes to the Fund that occurred during the reporting period.
WHAT WERE THE FUND COSTS FOR THE LAST YEAR?
This example shows the expenses you would have paid over the past year, based on a hypothetical $10,000 investment. This table reflects any applicable waivers or expense limitations.
| | |
Class Name | Costs of a $10,000 investment | Costs paid as a percentage of a $10,000 investment |
| Administrative Class | $85 | 0.81% |
HOW DID THE FUND PERFORM?
Global bond markets were broadly, and strongly, positive for the trailing one-year period. During the period, central banks responded to lower inflation data and began to lower policy interest rates, which was favorable for bond prices and returns. Macroeconomic sentiment centered, particularly more recently, on a soft-landing scenario in the U.S., providing a supportive credit risk environment. During the period, narrowing credit spreads were a positive return driver in the global bond market, in addition to the response to lower bond market yields. This resulted in broad gains across varied market sectors, including government bonds, investment grade and high yield corporate securities, mortgage- and asset-backed instruments, and emerging market issues.
Top contributors to the Fund’s performance relative to the Bloomberg U.S. Aggregate 1-3 Year Bond Index:
• The corporate credit exposure, mainly investment grade, was favorable from issue selection
• The securitized asset exposure (MBS, ABS, and CMBS) were also positive contributors from selection and allocation effects
Top detractors to the Fund’s performance relative to the Bloomberg U.S. Aggregate 1-3 Year Bond Index:
• U.S. Treasury by virtue of the Fund being underweight and the sector gaining from lower interest rates
• Derivatives exposure mainly from U.S. Treasury futures to manage Fund duration
Performance shown is past performance and does not guarantee future results. The graph and table below do not reflect the deduction of taxes that a shareholder would pay on Fund distributions or redemption of Fund shares. The graph and table below assume reinvestment of dividends and capital gain distributions.
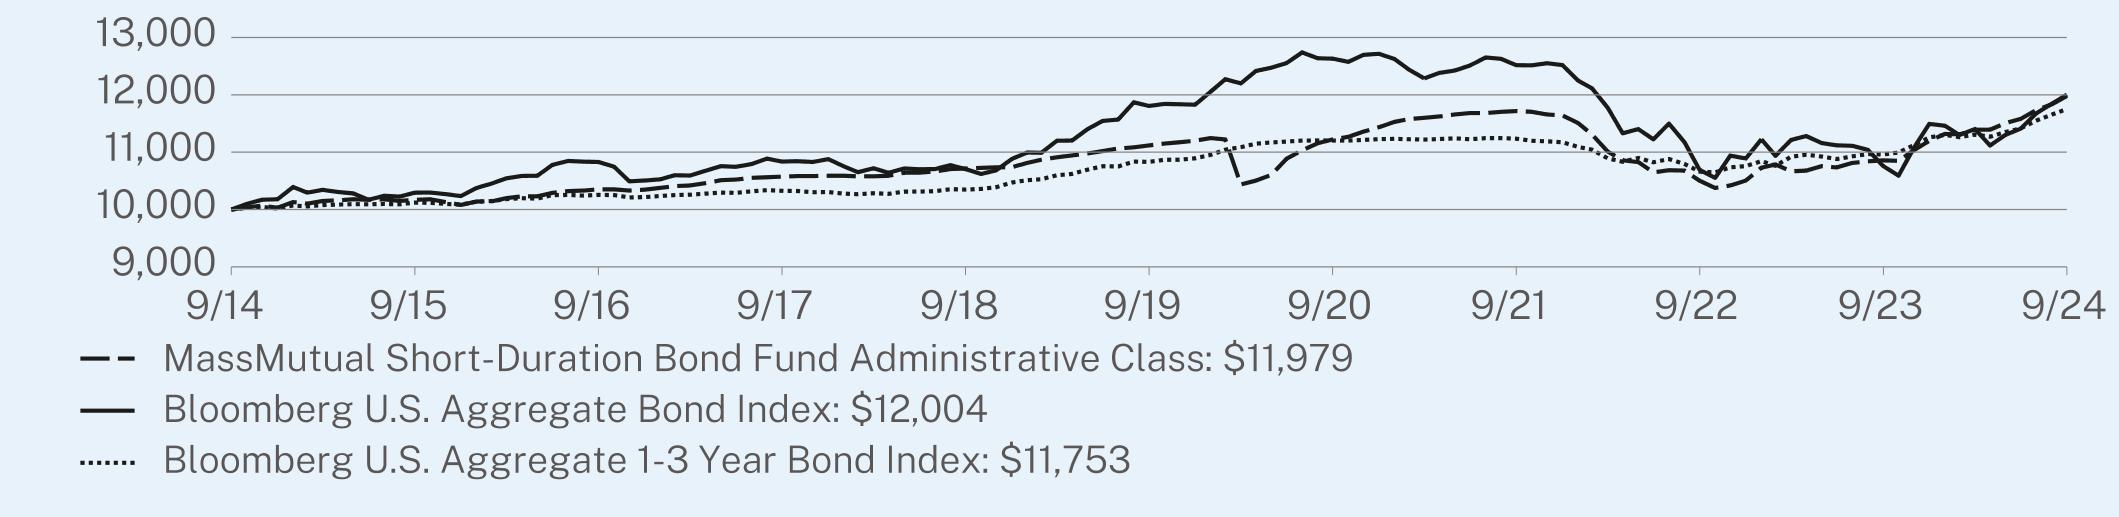
GROWTH OF A HYPOTHETICAL $10,000 INVESTMENT (October 1, 2014 through September 30, 2024)
This graph shows the performance of a hypothetical $10,000 investment in the share class noted over a ten-year period or since inception, if shorter, as compared to the performance of a broad-based securities market index, and, if applicable, one or more indexes that MML Investment Advisers, LLC believes more closely reflects the market segments in which the Fund invests or is a better comparison for the Fund’s investment strategy. This graph includes the deduction of the maximum applicable sales charge, if any.
| MM202912-309770 | PAGE 1 | TSR-AR-ITGS4 |
The index or indexes shown above are unmanaged, cannot be purchased directly, and, with the exception of any peer group index, do not incur expenses.
AVERAGE ANNUAL TOTAL RETURNS (%) (as of September 30, 2024)
| | | |
| | 1 Year | 5 Year | 10 Year |
Administrative Class - without sales charge | 10.33 | 1.50 | 1.82 |
Bloomberg U.S. Aggregate Bond Index1 | 11.57 | 0.33 | 1.84 |
Bloomberg U.S. Aggregate 1-3 Year Bond Index | 7.23 | 1.65 | 1.63 |
| 1 | Effective July 24, 2024, the Bloomberg U.S. Aggregate Bond Index replaced the Bloomberg U.S. Aggregate 1-3 Year Bond Index as a broad measure of market performance in accordance with new regulatory disclosure requirements. The Fund continues to use the Bloomberg U.S. Aggregate 1-3 Year Bond Index as a supplemental benchmark that MML Investment Advisers, LLC believes more closely reflects the market segments in which the Fund invests. |
Performance results reflect any applicable waivers or expense limitations in effect during these periods, without which performance would have been lower. The investment return and principal value of shares of the Fund fluctuate, so your shares, when sold, may be worth more or less than their original cost. Current performance of the Fund may be lower or higher than the performance quoted. Performance data current to the most recent month-end may be obtained at https://www.massmutual.com/product-performance/mutual-funds or by calling 1-888-309-3539 or by sending an email request to fundinfo@massmutual.com.
WHAT ARE SOME KEY FUND STATISTICS? (as of September 30, 2024)
| |
Total Net Assets (Millions) | $157.1 |
Total Number of Portfolio Holdings (includes derivative positions, if any) | 202 |
Total Advisory Fees Paid During the Reporting Period | $617,178 |
Portfolio Turnover Rate | 34% |
WHAT DID THE FUND INVEST IN? (as of September 30, 2024)
Derivative values, if any, are excluded from the table(s) below.
| |
Portfolio Characteristics
(% of Total Investments) | |
Corporate Debt | 45.6% |
Non-U.S. Government Agency Obligations | 39.1% |
Commercial Paper | 12.7% |
Repurchase Agreement | 2.1% |
Investment of Cash Collateral from Securities Loaned | 0.5% |
U.S. Government Agency Obligations and Instrumentalities | 0.0% |
| MM202912-309770 | PAGE 2 | TSR-AR-ITGS4 |
HOW HAS THE FUND CHANGED?
The following is a summary of certain changes to the Fund since October 1, 2023. For more complete information, you may review the Fund’s prospectus, including any applicable supplements, at https://www.massmutual.com/product-performance/mutual-funds or upon request at 1-888-309-3539 or fundinfo@massmutual.com.
Effective February 1, 2024, the maximum front-end sales charge on Class L shares of the Fund increased from 2.00% to 2.50%; and the maximum contingent deferred sales charge on Class L and Class C shares of the Fund increased from 0.50% to 1.00%.
Effective February 1, 2024, the annual rate for administrative services for Class A shares of the Fund was reduced from 0.30% to 0.25%.
Prior to February 1, 2024, MML Investment Advisers, LLC had agreed to cap the fees and expenses of the Fund (other than extraordinary legal and other expenses, Acquired Fund Fees and Expenses, interest expense, expenses related to borrowings, securities lending, leverage, taxes, and brokerage, short sale dividend and loan expense, or other non-recurring or unusual expenses such as organizational expenses and shareholder meeting expenses, as applicable) through January 31, 2024, to the extent that Total Annual Fund Operating Expenses after Expense Reimbursement would otherwise exceed 0.40% for Classes I and Y, and 0.65% and 0.90% for Classes L and C, respectively.
On February 1, 2024, this agreement was replaced by a new agreement with MML Investment Advisers, LLC to cap the fees and expenses of the Fund (other than extraordinary legal and other expenses, Acquired Fund Fees and Expenses, interest expense, expenses related to borrowings, securities lending, leverage, taxes, and brokerage, short sale dividend and loan expense, or other non-recurring or unusual expenses such as organizational expenses and shareholder meeting expenses, as applicable) through January 31, 2025, to the extent that Total Annual Fund Operating Expenses after Expense Reimbursement would otherwise exceed 0.46%, 0.56%, 0.66%, 0.76%, 0.91%, 0.96%, 1.16%, 0.51%, 0.76%, and 1.01% for Classes I, R5, Service, Administrative, R4, A, R3, Y, L, and C, respectively.
Effective February 1, 2024, the Fund’s Principal Investment Strategies were updated to reflect that the Fund’s subadvisers intend for the Fund’s portfolio dollar-weighted average duration generally to match (within 10%) the average duration of the Bloomberg U.S. Aggregate 1-3 Year Bond Index.
| |
| WHERE CAN I FIND ADDITIONAL INFORMATION ABOUT THE FUND? |
For additional information about the Fund, including its prospectus, financial information, holdings, and proxy voting information, scan the QR code or visit https://www.massmutual.com/product-performance/mutual-funds. |
| MM202912-309770 | PAGE 3 | TSR-AR-ITGS4 |
100001016910351105731071511118112231171710502108571197910000102941082910836107051180712632125181069110760120041000010121102551032610348108311120311236106611096011753
| | |
MassMutual Short-Duration Bond Fund | |
| Class R4 | MPSDX |
| Annual Shareholder Report | September 30, 2024 |
This annual shareholder report contains important information about the MassMutual Short-Duration Bond Fund (the “Fund”) for the period of October 1, 2023 to September 30, 2024. You can find additional information about the Fund at https://www.massmutual.com/product-performance/mutual-funds. You can also request this information by contacting us at 1-888-309-3539 or by sending an email request to fundinfo@massmutual.com.
This report describes changes to the Fund that occurred during the reporting period.
WHAT WERE THE FUND COSTS FOR THE LAST YEAR?
This example shows the expenses you would have paid over the past year, based on a hypothetical $10,000 investment. This table reflects any applicable waivers or expense limitations.
| | |
Class Name | Costs of a $10,000 investment | Costs paid as a percentage of a $10,000 investment |
| Class R4 | $98 | 0.93% |
HOW DID THE FUND PERFORM?
Global bond markets were broadly, and strongly, positive for the trailing one-year period. During the period, central banks responded to lower inflation data and began to lower policy interest rates, which was favorable for bond prices and returns. Macroeconomic sentiment centered, particularly more recently, on a soft-landing scenario in the U.S., providing a supportive credit risk environment. During the period, narrowing credit spreads were a positive return driver in the global bond market, in addition to the response to lower bond market yields. This resulted in broad gains across varied market sectors, including government bonds, investment grade and high yield corporate securities, mortgage- and asset-backed instruments, and emerging market issues.
Top contributors to the Fund’s performance relative to the Bloomberg U.S. Aggregate 1-3 Year Bond Index:
• The corporate credit exposure, mainly investment grade, was favorable from issue selection
• The securitized asset exposure (MBS, ABS, and CMBS) were also positive contributors from selection and allocation effects
Top detractors to the Fund’s performance relative to the Bloomberg U.S. Aggregate 1-3 Year Bond Index:
• U.S. Treasury by virtue of the Fund being underweight and the sector gaining from lower interest rates
• Derivatives exposure mainly from U.S. Treasury futures to manage Fund duration
Performance shown is past performance and does not guarantee future results. The graph and table below do not reflect the deduction of taxes that a shareholder would pay on Fund distributions or redemption of Fund shares. The graph and table below assume reinvestment of dividends and capital gain distributions.
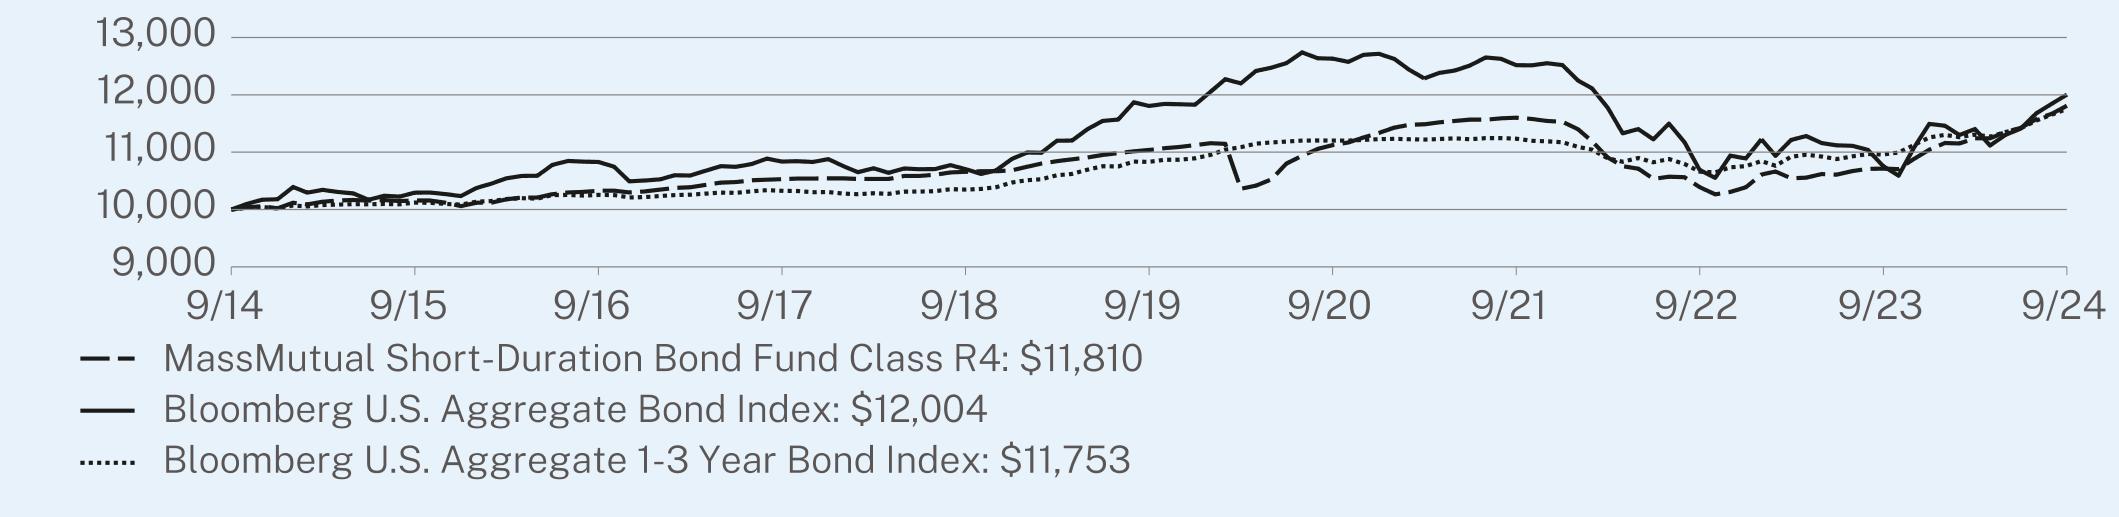
GROWTH OF A HYPOTHETICAL $10,000 INVESTMENT (October 1, 2014 through September 30, 2024)
This graph shows the performance of a hypothetical $10,000 investment in the share class noted over a ten-year period or since inception, if shorter, as compared to the performance of a broad-based securities market index, and, if applicable, one or more indexes that MML Investment Advisers, LLC believes more closely reflects the market segments in which the Fund invests or is a better comparison for the Fund’s investment strategy. This graph includes the deduction of the maximum applicable sales charge, if any.
| MM202912-309770 | PAGE 1 | TSR-AR-ITGSK |
The index or indexes shown above are unmanaged, cannot be purchased directly, and, with the exception of any peer group index, do not incur expenses.
AVERAGE ANNUAL TOTAL RETURNS (%) (as of September 30, 2024)
| | | |
| | 1 Year | 5 Year | 10 Year |
Class R4 - without sales charge | 10.24 | 1.36 | 1.68 |
Bloomberg U.S. Aggregate Bond Index1 | 11.57 | 0.33 | 1.84 |
Bloomberg U.S. Aggregate 1-3 Year Bond Index | 7.23 | 1.65 | 1.63 |
| 1 | Effective July 24, 2024, the Bloomberg U.S. Aggregate Bond Index replaced the Bloomberg U.S. Aggregate 1-3 Year Bond Index as a broad measure of market performance in accordance with new regulatory disclosure requirements. The Fund continues to use the Bloomberg U.S. Aggregate 1-3 Year Bond Index as a supplemental benchmark that MML Investment Advisers, LLC believes more closely reflects the market segments in which the Fund invests. |
Performance results reflect any applicable waivers or expense limitations in effect during these periods, without which performance would have been lower. The investment return and principal value of shares of the Fund fluctuate, so your shares, when sold, may be worth more or less than their original cost. Current performance of the Fund may be lower or higher than the performance quoted. Performance data current to the most recent month-end may be obtained at https://www.massmutual.com/product-performance/mutual-funds or by calling 1-888-309-3539 or by sending an email request to fundinfo@massmutual.com.
WHAT ARE SOME KEY FUND STATISTICS? (as of September 30, 2024)
| |
Total Net Assets (Millions) | $157.1 |
Total Number of Portfolio Holdings (includes derivative positions, if any) | 202 |
Total Advisory Fees Paid During the Reporting Period | $617,178 |
Portfolio Turnover Rate | 34% |
WHAT DID THE FUND INVEST IN? (as of September 30, 2024)
Derivative values, if any, are excluded from the table(s) below.
| |
Portfolio Characteristics
(% of Total Investments) | |
Corporate Debt | 45.6% |
Non-U.S. Government Agency Obligations | 39.1% |
Commercial Paper | 12.7% |
Repurchase Agreement | 2.1% |
Investment of Cash Collateral from Securities Loaned | 0.5% |
U.S. Government Agency Obligations and Instrumentalities | 0.0% |
| MM202912-309770 | PAGE 2 | TSR-AR-ITGSK |
HOW HAS THE FUND CHANGED?
The following is a summary of certain changes to the Fund since October 1, 2023. For more complete information, you may review the Fund’s prospectus, including any applicable supplements, at https://www.massmutual.com/product-performance/mutual-funds or upon request at 1-888-309-3539 or fundinfo@massmutual.com.
Effective February 1, 2024, the maximum front-end sales charge on Class L shares of the Fund increased from 2.00% to 2.50%; and the maximum contingent deferred sales charge on Class L and Class C shares of the Fund increased from 0.50% to 1.00%.
Effective February 1, 2024, the annual rate for administrative services for Class A shares of the Fund was reduced from 0.30% to 0.25%.
Prior to February 1, 2024, MML Investment Advisers, LLC had agreed to cap the fees and expenses of the Fund (other than extraordinary legal and other expenses, Acquired Fund Fees and Expenses, interest expense, expenses related to borrowings, securities lending, leverage, taxes, and brokerage, short sale dividend and loan expense, or other non-recurring or unusual expenses such as organizational expenses and shareholder meeting expenses, as applicable) through January 31, 2024, to the extent that Total Annual Fund Operating Expenses after Expense Reimbursement would otherwise exceed 0.40% for Classes I and Y, and 0.65% and 0.90% for Classes L and C, respectively.
On February 1, 2024, this agreement was replaced by a new agreement with MML Investment Advisers, LLC to cap the fees and expenses of the Fund (other than extraordinary legal and other expenses, Acquired Fund Fees and Expenses, interest expense, expenses related to borrowings, securities lending, leverage, taxes, and brokerage, short sale dividend and loan expense, or other non-recurring or unusual expenses such as organizational expenses and shareholder meeting expenses, as applicable) through January 31, 2025, to the extent that Total Annual Fund Operating Expenses after Expense Reimbursement would otherwise exceed 0.46%, 0.56%, 0.66%, 0.76%, 0.91%, 0.96%, 1.16%, 0.51%, 0.76%, and 1.01% for Classes I, R5, Service, Administrative, R4, A, R3, Y, L, and C, respectively.
Effective February 1, 2024, the Fund’s Principal Investment Strategies were updated to reflect that the Fund’s subadvisers intend for the Fund’s portfolio dollar-weighted average duration generally to match (within 10%) the average duration of the Bloomberg U.S. Aggregate 1-3 Year Bond Index.
| |
| WHERE CAN I FIND ADDITIONAL INFORMATION ABOUT THE FUND? |
For additional information about the Fund, including its prospectus, financial information, holdings, and proxy voting information, scan the QR code or visit https://www.massmutual.com/product-performance/mutual-funds. |
| MM202912-309770 | PAGE 3 | TSR-AR-ITGSK |
100001015710328105301065711038111241160210390107131181010000102941082910836107051180712632125181069110760120041000010121102551032610348108311120311236106611096011753
| | |
MassMutual Short-Duration Bond Fund | |
| Class A | MSHAX |
| Annual Shareholder Report | September 30, 2024 |
This annual shareholder report contains important information about the MassMutual Short-Duration Bond Fund (the “Fund”) for the period of October 1, 2023 to September 30, 2024. You can find additional information about the Fund at https://www.massmutual.com/product-performance/mutual-funds. You can also request this information by contacting us at 1-888-309-3539 or by sending an email request to fundinfo@massmutual.com.
This report describes changes to the Fund that occurred during the reporting period.
WHAT WERE THE FUND COSTS FOR THE LAST YEAR?
This example shows the expenses you would have paid over the past year, based on a hypothetical $10,000 investment. This table reflects any applicable waivers or expense limitations.
| | |
Class Name | Costs of a $10,000 investment | Costs paid as a percentage of a $10,000 investment |
| Class A | $107 | 1.02% |
HOW DID THE FUND PERFORM?
Global bond markets were broadly, and strongly, positive for the trailing one-year period. During the period, central banks responded to lower inflation data and began to lower policy interest rates, which was favorable for bond prices and returns. Macroeconomic sentiment centered, particularly more recently, on a soft-landing scenario in the U.S., providing a supportive credit risk environment. During the period, narrowing credit spreads were a positive return driver in the global bond market, in addition to the response to lower bond market yields. This resulted in broad gains across varied market sectors, including government bonds, investment grade and high yield corporate securities, mortgage- and asset-backed instruments, and emerging market issues.
Top contributors to the Fund’s performance relative to the Bloomberg U.S. Aggregate 1-3 Year Bond Index:
• The corporate credit exposure, mainly investment grade, was favorable from issue selection
• The securitized asset exposure (MBS, ABS, and CMBS) were also positive contributors from selection and allocation effects
Top detractors to the Fund’s performance relative to the Bloomberg U.S. Aggregate 1-3 Year Bond Index:
• U.S. Treasury by virtue of the Fund being underweight and the sector gaining from lower interest rates
• Derivatives exposure mainly from U.S. Treasury futures to manage Fund duration
Performance shown is past performance and does not guarantee future results. The graph and table below do not reflect the deduction of taxes that a shareholder would pay on Fund distributions or redemption of Fund shares. The graph and table below assume reinvestment of dividends and capital gain distributions.
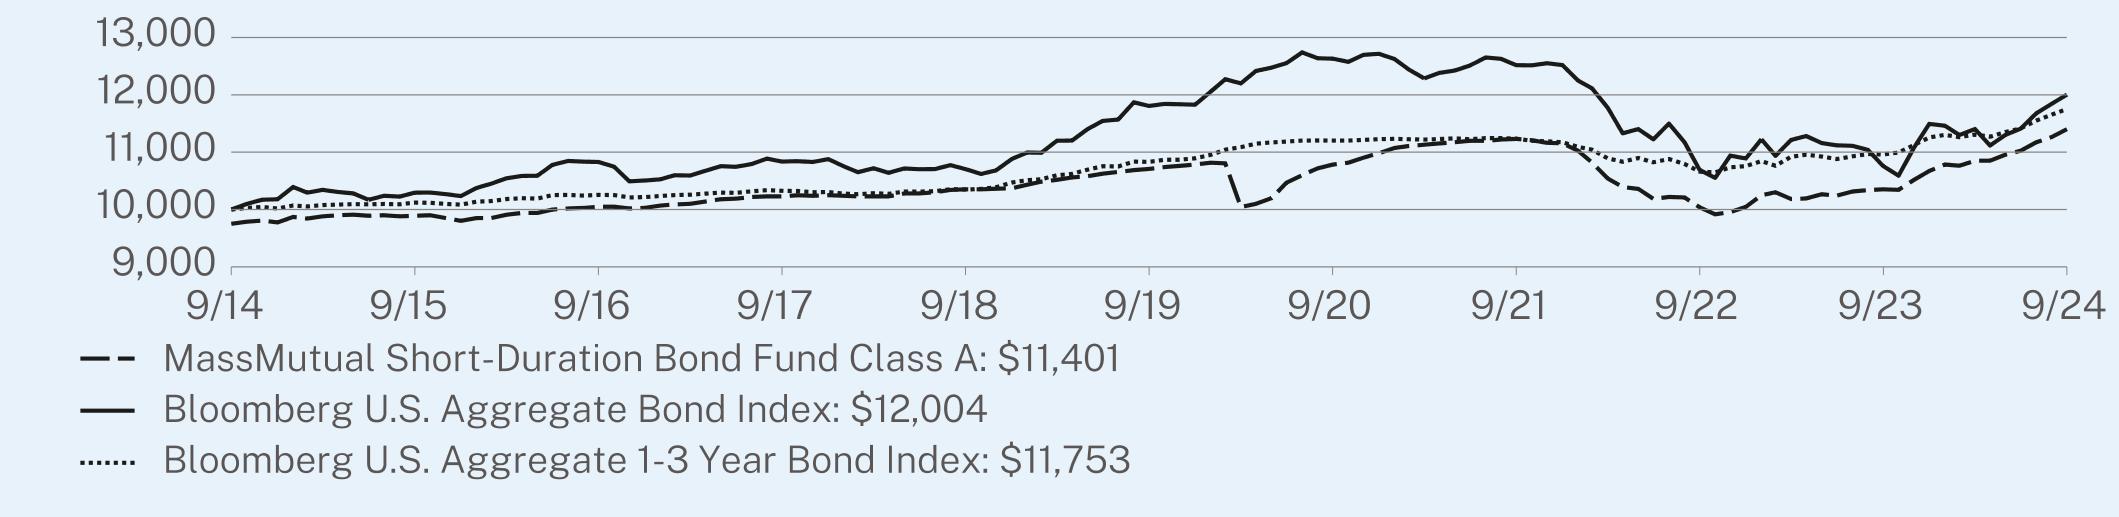
GROWTH OF A HYPOTHETICAL $10,000 INVESTMENT (October 1, 2014 through September 30, 2024)
This graph shows the performance of a hypothetical $10,000 investment in the share class noted over a ten-year period or since inception, if shorter, as compared to the performance of a broad-based securities market index, and, if applicable, one or more indexes that MML Investment Advisers, LLC believes more closely reflects the market segments in which the Fund invests or is a better comparison for the Fund’s investment strategy. This graph includes the deduction of the maximum applicable sales charge, if any.
| MM202912-309770 | PAGE 1 | TSR-AR-ITGS2 |
The index or indexes shown above are unmanaged, cannot be purchased directly, and, with the exception of any peer group index, do not incur expenses.
AVERAGE ANNUAL TOTAL RETURNS (%) (as of September 30, 2024)
| | | |
| | 1 Year | 5 Year | 10 Year |
Class A - without sales charge | 10.12 | 1.26 | 1.58 |
Class A - with maximum sales charge | 7.37 | 0.75 | 1.32 |
Bloomberg U.S. Aggregate Bond Index1 | 11.57 | 0.33 | 1.84 |
Bloomberg U.S. Aggregate 1-3 Year Bond Index | 7.23 | 1.65 | 1.63 |
| 1 | Effective July 24, 2024, the Bloomberg U.S. Aggregate Bond Index replaced the Bloomberg U.S. Aggregate 1-3 Year Bond Index as a broad measure of market performance in accordance with new regulatory disclosure requirements. The Fund continues to use the Bloomberg U.S. Aggregate 1-3 Year Bond Index as a supplemental benchmark that MML Investment Advisers, LLC believes more closely reflects the market segments in which the Fund invests. |
Performance results reflect any applicable waivers or expense limitations in effect during these periods, without which performance would have been lower. The investment return and principal value of shares of the Fund fluctuate, so your shares, when sold, may be worth more or less than their original cost. Current performance of the Fund may be lower or higher than the performance quoted. Performance data current to the most recent month-end may be obtained at https://www.massmutual.com/product-performance/mutual-funds or by calling 1-888-309-3539 or by sending an email request to fundinfo@massmutual.com.
WHAT ARE SOME KEY FUND STATISTICS? (as of September 30, 2024)
| |
Total Net Assets (Millions) | $157.1 |
Total Number of Portfolio Holdings (includes derivative positions, if any) | 202 |
Total Advisory Fees Paid During the Reporting Period | $617,178 |
Portfolio Turnover Rate | 34% |
WHAT DID THE FUND INVEST IN? (as of September 30, 2024)
Derivative values, if any, are excluded from the table(s) below.
| |
Portfolio Characteristics
(% of Total Investments) | |
Corporate Debt | 45.6% |
Non-U.S. Government Agency Obligations | 39.1% |
Commercial Paper | 12.7% |
Repurchase Agreement | 2.1% |
Investment of Cash Collateral from Securities Loaned | 0.5% |
U.S. Government Agency Obligations and Instrumentalities | 0.0% |
| MM202912-309770 | PAGE 2 | TSR-AR-ITGS2 |
HOW HAS THE FUND CHANGED?
The following is a summary of certain changes to the Fund since October 1, 2023. For more complete information, you may review the Fund’s prospectus, including any applicable supplements, at https://www.massmutual.com/product-performance/mutual-funds or upon request at 1-888-309-3539 or fundinfo@massmutual.com.
Effective February 1, 2024, the maximum front-end sales charge on Class L shares of the Fund increased from 2.00% to 2.50%; and the maximum contingent deferred sales charge on Class L and Class C shares of the Fund increased from 0.50% to 1.00%.
Effective February 1, 2024, the annual rate for administrative services for Class A shares of the Fund was reduced from 0.30% to 0.25%.
Prior to February 1, 2024, MML Investment Advisers, LLC had agreed to cap the fees and expenses of the Fund (other than extraordinary legal and other expenses, Acquired Fund Fees and Expenses, interest expense, expenses related to borrowings, securities lending, leverage, taxes, and brokerage, short sale dividend and loan expense, or other non-recurring or unusual expenses such as organizational expenses and shareholder meeting expenses, as applicable) through January 31, 2024, to the extent that Total Annual Fund Operating Expenses after Expense Reimbursement would otherwise exceed 0.40% for Classes I and Y, and 0.65% and 0.90% for Classes L and C, respectively.
On February 1, 2024, this agreement was replaced by a new agreement with MML Investment Advisers, LLC to cap the fees and expenses of the Fund (other than extraordinary legal and other expenses, Acquired Fund Fees and Expenses, interest expense, expenses related to borrowings, securities lending, leverage, taxes, and brokerage, short sale dividend and loan expense, or other non-recurring or unusual expenses such as organizational expenses and shareholder meeting expenses, as applicable) through January 31, 2025, to the extent that Total Annual Fund Operating Expenses after Expense Reimbursement would otherwise exceed 0.46%, 0.56%, 0.66%, 0.76%, 0.91%, 0.96%, 1.16%, 0.51%, 0.76%, and 1.01% for Classes I, R5, Service, Administrative, R4, A, R3, Y, L, and C, respectively.
Effective February 1, 2024, the Fund’s Principal Investment Strategies were updated to reflect that the Fund’s subadvisers intend for the Fund’s portfolio dollar-weighted average duration generally to match (within 10%) the average duration of the Bloomberg U.S. Aggregate 1-3 Year Bond Index.
| |
| WHERE CAN I FIND ADDITIONAL INFORMATION ABOUT THE FUND? |
For additional information about the Fund, including its prospectus, financial information, holdings, and proxy voting information, scan the QR code or visit https://www.massmutual.com/product-performance/mutual-funds. |
| MM202912-309770 | PAGE 3 | TSR-AR-ITGS2 |
9750989110048102291035210708107841123210039103531140110000102941082910836107051180712632125181069110760120041000010121102551032610348108311120311236106611096011753
| | |
MassMutual Short-Duration Bond Fund | |
| Class R3 | MSDNX |
| Annual Shareholder Report | September 30, 2024 |
This annual shareholder report contains important information about the MassMutual Short-Duration Bond Fund (the “Fund”) for the period of October 1, 2023 to September 30, 2024. You can find additional information about the Fund at https://www.massmutual.com/product-performance/mutual-funds. You can also request this information by contacting us at 1-888-309-3539 or by sending an email request to fundinfo@massmutual.com.
This report describes changes to the Fund that occurred during the reporting period.
WHAT WERE THE FUND COSTS FOR THE LAST YEAR?
This example shows the expenses you would have paid over the past year, based on a hypothetical $10,000 investment. This table reflects any applicable waivers or expense limitations.
| | |
Class Name | Costs of a $10,000 investment | Costs paid as a percentage of a $10,000 investment |
| Class R3 | $127 | 1.21% |
HOW DID THE FUND PERFORM?
Global bond markets were broadly, and strongly, positive for the trailing one-year period. During the period, central banks responded to lower inflation data and began to lower policy interest rates, which was favorable for bond prices and returns. Macroeconomic sentiment centered, particularly more recently, on a soft-landing scenario in the U.S., providing a supportive credit risk environment. During the period, narrowing credit spreads were a positive return driver in the global bond market, in addition to the response to lower bond market yields. This resulted in broad gains across varied market sectors, including government bonds, investment grade and high yield corporate securities, mortgage- and asset-backed instruments, and emerging market issues.
Top contributors to the Fund’s performance relative to the Bloomberg U.S. Aggregate 1-3 Year Bond Index:
• The corporate credit exposure, mainly investment grade, was favorable from issue selection
• The securitized asset exposure (MBS, ABS, and CMBS) were also positive contributors from selection and allocation effects
Top detractors to the Fund’s performance relative to the Bloomberg U.S. Aggregate 1-3 Year Bond Index:
• U.S. Treasury by virtue of the Fund being underweight and the sector gaining from lower interest rates
• Derivatives exposure mainly from U.S. Treasury futures to manage Fund duration
Performance shown is past performance and does not guarantee future results. The graph and table below do not reflect the deduction of taxes that a shareholder would pay on Fund distributions or redemption of Fund shares. The graph and table below assume reinvestment of dividends and capital gain distributions.
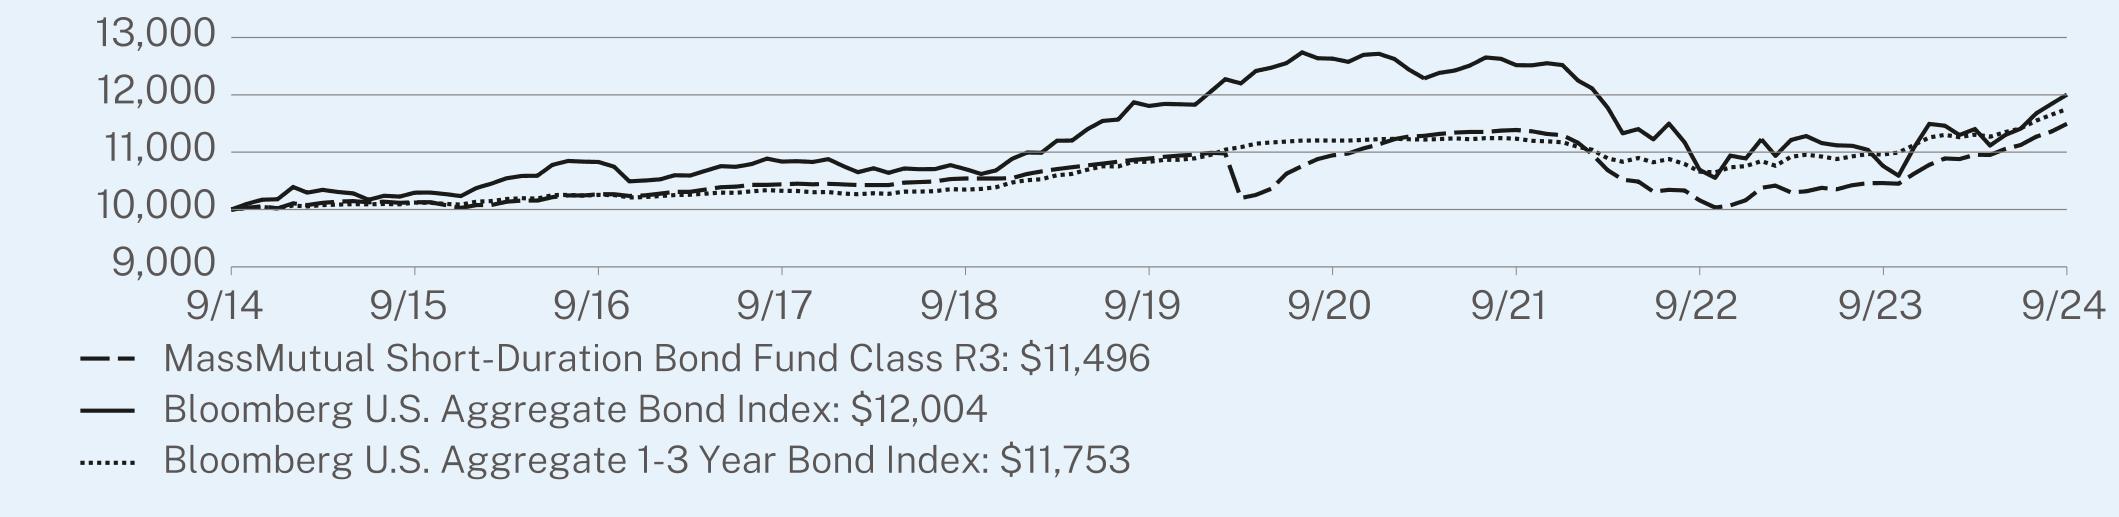
GROWTH OF A HYPOTHETICAL $10,000 INVESTMENT (October 1, 2014 through September 30, 2024)
This graph shows the performance of a hypothetical $10,000 investment in the share class noted over a ten-year period or since inception, if shorter, as compared to the performance of a broad-based securities market index, and, if applicable, one or more indexes that MML Investment Advisers, LLC believes more closely reflects the market segments in which the Fund invests or is a better comparison for the Fund’s investment strategy. This graph includes the deduction of the maximum applicable sales charge, if any.
| MM202912-309770 | PAGE 1 | TSR-AR-ITGS5 |
The index or indexes shown above are unmanaged, cannot be purchased directly, and, with the exception of any peer group index, do not incur expenses.
AVERAGE ANNUAL TOTAL RETURNS (%) (as of September 30, 2024)
| | | |
| | 1 Year | 5 Year | 10 Year |
Class R3 - without sales charge | 9.90 | 1.09 | 1.40 |
Bloomberg U.S. Aggregate Bond Index1 | 11.57 | 0.33 | 1.84 |
Bloomberg U.S. Aggregate 1-3 Year Bond Index | 7.23 | 1.65 | 1.63 |
| 1 | Effective July 24, 2024, the Bloomberg U.S. Aggregate Bond Index replaced the Bloomberg U.S. Aggregate 1-3 Year Bond Index as a broad measure of market performance in accordance with new regulatory disclosure requirements. The Fund continues to use the Bloomberg U.S. Aggregate 1-3 Year Bond Index as a supplemental benchmark that MML Investment Advisers, LLC believes more closely reflects the market segments in which the Fund invests. |
Performance results reflect any applicable waivers or expense limitations in effect during these periods, without which performance would have been lower. The investment return and principal value of shares of the Fund fluctuate, so your shares, when sold, may be worth more or less than their original cost. Current performance of the Fund may be lower or higher than the performance quoted. Performance data current to the most recent month-end may be obtained at https://www.massmutual.com/product-performance/mutual-funds or by calling 1-888-309-3539 or by sending an email request to fundinfo@massmutual.com.
WHAT ARE SOME KEY FUND STATISTICS? (as of September 30, 2024)
| |
Total Net Assets (Millions) | $157.1 |
Total Number of Portfolio Holdings (includes derivative positions, if any) | 202 |
Total Advisory Fees Paid During the Reporting Period | $617,178 |
Portfolio Turnover Rate | 34% |
WHAT DID THE FUND INVEST IN? (as of September 30, 2024)
Derivative values, if any, are excluded from the table(s) below.
| |
Portfolio Characteristics
(% of Total Investments) | |
Corporate Debt | 45.6% |
Non-U.S. Government Agency Obligations | 39.1% |
Commercial Paper | 12.7% |
Repurchase Agreement | 2.1% |
Investment of Cash Collateral from Securities Loaned | 0.5% |
U.S. Government Agency Obligations and Instrumentalities | 0.0% |
| MM202912-309770 | PAGE 2 | TSR-AR-ITGS5 |
HOW HAS THE FUND CHANGED?
The following is a summary of certain changes to the Fund since October 1, 2023. For more complete information, you may review the Fund’s prospectus, including any applicable supplements, at https://www.massmutual.com/product-performance/mutual-funds or upon request at 1-888-309-3539 or fundinfo@massmutual.com.
Effective February 1, 2024, the maximum front-end sales charge on Class L shares of the Fund increased from 2.00% to 2.50%; and the maximum contingent deferred sales charge on Class L and Class C shares of the Fund increased from 0.50% to 1.00%.
Effective February 1, 2024, the annual rate for administrative services for Class A shares of the Fund was reduced from 0.30% to 0.25%.
Prior to February 1, 2024, MML Investment Advisers, LLC had agreed to cap the fees and expenses of the Fund (other than extraordinary legal and other expenses, Acquired Fund Fees and Expenses, interest expense, expenses related to borrowings, securities lending, leverage, taxes, and brokerage, short sale dividend and loan expense, or other non-recurring or unusual expenses such as organizational expenses and shareholder meeting expenses, as applicable) through January 31, 2024, to the extent that Total Annual Fund Operating Expenses after Expense Reimbursement would otherwise exceed 0.40% for Classes I and Y, and 0.65% and 0.90% for Classes L and C, respectively.
On February 1, 2024, this agreement was replaced by a new agreement with MML Investment Advisers, LLC to cap the fees and expenses of the Fund (other than extraordinary legal and other expenses, Acquired Fund Fees and Expenses, interest expense, expenses related to borrowings, securities lending, leverage, taxes, and brokerage, short sale dividend and loan expense, or other non-recurring or unusual expenses such as organizational expenses and shareholder meeting expenses, as applicable) through January 31, 2025, to the extent that Total Annual Fund Operating Expenses after Expense Reimbursement would otherwise exceed 0.46%, 0.56%, 0.66%, 0.76%, 0.91%, 0.96%, 1.16%, 0.51%, 0.76%, and 1.01% for Classes I, R5, Service, Administrative, R4, A, R3, Y, L, and C, respectively.
Effective February 1, 2024, the Fund’s Principal Investment Strategies were updated to reflect that the Fund’s subadvisers intend for the Fund’s portfolio dollar-weighted average duration generally to match (within 10%) the average duration of the Bloomberg U.S. Aggregate 1-3 Year Bond Index.
| |
| WHERE CAN I FIND ADDITIONAL INFORMATION ABOUT THE FUND? |
For additional information about the Fund, including its prospectus, financial information, holdings, and proxy voting information, scan the QR code or visit https://www.massmutual.com/product-performance/mutual-funds. |
| MM202912-309770 | PAGE 3 | TSR-AR-ITGS5 |
100001012710266104401054110888109461138710159104611149610000102941082910836107051180712632125181069110760120041000010121102551032610348108311120311236106611096011753
| | |
MassMutual Short-Duration Bond Fund | |
| Class Y | BXDYX |
| Annual Shareholder Report | September 30, 2024 |
This annual shareholder report contains important information about the MassMutual Short-Duration Bond Fund (the “Fund”) for the period of October 1, 2023 to September 30, 2024. You can find additional information about the Fund at https://www.massmutual.com/product-performance/mutual-funds. You can also request this information by contacting us at 1-888-309-3539 or by sending an email request to fundinfo@massmutual.com.
This report describes changes to the Fund that occurred during the reporting period.
WHAT WERE THE FUND COSTS FOR THE LAST YEAR?
This example shows the expenses you would have paid over the past year, based on a hypothetical $10,000 investment. This table reflects any applicable waivers or expense limitations.
| | |
Class Name | Costs of a $10,000 investment | Costs paid as a percentage of a $10,000 investment |
| Class Y | $50 | 0.47% |
HOW DID THE FUND PERFORM?
Global bond markets were broadly, and strongly, positive for the trailing one-year period. During the period, central banks responded to lower inflation data and began to lower policy interest rates, which was favorable for bond prices and returns. Macroeconomic sentiment centered, particularly more recently, on a soft-landing scenario in the U.S., providing a supportive credit risk environment. During the period, narrowing credit spreads were a positive return driver in the global bond market, in addition to the response to lower bond market yields. This resulted in broad gains across varied market sectors, including government bonds, investment grade and high yield corporate securities, mortgage- and asset-backed instruments, and emerging market issues.
Top contributors to the Fund’s performance relative to the Bloomberg U.S. Aggregate 1-3 Year Bond Index:
• The corporate credit exposure, mainly investment grade, was favorable from issue selection
• The securitized asset exposure (MBS, ABS, and CMBS) were also positive contributors from selection and allocation effects
Top detractors to the Fund’s performance relative to the Bloomberg U.S. Aggregate 1-3 Year Bond Index:
• U.S. Treasury by virtue of the Fund being underweight and the sector gaining from lower interest rates
• Derivatives exposure mainly from U.S. Treasury futures to manage Fund duration
Performance shown is past performance and does not guarantee future results. The graph and table below do not reflect the deduction of taxes that a shareholder would pay on Fund distributions or redemption of Fund shares. The graph and table below assume reinvestment of dividends and capital gain distributions.
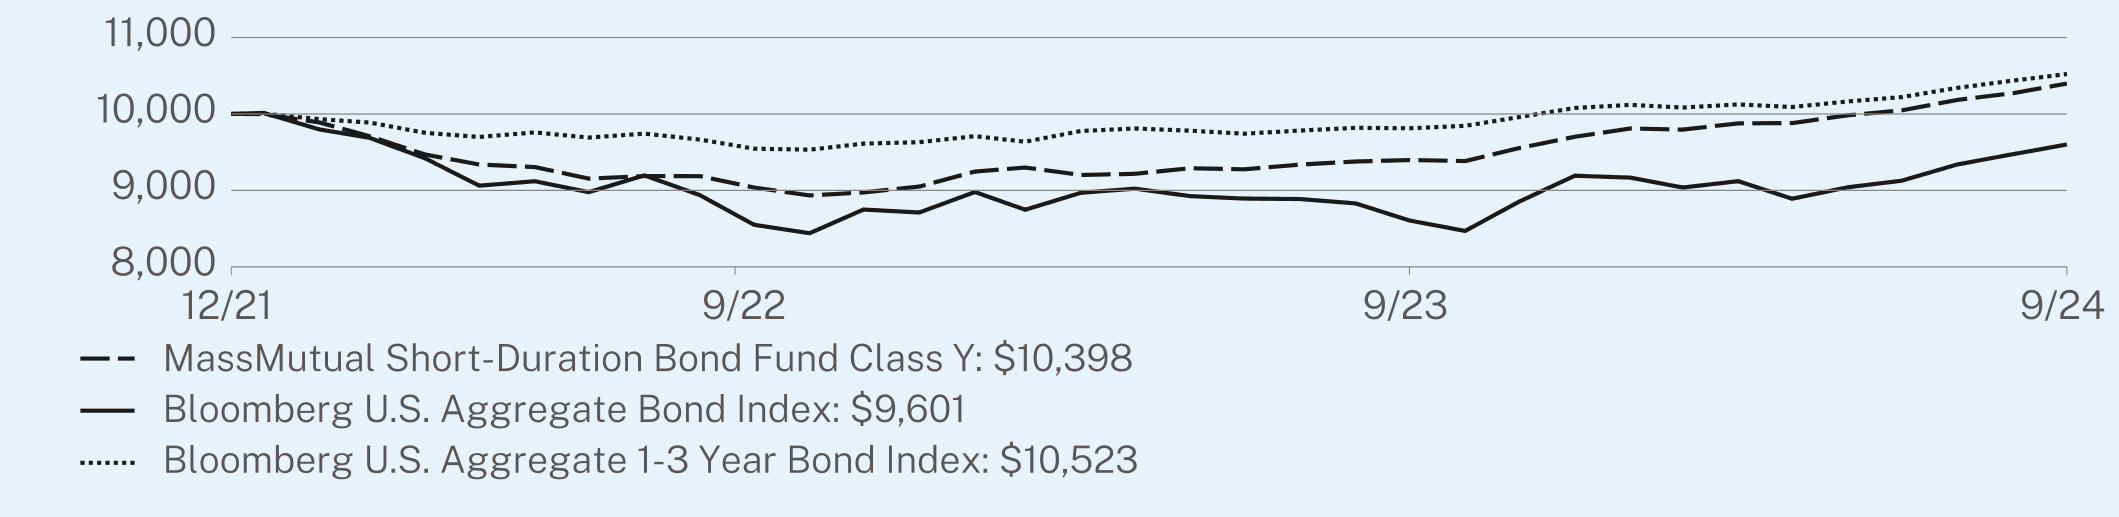
GROWTH OF A HYPOTHETICAL $10,000 INVESTMENT (December 13, 2021 through September 30, 2024)
This graph shows the performance of a hypothetical $10,000 investment in the share class noted over a ten-year period or since inception, if shorter, as compared to the performance of a broad-based securities market index, and, if applicable, one or more indexes that MML Investment Advisers, LLC believes more closely reflects the market segments in which the Fund invests or is a better comparison for the Fund’s investment strategy. This graph includes the deduction of the maximum applicable sales charge, if any.
| MM202912-309770 | PAGE 1 | TSR-AR-ITGS7 |
The index or indexes shown above are unmanaged, cannot be purchased directly, and, with the exception of any peer group index, do not incur expenses.
AVERAGE ANNUAL TOTAL RETURNS (%) (as of September 30, 2024)
| | |
| | 1 Year | Since Inception
(12/13/2021) |
Class Y - without sales charge | 10.65 | 1.40 |
Bloomberg U.S. Aggregate Bond Index1 | 11.57 | -1.44 |
Bloomberg U.S. Aggregate 1-3 Year Bond Index | 7.23 | 1.84 |
| 1 | Effective July 24, 2024, the Bloomberg U.S. Aggregate Bond Index replaced the Bloomberg U.S. Aggregate 1-3 Year Bond Index as a broad measure of market performance in accordance with new regulatory disclosure requirements. The Fund continues to use the Bloomberg U.S. Aggregate 1-3 Year Bond Index as a supplemental benchmark that MML Investment Advisers, LLC believes more closely reflects the market segments in which the Fund invests. |
Performance results reflect any applicable waivers or expense limitations in effect during these periods, without which performance would have been lower. The investment return and principal value of shares of the Fund fluctuate, so your shares, when sold, may be worth more or less than their original cost. Current performance of the Fund may be lower or higher than the performance quoted. Performance data current to the most recent month-end may be obtained at https://www.massmutual.com/product-performance/mutual-funds or by calling 1-888-309-3539 or by sending an email request to fundinfo@massmutual.com.
WHAT ARE SOME KEY FUND STATISTICS? (as of September 30, 2024)
| |
Total Net Assets (Millions) | $157.1 |
Total Number of Portfolio Holdings (includes derivative positions, if any) | 202 |
Total Advisory Fees Paid During the Reporting Period | $617,178 |
Portfolio Turnover Rate | 34% |
WHAT DID THE FUND INVEST IN? (as of September 30, 2024)
Derivative values, if any, are excluded from the table(s) below.
| |
Portfolio Characteristics
(% of Total Investments) | |
Corporate Debt | 45.6% |
Non-U.S. Government Agency Obligations | 39.1% |
Commercial Paper | 12.7% |
Repurchase Agreement | 2.1% |
Investment of Cash Collateral from Securities Loaned | 0.5% |
U.S. Government Agency Obligations and Instrumentalities | 0.0% |
| MM202912-309770 | PAGE 2 | TSR-AR-ITGS7 |
HOW HAS THE FUND CHANGED?
The following is a summary of certain changes to the Fund since October 1, 2023. For more complete information, you may review the Fund’s prospectus, including any applicable supplements, at https://www.massmutual.com/product-performance/mutual-funds or upon request at 1-888-309-3539 or fundinfo@massmutual.com.
Effective February 1, 2024, the maximum front-end sales charge on Class L shares of the Fund increased from 2.00% to 2.50%; and the maximum contingent deferred sales charge on Class L and Class C shares of the Fund increased from 0.50% to 1.00%.
Effective February 1, 2024, the annual rate for administrative services for Class A shares of the Fund was reduced from 0.30% to 0.25%.
Prior to February 1, 2024, MML Investment Advisers, LLC had agreed to cap the fees and expenses of the Fund (other than extraordinary legal and other expenses, Acquired Fund Fees and Expenses, interest expense, expenses related to borrowings, securities lending, leverage, taxes, and brokerage, short sale dividend and loan expense, or other non-recurring or unusual expenses such as organizational expenses and shareholder meeting expenses, as applicable) through January 31, 2024, to the extent that Total Annual Fund Operating Expenses after Expense Reimbursement would otherwise exceed 0.40% for Classes I and Y, and 0.65% and 0.90% for Classes L and C, respectively.
On February 1, 2024, this agreement was replaced by a new agreement with MML Investment Advisers, LLC to cap the fees and expenses of the Fund (other than extraordinary legal and other expenses, Acquired Fund Fees and Expenses, interest expense, expenses related to borrowings, securities lending, leverage, taxes, and brokerage, short sale dividend and loan expense, or other non-recurring or unusual expenses such as organizational expenses and shareholder meeting expenses, as applicable) through January 31, 2025, to the extent that Total Annual Fund Operating Expenses after Expense Reimbursement would otherwise exceed 0.46%, 0.56%, 0.66%, 0.76%, 0.91%, 0.96%, 1.16%, 0.51%, 0.76%, and 1.01% for Classes I, R5, Service, Administrative, R4, A, R3, Y, L, and C, respectively.
Effective February 1, 2024, the Fund’s Principal Investment Strategies were updated to reflect that the Fund’s subadvisers intend for the Fund’s portfolio dollar-weighted average duration generally to match (within 10%) the average duration of the Bloomberg U.S. Aggregate 1-3 Year Bond Index.
| |
| WHERE CAN I FIND ADDITIONAL INFORMATION ABOUT THE FUND? |
For additional information about the Fund, including its prospectus, financial information, holdings, and proxy voting information, scan the QR code or visit https://www.massmutual.com/product-performance/mutual-funds. |
| MM202912-309770 | PAGE 3 | TSR-AR-ITGS7 |
10000903893971039810000855186069601100009546981310523
| | |
MassMutual Short-Duration Bond Fund | |
| Class L | BXDLX |
| Annual Shareholder Report | September 30, 2024 |
This annual shareholder report contains important information about the MassMutual Short-Duration Bond Fund (the “Fund”) for the period of October 1, 2023 to September 30, 2024. You can find additional information about the Fund at https://www.massmutual.com/product-performance/mutual-funds. You can also request this information by contacting us at 1-888-309-3539 or by sending an email request to fundinfo@massmutual.com.
This report describes changes to the Fund that occurred during the reporting period.
WHAT WERE THE FUND COSTS FOR THE LAST YEAR?
This example shows the expenses you would have paid over the past year, based on a hypothetical $10,000 investment. This table reflects any applicable waivers or expense limitations.
| | |
Class Name | Costs of a $10,000 investment | Costs paid as a percentage of a $10,000 investment |
| Class L | $76 | 0.72% |
HOW DID THE FUND PERFORM?
Global bond markets were broadly, and strongly, positive for the trailing one-year period. During the period, central banks responded to lower inflation data and began to lower policy interest rates, which was favorable for bond prices and returns. Macroeconomic sentiment centered, particularly more recently, on a soft-landing scenario in the U.S., providing a supportive credit risk environment. During the period, narrowing credit spreads were a positive return driver in the global bond market, in addition to the response to lower bond market yields. This resulted in broad gains across varied market sectors, including government bonds, investment grade and high yield corporate securities, mortgage- and asset-backed instruments, and emerging market issues.
Top contributors to the Fund’s performance relative to the Bloomberg U.S. Aggregate 1-3 Year Bond Index:
• The corporate credit exposure, mainly investment grade, was favorable from issue selection
• The securitized asset exposure (MBS, ABS, and CMBS) were also positive contributors from selection and allocation effects
Top detractors to the Fund’s performance relative to the Bloomberg U.S. Aggregate 1-3 Year Bond Index:
• U.S. Treasury by virtue of the Fund being underweight and the sector gaining from lower interest rates
• Derivatives exposure mainly from U.S. Treasury futures to manage Fund duration
Performance shown is past performance and does not guarantee future results. The graph and table below do not reflect the deduction of taxes that a shareholder would pay on Fund distributions or redemption of Fund shares. The graph and table below assume reinvestment of dividends and capital gain distributions.
GROWTH OF A HYPOTHETICAL $10,000 INVESTMENT (December 13, 2021 through September 30, 2024)
This graph shows the performance of a hypothetical $10,000 investment in the share class noted over a ten-year period or since inception, if shorter, as compared to the performance of a broad-based securities market index, and, if applicable, one or more indexes that MML Investment Advisers, LLC believes more closely reflects the market segments in which the Fund invests or is a better comparison for the Fund’s investment strategy. This graph includes the deduction of the maximum applicable sales charge, if any.
| MM202912-309770 | PAGE 1 | TSR-AR-ITGS9 |
The index or indexes shown above are unmanaged, cannot be purchased directly, and, with the exception of any peer group index, do not incur expenses.
AVERAGE ANNUAL TOTAL RETURNS (%) (as of September 30, 2024)
| | |
| | 1 Year | Since Inception
(12/13/2021) |
Class L - without sales charge | 10.41 | 1.13 |
Class L - with maximum sales charge | 7.71 | 0.40 |
Bloomberg U.S. Aggregate Bond Index1 | 11.57 | -1.44 |
Bloomberg U.S. Aggregate 1-3 Year Bond Index | 7.23 | 1.84 |
| 1 | Effective July 24, 2024, the Bloomberg U.S. Aggregate Bond Index replaced the Bloomberg U.S. Aggregate 1-3 Year Bond Index as a broad measure of market performance in accordance with new regulatory disclosure requirements. The Fund continues to use the Bloomberg U.S. Aggregate 1-3 Year Bond Index as a supplemental benchmark that MML Investment Advisers, LLC believes more closely reflects the market segments in which the Fund invests. |
Performance results reflect any applicable waivers or expense limitations in effect during these periods, without which performance would have been lower. The investment return and principal value of shares of the Fund fluctuate, so your shares, when sold, may be worth more or less than their original cost. Current performance of the Fund may be lower or higher than the performance quoted. Performance data current to the most recent month-end may be obtained at https://www.massmutual.com/product-performance/mutual-funds or by calling 1-888-309-3539 or by sending an email request to fundinfo@massmutual.com.
WHAT ARE SOME KEY FUND STATISTICS? (as of September 30, 2024)
| |
Total Net Assets (Millions) | $157.1 |
Total Number of Portfolio Holdings (includes derivative positions, if any) | 202 |
Total Advisory Fees Paid During the Reporting Period | $617,178 |
Portfolio Turnover Rate | 34% |
WHAT DID THE FUND INVEST IN? (as of September 30, 2024)
Derivative values, if any, are excluded from the table(s) below.
| |
Portfolio Characteristics
(% of Total Investments) | |
Corporate Debt | 45.6% |
Non-U.S. Government Agency Obligations | 39.1% |
Commercial Paper | 12.7% |
Repurchase Agreement | 2.1% |
Investment of Cash Collateral from Securities Loaned | 0.5% |
U.S. Government Agency Obligations and Instrumentalities | 0.0% |
| MM202912-309770 | PAGE 2 | TSR-AR-ITGS9 |
HOW HAS THE FUND CHANGED?
The following is a summary of certain changes to the Fund since October 1, 2023. For more complete information, you may review the Fund’s prospectus, including any applicable supplements, at https://www.massmutual.com/product-performance/mutual-funds or upon request at 1-888-309-3539 or fundinfo@massmutual.com.
Effective February 1, 2024, the maximum front-end sales charge on Class L shares of the Fund increased from 2.00% to 2.50%; and the maximum contingent deferred sales charge on Class L and Class C shares of the Fund increased from 0.50% to 1.00%.
Effective February 1, 2024, the annual rate for administrative services for Class A shares of the Fund was reduced from 0.30% to 0.25%.
Prior to February 1, 2024, MML Investment Advisers, LLC had agreed to cap the fees and expenses of the Fund (other than extraordinary legal and other expenses, Acquired Fund Fees and Expenses, interest expense, expenses related to borrowings, securities lending, leverage, taxes, and brokerage, short sale dividend and loan expense, or other non-recurring or unusual expenses such as organizational expenses and shareholder meeting expenses, as applicable) through January 31, 2024, to the extent that Total Annual Fund Operating Expenses after Expense Reimbursement would otherwise exceed 0.40% for Classes I and Y, and 0.65% and 0.90% for Classes L and C, respectively.
On February 1, 2024, this agreement was replaced by a new agreement with MML Investment Advisers, LLC to cap the fees and expenses of the Fund (other than extraordinary legal and other expenses, Acquired Fund Fees and Expenses, interest expense, expenses related to borrowings, securities lending, leverage, taxes, and brokerage, short sale dividend and loan expense, or other non-recurring or unusual expenses such as organizational expenses and shareholder meeting expenses, as applicable) through January 31, 2025, to the extent that Total Annual Fund Operating Expenses after Expense Reimbursement would otherwise exceed 0.46%, 0.56%, 0.66%, 0.76%, 0.91%, 0.96%, 1.16%, 0.51%, 0.76%, and 1.01% for Classes I, R5, Service, Administrative, R4, A, R3, Y, L, and C, respectively.
Effective February 1, 2024, the Fund’s Principal Investment Strategies were updated to reflect that the Fund’s subadvisers intend for the Fund’s portfolio dollar-weighted average duration generally to match (within 10%) the average duration of the Bloomberg U.S. Aggregate 1-3 Year Bond Index.
| |
| WHERE CAN I FIND ADDITIONAL INFORMATION ABOUT THE FUND? |
For additional information about the Fund, including its prospectus, financial information, holdings, and proxy voting information, scan the QR code or visit https://www.massmutual.com/product-performance/mutual-funds. |
| MM202912-309770 | PAGE 3 | TSR-AR-ITGS9 |
9800883291591011210000855186069601100009546981310523
| | |
MassMutual Short-Duration Bond Fund | |
| Class C | BXDCX |
| Annual Shareholder Report | September 30, 2024 |
This annual shareholder report contains important information about the MassMutual Short-Duration Bond Fund (the “Fund”) for the period of October 1, 2023 to September 30, 2024. You can find additional information about the Fund at https://www.massmutual.com/product-performance/mutual-funds. You can also request this information by contacting us at 1-888-309-3539 or by sending an email request to fundinfo@massmutual.com.
This report describes changes to the Fund that occurred during the reporting period.
WHAT WERE THE FUND COSTS FOR THE LAST YEAR?
This example shows the expenses you would have paid over the past year, based on a hypothetical $10,000 investment. This table reflects any applicable waivers or expense limitations.
| | |
Class Name | Costs of a $10,000 investment | Costs paid as a percentage of a $10,000 investment |
| Class C | $102 | 0.97% |
HOW DID THE FUND PERFORM?
Global bond markets were broadly, and strongly, positive for the trailing one-year period. During the period, central banks responded to lower inflation data and began to lower policy interest rates, which was favorable for bond prices and returns. Macroeconomic sentiment centered, particularly more recently, on a soft-landing scenario in the U.S., providing a supportive credit risk environment. During the period, narrowing credit spreads were a positive return driver in the global bond market, in addition to the response to lower bond market yields. This resulted in broad gains across varied market sectors, including government bonds, investment grade and high yield corporate securities, mortgage- and asset-backed instruments, and emerging market issues.
Top contributors to the Fund’s performance relative to the Bloomberg U.S. Aggregate 1-3 Year Bond Index:
• The corporate credit exposure, mainly investment grade, was favorable from issue selection
• The securitized asset exposure (MBS, ABS, and CMBS) were also positive contributors from selection and allocation effects
Top detractors to the Fund’s performance relative to the Bloomberg U.S. Aggregate 1-3 Year Bond Index:
• U.S. Treasury by virtue of the Fund being underweight and the sector gaining from lower interest rates
• Derivatives exposure mainly from U.S. Treasury futures to manage Fund duration
Performance shown is past performance and does not guarantee future results. The graph and table below do not reflect the deduction of taxes that a shareholder would pay on Fund distributions or redemption of Fund shares. The graph and table below assume reinvestment of dividends and capital gain distributions.
GROWTH OF A HYPOTHETICAL $10,000 INVESTMENT (December 13, 2021 through September 30, 2024)
This graph shows the performance of a hypothetical $10,000 investment in the share class noted over a ten-year period or since inception, if shorter, as compared to the performance of a broad-based securities market index, and, if applicable, one or more indexes that MML Investment Advisers, LLC believes more closely reflects the market segments in which the Fund invests or is a better comparison for the Fund’s investment strategy. This graph includes the deduction of the maximum applicable sales charge, if any.
| MM202912-309770 | PAGE 1 | TSR-AR-ITGS8 |
The index or indexes shown above are unmanaged, cannot be purchased directly, and, with the exception of any peer group index, do not incur expenses.
AVERAGE ANNUAL TOTAL RETURNS (%) (as of September 30, 2024)
| | |
| | 1 Year | Since Inception
(12/13/2021) |
Class C - without sales charge | 10.20 | 0.89 |
Class C - with maximum sales charge | 9.70 | 0.89 |
Bloomberg U.S. Aggregate Bond Index1 | 11.57 | -1.44 |
Bloomberg U.S. Aggregate 1-3 Year Bond Index | 7.23 | 1.84 |
| 1 | Effective July 24, 2024, the Bloomberg U.S. Aggregate Bond Index replaced the Bloomberg U.S. Aggregate 1-3 Year Bond Index as a broad measure of market performance in accordance with new regulatory disclosure requirements. The Fund continues to use the Bloomberg U.S. Aggregate 1-3 Year Bond Index as a supplemental benchmark that MML Investment Advisers, LLC believes more closely reflects the market segments in which the Fund invests. |
Performance results reflect any applicable waivers or expense limitations in effect during these periods, without which performance would have been lower. The investment return and principal value of shares of the Fund fluctuate, so your shares, when sold, may be worth more or less than their original cost. Current performance of the Fund may be lower or higher than the performance quoted. Performance data current to the most recent month-end may be obtained at https://www.massmutual.com/product-performance/mutual-funds or by calling 1-888-309-3539 or by sending an email request to fundinfo@massmutual.com.
WHAT ARE SOME KEY FUND STATISTICS? (as of September 30, 2024)
| |
Total Net Assets (Millions) | $157.1 |
Total Number of Portfolio Holdings (includes derivative positions, if any) | 202 |
Total Advisory Fees Paid During the Reporting Period | $617,178 |
Portfolio Turnover Rate | 34% |
WHAT DID THE FUND INVEST IN? (as of September 30, 2024)
Derivative values, if any, are excluded from the table(s) below.
| |
Portfolio Characteristics
(% of Total Investments) | |
Corporate Debt | 45.6% |
Non-U.S. Government Agency Obligations | 39.1% |
Commercial Paper | 12.7% |
Repurchase Agreement | 2.1% |
Investment of Cash Collateral from Securities Loaned | 0.5% |
U.S. Government Agency Obligations and Instrumentalities | 0.0% |
| MM202912-309770 | PAGE 2 | TSR-AR-ITGS8 |
HOW HAS THE FUND CHANGED?
The following is a summary of certain changes to the Fund since October 1, 2023. For more complete information, you may review the Fund’s prospectus, including any applicable supplements, at https://www.massmutual.com/product-performance/mutual-funds or upon request at 1-888-309-3539 or fundinfo@massmutual.com.
Effective February 1, 2024, the maximum front-end sales charge on Class L shares of the Fund increased from 2.00% to 2.50%; and the maximum contingent deferred sales charge on Class L and Class C shares of the Fund increased from 0.50% to 1.00%.
Effective February 1, 2024, the annual rate for administrative services for Class A shares of the Fund was reduced from 0.30% to 0.25%.
Prior to February 1, 2024, MML Investment Advisers, LLC had agreed to cap the fees and expenses of the Fund (other than extraordinary legal and other expenses, Acquired Fund Fees and Expenses, interest expense, expenses related to borrowings, securities lending, leverage, taxes, and brokerage, short sale dividend and loan expense, or other non-recurring or unusual expenses such as organizational expenses and shareholder meeting expenses, as applicable) through January 31, 2024, to the extent that Total Annual Fund Operating Expenses after Expense Reimbursement would otherwise exceed 0.40% for Classes I and Y, and 0.65% and 0.90% for Classes L and C, respectively.
On February 1, 2024, this agreement was replaced by a new agreement with MML Investment Advisers, LLC to cap the fees and expenses of the Fund (other than extraordinary legal and other expenses, Acquired Fund Fees and Expenses, interest expense, expenses related to borrowings, securities lending, leverage, taxes, and brokerage, short sale dividend and loan expense, or other non-recurring or unusual expenses such as organizational expenses and shareholder meeting expenses, as applicable) through January 31, 2025, to the extent that Total Annual Fund Operating Expenses after Expense Reimbursement would otherwise exceed 0.46%, 0.56%, 0.66%, 0.76%, 0.91%, 0.96%, 1.16%, 0.51%, 0.76%, and 1.01% for Classes I, R5, Service, Administrative, R4, A, R3, Y, L, and C, respectively.
Effective February 1, 2024, the Fund’s Principal Investment Strategies were updated to reflect that the Fund’s subadvisers intend for the Fund’s portfolio dollar-weighted average duration generally to match (within 10%) the average duration of the Bloomberg U.S. Aggregate 1-3 Year Bond Index.
| |
| WHERE CAN I FIND ADDITIONAL INFORMATION ABOUT THE FUND? |
For additional information about the Fund, including its prospectus, financial information, holdings, and proxy voting information, scan the QR code or visit https://www.massmutual.com/product-performance/mutual-funds. |
| MM202912-309770 | PAGE 3 | TSR-AR-ITGS8 |
10000899493041025210000855186069601100009546981310523
| | |
MassMutual Inflation-Protected and Income Fund | |
| Class I | MIPZX |
| Annual Shareholder Report | September 30, 2024 |
This annual shareholder report contains important information about the MassMutual Inflation-Protected and Income Fund (the “Fund”) for the period of October 1, 2023 to September 30, 2024. You can find additional information about the Fund at https://www.massmutual.com/product-performance/mutual-funds. You can also request this information by contacting us at 1-888-309-3539 or by sending an email request to fundinfo@massmutual.com.
This report describes changes to the Fund that occurred during the reporting period.
WHAT WERE THE FUND COSTS FOR THE LAST YEAR?
This example shows the expenses you would have paid over the past year, based on a hypothetical $10,000 investment. This table reflects any applicable waivers or expense limitations.
| | |
Class Name | Costs of a $10,000 investment | Costs paid as a percentage of a $10,000 investment |
| Class I | $54 | 0.51% |
HOW DID THE FUND PERFORM?
Global bond markets were broadly, and strongly, positive for the trailing one-year period. During the period, central banks responded to lower inflation data and began to lower policy interest rates, which was favorable for bond prices and returns. Macroeconomic sentiment centered, particularly more recently, on a soft-landing scenario in the U.S., providing a supportive credit risk environment. During the period, narrowing credit spreads were a positive return driver in the global bond market, in addition to the response to lower bond market yields. This resulted in broad gains across varied market sectors, including government bonds, investment grade and high yield corporate securities, mortgage- and asset-backed instruments, and emerging market issues.
Top contributors to the Fund’s performance relative to the Bloomberg U.S. Treasury Inflation Protected Securities (TIPS) Index (Series-L):
• Fund income component of short-term nominal securities
• Long maturity TIPS exposure, given outperformance of shorter-term TIPS
• The Fund’s use of derivatives, which are utilized to gain income and inflation exposures, contributed to performance for the period
Top detractors to the Fund’s performance relative to the Bloomberg U.S. Treasury Inflation Protected Securities (TIPS) Index (Series-L):
• U.S. Treasury futures exposures used to manage Fund duration
• Shorter maturity TIPS exposure as longer maturity outperformed
• Cash equivalent holdings for liquidity, contrasted with high TIPS return
Performance shown is past performance and does not guarantee future results. The graph and table below do not reflect the deduction of taxes that a shareholder would pay on Fund distributions or redemption of Fund shares. The graph and table below assume reinvestment of dividends and capital gain distributions.
GROWTH OF A HYPOTHETICAL $10,000 INVESTMENT (October 1, 2014 through September 30, 2024)
This graph shows the performance of a hypothetical $10,000 investment in the share class noted over a ten-year period or since inception, if shorter, as compared to the performance of a broad-based securities market index, and, if applicable, one or more indexes that MML Investment Advisers, LLC believes more closely reflects the market segments in which the Fund invests or is a better comparison for the Fund’s investment strategy. This graph includes the deduction of the maximum applicable sales charge, if any.
| MM202912-309770 | PAGE 1 | TSR-AR-ITGU6 |
The index or indexes shown above are unmanaged, cannot be purchased directly, and, with the exception of any peer group index, do not incur expenses.
AVERAGE ANNUAL TOTAL RETURNS (%) (as of September 30, 2024)
| | | |
| | 1 Year | 5 Year | 10 Year |
Class I - without sales charge | 10.91 | 2.90 | 2.75 |
Bloomberg U.S. Aggregate Bond Index1 | 11.57 | 0.33 | 1.84 |
Bloomberg U.S. Treasury Inflation Protected Securities (TIPS) Index (Series-L) | 9.79 | 2.62 | 2.54 |
| 1 | Effective July 24, 2024, the Bloomberg U.S. Aggregate Bond Index replaced the Bloomberg U.S. Treasury Inflation Protected Securities (TIPS) Index (Series-L) as a broad measure of market performance in accordance with new regulatory disclosure requirements. The Fund continues to use the Bloomberg U.S. Treasury Inflation Protected Securities (TIPS) Index (Series-L) as a supplemental benchmark that MML Investment Advisers, LLC believes more closely reflects the market segments in which the Fund invests. |
Performance results reflect any applicable waivers or expense limitations in effect during these periods, without which performance would have been lower. The investment return and principal value of shares of the Fund fluctuate, so your shares, when sold, may be worth more or less than their original cost. Current performance of the Fund may be lower or higher than the performance quoted. Performance data current to the most recent month-end may be obtained at https://www.massmutual.com/product-performance/mutual-funds or by calling 1-888-309-3539 or by sending an email request to fundinfo@massmutual.com.
WHAT ARE SOME KEY FUND STATISTICS? (as of September 30, 2024)
| |
Total Net Assets (Millions) | $244.1 |
Total Number of Portfolio Holdings (includes derivative positions, if any) | 174 |
Total Advisory Fees Paid During the Reporting Period | $946,753 |
Portfolio Turnover Rate | 78% |
WHAT DID THE FUND INVEST IN? (as of September 30, 2024)
Derivative values, if any, are excluded from the table(s) below.
| |
Portfolio Characteristics
(% of Total Investments) | |
Non-U.S. Government Agency Obligations | 57.8% |
U.S. Treasury Obligations | 20.0% |
Commercial Paper | 15.2% |
U.S. Government Agency Obligations and Instrumentalities | 6.8% |
Repurchase Agreement | 0.2% |
| MM202912-309770 | PAGE 2 | TSR-AR-ITGU6 |
HOW HAS THE FUND CHANGED?
The following is a summary of certain changes to the Fund since October 1, 2023. For more complete information, you may review the Fund’s prospectus, including any applicable supplements, at https://www.massmutual.com/product-performance/mutual-funds or upon request at 1-888-309-3539 or fundinfo@massmutual.com.
Effective February 1, 2024, the annual rate for administrative services for Class A shares of the Fund was reduced from 0.30% to 0.25%.
Effective July 1, 2024, MML Investment Advisers, LLC has agreed to cap the fees and expenses of the Fund (other than extraordinary legal and other expenses, Acquired Fund Fees and Expenses, interest expense, expenses related to borrowings, securities lending, leverage, taxes, and brokerage, short sale dividend and loan expense, or other non-recurring or unusual expenses such as organizational expenses and shareholder meeting expenses, as applicable) through January 31, 2026, to the extent that Total Annual Fund Operating Expenses after Expense Reimbursement would otherwise exceed 0.49%, 0.59%, 0.69%, 0.79%, 0.94%, 0.99%, 1.19%, and 0.59% for Classes I, R5, Service, Administrative, R4, A, R3, and Y, respectively.
| |
| WHERE CAN I FIND ADDITIONAL INFORMATION ABOUT THE FUND? |
For additional information about the Fund, including its prospectus, financial information, holdings, and proxy voting information, scan the QR code or visit https://www.massmutual.com/product-performance/mutual-funds. |
| MM202912-309770 | PAGE 3 | TSR-AR-ITGU6 |
1000098881060610563106401136312491132551162811823131131000010294108291083610705118071263212518106911076012004100009917105701049310536112861242413069115571170112847
| | |
MassMutual Inflation-Protected and Income Fund | |
| Class R5 | MIPSX |
| Annual Shareholder Report | September 30, 2024 |
This annual shareholder report contains important information about the MassMutual Inflation-Protected and Income Fund (the “Fund”) for the period of October 1, 2023 to September 30, 2024. You can find additional information about the Fund at https://www.massmutual.com/product-performance/mutual-funds. You can also request this information by contacting us at 1-888-309-3539 or by sending an email request to fundinfo@massmutual.com.
This report describes changes to the Fund that occurred during the reporting period.
WHAT WERE THE FUND COSTS FOR THE LAST YEAR?
This example shows the expenses you would have paid over the past year, based on a hypothetical $10,000 investment. This table reflects any applicable waivers or expense limitations.
| | |
Class Name | Costs of a $10,000 investment | Costs paid as a percentage of a $10,000 investment |
| Class R5 | $64 | 0.61% |
HOW DID THE FUND PERFORM?
Global bond markets were broadly, and strongly, positive for the trailing one-year period. During the period, central banks responded to lower inflation data and began to lower policy interest rates, which was favorable for bond prices and returns. Macroeconomic sentiment centered, particularly more recently, on a soft-landing scenario in the U.S., providing a supportive credit risk environment. During the period, narrowing credit spreads were a positive return driver in the global bond market, in addition to the response to lower bond market yields. This resulted in broad gains across varied market sectors, including government bonds, investment grade and high yield corporate securities, mortgage- and asset-backed instruments, and emerging market issues.
Top contributors to the Fund’s performance relative to the Bloomberg U.S. Treasury Inflation Protected Securities (TIPS) Index (Series-L):
• Fund income component of short-term nominal securities
• Long maturity TIPS exposure, given outperformance of shorter-term TIPS
• The Fund’s use of derivatives, which are utilized to gain income and inflation exposures, contributed to performance for the period
Top detractors to the Fund’s performance relative to the Bloomberg U.S. Treasury Inflation Protected Securities (TIPS) Index (Series-L):
• U.S. Treasury futures exposures used to manage Fund duration
• Shorter maturity TIPS exposure as longer maturity outperformed
• Cash equivalent holdings for liquidity, contrasted with high TIPS return
Performance shown is past performance and does not guarantee future results. The graph and table below do not reflect the deduction of taxes that a shareholder would pay on Fund distributions or redemption of Fund shares. The graph and table below assume reinvestment of dividends and capital gain distributions.
GROWTH OF A HYPOTHETICAL $10,000 INVESTMENT (October 1, 2014 through September 30, 2024)
This graph shows the performance of a hypothetical $10,000 investment in the share class noted over a ten-year period or since inception, if shorter, as compared to the performance of a broad-based securities market index, and, if applicable, one or more indexes that MML Investment Advisers, LLC believes more closely reflects the market segments in which the Fund invests or is a better comparison for the Fund’s investment strategy. This graph includes the deduction of the maximum applicable sales charge, if any.
| MM202912-309770 | PAGE 1 | TSR-AR-ITGU1 |
The index or indexes shown above are unmanaged, cannot be purchased directly, and, with the exception of any peer group index, do not incur expenses.
AVERAGE ANNUAL TOTAL RETURNS (%) (as of September 30, 2024)
| | | |
| | 1 Year | 5 Year | 10 Year |
Class R5 - without sales charge | 10.89 | 2.82 | 2.65 |
Bloomberg U.S. Aggregate Bond Index1 | 11.57 | 0.33 | 1.84 |
Bloomberg U.S. Treasury Inflation Protected Securities (TIPS) Index (Series-L) | 9.79 | 2.62 | 2.54 |
| 1 | Effective July 24, 2024, the Bloomberg U.S. Aggregate Bond Index replaced the Bloomberg U.S. Treasury Inflation Protected Securities (TIPS) Index (Series-L) as a broad measure of market performance in accordance with new regulatory disclosure requirements. The Fund continues to use the Bloomberg U.S. Treasury Inflation Protected Securities (TIPS) Index (Series-L) as a supplemental benchmark that MML Investment Advisers, LLC believes more closely reflects the market segments in which the Fund invests. |
Performance results reflect any applicable waivers or expense limitations in effect during these periods, without which performance would have been lower. The investment return and principal value of shares of the Fund fluctuate, so your shares, when sold, may be worth more or less than their original cost. Current performance of the Fund may be lower or higher than the performance quoted. Performance data current to the most recent month-end may be obtained at https://www.massmutual.com/product-performance/mutual-funds or by calling 1-888-309-3539 or by sending an email request to fundinfo@massmutual.com.
WHAT ARE SOME KEY FUND STATISTICS? (as of September 30, 2024)
| |
Total Net Assets (Millions) | $244.1 |
Total Number of Portfolio Holdings (includes derivative positions, if any) | 174 |
Total Advisory Fees Paid During the Reporting Period | $946,753 |
Portfolio Turnover Rate | 78% |
WHAT DID THE FUND INVEST IN? (as of September 30, 2024)
Derivative values, if any, are excluded from the table(s) below.
| |
Portfolio Characteristics
(% of Total Investments) | |
Non-U.S. Government Agency Obligations | 57.8% |
U.S. Treasury Obligations | 20.0% |
Commercial Paper | 15.2% |
U.S. Government Agency Obligations and Instrumentalities | 6.8% |
Repurchase Agreement | 0.2% |
| MM202912-309770 | PAGE 2 | TSR-AR-ITGU1 |
HOW HAS THE FUND CHANGED?
The following is a summary of certain changes to the Fund since October 1, 2023. For more complete information, you may review the Fund’s prospectus, including any applicable supplements, at https://www.massmutual.com/product-performance/mutual-funds or upon request at 1-888-309-3539 or fundinfo@massmutual.com.
Effective February 1, 2024, the annual rate for administrative services for Class A shares of the Fund was reduced from 0.30% to 0.25%.
Effective July 1, 2024, MML Investment Advisers, LLC has agreed to cap the fees and expenses of the Fund (other than extraordinary legal and other expenses, Acquired Fund Fees and Expenses, interest expense, expenses related to borrowings, securities lending, leverage, taxes, and brokerage, short sale dividend and loan expense, or other non-recurring or unusual expenses such as organizational expenses and shareholder meeting expenses, as applicable) through January 31, 2026, to the extent that Total Annual Fund Operating Expenses after Expense Reimbursement would otherwise exceed 0.49%, 0.59%, 0.69%, 0.79%, 0.94%, 0.99%, 1.19%, and 0.59% for Classes I, R5, Service, Administrative, R4, A, R3, and Y, respectively.
| |
| WHERE CAN I FIND ADDITIONAL INFORMATION ABOUT THE FUND? |
For additional information about the Fund, including its prospectus, financial information, holdings, and proxy voting information, scan the QR code or visit https://www.massmutual.com/product-performance/mutual-funds. |
| MM202912-309770 | PAGE 3 | TSR-AR-ITGU1 |
1000098781058410530105961130412425131731153411713129891000010294108291083610705118071263212518106911076012004100009917105701049310536112861242413069115571170112847
| | |
MassMutual Inflation-Protected and Income Fund | |
| Service Class | MIPYX |
| Annual Shareholder Report | September 30, 2024 |
This annual shareholder report contains important information about the MassMutual Inflation-Protected and Income Fund (the “Fund”) for the period of October 1, 2023 to September 30, 2024. You can find additional information about the Fund at https://www.massmutual.com/product-performance/mutual-funds. You can also request this information by contacting us at 1-888-309-3539 or by sending an email request to fundinfo@massmutual.com.
This report describes changes to the Fund that occurred during the reporting period.
WHAT WERE THE FUND COSTS FOR THE LAST YEAR?
This example shows the expenses you would have paid over the past year, based on a hypothetical $10,000 investment. This table reflects any applicable waivers or expense limitations.
| | |
Class Name | Costs of a $10,000 investment | Costs paid as a percentage of a $10,000 investment |
| Service Class | $75 | 0.71% |
HOW DID THE FUND PERFORM?
Global bond markets were broadly, and strongly, positive for the trailing one-year period. During the period, central banks responded to lower inflation data and began to lower policy interest rates, which was favorable for bond prices and returns. Macroeconomic sentiment centered, particularly more recently, on a soft-landing scenario in the U.S., providing a supportive credit risk environment. During the period, narrowing credit spreads were a positive return driver in the global bond market, in addition to the response to lower bond market yields. This resulted in broad gains across varied market sectors, including government bonds, investment grade and high yield corporate securities, mortgage- and asset-backed instruments, and emerging market issues.
Top contributors to the Fund’s performance relative to the Bloomberg U.S. Treasury Inflation Protected Securities (TIPS) Index (Series-L):
• Fund income component of short-term nominal securities
• Long maturity TIPS exposure, given outperformance of shorter-term TIPS
• The Fund’s use of derivatives, which are utilized to gain income and inflation exposures, contributed to performance for the period
Top detractors to the Fund’s performance relative to the Bloomberg U.S. Treasury Inflation Protected Securities (TIPS) Index (Series-L):
• U.S. Treasury futures exposures used to manage Fund duration
• Shorter maturity TIPS exposure as longer maturity outperformed
• Cash equivalent holdings for liquidity, contrasted with high TIPS return
Performance shown is past performance and does not guarantee future results. The graph and table below do not reflect the deduction of taxes that a shareholder would pay on Fund distributions or redemption of Fund shares. The graph and table below assume reinvestment of dividends and capital gain distributions.
GROWTH OF A HYPOTHETICAL $10,000 INVESTMENT (October 1, 2014 through September 30, 2024)
This graph shows the performance of a hypothetical $10,000 investment in the share class noted over a ten-year period or since inception, if shorter, as compared to the performance of a broad-based securities market index, and, if applicable, one or more indexes that MML Investment Advisers, LLC believes more closely reflects the market segments in which the Fund invests or is a better comparison for the Fund’s investment strategy. This graph includes the deduction of the maximum applicable sales charge, if any.
| MM202912-309770 | PAGE 1 | TSR-AR-ITGU3 |
The index or indexes shown above are unmanaged, cannot be purchased directly, and, with the exception of any peer group index, do not incur expenses.
AVERAGE ANNUAL TOTAL RETURNS (%) (as of September 30, 2024)
| | | |
| | 1 Year | 5 Year | 10 Year |
Service Class - without sales charge | 10.74 | 2.72 | 2.55 |
Bloomberg U.S. Aggregate Bond Index1 | 11.57 | 0.33 | 1.84 |
Bloomberg U.S. Treasury Inflation Protected Securities (TIPS) Index (Series-L) | 9.79 | 2.62 | 2.54 |
| 1 | Effective July 24, 2024, the Bloomberg U.S. Aggregate Bond Index replaced the Bloomberg U.S. Treasury Inflation Protected Securities (TIPS) Index (Series-L) as a broad measure of market performance in accordance with new regulatory disclosure requirements. The Fund continues to use the Bloomberg U.S. Treasury Inflation Protected Securities (TIPS) Index (Series-L) as a supplemental benchmark that MML Investment Advisers, LLC believes more closely reflects the market segments in which the Fund invests. |
Performance results reflect any applicable waivers or expense limitations in effect during these periods, without which performance would have been lower. The investment return and principal value of shares of the Fund fluctuate, so your shares, when sold, may be worth more or less than their original cost. Current performance of the Fund may be lower or higher than the performance quoted. Performance data current to the most recent month-end may be obtained at https://www.massmutual.com/product-performance/mutual-funds or by calling 1-888-309-3539 or by sending an email request to fundinfo@massmutual.com.
WHAT ARE SOME KEY FUND STATISTICS? (as of September 30, 2024)
| |
Total Net Assets (Millions) | $244.1 |
Total Number of Portfolio Holdings (includes derivative positions, if any) | 174 |
Total Advisory Fees Paid During the Reporting Period | $946,753 |
Portfolio Turnover Rate | 78% |
WHAT DID THE FUND INVEST IN? (as of September 30, 2024)
Derivative values, if any, are excluded from the table(s) below.
| |
Portfolio Characteristics
(% of Total Investments) | |
Non-U.S. Government Agency Obligations | 57.8% |
U.S. Treasury Obligations | 20.0% |
Commercial Paper | 15.2% |
U.S. Government Agency Obligations and Instrumentalities | 6.8% |
Repurchase Agreement | 0.2% |
| MM202912-309770 | PAGE 2 | TSR-AR-ITGU3 |
HOW HAS THE FUND CHANGED?
The following is a summary of certain changes to the Fund since October 1, 2023. For more complete information, you may review the Fund’s prospectus, including any applicable supplements, at https://www.massmutual.com/product-performance/mutual-funds or upon request at 1-888-309-3539 or fundinfo@massmutual.com.
Effective February 1, 2024, the annual rate for administrative services for Class A shares of the Fund was reduced from 0.30% to 0.25%.
Effective July 1, 2024, MML Investment Advisers, LLC has agreed to cap the fees and expenses of the Fund (other than extraordinary legal and other expenses, Acquired Fund Fees and Expenses, interest expense, expenses related to borrowings, securities lending, leverage, taxes, and brokerage, short sale dividend and loan expense, or other non-recurring or unusual expenses such as organizational expenses and shareholder meeting expenses, as applicable) through January 31, 2026, to the extent that Total Annual Fund Operating Expenses after Expense Reimbursement would otherwise exceed 0.49%, 0.59%, 0.69%, 0.79%, 0.94%, 0.99%, 1.19%, and 0.59% for Classes I, R5, Service, Administrative, R4, A, R3, and Y, respectively.
| |
| WHERE CAN I FIND ADDITIONAL INFORMATION ABOUT THE FUND? |
For additional information about the Fund, including its prospectus, financial information, holdings, and proxy voting information, scan the QR code or visit https://www.massmutual.com/product-performance/mutual-funds. |
| MM202912-309770 | PAGE 3 | TSR-AR-ITGU3 |
1000098771056510498105511124812353130741143811615128621000010294108291083610705118071263212518106911076012004100009917105701049310536112861242413069115571170112847
| | |
MassMutual Inflation-Protected and Income Fund | |
| Administrative Class | MIPLX |
| Annual Shareholder Report | September 30, 2024 |
This annual shareholder report contains important information about the MassMutual Inflation-Protected and Income Fund (the “Fund”) for the period of October 1, 2023 to September 30, 2024. You can find additional information about the Fund at https://www.massmutual.com/product-performance/mutual-funds. You can also request this information by contacting us at 1-888-309-3539 or by sending an email request to fundinfo@massmutual.com.
This report describes changes to the Fund that occurred during the reporting period.
WHAT WERE THE FUND COSTS FOR THE LAST YEAR?
This example shows the expenses you would have paid over the past year, based on a hypothetical $10,000 investment. This table reflects any applicable waivers or expense limitations.
| | |
Class Name | Costs of a $10,000 investment | Costs paid as a percentage of a $10,000 investment |
| Administrative Class | $85 | 0.81% |
HOW DID THE FUND PERFORM?
Global bond markets were broadly, and strongly, positive for the trailing one-year period. During the period, central banks responded to lower inflation data and began to lower policy interest rates, which was favorable for bond prices and returns. Macroeconomic sentiment centered, particularly more recently, on a soft-landing scenario in the U.S., providing a supportive credit risk environment. During the period, narrowing credit spreads were a positive return driver in the global bond market, in addition to the response to lower bond market yields. This resulted in broad gains across varied market sectors, including government bonds, investment grade and high yield corporate securities, mortgage- and asset-backed instruments, and emerging market issues.
Top contributors to the Fund’s performance relative to the Bloomberg U.S. Treasury Inflation Protected Securities (TIPS) Index (Series-L):
• Fund income component of short-term nominal securities
• Long maturity TIPS exposure, given outperformance of shorter-term TIPS
• The Fund’s use of derivatives, which are utilized to gain income and inflation exposures, contributed to performance for the period
Top detractors to the Fund’s performance relative to the Bloomberg U.S. Treasury Inflation Protected Securities (TIPS) Index (Series-L):
• U.S. Treasury futures exposures used to manage Fund duration
• Shorter maturity TIPS exposure as longer maturity outperformed
• Cash equivalent holdings for liquidity, contrasted with high TIPS return
Performance shown is past performance and does not guarantee future results. The graph and table below do not reflect the deduction of taxes that a shareholder would pay on Fund distributions or redemption of Fund shares. The graph and table below assume reinvestment of dividends and capital gain distributions.
GROWTH OF A HYPOTHETICAL $10,000 INVESTMENT (October 1, 2014 through September 30, 2024)
This graph shows the performance of a hypothetical $10,000 investment in the share class noted over a ten-year period or since inception, if shorter, as compared to the performance of a broad-based securities market index, and, if applicable, one or more indexes that MML Investment Advisers, LLC believes more closely reflects the market segments in which the Fund invests or is a better comparison for the Fund’s investment strategy. This graph includes the deduction of the maximum applicable sales charge, if any.
| MM202912-309770 | PAGE 1 | TSR-AR-ITGU4 |
The index or indexes shown above are unmanaged, cannot be purchased directly, and, with the exception of any peer group index, do not incur expenses.
AVERAGE ANNUAL TOTAL RETURNS (%) (as of September 30, 2024)
| | | |
| | 1 Year | 5 Year | 10 Year |
Administrative Class - without sales charge | 10.76 | 2.63 | 2.46 |
Bloomberg U.S. Aggregate Bond Index1 | 11.57 | 0.33 | 1.84 |
Bloomberg U.S. Treasury Inflation Protected Securities (TIPS) Index (Series-L) | 9.79 | 2.62 | 2.54 |
| 1 | Effective July 24, 2024, the Bloomberg U.S. Aggregate Bond Index replaced the Bloomberg U.S. Treasury Inflation Protected Securities (TIPS) Index (Series-L) as a broad measure of market performance in accordance with new regulatory disclosure requirements. The Fund continues to use the Bloomberg U.S. Treasury Inflation Protected Securities (TIPS) Index (Series-L) as a supplemental benchmark that MML Investment Advisers, LLC believes more closely reflects the market segments in which the Fund invests. |
Performance results reflect any applicable waivers or expense limitations in effect during these periods, without which performance would have been lower. The investment return and principal value of shares of the Fund fluctuate, so your shares, when sold, may be worth more or less than their original cost. Current performance of the Fund may be lower or higher than the performance quoted. Performance data current to the most recent month-end may be obtained at https://www.massmutual.com/product-performance/mutual-funds or by calling 1-888-309-3539 or by sending an email request to fundinfo@massmutual.com.
WHAT ARE SOME KEY FUND STATISTICS? (as of September 30, 2024)
| |
Total Net Assets (Millions) | $244.1 |
Total Number of Portfolio Holdings (includes derivative positions, if any) | 174 |
Total Advisory Fees Paid During the Reporting Period | $946,753 |
Portfolio Turnover Rate | 78% |
WHAT DID THE FUND INVEST IN? (as of September 30, 2024)
Derivative values, if any, are excluded from the table(s) below.
| |
Portfolio Characteristics
(% of Total Investments) | |
Non-U.S. Government Agency Obligations | 57.8% |
U.S. Treasury Obligations | 20.0% |
Commercial Paper | 15.2% |
U.S. Government Agency Obligations and Instrumentalities | 6.8% |
Repurchase Agreement | 0.2% |
| MM202912-309770 | PAGE 2 | TSR-AR-ITGU4 |
HOW HAS THE FUND CHANGED?
The following is a summary of certain changes to the Fund since October 1, 2023. For more complete information, you may review the Fund’s prospectus, including any applicable supplements, at https://www.massmutual.com/product-performance/mutual-funds or upon request at 1-888-309-3539 or fundinfo@massmutual.com.
Effective February 1, 2024, the annual rate for administrative services for Class A shares of the Fund was reduced from 0.30% to 0.25%.
Effective July 1, 2024, MML Investment Advisers, LLC has agreed to cap the fees and expenses of the Fund (other than extraordinary legal and other expenses, Acquired Fund Fees and Expenses, interest expense, expenses related to borrowings, securities lending, leverage, taxes, and brokerage, short sale dividend and loan expense, or other non-recurring or unusual expenses such as organizational expenses and shareholder meeting expenses, as applicable) through January 31, 2026, to the extent that Total Annual Fund Operating Expenses after Expense Reimbursement would otherwise exceed 0.49%, 0.59%, 0.69%, 0.79%, 0.94%, 0.99%, 1.19%, and 0.59% for Classes I, R5, Service, Administrative, R4, A, R3, and Y, respectively.
| |
| WHERE CAN I FIND ADDITIONAL INFORMATION ABOUT THE FUND? |
For additional information about the Fund, including its prospectus, financial information, holdings, and proxy voting information, scan the QR code or visit https://www.massmutual.com/product-performance/mutual-funds. |
| MM202912-309770 | PAGE 3 | TSR-AR-ITGU4 |
1000098701055010480105131119912286129911135511514127541000010294108291083610705118071263212518106911076012004100009917105701049310536112861242413069115571170112847
| | |
MassMutual Inflation-Protected and Income Fund | |
| Class R4 | MIPRX |
| Annual Shareholder Report | September 30, 2024 |
This annual shareholder report contains important information about the MassMutual Inflation-Protected and Income Fund (the “Fund”) for the period of October 1, 2023 to September 30, 2024. You can find additional information about the Fund at https://www.massmutual.com/product-performance/mutual-funds. You can also request this information by contacting us at 1-888-309-3539 or by sending an email request to fundinfo@massmutual.com.
This report describes changes to the Fund that occurred during the reporting period.
WHAT WERE THE FUND COSTS FOR THE LAST YEAR?
This example shows the expenses you would have paid over the past year, based on a hypothetical $10,000 investment. This table reflects any applicable waivers or expense limitations.
| | |
Class Name | Costs of a $10,000 investment | Costs paid as a percentage of a $10,000 investment |
| Class R4 | $101 | 0.96% |
HOW DID THE FUND PERFORM?
Global bond markets were broadly, and strongly, positive for the trailing one-year period. During the period, central banks responded to lower inflation data and began to lower policy interest rates, which was favorable for bond prices and returns. Macroeconomic sentiment centered, particularly more recently, on a soft-landing scenario in the U.S., providing a supportive credit risk environment. During the period, narrowing credit spreads were a positive return driver in the global bond market, in addition to the response to lower bond market yields. This resulted in broad gains across varied market sectors, including government bonds, investment grade and high yield corporate securities, mortgage- and asset-backed instruments, and emerging market issues.
Top contributors to the Fund’s performance relative to the Bloomberg U.S. Treasury Inflation Protected Securities (TIPS) Index (Series-L):
• Fund income component of short-term nominal securities
• Long maturity TIPS exposure, given outperformance of shorter-term TIPS
• The Fund’s use of derivatives, which are utilized to gain income and inflation exposures, contributed to performance for the period
Top detractors to the Fund’s performance relative to the Bloomberg U.S. Treasury Inflation Protected Securities (TIPS) Index (Series-L):
• U.S. Treasury futures exposures used to manage Fund duration
• Shorter maturity TIPS exposure as longer maturity outperformed
• Cash equivalent holdings for liquidity, contrasted with high TIPS return
Performance shown is past performance and does not guarantee future results. The graph and table below do not reflect the deduction of taxes that a shareholder would pay on Fund distributions or redemption of Fund shares. The graph and table below assume reinvestment of dividends and capital gain distributions.
GROWTH OF A HYPOTHETICAL $10,000 INVESTMENT (October 1, 2014 through September 30, 2024)
This graph shows the performance of a hypothetical $10,000 investment in the share class noted over a ten-year period or since inception, if shorter, as compared to the performance of a broad-based securities market index, and, if applicable, one or more indexes that MML Investment Advisers, LLC believes more closely reflects the market segments in which the Fund invests or is a better comparison for the Fund’s investment strategy. This graph includes the deduction of the maximum applicable sales charge, if any.
| MM202912-309770 | PAGE 1 | TSR-AR-ITGUK |
The index or indexes shown above are unmanaged, cannot be purchased directly, and, with the exception of any peer group index, do not incur expenses.
AVERAGE ANNUAL TOTAL RETURNS (%) (as of September 30, 2024)
| | | |
| | 1 Year | 5 Year | 10 Year |
Class R4 - without sales charge | 10.55 | 2.47 | 2.31 |
Bloomberg U.S. Aggregate Bond Index1 | 11.57 | 0.33 | 1.84 |
Bloomberg U.S. Treasury Inflation Protected Securities (TIPS) Index (Series-L) | 9.79 | 2.62 | 2.54 |
| 1 | Effective July 24, 2024, the Bloomberg U.S. Aggregate Bond Index replaced the Bloomberg U.S. Treasury Inflation Protected Securities (TIPS) Index (Series-L) as a broad measure of market performance in accordance with new regulatory disclosure requirements. The Fund continues to use the Bloomberg U.S. Treasury Inflation Protected Securities (TIPS) Index (Series-L) as a supplemental benchmark that MML Investment Advisers, LLC believes more closely reflects the market segments in which the Fund invests. |
Performance results reflect any applicable waivers or expense limitations in effect during these periods, without which performance would have been lower. The investment return and principal value of shares of the Fund fluctuate, so your shares, when sold, may be worth more or less than their original cost. Current performance of the Fund may be lower or higher than the performance quoted. Performance data current to the most recent month-end may be obtained at https://www.massmutual.com/product-performance/mutual-funds or by calling 1-888-309-3539 or by sending an email request to fundinfo@massmutual.com.
WHAT ARE SOME KEY FUND STATISTICS? (as of September 30, 2024)
| |
Total Net Assets (Millions) | $244.1 |
Total Number of Portfolio Holdings (includes derivative positions, if any) | 174 |
Total Advisory Fees Paid During the Reporting Period | $946,753 |
Portfolio Turnover Rate | 78% |
WHAT DID THE FUND INVEST IN? (as of September 30, 2024)
Derivative values, if any, are excluded from the table(s) below.
| |
Portfolio Characteristics
(% of Total Investments) | |
Non-U.S. Government Agency Obligations | 57.8% |
U.S. Treasury Obligations | 20.0% |
Commercial Paper | 15.2% |
U.S. Government Agency Obligations and Instrumentalities | 6.8% |
Repurchase Agreement | 0.2% |
| MM202912-309770 | PAGE 2 | TSR-AR-ITGUK |
HOW HAS THE FUND CHANGED?
The following is a summary of certain changes to the Fund since October 1, 2023. For more complete information, you may review the Fund’s prospectus, including any applicable supplements, at https://www.massmutual.com/product-performance/mutual-funds or upon request at 1-888-309-3539 or fundinfo@massmutual.com.
Effective February 1, 2024, the annual rate for administrative services for Class A shares of the Fund was reduced from 0.30% to 0.25%.
Effective July 1, 2024, MML Investment Advisers, LLC has agreed to cap the fees and expenses of the Fund (other than extraordinary legal and other expenses, Acquired Fund Fees and Expenses, interest expense, expenses related to borrowings, securities lending, leverage, taxes, and brokerage, short sale dividend and loan expense, or other non-recurring or unusual expenses such as organizational expenses and shareholder meeting expenses, as applicable) through January 31, 2026, to the extent that Total Annual Fund Operating Expenses after Expense Reimbursement would otherwise exceed 0.49%, 0.59%, 0.69%, 0.79%, 0.94%, 0.99%, 1.19%, and 0.59% for Classes I, R5, Service, Administrative, R4, A, R3, and Y, respectively.
| |
| WHERE CAN I FIND ADDITIONAL INFORMATION ABOUT THE FUND? |
For additional information about the Fund, including its prospectus, financial information, holdings, and proxy voting information, scan the QR code or visit https://www.massmutual.com/product-performance/mutual-funds. |
| MM202912-309770 | PAGE 3 | TSR-AR-ITGUK |
1000098531051910431104641112012177128651122611365125631000010294108291083610705118071263212518106911076012004100009917105701049310536112861242413069115571170112847
| | |
MassMutual Inflation-Protected and Income Fund | |
| Class A | MPSAX |
| Annual Shareholder Report | September 30, 2024 |
This annual shareholder report contains important information about the MassMutual Inflation-Protected and Income Fund (the “Fund”) for the period of October 1, 2023 to September 30, 2024. You can find additional information about the Fund at https://www.massmutual.com/product-performance/mutual-funds. You can also request this information by contacting us at 1-888-309-3539 or by sending an email request to fundinfo@massmutual.com.
This report describes changes to the Fund that occurred during the reporting period.
WHAT WERE THE FUND COSTS FOR THE LAST YEAR?
This example shows the expenses you would have paid over the past year, based on a hypothetical $10,000 investment. This table reflects any applicable waivers or expense limitations.
| | |
Class Name | Costs of a $10,000 investment | Costs paid as a percentage of a $10,000 investment |
| Class A | $108 | 1.03% |
HOW DID THE FUND PERFORM?
Global bond markets were broadly, and strongly, positive for the trailing one-year period. During the period, central banks responded to lower inflation data and began to lower policy interest rates, which was favorable for bond prices and returns. Macroeconomic sentiment centered, particularly more recently, on a soft-landing scenario in the U.S., providing a supportive credit risk environment. During the period, narrowing credit spreads were a positive return driver in the global bond market, in addition to the response to lower bond market yields. This resulted in broad gains across varied market sectors, including government bonds, investment grade and high yield corporate securities, mortgage- and asset-backed instruments, and emerging market issues.
Top contributors to the Fund’s performance relative to the Bloomberg U.S. Treasury Inflation Protected Securities (TIPS) Index (Series-L):
• Fund income component of short-term nominal securities
• Long maturity TIPS exposure, given outperformance of shorter-term TIPS
• The Fund’s use of derivatives, which are utilized to gain income and inflation exposures, contributed to performance for the period
Top detractors to the Fund’s performance relative to the Bloomberg U.S. Treasury Inflation Protected Securities (TIPS) Index (Series-L):
• U.S. Treasury futures exposures used to manage Fund duration
• Shorter maturity TIPS exposure as longer maturity outperformed
• Cash equivalent holdings for liquidity, contrasted with high TIPS return
Performance shown is past performance and does not guarantee future results. The graph and table below do not reflect the deduction of taxes that a shareholder would pay on Fund distributions or redemption of Fund shares. The graph and table below assume reinvestment of dividends and capital gain distributions.
GROWTH OF A HYPOTHETICAL $10,000 INVESTMENT (October 1, 2014 through September 30, 2024)
This graph shows the performance of a hypothetical $10,000 investment in the share class noted over a ten-year period or since inception, if shorter, as compared to the performance of a broad-based securities market index, and, if applicable, one or more indexes that MML Investment Advisers, LLC believes more closely reflects the market segments in which the Fund invests or is a better comparison for the Fund’s investment strategy. This graph includes the deduction of the maximum applicable sales charge, if any.
| MM202912-309770 | PAGE 1 | TSR-AR-ITGU2 |
The index or indexes shown above are unmanaged, cannot be purchased directly, and, with the exception of any peer group index, do not incur expenses.
AVERAGE ANNUAL TOTAL RETURNS (%) (as of September 30, 2024)
| | | |
| | 1 Year | 5 Year | 10 Year |
Class A - without sales charge | 10.38 | 2.37 | 2.20 |
Class A - with maximum sales charge | 5.68 | 1.48 | 1.76 |
Bloomberg U.S. Aggregate Bond Index1 | 11.57 | 0.33 | 1.84 |
Bloomberg U.S. Treasury Inflation Protected Securities (TIPS) Index (Series-L) | 9.79 | 2.62 | 2.54 |
| 1 | Effective July 24, 2024, the Bloomberg U.S. Aggregate Bond Index replaced the Bloomberg U.S. Treasury Inflation Protected Securities (TIPS) Index (Series-L) as a broad measure of market performance in accordance with new regulatory disclosure requirements. The Fund continues to use the Bloomberg U.S. Treasury Inflation Protected Securities (TIPS) Index (Series-L) as a supplemental benchmark that MML Investment Advisers, LLC believes more closely reflects the market segments in which the Fund invests. |
Performance results reflect any applicable waivers or expense limitations in effect during these periods, without which performance would have been lower. The investment return and principal value of shares of the Fund fluctuate, so your shares, when sold, may be worth more or less than their original cost. Current performance of the Fund may be lower or higher than the performance quoted. Performance data current to the most recent month-end may be obtained at https://www.massmutual.com/product-performance/mutual-funds or by calling 1-888-309-3539 or by sending an email request to fundinfo@massmutual.com.
WHAT ARE SOME KEY FUND STATISTICS? (as of September 30, 2024)
| |
Total Net Assets (Millions) | $244.1 |
Total Number of Portfolio Holdings (includes derivative positions, if any) | 174 |
Total Advisory Fees Paid During the Reporting Period | $946,753 |
Portfolio Turnover Rate | 78% |
WHAT DID THE FUND INVEST IN? (as of September 30, 2024)
Derivative values, if any, are excluded from the table(s) below.
| |
Portfolio Characteristics
(% of Total Investments) | |
Non-U.S. Government Agency Obligations | 57.8% |
U.S. Treasury Obligations | 20.0% |
Commercial Paper | 15.2% |
U.S. Government Agency Obligations and Instrumentalities | 6.8% |
Repurchase Agreement | 0.2% |
| MM202912-309770 | PAGE 2 | TSR-AR-ITGU2 |
HOW HAS THE FUND CHANGED?
The following is a summary of certain changes to the Fund since October 1, 2023. For more complete information, you may review the Fund’s prospectus, including any applicable supplements, at https://www.massmutual.com/product-performance/mutual-funds or upon request at 1-888-309-3539 or fundinfo@massmutual.com.
Effective February 1, 2024, the annual rate for administrative services for Class A shares of the Fund was reduced from 0.30% to 0.25%.
Effective July 1, 2024, MML Investment Advisers, LLC has agreed to cap the fees and expenses of the Fund (other than extraordinary legal and other expenses, Acquired Fund Fees and Expenses, interest expense, expenses related to borrowings, securities lending, leverage, taxes, and brokerage, short sale dividend and loan expense, or other non-recurring or unusual expenses such as organizational expenses and shareholder meeting expenses, as applicable) through January 31, 2026, to the extent that Total Annual Fund Operating Expenses after Expense Reimbursement would otherwise exceed 0.49%, 0.59%, 0.69%, 0.79%, 0.94%, 0.99%, 1.19%, and 0.59% for Classes I, R5, Service, Administrative, R4, A, R3, and Y, respectively.
| |
| WHERE CAN I FIND ADDITIONAL INFORMATION ABOUT THE FUND? |
For additional information about the Fund, including its prospectus, financial information, holdings, and proxy voting information, scan the QR code or visit https://www.massmutual.com/product-performance/mutual-funds. |
| MM202912-309770 | PAGE 3 | TSR-AR-ITGU2 |
9575942410051995899751058911587122291066210785119041000010294108291083610705118071263212518106911076012004100009917105701049310536112861242413069115571170112847
| | |
MassMutual Inflation-Protected and Income Fund | |
| Class R3 | MIPNX |
| Annual Shareholder Report | September 30, 2024 |
This annual shareholder report contains important information about the MassMutual Inflation-Protected and Income Fund (the “Fund”) for the period of October 1, 2023 to September 30, 2024. You can find additional information about the Fund at https://www.massmutual.com/product-performance/mutual-funds. You can also request this information by contacting us at 1-888-309-3539 or by sending an email request to fundinfo@massmutual.com.
This report describes changes to the Fund that occurred during the reporting period.
WHAT WERE THE FUND COSTS FOR THE LAST YEAR?
This example shows the expenses you would have paid over the past year, based on a hypothetical $10,000 investment. This table reflects any applicable waivers or expense limitations.
| | |
Class Name | Costs of a $10,000 investment | Costs paid as a percentage of a $10,000 investment |
| Class R3 | $127 | 1.21% |
HOW DID THE FUND PERFORM?
Global bond markets were broadly, and strongly, positive for the trailing one-year period. During the period, central banks responded to lower inflation data and began to lower policy interest rates, which was favorable for bond prices and returns. Macroeconomic sentiment centered, particularly more recently, on a soft-landing scenario in the U.S., providing a supportive credit risk environment. During the period, narrowing credit spreads were a positive return driver in the global bond market, in addition to the response to lower bond market yields. This resulted in broad gains across varied market sectors, including government bonds, investment grade and high yield corporate securities, mortgage- and asset-backed instruments, and emerging market issues.
Top contributors to the Fund’s performance relative to the Bloomberg U.S. Treasury Inflation Protected Securities (TIPS) Index (Series-L):
• Fund income component of short-term nominal securities
• Long maturity TIPS exposure, given outperformance of shorter-term TIPS
• The Fund’s use of derivatives, which are utilized to gain income and inflation exposures, contributed to performance for the period
Top detractors to the Fund’s performance relative to the Bloomberg U.S. Treasury Inflation Protected Securities (TIPS) Index (Series-L):
• U.S. Treasury futures exposures used to manage Fund duration
• Shorter maturity TIPS exposure as longer maturity outperformed
• Cash equivalent holdings for liquidity, contrasted with high TIPS return
Performance shown is past performance and does not guarantee future results. The graph and table below do not reflect the deduction of taxes that a shareholder would pay on Fund distributions or redemption of Fund shares. The graph and table below assume reinvestment of dividends and capital gain distributions.
GROWTH OF A HYPOTHETICAL $10,000 INVESTMENT (October 1, 2014 through September 30, 2024)
This graph shows the performance of a hypothetical $10,000 investment in the share class noted over a ten-year period or since inception, if shorter, as compared to the performance of a broad-based securities market index, and, if applicable, one or more indexes that MML Investment Advisers, LLC believes more closely reflects the market segments in which the Fund invests or is a better comparison for the Fund’s investment strategy. This graph includes the deduction of the maximum applicable sales charge, if any.
| MM202912-309770 | PAGE 1 | TSR-AR-ITGU5 |
The index or indexes shown above are unmanaged, cannot be purchased directly, and, with the exception of any peer group index, do not incur expenses.
AVERAGE ANNUAL TOTAL RETURNS (%) (as of September 30, 2024)
| | | |
| | 1 Year | 5 Year | 10 Year |
Class R3 - without sales charge | 10.28 | 2.23 | 2.05 |
Bloomberg U.S. Aggregate Bond Index1 | 11.57 | 0.33 | 1.84 |
Bloomberg U.S. Treasury Inflation Protected Securities (TIPS) Index (Series-L) | 9.79 | 2.62 | 2.54 |
| 1 | Effective July 24, 2024, the Bloomberg U.S. Aggregate Bond Index replaced the Bloomberg U.S. Treasury Inflation Protected Securities (TIPS) Index (Series-L) as a broad measure of market performance in accordance with new regulatory disclosure requirements. The Fund continues to use the Bloomberg U.S. Treasury Inflation Protected Securities (TIPS) Index (Series-L) as a supplemental benchmark that MML Investment Advisers, LLC believes more closely reflects the market segments in which the Fund invests. |
Performance results reflect any applicable waivers or expense limitations in effect during these periods, without which performance would have been lower. The investment return and principal value of shares of the Fund fluctuate, so your shares, when sold, may be worth more or less than their original cost. Current performance of the Fund may be lower or higher than the performance quoted. Performance data current to the most recent month-end may be obtained at https://www.massmutual.com/product-performance/mutual-funds or by calling 1-888-309-3539 or by sending an email request to fundinfo@massmutual.com.
WHAT ARE SOME KEY FUND STATISTICS? (as of September 30, 2024)
| |
Total Net Assets (Millions) | $244.1 |
Total Number of Portfolio Holdings (includes derivative positions, if any) | 174 |
Total Advisory Fees Paid During the Reporting Period | $946,753 |
Portfolio Turnover Rate | 78% |
WHAT DID THE FUND INVEST IN? (as of September 30, 2024)
Derivative values, if any, are excluded from the table(s) below.
| |
Portfolio Characteristics
(% of Total Investments) | |
Non-U.S. Government Agency Obligations | 57.8% |
U.S. Treasury Obligations | 20.0% |
Commercial Paper | 15.2% |
U.S. Government Agency Obligations and Instrumentalities | 6.8% |
Repurchase Agreement | 0.2% |
| MM202912-309770 | PAGE 2 | TSR-AR-ITGU5 |
HOW HAS THE FUND CHANGED?
The following is a summary of certain changes to the Fund since October 1, 2023. For more complete information, you may review the Fund’s prospectus, including any applicable supplements, at https://www.massmutual.com/product-performance/mutual-funds or upon request at 1-888-309-3539 or fundinfo@massmutual.com.
Effective February 1, 2024, the annual rate for administrative services for Class A shares of the Fund was reduced from 0.30% to 0.25%.
Effective July 1, 2024, MML Investment Advisers, LLC has agreed to cap the fees and expenses of the Fund (other than extraordinary legal and other expenses, Acquired Fund Fees and Expenses, interest expense, expenses related to borrowings, securities lending, leverage, taxes, and brokerage, short sale dividend and loan expense, or other non-recurring or unusual expenses such as organizational expenses and shareholder meeting expenses, as applicable) through January 31, 2026, to the extent that Total Annual Fund Operating Expenses after Expense Reimbursement would otherwise exceed 0.49%, 0.59%, 0.69%, 0.79%, 0.94%, 0.99%, 1.19%, and 0.59% for Classes I, R5, Service, Administrative, R4, A, R3, and Y, respectively.
| |
| WHERE CAN I FIND ADDITIONAL INFORMATION ABOUT THE FUND? |
For additional information about the Fund, including its prospectus, financial information, holdings, and proxy voting information, scan the QR code or visit https://www.massmutual.com/product-performance/mutual-funds. |
| MM202912-309770 | PAGE 3 | TSR-AR-ITGU5 |
1000098241046010345103481097311982126291099011108122501000010294108291083610705118071263212518106911076012004100009917105701049310536112861242413069115571170112847
| | |
MassMutual Inflation-Protected and Income Fund | |
| Class Y | MMODX |
| Annual Shareholder Report | September 30, 2024 |
This annual shareholder report contains important information about the MassMutual Inflation-Protected and Income Fund (the “Fund”) for the period of October 1, 2023 to September 30, 2024. You can find additional information about the Fund at https://www.massmutual.com/product-performance/mutual-funds. You can also request this information by contacting us at 1-888-309-3539 or by sending an email request to fundinfo@massmutual.com.
This report describes changes to the Fund that occurred during the reporting period.
WHAT WERE THE FUND COSTS FOR THE LAST YEAR?
This example shows the expenses you would have paid over the past year, based on a hypothetical $10,000 investment. This table reflects any applicable waivers or expense limitations.
| | |
Class Name | Costs of a $10,000 investment | Costs paid as a percentage of a $10,000 investment |
| Class Y | $64 | 0.61% |
HOW DID THE FUND PERFORM?
Global bond markets were broadly, and strongly, positive for the trailing one-year period. During the period, central banks responded to lower inflation data and began to lower policy interest rates, which was favorable for bond prices and returns. Macroeconomic sentiment centered, particularly more recently, on a soft-landing scenario in the U.S., providing a supportive credit risk environment. During the period, narrowing credit spreads were a positive return driver in the global bond market, in addition to the response to lower bond market yields. This resulted in broad gains across varied market sectors, including government bonds, investment grade and high yield corporate securities, mortgage- and asset-backed instruments, and emerging market issues.
Top contributors to the Fund’s performance relative to the Bloomberg U.S. Treasury Inflation Protected Securities (TIPS) Index (Series-L):
• Fund income component of short-term nominal securities
• Long maturity TIPS exposure, given outperformance of shorter-term TIPS
• The Fund’s use of derivatives, which are utilized to gain income and inflation exposures, contributed to performance for the period
Top detractors to the Fund’s performance relative to the Bloomberg U.S. Treasury Inflation Protected Securities (TIPS) Index (Series-L):
• U.S. Treasury futures exposures used to manage Fund duration
• Shorter maturity TIPS exposure as longer maturity outperformed
• Cash equivalent holdings for liquidity, contrasted with high TIPS return
Performance shown is past performance and does not guarantee future results. The graph and table below do not reflect the deduction of taxes that a shareholder would pay on Fund distributions or redemption of Fund shares. The graph and table below assume reinvestment of dividends and capital gain distributions.
GROWTH OF A HYPOTHETICAL $10,000 INVESTMENT (February 1, 2023 through September 30, 2024)
This graph shows the performance of a hypothetical $10,000 investment in the share class noted over a ten-year period or since inception, if shorter, as compared to the performance of a broad-based securities market index, and, if applicable, one or more indexes that MML Investment Advisers, LLC believes more closely reflects the market segments in which the Fund invests or is a better comparison for the Fund’s investment strategy. This graph includes the deduction of the maximum applicable sales charge, if any.
| MM202912-309770 | PAGE 1 | TSR-AR-ITGUY |
The index or indexes shown above are unmanaged, cannot be purchased directly, and, with the exception of any peer group index, do not incur expenses.
AVERAGE ANNUAL TOTAL RETURNS (%) (as of September 30, 2024)
| | |
| | 1 Year | Since Inception
(02/01/2023) |
Class Y - without sales charge | 10.84 | 5.23 |
Bloomberg U.S. Aggregate Bond Index1 | 11.57 | 4.11 |
Bloomberg U.S. Treasury Inflation Protected Securities (TIPS) Index (Series-L) | 9.79 | 4.14 |
| 1 | Effective July 24, 2024, the Bloomberg U.S. Aggregate Bond Index replaced the Bloomberg U.S. Treasury Inflation Protected Securities (TIPS) Index (Series-L) as a broad measure of market performance in accordance with new regulatory disclosure requirements. The Fund continues to use the Bloomberg U.S. Treasury Inflation Protected Securities (TIPS) Index (Series-L) as a supplemental benchmark that MML Investment Advisers, LLC believes more closely reflects the market segments in which the Fund invests. |
Performance results reflect any applicable waivers or expense limitations in effect during these periods, without which performance would have been lower. The investment return and principal value of shares of the Fund fluctuate, so your shares, when sold, may be worth more or less than their original cost. Current performance of the Fund may be lower or higher than the performance quoted. Performance data current to the most recent month-end may be obtained at https://www.massmutual.com/product-performance/mutual-funds or by calling 1-888-309-3539 or by sending an email request to fundinfo@massmutual.com.
WHAT ARE SOME KEY FUND STATISTICS? (as of September 30, 2024)
| |
Total Net Assets (Millions) | $244.1 |
Total Number of Portfolio Holdings (includes derivative positions, if any) | 174 |
Total Advisory Fees Paid During the Reporting Period | $946,753 |
Portfolio Turnover Rate | 78% |
WHAT DID THE FUND INVEST IN? (as of September 30, 2024)
Derivative values, if any, are excluded from the table(s) below.
| |
Portfolio Characteristics
(% of Total Investments) | |
Non-U.S. Government Agency Obligations | 57.8% |
U.S. Treasury Obligations | 20.0% |
Commercial Paper | 15.2% |
U.S. Government Agency Obligations and Instrumentalities | 6.8% |
Repurchase Agreement | 0.2% |
| MM202912-309770 | PAGE 2 | TSR-AR-ITGUY |
HOW HAS THE FUND CHANGED?
The following is a summary of certain changes to the Fund since October 1, 2023. For more complete information, you may review the Fund’s prospectus, including any applicable supplements, at https://www.massmutual.com/product-performance/mutual-funds or upon request at 1-888-309-3539 or fundinfo@massmutual.com.
Effective February 1, 2024, the annual rate for administrative services for Class A shares of the Fund was reduced from 0.30% to 0.25%.
Effective July 1, 2024, MML Investment Advisers, LLC has agreed to cap the fees and expenses of the Fund (other than extraordinary legal and other expenses, Acquired Fund Fees and Expenses, interest expense, expenses related to borrowings, securities lending, leverage, taxes, and brokerage, short sale dividend and loan expense, or other non-recurring or unusual expenses such as organizational expenses and shareholder meeting expenses, as applicable) through January 31, 2026, to the extent that Total Annual Fund Operating Expenses after Expense Reimbursement would otherwise exceed 0.49%, 0.59%, 0.69%, 0.79%, 0.94%, 0.99%, 1.19%, and 0.59% for Classes I, R5, Service, Administrative, R4, A, R3, and Y, respectively.
| |
| WHERE CAN I FIND ADDITIONAL INFORMATION ABOUT THE FUND? |
For additional information about the Fund, including its prospectus, financial information, holdings, and proxy voting information, scan the QR code or visit https://www.massmutual.com/product-performance/mutual-funds. |
| MM202912-309770 | PAGE 3 | TSR-AR-ITGUY |
100009818108821000095191062110000967310620
| | |
MassMutual Core Bond Fund | |
| Class I | MCZZX |
| Annual Shareholder Report | September 30, 2024 |
This annual shareholder report contains important information about the MassMutual Core Bond Fund (the “Fund”) for the period of October 1, 2023 to September 30, 2024. You can find additional information about the Fund at https://www.massmutual.com/product-performance/mutual-funds. You can also request this information by contacting us at 1-888-309-3539 or by sending an email request to fundinfo@massmutual.com.
This report describes changes to the Fund that occurred during the reporting period.
WHAT WERE THE FUND COSTS FOR THE LAST YEAR?
This example shows the expenses you would have paid over the past year, based on a hypothetical $10,000 investment. This table reflects any applicable waivers or expense limitations.
| | |
Class Name | Costs of a $10,000 investment | Costs paid as a percentage of a $10,000 investment |
| Class I | $46 | 0.43% |
HOW DID THE FUND PERFORM?
Global bond markets were broadly, and strongly, positive for the trailing one-year period. During the period, central banks responded to lower inflation data and began to lower policy interest rates, which was favorable for bond prices and returns. Macroeconomic sentiment centered, particularly more recently, on a soft-landing scenario in the U.S., providing a supportive credit risk environment. During the period, narrowing credit spreads were a positive return driver in the global bond market, in addition to the response to lower bond market yields. This resulted in broad gains across varied market sectors, including government bonds, investment grade and high yield corporate securities, mortgage- and asset-backed instruments, and emerging market issues.
Top contributors to the Fund’s performance relative to the Bloomberg U.S. Aggregate Bond Index:
• The corporate credit exposure, mainly investment grade, from issue selection
• Security selection and allocation to securitized assets, namely ABS, CMBS, and RMBS
Top detractors to the Fund’s performance relative to the Bloomberg U.S. Aggregate Bond Index:
• U.S. Treasury by virtue of the Fund being underweight and the sector gaining from lower interest rates
• Derivatives exposure mainly from U.S. Treasury futures to manage Fund duration
Performance shown is past performance and does not guarantee future results. The graph and table below do not reflect the deduction of taxes that a shareholder would pay on Fund distributions or redemption of Fund shares. The graph and table below assume reinvestment of dividends and capital gain distributions.
GROWTH OF A HYPOTHETICAL $10,000 INVESTMENT (October 1, 2014 through September 30, 2024)
This graph shows the performance of a hypothetical $10,000 investment in the share class noted over a ten-year period or since inception, if shorter, as compared to the performance of a broad-based securities market index, and, if applicable, one or more indexes that MML Investment Advisers, LLC believes more closely reflects the market segments in which the Fund invests or is a better comparison for the Fund’s investment strategy. This graph includes the deduction of the maximum applicable sales charge, if any.
| MM202912-309770 | PAGE 1 | TSR-AR-ITGM6 |
The index or indexes shown above are unmanaged, cannot be purchased directly, and, with the exception of any peer group index, do not incur expenses.
AVERAGE ANNUAL TOTAL RETURNS (%) (as of September 30, 2024)
| | | |
| | 1 Year | 5 Year | 10 Year |
Class I - without sales charge | 14.13 | 1.10 | 2.23 |
Bloomberg U.S. Aggregate Bond Index | 11.57 | 0.33 | 1.84 |
Performance results reflect any applicable waivers or expense limitations in effect during these periods, without which performance would have been lower. The investment return and principal value of shares of the Fund fluctuate, so your shares, when sold, may be worth more or less than their original cost. Current performance of the Fund may be lower or higher than the performance quoted. Performance data current to the most recent month-end may be obtained at https://www.massmutual.com/product-performance/mutual-funds or by calling 1-888-309-3539 or by sending an email request to fundinfo@massmutual.com.
WHAT ARE SOME KEY FUND STATISTICS? (as of September 30, 2024)
| |
Total Net Assets (Millions) | $1,035.1 |
Total Number of Portfolio Holdings (includes derivative positions, if any) | 447 |
Total Advisory Fees Paid During the Reporting Period | $2,544,115 |
Portfolio Turnover Rate | 248% |
WHAT DID THE FUND INVEST IN? (as of September 30, 2024)
Derivative values, if any, are excluded from the table(s) below.
| |
Portfolio Characteristics
(% of Total Investments) | |
Corporate Debt | 32.1% |
U.S. Government Agency Obligations and Instrumentalities | 26.1% |
Non-U.S. Government Agency Obligations | 17.4% |
Commercial Paper | 13.6% |
U.S. Treasury Obligations | 8.6% |
Investment of Cash Collateral from Securities Loaned | 1.1% |
Repurchase Agreement | 1.0% |
Sovereign Debt Obligations | 0.1% |
HOW HAS THE FUND CHANGED?
The following is a summary of certain changes to the Fund since October 1, 2023. For more complete information, you may review the Fund’s prospectus, including any applicable supplements, at https://www.massmutual.com/product-performance/mutual-funds or upon request at 1-888-309-3539 or fundinfo@massmutual.com.
| MM202912-309770 | PAGE 2 | TSR-AR-ITGM6 |
Effective February 1, 2024, the annual rate for administrative services for Class A shares of the Fund was reduced from 0.30% to 0.25%.
Effective February 1, 2024, MML Investment Advisers, LLC has agreed to cap the fees and expenses of the Fund (other than extraordinary legal and other expenses, Acquired Fund Fees and Expenses, interest expense, expenses related to borrowings, securities lending, leverage, taxes, and brokerage, short sale dividend and loan expense, or other non-recurring or unusual expenses such as organizational expenses and shareholder meeting expenses, as applicable) through January 31, 2025, to the extent that Total Annual Fund Operating Expenses after Expense Reimbursement would otherwise exceed 0.42%, 0.52%, 0.62%, 0.72%, 0.87%, 0.92%, 1.12%, and 0.52% for Classes I, R5, Service, Administrative, R4, A, R3, and Y, respectively.
On September 23, 2024, the MassMutual Strategic Bond Fund was merged into the Fund and shareholders of the MassMutual Strategic Bond Fund became shareholders of the Fund.
| |
| WHERE CAN I FIND ADDITIONAL INFORMATION ABOUT THE FUND? |
For additional information about the Fund, including its prospectus, financial information, holdings, and proxy voting information, scan the QR code or visit https://www.massmutual.com/product-performance/mutual-funds. |
| MM202912-309770 | PAGE 3 | TSR-AR-ITGM6 |
10000101671063810779107291179912541129551082110921124641000010294108291083610705118071263212518106911076012004
| | |
MassMutual Core Bond Fund | |
| Class R5 | MCBDX |
| Annual Shareholder Report | September 30, 2024 |
This annual shareholder report contains important information about the MassMutual Core Bond Fund (the “Fund”) for the period of October 1, 2023 to September 30, 2024. You can find additional information about the Fund at https://www.massmutual.com/product-performance/mutual-funds. You can also request this information by contacting us at 1-888-309-3539 or by sending an email request to fundinfo@massmutual.com.
This report describes changes to the Fund that occurred during the reporting period.
WHAT WERE THE FUND COSTS FOR THE LAST YEAR?
This example shows the expenses you would have paid over the past year, based on a hypothetical $10,000 investment. This table reflects any applicable waivers or expense limitations.
| | |
Class Name | Costs of a $10,000 investment | Costs paid as a percentage of a $10,000 investment |
| Class R5 | $57 | 0.53% |
HOW DID THE FUND PERFORM?
Global bond markets were broadly, and strongly, positive for the trailing one-year period. During the period, central banks responded to lower inflation data and began to lower policy interest rates, which was favorable for bond prices and returns. Macroeconomic sentiment centered, particularly more recently, on a soft-landing scenario in the U.S., providing a supportive credit risk environment. During the period, narrowing credit spreads were a positive return driver in the global bond market, in addition to the response to lower bond market yields. This resulted in broad gains across varied market sectors, including government bonds, investment grade and high yield corporate securities, mortgage- and asset-backed instruments, and emerging market issues.
Top contributors to the Fund’s performance relative to the Bloomberg U.S. Aggregate Bond Index:
• The corporate credit exposure, mainly investment grade, from issue selection
• Security selection and allocation to securitized assets, namely ABS, CMBS, and RMBS
Top detractors to the Fund’s performance relative to the Bloomberg U.S. Aggregate Bond Index:
• U.S. Treasury by virtue of the Fund being underweight and the sector gaining from lower interest rates
• Derivatives exposure mainly from U.S. Treasury futures to manage Fund duration
Performance shown is past performance and does not guarantee future results. The graph and table below do not reflect the deduction of taxes that a shareholder would pay on Fund distributions or redemption of Fund shares. The graph and table below assume reinvestment of dividends and capital gain distributions.
GROWTH OF A HYPOTHETICAL $10,000 INVESTMENT (October 1, 2014 through September 30, 2024)
This graph shows the performance of a hypothetical $10,000 investment in the share class noted over a ten-year period or since inception, if shorter, as compared to the performance of a broad-based securities market index, and, if applicable, one or more indexes that MML Investment Advisers, LLC believes more closely reflects the market segments in which the Fund invests or is a better comparison for the Fund’s investment strategy. This graph includes the deduction of the maximum applicable sales charge, if any.
| MM202912-309770 | PAGE 1 | TSR-AR-ITGM1 |
The index or indexes shown above are unmanaged, cannot be purchased directly, and, with the exception of any peer group index, do not incur expenses.
AVERAGE ANNUAL TOTAL RETURNS (%) (as of September 30, 2024)
| | | |
| | 1 Year | 5 Year | 10 Year |
Class R5 - without sales charge | 13.93 | 0.99 | 2.12 |
Bloomberg U.S. Aggregate Bond Index | 11.57 | 0.33 | 1.84 |
Performance results reflect any applicable waivers or expense limitations in effect during these periods, without which performance would have been lower. The investment return and principal value of shares of the Fund fluctuate, so your shares, when sold, may be worth more or less than their original cost. Current performance of the Fund may be lower or higher than the performance quoted. Performance data current to the most recent month-end may be obtained at https://www.massmutual.com/product-performance/mutual-funds or by calling 1-888-309-3539 or by sending an email request to fundinfo@massmutual.com.
WHAT ARE SOME KEY FUND STATISTICS? (as of September 30, 2024)
| |
Total Net Assets (Millions) | $1,035.1 |
Total Number of Portfolio Holdings (includes derivative positions, if any) | 447 |
Total Advisory Fees Paid During the Reporting Period | $2,544,115 |
Portfolio Turnover Rate | 248% |
WHAT DID THE FUND INVEST IN? (as of September 30, 2024)
Derivative values, if any, are excluded from the table(s) below.
| |
Portfolio Characteristics
(% of Total Investments) | |
Corporate Debt | 32.1% |
U.S. Government Agency Obligations and Instrumentalities | 26.1% |
Non-U.S. Government Agency Obligations | 17.4% |
Commercial Paper | 13.6% |
U.S. Treasury Obligations | 8.6% |
Investment of Cash Collateral from Securities Loaned | 1.1% |
Repurchase Agreement | 1.0% |
Sovereign Debt Obligations | 0.1% |
HOW HAS THE FUND CHANGED?
The following is a summary of certain changes to the Fund since October 1, 2023. For more complete information, you may review the Fund’s prospectus, including any applicable supplements, at https://www.massmutual.com/product-performance/mutual-funds or upon request at 1-888-309-3539 or fundinfo@massmutual.com.
| MM202912-309770 | PAGE 2 | TSR-AR-ITGM1 |
Effective February 1, 2024, the annual rate for administrative services for Class A shares of the Fund was reduced from 0.30% to 0.25%.
Effective February 1, 2024, MML Investment Advisers, LLC has agreed to cap the fees and expenses of the Fund (other than extraordinary legal and other expenses, Acquired Fund Fees and Expenses, interest expense, expenses related to borrowings, securities lending, leverage, taxes, and brokerage, short sale dividend and loan expense, or other non-recurring or unusual expenses such as organizational expenses and shareholder meeting expenses, as applicable) through January 31, 2025, to the extent that Total Annual Fund Operating Expenses after Expense Reimbursement would otherwise exceed 0.42%, 0.52%, 0.62%, 0.72%, 0.87%, 0.92%, 1.12%, and 0.52% for Classes I, R5, Service, Administrative, R4, A, R3, and Y, respectively.
On September 23, 2024, the MassMutual Strategic Bond Fund was merged into the Fund and shareholders of the MassMutual Strategic Bond Fund became shareholders of the Fund.
| |
| WHERE CAN I FIND ADDITIONAL INFORMATION ABOUT THE FUND? |
For additional information about the Fund, including its prospectus, financial information, holdings, and proxy voting information, scan the QR code or visit https://www.massmutual.com/product-performance/mutual-funds. |
| MM202912-309770 | PAGE 3 | TSR-AR-ITGM1 |
10000101631062010748106871174712471128691073310830123381000010294108291083610705118071263212518106911076012004
| | |
MassMutual Core Bond Fund | |
| Service Class | MCBYX |
| Annual Shareholder Report | September 30, 2024 |
This annual shareholder report contains important information about the MassMutual Core Bond Fund (the “Fund”) for the period of October 1, 2023 to September 30, 2024. You can find additional information about the Fund at https://www.massmutual.com/product-performance/mutual-funds. You can also request this information by contacting us at 1-888-309-3539 or by sending an email request to fundinfo@massmutual.com.
This report describes changes to the Fund that occurred during the reporting period.
WHAT WERE THE FUND COSTS FOR THE LAST YEAR?
This example shows the expenses you would have paid over the past year, based on a hypothetical $10,000 investment. This table reflects any applicable waivers or expense limitations.
| | |
Class Name | Costs of a $10,000 investment | Costs paid as a percentage of a $10,000 investment |
| Service Class | $67 | 0.63% |
HOW DID THE FUND PERFORM?
Global bond markets were broadly, and strongly, positive for the trailing one-year period. During the period, central banks responded to lower inflation data and began to lower policy interest rates, which was favorable for bond prices and returns. Macroeconomic sentiment centered, particularly more recently, on a soft-landing scenario in the U.S., providing a supportive credit risk environment. During the period, narrowing credit spreads were a positive return driver in the global bond market, in addition to the response to lower bond market yields. This resulted in broad gains across varied market sectors, including government bonds, investment grade and high yield corporate securities, mortgage- and asset-backed instruments, and emerging market issues.
Top contributors to the Fund’s performance relative to the Bloomberg U.S. Aggregate Bond Index:
• The corporate credit exposure, mainly investment grade, from issue selection
• Security selection and allocation to securitized assets, namely ABS, CMBS, and RMBS
Top detractors to the Fund’s performance relative to the Bloomberg U.S. Aggregate Bond Index:
• U.S. Treasury by virtue of the Fund being underweight and the sector gaining from lower interest rates
• Derivatives exposure mainly from U.S. Treasury futures to manage Fund duration
Performance shown is past performance and does not guarantee future results. The graph and table below do not reflect the deduction of taxes that a shareholder would pay on Fund distributions or redemption of Fund shares. The graph and table below assume reinvestment of dividends and capital gain distributions.
GROWTH OF A HYPOTHETICAL $10,000 INVESTMENT (October 1, 2014 through September 30, 2024)
This graph shows the performance of a hypothetical $10,000 investment in the share class noted over a ten-year period or since inception, if shorter, as compared to the performance of a broad-based securities market index, and, if applicable, one or more indexes that MML Investment Advisers, LLC believes more closely reflects the market segments in which the Fund invests or is a better comparison for the Fund’s investment strategy. This graph includes the deduction of the maximum applicable sales charge, if any.
| MM202912-309770 | PAGE 1 | TSR-AR-ITGM3 |
The index or indexes shown above are unmanaged, cannot be purchased directly, and, with the exception of any peer group index, do not incur expenses.
AVERAGE ANNUAL TOTAL RETURNS (%) (as of September 30, 2024)
| | | |
| | 1 Year | 5 Year | 10 Year |
Service Class - without sales charge | 13.95 | 0.91 | 2.02 |
Bloomberg U.S. Aggregate Bond Index | 11.57 | 0.33 | 1.84 |
Performance results reflect any applicable waivers or expense limitations in effect during these periods, without which performance would have been lower. The investment return and principal value of shares of the Fund fluctuate, so your shares, when sold, may be worth more or less than their original cost. Current performance of the Fund may be lower or higher than the performance quoted. Performance data current to the most recent month-end may be obtained at https://www.massmutual.com/product-performance/mutual-funds or by calling 1-888-309-3539 or by sending an email request to fundinfo@massmutual.com.
WHAT ARE SOME KEY FUND STATISTICS? (as of September 30, 2024)
| |
Total Net Assets (Millions) | $1,035.1 |
Total Number of Portfolio Holdings (includes derivative positions, if any) | 447 |
Total Advisory Fees Paid During the Reporting Period | $2,544,115 |
Portfolio Turnover Rate | 248% |
WHAT DID THE FUND INVEST IN? (as of September 30, 2024)
Derivative values, if any, are excluded from the table(s) below.
| |
Portfolio Characteristics
(% of Total Investments) | |
Corporate Debt | 32.1% |
U.S. Government Agency Obligations and Instrumentalities | 26.1% |
Non-U.S. Government Agency Obligations | 17.4% |
Commercial Paper | 13.6% |
U.S. Treasury Obligations | 8.6% |
Investment of Cash Collateral from Securities Loaned | 1.1% |
Repurchase Agreement | 1.0% |
Sovereign Debt Obligations | 0.1% |
HOW HAS THE FUND CHANGED?
The following is a summary of certain changes to the Fund since October 1, 2023. For more complete information, you may review the Fund’s prospectus, including any applicable supplements, at https://www.massmutual.com/product-performance/mutual-funds or upon request at 1-888-309-3539 or fundinfo@massmutual.com.
| MM202912-309770 | PAGE 2 | TSR-AR-ITGM3 |
Effective February 1, 2024, the annual rate for administrative services for Class A shares of the Fund was reduced from 0.30% to 0.25%.
Effective February 1, 2024, MML Investment Advisers, LLC has agreed to cap the fees and expenses of the Fund (other than extraordinary legal and other expenses, Acquired Fund Fees and Expenses, interest expense, expenses related to borrowings, securities lending, leverage, taxes, and brokerage, short sale dividend and loan expense, or other non-recurring or unusual expenses such as organizational expenses and shareholder meeting expenses, as applicable) through January 31, 2025, to the extent that Total Annual Fund Operating Expenses after Expense Reimbursement would otherwise exceed 0.42%, 0.52%, 0.62%, 0.72%, 0.87%, 0.92%, 1.12%, and 0.52% for Classes I, R5, Service, Administrative, R4, A, R3, and Y, respectively.
On September 23, 2024, the MassMutual Strategic Bond Fund was merged into the Fund and shareholders of the MassMutual Strategic Bond Fund became shareholders of the Fund.
| |
| WHERE CAN I FIND ADDITIONAL INFORMATION ABOUT THE FUND? |
For additional information about the Fund, including its prospectus, financial information, holdings, and proxy voting information, scan the QR code or visit https://www.massmutual.com/product-performance/mutual-funds. |
| MM202912-309770 | PAGE 3 | TSR-AR-ITGM3 |
10000101491059910721106511168112389127731063810724122201000010294108291083610705118071263212518106911076012004
| | |
MassMutual Core Bond Fund | |
| Administrative Class | MCBLX |
| Annual Shareholder Report | September 30, 2024 |
This annual shareholder report contains important information about the MassMutual Core Bond Fund (the “Fund”) for the period of October 1, 2023 to September 30, 2024. You can find additional information about the Fund at https://www.massmutual.com/product-performance/mutual-funds. You can also request this information by contacting us at 1-888-309-3539 or by sending an email request to fundinfo@massmutual.com.
This report describes changes to the Fund that occurred during the reporting period.
WHAT WERE THE FUND COSTS FOR THE LAST YEAR?
This example shows the expenses you would have paid over the past year, based on a hypothetical $10,000 investment. This table reflects any applicable waivers or expense limitations.
| | |
Class Name | Costs of a $10,000 investment | Costs paid as a percentage of a $10,000 investment |
| Administrative Class | $78 | 0.73% |
HOW DID THE FUND PERFORM?
Global bond markets were broadly, and strongly, positive for the trailing one-year period. During the period, central banks responded to lower inflation data and began to lower policy interest rates, which was favorable for bond prices and returns. Macroeconomic sentiment centered, particularly more recently, on a soft-landing scenario in the U.S., providing a supportive credit risk environment. During the period, narrowing credit spreads were a positive return driver in the global bond market, in addition to the response to lower bond market yields. This resulted in broad gains across varied market sectors, including government bonds, investment grade and high yield corporate securities, mortgage- and asset-backed instruments, and emerging market issues.
Top contributors to the Fund’s performance relative to the Bloomberg U.S. Aggregate Bond Index:
• The corporate credit exposure, mainly investment grade, from issue selection
• Security selection and allocation to securitized assets, namely ABS, CMBS, and RMBS
Top detractors to the Fund’s performance relative to the Bloomberg U.S. Aggregate Bond Index:
• U.S. Treasury by virtue of the Fund being underweight and the sector gaining from lower interest rates
• Derivatives exposure mainly from U.S. Treasury futures to manage Fund duration
Performance shown is past performance and does not guarantee future results. The graph and table below do not reflect the deduction of taxes that a shareholder would pay on Fund distributions or redemption of Fund shares. The graph and table below assume reinvestment of dividends and capital gain distributions.
GROWTH OF A HYPOTHETICAL $10,000 INVESTMENT (October 1, 2014 through September 30, 2024)
This graph shows the performance of a hypothetical $10,000 investment in the share class noted over a ten-year period or since inception, if shorter, as compared to the performance of a broad-based securities market index, and, if applicable, one or more indexes that MML Investment Advisers, LLC believes more closely reflects the market segments in which the Fund invests or is a better comparison for the Fund’s investment strategy. This graph includes the deduction of the maximum applicable sales charge, if any.
| MM202912-309770 | PAGE 1 | TSR-AR-ITGM4 |
The index or indexes shown above are unmanaged, cannot be purchased directly, and, with the exception of any peer group index, do not incur expenses.
AVERAGE ANNUAL TOTAL RETURNS (%) (as of September 30, 2024)
| | | |
| | 1 Year | 5 Year | 10 Year |
Administrative Class - without sales charge | 13.82 | 0.78 | 1.92 |
Bloomberg U.S. Aggregate Bond Index | 11.57 | 0.33 | 1.84 |
Performance results reflect any applicable waivers or expense limitations in effect during these periods, without which performance would have been lower. The investment return and principal value of shares of the Fund fluctuate, so your shares, when sold, may be worth more or less than their original cost. Current performance of the Fund may be lower or higher than the performance quoted. Performance data current to the most recent month-end may be obtained at https://www.massmutual.com/product-performance/mutual-funds or by calling 1-888-309-3539 or by sending an email request to fundinfo@massmutual.com.
WHAT ARE SOME KEY FUND STATISTICS? (as of September 30, 2024)
| |
Total Net Assets (Millions) | $1,035.1 |
Total Number of Portfolio Holdings (includes derivative positions, if any) | 447 |
Total Advisory Fees Paid During the Reporting Period | $2,544,115 |
Portfolio Turnover Rate | 248% |
WHAT DID THE FUND INVEST IN? (as of September 30, 2024)
Derivative values, if any, are excluded from the table(s) below.
| |
Portfolio Characteristics
(% of Total Investments) | |
Corporate Debt | 32.1% |
U.S. Government Agency Obligations and Instrumentalities | 26.1% |
Non-U.S. Government Agency Obligations | 17.4% |
Commercial Paper | 13.6% |
U.S. Treasury Obligations | 8.6% |
Investment of Cash Collateral from Securities Loaned | 1.1% |
Repurchase Agreement | 1.0% |
Sovereign Debt Obligations | 0.1% |
HOW HAS THE FUND CHANGED?
The following is a summary of certain changes to the Fund since October 1, 2023. For more complete information, you may review the Fund’s prospectus, including any applicable supplements, at https://www.massmutual.com/product-performance/mutual-funds or upon request at 1-888-309-3539 or fundinfo@massmutual.com.
| MM202912-309770 | PAGE 2 | TSR-AR-ITGM4 |
Effective February 1, 2024, the annual rate for administrative services for Class A shares of the Fund was reduced from 0.30% to 0.25%.
Effective February 1, 2024, MML Investment Advisers, LLC has agreed to cap the fees and expenses of the Fund (other than extraordinary legal and other expenses, Acquired Fund Fees and Expenses, interest expense, expenses related to borrowings, securities lending, leverage, taxes, and brokerage, short sale dividend and loan expense, or other non-recurring or unusual expenses such as organizational expenses and shareholder meeting expenses, as applicable) through January 31, 2025, to the extent that Total Annual Fund Operating Expenses after Expense Reimbursement would otherwise exceed 0.42%, 0.52%, 0.62%, 0.72%, 0.87%, 0.92%, 1.12%, and 0.52% for Classes I, R5, Service, Administrative, R4, A, R3, and Y, respectively.
On September 23, 2024, the MassMutual Strategic Bond Fund was merged into the Fund and shareholders of the MassMutual Strategic Bond Fund became shareholders of the Fund.
| |
| WHERE CAN I FIND ADDITIONAL INFORMATION ABOUT THE FUND? |
For additional information about the Fund, including its prospectus, financial information, holdings, and proxy voting information, scan the QR code or visit https://www.massmutual.com/product-performance/mutual-funds. |
| MM202912-309770 | PAGE 3 | TSR-AR-ITGM4 |
10000101381057310680106051162812319126851056010635120911000010294108291083610705118071263212518106911076012004
| | |
MassMutual Core Bond Fund | |
| Class R4 | MCZRX |
| Annual Shareholder Report | September 30, 2024 |
This annual shareholder report contains important information about the MassMutual Core Bond Fund (the “Fund”) for the period of October 1, 2023 to September 30, 2024. You can find additional information about the Fund at https://www.massmutual.com/product-performance/mutual-funds. You can also request this information by contacting us at 1-888-309-3539 or by sending an email request to fundinfo@massmutual.com.
This report describes changes to the Fund that occurred during the reporting period.
WHAT WERE THE FUND COSTS FOR THE LAST YEAR?
This example shows the expenses you would have paid over the past year, based on a hypothetical $10,000 investment. This table reflects any applicable waivers or expense limitations.
| | |
Class Name | Costs of a $10,000 investment | Costs paid as a percentage of a $10,000 investment |
| Class R4 | $94 | 0.88% |
HOW DID THE FUND PERFORM?
Global bond markets were broadly, and strongly, positive for the trailing one-year period. During the period, central banks responded to lower inflation data and began to lower policy interest rates, which was favorable for bond prices and returns. Macroeconomic sentiment centered, particularly more recently, on a soft-landing scenario in the U.S., providing a supportive credit risk environment. During the period, narrowing credit spreads were a positive return driver in the global bond market, in addition to the response to lower bond market yields. This resulted in broad gains across varied market sectors, including government bonds, investment grade and high yield corporate securities, mortgage- and asset-backed instruments, and emerging market issues.
Top contributors to the Fund’s performance relative to the Bloomberg U.S. Aggregate Bond Index:
• The corporate credit exposure, mainly investment grade, from issue selection
• Security selection and allocation to securitized assets, namely ABS, CMBS, and RMBS
Top detractors to the Fund’s performance relative to the Bloomberg U.S. Aggregate Bond Index:
• U.S. Treasury by virtue of the Fund being underweight and the sector gaining from lower interest rates
• Derivatives exposure mainly from U.S. Treasury futures to manage Fund duration
Performance shown is past performance and does not guarantee future results. The graph and table below do not reflect the deduction of taxes that a shareholder would pay on Fund distributions or redemption of Fund shares. The graph and table below assume reinvestment of dividends and capital gain distributions.
GROWTH OF A HYPOTHETICAL $10,000 INVESTMENT (October 1, 2014 through September 30, 2024)
This graph shows the performance of a hypothetical $10,000 investment in the share class noted over a ten-year period or since inception, if shorter, as compared to the performance of a broad-based securities market index, and, if applicable, one or more indexes that MML Investment Advisers, LLC believes more closely reflects the market segments in which the Fund invests or is a better comparison for the Fund’s investment strategy. This graph includes the deduction of the maximum applicable sales charge, if any.
| MM202912-309770 | PAGE 1 | TSR-AR-ITGMK |
The index or indexes shown above are unmanaged, cannot be purchased directly, and, with the exception of any peer group index, do not incur expenses.
AVERAGE ANNUAL TOTAL RETURNS (%) (as of September 30, 2024)
| | | |
| | 1 Year | 5 Year | 10 Year |
Class R4 - without sales charge | 13.63 | 0.65 | 1.78 |
Bloomberg U.S. Aggregate Bond Index | 11.57 | 0.33 | 1.84 |
Performance results reflect any applicable waivers or expense limitations in effect during these periods, without which performance would have been lower. The investment return and principal value of shares of the Fund fluctuate, so your shares, when sold, may be worth more or less than their original cost. Current performance of the Fund may be lower or higher than the performance quoted. Performance data current to the most recent month-end may be obtained at https://www.massmutual.com/product-performance/mutual-funds or by calling 1-888-309-3539 or by sending an email request to fundinfo@massmutual.com.
WHAT ARE SOME KEY FUND STATISTICS? (as of September 30, 2024)
| |
Total Net Assets (Millions) | $1,035.1 |
Total Number of Portfolio Holdings (includes derivative positions, if any) | 447 |
Total Advisory Fees Paid During the Reporting Period | $2,544,115 |
Portfolio Turnover Rate | 248% |
WHAT DID THE FUND INVEST IN? (as of September 30, 2024)
Derivative values, if any, are excluded from the table(s) below.
| |
Portfolio Characteristics
(% of Total Investments) | |
Corporate Debt | 32.1% |
U.S. Government Agency Obligations and Instrumentalities | 26.1% |
Non-U.S. Government Agency Obligations | 17.4% |
Commercial Paper | 13.6% |
U.S. Treasury Obligations | 8.6% |
Investment of Cash Collateral from Securities Loaned | 1.1% |
Repurchase Agreement | 1.0% |
Sovereign Debt Obligations | 0.1% |
HOW HAS THE FUND CHANGED?
The following is a summary of certain changes to the Fund since October 1, 2023. For more complete information, you may review the Fund’s prospectus, including any applicable supplements, at https://www.massmutual.com/product-performance/mutual-funds or upon request at 1-888-309-3539 or fundinfo@massmutual.com.
| MM202912-309770 | PAGE 2 | TSR-AR-ITGMK |
Effective February 1, 2024, the annual rate for administrative services for Class A shares of the Fund was reduced from 0.30% to 0.25%.
Effective February 1, 2024, MML Investment Advisers, LLC has agreed to cap the fees and expenses of the Fund (other than extraordinary legal and other expenses, Acquired Fund Fees and Expenses, interest expense, expenses related to borrowings, securities lending, leverage, taxes, and brokerage, short sale dividend and loan expense, or other non-recurring or unusual expenses such as organizational expenses and shareholder meeting expenses, as applicable) through January 31, 2025, to the extent that Total Annual Fund Operating Expenses after Expense Reimbursement would otherwise exceed 0.42%, 0.52%, 0.62%, 0.72%, 0.87%, 0.92%, 1.12%, and 0.52% for Classes I, R5, Service, Administrative, R4, A, R3, and Y, respectively.
On September 23, 2024, the MassMutual Strategic Bond Fund was merged into the Fund and shareholders of the MassMutual Strategic Bond Fund became shareholders of the Fund.
| |
| WHERE CAN I FIND ADDITIONAL INFORMATION ABOUT THE FUND? |
For additional information about the Fund, including its prospectus, financial information, holdings, and proxy voting information, scan the QR code or visit https://www.massmutual.com/product-performance/mutual-funds. |
| MM202912-309770 | PAGE 3 | TSR-AR-ITGMK |
10000101281055210641105471154512215125591043410494119241000010294108291083610705118071263212518106911076012004
| | |
MassMutual Core Bond Fund | |
| Class A | MMCBX |
| Annual Shareholder Report | September 30, 2024 |
This annual shareholder report contains important information about the MassMutual Core Bond Fund (the “Fund”) for the period of October 1, 2023 to September 30, 2024. You can find additional information about the Fund at https://www.massmutual.com/product-performance/mutual-funds. You can also request this information by contacting us at 1-888-309-3539 or by sending an email request to fundinfo@massmutual.com.
This report describes changes to the Fund that occurred during the reporting period.
WHAT WERE THE FUND COSTS FOR THE LAST YEAR?
This example shows the expenses you would have paid over the past year, based on a hypothetical $10,000 investment. This table reflects any applicable waivers or expense limitations.
| | |
Class Name | Costs of a $10,000 investment | Costs paid as a percentage of a $10,000 investment |
| Class A | $101 | 0.95% |
HOW DID THE FUND PERFORM?
Global bond markets were broadly, and strongly, positive for the trailing one-year period. During the period, central banks responded to lower inflation data and began to lower policy interest rates, which was favorable for bond prices and returns. Macroeconomic sentiment centered, particularly more recently, on a soft-landing scenario in the U.S., providing a supportive credit risk environment. During the period, narrowing credit spreads were a positive return driver in the global bond market, in addition to the response to lower bond market yields. This resulted in broad gains across varied market sectors, including government bonds, investment grade and high yield corporate securities, mortgage- and asset-backed instruments, and emerging market issues.
Top contributors to the Fund’s performance relative to the Bloomberg U.S. Aggregate Bond Index:
• The corporate credit exposure, mainly investment grade, from issue selection
• Security selection and allocation to securitized assets, namely ABS, CMBS, and RMBS
Top detractors to the Fund’s performance relative to the Bloomberg U.S. Aggregate Bond Index:
• U.S. Treasury by virtue of the Fund being underweight and the sector gaining from lower interest rates
• Derivatives exposure mainly from U.S. Treasury futures to manage Fund duration
Performance shown is past performance and does not guarantee future results. The graph and table below do not reflect the deduction of taxes that a shareholder would pay on Fund distributions or redemption of Fund shares. The graph and table below assume reinvestment of dividends and capital gain distributions.
GROWTH OF A HYPOTHETICAL $10,000 INVESTMENT (October 1, 2014 through September 30, 2024)
This graph shows the performance of a hypothetical $10,000 investment in the share class noted over a ten-year period or since inception, if shorter, as compared to the performance of a broad-based securities market index, and, if applicable, one or more indexes that MML Investment Advisers, LLC believes more closely reflects the market segments in which the Fund invests or is a better comparison for the Fund’s investment strategy. This graph includes the deduction of the maximum applicable sales charge, if any.
| MM202912-309770 | PAGE 1 | TSR-AR-ITGM2 |
The index or indexes shown above are unmanaged, cannot be purchased directly, and, with the exception of any peer group index, do not incur expenses.
AVERAGE ANNUAL TOTAL RETURNS (%) (as of September 30, 2024)
| | | |
| | 1 Year | 5 Year | 10 Year |
Class A - without sales charge | 13.57 | 0.55 | 1.67 |
Class A - with maximum sales charge | 8.74 | -0.32 | 1.23 |
Bloomberg U.S. Aggregate Bond Index | 11.57 | 0.33 | 1.84 |
Performance results reflect any applicable waivers or expense limitations in effect during these periods, without which performance would have been lower. The investment return and principal value of shares of the Fund fluctuate, so your shares, when sold, may be worth more or less than their original cost. Current performance of the Fund may be lower or higher than the performance quoted. Performance data current to the most recent month-end may be obtained at https://www.massmutual.com/product-performance/mutual-funds or by calling 1-888-309-3539 or by sending an email request to fundinfo@massmutual.com.
WHAT ARE SOME KEY FUND STATISTICS? (as of September 30, 2024)
| |
Total Net Assets (Millions) | $1,035.1 |
Total Number of Portfolio Holdings (includes derivative positions, if any) | 447 |
Total Advisory Fees Paid During the Reporting Period | $2,544,115 |
Portfolio Turnover Rate | 248% |
WHAT DID THE FUND INVEST IN? (as of September 30, 2024)
Derivative values, if any, are excluded from the table(s) below.
| |
Portfolio Characteristics
(% of Total Investments) | |
Corporate Debt | 32.1% |
U.S. Government Agency Obligations and Instrumentalities | 26.1% |
Non-U.S. Government Agency Obligations | 17.4% |
Commercial Paper | 13.6% |
U.S. Treasury Obligations | 8.6% |
Investment of Cash Collateral from Securities Loaned | 1.1% |
Repurchase Agreement | 1.0% |
Sovereign Debt Obligations | 0.1% |
HOW HAS THE FUND CHANGED?
The following is a summary of certain changes to the Fund since October 1, 2023. For more complete information, you may review the Fund’s prospectus, including any applicable supplements, at https://www.massmutual.com/product-performance/mutual-funds or upon request at 1-888-309-3539 or fundinfo@massmutual.com.
| MM202912-309770 | PAGE 2 | TSR-AR-ITGM2 |
Effective February 1, 2024, the annual rate for administrative services for Class A shares of the Fund was reduced from 0.30% to 0.25%.
Effective February 1, 2024, MML Investment Advisers, LLC has agreed to cap the fees and expenses of the Fund (other than extraordinary legal and other expenses, Acquired Fund Fees and Expenses, interest expense, expenses related to borrowings, securities lending, leverage, taxes, and brokerage, short sale dividend and loan expense, or other non-recurring or unusual expenses such as organizational expenses and shareholder meeting expenses, as applicable) through January 31, 2025, to the extent that Total Annual Fund Operating Expenses after Expense Reimbursement would otherwise exceed 0.42%, 0.52%, 0.62%, 0.72%, 0.87%, 0.92%, 1.12%, and 0.52% for Classes I, R5, Service, Administrative, R4, A, R3, and Y, respectively.
On September 23, 2024, the MassMutual Strategic Bond Fund was merged into the Fund and shareholders of the MassMutual Strategic Bond Fund became shareholders of the Fund.
| |
| WHERE CAN I FIND ADDITIONAL INFORMATION ABOUT THE FUND? |
For additional information about the Fund, including its prospectus, financial information, holdings, and proxy voting information, scan the QR code or visit https://www.massmutual.com/product-performance/mutual-funds. |
| MM202912-309770 | PAGE 3 | TSR-AR-ITGM2 |
9575968210080101581005610994116201193499179951113011000010294108291083610705118071263212518106911076012004
| | |
MassMutual Core Bond Fund | |
| Class R3 | MCBNX |
| Annual Shareholder Report | September 30, 2024 |
This annual shareholder report contains important information about the MassMutual Core Bond Fund (the “Fund”) for the period of October 1, 2023 to September 30, 2024. You can find additional information about the Fund at https://www.massmutual.com/product-performance/mutual-funds. You can also request this information by contacting us at 1-888-309-3539 or by sending an email request to fundinfo@massmutual.com.
This report describes changes to the Fund that occurred during the reporting period.
WHAT WERE THE FUND COSTS FOR THE LAST YEAR?
This example shows the expenses you would have paid over the past year, based on a hypothetical $10,000 investment. This table reflects any applicable waivers or expense limitations.
| | |
Class Name | Costs of a $10,000 investment | Costs paid as a percentage of a $10,000 investment |
| Class R3 | $121 | 1.13% |
HOW DID THE FUND PERFORM?
Global bond markets were broadly, and strongly, positive for the trailing one-year period. During the period, central banks responded to lower inflation data and began to lower policy interest rates, which was favorable for bond prices and returns. Macroeconomic sentiment centered, particularly more recently, on a soft-landing scenario in the U.S., providing a supportive credit risk environment. During the period, narrowing credit spreads were a positive return driver in the global bond market, in addition to the response to lower bond market yields. This resulted in broad gains across varied market sectors, including government bonds, investment grade and high yield corporate securities, mortgage- and asset-backed instruments, and emerging market issues.
Top contributors to the Fund’s performance relative to the Bloomberg U.S. Aggregate Bond Index:
• The corporate credit exposure, mainly investment grade, from issue selection
• Security selection and allocation to securitized assets, namely ABS, CMBS, and RMBS
Top detractors to the Fund’s performance relative to the Bloomberg U.S. Aggregate Bond Index:
• U.S. Treasury by virtue of the Fund being underweight and the sector gaining from lower interest rates
• Derivatives exposure mainly from U.S. Treasury futures to manage Fund duration
Performance shown is past performance and does not guarantee future results. The graph and table below do not reflect the deduction of taxes that a shareholder would pay on Fund distributions or redemption of Fund shares. The graph and table below assume reinvestment of dividends and capital gain distributions.
GROWTH OF A HYPOTHETICAL $10,000 INVESTMENT (October 1, 2014 through September 30, 2024)
This graph shows the performance of a hypothetical $10,000 investment in the share class noted over a ten-year period or since inception, if shorter, as compared to the performance of a broad-based securities market index, and, if applicable, one or more indexes that MML Investment Advisers, LLC believes more closely reflects the market segments in which the Fund invests or is a better comparison for the Fund’s investment strategy. This graph includes the deduction of the maximum applicable sales charge, if any.
| MM202912-309770 | PAGE 1 | TSR-AR-ITGM5 |
The index or indexes shown above are unmanaged, cannot be purchased directly, and, with the exception of any peer group index, do not incur expenses.
AVERAGE ANNUAL TOTAL RETURNS (%) (as of September 30, 2024)
| | | |
| | 1 Year | 5 Year | 10 Year |
Class R3 - without sales charge | 14.06 | 0.52 | 1.59 |
Bloomberg U.S. Aggregate Bond Index | 11.57 | 0.33 | 1.84 |
Performance results reflect any applicable waivers or expense limitations in effect during these periods, without which performance would have been lower. The investment return and principal value of shares of the Fund fluctuate, so your shares, when sold, may be worth more or less than their original cost. Current performance of the Fund may be lower or higher than the performance quoted. Performance data current to the most recent month-end may be obtained at https://www.massmutual.com/product-performance/mutual-funds or by calling 1-888-309-3539 or by sending an email request to fundinfo@massmutual.com.
WHAT ARE SOME KEY FUND STATISTICS? (as of September 30, 2024)
| |
Total Net Assets (Millions) | $1,035.1 |
Total Number of Portfolio Holdings (includes derivative positions, if any) | 447 |
Total Advisory Fees Paid During the Reporting Period | $2,544,115 |
Portfolio Turnover Rate | 248% |
WHAT DID THE FUND INVEST IN? (as of September 30, 2024)
Derivative values, if any, are excluded from the table(s) below.
| |
Portfolio Characteristics
(% of Total Investments) | |
Corporate Debt | 32.1% |
U.S. Government Agency Obligations and Instrumentalities | 26.1% |
Non-U.S. Government Agency Obligations | 17.4% |
Commercial Paper | 13.6% |
U.S. Treasury Obligations | 8.6% |
Investment of Cash Collateral from Securities Loaned | 1.1% |
Repurchase Agreement | 1.0% |
Sovereign Debt Obligations | 0.1% |
HOW HAS THE FUND CHANGED?
The following is a summary of certain changes to the Fund since October 1, 2023. For more complete information, you may review the Fund’s prospectus, including any applicable supplements, at https://www.massmutual.com/product-performance/mutual-funds or upon request at 1-888-309-3539 or fundinfo@massmutual.com.
| MM202912-309770 | PAGE 2 | TSR-AR-ITGM5 |
Effective February 1, 2024, the annual rate for administrative services for Class A shares of the Fund was reduced from 0.30% to 0.25%.
Effective February 1, 2024, MML Investment Advisers, LLC has agreed to cap the fees and expenses of the Fund (other than extraordinary legal and other expenses, Acquired Fund Fees and Expenses, interest expense, expenses related to borrowings, securities lending, leverage, taxes, and brokerage, short sale dividend and loan expense, or other non-recurring or unusual expenses such as organizational expenses and shareholder meeting expenses, as applicable) through January 31, 2025, to the extent that Total Annual Fund Operating Expenses after Expense Reimbursement would otherwise exceed 0.42%, 0.52%, 0.62%, 0.72%, 0.87%, 0.92%, 1.12%, and 0.52% for Classes I, R5, Service, Administrative, R4, A, R3, and Y, respectively.
On September 23, 2024, the MassMutual Strategic Bond Fund was merged into the Fund and shareholders of the MassMutual Strategic Bond Fund became shareholders of the Fund.
| |
| WHERE CAN I FIND ADDITIONAL INFORMATION ABOUT THE FUND? |
For additional information about the Fund, including its prospectus, financial information, holdings, and proxy voting information, scan the QR code or visit https://www.massmutual.com/product-performance/mutual-funds. |
| MM202912-309770 | PAGE 3 | TSR-AR-ITGM5 |
10000101021049410562104431140712039123451024010264117071000010294108291083610705118071263212518106911076012004
| | |
MassMutual Core Bond Fund | |
| Class Y | MMNWX |
| Annual Shareholder Report | September 30, 2024 |
This annual shareholder report contains important information about the MassMutual Core Bond Fund (the “Fund”) for the period of October 1, 2023 to September 30, 2024. You can find additional information about the Fund at https://www.massmutual.com/product-performance/mutual-funds. You can also request this information by contacting us at 1-888-309-3539 or by sending an email request to fundinfo@massmutual.com.
This report describes changes to the Fund that occurred during the reporting period.
WHAT WERE THE FUND COSTS FOR THE LAST YEAR?
This example shows the expenses you would have paid over the past year, based on a hypothetical $10,000 investment. This table reflects any applicable waivers or expense limitations.
| | |
Class Name | Costs of a $10,000 investment | Costs paid as a percentage of a $10,000 investment |
| Class Y | $57 | 0.53% |
HOW DID THE FUND PERFORM?
Global bond markets were broadly, and strongly, positive for the trailing one-year period. During the period, central banks responded to lower inflation data and began to lower policy interest rates, which was favorable for bond prices and returns. Macroeconomic sentiment centered, particularly more recently, on a soft-landing scenario in the U.S., providing a supportive credit risk environment. During the period, narrowing credit spreads were a positive return driver in the global bond market, in addition to the response to lower bond market yields. This resulted in broad gains across varied market sectors, including government bonds, investment grade and high yield corporate securities, mortgage- and asset-backed instruments, and emerging market issues.
Top contributors to the Fund’s performance relative to the Bloomberg U.S. Aggregate Bond Index:
• The corporate credit exposure, mainly investment grade, from issue selection
• Security selection and allocation to securitized assets, namely ABS, CMBS, and RMBS
Top detractors to the Fund’s performance relative to the Bloomberg U.S. Aggregate Bond Index:
• U.S. Treasury by virtue of the Fund being underweight and the sector gaining from lower interest rates
• Derivatives exposure mainly from U.S. Treasury futures to manage Fund duration
Performance shown is past performance and does not guarantee future results. The graph and table below do not reflect the deduction of taxes that a shareholder would pay on Fund distributions or redemption of Fund shares. The graph and table below assume reinvestment of dividends and capital gain distributions.
GROWTH OF A HYPOTHETICAL $10,000 INVESTMENT (February 1, 2023 through September 30, 2024)
This graph shows the performance of a hypothetical $10,000 investment in the share class noted over a ten-year period or since inception, if shorter, as compared to the performance of a broad-based securities market index, and, if applicable, one or more indexes that MML Investment Advisers, LLC believes more closely reflects the market segments in which the Fund invests or is a better comparison for the Fund’s investment strategy. This graph includes the deduction of the maximum applicable sales charge, if any.
| MM202912-309770 | PAGE 1 | TSR-AR-ITGMY |
The index or indexes shown above are unmanaged, cannot be purchased directly, and, with the exception of any peer group index, do not incur expenses.
AVERAGE ANNUAL TOTAL RETURNS (%) (as of September 30, 2024)
| | |
| | 1 Year | Since Inception
(02/01/2023) |
Class Y - without sales charge | 14.03 | 4.98 |
Bloomberg U.S. Aggregate Bond Index | 11.57 | 4.11 |
Performance results reflect any applicable waivers or expense limitations in effect during these periods, without which performance would have been lower. The investment return and principal value of shares of the Fund fluctuate, so your shares, when sold, may be worth more or less than their original cost. Current performance of the Fund may be lower or higher than the performance quoted. Performance data current to the most recent month-end may be obtained at https://www.massmutual.com/product-performance/mutual-funds or by calling 1-888-309-3539 or by sending an email request to fundinfo@massmutual.com.
WHAT ARE SOME KEY FUND STATISTICS? (as of September 30, 2024)
| |
Total Net Assets (Millions) | $1,035.1 |
Total Number of Portfolio Holdings (includes derivative positions, if any) | 447 |
Total Advisory Fees Paid During the Reporting Period | $2,544,115 |
Portfolio Turnover Rate | 248% |
WHAT DID THE FUND INVEST IN? (as of September 30, 2024)
Derivative values, if any, are excluded from the table(s) below.
| |
Portfolio Characteristics
(% of Total Investments) | |
Corporate Debt | 32.1% |
U.S. Government Agency Obligations and Instrumentalities | 26.1% |
Non-U.S. Government Agency Obligations | 17.4% |
Commercial Paper | 13.6% |
U.S. Treasury Obligations | 8.6% |
Investment of Cash Collateral from Securities Loaned | 1.1% |
Repurchase Agreement | 1.0% |
Sovereign Debt Obligations | 0.1% |
HOW HAS THE FUND CHANGED?
The following is a summary of certain changes to the Fund since October 1, 2023. For more complete information, you may review the Fund’s prospectus, including any applicable supplements, at https://www.massmutual.com/product-performance/mutual-funds or upon request at 1-888-309-3539 or fundinfo@massmutual.com.
| MM202912-309770 | PAGE 2 | TSR-AR-ITGMY |
Effective February 1, 2024, the annual rate for administrative services for Class A shares of the Fund was reduced from 0.30% to 0.25%.
Effective February 1, 2024, MML Investment Advisers, LLC has agreed to cap the fees and expenses of the Fund (other than extraordinary legal and other expenses, Acquired Fund Fees and Expenses, interest expense, expenses related to borrowings, securities lending, leverage, taxes, and brokerage, short sale dividend and loan expense, or other non-recurring or unusual expenses such as organizational expenses and shareholder meeting expenses, as applicable) through January 31, 2025, to the extent that Total Annual Fund Operating Expenses after Expense Reimbursement would otherwise exceed 0.42%, 0.52%, 0.62%, 0.72%, 0.87%, 0.92%, 1.12%, and 0.52% for Classes I, R5, Service, Administrative, R4, A, R3, and Y, respectively.
On September 23, 2024, the MassMutual Strategic Bond Fund was merged into the Fund and shareholders of the MassMutual Strategic Bond Fund became shareholders of the Fund.
| |
| WHERE CAN I FIND ADDITIONAL INFORMATION ABOUT THE FUND? |
For additional information about the Fund, including its prospectus, financial information, holdings, and proxy voting information, scan the QR code or visit https://www.massmutual.com/product-performance/mutual-funds. |
| MM202912-309770 | PAGE 3 | TSR-AR-ITGMY |
1000095071084110000951910621
| | |
MassMutual Diversified Bond Fund | |
| Class I | MDBZX |
| Annual Shareholder Report | September 30, 2024 |
This annual shareholder report contains important information about the MassMutual Diversified Bond Fund (the “Fund”) for the period of October 1, 2023 to September 30, 2024. You can find additional information about the Fund at https://www.massmutual.com/product-performance/mutual-funds. You can also request this information by contacting us at 1-888-309-3539 or by sending an email request to fundinfo@massmutual.com.
This report describes changes to the Fund that occurred during the reporting period.
WHAT WERE THE FUND COSTS FOR THE LAST YEAR?
This example shows the expenses you would have paid over the past year, based on a hypothetical $10,000 investment. This table reflects any applicable waivers or expense limitations.
| | |
Class Name | Costs of a $10,000 investment | Costs paid as a percentage of a $10,000 investment |
| Class I | $69 | 0.64% |
HOW DID THE FUND PERFORM?
Global bond markets were broadly, and strongly, positive for the trailing one-year period. During the period, central banks responded to lower inflation data and began to lower policy interest rates, which was favorable for bond prices and returns. Macroeconomic sentiment centered, particularly more recently, on a soft-landing scenario in the U.S., providing a supportive credit risk environment. During the period, narrowing credit spreads were a positive return driver in the global bond market, in addition to the response to lower bond market yields. This resulted in broad gains across varied market sectors, including government bonds, investment grade and high yield corporate securities, mortgage- and asset-backed instruments, and emerging market issues.
Top contributors to the Fund’s performance relative to the Bloomberg U.S. Aggregate Bond Index:
• The corporate credit exposure was favorable from issue selection across investment grade and high yield bonds
• Security selection and allocation to securitized assets, namely ABS and CMBS
Top detractors to the Fund’s performance relative to the Bloomberg U.S. Aggregate Bond Index:
• U.S. Treasury had an indirect allocation effect by virtue of the Fund being underweight and the sector gaining from lower interest rates
• Relatively lower allocation to Agency MBS as the sector performed well
• Derivatives exposure mainly from U.S. Treasury futures to manage Fund duration
| MM202912-309770 | PAGE 1 | TSR-AR-ITGL6 |
Performance shown is past performance and does not guarantee future results. The graph and table below do not reflect the deduction of taxes that a shareholder would pay on Fund distributions or redemption of Fund shares. The graph and table below assume reinvestment of dividends and capital gain distributions.
GROWTH OF A HYPOTHETICAL $10,000 INVESTMENT (October 1, 2014 through September 30, 2024)
This graph shows the performance of a hypothetical $10,000 investment in the share class noted over a ten-year period or since inception, if shorter, as compared to the performance of a broad-based securities market index, and, if applicable, one or more indexes that MML Investment Advisers, LLC believes more closely reflects the market segments in which the Fund invests or is a better comparison for the Fund’s investment strategy. This graph includes the deduction of the maximum applicable sales charge, if any.
The index or indexes shown above are unmanaged, cannot be purchased directly, and, with the exception of any peer group index, do not incur expenses.
AVERAGE ANNUAL TOTAL RETURNS (%) (as of September 30, 2024)
| | | |
| | 1 Year | 5 Year | 10 Year |
Class I - without sales charge | 14.13 | 1.10 | 2.32 |
Bloomberg U.S. Aggregate Bond Index | 11.57 | 0.33 | 1.84 |
Performance results reflect any applicable waivers or expense limitations in effect during these periods, without which performance would have been lower. The investment return and principal value of shares of the Fund fluctuate, so your shares, when sold, may be worth more or less than their original cost. Current performance of the Fund may be lower or higher than the performance quoted. Performance data current to the most recent month-end may be obtained at https://www.massmutual.com/product-performance/mutual-funds or by calling 1-888-309-3539 or by sending an email request to fundinfo@massmutual.com.
WHAT ARE SOME KEY FUND STATISTICS? (as of September 30, 2024)
| |
Total Net Assets (Millions) | $134.7 |
Total Number of Portfolio Holdings (includes derivative positions, if any) | 406 |
Total Advisory Fees Paid During the Reporting Period | $528,588 |
Portfolio Turnover Rate | 153% |
| MM202912-309770 | PAGE 2 | TSR-AR-ITGL6 |
WHAT DID THE FUND INVEST IN? (as of September 30, 2024)
Derivative values, if any, are excluded from the table(s) below.
| |
Portfolio Characteristics
(% of Total Investments) | |
Corporate Debt | 37.7% |
Non-U.S. Government Agency Obligations | 22.5% |
U.S. Government Agency Obligations and Instrumentalities | 20.9% |
Commercial Paper | 11.3% |
U.S. Treasury Obligations | 3.4% |
Investment of Cash Collateral from Securities Loaned | 2.8% |
Repurchase Agreement | 1.3% |
Sovereign Debt Obligations | 0.1% |
Warrants | 0.0% |
| |
Largest Countries
(% of Total Investments) | |
United States | 68.1% |
Cayman Islands | 6.7% |
United Kingdom | 2.5% |
Canada | 1.8% |
France | 1.5% |
Bermuda | 1.1% |
Germany | 0.8% |
Australia | 0.5% |
Netherlands | 0.4% |
Ireland | 0.4% |
HOW HAS THE FUND CHANGED?
The following is a summary of certain changes to the Fund since October 1, 2023. For more complete information, you may review the Fund’s prospectus, including any applicable supplements, at https://www.massmutual.com/product-performance/mutual-funds or upon request at 1-888-309-3539 or fundinfo@massmutual.com.
Effective February 1, 2024, the annual rate for administrative services for Class A shares of the Fund was reduced from 0.30% to 0.25%.
Effective July 1, 2024, MML Investment Advisers, LLC has agreed to cap the fees and expenses of the Fund (other than extraordinary legal and other expenses, Acquired Fund Fees and Expenses, interest expense, expenses related to borrowings, securities lending, leverage, taxes, and brokerage, short sale dividend and loan expense, or other non-recurring or unusual expenses such as organizational expenses and shareholder meeting expenses, as applicable) through January 31, 2026, to the extent that Total Annual Fund Operating Expenses after Expense Reimbursement would otherwise exceed 0.59%, 0.69%, 0.79%, 0.89%, 1.04%, 1.09%, 1.29%, and 0.69% for Classes I, R5, Service, Administrative, R4, A, R3, and Y, respectively.
| |
| WHERE CAN I FIND ADDITIONAL INFORMATION ABOUT THE FUND? |
For additional information about the Fund, including its prospectus, financial information, holdings, and proxy voting information, scan the QR code or visit https://www.massmutual.com/product-performance/mutual-funds. |
| MM202912-309770 | PAGE 3 | TSR-AR-ITGL6 |
10000100811065610886108161190712553132931089911022125801000010294108291083610705118071263212518106911076012004
| | |
MassMutual Diversified Bond Fund | |
| Class R5 | MDBSX |
| Annual Shareholder Report | September 30, 2024 |
This annual shareholder report contains important information about the MassMutual Diversified Bond Fund (the “Fund”) for the period of October 1, 2023 to September 30, 2024. You can find additional information about the Fund at https://www.massmutual.com/product-performance/mutual-funds. You can also request this information by contacting us at 1-888-309-3539 or by sending an email request to fundinfo@massmutual.com.
This report describes changes to the Fund that occurred during the reporting period.
WHAT WERE THE FUND COSTS FOR THE LAST YEAR?
This example shows the expenses you would have paid over the past year, based on a hypothetical $10,000 investment. This table reflects any applicable waivers or expense limitations.
| | |
Class Name | Costs of a $10,000 investment | Costs paid as a percentage of a $10,000 investment |
| Class R5 | $79 | 0.74% |
HOW DID THE FUND PERFORM?
Global bond markets were broadly, and strongly, positive for the trailing one-year period. During the period, central banks responded to lower inflation data and began to lower policy interest rates, which was favorable for bond prices and returns. Macroeconomic sentiment centered, particularly more recently, on a soft-landing scenario in the U.S., providing a supportive credit risk environment. During the period, narrowing credit spreads were a positive return driver in the global bond market, in addition to the response to lower bond market yields. This resulted in broad gains across varied market sectors, including government bonds, investment grade and high yield corporate securities, mortgage- and asset-backed instruments, and emerging market issues.
Top contributors to the Fund’s performance relative to the Bloomberg U.S. Aggregate Bond Index:
• The corporate credit exposure was favorable from issue selection across investment grade and high yield bonds
• Security selection and allocation to securitized assets, namely ABS and CMBS
Top detractors to the Fund’s performance relative to the Bloomberg U.S. Aggregate Bond Index:
• U.S. Treasury had an indirect allocation effect by virtue of the Fund being underweight and the sector gaining from lower interest rates
• Relatively lower allocation to Agency MBS as the sector performed well
• Derivatives exposure mainly from U.S. Treasury futures to manage Fund duration
| MM202912-309770 | PAGE 1 | TSR-AR-ITGL1 |
Performance shown is past performance and does not guarantee future results. The graph and table below do not reflect the deduction of taxes that a shareholder would pay on Fund distributions or redemption of Fund shares. The graph and table below assume reinvestment of dividends and capital gain distributions.
GROWTH OF A HYPOTHETICAL $10,000 INVESTMENT (October 1, 2014 through September 30, 2024)
This graph shows the performance of a hypothetical $10,000 investment in the share class noted over a ten-year period or since inception, if shorter, as compared to the performance of a broad-based securities market index, and, if applicable, one or more indexes that MML Investment Advisers, LLC believes more closely reflects the market segments in which the Fund invests or is a better comparison for the Fund’s investment strategy. This graph includes the deduction of the maximum applicable sales charge, if any.
The index or indexes shown above are unmanaged, cannot be purchased directly, and, with the exception of any peer group index, do not incur expenses.
AVERAGE ANNUAL TOTAL RETURNS (%) (as of September 30, 2024)
| | | |
| | 1 Year | 5 Year | 10 Year |
Class R5 - without sales charge | 14.03 | 1.01 | 2.22 |
Bloomberg U.S. Aggregate Bond Index | 11.57 | 0.33 | 1.84 |
Performance results reflect any applicable waivers or expense limitations in effect during these periods, without which performance would have been lower. The investment return and principal value of shares of the Fund fluctuate, so your shares, when sold, may be worth more or less than their original cost. Current performance of the Fund may be lower or higher than the performance quoted. Performance data current to the most recent month-end may be obtained at https://www.massmutual.com/product-performance/mutual-funds or by calling 1-888-309-3539 or by sending an email request to fundinfo@massmutual.com.
WHAT ARE SOME KEY FUND STATISTICS? (as of September 30, 2024)
| |
Total Net Assets (Millions) | $134.7 |
Total Number of Portfolio Holdings (includes derivative positions, if any) | 406 |
Total Advisory Fees Paid During the Reporting Period | $528,588 |
Portfolio Turnover Rate | 153% |
| MM202912-309770 | PAGE 2 | TSR-AR-ITGL1 |
WHAT DID THE FUND INVEST IN? (as of September 30, 2024)
Derivative values, if any, are excluded from the table(s) below.
| |
Portfolio Characteristics
(% of Total Investments) | |
Corporate Debt | 37.7% |
Non-U.S. Government Agency Obligations | 22.5% |
U.S. Government Agency Obligations and Instrumentalities | 20.9% |
Commercial Paper | 11.3% |
U.S. Treasury Obligations | 3.4% |
Investment of Cash Collateral from Securities Loaned | 2.8% |
Repurchase Agreement | 1.3% |
Sovereign Debt Obligations | 0.1% |
Warrants | 0.0% |
| |
Largest Countries
(% of Total Investments) | |
United States | 68.1% |
Cayman Islands | 6.7% |
United Kingdom | 2.5% |
Canada | 1.8% |
France | 1.5% |
Bermuda | 1.1% |
Germany | 0.8% |
Australia | 0.5% |
Netherlands | 0.4% |
Ireland | 0.4% |
HOW HAS THE FUND CHANGED?
The following is a summary of certain changes to the Fund since October 1, 2023. For more complete information, you may review the Fund’s prospectus, including any applicable supplements, at https://www.massmutual.com/product-performance/mutual-funds or upon request at 1-888-309-3539 or fundinfo@massmutual.com.
Effective February 1, 2024, the annual rate for administrative services for Class A shares of the Fund was reduced from 0.30% to 0.25%.
Effective July 1, 2024, MML Investment Advisers, LLC has agreed to cap the fees and expenses of the Fund (other than extraordinary legal and other expenses, Acquired Fund Fees and Expenses, interest expense, expenses related to borrowings, securities lending, leverage, taxes, and brokerage, short sale dividend and loan expense, or other non-recurring or unusual expenses such as organizational expenses and shareholder meeting expenses, as applicable) through January 31, 2026, to the extent that Total Annual Fund Operating Expenses after Expense Reimbursement would otherwise exceed 0.59%, 0.69%, 0.79%, 0.89%, 1.04%, 1.09%, 1.29%, and 0.69% for Classes I, R5, Service, Administrative, R4, A, R3, and Y, respectively.
| |
| WHERE CAN I FIND ADDITIONAL INFORMATION ABOUT THE FUND? |
For additional information about the Fund, including its prospectus, financial information, holdings, and proxy voting information, scan the QR code or visit https://www.massmutual.com/product-performance/mutual-funds. |
| MM202912-309770 | PAGE 3 | TSR-AR-ITGL1 |
10000100661063310848107731184912478132001081710925124581000010294108291083610705118071263212518106911076012004
| | |
MassMutual Diversified Bond Fund | |
| Service Class | MDBYX |
| Annual Shareholder Report | September 30, 2024 |
This annual shareholder report contains important information about the MassMutual Diversified Bond Fund (the “Fund”) for the period of October 1, 2023 to September 30, 2024. You can find additional information about the Fund at https://www.massmutual.com/product-performance/mutual-funds. You can also request this information by contacting us at 1-888-309-3539 or by sending an email request to fundinfo@massmutual.com.
This report describes changes to the Fund that occurred during the reporting period.
WHAT WERE THE FUND COSTS FOR THE LAST YEAR?
This example shows the expenses you would have paid over the past year, based on a hypothetical $10,000 investment. This table reflects any applicable waivers or expense limitations.
| | |
Class Name | Costs of a $10,000 investment | Costs paid as a percentage of a $10,000 investment |
| Service Class | $90 | 0.84% |
HOW DID THE FUND PERFORM?
Global bond markets were broadly, and strongly, positive for the trailing one-year period. During the period, central banks responded to lower inflation data and began to lower policy interest rates, which was favorable for bond prices and returns. Macroeconomic sentiment centered, particularly more recently, on a soft-landing scenario in the U.S., providing a supportive credit risk environment. During the period, narrowing credit spreads were a positive return driver in the global bond market, in addition to the response to lower bond market yields. This resulted in broad gains across varied market sectors, including government bonds, investment grade and high yield corporate securities, mortgage- and asset-backed instruments, and emerging market issues.
Top contributors to the Fund’s performance relative to the Bloomberg U.S. Aggregate Bond Index:
• The corporate credit exposure was favorable from issue selection across investment grade and high yield bonds
• Security selection and allocation to securitized assets, namely ABS and CMBS
Top detractors to the Fund’s performance relative to the Bloomberg U.S. Aggregate Bond Index:
• U.S. Treasury had an indirect allocation effect by virtue of the Fund being underweight and the sector gaining from lower interest rates
• Relatively lower allocation to Agency MBS as the sector performed well
• Derivatives exposure mainly from U.S. Treasury futures to manage Fund duration
| MM202912-309770 | PAGE 1 | TSR-AR-ITGL3 |
Performance shown is past performance and does not guarantee future results. The graph and table below do not reflect the deduction of taxes that a shareholder would pay on Fund distributions or redemption of Fund shares. The graph and table below assume reinvestment of dividends and capital gain distributions.
GROWTH OF A HYPOTHETICAL $10,000 INVESTMENT (October 1, 2014 through September 30, 2024)
This graph shows the performance of a hypothetical $10,000 investment in the share class noted over a ten-year period or since inception, if shorter, as compared to the performance of a broad-based securities market index, and, if applicable, one or more indexes that MML Investment Advisers, LLC believes more closely reflects the market segments in which the Fund invests or is a better comparison for the Fund’s investment strategy. This graph includes the deduction of the maximum applicable sales charge, if any.
The index or indexes shown above are unmanaged, cannot be purchased directly, and, with the exception of any peer group index, do not incur expenses.
AVERAGE ANNUAL TOTAL RETURNS (%) (as of September 30, 2024)
| | | |
| | 1 Year | 5 Year | 10 Year |
Service Class - without sales charge | 14.09 | 0.91 | 2.13 |
Bloomberg U.S. Aggregate Bond Index | 11.57 | 0.33 | 1.84 |
Performance results reflect any applicable waivers or expense limitations in effect during these periods, without which performance would have been lower. The investment return and principal value of shares of the Fund fluctuate, so your shares, when sold, may be worth more or less than their original cost. Current performance of the Fund may be lower or higher than the performance quoted. Performance data current to the most recent month-end may be obtained at https://www.massmutual.com/product-performance/mutual-funds or by calling 1-888-309-3539 or by sending an email request to fundinfo@massmutual.com.
WHAT ARE SOME KEY FUND STATISTICS? (as of September 30, 2024)
| |
Total Net Assets (Millions) | $134.7 |
Total Number of Portfolio Holdings (includes derivative positions, if any) | 406 |
Total Advisory Fees Paid During the Reporting Period | $528,588 |
Portfolio Turnover Rate | 153% |
| MM202912-309770 | PAGE 2 | TSR-AR-ITGL3 |
WHAT DID THE FUND INVEST IN? (as of September 30, 2024)
Derivative values, if any, are excluded from the table(s) below.
| |
Portfolio Characteristics
(% of Total Investments) | |
Corporate Debt | 37.7% |
Non-U.S. Government Agency Obligations | 22.5% |
U.S. Government Agency Obligations and Instrumentalities | 20.9% |
Commercial Paper | 11.3% |
U.S. Treasury Obligations | 3.4% |
Investment of Cash Collateral from Securities Loaned | 2.8% |
Repurchase Agreement | 1.3% |
Sovereign Debt Obligations | 0.1% |
Warrants | 0.0% |
| |
Largest Countries
(% of Total Investments) | |
United States | 68.1% |
Cayman Islands | 6.7% |
United Kingdom | 2.5% |
Canada | 1.8% |
France | 1.5% |
Bermuda | 1.1% |
Germany | 0.8% |
Australia | 0.5% |
Netherlands | 0.4% |
Ireland | 0.4% |
HOW HAS THE FUND CHANGED?
The following is a summary of certain changes to the Fund since October 1, 2023. For more complete information, you may review the Fund’s prospectus, including any applicable supplements, at https://www.massmutual.com/product-performance/mutual-funds or upon request at 1-888-309-3539 or fundinfo@massmutual.com.
Effective February 1, 2024, the annual rate for administrative services for Class A shares of the Fund was reduced from 0.30% to 0.25%.
Effective July 1, 2024, MML Investment Advisers, LLC has agreed to cap the fees and expenses of the Fund (other than extraordinary legal and other expenses, Acquired Fund Fees and Expenses, interest expense, expenses related to borrowings, securities lending, leverage, taxes, and brokerage, short sale dividend and loan expense, or other non-recurring or unusual expenses such as organizational expenses and shareholder meeting expenses, as applicable) through January 31, 2026, to the extent that Total Annual Fund Operating Expenses after Expense Reimbursement would otherwise exceed 0.59%, 0.69%, 0.79%, 0.89%, 1.04%, 1.09%, 1.29%, and 0.69% for Classes I, R5, Service, Administrative, R4, A, R3, and Y, respectively.
| |
| WHERE CAN I FIND ADDITIONAL INFORMATION ABOUT THE FUND? |
For additional information about the Fund, including its prospectus, financial information, holdings, and proxy voting information, scan the QR code or visit https://www.massmutual.com/product-performance/mutual-funds. |
| MM202912-309770 | PAGE 3 | TSR-AR-ITGL3 |
10000100591061610816107411179412407131151074010819123431000010294108291083610705118071263212518106911076012004
| | |
MassMutual Diversified Bond Fund | |
| Administrative Class | MDBLX |
| Annual Shareholder Report | September 30, 2024 |
This annual shareholder report contains important information about the MassMutual Diversified Bond Fund (the “Fund”) for the period of October 1, 2023 to September 30, 2024. You can find additional information about the Fund at https://www.massmutual.com/product-performance/mutual-funds. You can also request this information by contacting us at 1-888-309-3539 or by sending an email request to fundinfo@massmutual.com.
This report describes changes to the Fund that occurred during the reporting period.
WHAT WERE THE FUND COSTS FOR THE LAST YEAR?
This example shows the expenses you would have paid over the past year, based on a hypothetical $10,000 investment. This table reflects any applicable waivers or expense limitations.
| | |
Class Name | Costs of a $10,000 investment | Costs paid as a percentage of a $10,000 investment |
| Administrative Class | $101 | 0.94% |
HOW DID THE FUND PERFORM?
Global bond markets were broadly, and strongly, positive for the trailing one-year period. During the period, central banks responded to lower inflation data and began to lower policy interest rates, which was favorable for bond prices and returns. Macroeconomic sentiment centered, particularly more recently, on a soft-landing scenario in the U.S., providing a supportive credit risk environment. During the period, narrowing credit spreads were a positive return driver in the global bond market, in addition to the response to lower bond market yields. This resulted in broad gains across varied market sectors, including government bonds, investment grade and high yield corporate securities, mortgage- and asset-backed instruments, and emerging market issues.
Top contributors to the Fund’s performance relative to the Bloomberg U.S. Aggregate Bond Index:
• The corporate credit exposure was favorable from issue selection across investment grade and high yield bonds
• Security selection and allocation to securitized assets, namely ABS and CMBS
Top detractors to the Fund’s performance relative to the Bloomberg U.S. Aggregate Bond Index:
• U.S. Treasury had an indirect allocation effect by virtue of the Fund being underweight and the sector gaining from lower interest rates
• Relatively lower allocation to Agency MBS as the sector performed well
• Derivatives exposure mainly from U.S. Treasury futures to manage Fund duration
| MM202912-309770 | PAGE 1 | TSR-AR-ITGL4 |
Performance shown is past performance and does not guarantee future results. The graph and table below do not reflect the deduction of taxes that a shareholder would pay on Fund distributions or redemption of Fund shares. The graph and table below assume reinvestment of dividends and capital gain distributions.
GROWTH OF A HYPOTHETICAL $10,000 INVESTMENT (October 1, 2014 through September 30, 2024)
This graph shows the performance of a hypothetical $10,000 investment in the share class noted over a ten-year period or since inception, if shorter, as compared to the performance of a broad-based securities market index, and, if applicable, one or more indexes that MML Investment Advisers, LLC believes more closely reflects the market segments in which the Fund invests or is a better comparison for the Fund’s investment strategy. This graph includes the deduction of the maximum applicable sales charge, if any.
The index or indexes shown above are unmanaged, cannot be purchased directly, and, with the exception of any peer group index, do not incur expenses.
AVERAGE ANNUAL TOTAL RETURNS (%) (as of September 30, 2024)
| | | |
| | 1 Year | 5 Year | 10 Year |
Administrative Class - without sales charge | 13.87 | 0.80 | 2.02 |
Bloomberg U.S. Aggregate Bond Index | 11.57 | 0.33 | 1.84 |
Performance results reflect any applicable waivers or expense limitations in effect during these periods, without which performance would have been lower. The investment return and principal value of shares of the Fund fluctuate, so your shares, when sold, may be worth more or less than their original cost. Current performance of the Fund may be lower or higher than the performance quoted. Performance data current to the most recent month-end may be obtained at https://www.massmutual.com/product-performance/mutual-funds or by calling 1-888-309-3539 or by sending an email request to fundinfo@massmutual.com.
WHAT ARE SOME KEY FUND STATISTICS? (as of September 30, 2024)
| |
Total Net Assets (Millions) | $134.7 |
Total Number of Portfolio Holdings (includes derivative positions, if any) | 406 |
Total Advisory Fees Paid During the Reporting Period | $528,588 |
Portfolio Turnover Rate | 153% |
| MM202912-309770 | PAGE 2 | TSR-AR-ITGL4 |
WHAT DID THE FUND INVEST IN? (as of September 30, 2024)
Derivative values, if any, are excluded from the table(s) below.
| |
Portfolio Characteristics
(% of Total Investments) | |
Corporate Debt | 37.7% |
Non-U.S. Government Agency Obligations | 22.5% |
U.S. Government Agency Obligations and Instrumentalities | 20.9% |
Commercial Paper | 11.3% |
U.S. Treasury Obligations | 3.4% |
Investment of Cash Collateral from Securities Loaned | 2.8% |
Repurchase Agreement | 1.3% |
Sovereign Debt Obligations | 0.1% |
Warrants | 0.0% |
| |
Largest Countries
(% of Total Investments) | |
United States | 68.1% |
Cayman Islands | 6.7% |
United Kingdom | 2.5% |
Canada | 1.8% |
France | 1.5% |
Bermuda | 1.1% |
Germany | 0.8% |
Australia | 0.5% |
Netherlands | 0.4% |
Ireland | 0.4% |
HOW HAS THE FUND CHANGED?
The following is a summary of certain changes to the Fund since October 1, 2023. For more complete information, you may review the Fund’s prospectus, including any applicable supplements, at https://www.massmutual.com/product-performance/mutual-funds or upon request at 1-888-309-3539 or fundinfo@massmutual.com.
Effective February 1, 2024, the annual rate for administrative services for Class A shares of the Fund was reduced from 0.30% to 0.25%.
Effective July 1, 2024, MML Investment Advisers, LLC has agreed to cap the fees and expenses of the Fund (other than extraordinary legal and other expenses, Acquired Fund Fees and Expenses, interest expense, expenses related to borrowings, securities lending, leverage, taxes, and brokerage, short sale dividend and loan expense, or other non-recurring or unusual expenses such as organizational expenses and shareholder meeting expenses, as applicable) through January 31, 2026, to the extent that Total Annual Fund Operating Expenses after Expense Reimbursement would otherwise exceed 0.59%, 0.69%, 0.79%, 0.89%, 1.04%, 1.09%, 1.29%, and 0.69% for Classes I, R5, Service, Administrative, R4, A, R3, and Y, respectively.
| |
| WHERE CAN I FIND ADDITIONAL INFORMATION ABOUT THE FUND? |
For additional information about the Fund, including its prospectus, financial information, holdings, and proxy voting information, scan the QR code or visit https://www.massmutual.com/product-performance/mutual-funds. |
| MM202912-309770 | PAGE 3 | TSR-AR-ITGL4 |
10000100541059510783106941174112339130201065010731122191000010294108291083610705118071263212518106911076012004
| | |
MassMutual Diversified Bond Fund | |
| Class R4 | MDBFX |
| Annual Shareholder Report | September 30, 2024 |
This annual shareholder report contains important information about the MassMutual Diversified Bond Fund (the “Fund”) for the period of October 1, 2023 to September 30, 2024. You can find additional information about the Fund at https://www.massmutual.com/product-performance/mutual-funds. You can also request this information by contacting us at 1-888-309-3539 or by sending an email request to fundinfo@massmutual.com.
This report describes changes to the Fund that occurred during the reporting period.
WHAT WERE THE FUND COSTS FOR THE LAST YEAR?
This example shows the expenses you would have paid over the past year, based on a hypothetical $10,000 investment. This table reflects any applicable waivers or expense limitations.
| | |
Class Name | Costs of a $10,000 investment | Costs paid as a percentage of a $10,000 investment |
| Class R4 | $117 | 1.09% |
HOW DID THE FUND PERFORM?
Global bond markets were broadly, and strongly, positive for the trailing one-year period. During the period, central banks responded to lower inflation data and began to lower policy interest rates, which was favorable for bond prices and returns. Macroeconomic sentiment centered, particularly more recently, on a soft-landing scenario in the U.S., providing a supportive credit risk environment. During the period, narrowing credit spreads were a positive return driver in the global bond market, in addition to the response to lower bond market yields. This resulted in broad gains across varied market sectors, including government bonds, investment grade and high yield corporate securities, mortgage- and asset-backed instruments, and emerging market issues.
Top contributors to the Fund’s performance relative to the Bloomberg U.S. Aggregate Bond Index:
• The corporate credit exposure was favorable from issue selection across investment grade and high yield bonds
• Security selection and allocation to securitized assets, namely ABS and CMBS
Top detractors to the Fund’s performance relative to the Bloomberg U.S. Aggregate Bond Index:
• U.S. Treasury had an indirect allocation effect by virtue of the Fund being underweight and the sector gaining from lower interest rates
• Relatively lower allocation to Agency MBS as the sector performed well
• Derivatives exposure mainly from U.S. Treasury futures to manage Fund duration
| MM202912-309770 | PAGE 1 | TSR-AR-ITGLK |
Performance shown is past performance and does not guarantee future results. The graph and table below do not reflect the deduction of taxes that a shareholder would pay on Fund distributions or redemption of Fund shares. The graph and table below assume reinvestment of dividends and capital gain distributions.
GROWTH OF A HYPOTHETICAL $10,000 INVESTMENT (October 1, 2014 through September 30, 2024)
This graph shows the performance of a hypothetical $10,000 investment in the share class noted over a ten-year period or since inception, if shorter, as compared to the performance of a broad-based securities market index, and, if applicable, one or more indexes that MML Investment Advisers, LLC believes more closely reflects the market segments in which the Fund invests or is a better comparison for the Fund’s investment strategy. This graph includes the deduction of the maximum applicable sales charge, if any.
The index or indexes shown above are unmanaged, cannot be purchased directly, and, with the exception of any peer group index, do not incur expenses.
AVERAGE ANNUAL TOTAL RETURNS (%) (as of September 30, 2024)
| | | |
| | 1 Year | 5 Year | 10 Year |
Class R4 - without sales charge | 13.84 | 0.69 | 1.88 |
Bloomberg U.S. Aggregate Bond Index | 11.57 | 0.33 | 1.84 |
Performance results reflect any applicable waivers or expense limitations in effect during these periods, without which performance would have been lower. The investment return and principal value of shares of the Fund fluctuate, so your shares, when sold, may be worth more or less than their original cost. Current performance of the Fund may be lower or higher than the performance quoted. Performance data current to the most recent month-end may be obtained at https://www.massmutual.com/product-performance/mutual-funds or by calling 1-888-309-3539 or by sending an email request to fundinfo@massmutual.com.
WHAT ARE SOME KEY FUND STATISTICS? (as of September 30, 2024)
| |
Total Net Assets (Millions) | $134.7 |
Total Number of Portfolio Holdings (includes derivative positions, if any) | 406 |
Total Advisory Fees Paid During the Reporting Period | $528,588 |
Portfolio Turnover Rate | 153% |
| MM202912-309770 | PAGE 2 | TSR-AR-ITGLK |
WHAT DID THE FUND INVEST IN? (as of September 30, 2024)
Derivative values, if any, are excluded from the table(s) below.
| |
Portfolio Characteristics
(% of Total Investments) | |
Corporate Debt | 37.7% |
Non-U.S. Government Agency Obligations | 22.5% |
U.S. Government Agency Obligations and Instrumentalities | 20.9% |
Commercial Paper | 11.3% |
U.S. Treasury Obligations | 3.4% |
Investment of Cash Collateral from Securities Loaned | 2.8% |
Repurchase Agreement | 1.3% |
Sovereign Debt Obligations | 0.1% |
Warrants | 0.0% |
| |
Largest Countries
(% of Total Investments) | |
United States | 68.1% |
Cayman Islands | 6.7% |
United Kingdom | 2.5% |
Canada | 1.8% |
France | 1.5% |
Bermuda | 1.1% |
Germany | 0.8% |
Australia | 0.5% |
Netherlands | 0.4% |
Ireland | 0.4% |
HOW HAS THE FUND CHANGED?
The following is a summary of certain changes to the Fund since October 1, 2023. For more complete information, you may review the Fund’s prospectus, including any applicable supplements, at https://www.massmutual.com/product-performance/mutual-funds or upon request at 1-888-309-3539 or fundinfo@massmutual.com.
Effective February 1, 2024, the annual rate for administrative services for Class A shares of the Fund was reduced from 0.30% to 0.25%.
Effective July 1, 2024, MML Investment Advisers, LLC has agreed to cap the fees and expenses of the Fund (other than extraordinary legal and other expenses, Acquired Fund Fees and Expenses, interest expense, expenses related to borrowings, securities lending, leverage, taxes, and brokerage, short sale dividend and loan expense, or other non-recurring or unusual expenses such as organizational expenses and shareholder meeting expenses, as applicable) through January 31, 2026, to the extent that Total Annual Fund Operating Expenses after Expense Reimbursement would otherwise exceed 0.59%, 0.69%, 0.79%, 0.89%, 1.04%, 1.09%, 1.29%, and 0.69% for Classes I, R5, Service, Administrative, R4, A, R3, and Y, respectively.
| |
| WHERE CAN I FIND ADDITIONAL INFORMATION ABOUT THE FUND? |
For additional information about the Fund, including its prospectus, financial information, holdings, and proxy voting information, scan the QR code or visit https://www.massmutual.com/product-performance/mutual-funds. |
| MM202912-309770 | PAGE 3 | TSR-AR-ITGLK |
10000100341056410729106311164012228128831051710584120481000010294108291083610705118071263212518106911076012004
| | |
MassMutual Diversified Bond Fund | |
| Class A | MDVAX |
| Annual Shareholder Report | September 30, 2024 |
This annual shareholder report contains important information about the MassMutual Diversified Bond Fund (the “Fund”) for the period of October 1, 2023 to September 30, 2024. You can find additional information about the Fund at https://www.massmutual.com/product-performance/mutual-funds. You can also request this information by contacting us at 1-888-309-3539 or by sending an email request to fundinfo@massmutual.com.
This report describes changes to the Fund that occurred during the reporting period.
WHAT WERE THE FUND COSTS FOR THE LAST YEAR?
This example shows the expenses you would have paid over the past year, based on a hypothetical $10,000 investment. This table reflects any applicable waivers or expense limitations.
| | |
Class Name | Costs of a $10,000 investment | Costs paid as a percentage of a $10,000 investment |
| Class A | $124 | 1.16% |
HOW DID THE FUND PERFORM?
Global bond markets were broadly, and strongly, positive for the trailing one-year period. During the period, central banks responded to lower inflation data and began to lower policy interest rates, which was favorable for bond prices and returns. Macroeconomic sentiment centered, particularly more recently, on a soft-landing scenario in the U.S., providing a supportive credit risk environment. During the period, narrowing credit spreads were a positive return driver in the global bond market, in addition to the response to lower bond market yields. This resulted in broad gains across varied market sectors, including government bonds, investment grade and high yield corporate securities, mortgage- and asset-backed instruments, and emerging market issues.
Top contributors to the Fund’s performance relative to the Bloomberg U.S. Aggregate Bond Index:
• The corporate credit exposure was favorable from issue selection across investment grade and high yield bonds
• Security selection and allocation to securitized assets, namely ABS and CMBS
Top detractors to the Fund’s performance relative to the Bloomberg U.S. Aggregate Bond Index:
• U.S. Treasury had an indirect allocation effect by virtue of the Fund being underweight and the sector gaining from lower interest rates
• Relatively lower allocation to Agency MBS as the sector performed well
• Derivatives exposure mainly from U.S. Treasury futures to manage Fund duration
| MM202912-309770 | PAGE 1 | TSR-AR-ITGL2 |
Performance shown is past performance and does not guarantee future results. The graph and table below do not reflect the deduction of taxes that a shareholder would pay on Fund distributions or redemption of Fund shares. The graph and table below assume reinvestment of dividends and capital gain distributions.
GROWTH OF A HYPOTHETICAL $10,000 INVESTMENT (October 1, 2014 through September 30, 2024)
This graph shows the performance of a hypothetical $10,000 investment in the share class noted over a ten-year period or since inception, if shorter, as compared to the performance of a broad-based securities market index, and, if applicable, one or more indexes that MML Investment Advisers, LLC believes more closely reflects the market segments in which the Fund invests or is a better comparison for the Fund’s investment strategy. This graph includes the deduction of the maximum applicable sales charge, if any.
The index or indexes shown above are unmanaged, cannot be purchased directly, and, with the exception of any peer group index, do not incur expenses.
AVERAGE ANNUAL TOTAL RETURNS (%) (as of September 30, 2024)
| | | |
| | 1 Year | 5 Year | 10 Year |
Class A - without sales charge | 13.53 | 0.57 | 1.77 |
Class A - with maximum sales charge | 8.70 | -0.30 | 1.33 |
Bloomberg U.S. Aggregate Bond Index | 11.57 | 0.33 | 1.84 |
Performance results reflect any applicable waivers or expense limitations in effect during these periods, without which performance would have been lower. The investment return and principal value of shares of the Fund fluctuate, so your shares, when sold, may be worth more or less than their original cost. Current performance of the Fund may be lower or higher than the performance quoted. Performance data current to the most recent month-end may be obtained at https://www.massmutual.com/product-performance/mutual-funds or by calling 1-888-309-3539 or by sending an email request to fundinfo@massmutual.com.
WHAT ARE SOME KEY FUND STATISTICS? (as of September 30, 2024)
| |
Total Net Assets (Millions) | $134.7 |
Total Number of Portfolio Holdings (includes derivative positions, if any) | 406 |
Total Advisory Fees Paid During the Reporting Period | $528,588 |
Portfolio Turnover Rate | 153% |
| MM202912-309770 | PAGE 2 | TSR-AR-ITGL2 |
WHAT DID THE FUND INVEST IN? (as of September 30, 2024)
Derivative values, if any, are excluded from the table(s) below.
| |
Portfolio Characteristics
(% of Total Investments) | |
Corporate Debt | 37.7% |
Non-U.S. Government Agency Obligations | 22.5% |
U.S. Government Agency Obligations and Instrumentalities | 20.9% |
Commercial Paper | 11.3% |
U.S. Treasury Obligations | 3.4% |
Investment of Cash Collateral from Securities Loaned | 2.8% |
Repurchase Agreement | 1.3% |
Sovereign Debt Obligations | 0.1% |
Warrants | 0.0% |
| |
Largest Countries
(% of Total Investments) | |
United States | 68.1% |
Cayman Islands | 6.7% |
United Kingdom | 2.5% |
Canada | 1.8% |
France | 1.5% |
Bermuda | 1.1% |
Germany | 0.8% |
Australia | 0.5% |
Netherlands | 0.4% |
Ireland | 0.4% |
HOW HAS THE FUND CHANGED?
The following is a summary of certain changes to the Fund since October 1, 2023. For more complete information, you may review the Fund’s prospectus, including any applicable supplements, at https://www.massmutual.com/product-performance/mutual-funds or upon request at 1-888-309-3539 or fundinfo@massmutual.com.
Effective February 1, 2024, the annual rate for administrative services for Class A shares of the Fund was reduced from 0.30% to 0.25%.
Effective July 1, 2024, MML Investment Advisers, LLC has agreed to cap the fees and expenses of the Fund (other than extraordinary legal and other expenses, Acquired Fund Fees and Expenses, interest expense, expenses related to borrowings, securities lending, leverage, taxes, and brokerage, short sale dividend and loan expense, or other non-recurring or unusual expenses such as organizational expenses and shareholder meeting expenses, as applicable) through January 31, 2026, to the extent that Total Annual Fund Operating Expenses after Expense Reimbursement would otherwise exceed 0.59%, 0.69%, 0.79%, 0.89%, 1.04%, 1.09%, 1.29%, and 0.69% for Classes I, R5, Service, Administrative, R4, A, R3, and Y, respectively.
| |
| WHERE CAN I FIND ADDITIONAL INFORMATION ABOUT THE FUND? |
For additional information about the Fund, including its prospectus, financial information, holdings, and proxy voting information, scan the QR code or visit https://www.massmutual.com/product-performance/mutual-funds. |
| MM202912-309770 | PAGE 3 | TSR-AR-ITGL2 |
95759595101001024510135110931164312252999810051114271000010294108291083610705118071263212518106911076012004
| | |
MassMutual Diversified Bond Fund | |
| Class R3 | MDBRX |
| Annual Shareholder Report | September 30, 2024 |
This annual shareholder report contains important information about the MassMutual Diversified Bond Fund (the “Fund”) for the period of October 1, 2023 to September 30, 2024. You can find additional information about the Fund at https://www.massmutual.com/product-performance/mutual-funds. You can also request this information by contacting us at 1-888-309-3539 or by sending an email request to fundinfo@massmutual.com.
This report describes changes to the Fund that occurred during the reporting period.
WHAT WERE THE FUND COSTS FOR THE LAST YEAR?
This example shows the expenses you would have paid over the past year, based on a hypothetical $10,000 investment. This table reflects any applicable waivers or expense limitations.
| | |
Class Name | Costs of a $10,000 investment | Costs paid as a percentage of a $10,000 investment |
| Class R3 | $143 | 1.34% |
HOW DID THE FUND PERFORM?
Global bond markets were broadly, and strongly, positive for the trailing one-year period. During the period, central banks responded to lower inflation data and began to lower policy interest rates, which was favorable for bond prices and returns. Macroeconomic sentiment centered, particularly more recently, on a soft-landing scenario in the U.S., providing a supportive credit risk environment. During the period, narrowing credit spreads were a positive return driver in the global bond market, in addition to the response to lower bond market yields. This resulted in broad gains across varied market sectors, including government bonds, investment grade and high yield corporate securities, mortgage- and asset-backed instruments, and emerging market issues.
Top contributors to the Fund’s performance relative to the Bloomberg U.S. Aggregate Bond Index:
• The corporate credit exposure was favorable from issue selection across investment grade and high yield bonds
• Security selection and allocation to securitized assets, namely ABS and CMBS
Top detractors to the Fund’s performance relative to the Bloomberg U.S. Aggregate Bond Index:
• U.S. Treasury had an indirect allocation effect by virtue of the Fund being underweight and the sector gaining from lower interest rates
• Relatively lower allocation to Agency MBS as the sector performed well
• Derivatives exposure mainly from U.S. Treasury futures to manage Fund duration
| MM202912-309770 | PAGE 1 | TSR-AR-ITGLJ |
Performance shown is past performance and does not guarantee future results. The graph and table below do not reflect the deduction of taxes that a shareholder would pay on Fund distributions or redemption of Fund shares. The graph and table below assume reinvestment of dividends and capital gain distributions.
GROWTH OF A HYPOTHETICAL $10,000 INVESTMENT (October 1, 2014 through September 30, 2024)
This graph shows the performance of a hypothetical $10,000 investment in the share class noted over a ten-year period or since inception, if shorter, as compared to the performance of a broad-based securities market index, and, if applicable, one or more indexes that MML Investment Advisers, LLC believes more closely reflects the market segments in which the Fund invests or is a better comparison for the Fund’s investment strategy. This graph includes the deduction of the maximum applicable sales charge, if any.
The index or indexes shown above are unmanaged, cannot be purchased directly, and, with the exception of any peer group index, do not incur expenses.
AVERAGE ANNUAL TOTAL RETURNS (%) (as of September 30, 2024)
| | | |
| | 1 Year | 5 Year | 10 Year |
Class R3 - without sales charge | 13.50 | 0.42 | 1.63 |
Bloomberg U.S. Aggregate Bond Index | 11.57 | 0.33 | 1.84 |
Performance results reflect any applicable waivers or expense limitations in effect during these periods, without which performance would have been lower. The investment return and principal value of shares of the Fund fluctuate, so your shares, when sold, may be worth more or less than their original cost. Current performance of the Fund may be lower or higher than the performance quoted. Performance data current to the most recent month-end may be obtained at https://www.massmutual.com/product-performance/mutual-funds or by calling 1-888-309-3539 or by sending an email request to fundinfo@massmutual.com.
WHAT ARE SOME KEY FUND STATISTICS? (as of September 30, 2024)
| |
Total Net Assets (Millions) | $134.7 |
Total Number of Portfolio Holdings (includes derivative positions, if any) | 406 |
Total Advisory Fees Paid During the Reporting Period | $528,588 |
Portfolio Turnover Rate | 153% |
| MM202912-309770 | PAGE 2 | TSR-AR-ITGLJ |
WHAT DID THE FUND INVEST IN? (as of September 30, 2024)
Derivative values, if any, are excluded from the table(s) below.
| |
Portfolio Characteristics
(% of Total Investments) | |
Corporate Debt | 37.7% |
Non-U.S. Government Agency Obligations | 22.5% |
U.S. Government Agency Obligations and Instrumentalities | 20.9% |
Commercial Paper | 11.3% |
U.S. Treasury Obligations | 3.4% |
Investment of Cash Collateral from Securities Loaned | 2.8% |
Repurchase Agreement | 1.3% |
Sovereign Debt Obligations | 0.1% |
Warrants | 0.0% |
| |
Largest Countries
(% of Total Investments) | |
United States | 68.1% |
Cayman Islands | 6.7% |
United Kingdom | 2.5% |
Canada | 1.8% |
France | 1.5% |
Bermuda | 1.1% |
Germany | 0.8% |
Australia | 0.5% |
Netherlands | 0.4% |
Ireland | 0.4% |
HOW HAS THE FUND CHANGED?
The following is a summary of certain changes to the Fund since October 1, 2023. For more complete information, you may review the Fund’s prospectus, including any applicable supplements, at https://www.massmutual.com/product-performance/mutual-funds or upon request at 1-888-309-3539 or fundinfo@massmutual.com.
Effective February 1, 2024, the annual rate for administrative services for Class A shares of the Fund was reduced from 0.30% to 0.25%.
Effective July 1, 2024, MML Investment Advisers, LLC has agreed to cap the fees and expenses of the Fund (other than extraordinary legal and other expenses, Acquired Fund Fees and Expenses, interest expense, expenses related to borrowings, securities lending, leverage, taxes, and brokerage, short sale dividend and loan expense, or other non-recurring or unusual expenses such as organizational expenses and shareholder meeting expenses, as applicable) through January 31, 2026, to the extent that Total Annual Fund Operating Expenses after Expense Reimbursement would otherwise exceed 0.59%, 0.69%, 0.79%, 0.89%, 1.04%, 1.09%, 1.29%, and 0.69% for Classes I, R5, Service, Administrative, R4, A, R3, and Y, respectively.
| |
| WHERE CAN I FIND ADDITIONAL INFORMATION ABOUT THE FUND? |
For additional information about the Fund, including its prospectus, financial information, holdings, and proxy voting information, scan the QR code or visit https://www.massmutual.com/product-performance/mutual-funds. |
| MM202912-309770 | PAGE 3 | TSR-AR-ITGLJ |
10000100151050910657105251150912040126591032310353117511000010294108291083610705118071263212518106911076012004
| | |
MassMutual Diversified Bond Fund | |
| Class Y | MMOBX |
| Annual Shareholder Report | September 30, 2024 |
This annual shareholder report contains important information about the MassMutual Diversified Bond Fund (the “Fund”) for the period of October 1, 2023 to September 30, 2024. You can find additional information about the Fund at https://www.massmutual.com/product-performance/mutual-funds. You can also request this information by contacting us at 1-888-309-3539 or by sending an email request to fundinfo@massmutual.com.
This report describes changes to the Fund that occurred during the reporting period.
WHAT WERE THE FUND COSTS FOR THE LAST YEAR?
This example shows the expenses you would have paid over the past year, based on a hypothetical $10,000 investment. This table reflects any applicable waivers or expense limitations.
| | |
Class Name | Costs of a $10,000 investment | Costs paid as a percentage of a $10,000 investment |
| Class Y | $79 | 0.74% |
HOW DID THE FUND PERFORM?
Global bond markets were broadly, and strongly, positive for the trailing one-year period. During the period, central banks responded to lower inflation data and began to lower policy interest rates, which was favorable for bond prices and returns. Macroeconomic sentiment centered, particularly more recently, on a soft-landing scenario in the U.S., providing a supportive credit risk environment. During the period, narrowing credit spreads were a positive return driver in the global bond market, in addition to the response to lower bond market yields. This resulted in broad gains across varied market sectors, including government bonds, investment grade and high yield corporate securities, mortgage- and asset-backed instruments, and emerging market issues.
Top contributors to the Fund’s performance relative to the Bloomberg U.S. Aggregate Bond Index:
• The corporate credit exposure was favorable from issue selection across investment grade and high yield bonds
• Security selection and allocation to securitized assets, namely ABS and CMBS
Top detractors to the Fund’s performance relative to the Bloomberg U.S. Aggregate Bond Index:
• U.S. Treasury had an indirect allocation effect by virtue of the Fund being underweight and the sector gaining from lower interest rates
• Relatively lower allocation to Agency MBS as the sector performed well
• Derivatives exposure mainly from U.S. Treasury futures to manage Fund duration
| MM202912-309770 | PAGE 1 | TSR-AR-ITGLY |
Performance shown is past performance and does not guarantee future results. The graph and table below do not reflect the deduction of taxes that a shareholder would pay on Fund distributions or redemption of Fund shares. The graph and table below assume reinvestment of dividends and capital gain distributions.
GROWTH OF A HYPOTHETICAL $10,000 INVESTMENT (February 1, 2023 through September 30, 2024)
This graph shows the performance of a hypothetical $10,000 investment in the share class noted over a ten-year period or since inception, if shorter, as compared to the performance of a broad-based securities market index, and, if applicable, one or more indexes that MML Investment Advisers, LLC believes more closely reflects the market segments in which the Fund invests or is a better comparison for the Fund’s investment strategy. This graph includes the deduction of the maximum applicable sales charge, if any.
The index or indexes shown above are unmanaged, cannot be purchased directly, and, with the exception of any peer group index, do not incur expenses.
AVERAGE ANNUAL TOTAL RETURNS (%) (as of September 30, 2024)
| | |
| | 1 Year | Since Inception
(02/01/2023) |
Class Y - without sales charge | 14.11 | 4.86 |
Bloomberg U.S. Aggregate Bond Index | 11.57 | 4.11 |
Performance results reflect any applicable waivers or expense limitations in effect during these periods, without which performance would have been lower. The investment return and principal value of shares of the Fund fluctuate, so your shares, when sold, may be worth more or less than their original cost. Current performance of the Fund may be lower or higher than the performance quoted. Performance data current to the most recent month-end may be obtained at https://www.massmutual.com/product-performance/mutual-funds or by calling 1-888-309-3539 or by sending an email request to fundinfo@massmutual.com.
WHAT ARE SOME KEY FUND STATISTICS? (as of September 30, 2024)
| |
Total Net Assets (Millions) | $134.7 |
Total Number of Portfolio Holdings (includes derivative positions, if any) | 406 |
Total Advisory Fees Paid During the Reporting Period | $528,588 |
Portfolio Turnover Rate | 153% |
| MM202912-309770 | PAGE 2 | TSR-AR-ITGLY |
WHAT DID THE FUND INVEST IN? (as of September 30, 2024)
Derivative values, if any, are excluded from the table(s) below.
| |
Portfolio Characteristics
(% of Total Investments) | |
Corporate Debt | 37.7% |
Non-U.S. Government Agency Obligations | 22.5% |
U.S. Government Agency Obligations and Instrumentalities | 20.9% |
Commercial Paper | 11.3% |
U.S. Treasury Obligations | 3.4% |
Investment of Cash Collateral from Securities Loaned | 2.8% |
Repurchase Agreement | 1.3% |
Sovereign Debt Obligations | 0.1% |
Warrants | 0.0% |
| |
Largest Countries
(% of Total Investments) | |
United States | 68.1% |
Cayman Islands | 6.7% |
United Kingdom | 2.5% |
Canada | 1.8% |
France | 1.5% |
Bermuda | 1.1% |
Germany | 0.8% |
Australia | 0.5% |
Netherlands | 0.4% |
Ireland | 0.4% |
HOW HAS THE FUND CHANGED?
The following is a summary of certain changes to the Fund since October 1, 2023. For more complete information, you may review the Fund’s prospectus, including any applicable supplements, at https://www.massmutual.com/product-performance/mutual-funds or upon request at 1-888-309-3539 or fundinfo@massmutual.com.
Effective February 1, 2024, the annual rate for administrative services for Class A shares of the Fund was reduced from 0.30% to 0.25%.
Effective July 1, 2024, MML Investment Advisers, LLC has agreed to cap the fees and expenses of the Fund (other than extraordinary legal and other expenses, Acquired Fund Fees and Expenses, interest expense, expenses related to borrowings, securities lending, leverage, taxes, and brokerage, short sale dividend and loan expense, or other non-recurring or unusual expenses such as organizational expenses and shareholder meeting expenses, as applicable) through January 31, 2026, to the extent that Total Annual Fund Operating Expenses after Expense Reimbursement would otherwise exceed 0.59%, 0.69%, 0.79%, 0.89%, 1.04%, 1.09%, 1.29%, and 0.69% for Classes I, R5, Service, Administrative, R4, A, R3, and Y, respectively.
| |
| WHERE CAN I FIND ADDITIONAL INFORMATION ABOUT THE FUND? |
For additional information about the Fund, including its prospectus, financial information, holdings, and proxy voting information, scan the QR code or visit https://www.massmutual.com/product-performance/mutual-funds. |
| MM202912-309770 | PAGE 3 | TSR-AR-ITGLY |
1000094821082010000951910621
| | |
MassMutual High Yield Fund | |
| Class I | MPHZX |
| Annual Shareholder Report | September 30, 2024 |
This annual shareholder report contains important information about the MassMutual High Yield Fund (the “Fund”) for the period of October 1, 2023 to September 30, 2024. You can find additional information about the Fund at https://www.massmutual.com/product-performance/mutual-funds. You can also request this information by contacting us at 1-888-309-3539 or by sending an email request to fundinfo@massmutual.com.
This report describes changes to the Fund that occurred during the reporting period.
WHAT WERE THE FUND COSTS FOR THE LAST YEAR?
This example shows the expenses you would have paid over the past year, based on a hypothetical $10,000 investment. This table reflects any applicable waivers or expense limitations.
| | |
Class Name | Costs of a $10,000 investment | Costs paid as a percentage of a $10,000 investment |
| Class I | $61 | 0.56% |
HOW DID THE FUND PERFORM?
Global bond markets were broadly, and strongly, positive for the trailing one-year period. During the period, central banks responded to lower inflation data and began to lower policy interest rates, which was favorable for bond prices and returns. Macroeconomic sentiment centered, particularly more recently, on a soft-landing scenario in the U.S., providing a supportive credit risk environment. During the period, narrowing credit spreads were a positive return driver in the global bond market, in addition to the response to lower bond market yields. This resulted in broad gains across varied market sectors, including government bonds, investment grade and high yield corporate securities, mortgage- and asset-backed instruments, and emerging market issues.
Top contributors to the Fund’s performance relative to the Bloomberg U.S. Corporate High-Yield Bond Index:
• Issue selection among consumer, non-cyclical bonds
• Issue selection among capital goods bonds
• Issue selection in total across all sectors
Top detractors to the Fund’s performance relative to the Bloomberg U.S. Corporate High-Yield Bond Index:
• An out-of-index bank loan allocation as the asset class lagged high yield bond performance
• Interest rate sensitivity primarily from yield curve effect
Performance shown is past performance and does not guarantee future results. The graph and table below do not reflect the deduction of taxes that a shareholder would pay on Fund distributions or redemption of Fund shares. The graph and table below assume reinvestment of dividends and capital gain distributions.
GROWTH OF A HYPOTHETICAL $10,000 INVESTMENT (October 1, 2014 through September 30, 2024)
This graph shows the performance of a hypothetical $10,000 investment in the share class noted over a ten-year period or since inception, if shorter, as compared to the performance of a broad-based securities market index, and, if applicable, one or more indexes that MML Investment Advisers, LLC believes more closely reflects the market segments in which the Fund invests or is a better comparison for the Fund’s investment strategy. This graph includes the deduction of the maximum applicable sales charge, if any.
| MM202912-309770 | PAGE 1 | TSR-AR-ITGF6 |
The index or indexes shown above are unmanaged, cannot be purchased directly, and, with the exception of any peer group index, do not incur expenses.
AVERAGE ANNUAL TOTAL RETURNS (%) (as of September 30, 2024)
| | | |
| | 1 Year | 5 Year | 10 Year |
Class I - without sales charge | 16.35 | 4.80 | 5.05 |
Bloomberg U.S. Aggregate Bond Index1 | 11.57 | 0.33 | 1.84 |
Bloomberg U.S. Corporate High-Yield Bond Index | 15.74 | 4.72 | 5.04 |
| 1 | Effective July 24, 2024, the Bloomberg U.S. Aggregate Bond Index replaced the Bloomberg U.S. Corporate High-Yield Bond Index as a broad measure of market performance in accordance with new regulatory disclosure requirements. The Fund continues to use the Bloomberg U.S. Corporate High-Yield Bond Index as a supplemental benchmark that MML Investment Advisers, LLC believes more closely reflects the market segments in which the Fund invests. |
Performance results reflect any applicable waivers or expense limitations in effect during these periods, without which performance would have been lower. The investment return and principal value of shares of the Fund fluctuate, so your shares, when sold, may be worth more or less than their original cost. Current performance of the Fund may be lower or higher than the performance quoted. Performance data current to the most recent month-end may be obtained at https://www.massmutual.com/product-performance/mutual-funds or by calling 1-888-309-3539 or by sending an email request to fundinfo@massmutual.com.
WHAT ARE SOME KEY FUND STATISTICS? (as of September 30, 2024)
| |
Total Net Assets (Millions) | $399.3 |
Total Number of Portfolio Holdings (includes derivative positions, if any) | 284 |
Total Advisory Fees Paid During the Reporting Period | $1,858,393 |
Portfolio Turnover Rate | 69% |
WHAT DID THE FUND INVEST IN? (as of September 30, 2024)
Derivative values, if any, are excluded from the table(s) below.
| |
Portfolio Characteristics
(% of Total Investments) | |
Corporate Debt | 75.1% |
Bank Loans | 9.2% |
Commercial Paper | 7.5% |
Investment of Cash Collateral from Securities Loaned | 7.5% |
Repurchase Agreement | 0.7% |
HOW HAS THE FUND CHANGED?
The following is a summary of certain changes to the Fund since October 1, 2023. For more complete information, you may review the Fund’s prospectus, including any applicable supplements, at https://www.massmutual.com/product-performance/mutual-funds or upon request at 1-888-309-3539 or fundinfo@massmutual.com.
| MM202912-309770 | PAGE 2 | TSR-AR-ITGF6 |
Effective February 1, 2024, the annual rate for administrative services for Class A shares of the Fund was reduced from 0.30% to 0.25%.
Effective February 1, 2024, MML Investment Advisers, LLC has agreed to cap the fees and expenses of the Fund (other than extraordinary legal and other expenses, Acquired Fund Fees and Expenses, interest expense, expenses related to borrowings, securities lending, leverage, taxes, and brokerage, short sale dividend and loan expense, or other non-recurring or unusual expenses such as organizational expenses and shareholder meeting expenses, as applicable) through January 31, 2025, to the extent that Total Annual Fund Operating Expenses after Expense Reimbursement would otherwise exceed 0.54%, 0.64%, 0.74%, 0.84%, 0.99%, 1.04%, 1.24%, 0.59%, and 1.54% for Classes I, R5, Service, Administrative, R4, A, R3, Y, and C, respectively.
| |
| WHERE CAN I FIND ADDITIONAL INFORMATION ABOUT THE FUND? |
For additional information about the Fund, including its prospectus, financial information, holdings, and proxy voting information, scan the QR code or visit https://www.massmutual.com/product-performance/mutual-funds. |
| MM202912-309770 | PAGE 3 | TSR-AR-ITGF6 |
1000097731083411942122741294212906147381272114062163611000010294108291083610705118071263212518106911076012004100009657108871185312215129911341414926128161413316358
| | |
MassMutual High Yield Fund | |
| Class R5 | MPHSX |
| Annual Shareholder Report | September 30, 2024 |
This annual shareholder report contains important information about the MassMutual High Yield Fund (the “Fund”) for the period of October 1, 2023 to September 30, 2024. You can find additional information about the Fund at https://www.massmutual.com/product-performance/mutual-funds. You can also request this information by contacting us at 1-888-309-3539 or by sending an email request to fundinfo@massmutual.com.
This report describes changes to the Fund that occurred during the reporting period.
WHAT WERE THE FUND COSTS FOR THE LAST YEAR?
This example shows the expenses you would have paid over the past year, based on a hypothetical $10,000 investment. This table reflects any applicable waivers or expense limitations.
| | |
Class Name | Costs of a $10,000 investment | Costs paid as a percentage of a $10,000 investment |
| Class R5 | $71 | 0.66% |
HOW DID THE FUND PERFORM?
Global bond markets were broadly, and strongly, positive for the trailing one-year period. During the period, central banks responded to lower inflation data and began to lower policy interest rates, which was favorable for bond prices and returns. Macroeconomic sentiment centered, particularly more recently, on a soft-landing scenario in the U.S., providing a supportive credit risk environment. During the period, narrowing credit spreads were a positive return driver in the global bond market, in addition to the response to lower bond market yields. This resulted in broad gains across varied market sectors, including government bonds, investment grade and high yield corporate securities, mortgage- and asset-backed instruments, and emerging market issues.
Top contributors to the Fund’s performance relative to the Bloomberg U.S. Corporate High-Yield Bond Index:
• Issue selection among consumer, non-cyclical bonds
• Issue selection among capital goods bonds
• Issue selection in total across all sectors
Top detractors to the Fund’s performance relative to the Bloomberg U.S. Corporate High-Yield Bond Index:
• An out-of-index bank loan allocation as the asset class lagged high yield bond performance
• Interest rate sensitivity primarily from yield curve effect
Performance shown is past performance and does not guarantee future results. The graph and table below do not reflect the deduction of taxes that a shareholder would pay on Fund distributions or redemption of Fund shares. The graph and table below assume reinvestment of dividends and capital gain distributions.
GROWTH OF A HYPOTHETICAL $10,000 INVESTMENT (October 1, 2014 through September 30, 2024)
This graph shows the performance of a hypothetical $10,000 investment in the share class noted over a ten-year period or since inception, if shorter, as compared to the performance of a broad-based securities market index, and, if applicable, one or more indexes that MML Investment Advisers, LLC believes more closely reflects the market segments in which the Fund invests or is a better comparison for the Fund’s investment strategy. This graph includes the deduction of the maximum applicable sales charge, if any.
| MM202912-309770 | PAGE 1 | TSR-AR-ITGF1 |
The index or indexes shown above are unmanaged, cannot be purchased directly, and, with the exception of any peer group index, do not incur expenses.
AVERAGE ANNUAL TOTAL RETURNS (%) (as of September 30, 2024)
| | | |
| | 1 Year | 5 Year | 10 Year |
Class R5 - without sales charge | 16.31 | 4.72 | 4.95 |
Bloomberg U.S. Aggregate Bond Index1 | 11.57 | 0.33 | 1.84 |
Bloomberg U.S. Corporate High-Yield Bond Index | 15.74 | 4.72 | 5.04 |
| 1 | Effective July 24, 2024, the Bloomberg U.S. Aggregate Bond Index replaced the Bloomberg U.S. Corporate High-Yield Bond Index as a broad measure of market performance in accordance with new regulatory disclosure requirements. The Fund continues to use the Bloomberg U.S. Corporate High-Yield Bond Index as a supplemental benchmark that MML Investment Advisers, LLC believes more closely reflects the market segments in which the Fund invests. |
Performance results reflect any applicable waivers or expense limitations in effect during these periods, without which performance would have been lower. The investment return and principal value of shares of the Fund fluctuate, so your shares, when sold, may be worth more or less than their original cost. Current performance of the Fund may be lower or higher than the performance quoted. Performance data current to the most recent month-end may be obtained at https://www.massmutual.com/product-performance/mutual-funds or by calling 1-888-309-3539 or by sending an email request to fundinfo@massmutual.com.
WHAT ARE SOME KEY FUND STATISTICS? (as of September 30, 2024)
| |
Total Net Assets (Millions) | $399.3 |
Total Number of Portfolio Holdings (includes derivative positions, if any) | 284 |
Total Advisory Fees Paid During the Reporting Period | $1,858,393 |
Portfolio Turnover Rate | 69% |
WHAT DID THE FUND INVEST IN? (as of September 30, 2024)
Derivative values, if any, are excluded from the table(s) below.
| |
Portfolio Characteristics
(% of Total Investments) | |
Corporate Debt | 75.1% |
Bank Loans | 9.2% |
Commercial Paper | 7.5% |
Investment of Cash Collateral from Securities Loaned | 7.5% |
Repurchase Agreement | 0.7% |
HOW HAS THE FUND CHANGED?
The following is a summary of certain changes to the Fund since October 1, 2023. For more complete information, you may review the Fund’s prospectus, including any applicable supplements, at https://www.massmutual.com/product-performance/mutual-funds or upon request at 1-888-309-3539 or fundinfo@massmutual.com.
| MM202912-309770 | PAGE 2 | TSR-AR-ITGF1 |
Effective February 1, 2024, the annual rate for administrative services for Class A shares of the Fund was reduced from 0.30% to 0.25%.
Effective February 1, 2024, MML Investment Advisers, LLC has agreed to cap the fees and expenses of the Fund (other than extraordinary legal and other expenses, Acquired Fund Fees and Expenses, interest expense, expenses related to borrowings, securities lending, leverage, taxes, and brokerage, short sale dividend and loan expense, or other non-recurring or unusual expenses such as organizational expenses and shareholder meeting expenses, as applicable) through January 31, 2025, to the extent that Total Annual Fund Operating Expenses after Expense Reimbursement would otherwise exceed 0.54%, 0.64%, 0.74%, 0.84%, 0.99%, 1.04%, 1.24%, 0.59%, and 1.54% for Classes I, R5, Service, Administrative, R4, A, R3, Y, and C, respectively.
| |
| WHERE CAN I FIND ADDITIONAL INFORMATION ABOUT THE FUND? |
For additional information about the Fund, including its prospectus, financial information, holdings, and proxy voting information, scan the QR code or visit https://www.massmutual.com/product-performance/mutual-funds. |
| MM202912-309770 | PAGE 3 | TSR-AR-ITGF1 |
1000097721081511905122211286812832146441261913932162051000010294108291083610705118071263212518106911076012004100009657108871185312215129911341414926128161413316358
| | |
MassMutual High Yield Fund | |
| Service Class | DLHYX |
| Annual Shareholder Report | September 30, 2024 |
This annual shareholder report contains important information about the MassMutual High Yield Fund (the “Fund”) for the period of October 1, 2023 to September 30, 2024. You can find additional information about the Fund at https://www.massmutual.com/product-performance/mutual-funds. You can also request this information by contacting us at 1-888-309-3539 or by sending an email request to fundinfo@massmutual.com.
This report describes changes to the Fund that occurred during the reporting period.
WHAT WERE THE FUND COSTS FOR THE LAST YEAR?
This example shows the expenses you would have paid over the past year, based on a hypothetical $10,000 investment. This table reflects any applicable waivers or expense limitations.
| | |
Class Name | Costs of a $10,000 investment | Costs paid as a percentage of a $10,000 investment |
| Service Class | $82 | 0.76% |
HOW DID THE FUND PERFORM?
Global bond markets were broadly, and strongly, positive for the trailing one-year period. During the period, central banks responded to lower inflation data and began to lower policy interest rates, which was favorable for bond prices and returns. Macroeconomic sentiment centered, particularly more recently, on a soft-landing scenario in the U.S., providing a supportive credit risk environment. During the period, narrowing credit spreads were a positive return driver in the global bond market, in addition to the response to lower bond market yields. This resulted in broad gains across varied market sectors, including government bonds, investment grade and high yield corporate securities, mortgage- and asset-backed instruments, and emerging market issues.
Top contributors to the Fund’s performance relative to the Bloomberg U.S. Corporate High-Yield Bond Index:
• Issue selection among consumer, non-cyclical bonds
• Issue selection among capital goods bonds
• Issue selection in total across all sectors
Top detractors to the Fund’s performance relative to the Bloomberg U.S. Corporate High-Yield Bond Index:
• An out-of-index bank loan allocation as the asset class lagged high yield bond performance
• Interest rate sensitivity primarily from yield curve effect
Performance shown is past performance and does not guarantee future results. The graph and table below do not reflect the deduction of taxes that a shareholder would pay on Fund distributions or redemption of Fund shares. The graph and table below assume reinvestment of dividends and capital gain distributions.
GROWTH OF A HYPOTHETICAL $10,000 INVESTMENT (October 1, 2014 through September 30, 2024)
This graph shows the performance of a hypothetical $10,000 investment in the share class noted over a ten-year period or since inception, if shorter, as compared to the performance of a broad-based securities market index, and, if applicable, one or more indexes that MML Investment Advisers, LLC believes more closely reflects the market segments in which the Fund invests or is a better comparison for the Fund’s investment strategy. This graph includes the deduction of the maximum applicable sales charge, if any.
| MM202912-309770 | PAGE 1 | TSR-AR-ITGF3 |
The index or indexes shown above are unmanaged, cannot be purchased directly, and, with the exception of any peer group index, do not incur expenses.
AVERAGE ANNUAL TOTAL RETURNS (%) (as of September 30, 2024)
| | | |
| | 1 Year | 5 Year | 10 Year |
Service Class - without sales charge | 16.20 | 4.60 | 4.84 |
Bloomberg U.S. Aggregate Bond Index1 | 11.57 | 0.33 | 1.84 |
Bloomberg U.S. Corporate High-Yield Bond Index | 15.74 | 4.72 | 5.04 |
| 1 | Effective July 24, 2024, the Bloomberg U.S. Aggregate Bond Index replaced the Bloomberg U.S. Corporate High-Yield Bond Index as a broad measure of market performance in accordance with new regulatory disclosure requirements. The Fund continues to use the Bloomberg U.S. Corporate High-Yield Bond Index as a supplemental benchmark that MML Investment Advisers, LLC believes more closely reflects the market segments in which the Fund invests. |
Performance results reflect any applicable waivers or expense limitations in effect during these periods, without which performance would have been lower. The investment return and principal value of shares of the Fund fluctuate, so your shares, when sold, may be worth more or less than their original cost. Current performance of the Fund may be lower or higher than the performance quoted. Performance data current to the most recent month-end may be obtained at https://www.massmutual.com/product-performance/mutual-funds or by calling 1-888-309-3539 or by sending an email request to fundinfo@massmutual.com.
WHAT ARE SOME KEY FUND STATISTICS? (as of September 30, 2024)
| |
Total Net Assets (Millions) | $399.3 |
Total Number of Portfolio Holdings (includes derivative positions, if any) | 284 |
Total Advisory Fees Paid During the Reporting Period | $1,858,393 |
Portfolio Turnover Rate | 69% |
WHAT DID THE FUND INVEST IN? (as of September 30, 2024)
Derivative values, if any, are excluded from the table(s) below.
| |
Portfolio Characteristics
(% of Total Investments) | |
Corporate Debt | 75.1% |
Bank Loans | 9.2% |
Commercial Paper | 7.5% |
Investment of Cash Collateral from Securities Loaned | 7.5% |
Repurchase Agreement | 0.7% |
HOW HAS THE FUND CHANGED?
The following is a summary of certain changes to the Fund since October 1, 2023. For more complete information, you may review the Fund’s prospectus, including any applicable supplements, at https://www.massmutual.com/product-performance/mutual-funds or upon request at 1-888-309-3539 or fundinfo@massmutual.com.
| MM202912-309770 | PAGE 2 | TSR-AR-ITGF3 |
Effective February 1, 2024, the annual rate for administrative services for Class A shares of the Fund was reduced from 0.30% to 0.25%.
Effective February 1, 2024, MML Investment Advisers, LLC has agreed to cap the fees and expenses of the Fund (other than extraordinary legal and other expenses, Acquired Fund Fees and Expenses, interest expense, expenses related to borrowings, securities lending, leverage, taxes, and brokerage, short sale dividend and loan expense, or other non-recurring or unusual expenses such as organizational expenses and shareholder meeting expenses, as applicable) through January 31, 2025, to the extent that Total Annual Fund Operating Expenses after Expense Reimbursement would otherwise exceed 0.54%, 0.64%, 0.74%, 0.84%, 0.99%, 1.04%, 1.24%, 0.59%, and 1.54% for Classes I, R5, Service, Administrative, R4, A, R3, Y, and C, respectively.
| |
| WHERE CAN I FIND ADDITIONAL INFORMATION ABOUT THE FUND? |
For additional information about the Fund, including its prospectus, financial information, holdings, and proxy voting information, scan the QR code or visit https://www.massmutual.com/product-performance/mutual-funds. |
| MM202912-309770 | PAGE 3 | TSR-AR-ITGF3 |
1000097601080411877121801281312751145361253213804160401000010294108291083610705118071263212518106911076012004100009657108871185312215129911341414926128161413316358
| | |
MassMutual High Yield Fund | |
| Administrative Class | MPHLX |
| Annual Shareholder Report | September 30, 2024 |
This annual shareholder report contains important information about the MassMutual High Yield Fund (the “Fund”) for the period of October 1, 2023 to September 30, 2024. You can find additional information about the Fund at https://www.massmutual.com/product-performance/mutual-funds. You can also request this information by contacting us at 1-888-309-3539 or by sending an email request to fundinfo@massmutual.com.
This report describes changes to the Fund that occurred during the reporting period.
WHAT WERE THE FUND COSTS FOR THE LAST YEAR?
This example shows the expenses you would have paid over the past year, based on a hypothetical $10,000 investment. This table reflects any applicable waivers or expense limitations.
| | |
Class Name | Costs of a $10,000 investment | Costs paid as a percentage of a $10,000 investment |
| Administrative Class | $93 | 0.86% |
HOW DID THE FUND PERFORM?
Global bond markets were broadly, and strongly, positive for the trailing one-year period. During the period, central banks responded to lower inflation data and began to lower policy interest rates, which was favorable for bond prices and returns. Macroeconomic sentiment centered, particularly more recently, on a soft-landing scenario in the U.S., providing a supportive credit risk environment. During the period, narrowing credit spreads were a positive return driver in the global bond market, in addition to the response to lower bond market yields. This resulted in broad gains across varied market sectors, including government bonds, investment grade and high yield corporate securities, mortgage- and asset-backed instruments, and emerging market issues.
Top contributors to the Fund’s performance relative to the Bloomberg U.S. Corporate High-Yield Bond Index:
• Issue selection among consumer, non-cyclical bonds
• Issue selection among capital goods bonds
• Issue selection in total across all sectors
Top detractors to the Fund’s performance relative to the Bloomberg U.S. Corporate High-Yield Bond Index:
• An out-of-index bank loan allocation as the asset class lagged high yield bond performance
• Interest rate sensitivity primarily from yield curve effect
Performance shown is past performance and does not guarantee future results. The graph and table below do not reflect the deduction of taxes that a shareholder would pay on Fund distributions or redemption of Fund shares. The graph and table below assume reinvestment of dividends and capital gain distributions.
GROWTH OF A HYPOTHETICAL $10,000 INVESTMENT (October 1, 2014 through September 30, 2024)
This graph shows the performance of a hypothetical $10,000 investment in the share class noted over a ten-year period or since inception, if shorter, as compared to the performance of a broad-based securities market index, and, if applicable, one or more indexes that MML Investment Advisers, LLC believes more closely reflects the market segments in which the Fund invests or is a better comparison for the Fund’s investment strategy. This graph includes the deduction of the maximum applicable sales charge, if any.
| MM202912-309770 | PAGE 1 | TSR-AR-ITGF4 |
The index or indexes shown above are unmanaged, cannot be purchased directly, and, with the exception of any peer group index, do not incur expenses.
AVERAGE ANNUAL TOTAL RETURNS (%) (as of September 30, 2024)
| | | |
| | 1 Year | 5 Year | 10 Year |
Administrative Class - without sales charge | 16.10 | 4.50 | 4.74 |
Bloomberg U.S. Aggregate Bond Index1 | 11.57 | 0.33 | 1.84 |
Bloomberg U.S. Corporate High-Yield Bond Index | 15.74 | 4.72 | 5.04 |
| 1 | Effective July 24, 2024, the Bloomberg U.S. Aggregate Bond Index replaced the Bloomberg U.S. Corporate High-Yield Bond Index as a broad measure of market performance in accordance with new regulatory disclosure requirements. The Fund continues to use the Bloomberg U.S. Corporate High-Yield Bond Index as a supplemental benchmark that MML Investment Advisers, LLC believes more closely reflects the market segments in which the Fund invests. |
Performance results reflect any applicable waivers or expense limitations in effect during these periods, without which performance would have been lower. The investment return and principal value of shares of the Fund fluctuate, so your shares, when sold, may be worth more or less than their original cost. Current performance of the Fund may be lower or higher than the performance quoted. Performance data current to the most recent month-end may be obtained at https://www.massmutual.com/product-performance/mutual-funds or by calling 1-888-309-3539 or by sending an email request to fundinfo@massmutual.com.
WHAT ARE SOME KEY FUND STATISTICS? (as of September 30, 2024)
| |
Total Net Assets (Millions) | $399.3 |
Total Number of Portfolio Holdings (includes derivative positions, if any) | 284 |
Total Advisory Fees Paid During the Reporting Period | $1,858,393 |
Portfolio Turnover Rate | 69% |
WHAT DID THE FUND INVEST IN? (as of September 30, 2024)
Derivative values, if any, are excluded from the table(s) below.
| |
Portfolio Characteristics
(% of Total Investments) | |
Corporate Debt | 75.1% |
Bank Loans | 9.2% |
Commercial Paper | 7.5% |
Investment of Cash Collateral from Securities Loaned | 7.5% |
Repurchase Agreement | 0.7% |
HOW HAS THE FUND CHANGED?
The following is a summary of certain changes to the Fund since October 1, 2023. For more complete information, you may review the Fund’s prospectus, including any applicable supplements, at https://www.massmutual.com/product-performance/mutual-funds or upon request at 1-888-309-3539 or fundinfo@massmutual.com.
| MM202912-309770 | PAGE 2 | TSR-AR-ITGF4 |
Effective February 1, 2024, the annual rate for administrative services for Class A shares of the Fund was reduced from 0.30% to 0.25%.
Effective February 1, 2024, MML Investment Advisers, LLC has agreed to cap the fees and expenses of the Fund (other than extraordinary legal and other expenses, Acquired Fund Fees and Expenses, interest expense, expenses related to borrowings, securities lending, leverage, taxes, and brokerage, short sale dividend and loan expense, or other non-recurring or unusual expenses such as organizational expenses and shareholder meeting expenses, as applicable) through January 31, 2025, to the extent that Total Annual Fund Operating Expenses after Expense Reimbursement would otherwise exceed 0.54%, 0.64%, 0.74%, 0.84%, 0.99%, 1.04%, 1.24%, 0.59%, and 1.54% for Classes I, R5, Service, Administrative, R4, A, R3, Y, and C, respectively.
| |
| WHERE CAN I FIND ADDITIONAL INFORMATION ABOUT THE FUND? |
For additional information about the Fund, including its prospectus, financial information, holdings, and proxy voting information, scan the QR code or visit https://www.massmutual.com/product-performance/mutual-funds. |
| MM202912-309770 | PAGE 3 | TSR-AR-ITGF4 |
1000097421077811832121271274912679144271243213688158911000010294108291083610705118071263212518106911076012004100009657108871185312215129911341414926128161413316358
| | |
MassMutual High Yield Fund | |
| Class R4 | MPHRX |
| Annual Shareholder Report | September 30, 2024 |
This annual shareholder report contains important information about the MassMutual High Yield Fund (the “Fund”) for the period of October 1, 2023 to September 30, 2024. You can find additional information about the Fund at https://www.massmutual.com/product-performance/mutual-funds. You can also request this information by contacting us at 1-888-309-3539 or by sending an email request to fundinfo@massmutual.com.
This report describes changes to the Fund that occurred during the reporting period.
WHAT WERE THE FUND COSTS FOR THE LAST YEAR?
This example shows the expenses you would have paid over the past year, based on a hypothetical $10,000 investment. This table reflects any applicable waivers or expense limitations.
| | |
Class Name | Costs of a $10,000 investment | Costs paid as a percentage of a $10,000 investment |
| Class R4 | $109 | 1.01% |
HOW DID THE FUND PERFORM?
Global bond markets were broadly, and strongly, positive for the trailing one-year period. During the period, central banks responded to lower inflation data and began to lower policy interest rates, which was favorable for bond prices and returns. Macroeconomic sentiment centered, particularly more recently, on a soft-landing scenario in the U.S., providing a supportive credit risk environment. During the period, narrowing credit spreads were a positive return driver in the global bond market, in addition to the response to lower bond market yields. This resulted in broad gains across varied market sectors, including government bonds, investment grade and high yield corporate securities, mortgage- and asset-backed instruments, and emerging market issues.
Top contributors to the Fund’s performance relative to the Bloomberg U.S. Corporate High-Yield Bond Index:
• Issue selection among consumer, non-cyclical bonds
• Issue selection among capital goods bonds
• Issue selection in total across all sectors
Top detractors to the Fund’s performance relative to the Bloomberg U.S. Corporate High-Yield Bond Index:
• An out-of-index bank loan allocation as the asset class lagged high yield bond performance
• Interest rate sensitivity primarily from yield curve effect
Performance shown is past performance and does not guarantee future results. The graph and table below do not reflect the deduction of taxes that a shareholder would pay on Fund distributions or redemption of Fund shares. The graph and table below assume reinvestment of dividends and capital gain distributions.
GROWTH OF A HYPOTHETICAL $10,000 INVESTMENT (October 1, 2014 through September 30, 2024)
This graph shows the performance of a hypothetical $10,000 investment in the share class noted over a ten-year period or since inception, if shorter, as compared to the performance of a broad-based securities market index, and, if applicable, one or more indexes that MML Investment Advisers, LLC believes more closely reflects the market segments in which the Fund invests or is a better comparison for the Fund’s investment strategy. This graph includes the deduction of the maximum applicable sales charge, if any.
| MM202912-309770 | PAGE 1 | TSR-AR-ITGFK |
The index or indexes shown above are unmanaged, cannot be purchased directly, and, with the exception of any peer group index, do not incur expenses.
AVERAGE ANNUAL TOTAL RETURNS (%) (as of September 30, 2024)
| | | |
| | 1 Year | 5 Year | 10 Year |
Class R4 - without sales charge | 15.94 | 4.36 | 4.59 |
Bloomberg U.S. Aggregate Bond Index1 | 11.57 | 0.33 | 1.84 |
Bloomberg U.S. Corporate High-Yield Bond Index | 15.74 | 4.72 | 5.04 |
| 1 | Effective July 24, 2024, the Bloomberg U.S. Aggregate Bond Index replaced the Bloomberg U.S. Corporate High-Yield Bond Index as a broad measure of market performance in accordance with new regulatory disclosure requirements. The Fund continues to use the Bloomberg U.S. Corporate High-Yield Bond Index as a supplemental benchmark that MML Investment Advisers, LLC believes more closely reflects the market segments in which the Fund invests. |
Performance results reflect any applicable waivers or expense limitations in effect during these periods, without which performance would have been lower. The investment return and principal value of shares of the Fund fluctuate, so your shares, when sold, may be worth more or less than their original cost. Current performance of the Fund may be lower or higher than the performance quoted. Performance data current to the most recent month-end may be obtained at https://www.massmutual.com/product-performance/mutual-funds or by calling 1-888-309-3539 or by sending an email request to fundinfo@massmutual.com.
WHAT ARE SOME KEY FUND STATISTICS? (as of September 30, 2024)
| |
Total Net Assets (Millions) | $399.3 |
Total Number of Portfolio Holdings (includes derivative positions, if any) | 284 |
Total Advisory Fees Paid During the Reporting Period | $1,858,393 |
Portfolio Turnover Rate | 69% |
WHAT DID THE FUND INVEST IN? (as of September 30, 2024)
Derivative values, if any, are excluded from the table(s) below.
| |
Portfolio Characteristics
(% of Total Investments) | |
Corporate Debt | 75.1% |
Bank Loans | 9.2% |
Commercial Paper | 7.5% |
Investment of Cash Collateral from Securities Loaned | 7.5% |
Repurchase Agreement | 0.7% |
HOW HAS THE FUND CHANGED?
The following is a summary of certain changes to the Fund since October 1, 2023. For more complete information, you may review the Fund’s prospectus, including any applicable supplements, at https://www.massmutual.com/product-performance/mutual-funds or upon request at 1-888-309-3539 or fundinfo@massmutual.com.
| MM202912-309770 | PAGE 2 | TSR-AR-ITGFK |
Effective February 1, 2024, the annual rate for administrative services for Class A shares of the Fund was reduced from 0.30% to 0.25%.
Effective February 1, 2024, MML Investment Advisers, LLC has agreed to cap the fees and expenses of the Fund (other than extraordinary legal and other expenses, Acquired Fund Fees and Expenses, interest expense, expenses related to borrowings, securities lending, leverage, taxes, and brokerage, short sale dividend and loan expense, or other non-recurring or unusual expenses such as organizational expenses and shareholder meeting expenses, as applicable) through January 31, 2025, to the extent that Total Annual Fund Operating Expenses after Expense Reimbursement would otherwise exceed 0.54%, 0.64%, 0.74%, 0.84%, 0.99%, 1.04%, 1.24%, 0.59%, and 1.54% for Classes I, R5, Service, Administrative, R4, A, R3, Y, and C, respectively.
| |
| WHERE CAN I FIND ADDITIONAL INFORMATION ABOUT THE FUND? |
For additional information about the Fund, including its prospectus, financial information, holdings, and proxy voting information, scan the QR code or visit https://www.massmutual.com/product-performance/mutual-funds. |
| MM202912-309770 | PAGE 3 | TSR-AR-ITGFK |
1000097331074911787120581265712562142871228413513156671000010294108291083610705118071263212518106911076012004100009657108871185312215129911341414926128161413316358
| | |
MassMutual High Yield Fund | |
| Class A | MPHAX |
| Annual Shareholder Report | September 30, 2024 |
This annual shareholder report contains important information about the MassMutual High Yield Fund (the “Fund”) for the period of October 1, 2023 to September 30, 2024. You can find additional information about the Fund at https://www.massmutual.com/product-performance/mutual-funds. You can also request this information by contacting us at 1-888-309-3539 or by sending an email request to fundinfo@massmutual.com.
This report describes changes to the Fund that occurred during the reporting period.
WHAT WERE THE FUND COSTS FOR THE LAST YEAR?
This example shows the expenses you would have paid over the past year, based on a hypothetical $10,000 investment. This table reflects any applicable waivers or expense limitations.
| | |
Class Name | Costs of a $10,000 investment | Costs paid as a percentage of a $10,000 investment |
| Class A | $117 | 1.08% |
HOW DID THE FUND PERFORM?
Global bond markets were broadly, and strongly, positive for the trailing one-year period. During the period, central banks responded to lower inflation data and began to lower policy interest rates, which was favorable for bond prices and returns. Macroeconomic sentiment centered, particularly more recently, on a soft-landing scenario in the U.S., providing a supportive credit risk environment. During the period, narrowing credit spreads were a positive return driver in the global bond market, in addition to the response to lower bond market yields. This resulted in broad gains across varied market sectors, including government bonds, investment grade and high yield corporate securities, mortgage- and asset-backed instruments, and emerging market issues.
Top contributors to the Fund’s performance relative to the Bloomberg U.S. Corporate High-Yield Bond Index:
• Issue selection among consumer, non-cyclical bonds
• Issue selection among capital goods bonds
• Issue selection in total across all sectors
Top detractors to the Fund’s performance relative to the Bloomberg U.S. Corporate High-Yield Bond Index:
• An out-of-index bank loan allocation as the asset class lagged high yield bond performance
• Interest rate sensitivity primarily from yield curve effect
Performance shown is past performance and does not guarantee future results. The graph and table below do not reflect the deduction of taxes that a shareholder would pay on Fund distributions or redemption of Fund shares. The graph and table below assume reinvestment of dividends and capital gain distributions.
GROWTH OF A HYPOTHETICAL $10,000 INVESTMENT (October 1, 2014 through September 30, 2024)
This graph shows the performance of a hypothetical $10,000 investment in the share class noted over a ten-year period or since inception, if shorter, as compared to the performance of a broad-based securities market index, and, if applicable, one or more indexes that MML Investment Advisers, LLC believes more closely reflects the market segments in which the Fund invests or is a better comparison for the Fund’s investment strategy. This graph includes the deduction of the maximum applicable sales charge, if any.
| MM202912-309770 | PAGE 1 | TSR-AR-ITGF2 |
The index or indexes shown above are unmanaged, cannot be purchased directly, and, with the exception of any peer group index, do not incur expenses.
AVERAGE ANNUAL TOTAL RETURNS (%) (as of September 30, 2024)
| | | |
| | 1 Year | 5 Year | 10 Year |
Class A - without sales charge | 15.86 | 4.24 | 4.48 |
Class A - with maximum sales charge | 10.94 | 3.34 | 4.03 |
Bloomberg U.S. Aggregate Bond Index1 | 11.57 | 0.33 | 1.84 |
Bloomberg U.S. Corporate High-Yield Bond Index | 15.74 | 4.72 | 5.04 |
| 1 | Effective July 24, 2024, the Bloomberg U.S. Aggregate Bond Index replaced the Bloomberg U.S. Corporate High-Yield Bond Index as a broad measure of market performance in accordance with new regulatory disclosure requirements. The Fund continues to use the Bloomberg U.S. Corporate High-Yield Bond Index as a supplemental benchmark that MML Investment Advisers, LLC believes more closely reflects the market segments in which the Fund invests. |
Performance results reflect any applicable waivers or expense limitations in effect during these periods, without which performance would have been lower. The investment return and principal value of shares of the Fund fluctuate, so your shares, when sold, may be worth more or less than their original cost. Current performance of the Fund may be lower or higher than the performance quoted. Performance data current to the most recent month-end may be obtained at https://www.massmutual.com/product-performance/mutual-funds or by calling 1-888-309-3539 or by sending an email request to fundinfo@massmutual.com.
WHAT ARE SOME KEY FUND STATISTICS? (as of September 30, 2024)
| |
Total Net Assets (Millions) | $399.3 |
Total Number of Portfolio Holdings (includes derivative positions, if any) | 284 |
Total Advisory Fees Paid During the Reporting Period | $1,858,393 |
Portfolio Turnover Rate | 69% |
WHAT DID THE FUND INVEST IN? (as of September 30, 2024)
Derivative values, if any, are excluded from the table(s) below.
| |
Portfolio Characteristics
(% of Total Investments) | |
Corporate Debt | 75.1% |
Bank Loans | 9.2% |
Commercial Paper | 7.5% |
Investment of Cash Collateral from Securities Loaned | 7.5% |
Repurchase Agreement | 0.7% |
HOW HAS THE FUND CHANGED?
The following is a summary of certain changes to the Fund since October 1, 2023. For more complete information, you may review the Fund’s prospectus, including any applicable supplements, at
| MM202912-309770 | PAGE 2 | TSR-AR-ITGF2 |
https://www.massmutual.com/product-performance/mutual-funds or upon request at 1-888-309-3539 or fundinfo@massmutual.com.
Effective February 1, 2024, the annual rate for administrative services for Class A shares of the Fund was reduced from 0.30% to 0.25%.
Effective February 1, 2024, MML Investment Advisers, LLC has agreed to cap the fees and expenses of the Fund (other than extraordinary legal and other expenses, Acquired Fund Fees and Expenses, interest expense, expenses related to borrowings, securities lending, leverage, taxes, and brokerage, short sale dividend and loan expense, or other non-recurring or unusual expenses such as organizational expenses and shareholder meeting expenses, as applicable) through January 31, 2025, to the extent that Total Annual Fund Operating Expenses after Expense Reimbursement would otherwise exceed 0.54%, 0.64%, 0.74%, 0.84%, 0.99%, 1.04%, 1.24%, 0.59%, and 1.54% for Classes I, R5, Service, Administrative, R4, A, R3, Y, and C, respectively.
| |
| WHERE CAN I FIND ADDITIONAL INFORMATION ABOUT THE FUND? |
For additional information about the Fund, including its prospectus, financial information, holdings, and proxy voting information, scan the QR code or visit https://www.massmutual.com/product-performance/mutual-funds. |
| MM202912-309770 | PAGE 3 | TSR-AR-ITGF2 |
957593081026811245114941205611958135901166212809148401000010294108291083610705118071263212518106911076012004100009657108871185312215129911341414926128161413316358
| | |
MassMutual High Yield Fund | |
| Class R3 | MPHNX |
| Annual Shareholder Report | September 30, 2024 |
This annual shareholder report contains important information about the MassMutual High Yield Fund (the “Fund”) for the period of October 1, 2023 to September 30, 2024. You can find additional information about the Fund at https://www.massmutual.com/product-performance/mutual-funds. You can also request this information by contacting us at 1-888-309-3539 or by sending an email request to fundinfo@massmutual.com.
This report describes changes to the Fund that occurred during the reporting period.
WHAT WERE THE FUND COSTS FOR THE LAST YEAR?
This example shows the expenses you would have paid over the past year, based on a hypothetical $10,000 investment. This table reflects any applicable waivers or expense limitations.
| | |
Class Name | Costs of a $10,000 investment | Costs paid as a percentage of a $10,000 investment |
| Class R3 | $136 | 1.26% |
HOW DID THE FUND PERFORM?
Global bond markets were broadly, and strongly, positive for the trailing one-year period. During the period, central banks responded to lower inflation data and began to lower policy interest rates, which was favorable for bond prices and returns. Macroeconomic sentiment centered, particularly more recently, on a soft-landing scenario in the U.S., providing a supportive credit risk environment. During the period, narrowing credit spreads were a positive return driver in the global bond market, in addition to the response to lower bond market yields. This resulted in broad gains across varied market sectors, including government bonds, investment grade and high yield corporate securities, mortgage- and asset-backed instruments, and emerging market issues.
Top contributors to the Fund’s performance relative to the Bloomberg U.S. Corporate High-Yield Bond Index:
• Issue selection among consumer, non-cyclical bonds
• Issue selection among capital goods bonds
• Issue selection in total across all sectors
Top detractors to the Fund’s performance relative to the Bloomberg U.S. Corporate High-Yield Bond Index:
• An out-of-index bank loan allocation as the asset class lagged high yield bond performance
• Interest rate sensitivity primarily from yield curve effect
Performance shown is past performance and does not guarantee future results. The graph and table below do not reflect the deduction of taxes that a shareholder would pay on Fund distributions or redemption of Fund shares. The graph and table below assume reinvestment of dividends and capital gain distributions.
GROWTH OF A HYPOTHETICAL $10,000 INVESTMENT (October 1, 2014 through September 30, 2024)
This graph shows the performance of a hypothetical $10,000 investment in the share class noted over a ten-year period or since inception, if shorter, as compared to the performance of a broad-based securities market index, and, if applicable, one or more indexes that MML Investment Advisers, LLC believes more closely reflects the market segments in which the Fund invests or is a better comparison for the Fund’s investment strategy. This graph includes the deduction of the maximum applicable sales charge, if any.
| MM202912-309770 | PAGE 1 | TSR-AR-ITGF5 |
The index or indexes shown above are unmanaged, cannot be purchased directly, and, with the exception of any peer group index, do not incur expenses.
AVERAGE ANNUAL TOTAL RETURNS (%) (as of September 30, 2024)
| | | |
| | 1 Year | 5 Year | 10 Year |
Class R3 - without sales charge | 15.67 | 4.08 | 4.32 |
Bloomberg U.S. Aggregate Bond Index1 | 11.57 | 0.33 | 1.84 |
Bloomberg U.S. Corporate High-Yield Bond Index | 15.74 | 4.72 | 5.04 |
| 1 | Effective July 24, 2024, the Bloomberg U.S. Aggregate Bond Index replaced the Bloomberg U.S. Corporate High-Yield Bond Index as a broad measure of market performance in accordance with new regulatory disclosure requirements. The Fund continues to use the Bloomberg U.S. Corporate High-Yield Bond Index as a supplemental benchmark that MML Investment Advisers, LLC believes more closely reflects the market segments in which the Fund invests. |
Performance results reflect any applicable waivers or expense limitations in effect during these periods, without which performance would have been lower. The investment return and principal value of shares of the Fund fluctuate, so your shares, when sold, may be worth more or less than their original cost. Current performance of the Fund may be lower or higher than the performance quoted. Performance data current to the most recent month-end may be obtained at https://www.massmutual.com/product-performance/mutual-funds or by calling 1-888-309-3539 or by sending an email request to fundinfo@massmutual.com.
WHAT ARE SOME KEY FUND STATISTICS? (as of September 30, 2024)
| |
Total Net Assets (Millions) | $399.3 |
Total Number of Portfolio Holdings (includes derivative positions, if any) | 284 |
Total Advisory Fees Paid During the Reporting Period | $1,858,393 |
Portfolio Turnover Rate | 69% |
WHAT DID THE FUND INVEST IN? (as of September 30, 2024)
Derivative values, if any, are excluded from the table(s) below.
| |
Portfolio Characteristics
(% of Total Investments) | |
Corporate Debt | 75.1% |
Bank Loans | 9.2% |
Commercial Paper | 7.5% |
Investment of Cash Collateral from Securities Loaned | 7.5% |
Repurchase Agreement | 0.7% |
HOW HAS THE FUND CHANGED?
The following is a summary of certain changes to the Fund since October 1, 2023. For more complete information, you may review the Fund’s prospectus, including any applicable supplements, at https://www.massmutual.com/product-performance/mutual-funds or upon request at 1-888-309-3539 or fundinfo@massmutual.com.
| MM202912-309770 | PAGE 2 | TSR-AR-ITGF5 |
Effective February 1, 2024, the annual rate for administrative services for Class A shares of the Fund was reduced from 0.30% to 0.25%.
Effective February 1, 2024, MML Investment Advisers, LLC has agreed to cap the fees and expenses of the Fund (other than extraordinary legal and other expenses, Acquired Fund Fees and Expenses, interest expense, expenses related to borrowings, securities lending, leverage, taxes, and brokerage, short sale dividend and loan expense, or other non-recurring or unusual expenses such as organizational expenses and shareholder meeting expenses, as applicable) through January 31, 2025, to the extent that Total Annual Fund Operating Expenses after Expense Reimbursement would otherwise exceed 0.54%, 0.64%, 0.74%, 0.84%, 0.99%, 1.04%, 1.24%, 0.59%, and 1.54% for Classes I, R5, Service, Administrative, R4, A, R3, Y, and C, respectively.
| |
| WHERE CAN I FIND ADDITIONAL INFORMATION ABOUT THE FUND? |
For additional information about the Fund, including its prospectus, financial information, holdings, and proxy voting information, scan the QR code or visit https://www.massmutual.com/product-performance/mutual-funds. |
| MM202912-309770 | PAGE 3 | TSR-AR-ITGF5 |
1000097091069211700119391250112382140421204113200152691000010294108291083610705118071263212518106911076012004100009657108871185312215129911341414926128161413316358
| | |
MassMutual High Yield Fund | |
| Class Y | BXHYX |
| Annual Shareholder Report | September 30, 2024 |
This annual shareholder report contains important information about the MassMutual High Yield Fund (the “Fund”) for the period of October 1, 2023 to September 30, 2024. You can find additional information about the Fund at https://www.massmutual.com/product-performance/mutual-funds. You can also request this information by contacting us at 1-888-309-3539 or by sending an email request to fundinfo@massmutual.com.
This report describes changes to the Fund that occurred during the reporting period.
WHAT WERE THE FUND COSTS FOR THE LAST YEAR?
This example shows the expenses you would have paid over the past year, based on a hypothetical $10,000 investment. This table reflects any applicable waivers or expense limitations.
| | |
Class Name | Costs of a $10,000 investment | Costs paid as a percentage of a $10,000 investment |
| Class Y | $66 | 0.61% |
HOW DID THE FUND PERFORM?
Global bond markets were broadly, and strongly, positive for the trailing one-year period. During the period, central banks responded to lower inflation data and began to lower policy interest rates, which was favorable for bond prices and returns. Macroeconomic sentiment centered, particularly more recently, on a soft-landing scenario in the U.S., providing a supportive credit risk environment. During the period, narrowing credit spreads were a positive return driver in the global bond market, in addition to the response to lower bond market yields. This resulted in broad gains across varied market sectors, including government bonds, investment grade and high yield corporate securities, mortgage- and asset-backed instruments, and emerging market issues.
Top contributors to the Fund’s performance relative to the Bloomberg U.S. Corporate High-Yield Bond Index:
• Issue selection among consumer, non-cyclical bonds
• Issue selection among capital goods bonds
• Issue selection in total across all sectors
Top detractors to the Fund’s performance relative to the Bloomberg U.S. Corporate High-Yield Bond Index:
• An out-of-index bank loan allocation as the asset class lagged high yield bond performance
• Interest rate sensitivity primarily from yield curve effect
Performance shown is past performance and does not guarantee future results. The graph and table below do not reflect the deduction of taxes that a shareholder would pay on Fund distributions or redemption of Fund shares. The graph and table below assume reinvestment of dividends and capital gain distributions.
GROWTH OF A HYPOTHETICAL $10,000 INVESTMENT (December 13, 2021 through September 30, 2024)
This graph shows the performance of a hypothetical $10,000 investment in the share class noted over a ten-year period or since inception, if shorter, as compared to the performance of a broad-based securities market index, and, if applicable, one or more indexes that MML Investment Advisers, LLC believes more closely reflects the market segments in which the Fund invests or is a better comparison for the Fund’s investment strategy. This graph includes the deduction of the maximum applicable sales charge, if any.
| MM202912-309770 | PAGE 1 | TSR-AR-ITGF7 |
The index or indexes shown above are unmanaged, cannot be purchased directly, and, with the exception of any peer group index, do not incur expenses.
AVERAGE ANNUAL TOTAL RETURNS (%) (as of September 30, 2024)
| | |
| | 1 Year | Since Inception
(12/13/2021) |
Class Y - without sales charge | 16.27 | 3.71 |
Bloomberg U.S. Aggregate Bond Index1 | 11.57 | -1.44 |
Bloomberg U.S. Corporate High-Yield Bond Index | 15.74 | 3.35 |
| 1 | Effective July 24, 2024, the Bloomberg U.S. Aggregate Bond Index replaced the Bloomberg U.S. Corporate High-Yield Bond Index as a broad measure of market performance in accordance with new regulatory disclosure requirements. The Fund continues to use the Bloomberg U.S. Corporate High-Yield Bond Index as a supplemental benchmark that MML Investment Advisers, LLC believes more closely reflects the market segments in which the Fund invests. |
Performance results reflect any applicable waivers or expense limitations in effect during these periods, without which performance would have been lower. The investment return and principal value of shares of the Fund fluctuate, so your shares, when sold, may be worth more or less than their original cost. Current performance of the Fund may be lower or higher than the performance quoted. Performance data current to the most recent month-end may be obtained at https://www.massmutual.com/product-performance/mutual-funds or by calling 1-888-309-3539 or by sending an email request to fundinfo@massmutual.com.
WHAT ARE SOME KEY FUND STATISTICS? (as of September 30, 2024)
| |
Total Net Assets (Millions) | $399.3 |
Total Number of Portfolio Holdings (includes derivative positions, if any) | 284 |
Total Advisory Fees Paid During the Reporting Period | $1,858,393 |
Portfolio Turnover Rate | 69% |
WHAT DID THE FUND INVEST IN? (as of September 30, 2024)
Derivative values, if any, are excluded from the table(s) below.
| |
Portfolio Characteristics
(% of Total Investments) | |
Corporate Debt | 75.1% |
Bank Loans | 9.2% |
Commercial Paper | 7.5% |
Investment of Cash Collateral from Securities Loaned | 7.5% |
Repurchase Agreement | 0.7% |
HOW HAS THE FUND CHANGED?
The following is a summary of certain changes to the Fund since October 1, 2023. For more complete information, you may review the Fund’s prospectus, including any applicable supplements, at
| MM202912-309770 | PAGE 2 | TSR-AR-ITGF7 |
https://www.massmutual.com/product-performance/mutual-funds or upon request at 1-888-309-3539 or fundinfo@massmutual.com.
Effective February 1, 2024, the annual rate for administrative services for Class A shares of the Fund was reduced from 0.30% to 0.25%.
Effective February 1, 2024, MML Investment Advisers, LLC has agreed to cap the fees and expenses of the Fund (other than extraordinary legal and other expenses, Acquired Fund Fees and Expenses, interest expense, expenses related to borrowings, securities lending, leverage, taxes, and brokerage, short sale dividend and loan expense, or other non-recurring or unusual expenses such as organizational expenses and shareholder meeting expenses, as applicable) through January 31, 2025, to the extent that Total Annual Fund Operating Expenses after Expense Reimbursement would otherwise exceed 0.54%, 0.64%, 0.74%, 0.84%, 0.99%, 1.04%, 1.24%, 0.59%, and 1.54% for Classes I, R5, Service, Administrative, R4, A, R3, Y, and C, respectively.
| |
| WHERE CAN I FIND ADDITIONAL INFORMATION ABOUT THE FUND? |
For additional information about the Fund, including its prospectus, financial information, holdings, and proxy voting information, scan the QR code or visit https://www.massmutual.com/product-performance/mutual-funds. |
| MM202912-309770 | PAGE 3 | TSR-AR-ITGF7 |
10000862295261107510000855186069601100008594947710969
| | |
MassMutual High Yield Fund | |
| Class C | BXHCX |
| Annual Shareholder Report | September 30, 2024 |
This annual shareholder report contains important information about the MassMutual High Yield Fund (the “Fund”) for the period of October 1, 2023 to September 30, 2024. You can find additional information about the Fund at https://www.massmutual.com/product-performance/mutual-funds. You can also request this information by contacting us at 1-888-309-3539 or by sending an email request to fundinfo@massmutual.com.
This report describes changes to the Fund that occurred during the reporting period.
WHAT WERE THE FUND COSTS FOR THE LAST YEAR?
This example shows the expenses you would have paid over the past year, based on a hypothetical $10,000 investment. This table reflects any applicable waivers or expense limitations.
| | |
Class Name | Costs of a $10,000 investment | Costs paid as a percentage of a $10,000 investment |
| Class C | $168 | 1.56% |
HOW DID THE FUND PERFORM?
Global bond markets were broadly, and strongly, positive for the trailing one-year period. During the period, central banks responded to lower inflation data and began to lower policy interest rates, which was favorable for bond prices and returns. Macroeconomic sentiment centered, particularly more recently, on a soft-landing scenario in the U.S., providing a supportive credit risk environment. During the period, narrowing credit spreads were a positive return driver in the global bond market, in addition to the response to lower bond market yields. This resulted in broad gains across varied market sectors, including government bonds, investment grade and high yield corporate securities, mortgage- and asset-backed instruments, and emerging market issues.
Top contributors to the Fund’s performance relative to the Bloomberg U.S. Corporate High-Yield Bond Index:
• Issue selection among consumer, non-cyclical bonds
• Issue selection among capital goods bonds
• Issue selection in total across all sectors
Top detractors to the Fund’s performance relative to the Bloomberg U.S. Corporate High-Yield Bond Index:
• An out-of-index bank loan allocation as the asset class lagged high yield bond performance
• Interest rate sensitivity primarily from yield curve effect
Performance shown is past performance and does not guarantee future results. The graph and table below do not reflect the deduction of taxes that a shareholder would pay on Fund distributions or redemption of Fund shares. The graph and table below assume reinvestment of dividends and capital gain distributions.
GROWTH OF A HYPOTHETICAL $10,000 INVESTMENT (December 13, 2021 through September 30, 2024)
This graph shows the performance of a hypothetical $10,000 investment in the share class noted over a ten-year period or since inception, if shorter, as compared to the performance of a broad-based securities market index, and, if applicable, one or more indexes that MML Investment Advisers, LLC believes more closely reflects the market segments in which the Fund invests or is a better comparison for the Fund’s investment strategy. This graph includes the deduction of the maximum applicable sales charge, if any.
| MM202912-309770 | PAGE 1 | TSR-AR-ITGF8 |
The index or indexes shown above are unmanaged, cannot be purchased directly, and, with the exception of any peer group index, do not incur expenses.
AVERAGE ANNUAL TOTAL RETURNS (%) (as of September 30, 2024)
| | |
| | 1 Year | Since Inception
(12/13/2021) |
Class C - without sales charge | 15.35 | 2.81 |
Class C - with maximum sales charge | 14.35 | 2.81 |
Bloomberg U.S. Aggregate Bond Index1 | 11.57 | -1.44 |
Bloomberg U.S. Corporate High-Yield Bond Index | 15.74 | 3.35 |
| 1 | Effective July 24, 2024, the Bloomberg U.S. Aggregate Bond Index replaced the Bloomberg U.S. Corporate High-Yield Bond Index as a broad measure of market performance in accordance with new regulatory disclosure requirements. The Fund continues to use the Bloomberg U.S. Corporate High-Yield Bond Index as a supplemental benchmark that MML Investment Advisers, LLC believes more closely reflects the market segments in which the Fund invests. |
Performance results reflect any applicable waivers or expense limitations in effect during these periods, without which performance would have been lower. The investment return and principal value of shares of the Fund fluctuate, so your shares, when sold, may be worth more or less than their original cost. Current performance of the Fund may be lower or higher than the performance quoted. Performance data current to the most recent month-end may be obtained at https://www.massmutual.com/product-performance/mutual-funds or by calling 1-888-309-3539 or by sending an email request to fundinfo@massmutual.com.
WHAT ARE SOME KEY FUND STATISTICS? (as of September 30, 2024)
| |
Total Net Assets (Millions) | $399.3 |
Total Number of Portfolio Holdings (includes derivative positions, if any) | 284 |
Total Advisory Fees Paid During the Reporting Period | $1,858,393 |
Portfolio Turnover Rate | 69% |
WHAT DID THE FUND INVEST IN? (as of September 30, 2024)
Derivative values, if any, are excluded from the table(s) below.
| |
Portfolio Characteristics
(% of Total Investments) | |
Corporate Debt | 75.1% |
Bank Loans | 9.2% |
Commercial Paper | 7.5% |
Investment of Cash Collateral from Securities Loaned | 7.5% |
Repurchase Agreement | 0.7% |
HOW HAS THE FUND CHANGED?
The following is a summary of certain changes to the Fund since October 1, 2023. For more complete information, you may review the Fund’s prospectus, including any applicable supplements, at
| MM202912-309770 | PAGE 2 | TSR-AR-ITGF8 |
https://www.massmutual.com/product-performance/mutual-funds or upon request at 1-888-309-3539 or fundinfo@massmutual.com.
Effective February 1, 2024, the annual rate for administrative services for Class A shares of the Fund was reduced from 0.30% to 0.25%.
Effective February 1, 2024, MML Investment Advisers, LLC has agreed to cap the fees and expenses of the Fund (other than extraordinary legal and other expenses, Acquired Fund Fees and Expenses, interest expense, expenses related to borrowings, securities lending, leverage, taxes, and brokerage, short sale dividend and loan expense, or other non-recurring or unusual expenses such as organizational expenses and shareholder meeting expenses, as applicable) through January 31, 2025, to the extent that Total Annual Fund Operating Expenses after Expense Reimbursement would otherwise exceed 0.54%, 0.64%, 0.74%, 0.84%, 0.99%, 1.04%, 1.24%, 0.59%, and 1.54% for Classes I, R5, Service, Administrative, R4, A, R3, Y, and C, respectively.
| |
| WHERE CAN I FIND ADDITIONAL INFORMATION ABOUT THE FUND? |
For additional information about the Fund, including its prospectus, financial information, holdings, and proxy voting information, scan the QR code or visit https://www.massmutual.com/product-performance/mutual-funds. |
| MM202912-309770 | PAGE 3 | TSR-AR-ITGF8 |
10000856293691080710000855186069601100008594947710969
| | |
MassMutual Balanced Fund | |
| Class I | MBBIX |
| Annual Shareholder Report | September 30, 2024 |
This annual shareholder report contains important information about the MassMutual Balanced Fund (the “Fund”) for the period of October 1, 2023 to September 30, 2024. You can find additional information about the Fund at https://www.massmutual.com/product-performance/mutual-funds. You can also request this information by contacting us at 1-888-309-3539 or by sending an email request to fundinfo@massmutual.com.
This report describes changes to the Fund that occurred during the reporting period.
WHAT WERE THE FUND COSTS FOR THE LAST YEAR?
This example shows the expenses you would have paid over the past year, based on a hypothetical $10,000 investment. This table reflects any applicable waivers or expense limitations.
| | |
Class Name | Costs of a $10,000 investment | Costs paid as a percentage of a $10,000 investment |
| Class I | $93 | 0.82% |
HOW DID THE FUND PERFORM?
Global equity markets advanced sharply as they weathered the unsettled geopolitical climate and higher interest rate environment well.
Geopolitical tensions remained high amid continued and escalating conflicts in Ukraine and the Middle East. In the U.S., the Federal Reserve continued its attempts to engineer a ‘soft landing’ and delivered a long-awaited cut in interest rates, with a 50bps cut in September. Domestic stocks advanced over the trailing 12-months as growth outperformed value and large cap shares outperformed their small cap counterparts in the period.
Global bond markets were broadly, and strongly, positive for the trailing one-year period. During the period, central banks responded to lower inflation data and began to lower policy interest rates, which was favorable for bond prices and returns. Macroeconomic sentiment centered, particularly more recently, on a soft-landing scenario in the U.S., providing a supportive credit risk environment. During the period, narrowing credit spreads were a positive return driver in the global bond market, in addition to the response to lower bond market yields. This resulted in broad gains across varied market sectors, including government bonds, investment grade and high yield corporate securities, mortgage- and asset-backed instruments, and emerging market issues.
Top contributors to the Fund’s performance relative to the Custom Balanced Index:
• An overweight allocation to the information technology sector in the equity component
• Stock selection within the energy sector in the equity component
• An overweight allocation to securitized issuers in the fixed income component
Top detractors to the Fund’s performance relative to the Custom Balanced Index:
• Stock selection within the industrials sector of the equity component
• Stock selection within the consumer staples sector of the equity component
• Weak security selection within the Treasury sector of the fixed income component
Performance shown is past performance and does not guarantee future results. The graph and table below do not reflect the deduction of taxes that a shareholder would pay on Fund distributions or redemption of Fund shares. The graph and table below assume reinvestment of dividends and capital gain distributions.
GROWTH OF A HYPOTHETICAL $10,000 INVESTMENT (October 1, 2014 through September 30, 2024)
This graph shows the performance of a hypothetical $10,000 investment in the share class noted over a ten-year period or since inception, if shorter, as compared to the performance of a broad-based securities market index, and, if applicable, one or more indexes that MML Investment Advisers, LLC believes more closely reflects the market segments in which the
| MM202912-309770 | PAGE 1 | TSR-AR-ITGCI |
Fund invests or is a better comparison for the Fund’s investment strategy. This graph includes the deduction of the maximum applicable sales charge, if any.
The index or indexes shown above are unmanaged, cannot be purchased directly, and, with the exception of any peer group index, do not incur expenses.
AVERAGE ANNUAL TOTAL RETURNS (%) (as of September 30, 2024)
| | | |
| | 1 Year | 5 Year | 10 Year |
Class I - without sales charge | 26.09 | 9.59 | 8.06 |
Russell 3000 Index1 | 35.19 | 15.26 | 12.83 |
Lipper Balanced Fund Index | 22.30 | 8.15 | 7.16 |
Custom Balanced Index | 27.24 | 10.56 | 9.46 |
S&P 500 Index | 36.35 | 15.98 | 13.38 |
| 1 | Effective July 24, 2024, the Russell 3000 Index replaced the S&P 500 Index as a broad measure of market performance in accordance with new regulatory disclosure requirements. |
The Custom Balanced Index comprises the S&P 500 Index and Bloomberg U.S. Aggregate Bond Index. The weightings of each index are 65% and 35%, respectively.
The Fund’s investment objective and investment strategy changed on November 18, 2020. The performance results shown above would not necessarily have been achieved had the Fund’s current investment strategy been in effect for the entire period for which performance results are presented.
Performance results reflect any applicable waivers or expense limitations in effect during these periods, without which performance would have been lower. The investment return and principal value of shares of the Fund fluctuate, so your shares, when sold, may be worth more or less than their original cost. Current performance of the Fund may be lower or higher than the performance quoted. Performance data current to the most recent month-end may be obtained at https://www.massmutual.com/product-performance/mutual-funds or by calling 1-888-309-3539 or by sending an email request to fundinfo@massmutual.com.
WHAT ARE SOME KEY FUND STATISTICS? (as of September 30, 2024)
| |
Total Net Assets (Millions) | $107.6 |
Total Number of Portfolio Holdings (includes derivative positions, if any) | 536 |
Total Advisory Fees Paid During the Reporting Period | $499,673 |
Portfolio Turnover Rate | 130% |
| MM202912-309770 | PAGE 2 | TSR-AR-ITGCI |
WHAT DID THE FUND INVEST IN? (as of September 30, 2024)
Derivative values, if any, are excluded from the table(s) below.
| |
Largest Holdings
(% of Total Investments) | |
Apple, Inc. | 4.7% |
Microsoft Corp. | 4.2% |
NVIDIA Corp. | 3.9% |
U.S. Treasury Notes 3.875% due 08/15/34 | 1.5% |
Broadcom, Inc. | 1.3% |
Uniform Mortgage-Backed Security, TBA 2.000% due 10/01/39 | 1.2% |
U.S. Treasury Bonds 4.125% due 08/15/44 | 1.2% |
Federal National Mortgage Association 2.000% due 10/01/51 | 1.2% |
Home Depot, Inc. | 1.2% |
Visa, Inc. Class A | 1.1% |
| |
Portfolio Characteristics
(% of Total Investments) | |
Common Stock | 63.0% |
U.S. Treasury Obligations | 11.2% |
Corporate Debt | 10.7% |
U.S. Government Agency Obligations and Instrumentalities | 9.6% |
Non-U.S. Government Agency Obligations | 3.4% |
Repurchase Agreement | 2.1% |
U.S. Treasury Bills | 0.0% |
HOW HAS THE FUND CHANGED?
The following is a summary of certain changes to the Fund since October 1, 2023. For more complete information, you may review the Fund’s prospectus, including any applicable supplements, at https://www.massmutual.com/product-performance/mutual-funds or upon request at 1-888-309-3539 or fundinfo@massmutual.com.
Effective February 1, 2024, the annual rate for administrative services for Class A shares of the Fund was reduced from 0.30% to 0.25%.
| |
| WHERE CAN I FIND ADDITIONAL INFORMATION ABOUT THE FUND? |
For additional information about the Fund, including its prospectus, financial information, holdings, and proxy voting information, scan the QR code or visit https://www.massmutual.com/product-performance/mutual-funds. |
| MM202912-309770 | PAGE 3 | TSR-AR-ITGCI |
1000098041078012223134721372815032179781552317212217031000099511144013579159671643318898249212052824729334321000098941084812032128631349814711174531467816327199681000010077112801261513998149461687119992170121940524692100009939114721360716044167271926025040211652574135098
| | |
MassMutual Balanced Fund | |
| Class R5 | MBLDX |
| Annual Shareholder Report | September 30, 2024 |
This annual shareholder report contains important information about the MassMutual Balanced Fund (the “Fund”) for the period of October 1, 2023 to September 30, 2024. You can find additional information about the Fund at https://www.massmutual.com/product-performance/mutual-funds. You can also request this information by contacting us at 1-888-309-3539 or by sending an email request to fundinfo@massmutual.com.
This report describes changes to the Fund that occurred during the reporting period.
WHAT WERE THE FUND COSTS FOR THE LAST YEAR?
This example shows the expenses you would have paid over the past year, based on a hypothetical $10,000 investment. This table reflects any applicable waivers or expense limitations.
| | |
Class Name | Costs of a $10,000 investment | Costs paid as a percentage of a $10,000 investment |
| Class R5 | $103 | 0.91% |
HOW DID THE FUND PERFORM?
Global equity markets advanced sharply as they weathered the unsettled geopolitical climate and higher interest rate environment well.
Geopolitical tensions remained high amid continued and escalating conflicts in Ukraine and the Middle East. In the U.S., the Federal Reserve continued its attempts to engineer a ‘soft landing’ and delivered a long-awaited cut in interest rates, with a 50bps cut in September. Domestic stocks advanced over the trailing 12-months as growth outperformed value and large cap shares outperformed their small cap counterparts in the period.
Global bond markets were broadly, and strongly, positive for the trailing one-year period. During the period, central banks responded to lower inflation data and began to lower policy interest rates, which was favorable for bond prices and returns. Macroeconomic sentiment centered, particularly more recently, on a soft-landing scenario in the U.S., providing a supportive credit risk environment. During the period, narrowing credit spreads were a positive return driver in the global bond market, in addition to the response to lower bond market yields. This resulted in broad gains across varied market sectors, including government bonds, investment grade and high yield corporate securities, mortgage- and asset-backed instruments, and emerging market issues.
Top contributors to the Fund’s performance relative to the Custom Balanced Index:
• An overweight allocation to the information technology sector in the equity component
• Stock selection within the energy sector in the equity component
• An overweight allocation to securitized issuers in the fixed income component
Top detractors to the Fund’s performance relative to the Custom Balanced Index:
• Stock selection within the industrials sector of the equity component
• Stock selection within the consumer staples sector of the equity component
• Weak security selection within the Treasury sector of the fixed income component
Performance shown is past performance and does not guarantee future results. The graph and table below do not reflect the deduction of taxes that a shareholder would pay on Fund distributions or redemption of Fund shares. The graph and table below assume reinvestment of dividends and capital gain distributions.
GROWTH OF A HYPOTHETICAL $10,000 INVESTMENT (October 1, 2014 through September 30, 2024)
This graph shows the performance of a hypothetical $10,000 investment in the share class noted over a ten-year period or since inception, if shorter, as compared to the performance of a broad-based securities market index, and, if applicable, one or more indexes that MML Investment Advisers, LLC believes more closely reflects the market segments in which the
| MM202912-309770 | PAGE 1 | TSR-AR-ITGC1 |
Fund invests or is a better comparison for the Fund’s investment strategy. This graph includes the deduction of the maximum applicable sales charge, if any.
The index or indexes shown above are unmanaged, cannot be purchased directly, and, with the exception of any peer group index, do not incur expenses.
AVERAGE ANNUAL TOTAL RETURNS (%) (as of September 30, 2024)
| | | |
| | 1 Year | 5 Year | 10 Year |
Class R5 - without sales charge | 25.92 | 9.47 | 7.94 |
Russell 3000 Index1 | 35.19 | 15.26 | 12.83 |
Lipper Balanced Fund Index | 22.30 | 8.15 | 7.16 |
Custom Balanced Index | 27.24 | 10.56 | 9.46 |
S&P 500 Index | 36.35 | 15.98 | 13.38 |
| 1 | Effective July 24, 2024, the Russell 3000 Index replaced the S&P 500 Index as a broad measure of market performance in accordance with new regulatory disclosure requirements. |
The Custom Balanced Index comprises the S&P 500 Index and Bloomberg U.S. Aggregate Bond Index. The weightings of each index are 65% and 35%, respectively.
The Fund’s investment objective and investment strategy changed on November 18, 2020. The performance results shown above would not necessarily have been achieved had the Fund’s current investment strategy been in effect for the entire period for which performance results are presented.
Performance results reflect any applicable waivers or expense limitations in effect during these periods, without which performance would have been lower. The investment return and principal value of shares of the Fund fluctuate, so your shares, when sold, may be worth more or less than their original cost. Current performance of the Fund may be lower or higher than the performance quoted. Performance data current to the most recent month-end may be obtained at https://www.massmutual.com/product-performance/mutual-funds or by calling 1-888-309-3539 or by sending an email request to fundinfo@massmutual.com.
WHAT ARE SOME KEY FUND STATISTICS? (as of September 30, 2024)
| |
Total Net Assets (Millions) | $107.6 |
Total Number of Portfolio Holdings (includes derivative positions, if any) | 536 |
Total Advisory Fees Paid During the Reporting Period | $499,673 |
Portfolio Turnover Rate | 130% |
| MM202912-309770 | PAGE 2 | TSR-AR-ITGC1 |
WHAT DID THE FUND INVEST IN? (as of September 30, 2024)
Derivative values, if any, are excluded from the table(s) below.
| |
Largest Holdings
(% of Total Investments) | |
Apple, Inc. | 4.7% |
Microsoft Corp. | 4.2% |
NVIDIA Corp. | 3.9% |
U.S. Treasury Notes 3.875% due 08/15/34 | 1.5% |
Broadcom, Inc. | 1.3% |
Uniform Mortgage-Backed Security, TBA 2.000% due 10/01/39 | 1.2% |
U.S. Treasury Bonds 4.125% due 08/15/44 | 1.2% |
Federal National Mortgage Association 2.000% due 10/01/51 | 1.2% |
Home Depot, Inc. | 1.2% |
Visa, Inc. Class A | 1.1% |
| |
Portfolio Characteristics
(% of Total Investments) | |
Common Stock | 63.0% |
U.S. Treasury Obligations | 11.2% |
Corporate Debt | 10.7% |
U.S. Government Agency Obligations and Instrumentalities | 9.6% |
Non-U.S. Government Agency Obligations | 3.4% |
Repurchase Agreement | 2.1% |
U.S. Treasury Bills | 0.0% |
HOW HAS THE FUND CHANGED?
The following is a summary of certain changes to the Fund since October 1, 2023. For more complete information, you may review the Fund’s prospectus, including any applicable supplements, at https://www.massmutual.com/product-performance/mutual-funds or upon request at 1-888-309-3539 or fundinfo@massmutual.com.
Effective February 1, 2024, the annual rate for administrative services for Class A shares of the Fund was reduced from 0.30% to 0.25%.
| |
| WHERE CAN I FIND ADDITIONAL INFORMATION ABOUT THE FUND? |
For additional information about the Fund, including its prospectus, financial information, holdings, and proxy voting information, scan the QR code or visit https://www.massmutual.com/product-performance/mutual-funds. |
| MM202912-309770 | PAGE 3 | TSR-AR-ITGC1 |
1000097971076912187134081366014929178521539917056214771000099511144013579159671643318898249212052824729334321000098941084812032128631349814711174531467816327199681000010077112801261513998149461687119992170121940524692100009939114721360716044167271926025040211652574135098
| | |
MassMutual Balanced Fund | |
| Service Class | MBAYX |
| Annual Shareholder Report | September 30, 2024 |
This annual shareholder report contains important information about the MassMutual Balanced Fund (the “Fund”) for the period of October 1, 2023 to September 30, 2024. You can find additional information about the Fund at https://www.massmutual.com/product-performance/mutual-funds. You can also request this information by contacting us at 1-888-309-3539 or by sending an email request to fundinfo@massmutual.com.
This report describes changes to the Fund that occurred during the reporting period.
WHAT WERE THE FUND COSTS FOR THE LAST YEAR?
This example shows the expenses you would have paid over the past year, based on a hypothetical $10,000 investment. This table reflects any applicable waivers or expense limitations.
| | |
Class Name | Costs of a $10,000 investment | Costs paid as a percentage of a $10,000 investment |
| Service Class | $115 | 1.02% |
HOW DID THE FUND PERFORM?
Global equity markets advanced sharply as they weathered the unsettled geopolitical climate and higher interest rate environment well.
Geopolitical tensions remained high amid continued and escalating conflicts in Ukraine and the Middle East. In the U.S., the Federal Reserve continued its attempts to engineer a ‘soft landing’ and delivered a long-awaited cut in interest rates, with a 50bps cut in September. Domestic stocks advanced over the trailing 12-months as growth outperformed value and large cap shares outperformed their small cap counterparts in the period.
Global bond markets were broadly, and strongly, positive for the trailing one-year period. During the period, central banks responded to lower inflation data and began to lower policy interest rates, which was favorable for bond prices and returns. Macroeconomic sentiment centered, particularly more recently, on a soft-landing scenario in the U.S., providing a supportive credit risk environment. During the period, narrowing credit spreads were a positive return driver in the global bond market, in addition to the response to lower bond market yields. This resulted in broad gains across varied market sectors, including government bonds, investment grade and high yield corporate securities, mortgage- and asset-backed instruments, and emerging market issues.
Top contributors to the Fund’s performance relative to the Custom Balanced Index:
• An overweight allocation to the information technology sector in the equity component
• Stock selection within the energy sector in the equity component
• An overweight allocation to securitized issuers in the fixed income component
Top detractors to the Fund’s performance relative to the Custom Balanced Index:
• Stock selection within the industrials sector of the equity component
• Stock selection within the consumer staples sector of the equity component
• Weak security selection within the Treasury sector of the fixed income component
Performance shown is past performance and does not guarantee future results. The graph and table below do not reflect the deduction of taxes that a shareholder would pay on Fund distributions or redemption of Fund shares. The graph and table below assume reinvestment of dividends and capital gain distributions.
GROWTH OF A HYPOTHETICAL $10,000 INVESTMENT (October 1, 2014 through September 30, 2024)
This graph shows the performance of a hypothetical $10,000 investment in the share class noted over a ten-year period or since inception, if shorter, as compared to the performance of a broad-based securities market index, and, if applicable, one or more indexes that MML Investment Advisers, LLC believes more closely reflects the market segments in which the
| MM202912-309770 | PAGE 1 | TSR-AR-ITGC3 |
Fund invests or is a better comparison for the Fund’s investment strategy. This graph includes the deduction of the maximum applicable sales charge, if any.
The index or indexes shown above are unmanaged, cannot be purchased directly, and, with the exception of any peer group index, do not incur expenses.
AVERAGE ANNUAL TOTAL RETURNS (%) (as of September 30, 2024)
| | | |
| | 1 Year | 5 Year | 10 Year |
Service Class - without sales charge | 25.82 | 9.37 | 7.83 |
Russell 3000 Index1 | 35.19 | 15.26 | 12.83 |
Lipper Balanced Fund Index | 22.30 | 8.15 | 7.16 |
Custom Balanced Index | 27.24 | 10.56 | 9.46 |
S&P 500 Index | 36.35 | 15.98 | 13.38 |
| 1 | Effective July 24, 2024, the Russell 3000 Index replaced the S&P 500 Index as a broad measure of market performance in accordance with new regulatory disclosure requirements. |
The Custom Balanced Index comprises the S&P 500 Index and Bloomberg U.S. Aggregate Bond Index. The weightings of each index are 65% and 35%, respectively.
The Fund’s investment objective and investment strategy changed on November 18, 2020. The performance results shown above would not necessarily have been achieved had the Fund’s current investment strategy been in effect for the entire period for which performance results are presented.
Performance results reflect any applicable waivers or expense limitations in effect during these periods, without which performance would have been lower. The investment return and principal value of shares of the Fund fluctuate, so your shares, when sold, may be worth more or less than their original cost. Current performance of the Fund may be lower or higher than the performance quoted. Performance data current to the most recent month-end may be obtained at https://www.massmutual.com/product-performance/mutual-funds or by calling 1-888-309-3539 or by sending an email request to fundinfo@massmutual.com.
WHAT ARE SOME KEY FUND STATISTICS? (as of September 30, 2024)
| |
Total Net Assets (Millions) | $107.6 |
Total Number of Portfolio Holdings (includes derivative positions, if any) | 536 |
Total Advisory Fees Paid During the Reporting Period | $499,673 |
Portfolio Turnover Rate | 130% |
| MM202912-309770 | PAGE 2 | TSR-AR-ITGC3 |
WHAT DID THE FUND INVEST IN? (as of September 30, 2024)
Derivative values, if any, are excluded from the table(s) below.
| |
Largest Holdings
(% of Total Investments) | |
Apple, Inc. | 4.7% |
Microsoft Corp. | 4.2% |
NVIDIA Corp. | 3.9% |
U.S. Treasury Notes 3.875% due 08/15/34 | 1.5% |
Broadcom, Inc. | 1.3% |
Uniform Mortgage-Backed Security, TBA 2.000% due 10/01/39 | 1.2% |
U.S. Treasury Bonds 4.125% due 08/15/44 | 1.2% |
Federal National Mortgage Association 2.000% due 10/01/51 | 1.2% |
Home Depot, Inc. | 1.2% |
Visa, Inc. Class A | 1.1% |
| |
Portfolio Characteristics
(% of Total Investments) | |
Common Stock | 63.0% |
U.S. Treasury Obligations | 11.2% |
Corporate Debt | 10.7% |
U.S. Government Agency Obligations and Instrumentalities | 9.6% |
Non-U.S. Government Agency Obligations | 3.4% |
Repurchase Agreement | 2.1% |
U.S. Treasury Bills | 0.0% |
HOW HAS THE FUND CHANGED?
The following is a summary of certain changes to the Fund since October 1, 2023. For more complete information, you may review the Fund’s prospectus, including any applicable supplements, at https://www.massmutual.com/product-performance/mutual-funds or upon request at 1-888-309-3539 or fundinfo@massmutual.com.
Effective February 1, 2024, the annual rate for administrative services for Class A shares of the Fund was reduced from 0.30% to 0.25%.
| |
| WHERE CAN I FIND ADDITIONAL INFORMATION ABOUT THE FUND? |
For additional information about the Fund, including its prospectus, financial information, holdings, and proxy voting information, scan the QR code or visit https://www.massmutual.com/product-performance/mutual-funds. |
| MM202912-309770 | PAGE 3 | TSR-AR-ITGC3 |
1000097821073712144133521358314836177141525616894212571000099511144013579159671643318898249212052824729334321000098941084812032128631349814711174531467816327199681000010077112801261513998149461687119992170121940524692100009939114721360716044167271926025040211652574135098
| | |
MassMutual Balanced Fund | |
| Administrative Class | MMBLX |
| Annual Shareholder Report | September 30, 2024 |
This annual shareholder report contains important information about the MassMutual Balanced Fund (the “Fund”) for the period of October 1, 2023 to September 30, 2024. You can find additional information about the Fund at https://www.massmutual.com/product-performance/mutual-funds. You can also request this information by contacting us at 1-888-309-3539 or by sending an email request to fundinfo@massmutual.com.
This report describes changes to the Fund that occurred during the reporting period.
WHAT WERE THE FUND COSTS FOR THE LAST YEAR?
This example shows the expenses you would have paid over the past year, based on a hypothetical $10,000 investment. This table reflects any applicable waivers or expense limitations.
| | |
Class Name | Costs of a $10,000 investment | Costs paid as a percentage of a $10,000 investment |
| Administrative Class | $125 | 1.11% |
HOW DID THE FUND PERFORM?
Global equity markets advanced sharply as they weathered the unsettled geopolitical climate and higher interest rate environment well.
Geopolitical tensions remained high amid continued and escalating conflicts in Ukraine and the Middle East. In the U.S., the Federal Reserve continued its attempts to engineer a ‘soft landing’ and delivered a long-awaited cut in interest rates, with a 50bps cut in September. Domestic stocks advanced over the trailing 12-months as growth outperformed value and large cap shares outperformed their small cap counterparts in the period.
Global bond markets were broadly, and strongly, positive for the trailing one-year period. During the period, central banks responded to lower inflation data and began to lower policy interest rates, which was favorable for bond prices and returns. Macroeconomic sentiment centered, particularly more recently, on a soft-landing scenario in the U.S., providing a supportive credit risk environment. During the period, narrowing credit spreads were a positive return driver in the global bond market, in addition to the response to lower bond market yields. This resulted in broad gains across varied market sectors, including government bonds, investment grade and high yield corporate securities, mortgage- and asset-backed instruments, and emerging market issues.
Top contributors to the Fund’s performance relative to the Custom Balanced Index:
• An overweight allocation to the information technology sector in the equity component
• Stock selection within the energy sector in the equity component
• An overweight allocation to securitized issuers in the fixed income component
Top detractors to the Fund’s performance relative to the Custom Balanced Index:
• Stock selection within the industrials sector of the equity component
• Stock selection within the consumer staples sector of the equity component
• Weak security selection within the Treasury sector of the fixed income component
Performance shown is past performance and does not guarantee future results. The graph and table below do not reflect the deduction of taxes that a shareholder would pay on Fund distributions or redemption of Fund shares. The graph and table below assume reinvestment of dividends and capital gain distributions.
GROWTH OF A HYPOTHETICAL $10,000 INVESTMENT (October 1, 2014 through September 30, 2024)
This graph shows the performance of a hypothetical $10,000 investment in the share class noted over a ten-year period or since inception, if shorter, as compared to the performance of a broad-based securities market index, and, if applicable, one or more indexes that MML Investment Advisers, LLC believes more closely reflects the market segments in which the
| MM202912-309770 | PAGE 1 | TSR-AR-ITGC4 |
Fund invests or is a better comparison for the Fund’s investment strategy. This graph includes the deduction of the maximum applicable sales charge, if any.
The index or indexes shown above are unmanaged, cannot be purchased directly, and, with the exception of any peer group index, do not incur expenses.
AVERAGE ANNUAL TOTAL RETURNS (%) (as of September 30, 2024)
| | | |
| | 1 Year | 5 Year | 10 Year |
Administrative Class - without sales charge | 25.70 | 9.26 | 7.73 |
Russell 3000 Index1 | 35.19 | 15.26 | 12.83 |
Lipper Balanced Fund Index | 22.30 | 8.15 | 7.16 |
Custom Balanced Index | 27.24 | 10.56 | 9.46 |
S&P 500 Index | 36.35 | 15.98 | 13.38 |
| 1 | Effective July 24, 2024, the Russell 3000 Index replaced the S&P 500 Index as a broad measure of market performance in accordance with new regulatory disclosure requirements. |
The Custom Balanced Index comprises the S&P 500 Index and Bloomberg U.S. Aggregate Bond Index. The weightings of each index are 65% and 35%, respectively.
The Fund’s investment objective and investment strategy changed on November 18, 2020. The performance results shown above would not necessarily have been achieved had the Fund’s current investment strategy been in effect for the entire period for which performance results are presented.
Performance results reflect any applicable waivers or expense limitations in effect during these periods, without which performance would have been lower. The investment return and principal value of shares of the Fund fluctuate, so your shares, when sold, may be worth more or less than their original cost. Current performance of the Fund may be lower or higher than the performance quoted. Performance data current to the most recent month-end may be obtained at https://www.massmutual.com/product-performance/mutual-funds or by calling 1-888-309-3539 or by sending an email request to fundinfo@massmutual.com.
WHAT ARE SOME KEY FUND STATISTICS? (as of September 30, 2024)
| |
Total Net Assets (Millions) | $107.6 |
Total Number of Portfolio Holdings (includes derivative positions, if any) | 536 |
Total Advisory Fees Paid During the Reporting Period | $499,673 |
Portfolio Turnover Rate | 130% |
| MM202912-309770 | PAGE 2 | TSR-AR-ITGC4 |
WHAT DID THE FUND INVEST IN? (as of September 30, 2024)
Derivative values, if any, are excluded from the table(s) below.
| |
Largest Holdings
(% of Total Investments) | |
Apple, Inc. | 4.7% |
Microsoft Corp. | 4.2% |
NVIDIA Corp. | 3.9% |
U.S. Treasury Notes 3.875% due 08/15/34 | 1.5% |
Broadcom, Inc. | 1.3% |
Uniform Mortgage-Backed Security, TBA 2.000% due 10/01/39 | 1.2% |
U.S. Treasury Bonds 4.125% due 08/15/44 | 1.2% |
Federal National Mortgage Association 2.000% due 10/01/51 | 1.2% |
Home Depot, Inc. | 1.2% |
Visa, Inc. Class A | 1.1% |
| |
Portfolio Characteristics
(% of Total Investments) | |
Common Stock | 63.0% |
U.S. Treasury Obligations | 11.2% |
Corporate Debt | 10.7% |
U.S. Government Agency Obligations and Instrumentalities | 9.6% |
Non-U.S. Government Agency Obligations | 3.4% |
Repurchase Agreement | 2.1% |
U.S. Treasury Bills | 0.0% |
HOW HAS THE FUND CHANGED?
The following is a summary of certain changes to the Fund since October 1, 2023. For more complete information, you may review the Fund’s prospectus, including any applicable supplements, at https://www.massmutual.com/product-performance/mutual-funds or upon request at 1-888-309-3539 or fundinfo@massmutual.com.
Effective February 1, 2024, the annual rate for administrative services for Class A shares of the Fund was reduced from 0.30% to 0.25%.
| |
| WHERE CAN I FIND ADDITIONAL INFORMATION ABOUT THE FUND? |
For additional information about the Fund, including its prospectus, financial information, holdings, and proxy voting information, scan the QR code or visit https://www.massmutual.com/product-performance/mutual-funds. |
| MM202912-309770 | PAGE 3 | TSR-AR-ITGC4 |
1000097771072412108133051352014754176011514516747210511000099511144013579159671643318898249212052824729334321000098941084812032128631349814711174531467816327199681000010077112801261513998149461687119992170121940524692100009939114721360716044167271926025040211652574135098
| | |
MassMutual Balanced Fund | |
| Class R4 | MBBRX |
| Annual Shareholder Report | September 30, 2024 |
This annual shareholder report contains important information about the MassMutual Balanced Fund (the “Fund”) for the period of October 1, 2023 to September 30, 2024. You can find additional information about the Fund at https://www.massmutual.com/product-performance/mutual-funds. You can also request this information by contacting us at 1-888-309-3539 or by sending an email request to fundinfo@massmutual.com.
This report describes changes to the Fund that occurred during the reporting period.
WHAT WERE THE FUND COSTS FOR THE LAST YEAR?
This example shows the expenses you would have paid over the past year, based on a hypothetical $10,000 investment. This table reflects any applicable waivers or expense limitations.
| | |
Class Name | Costs of a $10,000 investment | Costs paid as a percentage of a $10,000 investment |
| Class R4 | $143 | 1.27% |
HOW DID THE FUND PERFORM?
Global equity markets advanced sharply as they weathered the unsettled geopolitical climate and higher interest rate environment well.
Geopolitical tensions remained high amid continued and escalating conflicts in Ukraine and the Middle East. In the U.S., the Federal Reserve continued its attempts to engineer a ‘soft landing’ and delivered a long-awaited cut in interest rates, with a 50bps cut in September. Domestic stocks advanced over the trailing 12-months as growth outperformed value and large cap shares outperformed their small cap counterparts in the period.
Global bond markets were broadly, and strongly, positive for the trailing one-year period. During the period, central banks responded to lower inflation data and began to lower policy interest rates, which was favorable for bond prices and returns. Macroeconomic sentiment centered, particularly more recently, on a soft-landing scenario in the U.S., providing a supportive credit risk environment. During the period, narrowing credit spreads were a positive return driver in the global bond market, in addition to the response to lower bond market yields. This resulted in broad gains across varied market sectors, including government bonds, investment grade and high yield corporate securities, mortgage- and asset-backed instruments, and emerging market issues.
Top contributors to the Fund’s performance relative to the Custom Balanced Index:
• An overweight allocation to the information technology sector in the equity component
• Stock selection within the energy sector in the equity component
• An overweight allocation to securitized issuers in the fixed income component
Top detractors to the Fund’s performance relative to the Custom Balanced Index:
• Stock selection within the industrials sector of the equity component
• Stock selection within the consumer staples sector of the equity component
• Weak security selection within the Treasury sector of the fixed income component
Performance shown is past performance and does not guarantee future results. The graph and table below do not reflect the deduction of taxes that a shareholder would pay on Fund distributions or redemption of Fund shares. The graph and table below assume reinvestment of dividends and capital gain distributions.
GROWTH OF A HYPOTHETICAL $10,000 INVESTMENT (October 1, 2014 through September 30, 2024)
This graph shows the performance of a hypothetical $10,000 investment in the share class noted over a ten-year period or since inception, if shorter, as compared to the performance of a broad-based securities market index, and, if applicable, one or more indexes that MML Investment Advisers, LLC believes more closely reflects the market segments in which the
| MM202912-309770 | PAGE 1 | TSR-AR-ITGCK |
Fund invests or is a better comparison for the Fund’s investment strategy. This graph includes the deduction of the maximum applicable sales charge, if any.
The index or indexes shown above are unmanaged, cannot be purchased directly, and, with the exception of any peer group index, do not incur expenses.
AVERAGE ANNUAL TOTAL RETURNS (%) (as of September 30, 2024)
| | | |
| | 1 Year | 5 Year | 10 Year |
Class R4 - without sales charge | 25.53 | 9.09 | 7.56 |
Russell 3000 Index1 | 35.19 | 15.26 | 12.83 |
Lipper Balanced Fund Index | 22.30 | 8.15 | 7.16 |
Custom Balanced Index | 27.24 | 10.56 | 9.46 |
S&P 500 Index | 36.35 | 15.98 | 13.38 |
| 1 | Effective July 24, 2024, the Russell 3000 Index replaced the S&P 500 Index as a broad measure of market performance in accordance with new regulatory disclosure requirements. |
The Custom Balanced Index comprises the S&P 500 Index and Bloomberg U.S. Aggregate Bond Index. The weightings of each index are 65% and 35%, respectively.
The Fund’s investment objective and investment strategy changed on November 18, 2020. The performance results shown above would not necessarily have been achieved had the Fund’s current investment strategy been in effect for the entire period for which performance results are presented.
Performance results reflect any applicable waivers or expense limitations in effect during these periods, without which performance would have been lower. The investment return and principal value of shares of the Fund fluctuate, so your shares, when sold, may be worth more or less than their original cost. Current performance of the Fund may be lower or higher than the performance quoted. Performance data current to the most recent month-end may be obtained at https://www.massmutual.com/product-performance/mutual-funds or by calling 1-888-309-3539 or by sending an email request to fundinfo@massmutual.com.
WHAT ARE SOME KEY FUND STATISTICS? (as of September 30, 2024)
| |
Total Net Assets (Millions) | $107.6 |
Total Number of Portfolio Holdings (includes derivative positions, if any) | 536 |
Total Advisory Fees Paid During the Reporting Period | $499,673 |
Portfolio Turnover Rate | 130% |
| MM202912-309770 | PAGE 2 | TSR-AR-ITGCK |
WHAT DID THE FUND INVEST IN? (as of September 30, 2024)
Derivative values, if any, are excluded from the table(s) below.
| |
Largest Holdings
(% of Total Investments) | |
Apple, Inc. | 4.7% |
Microsoft Corp. | 4.2% |
NVIDIA Corp. | 3.9% |
U.S. Treasury Notes 3.875% due 08/15/34 | 1.5% |
Broadcom, Inc. | 1.3% |
Uniform Mortgage-Backed Security, TBA 2.000% due 10/01/39 | 1.2% |
U.S. Treasury Bonds 4.125% due 08/15/44 | 1.2% |
Federal National Mortgage Association 2.000% due 10/01/51 | 1.2% |
Home Depot, Inc. | 1.2% |
Visa, Inc. Class A | 1.1% |
| |
Portfolio Characteristics
(% of Total Investments) | |
Common Stock | 63.0% |
U.S. Treasury Obligations | 11.2% |
Corporate Debt | 10.7% |
U.S. Government Agency Obligations and Instrumentalities | 9.6% |
Non-U.S. Government Agency Obligations | 3.4% |
Repurchase Agreement | 2.1% |
U.S. Treasury Bills | 0.0% |
HOW HAS THE FUND CHANGED?
The following is a summary of certain changes to the Fund since October 1, 2023. For more complete information, you may review the Fund’s prospectus, including any applicable supplements, at https://www.massmutual.com/product-performance/mutual-funds or upon request at 1-888-309-3539 or fundinfo@massmutual.com.
Effective February 1, 2024, the annual rate for administrative services for Class A shares of the Fund was reduced from 0.30% to 0.25%.
| |
| WHERE CAN I FIND ADDITIONAL INFORMATION ABOUT THE FUND? |
For additional information about the Fund, including its prospectus, financial information, holdings, and proxy voting information, scan the QR code or visit https://www.massmutual.com/product-performance/mutual-funds. |
| MM202912-309770 | PAGE 3 | TSR-AR-ITGCK |
1000097541068112057132121341314612174061495816509207241000099511144013579159671643318898249212052824729334321000098941084812032128631349814711174531467816327199681000010077112801261513998149461687119992170121940524692100009939114721360716044167271926025040211652574135098
| | |
MassMutual Balanced Fund | |
| Class A | MMBDX |
| Annual Shareholder Report | September 30, 2024 |
This annual shareholder report contains important information about the MassMutual Balanced Fund (the “Fund”) for the period of October 1, 2023 to September 30, 2024. You can find additional information about the Fund at https://www.massmutual.com/product-performance/mutual-funds. You can also request this information by contacting us at 1-888-309-3539 or by sending an email request to fundinfo@massmutual.com.
This report describes changes to the Fund that occurred during the reporting period.
WHAT WERE THE FUND COSTS FOR THE LAST YEAR?
This example shows the expenses you would have paid over the past year, based on a hypothetical $10,000 investment. This table reflects any applicable waivers or expense limitations.
| | |
Class Name | Costs of a $10,000 investment | Costs paid as a percentage of a $10,000 investment |
| Class A | $150 | 1.33% |
HOW DID THE FUND PERFORM?
Global equity markets advanced sharply as they weathered the unsettled geopolitical climate and higher interest rate environment well.
Geopolitical tensions remained high amid continued and escalating conflicts in Ukraine and the Middle East. In the U.S., the Federal Reserve continued its attempts to engineer a ‘soft landing’ and delivered a long-awaited cut in interest rates, with a 50bps cut in September. Domestic stocks advanced over the trailing 12-months as growth outperformed value and large cap shares outperformed their small cap counterparts in the period.
Global bond markets were broadly, and strongly, positive for the trailing one-year period. During the period, central banks responded to lower inflation data and began to lower policy interest rates, which was favorable for bond prices and returns. Macroeconomic sentiment centered, particularly more recently, on a soft-landing scenario in the U.S., providing a supportive credit risk environment. During the period, narrowing credit spreads were a positive return driver in the global bond market, in addition to the response to lower bond market yields. This resulted in broad gains across varied market sectors, including government bonds, investment grade and high yield corporate securities, mortgage- and asset-backed instruments, and emerging market issues.
Top contributors to the Fund’s performance relative to the Custom Balanced Index:
• An overweight allocation to the information technology sector in the equity component
• Stock selection within the energy sector in the equity component
• An overweight allocation to securitized issuers in the fixed income component
Top detractors to the Fund’s performance relative to the Custom Balanced Index:
• Stock selection within the industrials sector of the equity component
• Stock selection within the consumer staples sector of the equity component
• Weak security selection within the Treasury sector of the fixed income component
Performance shown is past performance and does not guarantee future results. The graph and table below do not reflect the deduction of taxes that a shareholder would pay on Fund distributions or redemption of Fund shares. The graph and table below assume reinvestment of dividends and capital gain distributions.
GROWTH OF A HYPOTHETICAL $10,000 INVESTMENT (October 1, 2014 through September 30, 2024)
This graph shows the performance of a hypothetical $10,000 investment in the share class noted over a ten-year period or since inception, if shorter, as compared to the performance of a broad-based securities market index, and, if applicable, one or more indexes that MML Investment Advisers, LLC believes more closely reflects the market segments in which the
| MM202912-309770 | PAGE 1 | TSR-AR-ITGC2 |
Fund invests or is a better comparison for the Fund’s investment strategy. This graph includes the deduction of the maximum applicable sales charge, if any.
The index or indexes shown above are unmanaged, cannot be purchased directly, and, with the exception of any peer group index, do not incur expenses.
AVERAGE ANNUAL TOTAL RETURNS (%) (as of September 30, 2024)
| | | |
| | 1 Year | 5 Year | 10 Year |
Class A - without sales charge | 25.48 | 8.99 | 7.47 |
Class A - with maximum sales charge | 18.58 | 7.77 | 6.86 |
Russell 3000 Index1 | 35.19 | 15.26 | 12.83 |
Lipper Balanced Fund Index | 22.30 | 8.15 | 7.16 |
Custom Balanced Index | 27.24 | 10.56 | 9.46 |
S&P 500 Index | 36.35 | 15.98 | 13.38 |
| 1 | Effective July 24, 2024, the Russell 3000 Index replaced the S&P 500 Index as a broad measure of market performance in accordance with new regulatory disclosure requirements. |
The Custom Balanced Index comprises the S&P 500 Index and Bloomberg U.S. Aggregate Bond Index. The weightings of each index are 65% and 35%, respectively.
The Fund’s investment objective and investment strategy changed on November 18, 2020. The performance results shown above would not necessarily have been achieved had the Fund’s current investment strategy been in effect for the entire period for which performance results are presented.
Performance results reflect any applicable waivers or expense limitations in effect during these periods, without which performance would have been lower. The investment return and principal value of shares of the Fund fluctuate, so your shares, when sold, may be worth more or less than their original cost. Current performance of the Fund may be lower or higher than the performance quoted. Performance data current to the most recent month-end may be obtained at https://www.massmutual.com/product-performance/mutual-funds or by calling 1-888-309-3539 or by sending an email request to fundinfo@massmutual.com.
WHAT ARE SOME KEY FUND STATISTICS? (as of September 30, 2024)
| |
Total Net Assets (Millions) | $107.6 |
Total Number of Portfolio Holdings (includes derivative positions, if any) | 536 |
Total Advisory Fees Paid During the Reporting Period | $499,673 |
Portfolio Turnover Rate | 130% |
| MM202912-309770 | PAGE 2 | TSR-AR-ITGC2 |
WHAT DID THE FUND INVEST IN? (as of September 30, 2024)
Derivative values, if any, are excluded from the table(s) below.
| |
Largest Holdings
(% of Total Investments) | |
Apple, Inc. | 4.7% |
Microsoft Corp. | 4.2% |
NVIDIA Corp. | 3.9% |
U.S. Treasury Notes 3.875% due 08/15/34 | 1.5% |
Broadcom, Inc. | 1.3% |
Uniform Mortgage-Backed Security, TBA 2.000% due 10/01/39 | 1.2% |
U.S. Treasury Bonds 4.125% due 08/15/44 | 1.2% |
Federal National Mortgage Association 2.000% due 10/01/51 | 1.2% |
Home Depot, Inc. | 1.2% |
Visa, Inc. Class A | 1.1% |
| |
Portfolio Characteristics
(% of Total Investments) | |
Common Stock | 63.0% |
U.S. Treasury Obligations | 11.2% |
Corporate Debt | 10.7% |
U.S. Government Agency Obligations and Instrumentalities | 9.6% |
Non-U.S. Government Agency Obligations | 3.4% |
Repurchase Agreement | 2.1% |
U.S. Treasury Bills | 0.0% |
HOW HAS THE FUND CHANGED?
The following is a summary of certain changes to the Fund since October 1, 2023. For more complete information, you may review the Fund’s prospectus, including any applicable supplements, at https://www.massmutual.com/product-performance/mutual-funds or upon request at 1-888-309-3539 or fundinfo@massmutual.com.
Effective February 1, 2024, the annual rate for administrative services for Class A shares of the Fund was reduced from 0.30% to 0.25%.
| |
| WHERE CAN I FIND ADDITIONAL INFORMATION ABOUT THE FUND? |
For additional information about the Fund, including its prospectus, financial information, holdings, and proxy voting information, scan the QR code or visit https://www.massmutual.com/product-performance/mutual-funds. |
| MM202912-309770 | PAGE 3 | TSR-AR-ITGC2 |
945092151007911367124451262313734163531402815475194181000099511144013579159671643318898249212052824729334321000098941084812032128631349814711174531467816327199681000010077112801261513998149461687119992170121940524692100009939114721360716044167271926025040211652574135098
| | |
MassMutual Balanced Fund | |
| Class R3 | MMBRX |
| Annual Shareholder Report | September 30, 2024 |
This annual shareholder report contains important information about the MassMutual Balanced Fund (the “Fund”) for the period of October 1, 2023 to September 30, 2024. You can find additional information about the Fund at https://www.massmutual.com/product-performance/mutual-funds. You can also request this information by contacting us at 1-888-309-3539 or by sending an email request to fundinfo@massmutual.com.
This report describes changes to the Fund that occurred during the reporting period.
WHAT WERE THE FUND COSTS FOR THE LAST YEAR?
This example shows the expenses you would have paid over the past year, based on a hypothetical $10,000 investment. This table reflects any applicable waivers or expense limitations.
| | |
Class Name | Costs of a $10,000 investment | Costs paid as a percentage of a $10,000 investment |
| Class R3 | $171 | 1.52% |
HOW DID THE FUND PERFORM?
Global equity markets advanced sharply as they weathered the unsettled geopolitical climate and higher interest rate environment well.
Geopolitical tensions remained high amid continued and escalating conflicts in Ukraine and the Middle East. In the U.S., the Federal Reserve continued its attempts to engineer a ‘soft landing’ and delivered a long-awaited cut in interest rates, with a 50bps cut in September. Domestic stocks advanced over the trailing 12-months as growth outperformed value and large cap shares outperformed their small cap counterparts in the period.
Global bond markets were broadly, and strongly, positive for the trailing one-year period. During the period, central banks responded to lower inflation data and began to lower policy interest rates, which was favorable for bond prices and returns. Macroeconomic sentiment centered, particularly more recently, on a soft-landing scenario in the U.S., providing a supportive credit risk environment. During the period, narrowing credit spreads were a positive return driver in the global bond market, in addition to the response to lower bond market yields. This resulted in broad gains across varied market sectors, including government bonds, investment grade and high yield corporate securities, mortgage- and asset-backed instruments, and emerging market issues.
Top contributors to the Fund’s performance relative to the Custom Balanced Index:
• An overweight allocation to the information technology sector in the equity component
• Stock selection within the energy sector in the equity component
• An overweight allocation to securitized issuers in the fixed income component
Top detractors to the Fund’s performance relative to the Custom Balanced Index:
• Stock selection within the industrials sector of the equity component
• Stock selection within the consumer staples sector of the equity component
• Weak security selection within the Treasury sector of the fixed income component
Performance shown is past performance and does not guarantee future results. The graph and table below do not reflect the deduction of taxes that a shareholder would pay on Fund distributions or redemption of Fund shares. The graph and table below assume reinvestment of dividends and capital gain distributions.
GROWTH OF A HYPOTHETICAL $10,000 INVESTMENT (October 1, 2014 through September 30, 2024)
This graph shows the performance of a hypothetical $10,000 investment in the share class noted over a ten-year period or since inception, if shorter, as compared to the performance of a broad-based securities market index, and, if applicable, one or more indexes that MML Investment Advisers, LLC believes more closely reflects the market segments in which the
| MM202912-309770 | PAGE 1 | TSR-AR-ITGCJ |
Fund invests or is a better comparison for the Fund’s investment strategy. This graph includes the deduction of the maximum applicable sales charge, if any.
The index or indexes shown above are unmanaged, cannot be purchased directly, and, with the exception of any peer group index, do not incur expenses.
AVERAGE ANNUAL TOTAL RETURNS (%) (as of September 30, 2024)
| | | |
| | 1 Year | 5 Year | 10 Year |
Class R3 - without sales charge | 25.19 | 8.82 | 7.30 |
Russell 3000 Index1 | 35.19 | 15.26 | 12.83 |
Lipper Balanced Fund Index | 22.30 | 8.15 | 7.16 |
Custom Balanced Index | 27.24 | 10.56 | 9.46 |
S&P 500 Index | 36.35 | 15.98 | 13.38 |
| 1 | Effective July 24, 2024, the Russell 3000 Index replaced the S&P 500 Index as a broad measure of market performance in accordance with new regulatory disclosure requirements. |
The Custom Balanced Index comprises the S&P 500 Index and Bloomberg U.S. Aggregate Bond Index. The weightings of each index are 65% and 35%, respectively.
The Fund’s investment objective and investment strategy changed on November 18, 2020. The performance results shown above would not necessarily have been achieved had the Fund’s current investment strategy been in effect for the entire period for which performance results are presented.
Performance results reflect any applicable waivers or expense limitations in effect during these periods, without which performance would have been lower. The investment return and principal value of shares of the Fund fluctuate, so your shares, when sold, may be worth more or less than their original cost. Current performance of the Fund may be lower or higher than the performance quoted. Performance data current to the most recent month-end may be obtained at https://www.massmutual.com/product-performance/mutual-funds or by calling 1-888-309-3539 or by sending an email request to fundinfo@massmutual.com.
WHAT ARE SOME KEY FUND STATISTICS? (as of September 30, 2024)
| |
Total Net Assets (Millions) | $107.6 |
Total Number of Portfolio Holdings (includes derivative positions, if any) | 536 |
Total Advisory Fees Paid During the Reporting Period | $499,673 |
Portfolio Turnover Rate | 130% |
| MM202912-309770 | PAGE 2 | TSR-AR-ITGCJ |
WHAT DID THE FUND INVEST IN? (as of September 30, 2024)
Derivative values, if any, are excluded from the table(s) below.
| |
Largest Holdings
(% of Total Investments) | |
Apple, Inc. | 4.7% |
Microsoft Corp. | 4.2% |
NVIDIA Corp. | 3.9% |
U.S. Treasury Notes 3.875% due 08/15/34 | 1.5% |
Broadcom, Inc. | 1.3% |
Uniform Mortgage-Backed Security, TBA 2.000% due 10/01/39 | 1.2% |
U.S. Treasury Bonds 4.125% due 08/15/44 | 1.2% |
Federal National Mortgage Association 2.000% due 10/01/51 | 1.2% |
Home Depot, Inc. | 1.2% |
Visa, Inc. Class A | 1.1% |
| |
Portfolio Characteristics
(% of Total Investments) | |
Common Stock | 63.0% |
U.S. Treasury Obligations | 11.2% |
Corporate Debt | 10.7% |
U.S. Government Agency Obligations and Instrumentalities | 9.6% |
Non-U.S. Government Agency Obligations | 3.4% |
Repurchase Agreement | 2.1% |
U.S. Treasury Bills | 0.0% |
HOW HAS THE FUND CHANGED?
The following is a summary of certain changes to the Fund since October 1, 2023. For more complete information, you may review the Fund’s prospectus, including any applicable supplements, at https://www.massmutual.com/product-performance/mutual-funds or upon request at 1-888-309-3539 or fundinfo@massmutual.com.
Effective February 1, 2024, the annual rate for administrative services for Class A shares of the Fund was reduced from 0.30% to 0.25%.
| |
| WHERE CAN I FIND ADDITIONAL INFORMATION ABOUT THE FUND? |
For additional information about the Fund, including its prospectus, financial information, holdings, and proxy voting information, scan the QR code or visit https://www.massmutual.com/product-performance/mutual-funds. |
| MM202912-309770 | PAGE 3 | TSR-AR-ITGCJ |
1000097341063911977130941326014409171191467616165202361000099511144013579159671643318898249212052824729334321000098941084812032128631349814711174531467816327199681000010077112801261513998149461687119992170121940524692100009939114721360716044167271926025040211652574135098
| | |
MassMutual Balanced Fund | |
| Class Y | MMNVX |
| Annual Shareholder Report | September 30, 2024 |
This annual shareholder report contains important information about the MassMutual Balanced Fund (the “Fund”) for the period of October 1, 2023 to September 30, 2024. You can find additional information about the Fund at https://www.massmutual.com/product-performance/mutual-funds. You can also request this information by contacting us at 1-888-309-3539 or by sending an email request to fundinfo@massmutual.com.
This report describes changes to the Fund that occurred during the reporting period.
WHAT WERE THE FUND COSTS FOR THE LAST YEAR?
This example shows the expenses you would have paid over the past year, based on a hypothetical $10,000 investment. This table reflects any applicable waivers or expense limitations.
| | |
Class Name | Costs of a $10,000 investment | Costs paid as a percentage of a $10,000 investment |
| Class Y | $104 | 0.92% |
HOW DID THE FUND PERFORM?
Global equity markets advanced sharply as they weathered the unsettled geopolitical climate and higher interest rate environment well.
Geopolitical tensions remained high amid continued and escalating conflicts in Ukraine and the Middle East. In the U.S., the Federal Reserve continued its attempts to engineer a ‘soft landing’ and delivered a long-awaited cut in interest rates, with a 50bps cut in September. Domestic stocks advanced over the trailing 12-months as growth outperformed value and large cap shares outperformed their small cap counterparts in the period.
Global bond markets were broadly, and strongly, positive for the trailing one-year period. During the period, central banks responded to lower inflation data and began to lower policy interest rates, which was favorable for bond prices and returns. Macroeconomic sentiment centered, particularly more recently, on a soft-landing scenario in the U.S., providing a supportive credit risk environment. During the period, narrowing credit spreads were a positive return driver in the global bond market, in addition to the response to lower bond market yields. This resulted in broad gains across varied market sectors, including government bonds, investment grade and high yield corporate securities, mortgage- and asset-backed instruments, and emerging market issues.
Top contributors to the Fund’s performance relative to the Custom Balanced Index:
• An overweight allocation to the information technology sector in the equity component
• Stock selection within the energy sector in the equity component
• An overweight allocation to securitized issuers in the fixed income component
Top detractors to the Fund’s performance relative to the Custom Balanced Index:
• Stock selection within the industrials sector of the equity component
• Stock selection within the consumer staples sector of the equity component
• Weak security selection within the Treasury sector of the fixed income component
Performance shown is past performance and does not guarantee future results. The graph and table below do not reflect the deduction of taxes that a shareholder would pay on Fund distributions or redemption of Fund shares. The graph and table below assume reinvestment of dividends and capital gain distributions.
GROWTH OF A HYPOTHETICAL $10,000 INVESTMENT (February 1, 2023 through September 30, 2024)
This graph shows the performance of a hypothetical $10,000 investment in the share class noted over a ten-year period or since inception, if shorter, as compared to the performance of a broad-based securities market index, and, if applicable, one or more indexes that MML Investment Advisers, LLC believes more closely reflects the market segments in which the
| MM202912-309770 | PAGE 1 | TSR-AR-ITGCY |
Fund invests or is a better comparison for the Fund’s investment strategy. This graph includes the deduction of the maximum applicable sales charge, if any.
The index or indexes shown above are unmanaged, cannot be purchased directly, and, with the exception of any peer group index, do not incur expenses.
AVERAGE ANNUAL TOTAL RETURNS (%) (as of September 30, 2024)
| | |
| | 1 Year | Since Inception
(02/01/2023) |
Class Y - without sales charge | 25.88 | 14.15 |
Russell 3000 Index1 | 35.19 | 23.53 |
Lipper Balanced Fund Index | 22.30 | 12.49 |
Custom Balanced Index | 27.24 | 17.40 |
S&P 500 Index | 36.35 | 25.04 |
| 1 | Effective July 24, 2024, the Russell 3000 Index replaced the S&P 500 Index as a broad measure of market performance in accordance with new regulatory disclosure requirements. |
The Custom Balanced Index comprises the S&P 500 Index and Bloomberg U.S. Aggregate Bond Index. The weightings of each index are 65% and 35%, respectively.
Performance results reflect any applicable waivers or expense limitations in effect during these periods, without which performance would have been lower. The investment return and principal value of shares of the Fund fluctuate, so your shares, when sold, may be worth more or less than their original cost. Current performance of the Fund may be lower or higher than the performance quoted. Performance data current to the most recent month-end may be obtained at https://www.massmutual.com/product-performance/mutual-funds or by calling 1-888-309-3539 or by sending an email request to fundinfo@massmutual.com.
WHAT ARE SOME KEY FUND STATISTICS? (as of September 30, 2024)
| |
Total Net Assets (Millions) | $107.6 |
Total Number of Portfolio Holdings (includes derivative positions, if any) | 536 |
Total Advisory Fees Paid During the Reporting Period | $499,673 |
Portfolio Turnover Rate | 130% |
| MM202912-309770 | PAGE 2 | TSR-AR-ITGCY |
WHAT DID THE FUND INVEST IN? (as of September 30, 2024)
Derivative values, if any, are excluded from the table(s) below.
| |
Largest Holdings
(% of Total Investments) | |
Apple, Inc. | 4.7% |
Microsoft Corp. | 4.2% |
NVIDIA Corp. | 3.9% |
U.S. Treasury Notes 3.875% due 08/15/34 | 1.5% |
Broadcom, Inc. | 1.3% |
Uniform Mortgage-Backed Security, TBA 2.000% due 10/01/39 | 1.2% |
U.S. Treasury Bonds 4.125% due 08/15/44 | 1.2% |
Federal National Mortgage Association 2.000% due 10/01/51 | 1.2% |
Home Depot, Inc. | 1.2% |
Visa, Inc. Class A | 1.1% |
| |
Portfolio Characteristics
(% of Total Investments) | |
Common Stock | 63.0% |
U.S. Treasury Obligations | 11.2% |
Corporate Debt | 10.7% |
U.S. Government Agency Obligations and Instrumentalities | 9.6% |
Non-U.S. Government Agency Obligations | 3.4% |
Repurchase Agreement | 2.1% |
U.S. Treasury Bills | 0.0% |
HOW HAS THE FUND CHANGED?
The following is a summary of certain changes to the Fund since October 1, 2023. For more complete information, you may review the Fund’s prospectus, including any applicable supplements, at https://www.massmutual.com/product-performance/mutual-funds or upon request at 1-888-309-3539 or fundinfo@massmutual.com.
Effective February 1, 2024, the annual rate for administrative services for Class A shares of the Fund was reduced from 0.30% to 0.25%.
| |
| WHERE CAN I FIND ADDITIONAL INFORMATION ABOUT THE FUND? |
For additional information about the Fund, including its prospectus, financial information, holdings, and proxy voting information, scan the QR code or visit https://www.massmutual.com/product-performance/mutual-funds. |
| MM202912-309770 | PAGE 3 | TSR-AR-ITGCY |
1000098961245710000103951405310000994712165100001017112942100001052814355
| | |
MassMutual Disciplined Value Fund | |
| Class I | MPIVX |
| Annual Shareholder Report | September 30, 2024 |
This annual shareholder report contains important information about the MassMutual Disciplined Value Fund (the “Fund”) for the period of October 1, 2023 to September 30, 2024. You can find additional information about the Fund at https://www.massmutual.com/product-performance/mutual-funds. You can also request this information by contacting us at 1-888-309-3539 or by sending an email request to fundinfo@massmutual.com.
This report describes changes to the Fund that occurred during the reporting period.
WHAT WERE THE FUND COSTS FOR THE LAST YEAR?
This example shows the expenses you would have paid over the past year, based on a hypothetical $10,000 investment. This table reflects any applicable waivers or expense limitations.
| | |
Class Name | Costs of a $10,000 investment | Costs paid as a percentage of a $10,000 investment |
| Class I | $124 | 1.09% |
HOW DID THE FUND PERFORM?
Global equity markets advanced sharply as they weathered the unsettled geopolitical climate and higher interest rate environment well.
Geopolitical tensions remained high amid continued and escalating conflicts in Ukraine and the Middle East. In the U.S., the Federal Reserve continued its attempts to engineer a ‘soft landing’ and delivered a long-awaited cut in interest rates, with a 50bps cut in September. Domestic stocks advanced over the trailing 12-months as growth outperformed value and large cap shares outperformed their small cap counterparts in the period. U.S. large cap stocks outperformed their foreign counterparts, while shares in emerging markets outperformed developed non-U.S. markets.
Top contributors to the Fund’s performance relative to the Russell 1000® Value Index:
• Stock selection within the industrials sector where an overweight allocation to EMCOR Group, Inc. was particularly impactful
• Stock selection within the health care sector
• Stock selection within the utilities sector
Top detractors to the Fund’s performance relative to the Russell 1000 Value Index:
• Stock selection within the information technology sector where an underweight allocation to Micron Technology, Inc. was particularly impactful
• An underweight allocation to the utilities sector
• Stock selection within the financials sector
Performance shown is past performance and does not guarantee future results. The graph and table below do not reflect the deduction of taxes that a shareholder would pay on Fund distributions or redemption of Fund shares. The graph and table below assume reinvestment of dividends and capital gain distributions.
GROWTH OF A HYPOTHETICAL $10,000 INVESTMENT (October 1, 2014 through September 30, 2024)
This graph shows the performance of a hypothetical $10,000 investment in the share class noted over a ten-year period or since inception, if shorter, as compared to the performance of a broad-based securities market index, and, if applicable, one or more indexes that MML Investment Advisers, LLC believes more closely reflects the market segments in which the Fund invests or is a better comparison for the Fund’s investment strategy. This graph includes the deduction of the maximum applicable sales charge, if any.
| MM202912-309770 | PAGE 1 | TSR-AR-ITGHI |
The index or indexes shown above are unmanaged, cannot be purchased directly, and, with the exception of any peer group index, do not incur expenses.
AVERAGE ANNUAL TOTAL RETURNS (%) (as of September 30, 2024)
| | | |
| | 1 Year | 5 Year | 10 Year |
Class I - without sales charge | 26.76 | 10.88 | 8.66 |
S&P 500 Index1 | 36.35 | 15.98 | 13.38 |
Russell 1000 Value Index | 27.76 | 10.69 | 9.23 |
| 1 | Effective July 24, 2024, the S&P 500 Index replaced the Russell 1000 Value Index as a broad measure of market performance in accordance with new regulatory disclosure requirements. The Fund continues to use the Russell 1000 Value Index as a supplemental benchmark that MML Investment Advisers, LLC believes more closely reflects the market segments in which the Fund invests. |
The Fund’s investment objective and investment strategy changed on November 18, 2020. The performance results shown above would not necessarily have been achieved had the Fund’s current investment strategy been in effect for the entire period for which performance results are presented.
Performance results reflect any applicable waivers or expense limitations in effect during these periods, without which performance would have been lower. The investment return and principal value of shares of the Fund fluctuate, so your shares, when sold, may be worth more or less than their original cost. Current performance of the Fund may be lower or higher than the performance quoted. Performance data current to the most recent month-end may be obtained at https://www.massmutual.com/product-performance/mutual-funds or by calling 1-888-309-3539 or by sending an email request to fundinfo@massmutual.com.
WHAT ARE SOME KEY FUND STATISTICS? (as of September 30, 2024)
| |
Total Net Assets (Millions) | $39.0 |
Total Number of Portfolio Holdings (includes derivative positions, if any) | 166 |
Total Advisory Fees Paid During the Reporting Period | $190,547 |
Portfolio Turnover Rate | 66% |
| MM202912-309770 | PAGE 2 | TSR-AR-ITGHI |
WHAT DID THE FUND INVEST IN? (as of September 30, 2024)
Derivative values, if any, are excluded from the table(s) below.
| |
Largest Holdings
(% of Total Investments) | |
Berkshire Hathaway, Inc. Class B | 4.3% |
JP Morgan Chase & Co. | 3.1% |
Johnson & Johnson | 2.5% |
Walmart, Inc. | 2.4% |
Exxon Mobil Corp. | 2.3% |
UnitedHealth Group, Inc. | 1.7% |
BlackRock, Inc. | 1.6% |
Comcast Corp. Class A | 1.6% |
Aflac, Inc. | 1.3% |
CME Group, Inc. | 1.3% |
| |
Sectors
(% of Total Investments) | |
Financials | 24.3% |
Health Care | 15.7% |
Industrials | 11.5% |
Consumer Staples | 8.8% |
Information Technology | 8.7% |
Real Estate | 7.1% |
Consumer Discretionary | 6.7% |
Energy | 5.6% |
Communication Services | 4.8% |
Materials | 4.2% |
Utilities | 1.6% |
HOW HAS THE FUND CHANGED?
The following is a summary of certain changes to the Fund since October 1, 2023. For more complete information, you may review the Fund’s prospectus, including any applicable supplements, at https://www.massmutual.com/product-performance/mutual-funds or upon request at 1-888-309-3539 or fundinfo@massmutual.com.
Effective February 1, 2024, the annual rate for administrative services for Class A shares of the Fund was reduced from 0.30% to 0.25%.
On or about January 24, 2025 (the “Termination Date”), the Fund is expected to be dissolved pursuant to a Plan of Liquidation and Termination approved by its Board of Trustees, and shareholders of the various classes of shares of the Fund will receive proceeds in proportion to the number of shares of such class held by each of them on the Termination Date.
| |
| WHERE CAN I FIND ADDITIONAL INFORMATION ABOUT THE FUND? |
For additional information about the Fund, including its prospectus, financial information, holdings, and proxy voting information, scan the QR code or visit https://www.massmutual.com/product-performance/mutual-funds. |
| MM202912-309770 | PAGE 3 | TSR-AR-ITGHI |
100009536108001268213859136931269917493157101810622951100009939114721360716044167271926025040211652574135098100009558111061278513993145531382218661165401892924183
| | |
MassMutual Disciplined Value Fund | |
| Class R5 | MEPSX |
| Annual Shareholder Report | September 30, 2024 |
This annual shareholder report contains important information about the MassMutual Disciplined Value Fund (the “Fund”) for the period of October 1, 2023 to September 30, 2024. You can find additional information about the Fund at https://www.massmutual.com/product-performance/mutual-funds. You can also request this information by contacting us at 1-888-309-3539 or by sending an email request to fundinfo@massmutual.com.
This report describes changes to the Fund that occurred during the reporting period.
WHAT WERE THE FUND COSTS FOR THE LAST YEAR?
This example shows the expenses you would have paid over the past year, based on a hypothetical $10,000 investment. This table reflects any applicable waivers or expense limitations.
| | |
Class Name | Costs of a $10,000 investment | Costs paid as a percentage of a $10,000 investment |
| Class R5 | $135 | 1.19% |
HOW DID THE FUND PERFORM?
Global equity markets advanced sharply as they weathered the unsettled geopolitical climate and higher interest rate environment well.
Geopolitical tensions remained high amid continued and escalating conflicts in Ukraine and the Middle East. In the U.S., the Federal Reserve continued its attempts to engineer a ‘soft landing’ and delivered a long-awaited cut in interest rates, with a 50bps cut in September. Domestic stocks advanced over the trailing 12-months as growth outperformed value and large cap shares outperformed their small cap counterparts in the period. U.S. large cap stocks outperformed their foreign counterparts, while shares in emerging markets outperformed developed non-U.S. markets.
Top contributors to the Fund’s performance relative to the Russell 1000® Value Index:
• Stock selection within the industrials sector where an overweight allocation to EMCOR Group, Inc. was particularly impactful
• Stock selection within the health care sector
• Stock selection within the utilities sector
Top detractors to the Fund’s performance relative to the Russell 1000 Value Index:
• Stock selection within the information technology sector where an underweight allocation to Micron Technology, Inc. was particularly impactful
• An underweight allocation to the utilities sector
• Stock selection within the financials sector
Performance shown is past performance and does not guarantee future results. The graph and table below do not reflect the deduction of taxes that a shareholder would pay on Fund distributions or redemption of Fund shares. The graph and table below assume reinvestment of dividends and capital gain distributions.
GROWTH OF A HYPOTHETICAL $10,000 INVESTMENT (October 1, 2014 through September 30, 2024)
This graph shows the performance of a hypothetical $10,000 investment in the share class noted over a ten-year period or since inception, if shorter, as compared to the performance of a broad-based securities market index, and, if applicable, one or more indexes that MML Investment Advisers, LLC believes more closely reflects the market segments in which the Fund invests or is a better comparison for the Fund’s investment strategy. This graph includes the deduction of the maximum applicable sales charge, if any.
| MM202912-309770 | PAGE 1 | TSR-AR-ITGH1 |
The index or indexes shown above are unmanaged, cannot be purchased directly, and, with the exception of any peer group index, do not incur expenses.
AVERAGE ANNUAL TOTAL RETURNS (%) (as of September 30, 2024)
| | | |
| | 1 Year | 5 Year | 10 Year |
Class R5 - without sales charge | 26.74 | 10.79 | 8.57 |
S&P 500 Index1 | 36.35 | 15.98 | 13.38 |
Russell 1000 Value Index | 27.76 | 10.69 | 9.23 |
| 1 | Effective July 24, 2024, the S&P 500 Index replaced the Russell 1000 Value Index as a broad measure of market performance in accordance with new regulatory disclosure requirements. The Fund continues to use the Russell 1000 Value Index as a supplemental benchmark that MML Investment Advisers, LLC believes more closely reflects the market segments in which the Fund invests. |
The Fund’s investment objective and investment strategy changed on November 18, 2020. The performance results shown above would not necessarily have been achieved had the Fund’s current investment strategy been in effect for the entire period for which performance results are presented.
Performance results reflect any applicable waivers or expense limitations in effect during these periods, without which performance would have been lower. The investment return and principal value of shares of the Fund fluctuate, so your shares, when sold, may be worth more or less than their original cost. Current performance of the Fund may be lower or higher than the performance quoted. Performance data current to the most recent month-end may be obtained at https://www.massmutual.com/product-performance/mutual-funds or by calling 1-888-309-3539 or by sending an email request to fundinfo@massmutual.com.
WHAT ARE SOME KEY FUND STATISTICS? (as of September 30, 2024)
| |
Total Net Assets (Millions) | $39.0 |
Total Number of Portfolio Holdings (includes derivative positions, if any) | 166 |
Total Advisory Fees Paid During the Reporting Period | $190,547 |
Portfolio Turnover Rate | 66% |
| MM202912-309770 | PAGE 2 | TSR-AR-ITGH1 |
WHAT DID THE FUND INVEST IN? (as of September 30, 2024)
Derivative values, if any, are excluded from the table(s) below.
| |
Largest Holdings
(% of Total Investments) | |
Berkshire Hathaway, Inc. Class B | 4.3% |
JP Morgan Chase & Co. | 3.1% |
Johnson & Johnson | 2.5% |
Walmart, Inc. | 2.4% |
Exxon Mobil Corp. | 2.3% |
UnitedHealth Group, Inc. | 1.7% |
BlackRock, Inc. | 1.6% |
Comcast Corp. Class A | 1.6% |
Aflac, Inc. | 1.3% |
CME Group, Inc. | 1.3% |
| |
Sectors
(% of Total Investments) | |
Financials | 24.3% |
Health Care | 15.7% |
Industrials | 11.5% |
Consumer Staples | 8.8% |
Information Technology | 8.7% |
Real Estate | 7.1% |
Consumer Discretionary | 6.7% |
Energy | 5.6% |
Communication Services | 4.8% |
Materials | 4.2% |
Utilities | 1.6% |
HOW HAS THE FUND CHANGED?
The following is a summary of certain changes to the Fund since October 1, 2023. For more complete information, you may review the Fund’s prospectus, including any applicable supplements, at https://www.massmutual.com/product-performance/mutual-funds or upon request at 1-888-309-3539 or fundinfo@massmutual.com.
Effective February 1, 2024, the annual rate for administrative services for Class A shares of the Fund was reduced from 0.30% to 0.25%.
On or about January 24, 2025 (the “Termination Date”), the Fund is expected to be dissolved pursuant to a Plan of Liquidation and Termination approved by its Board of Trustees, and shareholders of the various classes of shares of the Fund will receive proceeds in proportion to the number of shares of such class held by each of them on the Termination Date.
| |
| WHERE CAN I FIND ADDITIONAL INFORMATION ABOUT THE FUND? |
For additional information about the Fund, including its prospectus, financial information, holdings, and proxy voting information, scan the QR code or visit https://www.massmutual.com/product-performance/mutual-funds. |
| MM202912-309770 | PAGE 3 | TSR-AR-ITGH1 |
100009526107741264713811136281262817373155881793522746100009939114721360716044167271926025040211652574135098100009558111061278513993145531382218661165401892924183
| | |
MassMutual Disciplined Value Fund | |
| Service Class | DENVX |
| Annual Shareholder Report | September 30, 2024 |
This annual shareholder report contains important information about the MassMutual Disciplined Value Fund (the “Fund”) for the period of October 1, 2023 to September 30, 2024. You can find additional information about the Fund at https://www.massmutual.com/product-performance/mutual-funds. You can also request this information by contacting us at 1-888-309-3539 or by sending an email request to fundinfo@massmutual.com.
This report describes changes to the Fund that occurred during the reporting period.
WHAT WERE THE FUND COSTS FOR THE LAST YEAR?
This example shows the expenses you would have paid over the past year, based on a hypothetical $10,000 investment. This table reflects any applicable waivers or expense limitations.
| | |
Class Name | Costs of a $10,000 investment | Costs paid as a percentage of a $10,000 investment |
| Service Class | $147 | 1.30% |
HOW DID THE FUND PERFORM?
Global equity markets advanced sharply as they weathered the unsettled geopolitical climate and higher interest rate environment well.
Geopolitical tensions remained high amid continued and escalating conflicts in Ukraine and the Middle East. In the U.S., the Federal Reserve continued its attempts to engineer a ‘soft landing’ and delivered a long-awaited cut in interest rates, with a 50bps cut in September. Domestic stocks advanced over the trailing 12-months as growth outperformed value and large cap shares outperformed their small cap counterparts in the period. U.S. large cap stocks outperformed their foreign counterparts, while shares in emerging markets outperformed developed non-U.S. markets.
Top contributors to the Fund’s performance relative to the Russell 1000® Value Index:
• Stock selection within the industrials sector where an overweight allocation to EMCOR Group, Inc. was particularly impactful
• Stock selection within the health care sector
• Stock selection within the utilities sector
Top detractors to the Fund’s performance relative to the Russell 1000 Value Index:
• Stock selection within the information technology sector where an underweight allocation to Micron Technology, Inc. was particularly impactful
• An underweight allocation to the utilities sector
• Stock selection within the financials sector
Performance shown is past performance and does not guarantee future results. The graph and table below do not reflect the deduction of taxes that a shareholder would pay on Fund distributions or redemption of Fund shares. The graph and table below assume reinvestment of dividends and capital gain distributions.
GROWTH OF A HYPOTHETICAL $10,000 INVESTMENT (October 1, 2014 through September 30, 2024)
This graph shows the performance of a hypothetical $10,000 investment in the share class noted over a ten-year period or since inception, if shorter, as compared to the performance of a broad-based securities market index, and, if applicable, one or more indexes that MML Investment Advisers, LLC believes more closely reflects the market segments in which the Fund invests or is a better comparison for the Fund’s investment strategy. This graph includes the deduction of the maximum applicable sales charge, if any.
| MM202912-309770 | PAGE 1 | TSR-AR-ITGH3 |
The index or indexes shown above are unmanaged, cannot be purchased directly, and, with the exception of any peer group index, do not incur expenses.
AVERAGE ANNUAL TOTAL RETURNS (%) (as of September 30, 2024)
| | | |
| | 1 Year | 5 Year | 10 Year |
Service Class - without sales charge | 26.62 | 10.66 | 8.45 |
S&P 500 Index1 | 36.35 | 15.98 | 13.38 |
Russell 1000 Value Index | 27.76 | 10.69 | 9.23 |
| 1 | Effective July 24, 2024, the S&P 500 Index replaced the Russell 1000 Value Index as a broad measure of market performance in accordance with new regulatory disclosure requirements. The Fund continues to use the Russell 1000 Value Index as a supplemental benchmark that MML Investment Advisers, LLC believes more closely reflects the market segments in which the Fund invests. |
The Fund’s investment objective and investment strategy changed on November 18, 2020. The performance results shown above would not necessarily have been achieved had the Fund’s current investment strategy been in effect for the entire period for which performance results are presented.
Performance results reflect any applicable waivers or expense limitations in effect during these periods, without which performance would have been lower. The investment return and principal value of shares of the Fund fluctuate, so your shares, when sold, may be worth more or less than their original cost. Current performance of the Fund may be lower or higher than the performance quoted. Performance data current to the most recent month-end may be obtained at https://www.massmutual.com/product-performance/mutual-funds or by calling 1-888-309-3539 or by sending an email request to fundinfo@massmutual.com.
WHAT ARE SOME KEY FUND STATISTICS? (as of September 30, 2024)
| |
Total Net Assets (Millions) | $39.0 |
Total Number of Portfolio Holdings (includes derivative positions, if any) | 166 |
Total Advisory Fees Paid During the Reporting Period | $190,547 |
Portfolio Turnover Rate | 66% |
| MM202912-309770 | PAGE 2 | TSR-AR-ITGH3 |
WHAT DID THE FUND INVEST IN? (as of September 30, 2024)
Derivative values, if any, are excluded from the table(s) below.
| |
Largest Holdings
(% of Total Investments) | |
Berkshire Hathaway, Inc. Class B | 4.3% |
JP Morgan Chase & Co. | 3.1% |
Johnson & Johnson | 2.5% |
Walmart, Inc. | 2.4% |
Exxon Mobil Corp. | 2.3% |
UnitedHealth Group, Inc. | 1.7% |
BlackRock, Inc. | 1.6% |
Comcast Corp. Class A | 1.6% |
Aflac, Inc. | 1.3% |
CME Group, Inc. | 1.3% |
| |
Sectors
(% of Total Investments) | |
Financials | 24.3% |
Health Care | 15.7% |
Industrials | 11.5% |
Consumer Staples | 8.8% |
Information Technology | 8.7% |
Real Estate | 7.1% |
Consumer Discretionary | 6.7% |
Energy | 5.6% |
Communication Services | 4.8% |
Materials | 4.2% |
Utilities | 1.6% |
HOW HAS THE FUND CHANGED?
The following is a summary of certain changes to the Fund since October 1, 2023. For more complete information, you may review the Fund’s prospectus, including any applicable supplements, at https://www.massmutual.com/product-performance/mutual-funds or upon request at 1-888-309-3539 or fundinfo@massmutual.com.
Effective February 1, 2024, the annual rate for administrative services for Class A shares of the Fund was reduced from 0.30% to 0.25%.
On or about January 24, 2025 (the “Termination Date”), the Fund is expected to be dissolved pursuant to a Plan of Liquidation and Termination approved by its Board of Trustees, and shareholders of the various classes of shares of the Fund will receive proceeds in proportion to the number of shares of such class held by each of them on the Termination Date.
| |
| WHERE CAN I FIND ADDITIONAL INFORMATION ABOUT THE FUND? |
For additional information about the Fund, including its prospectus, financial information, holdings, and proxy voting information, scan the QR code or visit https://www.massmutual.com/product-performance/mutual-funds. |
| MM202912-309770 | PAGE 3 | TSR-AR-ITGH3 |
100009516107561260613752135561253417247154561776722497100009939114721360716044167271926025040211652574135098100009558111061278513993145531382218661165401892924183
| | |
MassMutual Disciplined Value Fund | |
| Administrative Class | MPILX |
| Annual Shareholder Report | September 30, 2024 |
This annual shareholder report contains important information about the MassMutual Disciplined Value Fund (the “Fund”) for the period of October 1, 2023 to September 30, 2024. You can find additional information about the Fund at https://www.massmutual.com/product-performance/mutual-funds. You can also request this information by contacting us at 1-888-309-3539 or by sending an email request to fundinfo@massmutual.com.
This report describes changes to the Fund that occurred during the reporting period.
WHAT WERE THE FUND COSTS FOR THE LAST YEAR?
This example shows the expenses you would have paid over the past year, based on a hypothetical $10,000 investment. This table reflects any applicable waivers or expense limitations.
| | |
Class Name | Costs of a $10,000 investment | Costs paid as a percentage of a $10,000 investment |
| Administrative Class | $159 | 1.40% |
HOW DID THE FUND PERFORM?
Global equity markets advanced sharply as they weathered the unsettled geopolitical climate and higher interest rate environment well.
Geopolitical tensions remained high amid continued and escalating conflicts in Ukraine and the Middle East. In the U.S., the Federal Reserve continued its attempts to engineer a ‘soft landing’ and delivered a long-awaited cut in interest rates, with a 50bps cut in September. Domestic stocks advanced over the trailing 12-months as growth outperformed value and large cap shares outperformed their small cap counterparts in the period. U.S. large cap stocks outperformed their foreign counterparts, while shares in emerging markets outperformed developed non-U.S. markets.
Top contributors to the Fund’s performance relative to the Russell 1000® Value Index:
• Stock selection within the industrials sector where an overweight allocation to EMCOR Group, Inc. was particularly impactful
• Stock selection within the health care sector
• Stock selection within the utilities sector
Top detractors to the Fund’s performance relative to the Russell 1000 Value Index:
• Stock selection within the information technology sector where an underweight allocation to Micron Technology, Inc. was particularly impactful
• An underweight allocation to the utilities sector
• Stock selection within the financials sector
Performance shown is past performance and does not guarantee future results. The graph and table below do not reflect the deduction of taxes that a shareholder would pay on Fund distributions or redemption of Fund shares. The graph and table below assume reinvestment of dividends and capital gain distributions.
GROWTH OF A HYPOTHETICAL $10,000 INVESTMENT (October 1, 2014 through September 30, 2024)
This graph shows the performance of a hypothetical $10,000 investment in the share class noted over a ten-year period or since inception, if shorter, as compared to the performance of a broad-based securities market index, and, if applicable, one or more indexes that MML Investment Advisers, LLC believes more closely reflects the market segments in which the Fund invests or is a better comparison for the Fund’s investment strategy. This graph includes the deduction of the maximum applicable sales charge, if any.
| MM202912-309770 | PAGE 1 | TSR-AR-ITGH4 |
The index or indexes shown above are unmanaged, cannot be purchased directly, and, with the exception of any peer group index, do not incur expenses.
AVERAGE ANNUAL TOTAL RETURNS (%) (as of September 30, 2024)
| | | |
| | 1 Year | 5 Year | 10 Year |
Administrative Class - without sales charge | 26.48 | 10.55 | 8.34 |
S&P 500 Index1 | 36.35 | 15.98 | 13.38 |
Russell 1000 Value Index | 27.76 | 10.69 | 9.23 |
| 1 | Effective July 24, 2024, the S&P 500 Index replaced the Russell 1000 Value Index as a broad measure of market performance in accordance with new regulatory disclosure requirements. The Fund continues to use the Russell 1000 Value Index as a supplemental benchmark that MML Investment Advisers, LLC believes more closely reflects the market segments in which the Fund invests. |
The Fund’s investment objective and investment strategy changed on November 18, 2020. The performance results shown above would not necessarily have been achieved had the Fund’s current investment strategy been in effect for the entire period for which performance results are presented.
Performance results reflect any applicable waivers or expense limitations in effect during these periods, without which performance would have been lower. The investment return and principal value of shares of the Fund fluctuate, so your shares, when sold, may be worth more or less than their original cost. Current performance of the Fund may be lower or higher than the performance quoted. Performance data current to the most recent month-end may be obtained at https://www.massmutual.com/product-performance/mutual-funds or by calling 1-888-309-3539 or by sending an email request to fundinfo@massmutual.com.
WHAT ARE SOME KEY FUND STATISTICS? (as of September 30, 2024)
| |
Total Net Assets (Millions) | $39.0 |
Total Number of Portfolio Holdings (includes derivative positions, if any) | 166 |
Total Advisory Fees Paid During the Reporting Period | $190,547 |
Portfolio Turnover Rate | 66% |
| MM202912-309770 | PAGE 2 | TSR-AR-ITGH4 |
WHAT DID THE FUND INVEST IN? (as of September 30, 2024)
Derivative values, if any, are excluded from the table(s) below.
| |
Largest Holdings
(% of Total Investments) | |
Berkshire Hathaway, Inc. Class B | 4.3% |
JP Morgan Chase & Co. | 3.1% |
Johnson & Johnson | 2.5% |
Walmart, Inc. | 2.4% |
Exxon Mobil Corp. | 2.3% |
UnitedHealth Group, Inc. | 1.7% |
BlackRock, Inc. | 1.6% |
Comcast Corp. Class A | 1.6% |
Aflac, Inc. | 1.3% |
CME Group, Inc. | 1.3% |
| |
Sectors
(% of Total Investments) | |
Financials | 24.3% |
Health Care | 15.7% |
Industrials | 11.5% |
Consumer Staples | 8.8% |
Information Technology | 8.7% |
Real Estate | 7.1% |
Consumer Discretionary | 6.7% |
Energy | 5.6% |
Communication Services | 4.8% |
Materials | 4.2% |
Utilities | 1.6% |
HOW HAS THE FUND CHANGED?
The following is a summary of certain changes to the Fund since October 1, 2023. For more complete information, you may review the Fund’s prospectus, including any applicable supplements, at https://www.massmutual.com/product-performance/mutual-funds or upon request at 1-888-309-3539 or fundinfo@massmutual.com.
Effective February 1, 2024, the annual rate for administrative services for Class A shares of the Fund was reduced from 0.30% to 0.25%.
On or about January 24, 2025 (the “Termination Date”), the Fund is expected to be dissolved pursuant to a Plan of Liquidation and Termination approved by its Board of Trustees, and shareholders of the various classes of shares of the Fund will receive proceeds in proportion to the number of shares of such class held by each of them on the Termination Date.
| |
| WHERE CAN I FIND ADDITIONAL INFORMATION ABOUT THE FUND? |
For additional information about the Fund, including its prospectus, financial information, holdings, and proxy voting information, scan the QR code or visit https://www.massmutual.com/product-performance/mutual-funds. |
| MM202912-309770 | PAGE 3 | TSR-AR-ITGH4 |
100009503107351256813694134941246517118153291761422279100009939114721360716044167271926025040211652574135098100009558111061278513993145531382218661165401892924183
| | |
MassMutual Disciplined Value Fund | |
| Class R4 | MPIRX |
| Annual Shareholder Report | September 30, 2024 |
This annual shareholder report contains important information about the MassMutual Disciplined Value Fund (the “Fund”) for the period of October 1, 2023 to September 30, 2024. You can find additional information about the Fund at https://www.massmutual.com/product-performance/mutual-funds. You can also request this information by contacting us at 1-888-309-3539 or by sending an email request to fundinfo@massmutual.com.
This report describes changes to the Fund that occurred during the reporting period.
WHAT WERE THE FUND COSTS FOR THE LAST YEAR?
This example shows the expenses you would have paid over the past year, based on a hypothetical $10,000 investment. This table reflects any applicable waivers or expense limitations.
| | |
Class Name | Costs of a $10,000 investment | Costs paid as a percentage of a $10,000 investment |
| Class R4 | $178 | 1.57% |
HOW DID THE FUND PERFORM?
Global equity markets advanced sharply as they weathered the unsettled geopolitical climate and higher interest rate environment well.
Geopolitical tensions remained high amid continued and escalating conflicts in Ukraine and the Middle East. In the U.S., the Federal Reserve continued its attempts to engineer a ‘soft landing’ and delivered a long-awaited cut in interest rates, with a 50bps cut in September. Domestic stocks advanced over the trailing 12-months as growth outperformed value and large cap shares outperformed their small cap counterparts in the period. U.S. large cap stocks outperformed their foreign counterparts, while shares in emerging markets outperformed developed non-U.S. markets.
Top contributors to the Fund’s performance relative to the Russell 1000® Value Index:
• Stock selection within the industrials sector where an overweight allocation to EMCOR Group, Inc. was particularly impactful
• Stock selection within the health care sector
• Stock selection within the utilities sector
Top detractors to the Fund’s performance relative to the Russell 1000 Value Index:
• Stock selection within the information technology sector where an underweight allocation to Micron Technology, Inc. was particularly impactful
• An underweight allocation to the utilities sector
• Stock selection within the financials sector
Performance shown is past performance and does not guarantee future results. The graph and table below do not reflect the deduction of taxes that a shareholder would pay on Fund distributions or redemption of Fund shares. The graph and table below assume reinvestment of dividends and capital gain distributions.
GROWTH OF A HYPOTHETICAL $10,000 INVESTMENT (October 1, 2014 through September 30, 2024)
This graph shows the performance of a hypothetical $10,000 investment in the share class noted over a ten-year period or since inception, if shorter, as compared to the performance of a broad-based securities market index, and, if applicable, one or more indexes that MML Investment Advisers, LLC believes more closely reflects the market segments in which the Fund invests or is a better comparison for the Fund’s investment strategy. This graph includes the deduction of the maximum applicable sales charge, if any.
| MM202912-309770 | PAGE 1 | TSR-AR-ITGHK |
The index or indexes shown above are unmanaged, cannot be purchased directly, and, with the exception of any peer group index, do not incur expenses.
AVERAGE ANNUAL TOTAL RETURNS (%) (as of September 30, 2024)
| | | |
| | 1 Year | 5 Year | 10 Year |
Class R4 - without sales charge | 26.22 | 10.36 | 8.17 |
S&P 500 Index1 | 36.35 | 15.98 | 13.38 |
Russell 1000 Value Index | 27.76 | 10.69 | 9.23 |
| 1 | Effective July 24, 2024, the S&P 500 Index replaced the Russell 1000 Value Index as a broad measure of market performance in accordance with new regulatory disclosure requirements. The Fund continues to use the Russell 1000 Value Index as a supplemental benchmark that MML Investment Advisers, LLC believes more closely reflects the market segments in which the Fund invests. |
The Fund’s investment objective and investment strategy changed on November 18, 2020. The performance results shown above would not necessarily have been achieved had the Fund’s current investment strategy been in effect for the entire period for which performance results are presented.
Performance results reflect any applicable waivers or expense limitations in effect during these periods, without which performance would have been lower. The investment return and principal value of shares of the Fund fluctuate, so your shares, when sold, may be worth more or less than their original cost. Current performance of the Fund may be lower or higher than the performance quoted. Performance data current to the most recent month-end may be obtained at https://www.massmutual.com/product-performance/mutual-funds or by calling 1-888-309-3539 or by sending an email request to fundinfo@massmutual.com.
WHAT ARE SOME KEY FUND STATISTICS? (as of September 30, 2024)
| |
Total Net Assets (Millions) | $39.0 |
Total Number of Portfolio Holdings (includes derivative positions, if any) | 166 |
Total Advisory Fees Paid During the Reporting Period | $190,547 |
Portfolio Turnover Rate | 66% |
| MM202912-309770 | PAGE 2 | TSR-AR-ITGHK |
WHAT DID THE FUND INVEST IN? (as of September 30, 2024)
Derivative values, if any, are excluded from the table(s) below.
| |
Largest Holdings
(% of Total Investments) | |
Berkshire Hathaway, Inc. Class B | 4.3% |
JP Morgan Chase & Co. | 3.1% |
Johnson & Johnson | 2.5% |
Walmart, Inc. | 2.4% |
Exxon Mobil Corp. | 2.3% |
UnitedHealth Group, Inc. | 1.7% |
BlackRock, Inc. | 1.6% |
Comcast Corp. Class A | 1.6% |
Aflac, Inc. | 1.3% |
CME Group, Inc. | 1.3% |
| |
Sectors
(% of Total Investments) | |
Financials | 24.3% |
Health Care | 15.7% |
Industrials | 11.5% |
Consumer Staples | 8.8% |
Information Technology | 8.7% |
Real Estate | 7.1% |
Consumer Discretionary | 6.7% |
Energy | 5.6% |
Communication Services | 4.8% |
Materials | 4.2% |
Utilities | 1.6% |
HOW HAS THE FUND CHANGED?
The following is a summary of certain changes to the Fund since October 1, 2023. For more complete information, you may review the Fund’s prospectus, including any applicable supplements, at https://www.massmutual.com/product-performance/mutual-funds or upon request at 1-888-309-3539 or fundinfo@massmutual.com.
Effective February 1, 2024, the annual rate for administrative services for Class A shares of the Fund was reduced from 0.30% to 0.25%.
On or about January 24, 2025 (the “Termination Date”), the Fund is expected to be dissolved pursuant to a Plan of Liquidation and Termination approved by its Board of Trustees, and shareholders of the various classes of shares of the Fund will receive proceeds in proportion to the number of shares of such class held by each of them on the Termination Date.
| |
| WHERE CAN I FIND ADDITIONAL INFORMATION ABOUT THE FUND? |
For additional information about the Fund, including its prospectus, financial information, holdings, and proxy voting information, scan the QR code or visit https://www.massmutual.com/product-performance/mutual-funds. |
| MM202912-309770 | PAGE 3 | TSR-AR-ITGHK |
100009490107011251313619133941236216947151461736921923100009939114721360716044167271926025040211652574135098100009558111061278513993145531382218661165401892924183
| | |
MassMutual Disciplined Value Fund | |
| Class A | MEPAX |
| Annual Shareholder Report | September 30, 2024 |
This annual shareholder report contains important information about the MassMutual Disciplined Value Fund (the “Fund”) for the period of October 1, 2023 to September 30, 2024. You can find additional information about the Fund at https://www.massmutual.com/product-performance/mutual-funds. You can also request this information by contacting us at 1-888-309-3539 or by sending an email request to fundinfo@massmutual.com.
This report describes changes to the Fund that occurred during the reporting period.
WHAT WERE THE FUND COSTS FOR THE LAST YEAR?
This example shows the expenses you would have paid over the past year, based on a hypothetical $10,000 investment. This table reflects any applicable waivers or expense limitations.
| | |
Class Name | Costs of a $10,000 investment | Costs paid as a percentage of a $10,000 investment |
| Class A | $182 | 1.61% |
HOW DID THE FUND PERFORM?
Global equity markets advanced sharply as they weathered the unsettled geopolitical climate and higher interest rate environment well.
Geopolitical tensions remained high amid continued and escalating conflicts in Ukraine and the Middle East. In the U.S., the Federal Reserve continued its attempts to engineer a ‘soft landing’ and delivered a long-awaited cut in interest rates, with a 50bps cut in September. Domestic stocks advanced over the trailing 12-months as growth outperformed value and large cap shares outperformed their small cap counterparts in the period. U.S. large cap stocks outperformed their foreign counterparts, while shares in emerging markets outperformed developed non-U.S. markets.
Top contributors to the Fund’s performance relative to the Russell 1000® Value Index:
• Stock selection within the industrials sector where an overweight allocation to EMCOR Group, Inc. was particularly impactful
• Stock selection within the health care sector
• Stock selection within the utilities sector
Top detractors to the Fund’s performance relative to the Russell 1000 Value Index:
• Stock selection within the information technology sector where an underweight allocation to Micron Technology, Inc. was particularly impactful
• An underweight allocation to the utilities sector
• Stock selection within the financials sector
Performance shown is past performance and does not guarantee future results. The graph and table below do not reflect the deduction of taxes that a shareholder would pay on Fund distributions or redemption of Fund shares. The graph and table below assume reinvestment of dividends and capital gain distributions.
GROWTH OF A HYPOTHETICAL $10,000 INVESTMENT (October 1, 2014 through September 30, 2024)
This graph shows the performance of a hypothetical $10,000 investment in the share class noted over a ten-year period or since inception, if shorter, as compared to the performance of a broad-based securities market index, and, if applicable, one or more indexes that MML Investment Advisers, LLC believes more closely reflects the market segments in which the Fund invests or is a better comparison for the Fund’s investment strategy. This graph includes the deduction of the maximum applicable sales charge, if any.
| MM202912-309770 | PAGE 1 | TSR-AR-ITGH2 |
The index or indexes shown above are unmanaged, cannot be purchased directly, and, with the exception of any peer group index, do not incur expenses.
AVERAGE ANNUAL TOTAL RETURNS (%) (as of September 30, 2024)
| | | |
| | 1 Year | 5 Year | 10 Year |
Class A - without sales charge | 26.12 | 10.28 | 8.08 |
Class A - with maximum sales charge | 19.18 | 9.04 | 7.47 |
S&P 500 Index1 | 36.35 | 15.98 | 13.38 |
Russell 1000 Value Index | 27.76 | 10.69 | 9.23 |
| 1 | Effective July 24, 2024, the S&P 500 Index replaced the Russell 1000 Value Index as a broad measure of market performance in accordance with new regulatory disclosure requirements. The Fund continues to use the Russell 1000 Value Index as a supplemental benchmark that MML Investment Advisers, LLC believes more closely reflects the market segments in which the Fund invests. |
The Fund’s investment objective and investment strategy changed on November 18, 2020. The performance results shown above would not necessarily have been achieved had the Fund’s current investment strategy been in effect for the entire period for which performance results are presented.
Performance results reflect any applicable waivers or expense limitations in effect during these periods, without which performance would have been lower. The investment return and principal value of shares of the Fund fluctuate, so your shares, when sold, may be worth more or less than their original cost. Current performance of the Fund may be lower or higher than the performance quoted. Performance data current to the most recent month-end may be obtained at https://www.massmutual.com/product-performance/mutual-funds or by calling 1-888-309-3539 or by sending an email request to fundinfo@massmutual.com.
WHAT ARE SOME KEY FUND STATISTICS? (as of September 30, 2024)
| |
Total Net Assets (Millions) | $39.0 |
Total Number of Portfolio Holdings (includes derivative positions, if any) | 166 |
Total Advisory Fees Paid During the Reporting Period | $190,547 |
Portfolio Turnover Rate | 66% |
| MM202912-309770 | PAGE 2 | TSR-AR-ITGH2 |
WHAT DID THE FUND INVEST IN? (as of September 30, 2024)
Derivative values, if any, are excluded from the table(s) below.
| |
Largest Holdings
(% of Total Investments) | |
Berkshire Hathaway, Inc. Class B | 4.3% |
JP Morgan Chase & Co. | 3.1% |
Johnson & Johnson | 2.5% |
Walmart, Inc. | 2.4% |
Exxon Mobil Corp. | 2.3% |
UnitedHealth Group, Inc. | 1.7% |
BlackRock, Inc. | 1.6% |
Comcast Corp. Class A | 1.6% |
Aflac, Inc. | 1.3% |
CME Group, Inc. | 1.3% |
| |
Sectors
(% of Total Investments) | |
Financials | 24.3% |
Health Care | 15.7% |
Industrials | 11.5% |
Consumer Staples | 8.8% |
Information Technology | 8.7% |
Real Estate | 7.1% |
Consumer Discretionary | 6.7% |
Energy | 5.6% |
Communication Services | 4.8% |
Materials | 4.2% |
Utilities | 1.6% |
HOW HAS THE FUND CHANGED?
The following is a summary of certain changes to the Fund since October 1, 2023. For more complete information, you may review the Fund’s prospectus, including any applicable supplements, at https://www.massmutual.com/product-performance/mutual-funds or upon request at 1-888-309-3539 or fundinfo@massmutual.com.
Effective February 1, 2024, the annual rate for administrative services for Class A shares of the Fund was reduced from 0.30% to 0.25%.
On or about January 24, 2025 (the “Termination Date”), the Fund is expected to be dissolved pursuant to a Plan of Liquidation and Termination approved by its Board of Trustees, and shareholders of the various classes of shares of the Fund will receive proceeds in proportion to the number of shares of such class held by each of them on the Termination Date.
| |
| WHERE CAN I FIND ADDITIONAL INFORMATION ABOUT THE FUND? |
For additional information about the Fund, including its prospectus, financial information, holdings, and proxy voting information, scan the QR code or visit https://www.massmutual.com/product-performance/mutual-funds. |
| MM202912-309770 | PAGE 3 | TSR-AR-ITGH2 |
94508965101001179112821125971161915918142181629320548100009939114721360716044167271926025040211652574135098100009558111061278513993145531382218661165401892924183
| | |
MassMutual Disciplined Value Fund | |
| Class R3 | MPINX |
| Annual Shareholder Report | September 30, 2024 |
This annual shareholder report contains important information about the MassMutual Disciplined Value Fund (the “Fund”) for the period of October 1, 2023 to September 30, 2024. You can find additional information about the Fund at https://www.massmutual.com/product-performance/mutual-funds. You can also request this information by contacting us at 1-888-309-3539 or by sending an email request to fundinfo@massmutual.com.
This report describes changes to the Fund that occurred during the reporting period.
WHAT WERE THE FUND COSTS FOR THE LAST YEAR?
This example shows the expenses you would have paid over the past year, based on a hypothetical $10,000 investment. This table reflects any applicable waivers or expense limitations.
| | |
Class Name | Costs of a $10,000 investment | Costs paid as a percentage of a $10,000 investment |
| Class R3 | $203 | 1.80% |
HOW DID THE FUND PERFORM?
Global equity markets advanced sharply as they weathered the unsettled geopolitical climate and higher interest rate environment well.
Geopolitical tensions remained high amid continued and escalating conflicts in Ukraine and the Middle East. In the U.S., the Federal Reserve continued its attempts to engineer a ‘soft landing’ and delivered a long-awaited cut in interest rates, with a 50bps cut in September. Domestic stocks advanced over the trailing 12-months as growth outperformed value and large cap shares outperformed their small cap counterparts in the period. U.S. large cap stocks outperformed their foreign counterparts, while shares in emerging markets outperformed developed non-U.S. markets.
Top contributors to the Fund’s performance relative to the Russell 1000® Value Index:
• Stock selection within the industrials sector where an overweight allocation to EMCOR Group, Inc. was particularly impactful
• Stock selection within the health care sector
• Stock selection within the utilities sector
Top detractors to the Fund’s performance relative to the Russell 1000 Value Index:
• Stock selection within the information technology sector where an underweight allocation to Micron Technology, Inc. was particularly impactful
• An underweight allocation to the utilities sector
• Stock selection within the financials sector
Performance shown is past performance and does not guarantee future results. The graph and table below do not reflect the deduction of taxes that a shareholder would pay on Fund distributions or redemption of Fund shares. The graph and table below assume reinvestment of dividends and capital gain distributions.
GROWTH OF A HYPOTHETICAL $10,000 INVESTMENT (October 1, 2014 through September 30, 2024)
This graph shows the performance of a hypothetical $10,000 investment in the share class noted over a ten-year period or since inception, if shorter, as compared to the performance of a broad-based securities market index, and, if applicable, one or more indexes that MML Investment Advisers, LLC believes more closely reflects the market segments in which the Fund invests or is a better comparison for the Fund’s investment strategy. This graph includes the deduction of the maximum applicable sales charge, if any.
| MM202912-309770 | PAGE 1 | TSR-AR-ITGH5 |
The index or indexes shown above are unmanaged, cannot be purchased directly, and, with the exception of any peer group index, do not incur expenses.
AVERAGE ANNUAL TOTAL RETURNS (%) (as of September 30, 2024)
| | | |
| | 1 Year | 5 Year | 10 Year |
Class R3 - without sales charge | 25.97 | 10.10 | 7.91 |
S&P 500 Index1 | 36.35 | 15.98 | 13.38 |
Russell 1000 Value Index | 27.76 | 10.69 | 9.23 |
| 1 | Effective July 24, 2024, the S&P 500 Index replaced the Russell 1000 Value Index as a broad measure of market performance in accordance with new regulatory disclosure requirements. The Fund continues to use the Russell 1000 Value Index as a supplemental benchmark that MML Investment Advisers, LLC believes more closely reflects the market segments in which the Fund invests. |
The Fund’s investment objective and investment strategy changed on November 18, 2020. The performance results shown above would not necessarily have been achieved had the Fund’s current investment strategy been in effect for the entire period for which performance results are presented.
Performance results reflect any applicable waivers or expense limitations in effect during these periods, without which performance would have been lower. The investment return and principal value of shares of the Fund fluctuate, so your shares, when sold, may be worth more or less than their original cost. Current performance of the Fund may be lower or higher than the performance quoted. Performance data current to the most recent month-end may be obtained at https://www.massmutual.com/product-performance/mutual-funds or by calling 1-888-309-3539 or by sending an email request to fundinfo@massmutual.com.
WHAT ARE SOME KEY FUND STATISTICS? (as of September 30, 2024)
| |
Total Net Assets (Millions) | $39.0 |
Total Number of Portfolio Holdings (includes derivative positions, if any) | 166 |
Total Advisory Fees Paid During the Reporting Period | $190,547 |
Portfolio Turnover Rate | 66% |
| MM202912-309770 | PAGE 2 | TSR-AR-ITGH5 |
WHAT DID THE FUND INVEST IN? (as of September 30, 2024)
Derivative values, if any, are excluded from the table(s) below.
| |
Largest Holdings
(% of Total Investments) | |
Berkshire Hathaway, Inc. Class B | 4.3% |
JP Morgan Chase & Co. | 3.1% |
Johnson & Johnson | 2.5% |
Walmart, Inc. | 2.4% |
Exxon Mobil Corp. | 2.3% |
UnitedHealth Group, Inc. | 1.7% |
BlackRock, Inc. | 1.6% |
Comcast Corp. Class A | 1.6% |
Aflac, Inc. | 1.3% |
CME Group, Inc. | 1.3% |
| |
Sectors
(% of Total Investments) | |
Financials | 24.3% |
Health Care | 15.7% |
Industrials | 11.5% |
Consumer Staples | 8.8% |
Information Technology | 8.7% |
Real Estate | 7.1% |
Consumer Discretionary | 6.7% |
Energy | 5.6% |
Communication Services | 4.8% |
Materials | 4.2% |
Utilities | 1.6% |
HOW HAS THE FUND CHANGED?
The following is a summary of certain changes to the Fund since October 1, 2023. For more complete information, you may review the Fund’s prospectus, including any applicable supplements, at https://www.massmutual.com/product-performance/mutual-funds or upon request at 1-888-309-3539 or fundinfo@massmutual.com.
Effective February 1, 2024, the annual rate for administrative services for Class A shares of the Fund was reduced from 0.30% to 0.25%.
On or about January 24, 2025 (the “Termination Date”), the Fund is expected to be dissolved pursuant to a Plan of Liquidation and Termination approved by its Board of Trustees, and shareholders of the various classes of shares of the Fund will receive proceeds in proportion to the number of shares of such class held by each of them on the Termination Date.
| |
| WHERE CAN I FIND ADDITIONAL INFORMATION ABOUT THE FUND? |
For additional information about the Fund, including its prospectus, financial information, holdings, and proxy voting information, scan the QR code or visit https://www.massmutual.com/product-performance/mutual-funds. |
| MM202912-309770 | PAGE 3 | TSR-AR-ITGH5 |
100009471106531242413483132331217716668148571699821413100009939114721360716044167271926025040211652574135098100009558111061278513993145531382218661165401892924183
| | |
MassMutual Disciplined Value Fund | |
| Class Y | MMOAX |
| Annual Shareholder Report | September 30, 2024 |
This annual shareholder report contains important information about the MassMutual Disciplined Value Fund (the “Fund”) for the period of October 1, 2023 to September 30, 2024. You can find additional information about the Fund at https://www.massmutual.com/product-performance/mutual-funds. You can also request this information by contacting us at 1-888-309-3539 or by sending an email request to fundinfo@massmutual.com.
This report describes changes to the Fund that occurred during the reporting period.
WHAT WERE THE FUND COSTS FOR THE LAST YEAR?
This example shows the expenses you would have paid over the past year, based on a hypothetical $10,000 investment. This table reflects any applicable waivers or expense limitations.
| | |
Class Name | Costs of a $10,000 investment | Costs paid as a percentage of a $10,000 investment |
| Class Y | $136 | 1.20% |
HOW DID THE FUND PERFORM?
Global equity markets advanced sharply as they weathered the unsettled geopolitical climate and higher interest rate environment well.
Geopolitical tensions remained high amid continued and escalating conflicts in Ukraine and the Middle East. In the U.S., the Federal Reserve continued its attempts to engineer a ‘soft landing’ and delivered a long-awaited cut in interest rates, with a 50bps cut in September. Domestic stocks advanced over the trailing 12-months as growth outperformed value and large cap shares outperformed their small cap counterparts in the period. U.S. large cap stocks outperformed their foreign counterparts, while shares in emerging markets outperformed developed non-U.S. markets.
Top contributors to the Fund’s performance relative to the Russell 1000® Value Index:
• Stock selection within the industrials sector where an overweight allocation to EMCOR Group, Inc. was particularly impactful
• Stock selection within the health care sector
• Stock selection within the utilities sector
Top detractors to the Fund’s performance relative to the Russell 1000 Value Index:
• Stock selection within the information technology sector where an underweight allocation to Micron Technology, Inc. was particularly impactful
• An underweight allocation to the utilities sector
• Stock selection within the financials sector
Performance shown is past performance and does not guarantee future results. The graph and table below do not reflect the deduction of taxes that a shareholder would pay on Fund distributions or redemption of Fund shares. The graph and table below assume reinvestment of dividends and capital gain distributions.
GROWTH OF A HYPOTHETICAL $10,000 INVESTMENT (February 1, 2023 through September 30, 2024)
This graph shows the performance of a hypothetical $10,000 investment in the share class noted over a ten-year period or since inception, if shorter, as compared to the performance of a broad-based securities market index, and, if applicable, one or more indexes that MML Investment Advisers, LLC believes more closely reflects the market segments in which the Fund invests or is a better comparison for the Fund’s investment strategy. This graph includes the deduction of the maximum applicable sales charge, if any.
| MM202912-309770 | PAGE 1 | TSR-AR-ITGHY |
The index or indexes shown above are unmanaged, cannot be purchased directly, and, with the exception of any peer group index, do not incur expenses.
AVERAGE ANNUAL TOTAL RETURNS (%) (as of September 30, 2024)
| | |
| | 1 Year | Since Inception
(02/01/2023) |
Class Y - without sales charge | 26.71 | 13.22 |
S&P 500 Index1 | 36.35 | 25.04 |
Russell 1000 Value Index | 27.76 | 13.60 |
| 1 | Effective July 24, 2024, the S&P 500 Index replaced the Russell 1000 Value Index as a broad measure of market performance in accordance with new regulatory disclosure requirements. The Fund continues to use the Russell 1000 Value Index as a supplemental benchmark that MML Investment Advisers, LLC believes more closely reflects the market segments in which the Fund invests. |
Performance results reflect any applicable waivers or expense limitations in effect during these periods, without which performance would have been lower. The investment return and principal value of shares of the Fund fluctuate, so your shares, when sold, may be worth more or less than their original cost. Current performance of the Fund may be lower or higher than the performance quoted. Performance data current to the most recent month-end may be obtained at https://www.massmutual.com/product-performance/mutual-funds or by calling 1-888-309-3539 or by sending an email request to fundinfo@massmutual.com.
WHAT ARE SOME KEY FUND STATISTICS? (as of September 30, 2024)
| |
Total Net Assets (Millions) | $39.0 |
Total Number of Portfolio Holdings (includes derivative positions, if any) | 166 |
Total Advisory Fees Paid During the Reporting Period | $190,547 |
Portfolio Turnover Rate | 66% |
| MM202912-309770 | PAGE 2 | TSR-AR-ITGHY |
WHAT DID THE FUND INVEST IN? (as of September 30, 2024)
Derivative values, if any, are excluded from the table(s) below.
| |
Largest Holdings
(% of Total Investments) | |
Berkshire Hathaway, Inc. Class B | 4.3% |
JP Morgan Chase & Co. | 3.1% |
Johnson & Johnson | 2.5% |
Walmart, Inc. | 2.4% |
Exxon Mobil Corp. | 2.3% |
UnitedHealth Group, Inc. | 1.7% |
BlackRock, Inc. | 1.6% |
Comcast Corp. Class A | 1.6% |
Aflac, Inc. | 1.3% |
CME Group, Inc. | 1.3% |
| |
Sectors
(% of Total Investments) | |
Financials | 24.3% |
Health Care | 15.7% |
Industrials | 11.5% |
Consumer Staples | 8.8% |
Information Technology | 8.7% |
Real Estate | 7.1% |
Consumer Discretionary | 6.7% |
Energy | 5.6% |
Communication Services | 4.8% |
Materials | 4.2% |
Utilities | 1.6% |
HOW HAS THE FUND CHANGED?
The following is a summary of certain changes to the Fund since October 1, 2023. For more complete information, you may review the Fund’s prospectus, including any applicable supplements, at https://www.massmutual.com/product-performance/mutual-funds or upon request at 1-888-309-3539 or fundinfo@massmutual.com.
Effective February 1, 2024, the annual rate for administrative services for Class A shares of the Fund was reduced from 0.30% to 0.25%.
On or about January 24, 2025 (the “Termination Date”), the Fund is expected to be dissolved pursuant to a Plan of Liquidation and Termination approved by its Board of Trustees, and shareholders of the various classes of shares of the Fund will receive proceeds in proportion to the number of shares of such class held by each of them on the Termination Date.
| |
| WHERE CAN I FIND ADDITIONAL INFORMATION ABOUT THE FUND? |
For additional information about the Fund, including its prospectus, financial information, holdings, and proxy voting information, scan the QR code or visit https://www.massmutual.com/product-performance/mutual-funds. |
| MM202912-309770 | PAGE 3 | TSR-AR-ITGHY |
1000096981228910000105281435510000962412295
| | |
MassMutual Disciplined Growth Fund | |
| Class I | MPDIX |
| Annual Shareholder Report | September 30, 2024 |
This annual shareholder report contains important information about the MassMutual Disciplined Growth Fund (the “Fund”) for the period of October 1, 2023 to September 30, 2024. You can find additional information about the Fund at https://www.massmutual.com/product-performance/mutual-funds. You can also request this information by contacting us at 1-888-309-3539 or by sending an email request to fundinfo@massmutual.com.
This report describes changes to the Fund that occurred during the reporting period.
WHAT WERE THE FUND COSTS FOR THE LAST YEAR?
This example shows the expenses you would have paid over the past year, based on a hypothetical $10,000 investment. This table reflects any applicable waivers or expense limitations.
| | |
Class Name | Costs of a $10,000 investment | Costs paid as a percentage of a $10,000 investment |
| Class I | $72 | 0.59% |
HOW DID THE FUND PERFORM?
Global equity markets advanced sharply as they weathered the unsettled geopolitical climate and higher interest rate environment well.
Geopolitical tensions remained high amid continued and escalating conflicts in Ukraine and the Middle East. In the U.S., the Federal Reserve continued its attempts to engineer a ‘soft landing’ and delivered a long-awaited cut in interest rates, with a 50bps cut in September. Domestic stocks advanced over the trailing 12-months as growth outperformed value and large cap shares outperformed their small cap counterparts in the period. U.S. large cap stocks outperformed their foreign counterparts, while shares in emerging markets outperformed developed non-U.S. markets.
Top contributors to the Fund’s performance relative to the Russell 1000® Growth Index:
• Stock selection within the information technology sector where an overweight allocation to NVIDIA Corp. was particularly impactful
• Stock selection within and an overweight allocation to the industrials sector
• Stock selection within the consumer discretionary sector where an overweight allocation to TopBuild Corp. was beneficial
Top detractors to the Fund’s performance relative to the Russell 1000 Growth Index:
• Stock selection within and an overweight allocation to the health care sector
• Stock selection within the consumer staples sector where an overweight allocation to Monster Beverage Corp. was impactful
• An overweight allocation to, and stock selection within, the financials sector
Performance shown is past performance and does not guarantee future results. The graph and table below do not reflect the deduction of taxes that a shareholder would pay on Fund distributions or redemption of Fund shares. The graph and table below assume reinvestment of dividends and capital gain distributions.
GROWTH OF A HYPOTHETICAL $10,000 INVESTMENT (October 1, 2014 through September 30, 2024)
This graph shows the performance of a hypothetical $10,000 investment in the share class noted over a ten-year period or since inception, if shorter, as compared to the performance of a broad-based securities market index, and, if applicable, one or more indexes that MML Investment Advisers, LLC believes more closely reflects the market segments in which the Fund invests or is a better comparison for the Fund’s investment strategy. This graph includes the deduction of the maximum applicable sales charge, if any.
| MM202912-309770 | PAGE 1 | TSR-AR-ITJQI |
The index or indexes shown above are unmanaged, cannot be purchased directly, and, with the exception of any peer group index, do not incur expenses.
AVERAGE ANNUAL TOTAL RETURNS (%) (as of September 30, 2024)
| | | |
| | 1 Year | 5 Year | 10 Year |
Class I - without sales charge | 44.58 | 17.72 | 14.65 |
S&P 500 Index1 | 36.35 | 15.98 | 13.38 |
Russell 1000 Growth Index | 42.19 | 19.74 | 16.52 |
| 1 | Effective July 24, 2024, the S&P 500 Index replaced the Russell 1000 Growth Index as a broad measure of market performance in accordance with new regulatory disclosure requirements. The Fund continues to use the Russell 1000 Growth Index as a supplemental benchmark that MML Investment Advisers, LLC believes more closely reflects the market segments in which the Fund invests. |
The Fund’s investment objective and investment strategy changed on November 18, 2020. The performance results shown above would not necessarily have been achieved had the Fund’s current investment strategy been in effect for the entire period for which performance results are presented.
Performance results reflect any applicable waivers or expense limitations in effect during these periods, without which performance would have been lower. The investment return and principal value of shares of the Fund fluctuate, so your shares, when sold, may be worth more or less than their original cost. Current performance of the Fund may be lower or higher than the performance quoted. Performance data current to the most recent month-end may be obtained at https://www.massmutual.com/product-performance/mutual-funds or by calling 1-888-309-3539 or by sending an email request to fundinfo@massmutual.com.
WHAT ARE SOME KEY FUND STATISTICS? (as of September 30, 2024)
| |
Total Net Assets (Millions) | $197.2 |
Total Number of Portfolio Holdings (includes derivative positions, if any) | 89 |
Total Advisory Fees Paid During the Reporting Period | $826,097 |
Portfolio Turnover Rate | 69% |
| MM202912-309770 | PAGE 2 | TSR-AR-ITJQI |
WHAT DID THE FUND INVEST IN? (as of September 30, 2024)
Derivative values, if any, are excluded from the table(s) below.
| |
Largest Holdings
(% of Total Investments) | |
Apple, Inc. | 12.2% |
Microsoft Corp. | 11.7% |
NVIDIA Corp. | 11.4% |
Amazon.com, Inc. | 7.1% |
Meta Platforms, Inc. Class A | 4.8% |
Alphabet, Inc. Class A | 4.0% |
Alphabet, Inc. Class C | 3.4% |
Broadcom, Inc. | 3.2% |
Eli Lilly & Co. | 2.7% |
Visa, Inc. Class A | 2.6% |
| |
Sectors
(% of Total Investments) | |
Information Technology | 47.9% |
Communication Services | 13.6% |
Consumer Discretionary | 13.4% |
Financials | 9.0% |
Health Care | 8.1% |
Industrials | 4.4% |
Consumer Staples | 2.5% |
Energy | 0.0% |
HOW HAS THE FUND CHANGED?
The following is a summary of certain changes to the Fund since October 1, 2023. For more complete information, you may review the Fund’s prospectus, including any applicable supplements, at https://www.massmutual.com/product-performance/mutual-funds or upon request at 1-888-309-3539 or fundinfo@massmutual.com.
Effective February 1, 2024, the annual rate for administrative services for Class A shares of the Fund was reduced from 0.30% to 0.25%.
| |
| WHERE CAN I FIND ADDITIONAL INFORMATION ABOUT THE FUND? |
For additional information about the Fund, including its prospectus, financial information, holdings, and proxy voting information, scan the QR code or visit https://www.massmutual.com/product-performance/mutual-funds. |
| MM202912-309770 | PAGE 3 | TSR-AR-ITJQI |
10000101301133913870171921736223028291882191627149392521000099391147213607160441672719260250402116525741350981000010317117371431218076187462578232824254093245346145
| | |
MassMutual Disciplined Growth Fund | |
| Class R5 | MPGSX |
| Annual Shareholder Report | September 30, 2024 |
This annual shareholder report contains important information about the MassMutual Disciplined Growth Fund (the “Fund”) for the period of October 1, 2023 to September 30, 2024. You can find additional information about the Fund at https://www.massmutual.com/product-performance/mutual-funds. You can also request this information by contacting us at 1-888-309-3539 or by sending an email request to fundinfo@massmutual.com.
This report describes changes to the Fund that occurred during the reporting period.
WHAT WERE THE FUND COSTS FOR THE LAST YEAR?
This example shows the expenses you would have paid over the past year, based on a hypothetical $10,000 investment. This table reflects any applicable waivers or expense limitations.
| | |
Class Name | Costs of a $10,000 investment | Costs paid as a percentage of a $10,000 investment |
| Class R5 | $84 | 0.69% |
HOW DID THE FUND PERFORM?
Global equity markets advanced sharply as they weathered the unsettled geopolitical climate and higher interest rate environment well.
Geopolitical tensions remained high amid continued and escalating conflicts in Ukraine and the Middle East. In the U.S., the Federal Reserve continued its attempts to engineer a ‘soft landing’ and delivered a long-awaited cut in interest rates, with a 50bps cut in September. Domestic stocks advanced over the trailing 12-months as growth outperformed value and large cap shares outperformed their small cap counterparts in the period. U.S. large cap stocks outperformed their foreign counterparts, while shares in emerging markets outperformed developed non-U.S. markets.
Top contributors to the Fund’s performance relative to the Russell 1000® Growth Index:
• Stock selection within the information technology sector where an overweight allocation to NVIDIA Corp. was particularly impactful
• Stock selection within and an overweight allocation to the industrials sector
• Stock selection within the consumer discretionary sector where an overweight allocation to TopBuild Corp. was beneficial
Top detractors to the Fund’s performance relative to the Russell 1000 Growth Index:
• Stock selection within and an overweight allocation to the health care sector
• Stock selection within the consumer staples sector where an overweight allocation to Monster Beverage Corp. was impactful
• An overweight allocation to, and stock selection within, the financials sector
Performance shown is past performance and does not guarantee future results. The graph and table below do not reflect the deduction of taxes that a shareholder would pay on Fund distributions or redemption of Fund shares. The graph and table below assume reinvestment of dividends and capital gain distributions.
GROWTH OF A HYPOTHETICAL $10,000 INVESTMENT (October 1, 2014 through September 30, 2024)
This graph shows the performance of a hypothetical $10,000 investment in the share class noted over a ten-year period or since inception, if shorter, as compared to the performance of a broad-based securities market index, and, if applicable, one or more indexes that MML Investment Advisers, LLC believes more closely reflects the market segments in which the Fund invests or is a better comparison for the Fund’s investment strategy. This graph includes the deduction of the maximum applicable sales charge, if any.
| MM202912-309770 | PAGE 1 | TSR-AR-ITJQ1 |
The index or indexes shown above are unmanaged, cannot be purchased directly, and, with the exception of any peer group index, do not incur expenses.
AVERAGE ANNUAL TOTAL RETURNS (%) (as of September 30, 2024)
| | | |
| | 1 Year | 5 Year | 10 Year |
Class R5 - without sales charge | 44.56 | 17.62 | 14.53 |
S&P 500 Index1 | 36.35 | 15.98 | 13.38 |
Russell 1000 Growth Index | 42.19 | 19.74 | 16.52 |
| 1 | Effective July 24, 2024, the S&P 500 Index replaced the Russell 1000 Growth Index as a broad measure of market performance in accordance with new regulatory disclosure requirements. The Fund continues to use the Russell 1000 Growth Index as a supplemental benchmark that MML Investment Advisers, LLC believes more closely reflects the market segments in which the Fund invests. |
The Fund’s investment objective and investment strategy changed on November 18, 2020. The performance results shown above would not necessarily have been achieved had the Fund’s current investment strategy been in effect for the entire period for which performance results are presented.
Performance results reflect any applicable waivers or expense limitations in effect during these periods, without which performance would have been lower. The investment return and principal value of shares of the Fund fluctuate, so your shares, when sold, may be worth more or less than their original cost. Current performance of the Fund may be lower or higher than the performance quoted. Performance data current to the most recent month-end may be obtained at https://www.massmutual.com/product-performance/mutual-funds or by calling 1-888-309-3539 or by sending an email request to fundinfo@massmutual.com.
WHAT ARE SOME KEY FUND STATISTICS? (as of September 30, 2024)
| |
Total Net Assets (Millions) | $197.2 |
Total Number of Portfolio Holdings (includes derivative positions, if any) | 89 |
Total Advisory Fees Paid During the Reporting Period | $826,097 |
Portfolio Turnover Rate | 69% |
| MM202912-309770 | PAGE 2 | TSR-AR-ITJQ1 |
WHAT DID THE FUND INVEST IN? (as of September 30, 2024)
Derivative values, if any, are excluded from the table(s) below.
| |
Largest Holdings
(% of Total Investments) | |
Apple, Inc. | 12.2% |
Microsoft Corp. | 11.7% |
NVIDIA Corp. | 11.4% |
Amazon.com, Inc. | 7.1% |
Meta Platforms, Inc. Class A | 4.8% |
Alphabet, Inc. Class A | 4.0% |
Alphabet, Inc. Class C | 3.4% |
Broadcom, Inc. | 3.2% |
Eli Lilly & Co. | 2.7% |
Visa, Inc. Class A | 2.6% |
| |
Sectors
(% of Total Investments) | |
Information Technology | 47.9% |
Communication Services | 13.6% |
Consumer Discretionary | 13.4% |
Financials | 9.0% |
Health Care | 8.1% |
Industrials | 4.4% |
Consumer Staples | 2.5% |
Energy | 0.0% |
HOW HAS THE FUND CHANGED?
The following is a summary of certain changes to the Fund since October 1, 2023. For more complete information, you may review the Fund’s prospectus, including any applicable supplements, at https://www.massmutual.com/product-performance/mutual-funds or upon request at 1-888-309-3539 or fundinfo@massmutual.com.
Effective February 1, 2024, the annual rate for administrative services for Class A shares of the Fund was reduced from 0.30% to 0.25%.
| |
| WHERE CAN I FIND ADDITIONAL INFORMATION ABOUT THE FUND? |
For additional information about the Fund, including its prospectus, financial information, holdings, and proxy voting information, scan the QR code or visit https://www.massmutual.com/product-performance/mutual-funds. |
| MM202912-309770 | PAGE 3 | TSR-AR-ITJQ1 |
10000101291131413834171161726122866289752174226873388481000099391147213607160441672719260250402116525741350981000010317117371431218076187462578232824254093245346145
| | |
MassMutual Disciplined Growth Fund | |
| Service Class | DEIGX |
| Annual Shareholder Report | September 30, 2024 |
This annual shareholder report contains important information about the MassMutual Disciplined Growth Fund (the “Fund”) for the period of October 1, 2023 to September 30, 2024. You can find additional information about the Fund at https://www.massmutual.com/product-performance/mutual-funds. You can also request this information by contacting us at 1-888-309-3539 or by sending an email request to fundinfo@massmutual.com.
This report describes changes to the Fund that occurred during the reporting period.
WHAT WERE THE FUND COSTS FOR THE LAST YEAR?
This example shows the expenses you would have paid over the past year, based on a hypothetical $10,000 investment. This table reflects any applicable waivers or expense limitations.
| | |
Class Name | Costs of a $10,000 investment | Costs paid as a percentage of a $10,000 investment |
| Service Class | $97 | 0.79% |
HOW DID THE FUND PERFORM?
Global equity markets advanced sharply as they weathered the unsettled geopolitical climate and higher interest rate environment well.
Geopolitical tensions remained high amid continued and escalating conflicts in Ukraine and the Middle East. In the U.S., the Federal Reserve continued its attempts to engineer a ‘soft landing’ and delivered a long-awaited cut in interest rates, with a 50bps cut in September. Domestic stocks advanced over the trailing 12-months as growth outperformed value and large cap shares outperformed their small cap counterparts in the period. U.S. large cap stocks outperformed their foreign counterparts, while shares in emerging markets outperformed developed non-U.S. markets.
Top contributors to the Fund’s performance relative to the Russell 1000® Growth Index:
• Stock selection within the information technology sector where an overweight allocation to NVIDIA Corp. was particularly impactful
• Stock selection within and an overweight allocation to the industrials sector
• Stock selection within the consumer discretionary sector where an overweight allocation to TopBuild Corp. was beneficial
Top detractors to the Fund’s performance relative to the Russell 1000 Growth Index:
• Stock selection within and an overweight allocation to the health care sector
• Stock selection within the consumer staples sector where an overweight allocation to Monster Beverage Corp. was impactful
• An overweight allocation to, and stock selection within, the financials sector
Performance shown is past performance and does not guarantee future results. The graph and table below do not reflect the deduction of taxes that a shareholder would pay on Fund distributions or redemption of Fund shares. The graph and table below assume reinvestment of dividends and capital gain distributions.
GROWTH OF A HYPOTHETICAL $10,000 INVESTMENT (October 1, 2014 through September 30, 2024)
This graph shows the performance of a hypothetical $10,000 investment in the share class noted over a ten-year period or since inception, if shorter, as compared to the performance of a broad-based securities market index, and, if applicable, one or more indexes that MML Investment Advisers, LLC believes more closely reflects the market segments in which the Fund invests or is a better comparison for the Fund’s investment strategy. This graph includes the deduction of the maximum applicable sales charge, if any.
| MM202912-309770 | PAGE 1 | TSR-AR-ITJQ3 |
The index or indexes shown above are unmanaged, cannot be purchased directly, and, with the exception of any peer group index, do not incur expenses.
AVERAGE ANNUAL TOTAL RETURNS (%) (as of September 30, 2024)
| | | |
| | 1 Year | 5 Year | 10 Year |
Service Class - without sales charge | 44.35 | 17.47 | 14.40 |
S&P 500 Index1 | 36.35 | 15.98 | 13.38 |
Russell 1000 Growth Index | 42.19 | 19.74 | 16.52 |
| 1 | Effective July 24, 2024, the S&P 500 Index replaced the Russell 1000 Growth Index as a broad measure of market performance in accordance with new regulatory disclosure requirements. The Fund continues to use the Russell 1000 Growth Index as a supplemental benchmark that MML Investment Advisers, LLC believes more closely reflects the market segments in which the Fund invests. |
The Fund’s investment objective and investment strategy changed on November 18, 2020. The performance results shown above would not necessarily have been achieved had the Fund’s current investment strategy been in effect for the entire period for which performance results are presented.
Performance results reflect any applicable waivers or expense limitations in effect during these periods, without which performance would have been lower. The investment return and principal value of shares of the Fund fluctuate, so your shares, when sold, may be worth more or less than their original cost. Current performance of the Fund may be lower or higher than the performance quoted. Performance data current to the most recent month-end may be obtained at https://www.massmutual.com/product-performance/mutual-funds or by calling 1-888-309-3539 or by sending an email request to fundinfo@massmutual.com.
WHAT ARE SOME KEY FUND STATISTICS? (as of September 30, 2024)
| |
Total Net Assets (Millions) | $197.2 |
Total Number of Portfolio Holdings (includes derivative positions, if any) | 89 |
Total Advisory Fees Paid During the Reporting Period | $826,097 |
Portfolio Turnover Rate | 69% |
| MM202912-309770 | PAGE 2 | TSR-AR-ITJQ3 |
WHAT DID THE FUND INVEST IN? (as of September 30, 2024)
Derivative values, if any, are excluded from the table(s) below.
| |
Largest Holdings
(% of Total Investments) | |
Apple, Inc. | 12.2% |
Microsoft Corp. | 11.7% |
NVIDIA Corp. | 11.4% |
Amazon.com, Inc. | 7.1% |
Meta Platforms, Inc. Class A | 4.8% |
Alphabet, Inc. Class A | 4.0% |
Alphabet, Inc. Class C | 3.4% |
Broadcom, Inc. | 3.2% |
Eli Lilly & Co. | 2.7% |
Visa, Inc. Class A | 2.6% |
| |
Sectors
(% of Total Investments) | |
Information Technology | 47.9% |
Communication Services | 13.6% |
Consumer Discretionary | 13.4% |
Financials | 9.0% |
Health Care | 8.1% |
Industrials | 4.4% |
Consumer Staples | 2.5% |
Energy | 0.0% |
HOW HAS THE FUND CHANGED?
The following is a summary of certain changes to the Fund since October 1, 2023. For more complete information, you may review the Fund’s prospectus, including any applicable supplements, at https://www.massmutual.com/product-performance/mutual-funds or upon request at 1-888-309-3539 or fundinfo@massmutual.com.
Effective February 1, 2024, the annual rate for administrative services for Class A shares of the Fund was reduced from 0.30% to 0.25%.
| |
| WHERE CAN I FIND ADDITIONAL INFORMATION ABOUT THE FUND? |
For additional information about the Fund, including its prospectus, financial information, holdings, and proxy voting information, scan the QR code or visit https://www.massmutual.com/product-performance/mutual-funds. |
| MM202912-309770 | PAGE 3 | TSR-AR-ITJQ3 |
10000101191129113792170391717322725287542155326606384061000099391147213607160441672719260250402116525741350981000010317117371431218076187462578232824254093245346145
| | |
MassMutual Disciplined Growth Fund | |
| Administrative Class | MPGLX |
| Annual Shareholder Report | September 30, 2024 |
This annual shareholder report contains important information about the MassMutual Disciplined Growth Fund (the “Fund”) for the period of October 1, 2023 to September 30, 2024. You can find additional information about the Fund at https://www.massmutual.com/product-performance/mutual-funds. You can also request this information by contacting us at 1-888-309-3539 or by sending an email request to fundinfo@massmutual.com.
This report describes changes to the Fund that occurred during the reporting period.
WHAT WERE THE FUND COSTS FOR THE LAST YEAR?
This example shows the expenses you would have paid over the past year, based on a hypothetical $10,000 investment. This table reflects any applicable waivers or expense limitations.
| | |
Class Name | Costs of a $10,000 investment | Costs paid as a percentage of a $10,000 investment |
| Administrative Class | $109 | 0.89% |
HOW DID THE FUND PERFORM?
Global equity markets advanced sharply as they weathered the unsettled geopolitical climate and higher interest rate environment well.
Geopolitical tensions remained high amid continued and escalating conflicts in Ukraine and the Middle East. In the U.S., the Federal Reserve continued its attempts to engineer a ‘soft landing’ and delivered a long-awaited cut in interest rates, with a 50bps cut in September. Domestic stocks advanced over the trailing 12-months as growth outperformed value and large cap shares outperformed their small cap counterparts in the period. U.S. large cap stocks outperformed their foreign counterparts, while shares in emerging markets outperformed developed non-U.S. markets.
Top contributors to the Fund’s performance relative to the Russell 1000® Growth Index:
• Stock selection within the information technology sector where an overweight allocation to NVIDIA Corp. was particularly impactful
• Stock selection within and an overweight allocation to the industrials sector
• Stock selection within the consumer discretionary sector where an overweight allocation to TopBuild Corp. was beneficial
Top detractors to the Fund’s performance relative to the Russell 1000 Growth Index:
• Stock selection within and an overweight allocation to the health care sector
• Stock selection within the consumer staples sector where an overweight allocation to Monster Beverage Corp. was impactful
• An overweight allocation to, and stock selection within, the financials sector
Performance shown is past performance and does not guarantee future results. The graph and table below do not reflect the deduction of taxes that a shareholder would pay on Fund distributions or redemption of Fund shares. The graph and table below assume reinvestment of dividends and capital gain distributions.
GROWTH OF A HYPOTHETICAL $10,000 INVESTMENT (October 1, 2014 through September 30, 2024)
This graph shows the performance of a hypothetical $10,000 investment in the share class noted over a ten-year period or since inception, if shorter, as compared to the performance of a broad-based securities market index, and, if applicable, one or more indexes that MML Investment Advisers, LLC believes more closely reflects the market segments in which the Fund invests or is a better comparison for the Fund’s investment strategy. This graph includes the deduction of the maximum applicable sales charge, if any.
| MM202912-309770 | PAGE 1 | TSR-AR-ITJQ4 |
The index or indexes shown above are unmanaged, cannot be purchased directly, and, with the exception of any peer group index, do not incur expenses.
AVERAGE ANNUAL TOTAL RETURNS (%) (as of September 30, 2024)
| | | |
| | 1 Year | 5 Year | 10 Year |
Administrative Class - without sales charge | 44.20 | 17.38 | 14.31 |
S&P 500 Index1 | 36.35 | 15.98 | 13.38 |
Russell 1000 Growth Index | 42.19 | 19.74 | 16.52 |
| 1 | Effective July 24, 2024, the S&P 500 Index replaced the Russell 1000 Growth Index as a broad measure of market performance in accordance with new regulatory disclosure requirements. The Fund continues to use the Russell 1000 Growth Index as a supplemental benchmark that MML Investment Advisers, LLC believes more closely reflects the market segments in which the Fund invests. |
The Fund’s investment objective and investment strategy changed on November 18, 2020. The performance results shown above would not necessarily have been achieved had the Fund’s current investment strategy been in effect for the entire period for which performance results are presented.
Performance results reflect any applicable waivers or expense limitations in effect during these periods, without which performance would have been lower. The investment return and principal value of shares of the Fund fluctuate, so your shares, when sold, may be worth more or less than their original cost. Current performance of the Fund may be lower or higher than the performance quoted. Performance data current to the most recent month-end may be obtained at https://www.massmutual.com/product-performance/mutual-funds or by calling 1-888-309-3539 or by sending an email request to fundinfo@massmutual.com.
WHAT ARE SOME KEY FUND STATISTICS? (as of September 30, 2024)
| |
Total Net Assets (Millions) | $197.2 |
Total Number of Portfolio Holdings (includes derivative positions, if any) | 89 |
Total Advisory Fees Paid During the Reporting Period | $826,097 |
Portfolio Turnover Rate | 69% |
| MM202912-309770 | PAGE 2 | TSR-AR-ITJQ4 |
WHAT DID THE FUND INVEST IN? (as of September 30, 2024)
Derivative values, if any, are excluded from the table(s) below.
| |
Largest Holdings
(% of Total Investments) | |
Apple, Inc. | 12.2% |
Microsoft Corp. | 11.7% |
NVIDIA Corp. | 11.4% |
Amazon.com, Inc. | 7.1% |
Meta Platforms, Inc. Class A | 4.8% |
Alphabet, Inc. Class A | 4.0% |
Alphabet, Inc. Class C | 3.4% |
Broadcom, Inc. | 3.2% |
Eli Lilly & Co. | 2.7% |
Visa, Inc. Class A | 2.6% |
| |
Sectors
(% of Total Investments) | |
Information Technology | 47.9% |
Communication Services | 13.6% |
Consumer Discretionary | 13.4% |
Financials | 9.0% |
Health Care | 8.1% |
Industrials | 4.4% |
Consumer Staples | 2.5% |
Energy | 0.0% |
HOW HAS THE FUND CHANGED?
The following is a summary of certain changes to the Fund since October 1, 2023. For more complete information, you may review the Fund’s prospectus, including any applicable supplements, at https://www.massmutual.com/product-performance/mutual-funds or upon request at 1-888-309-3539 or fundinfo@massmutual.com.
Effective February 1, 2024, the annual rate for administrative services for Class A shares of the Fund was reduced from 0.30% to 0.25%.
| |
| WHERE CAN I FIND ADDITIONAL INFORMATION ABOUT THE FUND? |
For additional information about the Fund, including its prospectus, financial information, holdings, and proxy voting information, scan the QR code or visit https://www.massmutual.com/product-performance/mutual-funds. |
| MM202912-309770 | PAGE 3 | TSR-AR-ITJQ4 |
10000101081127813754169871710022604285852140126418380961000099391147213607160441672719260250402116525741350981000010317117371431218076187462578232824254093245346145
| | |
MassMutual Disciplined Growth Fund | |
| Class R4 | MPDGX |
| Annual Shareholder Report | September 30, 2024 |
This annual shareholder report contains important information about the MassMutual Disciplined Growth Fund (the “Fund”) for the period of October 1, 2023 to September 30, 2024. You can find additional information about the Fund at https://www.massmutual.com/product-performance/mutual-funds. You can also request this information by contacting us at 1-888-309-3539 or by sending an email request to fundinfo@massmutual.com.
This report describes changes to the Fund that occurred during the reporting period.
WHAT WERE THE FUND COSTS FOR THE LAST YEAR?
This example shows the expenses you would have paid over the past year, based on a hypothetical $10,000 investment. This table reflects any applicable waivers or expense limitations.
| | |
Class Name | Costs of a $10,000 investment | Costs paid as a percentage of a $10,000 investment |
| Class R4 | $127 | 1.04% |
HOW DID THE FUND PERFORM?
Global equity markets advanced sharply as they weathered the unsettled geopolitical climate and higher interest rate environment well.
Geopolitical tensions remained high amid continued and escalating conflicts in Ukraine and the Middle East. In the U.S., the Federal Reserve continued its attempts to engineer a ‘soft landing’ and delivered a long-awaited cut in interest rates, with a 50bps cut in September. Domestic stocks advanced over the trailing 12-months as growth outperformed value and large cap shares outperformed their small cap counterparts in the period. U.S. large cap stocks outperformed their foreign counterparts, while shares in emerging markets outperformed developed non-U.S. markets.
Top contributors to the Fund’s performance relative to the Russell 1000® Growth Index:
• Stock selection within the information technology sector where an overweight allocation to NVIDIA Corp. was particularly impactful
• Stock selection within and an overweight allocation to the industrials sector
• Stock selection within the consumer discretionary sector where an overweight allocation to TopBuild Corp. was beneficial
Top detractors to the Fund’s performance relative to the Russell 1000 Growth Index:
• Stock selection within and an overweight allocation to the health care sector
• Stock selection within the consumer staples sector where an overweight allocation to Monster Beverage Corp. was impactful
• An overweight allocation to, and stock selection within, the financials sector
Performance shown is past performance and does not guarantee future results. The graph and table below do not reflect the deduction of taxes that a shareholder would pay on Fund distributions or redemption of Fund shares. The graph and table below assume reinvestment of dividends and capital gain distributions.
GROWTH OF A HYPOTHETICAL $10,000 INVESTMENT (October 1, 2014 through September 30, 2024)
This graph shows the performance of a hypothetical $10,000 investment in the share class noted over a ten-year period or since inception, if shorter, as compared to the performance of a broad-based securities market index, and, if applicable, one or more indexes that MML Investment Advisers, LLC believes more closely reflects the market segments in which the Fund invests or is a better comparison for the Fund’s investment strategy. This graph includes the deduction of the maximum applicable sales charge, if any.
| MM202912-309770 | PAGE 1 | TSR-AR-ITJQK |
The index or indexes shown above are unmanaged, cannot be purchased directly, and, with the exception of any peer group index, do not incur expenses.
AVERAGE ANNUAL TOTAL RETURNS (%) (as of September 30, 2024)
| | | |
| | 1 Year | 5 Year | 10 Year |
Class R4 - without sales charge | 43.94 | 17.18 | 14.13 |
S&P 500 Index1 | 36.35 | 15.98 | 13.38 |
Russell 1000 Growth Index | 42.19 | 19.74 | 16.52 |
| 1 | Effective July 24, 2024, the S&P 500 Index replaced the Russell 1000 Growth Index as a broad measure of market performance in accordance with new regulatory disclosure requirements. The Fund continues to use the Russell 1000 Growth Index as a supplemental benchmark that MML Investment Advisers, LLC believes more closely reflects the market segments in which the Fund invests. |
The Fund’s investment objective and investment strategy changed on November 18, 2020. The performance results shown above would not necessarily have been achieved had the Fund’s current investment strategy been in effect for the entire period for which performance results are presented.
Performance results reflect any applicable waivers or expense limitations in effect during these periods, without which performance would have been lower. The investment return and principal value of shares of the Fund fluctuate, so your shares, when sold, may be worth more or less than their original cost. Current performance of the Fund may be lower or higher than the performance quoted. Performance data current to the most recent month-end may be obtained at https://www.massmutual.com/product-performance/mutual-funds or by calling 1-888-309-3539 or by sending an email request to fundinfo@massmutual.com.
WHAT ARE SOME KEY FUND STATISTICS? (as of September 30, 2024)
| |
Total Net Assets (Millions) | $197.2 |
Total Number of Portfolio Holdings (includes derivative positions, if any) | 89 |
Total Advisory Fees Paid During the Reporting Period | $826,097 |
Portfolio Turnover Rate | 69% |
| MM202912-309770 | PAGE 2 | TSR-AR-ITJQK |
WHAT DID THE FUND INVEST IN? (as of September 30, 2024)
Derivative values, if any, are excluded from the table(s) below.
| |
Largest Holdings
(% of Total Investments) | |
Apple, Inc. | 12.2% |
Microsoft Corp. | 11.7% |
NVIDIA Corp. | 11.4% |
Amazon.com, Inc. | 7.1% |
Meta Platforms, Inc. Class A | 4.8% |
Alphabet, Inc. Class A | 4.0% |
Alphabet, Inc. Class C | 3.4% |
Broadcom, Inc. | 3.2% |
Eli Lilly & Co. | 2.7% |
Visa, Inc. Class A | 2.6% |
| |
Sectors
(% of Total Investments) | |
Information Technology | 47.9% |
Communication Services | 13.6% |
Consumer Discretionary | 13.4% |
Financials | 9.0% |
Health Care | 8.1% |
Industrials | 4.4% |
Consumer Staples | 2.5% |
Energy | 0.0% |
HOW HAS THE FUND CHANGED?
The following is a summary of certain changes to the Fund since October 1, 2023. For more complete information, you may review the Fund’s prospectus, including any applicable supplements, at https://www.massmutual.com/product-performance/mutual-funds or upon request at 1-888-309-3539 or fundinfo@massmutual.com.
Effective February 1, 2024, the annual rate for administrative services for Class A shares of the Fund was reduced from 0.30% to 0.25%.
| |
| WHERE CAN I FIND ADDITIONAL INFORMATION ABOUT THE FUND? |
For additional information about the Fund, including its prospectus, financial information, holdings, and proxy voting information, scan the QR code or visit https://www.massmutual.com/product-performance/mutual-funds. |
| MM202912-309770 | PAGE 3 | TSR-AR-ITJQK |
10000100941124313694168791697822406282772114226059375101000099391147213607160441672719260250402116525741350981000010317117371431218076187462578232824254093245346145
| | |
MassMutual Disciplined Growth Fund | |
| Class A | MPGAX |
| Annual Shareholder Report | September 30, 2024 |
This annual shareholder report contains important information about the MassMutual Disciplined Growth Fund (the “Fund”) for the period of October 1, 2023 to September 30, 2024. You can find additional information about the Fund at https://www.massmutual.com/product-performance/mutual-funds. You can also request this information by contacting us at 1-888-309-3539 or by sending an email request to fundinfo@massmutual.com.
This report describes changes to the Fund that occurred during the reporting period.
WHAT WERE THE FUND COSTS FOR THE LAST YEAR?
This example shows the expenses you would have paid over the past year, based on a hypothetical $10,000 investment. This table reflects any applicable waivers or expense limitations.
| | |
Class Name | Costs of a $10,000 investment | Costs paid as a percentage of a $10,000 investment |
| Class A | $135 | 1.11% |
HOW DID THE FUND PERFORM?
Global equity markets advanced sharply as they weathered the unsettled geopolitical climate and higher interest rate environment well.
Geopolitical tensions remained high amid continued and escalating conflicts in Ukraine and the Middle East. In the U.S., the Federal Reserve continued its attempts to engineer a ‘soft landing’ and delivered a long-awaited cut in interest rates, with a 50bps cut in September. Domestic stocks advanced over the trailing 12-months as growth outperformed value and large cap shares outperformed their small cap counterparts in the period. U.S. large cap stocks outperformed their foreign counterparts, while shares in emerging markets outperformed developed non-U.S. markets.
Top contributors to the Fund’s performance relative to the Russell 1000® Growth Index:
• Stock selection within the information technology sector where an overweight allocation to NVIDIA Corp. was particularly impactful
• Stock selection within and an overweight allocation to the industrials sector
• Stock selection within the consumer discretionary sector where an overweight allocation to TopBuild Corp. was beneficial
Top detractors to the Fund’s performance relative to the Russell 1000 Growth Index:
• Stock selection within and an overweight allocation to the health care sector
• Stock selection within the consumer staples sector where an overweight allocation to Monster Beverage Corp. was impactful
• An overweight allocation to, and stock selection within, the financials sector
Performance shown is past performance and does not guarantee future results. The graph and table below do not reflect the deduction of taxes that a shareholder would pay on Fund distributions or redemption of Fund shares. The graph and table below assume reinvestment of dividends and capital gain distributions.
GROWTH OF A HYPOTHETICAL $10,000 INVESTMENT (October 1, 2014 through September 30, 2024)
This graph shows the performance of a hypothetical $10,000 investment in the share class noted over a ten-year period or since inception, if shorter, as compared to the performance of a broad-based securities market index, and, if applicable, one or more indexes that MML Investment Advisers, LLC believes more closely reflects the market segments in which the Fund invests or is a better comparison for the Fund’s investment strategy. This graph includes the deduction of the maximum applicable sales charge, if any.
| MM202912-309770 | PAGE 1 | TSR-AR-ITJQ2 |
The index or indexes shown above are unmanaged, cannot be purchased directly, and, with the exception of any peer group index, do not incur expenses.
AVERAGE ANNUAL TOTAL RETURNS (%) (as of September 30, 2024)
| | | |
| | 1 Year | 5 Year | 10 Year |
Class A - without sales charge | 43.98 | 17.09 | 14.02 |
Class A - with maximum sales charge | 36.06 | 15.77 | 13.38 |
S&P 500 Index1 | 36.35 | 15.98 | 13.38 |
Russell 1000 Growth Index | 42.19 | 19.74 | 16.52 |
| 1 | Effective July 24, 2024, the S&P 500 Index replaced the Russell 1000 Growth Index as a broad measure of market performance in accordance with new regulatory disclosure requirements. The Fund continues to use the Russell 1000 Growth Index as a supplemental benchmark that MML Investment Advisers, LLC believes more closely reflects the market segments in which the Fund invests. |
The Fund’s investment objective and investment strategy changed on November 18, 2020. The performance results shown above would not necessarily have been achieved had the Fund’s current investment strategy been in effect for the entire period for which performance results are presented.
Performance results reflect any applicable waivers or expense limitations in effect during these periods, without which performance would have been lower. The investment return and principal value of shares of the Fund fluctuate, so your shares, when sold, may be worth more or less than their original cost. Current performance of the Fund may be lower or higher than the performance quoted. Performance data current to the most recent month-end may be obtained at https://www.massmutual.com/product-performance/mutual-funds or by calling 1-888-309-3539 or by sending an email request to fundinfo@massmutual.com.
WHAT ARE SOME KEY FUND STATISTICS? (as of September 30, 2024)
| |
Total Net Assets (Millions) | $197.2 |
Total Number of Portfolio Holdings (includes derivative positions, if any) | 89 |
Total Advisory Fees Paid During the Reporting Period | $826,097 |
Portfolio Turnover Rate | 69% |
| MM202912-309770 | PAGE 2 | TSR-AR-ITJQ2 |
WHAT DID THE FUND INVEST IN? (as of September 30, 2024)
Derivative values, if any, are excluded from the table(s) below.
| |
Largest Holdings
(% of Total Investments) | |
Apple, Inc. | 12.2% |
Microsoft Corp. | 11.7% |
NVIDIA Corp. | 11.4% |
Amazon.com, Inc. | 7.1% |
Meta Platforms, Inc. Class A | 4.8% |
Alphabet, Inc. Class A | 4.0% |
Alphabet, Inc. Class C | 3.4% |
Broadcom, Inc. | 3.2% |
Eli Lilly & Co. | 2.7% |
Visa, Inc. Class A | 2.6% |
| |
Sectors
(% of Total Investments) | |
Information Technology | 47.9% |
Communication Services | 13.6% |
Consumer Discretionary | 13.4% |
Financials | 9.0% |
Health Care | 8.1% |
Industrials | 4.4% |
Consumer Staples | 2.5% |
Energy | 0.0% |
HOW HAS THE FUND CHANGED?
The following is a summary of certain changes to the Fund since October 1, 2023. For more complete information, you may review the Fund’s prospectus, including any applicable supplements, at https://www.massmutual.com/product-performance/mutual-funds or upon request at 1-888-309-3539 or fundinfo@massmutual.com.
Effective February 1, 2024, the annual rate for administrative services for Class A shares of the Fund was reduced from 0.30% to 0.25%.
| |
| WHERE CAN I FIND ADDITIONAL INFORMATION ABOUT THE FUND? |
For additional information about the Fund, including its prospectus, financial information, holdings, and proxy voting information, scan the QR code or visit https://www.massmutual.com/product-performance/mutual-funds. |
| MM202912-309770 | PAGE 3 | TSR-AR-ITJQ2 |
945095241059312894158881595521041265361982524386351101000099391147213607160441672719260250402116525741350981000010317117371431218076187462578232824254093245346145
| | |
MassMutual Disciplined Growth Fund | |
| Class R3 | MPDRX |
| Annual Shareholder Report | September 30, 2024 |
This annual shareholder report contains important information about the MassMutual Disciplined Growth Fund (the “Fund”) for the period of October 1, 2023 to September 30, 2024. You can find additional information about the Fund at https://www.massmutual.com/product-performance/mutual-funds. You can also request this information by contacting us at 1-888-309-3539 or by sending an email request to fundinfo@massmutual.com.
This report describes changes to the Fund that occurred during the reporting period.
WHAT WERE THE FUND COSTS FOR THE LAST YEAR?
This example shows the expenses you would have paid over the past year, based on a hypothetical $10,000 investment. This table reflects any applicable waivers or expense limitations.
| | |
Class Name | Costs of a $10,000 investment | Costs paid as a percentage of a $10,000 investment |
| Class R3 | $157 | 1.29% |
HOW DID THE FUND PERFORM?
Global equity markets advanced sharply as they weathered the unsettled geopolitical climate and higher interest rate environment well.
Geopolitical tensions remained high amid continued and escalating conflicts in Ukraine and the Middle East. In the U.S., the Federal Reserve continued its attempts to engineer a ‘soft landing’ and delivered a long-awaited cut in interest rates, with a 50bps cut in September. Domestic stocks advanced over the trailing 12-months as growth outperformed value and large cap shares outperformed their small cap counterparts in the period. U.S. large cap stocks outperformed their foreign counterparts, while shares in emerging markets outperformed developed non-U.S. markets.
Top contributors to the Fund’s performance relative to the Russell 1000® Growth Index:
• Stock selection within the information technology sector where an overweight allocation to NVIDIA Corp. was particularly impactful
• Stock selection within and an overweight allocation to the industrials sector
• Stock selection within the consumer discretionary sector where an overweight allocation to TopBuild Corp. was beneficial
Top detractors to the Fund’s performance relative to the Russell 1000 Growth Index:
• Stock selection within and an overweight allocation to the health care sector
• Stock selection within the consumer staples sector where an overweight allocation to Monster Beverage Corp. was impactful
• An overweight allocation to, and stock selection within, the financials sector
Performance shown is past performance and does not guarantee future results. The graph and table below do not reflect the deduction of taxes that a shareholder would pay on Fund distributions or redemption of Fund shares. The graph and table below assume reinvestment of dividends and capital gain distributions.
GROWTH OF A HYPOTHETICAL $10,000 INVESTMENT (October 1, 2014 through September 30, 2024)
This graph shows the performance of a hypothetical $10,000 investment in the share class noted over a ten-year period or since inception, if shorter, as compared to the performance of a broad-based securities market index, and, if applicable, one or more indexes that MML Investment Advisers, LLC believes more closely reflects the market segments in which the Fund invests or is a better comparison for the Fund’s investment strategy. This graph includes the deduction of the maximum applicable sales charge, if any.
| MM202912-309770 | PAGE 1 | TSR-AR-ITJQJ |
The index or indexes shown above are unmanaged, cannot be purchased directly, and, with the exception of any peer group index, do not incur expenses.
AVERAGE ANNUAL TOTAL RETURNS (%) (as of September 30, 2024)
| | | |
| | 1 Year | 5 Year | 10 Year |
Class R3 - without sales charge | 43.49 | 16.90 | 13.84 |
S&P 500 Index1 | 36.35 | 15.98 | 13.38 |
Russell 1000 Growth Index | 42.19 | 19.74 | 16.52 |
| 1 | Effective July 24, 2024, the S&P 500 Index replaced the Russell 1000 Growth Index as a broad measure of market performance in accordance with new regulatory disclosure requirements. The Fund continues to use the Russell 1000 Growth Index as a supplemental benchmark that MML Investment Advisers, LLC believes more closely reflects the market segments in which the Fund invests. |
The Fund’s investment objective and investment strategy changed on November 18, 2020. The performance results shown above would not necessarily have been achieved had the Fund’s current investment strategy been in effect for the entire period for which performance results are presented.
Performance results reflect any applicable waivers or expense limitations in effect during these periods, without which performance would have been lower. The investment return and principal value of shares of the Fund fluctuate, so your shares, when sold, may be worth more or less than their original cost. Current performance of the Fund may be lower or higher than the performance quoted. Performance data current to the most recent month-end may be obtained at https://www.massmutual.com/product-performance/mutual-funds or by calling 1-888-309-3539 or by sending an email request to fundinfo@massmutual.com.
WHAT ARE SOME KEY FUND STATISTICS? (as of September 30, 2024)
| |
Total Net Assets (Millions) | $197.2 |
Total Number of Portfolio Holdings (includes derivative positions, if any) | 89 |
Total Advisory Fees Paid During the Reporting Period | $826,097 |
Portfolio Turnover Rate | 69% |
| MM202912-309770 | PAGE 2 | TSR-AR-ITJQJ |
WHAT DID THE FUND INVEST IN? (as of September 30, 2024)
Derivative values, if any, are excluded from the table(s) below.
| |
Largest Holdings
(% of Total Investments) | |
Apple, Inc. | 12.2% |
Microsoft Corp. | 11.7% |
NVIDIA Corp. | 11.4% |
Amazon.com, Inc. | 7.1% |
Meta Platforms, Inc. Class A | 4.8% |
Alphabet, Inc. Class A | 4.0% |
Alphabet, Inc. Class C | 3.4% |
Broadcom, Inc. | 3.2% |
Eli Lilly & Co. | 2.7% |
Visa, Inc. Class A | 2.6% |
| |
Sectors
(% of Total Investments) | |
Information Technology | 47.9% |
Communication Services | 13.6% |
Consumer Discretionary | 13.4% |
Financials | 9.0% |
Health Care | 8.1% |
Industrials | 4.4% |
Consumer Staples | 2.5% |
Energy | 0.0% |
HOW HAS THE FUND CHANGED?
The following is a summary of certain changes to the Fund since October 1, 2023. For more complete information, you may review the Fund’s prospectus, including any applicable supplements, at https://www.massmutual.com/product-performance/mutual-funds or upon request at 1-888-309-3539 or fundinfo@massmutual.com.
Effective February 1, 2024, the annual rate for administrative services for Class A shares of the Fund was reduced from 0.30% to 0.25%.
| |
| WHERE CAN I FIND ADDITIONAL INFORMATION ABOUT THE FUND? |
For additional information about the Fund, including its prospectus, financial information, holdings, and proxy voting information, scan the QR code or visit https://www.massmutual.com/product-performance/mutual-funds. |
| MM202912-309770 | PAGE 3 | TSR-AR-ITJQJ |
10000100661117413578167031674222062277732070125474365521000099391147213607160441672719260250402116525741350981000010317117371431218076187462578232824254093245346145
| | |
MassMutual Disciplined Growth Fund | |
| Class Y | MMNYX |
| Annual Shareholder Report | September 30, 2024 |
This annual shareholder report contains important information about the MassMutual Disciplined Growth Fund (the “Fund”) for the period of October 1, 2023 to September 30, 2024. You can find additional information about the Fund at https://www.massmutual.com/product-performance/mutual-funds. You can also request this information by contacting us at 1-888-309-3539 or by sending an email request to fundinfo@massmutual.com.
This report describes changes to the Fund that occurred during the reporting period.
WHAT WERE THE FUND COSTS FOR THE LAST YEAR?
This example shows the expenses you would have paid over the past year, based on a hypothetical $10,000 investment. This table reflects any applicable waivers or expense limitations.
| | |
Class Name | Costs of a $10,000 investment | Costs paid as a percentage of a $10,000 investment |
| Class Y | $84 | 0.69% |
HOW DID THE FUND PERFORM?
Global equity markets advanced sharply as they weathered the unsettled geopolitical climate and higher interest rate environment well.
Geopolitical tensions remained high amid continued and escalating conflicts in Ukraine and the Middle East. In the U.S., the Federal Reserve continued its attempts to engineer a ‘soft landing’ and delivered a long-awaited cut in interest rates, with a 50bps cut in September. Domestic stocks advanced over the trailing 12-months as growth outperformed value and large cap shares outperformed their small cap counterparts in the period. U.S. large cap stocks outperformed their foreign counterparts, while shares in emerging markets outperformed developed non-U.S. markets.
Top contributors to the Fund’s performance relative to the Russell 1000® Growth Index:
• Stock selection within the information technology sector where an overweight allocation to NVIDIA Corp. was particularly impactful
• Stock selection within and an overweight allocation to the industrials sector
• Stock selection within the consumer discretionary sector where an overweight allocation to TopBuild Corp. was beneficial
Top detractors to the Fund’s performance relative to the Russell 1000 Growth Index:
• Stock selection within and an overweight allocation to the health care sector
• Stock selection within the consumer staples sector where an overweight allocation to Monster Beverage Corp. was impactful
• An overweight allocation to, and stock selection within, the financials sector
Performance shown is past performance and does not guarantee future results. The graph and table below do not reflect the deduction of taxes that a shareholder would pay on Fund distributions or redemption of Fund shares. The graph and table below assume reinvestment of dividends and capital gain distributions.
GROWTH OF A HYPOTHETICAL $10,000 INVESTMENT (February 1, 2023 through September 30, 2024)
This graph shows the performance of a hypothetical $10,000 investment in the share class noted over a ten-year period or since inception, if shorter, as compared to the performance of a broad-based securities market index, and, if applicable, one or more indexes that MML Investment Advisers, LLC believes more closely reflects the market segments in which the Fund invests or is a better comparison for the Fund’s investment strategy. This graph includes the deduction of the maximum applicable sales charge, if any.
| MM202912-309770 | PAGE 1 | TSR-AR-ITJQY |
The index or indexes shown above are unmanaged, cannot be purchased directly, and, with the exception of any peer group index, do not incur expenses.
AVERAGE ANNUAL TOTAL RETURNS (%) (as of September 30, 2024)
| | |
| | 1 Year | Since Inception
(02/01/2023) |
Class Y - without sales charge | 44.55 | 33.51 |
S&P 500 Index1 | 36.35 | 25.04 |
Russell 1000 Growth Index | 42.19 | 34.62 |
| 1 | Effective July 24, 2024, the S&P 500 Index replaced the Russell 1000 Growth Index as a broad measure of market performance in accordance with new regulatory disclosure requirements. The Fund continues to use the Russell 1000 Growth Index as a supplemental benchmark that MML Investment Advisers, LLC believes more closely reflects the market segments in which the Fund invests. |
Performance results reflect any applicable waivers or expense limitations in effect during these periods, without which performance would have been lower. The investment return and principal value of shares of the Fund fluctuate, so your shares, when sold, may be worth more or less than their original cost. Current performance of the Fund may be lower or higher than the performance quoted. Performance data current to the most recent month-end may be obtained at https://www.massmutual.com/product-performance/mutual-funds or by calling 1-888-309-3539 or by sending an email request to fundinfo@massmutual.com.
WHAT ARE SOME KEY FUND STATISTICS? (as of September 30, 2024)
| |
Total Net Assets (Millions) | $197.2 |
Total Number of Portfolio Holdings (includes derivative positions, if any) | 89 |
Total Advisory Fees Paid During the Reporting Period | $826,097 |
Portfolio Turnover Rate | 69% |
WHAT DID THE FUND INVEST IN? (as of September 30, 2024)
Derivative values, if any, are excluded from the table(s) below.
| |
Largest Holdings
(% of Total Investments) | |
Apple, Inc. | 12.2% |
Microsoft Corp. | 11.7% |
NVIDIA Corp. | 11.4% |
Amazon.com, Inc. | 7.1% |
Meta Platforms, Inc. Class A | 4.8% |
Alphabet, Inc. Class A | 4.0% |
Alphabet, Inc. Class C | 3.4% |
Broadcom, Inc. | 3.2% |
Eli Lilly & Co. | 2.7% |
Visa, Inc. Class A | 2.6% |
| |
Sectors
(% of Total Investments) | |
Information Technology | 47.9% |
Communication Services | 13.6% |
Consumer Discretionary | 13.4% |
Financials | 9.0% |
Health Care | 8.1% |
Industrials | 4.4% |
Consumer Staples | 2.5% |
Energy | 0.0% |
| MM202912-309770 | PAGE 2 | TSR-AR-ITJQY |
HOW HAS THE FUND CHANGED?
The following is a summary of certain changes to the Fund since October 1, 2023. For more complete information, you may review the Fund’s prospectus, including any applicable supplements, at https://www.massmutual.com/product-performance/mutual-funds or upon request at 1-888-309-3539 or fundinfo@massmutual.com.
Effective February 1, 2024, the annual rate for administrative services for Class A shares of the Fund was reduced from 0.30% to 0.25%.
| |
| WHERE CAN I FIND ADDITIONAL INFORMATION ABOUT THE FUND? |
For additional information about the Fund, including its prospectus, financial information, holdings, and proxy voting information, scan the QR code or visit https://www.massmutual.com/product-performance/mutual-funds. |
| MM202912-309770 | PAGE 3 | TSR-AR-ITJQY |
100001117916158100001052814355100001134116126
| | |
MassMutual Small Cap Opportunities Fund | |
| Class I | MSOOX |
| Annual Shareholder Report | September 30, 2024 |
This annual shareholder report contains important information about the MassMutual Small Cap Opportunities Fund (the “Fund”) for the period of October 1, 2023 to September 30, 2024. You can find additional information about the Fund at https://www.massmutual.com/product-performance/mutual-funds. You can also request this information by contacting us at 1-888-309-3539 or by sending an email request to fundinfo@massmutual.com.
This report describes changes to the Fund that occurred during the reporting period.
WHAT WERE THE FUND COSTS FOR THE LAST YEAR?
This example shows the expenses you would have paid over the past year, based on a hypothetical $10,000 investment. This table reflects any applicable waivers or expense limitations.
| | |
Class Name | Costs of a $10,000 investment | Costs paid as a percentage of a $10,000 investment |
| Class I | $74 | 0.65% |
HOW DID THE FUND PERFORM?
Global equity markets advanced sharply as they weathered the unsettled geopolitical climate and higher interest rate environment well.
Geopolitical tensions remained high amid continued and escalating conflicts in Ukraine and the Middle East. In the U.S., the Federal Reserve continued its attempts to engineer a ‘soft landing’ and delivered a long-awaited cut in interest rates, with a 50bps cut in September. Domestic stocks advanced over the trailing 12-months as growth outperformed value and large cap shares outperformed their small cap counterparts in the period. U.S. large cap stocks outperformed their foreign counterparts, while shares in emerging markets outperformed developed non-U.S. markets.
Top contributors to the Fund’s performance relative to the Russell 2000® Index:
• Stock selection overall and led in particular by the healthcare sector
• Sector allocation in total and led in particular by underweight to the energy sector
Top detractors to the Fund’s performance relative to the Russell 2000 Index:
• Technology sector stock selection and in particular no weight in Super Micro Computer, Inc.
• Industrials sector stock selection and in particular an active weight in Atkore Inc.
Performance shown is past performance and does not guarantee future results. The graph and table below do not reflect the deduction of taxes that a shareholder would pay on Fund distributions or redemption of Fund shares. The graph and table below assume reinvestment of dividends and capital gain distributions.
GROWTH OF A HYPOTHETICAL $10,000 INVESTMENT (October 1, 2014 through September 30, 2024)
This graph shows the performance of a hypothetical $10,000 investment in the share class noted over a ten-year period or since inception, if shorter, as compared to the performance of a broad-based securities market index, and, if applicable, one or more indexes that MML Investment Advisers, LLC believes more closely reflects the market segments in which the Fund invests or is a better comparison for the Fund’s investment strategy. This graph includes the deduction of the maximum applicable sales charge, if any.
| MM202912-309770 | PAGE 1 | TSR-AR-ITGEI |
The index or indexes shown above are unmanaged, cannot be purchased directly, and, with the exception of any peer group index, do not incur expenses.
AVERAGE ANNUAL TOTAL RETURNS (%) (as of September 30, 2024)
| | | |
| | 1 Year | 5 Year | 10 Year |
Class I - without sales charge | 27.85 | 12.48 | 10.39 |
Russell 3000 Index1 | 35.19 | 15.26 | 12.83 |
Russell 2000 Index | 26.76 | 9.39 | 8.78 |
| 1 | Effective July 24, 2024, the Russell 3000 Index replaced the Russell 2000 Index as a broad measure of market performance in accordance with new regulatory disclosure requirements. The Fund continues to use the Russell 2000 Index as a supplemental benchmark that MML Investment Advisers, LLC believes more closely reflects the market segments in which the Fund invests. |
Performance results reflect any applicable waivers or expense limitations in effect during these periods, without which performance would have been lower. The investment return and principal value of shares of the Fund fluctuate, so your shares, when sold, may be worth more or less than their original cost. Current performance of the Fund may be lower or higher than the performance quoted. Performance data current to the most recent month-end may be obtained at https://www.massmutual.com/product-performance/mutual-funds or by calling 1-888-309-3539 or by sending an email request to fundinfo@massmutual.com.
WHAT ARE SOME KEY FUND STATISTICS? (as of September 30, 2024)
| |
Total Net Assets (Millions) | $434.9 |
Total Number of Portfolio Holdings (includes derivative positions, if any) | 98 |
Total Advisory Fees Paid During the Reporting Period | $2,126,506 |
Portfolio Turnover Rate | 40% |
WHAT DID THE FUND INVEST IN? (as of September 30, 2024)
Derivative values, if any, are excluded from the table(s) below.
| |
Largest Holdings
(% of Total Investments) | |
ADMA Biologics, Inc. | 2.6% |
Summit Materials, Inc. Class A | 1.9% |
KB Home | 1.9% |
Zurn Elkay Water Solutions Corp. | 1.9% |
AutoNation, Inc. | 1.8% |
Allison Transmission Holdings, Inc. | 1.8% |
PennyMac Financial Services, Inc. | 1.7% |
Korn Ferry | 1.6% |
Four Corners Property Trust, Inc. | 1.6% |
ATI, Inc. | 1.6% |
| |
Sectors
(% of Total Investments) | |
Health Care | 19.3% |
Industrials | 19.0% |
Financials | 14.6% |
Information Technology | 14.0% |
Consumer Discretionary | 9.6% |
Real Estate | 6.7% |
Materials | 6.7% |
Energy | 5.1% |
Utilities | 2.1% |
Consumer Staples | 1.0% |
| MM202912-309770 | PAGE 2 | TSR-AR-ITGEI |
HOW HAS THE FUND CHANGED?
The following is a summary of certain changes to the Fund since October 1, 2023. For more complete information, you may review the Fund’s prospectus, including any applicable supplements, at https://www.massmutual.com/product-performance/mutual-funds or upon request at 1-888-309-3539 or fundinfo@massmutual.com.
Effective February 1, 2024, the annual rate for administrative services for Class A shares of the Fund was reduced from 0.30% to 0.25%.
Effective February 1, 2024, MML Investment Advisers, LLC has agreed to cap the fees and expenses of the Fund (other than extraordinary legal and other expenses, Acquired Fund Fees and Expenses, interest expense, expenses related to borrowings, securities lending, leverage, taxes, and brokerage, short sale dividend and loan expense, or other non-recurring or unusual expenses such as organizational expenses and shareholder meeting expenses, as applicable) through January 31, 2025, to the extent that Total Annual Fund Operating Expenses after Expense Reimbursement would otherwise exceed 0.65%, 0.75%, 0.85%, 0.95%, 1.10%, 1.15%, 1.35%, and 0.75% for Classes I, R5, Service, Administrative, R4, A, R3, and Y, respectively.
| |
| WHERE CAN I FIND ADDITIONAL INFORMATION ABOUT THE FUND? |
For additional information about the Fund, including its prospectus, financial information, holdings, and proxy voting information, scan the QR code or visit https://www.massmutual.com/product-performance/mutual-funds. |
| MM202912-309770 | PAGE 3 | TSR-AR-ITGEI |
10000102631145314094160571493015322228221858521026268821000099511144013579159671643318898249212052824729334321000010125116911411516266148201487821972168091831023210
| | |
MassMutual Small Cap Opportunities Fund | |
| Class R5 | MSCDX |
| Annual Shareholder Report | September 30, 2024 |
This annual shareholder report contains important information about the MassMutual Small Cap Opportunities Fund (the “Fund”) for the period of October 1, 2023 to September 30, 2024. You can find additional information about the Fund at https://www.massmutual.com/product-performance/mutual-funds. You can also request this information by contacting us at 1-888-309-3539 or by sending an email request to fundinfo@massmutual.com.
This report describes changes to the Fund that occurred during the reporting period.
WHAT WERE THE FUND COSTS FOR THE LAST YEAR?
This example shows the expenses you would have paid over the past year, based on a hypothetical $10,000 investment. This table reflects any applicable waivers or expense limitations.
| | |
Class Name | Costs of a $10,000 investment | Costs paid as a percentage of a $10,000 investment |
| Class R5 | $85 | 0.75% |
HOW DID THE FUND PERFORM?
Global equity markets advanced sharply as they weathered the unsettled geopolitical climate and higher interest rate environment well.
Geopolitical tensions remained high amid continued and escalating conflicts in Ukraine and the Middle East. In the U.S., the Federal Reserve continued its attempts to engineer a ‘soft landing’ and delivered a long-awaited cut in interest rates, with a 50bps cut in September. Domestic stocks advanced over the trailing 12-months as growth outperformed value and large cap shares outperformed their small cap counterparts in the period. U.S. large cap stocks outperformed their foreign counterparts, while shares in emerging markets outperformed developed non-U.S. markets.
Top contributors to the Fund’s performance relative to the Russell 2000® Index:
• Stock selection overall and led in particular by the healthcare sector
• Sector allocation in total and led in particular by underweight to the energy sector
Top detractors to the Fund’s performance relative to the Russell 2000 Index:
• Technology sector stock selection and in particular no weight in Super Micro Computer, Inc.
• Industrials sector stock selection and in particular an active weight in Atkore Inc.
Performance shown is past performance and does not guarantee future results. The graph and table below do not reflect the deduction of taxes that a shareholder would pay on Fund distributions or redemption of Fund shares. The graph and table below assume reinvestment of dividends and capital gain distributions.
GROWTH OF A HYPOTHETICAL $10,000 INVESTMENT (October 1, 2014 through September 30, 2024)
This graph shows the performance of a hypothetical $10,000 investment in the share class noted over a ten-year period or since inception, if shorter, as compared to the performance of a broad-based securities market index, and, if applicable, one or more indexes that MML Investment Advisers, LLC believes more closely reflects the market segments in which the Fund invests or is a better comparison for the Fund’s investment strategy. This graph includes the deduction of the maximum applicable sales charge, if any.
| MM202912-309770 | PAGE 1 | TSR-AR-ITGE1 |
The index or indexes shown above are unmanaged, cannot be purchased directly, and, with the exception of any peer group index, do not incur expenses.
AVERAGE ANNUAL TOTAL RETURNS (%) (as of September 30, 2024)
| | | |
| | 1 Year | 5 Year | 10 Year |
Class R5 - without sales charge | 27.69 | 12.37 | 10.27 |
Russell 3000 Index1 | 35.19 | 15.26 | 12.83 |
Russell 2000 Index | 26.76 | 9.39 | 8.78 |
| 1 | Effective July 24, 2024, the Russell 3000 Index replaced the Russell 2000 Index as a broad measure of market performance in accordance with new regulatory disclosure requirements. The Fund continues to use the Russell 2000 Index as a supplemental benchmark that MML Investment Advisers, LLC believes more closely reflects the market segments in which the Fund invests. |
Performance results reflect any applicable waivers or expense limitations in effect during these periods, without which performance would have been lower. The investment return and principal value of shares of the Fund fluctuate, so your shares, when sold, may be worth more or less than their original cost. Current performance of the Fund may be lower or higher than the performance quoted. Performance data current to the most recent month-end may be obtained at https://www.massmutual.com/product-performance/mutual-funds or by calling 1-888-309-3539 or by sending an email request to fundinfo@massmutual.com.
WHAT ARE SOME KEY FUND STATISTICS? (as of September 30, 2024)
| |
Total Net Assets (Millions) | $434.9 |
Total Number of Portfolio Holdings (includes derivative positions, if any) | 98 |
Total Advisory Fees Paid During the Reporting Period | $2,126,506 |
Portfolio Turnover Rate | 40% |
WHAT DID THE FUND INVEST IN? (as of September 30, 2024)
Derivative values, if any, are excluded from the table(s) below.
| |
Largest Holdings
(% of Total Investments) | |
ADMA Biologics, Inc. | 2.6% |
Summit Materials, Inc. Class A | 1.9% |
KB Home | 1.9% |
Zurn Elkay Water Solutions Corp. | 1.9% |
AutoNation, Inc. | 1.8% |
Allison Transmission Holdings, Inc. | 1.8% |
PennyMac Financial Services, Inc. | 1.7% |
Korn Ferry | 1.6% |
Four Corners Property Trust, Inc. | 1.6% |
ATI, Inc. | 1.6% |
| |
Sectors
(% of Total Investments) | |
Health Care | 19.3% |
Industrials | 19.0% |
Financials | 14.6% |
Information Technology | 14.0% |
Consumer Discretionary | 9.6% |
Real Estate | 6.7% |
Materials | 6.7% |
Energy | 5.1% |
Utilities | 2.1% |
Consumer Staples | 1.0% |
| MM202912-309770 | PAGE 2 | TSR-AR-ITGE1 |
HOW HAS THE FUND CHANGED?
The following is a summary of certain changes to the Fund since October 1, 2023. For more complete information, you may review the Fund’s prospectus, including any applicable supplements, at https://www.massmutual.com/product-performance/mutual-funds or upon request at 1-888-309-3539 or fundinfo@massmutual.com.
Effective February 1, 2024, the annual rate for administrative services for Class A shares of the Fund was reduced from 0.30% to 0.25%.
Effective February 1, 2024, MML Investment Advisers, LLC has agreed to cap the fees and expenses of the Fund (other than extraordinary legal and other expenses, Acquired Fund Fees and Expenses, interest expense, expenses related to borrowings, securities lending, leverage, taxes, and brokerage, short sale dividend and loan expense, or other non-recurring or unusual expenses such as organizational expenses and shareholder meeting expenses, as applicable) through January 31, 2025, to the extent that Total Annual Fund Operating Expenses after Expense Reimbursement would otherwise exceed 0.65%, 0.75%, 0.85%, 0.95%, 1.10%, 1.15%, 1.35%, and 0.75% for Classes I, R5, Service, Administrative, R4, A, R3, and Y, respectively.
| |
| WHERE CAN I FIND ADDITIONAL INFORMATION ABOUT THE FUND? |
For additional information about the Fund, including its prospectus, financial information, holdings, and proxy voting information, scan the QR code or visit https://www.massmutual.com/product-performance/mutual-funds. |
| MM202912-309770 | PAGE 3 | TSR-AR-ITGE1 |
10000102441141114035159751483415214226361840920816265811000099511144013579159671643318898249212052824729334321000010125116911411516266148201487821972168091831023210
| | |
MassMutual Small Cap Opportunities Fund | |
| Service Class | MSVYX |
| Annual Shareholder Report | September 30, 2024 |
This annual shareholder report contains important information about the MassMutual Small Cap Opportunities Fund (the “Fund”) for the period of October 1, 2023 to September 30, 2024. You can find additional information about the Fund at https://www.massmutual.com/product-performance/mutual-funds. You can also request this information by contacting us at 1-888-309-3539 or by sending an email request to fundinfo@massmutual.com.
This report describes changes to the Fund that occurred during the reporting period.
WHAT WERE THE FUND COSTS FOR THE LAST YEAR?
This example shows the expenses you would have paid over the past year, based on a hypothetical $10,000 investment. This table reflects any applicable waivers or expense limitations.
| | |
Class Name | Costs of a $10,000 investment | Costs paid as a percentage of a $10,000 investment |
| Service Class | $97 | 0.85% |
HOW DID THE FUND PERFORM?
Global equity markets advanced sharply as they weathered the unsettled geopolitical climate and higher interest rate environment well.
Geopolitical tensions remained high amid continued and escalating conflicts in Ukraine and the Middle East. In the U.S., the Federal Reserve continued its attempts to engineer a ‘soft landing’ and delivered a long-awaited cut in interest rates, with a 50bps cut in September. Domestic stocks advanced over the trailing 12-months as growth outperformed value and large cap shares outperformed their small cap counterparts in the period. U.S. large cap stocks outperformed their foreign counterparts, while shares in emerging markets outperformed developed non-U.S. markets.
Top contributors to the Fund’s performance relative to the Russell 2000® Index:
• Stock selection overall and led in particular by the healthcare sector
• Sector allocation in total and led in particular by underweight to the energy sector
Top detractors to the Fund’s performance relative to the Russell 2000 Index:
• Technology sector stock selection and in particular no weight in Super Micro Computer, Inc.
• Industrials sector stock selection and in particular an active weight in Atkore Inc.
Performance shown is past performance and does not guarantee future results. The graph and table below do not reflect the deduction of taxes that a shareholder would pay on Fund distributions or redemption of Fund shares. The graph and table below assume reinvestment of dividends and capital gain distributions.
GROWTH OF A HYPOTHETICAL $10,000 INVESTMENT (October 1, 2014 through September 30, 2024)
This graph shows the performance of a hypothetical $10,000 investment in the share class noted over a ten-year period or since inception, if shorter, as compared to the performance of a broad-based securities market index, and, if applicable, one or more indexes that MML Investment Advisers, LLC believes more closely reflects the market segments in which the Fund invests or is a better comparison for the Fund’s investment strategy. This graph includes the deduction of the maximum applicable sales charge, if any.
| MM202912-309770 | PAGE 1 | TSR-AR-ITGE3 |
The index or indexes shown above are unmanaged, cannot be purchased directly, and, with the exception of any peer group index, do not incur expenses.
AVERAGE ANNUAL TOTAL RETURNS (%) (as of September 30, 2024)
| | | |
| | 1 Year | 5 Year | 10 Year |
Service Class - without sales charge | 27.62 | 12.25 | 10.16 |
Russell 3000 Index1 | 35.19 | 15.26 | 12.83 |
Russell 2000 Index | 26.76 | 9.39 | 8.78 |
| 1 | Effective July 24, 2024, the Russell 3000 Index replaced the Russell 2000 Index as a broad measure of market performance in accordance with new regulatory disclosure requirements. The Fund continues to use the Russell 2000 Index as a supplemental benchmark that MML Investment Advisers, LLC believes more closely reflects the market segments in which the Fund invests. |
Performance results reflect any applicable waivers or expense limitations in effect during these periods, without which performance would have been lower. The investment return and principal value of shares of the Fund fluctuate, so your shares, when sold, may be worth more or less than their original cost. Current performance of the Fund may be lower or higher than the performance quoted. Performance data current to the most recent month-end may be obtained at https://www.massmutual.com/product-performance/mutual-funds or by calling 1-888-309-3539 or by sending an email request to fundinfo@massmutual.com.
WHAT ARE SOME KEY FUND STATISTICS? (as of September 30, 2024)
| |
Total Net Assets (Millions) | $434.9 |
Total Number of Portfolio Holdings (includes derivative positions, if any) | 98 |
Total Advisory Fees Paid During the Reporting Period | $2,126,506 |
Portfolio Turnover Rate | 40% |
WHAT DID THE FUND INVEST IN? (as of September 30, 2024)
Derivative values, if any, are excluded from the table(s) below.
| |
Largest Holdings
(% of Total Investments) | |
ADMA Biologics, Inc. | 2.6% |
Summit Materials, Inc. Class A | 1.9% |
KB Home | 1.9% |
Zurn Elkay Water Solutions Corp. | 1.9% |
AutoNation, Inc. | 1.8% |
Allison Transmission Holdings, Inc. | 1.8% |
PennyMac Financial Services, Inc. | 1.7% |
Korn Ferry | 1.6% |
Four Corners Property Trust, Inc. | 1.6% |
ATI, Inc. | 1.6% |
| |
Sectors
(% of Total Investments) | |
Health Care | 19.3% |
Industrials | 19.0% |
Financials | 14.6% |
Information Technology | 14.0% |
Consumer Discretionary | 9.6% |
Real Estate | 6.7% |
Materials | 6.7% |
Energy | 5.1% |
Utilities | 2.1% |
Consumer Staples | 1.0% |
| MM202912-309770 | PAGE 2 | TSR-AR-ITGE3 |
HOW HAS THE FUND CHANGED?
The following is a summary of certain changes to the Fund since October 1, 2023. For more complete information, you may review the Fund’s prospectus, including any applicable supplements, at https://www.massmutual.com/product-performance/mutual-funds or upon request at 1-888-309-3539 or fundinfo@massmutual.com.
Effective February 1, 2024, the annual rate for administrative services for Class A shares of the Fund was reduced from 0.30% to 0.25%.
Effective February 1, 2024, MML Investment Advisers, LLC has agreed to cap the fees and expenses of the Fund (other than extraordinary legal and other expenses, Acquired Fund Fees and Expenses, interest expense, expenses related to borrowings, securities lending, leverage, taxes, and brokerage, short sale dividend and loan expense, or other non-recurring or unusual expenses such as organizational expenses and shareholder meeting expenses, as applicable) through January 31, 2025, to the extent that Total Annual Fund Operating Expenses after Expense Reimbursement would otherwise exceed 0.65%, 0.75%, 0.85%, 0.95%, 1.10%, 1.15%, 1.35%, and 0.75% for Classes I, R5, Service, Administrative, R4, A, R3, and Y, respectively.
| |
| WHERE CAN I FIND ADDITIONAL INFORMATION ABOUT THE FUND? |
For additional information about the Fund, including its prospectus, financial information, holdings, and proxy voting information, scan the QR code or visit https://www.massmutual.com/product-performance/mutual-funds. |
| MM202912-309770 | PAGE 3 | TSR-AR-ITGE3 |
10000102411139113997159111477215122224901826520630263281000099511144013579159671643318898249212052824729334321000010125116911411516266148201487821972168091831023210
| | |
MassMutual Small Cap Opportunities Fund | |
| Administrative Class | MSCLX |
| Annual Shareholder Report | September 30, 2024 |
This annual shareholder report contains important information about the MassMutual Small Cap Opportunities Fund (the “Fund”) for the period of October 1, 2023 to September 30, 2024. You can find additional information about the Fund at https://www.massmutual.com/product-performance/mutual-funds. You can also request this information by contacting us at 1-888-309-3539 or by sending an email request to fundinfo@massmutual.com.
This report describes changes to the Fund that occurred during the reporting period.
WHAT WERE THE FUND COSTS FOR THE LAST YEAR?
This example shows the expenses you would have paid over the past year, based on a hypothetical $10,000 investment. This table reflects any applicable waivers or expense limitations.
| | |
Class Name | Costs of a $10,000 investment | Costs paid as a percentage of a $10,000 investment |
| Administrative Class | $108 | 0.95% |
HOW DID THE FUND PERFORM?
Global equity markets advanced sharply as they weathered the unsettled geopolitical climate and higher interest rate environment well.
Geopolitical tensions remained high amid continued and escalating conflicts in Ukraine and the Middle East. In the U.S., the Federal Reserve continued its attempts to engineer a ‘soft landing’ and delivered a long-awaited cut in interest rates, with a 50bps cut in September. Domestic stocks advanced over the trailing 12-months as growth outperformed value and large cap shares outperformed their small cap counterparts in the period. U.S. large cap stocks outperformed their foreign counterparts, while shares in emerging markets outperformed developed non-U.S. markets.
Top contributors to the Fund’s performance relative to the Russell 2000® Index:
• Stock selection overall and led in particular by the healthcare sector
• Sector allocation in total and led in particular by underweight to the energy sector
Top detractors to the Fund’s performance relative to the Russell 2000 Index:
• Technology sector stock selection and in particular no weight in Super Micro Computer, Inc.
• Industrials sector stock selection and in particular an active weight in Atkore Inc.
Performance shown is past performance and does not guarantee future results. The graph and table below do not reflect the deduction of taxes that a shareholder would pay on Fund distributions or redemption of Fund shares. The graph and table below assume reinvestment of dividends and capital gain distributions.
GROWTH OF A HYPOTHETICAL $10,000 INVESTMENT (October 1, 2014 through September 30, 2024)
This graph shows the performance of a hypothetical $10,000 investment in the share class noted over a ten-year period or since inception, if shorter, as compared to the performance of a broad-based securities market index, and, if applicable, one or more indexes that MML Investment Advisers, LLC believes more closely reflects the market segments in which the Fund invests or is a better comparison for the Fund’s investment strategy. This graph includes the deduction of the maximum applicable sales charge, if any.
| MM202912-309770 | PAGE 1 | TSR-AR-ITGE4 |
The index or indexes shown above are unmanaged, cannot be purchased directly, and, with the exception of any peer group index, do not incur expenses.
AVERAGE ANNUAL TOTAL RETURNS (%) (as of September 30, 2024)
| | | |
| | 1 Year | 5 Year | 10 Year |
Administrative Class - without sales charge | 27.42 | 12.13 | 10.05 |
Russell 3000 Index1 | 35.19 | 15.26 | 12.83 |
Russell 2000 Index | 26.76 | 9.39 | 8.78 |
| 1 | Effective July 24, 2024, the Russell 3000 Index replaced the Russell 2000 Index as a broad measure of market performance in accordance with new regulatory disclosure requirements. The Fund continues to use the Russell 2000 Index as a supplemental benchmark that MML Investment Advisers, LLC believes more closely reflects the market segments in which the Fund invests. |
Performance results reflect any applicable waivers or expense limitations in effect during these periods, without which performance would have been lower. The investment return and principal value of shares of the Fund fluctuate, so your shares, when sold, may be worth more or less than their original cost. Current performance of the Fund may be lower or higher than the performance quoted. Performance data current to the most recent month-end may be obtained at https://www.massmutual.com/product-performance/mutual-funds or by calling 1-888-309-3539 or by sending an email request to fundinfo@massmutual.com.
WHAT ARE SOME KEY FUND STATISTICS? (as of September 30, 2024)
| |
Total Net Assets (Millions) | $434.9 |
Total Number of Portfolio Holdings (includes derivative positions, if any) | 98 |
Total Advisory Fees Paid During the Reporting Period | $2,126,506 |
Portfolio Turnover Rate | 40% |
WHAT DID THE FUND INVEST IN? (as of September 30, 2024)
Derivative values, if any, are excluded from the table(s) below.
| |
Largest Holdings
(% of Total Investments) | |
ADMA Biologics, Inc. | 2.6% |
Summit Materials, Inc. Class A | 1.9% |
KB Home | 1.9% |
Zurn Elkay Water Solutions Corp. | 1.9% |
AutoNation, Inc. | 1.8% |
Allison Transmission Holdings, Inc. | 1.8% |
PennyMac Financial Services, Inc. | 1.7% |
Korn Ferry | 1.6% |
Four Corners Property Trust, Inc. | 1.6% |
ATI, Inc. | 1.6% |
| |
Sectors
(% of Total Investments) | |
Health Care | 19.3% |
Industrials | 19.0% |
Financials | 14.6% |
Information Technology | 14.0% |
Consumer Discretionary | 9.6% |
Real Estate | 6.7% |
Materials | 6.7% |
Energy | 5.1% |
Utilities | 2.1% |
Consumer Staples | 1.0% |
| MM202912-309770 | PAGE 2 | TSR-AR-ITGE4 |
HOW HAS THE FUND CHANGED?
The following is a summary of certain changes to the Fund since October 1, 2023. For more complete information, you may review the Fund’s prospectus, including any applicable supplements, at https://www.massmutual.com/product-performance/mutual-funds or upon request at 1-888-309-3539 or fundinfo@massmutual.com.
Effective February 1, 2024, the annual rate for administrative services for Class A shares of the Fund was reduced from 0.30% to 0.25%.
Effective February 1, 2024, MML Investment Advisers, LLC has agreed to cap the fees and expenses of the Fund (other than extraordinary legal and other expenses, Acquired Fund Fees and Expenses, interest expense, expenses related to borrowings, securities lending, leverage, taxes, and brokerage, short sale dividend and loan expense, or other non-recurring or unusual expenses such as organizational expenses and shareholder meeting expenses, as applicable) through January 31, 2025, to the extent that Total Annual Fund Operating Expenses after Expense Reimbursement would otherwise exceed 0.65%, 0.75%, 0.85%, 0.95%, 1.10%, 1.15%, 1.35%, and 0.75% for Classes I, R5, Service, Administrative, R4, A, R3, and Y, respectively.
| |
| WHERE CAN I FIND ADDITIONAL INFORMATION ABOUT THE FUND? |
For additional information about the Fund, including its prospectus, financial information, holdings, and proxy voting information, scan the QR code or visit https://www.massmutual.com/product-performance/mutual-funds. |
| MM202912-309770 | PAGE 3 | TSR-AR-ITGE4 |
10000102251136813954158501469615030223261811120444260501000099511144013579159671643318898249212052824729334321000010125116911411516266148201487821972168091831023210
| | |
MassMutual Small Cap Opportunities Fund | |
| Class R4 | MOORX |
| Annual Shareholder Report | September 30, 2024 |
This annual shareholder report contains important information about the MassMutual Small Cap Opportunities Fund (the “Fund”) for the period of October 1, 2023 to September 30, 2024. You can find additional information about the Fund at https://www.massmutual.com/product-performance/mutual-funds. You can also request this information by contacting us at 1-888-309-3539 or by sending an email request to fundinfo@massmutual.com.
This report describes changes to the Fund that occurred during the reporting period.
WHAT WERE THE FUND COSTS FOR THE LAST YEAR?
This example shows the expenses you would have paid over the past year, based on a hypothetical $10,000 investment. This table reflects any applicable waivers or expense limitations.
| | |
Class Name | Costs of a $10,000 investment | Costs paid as a percentage of a $10,000 investment |
| Class R4 | $125 | 1.10% |
HOW DID THE FUND PERFORM?
Global equity markets advanced sharply as they weathered the unsettled geopolitical climate and higher interest rate environment well.
Geopolitical tensions remained high amid continued and escalating conflicts in Ukraine and the Middle East. In the U.S., the Federal Reserve continued its attempts to engineer a ‘soft landing’ and delivered a long-awaited cut in interest rates, with a 50bps cut in September. Domestic stocks advanced over the trailing 12-months as growth outperformed value and large cap shares outperformed their small cap counterparts in the period. U.S. large cap stocks outperformed their foreign counterparts, while shares in emerging markets outperformed developed non-U.S. markets.
Top contributors to the Fund’s performance relative to the Russell 2000® Index:
• Stock selection overall and led in particular by the healthcare sector
• Sector allocation in total and led in particular by underweight to the energy sector
Top detractors to the Fund’s performance relative to the Russell 2000 Index:
• Technology sector stock selection and in particular no weight in Super Micro Computer, Inc.
• Industrials sector stock selection and in particular an active weight in Atkore Inc.
Performance shown is past performance and does not guarantee future results. The graph and table below do not reflect the deduction of taxes that a shareholder would pay on Fund distributions or redemption of Fund shares. The graph and table below assume reinvestment of dividends and capital gain distributions.
GROWTH OF A HYPOTHETICAL $10,000 INVESTMENT (October 1, 2014 through September 30, 2024)
This graph shows the performance of a hypothetical $10,000 investment in the share class noted over a ten-year period or since inception, if shorter, as compared to the performance of a broad-based securities market index, and, if applicable, one or more indexes that MML Investment Advisers, LLC believes more closely reflects the market segments in which the Fund invests or is a better comparison for the Fund’s investment strategy. This graph includes the deduction of the maximum applicable sales charge, if any.
| MM202912-309770 | PAGE 1 | TSR-AR-ITGEK |
The index or indexes shown above are unmanaged, cannot be purchased directly, and, with the exception of any peer group index, do not incur expenses.
AVERAGE ANNUAL TOTAL RETURNS (%) (as of September 30, 2024)
| | | |
| | 1 Year | 5 Year | 10 Year |
Class R4 - without sales charge | 27.28 | 11.98 | 9.90 |
Russell 3000 Index1 | 35.19 | 15.26 | 12.83 |
Russell 2000 Index | 26.76 | 9.39 | 8.78 |
| 1 | Effective July 24, 2024, the Russell 3000 Index replaced the Russell 2000 Index as a broad measure of market performance in accordance with new regulatory disclosure requirements. The Fund continues to use the Russell 2000 Index as a supplemental benchmark that MML Investment Advisers, LLC believes more closely reflects the market segments in which the Fund invests. |
Performance results reflect any applicable waivers or expense limitations in effect during these periods, without which performance would have been lower. The investment return and principal value of shares of the Fund fluctuate, so your shares, when sold, may be worth more or less than their original cost. Current performance of the Fund may be lower or higher than the performance quoted. Performance data current to the most recent month-end may be obtained at https://www.massmutual.com/product-performance/mutual-funds or by calling 1-888-309-3539 or by sending an email request to fundinfo@massmutual.com.
WHAT ARE SOME KEY FUND STATISTICS? (as of September 30, 2024)
| |
Total Net Assets (Millions) | $434.9 |
Total Number of Portfolio Holdings (includes derivative positions, if any) | 98 |
Total Advisory Fees Paid During the Reporting Period | $2,126,506 |
Portfolio Turnover Rate | 40% |
WHAT DID THE FUND INVEST IN? (as of September 30, 2024)
Derivative values, if any, are excluded from the table(s) below.
| |
Largest Holdings
(% of Total Investments) | |
ADMA Biologics, Inc. | 2.6% |
Summit Materials, Inc. Class A | 1.9% |
KB Home | 1.9% |
Zurn Elkay Water Solutions Corp. | 1.9% |
AutoNation, Inc. | 1.8% |
Allison Transmission Holdings, Inc. | 1.8% |
PennyMac Financial Services, Inc. | 1.7% |
Korn Ferry | 1.6% |
Four Corners Property Trust, Inc. | 1.6% |
ATI, Inc. | 1.6% |
| |
Sectors
(% of Total Investments) | |
Health Care | 19.3% |
Industrials | 19.0% |
Financials | 14.6% |
Information Technology | 14.0% |
Consumer Discretionary | 9.6% |
Real Estate | 6.7% |
Materials | 6.7% |
Energy | 5.1% |
Utilities | 2.1% |
Consumer Staples | 1.0% |
| MM202912-309770 | PAGE 2 | TSR-AR-ITGEK |
HOW HAS THE FUND CHANGED?
The following is a summary of certain changes to the Fund since October 1, 2023. For more complete information, you may review the Fund’s prospectus, including any applicable supplements, at https://www.massmutual.com/product-performance/mutual-funds or upon request at 1-888-309-3539 or fundinfo@massmutual.com.
Effective February 1, 2024, the annual rate for administrative services for Class A shares of the Fund was reduced from 0.30% to 0.25%.
Effective February 1, 2024, MML Investment Advisers, LLC has agreed to cap the fees and expenses of the Fund (other than extraordinary legal and other expenses, Acquired Fund Fees and Expenses, interest expense, expenses related to borrowings, securities lending, leverage, taxes, and brokerage, short sale dividend and loan expense, or other non-recurring or unusual expenses such as organizational expenses and shareholder meeting expenses, as applicable) through January 31, 2025, to the extent that Total Annual Fund Operating Expenses after Expense Reimbursement would otherwise exceed 0.65%, 0.75%, 0.85%, 0.95%, 1.10%, 1.15%, 1.35%, and 0.75% for Classes I, R5, Service, Administrative, R4, A, R3, and Y, respectively.
| |
| WHERE CAN I FIND ADDITIONAL INFORMATION ABOUT THE FUND? |
For additional information about the Fund, including its prospectus, financial information, holdings, and proxy voting information, scan the QR code or visit https://www.massmutual.com/product-performance/mutual-funds. |
| MM202912-309770 | PAGE 3 | TSR-AR-ITGEK |
10000102171134713900157651459414909221121791220184256911000099511144013579159671643318898249212052824729334321000010125116911411516266148201487821972168091831023210
| | |
MassMutual Small Cap Opportunities Fund | |
| Class A | DLBMX |
| Annual Shareholder Report | September 30, 2024 |
This annual shareholder report contains important information about the MassMutual Small Cap Opportunities Fund (the “Fund”) for the period of October 1, 2023 to September 30, 2024. You can find additional information about the Fund at https://www.massmutual.com/product-performance/mutual-funds. You can also request this information by contacting us at 1-888-309-3539 or by sending an email request to fundinfo@massmutual.com.
This report describes changes to the Fund that occurred during the reporting period.
WHAT WERE THE FUND COSTS FOR THE LAST YEAR?
This example shows the expenses you would have paid over the past year, based on a hypothetical $10,000 investment. This table reflects any applicable waivers or expense limitations.
| | |
Class Name | Costs of a $10,000 investment | Costs paid as a percentage of a $10,000 investment |
| Class A | $133 | 1.17% |
HOW DID THE FUND PERFORM?
Global equity markets advanced sharply as they weathered the unsettled geopolitical climate and higher interest rate environment well.
Geopolitical tensions remained high amid continued and escalating conflicts in Ukraine and the Middle East. In the U.S., the Federal Reserve continued its attempts to engineer a ‘soft landing’ and delivered a long-awaited cut in interest rates, with a 50bps cut in September. Domestic stocks advanced over the trailing 12-months as growth outperformed value and large cap shares outperformed their small cap counterparts in the period. U.S. large cap stocks outperformed their foreign counterparts, while shares in emerging markets outperformed developed non-U.S. markets.
Top contributors to the Fund’s performance relative to the Russell 2000® Index:
• Stock selection overall and led in particular by the healthcare sector
• Sector allocation in total and led in particular by underweight to the energy sector
Top detractors to the Fund’s performance relative to the Russell 2000 Index:
• Technology sector stock selection and in particular no weight in Super Micro Computer, Inc.
• Industrials sector stock selection and in particular an active weight in Atkore Inc.
Performance shown is past performance and does not guarantee future results. The graph and table below do not reflect the deduction of taxes that a shareholder would pay on Fund distributions or redemption of Fund shares. The graph and table below assume reinvestment of dividends and capital gain distributions.
GROWTH OF A HYPOTHETICAL $10,000 INVESTMENT (October 1, 2014 through September 30, 2024)
This graph shows the performance of a hypothetical $10,000 investment in the share class noted over a ten-year period or since inception, if shorter, as compared to the performance of a broad-based securities market index, and, if applicable, one or more indexes that MML Investment Advisers, LLC believes more closely reflects the market segments in which the Fund invests or is a better comparison for the Fund’s investment strategy. This graph includes the deduction of the maximum applicable sales charge, if any.
| MM202912-309770 | PAGE 1 | TSR-AR-ITGE2 |
The index or indexes shown above are unmanaged, cannot be purchased directly, and, with the exception of any peer group index, do not incur expenses.
AVERAGE ANNUAL TOTAL RETURNS (%) (as of September 30, 2024)
| | | |
| | 1 Year | 5 Year | 10 Year |
Class A - without sales charge | 27.16 | 11.87 | 9.78 |
Class A - with maximum sales charge | 20.17 | 10.61 | 9.16 |
Russell 3000 Index1 | 35.19 | 15.26 | 12.83 |
Russell 2000 Index | 26.76 | 9.39 | 8.78 |
| 1 | Effective July 24, 2024, the Russell 3000 Index replaced the Russell 2000 Index as a broad measure of market performance in accordance with new regulatory disclosure requirements. The Fund continues to use the Russell 2000 Index as a supplemental benchmark that MML Investment Advisers, LLC believes more closely reflects the market segments in which the Fund invests. |
Performance results reflect any applicable waivers or expense limitations in effect during these periods, without which performance would have been lower. The investment return and principal value of shares of the Fund fluctuate, so your shares, when sold, may be worth more or less than their original cost. Current performance of the Fund may be lower or higher than the performance quoted. Performance data current to the most recent month-end may be obtained at https://www.massmutual.com/product-performance/mutual-funds or by calling 1-888-309-3539 or by sending an email request to fundinfo@massmutual.com.
WHAT ARE SOME KEY FUND STATISTICS? (as of September 30, 2024)
| |
Total Net Assets (Millions) | $434.9 |
Total Number of Portfolio Holdings (includes derivative positions, if any) | 98 |
Total Advisory Fees Paid During the Reporting Period | $2,126,506 |
Portfolio Turnover Rate | 40% |
WHAT DID THE FUND INVEST IN? (as of September 30, 2024)
Derivative values, if any, are excluded from the table(s) below.
| |
Largest Holdings
(% of Total Investments) | |
ADMA Biologics, Inc. | 2.6% |
Summit Materials, Inc. Class A | 1.9% |
KB Home | 1.9% |
Zurn Elkay Water Solutions Corp. | 1.9% |
AutoNation, Inc. | 1.8% |
Allison Transmission Holdings, Inc. | 1.8% |
PennyMac Financial Services, Inc. | 1.7% |
Korn Ferry | 1.6% |
Four Corners Property Trust, Inc. | 1.6% |
ATI, Inc. | 1.6% |
| |
Sectors
(% of Total Investments) | |
Health Care | 19.3% |
Industrials | 19.0% |
Financials | 14.6% |
Information Technology | 14.0% |
Consumer Discretionary | 9.6% |
Real Estate | 6.7% |
Materials | 6.7% |
Energy | 5.1% |
Utilities | 2.1% |
Consumer Staples | 1.0% |
| MM202912-309770 | PAGE 2 | TSR-AR-ITGE2 |
HOW HAS THE FUND CHANGED?
The following is a summary of certain changes to the Fund since October 1, 2023. For more complete information, you may review the Fund’s prospectus, including any applicable supplements, at https://www.massmutual.com/product-performance/mutual-funds or upon request at 1-888-309-3539 or fundinfo@massmutual.com.
Effective February 1, 2024, the annual rate for administrative services for Class A shares of the Fund was reduced from 0.30% to 0.25%.
Effective February 1, 2024, MML Investment Advisers, LLC has agreed to cap the fees and expenses of the Fund (other than extraordinary legal and other expenses, Acquired Fund Fees and Expenses, interest expense, expenses related to borrowings, securities lending, leverage, taxes, and brokerage, short sale dividend and loan expense, or other non-recurring or unusual expenses such as organizational expenses and shareholder meeting expenses, as applicable) through January 31, 2025, to the extent that Total Annual Fund Operating Expenses after Expense Reimbursement would otherwise exceed 0.65%, 0.75%, 0.85%, 0.95%, 1.10%, 1.15%, 1.35%, and 0.75% for Classes I, R5, Service, Administrative, R4, A, R3, and Y, respectively.
| |
| WHERE CAN I FIND ADDITIONAL INFORMATION ABOUT THE FUND? |
For additional information about the Fund, including its prospectus, financial information, holdings, and proxy voting information, scan the QR code or visit https://www.massmutual.com/product-performance/mutual-funds. |
| MM202912-309770 | PAGE 3 | TSR-AR-ITGE2 |
945096431069213090148351371714001207421679318898240311000099511144013579159671643318898249212052824729334321000010125116911411516266148201487821972168091831023210
| | |
MassMutual Small Cap Opportunities Fund | |
| Class R3 | MCCRX |
| Annual Shareholder Report | September 30, 2024 |
This annual shareholder report contains important information about the MassMutual Small Cap Opportunities Fund (the “Fund”) for the period of October 1, 2023 to September 30, 2024. You can find additional information about the Fund at https://www.massmutual.com/product-performance/mutual-funds. You can also request this information by contacting us at 1-888-309-3539 or by sending an email request to fundinfo@massmutual.com.
This report describes changes to the Fund that occurred during the reporting period.
WHAT WERE THE FUND COSTS FOR THE LAST YEAR?
This example shows the expenses you would have paid over the past year, based on a hypothetical $10,000 investment. This table reflects any applicable waivers or expense limitations.
| | |
Class Name | Costs of a $10,000 investment | Costs paid as a percentage of a $10,000 investment |
| Class R3 | $153 | 1.35% |
HOW DID THE FUND PERFORM?
Global equity markets advanced sharply as they weathered the unsettled geopolitical climate and higher interest rate environment well.
Geopolitical tensions remained high amid continued and escalating conflicts in Ukraine and the Middle East. In the U.S., the Federal Reserve continued its attempts to engineer a ‘soft landing’ and delivered a long-awaited cut in interest rates, with a 50bps cut in September. Domestic stocks advanced over the trailing 12-months as growth outperformed value and large cap shares outperformed their small cap counterparts in the period. U.S. large cap stocks outperformed their foreign counterparts, while shares in emerging markets outperformed developed non-U.S. markets.
Top contributors to the Fund’s performance relative to the Russell 2000® Index:
• Stock selection overall and led in particular by the healthcare sector
• Sector allocation in total and led in particular by underweight to the energy sector
Top detractors to the Fund’s performance relative to the Russell 2000 Index:
• Technology sector stock selection and in particular no weight in Super Micro Computer, Inc.
• Industrials sector stock selection and in particular an active weight in Atkore Inc.
Performance shown is past performance and does not guarantee future results. The graph and table below do not reflect the deduction of taxes that a shareholder would pay on Fund distributions or redemption of Fund shares. The graph and table below assume reinvestment of dividends and capital gain distributions.
GROWTH OF A HYPOTHETICAL $10,000 INVESTMENT (October 1, 2014 through September 30, 2024)
This graph shows the performance of a hypothetical $10,000 investment in the share class noted over a ten-year period or since inception, if shorter, as compared to the performance of a broad-based securities market index, and, if applicable, one or more indexes that MML Investment Advisers, LLC believes more closely reflects the market segments in which the Fund invests or is a better comparison for the Fund’s investment strategy. This graph includes the deduction of the maximum applicable sales charge, if any.
| MM202912-309770 | PAGE 1 | TSR-AR-ITGEJ |
The index or indexes shown above are unmanaged, cannot be purchased directly, and, with the exception of any peer group index, do not incur expenses.
AVERAGE ANNUAL TOTAL RETURNS (%) (as of September 30, 2024)
| | | |
| | 1 Year | 5 Year | 10 Year |
Class R3 - without sales charge | 26.97 | 11.70 | 9.62 |
Russell 3000 Index1 | 35.19 | 15.26 | 12.83 |
Russell 2000 Index | 26.76 | 9.39 | 8.78 |
| 1 | Effective July 24, 2024, the Russell 3000 Index replaced the Russell 2000 Index as a broad measure of market performance in accordance with new regulatory disclosure requirements. The Fund continues to use the Russell 2000 Index as a supplemental benchmark that MML Investment Advisers, LLC believes more closely reflects the market segments in which the Fund invests. |
Performance results reflect any applicable waivers or expense limitations in effect during these periods, without which performance would have been lower. The investment return and principal value of shares of the Fund fluctuate, so your shares, when sold, may be worth more or less than their original cost. Current performance of the Fund may be lower or higher than the performance quoted. Performance data current to the most recent month-end may be obtained at https://www.massmutual.com/product-performance/mutual-funds or by calling 1-888-309-3539 or by sending an email request to fundinfo@massmutual.com.
WHAT ARE SOME KEY FUND STATISTICS? (as of September 30, 2024)
| |
Total Net Assets (Millions) | $434.9 |
Total Number of Portfolio Holdings (includes derivative positions, if any) | 98 |
Total Advisory Fees Paid During the Reporting Period | $2,126,506 |
Portfolio Turnover Rate | 40% |
WHAT DID THE FUND INVEST IN? (as of September 30, 2024)
Derivative values, if any, are excluded from the table(s) below.
| |
Largest Holdings
(% of Total Investments) | |
ADMA Biologics, Inc. | 2.6% |
Summit Materials, Inc. Class A | 1.9% |
KB Home | 1.9% |
Zurn Elkay Water Solutions Corp. | 1.9% |
AutoNation, Inc. | 1.8% |
Allison Transmission Holdings, Inc. | 1.8% |
PennyMac Financial Services, Inc. | 1.7% |
Korn Ferry | 1.6% |
Four Corners Property Trust, Inc. | 1.6% |
ATI, Inc. | 1.6% |
| |
Sectors
(% of Total Investments) | |
Health Care | 19.3% |
Industrials | 19.0% |
Financials | 14.6% |
Information Technology | 14.0% |
Consumer Discretionary | 9.6% |
Real Estate | 6.7% |
Materials | 6.7% |
Energy | 5.1% |
Utilities | 2.1% |
Consumer Staples | 1.0% |
| MM202912-309770 | PAGE 2 | TSR-AR-ITGEJ |
HOW HAS THE FUND CHANGED?
The following is a summary of certain changes to the Fund since October 1, 2023. For more complete information, you may review the Fund’s prospectus, including any applicable supplements, at https://www.massmutual.com/product-performance/mutual-funds or upon request at 1-888-309-3539 or fundinfo@massmutual.com.
Effective February 1, 2024, the annual rate for administrative services for Class A shares of the Fund was reduced from 0.30% to 0.25%.
Effective February 1, 2024, MML Investment Advisers, LLC has agreed to cap the fees and expenses of the Fund (other than extraordinary legal and other expenses, Acquired Fund Fees and Expenses, interest expense, expenses related to borrowings, securities lending, leverage, taxes, and brokerage, short sale dividend and loan expense, or other non-recurring or unusual expenses such as organizational expenses and shareholder meeting expenses, as applicable) through January 31, 2025, to the extent that Total Annual Fund Operating Expenses after Expense Reimbursement would otherwise exceed 0.65%, 0.75%, 0.85%, 0.95%, 1.10%, 1.15%, 1.35%, and 0.75% for Classes I, R5, Service, Administrative, R4, A, R3, and Y, respectively.
| |
| WHERE CAN I FIND ADDITIONAL INFORMATION ABOUT THE FUND? |
For additional information about the Fund, including its prospectus, financial information, holdings, and proxy voting information, scan the QR code or visit https://www.massmutual.com/product-performance/mutual-funds. |
| MM202912-309770 | PAGE 3 | TSR-AR-ITGEJ |
10000101971128913795156071441214681217281755919737250591000099511144013579159671643318898249212052824729334321000010125116911411516266148201487821972168091831023210
| | |
MassMutual Small Cap Opportunities Fund | |
| Class Y | MMOGX |
| Annual Shareholder Report | September 30, 2024 |
This annual shareholder report contains important information about the MassMutual Small Cap Opportunities Fund (the “Fund”) for the period of October 1, 2023 to September 30, 2024. You can find additional information about the Fund at https://www.massmutual.com/product-performance/mutual-funds. You can also request this information by contacting us at 1-888-309-3539 or by sending an email request to fundinfo@massmutual.com.
This report describes changes to the Fund that occurred during the reporting period.
WHAT WERE THE FUND COSTS FOR THE LAST YEAR?
This example shows the expenses you would have paid over the past year, based on a hypothetical $10,000 investment. This table reflects any applicable waivers or expense limitations.
| | |
Class Name | Costs of a $10,000 investment | Costs paid as a percentage of a $10,000 investment |
| Class Y | $85 | 0.75% |
HOW DID THE FUND PERFORM?
Global equity markets advanced sharply as they weathered the unsettled geopolitical climate and higher interest rate environment well.
Geopolitical tensions remained high amid continued and escalating conflicts in Ukraine and the Middle East. In the U.S., the Federal Reserve continued its attempts to engineer a ‘soft landing’ and delivered a long-awaited cut in interest rates, with a 50bps cut in September. Domestic stocks advanced over the trailing 12-months as growth outperformed value and large cap shares outperformed their small cap counterparts in the period. U.S. large cap stocks outperformed their foreign counterparts, while shares in emerging markets outperformed developed non-U.S. markets.
Top contributors to the Fund’s performance relative to the Russell 2000® Index:
• Stock selection overall and led in particular by the healthcare sector
• Sector allocation in total and led in particular by underweight to the energy sector
Top detractors to the Fund’s performance relative to the Russell 2000 Index:
• Technology sector stock selection and in particular no weight in Super Micro Computer, Inc.
• Industrials sector stock selection and in particular an active weight in Atkore Inc.
Performance shown is past performance and does not guarantee future results. The graph and table below do not reflect the deduction of taxes that a shareholder would pay on Fund distributions or redemption of Fund shares. The graph and table below assume reinvestment of dividends and capital gain distributions.
GROWTH OF A HYPOTHETICAL $10,000 INVESTMENT (February 1, 2023 through September 30, 2024)
This graph shows the performance of a hypothetical $10,000 investment in the share class noted over a ten-year period or since inception, if shorter, as compared to the performance of a broad-based securities market index, and, if applicable, one or more indexes that MML Investment Advisers, LLC believes more closely reflects the market segments in which the Fund invests or is a better comparison for the Fund’s investment strategy. This graph includes the deduction of the maximum applicable sales charge, if any.
| MM202912-309770 | PAGE 1 | TSR-AR-ITGEY |
The index or indexes shown above are unmanaged, cannot be purchased directly, and, with the exception of any peer group index, do not incur expenses.
AVERAGE ANNUAL TOTAL RETURNS (%) (as of September 30, 2024)
| | |
| | 1 Year | Since Inception
(02/01/2023) |
Class Y - without sales charge | 27.77 | 12.18 |
Russell 3000 Index1 | 35.19 | 23.53 |
Russell 2000 Index | 26.76 | 10.70 |
| 1 | Effective July 24, 2024, the Russell 3000 Index replaced the Russell 2000 Index as a broad measure of market performance in accordance with new regulatory disclosure requirements. The Fund continues to use the Russell 2000 Index as a supplemental benchmark that MML Investment Advisers, LLC believes more closely reflects the market segments in which the Fund invests. |
Performance results reflect any applicable waivers or expense limitations in effect during these periods, without which performance would have been lower. The investment return and principal value of shares of the Fund fluctuate, so your shares, when sold, may be worth more or less than their original cost. Current performance of the Fund may be lower or higher than the performance quoted. Performance data current to the most recent month-end may be obtained at https://www.massmutual.com/product-performance/mutual-funds or by calling 1-888-309-3539 or by sending an email request to fundinfo@massmutual.com.
WHAT ARE SOME KEY FUND STATISTICS? (as of September 30, 2024)
| |
Total Net Assets (Millions) | $434.9 |
Total Number of Portfolio Holdings (includes derivative positions, if any) | 98 |
Total Advisory Fees Paid During the Reporting Period | $2,126,506 |
Portfolio Turnover Rate | 40% |
WHAT DID THE FUND INVEST IN? (as of September 30, 2024)
Derivative values, if any, are excluded from the table(s) below.
| |
Largest Holdings
(% of Total Investments) | |
ADMA Biologics, Inc. | 2.6% |
Summit Materials, Inc. Class A | 1.9% |
KB Home | 1.9% |
Zurn Elkay Water Solutions Corp. | 1.9% |
AutoNation, Inc. | 1.8% |
Allison Transmission Holdings, Inc. | 1.8% |
PennyMac Financial Services, Inc. | 1.7% |
Korn Ferry | 1.6% |
Four Corners Property Trust, Inc. | 1.6% |
ATI, Inc. | 1.6% |
| |
Sectors
(% of Total Investments) | |
Health Care | 19.3% |
Industrials | 19.0% |
Financials | 14.6% |
Information Technology | 14.0% |
Consumer Discretionary | 9.6% |
Real Estate | 6.7% |
Materials | 6.7% |
Energy | 5.1% |
Utilities | 2.1% |
Consumer Staples | 1.0% |
| MM202912-309770 | PAGE 2 | TSR-AR-ITGEY |
HOW HAS THE FUND CHANGED?
The following is a summary of certain changes to the Fund since October 1, 2023. For more complete information, you may review the Fund’s prospectus, including any applicable supplements, at https://www.massmutual.com/product-performance/mutual-funds or upon request at 1-888-309-3539 or fundinfo@massmutual.com.
Effective February 1, 2024, the annual rate for administrative services for Class A shares of the Fund was reduced from 0.30% to 0.25%.
Effective February 1, 2024, MML Investment Advisers, LLC has agreed to cap the fees and expenses of the Fund (other than extraordinary legal and other expenses, Acquired Fund Fees and Expenses, interest expense, expenses related to borrowings, securities lending, leverage, taxes, and brokerage, short sale dividend and loan expense, or other non-recurring or unusual expenses such as organizational expenses and shareholder meeting expenses, as applicable) through January 31, 2025, to the extent that Total Annual Fund Operating Expenses after Expense Reimbursement would otherwise exceed 0.65%, 0.75%, 0.85%, 0.95%, 1.10%, 1.15%, 1.35%, and 0.75% for Classes I, R5, Service, Administrative, R4, A, R3, and Y, respectively.
| |
| WHERE CAN I FIND ADDITIONAL INFORMATION ABOUT THE FUND? |
For additional information about the Fund, including its prospectus, financial information, holdings, and proxy voting information, scan the QR code or visit https://www.massmutual.com/product-performance/mutual-funds. |
| MM202912-309770 | PAGE 3 | TSR-AR-ITGEY |
1000094721210310000103951405310000920611669
| | |
MassMutual Global Fund | |
| Class I | MGFZX |
| Annual Shareholder Report | September 30, 2024 |
This annual shareholder report contains important information about the MassMutual Global Fund (the “Fund”) for the period of October 1, 2023 to September 30, 2024. You can find additional information about the Fund at https://www.massmutual.com/product-performance/mutual-funds. You can also request this information by contacting us at 1-888-309-3539 or by sending an email request to fundinfo@massmutual.com.
This report describes changes to the Fund that occurred during the reporting period.
WHAT WERE THE FUND COSTS FOR THE LAST YEAR?
This example shows the expenses you would have paid over the past year, based on a hypothetical $10,000 investment. This table reflects any applicable waivers or expense limitations.
| | |
Class Name | Costs of a $10,000 investment | Costs paid as a percentage of a $10,000 investment |
| Class I | $109 | 0.93% |
HOW DID THE FUND PERFORM?
Global equity markets advanced sharply as they weathered the unsettled geopolitical climate and higher interest rate environment well.
Geopolitical tensions remained high amid continued and escalating conflicts in Ukraine and the Middle East. In the U.S., the Federal Reserve continued its attempts to engineer a ‘soft landing’ and delivered a long-awaited cut in interest rates, with a 50bps cut in September. Domestic stocks advanced over the trailing 12-months as growth outperformed value and large cap shares outperformed their small cap counterparts in the period. U.S. large cap stocks outperformed their foreign counterparts, while shares in emerging markets outperformed developed non-U.S. markets.
Top contributors to the Fund’s performance relative to the MSCI ACWI:
• Stock selection within the communication services sector where an overweight allocation to Meta Platforms, Inc. was particularly impactful
• Stock selection within the real estate sector
• An underweight allocation to the energy sector
Top detractors to the Fund’s performance relative to the MSCI ACWI:
• Stock selection within the information technology sector where the Fund was hurt by an overweight position in Adobe, Inc.
• Stock selection within the consumer discretionary sector
• An underweight to the financials sector, which was the third best performing sector in the period
| MM202912-309770 | PAGE 1 | TSR-AR-ITGVI |
Performance shown is past performance and does not guarantee future results. The graph and table below do not reflect the deduction of taxes that a shareholder would pay on Fund distributions or redemption of Fund shares. The graph and table below assume reinvestment of dividends and capital gain distributions.
GROWTH OF A HYPOTHETICAL $10,000 INVESTMENT (October 1, 2014 through September 30, 2024)
This graph shows the performance of a hypothetical $10,000 investment in the share class noted over a ten-year period or since inception, if shorter, as compared to the performance of a broad-based securities market index, and, if applicable, one or more indexes that MML Investment Advisers, LLC believes more closely reflects the market segments in which the Fund invests or is a better comparison for the Fund’s investment strategy. This graph includes the deduction of the maximum applicable sales charge, if any.
The index or indexes shown above are unmanaged, cannot be purchased directly, and, with the exception of any peer group index, do not incur expenses.
AVERAGE ANNUAL TOTAL RETURNS (%) (as of September 30, 2024)
| | | |
| | 1 Year | 5 Year | 10 Year |
Class I - without sales charge | 34.35 | 12.27 | 9.81 |
MSCI ACWI | 31.76 | 12.19 | 9.39 |
Performance results reflect any applicable waivers or expense limitations in effect during these periods, without which performance would have been lower. The investment return and principal value of shares of the Fund fluctuate, so your shares, when sold, may be worth more or less than their original cost. Current performance of the Fund may be lower or higher than the performance quoted. Performance data current to the most recent month-end may be obtained at https://www.massmutual.com/product-performance/mutual-funds or by calling 1-888-309-3539 or by sending an email request to fundinfo@massmutual.com.
WHAT ARE SOME KEY FUND STATISTICS? (as of September 30, 2024)
| |
Total Net Assets (Millions) | $188.2 |
Total Number of Portfolio Holdings (includes derivative positions, if any) | 62 |
Total Advisory Fees Paid During the Reporting Period | $1,430,664 |
Portfolio Turnover Rate | 6% |
| MM202912-309770 | PAGE 2 | TSR-AR-ITGVI |
WHAT DID THE FUND INVEST IN? (as of September 30, 2024)
Derivative values, if any, are excluded from the table(s) below.
| |
Largest Holdings
(% of Total Investments) | |
Alphabet, Inc. Class A | 10.4% |
Meta Platforms, Inc. Class A | 8.7% |
DLF Ltd. | 5.0% |
Analog Devices, Inc. | 4.5% |
S&P Global, Inc. | 4.2% |
Novo Nordisk AS Class B | 3.8% |
SAP SE | 3.5% |
Intuit, Inc. | 3.3% |
NVIDIA Corp. | 3.2% |
LVMH Moet Hennessy Louis Vuitton SE | 3.1% |
| |
Sectors
(% of Total Investments) | |
Information Technology | 29.4% |
Communication Services | 21.1% |
Health Care | 12.0% |
Consumer Discretionary | 10.8% |
Industrials | 10.1% |
Financials | 9.1% |
Real Estate | 5.0% |
Materials | 0.8% |
| |
Largest Countries
(% of Total Investments) | |
United States | 56.6% |
India | 7.0% |
France | 7.0% |
Sweden | 5.1% |
Japan | 4.7% |
Germany | 4.1% |
Denmark | 3.8% |
China | 3.3% |
Netherlands | 1.8% |
Spain | 1.3% |
HOW HAS THE FUND CHANGED?
The following is a summary of certain changes to the Fund since October 1, 2023. For more complete information, you may review the Fund’s prospectus, including any applicable supplements, at https://www.massmutual.com/product-performance/mutual-funds or upon request at 1-888-309-3539 or fundinfo@massmutual.com.
Effective February 1, 2024, the annual rate for administrative services for Class A shares of the Fund was reduced from 0.30% to 0.25%.
Effective February 1, 2024, the Fund’s Principal Investment Strategies were updated to reflect that the Fund may purchase American Depositary Shares as part of American Depositary Receipt issuances, which are negotiable certificates issued by a U.S. bank representing a specified number of shares in a foreign stock traded on a U.S. exchange.
| |
| WHERE CAN I FIND ADDITIONAL INFORMATION ABOUT THE FUND? |
For additional information about the Fund, including its prospectus, financial information, holdings, and proxy voting information, scan the QR code or visit https://www.massmutual.com/product-performance/mutual-funds. |
| MM202912-309770 | PAGE 3 | TSR-AR-ITGVI |
100009808103471319614567142861755823063146971896625482100009334104511239913611137991524019422154091861524526
| | |
MassMutual Global Fund | |
| Class R5 | MGFSX |
| Annual Shareholder Report | September 30, 2024 |
This annual shareholder report contains important information about the MassMutual Global Fund (the “Fund”) for the period of October 1, 2023 to September 30, 2024. You can find additional information about the Fund at https://www.massmutual.com/product-performance/mutual-funds. You can also request this information by contacting us at 1-888-309-3539 or by sending an email request to fundinfo@massmutual.com.
This report describes changes to the Fund that occurred during the reporting period.
WHAT WERE THE FUND COSTS FOR THE LAST YEAR?
This example shows the expenses you would have paid over the past year, based on a hypothetical $10,000 investment. This table reflects any applicable waivers or expense limitations.
| | |
Class Name | Costs of a $10,000 investment | Costs paid as a percentage of a $10,000 investment |
| Class R5 | $121 | 1.03% |
HOW DID THE FUND PERFORM?
Global equity markets advanced sharply as they weathered the unsettled geopolitical climate and higher interest rate environment well.
Geopolitical tensions remained high amid continued and escalating conflicts in Ukraine and the Middle East. In the U.S., the Federal Reserve continued its attempts to engineer a ‘soft landing’ and delivered a long-awaited cut in interest rates, with a 50bps cut in September. Domestic stocks advanced over the trailing 12-months as growth outperformed value and large cap shares outperformed their small cap counterparts in the period. U.S. large cap stocks outperformed their foreign counterparts, while shares in emerging markets outperformed developed non-U.S. markets.
Top contributors to the Fund’s performance relative to the MSCI ACWI:
• Stock selection within the communication services sector where an overweight allocation to Meta Platforms, Inc. was particularly impactful
• Stock selection within the real estate sector
• An underweight allocation to the energy sector
Top detractors to the Fund’s performance relative to the MSCI ACWI:
• Stock selection within the information technology sector where the Fund was hurt by an overweight position in Adobe, Inc.
• Stock selection within the consumer discretionary sector
• An underweight to the financials sector, which was the third best performing sector in the period
| MM202912-309770 | PAGE 1 | TSR-AR-ITGV1 |
Performance shown is past performance and does not guarantee future results. The graph and table below do not reflect the deduction of taxes that a shareholder would pay on Fund distributions or redemption of Fund shares. The graph and table below assume reinvestment of dividends and capital gain distributions.
GROWTH OF A HYPOTHETICAL $10,000 INVESTMENT (October 1, 2014 through September 30, 2024)
This graph shows the performance of a hypothetical $10,000 investment in the share class noted over a ten-year period or since inception, if shorter, as compared to the performance of a broad-based securities market index, and, if applicable, one or more indexes that MML Investment Advisers, LLC believes more closely reflects the market segments in which the Fund invests or is a better comparison for the Fund’s investment strategy. This graph includes the deduction of the maximum applicable sales charge, if any.
The index or indexes shown above are unmanaged, cannot be purchased directly, and, with the exception of any peer group index, do not incur expenses.
AVERAGE ANNUAL TOTAL RETURNS (%) (as of September 30, 2024)
| | | |
| | 1 Year | 5 Year | 10 Year |
Class R5 - without sales charge | 34.23 | 12.16 | 9.70 |
MSCI ACWI | 31.76 | 12.19 | 9.39 |
Performance results reflect any applicable waivers or expense limitations in effect during these periods, without which performance would have been lower. The investment return and principal value of shares of the Fund fluctuate, so your shares, when sold, may be worth more or less than their original cost. Current performance of the Fund may be lower or higher than the performance quoted. Performance data current to the most recent month-end may be obtained at https://www.massmutual.com/product-performance/mutual-funds or by calling 1-888-309-3539 or by sending an email request to fundinfo@massmutual.com.
WHAT ARE SOME KEY FUND STATISTICS? (as of September 30, 2024)
| |
Total Net Assets (Millions) | $188.2 |
Total Number of Portfolio Holdings (includes derivative positions, if any) | 62 |
Total Advisory Fees Paid During the Reporting Period | $1,430,664 |
Portfolio Turnover Rate | 6% |
| MM202912-309770 | PAGE 2 | TSR-AR-ITGV1 |
WHAT DID THE FUND INVEST IN? (as of September 30, 2024)
Derivative values, if any, are excluded from the table(s) below.
| |
Largest Holdings
(% of Total Investments) | |
Alphabet, Inc. Class A | 10.4% |
Meta Platforms, Inc. Class A | 8.7% |
DLF Ltd. | 5.0% |
Analog Devices, Inc. | 4.5% |
S&P Global, Inc. | 4.2% |
Novo Nordisk AS Class B | 3.8% |
SAP SE | 3.5% |
Intuit, Inc. | 3.3% |
NVIDIA Corp. | 3.2% |
LVMH Moet Hennessy Louis Vuitton SE | 3.1% |
| |
Sectors
(% of Total Investments) | |
Information Technology | 29.4% |
Communication Services | 21.1% |
Health Care | 12.0% |
Consumer Discretionary | 10.8% |
Industrials | 10.1% |
Financials | 9.1% |
Real Estate | 5.0% |
Materials | 0.8% |
| |
Largest Countries
(% of Total Investments) | |
United States | 56.6% |
India | 7.0% |
France | 7.0% |
Sweden | 5.1% |
Japan | 4.7% |
Germany | 4.1% |
Denmark | 3.8% |
China | 3.3% |
Netherlands | 1.8% |
Spain | 1.3% |
HOW HAS THE FUND CHANGED?
The following is a summary of certain changes to the Fund since October 1, 2023. For more complete information, you may review the Fund’s prospectus, including any applicable supplements, at https://www.massmutual.com/product-performance/mutual-funds or upon request at 1-888-309-3539 or fundinfo@massmutual.com.
Effective February 1, 2024, the annual rate for administrative services for Class A shares of the Fund was reduced from 0.30% to 0.25%.
Effective February 1, 2024, the Fund’s Principal Investment Strategies were updated to reflect that the Fund may purchase American Depositary Shares as part of American Depositary Receipt issuances, which are negotiable certificates issued by a U.S. bank representing a specified number of shares in a foreign stock traded on a U.S. exchange.
| |
| WHERE CAN I FIND ADDITIONAL INFORMATION ABOUT THE FUND? |
For additional information about the Fund, including its prospectus, financial information, holdings, and proxy voting information, scan the QR code or visit https://www.massmutual.com/product-performance/mutual-funds. |
| MM202912-309770 | PAGE 3 | TSR-AR-ITGV1 |
100009793103191316214514142141745022906145701879525228100009334104511239913611137991524019422154091861524526
| | |
MassMutual Global Fund | |
| Service Class | MGFYX |
| Annual Shareholder Report | September 30, 2024 |
This annual shareholder report contains important information about the MassMutual Global Fund (the “Fund”) for the period of October 1, 2023 to September 30, 2024. You can find additional information about the Fund at https://www.massmutual.com/product-performance/mutual-funds. You can also request this information by contacting us at 1-888-309-3539 or by sending an email request to fundinfo@massmutual.com.
This report describes changes to the Fund that occurred during the reporting period.
WHAT WERE THE FUND COSTS FOR THE LAST YEAR?
This example shows the expenses you would have paid over the past year, based on a hypothetical $10,000 investment. This table reflects any applicable waivers or expense limitations.
| | |
Class Name | Costs of a $10,000 investment | Costs paid as a percentage of a $10,000 investment |
| Service Class | $132 | 1.13% |
HOW DID THE FUND PERFORM?
Global equity markets advanced sharply as they weathered the unsettled geopolitical climate and higher interest rate environment well.
Geopolitical tensions remained high amid continued and escalating conflicts in Ukraine and the Middle East. In the U.S., the Federal Reserve continued its attempts to engineer a ‘soft landing’ and delivered a long-awaited cut in interest rates, with a 50bps cut in September. Domestic stocks advanced over the trailing 12-months as growth outperformed value and large cap shares outperformed their small cap counterparts in the period. U.S. large cap stocks outperformed their foreign counterparts, while shares in emerging markets outperformed developed non-U.S. markets.
Top contributors to the Fund’s performance relative to the MSCI ACWI:
• Stock selection within the communication services sector where an overweight allocation to Meta Platforms, Inc. was particularly impactful
• Stock selection within the real estate sector
• An underweight allocation to the energy sector
Top detractors to the Fund’s performance relative to the MSCI ACWI:
• Stock selection within the information technology sector where the Fund was hurt by an overweight position in Adobe, Inc.
• Stock selection within the consumer discretionary sector
• An underweight to the financials sector, which was the third best performing sector in the period
| MM202912-309770 | PAGE 1 | TSR-AR-ITGV3 |
Performance shown is past performance and does not guarantee future results. The graph and table below do not reflect the deduction of taxes that a shareholder would pay on Fund distributions or redemption of Fund shares. The graph and table below assume reinvestment of dividends and capital gain distributions.
GROWTH OF A HYPOTHETICAL $10,000 INVESTMENT (October 1, 2014 through September 30, 2024)
This graph shows the performance of a hypothetical $10,000 investment in the share class noted over a ten-year period or since inception, if shorter, as compared to the performance of a broad-based securities market index, and, if applicable, one or more indexes that MML Investment Advisers, LLC believes more closely reflects the market segments in which the Fund invests or is a better comparison for the Fund’s investment strategy. This graph includes the deduction of the maximum applicable sales charge, if any.
The index or indexes shown above are unmanaged, cannot be purchased directly, and, with the exception of any peer group index, do not incur expenses.
AVERAGE ANNUAL TOTAL RETURNS (%) (as of September 30, 2024)
| | | |
| | 1 Year | 5 Year | 10 Year |
Service Class - without sales charge | 34.08 | 12.07 | 9.59 |
MSCI ACWI | 31.76 | 12.19 | 9.39 |
Performance results reflect any applicable waivers or expense limitations in effect during these periods, without which performance would have been lower. The investment return and principal value of shares of the Fund fluctuate, so your shares, when sold, may be worth more or less than their original cost. Current performance of the Fund may be lower or higher than the performance quoted. Performance data current to the most recent month-end may be obtained at https://www.massmutual.com/product-performance/mutual-funds or by calling 1-888-309-3539 or by sending an email request to fundinfo@massmutual.com.
WHAT ARE SOME KEY FUND STATISTICS? (as of September 30, 2024)
| |
Total Net Assets (Millions) | $188.2 |
Total Number of Portfolio Holdings (includes derivative positions, if any) | 62 |
Total Advisory Fees Paid During the Reporting Period | $1,430,664 |
Portfolio Turnover Rate | 6% |
| MM202912-309770 | PAGE 2 | TSR-AR-ITGV3 |
WHAT DID THE FUND INVEST IN? (as of September 30, 2024)
Derivative values, if any, are excluded from the table(s) below.
| |
Largest Holdings
(% of Total Investments) | |
Alphabet, Inc. Class A | 10.4% |
Meta Platforms, Inc. Class A | 8.7% |
DLF Ltd. | 5.0% |
Analog Devices, Inc. | 4.5% |
S&P Global, Inc. | 4.2% |
Novo Nordisk AS Class B | 3.8% |
SAP SE | 3.5% |
Intuit, Inc. | 3.3% |
NVIDIA Corp. | 3.2% |
LVMH Moet Hennessy Louis Vuitton SE | 3.1% |
| |
Sectors
(% of Total Investments) | |
Information Technology | 29.4% |
Communication Services | 21.1% |
Health Care | 12.0% |
Consumer Discretionary | 10.8% |
Industrials | 10.1% |
Financials | 9.1% |
Real Estate | 5.0% |
Materials | 0.8% |
| |
Largest Countries
(% of Total Investments) | |
United States | 56.6% |
India | 7.0% |
France | 7.0% |
Sweden | 5.1% |
Japan | 4.7% |
Germany | 4.1% |
Denmark | 3.8% |
China | 3.3% |
Netherlands | 1.8% |
Spain | 1.3% |
HOW HAS THE FUND CHANGED?
The following is a summary of certain changes to the Fund since October 1, 2023. For more complete information, you may review the Fund’s prospectus, including any applicable supplements, at https://www.massmutual.com/product-performance/mutual-funds or upon request at 1-888-309-3539 or fundinfo@massmutual.com.
Effective February 1, 2024, the annual rate for administrative services for Class A shares of the Fund was reduced from 0.30% to 0.25%.
Effective February 1, 2024, the Fund’s Principal Investment Strategies were updated to reflect that the Fund may purchase American Depositary Shares as part of American Depositary Receipt issuances, which are negotiable certificates issued by a U.S. bank representing a specified number of shares in a foreign stock traded on a U.S. exchange.
| |
| WHERE CAN I FIND ADDITIONAL INFORMATION ABOUT THE FUND? |
For additional information about the Fund, including its prospectus, financial information, holdings, and proxy voting information, scan the QR code or visit https://www.massmutual.com/product-performance/mutual-funds. |
| MM202912-309770 | PAGE 3 | TSR-AR-ITGV3 |
100009785103011312114455141341735022743144571863524986100009334104511239913611137991524019422154091861524526
| | |
MassMutual Global Fund | |
| Administrative Class | MGFLX |
| Annual Shareholder Report | September 30, 2024 |
This annual shareholder report contains important information about the MassMutual Global Fund (the “Fund”) for the period of October 1, 2023 to September 30, 2024. You can find additional information about the Fund at https://www.massmutual.com/product-performance/mutual-funds. You can also request this information by contacting us at 1-888-309-3539 or by sending an email request to fundinfo@massmutual.com.
This report describes changes to the Fund that occurred during the reporting period.
WHAT WERE THE FUND COSTS FOR THE LAST YEAR?
This example shows the expenses you would have paid over the past year, based on a hypothetical $10,000 investment. This table reflects any applicable waivers or expense limitations.
| | |
Class Name | Costs of a $10,000 investment | Costs paid as a percentage of a $10,000 investment |
| Administrative Class | $144 | 1.23% |
HOW DID THE FUND PERFORM?
Global equity markets advanced sharply as they weathered the unsettled geopolitical climate and higher interest rate environment well.
Geopolitical tensions remained high amid continued and escalating conflicts in Ukraine and the Middle East. In the U.S., the Federal Reserve continued its attempts to engineer a ‘soft landing’ and delivered a long-awaited cut in interest rates, with a 50bps cut in September. Domestic stocks advanced over the trailing 12-months as growth outperformed value and large cap shares outperformed their small cap counterparts in the period. U.S. large cap stocks outperformed their foreign counterparts, while shares in emerging markets outperformed developed non-U.S. markets.
Top contributors to the Fund’s performance relative to the MSCI ACWI:
• Stock selection within the communication services sector where an overweight allocation to Meta Platforms, Inc. was particularly impactful
• Stock selection within the real estate sector
• An underweight allocation to the energy sector
Top detractors to the Fund’s performance relative to the MSCI ACWI:
• Stock selection within the information technology sector where the Fund was hurt by an overweight position in Adobe, Inc.
• Stock selection within the consumer discretionary sector
• An underweight to the financials sector, which was the third best performing sector in the period
| MM202912-309770 | PAGE 1 | TSR-AR-ITGV4 |
Performance shown is past performance and does not guarantee future results. The graph and table below do not reflect the deduction of taxes that a shareholder would pay on Fund distributions or redemption of Fund shares. The graph and table below assume reinvestment of dividends and capital gain distributions.
GROWTH OF A HYPOTHETICAL $10,000 INVESTMENT (October 1, 2014 through September 30, 2024)
This graph shows the performance of a hypothetical $10,000 investment in the share class noted over a ten-year period or since inception, if shorter, as compared to the performance of a broad-based securities market index, and, if applicable, one or more indexes that MML Investment Advisers, LLC believes more closely reflects the market segments in which the Fund invests or is a better comparison for the Fund’s investment strategy. This graph includes the deduction of the maximum applicable sales charge, if any.
The index or indexes shown above are unmanaged, cannot be purchased directly, and, with the exception of any peer group index, do not incur expenses.
AVERAGE ANNUAL TOTAL RETURNS (%) (as of September 30, 2024)
| | | |
| | 1 Year | 5 Year | 10 Year |
Administrative Class - without sales charge | 33.83 | 11.94 | 9.48 |
MSCI ACWI | 31.76 | 12.19 | 9.39 |
Performance results reflect any applicable waivers or expense limitations in effect during these periods, without which performance would have been lower. The investment return and principal value of shares of the Fund fluctuate, so your shares, when sold, may be worth more or less than their original cost. Current performance of the Fund may be lower or higher than the performance quoted. Performance data current to the most recent month-end may be obtained at https://www.massmutual.com/product-performance/mutual-funds or by calling 1-888-309-3539 or by sending an email request to fundinfo@massmutual.com.
WHAT ARE SOME KEY FUND STATISTICS? (as of September 30, 2024)
| |
Total Net Assets (Millions) | $188.2 |
Total Number of Portfolio Holdings (includes derivative positions, if any) | 62 |
Total Advisory Fees Paid During the Reporting Period | $1,430,664 |
Portfolio Turnover Rate | 6% |
| MM202912-309770 | PAGE 2 | TSR-AR-ITGV4 |
WHAT DID THE FUND INVEST IN? (as of September 30, 2024)
Derivative values, if any, are excluded from the table(s) below.
| |
Largest Holdings
(% of Total Investments) | |
Alphabet, Inc. Class A | 10.4% |
Meta Platforms, Inc. Class A | 8.7% |
DLF Ltd. | 5.0% |
Analog Devices, Inc. | 4.5% |
S&P Global, Inc. | 4.2% |
Novo Nordisk AS Class B | 3.8% |
SAP SE | 3.5% |
Intuit, Inc. | 3.3% |
NVIDIA Corp. | 3.2% |
LVMH Moet Hennessy Louis Vuitton SE | 3.1% |
| |
Sectors
(% of Total Investments) | |
Information Technology | 29.4% |
Communication Services | 21.1% |
Health Care | 12.0% |
Consumer Discretionary | 10.8% |
Industrials | 10.1% |
Financials | 9.1% |
Real Estate | 5.0% |
Materials | 0.8% |
| |
Largest Countries
(% of Total Investments) | |
United States | 56.6% |
India | 7.0% |
France | 7.0% |
Sweden | 5.1% |
Japan | 4.7% |
Germany | 4.1% |
Denmark | 3.8% |
China | 3.3% |
Netherlands | 1.8% |
Spain | 1.3% |
HOW HAS THE FUND CHANGED?
The following is a summary of certain changes to the Fund since October 1, 2023. For more complete information, you may review the Fund’s prospectus, including any applicable supplements, at https://www.massmutual.com/product-performance/mutual-funds or upon request at 1-888-309-3539 or fundinfo@massmutual.com.
Effective February 1, 2024, the annual rate for administrative services for Class A shares of the Fund was reduced from 0.30% to 0.25%.
Effective February 1, 2024, the Fund’s Principal Investment Strategies were updated to reflect that the Fund may purchase American Depositary Shares as part of American Depositary Receipt issuances, which are negotiable certificates issued by a U.S. bank representing a specified number of shares in a foreign stock traded on a U.S. exchange.
| |
| WHERE CAN I FIND ADDITIONAL INFORMATION ABOUT THE FUND? |
For additional information about the Fund, including its prospectus, financial information, holdings, and proxy voting information, scan the QR code or visit https://www.massmutual.com/product-performance/mutual-funds. |
| MM202912-309770 | PAGE 3 | TSR-AR-ITGV4 |
100009777102801308114398140671724022590143401847624726100009334104511239913611137991524019422154091861524526
| | |
MassMutual Global Fund | |
| Class R4 | MGFRX |
| Annual Shareholder Report | September 30, 2024 |
This annual shareholder report contains important information about the MassMutual Global Fund (the “Fund”) for the period of October 1, 2023 to September 30, 2024. You can find additional information about the Fund at https://www.massmutual.com/product-performance/mutual-funds. You can also request this information by contacting us at 1-888-309-3539 or by sending an email request to fundinfo@massmutual.com.
This report describes changes to the Fund that occurred during the reporting period.
WHAT WERE THE FUND COSTS FOR THE LAST YEAR?
This example shows the expenses you would have paid over the past year, based on a hypothetical $10,000 investment. This table reflects any applicable waivers or expense limitations.
| | |
Class Name | Costs of a $10,000 investment | Costs paid as a percentage of a $10,000 investment |
| Class R4 | $161 | 1.38% |
HOW DID THE FUND PERFORM?
Global equity markets advanced sharply as they weathered the unsettled geopolitical climate and higher interest rate environment well.
Geopolitical tensions remained high amid continued and escalating conflicts in Ukraine and the Middle East. In the U.S., the Federal Reserve continued its attempts to engineer a ‘soft landing’ and delivered a long-awaited cut in interest rates, with a 50bps cut in September. Domestic stocks advanced over the trailing 12-months as growth outperformed value and large cap shares outperformed their small cap counterparts in the period. U.S. large cap stocks outperformed their foreign counterparts, while shares in emerging markets outperformed developed non-U.S. markets.
Top contributors to the Fund’s performance relative to the MSCI ACWI:
• Stock selection within the communication services sector where an overweight allocation to Meta Platforms, Inc. was particularly impactful
• Stock selection within the real estate sector
• An underweight allocation to the energy sector
Top detractors to the Fund’s performance relative to the MSCI ACWI:
• Stock selection within the information technology sector where the Fund was hurt by an overweight position in Adobe, Inc.
• Stock selection within the consumer discretionary sector
• An underweight to the financials sector, which was the third best performing sector in the period
| MM202912-309770 | PAGE 1 | TSR-AR-ITGVK |
Performance shown is past performance and does not guarantee future results. The graph and table below do not reflect the deduction of taxes that a shareholder would pay on Fund distributions or redemption of Fund shares. The graph and table below assume reinvestment of dividends and capital gain distributions.
GROWTH OF A HYPOTHETICAL $10,000 INVESTMENT (October 1, 2014 through September 30, 2024)
This graph shows the performance of a hypothetical $10,000 investment in the share class noted over a ten-year period or since inception, if shorter, as compared to the performance of a broad-based securities market index, and, if applicable, one or more indexes that MML Investment Advisers, LLC believes more closely reflects the market segments in which the Fund invests or is a better comparison for the Fund’s investment strategy. This graph includes the deduction of the maximum applicable sales charge, if any.
The index or indexes shown above are unmanaged, cannot be purchased directly, and, with the exception of any peer group index, do not incur expenses.
AVERAGE ANNUAL TOTAL RETURNS (%) (as of September 30, 2024)
| | | |
| | 1 Year | 5 Year | 10 Year |
Class R4 - without sales charge | 33.68 | 11.78 | 9.31 |
MSCI ACWI | 31.76 | 12.19 | 9.39 |
Performance results reflect any applicable waivers or expense limitations in effect during these periods, without which performance would have been lower. The investment return and principal value of shares of the Fund fluctuate, so your shares, when sold, may be worth more or less than their original cost. Current performance of the Fund may be lower or higher than the performance quoted. Performance data current to the most recent month-end may be obtained at https://www.massmutual.com/product-performance/mutual-funds or by calling 1-888-309-3539 or by sending an email request to fundinfo@massmutual.com.
WHAT ARE SOME KEY FUND STATISTICS? (as of September 30, 2024)
| |
Total Net Assets (Millions) | $188.2 |
Total Number of Portfolio Holdings (includes derivative positions, if any) | 62 |
Total Advisory Fees Paid During the Reporting Period | $1,430,664 |
Portfolio Turnover Rate | 6% |
| MM202912-309770 | PAGE 2 | TSR-AR-ITGVK |
WHAT DID THE FUND INVEST IN? (as of September 30, 2024)
Derivative values, if any, are excluded from the table(s) below.
| |
Largest Holdings
(% of Total Investments) | |
Alphabet, Inc. Class A | 10.4% |
Meta Platforms, Inc. Class A | 8.7% |
DLF Ltd. | 5.0% |
Analog Devices, Inc. | 4.5% |
S&P Global, Inc. | 4.2% |
Novo Nordisk AS Class B | 3.8% |
SAP SE | 3.5% |
Intuit, Inc. | 3.3% |
NVIDIA Corp. | 3.2% |
LVMH Moet Hennessy Louis Vuitton SE | 3.1% |
| |
Sectors
(% of Total Investments) | |
Information Technology | 29.4% |
Communication Services | 21.1% |
Health Care | 12.0% |
Consumer Discretionary | 10.8% |
Industrials | 10.1% |
Financials | 9.1% |
Real Estate | 5.0% |
Materials | 0.8% |
| |
Largest Countries
(% of Total Investments) | |
United States | 56.6% |
India | 7.0% |
France | 7.0% |
Sweden | 5.1% |
Japan | 4.7% |
Germany | 4.1% |
Denmark | 3.8% |
China | 3.3% |
Netherlands | 1.8% |
Spain | 1.3% |
HOW HAS THE FUND CHANGED?
The following is a summary of certain changes to the Fund since October 1, 2023. For more complete information, you may review the Fund’s prospectus, including any applicable supplements, at https://www.massmutual.com/product-performance/mutual-funds or upon request at 1-888-309-3539 or fundinfo@massmutual.com.
Effective February 1, 2024, the annual rate for administrative services for Class A shares of the Fund was reduced from 0.30% to 0.25%.
Effective February 1, 2024, the Fund’s Principal Investment Strategies were updated to reflect that the Fund may purchase American Depositary Shares as part of American Depositary Receipt issuances, which are negotiable certificates issued by a U.S. bank representing a specified number of shares in a foreign stock traded on a U.S. exchange.
| |
| WHERE CAN I FIND ADDITIONAL INFORMATION ABOUT THE FUND? |
For additional information about the Fund, including its prospectus, financial information, holdings, and proxy voting information, scan the QR code or visit https://www.massmutual.com/product-performance/mutual-funds. |
| MM202912-309770 | PAGE 3 | TSR-AR-ITGVK |
100009756102491302114311139601708222341141781822524364100009334104511239913611137991524019422154091861524526
| | |
MassMutual Global Fund | |
| Class A | MGFAX |
| Annual Shareholder Report | September 30, 2024 |
This annual shareholder report contains important information about the MassMutual Global Fund (the “Fund”) for the period of October 1, 2023 to September 30, 2024. You can find additional information about the Fund at https://www.massmutual.com/product-performance/mutual-funds. You can also request this information by contacting us at 1-888-309-3539 or by sending an email request to fundinfo@massmutual.com.
This report describes changes to the Fund that occurred during the reporting period.
WHAT WERE THE FUND COSTS FOR THE LAST YEAR?
This example shows the expenses you would have paid over the past year, based on a hypothetical $10,000 investment. This table reflects any applicable waivers or expense limitations.
| | |
Class Name | Costs of a $10,000 investment | Costs paid as a percentage of a $10,000 investment |
| Class A | $169 | 1.45% |
HOW DID THE FUND PERFORM?
Global equity markets advanced sharply as they weathered the unsettled geopolitical climate and higher interest rate environment well.
Geopolitical tensions remained high amid continued and escalating conflicts in Ukraine and the Middle East. In the U.S., the Federal Reserve continued its attempts to engineer a ‘soft landing’ and delivered a long-awaited cut in interest rates, with a 50bps cut in September. Domestic stocks advanced over the trailing 12-months as growth outperformed value and large cap shares outperformed their small cap counterparts in the period. U.S. large cap stocks outperformed their foreign counterparts, while shares in emerging markets outperformed developed non-U.S. markets.
Top contributors to the Fund’s performance relative to the MSCI ACWI:
• Stock selection within the communication services sector where an overweight allocation to Meta Platforms, Inc. was particularly impactful
• Stock selection within the real estate sector
• An underweight allocation to the energy sector
Top detractors to the Fund’s performance relative to the MSCI ACWI:
• Stock selection within the information technology sector where the Fund was hurt by an overweight position in Adobe, Inc.
• Stock selection within the consumer discretionary sector
• An underweight to the financials sector, which was the third best performing sector in the period
| MM202912-309770 | PAGE 1 | TSR-AR-ITGV2 |
Performance shown is past performance and does not guarantee future results. The graph and table below do not reflect the deduction of taxes that a shareholder would pay on Fund distributions or redemption of Fund shares. The graph and table below assume reinvestment of dividends and capital gain distributions.
GROWTH OF A HYPOTHETICAL $10,000 INVESTMENT (October 1, 2014 through September 30, 2024)
This graph shows the performance of a hypothetical $10,000 investment in the share class noted over a ten-year period or since inception, if shorter, as compared to the performance of a broad-based securities market index, and, if applicable, one or more indexes that MML Investment Advisers, LLC believes more closely reflects the market segments in which the Fund invests or is a better comparison for the Fund’s investment strategy. This graph includes the deduction of the maximum applicable sales charge, if any.
The index or indexes shown above are unmanaged, cannot be purchased directly, and, with the exception of any peer group index, do not incur expenses.
AVERAGE ANNUAL TOTAL RETURNS (%) (as of September 30, 2024)
| | | |
| | 1 Year | 5 Year | 10 Year |
Class A - without sales charge | 33.59 | 11.67 | 9.21 |
Class A - with maximum sales charge | 26.24 | 10.41 | 8.59 |
MSCI ACWI | 31.76 | 12.19 | 9.39 |
Performance results reflect any applicable waivers or expense limitations in effect during these periods, without which performance would have been lower. The investment return and principal value of shares of the Fund fluctuate, so your shares, when sold, may be worth more or less than their original cost. Current performance of the Fund may be lower or higher than the performance quoted. Performance data current to the most recent month-end may be obtained at https://www.massmutual.com/product-performance/mutual-funds or by calling 1-888-309-3539 or by sending an email request to fundinfo@massmutual.com.
WHAT ARE SOME KEY FUND STATISTICS? (as of September 30, 2024)
| |
Total Net Assets (Millions) | $188.2 |
Total Number of Portfolio Holdings (includes derivative positions, if any) | 62 |
Total Advisory Fees Paid During the Reporting Period | $1,430,664 |
Portfolio Turnover Rate | 6% |
| MM202912-309770 | PAGE 2 | TSR-AR-ITGV2 |
WHAT DID THE FUND INVEST IN? (as of September 30, 2024)
Derivative values, if any, are excluded from the table(s) below.
| |
Largest Holdings
(% of Total Investments) | |
Alphabet, Inc. Class A | 10.4% |
Meta Platforms, Inc. Class A | 8.7% |
DLF Ltd. | 5.0% |
Analog Devices, Inc. | 4.5% |
S&P Global, Inc. | 4.2% |
Novo Nordisk AS Class B | 3.8% |
SAP SE | 3.5% |
Intuit, Inc. | 3.3% |
NVIDIA Corp. | 3.2% |
LVMH Moet Hennessy Louis Vuitton SE | 3.1% |
| |
Sectors
(% of Total Investments) | |
Information Technology | 29.4% |
Communication Services | 21.1% |
Health Care | 12.0% |
Consumer Discretionary | 10.8% |
Industrials | 10.1% |
Financials | 9.1% |
Real Estate | 5.0% |
Materials | 0.8% |
| |
Largest Countries
(% of Total Investments) | |
United States | 56.6% |
India | 7.0% |
France | 7.0% |
Sweden | 5.1% |
Japan | 4.7% |
Germany | 4.1% |
Denmark | 3.8% |
China | 3.3% |
Netherlands | 1.8% |
Spain | 1.3% |
HOW HAS THE FUND CHANGED?
The following is a summary of certain changes to the Fund since October 1, 2023. For more complete information, you may review the Fund’s prospectus, including any applicable supplements, at https://www.massmutual.com/product-performance/mutual-funds or upon request at 1-888-309-3539 or fundinfo@massmutual.com.
Effective February 1, 2024, the annual rate for administrative services for Class A shares of the Fund was reduced from 0.30% to 0.25%.
Effective February 1, 2024, the Fund’s Principal Investment Strategies were updated to reflect that the Fund may purchase American Depositary Shares as part of American Depositary Receipt issuances, which are negotiable certificates issued by a U.S. bank representing a specified number of shares in a foreign stock traded on a U.S. exchange.
| |
| WHERE CAN I FIND ADDITIONAL INFORMATION ABOUT THE FUND? |
For additional information about the Fund, including its prospectus, financial information, holdings, and proxy voting information, scan the QR code or visit https://www.massmutual.com/product-performance/mutual-funds. |
| MM202912-309770 | PAGE 3 | TSR-AR-ITGV2 |
9450921996661227413471131361605520975132891707222807100009334104511239913611137991524019422154091861524526
| | |
MassMutual Global Fund | |
| Class R3 | MGFNX |
| Annual Shareholder Report | September 30, 2024 |
This annual shareholder report contains important information about the MassMutual Global Fund (the “Fund”) for the period of October 1, 2023 to September 30, 2024. You can find additional information about the Fund at https://www.massmutual.com/product-performance/mutual-funds. You can also request this information by contacting us at 1-888-309-3539 or by sending an email request to fundinfo@massmutual.com.
This report describes changes to the Fund that occurred during the reporting period.
WHAT WERE THE FUND COSTS FOR THE LAST YEAR?
This example shows the expenses you would have paid over the past year, based on a hypothetical $10,000 investment. This table reflects any applicable waivers or expense limitations.
| | |
Class Name | Costs of a $10,000 investment | Costs paid as a percentage of a $10,000 investment |
| Class R3 | $191 | 1.64% |
HOW DID THE FUND PERFORM?
Global equity markets advanced sharply as they weathered the unsettled geopolitical climate and higher interest rate environment well.
Geopolitical tensions remained high amid continued and escalating conflicts in Ukraine and the Middle East. In the U.S., the Federal Reserve continued its attempts to engineer a ‘soft landing’ and delivered a long-awaited cut in interest rates, with a 50bps cut in September. Domestic stocks advanced over the trailing 12-months as growth outperformed value and large cap shares outperformed their small cap counterparts in the period. U.S. large cap stocks outperformed their foreign counterparts, while shares in emerging markets outperformed developed non-U.S. markets.
Top contributors to the Fund’s performance relative to the MSCI ACWI:
• Stock selection within the communication services sector where an overweight allocation to Meta Platforms, Inc. was particularly impactful
• Stock selection within the real estate sector
• An underweight allocation to the energy sector
Top detractors to the Fund’s performance relative to the MSCI ACWI:
• Stock selection within the information technology sector where the Fund was hurt by an overweight position in Adobe, Inc.
• Stock selection within the consumer discretionary sector
• An underweight to the financials sector, which was the third best performing sector in the period
| MM202912-309770 | PAGE 1 | TSR-AR-ITGV5 |
Performance shown is past performance and does not guarantee future results. The graph and table below do not reflect the deduction of taxes that a shareholder would pay on Fund distributions or redemption of Fund shares. The graph and table below assume reinvestment of dividends and capital gain distributions.
GROWTH OF A HYPOTHETICAL $10,000 INVESTMENT (October 1, 2014 through September 30, 2024)
This graph shows the performance of a hypothetical $10,000 investment in the share class noted over a ten-year period or since inception, if shorter, as compared to the performance of a broad-based securities market index, and, if applicable, one or more indexes that MML Investment Advisers, LLC believes more closely reflects the market segments in which the Fund invests or is a better comparison for the Fund’s investment strategy. This graph includes the deduction of the maximum applicable sales charge, if any.
The index or indexes shown above are unmanaged, cannot be purchased directly, and, with the exception of any peer group index, do not incur expenses.
AVERAGE ANNUAL TOTAL RETURNS (%) (as of September 30, 2024)
| | | |
| | 1 Year | 5 Year | 10 Year |
Class R3 - without sales charge | 33.40 | 11.50 | 9.05 |
MSCI ACWI | 31.76 | 12.19 | 9.39 |
Performance results reflect any applicable waivers or expense limitations in effect during these periods, without which performance would have been lower. The investment return and principal value of shares of the Fund fluctuate, so your shares, when sold, may be worth more or less than their original cost. Current performance of the Fund may be lower or higher than the performance quoted. Performance data current to the most recent month-end may be obtained at https://www.massmutual.com/product-performance/mutual-funds or by calling 1-888-309-3539 or by sending an email request to fundinfo@massmutual.com.
WHAT ARE SOME KEY FUND STATISTICS? (as of September 30, 2024)
| |
Total Net Assets (Millions) | $188.2 |
Total Number of Portfolio Holdings (includes derivative positions, if any) | 62 |
Total Advisory Fees Paid During the Reporting Period | $1,430,664 |
Portfolio Turnover Rate | 6% |
| MM202912-309770 | PAGE 2 | TSR-AR-ITGV5 |
WHAT DID THE FUND INVEST IN? (as of September 30, 2024)
Derivative values, if any, are excluded from the table(s) below.
| |
Largest Holdings
(% of Total Investments) | |
Alphabet, Inc. Class A | 10.4% |
Meta Platforms, Inc. Class A | 8.7% |
DLF Ltd. | 5.0% |
Analog Devices, Inc. | 4.5% |
S&P Global, Inc. | 4.2% |
Novo Nordisk AS Class B | 3.8% |
SAP SE | 3.5% |
Intuit, Inc. | 3.3% |
NVIDIA Corp. | 3.2% |
LVMH Moet Hennessy Louis Vuitton SE | 3.1% |
| |
Sectors
(% of Total Investments) | |
Information Technology | 29.4% |
Communication Services | 21.1% |
Health Care | 12.0% |
Consumer Discretionary | 10.8% |
Industrials | 10.1% |
Financials | 9.1% |
Real Estate | 5.0% |
Materials | 0.8% |
| |
Largest Countries
(% of Total Investments) | |
United States | 56.6% |
India | 7.0% |
France | 7.0% |
Sweden | 5.1% |
Japan | 4.7% |
Germany | 4.1% |
Denmark | 3.8% |
China | 3.3% |
Netherlands | 1.8% |
Spain | 1.3% |
HOW HAS THE FUND CHANGED?
The following is a summary of certain changes to the Fund since October 1, 2023. For more complete information, you may review the Fund’s prospectus, including any applicable supplements, at https://www.massmutual.com/product-performance/mutual-funds or upon request at 1-888-309-3539 or fundinfo@massmutual.com.
Effective February 1, 2024, the annual rate for administrative services for Class A shares of the Fund was reduced from 0.30% to 0.25%.
Effective February 1, 2024, the Fund’s Principal Investment Strategies were updated to reflect that the Fund may purchase American Depositary Shares as part of American Depositary Receipt issuances, which are negotiable certificates issued by a U.S. bank representing a specified number of shares in a foreign stock traded on a U.S. exchange.
| |
| WHERE CAN I FIND ADDITIONAL INFORMATION ABOUT THE FUND? |
For additional information about the Fund, including its prospectus, financial information, holdings, and proxy voting information, scan the QR code or visit https://www.massmutual.com/product-performance/mutual-funds. |
| MM202912-309770 | PAGE 3 | TSR-AR-ITGV5 |
100009737102021293014176137961683021965138961782123773100009334104511239913611137991524019422154091861524526
| | |
MassMutual International Equity Fund | |
| Class I | MIZIX |
| Annual Shareholder Report | September 30, 2024 |
This annual shareholder report contains important information about the MassMutual International Equity Fund (the “Fund”) for the period of October 1, 2023 to September 30, 2024. You can find additional information about the Fund at https://www.massmutual.com/product-performance/mutual-funds. You can also request this information by contacting us at 1-888-309-3539 or by sending an email request to fundinfo@massmutual.com.
This report describes changes to the Fund that occurred during the reporting period.
WHAT WERE THE FUND COSTS FOR THE LAST YEAR?
This example shows the expenses you would have paid over the past year, based on a hypothetical $10,000 investment. This table reflects any applicable waivers or expense limitations.
| | |
Class Name | Costs of a $10,000 investment | Costs paid as a percentage of a $10,000 investment |
| Class I | $120 | 1.08% |
HOW DID THE FUND PERFORM?
Global equity markets advanced sharply as they weathered the unsettled geopolitical climate and higher interest rate environment well.
Geopolitical tensions remained high amid continued and escalating conflicts in Ukraine and the Middle East. In the U.S., the Federal Reserve continued its attempts to engineer a ‘soft landing’ and delivered a long-awaited cut in interest rates, with a 50bps cut in September. Domestic stocks advanced over the trailing 12-months as growth outperformed value and large cap shares outperformed their small cap counterparts in the period. U.S. large cap stocks outperformed their foreign counterparts, while shares in emerging markets outperformed developed non-U.S. markets.
Top contributors to the Fund’s performance relative to the MSCI ACWI ex USA:
• Stock selection within the industrials sector, where overweight allocations to Experian PLC and Assa Abloy AB were particularly impactful
• Stock selection in consumer discretionary as well as an underweight position to the sector, which trailed the benchmark in the period
Top detractors to the Fund’s performance relative to the MSCI ACWI ex USA:
• An overweight position and poor stock selection in the consumer staples sector, which was the second worst performing sector in the period
• An underweight allocation and poor stock selection in the financials sector
Performance shown is past performance and does not guarantee future results. The graph and table below do not reflect the deduction of taxes that a shareholder would pay on Fund distributions or redemption of Fund shares. The graph and table below assume reinvestment of dividends and capital gain distributions.
GROWTH OF A HYPOTHETICAL $10,000 INVESTMENT (October 1, 2014 through September 30, 2024)
This graph shows the performance of a hypothetical $10,000 investment in the share class noted over a ten-year period or since inception, if shorter, as compared to the performance of a broad-based securities market index, and, if applicable, one or more indexes that MML Investment Advisers, LLC believes more closely reflects the market segments in which the Fund invests or is a better comparison for the Fund’s investment strategy. This graph includes the deduction of the maximum applicable sales charge, if any.
| MM202912-309770 | PAGE 1 | TSR-AR-IT2CI |
The index or indexes shown above are unmanaged, cannot be purchased directly, and, with the exception of any peer group index, do not incur expenses.
AVERAGE ANNUAL TOTAL RETURNS (%) (as of September 30, 2024)
| | | |
| | 1 Year | 5 Year | 10 Year |
Class I - without sales charge | 21.87 | 9.06 | 6.04 |
MSCI ACWI ex USA | 25.35 | 7.59 | 5.22 |
Performance results reflect any applicable waivers or expense limitations in effect during these periods, without which performance would have been lower. The investment return and principal value of shares of the Fund fluctuate, so your shares, when sold, may be worth more or less than their original cost. Current performance of the Fund may be lower or higher than the performance quoted. Performance data current to the most recent month-end may be obtained at https://www.massmutual.com/product-performance/mutual-funds or by calling 1-888-309-3539 or by sending an email request to fundinfo@massmutual.com.
WHAT ARE SOME KEY FUND STATISTICS? (as of September 30, 2024)
| |
Total Net Assets (Millions) | $120.5 |
Total Number of Portfolio Holdings (includes derivative positions, if any) | 138 |
Total Advisory Fees Paid During the Reporting Period | $923,211 |
Portfolio Turnover Rate | 25% |
WHAT DID THE FUND INVEST IN? (as of September 30, 2024)
Derivative values, if any, are excluded from the table(s) below.
| |
Largest Holdings
(% of Total Investments) | |
Symrise AG | 2.9% |
Capgemini SE | 2.8% |
Experian PLC | 2.7% |
Merck KGaA | 2.6% |
Roche Holding AG | 2.6% |
Intact Financial Corp. | 2.6% |
Sika AG Registered | 2.6% |
Nestle SA Registered | 2.5% |
Canadian National Railway Co. | 2.4% |
Novartis AG Registered | 2.4% |
| |
Sectors
(% of Total Investments) | |
Industrials | 18.1% |
Health Care | 18.0% |
Consumer Staples | 16.8% |
Financials | 11.8% |
Materials | 9.2% |
Information Technology | 7.4% |
Consumer Discretionary | 7.2% |
Energy | 2.4% |
Utilities | 2.4% |
Communication Services | 1.9% |
Real Estate | 0.2% |
| |
Largest Countries
(% of Total Investments) | |
United Kingdom | 17.1% |
Japan | 15.2% |
United States | 14.6% |
France | 8.6% |
Germany | 8.1% |
Switzerland | 7.1% |
Canada | 5.1% |
Spain | 3.8% |
Netherlands | 3.2% |
Hong Kong | 3.1% |
| MM202912-309770 | PAGE 2 | TSR-AR-IT2CI |
HOW HAS THE FUND CHANGED?
The following is a summary of certain changes to the Fund since October 1, 2023. For more complete information, you may review the Fund’s prospectus, including any applicable supplements, at https://www.massmutual.com/product-performance/mutual-funds or upon request at 1-888-309-3539 or fundinfo@massmutual.com.
Effective February 1, 2024, the annual rate for administrative services for Class A shares of the Fund was reduced from 0.30% to 0.25%.
| |
| WHERE CAN I FIND ADDITIONAL INFORMATION ABOUT THE FUND? |
For additional information about the Fund, including its prospectus, financial information, holdings, and proxy voting information, scan the QR code or visit https://www.massmutual.com/product-performance/mutual-funds. |
| MM202912-309770 | PAGE 3 | TSR-AR-IT2CI |
10000969810557122051194311646131801554712536147441796910000878495971147911681115381188414726110201326716630
| | |
MassMutual International Equity Fund | |
| Class R5 | MIEDX |
| Annual Shareholder Report | September 30, 2024 |
This annual shareholder report contains important information about the MassMutual International Equity Fund (the “Fund”) for the period of October 1, 2023 to September 30, 2024. You can find additional information about the Fund at https://www.massmutual.com/product-performance/mutual-funds. You can also request this information by contacting us at 1-888-309-3539 or by sending an email request to fundinfo@massmutual.com.
This report describes changes to the Fund that occurred during the reporting period.
WHAT WERE THE FUND COSTS FOR THE LAST YEAR?
This example shows the expenses you would have paid over the past year, based on a hypothetical $10,000 investment. This table reflects any applicable waivers or expense limitations.
| | |
Class Name | Costs of a $10,000 investment | Costs paid as a percentage of a $10,000 investment |
| Class R5 | $130 | 1.17% |
HOW DID THE FUND PERFORM?
Global equity markets advanced sharply as they weathered the unsettled geopolitical climate and higher interest rate environment well.
Geopolitical tensions remained high amid continued and escalating conflicts in Ukraine and the Middle East. In the U.S., the Federal Reserve continued its attempts to engineer a ‘soft landing’ and delivered a long-awaited cut in interest rates, with a 50bps cut in September. Domestic stocks advanced over the trailing 12-months as growth outperformed value and large cap shares outperformed their small cap counterparts in the period. U.S. large cap stocks outperformed their foreign counterparts, while shares in emerging markets outperformed developed non-U.S. markets.
Top contributors to the Fund’s performance relative to the MSCI ACWI ex USA:
• Stock selection within the industrials sector, where overweight allocations to Experian PLC and Assa Abloy AB were particularly impactful
• Stock selection in consumer discretionary as well as an underweight position to the sector, which trailed the benchmark in the period
Top detractors to the Fund’s performance relative to the MSCI ACWI ex USA:
• An overweight position and poor stock selection in the consumer staples sector, which was the second worst performing sector in the period
• An underweight allocation and poor stock selection in the financials sector
Performance shown is past performance and does not guarantee future results. The graph and table below do not reflect the deduction of taxes that a shareholder would pay on Fund distributions or redemption of Fund shares. The graph and table below assume reinvestment of dividends and capital gain distributions.
GROWTH OF A HYPOTHETICAL $10,000 INVESTMENT (October 1, 2014 through September 30, 2024)
This graph shows the performance of a hypothetical $10,000 investment in the share class noted over a ten-year period or since inception, if shorter, as compared to the performance of a broad-based securities market index, and, if applicable, one or more indexes that MML Investment Advisers, LLC believes more closely reflects the market segments in which the Fund invests or is a better comparison for the Fund’s investment strategy. This graph includes the deduction of the maximum applicable sales charge, if any.
| MM202912-309770 | PAGE 1 | TSR-AR-IT2C1 |
The index or indexes shown above are unmanaged, cannot be purchased directly, and, with the exception of any peer group index, do not incur expenses.
AVERAGE ANNUAL TOTAL RETURNS (%) (as of September 30, 2024)
| | | |
| | 1 Year | 5 Year | 10 Year |
Class R5 - without sales charge | 21.73 | 8.94 | 5.91 |
MSCI ACWI ex USA | 25.35 | 7.59 | 5.22 |
Performance results reflect any applicable waivers or expense limitations in effect during these periods, without which performance would have been lower. The investment return and principal value of shares of the Fund fluctuate, so your shares, when sold, may be worth more or less than their original cost. Current performance of the Fund may be lower or higher than the performance quoted. Performance data current to the most recent month-end may be obtained at https://www.massmutual.com/product-performance/mutual-funds or by calling 1-888-309-3539 or by sending an email request to fundinfo@massmutual.com.
WHAT ARE SOME KEY FUND STATISTICS? (as of September 30, 2024)
| |
Total Net Assets (Millions) | $120.5 |
Total Number of Portfolio Holdings (includes derivative positions, if any) | 138 |
Total Advisory Fees Paid During the Reporting Period | $923,211 |
Portfolio Turnover Rate | 25% |
WHAT DID THE FUND INVEST IN? (as of September 30, 2024)
Derivative values, if any, are excluded from the table(s) below.
| |
Largest Holdings
(% of Total Investments) | |
Symrise AG | 2.9% |
Capgemini SE | 2.8% |
Experian PLC | 2.7% |
Merck KGaA | 2.6% |
Roche Holding AG | 2.6% |
Intact Financial Corp. | 2.6% |
Sika AG Registered | 2.6% |
Nestle SA Registered | 2.5% |
Canadian National Railway Co. | 2.4% |
Novartis AG Registered | 2.4% |
| |
Sectors
(% of Total Investments) | |
Industrials | 18.1% |
Health Care | 18.0% |
Consumer Staples | 16.8% |
Financials | 11.8% |
Materials | 9.2% |
Information Technology | 7.4% |
Consumer Discretionary | 7.2% |
Energy | 2.4% |
Utilities | 2.4% |
Communication Services | 1.9% |
Real Estate | 0.2% |
| |
Largest Countries
(% of Total Investments) | |
United Kingdom | 17.1% |
Japan | 15.2% |
United States | 14.6% |
France | 8.6% |
Germany | 8.1% |
Switzerland | 7.1% |
Canada | 5.1% |
Spain | 3.8% |
Netherlands | 3.2% |
Hong Kong | 3.1% |
| MM202912-309770 | PAGE 2 | TSR-AR-IT2C1 |
HOW HAS THE FUND CHANGED?
The following is a summary of certain changes to the Fund since October 1, 2023. For more complete information, you may review the Fund’s prospectus, including any applicable supplements, at https://www.massmutual.com/product-performance/mutual-funds or upon request at 1-888-309-3539 or fundinfo@massmutual.com.
Effective February 1, 2024, the annual rate for administrative services for Class A shares of the Fund was reduced from 0.30% to 0.25%.
| |
| WHERE CAN I FIND ADDITIONAL INFORMATION ABOUT THE FUND? |
For additional information about the Fund, including its prospectus, financial information, holdings, and proxy voting information, scan the QR code or visit https://www.massmutual.com/product-performance/mutual-funds. |
| MM202912-309770 | PAGE 3 | TSR-AR-IT2C1 |
10000968310537121671188511573130941542312420145911776110000878495971147911681115381188414726110201326716630
| | |
MassMutual International Equity Fund | |
| Service Class | MYIEX |
| Annual Shareholder Report | September 30, 2024 |
This annual shareholder report contains important information about the MassMutual International Equity Fund (the “Fund”) for the period of October 1, 2023 to September 30, 2024. You can find additional information about the Fund at https://www.massmutual.com/product-performance/mutual-funds. You can also request this information by contacting us at 1-888-309-3539 or by sending an email request to fundinfo@massmutual.com.
This report describes changes to the Fund that occurred during the reporting period.
WHAT WERE THE FUND COSTS FOR THE LAST YEAR?
This example shows the expenses you would have paid over the past year, based on a hypothetical $10,000 investment. This table reflects any applicable waivers or expense limitations.
| | |
Class Name | Costs of a $10,000 investment | Costs paid as a percentage of a $10,000 investment |
| Service Class | $141 | 1.27% |
HOW DID THE FUND PERFORM?
Global equity markets advanced sharply as they weathered the unsettled geopolitical climate and higher interest rate environment well.
Geopolitical tensions remained high amid continued and escalating conflicts in Ukraine and the Middle East. In the U.S., the Federal Reserve continued its attempts to engineer a ‘soft landing’ and delivered a long-awaited cut in interest rates, with a 50bps cut in September. Domestic stocks advanced over the trailing 12-months as growth outperformed value and large cap shares outperformed their small cap counterparts in the period. U.S. large cap stocks outperformed their foreign counterparts, while shares in emerging markets outperformed developed non-U.S. markets.
Top contributors to the Fund’s performance relative to the MSCI ACWI ex USA:
• Stock selection within the industrials sector, where overweight allocations to Experian PLC and Assa Abloy AB were particularly impactful
• Stock selection in consumer discretionary as well as an underweight position to the sector, which trailed the benchmark in the period
Top detractors to the Fund’s performance relative to the MSCI ACWI ex USA:
• An overweight position and poor stock selection in the consumer staples sector, which was the second worst performing sector in the period
• An underweight allocation and poor stock selection in the financials sector
Performance shown is past performance and does not guarantee future results. The graph and table below do not reflect the deduction of taxes that a shareholder would pay on Fund distributions or redemption of Fund shares. The graph and table below assume reinvestment of dividends and capital gain distributions.
GROWTH OF A HYPOTHETICAL $10,000 INVESTMENT (October 1, 2014 through September 30, 2024)
This graph shows the performance of a hypothetical $10,000 investment in the share class noted over a ten-year period or since inception, if shorter, as compared to the performance of a broad-based securities market index, and, if applicable, one or more indexes that MML Investment Advisers, LLC believes more closely reflects the market segments in which the Fund invests or is a better comparison for the Fund’s investment strategy. This graph includes the deduction of the maximum applicable sales charge, if any.
| MM202912-309770 | PAGE 1 | TSR-AR-IT2C3 |
The index or indexes shown above are unmanaged, cannot be purchased directly, and, with the exception of any peer group index, do not incur expenses.
AVERAGE ANNUAL TOTAL RETURNS (%) (as of September 30, 2024)
| | | |
| | 1 Year | 5 Year | 10 Year |
Service Class - without sales charge | 21.67 | 8.83 | 5.81 |
MSCI ACWI ex USA | 25.35 | 7.59 | 5.22 |
Performance results reflect any applicable waivers or expense limitations in effect during these periods, without which performance would have been lower. The investment return and principal value of shares of the Fund fluctuate, so your shares, when sold, may be worth more or less than their original cost. Current performance of the Fund may be lower or higher than the performance quoted. Performance data current to the most recent month-end may be obtained at https://www.massmutual.com/product-performance/mutual-funds or by calling 1-888-309-3539 or by sending an email request to fundinfo@massmutual.com.
WHAT ARE SOME KEY FUND STATISTICS? (as of September 30, 2024)
| |
Total Net Assets (Millions) | $120.5 |
Total Number of Portfolio Holdings (includes derivative positions, if any) | 138 |
Total Advisory Fees Paid During the Reporting Period | $923,211 |
Portfolio Turnover Rate | 25% |
WHAT DID THE FUND INVEST IN? (as of September 30, 2024)
Derivative values, if any, are excluded from the table(s) below.
| |
Largest Holdings
(% of Total Investments) | |
Symrise AG | 2.9% |
Capgemini SE | 2.8% |
Experian PLC | 2.7% |
Merck KGaA | 2.6% |
Roche Holding AG | 2.6% |
Intact Financial Corp. | 2.6% |
Sika AG Registered | 2.6% |
Nestle SA Registered | 2.5% |
Canadian National Railway Co. | 2.4% |
Novartis AG Registered | 2.4% |
| |
Sectors
(% of Total Investments) | |
Industrials | 18.1% |
Health Care | 18.0% |
Consumer Staples | 16.8% |
Financials | 11.8% |
Materials | 9.2% |
Information Technology | 7.4% |
Consumer Discretionary | 7.2% |
Energy | 2.4% |
Utilities | 2.4% |
Communication Services | 1.9% |
Real Estate | 0.2% |
| |
Largest Countries
(% of Total Investments) | |
United Kingdom | 17.1% |
Japan | 15.2% |
United States | 14.6% |
France | 8.6% |
Germany | 8.1% |
Switzerland | 7.1% |
Canada | 5.1% |
Spain | 3.8% |
Netherlands | 3.2% |
Hong Kong | 3.1% |
| MM202912-309770 | PAGE 2 | TSR-AR-IT2C3 |
HOW HAS THE FUND CHANGED?
The following is a summary of certain changes to the Fund since October 1, 2023. For more complete information, you may review the Fund’s prospectus, including any applicable supplements, at https://www.massmutual.com/product-performance/mutual-funds or upon request at 1-888-309-3539 or fundinfo@massmutual.com.
Effective February 1, 2024, the annual rate for administrative services for Class A shares of the Fund was reduced from 0.30% to 0.25%.
| |
| WHERE CAN I FIND ADDITIONAL INFORMATION ABOUT THE FUND? |
For additional information about the Fund, including its prospectus, financial information, holdings, and proxy voting information, scan the QR code or visit https://www.massmutual.com/product-performance/mutual-funds. |
| MM202912-309770 | PAGE 3 | TSR-AR-IT2C3 |
10000968010519121311184911524130161532312331144601759310000878495971147911681115381188414726110201326716630
| | |
MassMutual International Equity Fund | |
| Administrative Class | MIELX |
| Annual Shareholder Report | September 30, 2024 |
This annual shareholder report contains important information about the MassMutual International Equity Fund (the “Fund”) for the period of October 1, 2023 to September 30, 2024. You can find additional information about the Fund at https://www.massmutual.com/product-performance/mutual-funds. You can also request this information by contacting us at 1-888-309-3539 or by sending an email request to fundinfo@massmutual.com.
This report describes changes to the Fund that occurred during the reporting period.
WHAT WERE THE FUND COSTS FOR THE LAST YEAR?
This example shows the expenses you would have paid over the past year, based on a hypothetical $10,000 investment. This table reflects any applicable waivers or expense limitations.
| | |
Class Name | Costs of a $10,000 investment | Costs paid as a percentage of a $10,000 investment |
| Administrative Class | $152 | 1.37% |
HOW DID THE FUND PERFORM?
Global equity markets advanced sharply as they weathered the unsettled geopolitical climate and higher interest rate environment well.
Geopolitical tensions remained high amid continued and escalating conflicts in Ukraine and the Middle East. In the U.S., the Federal Reserve continued its attempts to engineer a ‘soft landing’ and delivered a long-awaited cut in interest rates, with a 50bps cut in September. Domestic stocks advanced over the trailing 12-months as growth outperformed value and large cap shares outperformed their small cap counterparts in the period. U.S. large cap stocks outperformed their foreign counterparts, while shares in emerging markets outperformed developed non-U.S. markets.
Top contributors to the Fund’s performance relative to the MSCI ACWI ex USA:
• Stock selection within the industrials sector, where overweight allocations to Experian PLC and Assa Abloy AB were particularly impactful
• Stock selection in consumer discretionary as well as an underweight position to the sector, which trailed the benchmark in the period
Top detractors to the Fund’s performance relative to the MSCI ACWI ex USA:
• An overweight position and poor stock selection in the consumer staples sector, which was the second worst performing sector in the period
• An underweight allocation and poor stock selection in the financials sector
Performance shown is past performance and does not guarantee future results. The graph and table below do not reflect the deduction of taxes that a shareholder would pay on Fund distributions or redemption of Fund shares. The graph and table below assume reinvestment of dividends and capital gain distributions.
GROWTH OF A HYPOTHETICAL $10,000 INVESTMENT (October 1, 2014 through September 30, 2024)
This graph shows the performance of a hypothetical $10,000 investment in the share class noted over a ten-year period or since inception, if shorter, as compared to the performance of a broad-based securities market index, and, if applicable, one or more indexes that MML Investment Advisers, LLC believes more closely reflects the market segments in which the Fund invests or is a better comparison for the Fund’s investment strategy. This graph includes the deduction of the maximum applicable sales charge, if any.
| MM202912-309770 | PAGE 1 | TSR-AR-IT2C4 |
The index or indexes shown above are unmanaged, cannot be purchased directly, and, with the exception of any peer group index, do not incur expenses.
AVERAGE ANNUAL TOTAL RETURNS (%) (as of September 30, 2024)
| | | |
| | 1 Year | 5 Year | 10 Year |
Administrative Class - without sales charge | 21.49 | 8.72 | 5.71 |
MSCI ACWI ex USA | 25.35 | 7.59 | 5.22 |
Performance results reflect any applicable waivers or expense limitations in effect during these periods, without which performance would have been lower. The investment return and principal value of shares of the Fund fluctuate, so your shares, when sold, may be worth more or less than their original cost. Current performance of the Fund may be lower or higher than the performance quoted. Performance data current to the most recent month-end may be obtained at https://www.massmutual.com/product-performance/mutual-funds or by calling 1-888-309-3539 or by sending an email request to fundinfo@massmutual.com.
WHAT ARE SOME KEY FUND STATISTICS? (as of September 30, 2024)
| |
Total Net Assets (Millions) | $120.5 |
Total Number of Portfolio Holdings (includes derivative positions, if any) | 138 |
Total Advisory Fees Paid During the Reporting Period | $923,211 |
Portfolio Turnover Rate | 25% |
WHAT DID THE FUND INVEST IN? (as of September 30, 2024)
Derivative values, if any, are excluded from the table(s) below.
| |
Largest Holdings
(% of Total Investments) | |
Symrise AG | 2.9% |
Capgemini SE | 2.8% |
Experian PLC | 2.7% |
Merck KGaA | 2.6% |
Roche Holding AG | 2.6% |
Intact Financial Corp. | 2.6% |
Sika AG Registered | 2.6% |
Nestle SA Registered | 2.5% |
Canadian National Railway Co. | 2.4% |
Novartis AG Registered | 2.4% |
| |
Sectors
(% of Total Investments) | |
Industrials | 18.1% |
Health Care | 18.0% |
Consumer Staples | 16.8% |
Financials | 11.8% |
Materials | 9.2% |
Information Technology | 7.4% |
Consumer Discretionary | 7.2% |
Energy | 2.4% |
Utilities | 2.4% |
Communication Services | 1.9% |
Real Estate | 0.2% |
| |
Largest Countries
(% of Total Investments) | |
United Kingdom | 17.1% |
Japan | 15.2% |
United States | 14.6% |
France | 8.6% |
Germany | 8.1% |
Switzerland | 7.1% |
Canada | 5.1% |
Spain | 3.8% |
Netherlands | 3.2% |
Hong Kong | 3.1% |
| MM202912-309770 | PAGE 2 | TSR-AR-IT2C4 |
HOW HAS THE FUND CHANGED?
The following is a summary of certain changes to the Fund since October 1, 2023. For more complete information, you may review the Fund’s prospectus, including any applicable supplements, at https://www.massmutual.com/product-performance/mutual-funds or upon request at 1-888-309-3539 or fundinfo@massmutual.com.
Effective February 1, 2024, the annual rate for administrative services for Class A shares of the Fund was reduced from 0.30% to 0.25%.
| |
| WHERE CAN I FIND ADDITIONAL INFORMATION ABOUT THE FUND? |
For additional information about the Fund, including its prospectus, financial information, holdings, and proxy voting information, scan the QR code or visit https://www.massmutual.com/product-performance/mutual-funds. |
| MM202912-309770 | PAGE 3 | TSR-AR-IT2C4 |
10000967210503120991179811471129401521712234143401742210000878495971147911681115381188414726110201326716630
| | |
MassMutual International Equity Fund | |
| Class R4 | MEIRX |
| Annual Shareholder Report | September 30, 2024 |
This annual shareholder report contains important information about the MassMutual International Equity Fund (the “Fund”) for the period of October 1, 2023 to September 30, 2024. You can find additional information about the Fund at https://www.massmutual.com/product-performance/mutual-funds. You can also request this information by contacting us at 1-888-309-3539 or by sending an email request to fundinfo@massmutual.com.
This report describes changes to the Fund that occurred during the reporting period.
WHAT WERE THE FUND COSTS FOR THE LAST YEAR?
This example shows the expenses you would have paid over the past year, based on a hypothetical $10,000 investment. This table reflects any applicable waivers or expense limitations.
| | |
Class Name | Costs of a $10,000 investment | Costs paid as a percentage of a $10,000 investment |
| Class R4 | $168 | 1.52% |
HOW DID THE FUND PERFORM?
Global equity markets advanced sharply as they weathered the unsettled geopolitical climate and higher interest rate environment well.
Geopolitical tensions remained high amid continued and escalating conflicts in Ukraine and the Middle East. In the U.S., the Federal Reserve continued its attempts to engineer a ‘soft landing’ and delivered a long-awaited cut in interest rates, with a 50bps cut in September. Domestic stocks advanced over the trailing 12-months as growth outperformed value and large cap shares outperformed their small cap counterparts in the period. U.S. large cap stocks outperformed their foreign counterparts, while shares in emerging markets outperformed developed non-U.S. markets.
Top contributors to the Fund’s performance relative to the MSCI ACWI ex USA:
• Stock selection within the industrials sector, where overweight allocations to Experian PLC and Assa Abloy AB were particularly impactful
• Stock selection in consumer discretionary as well as an underweight position to the sector, which trailed the benchmark in the period
Top detractors to the Fund’s performance relative to the MSCI ACWI ex USA:
• An overweight position and poor stock selection in the consumer staples sector, which was the second worst performing sector in the period
• An underweight allocation and poor stock selection in the financials sector
Performance shown is past performance and does not guarantee future results. The graph and table below do not reflect the deduction of taxes that a shareholder would pay on Fund distributions or redemption of Fund shares. The graph and table below assume reinvestment of dividends and capital gain distributions.
GROWTH OF A HYPOTHETICAL $10,000 INVESTMENT (October 1, 2014 through September 30, 2024)
This graph shows the performance of a hypothetical $10,000 investment in the share class noted over a ten-year period or since inception, if shorter, as compared to the performance of a broad-based securities market index, and, if applicable, one or more indexes that MML Investment Advisers, LLC believes more closely reflects the market segments in which the Fund invests or is a better comparison for the Fund’s investment strategy. This graph includes the deduction of the maximum applicable sales charge, if any.
| MM202912-309770 | PAGE 1 | TSR-AR-IT2CK |
The index or indexes shown above are unmanaged, cannot be purchased directly, and, with the exception of any peer group index, do not incur expenses.
AVERAGE ANNUAL TOTAL RETURNS (%) (as of September 30, 2024)
| | | |
| | 1 Year | 5 Year | 10 Year |
Class R4 - without sales charge | 21.29 | 8.54 | 5.54 |
MSCI ACWI ex USA | 25.35 | 7.59 | 5.22 |
Performance results reflect any applicable waivers or expense limitations in effect during these periods, without which performance would have been lower. The investment return and principal value of shares of the Fund fluctuate, so your shares, when sold, may be worth more or less than their original cost. Current performance of the Fund may be lower or higher than the performance quoted. Performance data current to the most recent month-end may be obtained at https://www.massmutual.com/product-performance/mutual-funds or by calling 1-888-309-3539 or by sending an email request to fundinfo@massmutual.com.
WHAT ARE SOME KEY FUND STATISTICS? (as of September 30, 2024)
| |
Total Net Assets (Millions) | $120.5 |
Total Number of Portfolio Holdings (includes derivative positions, if any) | 138 |
Total Advisory Fees Paid During the Reporting Period | $923,211 |
Portfolio Turnover Rate | 25% |
WHAT DID THE FUND INVEST IN? (as of September 30, 2024)
Derivative values, if any, are excluded from the table(s) below.
| |
Largest Holdings
(% of Total Investments) | |
Symrise AG | 2.9% |
Capgemini SE | 2.8% |
Experian PLC | 2.7% |
Merck KGaA | 2.6% |
Roche Holding AG | 2.6% |
Intact Financial Corp. | 2.6% |
Sika AG Registered | 2.6% |
Nestle SA Registered | 2.5% |
Canadian National Railway Co. | 2.4% |
Novartis AG Registered | 2.4% |
| |
Sectors
(% of Total Investments) | |
Industrials | 18.1% |
Health Care | 18.0% |
Consumer Staples | 16.8% |
Financials | 11.8% |
Materials | 9.2% |
Information Technology | 7.4% |
Consumer Discretionary | 7.2% |
Energy | 2.4% |
Utilities | 2.4% |
Communication Services | 1.9% |
Real Estate | 0.2% |
| |
Largest Countries
(% of Total Investments) | |
United Kingdom | 17.1% |
Japan | 15.2% |
United States | 14.6% |
France | 8.6% |
Germany | 8.1% |
Switzerland | 7.1% |
Canada | 5.1% |
Spain | 3.8% |
Netherlands | 3.2% |
Hong Kong | 3.1% |
| MM202912-309770 | PAGE 2 | TSR-AR-IT2CK |
HOW HAS THE FUND CHANGED?
The following is a summary of certain changes to the Fund since October 1, 2023. For more complete information, you may review the Fund’s prospectus, including any applicable supplements, at https://www.massmutual.com/product-performance/mutual-funds or upon request at 1-888-309-3539 or fundinfo@massmutual.com.
Effective February 1, 2024, the annual rate for administrative services for Class A shares of the Fund was reduced from 0.30% to 0.25%.
| |
| WHERE CAN I FIND ADDITIONAL INFORMATION ABOUT THE FUND? |
For additional information about the Fund, including its prospectus, financial information, holdings, and proxy voting information, scan the QR code or visit https://www.massmutual.com/product-performance/mutual-funds. |
| MM202912-309770 | PAGE 3 | TSR-AR-IT2CK |
10000965410467120481173111385128321506512099141421715310000878495971147911681115381188414726110201326716630
| | |
MassMutual International Equity Fund | |
| Class A | MMIAX |
| Annual Shareholder Report | September 30, 2024 |
This annual shareholder report contains important information about the MassMutual International Equity Fund (the “Fund”) for the period of October 1, 2023 to September 30, 2024. You can find additional information about the Fund at https://www.massmutual.com/product-performance/mutual-funds. You can also request this information by contacting us at 1-888-309-3539 or by sending an email request to fundinfo@massmutual.com.
This report describes changes to the Fund that occurred during the reporting period.
WHAT WERE THE FUND COSTS FOR THE LAST YEAR?
This example shows the expenses you would have paid over the past year, based on a hypothetical $10,000 investment. This table reflects any applicable waivers or expense limitations.
| | |
Class Name | Costs of a $10,000 investment | Costs paid as a percentage of a $10,000 investment |
| Class A | $176 | 1.59% |
HOW DID THE FUND PERFORM?
Global equity markets advanced sharply as they weathered the unsettled geopolitical climate and higher interest rate environment well.
Geopolitical tensions remained high amid continued and escalating conflicts in Ukraine and the Middle East. In the U.S., the Federal Reserve continued its attempts to engineer a ‘soft landing’ and delivered a long-awaited cut in interest rates, with a 50bps cut in September. Domestic stocks advanced over the trailing 12-months as growth outperformed value and large cap shares outperformed their small cap counterparts in the period. U.S. large cap stocks outperformed their foreign counterparts, while shares in emerging markets outperformed developed non-U.S. markets.
Top contributors to the Fund’s performance relative to the MSCI ACWI ex USA:
• Stock selection within the industrials sector, where overweight allocations to Experian PLC and Assa Abloy AB were particularly impactful
• Stock selection in consumer discretionary as well as an underweight position to the sector, which trailed the benchmark in the period
Top detractors to the Fund’s performance relative to the MSCI ACWI ex USA:
• An overweight position and poor stock selection in the consumer staples sector, which was the second worst performing sector in the period
• An underweight allocation and poor stock selection in the financials sector
Performance shown is past performance and does not guarantee future results. The graph and table below do not reflect the deduction of taxes that a shareholder would pay on Fund distributions or redemption of Fund shares. The graph and table below assume reinvestment of dividends and capital gain distributions.
GROWTH OF A HYPOTHETICAL $10,000 INVESTMENT (October 1, 2014 through September 30, 2024)
This graph shows the performance of a hypothetical $10,000 investment in the share class noted over a ten-year period or since inception, if shorter, as compared to the performance of a broad-based securities market index, and, if applicable, one or more indexes that MML Investment Advisers, LLC believes more closely reflects the market segments in which the Fund invests or is a better comparison for the Fund’s investment strategy. This graph includes the deduction of the maximum applicable sales charge, if any.
| MM202912-309770 | PAGE 1 | TSR-AR-IT2C2 |
The index or indexes shown above are unmanaged, cannot be purchased directly, and, with the exception of any peer group index, do not incur expenses.
AVERAGE ANNUAL TOTAL RETURNS (%) (as of September 30, 2024)
| | | |
| | 1 Year | 5 Year | 10 Year |
Class A - without sales charge | 21.26 | 8.47 | 5.44 |
Class A - with maximum sales charge | 14.59 | 7.25 | 4.85 |
MSCI ACWI ex USA | 25.35 | 7.59 | 5.22 |
Performance results reflect any applicable waivers or expense limitations in effect during these periods, without which performance would have been lower. The investment return and principal value of shares of the Fund fluctuate, so your shares, when sold, may be worth more or less than their original cost. Current performance of the Fund may be lower or higher than the performance quoted. Performance data current to the most recent month-end may be obtained at https://www.massmutual.com/product-performance/mutual-funds or by calling 1-888-309-3539 or by sending an email request to fundinfo@massmutual.com.
WHAT ARE SOME KEY FUND STATISTICS? (as of September 30, 2024)
| |
Total Net Assets (Millions) | $120.5 |
Total Number of Portfolio Holdings (includes derivative positions, if any) | 138 |
Total Advisory Fees Paid During the Reporting Period | $923,211 |
Portfolio Turnover Rate | 25% |
WHAT DID THE FUND INVEST IN? (as of September 30, 2024)
Derivative values, if any, are excluded from the table(s) below.
| |
Largest Holdings
(% of Total Investments) | |
Symrise AG | 2.9% |
Capgemini SE | 2.8% |
Experian PLC | 2.7% |
Merck KGaA | 2.6% |
Roche Holding AG | 2.6% |
Intact Financial Corp. | 2.6% |
Sika AG Registered | 2.6% |
Nestle SA Registered | 2.5% |
Canadian National Railway Co. | 2.4% |
Novartis AG Registered | 2.4% |
| |
Sectors
(% of Total Investments) | |
Industrials | 18.1% |
Health Care | 18.0% |
Consumer Staples | 16.8% |
Financials | 11.8% |
Materials | 9.2% |
Information Technology | 7.4% |
Consumer Discretionary | 7.2% |
Energy | 2.4% |
Utilities | 2.4% |
Communication Services | 1.9% |
Real Estate | 0.2% |
| |
Largest Countries
(% of Total Investments) | |
United Kingdom | 17.1% |
Japan | 15.2% |
United States | 14.6% |
France | 8.6% |
Germany | 8.1% |
Switzerland | 7.1% |
Canada | 5.1% |
Spain | 3.8% |
Netherlands | 3.2% |
Hong Kong | 3.1% |
| MM202912-309770 | PAGE 2 | TSR-AR-IT2C2 |
HOW HAS THE FUND CHANGED?
The following is a summary of certain changes to the Fund since October 1, 2023. For more complete information, you may review the Fund’s prospectus, including any applicable supplements, at https://www.massmutual.com/product-performance/mutual-funds or upon request at 1-888-309-3539 or fundinfo@massmutual.com.
Effective February 1, 2024, the annual rate for administrative services for Class A shares of the Fund was reduced from 0.30% to 0.25%.
| |
| WHERE CAN I FIND ADDITIONAL INFORMATION ABOUT THE FUND? |
For additional information about the Fund, including its prospectus, financial information, holdings, and proxy voting information, scan the QR code or visit https://www.massmutual.com/product-performance/mutual-funds. |
| MM202912-309770 | PAGE 3 | TSR-AR-IT2C2 |
945091159867113421103510694120431412611330132411605610000878495971147911681115381188414726110201326716630
| | |
MassMutual International Equity Fund | |
| Class R3 | MEERX |
| Annual Shareholder Report | September 30, 2024 |
This annual shareholder report contains important information about the MassMutual International Equity Fund (the “Fund”) for the period of October 1, 2023 to September 30, 2024. You can find additional information about the Fund at https://www.massmutual.com/product-performance/mutual-funds. You can also request this information by contacting us at 1-888-309-3539 or by sending an email request to fundinfo@massmutual.com.
This report describes changes to the Fund that occurred during the reporting period.
WHAT WERE THE FUND COSTS FOR THE LAST YEAR?
This example shows the expenses you would have paid over the past year, based on a hypothetical $10,000 investment. This table reflects any applicable waivers or expense limitations.
| | |
Class Name | Costs of a $10,000 investment | Costs paid as a percentage of a $10,000 investment |
| Class R3 | $197 | 1.78% |
HOW DID THE FUND PERFORM?
Global equity markets advanced sharply as they weathered the unsettled geopolitical climate and higher interest rate environment well.
Geopolitical tensions remained high amid continued and escalating conflicts in Ukraine and the Middle East. In the U.S., the Federal Reserve continued its attempts to engineer a ‘soft landing’ and delivered a long-awaited cut in interest rates, with a 50bps cut in September. Domestic stocks advanced over the trailing 12-months as growth outperformed value and large cap shares outperformed their small cap counterparts in the period. U.S. large cap stocks outperformed their foreign counterparts, while shares in emerging markets outperformed developed non-U.S. markets.
Top contributors to the Fund’s performance relative to the MSCI ACWI ex USA:
• Stock selection within the industrials sector, where overweight allocations to Experian PLC and Assa Abloy AB were particularly impactful
• Stock selection in consumer discretionary as well as an underweight position to the sector, which trailed the benchmark in the period
Top detractors to the Fund’s performance relative to the MSCI ACWI ex USA:
• An overweight position and poor stock selection in the consumer staples sector, which was the second worst performing sector in the period
• An underweight allocation and poor stock selection in the financials sector
Performance shown is past performance and does not guarantee future results. The graph and table below do not reflect the deduction of taxes that a shareholder would pay on Fund distributions or redemption of Fund shares. The graph and table below assume reinvestment of dividends and capital gain distributions.
GROWTH OF A HYPOTHETICAL $10,000 INVESTMENT (October 1, 2014 through September 30, 2024)
This graph shows the performance of a hypothetical $10,000 investment in the share class noted over a ten-year period or since inception, if shorter, as compared to the performance of a broad-based securities market index, and, if applicable, one or more indexes that MML Investment Advisers, LLC believes more closely reflects the market segments in which the Fund invests or is a better comparison for the Fund’s investment strategy. This graph includes the deduction of the maximum applicable sales charge, if any.
| MM202912-309770 | PAGE 1 | TSR-AR-IT2CJ |
The index or indexes shown above are unmanaged, cannot be purchased directly, and, with the exception of any peer group index, do not incur expenses.
AVERAGE ANNUAL TOTAL RETURNS (%) (as of September 30, 2024)
| | | |
| | 1 Year | 5 Year | 10 Year |
Class R3 - without sales charge | 21.07 | 8.29 | 5.28 |
MSCI ACWI ex USA | 25.35 | 7.59 | 5.22 |
Performance results reflect any applicable waivers or expense limitations in effect during these periods, without which performance would have been lower. The investment return and principal value of shares of the Fund fluctuate, so your shares, when sold, may be worth more or less than their original cost. Current performance of the Fund may be lower or higher than the performance quoted. Performance data current to the most recent month-end may be obtained at https://www.massmutual.com/product-performance/mutual-funds or by calling 1-888-309-3539 or by sending an email request to fundinfo@massmutual.com.
WHAT ARE SOME KEY FUND STATISTICS? (as of September 30, 2024)
| |
Total Net Assets (Millions) | $120.5 |
Total Number of Portfolio Holdings (includes derivative positions, if any) | 138 |
Total Advisory Fees Paid During the Reporting Period | $923,211 |
Portfolio Turnover Rate | 25% |
WHAT DID THE FUND INVEST IN? (as of September 30, 2024)
Derivative values, if any, are excluded from the table(s) below.
| |
Largest Holdings
(% of Total Investments) | |
Symrise AG | 2.9% |
Capgemini SE | 2.8% |
Experian PLC | 2.7% |
Merck KGaA | 2.6% |
Roche Holding AG | 2.6% |
Intact Financial Corp. | 2.6% |
Sika AG Registered | 2.6% |
Nestle SA Registered | 2.5% |
Canadian National Railway Co. | 2.4% |
Novartis AG Registered | 2.4% |
| |
Sectors
(% of Total Investments) | |
Industrials | 18.1% |
Health Care | 18.0% |
Consumer Staples | 16.8% |
Financials | 11.8% |
Materials | 9.2% |
Information Technology | 7.4% |
Consumer Discretionary | 7.2% |
Energy | 2.4% |
Utilities | 2.4% |
Communication Services | 1.9% |
Real Estate | 0.2% |
| |
Largest Countries
(% of Total Investments) | |
United Kingdom | 17.1% |
Japan | 15.2% |
United States | 14.6% |
France | 8.6% |
Germany | 8.1% |
Switzerland | 7.1% |
Canada | 5.1% |
Spain | 3.8% |
Netherlands | 3.2% |
Hong Kong | 3.1% |
| MM202912-309770 | PAGE 2 | TSR-AR-IT2CJ |
HOW HAS THE FUND CHANGED?
The following is a summary of certain changes to the Fund since October 1, 2023. For more complete information, you may review the Fund’s prospectus, including any applicable supplements, at https://www.massmutual.com/product-performance/mutual-funds or upon request at 1-888-309-3539 or fundinfo@massmutual.com.
Effective February 1, 2024, the annual rate for administrative services for Class A shares of the Fund was reduced from 0.30% to 0.25%.
| |
| WHERE CAN I FIND ADDITIONAL INFORMATION ABOUT THE FUND? |
For additional information about the Fund, including its prospectus, financial information, holdings, and proxy voting information, scan the QR code or visit https://www.massmutual.com/product-performance/mutual-funds. |
| MM202912-309770 | PAGE 3 | TSR-AR-IT2CJ |
10000962410416119551161011234126291478511847138201673210000878495971147911681115381188414726110201326716630
| | |
MassMutual International Equity Fund | |
| Class Y | MMOEX |
| Annual Shareholder Report | September 30, 2024 |
This annual shareholder report contains important information about the MassMutual International Equity Fund (the “Fund”) for the period of October 1, 2023 to September 30, 2024. You can find additional information about the Fund at https://www.massmutual.com/product-performance/mutual-funds. You can also request this information by contacting us at 1-888-309-3539 or by sending an email request to fundinfo@massmutual.com.
This report describes changes to the Fund that occurred during the reporting period.
WHAT WERE THE FUND COSTS FOR THE LAST YEAR?
This example shows the expenses you would have paid over the past year, based on a hypothetical $10,000 investment. This table reflects any applicable waivers or expense limitations.
| | |
Class Name | Costs of a $10,000 investment | Costs paid as a percentage of a $10,000 investment |
| Class Y | $130 | 1.17% |
HOW DID THE FUND PERFORM?
Global equity markets advanced sharply as they weathered the unsettled geopolitical climate and higher interest rate environment well.
Geopolitical tensions remained high amid continued and escalating conflicts in Ukraine and the Middle East. In the U.S., the Federal Reserve continued its attempts to engineer a ‘soft landing’ and delivered a long-awaited cut in interest rates, with a 50bps cut in September. Domestic stocks advanced over the trailing 12-months as growth outperformed value and large cap shares outperformed their small cap counterparts in the period. U.S. large cap stocks outperformed their foreign counterparts, while shares in emerging markets outperformed developed non-U.S. markets.
Top contributors to the Fund’s performance relative to the MSCI ACWI ex USA:
• Stock selection within the industrials sector, where overweight allocations to Experian PLC and Assa Abloy AB were particularly impactful
• Stock selection in consumer discretionary as well as an underweight position to the sector, which trailed the benchmark in the period
Top detractors to the Fund’s performance relative to the MSCI ACWI ex USA:
• An overweight position and poor stock selection in the consumer staples sector, which was the second worst performing sector in the period
• An underweight allocation and poor stock selection in the financials sector
Performance shown is past performance and does not guarantee future results. The graph and table below do not reflect the deduction of taxes that a shareholder would pay on Fund distributions or redemption of Fund shares. The graph and table below assume reinvestment of dividends and capital gain distributions.
GROWTH OF A HYPOTHETICAL $10,000 INVESTMENT (February 1, 2023 through September 30, 2024)
This graph shows the performance of a hypothetical $10,000 investment in the share class noted over a ten-year period or since inception, if shorter, as compared to the performance of a broad-based securities market index, and, if applicable, one or more indexes that MML Investment Advisers, LLC believes more closely reflects the market segments in which the Fund invests or is a better comparison for the Fund’s investment strategy. This graph includes the deduction of the maximum applicable sales charge, if any.
| MM202912-309770 | PAGE 1 | TSR-AR-IT2CY |
The index or indexes shown above are unmanaged, cannot be purchased directly, and, with the exception of any peer group index, do not incur expenses.
AVERAGE ANNUAL TOTAL RETURNS (%) (as of September 30, 2024)
| | |
| | 1 Year | Since Inception
(02/01/2023) |
Class Y - without sales charge | 21.75 | 9.86 |
MSCI ACWI ex USA | 25.35 | 12.77 |
Performance results reflect any applicable waivers or expense limitations in effect during these periods, without which performance would have been lower. The investment return and principal value of shares of the Fund fluctuate, so your shares, when sold, may be worth more or less than their original cost. Current performance of the Fund may be lower or higher than the performance quoted. Performance data current to the most recent month-end may be obtained at https://www.massmutual.com/product-performance/mutual-funds or by calling 1-888-309-3539 or by sending an email request to fundinfo@massmutual.com.
WHAT ARE SOME KEY FUND STATISTICS? (as of September 30, 2024)
| |
Total Net Assets (Millions) | $120.5 |
Total Number of Portfolio Holdings (includes derivative positions, if any) | 138 |
Total Advisory Fees Paid During the Reporting Period | $923,211 |
Portfolio Turnover Rate | 25% |
WHAT DID THE FUND INVEST IN? (as of September 30, 2024)
Derivative values, if any, are excluded from the table(s) below.
| |
Largest Holdings
(% of Total Investments) | |
Symrise AG | 2.9% |
Capgemini SE | 2.8% |
Experian PLC | 2.7% |
Merck KGaA | 2.6% |
Roche Holding AG | 2.6% |
Intact Financial Corp. | 2.6% |
Sika AG Registered | 2.6% |
Nestle SA Registered | 2.5% |
Canadian National Railway Co. | 2.4% |
Novartis AG Registered | 2.4% |
| |
Sectors
(% of Total Investments) | |
Industrials | 18.1% |
Health Care | 18.0% |
Consumer Staples | 16.8% |
Financials | 11.8% |
Materials | 9.2% |
Information Technology | 7.4% |
Consumer Discretionary | 7.2% |
Energy | 2.4% |
Utilities | 2.4% |
Communication Services | 1.9% |
Real Estate | 0.2% |
| |
Largest Countries
(% of Total Investments) | |
United Kingdom | 17.1% |
Japan | 15.2% |
United States | 14.6% |
France | 8.6% |
Germany | 8.1% |
Switzerland | 7.1% |
Canada | 5.1% |
Spain | 3.8% |
Netherlands | 3.2% |
Hong Kong | 3.1% |
| MM202912-309770 | PAGE 2 | TSR-AR-IT2CY |
HOW HAS THE FUND CHANGED?
The following is a summary of certain changes to the Fund since October 1, 2023. For more complete information, you may review the Fund’s prospectus, including any applicable supplements, at https://www.massmutual.com/product-performance/mutual-funds or upon request at 1-888-309-3539 or fundinfo@massmutual.com.
Effective February 1, 2024, the annual rate for administrative services for Class A shares of the Fund was reduced from 0.30% to 0.25%.
| |
| WHERE CAN I FIND ADDITIONAL INFORMATION ABOUT THE FUND? |
For additional information about the Fund, including its prospectus, financial information, holdings, and proxy voting information, scan the QR code or visit https://www.massmutual.com/product-performance/mutual-funds. |
| MM202912-309770 | PAGE 3 | TSR-AR-IT2CY |
1000096011169010000968012135
| | |
MassMutual Strategic Emerging Markets Fund | |
| Class I | MPZSX |
| Annual Shareholder Report | September 30, 2024 |
This annual shareholder report contains important information about the MassMutual Strategic Emerging Markets Fund (the “Fund”) for the period of October 1, 2023 to September 30, 2024. You can find additional information about the Fund at https://www.massmutual.com/product-performance/mutual-funds. You can also request this information by contacting us at 1-888-309-3539 or by sending an email request to fundinfo@massmutual.com.
This report describes changes to the Fund that occurred during the reporting period.
WHAT WERE THE FUND COSTS FOR THE LAST YEAR?
This example shows the expenses you would have paid over the past year, based on a hypothetical $10,000 investment. This table reflects any applicable waivers or expense limitations.
| | |
Class Name | Costs of a $10,000 investment | Costs paid as a percentage of a $10,000 investment |
| Class I | $124 | 1.15% |
HOW DID THE FUND PERFORM?
Global equity markets advanced sharply as they weathered the unsettled geopolitical climate and higher interest rate environment well.
Geopolitical tensions remained high amid continued and escalating conflicts in Ukraine and the Middle East. In the U.S., the Federal Reserve continued its attempts to engineer a ‘soft landing’ and delivered a long-awaited cut in interest rates, with a 50bps cut in September. Emerging Market stocks advanced over the trailing 12-months, outperforming their developed non-U.S. counterparts. The MSCI Emerging Markets Index benefitted from strong performance out of Taiwan and China during the period, which offset negative contributions from stocks in Mexico and Chile.
Top contributors to the Fund’s performance relative to the MSCI Emerging Markets Index:
• Stock selection in the materials sector, where an allocation to Grupo Mexico SAB was particularly impactful
• An underweight to real estate, which was the third worst performing sector in the period
Top detractors to the Fund’s performance relative to the MSCI Emerging Markets Index:
• Stock selection within the consumer discretionary sector, with Yum China Holdings, Inc. as the largest detractor
• Stock selection in the consumer staples and financials sectors
• A modest cash holding also detracted from performance as the index advanced significantly in the period
| MM202912-309770 | PAGE 1 | TSR-AR-ITJV6 |
Performance shown is past performance and does not guarantee future results. The graph and table below do not reflect the deduction of taxes that a shareholder would pay on Fund distributions or redemption of Fund shares. The graph and table below assume reinvestment of dividends and capital gain distributions.
GROWTH OF A HYPOTHETICAL $10,000 INVESTMENT (October 1, 2014 through September 30, 2024)
This graph shows the performance of a hypothetical $10,000 investment in the share class noted over a ten-year period or since inception, if shorter, as compared to the performance of a broad-based securities market index, and, if applicable, one or more indexes that MML Investment Advisers, LLC believes more closely reflects the market segments in which the Fund invests or is a better comparison for the Fund’s investment strategy. This graph includes the deduction of the maximum applicable sales charge, if any.
The index or indexes shown above are unmanaged, cannot be purchased directly, and, with the exception of any peer group index, do not incur expenses.
AVERAGE ANNUAL TOTAL RETURNS (%) (as of September 30, 2024)
| | | |
| | 1 Year | 5 Year | 10 Year |
Class I - without sales charge | 15.42 | 1.37 | 1.97 |
MSCI Emerging Markets Index | 26.05 | 5.75 | 4.02 |
Performance results reflect any applicable waivers or expense limitations in effect during these periods, without which performance would have been lower. The investment return and principal value of shares of the Fund fluctuate, so your shares, when sold, may be worth more or less than their original cost. Current performance of the Fund may be lower or higher than the performance quoted. Performance data current to the most recent month-end may be obtained at https://www.massmutual.com/product-performance/mutual-funds or by calling 1-888-309-3539 or by sending an email request to fundinfo@massmutual.com.
WHAT ARE SOME KEY FUND STATISTICS? (as of September 30, 2024)
| |
Total Net Assets (Millions) | $106.9 |
Total Number of Portfolio Holdings (includes derivative positions, if any) | 83 |
Total Advisory Fees Paid During the Reporting Period | $1,026,058 |
Portfolio Turnover Rate | 62% |
| MM202912-309770 | PAGE 2 | TSR-AR-ITJV6 |
WHAT DID THE FUND INVEST IN? (as of September 30, 2024)
Derivative values, if any, are excluded from the table(s) below.
| |
Largest Holdings
(% of Total Investments) | |
Taiwan Semiconductor Manufacturing Co. Ltd. | 11.4% |
Tencent Holdings Ltd. | 5.7% |
H World Group Ltd. ADR | 5.1% |
Kotak Mahindra Bank Ltd. | 4.9% |
Samsung Electronics Co. Ltd. | 4.1% |
Fomento Economico Mexicano SAB de CV | 3.1% |
Meituan Class B | 3.0% |
HDFC Bank Ltd. | 2.9% |
Alibaba Group Holding Ltd. Sponsored ADR | 2.7% |
Tata Consultancy Services Ltd. | 2.5% |
| |
Sectors
(% of Total Investments) | |
Information Technology | 23.3% |
Consumer Discretionary | 17.9% |
Financials | 16.2% |
Communication Services | 8.5% |
Industrials | 8.2% |
Consumer Staples | 7.3% |
Health Care | 6.8% |
Energy | 4.0% |
Materials | 3.1% |
Real Estate | 2.5% |
| |
Largest Countries
(% of Total Investments) | |
China | 21.2% |
India | 16.6% |
Taiwan | 14.5% |
Mexico | 8.6% |
Republic of Korea | 7.0% |
Brazil | 5.5% |
France | 3.8% |
Italy | 3.1% |
Portugal | 2.1% |
Japan | 2.1% |
HOW HAS THE FUND CHANGED?
The following is a summary of certain changes to the Fund since October 1, 2023. For more complete information, you may review the Fund’s prospectus, including any applicable supplements, at https://www.massmutual.com/product-performance/mutual-funds or upon request at 1-888-309-3539 or fundinfo@massmutual.com.
Effective February 1, 2024, the annual rate for administrative services for Class A shares of the Fund was reduced from 0.30% to 0.25%, and the expense cap for Class A shares was adjusted from 1.70% to 1.65% to coincide with this change.
On or about January 24, 2025 (the “Termination Date”), the Fund is expected to be dissolved pursuant to a Plan of Liquidation and Termination approved by its Board of Trustees, and shareholders of the various classes of shares of the Fund will receive proceeds in proportion to the number of shares of such class held by each of them on the Termination Date.
| |
| WHERE CAN I FIND ADDITIONAL INFORMATION ABOUT THE FUND? |
For additional information about the Fund, including its prospectus, financial information, holdings, and proxy voting information, scan the QR code or visit https://www.massmutual.com/product-performance/mutual-funds. |
| MM202912-309770 | PAGE 3 | TSR-AR-ITJV6 |
100007687910710996110301135312516143349210105411215510000807294261154411450112191240114659105381177014837
| | |
MassMutual Strategic Emerging Markets Fund | |
| Class R5 | MPSMX |
| Annual Shareholder Report | September 30, 2024 |
This annual shareholder report contains important information about the MassMutual Strategic Emerging Markets Fund (the “Fund”) for the period of October 1, 2023 to September 30, 2024. You can find additional information about the Fund at https://www.massmutual.com/product-performance/mutual-funds. You can also request this information by contacting us at 1-888-309-3539 or by sending an email request to fundinfo@massmutual.com.
This report describes changes to the Fund that occurred during the reporting period.
WHAT WERE THE FUND COSTS FOR THE LAST YEAR?
This example shows the expenses you would have paid over the past year, based on a hypothetical $10,000 investment. This table reflects any applicable waivers or expense limitations.
| | |
Class Name | Costs of a $10,000 investment | Costs paid as a percentage of a $10,000 investment |
| Class R5 | $135 | 1.25% |
HOW DID THE FUND PERFORM?
Global equity markets advanced sharply as they weathered the unsettled geopolitical climate and higher interest rate environment well.
Geopolitical tensions remained high amid continued and escalating conflicts in Ukraine and the Middle East. In the U.S., the Federal Reserve continued its attempts to engineer a ‘soft landing’ and delivered a long-awaited cut in interest rates, with a 50bps cut in September. Emerging Market stocks advanced over the trailing 12-months, outperforming their developed non-U.S. counterparts. The MSCI Emerging Markets Index benefitted from strong performance out of Taiwan and China during the period, which offset negative contributions from stocks in Mexico and Chile.
Top contributors to the Fund’s performance relative to the MSCI Emerging Markets Index:
• Stock selection in the materials sector, where an allocation to Grupo Mexico SAB was particularly impactful
• An underweight to real estate, which was the third worst performing sector in the period
Top detractors to the Fund’s performance relative to the MSCI Emerging Markets Index:
• Stock selection within the consumer discretionary sector, with Yum China Holdings, Inc. as the largest detractor
• Stock selection in the consumer staples and financials sectors
• A modest cash holding also detracted from performance as the index advanced significantly in the period
| MM202912-309770 | PAGE 1 | TSR-AR-ITJV1 |
Performance shown is past performance and does not guarantee future results. The graph and table below do not reflect the deduction of taxes that a shareholder would pay on Fund distributions or redemption of Fund shares. The graph and table below assume reinvestment of dividends and capital gain distributions.
GROWTH OF A HYPOTHETICAL $10,000 INVESTMENT (October 1, 2014 through September 30, 2024)
This graph shows the performance of a hypothetical $10,000 investment in the share class noted over a ten-year period or since inception, if shorter, as compared to the performance of a broad-based securities market index, and, if applicable, one or more indexes that MML Investment Advisers, LLC believes more closely reflects the market segments in which the Fund invests or is a better comparison for the Fund’s investment strategy. This graph includes the deduction of the maximum applicable sales charge, if any.
The index or indexes shown above are unmanaged, cannot be purchased directly, and, with the exception of any peer group index, do not incur expenses.
AVERAGE ANNUAL TOTAL RETURNS (%) (as of September 30, 2024)
| | | |
| | 1 Year | 5 Year | 10 Year |
Class R5 - without sales charge | 15.31 | 1.28 | 1.86 |
MSCI Emerging Markets Index | 26.05 | 5.75 | 4.02 |
Performance results reflect any applicable waivers or expense limitations in effect during these periods, without which performance would have been lower. The investment return and principal value of shares of the Fund fluctuate, so your shares, when sold, may be worth more or less than their original cost. Current performance of the Fund may be lower or higher than the performance quoted. Performance data current to the most recent month-end may be obtained at https://www.massmutual.com/product-performance/mutual-funds or by calling 1-888-309-3539 or by sending an email request to fundinfo@massmutual.com.
WHAT ARE SOME KEY FUND STATISTICS? (as of September 30, 2024)
| |
Total Net Assets (Millions) | $106.9 |
Total Number of Portfolio Holdings (includes derivative positions, if any) | 83 |
Total Advisory Fees Paid During the Reporting Period | $1,026,058 |
Portfolio Turnover Rate | 62% |
| MM202912-309770 | PAGE 2 | TSR-AR-ITJV1 |
WHAT DID THE FUND INVEST IN? (as of September 30, 2024)
Derivative values, if any, are excluded from the table(s) below.
| |
Largest Holdings
(% of Total Investments) | |
Taiwan Semiconductor Manufacturing Co. Ltd. | 11.4% |
Tencent Holdings Ltd. | 5.7% |
H World Group Ltd. ADR | 5.1% |
Kotak Mahindra Bank Ltd. | 4.9% |
Samsung Electronics Co. Ltd. | 4.1% |
Fomento Economico Mexicano SAB de CV | 3.1% |
Meituan Class B | 3.0% |
HDFC Bank Ltd. | 2.9% |
Alibaba Group Holding Ltd. Sponsored ADR | 2.7% |
Tata Consultancy Services Ltd. | 2.5% |
| |
Sectors
(% of Total Investments) | |
Information Technology | 23.3% |
Consumer Discretionary | 17.9% |
Financials | 16.2% |
Communication Services | 8.5% |
Industrials | 8.2% |
Consumer Staples | 7.3% |
Health Care | 6.8% |
Energy | 4.0% |
Materials | 3.1% |
Real Estate | 2.5% |
| |
Largest Countries
(% of Total Investments) | |
China | 21.2% |
India | 16.6% |
Taiwan | 14.5% |
Mexico | 8.6% |
Republic of Korea | 7.0% |
Brazil | 5.5% |
France | 3.8% |
Italy | 3.1% |
Portugal | 2.1% |
Japan | 2.1% |
HOW HAS THE FUND CHANGED?
The following is a summary of certain changes to the Fund since October 1, 2023. For more complete information, you may review the Fund’s prospectus, including any applicable supplements, at https://www.massmutual.com/product-performance/mutual-funds or upon request at 1-888-309-3539 or fundinfo@massmutual.com.
Effective February 1, 2024, the annual rate for administrative services for Class A shares of the Fund was reduced from 0.30% to 0.25%, and the expense cap for Class A shares was adjusted from 1.70% to 1.65% to coincide with this change.
On or about January 24, 2025 (the “Termination Date”), the Fund is expected to be dissolved pursuant to a Plan of Liquidation and Termination approved by its Board of Trustees, and shareholders of the various classes of shares of the Fund will receive proceeds in proportion to the number of shares of such class held by each of them on the Termination Date.
| |
| WHERE CAN I FIND ADDITIONAL INFORMATION ABOUT THE FUND? |
For additional information about the Fund, including its prospectus, financial information, holdings, and proxy voting information, scan the QR code or visit https://www.massmutual.com/product-performance/mutual-funds. |
| MM202912-309770 | PAGE 3 | TSR-AR-ITJV1 |
100007680907910948109711128412430142179128104401202810000807294261154411450112191240114659105381177014837
| | |
MassMutual Strategic Emerging Markets Fund | |
| Service Class | MPEYX |
| Annual Shareholder Report | September 30, 2024 |
This annual shareholder report contains important information about the MassMutual Strategic Emerging Markets Fund (the “Fund”) for the period of October 1, 2023 to September 30, 2024. You can find additional information about the Fund at https://www.massmutual.com/product-performance/mutual-funds. You can also request this information by contacting us at 1-888-309-3539 or by sending an email request to fundinfo@massmutual.com.
This report describes changes to the Fund that occurred during the reporting period.
WHAT WERE THE FUND COSTS FOR THE LAST YEAR?
This example shows the expenses you would have paid over the past year, based on a hypothetical $10,000 investment. This table reflects any applicable waivers or expense limitations.
| | |
Class Name | Costs of a $10,000 investment | Costs paid as a percentage of a $10,000 investment |
| Service Class | $145 | 1.35% |
HOW DID THE FUND PERFORM?
Global equity markets advanced sharply as they weathered the unsettled geopolitical climate and higher interest rate environment well.
Geopolitical tensions remained high amid continued and escalating conflicts in Ukraine and the Middle East. In the U.S., the Federal Reserve continued its attempts to engineer a ‘soft landing’ and delivered a long-awaited cut in interest rates, with a 50bps cut in September. Emerging Market stocks advanced over the trailing 12-months, outperforming their developed non-U.S. counterparts. The MSCI Emerging Markets Index benefitted from strong performance out of Taiwan and China during the period, which offset negative contributions from stocks in Mexico and Chile.
Top contributors to the Fund’s performance relative to the MSCI Emerging Markets Index:
• Stock selection in the materials sector, where an allocation to Grupo Mexico SAB was particularly impactful
• An underweight to real estate, which was the third worst performing sector in the period
Top detractors to the Fund’s performance relative to the MSCI Emerging Markets Index:
• Stock selection within the consumer discretionary sector, with Yum China Holdings, Inc. as the largest detractor
• Stock selection in the consumer staples and financials sectors
• A modest cash holding also detracted from performance as the index advanced significantly in the period
| MM202912-309770 | PAGE 1 | TSR-AR-ITJV3 |
Performance shown is past performance and does not guarantee future results. The graph and table below do not reflect the deduction of taxes that a shareholder would pay on Fund distributions or redemption of Fund shares. The graph and table below assume reinvestment of dividends and capital gain distributions.
GROWTH OF A HYPOTHETICAL $10,000 INVESTMENT (October 1, 2014 through September 30, 2024)
This graph shows the performance of a hypothetical $10,000 investment in the share class noted over a ten-year period or since inception, if shorter, as compared to the performance of a broad-based securities market index, and, if applicable, one or more indexes that MML Investment Advisers, LLC believes more closely reflects the market segments in which the Fund invests or is a better comparison for the Fund’s investment strategy. This graph includes the deduction of the maximum applicable sales charge, if any.
The index or indexes shown above are unmanaged, cannot be purchased directly, and, with the exception of any peer group index, do not incur expenses.
AVERAGE ANNUAL TOTAL RETURNS (%) (as of September 30, 2024)
| | | |
| | 1 Year | 5 Year | 10 Year |
Service Class - without sales charge | 15.17 | 1.18 | 1.77 |
MSCI Emerging Markets Index | 26.05 | 5.75 | 4.02 |
Performance results reflect any applicable waivers or expense limitations in effect during these periods, without which performance would have been lower. The investment return and principal value of shares of the Fund fluctuate, so your shares, when sold, may be worth more or less than their original cost. Current performance of the Fund may be lower or higher than the performance quoted. Performance data current to the most recent month-end may be obtained at https://www.massmutual.com/product-performance/mutual-funds or by calling 1-888-309-3539 or by sending an email request to fundinfo@massmutual.com.
WHAT ARE SOME KEY FUND STATISTICS? (as of September 30, 2024)
| |
Total Net Assets (Millions) | $106.9 |
Total Number of Portfolio Holdings (includes derivative positions, if any) | 83 |
Total Advisory Fees Paid During the Reporting Period | $1,026,058 |
Portfolio Turnover Rate | 62% |
| MM202912-309770 | PAGE 2 | TSR-AR-ITJV3 |
WHAT DID THE FUND INVEST IN? (as of September 30, 2024)
Derivative values, if any, are excluded from the table(s) below.
| |
Largest Holdings
(% of Total Investments) | |
Taiwan Semiconductor Manufacturing Co. Ltd. | 11.4% |
Tencent Holdings Ltd. | 5.7% |
H World Group Ltd. ADR | 5.1% |
Kotak Mahindra Bank Ltd. | 4.9% |
Samsung Electronics Co. Ltd. | 4.1% |
Fomento Economico Mexicano SAB de CV | 3.1% |
Meituan Class B | 3.0% |
HDFC Bank Ltd. | 2.9% |
Alibaba Group Holding Ltd. Sponsored ADR | 2.7% |
Tata Consultancy Services Ltd. | 2.5% |
| |
Sectors
(% of Total Investments) | |
Information Technology | 23.3% |
Consumer Discretionary | 17.9% |
Financials | 16.2% |
Communication Services | 8.5% |
Industrials | 8.2% |
Consumer Staples | 7.3% |
Health Care | 6.8% |
Energy | 4.0% |
Materials | 3.1% |
Real Estate | 2.5% |
| |
Largest Countries
(% of Total Investments) | |
China | 21.2% |
India | 16.6% |
Taiwan | 14.5% |
Mexico | 8.6% |
Republic of Korea | 7.0% |
Brazil | 5.5% |
France | 3.8% |
Italy | 3.1% |
Portugal | 2.1% |
Japan | 2.1% |
HOW HAS THE FUND CHANGED?
The following is a summary of certain changes to the Fund since October 1, 2023. For more complete information, you may review the Fund’s prospectus, including any applicable supplements, at https://www.massmutual.com/product-performance/mutual-funds or upon request at 1-888-309-3539 or fundinfo@massmutual.com.
Effective February 1, 2024, the annual rate for administrative services for Class A shares of the Fund was reduced from 0.30% to 0.25%, and the expense cap for Class A shares was adjusted from 1.70% to 1.65% to coincide with this change.
On or about January 24, 2025 (the “Termination Date”), the Fund is expected to be dissolved pursuant to a Plan of Liquidation and Termination approved by its Board of Trustees, and shareholders of the various classes of shares of the Fund will receive proceeds in proportion to the number of shares of such class held by each of them on the Termination Date.
| |
| WHERE CAN I FIND ADDITIONAL INFORMATION ABOUT THE FUND? |
For additional information about the Fund, including its prospectus, financial information, holdings, and proxy voting information, scan the QR code or visit https://www.massmutual.com/product-performance/mutual-funds. |
| MM202912-309770 | PAGE 3 | TSR-AR-ITJV3 |
100007677906910921109311123612363141289072103451191510000807294261154411450112191240114659105381177014837
| | |
MassMutual Strategic Emerging Markets Fund | |
| Administrative Class | MPLSX |
| Annual Shareholder Report | September 30, 2024 |
This annual shareholder report contains important information about the MassMutual Strategic Emerging Markets Fund (the “Fund”) for the period of October 1, 2023 to September 30, 2024. You can find additional information about the Fund at https://www.massmutual.com/product-performance/mutual-funds. You can also request this information by contacting us at 1-888-309-3539 or by sending an email request to fundinfo@massmutual.com.
This report describes changes to the Fund that occurred during the reporting period.
WHAT WERE THE FUND COSTS FOR THE LAST YEAR?
This example shows the expenses you would have paid over the past year, based on a hypothetical $10,000 investment. This table reflects any applicable waivers or expense limitations.
| | |
Class Name | Costs of a $10,000 investment | Costs paid as a percentage of a $10,000 investment |
| Administrative Class | $156 | 1.45% |
HOW DID THE FUND PERFORM?
Global equity markets advanced sharply as they weathered the unsettled geopolitical climate and higher interest rate environment well.
Geopolitical tensions remained high amid continued and escalating conflicts in Ukraine and the Middle East. In the U.S., the Federal Reserve continued its attempts to engineer a ‘soft landing’ and delivered a long-awaited cut in interest rates, with a 50bps cut in September. Emerging Market stocks advanced over the trailing 12-months, outperforming their developed non-U.S. counterparts. The MSCI Emerging Markets Index benefitted from strong performance out of Taiwan and China during the period, which offset negative contributions from stocks in Mexico and Chile.
Top contributors to the Fund’s performance relative to the MSCI Emerging Markets Index:
• Stock selection in the materials sector, where an allocation to Grupo Mexico SAB was particularly impactful
• An underweight to real estate, which was the third worst performing sector in the period
Top detractors to the Fund’s performance relative to the MSCI Emerging Markets Index:
• Stock selection within the consumer discretionary sector, with Yum China Holdings, Inc. as the largest detractor
• Stock selection in the consumer staples and financials sectors
• A modest cash holding also detracted from performance as the index advanced significantly in the period
| MM202912-309770 | PAGE 1 | TSR-AR-ITJV4 |
Performance shown is past performance and does not guarantee future results. The graph and table below do not reflect the deduction of taxes that a shareholder would pay on Fund distributions or redemption of Fund shares. The graph and table below assume reinvestment of dividends and capital gain distributions.
GROWTH OF A HYPOTHETICAL $10,000 INVESTMENT (October 1, 2014 through September 30, 2024)
This graph shows the performance of a hypothetical $10,000 investment in the share class noted over a ten-year period or since inception, if shorter, as compared to the performance of a broad-based securities market index, and, if applicable, one or more indexes that MML Investment Advisers, LLC believes more closely reflects the market segments in which the Fund invests or is a better comparison for the Fund’s investment strategy. This graph includes the deduction of the maximum applicable sales charge, if any.
The index or indexes shown above are unmanaged, cannot be purchased directly, and, with the exception of any peer group index, do not incur expenses.
AVERAGE ANNUAL TOTAL RETURNS (%) (as of September 30, 2024)
| | | |
| | 1 Year | 5 Year | 10 Year |
Administrative Class - without sales charge | 15.02 | 1.07 | 1.67 |
MSCI Emerging Markets Index | 26.05 | 5.75 | 4.02 |
Performance results reflect any applicable waivers or expense limitations in effect during these periods, without which performance would have been lower. The investment return and principal value of shares of the Fund fluctuate, so your shares, when sold, may be worth more or less than their original cost. Current performance of the Fund may be lower or higher than the performance quoted. Performance data current to the most recent month-end may be obtained at https://www.massmutual.com/product-performance/mutual-funds or by calling 1-888-309-3539 or by sending an email request to fundinfo@massmutual.com.
WHAT ARE SOME KEY FUND STATISTICS? (as of September 30, 2024)
| |
Total Net Assets (Millions) | $106.9 |
Total Number of Portfolio Holdings (includes derivative positions, if any) | 83 |
Total Advisory Fees Paid During the Reporting Period | $1,026,058 |
Portfolio Turnover Rate | 62% |
| MM202912-309770 | PAGE 2 | TSR-AR-ITJV4 |
WHAT DID THE FUND INVEST IN? (as of September 30, 2024)
Derivative values, if any, are excluded from the table(s) below.
| |
Largest Holdings
(% of Total Investments) | |
Taiwan Semiconductor Manufacturing Co. Ltd. | 11.4% |
Tencent Holdings Ltd. | 5.7% |
H World Group Ltd. ADR | 5.1% |
Kotak Mahindra Bank Ltd. | 4.9% |
Samsung Electronics Co. Ltd. | 4.1% |
Fomento Economico Mexicano SAB de CV | 3.1% |
Meituan Class B | 3.0% |
HDFC Bank Ltd. | 2.9% |
Alibaba Group Holding Ltd. Sponsored ADR | 2.7% |
Tata Consultancy Services Ltd. | 2.5% |
| |
Sectors
(% of Total Investments) | |
Information Technology | 23.3% |
Consumer Discretionary | 17.9% |
Financials | 16.2% |
Communication Services | 8.5% |
Industrials | 8.2% |
Consumer Staples | 7.3% |
Health Care | 6.8% |
Energy | 4.0% |
Materials | 3.1% |
Real Estate | 2.5% |
| |
Largest Countries
(% of Total Investments) | |
China | 21.2% |
India | 16.6% |
Taiwan | 14.5% |
Mexico | 8.6% |
Republic of Korea | 7.0% |
Brazil | 5.5% |
France | 3.8% |
Italy | 3.1% |
Portugal | 2.1% |
Japan | 2.1% |
HOW HAS THE FUND CHANGED?
The following is a summary of certain changes to the Fund since October 1, 2023. For more complete information, you may review the Fund’s prospectus, including any applicable supplements, at https://www.massmutual.com/product-performance/mutual-funds or upon request at 1-888-309-3539 or fundinfo@massmutual.com.
Effective February 1, 2024, the annual rate for administrative services for Class A shares of the Fund was reduced from 0.30% to 0.25%, and the expense cap for Class A shares was adjusted from 1.70% to 1.65% to coincide with this change.
On or about January 24, 2025 (the “Termination Date”), the Fund is expected to be dissolved pursuant to a Plan of Liquidation and Termination approved by its Board of Trustees, and shareholders of the various classes of shares of the Fund will receive proceeds in proportion to the number of shares of such class held by each of them on the Termination Date.
| |
| WHERE CAN I FIND ADDITIONAL INFORMATION ABOUT THE FUND? |
For additional information about the Fund, including its prospectus, financial information, holdings, and proxy voting information, scan the QR code or visit https://www.massmutual.com/product-performance/mutual-funds. |
| MM202912-309770 | PAGE 3 | TSR-AR-ITJV4 |
100007668905010891108941118612292140329001102601180010000807294261154411450112191240114659105381177014837
| | |
MassMutual Strategic Emerging Markets Fund | |
| Class R4 | MPRSX |
| Annual Shareholder Report | September 30, 2024 |
This annual shareholder report contains important information about the MassMutual Strategic Emerging Markets Fund (the “Fund”) for the period of October 1, 2023 to September 30, 2024. You can find additional information about the Fund at https://www.massmutual.com/product-performance/mutual-funds. You can also request this information by contacting us at 1-888-309-3539 or by sending an email request to fundinfo@massmutual.com.
This report describes changes to the Fund that occurred during the reporting period.
WHAT WERE THE FUND COSTS FOR THE LAST YEAR?
This example shows the expenses you would have paid over the past year, based on a hypothetical $10,000 investment. This table reflects any applicable waivers or expense limitations.
| | |
Class Name | Costs of a $10,000 investment | Costs paid as a percentage of a $10,000 investment |
| Class R4 | $172 | 1.60% |
HOW DID THE FUND PERFORM?
Global equity markets advanced sharply as they weathered the unsettled geopolitical climate and higher interest rate environment well.
Geopolitical tensions remained high amid continued and escalating conflicts in Ukraine and the Middle East. In the U.S., the Federal Reserve continued its attempts to engineer a ‘soft landing’ and delivered a long-awaited cut in interest rates, with a 50bps cut in September. Emerging Market stocks advanced over the trailing 12-months, outperforming their developed non-U.S. counterparts. The MSCI Emerging Markets Index benefitted from strong performance out of Taiwan and China during the period, which offset negative contributions from stocks in Mexico and Chile.
Top contributors to the Fund’s performance relative to the MSCI Emerging Markets Index:
• Stock selection in the materials sector, where an allocation to Grupo Mexico SAB was particularly impactful
• An underweight to real estate, which was the third worst performing sector in the period
Top detractors to the Fund’s performance relative to the MSCI Emerging Markets Index:
• Stock selection within the consumer discretionary sector, with Yum China Holdings, Inc. as the largest detractor
• Stock selection in the consumer staples and financials sectors
• A modest cash holding also detracted from performance as the index advanced significantly in the period
| MM202912-309770 | PAGE 1 | TSR-AR-ITJVK |
Performance shown is past performance and does not guarantee future results. The graph and table below do not reflect the deduction of taxes that a shareholder would pay on Fund distributions or redemption of Fund shares. The graph and table below assume reinvestment of dividends and capital gain distributions.
GROWTH OF A HYPOTHETICAL $10,000 INVESTMENT (October 1, 2014 through September 30, 2024)
This graph shows the performance of a hypothetical $10,000 investment in the share class noted over a ten-year period or since inception, if shorter, as compared to the performance of a broad-based securities market index, and, if applicable, one or more indexes that MML Investment Advisers, LLC believes more closely reflects the market segments in which the Fund invests or is a better comparison for the Fund’s investment strategy. This graph includes the deduction of the maximum applicable sales charge, if any.
The index or indexes shown above are unmanaged, cannot be purchased directly, and, with the exception of any peer group index, do not incur expenses.
AVERAGE ANNUAL TOTAL RETURNS (%) (as of September 30, 2024)
| | | |
| | 1 Year | 5 Year | 10 Year |
Class R4 - without sales charge | 14.79 | 0.92 | 1.52 |
MSCI Emerging Markets Index | 26.05 | 5.75 | 4.02 |
Performance results reflect any applicable waivers or expense limitations in effect during these periods, without which performance would have been lower. The investment return and principal value of shares of the Fund fluctuate, so your shares, when sold, may be worth more or less than their original cost. Current performance of the Fund may be lower or higher than the performance quoted. Performance data current to the most recent month-end may be obtained at https://www.massmutual.com/product-performance/mutual-funds or by calling 1-888-309-3539 or by sending an email request to fundinfo@massmutual.com.
WHAT ARE SOME KEY FUND STATISTICS? (as of September 30, 2024)
| |
Total Net Assets (Millions) | $106.9 |
Total Number of Portfolio Holdings (includes derivative positions, if any) | 83 |
Total Advisory Fees Paid During the Reporting Period | $1,026,058 |
Portfolio Turnover Rate | 62% |
| MM202912-309770 | PAGE 2 | TSR-AR-ITJVK |
WHAT DID THE FUND INVEST IN? (as of September 30, 2024)
Derivative values, if any, are excluded from the table(s) below.
| |
Largest Holdings
(% of Total Investments) | |
Taiwan Semiconductor Manufacturing Co. Ltd. | 11.4% |
Tencent Holdings Ltd. | 5.7% |
H World Group Ltd. ADR | 5.1% |
Kotak Mahindra Bank Ltd. | 4.9% |
Samsung Electronics Co. Ltd. | 4.1% |
Fomento Economico Mexicano SAB de CV | 3.1% |
Meituan Class B | 3.0% |
HDFC Bank Ltd. | 2.9% |
Alibaba Group Holding Ltd. Sponsored ADR | 2.7% |
Tata Consultancy Services Ltd. | 2.5% |
| |
Sectors
(% of Total Investments) | |
Information Technology | 23.3% |
Consumer Discretionary | 17.9% |
Financials | 16.2% |
Communication Services | 8.5% |
Industrials | 8.2% |
Consumer Staples | 7.3% |
Health Care | 6.8% |
Energy | 4.0% |
Materials | 3.1% |
Real Estate | 2.5% |
| |
Largest Countries
(% of Total Investments) | |
China | 21.2% |
India | 16.6% |
Taiwan | 14.5% |
Mexico | 8.6% |
Republic of Korea | 7.0% |
Brazil | 5.5% |
France | 3.8% |
Italy | 3.1% |
Portugal | 2.1% |
Japan | 2.1% |
HOW HAS THE FUND CHANGED?
The following is a summary of certain changes to the Fund since October 1, 2023. For more complete information, you may review the Fund’s prospectus, including any applicable supplements, at https://www.massmutual.com/product-performance/mutual-funds or upon request at 1-888-309-3539 or fundinfo@massmutual.com.
Effective February 1, 2024, the annual rate for administrative services for Class A shares of the Fund was reduced from 0.30% to 0.25%, and the expense cap for Class A shares was adjusted from 1.70% to 1.65% to coincide with this change.
On or about January 24, 2025 (the “Termination Date”), the Fund is expected to be dissolved pursuant to a Plan of Liquidation and Termination approved by its Board of Trustees, and shareholders of the various classes of shares of the Fund will receive proceeds in proportion to the number of shares of such class held by each of them on the Termination Date.
| |
| WHERE CAN I FIND ADDITIONAL INFORMATION ABOUT THE FUND? |
For additional information about the Fund, including its prospectus, financial information, holdings, and proxy voting information, scan the QR code or visit https://www.massmutual.com/product-performance/mutual-funds. |
| MM202912-309770 | PAGE 3 | TSR-AR-ITJVK |
100007655902210848108371110412187138908892101281162610000807294261154411450112191240114659105381177014837
| | |
MassMutual Strategic Emerging Markets Fund | |
| Class A | MPASX |
| Annual Shareholder Report | September 30, 2024 |
This annual shareholder report contains important information about the MassMutual Strategic Emerging Markets Fund (the “Fund”) for the period of October 1, 2023 to September 30, 2024. You can find additional information about the Fund at https://www.massmutual.com/product-performance/mutual-funds. You can also request this information by contacting us at 1-888-309-3539 or by sending an email request to fundinfo@massmutual.com.
This report describes changes to the Fund that occurred during the reporting period.
WHAT WERE THE FUND COSTS FOR THE LAST YEAR?
This example shows the expenses you would have paid over the past year, based on a hypothetical $10,000 investment. This table reflects any applicable waivers or expense limitations.
| | |
Class Name | Costs of a $10,000 investment | Costs paid as a percentage of a $10,000 investment |
| Class A | $180 | 1.67% |
HOW DID THE FUND PERFORM?
Global equity markets advanced sharply as they weathered the unsettled geopolitical climate and higher interest rate environment well.
Geopolitical tensions remained high amid continued and escalating conflicts in Ukraine and the Middle East. In the U.S., the Federal Reserve continued its attempts to engineer a ‘soft landing’ and delivered a long-awaited cut in interest rates, with a 50bps cut in September. Emerging Market stocks advanced over the trailing 12-months, outperforming their developed non-U.S. counterparts. The MSCI Emerging Markets Index benefitted from strong performance out of Taiwan and China during the period, which offset negative contributions from stocks in Mexico and Chile.
Top contributors to the Fund’s performance relative to the MSCI Emerging Markets Index:
• Stock selection in the materials sector, where an allocation to Grupo Mexico SAB was particularly impactful
• An underweight to real estate, which was the third worst performing sector in the period
Top detractors to the Fund’s performance relative to the MSCI Emerging Markets Index:
• Stock selection within the consumer discretionary sector, with Yum China Holdings, Inc. as the largest detractor
• Stock selection in the consumer staples and financials sectors
• A modest cash holding also detracted from performance as the index advanced significantly in the period
| MM202912-309770 | PAGE 1 | TSR-AR-ITJV2 |
Performance shown is past performance and does not guarantee future results. The graph and table below do not reflect the deduction of taxes that a shareholder would pay on Fund distributions or redemption of Fund shares. The graph and table below assume reinvestment of dividends and capital gain distributions.
GROWTH OF A HYPOTHETICAL $10,000 INVESTMENT (October 1, 2014 through September 30, 2024)
This graph shows the performance of a hypothetical $10,000 investment in the share class noted over a ten-year period or since inception, if shorter, as compared to the performance of a broad-based securities market index, and, if applicable, one or more indexes that MML Investment Advisers, LLC believes more closely reflects the market segments in which the Fund invests or is a better comparison for the Fund’s investment strategy. This graph includes the deduction of the maximum applicable sales charge, if any.
The index or indexes shown above are unmanaged, cannot be purchased directly, and, with the exception of any peer group index, do not incur expenses.
AVERAGE ANNUAL TOTAL RETURNS (%) (as of September 30, 2024)
| | | |
| | 1 Year | 5 Year | 10 Year |
Class A - without sales charge | 15.11 | 0.87 | 1.45 |
Class A - with maximum sales charge | 8.68 | -0.26 | 0.88 |
MSCI Emerging Markets Index | 26.05 | 5.75 | 4.02 |
Performance results reflect any applicable waivers or expense limitations in effect during these periods, without which performance would have been lower. The investment return and principal value of shares of the Fund fluctuate, so your shares, when sold, may be worth more or less than their original cost. Current performance of the Fund may be lower or higher than the performance quoted. Performance data current to the most recent month-end may be obtained at https://www.massmutual.com/product-performance/mutual-funds or by calling 1-888-309-3539 or by sending an email request to fundinfo@massmutual.com.
WHAT ARE SOME KEY FUND STATISTICS? (as of September 30, 2024)
| |
Total Net Assets (Millions) | $106.9 |
Total Number of Portfolio Holdings (includes derivative positions, if any) | 83 |
Total Advisory Fees Paid During the Reporting Period | $1,026,058 |
Portfolio Turnover Rate | 62% |
| MM202912-309770 | PAGE 2 | TSR-AR-ITJV2 |
WHAT DID THE FUND INVEST IN? (as of September 30, 2024)
Derivative values, if any, are excluded from the table(s) below.
| |
Largest Holdings
(% of Total Investments) | |
Taiwan Semiconductor Manufacturing Co. Ltd. | 11.4% |
Tencent Holdings Ltd. | 5.7% |
H World Group Ltd. ADR | 5.1% |
Kotak Mahindra Bank Ltd. | 4.9% |
Samsung Electronics Co. Ltd. | 4.1% |
Fomento Economico Mexicano SAB de CV | 3.1% |
Meituan Class B | 3.0% |
HDFC Bank Ltd. | 2.9% |
Alibaba Group Holding Ltd. Sponsored ADR | 2.7% |
Tata Consultancy Services Ltd. | 2.5% |
| |
Sectors
(% of Total Investments) | |
Information Technology | 23.3% |
Consumer Discretionary | 17.9% |
Financials | 16.2% |
Communication Services | 8.5% |
Industrials | 8.2% |
Consumer Staples | 7.3% |
Health Care | 6.8% |
Energy | 4.0% |
Materials | 3.1% |
Real Estate | 2.5% |
| |
Largest Countries
(% of Total Investments) | |
China | 21.2% |
India | 16.6% |
Taiwan | 14.5% |
Mexico | 8.6% |
Republic of Korea | 7.0% |
Brazil | 5.5% |
France | 3.8% |
Italy | 3.1% |
Portugal | 2.1% |
Japan | 2.1% |
HOW HAS THE FUND CHANGED?
The following is a summary of certain changes to the Fund since October 1, 2023. For more complete information, you may review the Fund’s prospectus, including any applicable supplements, at https://www.massmutual.com/product-performance/mutual-funds or upon request at 1-888-309-3539 or fundinfo@massmutual.com.
Effective February 1, 2024, the annual rate for administrative services for Class A shares of the Fund was reduced from 0.30% to 0.25%, and the expense cap for Class A shares was adjusted from 1.70% to 1.65% to coincide with this change.
On or about January 24, 2025 (the “Termination Date”), the Fund is expected to be dissolved pursuant to a Plan of Liquidation and Termination approved by its Board of Trustees, and shareholders of the various classes of shares of the Fund will receive proceeds in proportion to the number of shares of such class held by each of them on the Termination Date.
| |
| WHERE CAN I FIND ADDITIONAL INFORMATION ABOUT THE FUND? |
For additional information about the Fund, including its prospectus, financial information, holdings, and proxy voting information, scan the QR code or visit https://www.massmutual.com/product-performance/mutual-funds. |
| MM202912-309770 | PAGE 3 | TSR-AR-ITJV2 |
9450723285111022810204104491145913043833994881091210000807294261154411450112191240114659105381177014837
| | |
MassMutual Strategic Emerging Markets Fund | |
| Class R3 | MPZRX |
| Annual Shareholder Report | September 30, 2024 |
This annual shareholder report contains important information about the MassMutual Strategic Emerging Markets Fund (the “Fund”) for the period of October 1, 2023 to September 30, 2024. You can find additional information about the Fund at https://www.massmutual.com/product-performance/mutual-funds. You can also request this information by contacting us at 1-888-309-3539 or by sending an email request to fundinfo@massmutual.com.
This report describes changes to the Fund that occurred during the reporting period.
WHAT WERE THE FUND COSTS FOR THE LAST YEAR?
This example shows the expenses you would have paid over the past year, based on a hypothetical $10,000 investment. This table reflects any applicable waivers or expense limitations.
| | |
Class Name | Costs of a $10,000 investment | Costs paid as a percentage of a $10,000 investment |
| Class R3 | $199 | 1.85% |
HOW DID THE FUND PERFORM?
Global equity markets advanced sharply as they weathered the unsettled geopolitical climate and higher interest rate environment well.
Geopolitical tensions remained high amid continued and escalating conflicts in Ukraine and the Middle East. In the U.S., the Federal Reserve continued its attempts to engineer a ‘soft landing’ and delivered a long-awaited cut in interest rates, with a 50bps cut in September. Emerging Market stocks advanced over the trailing 12-months, outperforming their developed non-U.S. counterparts. The MSCI Emerging Markets Index benefitted from strong performance out of Taiwan and China during the period, which offset negative contributions from stocks in Mexico and Chile.
Top contributors to the Fund’s performance relative to the MSCI Emerging Markets Index:
• Stock selection in the materials sector, where an allocation to Grupo Mexico SAB was particularly impactful
• An underweight to real estate, which was the third worst performing sector in the period
Top detractors to the Fund’s performance relative to the MSCI Emerging Markets Index:
• Stock selection within the consumer discretionary sector, with Yum China Holdings, Inc. as the largest detractor
• Stock selection in the consumer staples and financials sectors
• A modest cash holding also detracted from performance as the index advanced significantly in the period
| MM202912-309770 | PAGE 1 | TSR-AR-ITJVJ |
Performance shown is past performance and does not guarantee future results. The graph and table below do not reflect the deduction of taxes that a shareholder would pay on Fund distributions or redemption of Fund shares. The graph and table below assume reinvestment of dividends and capital gain distributions.
GROWTH OF A HYPOTHETICAL $10,000 INVESTMENT (October 1, 2014 through September 30, 2024)
This graph shows the performance of a hypothetical $10,000 investment in the share class noted over a ten-year period or since inception, if shorter, as compared to the performance of a broad-based securities market index, and, if applicable, one or more indexes that MML Investment Advisers, LLC believes more closely reflects the market segments in which the Fund invests or is a better comparison for the Fund’s investment strategy. This graph includes the deduction of the maximum applicable sales charge, if any.
The index or indexes shown above are unmanaged, cannot be purchased directly, and, with the exception of any peer group index, do not incur expenses.
AVERAGE ANNUAL TOTAL RETURNS (%) (as of September 30, 2024)
| | | |
| | 1 Year | 5 Year | 10 Year |
Class R3 - without sales charge | 14.60 | 0.66 | 1.26 |
MSCI Emerging Markets Index | 26.05 | 5.75 | 4.02 |
Performance results reflect any applicable waivers or expense limitations in effect during these periods, without which performance would have been lower. The investment return and principal value of shares of the Fund fluctuate, so your shares, when sold, may be worth more or less than their original cost. Current performance of the Fund may be lower or higher than the performance quoted. Performance data current to the most recent month-end may be obtained at https://www.massmutual.com/product-performance/mutual-funds or by calling 1-888-309-3539 or by sending an email request to fundinfo@massmutual.com.
WHAT ARE SOME KEY FUND STATISTICS? (as of September 30, 2024)
| |
Total Net Assets (Millions) | $106.9 |
Total Number of Portfolio Holdings (includes derivative positions, if any) | 83 |
Total Advisory Fees Paid During the Reporting Period | $1,026,058 |
Portfolio Turnover Rate | 62% |
| MM202912-309770 | PAGE 2 | TSR-AR-ITJVJ |
WHAT DID THE FUND INVEST IN? (as of September 30, 2024)
Derivative values, if any, are excluded from the table(s) below.
| |
Largest Holdings
(% of Total Investments) | |
Taiwan Semiconductor Manufacturing Co. Ltd. | 11.4% |
Tencent Holdings Ltd. | 5.7% |
H World Group Ltd. ADR | 5.1% |
Kotak Mahindra Bank Ltd. | 4.9% |
Samsung Electronics Co. Ltd. | 4.1% |
Fomento Economico Mexicano SAB de CV | 3.1% |
Meituan Class B | 3.0% |
HDFC Bank Ltd. | 2.9% |
Alibaba Group Holding Ltd. Sponsored ADR | 2.7% |
Tata Consultancy Services Ltd. | 2.5% |
| |
Sectors
(% of Total Investments) | |
Information Technology | 23.3% |
Consumer Discretionary | 17.9% |
Financials | 16.2% |
Communication Services | 8.5% |
Industrials | 8.2% |
Consumer Staples | 7.3% |
Health Care | 6.8% |
Energy | 4.0% |
Materials | 3.1% |
Real Estate | 2.5% |
| |
Largest Countries
(% of Total Investments) | |
China | 21.2% |
India | 16.6% |
Taiwan | 14.5% |
Mexico | 8.6% |
Republic of Korea | 7.0% |
Brazil | 5.5% |
France | 3.8% |
Italy | 3.1% |
Portugal | 2.1% |
Japan | 2.1% |
HOW HAS THE FUND CHANGED?
The following is a summary of certain changes to the Fund since October 1, 2023. For more complete information, you may review the Fund’s prospectus, including any applicable supplements, at https://www.massmutual.com/product-performance/mutual-funds or upon request at 1-888-309-3539 or fundinfo@massmutual.com.
Effective February 1, 2024, the annual rate for administrative services for Class A shares of the Fund was reduced from 0.30% to 0.25%, and the expense cap for Class A shares was adjusted from 1.70% to 1.65% to coincide with this change.
On or about January 24, 2025 (the “Termination Date”), the Fund is expected to be dissolved pursuant to a Plan of Liquidation and Termination approved by its Board of Trustees, and shareholders of the various classes of shares of the Fund will receive proceeds in proportion to the number of shares of such class held by each of them on the Termination Date.
| |
| WHERE CAN I FIND ADDITIONAL INFORMATION ABOUT THE FUND? |
For additional information about the Fund, including its prospectus, financial information, holdings, and proxy voting information, scan the QR code or visit https://www.massmutual.com/product-performance/mutual-funds. |
| MM202912-309770 | PAGE 3 | TSR-AR-ITJVJ |
10000764389831076910727109651200613644870698901133310000807294261154411450112191240114659105381177014837
Item 2. Code of Ethics.
As of September 30, 2024, the Registrant adopted a Code of Ethics that applies to the Principal Executive Officer, Principal Financial Officer, and other senior financial officers pursuant to the Sarbanes-Oxley Act of 2002. For the year ended September 30, 2024, there were no reportable amendments to any provision of the Code of Ethics and the Registrant did not grant any waivers, including implicit waivers, from any provisions of the Code of Ethics. A copy of its Code of Ethics is filed with this Form N-CSR under Item 19(a)(1).
Item 3. Audit Committee Financial Expert.
The Registrant’s Board of Trustees has determined that Nabil N. El-Hage, a member of the Audit Committee, is an audit committee financial expert as defined by the Securities and Exchange Commission (the “SEC”). Mr. El-Hage is “independent” as defined by the SEC for purposes of audit committee financial expert determinations.
Item 4. Principal Accountant Fees and Services.
References below to Deloitte & Touche LLP include its affiliates where applicable.
| (a) | AUDIT FEES: The aggregate fees billed to the Registrant for professional services rendered by its independent auditors, Deloitte & Touche LLP, for the audit of the Registrant’s annual financial statements for the fiscal years ended 2024 and 2023 were $505,736 and $510,847, respectively. |
| | | |
| (b) | AUDIT-RELATED FEES: No such fees were billed to the Registrant by Deloitte & Touche LLP for the fiscal years ended 2024 and 2023. No such fees were billed to the Registrant’s adviser and any entity controlling, controlled by, or under common control with the adviser that provides ongoing services to the Registrant by Deloitte & Touche LLP* for the fiscal years ended 2024 and 2023. |
| | | |
| (c) | TAX FEES: No such fees were billed to the Registrant by Deloitte & Touche LLP for the fiscal years ended 2024 and 2023. No such fees were billed to the Registrant’s adviser and any entity controlling, controlled by, or under common control with the adviser that provides ongoing services to the Registrant by Deloitte & Touche LLP* for the fiscal years ended 2024 and 2023. |
| | | |
| (d) | ALL OTHER FEES: No such fees were billed to the Registrant by Deloitte & Touche LLP for the fiscal years ended 2024 and 2023. No such fees were billed to the Registrant’s adviser and any entity controlling, controlled by, or under common control with the adviser that provides ongoing services to the Registrant by Deloitte & Touche LLP* for the fiscal years ended 2024 and 2023. |
| | | |
| (e) | (1) AUDIT COMMITTEE PRE-APPROVAL POLICY: All services to be performed for the Registrant by Deloitte & Touche LLP must be pre-approved by the audit committee. All services performed during the fiscal years ended 2024 and 2023 were pre-approved by the committee. |
| | | |
| | (2) | Not applicable. |
| | | |
| | (f) | Not applicable. |
| | | |
| | (g) | The aggregate non-audit fees billed by Deloitte & Touche LLP for services rendered to the Registrant, the Registrant’s adviser and any entity controlling, controlled by, or under common control with the adviser that provides ongoing services to the Registrant, for the fiscal years ended 2024 and 2023 were $760,661 and $692,517, respectively. |
| | * | Refers to fees that were required to be approved by the audit committee for services that relate directly to the operations and financial reporting of the Registrant. |
| (h) | The audit committee considers whether the provision of non-audit services by Deloitte & Touche LLP to the Registrant’s adviser and any entity controlling, controlled by, or under common control with the adviser that provides ongoing services to the Registrant that were not pre-approved pursuant to paragraph (c)(7)(ii) of Rule 2-01 of Regulation S-X is compatible with maintaining Deloitte & Touche LLP’s independence. |
| | | |
Item 5. Audit Committee of Listed Registrants.
Not applicable.
Item 6. Investments.
| (a) | Please see portfolio of investments contained in the financial statements filed under Item 7 of this form N-CSR. |
TABLE OF CONTENTS
Table of Contents
Please note the Annual Financial Statements and Other Information only contains Items 7-11 of Form N-CSR. All items required by Form N-CSR are filed with the Securities and Exchange Commission.
| |
Item 7. Financial Statements and Financial Highlights for Open-End Management Investment Companies.
|
Portfolios of Investments
| | | |
| | | |
| | | |
| | | |
| | | |
| | | |
| | | |
| | | |
| | | |
| | | |
| | | |
| | | |
| | | |
| | | |
| | | |
| | | |
| | | |
| | | |
| | | |
| | | |
| | | |
| | | |
| | | |
| | | |
| | | |
| | | | |
This material must be preceded or accompanied by a current prospectus (or summary prospectus, if available) for the applicable MassMutual Funds. Investors should consider a Fund’s investment objective, risks, and charges and expenses carefully before investing. This and other information about the investment company is available in the prospectus (or summary prospectus, if available). Read it carefully before investing.
TABLE OF CONTENTS
Item 7. Financial Statements and Financial Highlights for Open-End Management Investment Companies.
| | | |
| | MassMutual U.S. Government Money Market Fund — Portfolio of Investments | |
| | | |
| | | | | | | |
Short-Term Investments — 100.8%
| | | |
Discount Notes — 68.5%
| | | | | | |
Federal Home Loan Bank
| | | | | | |
1 day USD SOFR + 0.010%
4.850% FRN 10/01/24,
1/10/25 (a) | | | $13,500,000 | | | $13,500,000 |
1 day USD SOFR + 0.025%
4.865% FRN 10/01/24,
11/26/24 (a) | | | 9,000,000 | | | 9,000,000 |
4.668% 10/02/24, 10/02/24 (a) | | | 22,300,000 | | | 22,297,151 |
4.711% 10/23/24, 10/23/24 (a) | | | 16,000,000 | | | 15,954,729 |
4.752% 10/01/24, 10/01/24 (a) | | | 22,000,000 | | | 22,000,000 |
4.807% 11/08/24, 11/08/24 (a) | | | 34,000,000 | | | 33,830,963 |
Federal Home Loan Mortgage Corp.
| | | | | | |
5.224%, 1/17/25, 1/17/25 (a) | | | 2,400,000 | | | 2,363,856 |
| | | | | | 118,946,699 |
Repurchase Agreement — 14.4%
| | | | | | |
HSBC Securities (USA) Inc.,
Tri-Party Repurchase Agreement, dated 9/30/24, 4.780%, due 10/01/24 (b) | | | 25,000,000 | | | 25,000,000 |
U.S. Treasury Bill — 17.9%
| | | | | | |
U.S. Treasury Bill
| | | | | | |
5.136% 1/23/25 (c) | | | 9,000,000 | | | 8,859,139 |
5.192% 1/02/25 (c) | | | 9,000,000 | | | 8,883,657 |
5.196% 1/02/25 (c) | | | 9,000,000 | | | 8,883,657 |
5.216% 1/02/25 (c) | | | 4,500,000 | | | 4,441,648 |
| | | | | | 31,068,101 |
TOTAL SHORT-TERM INVESTMENTS
(Cost $175,014,800) | | | | | | 175,014,800 |
TOTAL INVESTMENTS — 100.8% (Cost $175,014,800) (d) | | | | | | 175,014,800 |
Other Assets/
(Liabilities) — (0.8)% | | | | | | (1,451,446) |
NET ASSETS — 100.0% | | | | | | $173,563,354 |
| | | | | | | |
Abbreviation Legend
| | | | | |
FRN | | | Floating Rate Note | |
SOFR | | | Secured Overnight Financing Rate | |
| | | | | |
Notes to Portfolio of Investments
Percentages are stated as a percent of net assets.
(a)
| The stated maturity dates reflect reset date and final maturity date, respectively. |
(b)
| Maturity value of $25,003,319. Collateralized by U.S. Government Agency obligations with a rate of 0.000%, maturity date of 11/15/33, and an aggregate market value, including accrued interest, of $25,500,000.
|
(c)
| The rate shown represents yield-to-maturity.
|
(d)
| See Note 6 for aggregate cost for federal tax purposes. |
| | | | | |
The accompanying notes are an integral part of the financial statements. | | | | |
| | | 1
| |
| | | | | |
TABLE OF CONTENTS
| | | |
| | MassMutual Short-Duration Bond Fund — Portfolio of Investments | |
| | | |
| | | | | | | |
Bonds & Notes — 84.3%
| | | | | | |
Corporate Debt — 45.4%
| | | | | | |
Aerospace & Defense — 0.5%
| | | | | | |
Boeing Co.
6.298% 5/01/29 (a) | | | $ 717,000 | | | $ 754,346 |
Agriculture — 0.2%
| | | | | | |
Imperial Brands Finance PLC
5.500% 2/01/30 (a) | | | 307,000 | | | 316,926 |
Auto Manufacturers — 1.2%
| | | | | | |
Ford Motor Credit Co. LLC
5.303% 9/06/29 | | | 380,000 | | | 378,211 |
General Motors Financial Co., Inc. 5.800% 1/07/29 | | | 366,000 | | | 380,680 |
Hyundai Capital America
6.100% 9/21/28 (a) | | | 356,000 | | | 375,572 |
Nissan Motor Acceptance Co. LLC 1.850% 9/16/26 (a) | | | 815,000 | | | 763,814 |
| | | | | | 1,898,277 |
Auto Parts & Equipment — 0.1%
| | | | | | |
BorgWarner, Inc.
4.950% 8/15/29 | | | 155,000 | | | 157,579 |
Banks — 8.5%
| | | | | | |
ABN AMRO Bank NV
4.750% 7/28/25 (a) | | | 1,585,000 | | | 1,577,950 |
ABQ Finance Ltd.
2.000% 7/06/26 (a) | | | 1,200,000 | | | 1,143,240 |
Bank Negara Indonesia Persero Tbk. PT
5.280% 4/05/29 (a) | | | 500,000 | | | 511,305 |
Barclays PLC
5.200% 5/12/26 | | | 440,000 | | | 442,745 |
1 day USD SOFR + 1.740%
5.690% VRN 3/12/30 | | | 445,000 | | | 462,910 |
BPCE SA, (Acquired 5/21/24,
Cost $430,000),
5.281% 5/30/29 (a) (b) | | | 430,000 | | | 444,192 |
Credit Agricole SA 1 day USD SOFR + 1.860%
6.316% VRN 10/03/29 (a) | | | 596,000 | | | 633,747 |
Danske Bank AS 1 yr. CMT + 0.730% 1.549% VRN 9/10/27 (a) | | | 809,000 | | | 766,996 |
Discover Bank 5 yr. USD SOFR ICE Swap Rate + 1.730%
5.974% VRN 8/09/28 | | | 625,000 | | | 645,386 |
HDFC Bank Ltd.
5.196% 2/15/27 (a) | | | 500,000 | | | 507,316 |
ING Groep NV 1 day USD SOFR + 1.440%
5.335% VRN 3/19/30 | | | 445,000 | | | 460,577 |
| | | | | | | |
| | | | | | | |
JP Morgan Chase & Co. 3 mo. USD Term SOFR + 1.522%
4.203% VRN 7/23/29 | | | $ 600,000 | | | $597,768 |
Macquarie Group Ltd. 1 day USD SOFR + 1.069%
1.340% VRN 1/12/27 (a) | | | 804,000 | | | 771,157 |
Morgan Stanley 1 day USD SOFR + 1.630%
5.449% VRN 7/20/29 | | | 739,000 | | | 767,894 |
Santander UK Group Holdings PLC 1 day USD SOFR Index + 1.554%
4.858% VRN 9/11/30 | | | 400,000 | | | 403,177 |
Societe Generale SA 1 yr. CMT + 1.300%
2.797% VRN 1/19/28 (a) | | | 807,000 | | | 771,026 |
Synovus Bank
5.625% 2/15/28 | | | 653,000 | | | 656,529 |
Truist Financial Corp. 1 day USD SOFR + 2.446%
7.161% VRN 10/30/29 | | | 515,000 | | | 564,504 |
UBS Group AG 1 yr. CMT + 1.080%
1.364% VRN 1/30/27 (a) | | | 875,000 | | | 837,625 |
Wells Fargo & Co. 1 day USD SOFR + 1.740%
5.574% VRN 7/25/29 | | | 369,000 | | | 383,909 |
| | | | | | 13,349,953 |
Chemicals — 1.7%
| | | | | | |
Celanese US Holdings LLC
| | | | | | |
6.165% 7/15/27 | | | 307,000 | | | 318,115 |
6.350% 11/15/28 | | | 560,000 | | | 591,264 |
MEGlobal Canada ULC
5.000% 5/18/25 (a) | | | 1,050,000 | | | 1,048,686 |
Yara International ASA
4.750% 6/01/28 (a) | | | 764,000 | | | 761,724 |
| | | | | | 2,719,789 |
Commercial Services — 0.6%
| | | | | | |
Triton Container International Ltd.
2.050% 4/15/26 (a) | | | 1,040,000 | | | 994,730 |
Computers — 0.8%
| | | | | | |
Genpact Luxembourg SARL/Genpact USA, Inc.
6.000% 6/04/29 | | | 813,000 | | | 851,391 |
Kyndryl Holdings, Inc.
2.700% 10/15/28 | | | 475,000 | | | 439,934 |
| | | | | | 1,291,325 |
Diversified Financial Services — 2.1%
| | | | | | |
Ally Financial, Inc. 1 day USD SOFR + 3.260%
6.992% VRN 6/13/29 | | | 375,000 | | | 396,417 |
| | | | | | | |
| | | | | |
| | | The accompanying notes are an integral part of the financial statements.
| |
2
| | | | |
| | | | | |
TABLE OF CONTENTS
| | MassMutual Short-Duration Bond Fund — Portfolio of Investments (Continued) | |
| | | | | | | |
Avolon Holdings Funding Ltd.
4.250% 4/15/26 (a) | | | $ 312,000 | | | $ 308,773 |
5.750% 11/15/29 (a) | | | 430,000 | | | 443,810 |
BGC Group, Inc.
4.375% 12/15/25 | | | 1,340,000 | | | 1,327,303 |
Macquarie Airfinance Holdings Ltd. 6.400% 3/26/29 (a) | | | 113,000 | | | 117,610 |
REC Ltd.
2.250% 9/01/26 (a) | | | 800,000 | | | 764,933 |
| | | | | | 3,358,846 |
Electric — 2.1%
| | | | | | |
Adani Transmission Step-One Ltd. 4.000% 8/03/26 (a) | | | 500,000 | | | 484,936 |
Alliant Energy Finance LLC
1.400% 3/15/26 (a) | | | 1,630,000 | | | 1,551,043 |
Engie SA
5.250% 4/10/29 (a) | | | 870,000 | | | 898,891 |
Pacific Gas & Electric Co.
5.550% 5/15/29 | | | 405,000 | | | 420,688 |
| | | | | | 3,355,558 |
Engineering & Construction — 0.1%
| | | | | | |
MasTec, Inc.
5.900% 6/15/29 | | | 208,000 | | | 217,067 |
Entertainment — 0.6%
| | | | | | |
Warnermedia Holdings, Inc.
4.054% 3/15/29 | | | 1,075,000 | | | 1,018,385 |
Food — 1.4%
| | | | | | |
JBS USA Holding Lux SARL/JBS USA Food Co./JBS Lux Co. SARL
2.500% 1/15/27 | | | 805,000 | | | 770,166 |
The Kroger Co.
4.650% 9/15/29 | | | 439,000 | | | 441,425 |
Smithfield Foods, Inc.
4.250% 2/01/27 (a) | | | 995,000 | | | 978,483 |
| | | | | | 2,190,074 |
Hand & Machine Tools — 0.2%
| | | | | | |
Regal Rexnord Corp.
6.050% 4/15/28 | | | 250,000 | | | 259,930 |
Home Furnishing — 0.4%
| | | | | | |
LG Electronics, Inc.
5.625% 4/24/27 (a) | | | 250,000 | | | 256,900 |
5.625% 4/24/29 (a) | | | 288,000 | | | 300,467 |
| | | | | | 557,367 |
Housewares — 0.2%
| | | | | | |
Newell Brands, Inc.
6.375% 9/15/27 (c) | | | 369,000 | | | 373,208 |
| | | | | | | |
| | | | | | | |
Insurance — 4.0%
| | | | | | |
Athene Global Funding
1.730% 10/02/26 (a) | | | $ 935,000 | | | $ 886,188 |
Brighthouse Financial Global Funding 5.650% 6/10/29 (a) | | | 375,000 | | | 387,354 |
CNO Global Funding
2.650% 1/06/29 (a) | | | 525,000 | | | 480,439 |
Enstar Group Ltd.
4.950% 6/01/29 | | | 875,000 | | | 879,839 |
GA Global Funding Trust
5.500% 1/08/29 (a) | | | 890,000 | | | 922,737 |
Jackson National Life Global Funding 4.600% 10/01/29 (a) (d) | | | 216,000 | | | 215,432 |
Lincoln National Corp., (Acquired 4/19/23, Cost $731,429),
3.800% 3/01/28 (b) (c) | | | 825,000 | | | 809,900 |
RGA Global Funding
5.448% 5/24/29 (a) | | | 538,000 | | | 560,090 |
Sammons Financial Group, Inc. 4.450% 5/12/27 (a) | | | 1,154,000 | | | 1,141,781 |
| | | | | | 6,283,760 |
Internet — 0.8%
| | | | | | |
Prosus NV
3.257% 1/19/27 (a) | | | 1,250,000 | | | 1,206,059 |
Investment Companies — 5.2%
| | | | | | |
Antares Holdings LP
2.750% 1/15/27 (a) | | | 485,000 | | | 454,191 |
3.950% 7/15/26 (a) | | | 880,000 | | | 855,583 |
Capital Corp.
2.875% 6/15/28 | | | 475,000 | | | 438,120 |
ARES Capital Corp.
5.950% 7/15/29 | | | 430,000 | | | 441,372 |
ARES Strategic Income Fund
6.350% 8/15/29 (a) | | | 770,000 | | | 787,116 |
Blackstone Private Credit Fund
2.625% 12/15/26 | | | 813,000 | | | 768,733 |
Blackstone Secured Lending Fund 2.750% 9/16/26 | | | 525,000 | | | 501,671 |
5.875% 11/15/27 | | | 195,000 | | | 198,284 |
Blue Owl Credit Income Corp.
4.700% 2/08/27 | | | 783,000 | | | 768,280 |
Blue Owl Technology Finance Corp. II 6.750% 4/04/29 (a) | | | 881,000 | | | 885,125 |
Golub Capital BDC, Inc.
2.500% 8/24/26 | | | 1,115,000 | | | 1,057,444 |
HPS Corporate Lending Fund
6.250% 9/30/29 (a) (c) | | | 425,000 | | | 432,659 |
6.750% 1/30/29 (a) | | | 522,000 | | | 540,688 |
| | | | | | 8,129,266 |
| | | | | | | |
| | | | | |
The accompanying notes are an integral part of the financial statements. | | | | |
| | | 3
| |
| | | | | |
TABLE OF CONTENTS
| | MassMutual Short-Duration Bond Fund — Portfolio of Investments (Continued) | |
| | | | | | | |
Lodging — 0.5%
| | | | | | |
Las Vegas Sands Corp.
6.000% 8/15/29 | | | $ 735,000 | | | $ 763,815 |
Machinery - Construction & Mining — 0.6%
| | | | | | |
Weir Group PLC
2.200% 5/13/26 (a) | | | 1,036,000 | | | 996,443 |
Media — 1.2%
| | | | | | |
CCO Holdings LLC/CCO Holdings Capital Corp.
5.125% 5/01/27 (a) | | | 575,000 | | | 565,924 |
Charter Communications Operating LLC/Charter Communications Operating Capital
2.250% 1/15/29 | | | 385,000 | | | 342,787 |
Paramount Global
3.700% 6/01/28 | | | 950,000 | | | 901,398 |
| | | | | | 1,810,109 |
Office & Business Equipment — 0.3%
| | | | | | |
CDW LLC/CDW Finance Corp. 5.100% 3/01/30 | | | 420,000 | | | 425,682 |
Oil & Gas — 1.8%
| | | | | | |
Helmerich & Payne, Inc.
4.850% 12/01/29 (a) | | | 760,000 | | | 749,606 |
Occidental Petroleum Corp.
5.200% 8/01/29 | | | 425,000 | | | 432,056 |
Parkland Corp.
5.875% 7/15/27 (a) | | | 455,000 | | | 453,828 |
Patterson-UTI Energy, Inc.
3.950% 2/01/28 | | | 1,220,000 | | | 1,174,698 |
| | | | | | 2,810,188 |
Packaging & Containers — 0.3%
| | | | | | |
Smurfit Kappa Treasury ULC
5.200% 1/15/30 (a) | | | 440,000 | | | 454,549 |
Pharmaceuticals — 1.5%
| | | | | | |
Bayer US Finance II LLC
4.375% 12/15/28 (a) | | | 525,000 | | | 518,133 |
Hikma Finance USA LLC
3.250% 7/09/25 (a) | | | 1,150,000 | | | 1,131,893 |
Viatris, Inc.
2.300% 6/22/27 | | | 816,000 | | | 768,889 |
| | | | | | 2,418,915 |
Pipelines — 0.8%
| | | | | | |
Enbridge, Inc.
5.300% 4/05/29 | | | 435,000 | | | 450,413 |
EQM Midstream Partners LP
5.500% 7/15/28 | | | 450,000 | | | 456,033 |
| | | | | | | |
| | | | | | | |
Harvest Midstream I LP
7.500% 9/01/28 (a) | | | $ 391,000 | | | $ 400,120 |
| | | | | | 1,306,566 |
Private Equity — 0.6%
| | | | | | |
Hercules Capital, Inc.
2.625% 9/16/26 | | | 966,000 | | | 912,892 |
Real Estate — 0.7%
| | | | | | |
MAF Sukuk Ltd.
4.500% 11/03/25 (a) | | | 1,025,000 | | | 1,022,684 |
Real Estate Investment Trusts (REITS) — 4.9%
| | | | | | |
CubeSmart LP
2.250% 12/15/28 | | | 650,000 | | | 597,787 |
EPR Properties
3.750% 8/15/29 | | | 175,000 | | | 163,645 |
4.500% 6/01/27 | | | 900,000 | | | 886,855 |
Global Net Lease, Inc./Global Net Lease Operating Partnership LP 3.750% 12/15/27 (a) | | | 1,125,000 | | | 1,048,714 |
GLP Capital LP/GLP Financing II, Inc. 5.375% 4/15/26 | | | 450,000 | | | 451,823 |
Omega Healthcare Investors, Inc. 4.750% 1/15/28 | | | 989,000 | | | 987,331 |
Piedmont Operating Partnership LP 9.250% 7/20/28 | | | 800,000 | | | 895,344 |
Store Capital LLC
4.500% 3/15/28 | | | 925,000 | | | 907,661 |
Sun Communities Operating LP 5.500% 1/15/29 | | | 430,000 | | | 442,628 |
VICI Properties LP/VICI Note Co., Inc. 3.750% 2/15/27 (a) | | | 395,000 | | | 385,251 |
Vornado Realty LP
2.150% 6/01/26 | | | 403,000 | | | 383,736 |
WEA Finance LLC
3.500% 6/15/29 (a) | | | 500,000 | | | 468,899 |
| | | | | | 7,619,674 |
Retail — 0.2%
| | | | | | |
Advance Auto Parts, Inc.
5.900% 3/09/26 | | | 343,000 | | | 346,539 |
Savings & Loans — 0.2%
| | | | | | |
Nationwide Building Society
4.000% 9/14/26 (a) | | | 297,000 | | | 292,773 |
Semiconductors — 0.4%
| | | | | | |
Intel Corp.
3.750% 3/25/27 | | | 300,000 | | | 294,761 |
SK Hynix, Inc.
5.500% 1/16/27 (a) | | | 300,000 | | | 306,375 |
| | | | | | 601,136 |
| | | | | | | |
| | | | | |
| | | The accompanying notes are an integral part of the financial statements.
| |
4
| | | | |
| | | | | |
TABLE OF CONTENTS
| | MassMutual Short-Duration Bond Fund — Portfolio of Investments (Continued) | |
| | | | | | | | |
Telecommunications — 0.7%
| | | | | | | |
Tower Bersama Infrastructure Tbk. PT 4.250% 1/21/25 (a) | | | $ 1,100,000 | | | $ 1,096,425 | |
TOTAL CORPORATE DEBT
(Cost $70,790,045) | | | | | | 71,310,835
| |
Non-U.S. Government Agency
Obligations — 38.9%
| | | | |
Automobile Asset-Backed Securities — 0.9%
| | | | | | | |
AmeriCredit Automobile Receivables Trust, Series 2020-3, Class D
1.490% 9/18/26 | | | 339,000 | | | 331,431 | |
PenFed Auto Receivables Owner Trust, Series 2024-A, Class C
5.200% 9/16/30 (a) | | | 400,000 | | | 402,961 | |
Westlake Automobile Receivables Trust, Series 2022-2A, Class D 5.480% 9/15/27 (a) | | | 700,000 | | | 704,310 | |
| | | | | | 1,438,702 | |
Commercial Mortgage-Backed Securities — 3.5%
| | | | | | | |
BAMLL Commercial Mortgage Securities Trust, Series 2019-BPR, Class CMP,
4.024% VRN 11/05/32 (a) (e) | | | 2,280,000 | | | 2,120,495 | |
JP Morgan Chase Commercial Mortgage Securities Trust, Series 2013-LC11, Class C,
3.958% VRN 4/15/46 (e) | | | 1,015,000 | | | 691,012 | |
One New York Plaza Trust
Series 2020-1NYP, Class C, 1 mo. USD Term SOFR + 2.314%
7.412% FRN 1/15/36 (a) | | | 2,106,000 | | | 1,956,328 | |
Series 2020-1NYP, Class D, 1 mo. USD Term SOFR + 2.864%
7.962% FRN 1/15/36 (a) | | | 760,000 | | | 658,793 | |
| | | | | | 5,426,628 | |
Credit Card Asset-Backed Securities — 0.6%
| | | | | | | |
Brex Commercial Charge Card Master Trust, Series 2024-1, Class A1 6.050% 7/15/27 (a) | | | 1,000,000 | | | 1,016,012 | |
Home Equity Asset-Backed Securities — 0.0%
| | | | | | | |
Argent Securities, Inc. Asset-Backed Pass-Through Certificates, Series 2004-W10, Class M1, 1 mo. USD Term SOFR + 1.014%
4.081% FRN 10/25/34 | | | 49,895 | | | 48,712 | |
| | | | | | | | |
| | | | | | | |
Other Asset-Backed Securities — 19.7%
| | | | | | |
321 Henderson Receivables I LLC, Series 2006-3A, Class A1, 1 mo. USD Term SOFR + 0.314%
5.411% FRN 9/15/41 (a) | | | $ 28,307 | | | $ 27,991 |
522 Funding CLO Ltd.,
Series 2018-3A, Class BR, 3 mo. USD Term SOFR + 1.812%
7.094% FRN 10/20/31 (a) | | | 2,352,000 | | | 2,354,117 |
Affirm Asset Securitization Trust, Series 2024-B, Class A
4.620% 9/15/29 (a) | | | 1,000,000 | | | 1,000,803 |
Apidos CLO XXX Ltd., Series XXXA, Class A2R, 3 mo. USD Term
SOFR + 1.500%
6.695% FRN 10/18/31 (a) | | | 500,000 | | | 500,348 |
Ballyrock CLO Ltd., Series 2020-2A, Class A2R, 3 mo. USD Term
SOFR + 1.812%
7.094% FRN 10/20/31 (a) | | | 3,700,000 | | | 3,706,105 |
BHG Securitization Trust,
Series 2021-B, Class C
2.240% 10/17/34 (a) | | | 3,736,000 | | | 3,467,354 |
BRE Grand Islander Timeshare Issuer LLC, Series 2019-A, Class B 3.780% 9/26/33 (a) | | | 501,243 | | | 486,819 |
Buttermilk Park CLO Ltd., Series 2018-1A, Class B1R, 3 mo. USD Term SOFR + 1.600%
6.901% FRN 10/15/31 (a) | | | 1,000,000 | | | 1,001,337 |
Canyon Capital CLO Ltd.,
Series 2020-1A, Class AR, 3 mo. USD Term SOFR + 1.442%
6.743% FRN 7/15/34 (a) | | | 900,000 | | | 900,338 |
Castlelake Aircraft Structured Trust, Series 2019-1A, Class B
5.095% 4/15/39 (a) | | | 707,996 | | | 483,431 |
CF Hippolyta Issuer LLC,
Series 2020-1, Class B1
2.280% 7/15/60 (a) | | | 577,448 | | | 551,920 |
Elara HGV Timeshare Issuer LLC, Series 2019-A, Class C
3.450% 1/25/34 (a) | | | 1,033,726 | | | 998,965 |
Flatiron CLO 20 Ltd., Series 2020-1A, Class AR, 3 mo. USD Term
SOFR + 1.380%
6.508% FRN 5/20/36 (a) | | | 1,000,000 | | | 1,002,240 |
Goodgreen Trust
Series 2019-2A, Class A,
2.760% 4/15/55 (a) | | | 1,836,419 | | | 1,619,087 |
| | | | | | | |
| | | | | |
The accompanying notes are an integral part of the financial statements. | | | | |
| | | 5
| |
| | | | | |
TABLE OF CONTENTS
| | MassMutual Short-Duration Bond Fund — Portfolio of Investments (Continued) | |
| | | | | | | |
Series 2016-1A, Class A,
3.230% 10/15/52 (a) | | | $ 680,952 | | | $ 632,627 |
Series 2019-1A, Class A,
3.860% 10/15/54 (a) | | | 1,479,737 | | | 1,378,795 |
GreenSky Home Improvement Trust, Series 2024-1, Class A4
5.670% 6/25/59 (a) | | | 800,000 | | | 811,626 |
Hero Funding Trust
| | | | | | |
Series 2017-3A, Class A1,
3.190% 9/20/48 (a) | | | 468,707 | | | 417,844 |
Series 2017-2A, Class A1,
3.280% 9/20/48 (a) | | | 92,797 | | | 83,242 |
Series 2016-4A, Class A1,
3.570% 9/20/47 (a) | | | 225,007 | | | 206,615 |
Series 2015-1A, Class A,
3.840% 9/21/40 (a) | | | 143,283 | | | 134,247 |
Series 2017-2A, Class A2,
4.070% 9/20/48 (a) | | | 75,397 | | | 69,434 |
Series 2018-1A, Class A2,
4.670% 9/20/48 (a) | | | 605,854 | | | 572,998 |
Hilton Grand Vacations Trust, Series 2019-AA, Class C
2.840% 7/25/33 (a) | | | 462,426 | | | 446,407 |
Horizon Aircraft Finance III Ltd., Series 2019-2, Class B
4.458% 11/15/39 (a) | | | 1,757,143 | | | 1,071,826 |
Mosaic Solar Loan Trust,
Series 2018-2GS, Class A
4.200% 2/22/44 (a) | | | 505,709 | | | 476,525 |
Mosaic Solar Loans LLC,
Series 2017-1A, Class A
4.450% 6/20/42 (a) | | | 80,508 | | | 78,810 |
Neuberger Berman CLO XX Ltd., Series 2015-20A, Class ARR, 3 mo. USD Term SOFR + 1.422%
6.723% FRN 7/15/34 (a) | | | 500,000 | | | 500,099 |
Newark BSL CLO 2 Ltd.,
Series 2017-1A, Class A2R, 3 mo. USD Term SOFR + 1.662%
6.946% FRN 7/25/30 (a) | | | 1,375,000 | | | 1,376,581 |
Oxford Finance Funding LLC, Series 2020-1A, Class B
4.037% 2/15/28 (a) | | | 339,904 | | | 337,017 |
PFS Financing Corp.,
Series 2022-A, Class B
2.770% 2/15/27 (a) | | | 800,000 | | | 790,832 |
PVOne LLC, Series 2023-2A, Class A 7.670% 9/17/35 (a) | | | 812,201 | | | 820,038 |
RR 8 Ltd., Series 2020-8A, Class A1R, 3 mo. USD Term SOFR + 1.350% 6.675% FRN 7/15/37 (a) | | | 1,000,000 | | | 1,000,279 |
| | | | | | | |
| | | | | | | |
Sierra Timeshare Receivables Funding LLC, Series 2020-2A, Class C 3.510% 7/20/37 (a) | | | $ 109,971 | | | $ 108,287 |
Symphony CLO XXII Ltd., Series 2020-22A, Class BR, 3 mo. USD Term SOFR + 1.680%
6.531% FRN 4/18/33 (a) | | | 750,000 | | | 750,131 |
Whitebox CLO III Ltd.,
Series 2021-3A, Class A1R, 3 mo. USD Term SOFR + 1.270%
1.000% FRN 10/15/35 (a) (d) | | | 750,000 | | | 750,000 |
| | | | | | 30,915,115 |
Student Loans Asset-Backed Securities — 5.7%
| | | | | | |
Chase Education Loan Trust, Series 2007-A, Class B, 90 day USD SOFR Average + 0.482%
5.814% FRN 3/28/68 | | | 286,969 | | | 265,897 |
College Avenue Student Loans LLC, Series 2017-A, Class A1, 1 mo. USD Term SOFR + 1.764%
6.619% FRN 11/26/46 (a) | | | 291,181 | | | 290,266 |
Commonbond Student Loan Trust
| | | | | | |
Series 2017-AGS, Class B,
3.470% 5/25/41 (a) | | | 219,039 | | | 189,461 |
Series 2018-AGS, Class C,
3.820% 2/25/44 (a) | | | 98,680 | | | 81,649 |
Series 2018-BGS, Class C,
4.120% 9/25/45 (a) | | | 80,965 | | | 68,871 |
Series 2018-CGS, Class C,
4.350% 2/25/46 (a) | | | 37,950 | | | 33,379 |
Series 2017-AGS, Class C,
5.280% 5/25/41 (a) | | | 149,221 | | | 137,182 |
Goal Structured Solutions Trust, Series 2015-1, Class B, 30 day USD SOFR Average + 1.614%
6.895% FRN 9/25/43 (a) | | | 100,000 | | | 88,621 |
Laurel Road Prime Student Loan Trust
| | | | | | |
Series 2019-A, Class BFX,
3.000% 10/25/48 (a) | | | 1,210,820 | | | 1,158,832 |
Series 2017-B, Class CFX,
3.610% 8/25/42 (a) | | | 688,402 | | | 674,425 |
Nelnet Student Loan Trust, Series 2018-5A, Class B, 1 mo. USD Term SOFR + 1.564%
6.419% FRN 2/25/67 (a) | | | 1,000,000 | | | 943,677 |
SLM Student Loan Trust
| | | | | | |
Series 2005-4, Class B, 90 day USD SOFR Average + 0.442%
5.801% FRN 7/25/55 | | | 384,181 | | | 360,054 |
Series 2006-5, Class B, 90 day USD SOFR Average + 0.472%
5.831% FRN 10/25/40 | | | 388,896 | | | 364,423 |
| | | | | | | |
| | | | | |
| | | The accompanying notes are an integral part of the financial statements.
| |
6
| | | | |
| | | | | |
TABLE OF CONTENTS
| | MassMutual Short-Duration Bond Fund — Portfolio of Investments (Continued) | |
| | | | | | | |
Series 2005-5, Class B, 90 day USD SOFR Average + 0.512%
5.871% FRN 10/25/40 | | | $ 407,899 | | | $ 372,918 |
Series 2005-8, Class B, 90 day USD SOFR Average + 0.572%
5.931% FRN 1/25/55 | | | 276,949 | | | 262,530 |
Series 2004-1, Class B, 90 day USD SOFR Average + 0.762%
6.121% FRN 7/25/39 | | | 244,277 | | | 233,207 |
Series 2003-4, Class B, 90 day USD SOFR Average + 0.912%
6.281% FRN 6/15/38 | | | 152,923 | | | 145,512 |
SMB Private Education Loan Trust
| | | | | | |
Series 2016-C, Class A2B, 1 mo. USD Term SOFR + 1.214% 6.311% FRN 9/15/34 (a) | | | 9,811 | | | 9,797 |
Series 2023-D, Class A1B, 30 day USD SOFR Average + 1.650% 6.992% FRN 9/15/53 (a) | | | 885,784 | | | 898,063 |
SoFi Alternative Trust,
Series 2019-C, Class PT,
5.240% VRN 1/25/45 (a) (e) | | | 1,371,230 | | | 1,355,577 |
SoFi Professional Loan Program LLC, Series 2019-A, Class BFX
4.110% 6/15/48 (a) | | | 870,000 | | | 800,659 |
Wachovia Student Loan Trust, Series 2005-1, Class B, 90 day USD SOFR Average + 0.562%
5.921% FRN 10/25/40 | | | 229,996 | | | 198,427 |
| | | | | | 8,933,427 |
Whole Loan Collateral Collateralized Mortgage Obligations — 8.5%
| | | |
Banc of America Mortgage Trust, Series 2004-G, Class 2A7,
6.643% VRN 8/25/34 (e) | | | 4,506 | | | 4,487 |
Credit Suisse Mortgage Trust, Series 2021-NQM4, Class M1, 2.472% VRN 5/25/66 (a) (e) | | | 7,095,350 | | | 5,234,710 |
Ellington Financial Mortgage Trust
| | | | | | |
Series 2024-INV2, Class A2, 5.289% VRN 10/25/69 (a) (e) | | | 750,000 | | | 750,028 |
Series 2024-INV2, Class A3, 5.441% VRN 10/25/69 (a) (e) | | | 750,000 | | | 750,029 |
Merrill Lynch Mortgage Investors Trust, Series 2004-A1, Class 2A2, 6.266% VRN 2/25/34 (e) | | | 30,495 | | | 29,281 |
OBX Trust, Series 2021-NQM1, Class M1,
2.219% VRN 2/25/66 (a) (e) | | | 2,501,000 | | | 1,765,280 |
| | | | | | | |
| | | | | | | |
TRK Trust, Series 2021-INV1, Class M1,
2.585% VRN 7/25/56 (a) (e) | | | $ 1,222,000 | | | $1,004,959 |
Verus Securitization Trust
| | | | | | |
Series 2021-1, Class M1,
1.968% VRN 1/25/66 (a) (e) | | | 2,247,000 | | | 1,738,143 |
Series 2019-INV3, Class M1, 3.279% VRN 11/25/59 (a) (e) | | | 2,129,000 | | | 2,088,434 |
| | | | | | 13,365,351 |
TOTAL NON-U.S. GOVERNMENT AGENCY OBLIGATIONS
(Cost $67,341,118) | | | | | | 61,143,947 |
U.S. Government Agency Obligations and Instrumentalities (f) — 0.0%
| | | | | | |
Pass-Through Securities — 0.0%
| | | | | | |
Federal Home Loan Mortgage Corp. Pool #1Q0239 1 yr. CMT + 2.143% 6.356% FRN 3/01/37 | | | 39,124 | | | 39,656 |
TOTAL BONDS & NOTES
(Cost $138,171,032) | | | | | | 132,494,438 |
TOTAL LONG-TERM INVESTMENTS
(Cost $138,171,032) | | | | | | 132,494,438
|
Short-Term Investments — 15.3%
| | | | | | |
Commercial Paper — 12.7%
| | | | | | |
Alimentation Couche-Tard, Inc. 5.039% 10/11/24 (a) | | | 2,000,000 | | | 1,996,937 |
Avangrid, Inc.
5.037% 10/15/24 (a) | | | 2,000,000 | | | 1,995,796 |
EIDP, Inc.
5.753% 12/02/24 (a) | | | 2,000,000 | | | 1,983,232 |
Microchip Technology, Inc.
5.460% 10/18/24 (a) | | | 3,000,000 | | | 2,992,358 |
Nutrien Financial US LLC
5.012% 10/30/24 (a) | | | 5,000,000 | | | 4,979,250 |
Spire, Inc.
5.324% 10/15/24 (a) | | | 6,000,000 | | | 5,987,605 |
| | | | | | 19,935,178 |
| | | | | | | |
| | | | | | | |
Investment of Cash Collateral from Securities Loaned — 0.5%
| | | | | | |
State Street Navigator Securities Lending Government Money
Market Portfolio (g) | | | 821,925 | | | 821,925 |
| | | | | | | |
| | | | | |
The accompanying notes are an integral part of the financial statements. | | | | |
| | | 7
| |
| | | | | |
TABLE OF CONTENTS
| | MassMutual Short-Duration Bond Fund — Portfolio of Investments (Continued) | |
| | | | | | | |
Repurchase Agreement — 2.1%
| | | | | | |
Fixed Income Clearing Corp., Repurchase Agreement, dated 9/30/24, 1.520%, due 10/01/24 (h) | | | $3,249,821 | | | $3,249,821 |
TOTAL SHORT-TERM INVESTMENTS
(Cost $24,006,597) | | | | | | 24,006,924 |
TOTAL INVESTMENTS — 99.6% (Cost $162,177,629) (i) | | | | | | 156,501,362 |
Other Assets/(Liabilities) — 0.4% | | | | | | 584,502 |
NET ASSETS — 100.0% | | | | | | $157,085,864 |
| | | | | | | |
Abbreviation Legend
| | | | | |
CLO | | | Collateralized Loan Obligation
| |
CMT | | | Constant Maturity Treasury Index
| |
FRN | | | Floating Rate Note
| |
ICE | | | Inter-Continental Exchange
| |
SOFR | | | Secured Overnight Financing Rate
| |
VRN | | | Variable Rate Note | |
| | | | | |
Notes to Portfolio of Investments
Percentages are stated as a percent of net assets.
(a)
| Security is exempt from registration under Regulation S or Rule 144A of the Securities Act of 1933. These securities are considered restricted and may be resold in transactions exempt from registration. At September 30, 2024, the aggregate market value of these securities amounted to $116,504,491 or 74.17% of net assets.
|
(b)
| Restricted security. Certain securities are restricted to resale. At September 30, 2024, these securities amounted to a value of $1,254,092 or 0.80% of net assets. The Fund generally bears the costs, if any, associated with the disposition of restricted securities.
|
(c)
| Denotes all or a portion of security on loan. The total value of securities on loan as of September 30, 2024, was $964,974 or 0.61% of net assets. The Fund received $164,482 of non-cash collateral (U.S. Treasury and/or Agency obligations) related to securities lending activity. This amount is not reflected on either the Portfolio of Investments or the Statement of Assets and Liabilities. (Note 2).
|
(d)
| A portion of this security is purchased on a when-issued, delayed-delivery or forward commitment basis. (Note 2).
|
(e)
| Certain variable rate securities are not based on a published reference rate and spread but are determined by the issuer or agent and are based on current market conditions. These securities do not indicate a reference rate and spread in their description above. The rates shown are the current interest rates at September 30, 2024.
|
(f)
| May contain securities that are issued by a U.S. Government Agency, but are unsecured and are not guaranteed by a U.S. Government Agency.
|
(g)
| Represents investment of security lending cash collateral. (Note 2).
|
(h)
| Maturity value of $3,249,958. Collateralized by U.S. Government Agency obligations with a rate of 2.125%, maturity date of 2/15/54, and an aggregate market value, including accrued interest, of $3,314,894.
|
(i)
| See Note 6 for aggregate cost for federal tax purposes. |
Country weightings, as a percentage of net assets, is as follows:
| | | | |
United States | | | 58.2 % |
Cayman Islands | | | 9.6 % |
France | | | 2.0 % |
United Kingdom | | | 1.9 % |
Canada | | | 1.4 % |
Netherlands | | | 1.3 % |
India | | | 1.1 % |
Indonesia | | | 1.0 % |
Ireland | | | 0.8 % |
China | | | 0.8 % |
Qatar | | | 0.7 % |
Jordan | | | 0.7 % |
Kuwait | | | 0.7 % |
United Arab Emirates | | | 0.7 % |
Bermuda | | | 0.6 % |
Republic of Korea | | | 0.5 % |
Switzerland | | | 0.5 % |
Australia | | | 0.5 % |
Denmark | | | 0.5 % |
Brazil | | | 0.5 % |
Germany | | | 0.3 % |
Total Long-Term Investments | | | 84.3 % |
Short-Term Investments and Other Assets and Liabilities | | | 15.7 % |
Net Assets | | | 100.0 % |
| | | | |
| | | | | |
| | | The accompanying notes are an integral part of the financial statements.
| |
8
| | | | |
| | | | | |
TABLE OF CONTENTS
| | MassMutual Short-Duration Bond Fund — Portfolio of Investments (Continued) | |
Futures contracts
| | | | | | | | | | | | | |
Long
| | | | | | | | | | | | |
U.S. Treasury Note 2 Year
| | | 12/31/24 | | | 396 | | | $82,292,165 | | | $171,741 |
Short
| | | | | | | | | | | | |
U.S. Treasury Long Bond
| | | 12/19/24 | | | 24 | | | $(2,994,857) | | | $14,357 |
U.S. Treasury Ultra 10 Year
| | | 12/19/24 | | | 62 | | | (7,338,152) | | | 3,746 |
U.S. Treasury Ultra Bond
| | | 12/19/24 | | | 1 | | | (134,083) | | | 989 |
U.S. Treasury Note 5 Year
| | | 12/31/24 | | | 282 | | | (30,967,313) | | | (19,640) |
| | | | | | | | | | | | $(548) |
| | | | | | | | | | | | | |
| | | | | |
The accompanying notes are an integral part of the financial statements. | | | | |
| | | 9
| |
| | | | | |
TABLE OF CONTENTS
| | | |
| | MassMutual Inflation-Protected and Income Fund — Portfolio of Investments | |
| | | |
| | | | | | | |
Bonds & Notes — 84.4%
| | | | | | |
Non-U.S. Government Agency
Obligations — 57.7%
|
Automobile Asset-Backed Securities — 12.5%
|
American Credit Acceptance Receivables Trust, Series 2021-2, Class E
2.540% 7/13/27 (a) | | | $4,700,000 | | | $4,655,453 |
BOF URSA VI Funding Trust I, Series 2023-CAR2, Class A2 5.542% 10/27/31 (a) | | | 1,559,758 | | | 1,570,273 |
Carvana Auto Receivables Trust, Series 2021-N3, Class B
0.660% 6/12/28 | | | 872,539 | | | 838,562 |
Drive Auto Receivables Trust
| | | | | | |
Series 2021-1, Class D,
1.450% 1/16/29 | | | 3,775,076 | | | 3,712,589 |
Series 2021-3, Class C,
1.470% 1/15/27 | | | 852,852 | | | 848,479 |
Exeter Automobile Receivables Trust
| | | | | | |
Series 2021-2A, Class D,
1.400% 4/15/27 | | | 1,819,860 | | | 1,770,422 |
Series 2020-3A, Class E,
3.440% 8/17/26 (a) | | | 3,412,257 | | | 3,380,175 |
Series 2023-5A, Class A2, 6.200% 4/15/26 | | | 160,047 | | | 160,134 |
Flagship Credit Auto Trust, Series 2021-2, Class C
1.270% 6/15/27 (a) | | | 4,914,179 | | | 4,824,175 |
Ford Credit Auto Owner Trust, Series 2018-1, Class C
3.490% 7/15/31 (a) | | | 3,500,000 | | | 3,480,098 |
OneMain Direct Auto Receivables Trust, Series 2022-1A, Class C 5.310% 6/14/29 (a) | | | 1,100,000 | | | 1,103,827 |
Santander Drive Auto Receivables Trust, Series 2021-2, Class D 1.350% 7/15/27 | | | 2,805,087 | | | 2,761,730 |
Westlake Automobile Receivables Trust, Series 2023-4A, Class A2 6.230% 1/15/27 (a) | | | 1,323,392 | | | 1,330,382 |
| | | | | | 30,436,299 |
Commercial Mortgage-Backed Securities — 3.7%
|
BHMS Mortgage Trust, Series 2018-ATLS, Class B, 1 mo.
USD Term SOFR + 1.797%
6.894% FRN 7/15/35 (a) | | | 1,150,000 | | | 1,141,378 |
| | | | | | | |
| | | | | | | |
CAMB Commercial Mortgage Trust, Series 2019-LIFE, Class D, 1 mo. USD Term SOFR + 2.047%
7.144% FRN 12/15/37 (a) | | | $250,836 | | | $250,523 |
COMM Mortgage Trust,
Series 2015-LC19, Class D
2.867% 2/10/48 (a) | | | 2,457,000 | | | 2,259,779 |
Extended Stay America Trust
| | | | | | |
Series 2021-ESH, Class D, 1 mo. USD Term SOFR + 2.364% 7.462% FRN 7/15/38 (a) | | | 1,158,346 | | | 1,158,346 |
Series 2021-ESH, Class F, 1 mo. USD Term SOFR + 3.814% 8.912% FRN 7/15/38 (a) | | | 1,603,864 | | | 1,603,863 |
KREF Ltd., Series 2021-FL2, Class D, 1 mo. USD Term
SOFR + 2.314%
7.397% FRN 2/15/39 (a) | | | 900,000 | | | 846,413 |
Ready Capital Mortgage Financing LLC, Series 2023-FL12, Class A, 1 mo. USD Term SOFR + 2.335%
7.190% FRN 5/25/38 (a) | | | 1,870,749 | | | 1,873,082 |
| | | | | | 9,133,384 |
Home Equity Asset-Backed Securities — 1.1%
|
Home Equity Asset Trust, Series 2005-9, Class M1, 1 mo. USD Term SOFR + 0.729%
5.584% FRN 4/25/36 | | | 872,075 | | | 860,268 |
JP Morgan Mortgage Acquisition Trust, Series 2007-CH3, Class A5, 1 mo. USD Term SOFR + 0.374%
5.229% FRN 3/25/37 | | | 188,016 | | | 185,173 |
Point Securitization Trust, Series 2024-1, Class A1
6.500% 6/25/54 (a) | | | 1,567,616 | | | 1,573,576 |
Structured Asset Securities Corp. Mortgage Loan Trust, Series 2006-BC6, Class A4,
1 mo. USD Term SOFR + 0.284% 5.139% FRN 1/25/37 | | | 84,450 | | | 83,289 |
| | | | | | 2,702,306 |
Other Asset-Backed Securities — 27.9%
|
321 Henderson Receivables I LLC, Series 2006-3A, Class A1, 1 mo. USD Term SOFR + 0.314% 5.411% FRN 9/15/41 (a) | | | 30,430 | | | 30,090 |
| | | | | | | |
| | | | | |
| | | The accompanying notes are an integral part of the financial statements.
| |
10
| | | | |
| | | | | |
TABLE OF CONTENTS
| | MassMutual Inflation-Protected and Income Fund — Portfolio of Investments (Continued) | |
| | | | | | | |
ACHV ABS Trust, Series 2024-1PL, Class A
5.900% 4/25/31 (a) | | | $1,434,106 | | | $1,446,228 |
Affirm Asset Securitization Trust
| | | | | | |
Series 2021-Z2, Class A,
1.170% 11/16/26 (a) | | | 91,500 | | | 90,551 |
Series 2022-X1, Class A,
1.750% 2/15/27 (a) | | | 34,463 | | | 34,421 |
Series 2023-A, Class 1A,
6.610% 1/18/28 (a) | | | 10,710,000 | | | 10,755,163 |
Series 2023-X1, Class A,
7.110% 11/15/28 (a) | | | 1,934,114 | | | 1,941,652 |
Series 2023-X1, Class B,
7.770% 11/15/28 (a) | | | 2,250,000 | | | 2,277,701 |
Alterna Funding III LLC
| | | | | | |
Series 2024-1A, Class A,
6.260% 5/16/39 (a) | | | 2,013,482 | | | 2,049,906 |
Series 2024-1A, Class B,
7.136% 5/16/39 (a) | | | 1,224,235 | | | 1,244,553 |
BHG Securitization Trust
| | | | | | |
Series 2021-B, Class A,
0.900% 10/17/34 (a) | | | 206,974 | | | 205,169 |
Series 2021-A, Class A,
1.420% 11/17/33 (a) | | | 1,505,645 | | | 1,457,007 |
Series 2022-C, Class A,
5.320% 10/17/35 (a) | | | 584,223 | | | 584,183 |
Series 2023-A, Class A,
5.550% 4/17/36 (a) | | | 1,910,800 | | | 1,915,138 |
CARS-DB4 LP, Series 2020-1A, Class A1 2.690% 2/15/50 (a) | | | 1,256,473 | | | 1,242,407 |
Conn’s Receivables Funding LLC, Series 2024-A, Class A
7.050% 1/16/29 (a) | | | 468,535 | | | 468,956 |
FCI Funding LLC, Series 2024-1A, Class A 5.440% 8/15/36 (a) | | | 968,903 | | | 970,114 |
FNA VI LLC, Series 2021-1A, Class A 1.350% 1/10/32 (a) | | | 2,087,298 | | | 1,955,211 |
GreenSky Home Improvement Trust, Series 2024-1, Class A2 5.880% 6/25/59 (a) | | | 4,000,000 | | | 4,050,959 |
Hilton Grand Vacations Trust, Series 2022-2A, Class C
5.570% 1/25/37 (a) | | | 811,792 | | | 814,281 |
LL ABS Trust, Series 2022-1A, Class B 5.050% 11/15/29 (a) | | | 504,663 | | | 504,187 |
Marlette Funding Trust
| | | | | | |
Series 2022-2A, Class B,
5.500% 8/15/32 (a) | | | 1,647,366 | | | 1,647,724 |
Series 2023-2A, Class A,
6.040% 6/15/33 (a) | | | 111,855 | | | 111,905 |
| | | | | | | |
| | | | | | | |
MCA Fund Holding LLC, Series 2020-1, Class A
3.250% 11/15/35 (a) | | | $546,460 | | | $529,512 |
MVW Owner Trust, Series 2018-1A, Class A
3.450% 1/21/36 (a) | | | 248,346 | | | 246,786 |
NP SPE II LLC, Series 2019-1A, Class A1
2.574% 9/20/49 (a) | | | 103,286 | | | 100,444 |
Oak Street Investment Grade Net Lease Fund
| | | | | | |
Series 2021-1A, Class A1,
1.480% 1/20/51 (a) | | | 4,068,236 | | | 3,861,715 |
Series 2020-1A, Class A1,
1.850% 11/20/50 (a) | | | 2,299,571 | | | 2,205,485 |
Oxford Finance Funding LLC, Series 2020-1A, Class A2 3.101% 2/15/28 (a) | | | 3,604,575 | | | 3,571,783 |
Pagaya AI Debt Grantor Trust
| | | | | | |
Series 2024-8, Class A,
5.331% 1/15/32 (a) | | | 5,000,000 | | | 5,012,558 |
Series 2024-5, Class A,
6.278% 10/15/31 (a) | | | 1,730,309 | | | 1,753,905 |
Pagaya AI Debt Trust
| | | | | | |
Series 2024-4, Class B,
6.539% 8/15/31 (a) | | | 4,489,828 | | | 4,552,957 |
Series 2023-5, Class A,
7.179% 4/15/31 (a) | | | 386,875 | | | 387,531 |
PFS Financing Corp.,
Series 2022-A, Class B
2.770% 2/15/27 (a) | | | 1,100,000 | | | 1,087,395 |
PVOne LLC, Series 2023-2A, Class A
7.670% 9/17/35 (a) | | | 952,490 | | | 961,680 |
RAM LLC, Series 2024-1, Class A 6.669% 2/15/39 (a) | | | 3,048,218 | | | 3,076,997 |
Reach ABS Trust, Series 2024-1A, Class A
6.300% 2/18/31 (a) | | | 801,682 | | | 806,109 |
Reach Financial LLC,
Series 2023-1A, Class A
7.050% 2/18/31 (a) | | | 951,840 | | | 954,535 |
SBA Tower Trust,
Series 2014-2A, Class C,
3.869% STEP 10/15/49 (a) | | | 3,200,000 | | | 3,198,937 |
| | | | | | 68,105,835 |
Real Estate Investment Trusts (REITS) — 0.6%
|
SBA Tower Trust
2. 836% 1/15/50 (a) | | | 1,375,000 | | | 1,365,124 |
| | | | | | | |
| | | | | |
The accompanying notes are an integral part of the financial statements. | | | | |
| | | 11
| |
| | | | | |
TABLE OF CONTENTS
| | MassMutual Inflation-Protected and Income Fund — Portfolio of Investments (Continued) | |
| | | | | | | |
Student Loans Asset-Backed Securities — 5.5%
|
Commonbond Student Loan Trust
| | | | | | |
Series 2021-AGS, Class B,
1.400% 3/25/52 (a) | | | $123,010 | | | $95,390 |
Series 2018-CGS, Class C,
4.350% 2/25/46 (a) | | | 9,831 | | | 8,647 |
Series 2019-AGS, Class A2, 1 mo. USD Term SOFR + 1.014% 5.869% FRN 1/25/47 (a) | | | 121,326 | | | 116,390 |
JP Morgan Student Loan Trust, Series 2007-A, Class B, 90 day USD SOFR Average + 0.612% 5.971% FRN 6/28/39 (a) | | | 148,509 | | | 132,646 |
Laurel Road Prime Student Loan Trust, Series 2019-A, Class A1FX
2.340% 10/25/48 (a) | | | 37,719 | | | 36,889 |
Navient Private Education Refi Loan Trust
| | | | | | |
Series 2021-A, Class A,
0.840% 5/15/69 (a) | | | 3,682,357 | | | 3,349,694 |
Series 2020-HA, Class A,
1.310% 1/15/69 (a) | | | 761,304 | | | 712,939 |
Navient Student Loan Trust, Series 2016-7A, Class A, 30 day USD SOFR Average + 1.264% 6.545% FRN 3/25/66 (a) | | | 946,221 | | | 953,063 |
Nelnet Student Loan Trust
| | | | | | |
Series 2005-2, Class B, 90 day USD SOFR Average + 0.432%
5.803% FRN 3/23/37 | | | 523,365 | | | 505,942 |
Series 2006-2, Class B, 90 day USD SOFR Average + 0.462%
5.821% FRN 1/25/38 | | | 269,434 | | | 229,550 |
Series 2006-3, Class B, 90 day USD SOFR Average + 0.512%
5.861% FRN 6/25/41 | | | 112,706 | | | 100,758 |
Series 2004-3, Class B, 90 day USD SOFR Average + 0.612%
5.971% FRN 10/25/40 | | | 545,845 | | | 539,489 |
Series 2014-2A, Class B, 30 day USD SOFR Average + 1.614% 6.895% FRN 6/25/41 (a) | | | 295,000 | | | 287,103 |
SLC Student Loan Trust
| | | | | | |
Series 2006-2, Class B, 90 day USD SOFR Average + 0.492%
5.861% FRN 12/15/39 | | | 154,861 | | | 137,724 |
Series 2005-2, Class B, 90 day USD SOFR Average + 0.542%
5.911% FRN 3/15/40 | | | 489,815 | | | 444,275 |
| | | | | | | |
| | | | | | | |
SLM Student Loan Trust
| | | | | | |
Series 2006-4, Class B, 90 day USD SOFR Average + 0.462%
5.821% FRN 1/25/70 | | | $108,215 | | | $100,837 |
Series 2006-5, Class B, 90 day USD SOFR Average + 0.472%
5.831% FRN 10/25/40 | | | 200,789 | | | 188,153 |
Series 2006-2, Class B, 90 day USD SOFR Average + 0.482%
5.841% FRN 1/25/41 | | | 195,695 | | | 182,356 |
Series 2005-8, Class B, 90 day USD SOFR Average + 0.572%
5.931% FRN 1/25/55 | | | 166,169 | | | 157,518 |
Series 2004-3, Class B, 90 day USD SOFR Average + 0.732%
6.091% FRN 10/25/64 | | | 104,156 | | | 98,394 |
SMB Asset-Backed Repackaging Trust, Series 2024-R1, Class M 6.000% 9/15/54 (a) | | | 3,797,334 | | | 3,778,966 |
SMB Private Education Loan Trust, Series 2019-A, Class A2B, 1 mo. USD Term SOFR + 0.984% 6.081% FRN 7/15/36 (a) | | | 510,861 | | | 509,111 |
SoFi Alternative Trust, Series 2019-C, Class PT,
5.240% VRN 1/25/45 (a) (b) | | | 346,708 | | | 342,750 |
SoFi Professional Loan Program LLC, Series 2018-D, Class A2FX 3.600% 2/25/48 (a) | | | 400,690 | | | 393,111 |
| | | | | | 13,401,695 |
Whole Loan Collateral Collateralized
Mortgage Obligations — 6.4%
|
Angel Oak Mortgage Trust, Series 2022-2, Class A1,
3.353% VRN 1/25/67 (a) (b) | | | 1,888,644 | | | 1,801,363 |
BRAVO Residential Funding Trust, Series 2021-NQM2, Class A3, 1.435% VRN 3/25/60 (a) (b) | | | 444,619 | | | 426,932 |
CIM Trust, Series 2019-INV3, Class A11, 30 day USD SOFR Average + 1.064%
5.500% FRN 8/25/49 (a) | | | 603,114 | | | 575,037 |
COLT Mortgage Loan Trust, Series 2022-1, Class A1,
2.284% VRN 12/27/66 (a) (b) | | | 6,969,406 | | | 6,398,105 |
Deephaven Residential Mortgage Trust, Series 2021-1, Class A3, 1.128% VRN 5/25/65 (a) (b) | | | 300,748 | | | 282,818 |
First Franklin Mortgage Loan Trust, Series 2006-FF15, Class A5,
1 mo. USD Term SOFR + 0.274% 5.129% FRN 11/25/36 | | | 162,648 | | | 163,659 |
| | | | | | | |
| | | | | |
| | | The accompanying notes are an integral part of the financial statements.
| |
12
| | | | |
| | | | | |
TABLE OF CONTENTS
| | MassMutual Inflation-Protected and Income Fund — Portfolio of Investments (Continued) | |
| | | | | | | |
OBX Trust
| | | | | | |
Series 2021-NQM2, Class A2, 1.357% VRN 5/25/61 (a) (b) | | | $551,007 | | | $460,563 |
Series 2020-EXP1, Class 2A2,
1 mo. USD Term SOFR + 1.064%
5.919% FRN 2/25/60 (a) | | | 234,019 | | | 226,063 |
PSMC Trust, Series 2020-2, Class A2,
3.000% VRN 5/25/50 (a) (b) | | | 697,165 | | | 628,031 |
STAR Trust, Series 2021-1, Class A3,
1.528% VRN 5/25/65 (a) (b) | | | 2,573,105 | | | 2,327,484 |
Starwood Mortgage Residential Trust
| | | | | | |
Series 2020-1, Class M1,
2.878% VRN 2/25/50 (a) (b) | | | 1,000,000 | | | 870,381 |
Series 2019-INV1, Class A3, 2.916% VRN 9/27/49 (a) (b) | | | 662,215 | | | 643,202 |
Verus Securitization Trust
| | | | | | |
Series 2021-3, Class A3,
1.437% VRN 6/25/66 (a) (b) | | | 781,415 | | | 680,519 |
Series 2019-INV2, Class A3, 4.219% VRN 7/25/59 (a) (b) | | | 116,265 | | | 115,635 |
| | | | | | 15,599,792 |
TOTAL NON-U.S. GOVERNMENT AGENCY OBLIGATIONS
(Cost $141,508,962) | | | | | | 140,744,435 |
U.S. Government Agency Obligations and Instrumentalities (c) — 6.8%
|
Whole Loans — 6.8%
| | | | | | |
Federal Home Loan Mortgage Corp. STACR REMICS Trust
| | | | | | |
Series 2021-DNA6, Class M1,
30 day USD SOFR Average + 0.800% 6.080% FRN
10/25/41 (a) | | | 1,190,713 | | | 1,190,708 |
Series 2021-DNA7, Class M1,
30 day USD SOFR Average + 0.850% 6.130% FRN
11/25/41 (a) | | | 1,058,697 | | | 1,057,173 |
Series 2022-DNA1, Class M1A, 30 day USD SOFR Average + 1.000% 6.280% FRN
1/25/42 (a) | | | 435,089 | | | 435,249 |
Series 2022-DNA2, Class M1A, 30 day USD SOFR Average + 1.300% 6.580% FRN
2/25/42 (a) | | | 1,627,397 | | | 1,631,788 |
Series 2020-DNA1, Class M2,
30 day USD SOFR Average + 1.814%
7.095% FRN 1/25/50 (a) | | | 366,119 | | | 367,709 |
| | | | | | | |
| | | | | | | |
Series 2022-DNA3, Class M1A,
30 day USD SOFR Average + 2.000%
7.280% FRN 4/25/42 (a) | | | $2,050,683 | | | $2,076,562 |
Series 2018-DNA3, Class M2A, 30 day USD SOFR Average + 2.214%
7.495% FRN 9/25/48 (a) | | | 152,027 | | | 152,633 |
Series 2022-DNA5, Class M1A, 30 day USD SOFR Average + 2.950%
8.230% FRN 6/25/42 (a) | | | 2,074,817 | | | 2,130,093 |
Federal National Mortgage Association Connecticut Avenue Securities
| | | | | | |
Series 2023-R05, Class 1M1,
30 day USD SOFR Average + 1.900%
7.163% FRN 6/25/43 (a) | | | 1,010,187 | | | 1,020,387 |
Series 2022-R05, Class 2M1,
30 day USD SOFR Average + 1.900%
7.180% FRN 4/25/42 (a) | | | 486,298 | | | 489,878 |
Series 2023-R03, Class 2M1,
30 day USD SOFR Average + 2.500%
7.780% FRN 4/25/43 (a) | | | 2,173,171 | | | 2,211,566 |
Series 2022-R07, Class 1M1,
30 day USD SOFR Average + 2.950%
8.213% FRN 6/25/42 (a) | | | 3,642,863 | | | 3,752,182 |
| | | | | | 16,515,928 |
TOTAL U.S. GOVERNMENT AGENCY OBLIGATIONS AND INSTRUMENTALITIES
(Cost $16,388,518) | | | | | | 16,515,928 |
U.S. Treasury Obligations — 19.9%
|
U.S. Treasury Bonds & Notes — 19.9%
| | | |
U.S. Treasury Inflation-Indexed Bonds
| | | | | | |
0.125% 2/15/51 | | | 785,259 | | | 495,609 |
0.125% 2/15/52 | | | 1,016,883 | | | 632,157 |
0.250% 2/15/50 | | | 734,034 | | | 486,983 |
0.625% 2/15/43 | | | 205,206 | | | 164,662 |
0.750% 2/15/42 | | | 974,372 | | | 811,871 |
0.750% 2/15/45 | | | 1,255,539 | | | 1,003,221 |
0.875% 2/15/47 | | | 781,782 | | | 627,498 |
1.000% 2/15/46 | | | 663,715 | | | 552,845 |
1.000% 2/15/48 | | | 446,418 | | | 366,652 |
1.000% 2/15/49 | | | 506,222 | | | 412,795 |
1.375% 2/15/44 | | | 1,349,560 | | | 1,230,466 |
| | | | | | | |
| | | | | |
The accompanying notes are an integral part of the financial statements. | | | | |
| | | 13
| |
| | | | | |
TABLE OF CONTENTS
| | MassMutual Inflation-Protected and Income Fund — Portfolio of Investments (Continued) | |
| | | | | | | |
1.500% 2/15/53 | | | $740,677 | | | $669,412 |
1.750% 1/15/28 | | | 1,201,080 | | | 1,210,761 |
2.125% 2/15/40 | | | 509,324 | | | 531,407 |
2.125% 2/15/41 | | | 660,680 | | | 691,172 |
2.125% 2/15/54 | | | 512,420 | | | 532,755 |
2.500% 1/15/29 | | | 952,231 | | | 993,079 |
3.375% 4/15/32 | | | 354,398 | | | 400,299 |
3.875% 4/15/29 | | | 478,315 | | | 527,863 |
U.S. Treasury Inflation-Indexed Notes
| | | | | | |
0.125% 4/15/25 | | | 2,435,360 | | | 2,391,966 |
0.125% 1/15/30 | | | 2,322,731 | | | 2,166,974 |
0.125% 7/15/30 | | | 2,392,163 | | | 2,224,281 |
0.125% 1/15/31 | | | 2,537,325 | | | 2,331,270 |
0.125% 7/15/31 | | | 2,112,336 | | | 1,932,276 |
0.125% 1/15/32 | | | 2,042,370 | | | 1,845,710 |
0.250% 7/15/29 | | | 1,475,544 | | | 1,399,832 |
0.500% 1/15/28 | | | 1,912,680 | | | 1,851,879 |
0.625% 7/15/32 | | | 2,598,072 | | | 2,432,448 |
0.750% 7/15/28 (d) | | | 1,528,684 | | | 1,494,716 |
0.875% 1/15/29 | | | 1,993,024 | | | 1,945,619 |
1.125% 1/15/33 | | | 2,534,160 | | | 2,444,932 |
1.250% 4/15/28 | | | 2,097,200 | | | 2,077,299 |
1.375% 7/15/33 | | | 2,868,695 | | | 2,827,563 |
1.625% 10/15/27 | | | 2,919,868 | | | 2,938,970 |
1.750% 1/15/34 | | | 1,739,474 | | | 1,758,764 |
2.375% 10/15/28 | | | 2,156,448 | | | 2,239,552 |
| | | | | | 48,645,558 |
TOTAL U.S. TREASURY OBLIGATIONS
(Cost $50,332,490) | | | | | | 48,645,558 |
TOTAL BONDS & NOTES
(Cost $208,229,970) | | | | | | 205,905,921 |
TOTAL LONG-TERM INVESTMENTS
(Cost $208,229,970) | | | | | | 205,905,921 |
Short-Term Investments — 15.3%
|
Commercial Paper — 15.1%
| | | | | | |
Alimentation Couche-Tard, Inc. 5.480% 10/10/24 (a) | | | 4,000,000 | | | 3,994,434 |
CRH America Finance, Inc.
5.730% 10/08/24 (a) | | | 3,000,000 | | | 2,996,711 |
5.733% 10/15/24 (a) | | | 4,000,000 | | | 3,991,737 |
Dominion Energy South Carolina, Inc.
5.382% 10/16/24 | | | 5,000,000 | | | 4,988,864 |
Evergy, Inc. 4.959% 10/01/24 | | | 5,000,000 | | | 4,999,318 |
| | | | | | | |
| | | | | | | |
HP, Inc.
4.993% 10/01/24 (a) | | | $2,000,000 | | | $1,999,727 |
Hubbell, Inc.
4.983% 10/07/24 (a) | | | 4,000,000 | | | 3,996,166 |
Microchip Technology, Inc.
5.470% 10/18/24 (a) | | | 4,000,000 | | | 3,989,811 |
Penske Truck Leasing Co. LP 5.665% 10/15/24 | | | 4,000,000 | | | 3,991,543 |
Tampa Electric Co.
5.084% 10/15/24 (a) | | | 2,000,000 | | | 1,995,972 |
| | | | | | 36,944,283 |
Repurchase Agreement — 0.2%
| | | | | | |
Fixed Income Clearing Corp., Repurchase Agreement, dated 9/30/24, 1.520%, due 10/01/24 (e) | | | 563,043 | | | 563,043 |
TOTAL SHORT-TERM INVESTMENTS
(Cost $37,508,934) | | | | | | 37,507,326 |
TOTAL INVESTMENTS — 99.7%
(Cost $245,738,904) (f)
| | | 243,413,247 |
Other Assets/
(Liabilities) — 0.3% | | | | | | 685,689 |
NET ASSETS — 100.0% | | | | | | $244,098,936 |
| | | | | | | |
Abbreviation Legend
| | | | | |
FRN | | | Floating Rate Note
| |
REMICS | | | Real Estate Mortgage Investment Conduits
| |
SOFR | | | Secured Overnight Financing Rate
| |
STEP | | | Step Coupon Bond
| |
VRN | | | Variable Rate Note | |
| | | | | |
Notes to Portfolio of Investments
Percentages are stated as a percent of net assets.
(a)
| Security is exempt from registration under Regulation S or Rule 144A of the Securities Act of 1933. These securities are considered restricted and may be resold in transactions exempt from registration. At September 30, 2024, the aggregate market value of these securities amounted to $166,155,620 or 68.07% of net assets.
|
(b)
| Certain variable rate securities are not based on a published reference rate and spread but are determined by the issuer or agent and are based on current market conditions. These securities do not indicate a reference rate and spread in their description above. The rates shown are the current interest rates at September 30, 2024.
|
(c)
| May contain securities that are issued by a U.S. Government Agency, but are unsecured and are not guaranteed by a U.S. Government Agency.
|
(d)
| All or a portion of this security is pledged/held as collateral for open derivatives. (Note 2).
|
| | | | | |
| | | The accompanying notes are an integral part of the financial statements.
| |
14
| | | | |
| | | | | |
TABLE OF CONTENTS
| | MassMutual Inflation-Protected and Income Fund — Portfolio of Investments (Continued) | |
Notes to Portfolio of Investments (Continued)
(e)
| Maturity value of $563,067. Collateralized by U.S. Government Agency obligations with a rate of 2.875%, maturity date of 5/15/52, and an aggregate market value, including accrued interest, of $574,415. |
(f)
| See Note 6 for aggregate cost for federal tax purposes. |
Futures contracts
| | | | | | | | | | | | | |
Long
| | | | | | | | | | | | |
U.S. Treasury Ultra Bond
| | | 12/19/24 | | | 2 | | | $268,196 | | | $(2,008) |
U.S. Treasury Note 2 Year
| | | 12/31/24 | | | 40 | | | 8,347,312 | | | (17,624) |
| | | | | | | | | | | | $(19,632) |
Short
| | | | | | | | | | | | |
U.S. Treasury Long Bond
| | | 12/19/24 | | | 11 | | | $(1,391,628) | | | $25,565 |
U.S. Treasury Note 10 Year
| | | 12/19/24 | | | 15 | | | (1,729,092) | | | 14,873 |
U.S. Treasury Ultra 10 Year
| | | 12/19/24 | | | 6 | | | (710,137) | | | 356 |
U.S. Treasury Note 2 Year
| | | 12/31/24 | | | 299 | | | (62,147,487) | | | (116,927) |
U.S. Treasury Note 5 Year
| | | 12/31/24 | | | 13 | | | (1,427,320) | | | (1,157) |
| | | | | | | | | | | | $(77,290) |
| | | | | | | | | | | | | |
Centrally Cleared Interest Rate Swaps
| | | | | | | | | | | | | | | | | |
Fixed 2.490%
| | | Maturity | | | U.S. Consumer Price Index | | | Maturity | | | 7/31/26 | | | USD | | | 1,500,000 | | | $320 | | | $ — | | | $320 |
Fixed 2.482%
| | | Maturity | | | U.S. Consumer Price Index | | | Maturity | | | 9/07/26 | | | USD | | | 3,000,000 | | | (1,980) | | | — | | | (1,980) |
Fixed 2.164%
| | | Maturity | | | U.S. Consumer Price Index | | | Maturity | | | 9/19/26 | | | USD | | | 7,000,000 | | | 6,399 | | | — | | | 6,399 |
| | | | | | | | | | | | | | | | | | | | $4,739 | | | $— | | | $4,739 |
| | | | | | | | | | | | | | | | | | | | | | | | | | | | | |
| | | | | |
The accompanying notes are an integral part of the financial statements. | | | | |
| | | 15
| |
| | | | | |
TABLE OF CONTENTS
| | MassMutual Inflation-Protected and Income Fund — Portfolio of Investments (Continued) | |
OTC Total Return Swaps
| | | | | | | | | | | | | | | | |
Fed Funds + 16.0 BP
| | | Maturity | | | Bloomberg
US
Treasury
Inflation
Notes TR
Index | | | Maturity | | | Barclays
PLC* | | | 11/26/24 | | | USD | | | 62,688,489 | | | $3,096,243 | | | $ — | | | $3,096,243 |
Fed Funds + 23.5 BP
| | | Maturity | | | Bloomberg
US
Treasury
Inflation
Notes TR
Index | | | Maturity | | | BNP
Paribas
SA* | | | 1/30/25 | | | USD | | | 64,812,301 | | | 1,489,006 | | | — | | | 1,489,006 |
Fed Funds + 18.0 BP
| | | Maturity | | | Bloomberg
US
Treasury
Inflation
Notes TR
Index | | | Maturity | | | Goldman
Sachs
International* | | | 10/31/24 | | | USD | | | 43,000,000 | | | 2,898,968 | | | — | | | 2,898,968 |
Fed Funds + 25.0 BP
| | | Maturity | | | Bloomberg
US
Treasury
Inflation
Notes TR
Index | | | Maturity | | | Goldman
Sachs
International* | | | 2/28/25 | | | USD | | | 14,021,051 | | | 210,480 | | | — | | | 210,480 |
| | | | | | | | | | | | | | | | | | | | | | | | $7,694,697 | | | $— | | | $7,694,697 |
| | | | | | | | | | | | | | | | | | | | | | | | | | | | | | | |
* Contracts are subject to a master netting agreement or similar agreement.
Currency Legend
| | | | | |
| | | The accompanying notes are an integral part of the financial statements.
| |
16
| | | | |
| | | | | |
TABLE OF CONTENTS
| | | |
| | MassMutual Core Bond Fund — Portfolio of Investments | |
| | | |
| | | | | | | |
Bonds & Notes — 99.6%
| | | | | | |
Corporate Debt — 37.9%
| | | | | | |
Aerospace & Defense — 0.4%
| | | | | | |
Boeing Co.
| | | | | | |
5.930% 5/01/60 | | | $1,470,000 | | | $1,408,065 |
6.858% 5/01/54 (a) | | | 718,000 | | | 788,084 |
Embraer Netherlands Finance BV
7.000% 7/28/30 (a) | | | 1,550,000 | | | 1,687,994 |
| | | | | | 3,884,143 |
Agriculture — 0.5%
| | | | | | |
Imperial Brands Finance PLC
| | | | | | |
5.500% 2/01/30 (a) | | | 1,161,000 | | | 1,198,536 |
5.875% 7/01/34 (a) | | | 1,935,000 | | | 2,011,676 |
Reynolds American, Inc.
5.850% 8/15/45 | | | 1,615,000 | | | 1,615,751 |
| | | | | | 4,825,963 |
Airlines — 0.1%
| | | | | | |
United Airlines Pass-Through Trust
| | | | | | |
Series 2018-1, Class B,
4.600% 9/01/27 | | | 240,919 | | | 237,594 |
Series 2024-1, Class AA,
5.450% 8/15/38 | | | 853,000 | | | 887,717 |
| | | | | | 1,125,311 |
Auto Manufacturers — 0.7%
| | | | | | |
Ford Motor Credit Co. LLC
5.303% 9/06/29 | | | 2,745,000 | | | 2,732,077 |
General Motors Co.
5.150% 4/01/38 | | | 1,295,000 | | | 1,241,476 |
Toyota Motor Credit Corp.
4.450% 5/18/26 | | | 3,070,000 | | | 3,092,131 |
| | | | | | 7,065,684 |
Banks — 6.2%
| | | | | | |
Bank of America Corp.
| | | | | | |
5 yr. CMT + 1.200%
2.482% VRN 9/21/36 | | | 4,040,000 | | | 3,408,956 |
3 mo. USD Term SOFR + 1.302% 3.419% VRN 12/20/28 | | | 2,945,000 | | | 2,864,903 |
5 yr. CMT + 2.000%
3.846% VRN 3/08/37 | | | 2,025,000 | | | 1,871,882 |
Barclays PLC
| | | | | | |
5 yr. CMT + 5.867%
6.125% VRN (b) | | | 1,500,000 | | | 1,494,946 |
5 yr. CMT + 5.431%
8.000% VRN (b) | | | 3,118,000 | | | 3,283,538 |
BNP Paribas SA 5 yr. CMT + 3.196% 4.625% VRN (a) (b) | | | 1,075,000 | | | 1,018,696 |
| | | | | | | |
| | | | | | | |
BPCE SA, (Acquired 10/12/21, Cost $1,830,000), 1 day USD SOFR + 1.730% 3.116% VRN
10/19/32 (a) (c) | | | $1,830,000 | | | $1,576,653 |
Citigroup, Inc. 10 yr. CMT + 2.757% 7.000% VRN (b) | | | 1,904,000 | | | 2,037,485 |
Discover Bank 5 yr. USD SOFR ICE Swap Rate + 1.730%
5.974% VRN 8/09/28 | | | 4,583,000 | | | 4,732,489 |
The Goldman Sachs Group, Inc. 1 day USD SOFR + 1.210%
5.049% VRN 7/23/30 | | | 1,318,000 | | | 1,352,368 |
HSBC Holdings PLC
| | | | | | |
1 day USD SOFR + 1.520% 5.733% VRN 5/17/32 | | | 1,985,000 | | | 2,091,055 |
5 yr. CMT + 3.298%
6.875% VRN (b) | | | 1,269,000 | | | 1,307,206 |
ING Groep NV 5 yr. USD Swap + 4.446% 6.500% VRN (b) | | | 1,925,000 | | | 1,926,611 |
JP Morgan Chase & Co. 3 mo. USD Term SOFR + 2.515%
2.956% VRN 5/13/31 | | | 1,975,000 | | | 1,816,504 |
Lloyds Banking Group PLC
| | | | | | |
5 yr. USD ICE Swap + 4.496% 7.500% VRN (b) | | | 975,000 | | | 983,915 |
5 yr. CMT + 3.913%
8.000% VRN (b) (d) | | | 2,050,000 | | | 2,196,302 |
Macquarie Bank Ltd. 5 yr. CMT + 1.700% 3.052%
VRN 3/03/36 (a) | | | 5,160,000 | | | 4,511,768 |
Morgan Stanley
| | | | | | |
1 day USD SOFR + 1.360% 2.484% VRN 9/16/36 | | | 3,540,000 | | | 2,962,090 |
1 day USD SOFR + 2.620% 5.297% VRN 4/20/37 | | | 2,435,000 | | | 2,453,423 |
National Australia Bank Ltd. 5 yr. CMT + 1.700% 3.347% VRN
1/12/37 (a) | | | 4,480,000 | | | 3,992,707 |
NatWest Group PLC 5 yr. CMT + 5.625% 6.000% VRN (b) | | | 1,950,000 | | | 1,948,989 |
Nordea Bank Abp 5 yr. CMT + 2.660% 6.300% VRN (a) (b) | | | 570,000 | | | 564,922 |
Societe Generale SA
| | | | | | |
1 yr. CMT + 1.300%
2.797% VRN 1/19/28 (a) | | | 2,440,000 | | | 2,331,232 |
5 yr. USD ICE Swap + 5.873% 8.000% VRN (a) (b) | | | 1,975,000 | | | 1,994,914 |
SVB Financial Group, 5 yr. CMT + 3.074% 4.250% (b) (e) | | | 301,000 | | | 376 |
Synovus Bank
5.625% 2/15/28 | | | 2,451,000 | | | 2,464,248 |
| | | | | | | |
| | | | | |
The accompanying notes are an integral part of the financial statements. | | | | |
| | | 17
| |
| | | | | |
TABLE OF CONTENTS
| | MassMutual Core Bond Fund — Portfolio of Investments (Continued) | |
| | | | | | | |
Toronto-Dominion Bank 5 yr. CMT + 4.075% 8.125% VRN
10/31/82 | | | $4,377,000 | | | $4,695,698 |
UBS AG
7.950% 1/09/25 | | | 710,000 | | | 715,496 |
Wells Fargo & Co. 5 yr. CMT + 2.767% 6.850% VRN (b) | | | 1,695,000 | | | 1,769,077 |
| | | | | | 64,368,449 |
Beverages — 0.3%
| | | | | | |
Bacardi Ltd./Bacardi-Martini BV
5.900% 6/15/43 (a) | | | 697,000 | | | 717,391 |
Molson Coors Beverage Co.
4.200% 7/15/46 | | | 2,364,000 | | | 2,039,441 |
| | | | | | 2,756,832 |
Biotechnology — 0.3%
| | | | | | |
Amgen, Inc.
| | | | | | |
5.600% 3/02/43 | | | 1,417,000 | | | 1,488,683 |
5.750% 3/02/63 | | | 1,065,000 | | | 1,124,137 |
| | | | | | 2,612,820 |
Chemicals — 0.3%
| | | | | | |
Dow Chemical Co.
5.600% 2/15/54 | | | 1,121,000 | | | 1,157,826 |
LYB International Finance III LLC
4.200% 5/01/50 | | | 2,160,000 | | | 1,773,699 |
| | | | | | 2,931,525 |
Computers — 0.3%
| | | | | | |
Kyndryl Holdings, Inc.
| | | | | | |
2.700% 10/15/28 | | | 2,225,000 | | | 2,060,743 |
6.350% 2/20/34 | | | 570,000 | | | 609,379 |
| | | | | | 2,670,122 |
Diversified Financial Services — 2.4%
| | | |
AerCap Holdings NV 5 yr. CMT + 4.535% 5.875% VRN
10/10/79 (d) | | | 1,400,000 | | | 1,399,973 |
AerCap Ireland Capital DAC/AerCap Global Aviation Trust
| | | | | | |
3.300% 1/30/32 | | | 3,175,000 | | | 2,865,433 |
5 yr. CMT + 2.720%
6.950% VRN 3/10/55 | | | 364,000 | | | 377,391 |
Apollo Global Management, Inc.
5.800% 5/21/54 | | | 1,949,000 | | | 2,077,817 |
ARES Finance Co. III LLC 5 yr. CMT + 3.237% 4.125% VRN 6/30/51 (a) | | | 2,745,000 | | | 2,616,933 |
ARES Finance Co. LLC
4.000% 10/08/24 (a) | | | 2,180,000 | | | 2,179,179 |
Avolon Holdings Funding Ltd.
| | | | | | |
2.528% 11/18/27 (a) | | | 1,770,000 | | | 1,652,835 |
| | | | | | | |
| | | | | | | |
5.750% 11/15/29 (a) | | | $2,060,000 | | | $2,126,162 |
BGC Group, Inc.
6.600% 6/10/29 | | | 2,560,000 | | | 2,648,164 |
Blue Owl Finance LLC
| | | | | | |
3.125% 6/10/31 (a) | | | 2,825,000 | | | 2,475,196 |
4.125% 10/07/51 (a) | | | 758,000 | | | 570,447 |
Charles Schwab Corp. 5 yr. CMT + 3.168% 4.000% VRN (b) | | | 3,320,000 | | | 3,184,507 |
Voya Financial, Inc.
5.000% 9/20/34 | | | 693,000 | | | 689,132 |
| | | | | | 24,863,169 |
Electric — 2.3%
| | | | | | |
AES Corp. 5 yr. CMT + 3.201%
7.600% VRN 1/15/55 | | | 2,598,000 | | | 2,733,202 |
Cleveland Electric Illuminating Co.
5.950% 12/15/36 | | | 864,000 | | | 925,827 |
CMS Energy Corp.
4.700% 3/31/43 | | | 960,000 | | | 881,916 |
Dominion Energy South Carolina, Inc.
6.250% 10/15/53 | | | 946,000 | | | 1,102,715 |
Duke Energy Florida LLC
6.200% 11/15/53 | | | 1,012,000 | | | 1,162,879 |
Emera, Inc. 3 mo. USD LIBOR + 5.440% 6.750% VRN 6/15/76 | | | 2,600,000 | | | 2,615,002 |
Entergy Mississippi LLC
5.850% 6/01/54 | | | 775,000 | | | 839,632 |
Entergy Texas, Inc.
5.800% 9/01/53 | | | 2,242,000 | | | 2,394,801 |
IPALCO Enterprises, Inc.
5.750% 4/01/34 | | | 877,000 | | | 918,684 |
MidAmerican Energy Co.
5.300% 2/01/55 | | | 777,000 | | | 803,114 |
NextEra Energy Capital Holdings, Inc. 5 yr. CMT + 2.547%
3.800% VRN 3/15/82 | | | 1,865,000 | | | 1,776,393 |
RWE Finance US LLC
5.875% 4/16/34 (a) | | | 2,560,000 | | | 2,676,534 |
Sempra
| | | | | | |
5 yr. CMT + 2.868%
4.125% VRN 4/01/52 | | | 2,163,000 | | | 2,056,601 |
5 yr. CMT + 4.550%
4.875% VRN (b) | | | 1,690,000 | | | 1,671,860 |
Tampa Electric Co.
4.450% 6/15/49 | | | 676,000 | | | 609,785 |
Virginia Electric & Power Co.
5.350% 1/15/54 | | | 918,000 | | | 938,728 |
| | | | | | 24,107,673 |
Entertainment — 0.4%
| | | | | | |
Warnermedia Holdings, Inc.
| | | | | | |
4.279% 3/15/32 (d) | | | 3,670,000 | | | 3,260,179 |
| | | | | | | |
| | | | | |
| | | The accompanying notes are an integral part of the financial statements.
| |
18
| | | | |
| | | | | |
TABLE OF CONTENTS
| | MassMutual Core Bond Fund — Portfolio of Investments (Continued) | |
| | | | | | | |
5.141% 3/15/52 | | | $1,370,000 | | | $1,056,646 |
| | | | | | 4,316,825 |
Food — 0.9%
| | | | | | |
JBS USA Holding Lux SARL/JBS USA Food Co./JBS Lux Co. SARL 3.625% 1/15/32 | | | 2,285,000 | | | 2,089,060 |
The Kroger Co.
5.000% 9/15/34 | | | 1,614,000 | | | 1,627,459 |
Smithfield Foods, Inc.
| | | | | | |
2.625% 9/13/31 (a) | | | 3,215,000 | | | 2,724,298 |
3.000% 10/15/30 (a) | | | 1,208,000 | | | 1,082,719 |
4.250% 2/01/27 (a) | | | 1,720,000 | | | 1,691,448 |
| | | | | | 9,214,984 |
Gas — 0.2%
| | | | | | |
CenterPoint Energy Resources Corp.
6.625% 11/01/37 | | | 2,190,000 | | | 2,485,014 |
Health Care - Services — 0.7%
| | | | | | |
Cigna Group
4.800% 7/15/46 | | | 1,615,000 | | | 1,512,189 |
HCA, Inc.
5.900% 6/01/53 | | | 2,215,000 | | | 2,310,599 |
Humana, Inc.
5.750% 4/15/54 | | | 1,305,000 | | | 1,335,767 |
UnitedHealth Group, Inc.
5.750% 7/15/64 | | | 1,521,000 | | | 1,641,929 |
| | | | | | 6,800,484 |
Insurance — 7.0%
| | | | | | |
Allianz SE 5 yr. CMT + 2.973%
3.500% VRN (a) (b) | | | 4,400,000 | | | 4,238,430 |
Allstate Corp., (Acquired 11/30/18, Cost $3,292,364), 3 mo. USD Term SOFR + 3.200%
8.318% VRN 8/15/53 (c) | | | 3,220,000 | | | 3,236,100 |
Arthur J Gallagher & Co.
5.750% 7/15/54 | | | 904,000 | | | 943,615 |
Ascot Group Ltd.
4.250% 12/15/30 (a) | | | 2,025,000 | | | 1,755,999 |
Athene Global Funding
2.673% 6/07/31 (a) | | | 4,510,000 | | | 3,901,311 |
AXIS Specialty Finance LLC
5 yr. CMT + 3.186%
4.900% VRN 1/15/40 | | | 2,450,000 | | | 2,344,523 |
CNO Financial Group, Inc.
6.450% 6/15/34 | | | 2,483,000 | | | 2,624,821 |
CNO Global Funding
2.650% 1/06/29 (a) | | | 2,145,000 | | | 1,962,937 |
Corebridge Financial, Inc.
5yr. CMT + 3.846%
6.875% VRN 12/15/52 | | | 5,159,000 | | | 5,340,391 |
| | | | | | | |
| | | | | | | |
Enstar Finance LLC
| | | | | | |
HYB, 5 yr. CMT + 4.006% 5.500% VRN 1/15/42 | | | $2,244,000 | | | $2,093,166 |
5 yr. CMT + 5.468%
5.750% VRN 9/01/40 (d) | | | 2,400,000 | | | 2,371,644 |
Equitable Holdings, Inc. 5 yr. CMT + 4.736% 4.950% VRN (b) | | | 1,480,000 | | | 1,465,947 |
Fairfax Financial Holdings Ltd.
6.100% 3/15/55 (a) | | | 2,535,000 | | | 2,639,636 |
Global Atlantic Fin Co.
| | | | | | |
3.125% 6/15/31 (a) | | | 1,611,000 | | | 1,415,425 |
5 yr. CMT + 3.796%
4.700% VRN 10/15/51 (a) | | | 3,275,000 | | | 3,135,386 |
6.750% 3/15/54 (a) | | | 2,379,000 | | | 2,531,288 |
5 yr. CMT + 3.608%
7.950% VRN 10/15/54 (a) | | | 596,000 | | | 622,124 |
Hill City Funding Trust
4.046% 8/15/41 (a) | | | 3,975,000 | | | 3,284,096 |
Jackson National Life Global Funding
| | | | | | |
4.600% 10/01/29 (a) (f) | | | 1,469,000 | | | 1,465,138 |
5.600% 4/10/26 (a) | | | 2,241,000 | | | 2,273,158 |
Kemper Corp.
3.800% 2/23/32 | | | 1,440,000 | | | 1,308,969 |
Liberty Mutual Group, Inc.
5 yr. CMT + 3.315%
4.125% VRN 12/15/51 (a) | | | 2,070,000 | | | 1,958,230 |
Markel Group, Inc.
6.000% 5/16/54 | | | 2,217,000 | | | 2,357,283 |
MetLife Capital Trust IV
7.875% 12/15/67 (a) | | | 1,520,000 | | | 1,691,008 |
Pine Street Trust III
6.223% 5/15/54 (a) | | | 2,655,000 | | | 2,878,145 |
Sammons Financial Group, Inc.
| | | | | | |
3.350% 4/16/31 (a) | | | 4,555,000 | | | 3,970,952 |
4.450% 5/12/27 (a) | | | 69,000 | | | 68,269 |
4.750% 4/08/32 (a) | | | 90,000 | | | 84,632 |
6.875% 4/15/34 (a) | | | 4,181,000 | | | 4,474,694 |
USF&G Capital I
8.500% 12/15/45 (a) | | | 1,015,000 | | | 1,052,346 |
Vitality Re XV Ltd. 3 mo. U.S.
T-Bill Rate + 2.500%
7.102% FRN 1/08/29 (a) | | | 3,276,000 | | | 3,272,069 |
| | | | | | 72,761,732 |
Internet — 0.1%
| | | | | | |
Netflix, Inc.
5.400% 8/15/54 | | | 824,000 | | | 872,302 |
Investment Companies — 3.3%
| | | | | | |
Antares Holdings LP
| | | | | | |
2.750% 1/15/27 (a) | | | 985,000 | | | 922,428 |
| | | | | | | |
| | | | | |
The accompanying notes are an integral part of the financial statements. | | | | |
| | | 19
| |
| | | | | |
TABLE OF CONTENTS
| | MassMutual Core Bond Fund — Portfolio of Investments (Continued) | |
| | | | | | | |
3.950% 7/15/26 (a) | | | $5,650,000 | | | $5,493,233 |
8.500% 5/18/25 (a) | | | 1,185,000 | | | 1,201,787 |
ARES Capital Corp.
5.875% 3/01/29 | | | 1,572,000 | | | 1,609,770 |
ARES Strategic Income Fund
6.350% 8/15/29 (a) | | | 3,131,000 | | | 3,200,595 |
Blackstone Private Credit Fund
2.625% 12/15/26 | | | 5,360,000 | | | 5,068,154 |
Blackstone Secured Lending Fund
| | | | | | |
2.750% 9/16/26 (d) | | | 1,950,000 | | | 1,863,351 |
5.875% 11/15/27 | | | 730,000 | | | 742,292 |
Blue Owl Credit Income Corp.
| | | | | | |
4.700% 2/08/27 | | | 2,970,000 | | | 2,914,164 |
5.800% 3/15/30 (a) | | | 2,720,000 | | | 2,694,124 |
Blue Owl Technology Finance Corp. II
6.750% 4/04/29 (a) | | | 2,083,000 | | | 2,092,753 |
Golub Capital BDC, Inc.
| | | | | | |
2.500% 8/24/26 | | | 2,635,000 | | | 2,498,982 |
6.000% 7/15/29 (d) | | | 1,961,000 | | | 1,992,520 |
HPS Corporate Lending Fund
6.250% 9/30/29 (a) (d) | | | 1,815,000 | | | 1,847,710 |
| | | | | | 34,141,863 |
Lodging — 0.1%
| | | | | | |
Las Vegas Sands Corp.
6.200% 8/15/34 | | | 1,280,000 | | | 1,340,324 |
Media — 0.8%
| | | | | | |
Charter Communications Operating LLC/Charter Communications Operating Capital
| | | | | | |
2.300% 2/01/32 | | | 1,865,000 | | | 1,502,350 |
6.484% 10/23/45 | | | 2,950,000 | | | 2,845,847 |
Paramount Global
| | | | | | |
5 yr. CMT + 3.999%
6.375% VRN 3/30/62 | | | 1,337,000 | | | 1,236,707 |
6.875% 4/30/36 | | | 1,760,000 | | | 1,783,379 |
Time Warner Cable LLC
6.750% 6/15/39 | | | 960,000 | | | 961,396 |
| | | | | | 8,329,679 |
Mining — 0.1%
| | | | | | |
Anglo American Capital PLC
5.750% 4/05/34 (a) | | | 977,000 | | | 1,019,912 |
Oil & Gas — 1.9%
| | | | | | |
BP Capital Markets PLC 5 yr. CMT + 2.153% 6.450% VRN (b) (d) | | | 1,150,000 | | | 1,209,723 |
EQT Corp.
7.000% STEP 2/01/30 | | | 2,370,000 | | | 2,587,604 |
| | | | | | | |
| | | | | | | |
Helmerich & Payne, Inc.
5.500% 12/01/34 (a) | | | $2,680,000 | | | $2,610,533 |
Occidental Petroleum Corp.
6.050% 10/01/54 | | | 2,611,000 | | | 2,650,820 |
Ovintiv, Inc.
| | | | | | |
6.500% 8/15/34 | | | 885,000 | | | 955,489 |
6.500% 2/01/38 | | | 1,380,000 | | | 1,478,795 |
7.100% 7/15/53 | | | 2,479,000 | | | 2,793,874 |
Patterson-UTI Energy, Inc.
| | | | | | |
3.950% 2/01/28 | | | 1,305,000 | | | 1,256,542 |
5.150% 11/15/29 | | | 2,950,000 | | | 2,913,149 |
Petroleos Mexicanos
| | | | | | |
5.350% 2/12/28 | | | 845,000 | | | 789,660 |
6.375% 1/23/45 | | | 585,000 | | | 407,766 |
6.500% 3/13/27 | | | 295,000 | | | 289,284 |
6.625% 6/15/38 | | | 202,000 | | | 153,096 |
| | | | | | 20,096,335 |
Oil & Gas Services — 0.2%
| | | | | | |
Nov, Inc.
3.950% 12/01/42 | | | 2,603,000 | | | 2,056,018 |
Pharmaceuticals — 0.7%
| | | | | | |
CVS Health Corp.
| | | | | | |
5.050% 3/25/48 | | | 1,650,000 | | | 1,506,004 |
5.875% 6/01/53 | | | 675,000 | | | 686,908 |
6.125% 9/15/39 | | | 895,000 | | | 943,694 |
CVS Pass-Through Trust
5.926% 1/10/34 (a) | | | 1,397,802 | | | 1,421,216 |
Utah Acquisition Sub, Inc.
5.250% 6/15/46 | | | 3,370,000 | | | 2,958,253 |
| | | | | | 7,516,075 |
Pipelines — 1.5%
| | | | | | |
Energy Transfer LP
| | | | | | |
5.950% 5/15/54 | | | 1,041,000 | | | 1,065,412 |
5 yr. CMT + 5.306%
7.125% VRN (b) | | | 2,750,000 | | | 2,809,194 |
EnLink Midstream LLC
5.650% 9/01/34 | | | 1,520,000 | | | 1,570,575 |
EnLink Midstream Partners LP
| | | | | | |
5.050% 4/01/45 | | | 625,000 | | | 562,130 |
5.450% 6/01/47 | | | 2,215,000 | | | 2,094,644 |
Enterprise Products Operating LLC 3 mo. USD Term SOFR + 3.295% 5.250% VRN 8/16/77 | | | 2,000,000 | | | 1,972,792 |
Plains All American Pipeline LP 3 mo. USD Term SOFR + 4.372%
9.490% VRN (b) | | | 2,590,000 | | | 2,578,842 |
Western Midstream Operating LP
5.450% 11/15/34 | | | 2,625,000 | | | 2,630,549 |
| | | | | | 15,284,138 |
| | | | | | | |
| | | | | |
| | | The accompanying notes are an integral part of the financial statements.
| |
20
| | | | |
| | | | | |
TABLE OF CONTENTS
| | MassMutual Core Bond Fund — Portfolio of Investments (Continued) | |
| | | | | | | |
Private Equity — 1.3%
| | | | | | |
Apollo Management Holdings LP 5 yr. CMT + 3.266%
4.950% VRN 1/14/50 (a) | | | $1,805,000 | | | $1,791,462 |
Brookfield Finance, Inc.
5.968% 3/04/54 | | | 2,386,000 | | | 2,591,415 |
Hercules Capital, Inc.
| | | | | | |
2.625% 9/16/26 | | | 3,352,000 | | | 3,167,716 |
3.375% 1/20/27 | | | 4,080,000 | | | 3,884,417 |
KKR Group Finance Co. VIII LLC
3.500% 8/25/50 (a) | | | 920,000 | | | 674,070 |
KKR Group Finance Co. X LLC
3.250% 12/15/51 (a) | | | 2,442,000 | | | 1,723,129 |
| | | | | | 13,832,209 |
Real Estate Investment Trusts (REITS) — 3.3%
| | | |
Agree LP
5.625% 6/15/34 | | | 890,000 | | | 931,056 |
Broadstone Net Lease LLC
2.600% 9/15/31 | | | 3,401,000 | | | 2,860,640 |
EPR Properties
| | | | | | |
3.600% 11/15/31 | | | 880,000 | | | 784,458 |
3.750% 8/15/29 | | | 1,650,000 | | | 1,542,941 |
4.500% 6/01/27 | | | 4,150,000 | | | 4,089,388 |
Equinix Europe 2 Financing Corp. LLC 5.500% 6/15/34 (d) | | | 1,840,000 | | | 1,930,770 |
Global Net Lease, Inc./Global Net Lease Operating Partnership LP
3.750% 12/15/27 (a) | | | 4,280,000 | | | 3,989,774 |
Kimco Realty OP LLC
| | | | | | |
4.125% 12/01/46 | | | 1,530,000 | | | 1,263,092 |
4.450% 9/01/47 | | | 1,055,000 | | | 913,300 |
Omega Healthcare Investors, Inc.
3.625% 10/01/29 | | | 3,160,000 | | | 2,978,156 |
Piedmont Operating Partnership LP
| | | | | | |
2.750% 4/01/32 (d) | | | 1,055,000 | | | 855,712 |
9.250% 7/20/28 | | | 1,872,000 | | | 2,095,104 |
Service Properties Trust
4.950% 10/01/29 (d) | | | 1,320,000 | | | 1,048,444 |
Store Capital LLC
| | | | | | |
4.500% 3/15/28 | | | 700,000 | | | 686,879 |
4.625% 3/15/29 | | | 5,140,000 | | | 5,038,459 |
WEA Finance LLC
2.875% 1/15/27 (a) | | | 3,145,000 | | | 3,007,965 |
| | | | | | 34,016,138 |
Semiconductors — 0.1%
| | | | | | |
Intel Corp.
5.600% 2/21/54 | | | 1,080,000 | | | 1,052,602 |
| | | | | | | |
| | | | | | | |
Software — 0.6%
| | | | | | |
Electronic Arts, Inc.
2.950% 2/15/51 | | | $1,680,000 | | | $1,159,540 |
Microsoft Corp.
2.921% 3/17/52 | | | 2,307,000 | | | 1,693,777 |
Oracle Corp.
5.375% 9/27/54 | | | 3,600,000 | | | 3,597,801 |
| | | | | | 6,451,118 |
Telecommunications — 0.9%
| | | | | | |
AT&T, Inc.
3.550% 9/15/55 | | | 6,263,000 | | | 4,580,975 |
Cisco Systems, Inc.
5.300% 2/26/54 | | | 428,000 | | | 454,103 |
Sprint Capital Corp.
8.750% 3/15/32 | | | 2,015,000 | | | 2,498,440 |
T-Mobile USA, Inc.
6.000% 6/15/54 | | | 1,477,000 | | | 1,627,337 |
| | | | | | 9,160,855 |
TOTAL CORPORATE DEBT
(Cost $396,928,223) | | | | | | 391,960,298 |
Non-U.S. Government Agency Obligations — 20.5%
|
Automobile Asset-Backed Securities — 0.5%
| | | |
Exeter Automobile Receivables Trust
| | | | | | |
Series 2024-5A, Class C,
4.640% 1/15/30 | | | 2,000,000 | | | 1,997,770 |
Series 2024-5A, Class D,
5.060% 2/18/31 | | | 3,500,000 | | | 3,495,209 |
| | | | | | 5,492,979 |
Commercial Mortgage-Backed Securities — 6.1%
|
Bank, Series 2020-BN30, Class MCDF,
3.016% VRN 12/15/53 (g) | | | 3,165,000 | | | 1,756,402 |
Benchmark Mortgage Trust
| | | | | | |
Series 2021-B23, Class 360A, 2.852% VRN 2/15/54 (a) (g) | | | 3,150,000 | | | 2,431,819 |
Series 2021-B23, Class 360B, 2.852% VRN 2/15/54 (a) (g) | | | 4,800,000 | | | 3,425,570 |
Series 2021-B25, Class 300C, 3.094% VRN 4/15/54 (a) (g) | | | 3,100,000 | | | 1,935,258 |
BGME Trust
| | | | | | |
Series 2021-VR, Class C, 3.094% VRN 1/10/43 (a) (g) | | | 16,248,000 | | | 13,314,547 |
Series 2021-VR, Class D, 3.094% VRN 1/10/43 (a) (g) | | | 3,790,000 | | | 2,970,555 |
BMO Mortgage Trust,
Series 2023-C4, Class A5, 5.117% VRN 2/15/56 (g) | | | 1,300,000 | | | 1,332,270 |
BX Trust, Series 2023-LIFE, Class C 5.884% 2/15/28 (a) | | | 600,000 | | | 572,072 |
| | | | | | | |
| | | | | |
The accompanying notes are an integral part of the financial statements. | | | | |
| | | 21
| |
| | | | | |
TABLE OF CONTENTS
| | MassMutual Core Bond Fund — Portfolio of Investments (Continued) | |
| | | | | | | |
Citigroup Commercial Mortgage Trust, Series 2019-GC41, Class C 3.502% 8/10/56 | | | $1,259,000 | | | $1,059,678 |
COLEM Mortgage Trust, Series 2022-HLNE, Class D, 2.543% VRN 4/12/42 (a) (g) | | | 1,900,000 | | | 1,439,817 |
COMM Mortgage Trust
| | | | | | |
Series 2015-CR23, Class B, 4.183% VRN 5/10/48 (g) | | | 1,200,000 | | | 1,164,698 |
Series 2015-CR23, Class C, 4.408% VRN 5/10/48 (g) | | | 1,050,000 | | | 991,609 |
DROP Mortgage Trust
| | | | | | |
Series 2021-FILE, Class C, 1 mo. USD Term SOFR + 2.364% 7.462% FRN 10/15/43 (a) | | | 3,365,000 | | | 2,983,490 |
Series 2021-FILE, Class D, 1 mo. USD Term SOFR + 2.864% 7.962% FRN 10/15/43 (a) | | | 1,162,000 | | | 954,873 |
GS Mortgage Securities Trust, Series 2019-GC39, Class C,
4.005% VRN 5/10/52 (g) | | | 1,357,000 | | | 1,050,297 |
KREF Ltd.
| | | | | | |
Series 2021-FL2, Class B, 1 mo. USD Term SOFR + 1.764% 6.847% FRN 2/15/39 (a) | | | 3,500,000 | | | 3,392,068 |
Series 2021-FL2, Class C, 1 mo. USD Term SOFR + 2.114% 7.197% FRN 2/15/39 (a) | | | 5,800,000 | | | 5,598,702 |
Series 2021-FL2, Class D, 1 mo. USD Term SOFR + 2.314% 7.397% FRN 2/15/39 (a) | | | 3,200,000 | | | 3,009,469 |
LEX Mortgage Trust, Series
2024-BBG, Class A, 4.874% VRN 10/13/33 (a) (f) (g) | | | 3,300,000 | | | 3,294,804 |
Life Mortgage Trust, Series
2021-BMR, Class E, 1 mo. USD Term SOFR + 1.864%
6.962% FRN 3/15/38 (a) | | | 2,021,699 | | | 1,959,892 |
MFT Mortgage Trust
| | | | | | |
Series 2020-ABC, Class A, 3.358% 2/10/42 (a) | | | 1,185,000 | | | 803,964 |
Series 2020-ABC, Class B,
3.593% VRN 2/10/42 (a) (g) | | | 1,278,000 | | | 803,671 |
VASA Trust, Series 2021-VASA, Class D, 1 mo. USD Term SOFR + 2.214% 7.312%
FRN 7/15/39 (a) | | | 4,879,000 | | | 3,406,784 |
Wells Fargo Commercial Mortgage Trust
| | | | | | |
Series 2018-C45, Class B, 4.556% 6/16/51 | | | 390,000 | | | 368,002 |
| | | | | | | |
| | | | | | | |
Series 2021-FCMT, Class B, 1 mo. USD Term SOFR + 1.964% 7.062% FRN 5/15/31 (a) | | | $3,000,000 | | | $2,925,055 |
| | | | | | 62,945,366 |
Home Equity Asset-Backed Securities — 0.3%
|
Asset-Backed Securities Corp. Home Equity Loan Trust, Series 2003-HE6, Class A3B, 1 mo. USD Term SOFR + 1.074% 5.929% FRN 11/25/33 | | | 1,143,977 | | | 1,143,723 |
Structured Asset Securities Corp. Mortgage Loan Trust, Series 2006-GEL1, Class M2, 1 mo. USD Term SOFR + 1.314% 6.169% FRN 11/25/35 (a) | | | 175,690 | | | 174,811 |
Unlock HEA Trust, Series 2024-1, Class A 7.000% 4/25/39 (a) | | | 1,473,738 | | | 1,478,181 |
| | | | | | 2,796,715 |
Other Asset-Backed Securities — 9.4%
| | | |
AASET Trust, Series 2021-2A, Class B 3.538% 1/15/47 (a) | | | 853,934 | | | 767,163 |
Apidos CLO XLIV Ltd., Series 2023-44A, Class B, 3 mo. USD Term SOFR + 2.550% 7.829% FRN 4/26/35 (a) | | | 1,750,000 | | | 1,755,056 |
Apidos CLO XLVIII Ltd., Series 2024-48A, Class A1,
3 mo. USD Term SOFR + 1.440% 6.755% FRN 7/25/37 (a) | | | 2,000,000 | | | 2,006,048 |
Apidos CLO XXXII Ltd., Series 2019-32A, Class B1R,
3 mo. USD Term SOFR + 1.500% 6.782% FRN 1/20/33 (a) | | | 1,750,000 | | | 1,750,744 |
ARES Loan Funding VI Ltd., Series 2024-ALF6A, Class A1,
3 mo. USD Term SOFR + 1.470% 6.789% FRN 7/10/37 (a) | | | 1,000,000 | | | 1,002,650 |
Bain Capital Credit CLO Ltd., Series 2022-1A, Class A1, 3 mo. USD Term SOFR + 1.320% 6.599% FRN 4/18/35 (a) | | | 1,000,000 | | | 1,000,250 |
Ballyrock CLO 26 Ltd., Series 2024-26A, Class A1A,
3 mo. USD Term SOFR + 1.510% 6.844% FRN 7/25/37 (a) | | | 1,700,000 | | | 1,704,359 |
Benefit Street Partners CLO V-B Ltd., Series 2018-5BA, Class A1R, 3 mo. USD Term SOFR + 1.530%
6.827% FRN 7/20/37 (a) | | | 2,000,000 | | | 2,013,544 |
| | | | | | | |
| | | | | |
| | | The accompanying notes are an integral part of the financial statements.
| |
22
| | | | |
| | | | | |
TABLE OF CONTENTS
| | MassMutual Core Bond Fund — Portfolio of Investments (Continued) | |
| | | | | | | |
Buttermilk Park CLO Ltd., Series 2018-1A, Class B1R,
3 mo. USD Term SOFR + 1.600% 6.901% FRN 10/15/31 (a) | | | $2,000,000 | | | $2,002,674 |
CARS-DB4 LP
| | | | | | |
Series 2020-1A, Class A3, 3.250% 2/15/50 (a) | | | 551,255 | | | 499,683 |
Series 2020-1A, Class A6, 3.810% 2/15/50 (a) | | | 484,886 | | | 431,735 |
CAUTO, Series 2024-3A, Class A1
4.400% 10/15/54 (a) (f) (h) | | | 2,500,000 | | | 2,458,022 |
CIFC Funding Ltd.
| | | | | | |
Series 2018-2A, Class A1R,
3 mo. USD Term SOFR + 1.370% 1.000% FRN
10/20/37 (a) (f) | | | 3,350,000 | | | 3,350,000 |
Series 2019-6A, Class A1R,
3 mo. USD Term SOFR + 1.450% 6.778% FRN 7/16/37 (a) | | | 2,650,000 | | | 2,656,736 |
Elmwood CLO I Ltd., Series
2019-1A, Class A1RR, 3 mo. USD Term SOFR + 1.520% 6.802% FRN 4/20/37 (a) | | | 3,000,000 | | | 3,007,500 |
Flatiron CLO 20 Ltd., Series
2020-1A, Class BR, 3 mo. USD Term SOFR + 1.920%
7.048% FRN 5/20/36 (a) | | | 500,000 | | | 501,111 |
Galaxy XXVI CLO Ltd., Series 2018-26A, Class BR,
3 mo. USD Term SOFR + 1.600% 6.721% FRN 11/22/31 (a) | | | 1,000,000 | | | 1,000,571 |
Goodgreen Trust
| | | | | | |
Series 2019-2A, Class A,
2.760% 4/15/55 (a) | | | 1,945,185 | | | 1,714,981 |
Series 2016-1A, Class A,
3.230% 10/15/52 (a) | | | 753,024 | | | 699,584 |
Series 2017-1A, Class A,
3.740% 10/15/52 (a) | | | 363,282 | | | 339,906 |
Series 2019-1A, Class A,
3.860% 10/15/54 (a) | | | 743,592 | | | 692,867 |
Series 2018-1A, Class A,
3.930% VRN 10/15/53 (a) (g) | | | 949,095 | | | 886,721 |
Harbor Park CLO 18-1 Ltd., Series 2018-1A, Class B1R, 3 mo. USD Term SOFR + 1.700% 6.982% FRN 1/20/31 (a) | | | 1,300,000 | | | 1,300,650 |
Hero Funding Trust
| | | | | | |
Series 2016-3A, Class A1, 3.080% 9/20/42 (a) | | | 286,811 | | | 260,233 |
Series 2017-3A, Class A1, 3.190% 9/20/48 (a) | | | 327,453 | | | 291,919 |
| | | | | | | |
| | | | | | | |
Series 2017-2A, Class A1, 3.280% 9/20/48 (a) | | | $98,597 | | | $88,445 |
Series 2016-4A, Class A1, 3.570% 9/20/47 (a) | | | 304,063 | | | 279,210 |
Series 2017-2A, Class A2, 4.070% 9/20/48 (a) | | | 79,264 | | | 72,995 |
Series 2018-1A, Class A2, 4.670% 9/20/48 (a) | | | 576,133 | | | 544,888 |
HPS Loan Management Ltd., Series 2023-18A, Class B, 3 mo. USD Term SOFR + 2.950% 8.232% FRN 7/20/36 (a) | | | 1,000,000 | | | 1,012,381 |
Juniper Valley Park CLO Ltd., Series 2023-1A, Class BR, 3 mo. USD Term SOFR + 1.550% 6.832% FRN 7/20/36 (a) | | | 1,350,000 | | | 1,351,459 |
Labrador Aviation Finance Ltd., Series 2016-1A, Class A1 4.300% 1/15/42 (a) | | | 1,363,995 | | | 1,261,754 |
MACH 1 Cayman Ltd., Series 2019-1, Class A
3.474% 10/15/39 (a) | | | 887,904 | | | 825,866 |
Madison Park Funding XXVIII Ltd., Series 2018-28A, Class B,
3 mo. USD Term SOFR + 1.862% 7.163% FRN 7/15/30 (a) | | | 2,090,000 | | | 2,094,023 |
Marble Point CLO XIX Ltd., Series 2020-3A, Class AR, 3 mo. USD Term SOFR + 1.400% 6.680% FRN 1/19/34 (a) | | | 2,250,000 | | | 2,252,545 |
Mariner Finance Issuance Trust
| | | | | | |
Series 2021-AA, Class B, 2.330% 3/20/36 (a) | | | 1,771,000 | | | 1,673,270 |
Series 2021-AA, Class C, 2.960% 3/20/36 (a) | | | 835,000 | | | 779,649 |
MidOcean Credit CLO XII Ltd., Series 2023-12A, Class CR,
3 mo. USD Term SOFR + 2.450% 7.729% FRN 4/18/36 (a) | | | 700,000 | | | 702,206 |
MidOcean Credit CLO XIV Ltd., Series 2024-14A, Class A1, 3 mo. USD Term SOFR + 1.580% 6.881% FRN 4/15/37 (a) | | | 2,000,000 | | | 2,011,040 |
Mosaic Solar Loan Trust, Series 2018-1A, Class A
4.010% 6/22/43 (a) | | | 120,531 | | | 114,522 |
Mosaic Solar Loans LLC
| | | | | | |
Series 2017-2A, Class A,
3.820% 6/22/43 (a) | | | 263,307 | | | 250,120 |
Series 2017-1A, Class A,
4.450% 6/20/42 (a) | | | 109,370 | | | 107,063 |
| | | | | | | |
| | | | | |
The accompanying notes are an integral part of the financial statements. | | | | |
| | | 23
| |
| | | | | |
TABLE OF CONTENTS
| | MassMutual Core Bond Fund — Portfolio of Investments (Continued) | |
| | | | | | | |
Neuberger Berman Loan Advisers CLO 45 Ltd., Series 2021-45A, Class B, 3 mo. USD Term SOFR + 1.912% 7.213%
FRN 10/14/35 (a) | | | $1,350,000 | | | $1,353,241 |
OCP CLO Ltd., Series 2023-27A, Class BR, 3 mo. USD Term SOFR + 1.700% 7.024% FRN 7/16/35 (a) | | | 2,500,000 | | | 2,502,502 |
OHA Credit Funding 5 Ltd., Series 2020-5A, Class AR, 3 mo. USD Term SOFR + 1.350% 1.000% FRN 10/18/37 (a) (f) | | | 5,000,000 | | | 5,000,000 |
Orion CLO Ltd., Series 2024-3A, Class A, 3 mo. USD Term SOFR + 1.560% 6.890%
FRN 7/25/37 (a) | | | 1,500,000 | | | 1,503,099 |
Parallel Ltd., Series 2021-2A, Class A2, 3 mo. USD Term SOFR + 2.112% 7.394% FRN 10/20/34 (a) | | | 550,000 | | | 550,829 |
Rad CLO 12 Ltd., Series 2021-12A, Class A, 3 mo. USD Term SOFR + 1.432% 6.687%
FRN 10/30/34 (a) | | | 2,000,000 | | | 2,004,638 |
Rad CLO 4 Ltd., Series 2019-4A, Class B1R, 3 mo. USD Term SOFR + 1.750% 7.035% FRN 4/25/32 (a) | | | 1,100,000 | | | 1,101,365 |
RR 29 Ltd., Series 2024-29RA, Class A1R, 3 mo. USD Term SOFR + 1.390% 6.691% FRN 7/15/39 (a) | | | 2,000,000 | | | 2,005,796 |
RR 7 Ltd., Series 2019-7A, Class A2B, 3 mo. USD Term SOFR + 1.850% 7.151% FRN 1/15/37 (a) | | | 750,000 | | | 750,581 |
Sierra Timeshare Receivables Funding LLC, Series 2021-1A, Class D 3.170% 11/20/37 (a) | | | 452,807 | | | 434,176 |
Structured Receivables Finance LLC, Series 2010-B, Class A
3.730% 8/15/36 (a) | | | 37,134 | | | 36,846 |
Sunnova Helios II Issuer LLC, Series 2018-1A, Class A
4.870% 7/20/48 (a) | | | 530,611 | | | 483,104 |
Sunnova Hestia II Issuer LLC, Series 2024-GRID1, Class 1A
5.630% 7/20/51 (a) | | | 1,168,321 | | | 1,202,641 |
Symphony CLO 39 Ltd., Series 2023-39A, Class B, 3 mo. USD Term SOFR + 2.300% 7.585% FRN 4/25/34 (a) | | | 1,500,000 | | | 1,502,577 |
| | | | | | | |
| | | | | | | |
Symphony CLO 42 Ltd., Series 2024-42A, Class A1, 3 mo. USD Term SOFR + 1.530% 6.837% FRN 4/17/37 (a) | | | $2,000,000 | | | $2,009,362 |
THL Credit Wind River CLO Ltd., Series 2018-3A, Class B, 3 mo. USD Term SOFR + 1.962% 7.244% FRN 1/20/31 (a) | | | 2,440,000 | | | 2,442,262 |
Thrust Engine Leasing DAC
| | | | | | |
Series 2021-1A, Class A,
4.163% 7/15/40 (a) | | | 3,216,761 | | | 3,076,966 |
Series 2021-1A, Class B,
6.121% 7/15/40 (a) | | | 1,460,497 | | | 1,357,848 |
Series 2021-1A, Class C,
7.386% 7/15/40 (a) | | | 530,985 | | | 482,176 |
TICP CLO XIV Ltd., Series
2019-14A, Class A2R, 3 mo. USD Term SOFR + 1.912% 7.194% FRN 10/20/32 (a) | | | 1,100,000 | | | 1,100,887 |
TICP CLO XV Ltd., Series 2020-15A, Class A, 3 mo. USD Term SOFR + 1.542% 6.824% FRN 4/20/33 (a) | | | 4,200,000 | | | 4,208,450 |
Vivint Solar Financing V LLC, Series 2018-1A, Class B
7.370% 4/30/48 (a) | | | 1,384,603 | | | 1,314,905 |
Voya CLO Ltd.
| | | | | | |
Series 2019-1A, Class A1RR,
3 mo. USD Term
SOFR + 1.370%
1.000% FRN 10/15/37 (a) (f) | | | 5,000,000 | | | 5,000,000 |
Series 2021-3A, Class B, 3 mo. USD Term SOFR + 1.862% 7.144% FRN 1/20/35 (a) | | | 500,000 | | | 500,342 |
WAVE Trust, Series 2017-1A, Class C 6.656% 11/15/42 (a) | | | 2,316,836 | | | 672,099 |
Whitebox CLO III Ltd.,
Series 2021-3A, Class A1R,
3 mo. USD Term SOFR + 1.270% 1.000% FRN 10/15/35 (a) (f) | | | 4,750,000 | | | 4,750,000 |
Willis Engine Structured Trust IV, Series 2018-A, Class A, 4.750% STEP 9/15/43 (a) | | | 414,170 | | | 409,985 |
| | | | | | 97,272,820 |
Real Estate Investment Trusts (REITS) — 0.3%
|
SBA Tower Trust
4.831% 10/15/29 (a) (f) | | | 3,250,000 | | | 3,232,288 |
Student Loans Asset-Backed Securities — 1.7%
|
College Avenue Student Loans LLC
| | | | | | |
Series 2019-A, Class B,
3.810% 12/28/48 (a) | | | 1,162,213 | | | 1,081,250 |
| | | | | | | |
| | | | | |
| | | The accompanying notes are an integral part of the financial statements.
| |
24
| | | | |
| | | | | |
TABLE OF CONTENTS
| | MassMutual Core Bond Fund — Portfolio of Investments (Continued) | |
| | | | | | | |
Series 2019-A, Class C,
4.460% 12/28/48 (a) | | | $782,408 | | | $744,535 |
Education Loan Asset-Backed Trust I
| | | | | | |
Series 2003-1, Class A2,
6.041% FRN 2/01/43 (a) (g) | | | 1,300,000 | | | 1,201,487 |
Series 2003-2, Class 2A1,
6.258% FRN 8/01/43 (a) (g) | | | 1,950,000 | | | 1,811,345 |
Series 2013-1, Class B1, 30 day USD SOFR Average + 1.114% 6.395% FRN 11/25/33 (a) | | | 428,575 | | | 425,346 |
Higher Education Funding I
| | | | | | |
Series 2004-1, Class B1,
5.784% FRN 1/01/44 (a) (g) | | | 600,000 | | | 516,337 |
Series 2004-1, Class B2,
5.793% FRN 1/01/44 (a) (g) | | | 600,000 | | | 516,199 |
Navient Student Loan Trust, Series 2018-EA, Class B
4.440% 12/15/59 (a) | | | 730,000 | | | 715,858 |
Nelnet Student Loan Trust
| | | | | | |
Series 2019-5, Class B,
3.450% 10/25/67 (a) | | | 2,850,000 | | | 2,300,094 |
Series 2014-3A, Class B, 30 day USD SOFR Average + 1.614% 6.895% FRN 10/25/50 (a) | | | 975,000 | | | 929,593 |
Series 2015-2A, Class B, 30 day USD SOFR Average + 1.614% 6.895% FRN 5/26/54 (a) | | | 1,130,000 | | | 1,108,537 |
SLC Student Loan Trust, Series 2005-1, Class B, 90 day USD SOFR Average + 0.462% 5.828% FRN 2/15/45 | | | 682,938 | | | 607,184 |
SLM Student Loan Trust
| | | | | | |
Series 2006-5, Class B, 90 day USD SOFR Average + 0.472% 5.831% FRN 10/25/40 | | | 1,409,044 | | | 1,320,373 |
Series 2005-8, Class B, 90 day USD SOFR Average + 0.572% 5.931% FRN 1/25/55 | | | 805,670 | | | 763,724 |
SMB Private Education Loan Trust, Series 2024-E, Class B
5.710% 10/16/56 (a) | | | 2,500,000 | | | 2,510,931 |
SoFi Alternative Trust, Series
2019-C, Class PT, 5.240%
VRN 1/25/45 (a) (g) | | | 1,610,466 | | | 1,592,081 |
| | | | | | 18,144,874 |
Whole Loan Collateral Collateralized
Mortgage Obligations — 2.2%
|
Banc of America Mortgage Trust, Series 2004-G, Class 2A7, 6.643% VRN 8/25/34 (g) | | | 15,623 | | | 15,558 |
| | | | | | | |
| | | | | | | |
Credit Suisse Mortgage Trust, Series 2021-NQM3, Class M1, 2.317% VRN 4/25/66 (a) (g) | | | $1,670,000 | | | $1,228,123 |
Ellington Financial Mortgage Trust
| | | | | | |
Series 2024-INV2, Class A2, 5.289% VRN
10/25/69 (a) (g) | | | 2,000,000 | | | 2,000,074 |
Series 2024-INV2, Class A3, 5.441% VRN 10/25/69 (a) (g) | | | 2,000,000 | | | 2,000,077 |
Flagstar Mortgage Trust, Series 2021-6INV, Class A18, 2.500% VRN 8/25/51 (a) (g) | | | 4,231,452 | | | 3,521,857 |
GS Mortgage-Backed Securities Trust, Series 2024-PJ8, Class B2, 6.952% VRN
2/25/55 (a) (f) (g) | | | 3,000,000 | | | 3,143,669 |
New Residential Mortgage Loan Trust, Series 2021-INV1, Class A4, 2.500%
VRN 6/25/51 (a) (g) | | | 2,531,975 | | | 2,107,374 |
NMLT Trust, Series 2021-INV1, Class M1, 2.711% VRN
5/25/56 (a) (g) | | | 3,723,000 | | | 2,860,994 |
STAR Trust, Series 2021-1, Class M1, 2.363%
VRN 5/25/65 (a) (g) | | | 5,273,000 | | | 4,356,162 |
Starwood Mortgage Residential Trust, Series 2021-3, Class M1, 2.491% VRN 6/25/56 (a) (g) | | | 1,840,000 | | | 1,367,163 |
Wells Fargo Mortgage-Backed Securities Trust, Series 2019-1, Class A1, 3.925% VRN
11/25/48 (a) (g) | | | 19,152 | | | 18,520 |
| | | | | | 22,619,571 |
TOTAL NON-U.S. GOVERNMENT AGENCY OBLIGATIONS
(Cost $231,764,316) | | | | | | 212,504,613 |
Sovereign Debt Obligations — 0.2%
|
Mexico Government International Bond 4.750% 3/08/44 | | | 1,778,000 | | | 1,503,794 |
TOTAL SOVEREIGN DEBT OBLIGATIONS
(Cost $1,788,936) | | | | | | 1,503,794 |
| | | | | | | |
| | | | | |
The accompanying notes are an integral part of the financial statements. | | | | |
| | | 25
| |
| | | | | |
TABLE OF CONTENTS
| | MassMutual Core Bond Fund — Portfolio of Investments (Continued) | |
| | | | | | | |
U.S. Government Agency Obligations and Instrumentalities (i) — 30.8%
|
Collateralized Mortgage Obligations — 0.0%
| | | |
Federal Home Loan Mortgage Corp. REMICS Series 2178, Class PB 7.000% 8/15/29 | | | $35,770 | | | $37,086 |
Pass-Through Securities — 30.8%
| | | | | | |
Federal Home Loan Mortgage Corp.
| | | | | | |
Pool #RA4245 2.000% 12/01/50 | | | 4,030,065 | | | 3,376,666 |
Pool #RA4255 2.000% 1/01/51 | | | 8,178,033 | | | 6,862,341 |
Pool #RA5576 2.500% 7/01/51 | | | 6,704,689 | | | 5,855,421 |
Pool #SD0905 3.000% 3/01/52 | | | 3,202,668 | | | 2,891,885 |
Pool #RA2483 3.500% 6/01/50 | | | 4,549,843 | | | 4,272,328 |
Pool #Z40047 4.000% 10/01/41 | | | 60,840 | | | 59,949 |
Pool #SD1523 4.000% 8/01/52 | | | 4,610,534 | | | 4,466,465 |
Pool #SD1603 4.000% 9/01/52 | | | 3,001,174 | | | 2,894,264 |
Pool #SD8245 4.500% 9/01/52 | | | 2,610,581 | | | 2,567,114 |
Pool #SD8257 4.500% 10/01/52 | | | 1,841,137 | | | 1,810,482 |
Pool #SD8266 4.500% 11/01/52 | | | 6,724,635 | | | 6,612,667 |
Pool #SD8268 5.500% 11/01/52 | | | 4,414,914 | | | 4,480,603 |
Pool #SD4364 5.500% 10/01/53 | | | 4,912,318 | | | 5,003,828 |
Federal National Mortgage Association
| | | | | | |
Pool #CB0414 2.500% 5/01/51 | | | 5,917,974 | | | 5,164,658 |
Pool #FM8596 2.500% 9/01/51 | | | 2,075,133 | | | 1,812,280 |
Pool #FS3035 2.500% 4/01/52 | | | 7,431,468 | | | 6,501,752 |
Pool #MA3029 3.000% 6/01/32 | | | 1,251,340 | | | 1,219,239 |
Pool #MA3090 3.000% 8/01/32 | | | 429,316 | | | 418,063 |
Pool #FS1075 3.000% 3/01/52 | | | 3,276,151 | | | 2,976,729 |
Pool #CB3304 3.000% 4/01/52 | | | 5,012,079 | | | 4,554,003 |
Pool #CB3305 3.000% 4/01/52 | | | 5,997,775 | | | 5,442,115 |
Pool #AS1304 3.500% 12/01/28 | | | 282,810 | | | 279,426 |
Pool #MA1356 3.500% 2/01/43 | | | 2,970,844 | | | 2,827,942 |
Pool #CA6096 3.500% 6/01/50 | | | 6,112,172 | | | 5,699,252 |
Pool #FM4017 3.500% 8/01/50 | | | 316,860 | | | 297,533 |
Pool #CB3842 3.500% 6/01/52 | | | 9,591,359 | | | 9,001,094 |
Pool #MA4626 4.000% 6/01/52 | | | 9,869,334 | | | 9,490,004 |
Pool #CA1909 4.500% 6/01/48 | | | 1,913,144 | | | 1,908,791 |
Pool #CB3866 4.500% 6/01/52 | | | 5,101,413 | | | 5,048,357 |
Pool #CB4129 4.500% 7/01/52 | | | 4,652,363 | | | 4,585,076 |
Pool #MA4733 4.500% 9/01/52 | | | 3,724,426 | | | 3,662,414 |
Pool #AD6437 5.000% 6/01/40 | | | 164,328 | | | 168,692 |
Pool #AD6996 5.000% 7/01/40 | | | 1,031,821 | | | 1,059,606 |
Pool #AL8173 5.000% 2/01/44 | | | 400,834 | | | 411,990 |
Pool #MA4785 5.000% 10/01/52 | | | 1,392,288 | | | 1,392,931 |
Pool #MA4806 5.000% 11/01/52 | | | 4,375,106 | | | 4,378,547 |
Government National Mortgage Association
| | | | | | |
Pool #781038 6.500% 5/15/29 | | | 11,563 | | | 11,825 |
| | | | | | | |
| | | | | | | |
Pool #781468 6.500% 7/15/32 | | | $1,126 | | | $1,168 |
Pool #781496 6.500% 9/15/32 | | | 4,878 | | | 5,039 |
Pool #781124 7.000% 12/15/29 | | | 1,788 | | | 1,831 |
Pool #781319 7.000% 7/15/31 | | | 37,110 | | | 38,322 |
Pool #581417 7.000% 7/15/32 | | | 6,008 | | | 6,129 |
Pool #565982 7.000% 7/15/32 | | | 9,644 | | | 10,051 |
Pool #441009 8.000% 11/15/26 | | | 38 | | | 38 |
Pool #522777 8.000% 12/15/29 | | | 2,207 | | | 2,278 |
Pool #523043 8.000% 3/15/30 | | | 83 | | | 87 |
Pool #529134 8.000% 3/15/30 | | | 956 | | | 1,007 |
Pool #477036 8.000% 4/15/30 | | | 97 | | | 102 |
Pool #503157 8.000% 4/15/30 | | | 8,138 | | | 8,564 |
Pool #528714 8.000% 4/15/30 | | | 764 | | | 806 |
Pool #544640 8.000% 11/15/30 | | | 6,761 | | | 7,154 |
Pool #531298 8.500% 8/15/30 | | | 200 | | | 207 |
Government National Mortgage Association II
| | | | | | |
Pool #MA6038 3.000% 7/20/49 | | | 2,347,269 | | | 2,150,472 |
Pool #MA6283 3.000% 11/20/49 | | | 4,261,569 | | | 3,901,612 |
Pool #MA6409 3.000% 1/20/50 | | | 4,436,800 | | | 4,062,041 |
Pool #MA4321 3.500% 3/20/47 | | | 2,644,814 | | | 2,510,313 |
Pool #MA8647 5.000% 2/20/53 | | | 3,773,056 | | | 3,783,537 |
Pool #MA8725 5.000% 3/20/53 | | | 3,810,408 | | | 3,820,993 |
Pool #MA8947 5.000% 6/20/53 | | | 2,094,211 | | | 2,098,719 |
Pool #MA8429 5.500% 11/20/52 | | | 5,982,000 | | | 6,048,468 |
Pool #MA8648 5.500% 2/20/53 | | | 1,516,409 | | | 1,532,311 |
Pool #MA8801 5.500% 4/20/53 | | | 4,794,158 | | | 4,845,929 |
Pool #MA8879 5.500% 5/20/53 | | | 4,210,963 | | | 4,256,436 |
Pool #MA8948 5.500% 6/20/53 | | | 1,344,484 | | | 1,358,583 |
Pool #MA9171 5.500% 9/20/53 | | | 3,984,291 | | | 4,026,072 |
Pool #MA9241 5.500% 10/20/53 | | | 3,534,320 | | | 3,569,173 |
Pool #MA9488 5.500% 2/20/54 | | | 2,492,532 | | | 2,518,281 |
Government National Mortgage Association II, TBA
| | | | | | |
2.500% 10/20/54 (f) | | | 3,900,000 | | | 3,435,259 |
3.000% 10/20/54 (f) | | | 12,100,000 | | | 11,034,862 |
3.500% 10/20/54 (f) | | | 9,280,000 | | | 8,723,036 |
4.500% 10/20/54 (f) | | | 2,000,000 | | | 1,974,528 |
5.000% 10/20/54 (f) | | | 11,500,000 | | | 11,521,207 |
Uniform Mortgage-Backed Security, TBA
| | | | | | |
2.000% 10/01/54 (f) | | | 6,300,000 | | | 5,209,312 |
2.500% 10/01/54 (f) | | | 28,575,000 | | | 24,658,216 |
3.500% 10/01/54 (f) | | | 13,150,000 | | | 12,249,533 |
4.000% 10/01/54 (f) | | | 6,075,000 | | | 5,834,136 |
4.500% 10/01/54 (f) | | | 3,625,000 | | | 3,563,686 |
5.000% 10/01/54 (f) | | | 20,500,000 | | | 20,483,985 |
| | | | | | | |
| | | | | |
| | | The accompanying notes are an integral part of the financial statements.
| |
26
| | | | |
| | | | | |
TABLE OF CONTENTS
| | MassMutual Core Bond Fund — Portfolio of Investments (Continued) | |
| | | | | | | |
5.500% 10/01/54 (f) | | | $19,400,000 | | | $19,626,586 |
6.000% 10/01/54 (f) | | | 10,300,000 | | | 10,525,715 |
| | | | | | 318,872,116 |
TOTAL U.S. GOVERNMENT AGENCY OBLIGATIONS AND INSTRUMENTALITIES
(Cost $326,172,245) | | | | | | 318,909,202 |
U.S. Treasury Obligations — 10.2%
| | | |
U.S. Treasury Bonds & Notes — 10.2%
| | | |
U.S. Treasury Bonds
| | | | | | |
2.250% 8/15/49 (j) | | | 29,050,000 | | | 20,117,601 |
3.000% 2/15/49 | | | 570,000 | | | 461,171 |
3.000% 8/15/52 | | | 9,000,000 | | | 7,231,666 |
4.125% 8/15/53 | | | 570,000 | | | 567,563 |
4.500% 2/15/44 | | | 19,600,000 | | | 20,426,875 |
4.750% 11/15/43 | | | 5,910,000 | | | 6,375,427 |
4.750% 11/15/53 | | | 2,730,000 | | | 3,015,477 |
U.S. Treasury Notes
| | | | | | |
1.625% 8/15/29 | | | 30,000,000 | | | 27,438,948 |
3.875% 8/15/33 | | | 18,000,000 | | | 18,147,384 |
4.000% 2/15/34 | | | 240,000 | | | 244,125 |
4.250% 2/28/31 | | | 1,550,000 | | | 1,602,890 |
| | | | | | 105,629,127 |
TOTAL U.S. TREASURY OBLIGATIONS
(Cost $104,462,798) | | | | | | 105,629,127 |
TOTAL BONDS & NOTES
(Cost $1,061,116,518) | | | | | | 1,030,507,034 |
TOTAL LONG-TERM INVESTMENTS
(Cost $1,061,116,518) | | | | | | 1,030,507,034 |
Short-Term Investments — 18.4%
| | | |
Commercial Paper — 16.0%
| | | | | | |
American Honda Finance Corp.
5.300% 12/11/24 | | | 4,000,000 | | | 3,960,944 |
Archer-Daniels-Midland Co.
4.918% 10/01/24 (a) | | | 15,750,000 | | | 15,747,886 |
Cargill, Inc.
4.871% 10/04/24 (a) | | | 7,500,000 | | | 7,495,928 |
CRH America Finance, Inc.
| | | | | | |
5.728% 12/05/24 (a) | | | 4,000,000 | | | 3,964,169 |
5.733% 10/15/24 (a) | | | 7,000,000 | | | 6,985,539 |
5.741% 10/08/24 (a) | | | 4,000,000 | | | 3,995,615 |
EIDP, Inc.
5.148% 12/09/24 (a) | | | 5,000,000 | | | 4,953,171 |
| | | | | | | |
| | | | | | | |
Enbridge US, Inc.
5.094% 10/31/24 (a) | | | $12,000,000 | | | $11,947,224 |
Evergy Kansas Central, Inc.
4.959% 10/01/24 (a) | | | 20,100,000 | | | 20,097,257 |
Eversource Energy
5.089% 10/29/24 (a) (f) | | | 10,000,000 | | | 9,961,110 |
Hubbell, Inc.
4.983% 10/07/24 (a) | | | 12,000,000 | | | 11,988,497 |
Keurig Dr. Pepper, Inc.
4.953% 10/03/24 (a) | | | 4,000,000 | | | 3,998,360 |
L3Harris Technologies, Inc.
5.078% 10/23/24 (a) | | | 15,000,000 | | | 14,952,285 |
Magna International, Inc.
| | | | | | |
5.476% 10/31/24 (a) | | | 5,000,000 | | | 4,978,489 |
5.671% 10/08/24 (a) | | | 7,000,000 | | | 6,992,326 |
Microchip Technology, Inc.
5.470% 10/18/24 (a) | | | 6,000,000 | | | 5,984,717 |
NextEra Energy Capital Holdings, Inc.
5.549% 10/24/24 (a) | | | 7,000,000 | | | 6,976,716 |
Penske Truck Leasing Co. LP
5.665% 10/15/24 | | | 2,000,000 | | | 1,995,772 |
Tampa Electric Co.
5.084% 10/15/24 (a) | | | 2,000,000 | | | 1,995,973 |
Volkswagen Financial Services
| | | | | | |
5.089% 10/24/24 (a) | | | 2,000,000 | | | 1,993,348 |
5.091% 10/28/24 (a) | | | 15,000,000 | | | 14,941,630 |
| | | | | | 165,906,956 |
| | | Number of
Shares | | | |
Investment of Cash Collateral from
Securities Loaned — 1.3%
|
State Street Navigator Securities Lending Government Money Market Portfolio (k) | | | 13,631,015 | | | 13,631,015 |
| | | Principal Amount | | | |
Repurchase Agreement — 1.1%
| | | | | | |
Fixed Income Clearing Corp., Repurchase Agreement, dated 9/30/24, 1.520%, due 10/01/24 (l) | | | $11,842,813 | | | 11,842,813 |
TOTAL SHORT-TERM INVESTMENTS
(Cost $191,387,148) | | | | | | 191,380,784 |
| | | | | | | |
| | | | | |
The accompanying notes are an integral part of the financial statements. | | | | |
| | | 27
| |
| | | | | |
TABLE OF CONTENTS
| | MassMutual Core Bond Fund — Portfolio of Investments (Continued) | |
| | | | | | | |
TOTAL INVESTMENTS — 118.0%
(Cost $1,252,503,666) (m) | | | | | | $1,221,887,818 |
Other Assets/
(Liabilities) — (18.0)% | | | | | | (186,780,195) |
NET ASSETS — 100.0% | | | | | | $1,035,107,623 |
| | | | | | | |
Abbreviation Legend
| | | | | |
CLO | | | Collateralized Loan Obligation | |
CMT | | | Constant Maturity Treasury Index | |
FRN | | | Floating Rate Note | |
ICE | | | Inter-Continental Exchange | |
LIBOR | | | London InterBank Offered Rate | |
REMICS | | | Real Estate Mortgage Investment Conduits | |
SOFR | | | Secured Overnight Financing Rate | |
STEP | | | Step Coupon Bond | |
TBA | | | To Be Announced | |
VRN | | | Variable Rate Note | |
| | | | | |
Notes to Portfolio of Investments
Percentages are stated as a percent of net assets.
(a)
| Security is exempt from registration under Regulation S or Rule 144A of the Securities Act of 1933. These securities are considered restricted and may be resold in transactions exempt from registration. At September 30, 2024, the aggregate market value of these securities amounted to $479,944,644 or 46.37% of net assets. |
(b)
| Security is perpetual and has no stated maturity date. |
(c)
| Restricted security. Certain securities are restricted to resale. At September 30, 2024, these securities amounted to a value of $4,812,753 or 0.46% of net assets. The Fund generally bears the costs, if any, associated with the disposition of restricted securities. |
(d)
| Denotes all or a portion of security on loan. The total value of securities on loan as of September 30, 2024, was $14,824,744 or 1.43% of net assets. The Fund received $1,524,104 of non-cash collateral (U.S. Treasury and/or Agency obligations) related to securities lending activity. This amount is not reflected on either the Portfolio of Investments or the Statement of Assets and Liabilities. (Note 2). |
(e)
| Security is currently in default due to bankruptcy or failure to make payment of principal or interest of the issuer. Income is not being accrued. At September 30, 2024, these securities amounted to a value of $376 or 0.00% of net assets. |
(f)
| A portion of this security is purchased on a when-issued, delayed-delivery or forward commitment basis. (Note 2). |
(g)
| Certain variable rate securities are not based on a published reference rate and spread but are determined by the issuer or |
agent and are based on current market conditions. These securities do not indicate a reference rate and spread in their description above. The rates shown are the current interest rates at September 30, 2024.
(h)
| This security is fair valued in good faith in accordance with procedures approved by the Board of Trustees. At September 30, 2024, these securities amounted to a value of $2,458,022 or 0.24% of net assets. |
(i)
| May contain securities that are issued by a U.S. Government Agency, but are unsecured and are not guaranteed by a U.S. Government Agency. |
(j)
| All or a portion of this security is pledged/held as collateral for open derivatives. (Note 2). |
(k)
| Represents investment of security lending cash collateral. (Note 2). |
(l)
| Maturity value of $11,843,313. Collateralized by U.S. Government Agency obligations with rates ranging from 3.625% - 4.000%, maturity dates ranging from 11/15/52 - 2/15/53, and an aggregate market value, including accrued interest, of $12,079,856. |
(m)
| See Note 6 for aggregate cost for federal tax purposes. |
Country weightings, as a percentage of net assets, is as follows:
| | | | |
United States | | | 83.8% |
Cayman Islands | | | 6.6% |
United Kingdom | | | 2.4% |
Canada | | | 1.9% |
France | | | 1.0% |
Australia | | | 0.8% |
Ireland | | | 0.8% |
Germany | | | 0.7% |
Bermuda | | | 0.6% |
Mexico | | | 0.3% |
Netherlands | | | 0.2% |
Brazil | | | 0.2% |
South Africa | | | 0.1% |
Switzerland | | | 0.1% |
Finland | | | 0.1% |
Total Long-Term Investments | | | 99.6% |
Short-Term Investments and Other Assets and Liabilities | | | 0.4% |
Net Assets | | | 100.0% |
| | | | |
| | | | | |
| | | The accompanying notes are an integral part of the financial statements.
| |
28
| | | | |
| | | | | |
TABLE OF CONTENTS
| | MassMutual Core Bond Fund — Portfolio of Investments (Continued) | |
Futures contracts
| | | | | | | | | | | | | |
Long | | | | | | | | | | | | |
U.S. Treasury Long Bond | | | 12/19/24 | | | 210 | | | $26,210,390 | | | $(131,015) |
U.S. Treasury Ultra Bond | | | 12/19/24 | | | 15 | | | 2,011,457 | | | (15,051) |
U.S. Treasury Note 2 Year | | | 12/31/24 | | | 469 | | | 97,796,961 | | | (131,375) |
U.S. Treasury Note 5 Year | | | 12/31/24 | | | 372 | | | 40,962,215 | | | (85,809) |
| | | | | | | | | | | | $ (363,250) |
Short | | | | | | | | | | | | |
U.S. Treasury Ultra 10 Year | | | 12/19/24 | | | 61 | | | $(7,250,225) | | | $34,116 |
| | | | | | | | | | | | | |
| | | | | |
The accompanying notes are an integral part of the financial statements. | | | | |
| | | 29
| |
| | | | | |
TABLE OF CONTENTS
| | | |
| | MassMutual Diversified Bond Fund — Portfolio of Investments | |
| | | |
| | | | | | | |
Bonds & Notes — 94.6%
| | | | | | |
Corporate Debt — 42.2%
| | | | | | |
Aerospace & Defense — 0.6%
| | | | | | |
Boeing Co.
| | | | | | |
5.930% 5/01/60 | | | $140,000 | | | $134,101 |
6.858% 5/01/54 (a) | | | 142,000 | | | 155,861 |
Embraer Netherlands Finance BV
| | | | | | |
7.000% 7/28/30 (a) | | | 300,000 | | | 326,708 |
TransDigm, Inc.
| | | | | | |
5.500% 11/15/27 | | | 250,000 | | | 249,141 |
| | | | | | 865,811 |
Agriculture — 0.2%
| | | | | | |
Imperial Brands Finance PLC
| | | | | | |
5.875% 7/01/34 (a) | | | 200,000 | | | 207,925 |
Reynolds American, Inc.
| | | | | | |
5.850% 8/15/45 | | | 120,000 | | | 120,056 |
| | | | | | 327,981 |
Airlines — 0.4%
| | | | | | |
Alaska Airlines Pass-Through Trust, Series 2020-1, Class A,
| | | | | | |
4.800% 2/15/29 (a) | | | 309,588 | | | 309,191 |
United Airlines Pass-Through Trust
| | | | | | |
Series 2018-1, Class B,
4.600% 9/01/27 | | | 44,205 | | | 43,596 |
Series 2024-1, Class AA,
5.450% 8/15/38 | | | 163,000 | | | 169,634 |
| | | | | | 522,421 |
Auto Manufacturers — 0.6%
| | | | | | |
Ford Motor Credit Co. LLC
| | | | | | |
5.303% 9/06/29 | | | 315,000 | | | 313,517 |
General Motors Co.
| | | | | | |
5.200% 4/01/45 | | | 225,000 | | | 206,230 |
Nissan Motor Acceptance Co. LLC
| | | | | | |
5.300% 9/13/27 (a) (b) | | | 320,000 | | | 319,432 |
| | | | | | 839,179 |
Banks — 6.5%
| | | | | | |
Bank of America Corp.
| | | | | | |
5 yr. CMT + 1.200%
2.482% VRN 9/21/36 | | | 310,000 | | | 261,578 |
5 yr. CMT + 2.000%
3.846% VRN 3/08/37 | | | 460,000 | | | 425,218 |
Barclays PLC
| | | | | | |
5 yr. CMT + 3.410%
4.375% VRN (c) | | | 375,000 | | | 335,648 |
5 yr. CMT + 5.431%
8.000% VRN (c) | | | 290,000 | | | 305,396 |
| | | | | | | |
| | | | | | | |
BNP Paribas SA 5 yr. CMT + 3.340%
| | | | | | |
4.625% VRN (a) (c) | | | $375,000 | | | $326,567 |
BPCE SA (Acquired 7/02/19, Cost $687,600), 1 day USD SOFR + 1.730%
| | | | | | |
3.116% VRN 10/19/32 (a) (d) | | | 450,000 | | | 387,702 |
Citigroup, Inc. 10 yr. CMT + 2.757%
| | | | | | |
7.000% VRN (c) | | | 226,000 | | | 241,844 |
Citizens Financial Group, Inc. 1 day USD SOFR + 2.325%
| | | | | | |
6.645% VRN 4/25/35 | | | 346,000 | | | 379,871 |
Discover Bank 5 yr. USD SOFR ICE Swap Rate + 1.730%
| | | | | | |
5.974% VRN 8/09/28 | | | 468,000 | | | 483,265 |
HSBC Holdings PLC
| | | | | | |
6.500% 9/15/37 | | | 125,000 | | | 137,266 |
7.350% 11/27/32 | | | 415,000 | | | 460,609 |
Huntington Bancshares, Inc. 3 mo. USD Term SOFR + 3.142%
| | | | | | |
8.443% VRN (c) | | | 510,000 | | | 509,326 |
ING Groep NV 5 yr. USD
Swap + 4.446%
| | | | | | |
6.500% VRN (c) | | | 675,000 | | | 675,565 |
JP Morgan Chase & Co. 3 mo. USD Term SOFR + 2.515%
| | | | | | |
2.956% VRN 5/13/31 | | | 235,000 | | | 216,141 |
Lloyds Banking Group PLC 5 yr. CMT + 3.913%
| | | | | | |
8.000% VRN (b) (c) | | | 605,000 | | | 648,177 |
Macquarie Bank Ltd. 5 yr.
CMT + 1.700%
| | | | | | |
3.052% VRN 3/03/36 (a) | | | 650,000 | | | 568,343 |
Morgan Stanley
| | | | | | |
1 day USD SOFR + 1.360%
2.484% VRN 9/16/36 | | | 280,000 | | | 234,290 |
1 day USD SOFR + 2.620% 5.297% VRN 4/20/37 | | | 185,000 | | | 186,400 |
Nordea Bank Abp 5 yr.
CMT + 4.110%
| | | | | | |
6.625% VRN (a) (c) | | | 275,000 | | | 278,356 |
Societe Generale SA
| | | | | | |
1 yr. CMT + 1.300%
2.797% VRN 1/19/28 (a) | | | 300,000 | | | 286,627 |
5 yr. USD ICE Swap +
5.873% 8.000% VRN (a) (c) | | | 525,000 | | | 530,294 |
SVB Financial Group
| | | | | | |
4.100% (c) (e) | | | 210,000 | | | 263 |
4.250% (c) (e) | | | 590,000 | | | 738 |
Synovus Bank
| | | | | | |
5.625% 2/15/28 | | | 300,000 | | | 301,621 |
| | | | | | | |
| | | | | |
| | | The accompanying notes are an integral part of the financial statements.
| |
30
| | | | |
| | | | | |
TABLE OF CONTENTS
| | MassMutual Diversified Bond Fund — Portfolio of Investments (Continued) | |
| | | | | | | |
Toronto-Dominion Bank 5 yr.
CMT + 4.075%
| | | | | | |
8.125% VRN 10/31/82 | | | $358,000 | | | $384,067 |
Wells Fargo & Co. 5 yr.
CMT + 2.767%
| | | | | | |
6.850% VRN (c) | | | 201,000 | | | 209,784 |
| | | | | | 8,774,956 |
Beverages — 0.4%
| | | | | | |
Bacardi Ltd.
| | | | | | |
5.150% 5/15/38 (a) | | | 200,000 | | | 195,030 |
Molson Coors Beverage Co.
| | | | | | |
4.200% 7/15/46 | | | 366,000 | | | 315,751 |
| | | | | | 510,781 |
Biotechnology — 0.3%
| | | | | | |
Amgen, Inc.
| | | | | | |
5.600% 3/02/43 | | | 171,000 | | | 179,651 |
5.750% 3/02/63 | | | 150,000 | | | 158,329 |
| | | | | | 337,980 |
Building Materials — 0.3%
| | | | | | |
Standard Industries, Inc.
| | | | | | |
4.375% 7/15/30 (a) | | | 200,000 | | | 189,301 |
4.750% 1/15/28 (a) | | | 151,000 | | | 147,903 |
| | | | | | 337,204 |
Chemicals — 0.3%
| | | | | | |
Dow Chemical Co.
| | | | | | |
5.600% 2/15/54 | | | 147,000 | | | 151,829 |
LYB International Finance III LLC
| | | | | | |
4.200% 5/01/50 | | | 265,000 | | | 217,607 |
| | | | | | 369,436 |
Computers — 0.4%
| | | | | | |
Dell International LLC/EMC Corp.
| | | | | | |
8.350% 7/15/46 | | | 96,000 | | | 129,818 |
Kyndryl Holdings, Inc.
| | | | | | |
6.350% 2/20/34 | | | 116,000 | | | 124,014 |
Leidos, Inc.
| | | | | | |
5.500% 7/01/33 | | | 226,000 | | | 229,848 |
| | | | | | 483,680 |
Distribution & Wholesale — 0.4%
| | | | | | |
H&E Equipment Services, Inc.
| | | | | | |
3.875% 12/15/28 (a) | | | 600,000 | | | 563,306 |
Diversified Financial Services — 2.7%
|
AerCap Holdings NV 5 yr.
CMT + 4.535%
| | | | | | |
5.875% VRN 10/10/79 (b) | | | 275,000 | | | 274,995 |
American Express Co. 1 day USD SOFR + 1.630%
| | | | | | |
5.915% VRN 4/25/35 | | | 201,000 | | | 214,400 |
| | | | | | | |
| | | | | | | |
Apollo Global Management, Inc.
| | | | | | |
5.800% 5/21/54 | | | $236,000 | | | $251,598 |
ARES Finance Co. III LLC 5 yr. CMT + 3.237%
| | | | | | |
4.125% VRN 6/30/51 (a) | | | 295,000 | | | 281,237 |
ARES Finance Co. LLC
| | | | | | |
4.000% 10/08/24 (a) | | | 375,000 | | | 374,859 |
Avolon Holdings Funding Ltd.
| | | | | | |
2.528% 11/18/27 (a) | | | 375,000 | | | 350,177 |
BGC Group, Inc.
| | | | | | |
4.375% 12/15/25 | | | 475,000 | | | 470,499 |
6.600% 6/10/29 | | | 300,000 | | | 310,332 |
Blue Owl Finance LLC
| | | | | | |
3.125% 6/10/31 (a) | | | 475,000 | | | 416,183 |
4.125% 10/07/51 (a) | | | 84,000 | | | 63,216 |
Charles Schwab Corp. 5 yr.
CMT + 3.168%
| | | | | | |
4.000% VRN (c) | | | 425,000 | | | 407,655 |
OneMain Finance Corp.
| | | | | | |
4.000% 9/15/30 | | | 220,000 | | | 195,949 |
| | | | | | 3,611,100 |
Electric — 1.8%
| | | | | | |
Berkshire Hathaway Energy Co.
| | | | | | |
5.950% 5/15/37 | | | 120,000 | | | 130,720 |
Cleveland Electric Illuminating Co.
| | | | | | |
5.950% 12/15/36 | | | 145,000 | | | 155,376 |
CMS Energy Corp.
| | | | | | |
4.700% 3/31/43 | | | 115,000 | | | 105,646 |
Dominion Energy South Carolina, Inc.
| | | | | | |
6.250% 10/15/53 | | | 57,000 | | | 66,443 |
Duke Energy Florida LLC
| | | | | | |
6.200% 11/15/53 | | | 133,000 | | | 152,829 |
Elwood Energy LLC
| | | | | | |
8.159% 7/05/26 | | | 38,447 | | | 36,140 |
Massachusetts Electric Co.
| | | | | | |
5.867% 2/26/54 (a) | | | 355,000 | | | 382,297 |
MidAmerican Energy Co.
| | | | | | |
5.300% 2/01/55 | | | 104,000 | | | 107,495 |
NextEra Energy Capital Holdings, Inc. 5 yr. CMT + 2.547%
| | | | | | |
3.800% VRN 3/15/82 | | | 475,000 | | | 452,433 |
Pacific Gas & Electric Co.
| | | | | | |
4.300% 3/15/45 | | | 160,000 | | | 133,826 |
Sempra 5 yr. CMT + 2.789%
| | | | | | |
6.875% VRN 10/01/54 | | | 332,000 | | | 344,134 |
Tampa Electric Co.
| | | | | | |
4.450% 6/15/49 | | | 94,000 | | | 84,792 |
| | | | | | | |
| | | | | |
The accompanying notes are an integral part of the financial statements. | | | | |
| | | 31
| |
| | | | | |
TABLE OF CONTENTS
| | MassMutual Diversified Bond Fund — Portfolio of Investments (Continued) | |
| | | | | | | |
Virginia Electric & Power Co.
| | | | | | |
5.350% 1/15/54 | | | $197,000 | | | $201,448 |
6.000% 1/15/36 | | | 100,000 | | | 109,577 |
| | | | | | 2,463,156 |
Entertainment — 0.3%
| | | | | | |
Live Nation Entertainment, Inc.
| | | | | | |
5.625% 3/15/26 (a) | | | 77,000 | | | 76,804 |
Warnermedia Holdings, Inc.
| | | | | | |
4.279% 3/15/32 (b) | | | 275,000 | | | 244,291 |
5.141% 3/15/52 | | | 150,000 | | | 115,691 |
| | | | | | 436,786 |
Food — 1.0%
| | | | | | |
JBS USA Holding Lux SARL/JBS USA Food Co./JBS Lux Co. SARL
| | | | | | |
6.750% 3/15/34 (a) | | | 242,000 | | | 268,111 |
7.250% 11/15/53 (a) | | | 260,000 | | | 303,313 |
Smithfield Foods, Inc.
| | | | | | |
2.625% 9/13/31 (a) | | | 375,000 | | | 317,764 |
3.000% 10/15/30 (a) | | | 81,000 | | | 72,600 |
4.250% 2/01/27 (a) | | | 340,000 | | | 334,356 |
| | | | | | 1,296,144 |
Health Care – Services — 0.2%
| | | | | | |
Humana, Inc.
| | | | | | |
5.750% 4/15/54 | | | 163,000 | | | 166,843 |
UnitedHealth Group, Inc.
| | | | | | |
5.750% 7/15/64 | | | 123,000 | | | 132,779 |
| | | | | | 299,622 |
Home Builders — 0.0%
| | | | | | |
Mattamy Group Corp.
| | | | | | |
4.625% 3/01/30 (a) (b) | | | 35,000 | | | 33,509 |
Insurance — 7.4%
| | | | | | |
Allianz SE 5 yr. CMT + 2.973%
| | | | | | |
3.500% VRN (a) (c) | | | 1,176,000 | | | 1,132,817 |
Allstate Corp., (Acquired 7/02/19, Cost $687,600), 3 mo. USD Term SOFR + 3.200%
| | | | | | |
8.318% VRN 8/15/53 (d) | | | 640,000 | | | 643,200 |
Arthur J Gallagher & Co.
| | | | | | |
5.750% 7/15/54 | | | 115,000 | | | 120,040 |
Ascot Group Ltd.
| | | | | | |
4.250% 12/15/30 (a) | | | 450,000 | | | 390,222 |
Athene Holding Ltd.
| | | | | | |
6.250% 4/01/54 | | | 355,000 | | | 378,447 |
AXIS Specialty Finance LLC 5 yr. CMT + 3.186%
| | | | | | |
4.900% VRN 1/15/40 | | | 400,000 | | | 382,779 |
| | | | | | | |
| | | | | | | |
Brighthouse Financial, Inc.
| | | | | | |
3.850% 12/22/51 | | | $575,000 | | | $397,863 |
CNO Financial Group, Inc.
| | | | | | |
6.450% 6/15/34 | | | 158,000 | | | 167,024 |
Corebridge Financial, Inc. 5 yr.
CMT + 3.846%
| | | | | | |
6.875% VRN 12/15/52 | | | 600,000 | | | 621,096 |
Enstar Finance LLC 5 yr.
CMT + 5.468%
| | | | | | |
5.750% VRN 9/01/40 | | | 910,000 | | | 899,248 |
Equitable Holdings, Inc. 5 yr.
CMT + 4.736%
| | | | | | |
4.950% VRN (c) | | | 410,000 | | | 406,107 |
Fairfax Financial Holdings Ltd.
| | | | | | |
6.100% 3/15/55 (a) | | | 295,000 | | | 307,177 |
Global Atlantic Fin Co.
| | | | | | |
3.125% 6/15/31 (a) | | | 310,000 | | | 272,366 |
5 yr. CMT + 3.796%
4.700% VRN 10/15/51 (a) | | | 955,000 | | | 914,288 |
6.750% 3/15/54 (a) | | | 81,000 | | | 86,185 |
Jackson National Life Global Funding
| | | | | | |
4.600% 10/01/29 (a) (f) | | | 180,000 | | | 179,527 |
Liberty Mutual Group, Inc. 5 yr. CMT + 3.315%
| | | | | | |
4.125% VRN 12/15/51 (a) | | | 255,000 | | | 241,231 |
Lincoln National Corp., (Acquired 11/15/22, Cost $169,000), 5 yr. CMT + 5.318%
| | | | | | |
9.250% VRN (c) (d) | | | 169,000 | | | 185,901 |
Markel Group, Inc.
| | | | | | |
6.000% 5/16/54 | | | 259,000 | | | 275,388 |
MetLife Capital Trust IV
| | | | | | |
7.875% 12/15/67 (a) | | | 225,000 | | | 250,314 |
Pine Street Trust III
| | | | | | |
6.223% 5/15/54 (a) | | | 310,000 | | | 336,055 |
Prudential Financial, Inc. 5 yr.
CMT + 3.162%
| | | | | | |
5.125% VRN 3/01/52 | | | 275,000 | | | 272,890 |
Sammons Financial Group, Inc.
| | | | | | |
3.350% 4/16/31 (a) | | | 320,000 | | | 278,969 |
4.750% 4/08/32 (a) | | | 790,000 | | | 742,881 |
USF&G Capital I
| | | | | | |
8.500% 12/15/45 (a) | | | 95,000 | | | 98,495 |
| | | | | | 9,980,510 |
Investment Companies — 4.2%
| | | | | | |
Antares Holdings LP
| | | | | | |
2.750% 1/15/27 (a) | | | 345,000 | | | 323,084 |
3.750% 7/15/27 (a) | | | 605,000 | | | 573,714 |
8.500% 5/18/25 (a) | | | 330,000 | | | 334,675 |
| | | | | | | |
| | | | | |
| | | The accompanying notes are an integral part of the financial statements.
| |
32
| | | | |
| | | | | |
TABLE OF CONTENTS
| | MassMutual Diversified Bond Fund — Portfolio of Investments (Continued) | |
| | | | | | | |
ARES Capital Corp.
| | | | | | |
5.875% 3/01/29 | | | $207,000 | | | $211,974 |
ARES Strategic Income Fund
| | | | | | |
6.350% 8/15/29 (a) | | | 560,000 | | | 572,448 |
Blackstone Private Credit Fund
| | | | | | |
2.625% 12/15/26 | | | 155,000 | | | 146,560 |
4.950% 9/26/27 (a) | | | 212,000 | | | 210,102 |
Blackstone Secured Lending Fund
| | | | | | |
2.750% 9/16/26 (b) | | | 375,000 | | | 358,337 |
Blue Owl Capital Corp.
| | | | | | |
8.450% 11/15/26 (a) | | | 375,000 | | | 393,735 |
Blue Owl Credit Income Corp.
| | | | | | |
4.700% 2/08/27 | | | 410,000 | | | 402,292 |
Blue Owl Technology Finance Corp. II
| | | | | | |
6.750% 4/04/29 (a) | | | 257,000 | | | 258,203 |
Golub Capital BDC, Inc.
| | | | | | |
2.500% 8/24/26 | | | 160,000 | | | 151,741 |
6.000% 7/15/29 (b) | | | 593,000 | | | 602,531 |
Icahn Enterprises LP/Icahn Enterprises Finance Corp.
| | | | | | |
6.250% 5/15/26 | | | 1,000,000 | | | 992,200 |
Sixth Street Specialty Lending, Inc.
| | | | | | |
6.125% 3/01/29 | | | 179,000 | | | 183,867 |
| | | | | | 5,715,463 |
Leisure Time — 1.0%
| | | | | | |
NCL Corp. Ltd.
| | | | | | |
6.250% 3/01/30 (a) | | | 219,000 | | | 218,757 |
Royal Caribbean Cruises Ltd.
| | | | | | |
5.500% 8/31/26 (a) | | | 485,000 | | | 489,748 |
Sabre GLBL, Inc.
| | | | | | |
8.625% 6/01/27 (a) (b) | | | 250,000 | | | 245,906 |
11.250% 12/15/27 (a) (b) | | | 325,000 | | | 337,238 |
| | | | | | 1,291,649 |
Lodging — 0.4%
| | | | | | |
Hilton Grand Vacations Borrower Escrow LLC/Hilton Grand Vacations Borrower Escrow, Inc.
| | | | | | |
6.625% 1/15/32 (a) | | | 500,000 | | | 506,128 |
Media — 1.6%
| | | | | | |
CCO Holdings LLC/CCO Holdings Capital Corp.
| | | | | | |
5.000% 2/01/28 (a) | | | 250,000 | | | 243,189 |
Charter Communications Operating LLC/Charter Communications Operating Capital
| | | | | | |
2.300% 2/01/32 | | | 440,000 | | | 354,442 |
6.484% 10/23/45 | | | 175,000 | | | 168,822 |
| | | | | | | |
| | | | | | | |
CSC Holdings LLC
| | | | | | |
4.625% 12/01/30 (a) | | | $250,000 | | | $126,873 |
5.000% 11/15/31 (a) | | | 325,000 | | | 160,609 |
5.750% 1/15/30 (a) | | | 200,000 | | | 103,527 |
DISH DBS Corp.
| | | | | | |
7.375% 7/01/28 | | | 223,000 | | | 167,125 |
Paramount Global
| | | | | | |
3.700% 6/01/28 | | | 300,000 | | | 284,652 |
5 yr. CMT + 3.999%
6.375% VRN 3/30/62 | | | 304,000 | | | 281,196 |
Time Warner Cable LLC
| | | | | | |
4.500% 9/15/42 | | | 180,000 | | | 137,929 |
6.750% 6/15/39 | | | 115,000 | | | 115,167 |
| | | | | | 2,143,531 |
Mining — 0.6%
| | | | | | |
Anglo American Capital PLC
| | | | | | |
6.000% 4/05/54 (a) | | | 330,000 | | | 345,528 |
Novelis Corp.
| | | | | | |
3.875% 8/15/31 (a) | | | 533,000 | | | 487,248 |
| | | | | | 832,776 |
Oil & Gas — 1.9%
| | | | | | |
Antero Resources Corp.
| | | | | | |
7.625% 2/01/29 (a) | | | 74,000 | | | 76,351 |
BP Capital Markets PLC 5 yr.
CMT + 2.153%
| | | | | | |
6.450% VRN (b) (c) | | | 134,000 | | | 140,959 |
EQT Corp.
| | | | | | |
7.000% STEP 2/01/30 | | | 265,000 | | | 289,331 |
Occidental Petroleum Corp.
| | | | | | |
6.050% 10/01/54 | | | 307,000 | | | 311,682 |
Ovintiv, Inc.
| | | | | | |
6.500% 8/15/34 | | | 75,000 | | | 80,974 |
6.500% 2/01/38 | | | 160,000 | | | 171,454 |
7.100% 7/15/53 | | | 420,000 | | | 473,347 |
Patterson-UTI Energy, Inc.
| | | | | | |
5.150% 11/15/29 | | | 615,000 | | | 607,318 |
Petroleos Mexicanos
| | | | | | |
5.350% 2/12/28 | | | 190,000 | | | 177,557 |
6.375% 1/23/45 | | | 35,000 | | | 24,396 |
6.500% 3/13/27 | | | 65,000 | | | 63,741 |
Santos Finance Ltd.
| | | | | | |
3.649% 4/29/31 (a) | | | 165,000 | | | 149,908 |
| | | | | | 2,567,018 |
Oil & Gas Services — 0.5%
| | | | | | |
Nov, Inc.
| | | | | | |
3.950% 12/01/42 | | | 254,000 | | | 200,626 |
| | | | | | | |
| | | | | |
The accompanying notes are an integral part of the financial statements. | | | | |
| | | 33
| |
| | | | | |
TABLE OF CONTENTS
| | MassMutual Diversified Bond Fund — Portfolio of Investments (Continued) | |
| | | | | | | |
Weatherford International Ltd.
| | | | | | |
8.625% 4/30/30 (a) | | | $483,000 | | | $503,296 |
| | | | | | 703,922 |
Pharmaceuticals — 0.8%
| | | | | | |
1375209 BC Ltd.
| | | | | | |
9.000% 1/30/28 (a) (b) | | | 158,000 | | | 156,596 |
Bausch Health Cos., Inc.
| | | | | | |
11.000% 9/30/28 (a) | | | 282,000 | | | 262,965 |
CVS Health Corp.
| | | | | | |
5.050% 3/25/48 | | | 115,000 | | | 104,964 |
5.875% 6/01/53 | | | 100,000 | | | 101,764 |
CVS Pass-Through Trust
| | | | | | |
5.926% 1/10/34 (a) | | | 145,604 | | | 148,043 |
7.507% 1/10/32 (a) | | | 10,120 | | | 10,790 |
Utah Acquisition Sub, Inc.
| | | | | | |
5.250% 6/15/46 | | | 405,000 | | | 355,517 |
| | | | | | 1,140,639 |
Pipelines — 1.2%
| | | | | | |
Enbridge, Inc., Series NC5, 5 yr. CMT + 3.785%
| | | | | | |
8.250% VRN 1/15/84 | | | 250,000 | | | 264,821 |
Energy Transfer LP
| | | | | | |
5.950% 5/15/54 | | | 138,000 | | | 141,236 |
5 yr. CMT + 5.134%
6.750% VRN (c) | | | 270,000 | | | 268,584 |
EnLink Midstream Partners LP 3 mo. USD Term SOFR + 4.372%
| | | | | | |
9.313% VRN (c) | | | 375,000 | | | 375,331 |
Enterprise Products Operating LLC
3 mo. USD Term SOFR + 3.295%
| | | | | | |
5.250% VRN 8/16/77 | | | 250,000 | | | 246,599 |
Plains All American Pipeline LP
3 mo. USD Term SOFR + 4.372%
| | | | | | |
9.490% VRN (c) | | | 325,000 | | | 323,600 |
| | | | | | 1,620,171 |
Private Equity — 1.4%
| | | | | | |
Apollo Management Holdings LP
5 yr. CMT + 3.266%
| | | | | | |
4.950% VRN 1/14/50 (a) | | | 325,000 | | | 322,562 |
Brookfield Finance, Inc.
| | | | | | |
5.968% 3/04/54 | | | 279,000 | | | 303,020 |
Hercules Capital, Inc.
| | | | | | |
2.625% 9/16/26 | | | 738,000 | | | 697,427 |
3.375% 1/20/27 | | | 340,000 | | | 323,701 |
KKR Group Finance Co. VIII LLC
| | | | | | |
3.500% 8/25/50 (a) | | | 160,000 | | | 117,230 |
| | | | | | | |
| | | | | | | |
KKR Group Finance Co. X LLC
| | | | | | |
3.250% 12/15/51 (a) | | | $153,000 | | | $107,960 |
| | | | | | 1,871,900 |
Real Estate Investment Trusts (REITS) — 3.1%
|
Broadstone Net Lease LLC
| | | | | | |
2.600% 9/15/31 | | | 605,000 | | | 508,876 |
EPR Properties
| | | | | | |
3.600% 11/15/31 | | | 185,000 | | | 164,914 |
3.750% 8/15/29 | | | 125,000 | | | 116,889 |
4.500% 6/01/27 | | | 355,000 | | | 349,815 |
4.950% 4/15/28 | | | 100,000 | | | 99,110 |
Equinix Europe 2 Financing Corp. LLC
| | | | | | |
5.500% 6/15/34 | | | 225,000 | | | 236,099 |
Omega Healthcare Investors, Inc.
| | | | | | |
3.625% 10/01/29 | | | 305,000 | | | 287,449 |
Piedmont Operating Partnership LP
| | | | | | |
2.750% 4/01/32 | | | 235,000 | | | 190,609 |
9.250% 7/20/28 | | | 133,000 | | | 148,851 |
Service Properties Trust
| | | | | | |
4.950% 10/01/29 (b) | | | 590,000 | | | 468,623 |
Store Capital LLC
| | | | | | |
4.500% 3/15/28 | | | 225,000 | | | 220,782 |
4.625% 3/15/29 | | | 525,000 | | | 514,629 |
Ventas Realty LP
| | | | | | |
5.700% 9/30/43 | | | 85,000 | | | 87,788 |
WEA Finance LLC
| | | | | | |
2.875% 1/15/27 (a) | | | 385,000 | | | 368,225 |
3.500% 6/15/29 (a) | | | 375,000 | | | 351,674 |
| | | | | | 4,114,333 |
Retail — 0.5%
| | | | | | |
Nordstrom, Inc.
| | | | | | |
4.250% 8/01/31 | | | 440,000 | | | 387,556 |
Sonic Automotive, Inc.
| | | | | | |
4.875% 11/15/31 (a) (b) | | | 277,000 | | | 255,733 |
| | | | | | 643,289 |
Software — 0.2%
| | | | | | |
Oracle Corp.
| | | | | | |
5.375% 9/27/54 | | | 330,000 | | | 329,798 |
Telecommunications — 1.0%
| | | | | | |
AT&T, Inc.
| | | | | | |
3.550% 9/15/55 | | | 664,000 | | | 485,673 |
Cisco Systems, Inc.
| | | | | | |
5.300% 2/26/54 | | | 49,000 | | | 51,988 |
Hughes Satellite Systems Corp.
| | | | | | |
6.625% 8/01/26 (b) | | | 444,000 | | | 386,439 |
Sprint Capital Corp.
| | | | | | |
8.750% 3/15/32 | | | 141,000 | | | 174,829 |
| | | | | | | |
| | | | | |
| | | The accompanying notes are an integral part of the financial statements.
| |
34
| | | | |
| | | | | |
TABLE OF CONTENTS
| | MassMutual Diversified Bond Fund — Portfolio of Investments (Continued) | |
| | | | | | | |
T-Mobile USA, Inc.
| | | | | | |
6.000% 6/15/54 | | | $190,000 | | | $209,339 |
| | | | | | 1,308,268 |
TOTAL CORPORATE DEBT (Cost $58,958,719) | | | | | | 56,842,447 |
Non-U.S. Government Agency
Obligations — 25.1%
|
Commercial Mortgage-Backed Securities — 7.7%
|
Aventura Mall Trust,
Series 2018-AVM, Class D,
| | | | | | |
4.249% VRN 7/05/40 (a) (g) | | | 530,000 | | | 495,681 |
BAMLL Commercial Mortgage Securities Trust,
Series 2019-BPR, Class CMP,
| | | | | | |
4.024% VRN 11/05/32 (a) (g) | | | 440,000 | | | 409,218 |
Bank
| | | | | | |
Series 2020-BN30, Class MCDF, 3.016% VRN 12/15/53 (g) | | | 500,000 | | | 277,473 |
Series 2019-BN17, Class C, 4.660% VRN 4/15/52 (g) | | | 331,000 | | | 284,919 |
Benchmark Mortgage Trust
| | | | | | |
Series 2021-B25, Class 300C, 3.094% VRN 4/15/54 (a) (g) | | | 500,000 | | | 312,139 |
Series 2020-IG1, Class D, 3.347% VRN 9/15/43 (g) | | | 400,000 | | | 118,765 |
BGME Trust,
Series 2021-VR, Class D,
| | | | | | |
3.094% VRN 1/10/43 (a) (g) | | | 3,100,000 | | | 2,429,741 |
BMO Mortgage Trust,
Series 2023-C4, Class A5,
| | | | | | |
5.117% VRN 2/15/56 (g) | | | 300,000 | | | 307,447 |
CAMB Commercial Mortgage Trust, Series 2019-LIFE, Class E, 1 mo. USD Term SOFR + 2.447%
| | | | | | |
7.544% FRN 12/15/37 (a) | | | 572,453 | | | 571,738 |
Citigroup Commercial Mortgage Trust,
Series 2019-GC41, Class C
| | | | | | |
3.502% 8/10/56 | | | 222,000 | | | 186,853 |
COMM Mortgage Trust,
Series 2015-CR23, Class C,
4.408% VRN 5/10/48 (g) | | | 110,000 | | | 103,883 |
DC Office Trust
| | | | | | |
Series 2019-MTC, Class D, 3.174% VRN 9/15/45 (a) (g) | | | 357,000 | | | 239,860 |
Series 2019-MTC, Class E, 3.174% VRN 9/15/45 (a) (g) | | | 622,000 | | | 347,983 |
| | | | | | | |
| | | | | | | |
DROP Mortgage Trust,
Series 2021-FILE, Class D, 1 mo. USD Term SOFR + 2.864%
| | | | | | |
7.962% FRN 10/15/43 (a) | | | $998,000 | | | $820,106 |
GS Mortgage Securities Trust, Series 2018-GS10, Class D
| | | | | | |
3.000% 7/10/51 (a) | | | 599,000 | | | 420,222 |
Hudson Yards Mortgage Trust, Series 2019-30HY, Class E,
| | | | | | |
3.558% VRN 7/10/39 (a) (g) | | | 630,000 | | | 536,874 |
Jackson Park Trust,
Series 2019-LIC, Class D,
| | | | | | |
3.351% VRN 10/14/39 (a) (g) | | | 686,000 | | | 559,610 |
JPMBB Commercial Mortgage Securities Trust,
Series 2014-C21, Class C,
| | | | | | |
4.716% VRN 8/15/47 (g) | | | 223,449 | | | 220,185 |
Life Mortgage Trust,
Series 2021-BMR, Class E, 1 mo. USD Term SOFR + 1.864%
| | | | | | |
6.962% FRN 3/15/38 (a) | | | 342,634 | | | 332,159 |
MFT Mortgage Trust
| | | | | | |
Series 2020-ABC, Class A, 3.358% 2/10/42 (a) | | | 205,000 | | | 139,082 |
Series 2020-ABC, Class B, 3.593% VRN 2/10/42 (a) (g) | | | 215,000 | | | 135,203 |
VASA Trust,
Series 2021-VASA, Class D,
1 mo. USD Term SOFR + 2.214%
| | | | | | |
7.312% FRN 7/15/39 (a) | | | 864,000 | | | 603,292 |
Wells Fargo Commercial Mortgage Trust
| | | | | | |
Series 2015-NXS1, Class C, 3.848% VRN 5/15/48 (g) | | | 140,000 | | | 133,697 |
Series 2021-FCMT, Class C, 1 mo. USD Term SOFR + 2.514% 7.612% FRN 5/15/31 (a) | | | 461,000 | | | 446,029 |
| | | | | | 10,432,159 |
Home Equity Asset-Backed Securities — 0.0%
|
Argent Securities, Inc. Asset-Backed Pass-Through Certificates, Series 2004-W10, Class M1, 1 mo. USD Term SOFR + 1.014%
| | | | | | |
4.081% FRN 10/25/34 | | | 65,862 | | | 64,300 |
Other Asset-Backed Securities — 12.6%
|
AIMCO CLO, 3 mo. USD Term SOFR + 1.662%
| | | | | | |
6.947% FRN 4/17/31 (a) | | | 250,000 | | | 250,371 |
| | | | | | | |
| | | | | |
The accompanying notes are an integral part of the financial statements. | | | | |
| | | 35
| |
| | | | | |
TABLE OF CONTENTS
| | MassMutual Diversified Bond Fund — Portfolio of Investments (Continued) | |
| | | | | | | |
Apidos CLO XLIV Ltd.,
Series 2023-44A, Class B, 3 mo. USD Term SOFR + 2.550%
| | | | | | |
7.829% FRN 4/26/35 (a) | | | $500,000 | | | $501,444 |
Apidos CLO XLVIII Ltd., Series 2024-48A, Class A1, 3 mo. USD Term SOFR + 1.440%
| | | | | | |
6.755% FRN 7/25/37 (a) | | | 500,000 | | | 501,512 |
Apidos CLO XXX Ltd., Series XXXA, Class A2R, 3 mo. USD Term SOFR + 1.500%
| | | | | | |
6.695% FRN 10/18/31 (a) | | | 500,000 | | | 500,348 |
Bain Capital Credit CLO Ltd., Series 2022-1A, Class A1, 3 mo. USD Term SOFR + 1.320%
| | | | | | |
6.599% FRN 4/18/35 (a) | | | 500,000 | | | 500,125 |
Blackbird Capital Aircraft Lease Securitization Ltd.,
Series 2016-1A, Class A,
| | | | | | |
4.213% STEP 12/16/41 (a) | | | 189,437 | | | 188,267 |
Canyon CLO Ltd., 3 mo. USD Term SOFR + 1.962%
| | | | | | |
7.263% FRN 10/15/34 (a) | | | 500,000 | | | 500,638 |
CIFC Funding Ltd.,
Series 2019-6A, Class A1R, 3 mo. USD Term SOFR + 1.450%
| | | | | | |
6.778% FRN 7/16/37 (a) | | | 500,000 | | | 501,271 |
DataBank Issuer LLC,
Series 2021-1A, Class B
| | | | | | |
2.650% 2/27/51 (a) | | | 300,000 | | | 281,561 |
Diameter Capital CLO 2 Ltd., 3 mo. USD Term SOFR + 1.482%
| | | | | | |
6.783% FRN 10/15/36 (a) | | | 500,000 | | | 500,349 |
Galaxy XXII CLO Ltd.,
Series 2016-22A, Class ARRR,
3 mo. USD Term SOFR + 1.240%
| | | | | | |
6.103% FRN 4/16/34 (a) (f) | | | 750,000 | | | 750,132 |
Goodgreen Trust
| | | | | | |
Series 2016-1A, Class A, 3.230% 10/15/52 (a) | | | 121,776 | | | 113,134 |
Series 2017-1A, Class A, 3.740% 10/15/52 (a) | | | 67,068 | | | 62,752 |
Series 2019-2A, Class B, 3.860% 4/15/55 (a) | | | 82,841 | | | 72,056 |
Series 2021-1A, Class C, 5.740% 10/15/56 (a) | | | 371,407 | | | 321,732 |
Harbor Park CLO 18-1 Ltd., Series 2018-1A, Class B1R, 3 mo. USD Term SOFR + 1.700%
| | | | | | |
6.982% FRN 1/20/31 (a) | | | 500,000 | | | 500,250 |
| | | | | | | |
| | | | | | | |
Hero Funding Trust
| | | | | | |
Series 2016-3A, Class A1,
3.080% 9/20/42 (a) | | | $38,996 | | | $35,383 |
Series 2017-3A, Class A1,
3.190% 9/20/48 (a) | | | 55,646 | | | 49,607 |
Series 2017-2A, Class A1,
3.280% 9/20/48 (a) | | | 21,266 | | | 19,076 |
Series 2016-4A, Class A2,
4.290% 9/20/47 (a) | | | 41,048 | | | 38,504 |
Horizon Aircraft Finance I Ltd., Series 2018-1, Class B
| | | | | | |
5.270% 12/15/38 (a) | | | 225,200 | | | 141,872 |
Horizon Aircraft Finance II Ltd., Series 2019-1, Class B
| | | | | | |
4.703% 7/15/39 (a) | | | 273,167 | | | 182,688 |
JG Wentworth XLIII LLC, Series 2019-1A, Class B
| | | | | | |
4.510% 8/15/73 (a) | | | 123,383 | | | 110,275 |
Labrador Aviation Finance Ltd., Series 2016-1A, Class A1
| | | | | | |
4.300% 1/15/42 (a) | | | 235,690 | | | 218,024 |
MACH 1 Cayman Ltd.,
Series 2019-1, Class B
| | | | | | |
4.335% 10/15/39 (a) | | | 319,562 | | | 262,038 |
Madison Park Funding XXVIII Ltd., Series 2018-28A, Class B, 3 mo. USD Term SOFR + 1.862%
| | | | | | |
7.163% FRN 7/15/30 (a) | | | 950,000 | | | 951,829 |
Marble Point CLO XIX Ltd., Series 2020-3A, Class AR, 3 mo. USD Term SOFR + 1.400%
| | | | | | |
6.680% FRN 1/19/34 (a) | | | 500,000 | | | 500,565 |
Mariner Finance Issuance Trust, Series 2021-AA, Class D
| | | | | | |
3.830% 3/20/36 (a) | | | 381,000 | | | 363,430 |
MCA Fund Holding LLC, Series 2020-1, Class A
| | | | | | |
3.250% 11/15/35 (a) | | | 294,248 | | | 285,122 |
MidOcean Credit CLO XII Ltd., Series 2023-12A, Class CR, 3 mo. USD Term SOFR + 2.450%
| | | | | | |
7.729% FRN 4/18/36 (a) | | | 250,000 | | | 250,788 |
MidOcean Credit CLO XIV Ltd., Series 2024-14A, Class A1, 3 mo. USD Term SOFR + 1.580%
| | | | | | |
6.881% FRN 4/15/37 (a) | | | 500,000 | | | 502,760 |
Mosaic Solar Loans LLC, Series 2017-1A, Class A
| | | | | | |
4.450% 6/20/42 (a) | | | 18,228 | | | 17,844 |
| | | | | | | |
| | | | | |
| | | The accompanying notes are an integral part of the financial statements.
| |
36
| | | | |
| | | | | |
TABLE OF CONTENTS
| | MassMutual Diversified Bond Fund — Portfolio of Investments (Continued) | |
| | | | | | | |
Neuberger Berman CLO XX Ltd.,
3 mo. USD Term SOFR + 1.912%
| | | | | | |
7.213% FRN 7/15/34 (a) | | | $500,000 | | | $500,829 |
Parallel Ltd.,
Series 2021-2A, Class A2, 3 mo. USD Term SOFR + 2.112%
| | | | | | |
7.394% FRN 10/20/34 (a) | | | 250,000 | | | 250,377 |
Pioneer Aircraft Finance Ltd., Series 2019-1, Class B
| | | | | | |
4.948% 6/15/44 (a) | | | 341,661 | | | 261,353 |
Rad CLO 12 Ltd., 3 mo. USD Term SOFR + 1.432%
| | | | | | |
6.687% FRN 10/30/34 (a) | | | 500,000 | | | 501,159 |
Rad CLO 4 Ltd.,
Series 2019-4A, Class B1R, 3 mo. USD Term SOFR + 1.750%
| | | | | | |
7.035% FRN 4/25/32 (a) | | | 250,000 | | | 250,310 |
Renew Financial,
Series 2021-1, Class M
| | | | | | |
3.210% 11/20/56 (a) | | | 146,905 | | | 120,134 |
Rockford Tower CLO Ltd., 3 mo. USD Term SOFR + 1.982%
| | | | | | |
7.110% FRN 5/20/31 (a) | | | 250,000 | | | 250,843 |
RRX 6 Ltd.,
Series 2021-6A, Class A2, 3 mo. USD Term SOFR + 2.012%
| | | | | | |
7.313% FRN 1/15/37 (a) | | | 250,000 | | | 250,290 |
Sierra Timeshare Receivables Funding LLC,
Series 2020-2A, Class C
| | | | | | |
3.510% 7/20/37 (a) | | | 20,757 | | | 20,439 |
Slam Ltd.,
Series 2021-1A, Class B
| | | | | | |
3.422% 6/15/46 (a) | | | 233,492 | | | 211,167 |
Store Master Funding I-VII & XIV, Series 2019-1, Class A4
| | | | | | |
4.490% 11/20/49 (a) | | | 751,392 | | | 637,129 |
Sunnova Helios II Issuer LLC, Series 2018-1A, Class A
| | | | | | |
4.870% 7/20/48 (a) | | | 97,556 | | | 88,822 |
Symphony CLO 39 Ltd.,
Series 2023-39A, Class B, 3 mo. USD Term SOFR + 2.300%
| | | | | | |
7.585% FRN 4/25/34 (a) | | | 500,000 | | | 500,859 |
Symphony CLO 42 Ltd.,
Series 2024-42A, Class A1, 3 mo. USD Term SOFR + 1.530%
| | | | | | |
6.837% FRN 4/17/37 (a) | | | 500,000 | | | 502,340 |
| | | | | | | |
| | | | | | | |
Symphony CLO XXII Ltd., Series 2020-22A, Class BR, 3 mo. USD Term SOFR + 1.680%
| | | | | | |
6.531% FRN 4/18/33 (a) | | | $500,000 | | | $500,088 |
THL Credit Wind River CLO Ltd.,
3 mo. USD Term SOFR + 1.962%
| | | | | | |
7.244% FRN 1/20/31 (a) | | | 490,000 | | | 490,454 |
Thrust Engine Leasing DAC
| | | | | | |
Series 2021-1A, Class B,
6.121% 7/15/40 (a) | | | 1,021,479 | | | 949,685 |
Series 2021-1A, Class C,
7.386% 7/15/40 (a) | | | 176,995 | | | 160,725 |
TICP CLO XIV Ltd., 3 mo. USD Term SOFR + 1.912%
| | | | | | |
7.194% FRN 10/20/32 (a) | | | 250,000 | | | 250,202 |
Willis Engine Structured Trust III, Series 2017-A, Class A,
| | | | | | |
4.690% STEP 8/15/42 (a) | | | 252,491 | | | 232,289 |
| | | | | | 16,905,241 |
Student Loans Asset-Backed Securities — 2.5%
|
College Avenue Student Loans LLC
| | | | | | |
Series 2021-A, Class D,
4.120% 7/25/51 (a) | | | 156,055 | | | 145,861 |
Series 2019-A, Class C,
4.460% 12/28/48 (a) | | | 116,971 | | | 111,309 |
Series 2019-A, Class D,
5.500% 12/28/48 (a) | | | 86,136 | | | 79,626 |
Commonbond Student Loan Trust, Series 2017-AGS, Class C
| | | | | | |
5.280% 5/25/41 (a) | | | 33,079 | | | 30,410 |
EDvestinU Private Education Loan Issue No. 3 LLC,
Series 2021-A, Class B
| | | | | | |
3.500% 11/25/50 (a) | | | 600,000 | | | 498,211 |
Goal Capital Funding Trust, 3 mo. USD LIBOR + 0.450%
| | | | | | |
5.783% FRN 8/25/42 | | | 268,910 | | | 243,683 |
Navient Student Loan Trust
| | | | | | |
Series 2018-EA, Class B,
4.440% 12/15/59 (a) | | | 140,000 | | | 137,288 |
Series 2018-1A, Class B, 30 day USD SOFR Average + 1.314% 6.595% FRN 3/25/67 (a) | | | 250,000 | | | 231,602 |
Nelnet Student Loan Trust
| | | | | | |
Series 2005-4, Class A4R2, 1.191% FRN 3/22/32 (g) | | | 70,000 | | | 69,523 |
90 day USD SOFR Average + 0.512% 5.861% FRN 6/25/41 | | | 53,752 | | | 48,054 |
Series 2012-2A, Class B, 30 day USD SOFR Average + 1.114% 6.395% FRN 11/25/36 (a) | | | 200,000 | | | 197,983 |
| | | | | | | |
| | | | | |
The accompanying notes are an integral part of the financial statements. | | | | |
| | | 37
| |
| | | | | |
TABLE OF CONTENTS
| | MassMutual Diversified Bond Fund — Portfolio of Investments (Continued) | |
| | | | | | | |
Series 2012-1A, Class B, 30 day USD SOFR Average + 1.114% 6.395% FRN 6/25/42 (a) | | | $150,000 | | | $147,076 |
Series 2012-4A, Class B, 30 day USD SOFR Average + 1.114% 6.395% FRN 7/26/49 (a) | | | 250,000 | | | 228,712 |
Series 2014-2A, Class B, 30 day USD SOFR Average + 1.614% 6.895% FRN 6/25/41 (a) | | | 100,000 | | | 97,323 |
SLM Student Loan Trust
| | | | | | |
90 day USD SOFR Average + 0.462% 5.821% FRN 1/25/70 | | | 84,167 | | | 78,429 |
90 day USD SOFR Average + 0.472% 5.831% FRN 10/25/40 | | | 105,678 | | | 99,028 |
90 day USD SOFR Average + 0.552% 5.911% FRN 1/25/44 | | | 157,025 | | | 149,570 |
90 day USD SOFR Average + 0.732% 6.091% FRN 10/25/64 | | | 53,814 | | | 50,837 |
SMB Private Education Loan Trust
| | | | | | |
Series 2019-A, Class B,
4.000% 11/17/42 (a) | | | 185,000 | | | 176,039 |
Series 2024-E, Class B,
5.710% 10/16/56 (a) | | | 500,000 | | | 502,186 |
South Carolina Student Loan Corp., Series 2015-A, Class A, 1 mo. USD Term SOFR + 1.614%
| | | | | | |
6.469% FRN 1/25/36 | | | 19,062 | | | 19,042 |
| | | | | | 3,341,792 |
Whole Loan Collateral Collateralized Mortgage
Obligations — 2.3%
|
Angel Oak Mortgage Trust I LLC
| | | | | | |
Series 2019-4, Class M1,
3.459% VRN 7/26/49 (a) (g) | | | 248,366 | | | 244,027 |
Series 2019-2, Class M1,
4.065% VRN 3/25/49 (a) (g) | | | 21,716 | | | 21,640 |
Banc of America Mortgage Trust, Series 2004-G, Class 2A7,
| | | | | | |
6.643% VRN 8/25/34 (g) | | | 2,499 | | | 2,488 |
New Residential Mortgage Loan Trust, Series 2021-NQM3, Class B1,
| | | | | | |
3.398% VRN 11/27/56 (a) (g) | | | 3,600,000 | | | 2,823,192 |
| | | | | | 3,091,347 |
TOTAL NON-U.S. GOVERNMENT AGENCY OBLIGATIONS
(Cost $38,015,421) | | | | | | 33,834,839 |
| | | | | | | |
| | | | | | | |
Sovereign Debt Obligations — 0.1%
|
Mexico Government International Bond
| | | | | | |
4.750% 3/08/44 | | | $174,000 | | | $147,166 |
TOTAL SOVEREIGN DEBT OBLIGATIONS
(Cost $193,750) | | | | | | 147,166 |
U.S. Government Agency Obligations and Instrumentalities (h) — 23.4%
|
Collateralized Mortgage Obligations — 0.0%
|
Federal Home Loan Mortgage Corp. REMICS Series 2178, Class PB 7.000% 8/15/29 | | | 1,944 | | | 2,016 |
Pass-Through Securities — 23.4%
| | | | | | |
Federal Home Loan Mortgage Corp.
| | | | | | |
Pool #RA4245 2.000% 12/01/50 | | | 429,127 | | | 359,552 |
Pool #RA4255 2.000% 1/01/51 | | | 864,638 | | | 725,534 |
Pool #SD0905 3.000% 3/01/52 | | | 648,642 | | | 585,698 |
Pool #SD1523 4.000% 8/01/52 | | | 974,056 | | | 943,619 |
Pool #SD1603 4.000% 9/01/52 | | | 641,472 | | | 618,621 |
Pool #SD8266 4.500% 11/01/52 | | | 1,344,927 | | | 1,322,533 |
Federal National Mortgage Association
| | | | | | |
Pool #FM8596 2.500% 9/01/51 | | | 419,017 | | | 365,941 |
Pool #FS3035 2.500% 4/01/52 | | | 1,382,599 | | | 1,209,628 |
Pool #MA3029 3.000% 6/01/32 | | | 177,213 | | | 172,667 |
Pool #MA3090 3.000% 8/01/32 | | | 72,765 | | | 70,858 |
Pool #AR3007 3.000% 2/01/43 | | | 76,886 | | | 71,344 |
Pool #FS1075 3.000% 3/01/52 | | | 663,524 | | | 602,882 |
Pool #CB3304 3.000% 4/01/52 | | | 1,019,406 | | | 926,238 |
Pool #CB3305 3.000% 4/01/52 | | | 1,251,334 | | | 1,135,405 |
Pool #AS1304 3.500% 12/01/28 | | | 38,718 | | | 38,255 |
Pool #MA1356 3.500% 2/01/43 | | | 393,518 | | | 374,589 |
Pool #CA6096 3.500% 6/01/50 | | | 863,466 | | | 805,132 |
Pool #FM4017 3.500% 8/01/50 | | | 53,934 | | | 50,644 |
Pool #CB3842 3.500% 6/01/52 | | | 2,033,932 | | | 1,908,761 |
Pool #CA1909 4.500% 6/01/48 | | | 311,265 | | | 310,557 |
Pool #CB3866 4.500% 6/01/52 | | | 752,668 | | | 744,840 |
Pool #CB4129 4.500% 7/01/52 | | | 981,691 | | | 967,493 |
Pool #AD6437 5.000% 6/01/40 | | | 21,389 | | | 21,957 |
Pool #AD6996 5.000% 7/01/40 | | | 134,825 | | | 138,455 |
Pool #AL8173 5.000% 2/01/44 | | | 52,967 | | | 54,442 |
Government National Mortgage Association
| | | | | | |
Pool #579140 6.500% 1/15/32 | | | 273 | | | 282 |
Pool #587280 6.500% 9/15/32 | | | 392 | | | 401 |
Pool #550659 6.500% 9/15/35 | | | 41,459 | | | 43,306 |
Pool #538689 6.500% 12/15/35 | | | 4,485 | | | 4,686 |
| | | | | | | |
| | | | | |
| | | The accompanying notes are an integral part of the financial statements.
| |
38
| | | | |
| | | | | |
TABLE OF CONTENTS
| | MassMutual Diversified Bond Fund — Portfolio of Investments (Continued) | |
| | | | | | | |
Pool #780651 7.000% 10/15/27 | | | $143 | | | $145 |
Pool #462384 7.000% 11/15/27 | | | 104 | | | 106 |
Pool #482668 7.000% 8/15/28 | | | 259 | | | 263 |
Pool #581417 7.000% 7/15/32 | | | 366 | | | 373 |
Pool #423836 8.000% 8/15/26 | | | 59 | | | 59 |
Government National Mortgage Association II
| | | | | | |
Pool #MA6038 3.000% 7/20/49 | | | 394,499 | | | 361,424 |
Pool #MA6283 3.000% 11/20/49 | | | 713,660 | | | 653,380 |
Pool #MA6409 3.000% 1/20/50 | | | 745,865 | | | 682,865 |
Pool #MA4321 3.500% 3/20/47 | | | 468,352 | | | 444,535 |
Pool #MA8429 5.500% 11/20/52 | | | 1,709,143 | | | 1,728,134 |
Government National Mortgage Association II, TBA 5.000% 10/20/54 (f) | | | 1,300,000 | | | 1,302,397 |
Uniform Mortgage-Backed Security, TBA
| | | | | | |
2.500% 10/01/54 (f) | | | 1,800,000 | | | 1,553,273 |
4.500% 10/01/54 (f) | | | 2,500,000 | | | 2,457,715 |
5.000% 10/01/54 (f) | | | 3,900,000 | | | 3,896,953 |
5.500% 10/01/54 (f) | | | 2,800,000 | | | 2,832,703 |
6.000% 10/01/54 (f) | | | 1,000,000 | | | 1,021,914 |
| | | | | | 31,510,559 |
TOTAL U.S. GOVERNMENT AGENCY OBLIGATIONS AND INSTRUMENTALITIES
(Cost $32,545,851) | | | | | | 31,512,575 |
U.S. Treasury Obligations — 3.8%
|
U.S. Treasury Bonds & Notes — 3.8%
|
U.S. Treasury Bonds
| | | | | | |
2.250% 8/15/49 (i) | | | 2,140,000 | | | 1,481,985 |
U.S. Treasury Notes
| | | | | | |
4.875% 5/31/26 (b) | | | 3,500,000 | | | 3,564,749 |
| | | | | | 5,046,734 |
TOTAL U.S. TREASURY OBLIGATIONS
(Cost $4,985,927) | | | | | | 5,046,734 |
TOTAL BONDS & NOTES
(Cost $134,699,668) | | | | | | 127,383,761 |
TOTAL PURCHASED
OPTIONS (#) — 0.0%
(Cost $17,008) | | | | | | 15,700 |
| | | | | | | |
| | | | | | | |
Warrants — 0.0%
| | | | | | |
Materials — 0.0%
| | | | | | |
Hercules LLC, Expires 3/31/29, Strike 0.09 (j) (k) (l) | | | 150 | | | $4,003 |
TOTAL WARRANTS
(Cost $0) | | | | | | 4,003 |
TOTAL LONG-TERM INVESTMENTS
(Cost $134,716,676) | | | | | | 127,403,464 |
| | | Principal Amount | | | |
Short-Term Investments — 17.2%
|
Commercial Paper — 12.6%
| | | | | | |
Alimentation Couche-Tard, Inc.
| | | | | | |
5.003% 10/03/24 (a) | | | $5,000,000 | | | 4,997,922 |
Avangrid, Inc.
| | | | | | |
5.037% 10/15/24 (a) | | | 4,000,000 | | | 3,991,592 |
Microchip Technology, Inc.
| | | | | | |
5.460% 10/18/24 (a) | | | 2,000,000 | | | 1,994,906 |
NextEra Energy Capital Holdings, Inc.
| | | | | | |
5.631% 10/04/24 (a) | | | 4,000,000 | | | 3,997,808 |
WRKCo, Inc.
| | | | | | |
5.402% 10/03/24 (a) | | | 2,000,000 | | | 1,999,180 |
| | | | | | 16,981,408 |
| | | Number of
Shares | | | |
Investment of Cash Collateral from
Securities Loaned — 3.1%
|
State Street Navigator Securities Lending Government Money Market Portfolio (m) | | | 4,223,208 | | | 4,223,208 |
| | | Principal
Amount | | | |
Repurchase Agreement — 1.5%
| | | | | | |
Fixed Income Clearing Corp., Repurchase Agreement, dated
9/30/24, 1.520%, due 10/01/24 (n) | | | $1,998,387 | | | 1,998,387 |
TOTAL SHORT-TERM INVESTMENTS
(Cost $23,205,050) | | | | | | 23,203,003 |
TOTAL INVESTMENTS — 111.8%
(Cost $157,921,726) (o) | | | | | | 150,606,467 |
Other Assets/
(Liabilities) — (11.8)% | | | | | | (15,900,255) |
NET ASSETS — 100.0% | | | | | | $134,706,212 |
| | | | | | | |
| | | | | |
The accompanying notes are an integral part of the financial statements. | | | | |
| | | 39
| |
| | | | | |
TABLE OF CONTENTS
| | MassMutual Diversified Bond Fund — Portfolio of Investments (Continued) | |
Abbreviation Legend
| | | | | |
CLO | | | Collateralized Loan Obligation | |
CMT | | | Constant Maturity Treasury Index | |
FRN | | | Floating Rate Note | |
ICE | | | Inter-Continental Exchange | |
LIBOR | | | London InterBank Offered Rate | |
REMICS | | | Real Estate Mortgage Investment Conduits | |
SOFR | | | Secured Overnight Financing Rate
| |
STEP | | | Step Coupon Bond | |
TBA | | | To Be Announced | |
VRN | | | Variable Rate Note | |
| | | | | |
Notes to Portfolio of Investments
Percentages are stated as a percent of net assets.
(a)
| Security is exempt from registration under Regulation S or Rule 144A of the Securities Act of 1933. These securities are considered restricted and may be resold in transactions exempt from registration. At September 30, 2024, the aggregate market value of these securities amounted to $70,417,615 or 52.27% of net assets.
|
(b)
| Denotes all or a portion of security on loan. The total value of securities on loan as of September 30, 2024, was $8,791,302 or 6.53% of net assets. The Fund received $4,757,716 of non-cash collateral (U.S. Treasury and/or Agency obligations) related to securities lending activity. This amount is not reflected on either the Portfolio of Investments or the Statement of Assets and Liabilities. (Note 2).
|
(c)
| Security is perpetual and has no stated maturity date.
|
(d)
| Restricted security. Certain securities are restricted to resale. At September 30, 2024, these securities amounted to a value of $1,216,803 or 0.90% of net assets. The Fund generally bears the costs, if any, associated with the disposition of restricted securities.
|
(e)
| Security is currently in default due to bankruptcy or failure to make payment of principal or interest of the issuer. Income is not being accrued. At September 30, 2024, these securities amounted to a value of $1,001 or 0.00% of net assets.
|
(f)
| A portion of this security is purchased on a when-issued, delayed-delivery or forward commitment basis. (Note 2).
|
(g)
| Certain variable rate securities are not based on a published reference rate and spread but are determined by the issuer or agent and are based on current market conditions. These securities do not indicate a reference rate and spread in their description above. The rates shown are the current interest rates at September 30, 2024.
|
(h)
| May contain securities that are issued by a U.S. Government Agency, but are unsecured and are not guaranteed by a U.S. Government Agency.
|
(i)
| All or a portion of this security is pledged/held as collateral for open derivatives. (Note 2).
|
(j)
| Investment is valued using significant unobservable inputs.
|
(k)
| This security is fair valued in good faith in accordance with procedures approved by the Board of Trustees. At September 30, 2024, these securities amounted to a value of $4,003 or 0.00% of net assets.
|
(l)
| Non-income producing security.
|
(m)
| Represents investment of security lending cash collateral. (Note 2).
|
(n)
| Maturity value of $1,998,472. Collateralized by U.S. Government Agency obligations with a rate of 3.625%, maturity date of 2/15/53, and an aggregate market value, including accrued interest, of $2,038,364.
|
(o)
| See Note 6 for aggregate cost for federal tax purposes. |
Country weightings, as a percentage of net assets, is as follows:
| | | | |
United States | | | 76.1% |
Cayman Islands | | | 7.5% |
United Kingdom | | | 2.8% |
Canada | | | 2.0% |
France | | | 1.7% |
Bermuda | | | 1.2% |
Germany | | | 0.8% |
Australia | | | 0.5% |
Netherlands | | | 0.5% |
Ireland | | | 0.5% |
Mexico | | | 0.3% |
South Africa | | | 0.3% |
Brazil | | | 0.2% |
Finland | | | 0.2% |
Israel | | | 0.0% |
Total Long-Term Investments | | | 94.6% |
Short-Term Investments and Other Assets and
Liabilities | | | 5.4% |
Net Assets | | | 100.0% |
| | | | |
| | | | | |
| | | The accompanying notes are an integral part of the financial statements.
| |
40
| | | | |
| | | | | |
TABLE OF CONTENTS
| | MassMutual Diversified Bond Fund — Portfolio of Investments (Continued) | |
(#) OTC Options Purchased
| | | | | | | | | | | | | | | | | | | | | | | | | |
Call
| | | | | | | | | | | | | | | | | | | | | | | | | | | |
USD Call CHF Put | | | Goldman Sachs International* | | | 11/22/24 | | | 0.89 | | | 149,000 | | | USD | | | 149,000 | | | $81 | | | $304 | | | $(223) |
USD Call ZAR Put | | | Morgan Stanley & Co. LLC* | | | 11/27/24 | | | 18.21 | | | 25,000 | | | USD | | | 25,000 | | | 167 | | | 522 | | | (355) |
USD Call ZAR Put | | | Morgan Stanley & Co. LLC* | | | 11/27/24 | | | 18.59 | | | 25,000 | | | USD | | | 25,000 | | | 98 | | | 349 | | | (251) |
| | | | | | | | | | | | | | | | | | | | | $346 | | | $1,175 | | | $(829) |
Put
| | | | | | | | | | | | | | | | | | | | | | | | | |
USD Put BRL Call | | | Bank of America N.A.* | | | 10/04/24 | | | 5.37 | | | 50,000 | | | USD | | | 50,000 | | | $74 | | | $392 | | | $(318) |
USD Put BRL Call | | | Bank of America N.A.* | | | 10/04/24 | | | 5.59 | | | 37,500 | | | USD | | | 37,500 | | | 953 | | | 775 | | | 178 |
USD Put BRL Call | | | Bank of America N.A.* | | | 11/04/24 | | | 5.46 | | | 118,000 | | | USD | | | 118,000 | | | 1,887 | | | 870 | | | 1,017 |
USD Put BRL Call | | | Bank of America N.A.* | | | 11/04/24 | | | 5.67 | | | 71,000 | | | USD | | | 71,000 | | | 3,027 | | | 1,375 | | | 1,652 |
USD Put MXN Call | | | Goldman Sachs International* | | | 10/31/24 | | | 17.92 | | | 99,000 | | | USD | | | 99,000 | | | 14 | | | 684 | | | (670) |
USD Put MXN Call | | | Goldman Sachs International* | | | 10/31/24 | | | 18.56 | | | 99,000 | | | USD | | | 99,000 | | | 100 | | | 1,851 | | | (1,751) |
USD Put KRW Call | | | Goldman Sachs International* | | | 11/11/24 | | | 1,307.00 | | | 99,000 | | | USD | | | 99,000 | | | 1,050 | | | 493 | | | 557 |
USD Put KRW Call | | | Goldman Sachs International* | | | 11/11/24 | | | 1,333.00 | | | 66,000 | | | USD | | | 66,000 | | | 1,411 | | | 676 | | | 735 |
USD Put ZAR Call | | | Morgan Stanley & Co. LLC* | | | 10/03/24 | | | 17.69 | | | 50,000 | | | USD | | | 50,000 | | | 1,195 | | | 373 | | | 822 |
USD Put BRL Call | | | Morgan Stanley & Co. LLC* | | | 10/23/24 | | | 5.36 | | | 50,000 | | | USD | | | 50,000 | | | 285 | | | 341 | | | (56) |
USD Put BRL Call | | | Morgan Stanley & Co. LLC* | | | 10/23/24 | | | 5.55 | | | 50,000 | | | USD | | | 50,000 | | | 1,206 | | | 899 | | | 307 |
USD Put MXN Call | | | Morgan Stanley & Co. LLC* | | | 2/06/25 | | | 18.06 | | | 240,000 | | | USD | | | 240,000 | | | 778 | | | 1,709 | | | (931) |
USD Put MXN Call | | | Morgan Stanley & Co. LLC* | | | 2/06/25 | | | 19.13 | | | 240,000 | | | USD | | | 240,000 | | | 3,374 | | | 5,395 | | | (2,021) |
| | | | | | | | | | | | | | | | | | | | | $15,354 | | | $15,833 | | | $(479) |
| | | | | | | | | | | | | | | | | | | | | $15,700 | | | $17,008 | | | $ (1,308) |
| | | | | | | | | | | | | | | | | | | | | | | | | | | | |
OTC Options Written
| | | | | | | | | | | | | | | | | | | | | | | | | |
Call
| | | | | | | | | | | | | | | | | | | | | | | | | | | |
USD Call MXN Put | | | Goldman Sachs International* | | | 10/31/24 | | | 18.90 | | | 99,000 | | | USD | | | 99,000 | | | $(4,661) | | | $(2,787) | | | $ (1,874) |
USD Call MXN Put | | | Morgan Stanley & Co. LLC* | | | 11/06/24 | | | 19.63 | | | 240,000 | | | USD | | | 240,000 | | | (6,136) | | | (7,824) | | | 1,688 |
| | | | | | | | | | | | | | | | | | | | | $(10,797) | | | $(10,611) | | | $(186) |
Put
| | | | | | | | | | | | | | | | | | | | | | | | | | | |
USD Put BRL Call | | | Morgan Stanley & Co. LLC* | | | 11/04/24 | | | 5.67 | | | 42,000 | | | USD | | | 42,000 | | | $(1,791) | | | $(1,731) | | | $(60) |
| | | | | | | | | | | | | | | | | | | | | $(12,588) | | | $(12,342) | | | $(246) |
| | | | | | | | | | | | | | | | | | | | | | | | | | | | |
| | | | | |
The accompanying notes are an integral part of the financial statements. | | | | |
| | | 41
| |
| | | | | |
TABLE OF CONTENTS
| | MassMutual Diversified Bond Fund — Portfolio of Investments (Continued) | |
Forward contracts
| | | | | | | | | | | | | |
Bank of America N.A.* | | | 11/05/24 | | | MXN | | | 6,452,068 | | | USD | | | 338,011 | | | $ (11,992) |
Bank of America N.A.* | | | 11/12/24 | | | ZAR | | | 447,084 | | | USD | | | 25,000 | | | 790 |
Bank of America N.A.* | | | 11/19/24 | | | USD | | | 103,548 | | | CNH | | | 734,672 | | | (1,650) |
Citibank N.A.* | | | 11/19/24 | | | USD | | | 101,254 | | | PHP | | | 5,779,592 | | | (1,864) |
Goldman Sachs International* | | | 11/05/24 | | | USD | | | 332,475 | | | MXN | | | 6,452,068 | | | 6,456 |
Goldman Sachs International* | | | 11/12/24 | | | PLN | | | 1,413,163 | | | USD | | | 356,950 | | | 9,858 |
Goldman Sachs International* | | | 11/19/24 | | | USD | | | 109,502 | | | MYR | | | 482,629 | | | (7,831) |
Goldman Sachs International* | | | 4/23/25 | | | BRL | | | 974,700 | | | USD | | | 180,000 | | | (6,324) |
Goldman Sachs International* | | | 4/28/25 | | | TRY | | | 2,351,750 | | | USD | | | 50,000 | | | 5,866 |
Goldman Sachs International* | | | 5/09/25 | | | TRY | | | 4,768,300 | | | USD | | | 104,000 | | | 8,136 |
HSBC Bank PLC* | | | 10/15/24 | | | USD | | | 150,098 | | | CHF | | | 132,730 | | | (6,962) |
HSBC Bank PLC* | | | 10/22/24 | | | USD | | | 155,046 | | | TWD | | | 5,035,053 | | | (4,315) |
HSBC Bank PLC* | | | 11/12/24 | | | TRY | | | 3,582,733 | | | USD | | | 95,503 | | | 4,847 |
HSBC Bank PLC* | | | 11/12/24 | | | HUF | | | 125,551,017 | | | USD | | | 343,161 | | | 8,068 |
HSBC Bank PLC* | | | 11/12/24 | | | USD | | | 213,065 | | | CHF | | | 179,543 | | | (53) |
HSBC Bank PLC* | | | 11/19/24 | | | THB | | | 8,957,520 | | | USD | | | 257,956 | | | 21,303 |
JP Morgan Chase Bank N.A.* | | | 10/08/24 | | | BRL | | | 653,149 | | | USD | | | 118,890 | | | 912 |
Morgan Stanley & Co. LLC* | | | 10/09/24 | | | PEN | | | 559,089 | | | USD | | | 147,677 | | | 3,129 |
Morgan Stanley & Co. LLC* | | | 10/15/24 | | | CHF | | | 132,730 | | | USD | | | 157,286 | | | (226) |
Morgan Stanley & Co. LLC* | | | 11/05/24 | | | BRL | | | 1,273,701 | | | USD | | | 223,374 | | | 9,544 |
Morgan Stanley & Co. LLC* | | | 11/12/24 | | | USD | | | 152,821 | | | ZAR | | | 2,821,353 | | | (9,920) |
Morgan Stanley & Co. LLC* | | | 11/19/24 | | | USD | | | 261,802 | | | SGD | | | 345,024 | | | (7,294) |
| | | | | | | | | | | | | | | | | | $20,478 |
| | | | | | | | | | | | | | | | | | | |
Futures contracts
| | | | | | | | | | | | | |
Long
| | | | | | | | | | | | |
U.S. Treasury Long Bond | | | 12/19/24 | | | 68 | | | $8,491,587 | | | $ (46,837) |
U.S. Treasury Ultra 10 Year | | | 12/19/24 | | | 10 | | | 1,180,806 | | | 2,163 |
U.S. Treasury Ultra Bond | | | 12/19/24 | | | 30 | | | 4,027,853 | | | (35,040) |
U.S. Treasury Note 2 Year | | | 12/31/24 | | | 40 | | | 8,321,140 | | | 8,548 |
U.S. Treasury Note 5 Year | | | 12/31/24 | | | 53 | | | 5,820,312 | | | 3,477 |
| | | | | | | | | | | | $(67,689) |
| | | | | | | | | | | | | |
*
| Contracts are subject to a master netting agreement or similar agreement. |
| | | | | |
| | | The accompanying notes are an integral part of the financial statements.
| |
42
| | | | |
| | | | | |
TABLE OF CONTENTS
| | MassMutual Diversified Bond Fund — Portfolio of Investments (Continued) | |
Currency Legend
| | | | | |
BRL | | | Brazilian Real | |
CHF | | | Swiss Franc | |
CNH | | | Offshore Chinese Yuan | |
HUF | | | Hungarian Forint | |
KRW | | | South Korean Won | |
MXN | | | Mexican Peso | |
MYR | | | Malaysian Ringgit | |
PEN | | | Peruvian New Sol | |
PHP | | | Philippine Peso | |
PLN | | | Polish Zloty | |
SGD | | | Singapore Dollar | |
THB | | | Thai Baht | |
TRY | | | New Turkish Lira | |
TWD | | | Taiwan Dollar | |
USD | | | U.S. Dollar | |
ZAR | | | South African Rand | |
| | | | | |
| | | | | |
The accompanying notes are an integral part of the financial statements. | | | | |
| | | 43
| |
| | | | | |
TABLE OF CONTENTS
| | | |
| | MassMutual High Yield Fund — Portfolio of Investments | |
| | | |
| | | | | | | |
Bonds & Notes — 92.7%
| | | | | | |
Bank Loans — 10.1%
| | | | | | |
Advertising — 0.3%
| | | | | | |
Neptune Bidco US, Inc., 2022 USD Term Loan B, 3 mo. USD Term SOFR + 5.000%
10.404% VRN 4/11/29 | | | $1,469,481 | | | $1,376,595 |
Chemicals — 2.8%
| | | | | | |
CPC Acquisition Corp., Term Loan, 3 mo. USD Term SOFR + 3.750%
8.615% VRN 12/29/27 | | | 4,141,797 | | | 3,595,619 |
LSF11 A5 Holdco LLC, 2024 Term Loan B, 1 mo. USD Term SOFR + 3.500%
8.460% VRN 10/15/28 | | | 3,014,337 | | | 3,006,258 |
PMHC II, Inc., 2022 Term Loan B, 3 mo. USD Term SOFR + 4.250%
9.704% VRN 4/23/29 (a) | | | 2,996,718 | | | 2,921,500 |
Polar US Borrower LLC, 2024 Term Loan B1B, 3 mo. U.S. (Fed) Prime Rate + 4.500%
13.000% VRN 10/16/28 (a) | | | 1,994,315 | | | 1,455,850 |
| | | | | | 10,979,227 |
Computers — 0.7%
| | | | | | |
McAfee LLC, 2024 USD Term Loan B, 1 mo. USD Term SOFR + 3.250%
8.451% VRN 3/01/29 | | | 985,722 | | | 981,099 |
SonicWall US Holdings, Inc., 2nd Lien Term Loan, 3 mo. USD Term SOFR + 7.500%
12.254% VRN 5/18/26 | | | 38,923 | | | 35,857 |
Vision Solutions, Inc., 2021 Incremental Term Loan, 3 mo. USD Term SOFR + 4.000%
9.514% VRN 4/24/28 | | | 1,978,369 | | | 1,922,738 |
| | | | | | 2,939,694 |
Diversified Financial Services — 0.2%
| | | |
Aretec Group, Inc., 2024 Term Loan B,
0.000% 8/09/30 (a) | | | 994,999 | | | 973,577 |
Health Care - Services — 0.7%
| | | | | | |
LifePoint Health, Inc., 2024 Term Loan B, 3 mo. USD Term SOFR + 4.750%
10.054% VRN 11/16/28 | | | 865,634 | | | 863,902 |
Radiology Partners, Inc., 2024 Extended Term Loan B, 3 mo. USD Term SOFR + 3.500%
8.883% - 8.883% VRN 1/31/29 (a) | | | 2,091,443 | | | 2,043,089 |
| | | | | | 2,906,991 |
| | | | | | | |
| | | | | | | |
Media — 0.7%
| | | | | | |
A-L Parent LLC, 2023 Take Back Term Loan, 1 mo. USD Term SOFR + 5.500%
10.345% VRN 6/30/28 | | | $2,068,361 | | | $2,060,605 |
Sinclair Television Group, Inc., Term Loan B2B, 3 mo. USD Term
SOFR + 2.500%
8.014% VRN 9/30/26 | | | 658,025 | | | 634,994 |
| | | | | | 2,695,599 |
Packaging & Containers — 0.3%
| | | | | | |
Five Star Intermediate Holding LLC, Term Loan, 3 mo. USD Term
SOFR + 4.250%
9.189% VRN 5/05/29 (a) | | | 1,054,184 | | | 1,026,248 |
Pharmaceuticals — 0.2%
| | | | | | |
Grifols Worldwide Operations USA, Inc., 2019 USD Term Loan B, 3 mo. USD Term SOFR + 2.000%
7.402% VRN 11/15/27 | | | 634,843 | | | 616,096 |
Pipelines — 0.7%
| | | | | | |
ITT Holdings LLC, 2024 Term Loan B, 1 mo. USD Term SOFR + 3.000%
7.945% VRN 10/11/30 (a) | | | 2,909,615 | | | 2,912,030 |
Software — 3.2%
| | | | | | |
Banff Merger Sub, Inc.
| | | | | | |
2024 Term Loan B, 3 mo. USD Term SOFR + 3.750%
9.005% VRN 7/30/31 (a) | | | 7,065,615 | | | 7,046,750 |
2024 2nd Lien Term Loan, 3 mo. USD Term SOFR + 5.750%
11.005% VRN 7/30/32 (a) | | | 1,590,349 | | | 1,564,506 |
Cloud Software Group, Inc., 2024 USD Term Loan B, 3 mo. USD Term SOFR + 4.000%
8.604% VRN 3/30/29 | | | 1,960,088 | | | 1,950,483 |
Renaissance Holding Corp., 2024 Term Loan, 1 mo. USD Term SOFR + 4.250%
9.095% VRN 4/05/30 | | | 1,865,113 | | | 1,863,211 |
Veritas US, Inc., 2021 USD Term Loan B, (Acquired 1/04/24, Cost $509,949), 1 mo. USD Term
SOFR + 5.000%
9.960% VRN 9/01/25 (b) | | | 566,382 | | | 529,374 |
| | | | | | 12,954,324 |
| | | | | | | |
| | | | | |
| | | The accompanying notes are an integral part of the financial statements.
| |
44
| | | | |
| | | | | |
TABLE OF CONTENTS
| | MassMutual High Yield Fund — Portfolio of Investments (Continued) | |
| | | | | | | |
Telecommunications — 0.3%
| | | | | | |
Coral-US Co-Borrower, LLC, 2020 Term Loan B2,
0.000% 1/31/28 (a) | | | $1,000,705 | | | $988,056 |
TOTAL BANK LOANS
(Cost $40,217,839) | | | | | | 40,368,437 |
Corporate Debt — 82.6%
| | | | | | |
Advertising — 0.7%
| | | | | | |
Clear Channel Outdoor Holdings, Inc.
| | | | | | |
9.000% 9/15/28 (c) | | | 710,000 | | | 754,814 |
7.500% 6/01/29 (c) (d) | | | 500,000 | | | 430,629 |
7.875% 4/01/30 (c) | | | 750,000 | | | 784,272 |
Stagwell Global LLC
5.625% 8/15/29 (c) | | | 1,019,000 | | | 985,188 |
| | | | | | 2,954,903 |
Aerospace & Defense — 1.3%
| | | | | | |
Boeing Co.
| | | | | | |
6.388% 5/01/31 (c) | | | 359,000 | | | 381,738 |
6.528% 5/01/34 (c) | | | 938,000 | | | 1,006,723 |
Spirit AeroSystems, Inc.
9.750% 11/15/30 (c) | | | 2,233,000 | | | 2,489,795 |
Triumph Group, Inc.
9.000% 3/15/28 (c) | | | 1,076,000 | | | 1,126,373 |
| | | | | | 5,004,629 |
Airlines — 0.9%
| | | | | | |
American Airlines, Inc.
8.500% 5/15/29 (c) | | | 1,488,000 | | | 1,578,789 |
Hawaiian Brand Intellectual Property Ltd./HawaiianMiles Loyalty Ltd.
11.000% 4/15/29 (c) (d) | | | 1,020,234 | | | 1,024,315 |
United Airlines, Inc.
4.375% 4/15/26 (c) | | | 934,000 | | | 919,008 |
| | | | | | 3,522,112 |
Auto Manufacturers — 0.5%
| | | | | | |
JB Poindexter & Co., Inc.
8.750% 12/15/31 (c) | | | 2,011,000 | | | 2,126,158 |
Auto Parts & Equipment — 0.4%
| | | | | | |
Adient Global Holdings Ltd.
4.875% 8/15/26 (c) | | | 1,734,000 | | | 1,717,971 |
Building Materials — 2.3%
| | | | | | |
EMRLD Borrower LP/Emerald
Co-Issuer, Inc.
6.625% 12/15/30 (c) | | | 2,389,000 | | | 2,463,286 |
Knife River Corp.
7.750% 5/01/31 (c) | | | 1,107,000 | | | 1,176,990 |
New Enterprise Stone & Lime Co., Inc.
9.750% 7/15/28 (c) | | | 1,785,000 | | | 1,823,383 |
| | | | | | | |
| | | | | | | |
Smyrna Ready Mix Concrete LLC
| | | | | | |
6.000% 11/01/28 (c) | | | $1,627,000 | | | $1,633,005 |
8.875% 11/15/31 (c) | | | 1,301,000 | | | 1,403,380 |
Wilsonart LLC
11.000% 8/15/32 (c) | | | 846,000 | | | 846,255 |
| | | | | | 9,346,299 |
Chemicals — 4.1%
| | | | | | |
Consolidated Energy Finance SA
5.625% 10/15/28 (c) | | | 4,296,000 | | | 3,631,369 |
LSF11 A5 HoldCo LLC
6.625% 10/15/29 (c) (d) | | | 2,667,000 | | | 2,594,031 |
Methanex Corp.
5.125% 10/15/27 | | | 2,056,000 | | | 2,034,433 |
Olympus Water US Holding Corp.
| | | | | | |
4.250% 10/01/28 (c) (d) | | | 2,503,000 | | | 2,390,093 |
6.250% 10/01/29 (c) (d) | | | 1,772,000 | | | 1,714,613 |
Vibrantz Technologies, Inc.
9.000% 2/15/30 (c) (d) | | | 4,083,000 | | | 3,814,296 |
| | | | | | 16,178,835 |
Coal — 0.5%
| | | | | | |
Coronado Finance Pty. Ltd.
10.750% 5/15/26 (c) | | | 2,077,000 | | | 2,160,647 |
Commercial Services — 1.3%
| | | | | | |
Alta Equipment Group, Inc.
9.000% 6/01/29 (c) | | | 938,000 | | | 839,949 |
Prime Security Services Borrower LLC/Prime Finance, Inc.
6.250% 1/15/28 (c) | | | 990,000 | | | 990,266 |
PROG Holdings, Inc.
6.000% 11/15/29 (c) | | | 3,185,100 | | | 3,142,097 |
Service Corp. International
4.000% 5/15/31 | | | 342,000 | | | 316,465 |
Vortex Opco LLC
8.000% 4/30/30 (c) | | | 109,751 | | | 43,901 |
| | | | | | 5,332,678 |
Cosmetics & Personal Care — 0.6%
| | | | | | |
Coty, Inc./HFC Prestige Products, Inc./HFC Prestige International US LLC
6.625% 7/15/30 (c) (d) | | | 410,000 | | | 426,005 |
Perrigo Finance Unlimited Co.
4.900% STEP 6/15/30 | | | 2,089,000 | | | 2,034,548 |
| | | | | | 2,460,553 |
Distribution & Wholesale — 1.0%
| | | | | | |
Resideo Funding, Inc.
| | | | | | |
4.000% 9/01/29 (c) (d) | | | 1,882,000 | | | 1,772,750 |
6.500% 7/15/32 (c) | | | 2,129,000 | | | 2,185,444 |
| | | | | | 3,958,194 |
| | | | | | | |
| | | | | |
The accompanying notes are an integral part of the financial statements. | | | | |
| | | 45
| |
| | | | | |
TABLE OF CONTENTS
| | MassMutual High Yield Fund — Portfolio of Investments (Continued) | |
| | | | | | | |
Diversified Financial Services — 5.4%
| | | |
Aretec Group, Inc.
10.000% 8/15/30 (c) (d) | | | $1,099,000 | | | $1,169,573 |
Coinbase Global, Inc.
| | | | | | |
3.375% 10/01/28 (c) | | | 305,000 | | | 274,034 |
3.625% 10/01/31 (c) | | | 373,000 | | | 316,044 |
GGAM Finance Ltd.
| | | | | | |
6.875% 4/15/29 (c) | | | 557,000 | | | 579,437 |
8.000% 2/15/27 (c) | | | 2,005,000 | | | 2,095,249 |
Jefferson Capital Holdings LLC
| | | | | | |
6.000% 8/15/26 (c) | | | 2,664,000 | | | 2,664,291 |
9.500% 2/15/29 (c) | | | 2,630,000 | | | 2,808,027 |
Macquarie Airfinance Holdings Ltd.
| | | | | | |
8.125% 3/30/29 (c) | | | 1,757,000 | | | 1,860,842 |
8.375% 5/01/28 (c) | | | 1,977,000 | | | 2,078,429 |
Midcap Financial Issuer Trust
| | | | | | |
5.625% 1/15/30 (c) | | | 857,000 | | | 789,544 |
6.500% 5/01/28 (c) | | | 1,492,000 | | | 1,445,516 |
PRA Group, Inc.
| | | | | | |
5.000% 10/01/29 (c) | | | 4,020,000 | | | 3,698,234 |
8.375% 2/01/28 (c) | | | 445,000 | | | 460,713 |
8.875% 1/31/30 (c) (d) | | | 1,053,000 | | | 1,096,768 |
| | | | | | 21,336,701 |
Electric — 2.4%
| | | | | | |
Lightning Power LLC
7.250% 8/15/32 (c) | | | 1,204,000 | | | 1,266,050 |
Pike Corp.
| | | | | | |
5.500% 9/01/28 (c) | | | 2,213,000 | | | 2,167,386 |
8.625% 1/31/31 (c) | | | 1,071,000 | | | 1,145,131 |
Talen Energy Supply LLC
8.625% 6/01/30 (c) | | | 4,435,000 | | | 4,833,361 |
| | | | | | 9,411,928 |
Electrical Components & Equipment — 0.3%
| | | |
Energizer Holdings, Inc.
4.375% 3/31/29 (c) | | | 1,145,000 | | | 1,084,315 |
Electronics — 0.6%
| | | | | | |
Atkore, Inc.
4.250% 6/01/31 (c) | | | 2,549,000 | | | 2,330,234 |
Engineering & Construction — 1.6%
| | | | | | |
Arcosa, Inc.
| | | | | | |
4.375% 4/15/29 (c) | | | 2,166,000 | | | 2,076,216 |
6.875% 8/15/32 (c) | | | 728,000 | | | 761,880 |
Global Infrastructure Solutions, Inc.
| | | | | | |
5.625% 6/01/29 (c) | | | 1,332,000 | | | 1,306,941 |
7.500% 4/15/32 (c) | | | 1,457,000 | | | 1,499,260 |
Railworks Holdings LP/Railworks Rally, Inc.
8.250% 11/15/28 (c) | | | 879,000 | | | 909,216 |
| | | | | | 6,553,51 |
| | | | | | | |
| | | | | | | |
Entertainment — 0.7%
| | | | | | |
Live Nation Entertainment, Inc.
| | | | | | |
3.750% 1/15/28 (c) (d) | | | $19,000 | | | $18,257 |
4.750% 10/15/27 (c) | | | 930,000 | | | 916,850 |
Midwest Gaming Borrower LLC/Midwest Gaming Finance Corp.
4.875% 5/01/29 (c) | | | 987,000 | | | 946,702 |
Ontario Gaming GTA LP/OTG
Co-Issuer, Inc.
8.000% 8/01/30 (c) | | | 684,000 | | | 710,831 |
| | | | | | 2,592,640 |
Environmental Controls — 0.2%
| | | | | | |
Enviri Corp.
| | | | | | |
5.750% 7/31/27 (c) | | | 847,000 | | | 831,379 |
Food — 1.9%
| | | | | | |
Albertsons Cos., Inc./Safeway, Inc./New Albertsons LP/Albertsons LLC
4.875% 2/15/30 (c) | | | 952,500 | | | 937,132 |
JBS USA Holding Lux SARL/JBS USA Food Co./JBS Lux Co. SARL
| | | | | | |
3.625% 1/15/32 | | | 3,863,000 | | | 3,531,746 |
3.750% 12/01/31 | | | 400,000 | | | 367,891 |
Pilgrim’s Pride Corp.
4.250% 4/15/31 (c) | | | 2,285,000 | | | 2,171,432 |
US Foods, Inc.
5.750% 4/15/33 (c) (e) | | | 585,000 | | | 585,628 |
| | | | | | 7,593,829 |
Hand & Machine Tools — 1.5%
| | | | | | |
Regal Rexnord Corp.
6.400% 4/15/33 | | | 5,539,000 | | | 5,924,035 |
Health Care - Products — 0.1%
| | | | | | |
Medline Borrower LP/Medline Co-Issuer, Inc.
6.250% 4/01/29 (c) | | | 320,000 | | | 329,706 |
Health Care - Services — 5.5%
| | | | | | |
Centene Corp.
3.375% 2/15/30 | | | 2,431,000 | | | 2,240,207 |
CHS/Community Health Systems, Inc.
| | | | | | |
4.750% 2/15/31 (c) (d) | | | 1,415,000 | | | 1,243,852 |
5.250% 5/15/30 (c) | | | 50,000 | | | 46,015 |
5.625% 3/15/27 (c) | | | 556,000 | | | 547,142 |
6.000% 1/15/29 (c) | | | 1,141,000 | | | 1,107,671 |
6.875% 4/15/29 (c) | | | 472,000 | | | 427,995 |
10.875% 1/15/32 (c) | | | 444,000 | | | 489,281 |
HCA, Inc.
5.450% 9/15/34 | | | 618,000 | | | 635,885 |
| | | | | | | |
| | | | | |
| | | The accompanying notes are an integral part of the financial statements.
| |
46
| | | | |
| | | | | |
TABLE OF CONTENTS
| | MassMutual High Yield Fund — Portfolio of Investments (Continued) | |
| | | | | | | |
LifePoint Health, Inc.
| | | | | | |
9.875% 8/15/30 (c) | | | $2,140,000 | | | $2,356,149 |
10.000% 6/01/32 (c) | | | 1,287,000 | | | 1,414,885 |
11.000% 10/15/30 (c) | | | 1,964,000 | | | 2,216,150 |
Molina Healthcare, Inc.
4.375% 6/15/28 (c) | | | 1,237,000 | | | 1,202,578 |
Radiology Partners, Inc.
| | | | | | |
7.775% 1/31/29 (c) | | | 1,046,732 | | | 1,038,882 |
9.781% 2/15/30 (c) | | | 3,779,104 | | | 3,571,253 |
Tenet Healthcare Corp.
| | | | | | |
4.375% 1/15/30 | | | 1,178,000 | | | 1,130,211 |
6.125% 6/15/30 | | | 2,081,000 | | | 2,115,008 |
| | | | | | 21,783,164 |
Home Builders — 1.8%
| | | | | | |
Ashton Woods USA LLC/Ashton Woods Finance Co.
4.625% 8/01/29 (c) | | | 1,241,000 | | | 1,191,286 |
Mattamy Group Corp.
| | | | | | |
4.625% 3/01/30 (c) (d) | | | 5,293,000 | | | 5,067,532 |
5.250% 12/15/27 (c) | | | 25,000 | | | 24,853 |
The New Home Co., Inc.
9.250% 10/01/29 (c) | | | 705,000 | | | 742,822 |
| | | | | | 7,026,493 |
Housewares — 0.3%
| | | | | | |
Newell Brands, Inc.
| | | | | | |
5.700% STEP 4/01/26 | | | 419,000 | | | 420,028 |
6.375% 9/15/27 (d) | | | 291,000 | | | 294,319 |
6.875% STEP 4/01/36 | | | 417,000 | | | 397,373 |
| | | | | | 1,111,720 |
Insurance — 0.8%
| | | | | | |
Highlands Holdings Bond Issuer Ltd./Highlands Holdings Bond
Co-Issuer, Inc.
7.625% 10/15/25 (c) | | | 3,333,066 | | | 3,326,719 |
Internet — 0.2%
| | | | | | |
Getty Images, Inc.
9.750% 3/01/27 (c) (d) | | | 484,000 | | | 483,807 |
Wayfair LLC
7.250% 10/31/29 (c) (e) | | | 441,000 | | | 451,787 |
| | | | | | 935,594 |
Investment Companies — 1.8%
| | | | | | |
HA Sustainable Infrastructure Capital, Inc.
6.375% 7/01/34 (c) | | | 1,945,000 | | | 1,990,963 |
Icahn Enterprises LP/Icahn Enterprises Finance Corp.
6.250% 5/15/26 | | | 5,270,000 | | | 5,228,895 |
| | | | | | 7,219,858 |
| | | | | | | |
| | | | | | | |
Leisure Time — 1.8%
| | | | | | |
Life Time, Inc.
8.000% 4/15/26 (c) | | | $398,000 | | | $401,706 |
NCL Corp. Ltd.
| | | | | | |
5.875% 3/15/26 (c) | | | 781,000 | | | 781,048 |
5.875% 2/15/27 (c) | | | 224,000 | | | 224,792 |
8.375% 2/01/28 (c) | | | 668,000 | | | 701,498 |
7.750% 2/15/29 (c) (d) | | | 524,000 | | | 561,520 |
NCL Finance Ltd.
6.125% 3/15/28 (c) | | | 620,000 | | | 632,400 |
Sabre GLBL, Inc.
| | | | | | |
8.625% 6/01/27 (c) (d) | | | 2,924,000 | | | 2,876,117 |
11.250% 12/15/27 (c) (d) | | | 503,000 | | | 521,941 |
Sabre Global, Inc., Convertible,
7.320% 8/01/26 | | | 500,000 | | | 557,750 |
| | | | | | 7,258,772 |
Lodging — 1.0%
| | | | | | |
Hilton Grand Vacations Borrower Escrow LLC/Hilton Grand Vacations Borrower Escrow, Inc.
6.625% 1/15/32 (c) | | | 1,279,000 | | | 1,294,674 |
MGM Resorts International
6.500% 4/15/32 | | | 564,500 | | | 575,245 |
Sugarhouse HSP Gaming Prop Mezz LP/Sugarhouse HSP Gaming Finance Corp.
5.875% 5/15/25 (c) | | | 1,046,000 | | | 1,042,504 |
Wyndham Hotels & Resorts, Inc.
4.375% 8/15/28 (c) | | | 1,071,000 | | | 1,033,105 |
| | | | | | 3,945,528 |
Machinery - Construction & Mining — 0.2%
| | | |
Terex Corp.
6.250% 10/15/32 (c) (e) | | | 855,000 | | | 855,000 |
Media — 5.1%
| | | | | | |
CCO Holdings LLC/CCO Holdings Capital Corp.
| | | | | | |
4.250% 2/01/31 (c) | | | 2,361,000 | | | 2,081,763 |
4.250% 1/15/34 (c) | | | 1,588,000 | | | 1,302,573 |
4.500% 5/01/32 | | | 853,000 | | | 737,549 |
CSC Holdings LLC
| | | | | | |
4.500% 11/15/31 (c) | | | 427,000 | | | 310,852 |
5.750% 1/15/30 (c) | | | 939,000 | | | 486,060 |
7.500% 4/01/28 (c) | | | 800,000 | | | 534,764 |
11.750% 1/31/29 (c) | | | 1,850,000 | | | 1,788,194 |
Cumulus Media New Holdings, Inc.
8.000% 7/01/29 (c) | | | 847,000 | | | 336,943 |
Directv Financing LLC/Directv Financing Co-Obligor, Inc.
5.875% 8/15/27 (c) | | | 3,333,000 | | | 3,272,447 |
| | | | | | | |
| | | | | |
The accompanying notes are an integral part of the financial statements. | | | | |
| | | 47
| |
| | | | | |
TABLE OF CONTENTS
| | MassMutual High Yield Fund — Portfolio of Investments (Continued) | |
| | | | | | | |
DISH DBS Corp.
| | | | | | |
5.125% 6/01/29 | | | $380,000 | | | $254,952 |
7.375% 7/01/28 | | | 1,266,000 | | | 948,793 |
DISH Network Corp.
11.750% 11/15/27 (c) | | | 818,000 | | | 858,516 |
Gray Television, Inc.
| | | | | | |
5.375% 11/15/31 (c) | | | 747,000 | | | 467,190 |
7.000% 5/15/27 (c) (d) | | | 195,000 | | | 191,666 |
LCPR Senior Secured Financing DAC
6.750% 10/15/27 (c) | | | 1,385,000 | | | 1,267,314 |
McGraw-Hill Education, Inc.
| | | | | | |
5.750% 8/01/28 (c) | | | 1,360,000 | | | 1,344,005 |
8.000% 8/01/29 (c) | | | 1,010,000 | | | 1,013,623 |
Time Warner Cable Enterprises LLC
8.375% 7/15/33 | | | 836,000 | | | 962,160 |
Virgin Media Secured Finance PLC
| | | | | | |
4.500% 8/15/30 (c) | | | 236,000 | | | 209,932 |
5.500% 5/15/29 (c) (d) | | | 1,317,000 | | | 1,263,132 |
Virgin Media Vendor Financing Notes IV DAC
5.000% 7/15/28 (c) | | | 588,000 | | | 566,692 |
| | | | | | 20,199,120 |
Mining — 1.4%
| | | | | | |
Constellium SE
| | | | | | |
3.750% 4/15/29 (c) | | | 2,250,000 | | | 2,101,185 |
6.375% 8/15/32 (c) (d) | | | 585,000 | | | 600,399 |
First Quantum Minerals Ltd.
9.375% 3/01/29 (c) | | | 1,397,000 | | | 1,480,741 |
Novelis Corp.
| | | | | | |
3.250% 11/15/26 (c) | | | 304,000 | | | 293,352 |
3.875% 8/15/31 (c) | | | 313,000 | | | 286,133 |
4.750% 1/30/30 (c) | | | 1,000,000 | | | 969,506 |
| | | | | | 5,731,316 |
Miscellaneous - Manufacturing — 0.6%
| | | |
Amsted Industries, Inc.
5.625% 7/01/27 (c) | | | 2,435,000 | | | 2,428,486 |
Oil & Gas — 3.7%
| | | | | | |
Apache Corp.
| | | | | | |
4.750% 4/15/43 (d) | | | 816,000 | | | 673,710 |
5.350% 7/01/49 | | | 910,000 | | | 788,806 |
CVR Energy, Inc.
5.750% 2/15/28 (c) | | | 1,011,000 | | | 949,431 |
Hilcorp Energy I LP/Hilcorp Finance Co.
| | | | | | |
6.000% 4/15/30 (c) | | | 443,000 | | | 431,805 |
6.000% 2/01/31 (c) | | | 1,792,000 | | | 1,739,523 |
6.875% 5/15/34 (c) | | | 1,600,000 | | | 1,594,058 |
Occidental Petroleum Corp.
| | | | | | |
6.200% 3/15/40 | | | 1,570,000 | | | 1,629,891 |
6.600% 3/15/46 (d) | | | 801,000 | | | 861,866 |
| | | | | | | |
| | | | | | | |
Parkland Corp.
| | | | | | |
4.625% 5/01/30 (c) | | | $1,127,000 | | | $1,062,819 |
6.625% 8/15/32 (c) (d) | | | 748,000 | | | 759,355 |
Sunoco LP/Sunoco Finance Corp.
| | | | | | |
4.500% 4/30/30 | | | 2,126,000 | | | 2,037,130 |
5.875% 3/15/28 | | | 245,000 | | | 246,224 |
7.000% 9/15/28 (c) | | | 510,000 | | | 528,550 |
Transocean Poseidon Ltd.
6.875% 2/01/27 (c) | | | 117,600 | | | 117,406 |
Transocean, Inc.
| | | | | | |
8.250% 5/15/29 (c) | | | 978,000 | | | 969,519 |
8.500% 5/15/31 (c) (d) | | | 470,000 | | | 467,015 |
| | | | | | 14,857,108 |
Oil & Gas Services — 0.7%
| | | | | | |
Weatherford International Ltd.
8.625% 4/30/30 (c) | | | 2,835,000 | | | 2,954,131 |
Packaging & Containers — 1.9%
| | | | | | |
Clydesdale Acquisition Holdings, Inc.
8.750% 4/15/30 (c) (d) | | | 2,181,000 | | | 2,214,681 |
Graphic Packaging International LLC
3.750% 2/01/30 (c) | | | 667,000 | | | 624,570 |
Mauser Packaging Solutions Holding Co.
| | | | | | |
7.875% 4/15/27 (c) | | | 2,895,000 | | | 2,991,049 |
9.250% 4/15/27 (c) (d) | | | 1,077,000 | | | 1,104,328 |
Trident TPI Holdings, Inc.
12.750% 12/31/28 (c) | | | 527,000 | | | 585,035 |
| | | | | | 7,519,663 |
Pharmaceuticals — 4.0%
| | | | | | |
1375209 BC Ltd.
9.000% 1/30/28 (c) (d) | | | 4,352,000 | | | 4,313,332 |
AdaptHealth LLC
| | | | | | |
4.625% 8/01/29 (c) | | | 1,000,000 | | | 926,096 |
5.125% 3/01/30 (c) (d) | | | 2,000,000 | | | 1,872,085 |
Bausch Health Cos., Inc.
| | | | | | |
4.875% 6/01/28 (c) | | | 1,347,000 | | | 1,054,027 |
5.250% 1/30/30 (c) | | | 1,102,000 | | | 617,120 |
5.500% 11/01/25 (c) (d) | | | 870,000 | | | 849,910 |
11.000% 9/30/28 (c) | | | 525,000 | | | 489,562 |
Grifols SA
4.750% 10/15/28 (c) (d) | | | 2,379,000 | | | 2,228,337 |
Herbalife Ltd., Convertible,
| | | | | | |
4.250% 6/15/28 | | | 399,000 | | | 291,925 |
Herbalife Nutrition Ltd./HLF Financing, Inc.
7.875% 9/01/25 (c) | | | 1,064,000 | | | 1,060,051 |
HLF Financing SARL LLC/Herbalife International, Inc.
| | | | | | |
4.875% 6/01/29 (c) | | | 194,000 | | | 122,061 |
12.250% 4/15/29 (c) | | | 875,000 | | | 872,167 |
| | | | | | | |
| | | | | |
| | | The accompanying notes are an integral part of the financial statements.
| |
48
| | | | |
| | | | | |
TABLE OF CONTENTS
| | MassMutual High Yield Fund — Portfolio of Investments (Continued) | |
| | | | | | | |
Organon & Co./Organon Foreign Debt Co-Issuer BV
| | | | | | |
6.750% 5/15/34 (c) | | | $680,000 | | | $702,284 |
7.875% 5/15/34 (c) (d) | | | 516,000 | | | 546,676 |
| | | | | | 15,945,633 |
Pipelines — 7.3%
| | | | | | |
CQP Holdco LP/BIP-V Chinook Holdco LLC
5.500% 6/15/31 (c) | | | 6,016,000 | | | 5,900,649 |
Energy Transfer LP
| | | | | | |
5 yr. CMT + 5.694%
6.500% VRN (f) | | | 2,852,000 | | | 2,845,177 |
5 yr. CMT + 5.306%
7.125% VRN (f) | | | 700,000 | | | 715,068 |
EnLink Midstream Partners LP
| | | | | | |
4.150% 6/01/25 | | | 27,000 | | | 26,757 |
5.050% 4/01/45 | | | 160,000 | | | 143,905 |
5.450% 6/01/47 | | | 380,000 | | | 359,352 |
5.600% 4/01/44 | | | 1,488,000 | | | 1,422,141 |
EQM Midstream Partners LP
| | | | | | |
6.500% 7/01/27 (c) | | | 763,000 | | | 785,969 |
7.500% 6/01/27 (c) | | | 832,000 | | | 856,346 |
7.500% 6/01/30 (c) | | | 176,000 | | | 193,289 |
Flex Intermediate Holdco LLC
3.363% 6/30/31 (c) | | | 2,185,000 | | | 1,914,623 |
Global Partners LP/GLP Finance Corp.
| | | | | | |
6.875% 1/15/29 | | | 413,000 | | | 414,273 |
8.250% 1/15/32 (c) | | | 1,880,000 | | | 1,950,103 |
Harvest Midstream I LP
7.500% 9/01/28 (c) | | | 1,911,000 | | | 1,955,574 |
Hess Midstream Operations LP
6.500% 6/01/29 (c) | | | 263,000 | | | 272,217 |
ITT Holdings LLC
6.500% 8/01/29 (c) | | | 4,327,000 | | | 4,099,194 |
NGL Energy Operating LLC/NGL Energy Finance Corp.
| | | | | | |
8.125% 2/15/29 (c) | | | 624,000 | | | 639,817 |
8.375% 2/15/32 (c) | | | 1,102,000 | | | 1,135,672 |
Northriver Midstream Finance LP
| | | | | | |
6.750% 7/15/32 (c) (e) | | | 1,549,000 | | | 1,598,749 |
Venture Global Calcasieu Pass LLC
| | | | | | |
3.875% 8/15/29 (c) | | | 869,000 | | | 821,233 |
4.125% 8/15/31 (c) | | | 994,000 | | | 924,151 |
| | | | | | 28,974,259 |
Private Equity — 1.0%
| | | | | | |
HAT Holdings I LLC/HAT Holdings II LLC
| | | | | | |
3.375% 6/15/26 (c) | | | 1,726,000 | | | 1,671,432 |
8.000% 6/15/27 (c) | | | 2,143,000 | | | 2,270,256 |
| | | | | | 3,941,688 |
| | | | | | | |
| | | | | | | |
Real Estate Investment Trusts (REITS) — 1.4%
| | | |
Global Net Lease, Inc./Global Net Lease Operating Partnership LP
3.750% 12/15/27 (c) | | | $993,000 | | | $925,665 |
Necessity Retail REIT, Inc./American Finance Operating Partner LP
4.500% 9/30/28 (c) | | | 535,000 | | | 502,089 |
RLJ Lodging Trust LP
4.000% 9/15/29 (c) | | | 2,345,000 | | | 2,158,638 |
Service Properties Trust
| | | | | | |
4.950% 2/15/27 | | | 284,000 | | | 268,829 |
5.500% 12/15/27 | | | 505,000 | | | 480,790 |
8.375% 6/15/29 (d) | | | 390,000 | | | 389,562 |
8.875% 6/15/32 | | | 907,000 | | | 866,382 |
| | | | | | 5,591,955 |
Retail — 5.0%
| | | | | | |
1011778 BC ULC/New Red Finance, Inc.
| | | | | | |
5.625% 9/15/29 (c) | | | 415,000 | | | 420,997 |
6.125% 6/15/29 (c) | | | 1,577,000 | | | 1,622,353 |
Bath & Body Works, Inc.
| | | | | | |
6.750% 7/01/36 | | | 658,000 | | | 678,140 |
6.875% 11/01/35 | | | 1,611,000 | | | 1,678,665 |
Carvana Co.
| | | | | | |
13.000% 6/01/30 (c) | | | 324,731 | | | 353,105 |
14.000% 6/01/31 (c) | | | 1,371,740 | | | 1,615,796 |
CEC Entertainment LLC
6.750% 5/01/26 (c) | | | 855,000 | | | 847,844 |
Michaels Cos., Inc.
| | | | | | |
5.250% 5/01/28 (c) (d) | | | 250,000 | | | 184,527 |
7.875% 5/01/29 (c) | | | 328,000 | | | 190,819 |
PetSmart, Inc./PetSmart Finance Corp.
| | | | | | |
4.750% 2/15/28 (c) | | | 610,000 | | | 584,818 |
7.750% 2/15/29 (c) | | | 1,096,000 | | | 1,081,933 |
Raising Cane’s Restaurants LLC
9.375% 5/01/29 (c) | | | 218,000 | | | 236,057 |
Specialty Building Products Holdings LLC/SBP Finance Corp.
6.375% 9/30/26 (c) | | | 1,918,000 | | | 1,910,795 |
Staples, Inc.
| | | | | | |
10.750% 9/01/29 (c) | | | 832,000 | | | 807,290 |
12.750% 1/15/30 (c) | | | 602,744 | | | 495,098 |
Suburban Propane Partners LP/Suburban Energy Finance Corp.
5.000% 6/01/31 (c) | | | 1,271,000 | | | 1,185,008 |
Superior Plus LP/Superior General Partner, Inc.
4.500% 3/15/29 (c) | | | 2,169,000 | | | 2,056,527 |
Walgreen Co.
4.400% 9/15/42 | | | 125,000 | | | 84,626 |
| | | | | | | |
| | | | | |
The accompanying notes are an integral part of the financial statements. | | | | |
| | | 49
| |
| | | | | |
TABLE OF CONTENTS
| | MassMutual High Yield Fund — Portfolio of Investments (Continued) | |
| | | | | | | |
Walgreens Boots Alliance, Inc.
| | | | | | |
3.450% 6/01/26 (d) | | | $1,752,000 | | | $1,685,444 |
4.650% 6/01/46 | | | 362,000 | | | 243,985 |
4.800% 11/18/44 | | | 495,000 | | | 370,398 |
8.125% 8/15/29 (d) | | | 1,730,000 | | | 1,726,682 |
| | | | | | 20,060,907 |
Software — 1.5%
| | | | | | |
Cloud Software Group, Inc.
| | | | | | |
6.500% 3/31/29 (c) | | | 2,178,000 | | | 2,167,037 |
8.250% 6/30/32 (c) | | | 445,000 | | | 465,158 |
9.000% 9/30/29 (c) | | | 1,129,000 | | | 1,148,882 |
Consensus Cloud Solutions, Inc.
6.000% 10/15/26 (c) | | | 934,000 | | | 931,444 |
Veritas US, Inc./Veritas Bermuda Ltd., (Acquired 12/03/20, Cost $1,317,686),
7.500% 9/01/25 (b) (c) (d) | | | 1,317,000 | | | 1,235,529 |
| | | | | | 5,948,050 |
Telecommunications — 5.5%
| | | | | | |
Altice Financing SA
| | | | | | |
5.000% 1/15/28 (c) | | | 464,000 | | | 392,496 |
5.750% 8/15/29 (c) | | | 699,000 | | | 561,743 |
C&W Senior Finance Ltd.
6.875% 9/15/27 (c) | | | 2,136,000 | | | 2,128,575 |
Connect Finco SARL/Connect US Finco LLC
| | | | | | |
6.750% 10/01/26 (c) | | | 1,897,415 | | | 1,897,415 |
9.000% 9/15/29 (c) | | | 593,000 | | | 573,867 |
Consolidated Communications, Inc.
| | | | | | |
5.000% 10/01/28 (c) | | | 1,858,000 | | | 1,708,558 |
6.500% 10/01/28 (c) | | | 1,415,000 | | | 1,336,053 |
Frontier Communications Holdings LLC
| | | | | | |
6.000% 1/15/30 (c) | | | 2,191,000 | | | 2,187,193 |
6.750% 5/01/29 (c) | | | 902,000 | | | 908,358 |
8.625% 3/15/31 (c) | | | 3,081,000 | | | 3,321,595 |
Hughes Satellite Systems Corp., (Acquired 3/06/20, Cost $1,019,010),
| | | | | | |
6.625% 8/01/26 (b) (d) | | | 985,000 | | | 857,304 |
Level 3 Financing, Inc.
| | | | | | |
4.500% 4/01/30 (c) | | | 647,000 | | | 501,106 |
11.000% 11/15/29 (c) | | | 3,793,000 | | | 4,201,035 |
Sable International Finance Ltd.
7.125% 10/15/32 (c) (e) | | | 1,159,000 | | | 1,163,346 |
| | | | | | | |
| | | | | | | |
Zayo Group Holdings, Inc.
4.000% 3/01/27 (c) (d) | | | $283,000 | | | $253,127 |
| | | | | | 21,991,771 |
Transportation — 1.8%
| | | | | | |
Carriage Purchaser, Inc.
7.875% 10/15/29 (c) | | | 1,473,000 | | | 1,368,929 |
Genesee & Wyoming, Inc.
6.250% 4/15/32 (c) | | | 1,297,000 | | | 1,333,769 |
Seaspan Corp.
5.500% 8/01/29 (c) | | | 4,074,320 | | | 3,880,603 |
Watco Cos. LLC/Watco Finance Corp.
7.125% 8/01/32 (c) | | | 702,000 | | | 731,675 |
| | | | | | 7,314,976 |
TOTAL CORPORATE DEBT
(Cost $325,567,482) | | | | | | 329,673,170 |
TOTAL BONDS & NOTES
(Cost $365,785,321) | | | | | | 370,041,607 |
TOTAL LONG-TERM INVESTMENTS
(Cost $365,785,321) | | | | | | 370,041,607 |
Short-Term Investments — 17.2%
| | | |
Commercial Paper — 8.2%
| | | | | | |
Alimentation Couche-Tard, Inc.
5.480% 10/10/24 (c) | | | 5,000,000 | | | 4,993,043 |
Dominion Energy South Carolina, Inc.
5.382% 10/16/24 | | | 4,000,000 | | | 3,991,091 |
Evergy, Inc.
4.959% 10/01/24 | | | 8,000,000 | | | 7,998,908 |
Hubbell, Inc.
4.983% 10/07/24 (c) | | | 8,000,000 | | | 7,992,331 |
Microchip Technology, Inc.
5.470% 10/18/24 (c) | | | 6,000,000 | | | 5,984,717 |
Penske Truck Leasing Co. LP
5.641% 1/23/25 | | | 2,000,000 | | | 1,969,316 |
| | | | | | 32,929,406 |
| | | | | | | |
| | | | | | | |
Investment of Cash Collateral from Securities Loaned — 8.2%
| | | | | | |
State Street Navigator Securities Lending Government Money
Market Portfolio (g) | | | 32,897,900 | | | 32,897,900 |
| | | | | | | |
| | | | | |
| | | The accompanying notes are an integral part of the financial statements.
| |
50
| | | | |
| | | | | |
TABLE OF CONTENTS
| | MassMutual High Yield Fund — Portfolio of Investments (Continued) | |
| | | | | | | |
Repurchase Agreement — 0.8%
| | | | | | |
Fixed Income Clearing Corp., Repurchase Agreement, dated 9/30/24, 1.520%, due 10/01/24 (h) | | | $3,171,648 | | | $3,171,648 |
TOTAL SHORT-TERM INVESTMENTS
(Cost $68,998,026) | | | | | | 68,998,954 |
TOTAL INVESTMENTS — 109.9%
(Cost $434,783,347) (i) | | | | | | 439,040,561 |
Other Assets/
(Liabilities) — (9.9)% | | | | | | (39,711,226) |
NET ASSETS — 100.0% | | | | | | $399,329,335 |
| | | | | | | |
Abbreviation Legend
| | | | | |
CMT | | | Constant Maturity Treasury Index | |
SOFR | | | Secured Overnight Financing Rate | |
STEP | | | Step Coupon Bond | |
VRN | | | Variable Rate Note | |
| | | | | |
Notes to Portfolio of Investments
Percentages are stated as a percent of net assets.
(a)
| All or a portion of the security represents unsettled bank loan commitments at September 30, 2024, where the rate will be determined at time of settlement.
|
(b)
| Restricted security. Certain securities are restricted to resale. At September 30, 2024, these securities amounted to a value of $2,622,207 or 0.66% of net assets. The Fund generally bears the costs, if any, associated with the disposition of restricted securities.
|
(c)
| Security is exempt from registration under Regulation S or Rule 144A of the Securities Act of 1933. These securities are considered restricted and may be resold in transactions exempt from registration. At September 30, 2024, the aggregate market value of these securities amounted to $296,148,736 or 74.16% of net assets.
|
(d)
| Denotes all or a portion of security on loan. The total value of securities on loan as of September 30, 2024, was $31,665,949 or 7.93% of net assets. The Fund received $47,513 of non-cash collateral (U.S. Treasury and/or Agency obligations) related to securities lending activity. This amount is not reflected on either the Portfolio of Investments or the Statement of Assets and Liabilities. (Note 2).
|
(e)
| A portion of this security is purchased on a when-issued, delayed-delivery or forward commitment basis. (Note 2).
|
(f)
| Security is perpetual and has no stated maturity date.
|
(g)
| Represents investment of security lending cash collateral. (Note 2).
|
(h)
| Maturity value of $3,171,782. Collateralized by U.S. Government Agency obligations with rates ranging from 2.875% - 4.000%, maturity dates ranging from 5/15/52 - 11/15/52, and an aggregate market value, including accrued interest, of $3,235,224.
|
(i)
| See Note 6 for aggregate cost for federal tax purposes. |
| | | | | |
The accompanying notes are an integral part of the financial statements. | | | | |
| | | 51
| |
| | | | | |
TABLE OF CONTENTS
| | | |
| | MassMutual Balanced Fund — Portfolio of Investments | |
| | | |
| | | | | | | |
Equities — 64.6%
| | | | | | |
Common Stock — 64.6%
| | | | | | |
Communication Services — 2.2%
| | | | | | |
Electronic Arts, Inc. | | | 1,494 | | | $214,299 |
Netflix, Inc. (a) | | | 782 | | | 554,649 |
Omnicom Group, Inc. | | | 963 | | | 99,565 |
Verizon Communications, Inc. | | | 22,088 | | | 991,972 |
Walt Disney Co. | | | 5,028 | | | 483,643 |
| | | | | | 2,344,128 |
Consumer Discretionary — 5.7%
| | | | | | |
Aptiv PLC (a) | | | 576 | | | 41,478 |
AutoZone, Inc. (a) | | | 124 | | | 390,605 |
Booking Holdings, Inc. | | | 179 | | | 753,970 |
Chipotle Mexican Grill, Inc. (a) | | | 4,492 | | | 258,829 |
DR Horton, Inc. | | | 825 | | | 157,385 |
eBay, Inc. | | | 2,815 | | | 183,285 |
Ford Motor Co. | | | 21,458 | | | 226,596 |
Garmin Ltd. | | | 931 | | | 163,884 |
Genuine Parts Co. | | | 424 | | | 59,224 |
Hilton Worldwide Holdings, Inc. | | | 1,086 | | | 250,323 |
Home Depot, Inc. | | | 3,227 | | | 1,307,580 |
Las Vegas Sands Corp. | | | 1,605 | | | 80,796 |
Lowe’s Cos., Inc. | | | 3,286 | | | 890,013 |
Lululemon Athletica, Inc. (a) | | | 242 | | | 65,667 |
Marriott International, Inc. Class A | | | 721 | | | 179,241 |
NIKE, Inc. Class B | | | 2,227 | | | 196,867 |
Ross Stores, Inc. | | | 1,082 | | | 162,852 |
Royal Caribbean Cruises Ltd. | | | 262 | | | 46,468 |
TJX Cos., Inc. | | | 3,999 | | | 470,042 |
Ulta Beauty, Inc. (a) | | | 142 | | | 55,255 |
Yum! Brands, Inc. | | | 1,162 | | | 162,343 |
| | | | | | 6,102,703 |
Consumer Staples — 4.8%
| | | | | | |
Brown-Forman Corp. Class B | | | 268 | | | 13,186 |
Church & Dwight Co., Inc. | | | 438 | | | 45,867 |
Coca-Cola Co. | | | 9,503 | | | 682,885 |
Colgate-Palmolive Co. | | | 5,540 | | | 575,107 |
Constellation Brands, Inc. Class A | | | 384 | | | 98,953 |
Dollar General Corp. | | | 386 | | | 32,644 |
Dollar Tree, Inc. (a) | | | 256 | | | 18,002 |
Estee Lauder Cos., Inc. Class A | | | 262 | | | 26,119 |
General Mills, Inc. | | | 7,357 | | | 543,314 |
Hershey Co. | | | 395 | | | 75,753 |
Hormel Foods Corp. | | | 638 | | | 20,225 |
Kellanova | | | 1,311 | | | 105,811 |
Kenvue, Inc. | | | 1,776 | | | 41,079 |
Keurig Dr. Pepper, Inc. | | | 1,165 | | | 43,664 |
| | | | | | | |
| | | | | | | |
Kimberly-Clark Corp. | | | 1,079 | | | $153,520 |
Kroger Co. | | | 4,172 | | | 239,056 |
McCormick & Co., Inc. | | | 256 | | | 21,069 |
Mondelez International, Inc. Class A | | | 3,409 | | | 251,141 |
PepsiCo, Inc. | | | 3,766 | | | 640,408 |
Procter & Gamble Co. | | | 7,089 | | | 1,227,815 |
Sysco Corp. | | | 1,198 | | | 93,516 |
Target Corp. | | | 1,678 | | | 261,533 |
| | | | | | 5,210,667 |
Energy — 1.9%
| | | | | | |
Baker Hughes Co. | | | 2,671 | | | 96,557 |
Cheniere Energy, Inc. | | | 2,693 | | | 484,309 |
Halliburton Co. | | | 5,460 | | | 158,613 |
Kinder Morgan, Inc. | | | 33,438 | | | 738,645 |
ONEOK, Inc. | | | 1,115 | | | 101,610 |
Schlumberger NV | | | 2,797 | | | 117,334 |
Williams Cos., Inc. | | | 8,344 | | | 380,904 |
| | | | | | 2,077,972 |
Financials — 8.4%
| | | | | | |
Aflac, Inc. | | | 1,665 | | | 186,147 |
Allstate Corp. | | | 1,470 | | | 278,785 |
American Express Co. | | | 2,248 | | | 609,658 |
Ameriprise Financial, Inc. | | | 254 | | | 119,332 |
Aon PLC Class A | | | 221 | | | 76,464 |
Apollo Global Management, Inc. | | | 316 | | | 39,472 |
Arch Capital Group Ltd. (a) | | | 1,766 | | | 197,580 |
Arthur J Gallagher & Co. | | | 274 | | | 77,095 |
Bank of New York Mellon Corp. | | | 863 | | | 62,015 |
BlackRock, Inc. | | | 151 | | | 143,376 |
Blackstone, Inc. | | | 663 | | | 101,525 |
Block, Inc. (a) | | | 131 | | | 8,794 |
Charles Schwab Corp. | | | 1,393 | | | 90,280 |
Chubb Ltd. | | | 2,480 | | | 715,207 |
CME Group, Inc. | | | 722 | | | 159,309 |
Discover Financial Services | | | 658 | | | 92,311 |
Fidelity National Information Services, Inc. | | | 3,535 | | | 296,056 |
Fifth Third Bancorp | | | 1,343 | | | 57,534 |
Fiserv, Inc. (a) | | | 2,872 | | | 515,955 |
Global Payments, Inc. | | | 409 | | | 41,890 |
Hartford Financial Services Group, Inc. | | | 3,537 | | | 415,987 |
Intercontinental Exchange, Inc. | | | 869 | | | 139,596 |
KKR & Co., Inc. | | | 488 | | | 63,723 |
M&T Bank Corp. | | | 369 | | | 65,726 |
Marsh & McLennan Cos., Inc. | | | 1,062 | | | 236,922 |
MetLife, Inc. | | | 4,028 | | | 332,229 |
Moody’s Corp. | | | 228 | | | 108,207 |
| | | | | | | |
| | | | | |
| | | The accompanying notes are an integral part of the financial statements.
| |
52
| | | | |
| | | | | |
TABLE OF CONTENTS
| | MassMutual Balanced Fund — Portfolio of Investments (Continued) | |
| | | | | | | |
Morgan Stanley | | | 2,609 | | | $271,962 |
MSCI, Inc. | | | 64 | | | 37,308 |
Nasdaq, Inc. | | | 581 | | | 42,419 |
NU Holdings Ltd. Class A (a) | | | 2,373 | | | 32,391 |
PayPal Holdings, Inc. (a) | | | 2,872 | | | 224,102 |
Principal Financial Group, Inc. | | | 404 | | | 34,704 |
Progressive Corp. | | | 3,813 | | | 967,587 |
Prudential Financial, Inc. | | | 1,291 | | | 156,340 |
Regions Financial Corp. | | | 1,669 | | | 38,938 |
S&P Global, Inc. | | | 303 | | | 156,536 |
State Street Corp. | | | 837 | | | 74,049 |
T. Rowe Price Group, Inc. | | | 364 | | | 39,651 |
Travelers Cos., Inc. | | | 1,251 | | | 292,884 |
Truist Financial Corp. | | | 983 | | | 42,043 |
Visa, Inc. Class A | | | 4,577 | | | 1,258,446 |
Willis Towers Watson PLC | | | 381 | | | 112,216 |
| | | | | | 9,012,751 |
Health Care — 7.7%
| | | | | | |
Abbott Laboratories | | | 3,132 | | | 357,079 |
Agilent Technologies, Inc. | | | 487 | | | 72,310 |
Align Technology, Inc. (a) | | | 47 | | | 11,953 |
Amgen, Inc. | | | 883 | | | 284,511 |
Baxter International, Inc. | | | 665 | | | 25,250 |
Becton Dickinson & Co. | | | 484 | | | 116,692 |
Biogen, Inc. (a) | | | 97 | | | 18,802 |
BioNTech SE ADR (a) | | | 281 | | | 33,374 |
Boston Scientific Corp. (a) | | | 3,490 | | | 292,462 |
Bristol-Myers Squibb Co. | | | 4,007 | | | 207,322 |
Cardinal Health, Inc. | | | 508 | | | 56,144 |
Cencora, Inc. | | | 602 | | | 135,498 |
Centene Corp. (a) | | | 993 | | | 74,753 |
Cigna Group | | | 1,322 | | | 457,994 |
CVS Health Corp. | | | 4,982 | | | 313,268 |
Danaher Corp. | | | 742 | | | 206,291 |
Dexcom, Inc. (a) | | | 131 | | | 8,782 |
Edwards Lifesciences Corp. (a) | | | 522 | | | 34,447 |
Elevance Health, Inc. | | | 577 | | | 300,040 |
Eli Lilly & Co. | | | 1,168 | | | 1,034,778 |
Gilead Sciences, Inc. | | | 2,137 | | | 179,166 |
GRAIL, Inc. (a) | | | 9 | | | 124 |
Humana, Inc. | | | 51 | | | 16,154 |
IDEXX Laboratories, Inc. (a) | | | 59 | | | 29,808 |
Illumina, Inc. (a) | | | 55 | | | 7,173 |
Intuitive Surgical, Inc. (a) | | | 226 | | | 111,027 |
IQVIA Holdings, Inc. (a) | | | 249 | | | 59,006 |
McKesson Corp. | | | 658 | | | 325,328 |
Medtronic PLC | | | 3,229 | | | 290,707 |
Merck & Co., Inc. | | | 8,367 | | | 950,157 |
Mettler-Toledo International, Inc. (a) | | | 28 | | | 41,992 |
| | | | | | | |
| | | | | | | |
Moderna, Inc. (a) | | | 91 | | | $6,082 |
Pfizer, Inc. | | | 3,925 | | | 113,589 |
Regeneron Pharmaceuticals, Inc. (a) | | | 240 | | | 252,298 |
Stryker Corp. | | | 525 | | | 189,661 |
Thermo Fisher Scientific, Inc. | | | 715 | | | 442,278 |
UnitedHealth Group, Inc. | | | 1,408 | | | 823,229 |
Veeva Systems, Inc. Class A (a) | | | 125 | | | 26,234 |
Vertex Pharmaceuticals, Inc. (a) | | | 546 | | | 253,934 |
Waters Corp. (a) | | | 59 | | | 21,233 |
West Pharmaceutical Services, Inc. | | | 53 | | | 15,908 |
Zoetis, Inc. | | | 360 | | | 70,337 |
| | | | | | 8,267,175 |
Industrials — 4.9%
| | | | | | |
AMETEK, Inc. | | | 660 | | | 113,329 |
Automatic Data Processing, Inc. | | | 769 | | | 212,805 |
Carrier Global Corp. | | | 867 | | | 69,785 |
Cintas Corp. | | | 1,024 | | | 210,821 |
Copart, Inc. (a) | | | 1,721 | | | 90,180 |
CSX Corp. | | | 7,414 | | | 256,005 |
Cummins, Inc. | | | 1,131 | | | 366,206 |
Deere & Co. | | | 750 | | | 312,997 |
Eaton Corp. PLC | | | 736 | | | 243,940 |
Emerson Electric Co. | | | 603 | | | 65,950 |
FedEx Corp. | | | 536 | | | 146,692 |
Honeywell International, Inc. | | | 1,546 | | | 319,574 |
Illinois Tool Works, Inc. | | | 680 | | | 178,208 |
Ingersoll Rand, Inc. | | | 919 | | | 90,209 |
Johnson Controls International PLC | | | 732 | | | 56,811 |
Norfolk Southern Corp. | | | 290 | | | 72,065 |
Otis Worldwide Corp. | | | 937 | | | 97,392 |
Paychex, Inc. | | | 435 | | | 58,373 |
Republic Services, Inc. | | | 1,811 | | | 363,721 |
Rockwell Automation, Inc. | | | 131 | | | 35,168 |
Trane Technologies PLC | | | 556 | | | 216,134 |
Union Pacific Corp. | | | 1,140 | | | 280,987 |
United Parcel Service, Inc. Class B | | | 823 | | | 112,208 |
United Rentals, Inc. | | | 198 | | | 160,327 |
Verisk Analytics, Inc. | | | 282 | | | 75,565 |
Vertiv Holdings Co. Class A | | | 845 | | | 84,069 |
W.W. Grainger, Inc. | | | 214 | | | 222,305 |
Waste Connections, Inc. | | | 1,034 | | | 184,900 |
Waste Management, Inc. | | | 2,426 | | | 503,638 |
Xylem, Inc. | | | 227 | | | 30,652 |
| | | | | | 5,231,016 |
Information Technology — 24.2%
| | | | | | |
Accenture PLC Class A | | | 1,950 | | | 689,286 |
Adobe, Inc. (a) | | | 718 | | | 371,766 |
Advanced Micro Devices, Inc. (a) | | | 1,140 | | | 187,051 |
Amphenol Corp. Class A | | | 5,478 | | | 356,946 |
| | | | | | | |
| | | | | |
The accompanying notes are an integral part of the financial statements. | | | | |
| | | 53
| |
| | | | | |
TABLE OF CONTENTS
| | MassMutual Balanced Fund — Portfolio of Investments (Continued) | |
| | | | | | | |
Analog Devices, Inc. | | | 852 | | | $196,105 |
ANSYS, Inc. (a) | | | 140 | | | 44,608 |
Apple, Inc. | | | 22,440 | | | 5,228,520 |
Applied Materials, Inc. | | | 3,299 | | | 666,563 |
Arista Networks, Inc. (a) | | | 437 | | | 167,729 |
Autodesk, Inc. (a) | | | 304 | | | 83,746 |
Broadcom, Inc. | | | 8,543 | | | 1,473,667 |
Cadence Design Systems, Inc. (a) | | | 783 | | | 212,216 |
CDW Corp. | | | 532 | | | 120,392 |
Cisco Systems, Inc. | | | 11,593 | | | 616,979 |
Cognizant Technology Solutions Corp. Class A | | | 1,193 | | | 92,076 |
Corning, Inc. | | | 1,630 | | | 73,595 |
Crowdstrike Holdings, Inc. Class A (a) | | | 443 | | | 124,248 |
Dell Technologies, Inc. Class C | | | 1,255 | | | 148,768 |
Fortinet, Inc. (a) | | | 1,178 | | | 91,354 |
Gartner, Inc. (a) | | | 196 | | | 99,325 |
GLOBALFOUNDRIES, Inc. (a) | | | 70 | | | 2,818 |
Hewlett Packard Enterprise Co. | | | 7,124 | | | 145,757 |
HP, Inc. | | | 2,071 | | | 74,287 |
HubSpot, Inc. (a) | | | 59 | | | 31,364 |
Intel Corp. | | | 5,875 | | | 137,828 |
International Business Machines Corp. | | | 5,122 | | | 1,132,372 |
Intuit, Inc. | | | 723 | | | 448,983 |
Keysight Technologies, Inc. (a) | | | 338 | | | 53,718 |
KLA Corp. | | | 501 | | | 387,979 |
Lam Research Corp. | | | 495 | | | 403,960 |
Marvell Technology, Inc. | | | 762 | | | 54,955 |
Micron Technology, Inc. | | | 1,477 | | | 153,180 |
Microsoft Corp. | | | 10,725 | | | 4,614,967 |
Monolithic Power Systems, Inc. | | | 55 | | | 50,848 |
Motorola Solutions, Inc. | | | 725 | | | 325,982 |
NetApp, Inc. | | | 1,097 | | | 135,490 |
NVIDIA Corp. | | | 35,165 | | | 4,270,438 |
Oracle Corp. | | | 2,603 | | | 443,551 |
Palo Alto Networks, Inc. (a) | | | 389 | | | 132,960 |
Roper Technologies, Inc. | | | 341 | | | 189,746 |
Salesforce, Inc. | | | 2,560 | | | 700,698 |
ServiceNow, Inc. (a) | | | 471 | | | 421,258 |
Snowflake, Inc. Class A (a) | | | 162 | | | 18,607 |
Super Micro Computer, Inc. (a) | | | 27 | | | 11,243 |
Synopsys, Inc. (a) | | | 220 | | | 111,406 |
TE Connectivity PLC (a) | | | 872 | | | 131,663 |
Texas Instruments, Inc. | | | 1,674 | | | 345,798 |
Workday, Inc. Class A (a) | | | 326 | | | 79,678 |
| | | | | | 26,056,474 |
Materials — 1.8%
| | | | | | |
Air Products & Chemicals, Inc. | | | 93 | | | 27,690 |
Ball Corp. | | | 368 | | | 24,991 |
| | | | | | | |
| | | | | | | |
Dow, Inc. | | | 2,072 | | | $113,193 |
DuPont de Nemours, Inc. | | | 1,752 | | | 156,121 |
Ecolab, Inc. | | | 590 | | | 150,645 |
International Flavors & Fragrances, Inc. | | | 192 | | | 20,146 |
Linde PLC (LIN US) | | | 1,923 | | | 917,002 |
LyondellBasell Industries NV Class A | | | 1,473 | | | 141,261 |
Martin Marietta Materials, Inc. | | | 95 | | | 51,134 |
Newmont Corp. (NEM US) | | | 285 | | | 15,233 |
PPG Industries, Inc. | | | 379 | | | 50,202 |
Sherwin-Williams Co. | | | 512 | | | 195,415 |
Vulcan Materials Co. | | | 180 | | | 45,077 |
| | | | | | 1,908,110 |
Real Estate — 1.0%
| | | | | | |
Alexandria Real Estate Equities, Inc. | | | 285 | | | 33,844 |
American Tower Corp. | | | 410 | | | 95,350 |
AvalonBay Communities, Inc. | | | 336 | | | 75,684 |
CBRE Group, Inc. Class A (a) | | | 640 | | | 79,667 |
Crown Castle, Inc. | | | 564 | | | 66,907 |
Digital Realty Trust, Inc. | | | 416 | | | 67,321 |
Equinix, Inc. | | | 115 | | | 102,078 |
Equity Residential | | | 1,031 | | | 76,768 |
Extra Space Storage, Inc. | | | 170 | | | 30,632 |
Prologis, Inc. | | | 663 | | | 83,724 |
Public Storage | | | 382 | | | 138,999 |
SBA Communications Corp. | | | 86 | | | 20,700 |
Simon Property Group, Inc. | | | 708 | | | 119,666 |
Ventas, Inc. | | | 690 | | | 44,250 |
VICI Properties, Inc. | | | 2,259 | | | 75,247 |
| | | | | | 1,110,837 |
Utilities — 2.0%
| | | | | | |
Ameren Corp. | | | 476 | | | 41,631 |
American Electric Power Co., Inc. | | | 1,021 | | | 104,755 |
American Water Works Co., Inc. | | | 100 | | | 14,624 |
CMS Energy Corp. | | | 636 | | | 44,921 |
Consolidated Edison, Inc. | | | 831 | | | 86,532 |
Dominion Energy, Inc. | | | 807 | | | 46,637 |
Duke Energy Corp. | | | 4,025 | | | 464,082 |
Edison International | | | 835 | | | 72,720 |
Entergy Corp. | | | 613 | | | 80,677 |
Eversource Energy | | | 625 | | | 42,531 |
Exelon Corp. | | | 3,030 | | | 122,866 |
FirstEnergy Corp. | | | 660 | | | 29,271 |
NextEra Energy, Inc. | | | 1,777 | | | 150,210 |
PPL Corp. | | | 3,765 | | | 124,546 |
Public Service Enterprise Group, Inc. | | | 2,822 | | | 251,751 |
Sempra | | | 992 | | | 82,961 |
Southern Co. | | | 2,152 | | | 194,067 |
WEC Energy Group, Inc. | | | 1,412 | | | 135,806 |
| | | | | | | |
| | | | | |
| | | The accompanying notes are an integral part of the financial statements.
| |
54
| | | | |
| | | | | |
TABLE OF CONTENTS
| | MassMutual Balanced Fund — Portfolio of Investments (Continued) | |
| | | | | | | |
Xcel Energy, Inc. | | | 1,650 | | | $107,745 |
| | | | | | 2,198,333 |
TOTAL COMMON STOCK
(Cost $53,731,010) | | | | | | 69,520,166 |
TOTAL EQUITIES
(Cost $53,731,010) | | | | | | 69,520,166 |
| | | | | | | |
| | | | | | | |
Bonds & Notes — 35.8%
| | | | | | |
Corporate Debt — 10.9%
| | | | | | |
Agriculture — 0.1%
| | | | | | |
Archer-Daniels-Midland Co.
2.700% 9/15/51 | | | $49,000 | | | 32,698 |
Bunge Ltd. Finance Corp.
3.250% 8/15/26 | | | 47,000 | | | 46,246 |
| | | | | | 78,944 |
Airlines — 0.1%
| | | | | | |
American Airlines Pass-Through Trust, Series 2021-1A, Class EETC,
2.875% 1/11/36 | | | 61,600 | | | 53,675 |
Delta Air Lines, Inc./SkyMiles IP Ltd.
4.500% 10/20/25 (b) | | | 34,581 | | | 34,370 |
| | | | | | 88,045 |
Auto Manufacturers — 0.2%
| | | | | | |
General Motors Financial Co., Inc.
5.800% 6/23/28 | | | 72,000 | | | 74,699 |
PACCAR Financial Corp.
4.600% 1/10/28 | | | 91,000 | | | 92,501 |
| | | | | | 167,200 |
Banks — 2.9%
| | | | | | |
Australia & New Zealand Banking Group Ltd. 5 yr. CMT + 1.700%
2.570% VRN 11/25/35 (b) | | | 225,000 | | | 195,232 |
Bank of America Corp.
| | | | | | |
5 yr. CMT + 1.200%
2.482% VRN 9/21/36 | | | 162,000 | | | 136,696 |
4.183% 11/25/27 | | | 41,000 | | | 40,917 |
3 mo. USD Term SOFR + 2.076% 4.244% VRN 4/24/38 | | | 23,000 | | | 21,799 |
3 mo. USD Term SOFR + 1.572% 4.271% VRN 7/23/29 | | | 18,000 | | | 17,953 |
4.750% 4/21/45 | | | 63,000 | | | 60,507 |
1 day USD SOFR + 1.910%
5.288% VRN 4/25/34 | | | 69,000 | | | 71,738 |
5 yr. CMT + 3.231%
6.125% VRN (c) | | | 162,000 | | | 165,645 |
| | | | | | | |
| | | | | | | |
7.750% 5/14/38 | | | $20,000 | | | $25,272 |
Bank of New York Mellon Corp. 5 yr. CMT + 2.630%
3.750% VRN (c) | | | 156,000 | | | 147,238 |
1 day USD SOFR + 1.230%
5.060% VRN 7/22/32 | | | 41,000 | | | 42,424 |
Bank of Nova Scotia
4.500% 12/16/25 | | | 36,000 | | | 35,912 |
Citigroup, Inc.
4.450% 9/29/27 | | | 27,000 | | | 27,038 |
1 day USD SOFR + 2.086% 4.910% VRN 5/24/33 | | | 71,000 | | | 71,566 |
5.500% 9/13/25 | | | 54,000 | | | 54,329 |
5.875% 1/30/42 | | | 18,000 | | | 19,772 |
6.000% 10/31/33 | | | 16,000 | | | 17,245 |
6.625% 6/15/32 | | | 14,000 | | | 15,509 |
8.125% 7/15/39 | | | 14,000 | | | 18,576 |
Comerica, Inc. 1 day USD SOFR + 2.155%
5.982% VRN 1/30/30 | | | 27,000 | | | 27,834 |
Cooperatieve Rabobank UA 1 yr.
CMT + 0.550%
| | | | | | |
1.106% VRN 2/24/27 (b) | | | 250,000 | | | 238,462 |
Fifth Third Bancorp
| | | | | | |
1 day USD SOFR + 1.840% 5.631% VRN 1/29/32 | | | 28,000 | | | 29,247 |
1 day USD SOFR + 2.340% 6.339% VRN 7/27/29 | | | 14,000 | | | 14,881 |
Goldman Sachs Group, Inc.
| | | | | | |
1 day USD SOFR + 0.798% 1.431% VRN 3/09/27 | | | 227,000 | | | 217,129 |
4.250% 10/21/25 | | | 32,000 | | | 31,881 |
1 day USD SOFR + 1.552% 5.851% VRN 4/25/35 | | | 63,000 | | | 67,693 |
5.950% 1/15/27 | | | 72,000 | | | 74,645 |
6.750% 10/01/37 | | | 32,000 | | | 36,848 |
Huntington Bancshares, Inc. 1 day USD SOFR + 2.020%
6.208% VRN 8/21/29 | | | 29,000 | | | 30,679 |
JP Morgan Chase & Co.
| | | | | | |
3 mo. USD Term SOFR + 1.422% 3.702% VRN 5/06/30 | | | 160,000 | | | 155,620 |
5.600% 7/15/41 | | | 41,000 | | | 44,553 |
Mizuho Financial Group, Inc.
2.564% 9/13/31 | | | 200,000 | | | 171,644 |
Morgan Stanley
| | | | | | |
1 day USD SOFR + 1.485% 3.217% VRN 4/22/42 | | | 44,000 | | | 35,476 |
3 mo. USD Term SOFR + 1.890% 4.431% VRN 1/23/30 | | | 79,000 | | | 79,173 |
| | | | | | | |
| | | | | |
The accompanying notes are an integral part of the financial statements. | | | | |
| | | 55
| |
| | | | | |
TABLE OF CONTENTS
| | MassMutual Balanced Fund — Portfolio of Investments (Continued) | |
| | | | | | | |
1 day USD SOFR + 1.870% 5.250% VRN 4/21/34 | | | $73,000 | | | $75,394 |
1 day USD SOFR + 1.555% 5.320% VRN 7/19/35 | | | 69,000 | | | 71,651 |
PNC Financial Services Group, Inc.
| | | | | | |
1 day USD SOFR + 1.933% 5.068% VRN 1/24/34 | | | 54,000 | | | 54,748 |
1 day USD SOFR + 1.841% 5.582% VRN 6/12/29 | | | 85,000 | | | 88,475 |
Truist Financial Corp. 1 day USD SOFR + 1.620%
5.435% VRN 1/24/30 | | | 40,000 | | | 41,402 |
US Bancorp
| | | | | | |
1 day USD SOFR + 1.600% 4.839% VRN 2/01/34 | | | 79,000 | | | 78,944 |
1 day USD SOFR + 2.020% 5.775% VRN 6/12/29 | | | 66,000 | | | 69,170 |
Wells Fargo & Co.
| | | | | | |
1 day USD SOFR + 2.020% 5.389% VRN 4/24/34 | | | 67,000 | | | 69,492 |
1 day USD SOFR + 1.990%
5.557% VRN 7/25/34 | | | 54,000 | | | 56,655 |
5 yr. CMT + 3.606%
7.625% VRN (c) | | | 30,000 | | | 32,671 |
| | | | | | 3,079,735 |
Biotechnology — 0.4%
| | | | | | |
Amgen, Inc.
| | | | | | |
2.200% 2/21/27 | | | 347,000 | | | 332,268 |
5.250% 3/02/33 | | | 54,000 | | | 56,218 |
5.650% 3/02/53 | | | 36,000 | | | 37,870 |
| | | | | | 426,356 |
Building Materials — 0.0%
| | | | | | |
Carrier Global Corp.
6.200% 3/15/54 | | | 10,000 | | | 11,547 |
Commercial Services — 0.3%
| | | | | | |
ERAC USA Finance LLC
5.000% 2/15/29 (b) | | | 42,000 | | | 43,283 |
Moody’s Corp.
4.250% 2/01/29 | | | 209,000 | | | 210,085 |
PayPal Holdings, Inc.
3.250% 6/01/50 | | | 27,000 | | | 20,057 |
Triton Container International Ltd.
3.150% 6/15/31 (b) | | | 100,000 | | | 87,148 |
| | | | | | 360,573 |
Computers — 0.3%
| | | | | | |
Apple, Inc.
| | | | | | |
2.650% 5/11/50 | | | 27,000 | | | 18,636 |
3.000% 6/20/27 | | | 177,000 | | | 173,859 |
| | | | | | | |
| | | | | | | |
Hewlett Packard Enterprise Co.
| | | | | | |
5.000% 10/15/34 | | | $70,000 | | | $69,302 |
5.600% 10/15/54 | | | 54,000 | | | 53,013 |
| | | | | | 314,810 |
Diversified Financial Services — 0.2%
| | | |
Air Lease Corp.
2.200% 1/15/27 | | | 64,000 | | | 60,944 |
LPL Holdings, Inc.
6.000% 5/20/34 | | | 48,000 | | | 50,173 |
Mastercard, Inc.
4.350% 1/15/32 | | | 103,000 | | | 103,507 |
| | | | | | 214,624 |
Electric — 0.2%
| | | | | | |
MidAmerican Energy Co.
5.300% 2/01/55 | | | 20,000 | | | 20,672 |
Nevada Power Co.
6.650% 4/01/36 | | | 20,000 | | | 22,695 |
Xcel Energy, Inc.
6.500% 7/01/36 | | | 99,000 | | | 109,546 |
| | | | | | 152,913 |
Entertainment — 0.0%
| | | | | | |
Warnermedia Holdings, Inc.
5.141% 3/15/52 | | | 49,000 | | | 37,792 |
Environmental Controls — 0.0%
| | | | | | |
Republic Services, Inc.
5.000% 4/01/34 | | | 28,000 | | | 28,830 |
Food — 0.4%
| | | | | | |
Campbell Soup Co.
5.250% 10/13/54 (d) | | | 12,000 | | | 11,912 |
Conagra Brands, Inc.
4.850% 11/01/28 | | | 170,000 | | | 172,675 |
General Mills, Inc.
3.000% 2/01/51 | | | 112,000 | | | 77,623 |
Ingredion, Inc.
3.200% 10/01/26 | | | 25,000 | | | 24,495 |
The Kroger Co.
| | | | | | |
4.650% 9/15/29 | | | 54,000 | | | 54,298 |
5.000% 9/15/34 | | | 43,000 | | | 43,359 |
5.500% 9/15/54 | | | 26,000 | | | 26,166 |
Mars, Inc.
3.950% 4/01/49 (b) | | | 67,000 | | | 55,878 |
| | | | | | 466,406 |
Gas — 0.0%
| | | | | | |
Atmos Energy Corp.
5.000% 12/15/54 (d) | | | 13,000 | | | 12,697 |
Health Care – Services — 0.4%
| | | | | | |
Cigna Group
4.800% 7/15/46 | | | 27,000 | | | 25,281 |
| | | | | | | |
| | | | | |
| | | The accompanying notes are an integral part of the financial statements.
| |
56
| | | | |
| | | | | |
TABLE OF CONTENTS
| | MassMutual Balanced Fund — Portfolio of Investments (Continued) | |
| | | | | | | |
Kaiser Foundation Hospitals
| | | | | | |
2.810% 6/01/41 | | | $110,000 | | | $84,821 |
3.002% 6/01/51 | | | 80,000 | | | 57,365 |
Mayo Clinic
3.196% 11/15/61 | | | 106,000 | | | 76,305 |
Providence St. Joseph Health Obligated Group
2.700% 10/01/51 | | | 93,000 | | | 59,076 |
Quest Diagnostics, Inc.
6.400% 11/30/33 | | | 47,000 | | | 52,530 |
UnitedHealth Group, Inc.
| | | | | | |
3.125% 5/15/60 | | | 36,000 | | | 24,570 |
5.050% 4/15/53 | | | 20,000 | | | 19,853 |
5.875% 2/15/53 | | | 25,000 | | | 27,674 |
| | | | | | 427,475 |
Insurance — 0.8%
| | | | | | |
American International Group, Inc.
3 mo. USD LIBOR + 2.868%
5.750% VRN 4/01/48 | | | 104,000 | | | 104,328 |
Arch Capital Finance LLC
5.031% 12/15/46 | | | 27,000 | | | 25,934 |
Arch Capital Group Ltd.
3.635% 6/30/50 | | | 49,000 | | | 38,088 |
Athene Holding Ltd.
| | | | | | |
3.950% 5/25/51 | | | 16,000 | | | 12,296 |
6.250% 4/01/54 | | | 37,000 | | | 39,444 |
Brighthouse Financial, Inc.
3.850% 12/22/51 | | | 68,000 | | | 47,052 |
GA Global Funding Trust
1.625% 1/15/26 (b) | | | 37,000 | | | 35,618 |
Jackson Financial, Inc.
5.170% 6/08/27 | | | 78,000 | | | 79,190 |
Marsh & McLennan Cos., Inc.
| | | | | | |
5.450% 3/15/53 | | | 16,000 | | | 16,637 |
5.700% 9/15/53 | | | 42,000 | | | 45,146 |
New York Life Global Funding
4.550% 1/28/33 (b) | | | 47,000 | | | 47,200 |
New York Life Insurance Co.
3.750% 5/15/50 (b) | | | 23,000 | | | 18,433 |
Pacific Life Global Funding II
5.500% 8/28/26 (b) | | | 64,000 | | | 65,512 |
Prudential Financial, Inc.
| | | | | | |
5 yr. CMT + 3.035% 3.700% VRN 10/01/50 | | | 18,000 | | | 16,621 |
3 mo. USD LIBOR + 2.665% 5.700% VRN 9/15/48 | | | 99,000 | | | 100,231 |
Reinsurance Group of America, Inc.
| | | | | | |
3.150% 6/15/30 | | | 49,000 | | | 45,608 |
3.900% 5/15/29 | | | 54,000 | | | 52,706 |
| | | | | | | |
| | | | | | | |
USF&G Capital I
| | | | | | |
8.500% 12/15/45 (b) | | | $35,000 | | | $36,288 |
| | | | | | 826,332 |
Internet — 0.0%
| | | | | | |
Alphabet, Inc.
2.250% 8/15/60 | | | 32,000 | | | 19,746 |
Uber Technologies, Inc.
4.800% 9/15/34 | | | 22,000 | | | 21,969 |
| | | | | | 41,715 |
Investment Companies — 0.1%
| | | | | | |
Blackstone Secured Lending Fund
2.750% 9/16/26 | | | 158,000 | | | 150,979 |
Machinery – Diversified — 0.0%
| | | | | | |
AGCO Corp.
| | | | | | |
5.450% 3/21/27 | | | 18,000 | | | 18,366 |
5.800% 3/21/34 | | | 23,000 | | | 24,051 |
| | | | | | 42,417 |
Media — 0.2%
| | | | | | |
Charter Communications Operating LLC/Charter Communications Operating Capital
| | | | | | |
3.850% 4/01/61 | | | 46,000 | | | 28,214 |
6.484% 10/23/45 | | | 32,000 | | | 30,870 |
Comcast Corp.
| | | | | | |
2.937% 11/01/56 | | | 43,000 | | | 28,103 |
3.400% 7/15/46 | | | 41,000 | | | 31,727 |
3.969% 11/01/47 | | | 23,000 | | | 19,218 |
Discovery Communications LLC
3.950% 3/20/28 | | | 56,000 | | | 53,339 |
Time Warner Cable LLC
6.750% 6/15/39 | | | 27,000 | | | 27,039 |
| | | | | | 218,510 |
Oil & Gas — 0.1%
| | | | | | |
BP Capital Markets America, Inc.
3.379% 2/08/61 | | | 95,000 | | | 66,879 |
BP Capital Markets PLC 5 yr.
CMT + 4.036%
4.375% VRN (c) | | | 12,000 | | | 11,884 |
Occidental Petroleum Corp.
| | | | | | |
5.200% 8/01/29 | | | 18,000 | | | 18,299 |
5.550% 10/01/34 | | | 12,000 | | | 12,182 |
| | | | | | 109,244 |
Packaging & Containers — 0.3%
| | | | | | |
Berry Global, Inc.
1.570% 1/15/26 | | | 48,000 | | | 46,189 |
Silgan Holdings, Inc.
1.400% 4/01/26 (b) | | | 49,000 | | | 46,475 |
| | | | | | | |
| | | | | |
The accompanying notes are an integral part of the financial statements. | | | | |
| | | 57
| |
| | | | | |
TABLE OF CONTENTS
| | MassMutual Balanced Fund — Portfolio of Investments (Continued) | |
| | | | | | | |
WRKCo, Inc.
| | | | | | |
3.000% 6/15/33 | | | $27,000 | | | $23,713 |
4.650% 3/15/26 | | | 192,000 | | | 192,115 |
| | | | | | 308,492 |
Pharmaceuticals — 0.5%
| | | | | | |
AbbVie, Inc.
| | | | | | |
4.700% 5/14/45 | | | 67,000 | | | 64,834 |
5.050% 3/15/34 | | | 68,000 | | | 71,027 |
5.400% 3/15/54 | | | 45,000 | | | 47,716 |
Astrazeneca Finance LLC
5.000% 2/26/34 | | | 58,000 | | | 60,570 |
Bristol-Myers Squibb Co.
| | | | | | |
4.350% 11/15/47 | | | 27,000 | | | 24,172 |
6.250% 11/15/53 | | | 28,000 | | | 32,435 |
CVS Health Corp.
| | | | | | |
5.875% 6/01/53 | | | 17,000 | | | 17,300 |
6.125% 9/15/39 | | | 8,000 | | | 8,435 |
Eli Lilly & Co.
4.950% 2/27/63 | | | 33,000 | | | 33,007 |
Pfizer Investment Enterprises Pte. Ltd.
| | | | | | |
4.450% 5/19/28 | | | 93,000 | | | 94,380 |
4.750% 5/19/33 | | | 61,000 | | | 62,177 |
| | | | | | 516,053 |
Pipelines — 0.9%
| | | | | | |
Enterprise Products Operating LLC
| | | | | | |
3 mo. USD Term SOFR + 3.295% 5.250% VRN 8/16/77 | | | 41,000 | | | 40,442 |
3 mo. USD Term SOFR + 2.832% 5.375% VRN 2/15/78 | | | 27,000 | | | 25,794 |
Kinder Morgan, Inc.
3.250% 8/01/50 | | | 50,000 | | | 34,033 |
MPLX LP
| | | | | | |
1.750% 3/01/26 | | | 365,000 | | | 351,502 |
4.500% 4/15/38 | | | 27,000 | | | 24,957 |
5.650% 3/01/53 | | | 7,000 | | | 6,961 |
ONEOK, Inc.
| | | | | | |
6.350% 1/15/31 | | | 200,000 | | | 216,716 |
6.625% 9/01/53 | | | 46,000 | | | 51,043 |
Sabine Pass Liquefaction LLC
4.500% 5/15/30 | | | 100,000 | | | 99,735 |
Western Midstream Operating LP
5.450% 11/15/34 | | | 36,000 | | | 36,076 |
Williams Cos., Inc.
| | | | | | |
3.500% 10/15/51 | | | 45,000 | | | 32,687 |
5.800% 11/15/54 | | | 11,000 | | | 11,371 |
| | | | | | 931,317 |
Private Equity — 0.1%
| | | | | | |
Brookfield Finance, Inc.
3.900% 1/25/28 | | | 99,000 | | | 97,640 |
| | | | | | | |
| | | | | | | |
Real Estate — 0.1%
| | | | | | |
CBRE Services, Inc.
2.500% 4/01/31 | | | $121,000 | | | $105,666 |
Real Estate Investment Trusts (REITS) — 1.0%
| | | |
Alexandria Real Estate Equities, Inc.
| | | | | | |
2.950% 3/15/34 | | | 78,000 | | | 67,434 |
5.150% 4/15/53 | | | 20,000 | | | 19,133 |
American Tower Corp.
1.600% 4/15/26 | | | 96,000 | | | 91,980 |
Brixmor Operating Partnership LP
2.250% 4/01/28 | | | 24,000 | | | 22,129 |
Crown Castle, Inc.
| | | | | | |
2.500% 7/15/31 | | | 88,000 | | | 76,588 |
3.700% 6/15/26 | | | 243,000 | | | 240,042 |
5.200% 2/15/49 | | | 11,000 | | | 10,567 |
Extra Space Storage LP
2.350% 3/15/32 | | | 65,000 | | | 54,859 |
Host Hotels & Resorts LP
3.500% 9/15/30 | | | 84,000 | | | 77,902 |
Kimco Realty OP LLC
2.250% 12/01/31 | | | 58,000 | | | 49,446 |
Kite Realty Group LP
| | | | | | |
4.000% 10/01/26 | | | 110,000 | | | 108,500 |
4.950% 12/15/31 | | | 26,000 | | | 26,033 |
Mid-America Apartments LP
5.300% 2/15/32 | | | 68,000 | | | 70,756 |
NNN REIT, Inc.
5.600% 10/15/33 | | | 40,000 | | | 41,858 |
Prologis LP
4.875% 6/15/28 | | | 75,000 | | | 76,960 |
Public Storage Operating Co.
5.350% 8/01/53 | | | 14,000 | | | 14,472 |
Realty Income Corp.
4.850% 3/15/30 | | | 30,000 | | | 30,744 |
Regency Centers LP
5.250% 1/15/34 | | | 25,000 | | | 25,806 |
| | | | | | 1,105,209 |
Retail — 0.3%
| | | | | | |
Home Depot, Inc.
2.375% 3/15/51 | | | 48,000 | | | 30,131 |
McDonald’s Corp.
| | | | | | |
3.300% 7/01/25 | | | 100,000 | | | 99,048 |
5.450% 8/14/53 | | | 51,000 | | | 53,153 |
Starbucks Corp.
4.450% 8/15/49 | | | 86,000 | | | 76,331 |
Walmart, Inc.
4.500% 4/15/53 | | | 67,000 | | | 64,624 |
| | | | | | 323,287 |
| | | | | | | |
| | | | | |
| | | The accompanying notes are an integral part of the financial statements.
| |
58
| | | | |
| | | | | |
TABLE OF CONTENTS
| | MassMutual Balanced Fund — Portfolio of Investments (Continued) | |
| | | | | | | | |
Semiconductors — 0.2%
| | | | | | | |
Micron Technology, Inc.
| | | | | | | |
4.185% 2/15/27 | | | $200,000 | | | $199,457 | |
5.300% 1/15/31 | | | 33,000 | | | 34,289 | |
| | | | | | 233,746 | |
Software — 0.4%
| | | | | | | |
Electronic Arts, Inc.
2.950% 2/15/51 | | | 42,000 | | | 28,989 | |
Fiserv, Inc.
5.450% 3/15/34 | | | 86,000 | | | 89,883 | |
Intuit, Inc.
5.500% 9/15/53 | | | 48,000 | | | 51,591 | |
Microsoft Corp.
2.921% 3/17/52 | | | 80,000 | | | 58,735 | |
Oracle Corp.
| | | | | | | |
3.600% 4/01/40 | | | 197,000 | | | 163,901 | |
5.550% 2/06/53 | | | 15,000 | | | 15,350 | |
6.900% 11/09/52 | | | 53,000 | | | 63,885 | |
| | | | | | 472,334 | |
Telecommunications — 0.4%
| | | | | | | |
Cisco Systems, Inc.
5.050% 2/26/34 | | | 36,000 | | | 37,807 | |
T-Mobile USA, Inc.
| | | | | | | |
5.050% 7/15/33 | | | 80,000 | | | 81,999 | |
5.500% 1/15/55 | | | 36,000 | | | 37,292 | |
6.000% 6/15/54 | | | 16,000 | | | 17,629 | |
Verizon Communications, Inc.
| | | | | | | |
3.700% 3/22/61 | | | 47,000 | | | 35,570 | |
3.875% 2/08/29 | | | 180,000 | | | 177,578 | |
| | | | | | 387,875 | |
Transportation — 0.0%
| | | | | | | |
CSX Corp.
| | | | | | | |
4.750% 11/15/48 | | | 18,000 | | | 17,290 | |
TOTAL CORPORATE DEBT
(Cost $12,624,615) | | | | | | 11,756,053 | |
Non-U.S. Government Agency Obligations — 3.5%
| | | | |
Automobile Asset-Backed Securities — 0.7%
| | | | |
Avis Budget Rental Car Funding AESOP LLC, Series 2021-2A, Class A
1.660% 2/20/28 (b) | | | 150,000 | | | 141,073 | |
Enterprise Fleet Financing LLC, Series 2021-3, Class A3
1.220% 8/20/27 (b) | | | 234,000 | | | 228,161 | |
Fifth Third Auto Trust, Series 2023-1, Class A3
5.530% 8/15/28 | | | 131,000 | | | 132,855 | |
| | | | | | | | |
| | | | | | | |
Hyundai Auto Receivables Trust, Series 2021-C, Class A4
1.030% 12/15/27 | | | $140,000 | | | $136,150 |
Toyota Auto Receivables Owner Trust, Series 2021-D, Class A4
1.020% 3/15/27 | | | 70,000 | | | 67,501 |
| | | | | | 705,740 |
Commercial Mortgage-Backed Securities — 0.9%
| | | |
Bank
| | | | | | |
Series 2019-BN17, Class B, 4.128% VRN 4/15/52 (e) | | | 29,000 | | | 26,322 |
Series 2019-BN16, Class AS, 4.267% 2/15/52 | | | 31,333 | | | 29,598 |
Series 2019-BN16, Class B, 4.438% VRN 2/15/52 (e) | | | 24,330 | | | 22,627 |
BBCMS Mortgage Trust, Series 2020-C7, Class AS
2.444% 4/15/53 | | | 57,000 | | | 48,388 |
Benchmark Mortgage Trust, Series 2019-B9, Class AAB
3.933% 3/15/52 | | | 234,213 | | | 231,271 |
BX Commercial Mortgage Trust
| | | | | | |
Series 2021-VOLT, Class A, 1 mo. USD Term SOFR + 0.814% 5.911% FRN 9/15/36 (b) | | | 115,000 | | | 114,785 |
Series 2021-VOLT, Class C, 1 mo. USD Term SOFR + 1.214% 6.311% FRN 9/15/36 (b) | | | 100,000 | | | 98,651 |
Citigroup Commercial Mortgage Trust, Series 2017-C4, Class C,
4.285% VRN 10/12/50 (e) | | | 70,000 | | | 63,764 |
GS Mortgage Securities Trust, Series 2020-GC45, Class A5
2.911% 2/13/53 | | | 140,000 | | | 128,459 |
Life Mortgage Trust
| | | | | | |
Series 2021-BMR, Class A, 1 mo. USD Term SOFR + 0.814% 5.912% FRN 3/15/38 (b) | | | 79,313 | | | 77,926 |
Series 2021-BMR, Class B, 1 mo. USD Term SOFR + 0.994% 6.092% FRN 3/15/38 (b) | | | 79,313 | | | 77,891 |
Morgan Stanley Capital I Trust, Series 2018-H3, Class B,
4.620% VRN 7/15/51 (e) | | | 20,000 | | | 18,976 |
Wells Fargo Commercial Mortgage Trust
| | | | | | |
Series 2018-C45, Class AS, 4.405% VRN 6/15/51 (e) | | | 30,000 | | | 28,709 |
Series 2018-C45, Class B, 4.556% 6/16/51 | | | 10,000 | | | 9,436 |
| | | | | | 976,803 |
| | | | | | | |
| | | | | |
The accompanying notes are an integral part of the financial statements. | | | | |
| | | 59
| |
| | | | | |
TABLE OF CONTENTS
| | MassMutual Balanced Fund — Portfolio of Investments (Continued) | |
| | | | | | | |
Other Asset-Backed Securities — 0.4%
| | | |
AMSR Trust, Series 2021-SFR3, Class B
1.726% 10/17/38 (b) | | | $130,000 | | | $121,563 |
Dllmt LLC, Series 2021-1A, Class A4
1.240% 6/20/29 (b) | | | 150,000 | | | 147,260 |
MVW LLC, Series 2021-2A, Class A
1.430% 5/20/39 (b) | | | 110,836 | | | 104,450 |
Progress Residential Trust, Series 2021-SFR10, Class A
2.393% 12/17/40 (b) | | | 94,066 | | | 86,382 |
| | | | | | 459,655 |
Whole Loan Collateral Collateralized
Mortgage Obligations — 1.5%
|
Angel Oak Mortgage Trust
| | | | | | |
Series 2021-8, Class A1, 1.820% VRN 11/25/66 (b) (e) | | | 188,549 | | | 169,027 |
Series 2022-1, Class A1, 2.881% STEP 12/25/66 (b) | | | 209,355 | | | 196,631 |
Bayview MSR Opportunity Master Fund Trust
| | | | | | |
Series 2021-5, Class A2, 2.500% VRN 11/25/51 (b) (e) | | | 118,106 | | | 99,334 |
Series 2021-5, Class A1, 3.000% VRN 11/25/51 (b) (e) | | | 96,859 | | | 84,688 |
Ellington Financial Mortgage Trust, Series 2022-3, Class A1,
5.000% STEP 8/25/67 (b) | | | 187,393 | | | 190,022 |
Flagstar Mortgage Trust, Series
2021-11IN, Class A6,
2.500% VRN 11/25/51 (b) (e) | | | 197,356 | | | 176,884 |
JP Morgan Mortgage Trust, Series 2022-8, Class A4A,
4.000% VRN 1/25/53 (b) (e) | | | 132,038 | | | 125,750 |
OBX Trust, Series 2022-NQM1, Class A1,
2.305% VRN 11/25/61 (b) (e) | | | 190,946 | | | 171,175 |
Starwood Mortgage Residential Trust
| | | | | | |
Series 2021-6, Class A1, 1.920% VRN 11/25/66 (b) (e) | | | 212,590 | | | 185,555 |
Series 2022-1, Class A1, 2.447% VRN 12/25/66 (b) (e) | | | 232,007 | | | 208,138 |
| | | | | | 1,607,204 |
TOTAL NON-U.S. GOVERNMENT AGENCY OBLIGATIONS
(Cost $4,035,327) | | | | | | 3,749,402 |
| | | | | | | |
| | | | | | | | |
U.S. Government Agency Obligations and Instrumentalities (f) — 9.9%
| | | | |
Pass-Through Securities — 9.9%
| | | | | | | |
Federal Home Loan Mortgage Corp.
| | | | | | | |
Pool #SD8212 2.500% 5/01/52 | | | $698,261 | | | $603,268 | |
Pool #SD8174 3.000% 10/01/51 | | | 366,957 | | | 330,689 | |
Pool #SD8242 3.000% 9/01/52 | | | 417,862 | | | 375,199 | |
Pool #RA7484 4.000% 6/01/52 | | | 405,687 | | | 390,094 | |
Pool #SD1351 4.500% 7/01/52 | | | 349,933 | | | 345,200 | |
Pool #SD1628 5.000% 9/01/52 | | | 370,675 | | | 372,240 | |
Pool #SD3386 5.500% 7/01/53 | | | 284,393 | | | 288,091 | |
Pool #SD5060 5.500% 3/01/54 | | | 282,931 | | | 287,583 | |
Federal National Mortgage Association
| | | | | | | |
Pool #MA4437 2.000% 10/01/51 | | | 458,505 | | | 380,155 | |
Pool #CB1787 2.000% 10/01/51 | | | 452,737 | | | 375,372 | |
Pool #CB1782 2.000% 10/01/51 | | | 695,465 | | | 577,927 | |
Pool #MA4562 2.000% 3/01/52 | | | 437,317 | | | 362,178 | |
Pool #MA4361 2.500% 6/01/36 | | | 245,012 | | | 230,152 | |
Pool #CB2074 2.500% 11/01/51 | | | 351,078 | | | 305,181 | |
Pool #FS2635 2.500% 5/01/52 | | | 420,953 | | | 366,974 | |
Pool #BO7245 3.000% 1/01/50 | | | 253,928 | | | 230,462 | |
Pool #FS2600 3.000% 5/01/52 | | | 435,342 | | | 394,465 | |
Pool #BU8819 3.500% 5/01/52 | | | 432,596 | | | 404,892 | |
Pool #CB4891 4.500% 10/01/52 | | | 93,791 | | | 92,288 | |
Pool #CB4404 5.000% 8/01/52 | | | 348,762 | | | 350,126 | |
Pool #CB7100 5.000% 9/01/53 | | | 192,924 | | | 192,955 | |
Pool #CB7859 5.500% 1/01/54 | | | 570,460 | | | 577,878 | |
Government National Mortgage Association II, TBA
6.000% 10/20/54 (d) | | | 375,000 | | | 381,295 | |
Uniform Mortgage-Backed Security, TBA
| | | | | | | |
2.000% 10/01/39 (d) | | | 1,500,000 | | | 1,372,559 | |
3.000% 10/01/54 (d) | | | 200,000 | | | 179,500 | |
3.500% 10/01/54 (d) | | | 500,000 | | | 465,762 | |
6.000% 10/01/54 (d) | | | 375,000 | | | 383,218 | |
| | | | | | 10,615,703 | |
TOTAL U.S. GOVERNMENT AGENCY OBLIGATIONS AND INSTRUMENTALITIES
(Cost $10,935,049) | | | | | | 10,615,703 | |
U.S. Treasury Obligations — 11.5%
| | | | | | |
U.S. Treasury Bonds & Notes — 11.5%
| | | | | | |
U.S. Treasury Bonds
| | | | | | | |
2.250% 8/15/49 | | | 839,900 | | | 581,644 | |
4.125% 8/15/44 | | | 1,369,200 | | | 1,358,499 | |
4.625% 5/15/54 | | | 840,600 | | | 911,806 | |
4.750% 11/15/43 | | | 100,000 | | | 107,875 | |
| | | | | | | | |
| | | | | |
| | | The accompanying notes are an integral part of the financial statements.
| |
60
| | | | |
| | | | | |
TABLE OF CONTENTS
| | MassMutual Balanced Fund — Portfolio of Investments (Continued) | |
| | | | | | | |
U.S. Treasury Notes
| | | | | | |
2.750% 4/30/27 | | | $963,000 | | | $943,257 |
2.875% 4/30/29 | | | 1,050,000 | | | 1,018,816 |
3.375% 9/15/27 | | | 1,194,400 | | | 1,188,334 |
3.500% 9/30/26 | | | 729,600 | | | 727,549 |
3.500% 9/30/29 | | | 786,500 | | | 784,164 |
3.500% 2/15/33 | | | 285,000 | | | 280,034 |
3.625% 9/30/31 | | | 1,069,400 | | | 1,067,395 |
3.875% 8/15/34 | | | 1,589,100 | | | 1,600,279 |
4.250% 2/28/31 | | | 127,000 | | | 131,333 |
4.500% 11/15/33 | | | 431,000 | | | 455,246 |
4.625% 9/30/30 | | | 1,175,000 | | | 1,237,503 |
| | | | | | 12,393,734 |
TOTAL U.S. TREASURY OBLIGATIONS
(Cost $12,636,912) | | | | | | $12,393,734 |
TOTAL BONDS & NOTES
(Cost $40,231,903) | | | | | | 38,514,892 |
TOTAL LONG-TERM INVESTMENTS
(Cost $93,962,913) | | | | | | 108,035,058 |
Short-Term Investments — 2.1%
| | | |
Repurchase Agreement — 2.1%
| | | | | | |
Fixed Income Clearing Corp., Repurchase Agreement, dated 9/30/24, 1.520%, due 10/01/24 (g) | | | 2,265,961 | | | 2,265,961 |
U.S. Treasury Bill — 0.0%
| | | | | | |
U.S. Treasury Bill
| | | | | | |
4.845% 1/30/25 (h) (i) | | | 37,000 | | | 36,460 |
TOTAL SHORT-TERM INVESTMENTS
(Cost $2,302,378) | | | | | | 2,302,421 |
TOTAL INVESTMENTS — 102.5%
(Cost $96,265,291) (j) | | | | | | 110,337,479 |
Other Assets/(Liabilities) — (2.5)% | | | | | | (2,718,914) |
NET ASSETS — 100.0% | | | | | | $107,618,565 |
| | | | | | | |
Abbreviation Legend
| | | | | |
ADR | | | American Depositary Receipt | |
CMT | | | Constant Maturity Treasury Index | |
FRN | | | Floating Rate Note | |
LIBOR | | | London InterBank Offered Rate | |
SOFR | | | Secured Overnight Financing Rate | |
STEP | | | Step Coupon Bond | |
TBA | | | To Be Announced | |
VRN | | | Variable Rate Note | |
| | | | | |
Notes to Portfolio of Investments
Percentages are stated as a percent of net assets.
(a)
| Non-income producing security. |
(b)
| Security is exempt from registration under Regulation S or Rule 144A of the Securities Act of 1933. These securities are considered restricted and may be resold in transactions exempt from registration. At September 30, 2024, the aggregate market value of these securities amounted to $3,709,245 or 3.45% of net assets. |
(c)
| Security is perpetual and has no stated maturity date.
|
(d)
| A portion of this security is purchased on a when-issued, delayed-delivery or forward commitment basis. (Note 2).
|
(e)
| Certain variable rate securities are not based on a published reference rate and spread but are determined by the issuer or agent and are based on current market conditions. These securities do not indicate a reference rate and spread in their description above. The rates shown are the current interest rates at September 30, 2024.
|
(f)
| May contain securities that are issued by a U.S. Government Agency, but are unsecured and are not guaranteed by a U.S. Government Agency.
|
(g)
| Maturity value of $2,266,056. Collateralized by U.S. Government Agency obligations with a rate of 4.875%, maturity date of 4/30/26, and an aggregate market value, including accrued interest, of $2,311,343.
|
(h)
| The rate shown represents yield-to-maturity.
|
(i)
| All or a portion of this security is pledged/held as collateral for open derivatives. (Note 2). |
(j)
| See Note 6 for aggregate cost for federal tax purposes. |
| | | | | |
The accompanying notes are an integral part of the financial statements. | | | | |
| | | 61
| |
| | | | | |
TABLE OF CONTENTS
| | MassMutual Balanced Fund — Portfolio of Investments (Continued) | |
Futures contracts
| | | | | | | | | | | | | |
Long | | | | | | | | | | | | |
U.S. Treasury Note 2 Year | | | 12/31/24 | | | 4 | | | $831,695 | | | $ 1,274 |
U.S. Treasury Note 5 Year | | | 12/31/24 | | | 7 | | | 768,593 | | | 587 |
| | | | | | | | | | | | $1,861 |
Short
| | | | | | | | | | | | |
U.S. Treasury Note 10 Year | | | 12/19/24 | | | 5 | | | $(570,887) | | | $(519) |
U.S. Treasury Ultra 10 Year | | | 12/19/24 | | | 9 | | | (1,064,934) | | | 262 |
| | | | | | | | | | | | $(257) |
| | | | | | | | | | | | | |
| | | | | |
| | | The accompanying notes are an integral part of the financial statements.
| |
62
| | | | |
| | | | | |
TABLE OF CONTENTS
| | | |
| | MassMutual Disciplined Value Fund — Portfolio of Investments | |
| | | |
| | | | | | | |
Equities — 99.4%
| | | | | | |
Common Stock — 99.4%
| | | | | | |
Communication Services — 4.8%
| | | | | | |
Comcast Corp. Class A | | | 15,178 | | | $633,985 |
Fox Corp. Class A | | | 10,809 | | | 457,545 |
Omnicom Group, Inc. | | | 2,017 | | | 208,538 |
Paramount Global Class B | | | 7,735 | | | 82,146 |
Roku, Inc. (a) | | | 564 | | | 42,108 |
Walt Disney Co. | | | 3,473 | | | 334,068 |
Warner Bros Discovery, Inc. (a) | | | 13,562 | | | 111,886 |
| | | | | | 1,870,276 |
Consumer Discretionary — 6.7%
| | | | | | |
Aptiv PLC (a) | | | 1,371 | | | 98,726 |
BorgWarner, Inc. | | | 1,118 | | | 40,572 |
DR Horton, Inc. | | | 1,267 | | | 241,706 |
Ford Motor Co. | | | 6,050 | | | 63,888 |
General Motors Co. | | | 4,328 | | | 194,068 |
Gentex Corp. | | | 1,047 | | | 31,085 |
Genuine Parts Co. | | | 1,587 | | | 221,672 |
McDonald’s Corp. | | | 1,645 | | | 500,919 |
NVR, Inc. (a) | | | 33 | | | 323,789 |
Polaris, Inc. | | | 1,536 | | | 127,857 |
PulteGroup, Inc. | | | 2,448 | | | 351,362 |
Tapestry, Inc. | | | 2,678 | | | 125,812 |
TopBuild Corp. (a) | | | 598 | | | 243,272 |
YETI Holdings, Inc. (a) | | | 1,203 | | | 49,359 |
| | | | | | 2,614,087 |
Consumer Staples — 8.9%
| | | | | | |
BellRing Brands, Inc. (a) | | | 4,141 | | | 251,442 |
Campbell Soup Co. | | | 2,815 | | | 137,710 |
Church & Dwight Co., Inc. | | | 530 | | | 55,502 |
Colgate-Palmolive Co. | | | 1,220 | | | 126,648 |
General Mills, Inc. | | | 1,171 | | | 86,478 |
Hershey Co. | | | 223 | | | 42,767 |
J.M. Smucker Co. | | | 564 | | | 68,300 |
Kimberly-Clark Corp. | | | 1,044 | | | 148,540 |
Kraft Heinz Co. | | | 6,350 | | | 222,948 |
Lamb Weston Holdings, Inc. | | | 1,225 | | | 79,307 |
Mondelez International, Inc. Class A | | | 2,010 | | | 148,077 |
PepsiCo, Inc. | | | 2,331 | | | 396,387 |
Philip Morris International, Inc. | | | 995 | | | 120,793 |
Pilgrim’s Pride Corp. (a) | | | 2,453 | | | 112,961 |
Procter & Gamble Co. | | | 2,754 | | | 476,993 |
Walgreens Boots Alliance, Inc. | | | 3,041 | | | 27,247 |
Walmart, Inc. | | | 11,854 | | | 957,210 |
| | | | | | 3,459,310 |
| | | | | | | |
| | | | | | | |
Energy — 5.6%
| | | | | | |
APA Corp. | | | 2,381 | | | $58,239 |
Chevron Corp. | | | 2,940 | | | 432,974 |
ConocoPhillips | | | 1,076 | | | 113,281 |
Coterra Energy, Inc. | | | 1,940 | | | 46,463 |
Devon Energy Corp. | | | 1,148 | | | 44,910 |
Exxon Mobil Corp. | | | 7,677 | | | 899,898 |
HF Sinclair Corp. | | | 668 | | | 29,773 |
Marathon Petroleum Corp. | | | 822 | | | 133,912 |
Matador Resources Co. | | | 2,421 | | | 119,646 |
ONEOK, Inc. | | | 994 | | | 90,583 |
Ovintiv, Inc. | | | 2,595 | | | 99,414 |
Valero Energy Corp. | | | 949 | | | 128,144 |
| | | | | | 2,197,237 |
Financials — 24.4%
| | | | | | |
Affiliated Managers Group, Inc. | | | 1,044 | | | 185,623 |
Aflac, Inc. | | | 4,676 | | | 522,777 |
Aon PLC Class A | | | 458 | | | 158,463 |
Arthur J Gallagher & Co. | | | 1,419 | | | 399,264 |
Assurant, Inc. | | | 362 | | | 71,987 |
Bank of America Corp. | | | 7,724 | | | 306,488 |
Bank of New York Mellon Corp. | | | 7,004 | | | 503,307 |
Bank OZK | | | 4,379 | | | 188,253 |
Berkshire Hathaway, Inc. Class B (a) | | | 3,665 | | | 1,686,853 |
BlackRock, Inc. | | | 677 | | | 642,818 |
Block, Inc. (a) | | | 1,212 | | | 81,362 |
Brown & Brown, Inc. | | | 4,158 | | | 430,769 |
Cboe Global Markets, Inc. | | | 1,554 | | | 318,368 |
Citigroup, Inc. | | | 1,265 | | | 79,189 |
CME Group, Inc. | | | 2,350 | | | 518,528 |
Coinbase Global, Inc. Class A (a) | | | 151 | | | 26,904 |
East West Bancorp, Inc. | | | 1,359 | | | 112,444 |
First Citizens BancShares, Inc.
Class A | | | 22 | | | 40,501 |
Global Payments, Inc. | | | 696 | | | 71,284 |
Globe Life, Inc. | | | 1,087 | | | 115,124 |
Interactive Brokers Group, Inc.
Class A | | | 473 | | | 65,917 |
Janus Henderson Group PLC | | | 5,631 | | | 214,372 |
JP Morgan Chase & Co. | | | 5,741 | | | 1,210,547 |
MGIC Investment Corp. | | | 5,843 | | | 149,581 |
Progressive Corp. | | | 1,580 | | | 400,941 |
State Street Corp. | | | 3,514 | | | 310,884 |
Synchrony Financial | | | 3,523 | | | 175,727 |
T. Rowe Price Group, Inc. | | | 3,429 | | | 373,521 |
Tradeweb Markets, Inc. Class A | | | 351 | | | 43,408 |
| | | | | | | |
| | | | | |
The accompanying notes are an integral part of the financial statements. | | | | |
| | | 63
| |
| | | | | |
TABLE OF CONTENTS
| | MassMutual Disciplined Value Fund — Portfolio of Investments (Continued) | |
| | | | | | | |
Wells Fargo & Co. | | | 1,271 | | | $71,799 |
Western Union Co. | | | 4,958 | | | 59,149 |
| | | | | | 9,536,152 |
Health Care — 15.8%
| | | | | | |
Amgen, Inc. | | | 1,006 | | | 324,143 |
Bio-Rad Laboratories, Inc.
Class A (a) | | | 699 | | | 233,871 |
Cardinal Health, Inc. | | | 407 | | | 44,982 |
The Cooper Cos., Inc. (a) | | | 1,438 | | | 158,669 |
Elevance Health, Inc. | | | 874 | | | 454,480 |
Exelixis, Inc. (a) | | | 11,267 | | | 292,379 |
Gilead Sciences, Inc. | | | 3,722 | | | 312,053 |
Globus Medical, Inc. Class A (a) | | | 818 | | | 58,520 |
Hologic, Inc. (a) | | | 638 | | | 51,971 |
Illumina, Inc. (a) | | | 1,886 | | | 245,953 |
Incyte Corp. (a) | | | 3,172 | | | 209,669 |
Jazz Pharmaceuticals PLC (a) | | | 3,400 | | | 378,794 |
Johnson & Johnson | | | 6,094 | | | 987,594 |
McKesson Corp. | | | 87 | | | 43,015 |
Medtronic PLC | | | 3,747 | | | 337,342 |
Molina Healthcare, Inc. (a) | | | 297 | | | 102,334 |
Organon & Co. | | | 1,734 | | | 33,171 |
ResMed, Inc. | | | 1,553 | | | 379,118 |
Stryker Corp. | | | 914 | | | 330,192 |
United Therapeutics Corp. (a) | | | 858 | | | 307,464 |
UnitedHealth Group, Inc. | | | 1,116 | | | 652,503 |
Zimmer Biomet Holdings, Inc. | | | 2,061 | | | 222,485 |
| | | | | | 6,160,702 |
Industrials — 11.5%
| | | | | | |
Acuity Brands, Inc. | | | 199 | | | 54,802 |
Allison Transmission Holdings, Inc. | | | 1,258 | | | 120,856 |
AMETEK, Inc. | | | 263 | | | 45,160 |
Caterpillar, Inc. | | | 997 | | | 389,947 |
Cummins, Inc. | | | 249 | | | 80,624 |
Curtiss-Wright Corp. | | | 1,035 | | | 340,194 |
Eaton Corp. PLC | | | 1,328 | | | 440,152 |
EMCOR Group, Inc. | | | 1,023 | | | 440,432 |
Emerson Electric Co. | | | 2,067 | | | 226,068 |
General Dynamics Corp. | | | 365 | | | 110,303 |
Honeywell International, Inc. | | | 433 | | | 89,505 |
Hubbell, Inc. | | | 708 | | | 303,272 |
Leidos Holdings, Inc. | | | 394 | | | 64,222 |
Middleby Corp. (a) | | | 588 | | | 81,808 |
MSA Safety, Inc. | | | 352 | | | 62,424 |
nVent Electric PLC | | | 1,754 | | | 123,236 |
Oshkosh Corp. | | | 1,325 | | | 132,778 |
PACCAR, Inc. | | | 3,913 | | | 386,135 |
RTX Corp. | | | 2,223 | | | 269,339 |
Snap-on, Inc. | | | 1,069 | | | 309,700 |
| | | | | | | |
| | | | | | | |
TransDigm Group, Inc. | | | 113 | | | $161,266 |
United Rentals, Inc. | | | 276 | | | 223,485 |
Westinghouse Air Brake Technologies Corp. | | | 226 | | | 41,080 |
| | | | | | 4,496,788 |
Information Technology — 8.8%
| | | | | | |
Accenture PLC Class A | | | 554 | | | 195,828 |
Amdocs Ltd. | | | 2,022 | | | 176,885 |
Applied Materials, Inc. | | | 1,587 | | | 320,653 |
Arrow Electronics, Inc. (a) | | | 295 | | | 39,185 |
Cognizant Technology Solutions Corp. Class A | | | 3,118 | | | 240,647 |
Dell Technologies, Inc. Class C | | | 942 | | | 111,665 |
F5, Inc. (a) | | | 349 | | | 76,850 |
First Solar, Inc. (a) | | | 158 | | | 39,412 |
Hewlett Packard Enterprise Co. | | | 12,459 | | | 254,911 |
HP, Inc. | | | 6,756 | | | 242,338 |
Intel Corp. | | | 6,526 | | | 153,100 |
International Business Machines Corp. | | | 1,679 | | | 371,193 |
Micron Technology, Inc. | | | 2,641 | | | 273,898 |
Roper Technologies, Inc. | | | 786 | | | 437,362 |
TD SYNNEX Corp. | | | 2,318 | | | 278,345 |
Western Digital Corp. (a) | | | 1,993 | | | 136,102 |
Zoom Video Communications, Inc. Class A (a) | | | 895 | | | 62,417 |
| | | | | | 3,410,791 |
Materials — 4.2%
| | | | | | |
AptarGroup, Inc. | | | 1,270 | | | 203,441 |
Ecolab, Inc. | | | 1,204 | | | 307,417 |
LyondellBasell Industries NV
Class A | | | 990 | | | 94,941 |
Mosaic Co. | | | 2,318 | | | 62,076 |
Newmont Corp. (NEM US) | | | 3,662 | | | 195,734 |
Packaging Corp. of America | | | 551 | | | 118,686 |
PPG Industries, Inc. | | | 3,199 | | | 423,740 |
RPM International, Inc. | | | 1,618 | | | 195,778 |
Steel Dynamics, Inc. | | | 353 | | | 44,506 |
| | | | | | 1,646,319 |
Real Estate — 7.1%
| | | | | | |
Agree Realty Corp. (b) | | | 5,862 | | | 441,584 |
Brixmor Property Group, Inc. | | | 6,082 | | | 169,445 |
Healthcare Realty Trust, Inc. | | | 6,018 | | | 109,227 |
Highwoods Properties, Inc. | | | 2,240 | | | 75,062 |
Kimco Realty Corp. | | | 7,782 | | | 180,698 |
Mid-America Apartment Communities, Inc. | | | 2,671 | | | 424,422 |
Omega Healthcare Investors, Inc. | | | 1,148 | | | 46,724 |
Realty Income Corp. | | | 7,795 | | | 494,359 |
SBA Communications Corp. | | | 2,019 | | | 485,973 |
| | | | | | | |
| | | | | |
| | | The accompanying notes are an integral part of the financial statements.
| |
64
| | | | |
| | | | | |
TABLE OF CONTENTS
| | MassMutual Disciplined Value Fund — Portfolio of Investments (Continued) | |
| | | | | | | |
STAG Industrial, Inc. | | | 7,849 | | | $306,817 |
WP Carey, Inc. | | | 645 | | | 40,184 |
| | | | | | 2,774,495 |
Utilities — 1.6%
| | | | | | |
Constellation Energy Corp. | | | 1,299 | | | 337,766 |
National Fuel Gas Co. | | | 4,511 | | | 273,412 |
| | | | | | 611,178 |
TOTAL COMMON STOCK
(Cost $32,015,902) | | | | | | 38,777,335 |
TOTAL EQUITIES
(Cost $32,015,902) | | | | | | 38,777,335 |
TOTAL LONG-TERM INVESTMENTS
(Cost $32,015,902) | | | | | | 38,777,335 |
Short-Term Investments — 1.1%
|
Investment of Cash Collateral from
Securities Loaned — 1.1%
|
State Street Navigator Securities Lending Government Money
Market Portfolio (c) | | | 446,831 | | | 446,831 |
TOTAL SHORT-TERM INVESTMENTS
(Cost $446,831) | | | | | | 446,831 |
TOTAL INVESTMENTS — 100.5%
(Cost $32,462,733) (d) | | | | | | 39,224,166 |
Other Assets/(Liabilities) — (0.5)% | | | | | | (195,277) |
NET ASSETS — 100.0% | | | | | | $39,028,889 |
| | | | | | | |
Notes to Portfolio of Investments
Percentages are stated as a percent of net assets.
(a)
| Non-income producing security.
|
(b)
| Denotes all or a portion of security on loan. The total value of securities on loan as of September 30, 2024, was $437,140 or 1.12% of net assets. (Note 2).
|
(c)
| Represents investment of security lending cash collateral. (Note 2).
|
(d)
| See Note 6 for aggregate cost for federal tax purposes. |
| | | | | |
The accompanying notes are an integral part of the financial statements. | | | | |
| | | 65
| |
| | | | | |
TABLE OF CONTENTS
| | | |
| | MassMutual Disciplined Growth Fund — Portfolio of Investments | |
| | | |
| | | | | | | |
Equities — 99.2%
| | | | | | |
Common Stock — 99.2%
| | | | | | |
Communication Services — 13.7%
| | | | | | |
Alphabet, Inc. Class A | | | 47,638 | | | $7,900,762 |
Alphabet, Inc. Class C | | | 40,673 | | | 6,800,119 |
Meta Platforms, Inc. Class A | | | 16,646 | | | 9,528,836 |
Netflix, Inc. (a) | | | 2,502 | | | 1,774,594 |
Spotify Technology SA (a) | | | 2,544 | | | 937,540 |
| | | | | | 26,941,851 |
Consumer Discretionary — 13.4%
| | | | | | |
Airbnb, Inc. Class A (a) | | | 1,418 | | | 179,817 |
Amazon.com, Inc. (a) | | | 74,971 | | | 13,969,346 |
AutoZone, Inc. (a) | | | 166 | | | 522,907 |
Booking Holdings, Inc. | | | 22 | | | 92,667 |
Carvana Co. (a) | | | 138 | | | 24,027 |
Deckers Outdoor Corp. (a) | | | 6,159 | | | 982,053 |
Duolingo, Inc. (a) | | | 589 | | | 166,110 |
Grand Canyon Education, Inc. (a) | | | 2,781 | | | 394,485 |
Home Depot, Inc. | | | 3,291 | | | 1,333,513 |
Lululemon Athletica, Inc. (a) | | | 6,109 | | | 1,657,677 |
SharkNinja, Inc. | | | 6,758 | | | 734,662 |
Tesla, Inc. (a) | | | 14,311 | | | 3,744,187 |
TopBuild Corp. (a) | | | 1,346 | | | 547,566 |
Ulta Beauty, Inc. (a) | | | 1,394 | | | 542,433 |
Wingstop, Inc. | | | 2,205 | | | 917,456 |
YETI Holdings, Inc. (a) | | | 16,383 | | | 672,195 |
| | | | | | 26,481,101 |
Consumer Staples — 2.5%
| | | | | | |
Colgate-Palmolive Co. | | | 1,799 | | | 186,754 |
Costco Wholesale Corp. | | | 1,625 | | | 1,440,595 |
elf Beauty, Inc. (a) | | | 1,753 | | | 191,130 |
Monster Beverage Corp. (a) | | | 13,711 | | | 715,303 |
PepsiCo, Inc. | | | 14,003 | | | 2,381,210 |
| | | | | | 4,914,992 |
Energy — 0.0%
| | | | | | |
Matador Resources Co. | | | 1,320 | | | 65,234 |
Financials — 9.1%
| | | | | | |
Arthur J Gallagher & Co. | | | 1,749 | | | 492,116 |
Block, Inc. (a) | | | 1,165 | | | 78,207 |
Brown & Brown, Inc. | | | 19,309 | | | 2,000,412 |
Coinbase Global, Inc. Class A (a) | | | 671 | | | 119,552 |
Corpay, Inc. (a) | | | 2,308 | | | 721,850 |
Fiserv, Inc. (a) | | | 8,105 | | | 1,456,063 |
Mastercard, Inc. Class A | | | 9,801 | | | 4,839,734 |
Moody’s Corp. | | | 677 | | | 321,298 |
NU Holdings Ltd. Class A (a) | | | 12,299 | | | 167,881 |
| | | | | | | |
| | | | | | | |
Progressive Corp. | | | 7,874 | | | $1,998,106 |
Toast, Inc., Class A (a) (b) | | | 7,118 | | | 201,511 |
Tradeweb Markets, Inc. Class A | | | 3,409 | | | 421,591 |
Visa, Inc. Class A | | | 18,366 | | | 5,049,732 |
| | | | | | 17,868,053 |
Health Care — 8.1%
| | | | | | |
Apellis Pharmaceuticals, Inc. (a) | | | 2,697 | | | 77,781 |
Cencora, Inc. | | | 3,961 | | | 891,542 |
Chemed Corp. | | | 890 | | | 534,863 |
Elevance Health, Inc. | | | 1,392 | | | 723,840 |
Eli Lilly & Co. | | | 6,007 | | | 5,321,842 |
Exelixis, Inc. (a) | | | 25,798 | | | 669,458 |
Incyte Corp. (a) | | | 4,045 | | | 267,375 |
Medpace Holdings, Inc. (a) | | | 735 | | | 245,343 |
Merck & Co., Inc. | | | 28,691 | | | 3,258,150 |
Molina Healthcare, Inc. (a) | | | 2,695 | | | 928,589 |
Neurocrine Biosciences, Inc. (a) | | | 5,464 | | | 629,562 |
Regeneron Pharmaceuticals, Inc. (a) | | | 261 | | | 274,374 |
ResMed, Inc. | | | 8,870 | | | 2,165,344 |
| | | | | | 15,988,063 |
Industrials — 4.4%
| | | | | | |
Automatic Data Processing, Inc. | | | 708 | | | 195,925 |
Booz Allen Hamilton Holding Corp. | | | 961 | | | 156,412 |
Comfort Systems USA, Inc. | | | 5,850 | | | 2,283,547 |
Copart, Inc. (a) | | | 18,737 | | | 981,819 |
EMCOR Group, Inc. | | | 5,240 | | | 2,255,977 |
HEICO Corp. | | | 100 | | | 26,148 |
Illinois Tool Works, Inc. | | | 2,851 | | | 747,162 |
Paychex, Inc. | | | 6,439 | | | 864,049 |
Paycom Software, Inc. | | | 3,902 | | | 649,956 |
United Rentals, Inc. | | | 161 | | | 130,367 |
Vertiv Holdings Co. Class A | | | 4,149 | | | 412,784 |
| | | | | | 8,704,146 |
Information Technology — 48.0%
| | | | | | |
Adobe, Inc. (a) | | | 3,211 | | | 1,662,592 |
Advanced Micro Devices, Inc. (a) | | | 4,886 | | | 801,695 |
Amphenol Corp. Class A | | | 20,428 | | | 1,331,088 |
Appfolio, Inc. Class A (a) | | | 1,984 | | | 467,034 |
Apple, Inc. | | | 103,318 | | | 24,073,094 |
Applied Materials, Inc. | | | 6,211 | | | 1,254,933 |
AppLovin Corp. Class A (a) | | | 3,813 | | | 497,787 |
Arista Networks, Inc. (a) | | | 4,790 | | | 1,838,498 |
Astera Labs, Inc. (a) | | | 2,309 | | | 120,969 |
Broadcom, Inc. | | | 36,565 | | | 6,307,462 |
Cadence Design Systems, Inc. (a) | | | 2,388 | | | 647,220 |
Dell Technologies, Inc. Class C | | | 1,874 | | | 222,144 |
Dynatrace, Inc. (a) | | | 13,576 | | | 725,909 |
Fortinet, Inc. (a) | | | 16,709 | | | 1,295,783 |
| | | | | | | |
| | | | | |
| | | The accompanying notes are an integral part of the financial statements.
| |
66
| | | | |
| | | | | |
TABLE OF CONTENTS
| | MassMutual Disciplined Growth Fund — Portfolio of Investments (Continued) | |
| | | | | | | |
GoDaddy, Inc. Class A (a) | | | 6,528 | | | $1,023,460 |
Intuit, Inc. | | | 2,210 | | | 1,372,410 |
KLA Corp. | | | 2,114 | | | 1,637,103 |
Manhattan Associates, Inc. (a) | | | 3,159 | | | 888,879 |
Microsoft Corp. | | | 53,644 | | | 23,083,013 |
NVIDIA Corp. | | | 185,310 | | | 22,504,046 |
QUALCOMM, Inc. | | | 3,301 | | | 561,335 |
Salesforce, Inc. | | | 4,450 | | | 1,218,009 |
Super Micro Computer, Inc. (a) (b) | | | 866 | | | 360,602 |
Synopsys, Inc. (a) | | | 1,691 | | | 856,305 |
| | | | | | 94,751,370 |
TOTAL COMMON STOCK
(Cost $144,997,843) | | | | | | 195,714,810 |
TOTAL EQUITIES
(Cost $144,997,843) | | | | | | 195,714,810 |
TOTAL LONG-TERM INVESTMENTS
(Cost $144,997,843) | | | | | | 195,714,810 |
| | | Principal
Amount | | | |
Short-Term Investments — 1.1%
|
Repurchase Agreement — 1.1%
|
Fixed Income Clearing Corp., Repurchase Agreement, dated 9/30/24, 1.520%, due 10/01/24 (c) | | | $ 2,110,342 | | | 2,110,342 |
TOTAL SHORT-TERM INVESTMENTS
(Cost $2,110,342) | | | | | | 2,110,342 |
TOTAL INVESTMENTS — 100.3%
(Cost $147,108,185) (d) | | | | | | 197,825,152 |
Other Assets/(Liabilities) — (0.3)% | | | | | | (651,949) |
NET ASSETS — 100.0% | | | | | | $197,173,203 |
| | | | | | | |
Notes to Portfolio of Investments
Percentages are stated as a percent of net assets.
(a)
| Non-income producing security.
|
(b)
| Denotes all or a portion of security on loan. The total value of securities on loan as of September 30, 2024, was $556,327 or 0.28% of net assets. The Fund received $569,198 of non-cash collateral (U.S. Treasury and/or Agency obligations) related to securities lending activity. This amount is not reflected on either the Portfolio of Investments or the Statement of Assets and Liabilities. (Note 2).
|
(c)
| Maturity value of $2,110,431. Collateralized by U.S. Government Agency obligations with a rate of 4.875%, maturity date of 5/31/26, and an aggregate market value, including accrued interest, of $2,152,718.
|
(d)
| See Note 6 for aggregate cost for federal tax purposes. |
| | | | | |
The accompanying notes are an integral part of the financial statements. | | | | |
| | | 67
| |
| | | | | |
TABLE OF CONTENTS
| | | |
| | MassMutual Small Cap Opportunities Fund — Portfolio of Investments | |
| | | |
| | | | | | | |
Equities — 98.5%
| | | | | | |
Common Stock — 98.5%
| | | | | | |
Consumer Discretionary — 9.6%
| | | | | | |
AutoNation, Inc. (a) | | | 44,147 | | | $7,898,781 |
Dorman Products, Inc. (a) | | | 55,532 | | | 6,281,780 |
Dutch Bros, Inc. Class A (a) | | | 58,844 | | | 1,884,773 |
KB Home | | | 98,132 | | | 8,408,931 |
Steven Madden Ltd. (b) | | | 108,171 | | | 5,299,297 |
Stride, Inc. (a) (b) | | | 45,778 | | | 3,905,321 |
Texas Roadhouse, Inc. | | | 18,804 | | | 3,320,787 |
Visteon Corp. (a) | | | 50,873 | | | 4,845,145 |
| | | | | | 41,844,815 |
Consumer Staples — 1.1%
| | | | | | |
BellRing Brands, Inc. (a) | | | 74,812 | | | 4,542,585 |
Energy — 5.1%
| | | | | | |
Civitas Resources, Inc. | | | 83,189 | | | 4,215,187 |
CNX Resources Corp. (a) (b) | | | 174,130 | | | 5,671,414 |
Helmerich & Payne, Inc. (b) | | | 164,080 | | | 4,991,313 |
Northern Oil & Gas, Inc. | | | 135,753 | | | 4,807,014 |
Nov, Inc. | | | 147,167 | | | 2,350,257 |
| | | | | | 22,035,185 |
Financials — 14.7%
| | | | | | |
Bank of NT Butterfield & Son Ltd. | | | 69,665 | | | 2,569,245 |
Berkshire Hills Bancorp, Inc. | | | 91,627 | | | 2,467,515 |
Cathay General Bancorp | | | 119,339 | | | 5,125,610 |
Columbia Banking System, Inc. (b) | | | 184,950 | | | 4,829,045 |
Definity Financial Corp. (b) | | | 127,193 | | | 5,126,467 |
Federated Hermes, Inc. | | | 121,533 | | | 4,468,769 |
Marqeta, Inc. Class A (a) | | | 462,251 | | | 2,274,275 |
OceanFirst Financial Corp. | | | 139,363 | | | 2,590,758 |
Pacific Premier Bancorp, Inc. | | | 177,448 | | | 4,464,592 |
PennyMac Financial Services, Inc. | | | 66,046 | | | 7,527,263 |
Skyward Specialty Insurance Group, Inc. (a) | | | 48,545 | | | 1,977,238 |
Stifel Financial Corp. | | | 37,866 | | | 3,555,617 |
United Community Banks, Inc. | | | 99,438 | | | 2,891,657 |
Webster Financial Corp. | | | 87,120 | | | 4,060,663 |
Wintrust Financial Corp. | | | 62,072 | | | 6,736,674 |
WSFS Financial Corp. (b) | | | 62,489 | | | 3,186,314 |
| | | | | | 63,851,702 |
Health Care — 19.3%
| | | | | | |
Acadia Healthcare Co., Inc. (a) (b) | | | 77,742 | | | 4,929,620 |
Addus HomeCare Corp. (a) | | | 23,681 | | | 3,150,283 |
ADMA Biologics, Inc. (a) | | | 572,586 | | | 11,445,994 |
Ascendis Pharma AS ADR (a) | | | 32,013 | | | 4,779,861 |
BioLife Solutions, Inc. (a) (b) | | | 128,728 | | | 3,223,349 |
| | | | | | | |
| | | | | | | |
Bridgebio Pharma, Inc. (a) | | | 77,622 | | | $1,976,256 |
BrightSpring Health Services,
Inc. (a) (b) | | | 144,656 | | | 2,123,550 |
Collegium Pharmaceutical, Inc. (a) | | | 91,552 | | | 3,537,569 |
Encompass Health Corp. | | | 36,655 | | | 3,542,339 |
Evolent Health, Inc. Class A (a) (b) | | | 117,131 | | | 3,312,465 |
Guardant Health, Inc. (a) | | | 120,902 | | | 2,773,492 |
Immunovant, Inc. (a) (b) | | | 44,344 | | | 1,264,248 |
Inspire Medical Systems, Inc. (a) (b) | | | 21,174 | | | 4,468,773 |
Instil Bio, Inc. (a) (b) | | | 14,439 | | | 972,034 |
Integer Holdings Corp. (a) (b) | | | 34,924 | | | 4,540,120 |
Intra-Cellular Therapies, Inc. (a) | | | 68,924 | | | 5,043,169 |
Merus NV (a) | | | 25,517 | | | 1,274,829 |
Repligen Corp. (a) | | | 24,699 | | | 3,675,705 |
Structure Therapeutics, Inc.
ADR (a) (b) | | | 35,661 | | | 1,565,161 |
Surgery Partners, Inc. (a) | | | 129,306 | | | 4,168,826 |
TransMedics Group, Inc. (a) | | | 28,547 | | | 4,481,879 |
Twist Bioscience Corp. (a) | | | 113,151 | | | 5,112,162 |
Ultragenyx Pharmaceutical, Inc. (a) | | | 49,224 | | | 2,734,393 |
| | | | | | 84,096,077 |
Industrials — 19.1%
| | | | | | |
AAR Corp. (a) | | | 56,999 | | | 3,725,455 |
ABM Industries, Inc. | | | 78,257 | | | 4,128,839 |
Air Lease Corp. (b) | | | 82,840 | | | 3,751,824 |
Allison Transmission Holdings, Inc. | | | 81,507 | | | 7,830,378 |
Atkore, Inc. | | | 58,361 | | | 4,945,511 |
BWX Technologies, Inc. | | | 35,187 | | | 3,824,827 |
CACI International, Inc. Class A (a) | | | 9,700 | | | 4,894,232 |
Casella Waste Systems, Inc.
Class A (a) | | | 61,125 | | | 6,081,326 |
Enpro, Inc. | | | 35,500 | | | 5,757,390 |
Esab Corp. | | | 58,574 | | | 6,227,002 |
Gates Industrial Corp. PLC (a) | | | 203,580 | | | 3,572,829 |
Hub Group, Inc. Class A | | | 136,785 | | | 6,216,878 |
Korn Ferry | | | 93,293 | | | 7,019,365 |
Paycor HCM, Inc. (a) | | | 260,162 | | | 3,691,699 |
Regal Rexnord Corp. | | | 18,221 | | | 3,022,499 |
Zurn Elkay Water Solutions Corp. (b) | | | 233,330 | | | 8,385,880 |
| | | | | | 83,075,934 |
Information Technology — 14.1%
| | | | | | |
Allegro MicroSystems, Inc. (a) (b) | | | 182,446 | | | 4,250,992 |
ASGN, Inc. (a) | | | 53,278 | | | 4,967,108 |
Astera Labs, Inc. (a) (b) | | | 38,280 | | | 2,005,489 |
Belden, Inc. | | | 56,389 | | | 6,604,844 |
Gitlab, Inc. Class A (a) | | | 77,418 | | | 3,990,124 |
Informatica, Inc. Class A (a) | | | 133,712 | | | 3,380,239 |
Itron, Inc. (a) | | | 62,868 | | | 6,714,931 |
| | | | | | | |
| | | | | |
| | | The accompanying notes are an integral part of the financial statements.
| |
68
| | | | |
| | | | | |
TABLE OF CONTENTS
| | MassMutual Small Cap Opportunities Fund — Portfolio of Investments (Continued) | |
| | | | | | | |
MACOM Technology Solutions Holdings, Inc. (a) | | | 52,218 | | | $5,809,775 |
MARA Holdings, Inc. (a) (b) | | | 180,124 | | | 2,921,611 |
MKS Instruments, Inc. | | | 40,550 | | | 4,408,190 |
Progress Software Corp. (b) | | | 57,535 | | | 3,876,133 |
Silicon Laboratories, Inc. (a) (b) | | | 34,615 | | | 4,000,455 |
Unity Software, Inc. (a) (b) | | | 191,979 | | | 4,342,565 |
Vishay Intertechnology, Inc. | | | 205,248 | | | 3,881,240 |
| | | | | | 61,153,696 |
Materials — 6.7%
| | | | | | |
ATI, Inc. (a) | | | 101,175 | | | 6,769,619 |
Century Aluminum Co. (a) | | | 124,623 | | | 2,022,631 |
Commercial Metals Co. | | | 76,280 | | | 4,192,349 |
Kaiser Aluminum Corp. | | | 32,906 | | | 2,386,343 |
Silgan Holdings, Inc. | | | 101,826 | | | 5,345,865 |
Summit Materials, Inc. Class A (a) | | | 216,687 | | | 8,457,294 |
| | | | | | 29,174,101 |
Real Estate — 6.7%
| | | | | | |
DiamondRock Hospitality Co. | | | 726,812 | | | 6,345,069 |
DigitalBridge Group, Inc. | | | 291,771 | | | 4,122,724 |
Four Corners Property Trust, Inc. | | | 238,276 | | | 6,983,869 |
Outfront Media, Inc. | | | 306,807 | | | 5,639,113 |
Terreno Realty Corp. | | | 91,875 | | | 6,140,006 |
| | | | | | 29,230,781 |
Utilities — 2.1%
| | | | | | |
Chesapeake Utilities Corp. | | | 36,332 | | | 4,511,345 |
Portland General Electric Co. | | | 98,709 | | | 4,728,161 |
| | | | | | 9,239,506 |
TOTAL COMMON STOCK
(Cost $346,399,051) | | | | | | 428,244,382 |
TOTAL EQUITIES
(Cost $346,399,051) | | | | | | 428,244,382 |
TOTAL LONG-TERM INVESTMENTS
(Cost $346,399,051) | | | | | | 428,244,382 |
Short-Term Investments — 1.9%
|
Investment of Cash Collateral from
Securities Loaned — 0.5%
|
State Street Navigator Securities Lending Government Money
Market Portfolio (c) | | | 1,962,671 | | | 1,962,671 |
| | | | | | | |
| | | | | | | |
Repurchase Agreement — 1.4%
|
Fixed Income Clearing Corp., Repurchase Agreement, dated 9/30/24, 1.520%, due 10/01/24 (d) | | | $ 6,203,516 | | | $6,203,516 |
TOTAL SHORT-TERM INVESTMENTS
(Cost $8,166,187) | | | | | | 8,166,187 |
TOTAL INVESTMENTS — 100.4%
(Cost $354,565,238) (e) | | | | | | 436,410,569 |
Other Assets/(Liabilities) — (0.4)% | | | | | | (1,540,930) |
NET ASSETS — 100.0% | | | | | | $434,869,639 |
| | | | | | | |
Abbreviation Legend
| | | | | |
ADR | | | American Depositary Receipt | |
| | | | | |
Notes to Portfolio of Investments
Percentages are stated as a percent of net assets.
(a)
| Non-income producing security.
|
(b)
| Denotes all or a portion of security on loan. The total value of securities on loan as of September 30, 2024, was $73,265,022 or 16.85% of net assets. The Fund received $72,734,376 of non-cash collateral (U.S. Treasury and/or Agency obligations) related to securities lending activity. This amount is not reflected on either the Portfolio of Investments or the Statement of Assets and Liabilities. (Note 2).
|
(c)
| Represents investment of security lending cash collateral. (Note 2).
|
(d)
| Maturity value of $6,203,778. Collateralized by U.S. Government Agency obligations with a rate of 0.750%, maturity date of 5/31/26, and an aggregate market value, including accrued interest, of $6,327,752.
|
(e)
| See Note 6 for aggregate cost for federal tax purposes. |
| | | | | |
The accompanying notes are an integral part of the financial statements. | | | | |
| | | 69
| |
| | | | | |
TABLE OF CONTENTS
| | | |
| | MassMutual Global Fund — Portfolio of Investments | |
| | | |
| | | | | | | |
Equities — 100.6%
| | | | | | |
Common Stock — 100.6%
| | | | | | |
Canada — 0.6%
| | | | | | |
Canadian Pacific Kansas City Ltd. (a) | | | 13,366 | | | $1,143,328 |
China — 3.4%
| | | | | | |
JD.com, Inc. ADR | | | 128,029 | | | 5,121,160 |
Tencent Holdings Ltd. | | | 22,900 | | | 1,282,237 |
| | | | | | 6,403,397 |
Denmark — 3.9%
| | | | | | |
Novo Nordisk AS Class B | | | 61,964 | | | 7,378,256 |
France — 7.2%
| | | | | | |
Airbus SE | | | 35,076 | | | 5,136,066 |
Dassault Systemes SE | | | 17,516 | | | 695,116 |
EssilorLuxottica SA | | | 6,914 | | | 1,638,343 |
LVMH Moet Hennessy Louis
Vuitton SE | | | 7,797 | | | 5,988,208 |
| | | | | | 13,457,733 |
Germany — 4.2%
| | | | | | |
Allianz SE Registered | | | 3,536 | | | 1,160,261 |
SAP SE | | | 29,339 | | | 6,664,682 |
| | | | | | 7,824,943 |
India — 7.2%
| | | | | | |
DLF Ltd. | | | 905,778 | | | 9,712,399 |
HDFC Bank Ltd. | | | 42,630 | | | 882,361 |
ICICI Bank Ltd. Sponsored ADR | | | 99,132 | | | 2,959,090 |
| | | | | | 13,553,850 |
Israel — 0.9%
| | | | | | |
Nice Ltd. Sponsored ADR (a) (b) | | | 10,280 | | | 1,785,328 |
Italy — 1.3%
| | | | | | |
Brunello Cucinelli SpA | | | 15,187 | | | 1,637,991 |
Ferrari NV | | | 787 | | | 368,642 |
Moncler SpA | | | 6,152 | | | 390,614 |
| | | | | | 2,397,247 |
Japan — 4.8%
| | | | | | |
Capcom Co. Ltd. | | | 40,500 | | | 941,799 |
Hoya Corp. | | | 6,800 | | | 941,604 |
Keyence Corp. | | | 10,300 | | | 4,930,113 |
TDK Corp. | | | 178,000 | | | 2,271,767 |
| | | | | | 9,085,283 |
Netherlands — 1.8%
| | | | | | |
ASML Holding NV | | | 3,066 | | | 2,555,969 |
BE Semiconductor Industries NV | | | 3,640 | | | 462,293 |
Universal Music Group NV (a) | | | 16,535 | | | 432,954 |
| | | | | | 3,451,216 |
| | | | | | | |
| | | | | | | |
Spain — 1.3%
| | | | | | |
Amadeus IT Group SA | | | 33,949 | | | $2,450,373 |
Sweden — 5.2%
| | | | | | |
Assa Abloy AB Class B | | | 122,462 | | | 4,123,196 |
Atlas Copco AB Class A | | | 292,541 | | | 5,659,681 |
| | | | | | 9,782,877 |
Switzerland — 0.9%
| | | | | | |
Lonza Group AG Registered | | | 2,553 | | | 1,615,076 |
United States — 57.9%
| | | | | | |
Adobe, Inc. (b) | | | 9,938 | | | 5,145,698 |
Alphabet, Inc. Class A | | | 120,434 | | | 19,973,979 |
Amazon.com, Inc. (b) | | | 14,415 | | | 2,685,947 |
Analog Devices, Inc. | | | 37,627 | | | 8,660,607 |
Avantor, Inc. (b) | | | 10,994 | | | 284,415 |
Boston Scientific Corp. (b) | | | 10,911 | | | 914,342 |
Broadcom, Inc. | | | 8,642 | | | 1,490,745 |
Danaher Corp. | | | 3,469 | | | 964,451 |
Ecolab, Inc. | | | 3,336 | | | 851,781 |
Eli Lilly & Co. | | | 2,397 | | | 2,123,598 |
Equifax, Inc. | | | 11,446 | | | 3,363,522 |
IDEXX Laboratories, Inc. (b) | | | 1,415 | | | 714,886 |
Illumina, Inc. (b) | | | 2,289 | | | 298,508 |
Intuit, Inc. | | | 10,345 | | | 6,424,245 |
Intuitive Surgical, Inc. (b) | | | 5,164 | | | 2,536,918 |
IQVIA Holdings, Inc. (b) | | | 7,906 | | | 1,873,485 |
Lam Research Corp. | | | 1,221 | | | 996,434 |
Linde PLC (LIN US) | | | 1,260 | | | 600,844 |
Marriott International, Inc. Class A | | | 6,689 | | | 1,662,885 |
Marvell Technology, Inc. | | | 49,742 | | | 3,587,393 |
Meta Platforms, Inc. Class A | | | 29,314 | | | 16,780,506 |
Microsoft Corp. | | | 9,609 | | | 4,134,753 |
Netflix, Inc. (b) | | | 1,685 | | | 1,195,120 |
NVIDIA Corp. | | | 50,116 | | | 6,086,087 |
Phathom Pharmaceuticals, Inc. (a) (b) | | | 39,040 | | | 705,843 |
QUALCOMM, Inc. | | | 2,202 | | | 374,450 |
S&P Global, Inc. | | | 15,576 | | | 8,046,873 |
Synopsys, Inc. (b) | | | 834 | | | 422,329 |
Thermo Fisher Scientific, Inc. | | | 1,269 | | | 784,965 |
TJX Cos., Inc. | | | 3,424 | | | 402,457 |
Visa, Inc. Class A | | | 16,590 | | | 4,561,420 |
Zoetis, Inc. | | | 1,883 | | | 367,901 |
| | | | | | 109,017,387 |
TOTAL COMMON STOCK
(Cost $96,672,683) | | | | | | 189,346,294 |
TOTAL EQUITIES
(Cost $96,672,683) | | | | | | 189,346,294 |
| | | | | | | |
| | | | | |
| | | The accompanying notes are an integral part of the financial statements.
| |
70
| | | | |
| | | | | |
TABLE OF CONTENTS
| | MassMutual Global Fund — Portfolio of Investments (Continued) | |
| | | | | | | |
TOTAL LONG-TERM INVESTMENTS
(Cost $96,672,683) | | | | | | $189,346,294 |
Short-Term Investments — 1.8%
|
Investment of Cash Collateral from
Securities Loaned — 1.5%
|
State Street Navigator Securities Lending Government Money
Market Portfolio (c) | | | 2,842,364 | | | 2,842,364 |
| | | Principal
Amount | | | |
Repurchase Agreement — 0.3%
|
Fixed Income Clearing Corp., Repurchase Agreement, dated 9/30/24, 1.520%, due 10/01/24 (d) | | | $461,474 | | | 461,474 |
TOTAL SHORT-TERM INVESTMENTS
(Cost $3,303,838) | | | | | | 3,303,838 |
TOTAL INVESTMENTS — 102.4%
(Cost $99,976,521) (e) | | | | | | 192,650,132 |
Other Assets/(Liabilities) — (2.4)% | | | | | | (4,495,859) |
NET ASSETS — 100.0% | | | | | | $188,154,273 |
| | | | | | | |
Abbreviation Legend
| | | | | |
ADR | | | American Depositary Receipt | |
| | | | | |
Notes to Portfolio of Investments
Percentages are stated as a percent of net assets.
(a)
| Denotes all or a portion of security on loan. The total value of securities on loan as of September 30, 2024, was $4,021,998 or 2.14% of net assets. The Fund received $1,279,738 of non-cash collateral (U.S. Treasury and/or Agency obligations) related to securities lending activity. This amount is not reflected on either the Portfolio of Investments or the Statement of Assets and Liabilities. (Note 2).
|
(b)
| Non-income producing security.
|
(c)
| Represents investment of security lending cash collateral. (Note 2).
|
(d)
| Maturity value of $461,493. Collateralized by U.S. Government Agency obligations with a rate of 4.875%, maturity date of 4/30/26, and an aggregate market value, including accrued interest, of $470,815.
|
(e)
| See Note 6 for aggregate cost for federal tax purposes. |
Sector weightings, as a percentage of net assets, is as follows:
| | | | |
Information Technology | | | 30.1% |
Communication Services | | | 21.6% |
Health Care | | | 12.3% |
Consumer Discretionary | | | 11.0% |
Industrials | | | 10.3% |
Financials | | | 9.4% |
Real Estate | | | 5.1% |
Materials | | | 0.8% |
Total Long-Term Investments | | | 100.6 % |
Short-Term Investments and Other Assets and
Liabilities | | | (0.6)% |
Net Assets | | | 100.0% |
| | | | |
| | | | | |
The accompanying notes are an integral part of the financial statements. | | | | |
| | | 71
| |
| | | | | |
TABLE OF CONTENTS
| | | |
| | MassMutual International Equity Fund — Portfolio of Investments | |
| | | |
| | | | | | | |
Equities — 96.4%
| | | | | | |
Common Stock — 96.3%
| | | | | | |
Australia — 1.2%
| | | | | | |
BHP Group Ltd. (a) | | | 2,000 | | | $62,186 |
Glencore PLC | | | 55,700 | | | 318,967 |
Macquarie Group Ltd. | | | 2,200 | | | 354,791 |
Santos Ltd. | | | 54,900 | | | 267,577 |
Sonic Healthcare Ltd. | | | 11,600 | | | 218,283 |
Whitehaven Coal Ltd. | | | 31,960 | | | 160,100 |
| | | | | | 1,381,904 |
Belgium — 0.9%
| | | | | | |
Anheuser-Busch InBev SA | | | 7,400 | | | 490,297 |
Groupe Bruxelles Lambert NV | | | 1,500 | | | 116,841 |
KBC Group NV | | | 3,500 | | | 278,475 |
Liberty Global Ltd. Class C (a) (b) | | | 9,200 | | | 198,812 |
| | | | | | 1,084,425 |
Brazil — 0.1%
| | | | | | |
Pluxee NV (b) | | | 3,534 | | | 74,541 |
Canada — 5.1%
| | | | | | |
Canadian National Railway Co. | | | 25,214 | | | 2,952,524 |
CCL Industries, Inc. Class B | | | 1,300 | | | 79,253 |
Intact Financial Corp. | | | 16,449 | | | 3,158,568 |
| | | | | | 6,190,345 |
China — 0.2%
| | | | | | |
Prosus NV (PRX NA) | | | 6,200 | | | 268,144 |
Denmark — 0.1%
| | | | | | |
Novo Nordisk AS Class B | | | 900 | | | 107,166 |
Finland — 2.2%
| | | | | | |
Kone OYJ Class B | | | 44,940 | | | 2,688,375 |
France — 8.7%
| | | | | | |
Accor SA | | | 9,326 | | | 405,361 |
Amundi SA (c) | | | 2,792 | | | 208,748 |
AXA SA | | | 50,470 | | | 1,942,413 |
Capgemini SE | | | 15,767 | | | 3,415,405 |
Cie de Saint-Gobain SA | | | 2,800 | | | 255,220 |
LVMH Moet Hennessy Louis Vuitton SE | | | 1,258 | | | 966,162 |
Rexel SA | | | 3,300 | | | 95,598 |
Societe Generale SA | | | 11,532 | | | 287,486 |
Sodexo SA | | | 2,334 | | | 191,361 |
Teleperformance SE | | | 1,400 | | | 145,212 |
TotalEnergies SE (a) | | | 6,100 | | | 395,373 |
| | | | | | | |
| | | | | | | |
Veolia Environnement SA | | | 12,892 | | | $424,160 |
Vinci SA | | | 15,051 | | | 1,760,968 |
| | | | | | 10,493,467 |
Germany — 8.1%
| | | | | | |
Allianz SE Registered | | | 760 | | | 249,377 |
BASF SE | | | 3,000 | | | 158,766 |
Deutsche Boerse AG | | | 1,236 | | | 289,845 |
Deutsche Post AG | | | 6,800 | | | 302,810 |
Heidelberg Materials AG | | | 2,900 | | | 315,225 |
Infineon Technologies AG | | | 8,800 | | | 307,993 |
K&S AG Registered | | | 4,811 | | | 61,713 |
Merck KGaA | | | 18,254 | | | 3,214,027 |
SAP SE | | | 2,600 | | | 590,619 |
Siemens AG Registered | | | 2,160 | | | 436,213 |
Symrise AG | | | 25,908 | | | 3,581,921 |
Zalando SE (b) (c) | | | 6,999 | | | 230,934 |
| | | | | | 9,739,443 |
Hong Kong — 3.1%
| | | | | | |
AIA Group Ltd. | | | 305,848 | | | 2,704,553 |
CK Asset Holdings Ltd. | | | 48,000 | | | 208,582 |
Prudential PLC | | | 86,423 | | | 806,201 |
| | | | | | 3,719,336 |
Ireland — 0.5%
| | | | | | |
AerCap Holdings NV | | | 3,881 | | | 367,608 |
AIB Group PLC | | | 48,900 | | | 280,315 |
| | | | | | 647,923 |
Israel — 0.3%
| | | | | | |
Check Point Software Technologies Ltd. (b) | | | 1,590 | | | 306,568 |
Italy — 0.1%
| | | | | | |
Prysmian SpA | | | 1,300 | | | 94,514 |
Ryanair Holdings PLC Sponsored ADR | | | 450 | | | 20,331 |
| | | | | | 114,845 |
Japan — 15.4%
| | | | | | |
Astellas Pharma, Inc. (a) | | | 110,300 | | | 1,266,068 |
Canon, Inc. (a) | | | 6,600 | | | 216,764 |
Chugai Pharmaceutical Co. Ltd. | | | 60,791 | | | 2,939,991 |
FANUC Corp. (a) | | | 7,200 | | | 210,432 |
Fujitsu Ltd. | | | 25,200 | | | 516,975 |
Hitachi Ltd. | | | 26,000 | | | 686,886 |
Hoya Corp. | | | 15,690 | | | 2,172,613 |
Kao Corp. | | | 43,906 | | | 2,175,758 |
KDDI Corp. | | | 52,864 | | | 1,692,115 |
Keyence Corp. | | | 5,360 | | | 2,565,573 |
Kyocera Corp. | | | 19,100 | | | 221,612 |
| | | | | | | |
| | | | | |
| | | The accompanying notes are an integral part of the financial statements.
| |
72
| | | | |
| | | | | |
TABLE OF CONTENTS
| | MassMutual International Equity Fund — Portfolio of Investments (Continued) | |
| | | | | | | |
Nintendo Co. Ltd. | | | 4,100 | | | $218,597 |
Olympus Corp. | | | 18,500 | | | 351,122 |
ORIX Corp. | | | 18,200 | | | 422,544 |
Rakuten Group, Inc. (a) (b) | | | 42,600 | | | 275,832 |
Renesas Electronics Corp. | | | 16,900 | | | 246,608 |
SBI Holdings, Inc. (a) | | | 13,800 | | | 318,008 |
Seven & i Holdings Co. Ltd. | | | 30,700 | | | 459,738 |
Sony Group Corp. | | | 31,500 | | | 611,775 |
Square Enix Holdings Co. Ltd. | | | 2,300 | | | 91,295 |
Sumitomo Mitsui Financial Group, Inc. | | | 24,300 | | | 517,345 |
Toyota Industries Corp. | | | 4,300 | | | 331,939 |
| | | | | | 18,509,590 |
Luxembourg — 0.4%
| | | | | | |
ArcelorMittal SA | | | 8,200 | | | 215,201 |
Eurofins Scientific SE | | | 3,600 | | | 228,167 |
| | | | | | 443,368 |
Netherlands — 3.2%
| | | | | | |
ASML Holding NV | | | 390 | | | 325,123 |
EXOR NV | | | 800 | | | 85,742 |
Heineken Holding NV | | | 3,400 | | | 256,782 |
Heineken NV (a) | | | 32,816 | | | 2,909,693 |
ING Groep NV Series N | | | 12,500 | | | 227,354 |
Koninklijke Philips NV (b) | | | 2,836 | | | 92,931 |
| | | | | | 3,897,625 |
Norway — 0.4%
| | | | | | |
Aker BP ASA | | | 10,113 | | | 217,517 |
DNB Bank ASA | | | 14,600 | | | 299,491 |
| | | | | | 517,008 |
Republic of Korea — 0.3%
| | | | | | |
Samsung Electronics Co. Ltd. | | | 6,900 | | | 327,028 |
Singapore — 0.3%
| | | | | | |
DBS Group Holdings Ltd. | | | 13,610 | | | 404,211 |
Spain — 3.9%
| | | | | | |
Iberdrola SA | | | 159,452 | | | 2,466,973 |
Industria de Diseno Textil SA | | | 37,422 | | | 2,214,890 |
| | | | | | 4,681,863 |
Sweden — 2.7%
| | | | | | |
Assa Abloy AB Class B | | | 70,430 | | | 2,371,321 |
Boliden AB | | | 4,100 | | | 139,095 |
Essity AB Class B | | | 11,500 | | | 358,899 |
Husqvarna AB Class B | | | 7,600 | | | 53,300 |
Skandinaviska Enskilda Banken AB Class A | | | 16,259 | | | 248,754 |
Volvo AB Class B | | | 2,700 | | | 71,379 |
| | | | | | 3,242,748 |
| | | | | | | |
| | | | | | | |
Switzerland — 7.2%
| | | | | | |
Chocoladefabriken Lindt & Spruengli AG | | | 162 | | | $2,091,555 |
Cie Financiere Richemont SA Registered Class A | | | 1,900 | | | 301,230 |
Julius Baer Group Ltd. | | | 3,200 | | | 192,808 |
Novartis AG Registered | | | 25,667 | | | 2,954,677 |
Sika AG Registered | | | 9,368 | | | 3,108,012 |
| | | | | | 8,648,282 |
United Kingdom — 17.2%
| | | | | | |
Ashtead Group PLC | | | 3,900 | | | 302,723 |
AstraZeneca PLC | | | 15,111 | | | 2,353,763 |
Aviva PLC | | | 30,058 | | | 194,807 |
BAE Systems PLC | | | 140,836 | | | 2,331,347 |
Barratt Developments PLC | | | 16,100 | | | 103,249 |
Bunzl PLC | | | 2,500 | | | 118,275 |
Burberry Group PLC | | | 6,000 | | | 56,361 |
CK Hutchison Holdings Ltd. | | | 66,500 | | | 377,535 |
Compass Group PLC | | | 69,268 | | | 2,219,367 |
DCC PLC | | | 4,441 | | | 302,700 |
Diageo PLC | | | 76,089 | | | 2,654,899 |
Dowlais Group PLC | | | 50,469 | | | 39,445 |
Entain PLC | | | 9,900 | | | 101,094 |
Inchcape PLC | | | 20,256 | | | 216,124 |
Informa PLC | | | 10,500 | | | 115,343 |
Kingfisher PLC | | | 50,500 | | | 217,905 |
Legal & General Group PLC | | | 92,900 | | | 280,993 |
Lloyds Banking Group PLC | | | 600,700 | | | 471,685 |
Pearson PLC | | | 11,361 | | | 154,058 |
Persimmon PLC | | | 7,900 | | | 173,469 |
Reckitt Benckiser Group PLC | | | 38,563 | | | 2,361,513 |
Smith & Nephew PLC | | | 135,162 | | | 2,101,334 |
Tesco PLC | | | 72,200 | | | 346,149 |
Unilever PLC (ULVR LN) | | | 7,100 | | | 459,810 |
Unilever PLC (UNA NA) | | | 41,895 | | | 2,715,284 |
| | | | | | 20,769,232 |
United States — 14.7%
| | | | | | |
BP PLC | | | 70,000 | | | 369,234 |
CNH Industrial NV | | | 20,800 | | | 230,880 |
Experian PLC | | | 61,784 | | | 3,254,906 |
GSK PLC | | | 14,120 | | | 287,199 |
Linde PLC (LIN US) | | | 5,901 | | | 2,813,951 |
Nestle SA Registered | | | 29,699 | | | 2,993,155 |
Roche Holding AG | | | 9,933 | | | 3,179,699 |
Sanofi SA | | | 3,900 | | | 449,335 |
Schneider Electric SE | | | 8,409 | | | 2,224,703 |
Shell PLC | | | 41,356 | | | 1,347,912 |
Smurfit WestRock PLC | | | 7,900 | | | 390,418 |
| | | | | | | |
| | | | | |
The accompanying notes are an integral part of the financial statements. | | | | |
| | | 73
| |
| | | | | |
TABLE OF CONTENTS
| | MassMutual International Equity Fund — Portfolio of Investments (Continued) | |
| | | | | | | |
Stellantis NV | | | 4,700 | | | $65,045 |
Tenaris SA | | | 8,800 | | | 139,682 |
| | | | | | 17,746,119 |
TOTAL COMMON STOCK
(Cost $100,900,208) | | | | | | 116,003,556 |
Preferred Stock — 0.1%
| | | | | | |
Germany — 0.1%
| | | | | | |
Henkel AG & Co. KGaA 2.197% | | | 1,669 | | | 156,824 |
TOTAL PREFERRED STOCK
(Cost $130,842) | | | | | | 156,824 |
TOTAL EQUITIES
(Cost $101,031,050) | | | | | | 116,160,380 |
TOTAL LONG-TERM INVESTMENTS
(Cost $101,031,050) | | | | | | 116,160,380 |
Short-Term Investments — 4.6%
|
Investment of Cash Collateral from
Securities Loaned — 1.6%
|
State Street Navigator Securities Lending Government Money Market Portfolio (d) | | | 1,924,845 | | | 1,924,845 |
| | | Principal Amount | | | |
Repurchase Agreement — 3.0%
| | | | | | |
Fixed Income Clearing Corp., Repurchase Agreement, dated 9/30/24, 1.520%, due 10/01/24 (e) | | | $3,619,121 | | | 3,619,121 |
TOTAL SHORT-TERM INVESTMENTS
(Cost $5,543,966) | | | | | | 5,543,966 |
TOTAL INVESTMENTS — 101.0%
(Cost $106,575,016) (f) | | | | | | 121,704,346 |
Other Assets/(Liabilities) — (1.0)% | | | | | | (1,243,780) |
NET ASSETS — 100.0% | | | | | | $120,460,566 |
| | | | | | | |
Abbreviation Legend
| | | | | |
ADR | | | American Depositary Receipt | |
| | | | | |
Notes to Portfolio of Investments
Percentages are stated as a percent of net assets.
(a)
| Denotes all or a portion of security on loan. The total value of securities on loan as of September 30, 2024, was $5,139,085 or 4.27% of net assets. The Fund received $3,528,859 of non-cash collateral (U.S. Treasury and/or Agency obligations) related to securities lending activity. This amount is not reflected on either the Portfolio of Investments or the Statement of Assets and Liabilities. (Note 2).
|
(b)
| Non-income producing security.
|
(c)
| Security is exempt from registration under Regulation S or Rule 144A of the Securities Act of 1933. These securities are considered restricted and may be resold in transactions exempt from registration. At September 30, 2024, the aggregate market value of these securities amounted to $439,682 or 0.37% of net assets.
|
(d)
| Represents investment of security lending cash collateral. (Note 2).
|
(e)
| Maturity value of $3,619,274. Collateralized by U.S. Government Agency obligations with a rate of 4.875%, maturity date of 4/30/26, and an aggregate market value, including accrued interest, of $3,691,687.
|
(f)
| See Note 6 for aggregate cost for federal tax purposes. |
Sector weightings, as a percentage of net assets, is as follows:
| | | | |
Industrials | | | 18.3% |
Health Care | | | 18.2% |
Consumer Staples | | | 17.0% |
Financials | | | 11.9% |
Materials | | | 9.3% |
Information Technology | | | 7.5% |
Consumer Discretionary | | | 7.3% |
Energy | | | 2.4% |
Utilities | | | 2.4% |
Communication Services | | | 1.9% |
Real Estate | | | 0.2% |
Total Long-Term Investments | | | 96.4% |
Short-Term Investments and Other Assets and
Liabilities | | | 3.6% |
Net Assets | | | 100.0% |
| | | | |
| | | | | |
| | | The accompanying notes are an integral part of the financial statements.
| |
74
| | | | |
| | | | | |
TABLE OF CONTENTS
| | | |
| | MassMutual Strategic Emerging Markets Fund — Portfolio of Investments | |
| | | |
| | | | | | | |
Equities — 97.4%
| | | | | | |
Common Stock — 96.5%
| | | | | | |
Brazil — 4.7%
| | | | | | |
Azzas 2154 SA | | | 9,936 | | | $76,914 |
Banco BTG Pactual SA | | | 148,400 | | | 906,303 |
Localiza Rent a Car SA | | | 138,686 | | | 1,043,766 |
NU Holdings Ltd. Class A (a) | | | 75,054 | | | 1,024,487 |
Raia Drogasil SA | | | 151,700 | | | 709,810 |
Vale SA Sponsored ADR | | | 4,285 | | | 50,049 |
WEG SA | | | 119,137 | | | 1,189,467 |
| | | | | | 5,000,796 |
Chile — 1.1%
| | | | | | |
Antofagasta PLC | | | 21,304 | | | 575,293 |
Banco de Chile | | | 4,763,456 | | | 607,549 |
| | | | | | 1,182,842 |
China — 21.1%
| | | | | | |
Airtac International Group | | | 18,000 | | | 522,427 |
Alibaba Group Holding Ltd. Sponsored ADR | | | 27,374 | | | 2,904,929 |
Budweiser Brewing Co. APAC
Ltd. (b) | | | 228,600 | | | 301,763 |
Contemporary Amperex Technology Co. Ltd. Class A | | | 5,500 | | | 195,351 |
H World Group Ltd. | | | 10,800 | | | 40,770 |
H World Group Ltd. ADR (c) | | | 146,519 | | | 5,450,507 |
Meituan Class B (a) (b) | | | 149,400 | | | 3,179,811 |
NetEase, Inc. ADR | | | 5,383 | | | 503,364 |
New Horizon Health
Ltd. (a) (b) (d) (e) | | | 145,000 | | | 65,936 |
PDD Holdings, Inc. ADR (a) | | | 9,178 | | | 1,237,286 |
Tencent Holdings Ltd. | | | 108,790 | | | 6,091,466 |
WuXi XDC Cayman, Inc. (a) | | | 35,269 | | | 106,063 |
Yum China Holdings, Inc. | | | 14,094 | | | 634,512 |
ZTO Express Cayman, Inc. ADR | | | 55,502 | | | 1,374,784 |
| | | | | | 22,608,969 |
France — 3.8%
| | | | | | |
Pernod Ricard SA | | | 13,875 | | | 2,097,204 |
TotalEnergies SE (c) | | | 30,164 | | | 1,955,088 |
| | | | | | 4,052,292 |
Hong Kong — 1.1%
| | | | | | |
AIA Group Ltd. | | | 139,200 | | | 1,230,918 |
India — 16.5%
| | | | | | |
Adani Ports & Special Economic Zone Ltd. | | | 31,194 | | | 538,411 |
Bajaj Finance Ltd. | | | 1,525 | | | 140,412 |
Bajaj Finserv Ltd. | | | 2,983 | | | 70,228 |
| | | | | | | |
| | | | | | | |
Bharti Airtel Ltd. | | | 23,573 | | | $483,015 |
Havells India Ltd. | | | 27,828 | | | 672,638 |
HCL Technologies Ltd. | | | 31,011 | | | 666,851 |
HDFC Bank Ltd. | | | 149,104 | | | 3,086,173 |
Infosys Ltd. | | | 53,408 | | | 1,192,093 |
Kotak Mahindra Bank Ltd. | | | 234,102 | | | 5,195,015 |
Macrotech Developers Ltd. (b) | | | 44,475 | | | 656,810 |
Mahindra & Mahindra Ltd. | | | 9,862 | | | 367,463 |
Maruti Suzuki India Ltd. | | | 1,306 | | | 206,382 |
Oberoi Realty Ltd. | | | 73,149 | | | 1,641,579 |
Sun Pharmaceutical Industries Ltd. | | | 3,337 | | | 76,801 |
Tata Consultancy Services Ltd. | | | 52,487 | | | 2,679,958 |
| | | | | | 17,673,829 |
Indonesia — 1.5%
| | | | | | |
Bank Central Asia Tbk. PT | | | 2,286,400 | | | 1,558,872 |
Italy — 3.1%
| | | | | | |
Ermenegildo Zegna NV (c) | | | 27,805 | | | 273,601 |
Moncler SpA | | | 16,035 | | | 1,018,124 |
PRADA SpA | | | 258,400 | | | 1,995,663 |
| | | | | | 3,287,388 |
Japan — 2.1%
| | | | | | |
Chugai Pharmaceutical Co. Ltd. | | | 13,600 | | | 657,727 |
Daiichi Sankyo Co. Ltd. | | | 46,900 | | | 1,541,893 |
| | | | | | 2,199,620 |
Mexico — 8.5%
| | | | | | |
America Movil SAB de CV ADR | | | 102,235 | | | 1,672,565 |
Fomento Economico Mexicano SAB
de CV | | | 334,508 | | | 3,298,021 |
Grupo Aeroportuario del Pacifico SAB de CV Class B | | | 11,294 | | | 195,743 |
Grupo Aeroportuario del Sureste SAB de CV Class B | | | 10,900 | | | 308,018 |
Grupo Mexico SAB de CV Series B | | | 476,060 | | | 2,659,553 |
Wal-Mart de Mexico SAB de CV | | | 321,332 | | | 969,545 |
| | | | | | 9,103,445 |
Netherlands — 1.0%
| | | | | | |
Argenx SE ADR (a) | | | 1,890 | | | 1,024,531 |
Peru — 1.1%
| | | | | | |
Credicorp Ltd. | | | 6,325 | | | 1,144,635 |
Philippines — 1.9%
| | | | | | |
SM Investments Corp. | | | 94,570 | | | 1,616,345 |
SM Prime Holdings, Inc. | | | 698,600 | | | 403,351 |
| | | | | | 2,019,696 |
Poland — 0.8%
| | | | | | |
Allegro.eu SA (a) (b) | | | 91,135 | | | 823,542 |
| | | | | | | |
| | | | | |
The accompanying notes are an integral part of the financial statements. | | | | |
| | | 75
| |
| | | | | |
TABLE OF CONTENTS
| | MassMutual Strategic Emerging Markets Fund — Portfolio of Investments (Continued) | |
| | | | | | | |
Portugal — 2.1%
| | | | | | |
Galp Energia SGPS SA | | | 119,773 | | | $2,248,900 |
Republic of Korea — 7.0%
| | | | | | |
Kakao Corp. | | | 1,502 | | | 41,521 |
NAVER Corp. | | | 2,095 | | | 272,776 |
Samsung Biologics Co. Ltd. (a) (b) | | | 2,408 | | | 1,803,203 |
Samsung Electronics Co. Ltd. | | | 92,856 | | | 4,400,943 |
SK Hynix, Inc. | | | 7,161 | | | 964,647 |
| | | | | | 7,483,090 |
Russia — 0.0%
| | | | | | |
Novatek PJSC GDR (a) (b) (d) (e) | | | 700 | | | — |
Sberbank of Russia PJSC (a) (d) (e) | | | 18,062 | | | — |
| | | | | | — |
South Africa — 1.2%
| | | | | | |
FirstRand Ltd. | | | 259,789 | | | 1,252,119 |
Switzerland — 0.5%
| | | | | | |
Cie Financiere Richemont SA Registered Class A | | | 3,433 | | | 544,276 |
Taiwan — 14.4%
| | | | | | |
Global Unichip Corp. | | | 7,000 | | | 245,281 |
Hon Hai Precision Industry Co. Ltd. | | | 76,000 | | | 454,239 |
MediaTek, Inc. | | | 53,000 | | | 1,979,210 |
Taiwan Semiconductor Manufacturing Co. Ltd. | | | 399,000 | | | 12,181,342 |
Voltronic Power Technology Corp. | | | 9,000 | | | 574,134 |
| | | | | | 15,434,206 |
Turkey — 0.9%
| | | | | | |
Akbank TAS | | | 88,878 | | | 160,305 |
BIM Birlesik Magazalar AS | | | 18,408 | | | 267,379 |
KOC Holding AS | | | 81,340 | | | 448,198 |
Migros Ticaret AS | | | 8,835 | | | 116,176 |
| | | | | | 992,058 |
United Arab Emirates — 0.3%
| | | | | | |
Americana Restaurants International PLC - Foreign Co. | | | 400,155 | | | 292,061 |
United Kingdom — 1.3%
| | | | | | |
AstraZeneca PLC | | | 9,292 | | | 1,447,367 |
United States — 0.5%
| | | | | | |
Legend Biotech Corp. ADR (a) (c) | | | 11,013 | | | 536,664 |
TOTAL COMMON STOCK
(Cost $91,081,343) | | | | | | 103,142,116 |
| | | | | | | |
| | | | | | | |
Preferred Stock — 0.9%
| | | | | | |
Brazil — 0.9%
| | | | | | |
Itau Unibanco Holding SA 6.508%
| | | | | | |
| | | 136,282 | | | $903,343 |
TOTAL PREFERRED STOCK
(Cost $792,967) | | | | | | 903,343 |
TOTAL EQUITIES
(Cost $91,874,310) | | | | | | 104,045,459 |
TOTAL LONG-TERM INVESTMENTS
(Cost $91,874,310) | | | | | | 104,045,459 |
Short-Term Investments — 2.2%
| | | | | | |
Investment of Cash Collateral from Securities Loaned — 0.4%
| | | | | | |
State Street Navigator Securities Lending Government Money
Market Portfolio (f) | | | 471,549 | | | 471,549 |
| | | | | | | |
| | | | | | | |
Repurchase Agreement — 1.8%
| | | | | | |
Fixed Income Clearing Corp., Repurchase Agreement, dated 9/30/24, 1.520%, due 10/01/24 (g) | | | $1,914,863 | | | 1,914,863 |
TOTAL SHORT-TERM INVESTMENTS
(Cost $2,386,412) | | | | | | 2,386,412 |
TOTAL INVESTMENTS — 99.6%
(Cost $94,260,722) (h) | | | | | | 106,431,871 |
Other Assets/(Liabilities) — 0.4% | | | | | | 455,965 |
NET ASSETS — 100.0% | | | | | | $106,887,836 |
| | | | | | | |
Abbreviation Legend
| | | | | |
ADR | | | American Depositary Receipt | |
GDR | | | Global Depositary Receipt | |
| | | | | |
Notes to Portfolio of Investments
Percentages are stated as a percent of net assets.
(a)
| Non-income producing security.
|
(b)
| Security is exempt from registration under Regulation S or Rule 144A of the Securities Act of 1933. These securities are considered restricted and may be resold in transactions exempt from registration. At September 30, 2024, the aggregate market value of these securities amounted to $6,831,065 or 6.39% of net assets.
|
| | | | | |
| | | The accompanying notes are an integral part of the financial statements.
| |
76
| | | | |
| | | | | |
TABLE OF CONTENTS
| | MassMutual Strategic Emerging Markets Fund — Portfolio of Investments (Continued) | |
Notes to Portfolio of Investments (Continued)
(c)
| Denotes all or a portion of security on loan. The total value of securities on loan as of September 30, 2024, was $3,200,301 or 2.99% of net assets. The Fund received $2,903,178 of non-cash collateral (U.S. Treasury and/or Agency obligations) related to securities lending activity. This amount is not reflected on either the Portfolio of Investments or the Statement of Assets and Liabilities. (Note 2).
|
(d)
| This security is fair valued in good faith in accordance with procedures approved by the Board of Trustees. At September 30, 2024, these securities amounted to a value of $65,936 or 0.06% of net assets.
|
(e)
| Investment is valued using significant unobservable inputs.
|
(f)
| Represents investment of security lending cash collateral. (Note 2). |
(g)
| Maturity value of $1,914,943. Collateralized by U.S. Government Agency obligations with a rate of 0.750%, maturity date of 5/31/26, and an aggregate market value, including accrued interest, of $1,953,281.
|
(h)
| See Note 6 for aggregate cost for federal tax purposes. |
Sector weightings, as a percentage of net assets, is as follows:
| | | | |
Information Technology | | | 23.2% |
Consumer Discretionary | | | 17.8% |
Financials | | | 16.2% |
Communication Services | | | 8.5% |
Industrials | | | 8.1% |
Consumer Staples | | | 7.3% |
Health Care | | | 6.8% |
Energy | | | 3.9% |
Materials | | | 3.1% |
Real Estate | | | 2.5% |
Total Long-Term Investments | | | 97.4% |
Short-Term Investments and Other
Assets and Liabilities | | | 2.6% |
Net Assets | | | 100.0% |
| | | | |
| | | | | |
The accompanying notes are an integral part of the financial statements. | | | | |
| | | 77
| |
| | | | | |
TABLE OF CONTENTS
Statements of Assets and Liabilities
September 30, 2024
| | | | | | | |
Assets:
| | | | | | |
Investments, at value (Note 2) (a) | | | $ 150,014,800 | | | $ 153,251,541 |
Repurchase agreements, at value (Note 2) (b) | | | 25,000,000 | | | 3,249,821 |
Total investments (c) | | | 175,014,800 | | | 156,501,362 |
Cash | | | 78,061 | | | 38 |
Foreign currency, at value (d) | | | — | | | 190 |
Receivables from:
| | | | | | |
Investments sold
| | | | | | |
Regular delivery | | | — | | | — |
Delayed delivery | | | — | | | — |
Cash collateral pledged for open derivatives (Note 2) | | | — | | | 3,042,000 |
Cash collateral pledged for when-issued securities (Note 2) | | | — | | | — |
Due from broker | | | — | | | — |
Open forward contracts (Note 2) | | | — | | | — |
Fund shares sold | | | 467,132 | | | 174,673 |
Variation margin on open derivative instruments (Note 2) | | | — | | | 7,996 |
Interest and dividends | | | 61,080 | | | 1,159,054 |
Foreign tax reclaims | | | — | | | — |
Open swap agreements, at value (Note 2) | | | — | | | — |
Prepaid expenses | | | 14,463 | | | 44,153 |
Other receivables | | | — | | | — |
Total assets | | | 175,635,536 | | | 160,929,466 |
Liabilities:
| | | | | | |
Payables for:
| | | | | | |
Investments purchased
| | | | | | |
Regular delivery | | | — | | | 1,507,148 |
Delayed delivery | | | — | | | 965,676 |
Cash collateral held for open derivatives (Note 2) | | | — | | | — |
Cash collateral held for when-issued securities (Note2) | | | — | | | — |
Written options outstanding, at value (Note 2) (e) | | | — | | | — |
Distributions (Note 2) | | | 589 | | | 11,821 |
Open forward contracts (Note 2) | | | — | | | — |
Interest and dividends | | | — | | | — |
Fund shares redeemed | | | 1,864,977 | | | 172,563 |
Cash collateral held for securities on loan (Note 2) | | | — | | | 821,925 |
Trustees’ fees and expenses (Note 3) | | | 27,281 | | | 30,228 |
Variation margin on open derivative instruments (Note 2) | | | — | | | — |
Affiliates (Note 3):
| | | | | | |
Administration fees | | | 57,855 | | | 92,374 |
Investment advisory fees | | | 49,687 | | | 29,275 |
Service fees | | | — | | | 34,476 |
Distribution fees | | | — | | | 4,052 |
Merger fees | | | — | | | — |
Accrued expense and other liabilities | | | 71,793 | | | 174,064 |
Total liabilities | | | 2,072,182 | | | 3,843,602 |
Net assets | | | $173,563,354 | | | $157,085,864 |
Net assets consist of:
| | | | | | |
Paid-in capital | | | $173,588,071 | | | $321,089,436 |
Accumulated earnings (loss) | | | (24,717) | | | (164,003,572) |
Net assets | | | $173,563,354 | | | $157,085,864 |
(a) Cost of investments: | | | $150,014,800 | | | $158,927,808 |
(b) Cost of repurchase agreements: | | | $25,000,000 | | | $3,249,821 |
(c) Securities on loan with market value of: | | | $— | | | $964,974 |
(d) Cost of foreign currency: | | | $— | | | $186 |
(e) Premiums received on written options: | | | $— | | | $— |
| | | | | | | |
| | | | | |
| | | The accompanying notes are an integral part of the financial statements.
| |
78
| | | | |
| | | | | |
TABLE OF CONTENTS
| | | | | | | | | | | | | |
|
$ 242,850,204 | | | $ 1,210,045,005 | | | $ 148,608,080 | | | $ 435,868,913 | | | $ 108,071,518 |
563,043 | | | 11,842,813 | | | 1,998,387 | | | 3,171,648 | | | 2,265,961 |
243,413,247 | | | 1,221,887,818 | | | 150,606,467 | | | 439,040,561 | | | 110,337,479 |
831,162 | | | 158,530 | | | 15,564 | | | 10,057 | | | — |
— | | | 2 | | | 4,658 | | | — | | | — |
|
|
— | | | 10,476,070 | | | 1,036,256 | | | 3,692,708 | | | 2,617,597 |
— | | | — | | | — | | | — | | | 11,323 |
308,000 | | | — | | | 40,000 | | | — | | | — |
— | | | 50,000 | | | — | | | — | | | — |
— | | | — | | | 173,103 | | | — | | | — |
— | | | — | | | 78,909 | | | — | | | — |
168,715 | | | 2,586,485 | | | 243,371 | | | 231,723 | | | 22,779 |
114,584 | | | — | | | — | | | — | | | 2,851 |
460,519 | | | 7,624,948 | | | 1,113,643 | | | 6,378,728 | | | 263,295 |
— | | | — | | | 14,105 | | | 461,273 | | | — |
7,694,697 | | | — | | | — | | | — | | | — |
41,187 | | | 36,855 | | | 40,944 | | | 44,075 | | | 39,578 |
— | | | 21,643 | | | — | | | — | | | — |
253,032,111 | | | 1,242,842,351 | | | 153,367,020 | | | 449,859,125 | | | 113,294,902 |
|
|
|
— | | | 4,019,062 | | | — | | | 11,507,720 | | | 2,582,882 |
— | | | 180,869,893 | | | 13,980,243 | | | 3,443,129 | | | 2,811,273 |
4,970,000 | | | — | | | — | | | — | | | — |
— | | | 354,586 | | | — | | | — | | | — |
— | | | — | | | 12,588 | | | — | | | — |
438 | | | 1,572 | | | 386 | | | 576 | | | — |
— | | | — | | | 58,431 | | | — | | | — |
2,859,627 | | | — | | | — | | | — | | | — |
850,712 | | | 7,308,481 | | | 64,057 | | | 2,247,468 | | | 44,027 |
— | | | 13,631,015 | | | 4,223,208 | | | 32,897,900 | | | — |
18,713 | | | 123,268 | | | 11,670 | | | 22,447 | | | 9,598 |
— | | | 349,065 | | | 106,720 | | | — | | | — |
|
50,789 | | | 227,831 | | | 58,889 | | | 71,649 | | | 52,121 |
66,934 | | | 331,416 | | | 37,862 | | | 139,215 | | | 43,168 |
8,194 | | | 34,147 | | | 4,441 | | | 31,912 | | | 18,592 |
1,374 | | | 2,710 | | | 685 | | | 17,448 | | | 7,078 |
— | | | 95,972 | | | — | | | — | | | — |
106,394 | | | 385,710 | | | 101,628 | | | 150,326 | | | 107,598 |
8,933,175 | | | 207,734,728 | | | 18,660,808 | | | 50,529,790 | | | 5,676,337 |
$244,098,936 | | | $1,035,107,623 | | | $134,706,212 | | | $399,329,335 | | | $107,618,565 |
|
$276,423,783 | | | $1,242,817,416 | | | $167,844,228 | | | $466,022,579 | | | $89,186,888 |
(32,324,847) | | | (207,709,793) | | | (33,138,016) | | | (66,693,244) | | | 18,431,677 |
$244,098,936 | | | $1,035,107,623 | | | $134,706,212 | | | $399,329,335 | | | $107,618,565 |
$245,175,861 | | | $1,240,660,853 | | | $155,923,339 | | | $431,611,699 | | | $93,999,330 |
$563,043 | | | $11,842,813 | | | $1,998,387 | | | $3,171,648 | | | $2,265,961 |
$— | | | $14,824,744 | | | $8,791,302 | | | $31,665,949 | | | $— |
$— | | | $2 | | | $4,581 | | | $— | | | $— |
$— | | | $— | | | $12,342 | | | $— | | | $— |
| | | | | | | | | | | | | |
| | | | | |
The accompanying notes are an integral part of the financial statements. | | | | |
| | | 79
| |
| | | | | |
TABLE OF CONTENTS
| | | |
| | MassMutual Funds (Continued) | |
| | | |
Statements of Assets and Liabilities
September 30, 2024
| | | | | | | |
Class I shares:
| | | | | | |
Net assets | | | | | | $ 53,625,322 |
Shares outstanding (a) | | | | | | 5,801,178 |
Net asset value, offering price and redemption price per share | | | | | | $9.24 |
Class R5 shares:
| | | | | | |
Net assets | | | $ 173,563,354 | | | $11,547,064 |
Shares outstanding (a) | | | 173,765,701 | | | 1,243,140 |
Net asset value, offering price and redemption price per share | | | $1.00 | | | $9.29 |
Service Class shares:
| | | | | | |
Net assets | | | | | | $2,117,298 |
Shares outstanding (a) | | | | | | 229,615 |
Net asset value, offering price and redemption price per share | | | | | | $9.22 |
Administrative Class shares:
| | | | | | |
Net assets | | | | | | $12,115,656 |
Shares outstanding (a) | | | | | | 1,318,040 |
Net asset value, offering price and redemption price per share | | | | | | $9.19 |
Class R4 shares:
| | | | | | |
Net assets | | | | | | $8,390,744 |
Shares outstanding (a) | | | | | | 905,862 |
Net asset value, offering price and redemption price per share | | | | | | $9.26 |
Class A shares:
| | | | | | |
Net assets | | | | | | $5,960,488 |
Shares outstanding (a) | | | | | | 651,450 |
Net asset value and redemption price per share | | | | | | $9.15 |
Maximum Offering price per share (100/[100-maximum sales charge] of net asset value) | | | | | | $9.38 |
Class R3 shares:
| | | | | | |
Net assets | | | | | | $5,406,054 |
Shares outstanding (a) | | | | | | 588,746 |
Net asset value, offering price and redemption price per share | | | | | | $9.18 |
Class Y shares:
| | | | | | |
Net assets | | | | | | $35,518,791 |
Shares outstanding (a) | | | | | | 3,838,561 |
Net asset value, offering price and redemption price per share | | | | | | $9.25 |
Class L shares:
| | | | | | |
Net assets | | | | | | $21,637,755 |
Shares outstanding (a) | | | | | | 2,348,374 |
Net asset value and redemption price per share | | | | | | $9.21 |
Maximum Offering price per share (100/[100-maximum sales charge] of net asset value) | | | | | | $9.45 |
Class C shares:
| | | | | | |
Net assets | | | | | | $766,692 |
Shares outstanding (a) | | | | | | 82,520 |
Net asset value, offering price and redemption price per share | | | | | | $9.29 |
| | | | | | | |
(a)
| Authorized unlimited number of shares with no par value. |
| | | | | |
| | | The accompanying notes are an integral part of the financial statements.
| |
80
| | | | |
| | | | | |
TABLE OF CONTENTS
| | | | | | | | | | | | | |
|
$ 162,466,793 | | | $ 758,457,207 | | | $ 52,500,030 | | | $ 253,129,991 | | | $ 41,741,631 |
17,039,041 | | | 81,516,633 | | | 5,766,638 | | | 31,011,483 | | | 3,231,247 |
$9.53 | | | $9.30 | | | $9.10 | | | $8.16 | | | $12.92 |
|
$47,911,972 | | | $145,070,652 | | | $67,567,963 | | | $38,879,385 | | | $24,927,982 |
5,022,911 | | | 15,525,551 | | | 8,225,242 | | | 4,729,991 | | | 1,930,921 |
$9.54 | | | $9.34 | | | $8.21 | | | $8.22 | | | $12.91 |
|
$15,951,926 | | | $36,028,408 | | | $3,629,030 | | | $18,904,598 | | | $9,664,880 |
1,677,052 | | | 3,877,400 | | | 433,442 | | | 2,298,447 | | | 692,970 |
$9.51 | | | $9.29 | | | $8.37 | | | $8.22 | | | $13.95 |
|
$4,953,229 | | | $37,303,922 | | | $3,901,353 | | | $12,022,718 | | | $978,017 |
513,291 | | | 4,056,714 | | | 466,436 | | | 1,488,803 | | | 75,430 |
$9.65 | | | $9.20 | | | $8.36 | | | $8.08 | | | $12.97 |
|
$2,120,313 | | | $19,865,281 | | | $2,253,648 | | | $16,487,944 | | | $5,291,262 |
228,021 | | | 2,182,115 | | | 273,506 | | | 2,077,636 | | | 431,934 |
$9.30 | | | $9.10 | | | $8.24 | | | $7.94 | | | $12.25 |
|
$8,349,374 | | | $30,137,809 | | | $3,673,359 | | | $6,744,955 | | | $12,924,364 |
888,940 | | | 3,292,155 | | | 436,923 | | | 835,482 | | | 1,039,306 |
$9.39 | | | $9.15 | | | $8.41 | | | $8.07 | | | $12.44 |
$9.81 | | | $9.56 | | | $8.78 | | | $8.43 | | | $13.16 |
|
$2,242,752 | | | $4,125,667 | | | $1,081,802 | | | $27,608,712 | | | $11,967,917 |
240,494 | | | 433,251 | | | 129,702 | | | 3,376,079 | | | 985,298 |
$9.33 | | | $9.52 | | | $8.34 | | | $8.18 | | | $12.15 |
|
$102,577 | | | $4,118,677 | | | $99,027 | | | $25,376,605 | | | $122,512 |
10,741 | | | 440,788 | | | 12,048 | | | 3,100,416 | | | 9,488 |
$9.55 | | | $9.34 | | | $8.22 | | | $8.18 | | | $12.91 |
|
|
| | | | | | | | | $174,427 | | | |
| | | | | | | | | 21,223 | | | |
| | | | | | | | | $8.22 | | | |
| | | | | | | | | | | | | |
| | | | | |
The accompanying notes are an integral part of the financial statements. | | | | |
| | | 81
| |
| | | | | |
TABLE OF CONTENTS
| | | |
| | MassMutual Funds (Continued) | |
| | | |
Statements of Assets and Liabilities
September 30, 2024
| | | | | | | |
Assets:
| | | | | | |
Investments, at value (Note 2) (a) | | | $39,224,166 | | | $195,714,810 |
Repurchase agreements, at value (Note 2) (b) | | | — | | | 2,110,342 |
Total investments (c) | | | 39,224,166 | | | 197,825,152 |
Cash | | | — | | | — |
Foreign currency, at value (d) | | | — | | | — |
Receivables from:
| | | | | | |
Investments sold
| | | | | | |
Regular delivery | | | 460,762 | | | — |
Fund shares sold | | | 10,030 | | | 199,417 |
Interest and dividends | | | 23,601 | | | 35,280 |
Foreign tax reclaims | | | — | | | — |
Prepaid expenses | | | 37,173 | | | 36,949 |
Total assets | | | 39,755,732 | | | 198,096,798 |
Liabilities:
| | | | | | |
Payables for:
| | | | | | |
Investments purchased
| | | | | | |
Regular delivery | | | — | | | — |
Fund shares redeemed | | | 8,441 | | | 669,851 |
Cash collateral held for securities on loan (Note 2) | | | 446,831 | | | — |
Trustees’ fees and expenses (Note 3) | | | 12,689 | | | 18,212 |
Affiliates (Note 3):
| | | | | | |
Administration fees | | | 26,163 | | | 42,917 |
Investment advisory fees | | | 14,949 | | | 74,157 |
Service fees | | | 3,703 | | | 13,651 |
Distribution fees | | | 1,173 | | | 3,496 |
Due to custodian | | | 94,400 | | | — |
Accrued expense and other liabilities | | | 118,494 | | | 101,311 |
Total liabilities | | | 726,843 | | | 923,595 |
Net assets | | | $39,028,889 | | | $197,173,203 |
Net assets consist of:
| | | | | | |
Paid-in capital | | | $28,974,358 | | | $118,507,445 |
Accumulated earnings (loss) | | | 10,054,531 | | | 78,665,758 |
Net assets | | | $39,028,889 | | | $197,173,203 |
(a) Cost of investments: | | | $32,462,733 | | | $144,997,843 |
(b) Cost of repurchase agreements: | | | $— | | | $2,110,342 |
(c) Securities on loan with market value of: | | | $437,140 | | | $556,327 |
(d) Cost of foreign currency: | | | $— | | | $— |
| | | | | | | |
| | | | | |
| | | The accompanying notes are an integral part of the financial statements.
| |
82
| | | | |
| | | | | |
TABLE OF CONTENTS
| | | | | | | | | | |
|
$ 430,207,053 | | | $ 192,188,658 | | | $ 118,085,225 | | | $ 104,517,008 |
6,203,516 | | | 461,474 | | | 3,619,121 | | | 1,914,863 |
436,410,569 | | | 192,650,132 | | | 121,704,346 | | | 106,431,871 |
— | | | 27 | | | 1 | | | 15 |
12,506 | | | 33,604 | | | 75,292 | | | 443,632 |
|
|
642,313 | | | — | | | 66,549 | | | 1,531,328 |
191,888 | | | 74,473 | | | 65,553 | | | 53,114 |
391,865 | | | 40,085 | | | 167,140 | | | 185,702 |
— | | | 326,092 | | | 681,550 | | | 38,248 |
49,795 | | | 29,286 | | | 39,920 | | | 39,741 |
437,698,936 | | | 193,153,699 | | | 122,800,351 | | | 108,723,651 |
|
|
|
15,634 | | | — | | | 56,392 | | | 521,571 |
447,464 | | | 699,932 | | | 70,249 | | | 66,599 |
1,962,671 | | | 2,842,364 | | | 1,924,845 | | | 471,549 |
18,184 | | | 20,509 | | | 30,210 | | | 9,308 |
|
53,224 | | | 44,024 | | | 29,230 | | | 17,580 |
199,396 | | | 118,068 | | | 84,069 | | | 25,290 |
42,167 | | | 20,042 | | | 8,205 | | | 637 |
6,075 | | | 5,851 | | | 1,602 | | | 319 |
— | | | — | | | — | | | — |
84,482 | | | 1,248,636 | | | 134,983 | | | 722,962 |
2,829,297 | | | 4,999,426 | | | 2,339,785 | | | 1,835,815 |
$434,869,639 | | | $188,154,273 | | | $120,460,566 | | | $106,887,836 |
|
$317,945,755 | | | $75,639,042 | | | $103,109,456 | | | $120,238,819 |
116,923,884 | | | 112,515,231 | | | 17,351,110 | | | (13,350,983) |
$434,869,639 | | | $188,154,273 | | | $120,460,566 | | | $106,887,836 |
$348,361,722 | | | $99,515,047 | | | $102,955,895 | | | $92,345,859 |
$6,203,516 | | | $461,474 | | | $3,619,121 | | | $1,914,863 |
$73,265,022 | | | $4,021,998 | | | $5,139,085 | | | $3,200,301 |
$12,525 | | | $33,534 | | | $75,382 | | | $442,775 |
| | | | | | | | | | |
| | | | | |
The accompanying notes are an integral part of the financial statements. | | | | |
| | | 83
| |
| | | | | |
TABLE OF CONTENTS
| | | |
| | MassMutual Funds (Continued) | |
| | | |
Statements of Assets and Liabilities
September 30, 2024
| | | | | | | |
Class I shares:
| | | | | | |
Net assets | | | $ 10,019,243 | | | $ 41,636,750 |
Shares outstanding (a) | | | 664,741 | | | 3,410,023 |
Net asset value, offering price and redemption price per share | | | $15.07 | | | $12.21 |
Class R5 shares:
| | | | | | |
Net assets | | | $13,569,167 | | | $103,667,958 |
Shares outstanding (a) | | | 896,548 | | | 8,499,174 |
Net asset value, offering price and redemption price per share | | | $15.13 | | | $12.20 |
Service Class shares:
| | | | | | |
Net assets | | | $8,585,583 | | | $8,565,828 |
Shares outstanding (a) | | | 575,429 | | | 697,838 |
Net asset value, offering price and redemption price per share | | | $14.92 | | | $12.27 |
Administrative Class shares:
| | | | | | |
Net assets | | | $991,200 | | | $21,907,251 |
Shares outstanding (a) | | | 64,128 | | | 1,744,427 |
Net asset value, offering price and redemption price per share | | | $15.46 | | | $12.56 |
Class R4 shares:
| | | | | | |
Net assets | | | $501,722 | | | $7,467,069 |
Shares outstanding (a) | | | 34,057 | | | 654,892 |
Net asset value, offering price and redemption price per share | | | $14.73 | | | $11.40 |
Class A shares:
| | | | | | |
Net assets | | | $3,583,328 | | | $8,201,692 |
Shares outstanding (a) | | | 243,854 | | | 707,791 |
Net asset value and redemption price per share | | | $14.69 | | | $11.59 |
Maximum Offering price per share (100/[100-maximum sales charge] of net asset value) | | | $15.54 | | | $12.26 |
Class R3 shares:
| | | | | | |
Net assets | | | $1,664,426 | | | $5,572,086 |
Shares outstanding (a) | | | 111,406 | | | 496,403 |
Net asset value, offering price and redemption price per share | | | $14.94 | | | $11.22 |
Class Y shares:
| | | | | | |
Net assets | | | $114,220 | | | $154,569 |
Shares outstanding (a) | | | 7,547 | | | 12,674 |
Net asset value, offering price and redemption price per share | | | $15.13 | | | $12.20 |
| | | | | | | |
(a)
| Authorized unlimited number of shares with no par value. |
| | | | | |
| | | The accompanying notes are an integral part of the financial statements.
| |
84
| | | | |
| | | | | |
TABLE OF CONTENTS
| | | | | | | | | | |
|
$ 219,360,764 | | | $ 54,969,706 | | | $ 72,976,653 | | | $ 103,773,624 |
11,377,489 | | | 4,820,925 | | | 7,809,148 | | | 9,621,345 |
$19.28 | | | $11.40 | | | $9.35 | | | $10.79 |
|
$109,539,214 | | | $50,714,267 | | | $29,483,084 | | | $139,131 |
5,708,269 | | | 4,466,994 | | | 3,153,314 | | | 12,637 |
$19.19 | | | $11.35 | | | $9.35 | | | $11.01 |
|
$16,695,724 | | | $3,979,651 | | | $2,956,638 | | | $1,718,945 |
874,279 | | | 359,270 | | | 317,256 | | | 159,425 |
$19.10 | | | $11.08 | | | $9.32 | | | $10.78 |
|
$22,272,130 | | | $47,136,671 | | | $1,720,006 | | | $238,121 |
1,178,219 | | | 4,210,695 | | | 186,562 | | | 22,044 |
$18.90 | | | $11.19 | | | $9.22 | | | $10.80 |
|
$12,849,096 | | | $9,711,657 | | | $629,837 | | | $452,787 |
711,226 | | | 927,624 | | | 73,976 | | | 42,591 |
$18.07 | | | $10.47 | | | $8.51 | | | $10.63 |
|
$43,168,424 | | | $12,339,405 | | | $10,000,529 | | | $68,386 |
2,374,571 | | | 1,149,879 | | | 1,156,610 | | | 6,368 |
$18.18 | | | $10.73 | | | $8.65 | | | $10.74 |
$19.24 | | | $11.35 | | | $9.15 | | | $11.37 |
|
$9,822,331 | | | $9,302,916 | | | $2,580,786 | | | $496,842 |
554,404 | | | 886,006 | | | 308,409 | | | 47,582 |
$17.72 | | | $10.50 | | | $8.37 | | | $10.44 |
|
$1,161,956 | | | | | | $113,033 | | | |
60,499 | | | | | | 12,092 | | | |
$19.21 | | | | | | $9.35 | | | |
| | | | | | | | | | |
| | | | | |
The accompanying notes are an integral part of the financial statements. | | | | |
| | | 85
| |
| | | | | |
TABLE OF CONTENTS
| | | |
| | MassMutual Funds (Continued) | |
| | | |
Statements of Operations
For the Year Ended September 30, 2024
| | | | | | | |
Investment income (Note 2):
| | | | | | |
Dividends (a) | | | $— | | | $— |
Interest (b) | | | 9,719,744 | | | 8,190,970 |
Securities lending net income | | | — | | | 9,298 |
Total investment income | | | 9,719,744 | | | 8,200,268 |
Expenses (Note 3):
| | | | | | |
Investment advisory fees | | | 634,458 | | | 617,178 |
Custody fees | | | 6,013 | | | 51,663 |
Trustee reporting | | | — | | | 10,754 |
Audit and tax fees | | | 36,170 | | | 53,599 |
Legal fees | | | 6,746 | | | 11,373 |
Proxy fees | | | 1,691 | | | 1,443 |
Accounting & Administration fees | | | 56,031 | | | 66,273 |
Shareholder reporting fees | | | 14,518 | | | 21,397 |
Trustees’ fees | | | 12,589 | | | 9,506 |
Registration and filing fees | | | 32,610 | | | 157,520 |
Transfer agent fees | | | 3,024 | | | 42,003 |
Merger fees | | | — | | | — |
| | | 803,850 | | | 1,042,709 |
Administration fees:
| | | | | | |
Class R5 | | | 181,274 | | | 11,836 |
Service Class | | | — | | | 4,108 |
Administrative Class | | | — | | | 34,431 |
Class R4 | | | — | | | 13,148 |
Class A | | | — | | | 16,404 |
Class R3 | | | — | | | 11,917 |
Class Y | | | — | | | 35,099 |
Class L | | | — | | | 20,218 |
Class C | | | — | | | 386 |
Distribution and Service fees:
| | | | | | |
Class R4 | | | — | | | 16,435 |
Class A | | | — | | | 15,381 |
Class R3 | | | — | | | 29,794 |
Class L | | | — | | | 101,090 |
Class C | | | — | | | 3,856 |
Total expenses | | | 985,124 | | | 1,356,812 |
Expenses waived (Note 3):
| | | | | | |
Class I fees reimbursed by adviser | | | — | | | (86,129) |
Class R5 fees reimbursed by adviser | | | (9,363) | | | (10,129) |
Service Class fees reimbursed by adviser | | | — | | | (1,686) |
Administrative Class fees reimbursed by adviser | | | — | | | (9,902) |
Class R4 fees reimbursed by adviser | | | — | | | (7,117) |
Class A fees reimbursed by adviser | | | — | | | (5,267) |
Class R3 fees reimbursed by adviser | | | — | | | (4,895) |
Class Y fees reimbursed by adviser | | | — | | | (78,677) |
Class L fees reimbursed by adviser | | | — | | | (69,453) |
Class C fees reimbursed by adviser | | | — | | | (1,312) |
Net expenses: | | | 975,761 | | | 1,082,245 |
Net investment income (loss) | | | 8,743,983 | | | 7,118,023 |
| | | | | | | |
+
| Effective September 23, 2024, the MassMutual Strategic Bond Fund reorganized into the MassMutual Core Bond Fund. Prior to September 23, 2024, information provided reflects MassMutual Core Bond Fund, which was the accounting and performance survivor of the reorganization. Please reference Note 7 “Acquisition of MassMutual Strategic Bond Fund” in the Notes to the Financial Statements for additional information. |
| | | | | |
| | | The accompanying notes are an integral part of the financial statements.
| |
86
| | | | |
| | | | | |
TABLE OF CONTENTS
| | | | | | | | | | | | | |
|
$— | | | $— | | | $35,334 | | | $— | | | $1,092,023 |
12,810,363 | | | 35,329,634 | | | 7,215,429 | | | 30,259,580 | | | 1,394,789 |
57 | | | 11,451 | | | 9,884 | | | 158,355 | | | — |
12,810,420 | | | 35,341,085 | | | 7,260,647 | | | 30,417,935 | | | 2,486,812 |
|
946,753 | | | 2,544,115 | | | 528,588 | | | 1,858,393 | | | 499,673 |
48,189 | | | 70,968 | | | 47,355 | | | 82,621 | | | 51,685 |
— | | | — | | | — | | | 21,427 | | | — |
54,695 | | | 54,525 | | | 57,125 | | | 53,877 | | | 54,367 |
9,231 | | | 28,363 | | | 4,027 | | | 5,960 | | | 24,630 |
1,443 | | | 1,353 | | | 1,443 | | | 1,443 | | | 1,443 |
52,311 | | | 78,264 | | | 67,232 | | | 76,386 | | | 56,386 |
56,384 | | | 69,974 | | | 38,959 | | | 54,778 | | | 36,052 |
17,586 | | | 46,373 | | | 9,720 | | | 28,161 | | | 7,236 |
119,870 | | | 117,260 | | | 114,847 | | | 140,233 | | | 113,950 |
3,024 | | | 3,024 | | | 3,024 | | | 37,129 | | | 3,024 |
— | | | 10,000 | | | — | | | — | | | — |
1,309,486 | | | 3,024,219 | | | 872,320 | | | 2,360,408 | | | 848,446 |
|
48,570 | | | 95,674 | | | 65,559 | | | 36,113 | | | 24,327 |
35,890 | | | 51,100 | | | 7,817 | | | 40,735 | | | 17,855 |
18,773 | | | 97,216 | | | 11,111 | | | 39,825 | | | 5,361 |
5,484 | | | 3,598 | | | 5,741 | | | 32,944 | | | 10,555 |
21,505 | | | 56,635 | | | 10,843 | | | 18,360 | | | 33,726 |
4,359 | | | 503 | | | 2,184 | | | 49,595 | | | 20,404 |
99 | | | 567 | | | 96 | | | 13,137 | | | 111 |
— | | | — | | | — | | | — | | | — |
— | | | — | | | — | | | — | | | — |
|
6,855 | | | 4,497 | | | 7,176 | | | 41,180 | | | 13,194 |
20,140 | | | 53,019 | | | 10,067 | | | 17,174 | | | 31,622 |
10,896 | | | 1,258 | | | 5,460 | | | 123,988 | | | 51,010 |
— | | | — | | | — | | | — | | | — |
— | | | — | | | — | | | 1,074 | | | — |
1,482,057 | | | 3,388,286 | | | 998,374 | | | 2,774,533 | | | 1,056,611 |
|
(20,145) | | | (103,627) | | | (9,609) | | | (98,854) | | | — |
(5,976) | | | (20,583) | | | (12,326) | | | (15,062) | | | — |
(1,991) | | | (5,312) | | | (726) | | | (8,034) | | | — |
(694) | | | (6,998) | | | (689) | | | (5,397) | | | — |
(296) | | | (418) | | | (420) | | | (6,596) | | | — |
(1,023) | | | (4,464) | | | (688) | | | (2,745) | | | — |
(269) | | | (67) | | | (203) | | | (10,510) | | | — |
(13) | | | (142) | | | (19) | | | (10,396) | | | — |
— | | | — | | | — | | | — | | | — |
— | | | — | | | — | | | (46) | | | — |
1,451,650 | | | 3,246,675 | | | 973,694 | | | 2,616,893 | | | 1,056,611 |
11,358,770 | | | 32,094,410 | | | 6,286,953 | | | 27,801,042 | | | 1,430,201 |
| | | | | | | | | | | | | |
| | | | | |
The accompanying notes are an integral part of the financial statements. | | | | |
| | | 87
| |
| | | | | |
TABLE OF CONTENTS
| | | |
| | MassMutual Funds (Continued) | |
| | | |
Statements of Operations
For the Year Ended September 30, 2024
| | | | | | | |
Realized and unrealized gain (loss):
| | | | | | |
Net realized gain (loss) on:
| | | | | | |
Investment transactions | | | 108 | | | (19,887,633) |
Futures contracts | | | — | | | (619,798) |
Written options | | | — | | | — |
Swap agreements | | | — | | | (542,055) |
Foreign currency transactions | | | — | | | — |
Forward contracts | | | — | | | — |
Net realized gain (loss) | | | 108 | | | (21,049,486) |
Net change in unrealized appreciation (depreciation) on:
| | | | | | |
Investment transactions | | | — | | | 31,523,386 |
Futures contracts | | | — | | | (34,615) |
Written options | | | — | | | — |
Swap agreements | | | — | | | 16,313 |
Translation of assets and liabilities in foreign currencies | | | — | | | 10 |
Forward contracts | | | — | | | — |
Net change in unrealized appreciation (depreciation) | | | — | | | 31,505,094 |
Net realized gain (loss) and change in unrealized appreciation (depreciation) | | | 108 | | | 10,455,608 |
Net increase (decrease) in net assets resulting from operations | | | $ 8,744,091 | | | $ 17,573,631 |
(a) Net of foreign withholding tax of: | | | $— | | | $— |
(b) Net of foreign withholding tax of: | | | $— | | | $664 |
| | | | | | | |
+
| Effective September 23, 2024, the MassMutual Strategic Bond Fund reorganized into the MassMutual Core Bond Fund. Prior to September 23, 2024, information provided reflects MassMutual Core Bond Fund, which was the accounting and performance survivor of the reorganization. Please reference Note 7 “Acquisition of MassMutual Strategic Bond Fund” in the Notes to the Financial Statements for additional information. |
| | | | | |
| | | The accompanying notes are an integral part of the financial statements.
| |
88
| | | | |
| | | | | |
TABLE OF CONTENTS
| | | | | | | | | | | | | |
|
|
(1,235,773) | | | (9,350,953) | | | (6,719,712) | | | (8,428,430) | | | 6,798,634 |
(492,648) | | | 927,129 | | | 230,289 | | | — | | | (45,370) |
— | | | — | | | 22,904 | | | — | | | — |
(5,519,040) | | | (2,937,406) | | | (559,950) | | | — | | | — |
(1) | | | 11 | | | (20,042) | | | — | | | (2) |
— | | | — | | | (145,004) | | | — | | | — |
(7,247,462) | | | (11,361,219) | | | (7,191,515) | | | (8,428,430) | | | 6,753,262 |
|
9,096,256 | | | 61,995,762 | | | 16,418,602 | | | 40,442,790 | | | 15,741,660 |
(478,023) | | | 3,232,503 | | | 979,298 | | | — | | | (40,450) |
— | | | — | | | (8,935) | | | — | | | — |
13,025,045 | | | 190,143 | | | (14,889) | | | — | | | — |
— | | | 676 | | | 20,005 | | | 1,969 | | | — |
— | | | — | | | 72,154 | | | — | | | — |
21,643,278 | | | 65,419,084 | | | 17,466,235 | | | 40,444,759 | | | 15,701,210 |
14,395,816 | | | 54,057,865 | | | 10,274,720 | | | 32,016,329 | | | 22,454,472 |
$ 25,754,586 | | | $ 86,152,275 | | | $ 16,561,673 | | | $ 59,817,371 | | | $ 23,884,673 |
|
$— | | | $— | | | $— | | | $— | | | $184 |
$— | | | $— | | | $— | | | $— | | | $— |
| | | | | | | | | | | | | |
| | | | | |
The accompanying notes are an integral part of the financial statements. | | | | |
| | | 89
| |
| | | | | |
TABLE OF CONTENTS
| | | |
| | MassMutual Funds (Continued) | |
| | | |
Statements of Operations
For the Year Ended September 30, 2024
| | | | | | | |
Investment income (Note 2):
| | | | | | |
Dividends (a) | | | $934,750 | | | $1,047,874 |
Interest | | | 3,801 | | | 19,683 |
Securities lending net income | | | 3,567 | | | 4,644 |
Total investment income | | | 942,118 | | | 1,072,201 |
Expenses (Note 3):
| | | | | | |
Investment advisory fees | | | 190,547 | | | 826,097 |
Custody fees | | | 54,783 | | | 29,272 |
Audit and tax fees | | | 49,095 | | | 46,840 |
Legal fees | | | 2,265 | | | 5,223 |
Proxy fees | | | 1,443 | | | 1,443 |
Accounting & Administration fees | | | 26,621 | | | 28,732 |
Shareholder reporting fees | | | 18,801 | | | 19,219 |
Trustees’ fees | | | 3,229 | | | 13,310 |
Registration and filing fees | | | 113,393 | | | 113,796 |
Transfer agent fees | | | 3,024 | | | 3,024 |
| | | 463,201 | | | 1,086,956 |
Administration fees:
| | | | | | |
Class R5 | | | 15,138 | | | 90,997 |
Service Class | | | 19,041 | | | 18,557 |
Administrative Class | | | 2,908 | | | 65,884 |
Class R4 | | | 777 | | | 13,231 |
Class A | | | 10,266 | | | 23,760 |
Class R3 | | | 3,888 | | | 10,338 |
Class Y | | | 102 | | | 135 |
Distribution and Service fees:
| | | | | | |
Class R4 | | | 971 | | | 16,538 |
Class A | | | 9,561 | | | 22,300 |
Class R3 | | | 9,720 | | | 25,846 |
Total expenses | | | 535,573 | | | 1,374,542 |
Expenses waived (Note 3):
| | | | | | |
Class I fees reimbursed by adviser | | | — | | | — |
Class R5 fees reimbursed by adviser | | | — | | | — |
Service Class fees reimbursed by adviser | | | — | | | — |
Administrative Class fees reimbursed by adviser | | | — | | | — |
Class R4 fees reimbursed by adviser | | | — | | | — |
Class A fees reimbursed by adviser | | | — | | | — |
Class R3 fees reimbursed by adviser | | | — | | | — |
Class Y fees reimbursed by adviser | | | — | | | — |
Investment advisory fees waived | | | — | | | — |
Net expenses: | | | 535,573 | | | 1,374,542 |
Net investment income (loss) | | | 406,545 | | | (302,341) |
| | | | | | | |
| | | | | |
| | | The accompanying notes are an integral part of the financial statements.
| |
90
| | | | |
| | | | | |
TABLE OF CONTENTS
| | | | | | | | | | |
|
$4,644,510 | | | $1,554,988 | | | $2,909,568 | | | $2,077,540 |
107,807 | | | 16,686 | | | 57,095 | | | 47,190 |
40,139 | | | 18,034 | | | 17,397 | | | 2,808 |
4,792,456 | | | 1,589,708 | | | 2,984,060 | | | 2,127,538 |
|
2,126,506 | | | 1,430,664 | | | 982,391 | | | 1,026,058 |
21,592 | | | 65,018 | | | 73,222 | | | 136,181 |
49,467 | | | 96,310 | | | 68,844 | | | 80,372 |
13,549 | | | 7,244 | | | 4,475 | | | 1,652 |
1,443 | | | 1,443 | | | 1,447 | | | 1,443 |
30,133 | | | 26,596 | | | 27,517 | | | 22,938 |
48,538 | | | 33,044 | | | 36,820 | | | 41,933 |
26,234 | | | 13,415 | | | 8,354 | | | 7,304 |
127,272 | | | 104,463 | | | 126,170 | | | 103,398 |
3,024 | | | 3,024 | | | 2,774 | | | 3,024 |
2,447,758 | | | 1,781,221 | | | 1,332,014 | | | 1,424,303 |
|
108,970 | | | 51,301 | | | 28,735 | | | 159 |
31,786 | | | 8,006 | | | 5,756 | | | 3,070 |
65,651 | | | 150,968 | | | 5,769 | | | 788 |
29,218 | | | 19,201 | | | 1,153 | | | 820 |
103,704 | | | 32,355 | | | 25,861 | | | 203 |
17,655 | | | 16,864 | | | 4,778 | | | 1,008 |
545 | | | — | | | 102 | | | — |
|
36,522 | | | 24,001 | | | 1,441 | | | 1,025 |
97,562 | | | 30,458 | | | 24,184 | | | 187 |
44,136 | | | 42,160 | | | 11,946 | | | 2,520 |
2,983,507 | | | 2,156,535 | | | 1,441,739 | | | 1,434,083 |
|
(5,487) | | | — | | | — | | | (237,308) |
(2,778) | | | — | | | — | | | (361) |
(344) | | | — | | | — | | | (3,691) |
(549) | | | — | | | — | | | (619) |
(353) | | | — | | | — | | | (979) |
(1,079) | | | — | | | — | | | (171) |
(244) | | | — | | | — | | | (1,206) |
(25) | | | — | | | — | | | — |
— | | | — | | | (59,180) | | | — |
2,972,648 | | | 2,156,535 | | | 1,382,559 | | | 1,189,748 |
1,819,808 | | | (566,827) | | | 1,601,501 | | | 937,790 |
| | | | | | | | | | |
| | | | | |
The accompanying notes are an integral part of the financial statements. | | | | |
| | | 91
| |
| | | | | |
TABLE OF CONTENTS
| | | |
| | MassMutual Funds (Continued) | |
| | | |
Statements of Operations
For the Year Ended September 30, 2024
| | | | | | | |
Realized and unrealized gain (loss):
| | | | | | |
Net realized gain (loss) on:
| | | | | | |
Investment transactions | | | 3,223,034 | | | 29,408,099 |
Foreign currency transactions | | | — | | | — |
Net realized gain (loss) | | | 3,223,034 | | | 29,408,099 |
Net change in unrealized appreciation (depreciation) on:
| | | | | | |
Investment transactions | | | 5,466,166 | | | 36,806,565 |
Translation of assets and liabilities in foreign currencies | | | — | | | — |
Net change in unrealized appreciation (depreciation) | | | 5,466,166 | | | 36,806,565 |
Net realized gain (loss) and change in unrealized appreciation (depreciation) | | | 8,689,200 | | | 66,214,664 |
Net increase (decrease) in net assets resulting from operations | | | $ 9,095,745 | | | $ 65,912,323 |
(a) Net of foreign withholding tax of: | | | $— | | | $— |
* Net of net increase (decrease) in accrued foreign capital gains tax of: | | | $— | | | $— |
| | | | | | | |
| | | | | |
| | | The accompanying notes are an integral part of the financial statements.
| |
92
| | | | |
| | | | | |
TABLE OF CONTENTS
| | | | | | | | | | |
|
|
34,006,080 | | | 27,718,250 | | | 3,556,183 | | | 1,164,678 |
(1,786) | | | (3,853) | | | 7,288 | | | (76,934) |
34,004,294 | | | 27,714,397 | | | 3,563,471 | | | 1,087,744 |
|
55,468,561 | | | 28,051,269 * | | | 18,030,346 | | | 12,622,191* |
(15) | | | 14,420 | | | 43,937 | | | 9,767 |
55,468,546 | | | 28,065,689 | | | 18,074,283 | | | 12,631,958 |
89,472,840 | | | 55,780,086 | | | 21,637,754 | | | 13,719,702 |
$ 91,292,648 | | | $ 55,213,259 | | | $ 23,239,255 | | | $ 14,657,492 |
$8,304 | | | $160,029 | | | $294,010 | | | $260,305 |
$— | | | $(610,826) | | | $— | | | $(198,615) |
| | | | | | | | | | |
| | | | | |
The accompanying notes are an integral part of the financial statements. | | | | |
| | | 93
| |
| | | | | |
TABLE OF CONTENTS
| | | |
| | MassMutual Funds (Continued) | |
| | | |
Statements of Changes in Net Assets
| | | | |
Increase (Decrease) in Net Assets:
| | | | | | |
Operations:
| | | | | | |
Net investment income (loss) | | | $8,743,983 | | | $7,696,118 |
Net realized gain (loss) | | | 108 | | | 321 |
Net change in unrealized appreciation (depreciation) | | | — | | | — |
Net increase (decrease) in net assets resulting from operations | | | 8,744,091 | | | 7,696,439 |
Distributions to shareholders (Note 2):
| | | | | | |
Class I | | | — | | | — |
Class R5 | | | (8,744,012) | | | (7,696,593) |
Service Class | | | — | | | — |
Administrative Class | | | — | | | — |
Class R4 | | | — | | | — |
Class A | | | — | | | — |
Class R3 | | | — | | | — |
Class Y | | | — | | | — |
Class L | | | — | | | — |
Class C | | | — | | | — |
Total distributions | | | (8,744,012) | | | (7,696,593) |
Tax return of capital:
| | | | | | |
Class I | | | — | | | — |
Class R5 | | | — | | | — |
Service Class | | | — | | | — |
Administrative Class | | | — | | | — |
Class R4 | | | — | | | — |
Class A | | | — | | | — |
Class R3 | | | — | | | — |
Class Y | | | — | | | — |
Class L | | | — | | | — |
Class C | | | — | | | — |
Total tax return of capital | | | — | | | — |
Net fund share transactions (Note 5):
| | | | | | |
Class I | | | — | | | — |
Class R5 | | | 1,454,903 | | | (33,219,795) |
Service Class | | | — | | | — |
Administrative Class | | | — | | | — |
Class R4 | | | — | | | — |
Class A | | | — | | | — |
Class R3 | | | — | | | — |
Class Y | | | — | | | — |
Class L | | | — | | | — |
Class C | | | — | | | — |
Increase (decrease) in net assets from fund share transactions | | | 1,454,903 | | | (33,219,795) |
Total increase (decrease) in net assets | | | 1,454,982 | | | (33,219,949) |
Net assets
| | | | | | |
Beginning of year | | | 172,108,372 | | | 205,328,321 |
End of year | | | $ 173,563,354 | | | $ 172,108,372 |
| | | | | | | |
*
| Commenced operations on February 1, 2023. |
| | | | | |
| | | The accompanying notes are an integral part of the financial statements.
| |
94
| | | | |
| | | | | |
TABLE OF CONTENTS
| | | | |
|
|
$7,118,023 | | | $10,009,542 | | | $11,358,770 | | | $10,561,885 |
(21,049,486) | | | (37,538,076) | | | (7,247,462) | | | (24,267,730) |
31,505,094 | | | 37,179,707 | | | 21,643,278 | | | 19,176,541 |
17,573,631 | | | 9,651,173 | | | 25,754,586 | | | 5,470,696 |
|
(2,189,172) | | | (3,308,878) | | | (10,449,460) | | | (6,485,045) |
(444,245) | | | (876,994) | | | (3,043,431) | | | (2,502,538) |
(75,025) | | | (102,714) | | | (1,045,119) | | | (1,108,108) |
(409,315) | | | (324,168) | | | (374,784) | | | (279,683) |
(231,129) | | | (184,942) | | | (144,067) | | | (151,257) |
(205,546) | | | (202,700) | | | (433,489) | | | (277,944) |
(187,095) | | | (197,586) | | | (112,043) | | | (69,335) |
(1,361,925) | | | (3,736,266) | | | (6,095) | | | — |
(1,463,561) | | | (1,945,558) | | | — | | | — |
(26,137) | | | (32,732) | | | — | | | — |
(6,593,150) | | | (10,912,538) | | | (15,608,488) | | | (10,873,910) |
|
— | | | (39,122) | | | — | | | — |
— | | | (10,369) | | | — | | | — |
— | | | (1,214) | | | — | | | — |
— | | | (3,833) | | | — | | | — |
— | | | (2,187) | | | — | | | — |
— | | | (2,397) | | | — | | | — |
— | | | (2,336) | | | — | | | — |
— | | | (44,174) | | | — | | | — |
— | | | (23,003) | | | — | | | — |
— | | | (387) | | | — | | | — |
— | | | (129,022) | | | — | | | — |
|
(27,497,236) | | | (53,385,498) | | | (13,010,647) | | | 3,108,492 |
(552,456) | | | (19,277,163) | | | (3,745,837) | | | (15,484,149) |
(1,447,095) | | | 453,367 | | | (6,271,371) | | | (9,153,994) |
(332,794) | | | 1,139,234 | | | (2,171,230) | | | (744,313) |
4,771,191 | | | (5,426,682) | | | (1,551,953) | | | (681,621) |
(483,249) | | | (1,541,741) | | | 73,948 | | | (802,215) |
(1,708,469) | | | (918,891) | | | 46,116 | | | (270,924) |
(12,712,051) | | | (175,479,422) | | | 230 | | | 100,000 * |
(26,761,850) | | | (30,588,796) | | | — | | | — |
(152,473) | | | (226,678) | | | — | | | — |
(66,876,482) | | | (285,252,270) | | | (26,630,744) | | | (23,928,724) |
(55,896,001) | | | (286,642,657) | | | (16,484,646) | | | (29,331,938) |
|
212,981,865 | | | 499,624,522 | | | 260,583,582 | | | 289,915,520 |
$ 157,085,864 | | | $ 212,981,865 | | | $ 244,098,936 | | | $ 260,583,582 |
| | | | | | | | | | |
| | | | | |
The accompanying notes are an integral part of the financial statements. | | | | |
| | | 95
| |
| | | | | |
TABLE OF CONTENTS
| | | |
| | MassMutual Funds (Continued) | |
| | | |
Statements of Changes in Net Assets
| | | | |
Increase (Decrease) in Net Assets:
| | | | | | |
Operations:
| | | | | | |
Net investment income (loss) | | | $32,094,410 | | | $32,777,099 |
Net realized gain (loss) | | | (11,361,219) | | | (44,206,762) |
Net change in unrealized appreciation (depreciation) | | | 65,419,084 | | | 19,529,329 |
Net increase (decrease) in net assets resulting from operations | | | 86,152,275 | | | 8,099,666 |
Distributions to shareholders (Note 2):
| | | | | | |
Class I | | | (40,136,674) | | | (18,947,053) |
Class R5 | | | (7,605,434) | | | (5,049,706) |
Service Class | | | (1,891,061) | | | (1,323,476) |
Administrative Class | | | (2,478,143) | | | (1,260,653) |
Class R4 | | | (120,279) | | | (58,399) |
Class A | | | (1,509,569) | | | (772,091) |
Class R3 | | | (14,892) | | | (5,295) |
Class Y | | | (29,646) | | | — |
Class C | | | — | | | — |
Total distributions | | | (53,785,698) | | | (27,416,673) |
Net fund share transactions (Note 5):
| | | | | | |
Class I | | | 242,538,186 | | | 21,198,419 |
Class R5 | | | 48,000,069 | | | (39,642,243) |
Service Class | | | 4,970,114 | | | (6,333,157) |
Administrative Class | | | 4,925,043 | | | (3,493,050) |
Class R4 | | | 18,431,557 | | | (834,390) |
Class A | | | 7,180,960 | | | (1,400,222) |
Class R3 | | | 3,962,877 | | | (3,658) |
Class Y | | | 3,968,772 | | | 100,000 * |
Class C | | | — | | | — |
Increase (decrease) in net assets from fund share transactions | | | 333,977,578 | | | (30,408,301) |
Total increase (decrease) in net assets | | | 366,344,155 | | | (49,725,308) |
Net assets
| | | | | | |
Beginning of year | | | 668,763,468 | | | 718,488,776 |
End of year | | | $ 1,035,107,623 | | | $ 668,763,468 |
| | | | | | | |
*
| Commenced operations on February 1, 2023. |
| | | | | |
| | | The accompanying notes are an integral part of the financial statements.
| |
96
| | | | |
| | | | | |
TABLE OF CONTENTS
| | | | |
|
|
$6,286,953 | | | $7,284,900 | | | $27,801,042 | | | $25,114,192 |
(7,191,515) | | | (9,858,082) | | | (8,428,430) | | | (20,871,649) |
17,466,235 | | | 4,031,077 | | | 40,444,759 | | | 33,949,166 |
16,561,673 | | | 1,457,895 | | | 59,817,371 | | | 38,191,709 |
|
(4,094,531) | | | (3,066,113) | | | (17,898,093) | | | (16,023,785) |
(5,721,867) | | | (2,434,368) | | | (2,549,886) | | | (2,147,884) |
(341,259) | | | (190,793) | | | (1,414,181) | | | (1,399,388) |
(309,178) | | | (338,479) | | | (909,388) | | | (805,064) |
(291,894) | | | (150,025) | | | (1,103,163) | | | (1,415,359) |
(342,709) | | | (189,315) | | | (455,417) | | | (493,437) |
(84,938) | | | (50,765) | | | (1,603,752) | | | (1,394,875) |
(8,489) | | | — | | | (1,863,291) | | | (1,711,818) |
— | | | — | | | (6,636) | | | (5,020) |
(11,194,865) | | | (6,419,858) | | | (27,803,807) | | | (25,396,630) |
|
(25,822,733) | | | 3,113,199 | | | (26,792,695) | | | 23,134,345 |
2,941,547 | | | 6,269,488 | | | 3,193,466 | | | (2,543,088) |
(379,460) | | | (992,171) | | | (3,645,131) | | | (2,005,567) |
(1,063,196) | | | (3,181,064) | | | (1,454,696) | | | (733,839) |
(2,259,714) | | | 783,745 | | | (1,828,568) | | | (14,766,226) |
(982,660) | | | (498,374) | | | (938,051) | | | (1,519,440) |
(76,807) | | | (198,615) | | | 2,425,766 | | | (2,442,085) |
— | | | 100,000 * | | | (5,880,715) | | | 5,082,253 |
— | | | — | | | 68,832 | | | 12,873 |
(27,643,023) | | | 5,396,208 | | | (34,851,792) | | | 4,219,226 |
(22,276,215) | | | 434,245 | | | (2,838,228) | | | 17,014,305 |
|
156,982,427 | | | 156,548,182 | | | 402,167,563 | | | 385,153,258 |
$ 134,706,212 | | | $ 156,982,427 | | | $ 399,329,335 | | | $ 402,167,563 |
| | | | | | | | | | |
| | | | | |
The accompanying notes are an integral part of the financial statements. | | | | |
| | | 97
| |
| | | | | |
TABLE OF CONTENTS
| | | |
| | MassMutual Funds (Continued) | |
| | | |
Statements of Changes in Net Assets
| | | | |
Increase (Decrease) in Net Assets:
| | | | | | |
Operations:
| | | | | | |
Net investment income (loss) | | | $1,430,201 | | | $1,776,033 |
Net realized gain (loss) | | | 6,753,262 | | | (1,290,556) |
Net change in unrealized appreciation (depreciation) | | | 15,701,210 | | | 11,790,990 |
Net increase (decrease) in net assets resulting from operations | | | 23,884,673 | | | 12,276,467 |
Distributions to shareholders (Note 2):
| | | | | | |
Class I | | | (723,616) | | | (834,824) |
Class R5 | | | (396,171) | | | (506,260) |
Service Class | | | (130,066) | | | (114,812) |
Administrative Class | | | (53,892) | | | (91,105) |
Class R4 | | | (76,162) | | | (65,417) |
Class A | | | (157,071) | | | (167,111) |
Class R3 | | | (112,924) | | | (108,827) |
Class Y | | | (1,775) | | | — |
Total distributions | | | (1,651,677) | | | (1,888,356) |
Net fund share transactions (Note 5):
| | | | | | |
Class I | | | (5,511,108) | | | (10,052,972) |
Class R5 | | | (6,276,565) | | | (5,639,482) |
Service Class | | | (329,955) | | | (259,810) |
Administrative Class | | | (2,698,418) | | | (3,510,700) |
Class R4 | | | (770,920) | | | (25,310) |
Class A | | | (1,843,172) | | | (2,260,526) |
Class R3 | | | 547,814 | | | (1,260,911) |
Class Y | | | — | | | 100,000 * |
Increase (decrease) in net assets from fund share transactions | | | (16,882,324) | | | (22,909,711) |
Total increase (decrease) in net assets | | | 5,350,672 | | | (12,521,600) |
Net assets
| | | | | | |
Beginning of year | | | 102,267,893 | | | 114,789,493 |
End of year | | | $ 107,618,565 | | | $ 102,267,893 |
| | | | | | | |
*
| Commenced operations on February 1, 2023. |
| | | | | |
| | | The accompanying notes are an integral part of the financial statements.
| |
98
| | | | |
| | | | | |
TABLE OF CONTENTS
| | | | |
|
|
$406,545 | | | $833,586 | | | $(302,341) | | | $166,428 |
3,223,034 | | | 1,977,748 | | | 29,408,099 | | | 6,445,246 |
5,466,166 | | | 7,544,162 | | | 36,806,565 | | | 27,318,816 |
9,095,745 | | | 10,355,496 | | | 65,912,323 | | | 33,930,490 |
|
(632,068) | | | (2,730,325) | | | (1,615,353) | | | (916,567) |
(1,110,403) | | | (2,040,561) | | | (3,517,567) | | | (3,740,607) |
(732,368) | | | (1,301,070) | | | (356,459) | | | (712,618) |
(60,562) | | | (119,698) | | | (877,160) | | | (1,134,152) |
(12,495) | | | (137,935) | | | (300,501) | | | (305,507) |
(286,793) | | | (437,484) | | | (402,264) | | | (744,187) |
(116,304) | | | (388,059) | | | (219,465) | | | (206,964) |
(7,162) | | | — | | | (5,349) | | | — |
(2,958,155) | | | (7,155,132) | | | (7,294,118) | | | (7,760,602) |
|
(17,395,264) | | | 257,915 | | | (5,546,394) | | | 12,682,155 |
(7,075,121) | | | (2,594,356) | | | 1,367,440 | | | (13,137,877) |
(3,412,322) | | | (1,961,343) | | | (7,056,823) | | | (4,241,389) |
(477,608) | | | 105,908 | | | (5,260,335) | | | (7,365,749) |
51,781 | | | (998,296) | | | (938,506) | | | (986,886) |
(1,198,715) | | | (249,420) | | | (2,743,064) | | | (8,570,392) |
(488,723) | | | (2,168,024) | | | (502,122) | | | (178,596) |
— | | | 100,000 * | | | — | | | 100,000 * |
(29,995,972) | | | (7,507,616) | | | (20,679,804) | | | (21,698,734) |
(23,858,382) | | | (4,307,252) | | | 37,938,401 | | | 4,471,154 |
|
62,887,271 | | | 67,194,523 | | | 159,234,802 | | | 154,763,648 |
$ 39,028,889 | | | $ 62,887,271 | | | $ 197,173,203 | | | $ 159,234,802 |
| | | | | | | | | | |
| | | | | |
The accompanying notes are an integral part of the financial statements. | | | | |
| | | 99
| |
| | | | | |
TABLE OF CONTENTS
| | | |
| | MassMutual Funds (Continued) | |
| | | |
Statements of Changes in Net Assets
| | | | |
Increase (Decrease) in Net Assets:
| | | | | | |
Operations:
| | | | | | |
Net investment income (loss) | | | $1,819,808 | | | $1,569,331 |
Net realized gain (loss) | | | 34,004,294 | | | 14,217,264 |
Net change in unrealized appreciation (depreciation) | | | 55,468,546 | | | 22,002,464 |
Net increase (decrease) in net assets resulting from operations | | | 91,292,648 | | | 37,789,059 |
Distributions to shareholders (Note 2):
| | | | | | |
Class I | | | (6,676,666) | | | (1,468,645) |
Class R5 | | | (5,186,500) | | | (1,410,819) |
Service Class | | | (766,370) | | | (207,096) |
Administrative Class | | | (1,035,678) | | | (242,408) |
Class R4 | | | (720,788) | | | (128,301) |
Class A | | | (1,811,705) | | | (357,876) |
Class R3 | | | (406,374) | | | (61,858) |
Class Y | | | (4,792) | | | — |
Total distributions | | | (16,608,873) | | | (3,877,003) |
Net fund share transactions (Note 5):
| | | | | | |
Class I | | | 59,189,534 | | | 19,726,109 |
Class R5 | | | (16,489,541) | | | (7,603,679) |
Service Class | | | (2,139,233) | | | (2,169,683) |
Administrative Class | | | (3,274,170) | | | (1,184,446) |
Class R4 | | | (3,807,912) | | | 729,008 |
Class A | | | (841,795) | | | (6,761,451) |
Class R3 | | | 478,485 | | | (334,449) |
Class Y | | | 967,284 | | | 100,000 * |
Increase (decrease) in net assets from fund share transactions | | | 34,082,652 | | | 2,501,409 |
Total increase (decrease) in net assets | | | 108,766,427 | | | 36,413,465 |
Net assets
| | | | | | |
Beginning of year | | | 326,103,212 | | | 289,689,747 |
End of year | | | $ 434,869,639 | | | $ 326,103,212 |
| | | | | | | |
*
| Commenced operations on February 1, 2023. |
| | | | | |
| | | The accompanying notes are an integral part of the financial statements.
| |
100
| | | | |
| | | | | |
TABLE OF CONTENTS
| | | | |
|
|
$(566,827) | | | $(358,314) | | | $1,601,501 | | | $2,164,000 |
27,714,397 | | | 39,566,304 | | | 3,563,471 | | | 325,214 |
28,065,689 | | | 15,219,762 | | | 18,074,283 | | | 17,836,400 |
55,213,259 | | | 54,427,752 | | | 23,239,255 | | | 20,325,614 |
|
(12,522,119) | | | (12,546,325) | | | (2,460,099) | | | (4,199,952) |
(11,551,942) | | | (13,889,612) | | | (972,915) | | | (1,950,265) |
(950,873) | | | (1,359,215) | | | (95,641) | | | (154,615) |
(11,606,738) | | | (10,936,495) | | | (62,526) | | | (141,221) |
(2,340,010) | | | (2,097,768) | | | (18,101) | | | (33,604) |
(2,779,676) | | | (2,182,359) | | | (312,344) | | | (544,895) |
(1,893,964) | | | (1,873,279) | | | (71,282) | | | (130,573) |
— | | | — | | | (3,327) | | | — |
(43,645,322) | | | (44,885,053) | | | (3,996,235) | | | (7,155,125) |
|
3,476,953 | | | (11,792,685) | | | (9,149,308) | | | (3,620,656) |
2,919,396 | | | (17,628,169) | | | (5,432,261) | | | (4,249,875) |
91,559 | | | (2,115,174) | | | (990,872) | | | 594,398 |
(6,605,617) | | | 2,705,642 | | | (475,126) | | | (644,826) |
343,503 | | | (96,932) | | | (1,435) | | | (265,108) |
1,104,000 | | | 1,243,342 | | | (1,432,620) | | | (151,139) |
1,456,707 | | | (818,187) | | | (36,174) | | | (60,727) |
— | | | — | | | — | | | 100,000 * |
2,786,501 | | | (28,502,163) | | | (17,517,796) | | | (8,297,933) |
14,354,438 | | | (18,959,464) | | | 1,725,224 | | | 4,872,556 |
|
173,799,835 | | | 192,759,299 | | | 118,735,342 | | | 113,862,786 |
$ 188,154,273 | | | $ 173,799,835 | | | $ 120,460,566 | | | $ 118,735,342 |
| | | | | | | | | | |
| | | | | |
The accompanying notes are an integral part of the financial statements. | | | | |
| | | 101
| |
| | | | | |
TABLE OF CONTENTS
| | | |
| | MassMutual Funds (Continued) | |
| | | |
Statements of Changes in Net Assets
| | | | |
Increase (Decrease) in Net Assets:
| | | | | | |
Operations:
| | | | | | |
Net investment income (loss) | | | $937,790 | | | $806,348 |
Net realized gain (loss) | | | 1,087,744 | | | (12,173,908) |
Net change in unrealized appreciation (depreciation) | | | 12,631,958 | | | 28,094,437 |
Net increase (decrease) in net assets resulting from operations | | | 14,657,492 | | | 16,726,877 |
Distributions to shareholders (Note 2):
| | | | | | |
Class I | | | (116,712) | | | (454,812) |
Class R5 | | | (56) | | | — |
Service Class | | | — | | | (2,309) |
Administrative Class | | | — | | | (69) |
Total distributions | | | (116,768) | | | (457,190) |
Net fund share transactions (Note 5):
| | | | | | |
Class I | | | (9,023,096) | | | (22,442,122) |
Class R5 | | | (153,416) | | | 10,933 |
Service Class | | | 132,899 | | | (180,384) |
Administrative Class | | | (87,339) | | | 22,198 |
Class R4 | | | 16,749 | | | 30,814 |
Class A | | | (94,712) | | | (6,554) |
Class R3 | | | (63,684) | | | (135,227) |
Increase (decrease) in net assets from fund share transactions | | | (9,272,599) | | | (22,700,342) |
Total increase (decrease) in net assets | | | 5,268,125 | | | (6,430,655) |
Net assets
| | | | | | |
Beginning of year | | | 101,619,711 | | | 108,050,366 |
End of year | | | $ 106,887,836 | | | $ 101,619,711 |
| | | | | | | |
| | | | | |
| | | The accompanying notes are an integral part of the financial statements.
| |
102
| | | | |
| | | | | |
TABLE OF CONTENTS
| | | |
| | MassMutual Funds (Continued) | |
| | | |
Financial Highlights (For a share outstanding throughout each period)
MassMutual U.S. Government Money Market Fund
| | | | | | | | | | | | | | | | | | | |
Class R5 | | | | | | | | | | | | | | | | | | | | | | | | | | | | | | | | | | | | | | | |
9/30/24 | | | $1.00 | | | $0.05 | | | $0.00d | | | $0.05 | | | $(0.05) | | | $ — | | | $(0.05) | | | $1.00 | | | 4.96% | | | $173,563 | | | 0.54% | | | 0.53% | | | 4.82% |
9/30/23 | | | 1.00 | | | 0.04 | | | 0.00d | | | 0.04 | | | (0.04) | | | — | | | (0.04) | | | 1.00 | | | 4.08% | | | 172,108 | | | 0.61% | | | N/A | | | 3.95% |
9/30/22 | | | 1.00 | | | 0.00d | | | 0.00d | | | 0.00d | | | (0.00)d | | | — | | | (0.00)d | | | 1.00 | | | 0.44% | | | 205,328 | | | 0.54% | | | 0.27% | | | 0.39% |
9/30/21 | | | 1.00 | | | (0.00)d | | | 0.00d | | | 0.00d | | | — | | | — | | | — | | | 1.00 | | | 0.00%e | | | 235,578 | | | 0.51% | | | 0.07% | | | 0.00%e |
9/30/20 | | | 1.00 | | | 0.01 | | | 0.00d | | | 0.01 | | | (0.01) | | | — | | | (0.01) | | | 1.00 | | | 0.56% | | | 277,991 | | | 0.51% | | | 0.40% | | | 0.59% |
| | | | | | | | | | | | | | | | | | | | | | | | | | | | | | | | | | | | | | | | |
c
| Per share amount calculated on the average shares method. |
d
| Amount is less than $0.005 per share. |
e
| Amount is less than 0.005%. |
j
| Computed after giving effect to an agreement by MML Advisers to waive certain fees and expenses of the Fund. |
l
| Employee retirement benefit plans that invest plan assets in the Separate Investment Accounts (SIAs) may be subject to certain charges as set forth in their respective Plan Documents. Total return figures would be lower for the periods presented if they reflected these charges. |
q
| Excludes fees and expenses incurred indirectly as a result of investments in underlying funds, as applicable. |
z
| The net asset values and total returns have been calculated on net assets which include adjustments made in accordance with U.S. generally accepted accounting principles required at period end for financial reporting purposes. |
| | | | | |
The accompanying notes are an integral part of the financial statements. | | | | |
| | | 103
| |
| | | | | |
TABLE OF CONTENTS
| | | |
| | MassMutual Funds (Continued) | |
| | | |
Financial Highlights (For a share outstanding throughout each period)
MassMutual Short-Duration Bond Fund
| | | | | | | | | | | | | | | | | | | |
Class I | | | | | | | | | | | | | | | | | | | | | | | | | | | | | | | | | | | | | | | |
9/30/24 | | | $8.68 | | | $0.38 | | | $0.53 | | | $0.91 | | | $(0.35) | | | $— | | | $(0.35) | | | $9.24 | | | 10.69% | | | $53,625 | | | 0.59% | | | 0.44% | | | 4.21% |
9/30/23 | | | 8.67 | | | 0.30 | | | 0.04aa | | | 0.34 | | | (0.33) | | | (0.00)d | | | (0.33) | | | 8.68 | | | 3.96% | | | 77,614 | | | 0.70% | | | 0.46% | | | 3.47% |
9/30/22 | | | 10.10 | | | 0.20 | | | (1.19) | | | (0.99) | | | (0.44) | | | — | | | (0.44) | | | 8.67 | | | (10.11%) | | | 131,484 | | | 0.40% | | | 0.39% | | | 2.08% |
9/30/21 | | | 10.09 | | | 0.24 | | | 0.22 | | | 0.46 | | | (0.45) | | | — | | | (0.45) | | | 10.10 | | | 4.69% | | | 211,826 | | | 0.44% | | | N/A | | | 2.41% |
9/30/20 | | | 10.31 | | | 0.34 | | | (0.21) | | | 0.13 | | | (0.35) | | | — | | | (0.35) | | | 10.09 | | | 1.26% | | | 189,805 | | | 0.42% | | | N/A | | | 3.41% |
Class R5 | | | | | | | | | | | | | | | | | | | | | | | | | | | | | | | | | | | | | | | |
9/30/24 | | | $8.72 | | | $0.36 | | | $0.55 | | | $0.91 | | | $(0.34) | | | $— | | | $(0.34) | | | $9.29 | | | 10.60% | | | $11,547 | | | 0.69% | | | 0.61% | | | 4.03% |
9/30/23 | | | 8.70 | | | 0.27 | | | 0.05aa | | | 0.32 | | | (0.30) | | | (0.00)d | | | (0.30) | | | 8.72 | | | 3.71% | | | 11,359 | | | 0.82% | | | N/A | | | 3.09% |
9/30/22 | | | 10.13 | | | 0.19 | | | (1.20) | | | (1.01) | | | (0.42) | | | — | | | (0.42) | | | 8.70 | | | (10.26%) | | | 30,546 | | | 0.50% | | | N/A | | | 1.95% |
9/30/21 | | | 10.12 | | | 0.24 | | | 0.21 | | | 0.45 | | | (0.44) | | | — | | | (0.44) | | | 10.13 | | | 4.56% | | | 66,938 | | | 0.54% | | | N/A | | | 2.34% |
9/30/20 | | | 10.34 | | | 0.33 | | | (0.21) | | | 0.12 | | | (0.34) | | | — | | | (0.34) | | | 10.12 | | | 1.15% | | | 110,813 | | | 0.52% | | | N/A | | | 3.31% |
Service Class | | | | | | | | | | | | | | | | | | | | | | | | | | | | | | | | | | | | |
9/30/24 | | | $8.65 | | | $0.35 | | | $0.55 | | | $0.90 | | | $(0.33) | | | $— | | | $(0.33) | | | $9.22 | | | 10.55% | | | $2,117 | | | 0.79% | | | 0.71% | | | 3.98% |
9/30/23 | | | 8.65 | | | 0.26 | | | 0.03aa | | | 0.29 | | | (0.29) | | | (0.00)d | | | (0.29) | | | 8.65 | | | 3.37% | | | 3,437 | | | 0.91% | | | N/A | | | 3.02% |
9/30/22 | | | 10.06 | | | 0.17 | | | (1.18) | | | (1.01) | | | (0.40) | | | — | | | (0.40) | | | 8.65 | | | (10.30%) | | | 2,981 | | | 0.62% | | | N/A | | | 1.82% |
9/30/21 | | | 10.04 | | | 0.23 | | | 0.21 | | | 0.44 | | | (0.42) | | | — | | | (0.42) | | | 10.06 | | | 4.51% | | | 16,282 | | | 0.64% | | | N/A | | | 2.25% |
9/30/20 | | | 10.26 | | | 0.32 | | | (0.22) | | | 0.10 | | | (0.32) | | | — | | | (0.32) | | | 10.04 | | | 1.00% | | | 38,559 | | | 0.62% | | | N/A | | | 3.19% |
| | | | | | | | | | | | | | | | | | | | | | | | | | | | | | | | | | | | | | | | |
| | | | |
Portfolio turnover rate
| | | 34% | | | 16% | | | 20% | | | 72% | | | 37% |
| | | | | | | | | | | | | | | | |
b
| Percentage represents the results for the period and is not annualized. |
c
| Per share amount calculated on the average shares method. |
d
| Amount is less than $0.005 per share. |
g
| For the period December 13, 2021 (commencement of operations) through September 30, 2022. |
j
| Computed after giving effect to an agreement by MML Advisers to waive certain fees and expenses of the Fund. |
l
| Employee retirement benefit plans that invest plan assets in the Separate Investment Accounts (SIAs) may be subject to certain charges as set forth in their respective Plan Documents. Total return figures would be lower for the periods presented if they reflected these charges. |
m
| Total return excludes sales charges, if any, and would be lower for the period presented if it reflected these charges. |
q
| Excludes fees and expenses incurred indirectly as a result of investments in underlying funds, as applicable. |
z
| The net asset values and total returns have been calculated on net assets which include adjustments made in accordance with U.S. generally accepted accounting principles required at period end for financial reporting purposes. |
aa
| The amount shown for a share outstanding does not correspond with the aggregate net realized and unrealized gain (loss) for the period due to the timing of purchases and redemptions of Fund shares in relation to the fluctuating market values of the Fund. |
| | | | | |
| | | The accompanying notes are an integral part of the financial statements.
| |
104
| | | | |
| | | | | |
TABLE OF CONTENTS
| | | | | | | | | | | | | | | | | | | |
Administrative Class | | | | | | | | | | | | | | | | | | | | | | | | | | | | | | | | | |
9/30/24 | | | $8.63 | | | $0.34 | | | $0.54 | | | $0.88 | | | $(0.32) | | | $— | | | $(0.32) | | | $9.19 | | | 10.33% | | | $12,116 | | | 0.89% | | | 0.81% | | | 3.86% |
9/30/23 | | | 8.62 | | | 0.25 | | | 0.04aa | | | 0.29 | | | (0.28) | | | (0.00)d | | | (0.28) | | | 8.63 | | | 3.39% | | | 11,719 | | | 1.01% | | | N/A | | | 2.96% |
9/30/22 | | | 10.01 | | | 0.17 | | | (1.18) | | | (1.01) | | | (0.38) | | | — | | | (0.38) | | | 8.62 | | | (10.38%) | | | 10,582 | | | 0.70% | | | N/A | | | 1.78% |
9/30/21 | | | 10.00 | | | 0.21 | | | 0.22 | | | 0.43 | | | (0.42) | | | — | | | (0.42) | | | 10.01 | | | 4.40% | | | 16,920 | | | 0.74% | | | N/A | | | 2.16% |
9/30/20 | | | 10.22 | | | 0.31 | | | (0.21) | | | 0.10 | | | (0.32) | | | — | | | (0.32) | | | 10.00 | | | 0.94% | | | 27,628 | | | 0.72% | | | N/A | | | 3.12% |
Class R4 | | | | | | | | | | | | | | | | | | | | | | | | | | | | | | | | | | | | | | | |
9/30/24 | | | $8.69 | | | $0.34 | | | $0.54 | | | $0.88 | | | $(0.31) | | | $— | | | $(0.31) | | | $9.26 | | | 10.24% | | | $8,391 | | | 1.04% | | | 0.93% | | | 3.75% |
9/30/23 | | | 8.69 | | | 0.23 | | | 0.04aa | | | 0.27 | | | (0.27) | | | (0.00)d | | | (0.27) | | | 8.69 | | | 3.11% | | | 3,225 | | | 1.16% | | | N/A | | | 2.63% |
9/30/22 | | | 10.07 | | | 0.15 | | | (1.18) | | | (1.03) | | | (0.35) | | | — | | | (0.35) | | | 8.69 | | | (10.46%) | | | 8,688 | | | 0.85% | | | N/A | | | 1.63% |
9/30/21 | | | 10.05 | | | 0.20 | | | 0.22 | | | 0.42 | | | (0.40) | | | — | | | (0.40) | | | 10.07 | | | 4.30% | | | 11,743 | | | 0.89% | | | N/A | | | 1.97% |
9/30/20 | | | 10.27 | | | 0.29 | | | (0.21) | | | 0.08 | | | (0.30) | | | — | | | (0.30) | | | 10.05 | | | 0.79% | | | 11,525 | | | 0.87% | | | N/A | | | 2.96% |
Class A | | | | | | | | | | | | | | | | | | | | | | | | | | | | | | | | | | | | | | | |
9/30/24 | | | $8.59 | | | $0.32 | | | $0.54 | | | $0.86 | | | $(0.30) | | | $— | | | $(0.30) | | | $9.15 | | | 10.12% | | | $5,960 | | | 1.11% | | | 1.02% | | | 3.63% |
9/30/23 | | | 8.58 | | | 0.23 | | | 0.03aa | | | 0.26 | | | (0.25) | | | (0.00)d | | | (0.25) | | | 8.59 | | | 3.13% | | | 6,055 | | | 1.26% | | | N/A | | | 2.65% |
9/30/22 | | | 9.93 | | | 0.14 | | | (1.18) | | | (1.04) | | | (0.31) | | | — | | | (0.31) | | | 8.58 | | | (10.63%) | | | 7,588 | | | 0.95% | | | N/A | | | 1.44% |
9/30/21 | | | 9.92 | | | 0.19 | | | 0.21 | | | 0.40 | | | (0.39) | | | — | | | (0.39) | | | 9.93 | | | 4.15% | | | 36,186 | | | 0.99% | | | N/A | | | 1.90% |
9/30/20 | | | 10.14 | | | 0.28 | | | (0.21) | | | 0.07 | | | (0.29) | | | — | | | (0.29) | | | 9.92 | | | 0.71% | | | 41,913 | | | 0.97% | | | N/A | | | 2.87% |
Class R3 | | | | | | | | | | | | | | | | | | | | | | | | | | | | | | | | | | | | | | | |
9/30/24 | | | $8.62 | | | $0.30 | | | $0.54 | | | $0.84 | | | $(0.28) | | | $— | | | $(0.28) | | | $9.18 | | | 9.90% | | | $5,406 | | | 1.29% | | | 1.21% | | | 3.44% |
9/30/23 | | | 8.61 | | | 0.21 | | | 0.04aa | | | 0.25 | | | (0.24) | | | (0.00)d | | | (0.24) | | | 8.62 | | | 2.98% | | | 6,742 | | | 1.41% | | | N/A | | | 2.49% |
9/30/22 | | | 9.99 | | | 0.13 | | | (1.19) | | | (1.06) | | | (0.32) | | | — | | | (0.32) | | | 8.61 | | | (10.80%) | | | 7,665 | | | 1.10% | | | N/A | | | 1.37% |
9/30/21 | | | 9.98 | | | 0.17 | | | 0.22 | | | 0.39 | | | (0.38) | | | — | | | (0.38) | | | 9.99 | | | 4.04% | | | 11,652 | | | 1.14% | | | N/A | | | 1.70% |
9/30/20 | | | 10.20 | | | 0.27 | | | (0.22) | | | 0.05 | | | (0.27) | | | — | | | (0.27) | | | 9.98 | | | 0.53% | | | 7,737 | | | 1.12% | | | N/A | | | 2.72% |
Class Y | | | | | | | | | | | | | | | | | | | | | | | | | | | | | | | | | | | | | | | |
9/30/24 | | | $8.69 | | | $0.37 | | | $0.54 | | | $0.91 | | | $(0.35) | | | $— | | | $(0.35) | | | $9.25 | | | 10.65% | | | $35,519 | | | 0.69% | | | 0.47% | | | 4.19% |
9/30/23 | | | 8.68 | | | 0.30 | | | 0.04aa | | | 0.34 | | | (0.33) | | | (0.00)d | | | (0.33) | | | 8.69 | | | 3.96% | | | 46,025 | | | 0.81% | | | 0.46% | | | 3.43% |
9/30/22g | | | 9.86 | | | 0.15 | | | (1.09) | | | (0.94) | | | (0.24) | | | — | | | (0.24) | | | 8.68 | | | (9.66%)b | | | 222,385 | | | 0.48%a | | | 0.40%a | | | 2.05%a |
Class L | | | | | | | | | | | | | | | | | | | | | | | | | | | | | | | | | | | | | | | |
9/30/24 | | | $8.65 | | | $0.35 | | | $0.53 | | | $0.88 | | | $(0.32) | | | $— | | | $(0.32) | | | $9.21 | | | 10.41% | | | $21,638 | | | 0.89% | | | 0.72% | | | 3.92% |
9/30/23 | | | 8.64 | | | 0.28 | | | 0.03aa | | | 0.31 | | | (0.30) | | | (0.00)d | | | (0.30) | | | 8.65 | | | 3.70% | | | 45,936 | | | 1.00% | | | 0.71% | | | 3.22% |
9/30/22g | | | 9.82 | | | 0.14 | | | (1.10) | | | (0.96) | | | (0.22) | | | — | | | (0.22) | | | 8.64 | | | (9.87%)b | | | 76,609 | | | 0.69%a | | | 0.65%a | | | 1.86%a |
Class C | | | | | | | | | | | | | | | | | | | | | | | | | | | | | | | | | | | | | | | |
9/30/24 | | | $8.72 | | | $0.33 | | | $0.55 | | | $0.88 | | | $(0.31) | | | $— | | | $(0.31) | | | $9.29 | | | 10.20% | | | $767 | | | 1.14% | | | 0.97% | | | 3.68% |
9/30/23 | | | 8.71 | | | 0.26 | | | 0.04aa | | | 0.30 | | | (0.29) | | | (0.00)d | | | (0.29) | | | 8.72 | | | 3.44% | | | 871 | | | 1.26% | | | 0.96% | | | 2.95% |
9/30/22g | | | 9.90 | | | 0.12 | | | (1.11) | | | (0.99) | | | (0.20) | | | — | | | (0.20) | | | 8.71 | | | (10.07%)b | | | 1,097 | | | 0.94%a | | | 0.90%a | | | 1.64%a |
| | | | | | | | | | | | | | | | | | | | | | | | | | | | | | | | | | | | | | | | |
| | | | | |
The accompanying notes are an integral part of the financial statements. | | | | |
| | | 105
| |
| | | | | |
TABLE OF CONTENTS
| | | |
| | MassMutual Funds (Continued) | |
| | | |
Financial Highlights (For a share outstanding throughout each period)
MassMutual Inflation-Protected and Income Fund
| | | | | | | | | | | | | | | | | | | | | | |
Class I | | | | | | | | | | | | | | | | | | | | | | | | | | | | | | | | | | | | | | | | | | |
9/30/24 | | | $9.15 | | | $0.43 | | | $0.53 | | | $0.96 | | | $(0.58) | | | $— | | | $(0.58) | | | $9.53 | | | 10.91% | | | $162,467 | | | 0.53% | | | N/A | | | 0.51% | | | 4.63% |
9/30/23 | | | 9.35 | | | 0.35 | | | (0.19) | | | 0.16 | | | (0.36) | | | — | | | (0.36) | | | 9.15 | | | 1.67% | | | 168,966 | | | 0.51% | | | N/A | | | N/A | | | 3.74% |
9/30/22 | | | 11.46 | | | 0.27 | | | (1.57) | | | (1.30) | | | (0.20) | | | (0.61) | | | (0.81) | | | 9.35 | | | (12.28%) | | | 169,362 | | | 0.47% | | | N/A | | | N/A | | | 2.60% |
9/30/21 | | | 11.40 | | | 0.19 | | | 0.48 | | | 0.67 | | | (0.12) | | | (0.49) | | | (0.61) | | | 11.46 | | | 6.12% | | | 187,579 | | | 0.47% | | | 0.47%n | | | 0.47%n | | | 1.73% |
9/30/20 | | | 10.59 | | | 0.20 | | | 0.83 | | | 1.03 | | | (0.22) | | | — | | | (0.22) | | | 11.40 | | | 9.93% | | | 176,809 | | | 0.47% | | | 0.47%n | | | 0.47%n | | | 1.86% |
Class R5 |
9/30/24 | | | $9.15 | | | $0.42 | | | $0.54 | | | $0.96 | | | $(0.57) | | | $— | | | $(0.57) | | | $9.54 | | | 10.89% | | | $47,912 | | | 0.63% | | | N/A | | | 0.61% | | | 4.52% |
9/30/23 | | | 9.35 | | | 0.34 | | | (0.19) | | | 0.15 | | | (0.35) | | | — | | | (0.35) | | | 9.15 | | | 1.56% | | | 49,635 | | | 0.61% | | | N/A | | | N/A | | | 3.63% |
9/30/22 | | | 11.47 | | | 0.25 | | | (1.57) | | | (1.32) | | | (0.19) | | | (0.61) | | | (0.80) | | | 9.35 | | | (12.44%) | | | 66,136 | | | 0.57% | | | N/A | | | N/A | | | 2.40% |
9/30/21 | | | 11.41 | | | 0.18 | | | 0.48 | | | 0.66 | | | (0.11) | | | (0.49) | | | (0.60) | | | 11.47 | | | 6.01% | | | 93,318 | | | 0.57% | | | 0.57%n | | | 0.57%n | | | 1.63% |
9/30/20 | | | 10.59 | | | 0.19 | | | 0.84 | | | 1.03 | | | (0.21) | | | — | | | (0.21) | | | 11.41 | | | 9.92% | | | 86,369 | | | 0.57% | | | 0.57%n | | | 0.57%n | | | 1.75% |
Service Class |
9/30/24 | | | $9.12 | | | $0.41 | | | $0.54 | | | $0.95 | | | $(0.56) | | | $— | | | $(0.56) | | | $9.51 | | | 10.74% | | | $15,952 | | | 0.72% | | | N/A | | | 0.71% | | | 4.44% |
9/30/23 | | | 9.31 | | | 0.32 | | | (0.17) | | | 0.15 | | | (0.34) | | | — | | | (0.34) | | | 9.12 | | | 1.55% | | | 21,436 | | | 0.71% | | | N/A | | | N/A | | | 3.48% |
9/30/22 | | | 11.42 | | | 0.23 | | | (1.55) | | | (1.32) | | | (0.18) | | | (0.61) | | | (0.79) | | | 9.31 | | | (12.51%) | | | 31,069 | | | 0.67% | | | N/A | | | N/A | | | 2.19% |
9/30/21 | | | 11.37 | | | 0.17 | | | 0.47 | | | 0.64 | | | (0.10) | | | (0.49) | | | (0.59) | | | 11.42 | | | 5.84% | | | 55,836 | | | 0.67% | | | 0.67%n | | | 0.67%n | | | 1.53% |
9/30/20 | | | 10.55 | | | 0.18 | | | 0.84 | | | 1.02 | | | (0.20) | | | — | | | (0.20) | | | 11.37 | | | 9.82% | | | 54,729 | | | 0.67% | | | 0.67%n | | | 0.67%n | | | 1.66% |
| | | | | | | | | | | | | | | | | | | | | | | | | | | | | | | | | | | | | | | | | | | |
| | | | |
Portfolio turnover rate
| | | 78% | | | 80% | | | 77% | | | 100% | | | 110% |
| | | | | | | | | | | | | | | | |
b
| Percentage represents the results for the period and is not annualized. |
c
| Per share amount calculated on the average shares method. |
g
| For the period February 1, 2023 (commencement of operations) through September 30, 2023. |
j
| Computed after giving effect to an agreement by MML Advisers to waive certain fees and expenses of the Fund. |
l
| Employee retirement benefit plans that invest plan assets in the Separate Investment Accounts (SIAs) may be subject to certain charges as set forth in their respective Plan Documents. Total return figures would be lower for the periods presented if they reflected these charges. |
m
| Total return excludes sales charges, if any, and would be lower for the period presented if it reflected these charges. |
n
| Expenses incurred during the period fell under the expense cap. |
p
| Interest expense incurred as a result of entering into reverse repurchase agreements and Treasury roll transactions is included in the Fund’s net expenses in the Statements of Operations. Income earned on investing proceeds from reverse repurchase agreements and Treasury roll transactions is included in interest income in the Statements of Operations. |
q
| Excludes fees and expenses incurred indirectly as a result of investments in underlying funds, as applicable. |
z
| The net asset values and total returns have been calculated on net assets which include adjustments made in accordance with U.S. generally accepted accounting principles required at period end for financial reporting purposes. |
| | | | | |
| | | The accompanying notes are an integral part of the financial statements.
| |
106
| | | | |
| | | | | |
TABLE OF CONTENTS
| | | | | | | | | | | | | | | | | | | | | | |
Administrative Class |
9/30/24 | | | $9.24 | | | $0.40 | | | $0.56 | | | $0.96 | | | $(0.55) | | | $— | | | $(0.55) | | | $9.65 | | | 10.76% | | | $4,953 | | | 0.82% | | | N/A | | | 0.81% | | | 4.32% |
9/30/23 | | | 9.43 | | | 0.33 | | | (0.19) | | | 0.14 | | | (0.33) | | | — | | | (0.33) | | | 9.24 | | | 1.40% | | | 6,883 | | | 0.81% | | | N/A | | | N/A | | | 3.45% |
9/30/22 | | | 11.55 | | | 0.23 | | | (1.58) | | | (1.35) | | | (0.16) | | | (0.61) | | | (0.77) | | | 9.43 | | | (12.59%) | | | 7,759 | | | 0.77% | | | N/A | | | N/A | | | 2.15% |
9/30/21 | | | 11.49 | | | 0.16 | | | 0.48 | | | 0.64 | | | (0.09) | | | (0.49) | | | (0.58) | | | 11.55 | | | 5.74% | | | 14,073 | | | 0.77% | | | 0.77%n | | | 0.77%n | | | 1.42% |
9/30/20 | | | 10.66 | | | 0.17 | | | 0.85 | | | 1.02 | | | (0.19) | | | — | | | (0.19) | | | 11.49 | | | 9.70% | | | 15,288 | | | 0.77% | | | 0.77%n | | | 0.77%n | | | 1.56% |
Class R4 |
9/30/24 | | | $8.88 | | | $0.38 | | | $0.53 | | | $0.91 | | | $(0.49) | | | $— | | | $(0.49) | | | $9.30 | | | 10.55% | | | $2,120 | | | 0.97% | | | N/A | | | 0.96% | | | 4.19% |
9/30/23 | | | 9.08 | | | 0.30 | | | (0.18) | | | 0.12 | | | (0.32) | | | — | | | (0.32) | | | 8.88 | | | 1.24% | | | 3,557 | | | 0.96% | | | N/A | | | N/A | | | 3.26% |
9/30/22 | | | 11.16 | | | 0.22 | | | (1.54) | | | (1.32) | | | (0.15) | | | (0.61) | | | (0.76) | | | 9.08 | | | (12.75%) | | | 4,316 | | | 0.92% | | | N/A | | | N/A | | | 2.10% |
9/30/21 | | | 11.12 | | | 0.14 | | | 0.47 | | | 0.61 | | | (0.08) | | | (0.49) | | | (0.57) | | | 11.16 | | | 5.65% | | | 5,234 | | | 0.92% | | | 0.92%n | | | 0.92%n | | | 1.31% |
9/30/20 | | | 10.33 | | | 0.15 | | | 0.82 | | | 0.97 | | | (0.18) | | | — | | | (0.18) | | | 11.12 | | | 9.51% | | | 4,358 | | | 0.92% | | | 0.92%n | | | 0.92%n | | | 1.40% |
Class A |
9/30/24 | | | $8.98 | | | $0.37 | | | $0.53 | | | $0.90 | | | $(0.49) | | | $— | | | $(0.49) | | | $9.39 | | | 10.38% | | | $8,349 | | | 1.04% | | | N/A | | | 1.03% | | | 4.10% |
9/30/23 | | | 9.17 | | | 0.29 | | | (0.18) | | | 0.11 | | | (0.30) | | | — | | | (0.30) | | | 8.98 | | | 1.15% | | | 7,905 | | | 1.06% | | | N/A | | | N/A | | | 3.17% |
9/30/22 | | | 11.23 | | | 0.20 | | | (1.54) | | | (1.34) | | | (0.11) | | | (0.61) | | | (0.72) | | | 9.17 | | | (12.81%) | | | 8,860 | | | 1.02% | | | N/A | | | N/A | | | 1.94% |
9/30/21 | | | 11.19 | | | 0.12 | | | 0.48 | | | 0.60 | | | (0.07) | | | (0.49) | | | (0.56) | | | 11.23 | | | 5.54% | | | 13,244 | | | 1.02% | | | 1.02%n | | | 1.02%n | | | 1.12% |
9/30/20 | | | 10.39 | | | 0.14 | | | 0.82 | | | 0.96 | | | (0.16) | | | — | | | (0.16) | | | 11.19 | | | 9.42% | | | 22,018 | | | 1.02% | | | 1.02%n | | | 1.02%n | | | 1.30% |
Class R3 |
9/30/24 | | | $8.91 | | | $0.36 | | | $0.53 | | | $0.89 | | | $(0.47) | | | $— | | | $(0.47) | | | $9.33 | | | 10.28% | | | $2,243 | | | 1.23% | | | N/A | | | 1.21% | | | 3.92% |
9/30/23 | | | 9.09 | | | 0.27 | | | (0.17) | | | 0.10 | | | (0.28) | | | — | | | (0.28) | | | 8.91 | | | 1.07% | | | 2,103 | | | 1.21% | | | N/A | | | N/A | | | 3.01% |
9/30/22 | | | 11.17 | | | 0.19 | | | (1.54) | | | (1.35) | | | (0.12) | | | (0.61) | | | (0.73) | | | 9.09 | | | (12.98%) | | | 2,414 | | | 1.17% | | | N/A | | | N/A | | | 1.89% |
9/30/21 | | | 11.12 | | | 0.11 | | | 0.47 | | | 0.58 | | | (0.04) | | | (0.49) | | | (0.53) | | | 11.17 | | | 5.40% | | | 2,940 | | | 1.17% | | | 1.17%n | | | 1.17%n | | | 1.02% |
9/30/20 | | | 10.33 | | | 0.12 | | | 0.82 | | | 0.94 | | | (0.15) | | | — | | | (0.15) | | | 11.12 | | | 9.20% | | | 3,256 | | | 1.17% | | | 1.17%n | | | 1.17%n | | | 1.16% |
Class Y |
9/30/24 | | | $9.16 | | | $0.42 | | | $0.54 | | | $0.96 | | | $(0.57) | | | $— | | | $(0.57) | | | $9.55 | | | 10.84% | | | $103 | | | 0.63% | | | N/A | | | 0.61% | | | 4.53% |
9/30/23g | | | 9.33 | | | 0.26 | | | (0.43) | | | (0.17) | | | — | | | — | | | — | | | 9.16 | | | (1.82%)b | | | 98 | | | 0.61%a | | | N/A | | | N/A | | | 4.16%a |
| | | | | | | | | | | | | | | | | | | | | | | | | | | | | | | | | | | | | | | | | | | |
| | | | | |
The accompanying notes are an integral part of the financial statements. | | | | |
| | | 107
| |
| | | | | |
TABLE OF CONTENTS
| | | |
| | MassMutual Funds (Continued) | |
| | | |
Financial Highlights (For a share outstanding throughout each period)
MassMutual Core Bond Fund
| | | | | | | | | | | | | | | | | | | | | | | | |
| | Class I | |
| | 9/30/24 | | | $8.84 | | | $0.43 | | | $0.76 | | | $1.19 | | | $(0.73) | | | $— | | | $(0.73) | | | $9.30 | | | 14.13% | | | $758,457 | | | 0.45% | | | 0.43% | | | 4.85% | |
| | 9/30/23 | | | 9.10 | | | 0.41 | | | (0.32) | | | 0.09 | | | (0.35) | | | — | | | (0.35) | | | 8.84 | | | 0.92% | | | 492,575 | | | 0.45% | | | N/A | | | 4.53% | |
| | 9/30/22 | | | 11.33 | | | 0.27 | | | (2.07) | | | (1.80) | | | (0.26) | | | (0.17) | | | (0.43) | | | 9.10 | | | (16.47%) | | | 485,216 | | | 0.42% | | | N/A | | | 2.62% | |
| | 9/30/21 | | | 11.64 | | | 0.27 | | | 0.11 | | | 0.38 | | | (0.43) | | | (0.26) | | | (0.69) | | | 11.33 | | | 3.31% | | | 679,036 | | | 0.42% | | | N/A | | | 2.39% | |
| | 9/30/20 | | | 11.33 | | | 0.37 | | | 0.32 | | | 0.69 | | | (0.38) | | | — | | | (0.38) | | | 11.64 | | | 6.28% | | | 786,360 | | | 0.42% | | | N/A | | | 3.27% | |
| | Class R5 | |
| | 9/30/24 | | | $8.88 | | | $0.43 | | | $0.75 | | | $1.18 | | | $(0.72) | | | $— | | | $(0.72) | | | $9.34 | | | 13.93% | | | $145,071 | | | 0.55% | | | 0.53% | | | 4.75% | |
| | 9/30/23 | | | 9.13 | | | 0.40 | | | (0.31) | | | 0.09 | | | (0.34) | | | — | | | (0.34) | | | 8.88 | | | 0.91% | | | 92,389 | | | 0.55% | | | N/A | | | 4.41% | |
| | 9/30/22 | | | 11.37 | | | 0.25 | | | (2.07) | | | (1.82) | | | (0.25) | | | (0.17) | | | (0.42) | | | 9.13 | | | (16.60%) | | | 135,050 | | | 0.52% | | | N/A | | | 2.43% | |
| | 9/30/21 | | | 11.68 | | | 0.26 | | | 0.11 | | | 0.37 | | | (0.42) | | | (0.26) | | | (0.68) | | | 11.37 | | | 3.19% | | | 306,648 | | | 0.52% | | | N/A | | | 2.29% | |
| | 9/30/20 | | | 11.37 | | | 0.36 | | | 0.32 | | | 0.68 | | | (0.37) | | | — | | | (0.37) | | | 11.68 | | | 6.16% | | | 316,359 | | | 0.52% | | | N/A | | | 3.17% | |
| | Service Class | |
| | 9/30/24 | | | $8.82 | | | $0.42 | | | $0.76 | | | $1.18 | | | $(0.71) | | | $— | | | $(0.71) | | | $9.29 | | | 13.95% | | | $36,028 | | | 0.65% | | | 0.63% | | | 4.66% | |
| | 9/30/23 | | | 9.07 | | | 0.39 | | | (0.31) | | | 0.08 | | | (0.33) | | | — | | | (0.33) | | | 8.82 | | | 0.81% | | | 29,605 | | | 0.65% | | | N/A | | | 4.31% | |
| | 9/30/22 | | | 11.30 | | | 0.25 | | | (2.07) | | | (1.82) | | | (0.24) | | | (0.17) | | | (0.41) | | | 9.07 | | | (16.72%) | | | 36,797 | | | 0.62% | | | N/A | | | 2.40% | |
| | 9/30/21 | | | 11.60 | | | 0.25 | | | 0.10 | | | 0.35 | | | (0.39) | | | (0.26) | | | (0.65) | | | 11.30 | | | 3.11% | | | 58,047 | | | 0.62% | | | N/A | | | 2.19% | |
| | 9/30/20 | | | 11.29 | | | 0.35 | | | 0.31 | | | 0.66 | | | (0.35) | | | — | | | (0.35) | | | 11.60 | | | 6.06% | | | 83,876 | | | 0.62% | | | N/A | | | 3.08% | |
| | | | | | | | | | | | | | | | | | | | | | | | | | | | | | | | | | | | | | | | | | |
| | | | |
Portfolio turnover rate
| | | 248% | | | 206% | | | 239% | | | 256% | | | 231% |
| | | | | | | | | | | | | | | | |
b
| Percentage represents the results for the period and is not annualized. |
c
| Per share amount calculated on the average shares method. |
g
| For the period February 1, 2023 (commencement of operations) through September 30, 2023. |
j
| Computed after giving effect to an agreement by MML Advisers to waive certain fees and expenses of the Fund. |
l
| Employee retirement benefit plans that invest plan assets in the Separate Investment Accounts (SIAs) may be subject to certain charges as set forth in their respective Plan Documents. Total return figures would be lower for the periods presented if they reflected these charges. |
m
| Total return excludes sales charges, if any, and would be lower for the period presented if it reflected these charges. |
q
| Excludes fees and expenses incurred indirectly as a result of investments in underlying funds, as applicable. |
z
| The net asset values and total returns have been calculated on net assets which include adjustments made in accordance with U.S. generally accepted accounting principles required at period end for financial reporting purposes. |
| | | | | |
| | | The accompanying notes are an integral part of the financial statements.
| |
108
| | | | |
| | | | | |
TABLE OF CONTENTS
| | | | | | | | | | | | | | | | | | | | | | | | |
| | Administrative Class | |
| | 9/30/24 | | | $8.74 | | | $0.40 | | | $0.76 | | | $1.16 | | | $(0.70) | | | $— | | | $(0.70) | | | $9.20 | | | 13.82% | | | $37,304 | | | 0.75% | | | 0.73% | | | 4.55% | |
| | 9/30/23 | | | 8.99 | | | 0.38 | | | (0.31) | | | 0.07 | | | (0.32) | | | — | | | (0.32) | | | 8.74 | | | 0.70% | | | 30,750 | | | 0.75% | | | N/A | | | 4.22% | |
| | 9/30/22 | | | 11.19 | | | 0.24 | | | (2.05) | | | (1.81) | | | (0.22) | | | (0.17) | | | (0.39) | | | 8.99 | | | (16.75%) | | | 35,207 | | | 0.72% | | | N/A | | | 2.30% | |
| | 9/30/21 | | | 11.51 | | | 0.24 | | | 0.10 | | | 0.34 | | | (0.40) | | | (0.26) | | | (0.66) | | | 11.19 | | | 2.97% | | | 55,178 | | | 0.72% | | | N/A | | | 2.11% | |
| | 9/30/20 | | | 11.21 | | | 0.33 | | | 0.32 | | | 0.65 | | | (0.35) | | | — | | | (0.35) | | | 11.51 | | | 5.94% | | | 76,597 | | | 0.72% | | | N/A | | | 2.97% | |
| | Class R4 | |
| | 9/30/24 | | | $8.62 | | | $0.37 | | | $0.76 | | | $1.13 | | | $(0.65) | | | $— | | | $(0.65) | | | $9.10 | | | 13.63% | | | $19,865 | | | 0.90% | | | 0.88% | | | 4.35% | |
| | 9/30/23 | | | 8.84 | | | 0.36 | | | (0.30) | | | 0.06 | | | (0.28) | | | — | | | (0.28) | | | 8.62 | | | 0.57% | | | 1,420 | | | 0.90% | | | N/A | | | 4.05% | |
| | 9/30/22 | | | 11.01 | | | 0.20 | | | (2.00) | | | (1.80) | | | (0.20) | | | (0.17) | | | (0.37) | | | 8.84 | | | (16.92%) | | | 2,295 | | | 0.87% | | | N/A | | | 1.99% | |
| | 9/30/21 | | | 11.33 | | | 0.21 | | | 0.10 | | | 0.31 | | | (0.37) | | | (0.26) | | | (0.63) | | | 11.01 | | | 2.82% | | | 8,557 | | | 0.87% | | | N/A | | | 1.95% | |
| | 9/30/20 | | | 11.04 | | | 0.31 | | | 0.31 | | | 0.62 | | | (0.33) | | | — | | | (0.33) | | | 11.33 | | | 5.80% | | | 10,444 | | | 0.87% | | | N/A | | | 2.80% | |
| | Class A | |
| | 9/30/24 | | | $8.66 | | | $0.38 | | | $0.75 | | | $1.13 | | | $(0.64) | | | $— | | | $(0.64) | | | $9.15 | | | 13.57% | | | $30,138 | | | 0.97% | | | 0.95% | | | 4.34% | |
| | 9/30/23 | | | 8.91 | | | 0.35 | | | (0.31) | | | 0.04 | | | (0.29) | | | — | | | (0.29) | | | 8.66 | | | 0.34% | | | 21,761 | | | 1.00% | | | N/A | | | 3.97% | |
| | 9/30/22 | | | 11.09 | | | 0.20 | | | (2.01) | | | (1.81) | | | (0.20) | | | (0.17) | | | (0.37) | | | 8.91 | | | (16.91%) | | | 23,746 | | | 0.97% | | | N/A | | | 1.97% | |
| | 9/30/21 | | | 11.40 | | | 0.21 | | | 0.09 | | | 0.30 | | | (0.35) | | | (0.26) | | | (0.61) | | | 11.09 | | | 2.70% | | | 57,351 | | | 0.97% | | | N/A | | | 1.83% | |
| | 9/30/20 | | | 11.10 | | | 0.30 | | | 0.32 | | | 0.62 | | | (0.32) | | | — | | | (0.32) | | | 11.40 | | | 5.70% | | | 58,572 | | | 0.97% | | | N/A | | | 2.72% | |
| | Class R3 | |
| | 9/30/24 | | | $8.94 | | | $0.35 | | | $0.86 | | | $1.21 | | | $(0.63) | | | $— | | | $(0.63) | | | $9.52 | | | 14.06% | | | $4,126 | | | 1.15% | | | 1.13% | | | 4.06% | |
| | 9/30/23 | | | 9.18 | | | 0.35 | | | (0.32) | | | 0.03 | | | (0.27) | | | — | | | (0.27) | | | 8.94 | | | 0.23% | | | 169 | | | 1.15% | | | N/A | | | 3.81% | |
| | 9/30/22 | | | 11.34 | | | 0.20 | | | (2.09) | | | (1.89) | | | (0.10) | | | (0.17) | | | (0.27) | | | 9.18 | | | (17.05%) | | | 177 | | | 1.12% | | | N/A | | | 1.88% | |
| | 9/30/21 | | | 11.63 | | | 0.19 | | | 0.10 | | | 0.29 | | | (0.32) | | | (0.26) | | | (0.58) | | | 11.34 | | | 2.54% | | | 352 | | | 1.12% | | | N/A | | | 1.70% | |
| | 9/30/20 | | | 11.34 | | | 0.29 | | | 0.32 | | | 0.61 | | | (0.32) | | | — | | | (0.32) | | | 11.63 | | | 5.54% | | | 867 | | | 1.12% | | | N/A | | | 2.57% | |
| | Class Y | |
| | 9/30/24 | | | $8.87 | | | $0.44 | | | $0.75 | | | $1.19 | | | $(0.72) | | | $— | | | $(0.72) | | | $9.34 | | | 14.03% | | | $4,119 | | | 0.55% | | | 0.53% | | | 4.78% | |
| | 9/30/23g | | | 9.33 | | | 0.28 | | | (0.74) | | | (0.46) | | | — | | | — | | | — | | | 8.87 | | | (4.93%)b | | | 95 | | | 0.55%a | | | N/A | | | 4.59%a | |
| | | | | | | | | | | | | | | | | | | | | | | | | | | | | | | | | | | | | | | | | | |
| | | | | |
The accompanying notes are an integral part of the financial statements. | | | | |
| | | 109
| |
| | | | | |
TABLE OF CONTENTS
| | | |
| | MassMutual Funds (Continued) | |
| | | |
Financial Highlights (For a share outstanding throughout each period)
MassMutual Diversified Bond Fund
| | | | | | | | | | | | | | | | | | | | | | |
Class I |
9/30/24 | | | $8.68 | | | $0.43 | | | $0.74 | | | $1.17 | | | $(0.75) | | | $— | | | $(0.75) | | | $9.10 | | | 14.13% | | | $52,500 | | | 0.66% | | | 0.64% | | | 4.85% |
9/30/23 | | | 8.93 | | | 0.41 | | | (0.30) | | | 0.11 | | | (0.36) | | | — | | | (0.36) | | | 8.68 | | | 1.13% | | | 76,296 | | | 0.61% | | | N/A | | | 4.65% |
9/30/22 | | | 11.33 | | | 0.31 | | | (2.27) | | | (1.96) | | | (0.30) | | | (0.14) | | | (0.44) | | | 8.93 | | | (18.00%) | | | 75,455 | | | 0.54% | | | N/A | | | 3.07% |
9/30/21 | | | 11.51 | | | 0.32 | | | 0.33 | | | 0.65 | | | (0.46) | | | (0.37) | | | (0.83) | | | 11.33 | | | 5.89% | | | 111,411 | | | 0.52% | | | N/A | | | 2.85% |
9/30/20 | | | 11.28 | | | 0.39 | | | 0.20 | | | 0.59 | | | (0.36) | | | (0.00)d | | | (0.36) | | | 11.51 | | | 5.43% | | | 97,183 | | | 0.51% | | | N/A | | | 3.54% |
Class R5 |
9/30/24 | | | $7.87 | | | $0.38 | | | $0.67 | | | $1.05 | | | $(0.71) | | | $— | | | $(0.71) | | | $8.21 | | | 14.03% | | | $67,568 | | | 0.76% | | | 0.74% | | | 4.75% |
9/30/23 | | | 8.13 | | | 0.37 | | | (0.28) | | | 0.09 | | | (0.35) | | | — | | | (0.35) | | | 7.87 | | | 1.00% | | | 61,990 | | | 0.71% | | | N/A | | | 4.55% |
9/30/22 | | | 10.35 | | | 0.28 | | | (2.07) | | | (1.79) | | | (0.29) | | | (0.14) | | | (0.43) | | | 8.13 | | | (18.05%) | | | 57,774 | | | 0.64% | | | N/A | | | 2.99% |
9/30/21 | | | 10.58 | | | 0.28 | | | 0.31 | | | 0.59 | | | (0.45) | | | (0.37) | | | (0.82) | | | 10.35 | | | 5.79% | | | 80,079 | | | 0.62% | | | N/A | | | 2.75% |
9/30/20 | | | 10.40 | | | 0.35 | | | 0.18 | | | 0.53 | | | (0.35) | | | (0.00)d | | | (0.35) | | | 10.58 | | | 5.30% | | | 78,289 | | | 0.61% | | | N/A | | | 3.46% |
Service Class |
9/30/24 | | | $8.00 | | | $0.38 | | | $0.69 | | | $1.07 | | | $(0.70) | | | $— | | | $(0.70) | | | $8.37 | | | 14.09% | | | $3,629 | | | 0.86% | | | 0.84% | | | 4.65% |
9/30/23 | | | 8.27 | | | 0.37 | | | (0.30) | | | 0.07 | | | (0.34) | | | — | | | (0.34) | | | 8.00 | | | 0.73% | | | 3,836 | | | 0.81% | | | N/A | | | 4.44% |
9/30/22 | | | 10.51 | | | 0.27 | | | (2.10) | | | (1.83) | | | (0.27) | | | (0.14) | | | (0.41) | | | 8.27 | | | (18.11%) | | | 4,963 | | | 0.74% | | | N/A | | | 2.81% |
9/30/21 | | | 10.73 | | | 0.28 | | | 0.31 | | | 0.59 | | | (0.44) | | | (0.37) | | | (0.81) | | | 10.51 | | | 5.71% | | | 11,853 | | | 0.72% | | | N/A | | | 2.66% |
9/30/20 | | | 10.54 | | | 0.35 | | | 0.18 | | | 0.53 | | | (0.34) | | | (0.00)d | | | (0.34) | | | 10.73 | | | 5.20% | | | 12,067 | | | 0.71% | | | N/A | | | 3.36% |
| | | | | | | | | | | | | | | | | | | | | | | | | | | | | | | | | | | | | | | | |
| | | | |
Portfolio turnover rate
| | | 153% | | | 107% | | | 198% | | | 192% | | | 186% |
| | | | | | | | | | | | | | | | |
b
| Percentage represents the results for the period and is not annualized. |
c
| Per share amount calculated on the average shares method. |
d
| Amount is less than $0.005 per share. |
g
| For the period February 1, 2023 (commencement of operations) through September 30, 2023. |
j
| Computed after giving effect to an agreement by MML Advisers to waive certain fees and expenses of the Fund. |
l
| Employee retirement benefit plans that invest plan assets in the Separate Investment Accounts (SIAs) may be subject to certain charges as set forth in their respective Plan Documents. Total return figures would be lower for the periods presented if they reflected these charges. |
m
| Total return excludes sales charges, if any, and would be lower for the period presented if it reflected these charges. |
q
| Excludes fees and expenses incurred indirectly as a result of investments in underlying funds, as applicable. |
z
| The net asset values and total returns have been calculated on net assets which include adjustments made in accordance with U.S. generally accepted accounting principles required at period end for financial reporting purposes. |
| | | | | |
| | | The accompanying notes are an integral part of the financial statements.
| |
110
| | | | |
| | | | | |
TABLE OF CONTENTS
| | | | | | | | | | | | | | | | | | | | | | |
Administrative Class |
9/30/24 | | | $7.99 | | | $0.37 | | | $0.68 | | | $1.05 | | | $(0.68) | | | $— | | | $(0.68) | | | $8.36 | | | 13.87% | | | $3,901 | | | 0.96% | | | 0.94% | | | 4.54% |
9/30/23 | | | 8.25 | | | 0.35 | | | (0.28) | | | 0.07 | | | (0.33) | | | — | | | (0.33) | | | 7.99 | | | 0.76% | | | 4,797 | | | 0.91% | | | N/A | | | 4.31% |
9/30/22 | | | 10.49 | | | 0.26 | | | (2.10) | | | (1.84) | | | (0.26) | | | (0.14) | | | (0.40) | | | 8.25 | | | (18.21%) | | | 8,149 | | | 0.84% | | | N/A | | | 2.76% |
9/30/21 | | | 10.71 | | | 0.27 | | | 0.30 | | | 0.57 | | | (0.42) | | | (0.37) | | | (0.79) | | | 10.49 | | | 5.52% | | | 12,621 | | | 0.82% | | | N/A | | | 2.57% |
9/30/20 | | | 10.52 | | | 0.34 | | | 0.18 | | | 0.52 | | | (0.33) | | | (0.00)d | | | (0.33) | | | 10.71 | | | 5.10% | | | 17,108 | | | 0.81% | | | N/A | | | 3.25% |
Class R4 |
9/30/24 | | | $7.86 | | | $0.35 | | | $0.69 | | | $1.04 | | | $(0.66) | | | $— | | | $(0.66) | | | $8.24 | | | 13.84% | | | $2,254 | | | 1.11% | | | 1.09% | | | 4.39% |
9/30/23 | | | 8.12 | | | 0.34 | | | (0.28) | | | 0.06 | | | (0.32) | | | — | | | (0.32) | | | 7.86 | | | 0.64% | | | 4,395 | | | 1.06% | | | N/A | | | 4.20% |
9/30/22 | | | 10.33 | | | 0.25 | | | (2.08) | | | (1.83) | | | (0.24) | | | (0.14) | | | (0.38) | | | 8.12 | | | (18.37%) | | | 3,754 | | | 0.99% | | | N/A | | | 2.63% |
9/30/21 | | | 10.57 | | | 0.25 | | | 0.29 | | | 0.54 | | | (0.41) | | | (0.37) | | | (0.78) | | | 10.33 | | | 5.35% | | | 5,253 | | | 0.97% | | | N/A | | | 2.42% |
9/30/20 | | | 10.38 | | | 0.32 | | | 0.19 | | | 0.51 | | | (0.32) | | | (0.00)d | | | (0.32) | | | 10.57 | | | 5.05% | | | 6,233 | | | 0.96% | | | N/A | | | 3.10% |
Class A |
9/30/24 | | | $8.01 | | | $0.35 | | | $0.70 | | | $1.05 | | | $(0.65) | | | $— | | | $(0.65) | | | $8.41 | | | 13.69% | | | $3,673 | | | 1.18% | | | 1.16% | | | 4.32% |
9/30/23 | | | 8.26 | | | 0.34 | | | (0.29) | | | 0.05 | | | (0.30) | | | — | | | (0.30) | | | 8.01 | | | 0.54% | | | 4,468 | | | 1.16% | | | N/A | | | 4.09% |
9/30/22 | | | 10.49 | | | 0.24 | | | (2.10) | | | (1.86) | | | (0.23) | | | (0.14) | | | (0.37) | | | 8.26 | | | (18.40%) | | | 5,106 | | | 1.09% | | | N/A | | | 2.46% |
9/30/21 | | | 10.69 | | | 0.24 | | | 0.30 | | | 0.54 | | | (0.37) | | | (0.37) | | | (0.74) | | | 10.49 | | | 5.23% | | | 9,381 | | | 1.07% | | | N/A | | | 2.33% |
9/30/20 | | | 10.48 | | | 0.31 | | | 0.20 | | | 0.51 | | | (0.30) | | | (0.00)d | | | (0.30) | | | 10.69 | | | 4.96% | | | 14,756 | | | 1.06% | | | N/A | | | 2.99% |
Class R3 |
9/30/24 | | | $7.93 | | | $0.33 | | | $0.69 | | | $1.02 | | | $(0.61) | | | $— | | | $(0.61) | | | $8.34 | | | 13.50% | | | $1,082 | | | 1.36% | | | 1.34% | | | 4.14% |
9/30/23 | | | 8.20 | | | 0.32 | | | (0.29) | | | 0.03 | | | (0.30) | | | — | | | (0.30) | | | 7.93 | | | 0.29% | | | 1,106 | | | 1.31% | | | N/A | | | 3.94% |
9/30/22 | | | 10.30 | | | 0.22 | | | (2.08) | | | (1.86) | | | (0.10) | | | (0.14) | | | (0.24) | | | 8.20 | | | (18.45%) | | | 1,347 | | | 1.24% | | | N/A | | | 2.35% |
9/30/21 | | | 10.53 | | | 0.22 | | | 0.30 | | | 0.52 | | | (0.38) | | | (0.37) | | | (0.75) | | | 10.30 | | | 5.14% | | | 3,255 | | | 1.22% | | | N/A | | | 2.16% |
9/30/20 | | | 10.34 | | | 0.29 | | | 0.17 | | | 0.46 | | | (0.27) | | | (0.00)d | | | (0.27) | | | 10.53 | | | 4.61% | | | 3,881 | | | 1.21% | | | N/A | | | 2.85% |
Class Y |
9/30/24 | | | $7.87 | | | $0.38 | | | $0.67 | | | $1.05 | | | $(0.70) | | | $— | | | $(0.70) | | | $8.22 | | | 14.11% | | | $99 | | | 0.76% | | | 0.74% | | | 4.75% |
9/30/23g | | | 8.30 | | | 0.25 | | | (0.68) | | | (0.43) | | | — | | | — | | | — | | | 7.87 | | | (5.18%)b | | | 95 | | | 0.71%a | | | N/A | | | 4.63%a |
| | | | | | | | | | | | | | | | | | | | | | | | | | | | | | | | | | | | | | | | |
| | | | | |
The accompanying notes are an integral part of the financial statements. | | | | |
| | | 111
| |
| | | | | |
TABLE OF CONTENTS
| | | |
| | MassMutual Funds (Continued) | |
| | | |
Financial Highlights (For a share outstanding throughout each period)
MassMutual High Yield Fund
| | | | | | | | | | | | | | | | | | | | | | |
Class I |
9/30/24 | | | $7.53 | | | $0.56 | | | $0.63 | | | $1.19 | | | $(0.56) | | | $(0.56) | | | $8.16 | | | 16.35% | | | $253,130 | | | 0.60% | | | 0.56% | | | 7.15% |
9/30/23 | | | 7.28 | | | 0.49 | | | 0.25 | | | 0.74 | | | (0.49) | | | (0.49) | | | 7.53 | | | 10.39% | | | 259,513 | | | 0.68% | | | N/A | | | 6.47% |
9/30/22 | | | 9.34 | | | 0.47 | | | (1.64) | | | (1.17) | | | (0.89) | | | (0.89) | | | 7.28 | | | (13.59%) | | | 228,970 | | | 0.55% | | | N/A | | | 5.61% |
9/30/21 | | | 8.63 | | | 0.49 | | | 0.70 | | | 1.19 | | | (0.48) | | | (0.48) | | | 9.34 | | | 14.20% | | | 351,942 | | | 0.54% | | | N/A | | | 5.50% |
9/30/20 | | | 9.21 | | | 0.50 | | | (0.52) | | | (0.02) | | | (0.56) | | | (0.56) | | | 8.63 | | | (0.28%) | | | 375,807 | | | 0.53% | | | N/A | | | 5.79% |
Class R5 |
9/30/24 | | | $7.58 | | | $0.56 | | | $0.64 | | | $1.20 | | | $(0.56) | | | $(0.56) | | | $8.22 | | | 16.31% | | | $38,879 | | | 0.70% | | | 0.66% | | | 7.06% |
9/30/23 | | | 7.33 | | | 0.49 | | | 0.25 | | | 0.74 | | | (0.49) | | | (0.49) | | | 7.58 | | | 10.26% | | | 32,778 | | | 0.78% | | | N/A | | | 6.37% |
9/30/22 | | | 9.40 | | | 0.47 | | | (1.66) | | | (1.19) | | | (0.88) | | | (0.88) | | | 7.33 | | | (13.74%) | | | 34,164 | | | 0.65% | | | N/A | | | 5.52% |
9/30/21 | | | 8.68 | | | 0.49 | | | 0.70 | | | 1.19 | | | (0.47) | | | (0.47) | | | 9.40 | | | 14.13% | | | 46,518 | | | 0.64% | | | N/A | | | 5.39% |
9/30/20 | | | 9.25 | | | 0.49 | | | (0.51) | | | (0.02) | | | (0.55) | | | (0.55) | | | 8.68 | | | (0.28%) | | | 49,116 | | | 0.63% | | | N/A | | | 5.69% |
Service Class | |
9/30/24 | | | $7.58 | | | $0.55 | | | $0.64 | | | $1.19 | | | $(0.55) | | | $(0.55) | | | $8.22 | | | 16.20% | | | $18,905 | | | 0.80% | | | 0.76% | | | 6.94% |
9/30/23 | | | 7.33 | | | 0.48 | | | 0.25 | | | 0.73 | | | (0.48) | | | (0.48) | | | 7.58 | | | 10.15% | | | 20,937 | | | 0.88% | | | N/A | | | 6.26% |
9/30/22 | | | 9.39 | | | 0.46 | | | (1.66) | | | (1.20) | | | (0.86) | | | (0.86) | | | 7.33 | | | (13.81%) | | | 22,158 | | | 0.75% | | | N/A | | | 5.44% |
9/30/21 | | | 8.67 | | | 0.48 | | | 0.70 | | | 1.18 | | | (0.46) | | | (0.46) | | | 9.39 | | | 14.00% | | | 29,097 | | | 0.74% | | | N/A | | | 5.31% |
9/30/20 | | | 9.25 | | | 0.48 | | | (0.52) | | | (0.04) | | | (0.54) | | | (0.54) | | | 8.67 | | | (0.48%) | | | 33,897 | | | 0.73% | | | N/A | | | 5.58% |
| | | | | | | | | | | | | | | | | | | | | | | | | | | | | | | | | | | | | |
| | | | |
Portfolio turnover rate | | | 69% | | | 38% | | | 53% | | | 68% | | | 79% |
| | | | | | | | | | | | | | | | |
b
| Percentage represents the results for the period and is not annualized. |
c
| Per share amount calculated on the average shares method. |
g
| For the period December 13, 2021 (commencement of operations) through September 30, 2022. |
j
| Computed after giving effect to an agreement by MML Advisers to waive certain fees and expenses of the Fund. |
l
| Employee retirement benefit plans that invest plan assets in the Separate Investment Accounts (SIAs) may be subject to certain charges as set forth in their respective Plan Documents. Total return figures would be lower for the periods presented if they reflected these charges. |
m
| Total return excludes sales charges, if any, and would be lower for the period presented if it reflected these charges. |
q
| Excludes fees and expenses incurred indirectly as a result of investments in underlying funds, as applicable. |
z
| The net asset values and total returns have been calculated on net assets which include adjustments made in accordance with U.S. generally accepted accounting principles required at period end for financial reporting purposes. |
| | | | | |
| | | The accompanying notes are an integral part of the financial statements.
| |
112
| | | | |
| | | | | |
TABLE OF CONTENTS
| | | | | | | | | | | | | | | | | | | | | | |
Administrative Class |
9/30/24 | | | $7.45 | | | $0.53 | | | $0.63 | | | $1.16 | | | $(0.53) | | | $(0.53) | | | $8.08 | | | 16.10% | | | $12,023 | | | 0.90% | | | 0.86% | | | 6.85% |
9/30/23 | | | 7.20 | | | 0.46 | | | 0.26 | | | 0.72 | | | (0.47) | | | (0.47) | | | 7.45 | | | 10.10% | | | 12,382 | | | 0.98% | | | N/A | | | 6.17% |
9/30/22 | | | 9.22 | | | 0.44 | | | (1.62) | | | (1.18) | | | (0.84) | | | (0.84) | | | 7.20 | | | (13.85%) | | | 12,693 | | | 0.85% | | | N/A | | | 5.28% |
9/30/21 | | | 8.53 | | | 0.46 | | | 0.68 | | | 1.14 | | | (0.45) | | | (0.45) | | | 9.22 | | | 13.79% | | | 23,211 | | | 0.84% | | | N/A | | | 5.20% |
9/30/20 | | | 9.10 | | | 0.47 | | | (0.51) | | | (0.04) | | | (0.53) | | | (0.53) | | | 8.53 | | | (0.55%) | | | 23,549 | | | 0.83% | | | N/A | | | 5.49% |
Class R4 |
9/30/24 | | | $7.32 | | | $0.51 | | | $0.62 | | | $1.13 | | | $(0.51) | | | $(0.51) | | | $7.94 | | | 15.94% | | | $16,488 | | | 1.05% | | | 1.01% | | | 6.70% |
9/30/23 | | | 7.07 | | | 0.44 | | | 0.26 | | | 0.70 | | | (0.45) | | | (0.45) | | | 7.32 | | | 10.01% | | | 16,984 | | | 1.13% | | | N/A | | | 6.00% |
9/30/22 | | | 9.06 | | | 0.42 | | | (1.60) | | | (1.18) | | | (0.81) | | | (0.81) | | | 7.07 | | | (14.05%) | | | 30,615 | | | 1.00% | | | N/A | | | 5.19% |
9/30/21 | | | 8.38 | | | 0.44 | | | 0.68 | | | 1.12 | | | (0.44) | | | (0.44) | | | 9.06 | | | 13.73% | | | 39,125 | | | 0.99% | | | N/A | | | 5.05% |
9/30/20 | | | 8.97 | | | 0.45 | | | (0.51) | | | (0.06) | | | (0.53) | | | (0.53) | | | 8.38 | | | (0.75%) | | | 40,160 | | | 0.98% | | | N/A | | | 5.34% |
Class A | | | |
9/30/24 | | | $7.44 | | | $0.51 | | | $0.63 | | | $1.14 | | | $(0.51) | | | $(0.51) | | | $8.07 | | | 15.86% | | | $6,745 | | | 1.12% | | | 1.08% | | | 6.63% |
9/30/23 | | | 7.20 | | | 0.44 | | | 0.25 | | | 0.69 | | | (0.45) | | | (0.45) | | | 7.44 | | | 9.68% | | | 7,116 | | | 1.23% | | | N/A | | | 5.91% |
9/30/22 | | | 9.19 | | | 0.42 | | | (1.63) | | | (1.21) | | | (0.78) | | | (0.78) | | | 7.20 | | | (14.10%) | | | 8,335 | | | 1.10% | | | N/A | | | 5.06% |
9/30/21 | | | 8.49 | | | 0.44 | | | 0.69 | | | 1.13 | | | (0.43) | | | (0.43) | | | 9.19 | | | 13.65% | | | 13,444 | | | 1.09% | | | N/A | | | 4.97% |
9/30/20 | | | 9.07 | | | 0.44 | | | (0.50) | | | (0.06) | | | (0.52) | | | (0.52) | | | 8.49 | | | (0.81%) | | | 24,556 | | | 1.08% | | | N/A | | | 5.24% |
Class R3 | |
9/30/24 | | | $7.54 | | | $0.51 | | | $0.64 | | | $1.15 | | | $(0.51) | | | $(0.51) | | | $8.18 | | | 15.67% | | | $27,609 | | | 1.30% | | | 1.26% | | | 6.46% |
9/30/23 | | | 7.29 | | | 0.44 | | | 0.25 | | | 0.69 | | | (0.44) | | | (0.44) | | | 7.54 | | | 9.62% | | | 23,159 | | | 1.38% | | | N/A | | | 5.76% |
9/30/22 | | | 9.31 | | | 0.41 | | | (1.65) | | | (1.24) | | | (0.78) | | | (0.78) | | | 7.29 | | | (14.27%) | | | 24,740 | | | 1.25% | | | N/A | | | 4.93% |
9/30/21 | | | 8.60 | | | 0.43 | | | 0.69 | | | 1.12 | | | (0.41) | | | (0.41) | | | 9.31 | | | 13.41% | | | 33,334 | | | 1.24% | | | N/A | | | 4.79% |
9/30/20 | | | 9.17 | | | 0.44 | | | (0.52) | | | (0.08) | | | (0.49) | | | (0.49) | | | 8.60 | | | (0.96%) | | | 35,047 | | | 1.23% | | | N/A | | | 5.09% |
Class Y |
9/30/24 | | | $7.55 | | | $0.56 | | | $0.63 | | | $1.19 | | | $(0.56) | | | $(0.56) | | | $8.18 | | | 16.27% | | | $25,377 | | | 0.65% | | | 0.61% | | | 7.09% |
9/30/23 | | | 7.30 | | | 0.49 | | | 0.25 | | | 0.74 | | | (0.49) | | | (0.49) | | | 7.55 | | | 10.33% | | | 29,201 | | | 0.73% | | | N/A | | | 6.43% |
9/30/22g | | | 8.86 | | | 0.38 | | | (1.56) | | | (1.18) | | | (0.38) | | | (0.38) | | | 7.30 | | | (13.66%)b | | | 23,397 | | | 0.60%a | | | N/A | | | 5.81%a |
Class C |
9/30/24 | | | $7.58 | | | $0.49 | | | $0.64 | | | $1.13 | | | $(0.49) | | | $(0.49) | | | $8.22 | | | 15.35% | | | $174 | | | 1.60% | | | 1.56% | | | 6.17% |
9/30/23 | | | 7.33 | | | 0.42 | | | 0.25 | | | 0.67 | | | (0.42) | | | (0.42) | | | 7.58 | | | 9.27% | | | 96 | | | 1.69% | | | N/A | | | 5.47% |
9/30/22g | | | 8.89 | | | 0.32 | | | (1.56) | | | (1.24) | | | (0.32) | | | (0.32) | | | 7.33 | | | (14.28%)b | | | 81 | | | 1.55%a | | | N/A | | | 4.78%a |
| | | | | | | | | | | | | | | | | | | | | | | | | | | | | | | | | | | | | |
| | | | | |
The accompanying notes are an integral part of the financial statements. | | | | |
| | | 113
| |
| | | | | |
TABLE OF CONTENTS
| | | |
| | MassMutual Funds (Continued) | |
| | | |
Financial Highlights (For a share outstanding throughout each period)
MassMutual Balanced Fund
| | | | | | | | | | | | | | | | | | | |
Class I |
9/30/24 | | | $10.43 | | | $0.18 | | | $2.51 | | | $2.69 | | | $(0.20) | | | $— | | | $(0.20) | | | $12.92 | | | 26.09% | | | $41,742 | | | 0.82% | | | 1.57% |
9/30/23 | | | 9.57 | | | 0.18 | | | 0.86 | | | 1.04 | | | (0.18) | | | — | | | (0.18) | | | 10.43 | | | 10.88% | | | 38,571 | | | 0.77% | | | 1.73% |
9/30/22 | | | 14.34 | | | 0.16 | | | (1.45) | | | (1.29) | | | (0.22) | | | (3.26) | | | (3.48) | | | 9.57 | | | (13.65%) | | | 44,532 | | | 0.70% | | | 1.37% |
9/30/21 | | | 12.40 | | | 0.16 | | | 2.21 | | | 2.37 | | | (0.21) | | | (0.22) | | | (0.43) | | | 14.34 | | | 19.60% | | | 54,692 | | | 0.69% | | | 1.21% |
9/30/20 | | | 12.07 | | | 0.21 | | | 0.90 | | | 1.11 | | | (0.27) | | | (0.51) | | | (0.78) | | | 12.40 | | | 9.49% | | | 42,455 | | | 0.71% | | | 1.75% |
Class R5 |
9/30/24 | | | $10.43 | | | $0.17 | | | $2.50 | | | $2.67 | | | $(0.19) | | | $— | | | $(0.19) | | | $12.91 | | | 25.92% | | | $24,928 | | | 0.91% | | | 1.47% |
9/30/23 | | | 9.57 | | | 0.17 | | | 0.86 | | | 1.03 | | | (0.17) | | | — | | | (0.17) | | | 10.43 | | | 10.76% | | | 26,032 | | | 0.87% | | | 1.62% |
9/30/22 | | | 14.34 | | | 0.15 | | | (1.46) | | | (1.31) | | | (0.20) | | | (3.26) | | | (3.46) | | | 9.57 | | | (13.74%) | | | 28,960 | | | 0.80% | | | 1.26% |
9/30/21 | | | 12.39 | | | 0.15 | | | 2.22 | | | 2.37 | | | (0.20) | | | (0.22) | | | (0.42) | | | 14.34 | | | 19.58% | | | 39,742 | | | 0.79% | | | 1.10% |
9/30/20 | | | 12.07 | | | 0.20 | | | 0.89 | | | 1.09 | | | (0.26) | | | (0.51) | | | (0.77) | | | 12.39 | | | 9.29% | | | 42,199 | | | 0.81% | | | 1.66% |
Service Class |
9/30/24 | | | $11.26 | | | $0.17 | | | $2.71 | | | $2.88 | | | $(0.19) | | | $— | | | $(0.19) | | | $13.95 | | | 25.82% | | | $9,665 | | | 1.02% | | | 1.37% |
9/30/23 | | | 10.31 | | | 0.17 | | | 0.94 | | | 1.11 | | | (0.16) | | | — | | | (0.16) | | | 11.26 | | | 10.74% | | | 8,093 | | | 0.97% | | | 1.52% |
9/30/22 | | | 15.20 | | | 0.14 | | | (1.58) | | | (1.44) | | | (0.19) | | | (3.26) | | | (3.45) | | | 10.31 | | | (13.87%) | | | 7,659 | | | 0.90% | | | 1.16% |
9/30/21 | | | 13.12 | | | 0.14 | | | 2.35 | | | 2.49 | | | (0.19) | | | (0.22) | | | (0.41) | | | 15.20 | | | 19.40% | | | 10,330 | | | 0.89% | | | 1.00% |
9/30/20 | | | 12.73 | | | 0.19 | | | 0.95 | | | 1.14 | | | (0.24) | | | (0.51) | | | (0.75) | | | 13.12 | | | 9.22% | | | 8,637 | | | 0.91% | | | 1.56% |
| | | | | | | | | | | | | | | | | | | | | | | | | | | | | | | | | | | | | |
| | | | |
Portfolio turnover rate | | | 130% | | | 155% | | | 215% | | | 343% | | | 113% |
| | | | | | | | | | | | | | | | |
b
| Percentage represents the results for the period and is not annualized. |
c
| Per share amount calculated on the average shares method. |
g
| For the period February 1, 2023 (commencement of operations) through September 30, 2023. |
l
| Employee retirement benefit plans that invest plan assets in the Separate Investment Accounts (SIAs) may be subject to certain charges as set forth in their respective Plan Documents. Total return figures would be lower for the periods presented if they reflected these charges. |
m
| Total return excludes sales charges, if any, and would be lower for the period presented if it reflected these charges. |
q
| Excludes fees and expenses incurred indirectly as a result of investments in underlying funds, as applicable. |
z
| The net asset values and total returns have been calculated on net assets which include adjustments made in accordance with U.S. generally accepted accounting principles required at period end for financial reporting purposes. |
aa
| The amount shown for a share outstanding does not correspond with the aggregate net realized and unrealized gain (loss) for the period due to the timing of purchases and redemptions of Fund shares in relation to the fluctuating market values of the Fund. |
| | | | | |
| | | The accompanying notes are an integral part of the financial statements.
| |
114
| | | | |
| | | | | |
TABLE OF CONTENTS
| | | | | | | | | | | | | | | | | | | |
Administrative Class |
9/30/24 | | | $10.48 | | | $0.15 | | | $2.51 | | | $2.66 | | | $(0.17) | | | $— | | | $(0.17) | | | $12.97 | | | 25.70% | | | $978 | | | 1.11% | | | 1.31% |
9/30/23 | | | 9.61 | | | 0.15 | | | 0.87 | | | 1.02 | | | (0.15) | | | — | | | (0.15) | | | 10.48 | | | 10.57% | | | 3,247 | | | 1.07% | | | 1.44% |
9/30/22 | | | 14.39 | | | 0.12 | | | (1.46) | | | (1.34) | | | (0.18) | | | (3.26) | | | (3.44) | | | 9.61 | | | (13.95%) | | | 6,318 | | | 1.00% | | | 1.07% |
9/30/21 | | | 12.44 | | | 0.12 | | | 2.23 | | | 2.35 | | | (0.18) | | | (0.22) | | | (0.40) | | | 14.39 | | | 19.30% | | | 7,411 | | | 0.99% | | | 0.90% |
9/30/20 | | | 12.11 | | | 0.17 | | | 0.90 | | | 1.07 | | | (0.23) | | | (0.51) | | | (0.74) | | | 12.44 | | | 9.13% | | | 5,849 | | | 1.01% | | | 1.44% |
Class R4 |
9/30/24 | | | $9.90 | | | $0.12 | | | $2.38 | | | $2.50 | | | $(0.15) | | | $— | | | $(0.15) | | | $12.25 | | | 25.53% | | | $5,291 | | | 1.27% | | | 1.12% |
9/30/23 | | | 9.09 | | | 0.13 | | | 0.81 | | | 0.94 | | | (0.13) | | | — | | | (0.13) | | | 9.90 | | | 10.37% | | | 4,937 | | | 1.22% | | | 1.27% |
9/30/22 | | | 13.77 | | | 0.10 | | | (1.37) | | | (1.27) | | | (0.15) | | | (3.26) | | | (3.41) | | | 9.09 | | | (14.06%) | | | 4,554 | | | 1.15% | | | 0.92% |
9/30/21 | | | 11.92 | | | 0.10 | | | 2.13 | | | 2.23 | | | (0.16) | | | (0.22) | | | (0.38) | | | 13.77 | | | 19.12% | | | 5,984 | | | 1.14% | | | 0.76% |
9/30/20 | | | 11.64 | | | 0.15 | | | 0.86 | | | 1.01 | | | (0.22) | | | (0.51) | | | (0.73) | | | 11.92 | | | 8.94% | | | 2,994 | | | 1.16% | | | 1.31% |
Class A |
9/30/24 | | | $10.04 | | | $0.12 | | | $2.41 | | | $2.53 | | | $(0.13) | | | $— | | | $(0.13) | | | $12.44 | | | 25.48% | | | $12,924 | | | 1.33% | | | 1.06% |
9/30/23 | | | 9.21 | | | 0.12 | | | 0.83 | | | 0.95 | | | (0.12) | | | — | | | (0.12) | | | 10.04 | | | 10.32% | | | 12,044 | | | 1.32% | | | 1.17% |
9/30/22 | | | 13.91 | | | 0.09 | | | (1.41) | | | (1.32) | | | (0.12) | | | (3.26) | | | (3.38) | | | 9.21 | | | (14.22%) | | | 13,123 | | | 1.25% | | | 0.80% |
9/30/21 | | | 12.03 | | | 0.09 | | | 2.16 | | | 2.25 | | | (0.15) | | | (0.22) | | | (0.37) | | | 13.91 | | | 19.07% | | | 20,919 | | | 1.24% | | | 0.67% |
9/30/20 | | | 11.74 | | | 0.14 | | | 0.86 | | | 1.00 | | | (0.20) | | | (0.51) | | | (0.71) | | | 12.03 | | | 8.80% | | | 26,626 | | | 1.26% | | | 1.21% |
Class R3 |
9/30/24 | | | $9.82 | | | $0.10 | | | $2.35 | | | $2.45 | | | $(0.12) | | | $— | | | $(0.12) | | | $12.15 | | | 25.19% | | | $11,968 | | | 1.52% | | | 0.87% |
9/30/23 | | | 9.01 | | | 0.10 | | | 0.81 | | | 0.91 | | | (0.10) | | | — | | | (0.10) | | | 9.82 | | | 10.14% | | | 9,244 | | | 1.47% | | | 1.02% |
9/30/22 | | | 13.69 | | | 0.07 | | | (1.36) | | | (1.29) | | | (0.13) | | | (3.26) | | | (3.39) | | | 9.01 | | | (14.27%) | | | 9,643 | | | 1.40% | | | 0.66% |
9/30/21 | | | 11.85 | | | 0.07 | | | 2.11 | | | 2.18 | | | (0.12) | | | (0.22) | | | (0.34) | | | 13.69 | | | 18.81% | | | 12,390 | | | 1.39% | | | 0.50% |
9/30/20 | | | 11.57 | | | 0.12 | | | 0.85 | | | 0.97 | | | (0.18) | | | (0.51) | | | (0.69) | | | 11.85 | | | 8.66% | | | 7,503 | | | 1.41% | | | 1.06% |
Class Y |
9/30/24 | | | $10.43 | | | $0.17 | | | $2.50 | | | $2.67 | | | $(0.19) | | | $— | | | $(0.19) | | | $12.91 | | | 25.88% | | | $123 | | | 0.92% | | | 1.46% |
9/30/23g | | | 10.54 | | | 0.11 | | | (0.22)aa | | | (0.11) | | | — | | | — | | | — | | | 10.43 | | | (1.04%)b | | | 99 | | | 0.87%a | | | 1.61%a |
| | | | | | | | | | | | | | | | | | | | | | | | | | | | | | | | | | | | | |
| | | | | |
The accompanying notes are an integral part of the financial statements. | | | | |
| | | 115
| |
| | | | | |
TABLE OF CONTENTS
| | | |
| | MassMutual Funds (Continued) | |
| | | |
Financial Highlights (For a share outstanding throughout each period)
MassMutual Disciplined Value Fund
| | | | | | | | | | | | | | | | | | | |
Class I |
9/30/24 | | | $12.81 | | | $0.14 | | | $3.08 | | | $3.22 | | | $(0.35) | | | $(0.61) | | | $(0.96) | | | $15.07 | | | 26.76% | | | $10,019 | | | 1.09% | | | 1.07% |
9/30/23 | | | 12.29 | | | 0.17 | | | 1.70 | | | 1.87 | | | (0.17) | | | (1.18) | | | (1.35) | | | 12.81 | | | 15.25% | | | 26,343 | | | 0.81% | | | 1.31% |
9/30/22 | | | 16.30 | | | 0.20 | | | (1.43) | | | (1.23) | | | (0.22) | | | (2.56) | | | (2.78) | | | 12.29 | | | (10.19%) | | | 24,938 | | | 0.76% | | | 1.40% |
9/30/21 | | | 12.08 | | | 0.22 | | | 4.28 | | | 4.50 | | | (0.28) | | | — | | | (0.28) | | | 16.30 | | | 37.75% | | | 31,848 | | | 0.74% | | | 1.46% |
9/30/20 | | | 13.98 | | | 0.28 | | | (1.16) | | | (0.88) | | | (0.31) | | | (0.71) | | | (1.02) | | | 12.08 | | | (7.26%) | | | 20,650 | | | 0.72% | | | 2.20% |
Class R5 |
9/30/24 | | | $12.85 | | | $0.14 | | | $3.09 | | | $3.23 | | | $(0.34) | | | $(0.61) | | | $(0.95) | | | $15.13 | | | 26.74% | | | $13,569 | | | 1.19% | | | 1.06% |
9/30/23 | | | 12.33 | | | 0.16 | | | 1.70 | | | 1.86 | | | (0.16) | | | (1.18) | | | (1.34) | | | 12.85 | | | 15.06% | | | 18,288 | | | 0.91% | | | 1.21% |
9/30/22 | | | 16.34 | | | 0.19 | | | (1.44) | | | (1.25) | | | (0.20) | | | (2.56) | | | (2.76) | | | 12.33 | | | (10.28%) | | | 19,907 | | | 0.85% | | | 1.27% |
9/30/21 | | | 12.11 | | | 0.21 | | | 4.28 | | | 4.49 | | | (0.26) | | | — | | | (0.26) | | | 16.34 | | | 37.57% | | | 35,564 | | | 0.84% | | | 1.39% |
9/30/20 | | | 14.01 | | | 0.27 | | | (1.17) | | | (0.90) | | | (0.29) | | | (0.71) | | | (1.00) | | | 12.11 | | | (7.34%) | | | 32,418 | | | 0.82% | | | 2.10% |
Service Class |
9/30/24 | | | $12.69 | | | $0.13 | | | $3.04 | | | $3.17 | | | $(0.33) | | | $(0.61) | | | $(0.94) | | | $14.92 | | | 26.62% | | | $8,586 | | | 1.30% | | | 0.95% |
9/30/23 | | | 12.19 | | | 0.14 | | | 1.68 | | | 1.82 | | | (0.14) | | | (1.18) | | | (1.32) | | | 12.69 | | | 14.95% | | | 10,471 | | | 1.01% | | | 1.11% |
9/30/22 | | | 16.19 | | | 0.17 | | | (1.43) | | | (1.26) | | | (0.18) | | | (2.56) | | | (2.74) | | | 12.19 | | | (10.38%) | | | 11,925 | | | 0.96% | | | 1.20% |
9/30/21 | | | 12.00 | | | 0.19 | | | 4.25 | | | 4.44 | | | (0.25) | | | — | | | (0.25) | | | 16.19 | | | 37.48% | | | 16,120 | | | 0.94% | | | 1.27% |
9/30/20 | | | 13.88 | | | 0.25 | | | (1.16) | | | (0.91) | | | (0.26) | | | (0.71) | | | (0.97) | | | 12.00 | | | (7.46%) | | | 11,618 | | | 0.92% | | | 1.98% |
| | | | | | | | | | | | | | | | | | | | | | | | | | | | | | | | | | | | | |
| | | | |
Portfolio turnover rate
| | | 66% | | | 70% | | | 40% | | | 189% | | | 57% |
| | | | | | | | | | | | | | | | |
b
| Percentage represents the results for the period and is not annualized. |
c
| Per share amount calculated on the average shares method. |
g
| For the period February 1, 2023 (commencement of operations) through September 30, 2023. |
l
| Employee retirement benefit plans that invest plan assets in the Separate Investment Accounts (SIAs) may be subject to certain charges as set forth in their respective Plan Documents. Total return figures would be lower for the periods presented if they reflected these charges. |
m
| Total return excludes sales charges, if any, and would be lower for the period presented if it reflected these charges. |
q
| Excludes fees and expenses incurred indirectly as a result of investments in underlying funds, as applicable. |
z
| The net asset values and total returns have been calculated on net assets which include adjustments made in accordance with U.S. generally accepted accounting principles required at period end for financial reporting purposes. |
aa
| The amount shown for a share outstanding does not correspond with the aggregate net realized and unrealized gain (loss) for the period due to the timing of purchases and redemptions of Fund shares in relation to the fluctuating market values of the Fund. |
| | | | | |
| | | The accompanying notes are an integral part of the financial statements.
| |
116
| | | | |
| | | | | |
TABLE OF CONTENTS
| | | | | | | | | | | | | | | | | | | |
Administrative Class |
9/30/24 | | | $13.12 | | | $0.11 | | | $3.16 | | | $3.27 | | | $(0.32) | | | $(0.61) | | | $(0.93) | | | $15.46 | | | 26.48% | | | $991 | | | 1.40% | | | 0.82% |
9/30/23 | | | 12.55 | | | 0.13 | | | 1.74 | | | 1.87 | | | (0.12) | | | (1.18) | | | (1.30) | | | 13.12 | | | 14.90% | | | 1,314 | | | 1.11% | | | 1.01% |
9/30/22 | | | 16.57 | | | 0.16 | | | (1.47) | | | (1.31) | | | (0.15) | | | (2.56) | | | (2.71) | | | 12.55 | | | (10.45%) | | | 1,154 | | | 1.06% | | | 1.10% |
9/30/21 | | | 12.28 | | | 0.18 | | | 4.35 | | | 4.53 | | | (0.24) | | | — | | | (0.24) | | | 16.57 | | | 37.32% | | | 1,652 | | | 1.04% | | | 1.23% |
9/30/20 | | | 14.20 | | | 0.24 | | | (1.20) | | | (0.96) | | | (0.25) | | | (0.71) | | | (0.96) | | | 12.28 | | | (7.62%) | | | 4,214 | | | 1.02% | | | 1.88% |
Class R4 |
9/30/24 | | | $12.35 | | | $0.09 | | | $3.00 | | | $3.09 | | | $(0.10) | | | $(0.61) | | | $(0.71) | | | $14.73 | | | 26.22% | | | $502 | | | 1.57% | | | 0.65% |
9/30/23 | | | 11.89 | | | 0.10 | | | 1.65 | | | 1.75 | | | (0.11) | | | (1.18) | | | (1.29) | | | 12.35 | | | 14.67% | | | 378 | | | 1.26% | | | 0.80% |
9/30/22 | | | 15.85 | | | 0.13 | | | (1.39) | | | (1.26) | | | (0.14) | | | (2.56) | | | (2.70) | | | 11.89 | | | (10.62%) | | | 1,293 | | | 1.20% | | | 0.87% |
9/30/21 | | | 11.76 | | | 0.15 | | | 4.16 | | | 4.31 | | | (0.22) | | | — | | | (0.22) | | | 15.85 | | | 37.08% | | | 2,731 | | | 1.19% | | | 1.06% |
9/30/20 | | | 13.63 | | | 0.21 | | | (1.13) | | | (0.92) | | | (0.24) | | | (0.71) | | | (0.95) | | | 11.76 | | | (7.70%) | | | 2,707 | | | 1.17% | | | 1.73% |
Class A |
9/30/24 | | | $12.50 | | | $0.08 | | | $2.99 | | | $3.07 | | | $(0.27) | | | $(0.61) | | | $(0.88) | | | $14.69 | | | 26.12% | | | $3,583 | | | 1.61% | | | 0.64% |
9/30/23 | | | 12.01 | | | 0.10 | | | 1.66 | | | 1.76 | | | (0.09) | | | (1.18) | | | (1.27) | | | 12.50 | | | 14.59% | | | 4,164 | | | 1.36% | | | 0.76% |
9/30/22 | | | 15.98 | | | 0.12 | | | (1.41) | | | (1.29) | | | (0.12) | | | (2.56) | | | (2.68) | | | 12.01 | | | (10.68%) | | | 4,245 | | | 1.30% | | | 0.83% |
9/30/21 | | | 11.85 | | | 0.14 | | | 4.20 | | | 4.34 | | | (0.21) | | | — | | | (0.21) | | | 15.98 | | | 37.00% | | | 6,784 | | | 1.29% | | | 0.93% |
9/30/20 | | | 13.73 | | | 0.21 | | | (1.15) | | | (0.94) | | | (0.23) | | | (0.71) | | | (0.94) | | | 11.85 | | | (7.77%) | | | 5,569 | | | 1.27% | | | 1.66% |
Class R3 |
9/30/24 | | | $12.63 | | | $0.06 | | | $3.05 | | | $3.11 | | | $(0.19) | | | $(0.61) | | | $(0.80) | | | $14.94 | | | 25.97% | | | $1,664 | | | 1.80% | | | 0.44% |
9/30/23 | | | 12.13 | | | 0.07 | | | 1.68 | | | 1.75 | | | (0.07) | | | (1.18) | | | (1.25) | | | 12.63 | | | 14.41% | | | 1,833 | | | 1.51% | | | 0.57% |
9/30/22 | | | 16.12 | | | 0.10 | | | (1.43) | | | (1.33) | | | (0.10) | | | (2.56) | | | (2.66) | | | 12.13 | | | (10.86%) | | | 3,732 | | | 1.46% | | | 0.72% |
9/30/21 | | | 11.95 | | | 0.12 | | | 4.24 | | | 4.36 | | | (0.19) | | | — | | | (0.19) | | | 16.12 | | | 36.87% | | | 4,873 | | | 1.44% | | | 0.79% |
9/30/20 | | | 13.85 | | | 0.19 | | | (1.17) | | | (0.98) | | | (0.21) | | | (0.71) | | | (0.92) | | | 11.95 | | | (7.98%) | | | 3,988 | | | 1.42% | | | 1.50% |
Class Y |
9/30/24 | | | $12.85 | | | $0.14 | | | $3.09 | | | $3.23 | | | $(0.34) | | | $(0.61) | | | $(0.95) | | | $15.13 | | | 26.71% | | | $114 | | | 1.20% | | | 1.03% |
9/30/23g | | | 13.25 | | | 0.11 | | | (0.51)aa | | | (0.40) | | | — | | | — | | | — | | | 12.85 | | | (3.02%)b | | | 97 | | | 0.91%a | | | 1.27%a |
| | | | | | | | | | | | | | | | | | | | | | | | | | | | | | | | | | | | | |
| | | | | |
The accompanying notes are an integral part of the financial statements. | | | | |
| | | 117
| |
| | | | | |
TABLE OF CONTENTS
| | | |
| | MassMutual Funds (Continued) | |
| | | |
Financial Highlights (For a share outstanding throughout each period)
MassMutual Disciplined Growth Fund
| | | | | | | | | | | | | | | | | | | | |
Class I | | | | | | | | | | | | | | | | | | | | | | | | | | | | | | | | | | | | | |
9/30/24 | | | $8.83 | | | $(0.00)d | | | $3.81 | | | $3.81 | | | $(0.01) | | | $(0.42) | | | $(0.43) | | | $12.21 | | | 44.58% | | | $41,637 | | | 0.59% | | | (0.01%) | |
9/30/23 | | | 7.49 | | | 0.02 | | | 1.71 | | | 1.73 | | | (0.02) | | | (0.37) | | | (0.39) | | | 8.83 | | | 23.88% | | | 34,334 | | | 0.63% | | | 0.25% | |
9/30/22 | | | 15.56 | | | 0.02bb | | | (1.93) | | | (1.91) | | | — | | | (6.16) | | | (6.16) | | | 7.49 | | | (24.92%) | | | 18,483 | | | 0.58% | | | 0.18% | |
9/30/21 | | | 12.85 | | | 0.04 | | | 3.27 | | | 3.31 | | | (0.06) | | | (0.54) | | | (0.60) | | | 15.56 | | | 26.75% | | | 31,388 | | | 0.57% | | | 0.26% | |
9/30/20 | | | 11.00 | | | 0.09 | | | 3.18 | | | 3.27 | | | (0.11) | | | (1.31) | | | (1.42) | | | 12.85 | | | 32.63% | | | 35,702 | | | 0.56% | | | 0.77% | |
Class R5 | | | | | | | | | | | | | | | | | | | | | | | | | | | | | | | | | | | | | |
9/30/24 | | | $8.82 | | | $(0.01) | | | $3.81 | | | $3.80 | | | $— | | | $(0.42) | | | $(0.42) | | | $12.20 | | | 44.56% | | | $103,668 | | | 0.69% | | | (0.11%) | |
9/30/23 | | | 7.49 | | | 0.02 | | | 1.69 | | | 1.71 | | | (0.01) | | | (0.37) | | | (0.38) | | | 8.82 | | | 23.60% | | | 73,393 | | | 0.73% | | | 0.19% | |
9/30/22 | | | 15.57 | | | 0.01bb | | | (1.93) | | | (1.92) | | | — | | | (6.16) | | | (6.16) | | | 7.49 | | | (24.92%) | | | 73,291 | | | 0.68% | | | 0.09% | |
9/30/21 | | | 12.85 | | | 0.02 | | | 3.29 | | | 3.31 | | | (0.05) | | | (0.54) | | | (0.59) | | | 15.57 | | | 26.72% | | | 108,948 | | | 0.67% | | | 0.15% | |
9/30/20 | | | 11.00 | | | 0.07 | | | 3.19 | | | 3.26 | | | (0.10) | | | (1.31) | | | (1.41) | | | 12.85 | | | 32.48% | | | 101,466 | | | 0.66% | | | 0.67% | |
Service Class | | | | | | | | | | | | | | | | | | | | | | | | | | | | | | | | | | | | |
9/30/24 | | | $8.88 | | | $(0.02) | | | $3.83 | | | $3.81 | | | $— | | | $(0.42) | | | $(0.42) | | | $12.27 | | | 44.35% | | | $8,566 | | | 0.79% | | | (0.19%) | |
9/30/23 | | | 7.54 | | | 0.01 | | | 1.70 | | | 1.71 | | | — | | | (0.37) | | | (0.37) | | | 8.88 | | | 23.44% | | | 12,529 | | | 0.83% | | | 0.12% | |
9/30/22 | | | 15.65 | | | (0.00)d | | | (1.95) | | | (1.95) | | | — | | | (6.16) | | | (6.16) | | | 7.54 | | | (25.04%) | | | 14,309 | | | 0.78% | | | (0.02%) | |
9/30/21 | | | 12.92 | | | 0.01 | | | 3.30 | | | 3.31 | | | (0.04) | | | (0.54) | | | (0.58) | | | 15.65 | | | 26.53% | | | 25,505 | | | 0.77% | | | 0.05% | |
9/30/20 | | | 11.04 | | | 0.06 | | | 3.20 | | | 3.26 | | | (0.07) | | | (1.31) | | | (1.38) | | | 12.92 | | | 32.33% | | | 25,668 | | | 0.76% | | | 0.57% | |
| | | | | | | | | | | | | | | | | | | | | | | | | | | | | | | | | | | | | | |
| | | | |
Portfolio turnover rate
| | | 69% | | | 64% | | | 60% | | | 110% | | | 50% |
| | | | | | | | | | | | | | | | |
b
| Percentage represents the results for the period and is not annualized. |
c
| Per share amount calculated on the average shares method. |
d
| Amount is less than $0.005 per share. |
e
| Amount is less than 0.005%. |
g
| For the period February 1, 2023 (commencement of operations) through September 30, 2023. |
l
| Employee retirement benefit plans that invest plan assets in the Separate Investment Accounts (SIAs) may be subject to certain charges as set forth in their respective Plan Documents. Total return figures would be lower for the periods presented if they reflected these charges. |
m
| Total return excludes sales charges, if any, and would be lower for the period presented if it reflected these charges. |
q
| Excludes fees and expenses incurred indirectly as a result of investments in underlying funds, as applicable. |
z
| The net asset values and total returns have been calculated on net assets which include adjustments made in accordance with U.S. generally accepted accounting principles required at period end for financial reporting purposes. |
bb
| The amount shown for a share outstanding does not correspond with the aggregate net investment income (loss) as shown on the Statement of Operations for the period due to the timing of class-specific expenses. See Note 3 for each fund’s expense structure. |
| | | | | |
| | | The accompanying notes are an integral part of the financial statements.
| |
118
| | | | |
| | | | | |
TABLE OF CONTENTS
| | | | | | | | | | | | | | | | | | | |
Administrative Class | | | | | | | | | | | | | | | | | | | | | | | | | | | |
9/30/24 | | | $9.09 | | | $(0.03) | | | $3.92 | | | $3.89 | | | $— | | | $(0.42) | | | $(0.42) | | | $12.56 | | | 44.20% | | | $21,907 | | | 0.89% | | | (0.31%) |
9/30/23 | | | 7.71 | | | (0.00)d,bb | | | 1.75 | | | 1.75 | | | — | | | (0.37) | | | (0.37) | | | 9.09 | | | 23.44% | | | 19,964 | | | 0.93% | | | (0.00%)e |
9/30/22 | | | 15.89 | | | (0.01) | | | (2.01) | | | (2.02) | | | — | | | (6.16) | | | (6.16) | | | 7.71 | | | (25.13%) | | | 24,021 | | | 0.88% | | | (0.11%) |
9/30/21 | | | 13.10 | | | (0.01) | | | 3.36 | | | 3.35 | | | (0.02) | | | (0.54) | | | (0.56) | | | 15.89 | | | 26.46% | | | 36,207 | | | 0.87% | | | (0.05%) |
9/30/20 | | | 11.19 | | | 0.05 | | | 3.25 | | | 3.30 | | | (0.08) | | | (1.31) | | | (1.39) | | | 13.10 | | | 32.19% | | | 36,957 | | | 0.86% | | | 0.47% |
Class R4 | | | | | | | | | | | | | | | | | | | | | | | | | | | | | | | | | | | | |
9/30/24 | | | $8.30 | | | $(0.05) | | | $3.57 | | | $3.52 | | | $— | | | $(0.42) | | | $(0.42) | | | $11.40 | | | 43.94% | | | $7,467 | | | 1.04% | | | (0.46%) |
9/30/23 | | | 7.08 | | | (0.01)bb | | | 1.60 | | | 1.59 | | | — | | | (0.37) | | | (0.37) | | | 8.30 | | | 23.26% | | | 6,373 | | | 1.08% | | | (0.16%) |
9/30/22 | | | 15.06 | | | (0.03) | | | (1.79) | | | (1.82) | | | — | | | (6.16) | | | (6.16) | | | 7.08 | | | (25.23%) | | | 6,348 | | | 1.03% | | | (0.28%) |
9/30/21 | | | 12.45 | | | (0.03) | | | 3.18 | | | 3.15 | | | — | | | (0.54) | | | (0.54) | | | 15.06 | | | 26.20% | | | 12,613 | | | 1.02% | | | (0.22%) |
9/30/20 | | | 10.70 | | | 0.03 | | | 3.09 | | | 3.12 | | | (0.06) | | | (1.31) | | | (1.37) | | | 12.45 | | | 31.97% | | | 28,832 | | | 1.01% | | | 0.31% |
Class A | | | | | | | | | | | | | | | | | | | | | | | | | | | | | | | | | | | | |
9/30/24 | | | $8.43 | | | $(0.05) | | | $3.63 | | | $3.58 | | | $— | | | $(0.42) | | | $(0.42) | | | $11.59 | | | 43.98% | | | $8,202 | | | 1.11% | | | (0.52%) |
9/30/23 | | | 7.20 | | | (0.02)bb | | | 1.62 | | | 1.60 | | | — | | | (0.37) | | | (0.37) | | | 8.43 | | | 23.00% | | | 8,081 | | | 1.18% | | | (0.25%) |
9/30/22 | | | 15.23 | | | (0.04) | | | (1.83) | | | (1.87) | | | — | | | (6.16) | | | (6.16) | | | 7.20 | | | (25.29%) | | | 14,354 | | | 1.13% | | | (0.38%) |
9/30/21 | | | 12.59 | | | (0.04) | | | 3.22 | | | 3.18 | | | — | | | (0.54) | | | (0.54) | | | 15.23 | | | 26.12% | | | 26,591 | | | 1.12% | | | (0.30%) |
9/30/20 | | | 10.80 | | | 0.02 | | | 3.13 | | | 3.15 | | | (0.05) | | | (1.31) | | | (1.36) | | | 12.59 | | | 31.87% | | | 27,988 | | | 1.11% | | | 0.22% |
Class R3 | | | | | | | | | | | | | | | | | | | | | | | | | | | | | | | | | | | | |
9/30/24 | | | $8.20 | | | $(0.07) | | | $3.51 | | | $3.44 | | | $— | | | $(0.42) | | | $(0.42) | | | $11.22 | | | 43.49% | | | $5,572 | | | 1.29% | | | (0.71%) |
9/30/23 | | | 7.01 | | | (0.03)bb | | | 1.59 | | | 1.56 | | | — | | | (0.37) | | | (0.37) | | | 8.20 | | | 23.06% | | | 4,449 | | | 1.33% | | | (0.41%) |
9/30/22 | | | 15.00 | | | (0.05) | | | (1.78) | | | (1.83) | | | — | | | (6.16) | | | (6.16) | | | 7.01 | | | (25.46%) | | | 3,959 | | | 1.28% | | | (0.51%) |
9/30/21 | | | 12.43 | | | (0.06) | | | 3.17 | | | 3.11 | | | — | | | (0.54) | | | (0.54) | | | 15.00 | | | 25.88% | | | 5,002 | | | 1.27% | | | (0.46%) |
9/30/20 | | | 10.66 | | | 0.01 | | | 3.09 | | | 3.10 | | | (0.02) | | | (1.31) | | | (1.33) | | | 12.43 | | | 31.78% | | | 5,875 | | | 1.26% | | | 0.05% |
Class Y | | | | | | | | | | | | | | | | | | | | | | | | | | | | | | | | | | | | |
9/30/24 | | | $8.82 | | | $(0.01) | | | $3.81 | | | $3.80 | | | $— | | | $(0.42) | | | $(0.42) | | | $12.20 | | | 44.55% | | | $155 | | | 0.69% | | | (0.11%) |
9/30/23g | | | 7.89 | | | 0.01 | | | 0.92 | | | 0.93 | | | — | | | — | | | — | | | 8.82 | | | 11.79%b | | | 112 | | | 0.73%a | | | 0.15%a |
| | | | | | | | | | | | | | | | | | | | | | | | | | | | | | | | | | | | | |
| | | | | |
The accompanying notes are an integral part of the financial statements. | | | | |
| | | 119
| |
| | | | | |
TABLE OF CONTENTS
| | | |
| | MassMutual Funds (Continued) | |
| | | |
Financial Highlights (For a share outstanding throughout each period)
MassMutual Small Cap Opportunities Fund
| | | | | | | | | | | | | | | | | | | |
Class I | |
9/30/24 | | | $15.85 | | | $0.11 | | | $4.13 | | | $4.24 | | | $(0.05) | | | $(0.76) | | | $(0.81) | | | $19.28 | | | 27.85% | | | $219,361 | | | 0.66% | | | 0.65% | | | 0.64% |
9/30/23 | | | 14.20 | | | 0.10 | | | 1.76 | | | 1.86 | | | (0.14) | | | (0.07) | | | (0.21) | | | 15.85 | | | 13.14% | | | 125,988 | | | 0.67% | | | N/A | | | 0.65% |
9/30/22 | | | 19.21 | | | 0.08 | | | (3.28) | | | (3.20) | | | — | | | (1.81) | | | (1.81) | | | 14.20 | | | (18.57%) | | | 95,436 | | | 0.66% | | | N/A | | | 0.48% |
9/30/21 | | | 13.96 | | | 0.06 | | | 6.51 | | | 6.57 | | | (0.11) | | | (1.21) | | | (1.32) | | | 19.21 | | | 48.95% | | | 85,183 | | | 0.66% | | | N/A | | | 0.35% |
9/30/20 | | | 13.72 | | | 0.10 | | | 0.27 | | | 0.37 | | | (0.06) | | | (0.07) | | | (0.13) | | | 13.96 | | | 2.62% | | | 39,988 | | | 0.69% | | | N/A | | | 0.77% |
Class R5 | |
9/30/24 | | | $15.79 | | | $0.09 | | | $4.11 | | | $4.20 | | | $(0.04) | | | $(0.76) | | | $(0.80) | | | $19.19 | | | 27.69% | | | $109,539 | | | 0.76% | | | 0.75% | | | 0.52% |
9/30/23 | | | 14.14 | | | 0.09 | | | 1.76 | | | 1.85 | | | (0.13) | | | (0.07) | | | (0.20) | | | 15.79 | | | 13.08% | | | 104,951 | | | 0.77% | | | N/A | | | 0.55% |
9/30/22 | | | 19.16 | | | 0.06 | | | (3.27) | | | (3.21) | | | — | | | (1.81) | | | (1.81) | | | 14.14 | | | (18.68%) | | | 100,585 | | | 0.75% | | | N/A | | | 0.35% |
9/30/21 | | | 13.93 | | | 0.05 | | | 6.48 | | | 6.53 | | | (0.09) | | | (1.21) | | | (1.30) | | | 19.16 | | | 48.78% | | | 137,127 | | | 0.76% | | | N/A | | | 0.26% |
9/30/20 | | | 13.69 | | | 0.09 | | | 0.27 | | | 0.36 | | | (0.05) | | | (0.07) | | | (0.12) | | | 13.93 | | | 2.56% | | | 92,440 | | | 0.79% | | | N/A | | | 0.68% |
Service Class | |
9/30/24 | | | $15.72 | | | $0.07 | | | $4.10 | | | $4.17 | | | $(0.03) | | | $(0.76) | | | $(0.79) | | | $19.10 | | | 27.62% | | | $16,696 | | | 0.86% | | | 0.85% | | | 0.42% |
9/30/23 | | | 14.08 | | | 0.07 | | | 1.75 | | | 1.82 | | | (0.11) | | | (0.07) | | | (0.18) | | | 15.72 | | | 12.95% | | | 15,707 | | | 0.87% | | | N/A | | | 0.45% |
9/30/22 | | | 19.11 | | | 0.04 | | | (3.26) | | | (3.22) | | | — | | | (1.81) | | | (1.81) | | | 14.08 | | | (18.78%) | | | 15,851 | | | 0.85% | | | N/A | | | 0.24% |
9/30/21 | | | 13.89 | | | 0.03 | | | 6.48 | | | 6.51 | | | (0.08) | | | (1.21) | | | (1.29) | | | 19.11 | | | 48.72% | | | 24,560 | | | 0.86% | | | N/A | | | 0.17% |
9/30/20 | | | 13.66 | | | 0.08 | | | 0.25 | | | 0.33 | | | (0.03) | | | (0.07) | | | (0.10) | | | 13.89 | | | 2.37% | | | 17,146 | | | 0.89% | | | N/A | | | 0.58% |
| | | | | | | | | | | | | | | | | | | | | | | | | | | | | | | | | | | | | | | | |
| | | | |
Portfolio turnover rate | | | 40% | | | 46% | | | 39% | | | 40% | | | 47% |
| | | | | | | | | | | | | | | | |
b
| Percentage represents the results for the period and is not annualized. |
c
| Per share amount calculated on the average shares method. |
d
| Amount is less than $0.005 per share. |
e
| Amount is less than 0.005%. |
g
| For the period February 1, 2023 (commencement of operations) through September 30, 2023. |
j
| Computed after giving effect to an agreement by MML Advisers to waive certain fees and expenses of the Fund. |
l
| Employee retirement benefit plans that invest plan assets in the Separate Investment Accounts (SIAs) may be subject to certain charges as set forth in their respective Plan Documents. Total return figures would be lower for the periods presented if they reflected these charges. |
m
| Total return excludes sales charges, if any, and would be lower for the period presented if it reflected these charges. |
q
| Excludes fees and expenses incurred indirectly as a result of investments in underlying funds, as applicable. |
z
| The net asset values and total returns have been calculated on net assets which include adjustments made in accordance with U.S. generally accepted accounting principles required at period end for financial reporting purposes. |
aa
| The amount shown for a share outstanding does not correspond with the aggregate net realized and unrealized gain (loss) for the period due to the timing of purchases and redemptions of Fund shares in relation to the fluctuating market values of the Fund. |
bb
| The amount shown for a share outstanding does not correspond with the aggregate net investment income (loss) as shown on the Statement of Operations for the period due to the timing of class-specific expenses. See Note 3 for each fund’s expense structure. |
| | | | | |
| | | The accompanying notes are an integral part of the financial statements.
| |
120
| | | | |
| | | | | |
TABLE OF CONTENTS
| | | | | | | | | | | | | | | | | | | |
Administrative Class | |
9/30/24 | | | $15.58 | | | $0.05 | | | $4.06 | | | $4.11 | | | $(0.03) | | | $(0.76) | | | $(0.79) | | | $18.90 | | | 27.42% | | | $22,272 | | | 0.96% | | | 0.95% | | | 0.32% |
9/30/23 | | | 13.95 | | | 0.05 | | | 1.75 | | | 1.80 | | | (0.10) | | | (0.07) | | | (0.17) | | | 15.58 | | | 12.88% | | | 21,277 | | | 0.97% | | | N/A | | | 0.35% |
9/30/22 | | | 18.97 | | | 0.02 | | | (3.23) | | | (3.21) | | | — | | | (1.81) | | | (1.81) | | | 13.95 | | | (18.88%) | | | 20,100 | | | 0.95% | | | N/A | | | 0.15% |
9/30/21 | | | 13.80 | | | 0.01 | | | 6.44 | | | 6.45 | | | (0.07) | | | (1.21) | | | (1.28) | | | 18.97 | | | 48.54% | | | 26,314 | | | 0.96% | | | N/A | | | 0.07% |
9/30/20 | | | 13.57 | | | 0.06 | | | 0.26 | | | 0.32 | | | (0.02) | | | (0.07) | | | (0.09) | | | 13.80 | | | 2.27% | | | 18,422 | | | 0.99% | | | N/A | | | 0.48% |
Class R4 | |
9/30/24 | | | $14.92 | | | $0.03 | | | $3.88 | | | $3.91 | | | $— | | | $(0.76) | | | $(0.76) | | | $18.07 | | | 27.28% | | | $12,849 | | | 1.11% | | | 1.10% | | | 0.16% |
9/30/23 | | | 13.37 | | | 0.03 | | | 1.67 | | | 1.70 | | | (0.08) | | | (0.07) | | | (0.15) | | | 14.92 | | | 12.69% | | | 13,888 | | | 1.12% | | | N/A | | | 0.20% |
9/30/22 | | | 18.28 | | | (0.00)d,bb | | | (3.10) | | | (3.10) | | | — | | | (1.81) | | | (1.81) | | | 13.37 | | | (18.99%) | | | 11,835 | | | 1.10% | | | N/A | | | (0.00%)e |
9/30/21 | | | 13.34 | | | (0.02) | | | 6.22 | | | 6.20 | | | (0.05) | | | (1.21) | | | (1.26) | | | 18.28 | | | 48.31% | | | 15,682 | | | 1.11% | | | N/A | | | (0.09%) |
9/30/20 | | | 13.12 | | | 0.04 | | | 0.25 | | | 0.29 | | | — | | | (0.07) | | | (0.07) | | | 13.34 | | | 2.16% | | | 9,413 | | | 1.14% | | | N/A | | | 0.32% |
Class A | |
9/30/24 | | | $15.02 | | | $0.02 | | | $3.90 | | | $3.92 | | | $— | | | $(0.76) | | | $(0.76) | | | $18.18 | | | 27.16% | | | $43,168 | | | 1.17% | | | 1.17% | | | 0.11% |
9/30/23 | | | 13.46 | | | 0.02 | | | 1.67 | | | 1.69 | | | (0.06) | | | (0.07) | | | (0.13) | | | 15.02 | | | 12.53% | | | 36,525 | | | 1.22% | | | N/A | | | 0.10% |
9/30/22 | | | 18.40 | | | (0.02)bb | | | (3.11) | | | (3.13) | | | — | | | (1.81) | | | (1.81) | | | 13.46 | | | (19.04%) | | | 38,730 | | | 1.20% | | | N/A | | | (0.11%) |
9/30/21 | | | 13.42 | | | (0.03) | | | 6.25 | | | 6.22 | | | (0.03) | | | (1.21) | | | (1.24) | | | 18.40 | | | 48.15% | | | 55,207 | | | 1.21% | | | N/A | | | (0.18%) |
9/30/20 | | | 13.21 | | | 0.03 | | | 0.25 | | | 0.28 | | | — | | | (0.07) | | | (0.07) | | | 13.42 | | | 2.07% | | | 42,491 | | | 1.24% | | | N/A | | | 0.22% |
Class R3 | |
9/30/24 | | | $14.68 | | | $(0.01)bb | | | $3.81 | | | $3.80 | | | $— | | | $(0.76) | | | $(0.76) | | | $17.72 | | | 26.97% | | | $9,822 | | | 1.36% | | | 1.35% | | | (0.07%) |
9/30/23 | | | 13.16 | | | (0.01)bb | | | 1.64 | | | 1.63 | | | (0.04) | | | (0.07) | | | (0.11) | | | 14.68 | | | 12.40% | | | 7,672 | | | 1.37% | | | N/A | | | (0.05%) |
9/30/22 | | | 18.06 | | | (0.04)bb | | | (3.05) | | | (3.09) | | | — | | | (1.81) | | | (1.81) | | | 13.16 | | | (19.19%) | | | 7,153 | | | 1.35% | | | N/A | | | (0.26%) |
9/30/21 | | | 13.18 | | | (0.06) | | | 6.15 | | | 6.09 | | | — | | | (1.21) | | | (1.21) | | | 18.06 | | | 48.00% | | | 9,695 | | | 1.36% | | | N/A | | | (0.34%) |
9/30/20 | | | 13.00 | | | 0.01 | | | 0.24 | | | 0.25 | | | — | | | (0.07) | | | (0.07) | | | 13.18 | | | 1.87% | | | 6,048 | | | 1.39% | | | N/A | | | 0.07% |
Class Y | |
9/30/24 | | | $15.79 | | | $0.10 | | | $4.12 | | | $4.22 | | | $(0.04) | | | $(0.76) | | | $(0.80) | | | $19.21 | | | 27.77% | | | $1,162 | | | 0.76% | | | 0.75% | | | 0.57% |
9/30/23g | | | 16.67 | | | 0.06 | | | (0.94)aa | | | (0.88) | | | — | | | — | | | — | | | 15.79 | | | (5.28%)b | | | 95 | | | 0.77%a | | | N/A | | | 0.55%a |
| | | | | | | | | | | | | | | | | | | | | | | | | | | | | | | | | | | | | | | | |
| | | | | |
The accompanying notes are an integral part of the financial statements. | | | | |
| | | 121
| |
| | | | | |
TABLE OF CONTENTS
| | | |
| | MassMutual Funds (Continued) | |
| | | |
Financial Highlights (For a share outstanding throughout each period)
MassMutual Global Fund
| | | | | | | | | | | | | | | | | | | |
Class I |
9/30/24 | | | $11.02 | | | $(0.01) | | | $3.18 | | | $3.17 | | | $— | | | $(2.79) | | | $(2.79) | | | $11.40 | | | 34.35% | | | $54,970 | | | 0.93% | | | (0.10%) |
9/30/23 | | | 10.72 | | | 0.00d,bb | | | 2.84 | | | 2.84 | | | — | | | (2.54) | | | (2.54) | | | 11.02 | | | 29.05% | | | 48,335 | | | 0.91% | | | 0.02% |
9/30/22 | | | 18.79 | | | (0.01) | | | (6.02) | | | (6.03) | | | — | | | (2.04) | | | (2.04) | | | 10.72 | | | (36.28%) | | | 56,931 | | | 0.86% | | | (0.06%) |
9/30/21 | | | 15.04 | | | (0.05) | | | 4.64 | | | 4.59 | | | — | | | (0.84) | | | (0.84) | | | 18.79 | | | 31.36% | | | 99,959 | | | 0.84% | | | (0.29%) |
9/30/20 | | | 12.35 | | | 0.00d | | | 2.81 | | | 2.81 | | | (0.09) | | | (0.03) | | | (0.12) | | | 15.04 | | | 22.90% | | | 75,893 | | | 0.85% | | | 0.00%e |
Class R5 |
9/30/24 | | | $10.99 | | | $(0.02) | | | $3.17 | | | $3.15 | | | $— | | | $(2.79) | | | $(2.79) | | | $11.35 | | | 34.23% | | | $50,714 | | | 1.03% | | | (0.19%) |
9/30/23 | | | 10.70 | | | (0.01) | | | 2.84 | | | 2.83 | | | — | | | (2.54) | | | (2.54) | | | 10.99 | | | 28.99% | | | 44,364 | | | 1.02% | | | (0.08%) |
9/30/22 | | | 18.78 | | | (0.03) | | | (6.01) | | | (6.04) | | | — | | | (2.04) | | | (2.04) | | | 10.70 | | | (36.36%) | | | 58,808 | | | 0.96% | | | (0.17%) |
9/30/21 | | | 15.05 | | | (0.07) | | | 4.64 | | | 4.57 | | | — | | | (0.84) | | | (0.84) | | | 18.78 | | | 31.20% | | | 126,049 | | | 0.94% | | | (0.39%) |
9/30/20 | | | 12.36 | | | (0.01) | | | 2.81 | | | 2.80 | | | (0.08) | | | (0.03) | | | (0.11) | | | 15.05 | | | 22.77% | | | 111,038 | | | 0.95% | | | (0.09%) |
Service Class |
9/30/24 | | | $10.80 | | | $(0.03) | | | $3.10 | | | $3.07 | | | $— | | | $(2.79) | | | $(2.79) | | | $11.08 | | | 34.08% | | | $3,980 | | | 1.13% | | | (0.32%) |
9/30/23 | | | 10.56 | | | (0.02) | | | 2.80 | | | 2.78 | | | — | | | (2.54) | | | (2.54) | | | 10.80 | | | 28.90% | | | 3,655 | | | 1.12% | | | (0.20%) |
9/30/22 | | | 18.58 | | | (0.04) | | | (5.94) | | | (5.98) | | | — | | | (2.04) | | | (2.04) | | | 10.56 | | | (36.43%) | | | 5,579 | | | 1.06% | | | (0.24%) |
9/30/21 | | | 14.91 | | | (0.08) | | | 4.59 | | | 4.51 | | | — | | | (0.84) | | | (0.84) | | | 18.58 | | | 31.09% | | | 7,892 | | | 1.04% | | | (0.49%) |
9/30/20 | | | 12.23 | | | (0.03) | | | 2.80 | | | 2.77 | | | (0.06) | | | (0.03) | | | (0.09) | | | 14.91 | | | 22.75% | | | 6,166 | | | 1.05% | | | (0.19%) |
| | | | | | | | | | | | | | | | | | | | | | | | | | | | | | | | | | | | | |
| | | | |
Portfolio turnover rate
| | | 6% | | | 10% | | | 10% | | | 10% | | | 12% |
| | | | | | | | | | | | | | | | |
c
| Per share amount calculated on the average shares method. |
d
| Amount is less than $0.005 per share. |
e
| Amount is less than 0.005%. |
l
| Employee retirement benefit plans that invest plan assets in the Separate Investment Accounts (SIAs) may be subject to certain charges as set forth in their respective Plan Documents. Total return figures would be lower for the periods presented if they reflected these charges. |
m
| Total return excludes sales charges, if any, and would be lower for the period presented if it reflected these charges. |
q
| Excludes fees and expenses incurred indirectly as a result of investments in underlying funds, as applicable. |
z
| The net asset values and total returns have been calculated on net assets which include adjustments made in accordance with U.S. generally accepted accounting principles required at period end for financial reporting purposes. |
bb
| The amount shown for a share outstanding does not correspond with the aggregate net investment income (loss) as shown on the Statement of Operations for the period due to the timing of class-specific expenses. See Note 3 for each fund’s expense structure. |
| | | | | |
| | | The accompanying notes are an integral part of the financial statements.
| |
122
| | | | |
| | | | | |
TABLE OF CONTENTS
| | | | | | | | | | | | | | | | | | | |
Administrative Class |
9/30/24 | | | $10.90 | | | $(0.04) | | | $3.12 | | | $3.08 | | | $— | | | $(2.79) | | | $(2.79) | | | $11.19 | | | 33.83% | | | $47,137 | | | 1.23% | | | (0.41%) |
9/30/23 | | | 10.64 | | | (0.03) | | | 2.83 | | | 2.80 | | | — | | | (2.54) | | | (2.54) | | | 10.90 | | | 28.84% | | | 50,587 | | | 1.22% | | | (0.29%) |
9/30/22 | | | 18.73 | | | (0.06) | | | (5.99) | | | (6.05) | | | — | | | (2.04) | | | (2.04) | | | 10.64 | | | (36.52%) | | | 45,831 | | | 1.16% | | | (0.38%) |
9/30/21 | | | 15.03 | | | (0.10) | | | 4.64 | | | 4.54 | | | — | | | (0.84) | | | (0.84) | | | 18.73 | | | 31.03% | | | 88,387 | | | 1.14% | | | (0.59%) |
9/30/20 | | | 12.34 | | | (0.04) | | | 2.81 | | | 2.77 | | | (0.05) | | | (0.03) | | | (0.08) | | | 15.03 | | | 22.56% | | | 80,607 | | | 1.15% | | | (0.29%) |
Class R4 |
9/30/24 | | | $10.37 | | | $(0.06) | | | $2.95 | | | $2.89 | | | $— | | | $(2.79) | | | $(2.79) | | | $10.47 | | | 33.68% | | | $9,712 | | | 1.38% | | | (0.56%) |
9/30/23 | | | 10.24 | | | (0.04) | | | 2.71 | | | 2.67 | | | — | | | (2.54) | | | (2.54) | | | 10.37 | | | 28.67% | | | 8,921 | | | 1.37% | | | (0.43%) |
9/30/22 | | | 18.12 | | | (0.07) | | | (5.77) | | | (5.84) | | | — | | | (2.04) | | | (2.04) | | | 10.24 | | | (36.60%) | | | 8,676 | | | 1.31% | | | (0.52%) |
9/30/21 | | | 14.59 | | | (0.12) | | | 4.49 | | | 4.37 | | | — | | | (0.84) | | | (0.84) | | | 18.12 | | | 30.79% | | | 15,975 | | | 1.29% | | | (0.72%) |
9/30/20 | | | 11.98 | | | (0.06) | | | 2.73 | | | 2.67 | | | (0.03) | | | (0.03) | | | (0.06) | | | 14.59 | | | 22.36% | | | 8,878 | | | 1.30% | | | (0.45%) |
Class A |
9/30/24 | | | $10.57 | | | $(0.06) | | | $3.01 | | | $2.95 | | | $— | | | $(2.79) | | | $(2.79) | | | $10.73 | | | 33.59% | | | $12,339 | | | 1.45% | | | (0.61%) |
9/30/23 | | | 10.41 | | | (0.06) | | | 2.76 | | | 2.70 | | | — | | | (2.54) | | | (2.54) | | | 10.57 | | | 28.47% | | | 10,559 | | | 1.47% | | | (0.54%) |
9/30/22 | | | 18.40 | | | (0.09) | | | (5.86) | | | (5.95) | | | — | | | (2.04) | | | (2.04) | | | 10.41 | | | (36.64%) | | | 9,014 | | | 1.41% | | | (0.63%) |
9/30/21 | | | 14.82 | | | (0.14) | | | 4.56 | | | 4.42 | | | — | | | (0.84) | | | (0.84) | | | 18.40 | | | 30.65% | | | 19,415 | | | 1.39% | | | (0.84%) |
9/30/20 | | | 12.17 | | | (0.07) | | | 2.77 | | | 2.70 | | | (0.02) | | | (0.03) | | | (0.05) | | | 14.82 | | | 22.22% | | | 22,903 | | | 1.40% | | | (0.55%) |
Class R3 |
9/30/24 | | | $10.41 | | | $(0.08) | | | $2.96 | | | $2.88 | | | $— | | | $(2.79) | | | $(2.79) | | | $10.50 | | | 33.40% | | | $9,303 | | | 1.64% | | | (0.81%) |
9/30/23 | | | 10.30 | | | (0.07) | | | 2.72 | | | 2.65 | | | — | | | (2.54) | | | (2.54) | | | 10.41 | | | 28.24% | | | 7,378 | | | 1.62% | | | (0.69%) |
9/30/22 | | | 18.25 | | | (0.11) | | | (5.80) | | | (5.91) | | | — | | | (2.04) | | | (2.04) | | | 10.30 | | | (36.73%) | | | 7,920 | | | 1.56% | | | (0.77%) |
9/30/21 | | | 14.72 | | | (0.17) | | | 4.54 | | | 4.37 | | | — | | | (0.84) | | | (0.84) | | | 18.25 | | | 30.51% | | | 13,541 | | | 1.54% | | | (0.98%) |
9/30/20 | | | 12.10 | | | (0.09) | | | 2.75 | | | 2.66 | | | (0.01) | | | (0.03) | | | (0.04) | | | 14.72 | | | 21.99% | | | 9,792 | | | 1.55% | | | (0.69%) |
| | | | | | | | | | | | | | | | | | | | | | | | | | | | | | | | | | | | | |
| | | | | |
The accompanying notes are an integral part of the financial statements. | | | �� | |
| | | 123
| |
| | | | | |
TABLE OF CONTENTS
| | | |
| | MassMutual Funds (Continued) | |
| | | |
Financial Highlights (For a share outstanding throughout each period)
MassMutual International Equity Fund
| | | | | | | | | | | | | | | | | | | |
Class I |
9/30/24 | | | $7.94 | | | $0.12 | | | $1.57 | | | $1.69 | | | $(0.17) | | | $(0.11) | | | $(0.28) | | | $9.35 | | | 21.87% | | | $72,977 | | | 1.13% | | | 1.08% | | | 1.45% |
9/30/23 | | | 7.14 | | | 0.14 | | | 1.12 | | | 1.26 | | | (0.10) | | | (0.36) | | | (0.46) | | | 7.94 | | | 17.61% | | | 70,386 | | | 1.10% | | | 1.05% | | | 1.75% |
9/30/22 | | | 10.08 | | | 0.12 | | | (1.83) | | | (1.71) | | | (0.21) | | | (1.02) | | | (1.23) | | | 7.14 | | | (19.37%) | | | 66,355 | | | 1.09% | | | 1.04% | | | 1.41% |
9/30/21 | | | 13.08 | | | 0.14 | | | 1.84 | | | 1.98 | | | (0.04) | | | (4.94) | | | (4.98) | | | 10.08 | | | 17.97% | | | 89,913 | | | 1.02% | | | 1.00% | | | 1.31% |
9/30/20 | | | 12.01 | | | 0.03 | | | 1.54 | | | 1.57 | | | (0.13) | | | (0.37) | | | (0.50) | | | 13.08 | | | 13.17% | | | 96,308 | | | 1.02% | | | 1.00% | | | 0.26% |
Class R5 |
9/30/24 | | | $7.94 | | | $0.11 | | | $1.57 | | | $1.68 | | | $(0.16) | | | $(0.11) | | | $(0.27) | | | $9.35 | | | 21.73% | | | $29,483 | | | 1.22% | | | 1.17% | | | 1.33% |
9/30/23 | | | 7.14 | | | 0.13 | | | 1.12 | | | 1.25 | | | (0.09) | | | (0.36) | | | (0.45) | | | 7.94 | | | 17.48% | | | 30,262 | | | 1.20% | | | 1.15% | | | 1.62% |
9/30/22 | | | 10.08 | | | 0.12 | | | (1.85) | | | (1.73) | | | (0.19) | | | (1.02) | | | (1.21) | | | 7.14 | | | (19.47%) | | | 30,827 | | | 1.19% | | | 1.14% | | | 1.38% |
9/30/21 | | | 13.08 | | | 0.14 | | | 1.83 | | | 1.97 | | | (0.03) | | | (4.94) | | | (4.97) | | | 10.08 | | | 17.79% | | | 50,688 | | | 1.12% | | | 1.10% | | | 1.27% |
9/30/20 | | | 12.00 | | | 0.02 | | | 1.55 | | | 1.57 | | | (0.12) | | | (0.37) | | | (0.49) | | | 13.08 | | | 13.14% | | | 61,444 | | | 1.12% | | | 1.10% | | | 0.20% |
Service Class |
9/30/24 | | | $7.91 | | | $0.10 | | | $1.57 | | | $1.67 | | | $(0.15) | | | $(0.11) | | | $(0.26) | | | $9.32 | | | 21.67% | | | $2,957 | | | 1.32% | | | 1.27% | | | 1.20% |
9/30/23 | | | 7.12 | | | 0.13 | | | 1.10 | | | 1.23 | | | (0.08) | | | (0.36) | | | (0.44) | | | 7.91 | | | 17.26% | | | 3,485 | | | 1.30% | | | 1.25% | | | 1.60% |
9/30/22 | | | 10.05 | | | 0.12 | | | (1.85) | | | (1.73) | | | (0.18) | | | (1.02) | | | (1.20) | | | 7.12 | | | (19.52%) | | | 2,624 | | | 1.29% | | | 1.24% | | | 1.35% |
9/30/21 | | | 13.04 | | | 0.12 | | | 1.84 | | | 1.96 | | | (0.01) | | | (4.94) | | | (4.95) | | | 10.05 | | | 17.72% | | | 3,469 | | | 1.22% | | | 1.20% | | | 1.16% |
9/30/20 | | | 11.97 | | | 0.00d | | | 1.54 | | | 1.54 | | | (0.10) | | | (0.37) | | | (0.47) | | | 13.04 | | | 12.94% | | | 4,524 | | | 1.22% | | | 1.20% | | | 0.00%e |
| | | | | | | | | | | | | | | | | | | | | | | | | | | | | | | | | | | | | | | | |
| | | | |
Portfolio turnover rate | | | 25% | | | 20% | | | 22% | | | 30% | | | 106% |
| | | | | | | | | | | | | | | | |
b
| Percentage represents the results for the period and is not annualized. |
c
| Per share amount calculated on the average shares method. |
d
| Amount is less than $0.005 per share. |
e
| Amount is less than 0.005%. |
g
| For the period February 1, 2023 (commencement of operations) through September 30, 2023. |
j
| Computed after giving effect to an agreement by MML Advisers to waive certain fees and expenses of the Fund. |
l
| Employee retirement benefit plans that invest plan assets in the Separate Investment Accounts (SIAs) may be subject to certain charges as set forth in their respective Plan Documents. Total return figures would be lower for the periods presented if they reflected these charges. |
m
| Total return excludes sales charges, if any, and would be lower for the period presented if it reflected these charges. |
q
| Excludes fees and expenses incurred indirectly as a result of investments in underlying funds, as applicable. |
z
| The net asset values and total returns have been calculated on net assets which include adjustments made in accordance with U.S. generally accepted accounting principles required at period end for financial reporting purposes. |
aa
| The amount shown for a share outstanding does not correspond with the aggregate net realized and unrealized gain (loss) for the period due to the timing of purchases and redemptions of Fund shares in relation to the fluctuating market values of the Fund. |
| | | | | |
| | | The accompanying notes are an integral part of the financial statements.
| |
124
| | | | |
| | | | | |
TABLE OF CONTENTS
| | | | | | | | | | | | | | | | | | | |
Administrative Class |
9/30/24 | | | $7.83 | | | $0.10 | | | $1.54 | | | $1.64 | | | $(0.14) | | | $(0.11) | | | $(0.25) | | | $9.22 | | | 21.49% | | | $1,720 | | | 1.42% | | | 1.37% | | | 1.24% |
9/30/23 | | | 7.05 | | | 0.11 | | | 1.10 | | | 1.21 | | | (0.07) | | | (0.36) | | | (0.43) | | | 7.83 | | | 17.21% | | | 1,890 | | | 1.40% | | | 1.35% | | | 1.38% |
9/30/22 | | | 9.96 | | | 0.11 | | | (1.83) | | | (1.72) | | | (0.17) | | | (1.02) | | | (1.19) | | | 7.05 | | | (19.60%) | | | 2,273 | | | 1.39% | | | 1.34% | | | 1.26% |
9/30/21 | | | 12.97 | | | 0.11 | | | 1.82 | | | 1.93 | | | — | | | (4.94) | | | (4.94) | | | 9.96 | | | 17.59% | | | 2,436 | | | 1.32% | | | 1.30% | | | 1.03% |
9/30/20 | | | 11.91 | | | (0.00)d | | | 1.52 | | | 1.52 | | | (0.09) | | | (0.37) | | | (0.46) | | | 12.97 | | | 12.81% | | | 3,565 | | | 1.32% | | | 1.30% | | | (0.02%) |
Class R4 |
9/30/24 | | | $7.25 | | | $0.08 | | | $1.42 | | | $1.50 | | | $(0.13) | | | $(0.11) | | | $(0.24) | | | $8.51 | | | 21.29% | | | $630 | | | 1.57% | | | 1.52% | | | 1.03% |
9/30/23 | | | 6.55 | | | 0.08 | | | 1.03 | | | 1.11 | | | (0.05) | | | (0.36) | | | (0.41) | | | 7.25 | | | 16.89% | | | 537 | | | 1.55% | | | 1.50% | | | 1.14% |
9/30/22 | | | 9.33 | | | 0.08 | | | (1.69) | | | (1.61) | | | (0.15) | | | (1.02) | | | (1.17) | | | 6.55 | | | (19.69%) | | | 711 | | | 1.53% | | | 1.48% | | | 0.93% |
9/30/21 | | | 12.45 | | | 0.09 | | | 1.73 | | | 1.82 | | | — | | | (4.94) | | | (4.94) | | | 9.33 | | | 17.41% | | | 1,639 | | | 1.47% | | | 1.45% | | | 0.88% |
9/30/20 | | | 11.43 | | | (0.04) | | | 1.48 | | | 1.44 | | | (0.05) | | | (0.37) | | | (0.42) | | | 12.45 | | | 12.70% | | | 1,951 | | | 1.47% | | | 1.45% | | | (0.31%) |
Class A |
9/30/24 | | | $7.36 | | | $0.07 | | | $1.46 | | | $1.53 | | | $(0.13) | | | $(0.11) | | | $(0.24) | | | $8.65 | | | 21.26% | | | $10,001 | | | 1.64% | | | 1.59% | | | 0.90% |
9/30/23 | | | 6.65 | | | 0.09 | | | 1.03 | | | 1.12 | | | (0.05) | | | (0.36) | | | (0.41) | | | 7.36 | | | 16.87% | | | 9,847 | | | 1.65% | | | 1.60% | | | 1.14% |
9/30/22 | | | 9.45 | | | 0.08 | | | (1.72) | | | (1.64) | | | (0.14) | | | (1.02) | | | (1.16) | | | 6.65 | | | (19.79%) | | | 9,014 | | | 1.64% | | | 1.59% | | | 0.95% |
9/30/21 | | | 12.56 | | | 0.08 | | | 1.75 | | | 1.83 | | | — | | | (4.94) | | | (4.94) | | | 9.45 | | | 17.30% | | | 13,793 | | | 1.57% | | | 1.55% | | | 0.82% |
9/30/20 | | | 11.54 | | | (0.03) | | | 1.48 | | | 1.45 | | | (0.06) | | | (0.37) | | | (0.43) | | | 12.56 | | | 12.61% | | | 18,670 | | | 1.57% | | | 1.55% | | | (0.22%) |
Class R3 |
9/30/24 | | | $7.13 | | | $0.06 | | | $1.41 | | | $1.47 | | | $(0.12) | | | $(0.11) | | | $(0.23) | | | $8.37 | | | 21.07% | | | $2,581 | | | 1.83% | | | 1.78% | | | 0.76% |
9/30/23 | | | 6.46 | | | 0.08 | | | 1.00 | | | 1.08 | | | (0.05) | | | (0.36) | | | (0.41) | | | 7.13 | | | 16.65% | | | 2,231 | | | 1.80% | | | 1.75% | | | 1.03% |
9/30/22 | | | 9.22 | | | 0.07 | | | (1.67) | | | (1.60) | | | (0.14) | | | (1.02) | | | (1.16) | | | 6.46 | | | (19.87%) | | | 2,060 | | | 1.79% | | | 1.74% | | | 0.89% |
9/30/21 | | | 12.38 | | | 0.07 | | | 1.71 | | | 1.78 | | | — | | | (4.94) | | | (4.94) | | | 9.22 | | | 17.07% | | | 2,294 | | | 1.72% | | | 1.70% | | | 0.74% |
9/30/20 | | | 11.38 | | | (0.06) | | | 1.47 | | | 1.41 | | | (0.04) | | | (0.37) | | | (0.41) | | | 12.38 | | | 12.42% | | | 2,427 | | | 1.72% | | | 1.70% | | | (0.49%) |
Class Y |
9/30/24 | | | $7.94 | | | $0.12 | | | $1.56 | | | $1.68 | | | $(0.16) | | | $(0.11) | | | $(0.27) | | | $9.35 | | | 21.75% | | | $113 | | | 1.22% | | | 1.17% | | | 1.36% |
9/30/23g | | | 8.27 | | | 0.12 | | | (0.45)aa | | | (0.33) | | | — | | | — | | | — | | | 7.94 | | | (3.99%)b | | | 96 | | | 1.20%a | | | 1.15%a | | | 2.27%a |
| | | | | | | | | | | | | | | | | | | | | | | | | | | | | | | | | | | | | | | | |
| | | | | |
The accompanying notes are an integral part of the financial statements. | | | | |
| | | 125
| |
| | | | | |
TABLE OF CONTENTS
| | | |
| | MassMutual Funds (Continued) | |
| | | |
Financial Highlights (For a share outstanding throughout each period)
MassMutual Strategic Emerging Markets Fund
| | | | | | | | | | | | | | | | | | | |
Class I |
9/30/24 | | | $9.36 | | | $0.09 | | | $1.35 | | | $1.44 | | | $(0.01) | | | $— | | | $(0.01) | | | $10.79 | | | 15.42% | | | $103,774 | | | 1.39% | | | 1.15% | | | 0.92% |
9/30/23 | | | 8.22 | | | 0.07 | | | 1.11 | | | 1.18 | | | (0.04) | | | — | | | (0.04) | | | 9.36 | | | 14.31% | | | 98,677 | | | 1.38% | | | 1.15% | | | 0.70% |
9/30/22 | | | 14.93 | | | 0.05 | | | (4.73) | | | (4.68) | | | (0.20) | | | (1.83) | | | (2.03) | | | 8.22 | | | (35.67%) | | | 105,253 | | | 1.35% | | | 1.15% | | | 0.43% |
9/30/21 | | | 13.23 | | | 0.04 | | | 1.88 | | | 1.92 | | | — | | | (0.22) | | | (0.22) | | | 14.93 | | | 14.53% | | | 156,998 | | | 1.22% | | | 1.15% | | | 0.25% |
9/30/20 | | | 13.02 | | | 0.02 | | | 1.33 | | | 1.35 | | | (0.08) | | | (1.06) | | | (1.14) | | | 13.23 | | | 10.33% | | | 169,366 | | | 1.27% | | | 1.15% | | | 0.12% |
Class R5 |
9/30/24 | | | $9.55 | | | $0.08 | | | $1.38 | | | $1.46 | | | $(0.00)d | | | $— | | | $(0.00)d | | | $11.01 | | | 15.31% | | | $139 | | | 1.48% | | | 1.25% | | | 0.77% |
9/30/23 | | | 8.36 | | | 0.06 | | | 1.13 | | | 1.19 | | | — | | | — | | | — | | | 9.55 | | | 14.23% | | | 267 | | | 1.48% | | | 1.25% | | | 0.60% |
9/30/22 | | | 15.14 | | | 0.03 | | | (4.80) | | | (4.77) | | | (0.18) | | | (1.83) | | | (2.01) | | | 8.36 | | | (35.72%) | | | 225 | | | 1.45% | | | 1.23% | | | 0.25% |
9/30/21 | | | 13.43 | | | 0.03 | | | 1.90 | | | 1.93 | | | — | | | (0.22) | | | (0.22) | | | 15.14 | | | 14.38% | | | 2,703 | | | 1.32% | | | 1.25% | | | 0.16% |
9/30/20 | | | 13.20 | | | 0.00d | | | 1.35 | | | 1.35 | | | (0.06) | | | (1.06) | | | (1.12) | | | 13.43 | | | 10.23% | | | 3,165 | | | 1.37% | | | 1.25% | | | 0.02% |
Service Class |
9/30/24 | | | $9.36 | | | $0.07 | | | $1.35 | | | $1.42 | | | $— | | | $— | | | $— | | | $10.78 | | | 15.17% | | | $1,719 | | | 1.59% | | | 1.35% | | | 0.72% |
9/30/23 | | | 8.22 | | | 0.05 | | | 1.10 | | | 1.15 | | | (0.01) | | | — | | | (0.01) | | | 9.36 | | | 14.04% | | | 1,364 | | | 1.58% | | | 1.35% | | | 0.49% |
9/30/22 | | | 14.93 | | | 0.02 | | | (4.73) | | | (4.71) | | | (0.17) | | | (1.83) | | | (2.00) | | | 8.22 | | | (35.83%) | | | 1,346 | | | 1.55% | | | 1.35% | | | 0.22% |
9/30/21 | | | 13.25 | | | 0.01 | | | 1.89 | | | 1.90 | | | — | | | (0.22) | | | (0.22) | | | 14.93 | | | 14.35% | | | 2,216 | | | 1.42% | | | 1.35% | | | 0.05% |
9/30/20 | | | 13.05 | | | (0.01) | | | 1.33 | | | 1.32 | | | (0.06) | | | (1.06) | | | (1.12) | | | 13.25 | | | 10.12% | | | 2,473 | | | 1.47% | | | 1.35% | | | (0.05%) |
| | | | | | | | | | | | | | | | | | | | | | | | | | | | | | | | | | | | | | | | |
| | | | |
Portfolio turnover rate | | | 62% | | | 38% | | | 55% | | | 48% | | | 71% |
| | | | | | | | | | | | | | | | |
c
| Per share amount calculated on the average shares method. |
d
| Amount is less than $0.005 per share. |
j
| Computed after giving effect to an agreement by MML Advisers to waive certain fees and expenses of the Fund. |
l
| Employee retirement benefit plans that invest plan assets in the Separate Investment Accounts (SIAs) may be subject to certain charges as set forth in their respective Plan Documents. Total return figures would be lower for the periods presented if they reflected these charges. |
m
| Total return excludes sales charges, if any, and would be lower for the period presented if it reflected these charges. |
q
| Excludes fees and expenses incurred indirectly as a result of investments in underlying funds, as applicable. |
z
| The net asset values and total returns have been calculated on net assets which include adjustments made in accordance with U.S. generally accepted accounting principles required at period end for financial reporting purposes. |
bb
| The amount shown for a share outstanding does not correspond with the aggregate net investment income (loss) as shown on the Statement of Operations for the period due to the timing of class-specific expenses. See Note 3 for each fund’s expense structure. |
| | | | | |
| | | The accompanying notes are an integral part of the financial statements.
| |
126
| | | | |
| | | | | |
TABLE OF CONTENTS
| | | | | | | | | | | | | | | | | | | |
Administrative Class |
9/30/24 | | | $9.39 | | | $0.06 | | | $1.35 | | | $1.41 | | | $— | | | $— | | | $— | | | $10.80 | | | 15.02% | | | $238 | | | 1.69% | | | 1.45% | | | 0.64% |
9/30/23 | | | 8.24 | | | 0.04 | | | 1.11 | | | 1.15 | | | (0.00)d | | | — | | | (0.00)d | | | 9.39 | | | 13.99% | | | 287 | | | 1.68% | | | 1.45% | | | 0.41% |
9/30/22 | | | 14.96 | | | (0.01)bb | | | (4.72) | | | (4.73) | | | (0.16) | | | (1.83) | | | (1.99) | | | 8.24 | | | (35.90%) | | | 233 | | | 1.65% | | | 1.45% | | | (0.06%) |
9/30/21 | | | 13.29 | | | (0.01) | | | 1.90 | | | 1.89 | | | — | | | (0.22) | | | (0.22) | | | 14.96 | | | 14.23% | | | 1,017 | | | 1.52% | | | 1.45% | | | (0.03%) |
9/30/20 | | | 13.08 | | | (0.02) | | | 1.33 | | | 1.31 | | | (0.04) | | | (1.06) | | | (1.10) | | | 13.29 | | | 9.96% | | | 989 | | | 1.57% | | | 1.45% | | | (0.16%) |
Class R4 | | | | | | | | | | | | | | | | | | | | | | | | | | | | | | | | | | | | | | | |
9/30/24 | | | $9.26 | | | $0.05 | | | $1.32 | | | $1.37 | | | $— | | | $— | | | $— | | | $10.63 | | | 14.79% | | | $453 | | | 1.84% | | | 1.60% | | | 0.48% |
9/30/23 | | | 8.13 | | | 0.02 | | | 1.11 | | | 1.13 | | | — | | | — | | | — | | | 9.26 | | | 13.90% | | | 379 | | | 1.83% | | | 1.60% | | | 0.25% |
9/30/22 | | | 14.71 | | | (0.00)d,bb | | | (4.69) | | | (4.69) | | | (0.06) | | | (1.83) | | | (1.89) | | | 8.13 | | | (35.99%) | | | 307 | | | 1.80% | | | 1.60% | | | (0.02%) |
9/30/21 | | | 13.10 | | | (0.05) | | | 1.88 | | | 1.83 | | | — | | | (0.22) | | | (0.22) | | | 14.71 | | | 13.98% | | | 443 | | | 1.67% | | | 1.60% | | | (0.32%) |
9/30/20 | | | 12.90 | | | (0.04) | | | 1.32 | | | 1.28 | | | (0.02) | | | (1.06) | | | (1.08) | | | 13.10 | | | 9.84% | | | 1,237 | | | 1.72% | | | 1.60% | | | (0.30%) |
Class A |
9/30/24 | | | $9.33 | | | $0.02 | | | $1.39 | | | $1.41 | | | $— | | | $— | | | $— | | | $10.74 | | | 15.11% | | | $68 | | | 1.90% | | | 1.67% | | | 0.21% |
9/30/23 | | | 8.21 | | | 0.01 | | | 1.11 | | | 1.12 | | | — | | | — | | | — | | | 9.33 | | | 13.64% | | | 153 | | | 1.93% | | | 1.70% | | | 0.15% |
9/30/22 | | | 14.77 | | | (0.02)bb | | | (4.71) | | | (4.73) | | | — | | | (1.83) | | | (1.83) | | | 8.21 | | | (35.99%) | | | 140 | | | 1.90% | | | 1.68% | | | (0.15%) |
9/30/21 | | | 13.17 | | | (0.06) | | | 1.88 | | | 1.82 | | | — | | | (0.22) | | | (0.22) | | | 14.77 | | | 13.83% | | | 635 | | | 1.77% | | | 1.70% | | | (0.36%) |
9/30/20 | | | 12.98 | | | (0.05) | | | 1.32 | | | 1.27 | | | (0.02) | | | (1.06) | | | (1.08) | | | 13.17 | | | 9.75% | | | 2,029 | | | 1.82% | | | 1.70% | | | (0.42%) |
Class R3 |
9/30/24 | | | $9.11 | | | $0.02 | | | $1.31 | | | $1.33 | | | $— | | | $— | | | $— | | | $10.44 | | | 14.60% | | | $497 | | | 2.09% | | | 1.85% | | | 0.23% |
9/30/23 | | | 8.03 | | | 0.00d | | | 1.08 | | | 1.08 | | | — | | | — | | | — | | | 9.11 | | | 13.45% | | | 493 | | | 2.08% | | | 1.85% | | | 0.01% |
9/30/22 | | | 14.62 | | | (0.03)bb | | | (4.64) | | | (4.67) | | | (0.09) | | | (1.83) | | | (1.92) | | | 8.03 | | | (36.15%) | | | 546 | | | 2.05% | | | 1.85% | | | (0.29%) |
9/30/21 | | | 13.05 | | | (0.06) | | | 1.85 | | | 1.79 | | | — | | | (0.22) | | | (0.22) | | | 14.62 | | | 13.72% | | | 1,120 | | | 1.92% | | | 1.85% | | | (0.42%) |
9/30/20 | | | 12.87 | | | (0.07) | | | 1.31 | | | 1.24 | | | (0.00)d | | | (1.06) | | | (1.06) | | | 13.05 | | | 9.57% | | | 992 | | | 1.97% | | | 1.85% | | | (0.58%) |
| | | | | | | | | | | | | | | | | | | | | | | | | | | | | | | | | | | | | | | | |
| | | | | |
The accompanying notes are an integral part of the financial statements. | | | | |
| | | 127
| |
| | | | | |
TABLE OF CONTENTS
| | | |
| | Notes to Financial Statements | |
| | | |
MassMutual Premier Funds (the “Trust”) is registered under the Investment Company Act of 1940, as amended (the “1940 Act”), as an open-end management investment company. The Trust is organized under the laws of the Commonwealth of Massachusetts as a Massachusetts business trust pursuant to an Agreement and Declaration of Trust dated August 1, 1994, as amended and restated as of November 21, 2011, as it may be further amended from time to time. The Trust consists of the following series (each individually referred to as a “Fund” or collectively as the “Funds”):
MassMutual U.S. Government Money Market Fund (“U.S. Government Money Market Fund”)
MassMutual Short-Duration Bond Fund (“Short-Duration Bond Fund”)
MassMutual Inflation-Protected and Income Fund (“Inflation-Protected and Income Fund”)
MassMutual Core Bond Fund (“Core Bond Fund”)
MassMutual Diversified Bond Fund (“Diversified Bond Fund”)
MassMutual High Yield Fund (“High Yield Fund”)
MassMutual Balanced Fund (“Balanced Fund”)
MassMutual Disciplined Value Fund (“Disciplined Value Fund”)
MassMutual Disciplined Growth Fund (“Disciplined Growth Fund”)
MassMutual Small Cap Opportunities Fund (“Small Cap Opportunities Fund”)
MassMutual Global Fund (“Global Fund”)
MassMutual International Equity Fund (“International Equity Fund”)
MassMutual Strategic Emerging Markets Fund (“Strategic Emerging Markets Fund”)
Each share class of a Fund represents an interest in the same portfolio of assets. The principal difference among the classes is the level of service and administration fees, and shareholder and distribution service expenses borne by the classes. Because each class will have different fees and expenses, performance and share prices will vary between the classes. The classes of shares are offered to different types of investors, as outlined in the Funds’ Prospectuses.
2.
| Significant Accounting Policies |
The following is a summary of significant accounting policies followed consistently by each Fund in the preparation of the financial statements in conformity with accounting principles generally accepted in the United States of America (“generally accepted accounting principles”). The preparation of the financial statements in accordance with generally accepted accounting principles requires management to make estimates and assumptions that affect the reported amounts and disclosures in the financial statements. Actual results could differ from those estimates.
Each Fund is an investment company and accordingly follows the investment company accounting and reporting guidance of the Financial Accounting Standards Board Accounting Standards Codification Topic 946, Financial Services – Investment Companies.
Investment Valuation
The net asset value of each Fund’s shares is determined once daily as of the close of regular trading on the New York Stock Exchange (“NYSE”), on each day the NYSE is open for trading (a “business day”). The NYSE normally closes at 4:00 p.m. Eastern Time, but may close earlier on some days. If the NYSE is scheduled to close early, the business day will be considered to end as of the time of the NYSE’s scheduled close. A Fund will not treat an intraday disruption in NYSE trading or other event that causes an unscheduled closing of the NYSE as a close of business of the NYSE for these purposes; instead, MML Investment Advisers, LLC (“MML Advisers”) will determine the fair value of a Fund’s securities in accordance with MML Advisers’ fair valuation policy and procedures. On holidays and other days when the NYSE is closed, each Fund’s net asset value generally is not calculated and the Funds do not anticipate accepting buy or sell orders. However, the value of each Fund’s assets may still be affected on such days to the extent that a Fund holds foreign securities that trade on days that foreign securities markets are open.
Equity securities and derivative contracts that are actively traded on a national securities exchange or contract market are valued on the basis of information furnished by a pricing service, which provides the last reported sale price, or, in the case of futures contracts, the settlement price, for securities or derivatives listed on the exchange or contract market or the official closing price on the NASDAQ National Market System (“NASDAQ System”), or in the case of over-the-counter (“OTC”) securities for which an official closing price is unavailable or not reported on the NASDAQ System, the last reported bid price. Portfolio securities
TABLE OF CONTENTS
| | Notes to Financial Statements (Continued) | |
traded on more than one national securities exchange are valued at the last price at the close of the exchange representing the principal market for such securities. Debt securities (with the exception of debt securities held by the U.S. Government Money Market Fund) are valued on the basis of valuations furnished by a pricing service, which generally determines valuations taking into account factors such as institutional-size trading in similar securities, yield, quality, coupon rate, maturity, type of issue, trading characteristics, and other market data. Shares of other open-end mutual funds are valued at their closing net asset values as reported on each business day. The U.S. Government Money Market Fund’s debt securities are typically valued at amortized cost, but may be valued using a vendor quote if MML Advisers determines it more closely approximates current market value, in accordance with Rule 2a-7 under the 1940 Act pursuant to which the U.S. Government Money Market Fund must adhere to certain conditions. It is the intention of the U.S. Government Money Market Fund to maintain a stable net asset value per share of $1.00, although this cannot be assured.
Investments for which market quotations are readily available are marked to market daily based on those quotations. Market quotations may be provided by third-party vendors or market makers, and may be determined on the basis of a variety of factors, such as broker quotations, financial modeling, and other market data, such as market indexes and yield curves, counterparty information, and foreign exchange rates. U.S. Government and agency securities may be valued on the basis of market quotations or using a model that may incorporate market observable data such as reported sales of similar securities, broker quotes, yields, bids, offers, quoted market prices, and reference data. The fair values of OTC derivative contracts, including forward, swap, and option contracts related to interest rates, foreign currencies, credit standing of reference entities, equity prices, or commodity prices, may be based on market quotations or may be modeled using a series of techniques, including simulation models, depending on the contract and the terms of the transaction. The fair values of asset-backed securities and mortgage-backed securities are estimated based on models that consider the estimated cash flows of each debt tranche of the issuer, established benchmark yield, and estimated tranche-specific spread to the benchmark yield based on the unique attributes of the tranche, including, but not limited to, prepayment speed assumptions and attributes of the collateral.
The Board of Trustees (“Trustees”) have designated MML Advisers as the Funds’ “valuation designee,” responsible for determining the fair value, in good faith, of securities and other instruments held by the Funds for which market quotations are not readily available or for which such market quotations or values are considered by MML Advisers or a subadviser to be unreliable (including, for example, certain foreign securities, thinly-traded securities, certain restricted securities, certain initial public offerings, or securities whose values may have been affected by a significant event). It is possible that a significant amount of a Fund’s assets will be subject to fair valuation in accordance with MML Advisers’ fair valuation policy and procedures. The fair value determined for an investment by MML Advisers may differ from recent market prices for the investment and may be significantly different from the value realized upon the sale of such investment.
The Funds may invest in securities that are traded principally in foreign markets and that trade on weekends and other days when the Funds do not price their shares. As a result, the values of the Funds’ portfolio securities may change on days when the prices of the Funds’ shares are not calculated. The prices of the Funds’ shares will reflect any such changes when the prices of the Funds’ shares are next calculated, which is the next business day. The Funds may use fair value pricing more frequently for securities primarily traded in foreign markets because, among other things, most foreign markets close well before the Funds value their securities. The earlier close of these foreign markets gives rise to the possibility that significant events, including broad market moves, may have occurred in the interim. The Funds’ investments may be priced based on fair values provided by a third-party vendor, based on certain factors and methodologies applied by such vendor, in the event that there is movement in the U.S. market, between the close of the foreign market and the time the Funds calculate their net asset values. All assets and liabilities expressed in foreign currencies are converted into U.S. dollars at the mean between the buying and selling rates of such currencies against the U.S. dollar at the end of each business day.
Investments in equity or debt issued by privately held companies or funds (“Private Company” or collectively, the “Private Companies”) and any other investments fair valued using significant unobservable inputs may be fair valued using alternate valuation approaches including, but not limited to, the following:
Market approach: considers factors including the price of recent investments in the same or similar security or financial metrics of comparable securities.
Income approach: considers factors including expected future cash flows, security specific risks, and corresponding discount rates.
Cost approach: considers factors including the value of the security’s underlying assets and liabilities.
TABLE OF CONTENTS
| | Notes to Financial Statements (Continued) | |
Investments in series of preferred stock issued by Private Companies are typically valued utilizing the Market approach in determining the enterprise value of the company. Such investments often contain rights and preferences that differ from other series of preferred and common stock of the same issuer. Valuation techniques such as the current value method (“CVM”), an option pricing model (“OPM”), a probability weighted expected return model (“PWERM”), or a hybrid of those techniques are used in allocating enterprise value of the company, as deemed appropriate under the circumstances. The CVM allocates value among the various parts of a company’s capital structure assuming that the value of convertible preferred stock is represented by the most favorable claim the preferred stockholders have on the enterprise value as of the valuation date. The use of OPM and PWERM techniques involve a determination of the exit scenarios of the investment in order to appropriately allocate the enterprise value of the company among the various parts of its capital structure.
The Private Companies are not subject to the public company disclosure, timing, and reporting standards as other investments held by a Fund. Typically, the most recently available information for a Private Company is as of a date that is earlier than the date a Fund is calculating its net asset value. This factor may result in a difference between the value of the investment and the price a Fund could receive upon the sale of the investment.
Fair value is defined as the price that would be received to sell an asset or paid to transfer a liability in an orderly transaction between market participants at the measurement date. A three-tier hierarchy is utilized to maximize the use of observable market data inputs and minimize the use of unobservable inputs and to establish classification of fair value measurements for disclosure purposes. Inputs refer broadly to the assumptions that market participants would use in pricing the asset or liability, including assumptions about risk, for example, the risk inherent in a particular valuation technique used to measure fair value (such as a pricing model) and/or the risk inherent in the inputs to the valuation technique. Inputs may be observable or unobservable. Observable inputs are inputs that reflect the assumptions market participants would use in pricing the asset or liability and are developed based on market data obtained from sources independent of the reporting entity. Unobservable inputs are inputs that reflect the reporting entity’s own assumptions about the assumptions market participants would use in pricing the asset or liability and are developed based on the best information available in the circumstances. The three-tier hierarchy of inputs is summarized in the three broad Levels listed below. The inputs or methodology used for valuing investments are not necessarily an indication of the risk associated with investing in those investments and the determination of the significance of a particular input to the fair value measurement in its entirety requires judgment and consideration of factors specific to each security.
Level 1 – quoted prices (unadjusted) in active markets for identical investments that the Funds can access at the measurement date
Level 2 – other significant observable inputs (including fair value factors, quoted prices for similar investments, interest rates, prepayment speeds, credit risk, etc.)
Level 3 – significant unobservable inputs, to the extent observable inputs are not available (including the Funds’ own assumptions in determining the fair value of investments)
The availability of observable inputs can vary from security to security and is affected by a wide variety of factors, including, for example, the type of security, whether the security is new and not yet established in the marketplace, the liquidity of markets, and other characteristics particular to the security. To the extent that valuation is based on models or inputs that are less observable or unobservable in the market, the determination of fair value requires more judgment. Accordingly, the degree of judgment exercised in determining fair value is greatest for instruments categorized in Level 3.
Changes in valuation techniques may result in transfers in or out of an investment’s assigned Level within the hierarchy. In addition, in periods of market dislocation, the observability of prices and inputs may be reduced for many instruments. This condition, as well as changes related to liquidity of investments, could cause a security to be reclassified between Levels.
In certain cases, the inputs used to measure fair value may fall into different Levels of the fair value hierarchy. In such cases, for disclosure purposes, the Level in the fair value hierarchy within which the fair value measurement falls is determined based on the lowest Level input that is significant to the overall fair value measurement.
The Disciplined Value Fund characterized all investments at Level 1, as of September 30, 2024. The Disciplined Growth Fund characterized all long-term investments at Level 1, and all short-term investments at Level 2, as of September 30, 2024. The U.S. Government Money Market Fund characterized all investments at Level 2, as of September 30, 2024. For each Fund noted in the preceding sentences, the level classification by major category of investments is the same as the category presentation in the Portfolio of Investments.
TABLE OF CONTENTS
| | Notes to Financial Statements (Continued) | |
The following is the aggregate value by input level, as of September 30, 2024, for the remaining Funds’ investments:
| | | | | | | | | | | | | |
Short-Duration Bond Fund
| | | | | | | | | | | | |
Asset Investments
| | | | | | | | | | | | |
Corporate Debt | | | $— | | | $71,310,835 | | | $ — | | | $71,310,835 |
Non-U.S. Government Agency Obligations | | | — | | | 61,143,947 | | | — | | | 61,143,947 |
U.S. Government Agency Obligations and Instrumentalities | | | — | | | 39,656 | | | — | | | 39,656 |
Short-Term Investments | | | 821,925 | | | 23,184,999 | | | — | | | 24,006,924 |
Total Investments | | | $821,925 | | | $155,679,437 | | | $— | | | $156,501,362 |
Asset Derivatives | | | | | | | | | | | | |
Futures Contracts | | | $190,833 | | | $— | | | $— | | | $190,833 |
Liability Derivatives | | | | | | | | | | | | |
Futures Contracts | | | $(19,640) | | | $— | | | $— | | | $(19,640) |
Inflation-Protected and Income Fund | | | | | | | | | | | | |
Asset Investments | | | | | | | | | | | | |
Non-U.S. Government Agency Obligations | | | $— | | | $140,744,435 | | | $— | | | $140,744,435 |
U.S. Government Agency Obligations and Instrumentalities | | | — | | | 16,515,928 | | | — | | | 16,515,928 |
U.S. Treasury Obligations | | | — | | | 48,645,558 | | | — | | | 48,645,558 |
Short-Term Investments | | | — | | | 37,507,326 | | | — | | | 37,507,326 |
Total Investments | | | $— | | | $243,413,247 | | | $— | | | $243,413,247 |
Asset Derivatives | | | | | | | | | | | | |
Futures Contracts | | | $40,794 | | | $— | | | $— | | | $40,794 |
Swap Agreements | | | — | | | 7,701,416 | | | — | | | 7,701,416 |
Total | | | $40,794 | | | $7,701,416 | | | $— | | | $7,742,210 |
Liability Derivatives | | | | | | | | | | | | |
Futures Contracts | | | $(137,716) | | | $— | | | $— | | | $(137,716) |
Swap Agreements | | | — | | | (1,980) | | | — | | | (1,980) |
Total | | | $(137,716) | | | $(1,980) | | | $— | | | $(139,696) |
Core Bond Fund | | | | | | | | | | | | |
Asset Investments | | | | | | | | | | | | |
Corporate Debt | | | $— | | | $391,960,298 | | | $— | | | $391,960,298 |
Non-U.S. Government Agency Obligations | | | — | | | 212,504,613 | | | — | | | 212,504,613 |
Sovereign Debt Obligations | | | — | | | 1,503,794 | | | — | | | 1,503,794 |
U.S. Government Agency Obligations and Instrumentalities | | | — | | | 318,909,202 | | | — | | | 318,909,202 |
U.S. Treasury Obligations | | | — | | | 105,629,127 | | | — | | | 105,629,127 |
Short-Term Investments | | | 13,631,015 | | | 177,749,769 | | | — | | | 191,380,784 |
Total Investments | | | $ 13,631,015 | | | $ 1,208,256,803 | | | $— | | | $1,221,887,818 |
Asset Derivatives | | | | | | | | | | | | |
Futures Contracts | | | $34,116 | | | $— | | | $— | | | $34,116 |
Liability Derivatives | | | | | | | | | | | | |
Futures Contracts | | | $(363,250) | | | $— | | | $— | | | $(363,250) |
| | | | | | | | | | | | | |
TABLE OF CONTENTS
| | Notes to Financial Statements (Continued) | |
| | | | | | | | | | | | | |
Diversified Bond Fund | | | | | | | | | | | | |
Asset Investments | | | | | | | | | | | | |
Corporate Debt | | | $— | | | $56,842,447 | | | $— | | | $56,842,447 |
Non-U.S. Government Agency Obligations | | | — | | | 33,834,839 | | | — | | | 33,834,839 |
Sovereign Debt Obligations | | | — | | | 147,166 | | | — | | | 147,166 |
U.S. Government Agency Obligations and Instrumentalities | | | — | | | 31,512,575 | | | — | | | 31,512,575 |
U.S. Treasury Obligations | | | — | | | 5,046,734 | | | — | | | 5,046,734 |
Purchased Options | | | — | | | 15,700 | | | — | | | 15,700 |
Warrants | | | — | | | — | | | 4,003 | | | 4,003 |
Short-Term Investments | | | 4,223,208 | | | 18,979,795 | | | — | | | 23,203,003 |
Total Investments | | | $4,223,208 | | | $146,379,256 | | | $4,003 | | | $ 150,606,467 |
Asset Derivatives | | | | | | | | | | | | |
Forward Contract | | | $— | | | $78,909 | | | $— | | | $78,909 |
Futures Contracts | | | 14,188 | | | — | | | — | | | 14,188 |
Total | | | $14,188 | | | $78,909 | | | $— | | | $93,097 |
Liability Derivatives | | | | | | | | | | | | |
Forward Contracts | | | $— | | | $(58,431) | | | $— | | | $(58,431) |
Futures Contracts | | | (81,877) | | | — | | | — | | | (81,877) |
Written Options | | | — | | | (12,588) | | | — | | | (12,588) |
Total | | | $(81,877) | | | $(71,019) | | | $— | | | $(152,896) |
High Yield Fund | | | | | | | | | | | | |
Asset Investments | | | | | | | | | | | | |
Bank Loans | | | $— | | | $40,368,437 | | | $ — | | | $40,368,437 |
Corporate Debt | | | — | | | 329,673,170 | | | — | | | 329,673,170 |
Short-Term Investments | | | 32,897,900 | | | 36,101,054 | | | — | | | 68,998,954 |
Total Investments | | | $ 32,897,900 | | | $ 406,142,661 | | | $— | | | $439,040,561 |
Balanced Fund | | | | | | | | | | | | |
Asset Investments | | | | | | | | | | | | |
Common Stock | | | $69,520,166 | | | $— | | | $— | | | $69,520,166 |
Corporate Debt | | | — | | | 11,756,053 | | | — | | | 11,756,053 |
Non-U.S. Government Agency Obligations | | | — | | | 3,749,402 | | | — | | | 3,749,402 |
U.S. Government Agency Obligations and Instrumentalities | | | — | | | 10,615,703 | | | — | | | 10,615,703 |
U.S. Treasury Obligations | | | — | | | 12,393,734 | | | — | | | 12,393,734 |
Short-Term Investments | | | — | | | 2,302,421 | | | — | | | 2,302,421 |
Total Investments | | | $69,520,166 | | | $40,817,313 | | | $— | | | $110,337,479 |
Asset Derivatives | | | | | | | | | | | | |
Futures Contracts | | | $2,123 | | | $— | | | $— | | | $2,123 |
Liability Derivatives | | | | | | | | | | | | |
Futures Contracts | | | $(519) | | | $— | | | $— | | | $(519) |
Small Cap Opportunities Fund | | | | | | | | | | | | |
Asset Investments | | | | | | | | | | | | |
Common Stock | | | $428,244,382 | | | $— | | | $— | | | $428,244,382 |
Short-Term Investments | | | 1,962,671 | | | 6,203,516 | | | — | | | 8,166,187 |
Total Investments | | | $430,207,053 | | | $6,203,516 | | | $— | | | $436,410,569 |
| | | | | | | | | | | | | |
TABLE OF CONTENTS
| | Notes to Financial Statements (Continued) | |
| | | | | | | | | | | | | |
Global Fund | | | | | | | | | | | | |
Asset Investments | | | | | | | | | | | | |
Common Stock* | | | | | | | | | | | | |
Canada | | | $ 1,143,328 | | | $— | | | $— | | | $1,143,328 |
China | | | 5,121,160 | | | 1,282,237 | | | — | | | 6,403,397 |
Denmark | | | — | | | 7,378,256 | | | — | | | 7,378,256 |
France | | | — | | | 13,457,733 | | | — | | | 13,457,733 |
Germany | | | — | | | 7,824,943 | | | — | | | 7,824,943 |
India | | | 2,959,090 | | | 10,594,760 | | | — | | | 13,553,850 |
Israel | | | 1,785,328 | | | — | | | — | | | 1,785,328 |
Italy | | | — | | | 2,397,247 | | | — | | | 2,397,247 |
Japan | | | — | | | 9,085,283 | | | — | | | 9,085,283 |
Netherlands | | | — | | | 3,451,216 | | | — | | | 3,451,216 |
Spain | | | — | | | 2,450,373 | | | — | | | 2,450,373 |
Sweden | | | — | | | 9,782,877 | | | — | | | 9,782,877 |
Switzerland | | | — | | | 1,615,076 | | | — | | | 1,615,076 |
United States | | | 109,017,387 | | | — | | | — | | | 109,017,387 |
Short-Term Investments | | | 2,842,364 | | | 461,474 | | | — | | | 3,303,838 |
Total Investments | | | $122,868,657 | | | $69,781,475 | | | $— | | | $192,650,132 |
International Equity Fund | | | | | | | | | | | | |
Asset Investments | | | | | | | | | | | | |
Common Stock* | | | | | | | | | | | | |
Australia | | | $— | | | $1,381,904 | | | $— | | | $1,381,904 |
Belgium | | | 198,812 | | | 885,613 | | | — | | | 1,084,425 |
Brazil | | | — | | | 74,541 | | | — | | | 74,541 |
Canada | | | 6,190,345 | | | — | | | — | | | 6,190,345 |
China | | | — | | | 268,144 | | | — | | | 268,144 |
Denmark | | | — | | | 107,166 | | | — | | | 107,166 |
Finland | | | — | | | 2,688,375 | | | — | | | 2,688,375 |
France | | | — | | | 10,493,467 | | | — | | | 10,493,467 |
Germany | | | — | | | 9,739,443 | | | — | | | 9,739,443 |
Hong Kong | | | — | | | 3,719,336 | | | — | | | 3,719,336 |
Ireland | | | 367,608 | | | 280,315 | | | — | | | 647,923 |
Israel | | | 306,568 | | | — | | | — | | | 306,568 |
Italy | | | 20,331 | | | 94,514 | | | — | | | 114,845 |
Japan | | | — | | | 18,509,590 | | | — | | | 18,509,590 |
Luxembourg | | | — | | | 443,368 | | | — | | | 443,368 |
Netherlands | | | — | | | 3,897,625 | | | — | | | 3,897,625 |
Norway | | | — | | | 517,008 | | | — | | | 517,008 |
Republic of Korea | | | — | | | 327,028 | | | — | | | 327,028 |
Singapore | | | — | | | 404,211 | | | — | | | 404,211 |
Spain | | | — | | | 4,681,863 | | | — | | | 4,681,863 |
Sweden | | | — | | | 3,242,748 | | | — | | | 3,242,748 |
Switzerland | | | — | | | 8,648,282 | | | — | | | 8,648,282 |
United Kingdom | | | — | | | 20,769,232 | | | — | | | 20,769,232 |
United States | | | 3,435,249 | | | 14,310,870 | | | — | | | 17,746,119 |
Preferred Stock* | | | | | | | | | | | | |
Germany | | | — | | | 156,824 | | | — | | | 156,824 |
Short-Term Investments | | | 1,924,845 | | | 3,619,121 | | | — | | | 5,543,966 |
Total Investments | | | $12,443,758 | | | $ 109,260,588 | | | $— | | | $ 121,704,346 |
| | | | | | | | | | | | | |
TABLE OF CONTENTS
| | Notes to Financial Statements (Continued) | |
| | | | | | | | | | | | | |
Strategic Emerging Markets Fund | | | | | | | | | | | | |
Asset Investments | | | | | | | | | | | | |
Common Stock* | | | | | | | | | | | | |
Brazil | | | $ 5,000,796 | | | $ — | | | $ — | | | $ 5,000,796 |
Chile | | | 607,549 | | | 575,293 | | | — | | | 1,182,842 |
China | | | 12,105,382 | | | 10,437,651 | | | 65,936 | | | 22,608,969 |
France | | | — | | | 4,052,292 | | | — | | | 4,052,292 |
Hong Kong | | | — | | | 1,230,918 | | | — | | | 1,230,918 |
India | | | — | | | 17,673,829 | | | — | | | 17,673,829 |
Indonesia | | | — | | | 1,558,872 | | | — | | | 1,558,872 |
Italy | | | 273,601 | | | 3,013,787 | | | — | | | 3,287,388 |
Japan | | | — | | | 2,199,620 | | | — | | | 2,199,620 |
Mexico | | | 9,103,445 | | | — | | | — | | | 9,103,445 |
Netherlands | | | 1,024,531 | | | — | | | — | | | 1,024,531 |
Peru | | | 1,144,635 | | | — | | | — | | | 1,144,635 |
Philippines | | | — | | | 2,019,696 | | | — | | | 2,019,696 |
Poland | | | — | | | 823,542 | | | — | | | 823,542 |
Portugal | | | — | | | 2,248,900 | | | — | | | 2,248,900 |
Republic of Korea | | | 41,521 | | | 7,441,569 | | | — | | | 7,483,090 |
Russia | | | — | | | — | | | —+ | | | — |
South Africa | | | — | | | 1,252,119 | | | — | | | 1,252,119 |
Switzerland | | | — | | | 544,276 | | | — | | | 544,276 |
Taiwan | | | — | | | 15,434,206 | | | — | | | 15,434,206 |
Turkey | | | — | | | 992,058 | | | — | | | 992,058 |
United Arab Emirates | | | — | | | 292,061 | | | — | | | 292,061 |
United Kingdom | | | — | | | 1,447,367 | | | — | | | 1,447,367 |
United States | | | 536,664 | | | — | | | — | | | 536,664 |
Preferred Stock | | | | | | | | | | | | |
Brazil | | | 903,343 | | | — | | | — | | | 903,343 |
Short-Term Investments | | | 471,549 | | | 1,914,863 | | | — | | | 2,386,412 |
Total Investments | | | $31,213,016 | | | $75,152,919 | | | $65,936 | | | $106,431,871 |
| | | | | | | | | | | | | |
*
| Includes foreign equity securities whose values were adjusted to reflect market trading of comparable securities or other correlated instruments after the close of trading in their respective foreign markets, as applicable. |
+
| Represents a security at $0 value as of September 30, 2024. |
For certain Funds the Statement of Assets and Liabilities shows receivables from investments sold on a delayed delivery basis, as well as any applicable liabilities for investments purchased on a delayed delivery basis and amounts due to custodian. These amounts approximate fair value and would be categorized at Level 2 for each applicable Fund as of September 30, 2024.
The Funds, with the exception of the Strategic Emerging Markets Fund, had no Level 3 transfers during the year ended September 30, 2024. The Strategic Emerging Markets Fund had Level 3 transfers during the year ended September 30, 2024; however, none of the transfers individually or collectively had a material impact on the Strategic Emerging Markets Fund.
Derivative Instruments
Derivatives are financial instruments whose values are based on the values of one or more underlying indicators, such as a security, asset, currency, interest rate, or index. Derivative transactions can create investment leverage and may be highly volatile. Losses from derivatives can be substantially greater than the derivatives’ original cost and can sometimes be unlimited. A Fund may not be able to close out a derivative transaction at a favorable time or price.
TABLE OF CONTENTS
| | Notes to Financial Statements (Continued) | |
At September 30, 2024, and during the year then ended, the Fund(s) had the following derivatives and transactions in derivatives, grouped into the indicated risk categories:
| | | | | | | | | | | | | |
Short-Duration Bond Fund | | | | | | | | | | | | |
Asset Derivatives | | | | | | | | | | | | |
Futures Contracts^^ | | | $— | | | $ — | | | $190,833 | | | $190,833 |
Liability Derivatives | | | | | | | | | | | | |
Futures Contracts^^ | | | $— | | | $— | | | $(19,640) | | | $(19,640) |
Realized Gain (Loss)# | | | | | | | | | | | | |
Futures Contracts | | | $— | | | $— | | | $(619,798) | | | $(619,798) |
Swap Agreements | | | (281,746) | | | — | | | (260,309) | | | (542,055) |
Total Realized Gain (Loss) | | | $ (281,746) | | | $— | | | $(880,107) | | | $(1,161,853) |
Change in Appreciation (Depreciation)## | | | | | | | | | | | | |
Futures Contracts | | | $— | | | $— | | | $(34,615) | | | $(34,615) |
Swap Agreements | | | (54,163) | | | — | | | 70,476 | | | 16,313 |
Total Change in Appreciation (Depreciation) | | | $(54,163) | | | $— | | | $35,861 | | | $(18,302) |
Inflation-Protected and Income Fund | | | | | | | | | | | | |
Asset Derivatives | | | | | | | | | | | | |
Futures Contracts^^ | | | $— | | | $— | | | $40,794 | | | $40,794 |
Swap Agreements* | | | — | | | — | | | 7,694,697 | | | 7,694,697 |
Swap Agreements^^,^^^ | | | — | | | — | | | 6,719 | | | 6,719 |
Total Value | | | $— | | | $— | | | $7,742,210 | | | $7,742,210 |
Liability Derivatives | | | | | | | | | | | | |
Futures Contracts^^ | | | $— | | | $— | | | $(137,716) | | | $(137,716) |
Swap Agreements^^,^^^ | | | — | | | — | | | (1,980) | | | (1,980) |
Total Value | | | $— | | | $— | | | $(139,696) | | | $(139,696) |
Realized Gain (Loss)# | | | | | | | | | | | | |
Futures Contracts | | | $— | | | $— | | | $(492,648) | | | $(492,648) |
Swap Agreements | | | — | | | — | | | (5,519,040) | | | (5,519,040) |
Total Realized Gain (Loss) | | | $— | | | $— | | | $(6,011,688) | | | $(6,011,688) |
Change in Appreciation (Depreciation)## | | | | | | | | | | | | |
Futures Contracts | | | $— | | | $— | | | $(478,023) | | | $(478,023) |
Swap Agreements | | | — | | | — | | | 13,025,045 | | | 13,025,045 |
Total Change in Appreciation (Depreciation) | | | $— | | | $— | | | $12,547,022 | | | $12,547,022 |
Core Bond Fund | | | | | | | | | | | | |
Asset Derivatives | | | | | | | | | | | | |
Futures Contracts^^ | | | $— | | | $— | | | $34,116 | | | $34,116 |
Liability Derivatives | | | | | | | | | | | | |
Futures Contracts^^ | | | $— | | | $— | | | $(363,250) | | | $(363,250) |
Realized Gain (Loss)# | | | | | | | | | | | | |
Futures Contracts | | | $— | | | $— | | | $927,129 | | | $927,129 |
Swap Agreements | | | (1,434,343) | | | — | | | (1,503,063) | | | (2,937,406) |
Total Realized Gain (Loss) | | | $(1,434,343) | | | $— | | | $(575,934) | | | $(2,010,277) |
| | | | | | | | | | | | | |
TABLE OF CONTENTS
| | Notes to Financial Statements (Continued) | |
| | | | | | | | | | | | | |
Core Bond Fund (Continued) | |
Change in Appreciation (Depreciation)## | | | | | | | | | | | | |
Futures Contracts | | | $— | | | $— | | | $3,232,503 | | | $3,232,503 |
Swap Agreements | | | (275,741) | | | — | | | 465,884 | | | 190,143 |
Total Change in Appreciation (Depreciation) | | | $(275,741) | | | $— | | | $3,698,387 | | | $3,422,646 |
Diversified Bond Fund | | | | | | | | | | | | |
Asset Derivatives | | | | | | | | | | | | |
Purchased Options* | | | $— | | | $15,700 | | | $— | | | $15,700 |
Forward Contracts* | | | — | | | 78,909 | | | — | | | 78,909 |
Futures Contracts^^ | | | — | | | — | | | 14,188 | | | 14,188 |
Total Value | | | $— | | | $94,609 | | | $14,188 | | | $108,797 |
Liability Derivatives | | | | | | | | | | | | |
Forward Contracts^ | | | $— | | | $(58,431) | | | $— | | | $(58,431) |
Futures Contracts^^ | | | — | | | — | | | (81,877) | | | (81,877) |
Written Options^ | | | — | | | (12,588) | | | — | | | (12,588) |
Total Value | | | $— | | | $(71,019) | | | $(81,877) | | | $(152,896) |
Realized Gain (Loss)# | | | | | | | | | | | | |
Purchased Options | | | $— | | | $(17,321) | | | $— | | | $(17,321) |
Forward Contracts | | | — | | | (145,004) | | | — | | | (145,004) |
Futures Contracts | | | — | | | — | | | 230,289 | | | 230,289 |
Swap Agreements | | | (274,307) | | | — | | | (285,643) | | | (559,950) |
Written Options | | | — | | | 22,904 | | | — | | | 22,904 |
Total Realized Gain (Loss) | | | $(274,307) | | | $ (139,421) | | | $(55,354) | | | $(469,082) |
Change in Appreciation (Depreciation)## | | | | | | | | | | | | |
Purchased Options | | | $— | | | $11,115 | | | $— | | | $11,115 |
Forward Contracts | | | — | | | 72,154 | | | — | | | 72,154 |
Futures Contracts | | | — | | | — | | | 979,298 | | | 979,298 |
Swap Agreements | | | (59,087) | | | — | | | 44,198 | | | (14,889) |
Written Options | | | — | | | (8,935) | | | — | | | (8,935) |
Total Change in Appreciation (Depreciation) | | | $ (59,087) | | | $74,334 | | | $1,023,496 | | | $1,038,743 |
Balanced Fund | | | | | | | | | | | | |
Asset Derivatives | | | | | | | | | | | | |
Futures Contracts^^ | | | $— | | | $— | | | $2,123 | | | $2,123 |
Liability Derivatives | | | | | | | | | | | | |
Futures Contracts^^ | | | $— | | | $— | | | $(519) | | | $(519) |
Realized Gain (Loss)# | | | | | | | | | | | | |
Futures Contracts | | | $— | | | $— | | | $(45,370) | | | $(45,370) |
Change in Appreciation (Depreciation)## | | | | | | | | | | | | |
Futures Contracts | | | $— | | | $— | | | $(40,450) | | | $(40,450) |
| | | | | | | | | | | | | |
*
| Statements of Assets and Liabilities location: Investments, at value, or Receivables from: open forward contracts or open swap agreements, at value, as applicable. |
^
| Statements of Assets and Liabilities location: Payables for: open forward contracts, open swap agreements, at value, or written options outstanding, at value, as applicable. |
TABLE OF CONTENTS
| | Notes to Financial Statements (Continued) | |
^^
| Cumulative appreciation (depreciation) on futures contracts and centrally cleared swaps is reported in “Futures Contracts” and “Swap Agreements” in each applicable Fund’s Portfolio of Investments. Only current day’s variation margin, if any, is reported within the Statements of Assets and Liabilities. |
^^^
| Represents centrally cleared swaps, which are not subject to a master netting agreement or similar agreement. |
#
| Statements of Operations location: Amounts are included in net realized gain (loss) on investment transactions, forward contracts, futures contracts, swap agreements, or written options, as applicable. |
##
| Statements of Operations location: Amounts are included in net change in unrealized appreciation (depreciation) on investment transactions, forward contracts, futures contracts, swap agreements, or written options, as applicable. |
For the year ended September 30, 2024, the average balances for each derivative type were as follows:
| | | | |
Futures Contracts: | | | | | | | | | | | | | | | |
Average number of contracts - long | | | 461 | | | 7 | | | 855 | | | 228 | | | 10 |
Average number of contracts - short | | | 444 | | | 319 | | | 63 | | | 13 | | | 19 |
Forward Contracts: | | | | | | | | | | | | | | | |
Average notional amounts purchased - in USD | | | $— | | | $— | | | $— | | | $3,199,381 | | | $ — |
Average notional amounts sold - in USD | | | $— | | | $— | | | $— | | | $2,206,415 | | | $— |
Swap Agreements: | | | | | | | | | | | | | | | |
Credit Default Swaps: | | | | | | | | | | | | | | | |
Average notional amounts - buy protection | | | $22,000,000 | | | $— | | | $112,000,000 | | | $24,000,000 | | | $— |
Average notional amounts - sell protection | | | $— | | | $— | | | $— | | | $— | | | $— |
Interest Rate Swaps: | | | | | | | | | | | | | | | |
Average notional amounts | | | $43,970,000 | | | $83,458,333 | | | $244,079,000 | | | $46,408,000 | | | $— |
Total Return Swaps: | | | | | | | | | | | | | | | |
Average notional amounts | | | $— | | | $201,002,045 | | | $— | | | $— | | | $— |
Options: | | | | | | | | | | | | | | | |
Average shares/units outstanding of Purchased Options | | | — | | | — | | | — | | | 756,272 | | | — |
Average shares/units outstanding of Written Options | | | — | | | — | | | — | | | 294,795 | | | — |
| | | | | | | | | | | | | | | | |
The Portfolio of Investments included in a Fund’s financial statements shows the assets or liabilities of the Fund associated with individual derivatives transactions. The terms of many of those transactions contemplate that derivatives receivables and payables between the same two parties may be netted and that the parties will collateralize certain obligations. The following tables provide an illustration of the possible effect of netting provisions and of collateral (delivered or received) on a Fund’s derivatives exposure as of September 30, 2024. Netting arrangements vary among different counterparties, and the actual disposition of derivatives receivables and payables, and of collateral, in a bankruptcy or insolvency can be complicated and difficult to predict.
TABLE OF CONTENTS
| | Notes to Financial Statements (Continued) | |
The following table presents derivative assets by counterparty net of amounts available for offset under a master netting agreement (“MNA”) or similar agreement and net of the related collateral received by the Fund(s) as of September 30, 2024.
| | | | | | | | | | | | | |
Inflation-Protected and Income Fund | | | | | | | | | | | | |
Barclays PLC | | | $ 3,096,243 | | | $ — | | | $ (1,940,000) | | | $ 1,156,243 |
BNP Paribas SA | | | 1,489,006 | | | — | | | (990,000) | | | 499,006 |
Goldman Sachs International | | | 3,109,448 | | | — | | | (2,040,000) | | | 1,069,448 |
| | | $7,694,697 | | | $— | | | $(4,970,000) | | | $2,724,697 |
Diversified Bond Fund | | | | | | | | | | | | |
Bank of America N.A. | | | $6,731 | | | $(6,731) | | | $— | | | $— |
Goldman Sachs International | | | 32,972 | | | (18,816) | | | — | | | 14,156 |
HSBC Bank PLC | | | 34,218 | | | (11,330) | | | — | | | 22,888 |
JP Morgan Chase Bank N.A. | | | 912 | | | — | | | — | | | 912 |
Morgan Stanley & Co. LLC | | | 19,776 | | | (19,776) | | | — | | | — |
| | | $94,609 | | | $(56,653) | | | $— | | | $37,956 |
| | | | | | | | | | | | | |
The following table presents derivative liabilities by counterparty net of amounts available for offset under an MNA or similar agreement and net of the related collateral pledged by the Fund(s) as of September 30, 2024.
| | | | | | | | | | | | | |
Diversified Bond Fund | | | | | | | | | | | | |
Bank of America N.A. | | | $ (13,642) | | | $ 6,731 | | | $ — | | | $ (6,911) |
Citibank N.A. | | | (1,864) | | | — | | | — | | | (1,864) |
Goldman Sachs International | | | (18,816) | | | 18,816 | | | — | | | — |
HSBC Bank PLC | | | (11,330) | | | 11,330 | | | — | | | — |
Morgan Stanley & Co. LLC | | | (25,367) | | | 19,776 | | | — | | | (5,591) |
| | | $ (71,019) | | | $ 56,653 | | | $— | | | $(14,366) |
| | | | | | | | | | | | | |
*
| Represents the net amount receivable from the counterparty in the event of default. |
**
| Represents the net amount payable to the counterparty in the event of default. |
***
| The amount presented here may be less than the total amount of collateral received/pledged as the net amount of derivative assets and liabilities for a counterparty cannot be less than $0. |
†
| The amount presented here may be less than the total amount shown in the Statements of Assets and Liabilities as some derivatives held by the counterparty are not covered within an MNA or similar agreement. |
Such agreements typically permit a single net payment in the event of default, including the bankruptcy or insolvency of the counterparty. The Fund(s) and counterparties may not be permitted to sell, re-pledge, or use the collateral they receive. In the event that cash collateral is restricted for use, the balance will be reflected as restricted cash within the Statement of Assets and Liabilities.
Further details regarding the derivatives and other investments held by the Fund(s) during the year ended September 30, 2024, are discussed below.
TABLE OF CONTENTS
| | Notes to Financial Statements (Continued) | |
Foreign Currency Exchange Transactions
A Fund may enter into foreign currency exchange transactions for hedging purposes in order to protect against uncertainty in the level of future foreign currency exchange rates, or for other, non-hedging purposes.
A Fund may enter into foreign currency exchange transactions, including foreign currency forward contracts. These contracts call for the Fund to deliver in the future an amount of one currency in return for an amount of another currency, at an exchange rate determined at the time the contract is entered into. Forward contracts are private contractual arrangements and a Fund is subject to the risk that its counterparty will not, or will not be able to, perform its obligations. This type of arrangement may require the Fund to post margin. A Fund may also buy and sell options on currencies. When the Fund buys an option, its loss should generally be limited to the amount of the premium paid and any transaction costs. If a Fund sells an option on a currency, it is subject generally to the same risks as if it had entered into a futures contract or forward contract with respect to that currency. A Fund may enter into foreign currency exchange transactions in order to hedge against changes in the values of the assets or liabilities denominated in one or more foreign currencies, or otherwise to increase or reduce a Fund’s exposure to various foreign currencies. The use of foreign currency exchange transactions may create investment leverage.
Whenever a Fund enters into a foreign currency exchange transaction, it is subject to the risk that the value of the transaction will move in a direction unfavorable to it. When the Fund uses the transactions for hedging purposes, it is likely that the Fund will have an asset or liability that will offset any loss (or gain) on the transactions, at least in part. If a Fund enters into foreign currency exchange transactions other than for hedging purposes (for example, seeking to profit from an anticipated change in the values of currencies by creating directional exposures in the portfolio with respect to one or more currencies), it will generally be subject to the same risks, but is less likely to have assets or liabilities that will offset any losses on the transactions. There can be no assurance that a Fund will be able to terminate any foreign currency exchange transaction prior to its maturity in order to limit its loss on the transaction.
Forward foreign currency contracts are marked to market daily and the change in their value is recorded by the Funds as an unrealized gain or loss. Forward foreign currency contracts are valued at the settlement price established through dealers or other market sources on the day which they are traded. When a forward foreign currency contract is extinguished, through delivery or offset by entering into another forward foreign currency contract, the Funds record a realized gain or loss equal to the difference between the value of the contract at the time it was opened and the value of the contract at the time it was extinguished or offset. The notional or contractual amounts of these instruments do not necessarily represent the amounts potentially subject to risk. The measurement of the risk associated with these instruments is meaningful only when all related and offsetting transactions and counterparty risks are considered. For information regarding the accounting treatment of options, see “Options, Rights, and Warrants” below.
A Fund’s current exposure to a counterparty is the unrealized appreciation (depreciation) on the contract.
Futures Contracts
A Fund may seek to manage a variety of different risks, such as interest rate risk, equity price risk, and currency risk, through the use of futures contracts. A Fund may use interest rate futures contracts to adjust the interest rate sensitivity (duration) of its portfolio or the credit exposure of the portfolio. Interest rate futures contracts obligate the long or short holder to take or make delivery of a specified quantity of a financial instrument, such as a specific fixed income security, during a specified future period at a specified price. A Fund may use index futures contracts to hedge against broad market risks to its portfolio or to gain broad market exposure when it holds uninvested cash or as an inexpensive substitute for cash investments directly in securities or other assets, including commodities and precious metals. Securities index futures contracts are contracts to buy or sell units of a securities index at a specified future date at a price agreed upon when the contract is made and are settled in cash. Positions in futures contracts may be closed out only on an exchange or board of trade which provides a market for such futures. Because futures contracts are exchange-traded, they typically have minimal exposure to counterparty risk.
Parties to a futures contract are not required to post the entire notional amount of the contract, but rather a small percentage of that amount (by way of margin), both at the time they enter into futures transactions, and then on a daily basis if their positions decline in value; as a result, futures contracts are highly leveraged. Such payments are known as variation margin and are recorded by the Funds as unrealized gains or losses. Because futures markets are highly leveraged, they can be extremely volatile, and there can be no assurance that the pricing of a futures contract will correlate precisely with the pricing of the asset or index underlying it or the asset or liability of the Fund that is the subject of the hedge. It may not always be possible for a Fund to enter into a closing
TABLE OF CONTENTS
| | Notes to Financial Statements (Continued) | |
transaction with respect to a futures contract it has entered into, at a favorable time or price. When a Fund enters into a futures transaction, it is subject to the risk that the value of the futures contract will move in a direction unfavorable to it. When a Fund uses futures contracts for hedging purposes, it is likely that the Fund will have an asset or liability that will offset any loss (or gain) on the transactions, at least in part.
When a futures contract is closed, the Fund records a realized gain or loss equal to the difference between the value of the contract at the time it was opened and the value at the time it was closed. Futures contracts are valued at the settlement price established each day by the board of trade or exchange on which they are traded.
Swap Agreements
Swap agreements are typically two-party contracts entered into primarily by institutional investors. In a standard “swap” transaction, two parties agree to exchange the returns (or differentials in rates of return) earned or realized on particular predetermined investments or instruments or rates, which may be adjusted for an interest factor. The gross returns to be exchanged or “swapped” between the parties are generally calculated with respect to a “notional amount,” (i.e., the return on or increase in value of a particular dollar amount invested at a particular interest rate or in a “basket” of securities representing a particular index).
Interest Rate Swaps. When a Fund enters into an interest rate swap, it typically agrees to make payments to its counterparty based on a specified long- or short-term interest rate, and will receive payments from its counterparty based on another interest rate. Other forms of interest rate swap agreements include, among others, interest rate caps, under which, in return for a specified payment stream, one party agrees to make payments to the other to the extent that interest rates exceed a specified rate, or “cap”; interest rate floors, under which, in return for a specified payment stream, one party agrees to make payments to the other to the extent that interest rates fall below a specified rate, or “floor”; and interest rate collars, under which a party sells a cap and purchases a floor or vice versa in an attempt to protect itself against interest rate movements exceeding given minimum or maximum levels. A Fund may enter into an interest rate swap in order, for example, to hedge against the effect of interest rate changes on the value of specific securities in its portfolio, or to adjust the interest rate sensitivity (duration) or the credit exposure of its portfolio overall, or otherwise as a substitute for a direct investment in debt securities.
Total Return Swaps. A Fund also may enter into total return swaps. In a total return swap, one party typically agrees to pay to the other a short-term interest rate in return for a payment at one or more times in the future based on the increase in the value of an underlying security or other asset, or index of securities or assets; if the underlying security, asset, or index declines in value, the party that pays the short-term interest rate must also pay to its counterparty a payment based on the amount of the decline. A Fund may take either side of such a swap, and so may take a long or short position in the underlying security, asset, or index. A Fund may enter into a total return swap to hedge against an exposure in its portfolio — such as interest rate risk (including to adjust the duration or credit quality of a Fund’s bond portfolio), equity risk, or credit risk — or generally to put cash to work efficiently in the markets in anticipation of, or as a replacement for, cash investments. A Fund may also enter into a total return swap to gain exposure to securities or markets in which it might not be able to invest directly (in so-called market access transactions).
Credit Default Swaps. A Fund also may enter into credit default swap transactions, as a “buyer” or “seller” of credit protection. In a credit default swap, one party provides what is in effect insurance against a default or other adverse credit event affecting an issuer of debt securities (typically referred to as a “reference entity”). In general, the buyer of credit protection is obligated to pay the protection seller an upfront amount or a periodic stream of payments over the term of the swap. If a “credit event” occurs, the buyer has the right to deliver to the seller bonds or other obligations of the reference entity (with a value up to the full notional value of the swap), and to receive a payment equal to the par value of the bonds or other obligations. Credit events that would trigger a request that the seller make payment are specific to each credit default swap agreement, but generally include bankruptcy, failure to pay, restructuring, acceleration, default, or repudiation/moratorium. When a Fund buys protection, it may or may not own securities of the reference entity. If it does own securities of the reference entity, the swap serves as a hedge against a decline in the value of the securities due to the occurrence of a credit event involving the issuer of the securities. If the Fund does not own securities of the reference entity, the credit default swap may be seen to create a short position in the reference entity. If a Fund is a buyer and no credit event occurs, the Fund will typically recover nothing under the swap, but will have had to pay the required upfront payment and stream of continuing payments under the swap. When a Fund sells protection under a credit default swap, the position may have the effect of creating leverage in the Fund’s portfolio through the Fund’s indirect long exposure to the issuer or securities on which the swap is written. When a Fund sells protection, it may do so either to earn additional income or to create a “synthetic” long position.
Whenever a Fund enters into a swap agreement, it takes on counterparty risk — the risk that its counterparty will be unable or unwilling to meet its obligations under the swap agreement. The Fund also takes the risk that the market will move against its
TABLE OF CONTENTS
| | Notes to Financial Statements (Continued) | |
position in the swap agreement. In the case of an interest rate swap, the value of the swap may increase or decrease depending on changes in interest rates. In the case of a total return swap, the swap will change in value depending on the change in value of the asset or index on which the swap is written. In the case of a credit default swap, the swap will become more or less valuable depending on the credit of the issuer of the underlying security, and, if a credit event occurs under a swap where the Fund is the seller of credit protection, the Fund could be required to purchase the security at par value, resulting in a significant loss to the Fund. When the Fund enters into any type of swap for hedging purposes, it is likely that the Fund will have an asset or liability that will offset any loss (or gain) on the swap, at least in part. Swap agreements may be non-transferable or otherwise highly illiquid, and a Fund may not be able to terminate or transfer a swap agreement at any particular time or at an acceptable price.
Centrally Cleared Swaps. Certain clearinghouses currently offer clearing for limited types of derivatives transactions, principally certain interest rate swaps, certain index swaps, and credit derivatives. In a cleared derivative transaction, a Fund typically enters into the transaction with a financial institution counterparty, and performance of the transaction is effectively guaranteed by a central clearinghouse, thereby reducing or eliminating the Fund’s exposure to the credit risk of its original counterparty. The Fund will be required to post amounts (“initial margin”) with the clearinghouse or at the instruction of the clearinghouse. The initial margin required by a clearinghouse may be greater than the initial margin the Fund would be required to post in an uncleared transaction. If cash is deposited as the initial margin, it is shown as collateral on a Fund’s Statement of Assets and Liabilities. Swap agreements are marked to market daily and subsequent payments (“variation margin”) are made or received by a Fund depending on whether unrealized gains or losses are incurred. These amounts are reflected as receivables or payables on a Fund’s Statement of Assets and Liabilities (“Variation margin on open derivative instruments”) and as a component of net change in unrealized appreciation (depreciation) on a Fund’s Statement of Operations. Only a limited number of transaction types are currently eligible for clearing.
During the term of a swap transaction, changes in the value of the swap are recognized as unrealized gains or losses by marking to market to reflect the market value of the swap. When the swap is terminated, a Fund will record a realized gain or loss equal to the difference, if any, between the proceeds from (or cost of) the closing transaction and a Fund’s basis in the agreement. Upfront swap premium payments paid or received by a Fund, if any, are recorded within the value of the open swap agreement on the Fund’s Statement of Assets and Liabilities and represent payments paid or received upon entering into the swap agreement to compensate for differences between stated terms of the swap agreement and prevailing market conditions (credit spreads, currency exchange rates, and other relevant factors). These upfront payments are recorded as realized gain or loss on the Fund’s Statement of Operations upon termination or maturity of the swap agreement.
During the term of a swap transaction, the periodic net payments can be made for a set period of time or may be triggered by a predetermined credit event. The net periodic payments may be based on a fixed or variable interest rate, the change in market value of a specified security, basket of securities or index, or the return generated by a security. These periodic payments received or made by the Funds are recorded in the accompanying Statements of Operations as realized gains and losses, respectively.
A Fund’s current exposure to a counterparty is the fair value of the transaction.
Options, Rights, and Warrants
A Fund may purchase and sell put and call options on portfolio securities or an index of securities to enhance investment performance or to protect against changes in market prices. A Fund that invests in debt securities may also purchase and sell put and call options to adjust the interest rate sensitivity of its portfolio or the credit exposure of the portfolio.
Call Options. A call option gives the holder the right to purchase, and obligates the writer to sell, a security at the strike price at any time before the expiration date in the case of an American-style option or only on the expiration date in the case of a European-style option.
Put Options. A put option gives the holder the right to sell, and obligates the writer to buy, a security at the exercise price.
Writing put and call options. A Fund may write call options on a security it owns, in a “directional” strategy hoping to realize a greater current return through the receipt of premiums. In return for the option premium, the Fund takes the risk that it will have to forego any increase in the value of the security over the strike price. When a Fund has written a call option on a security it does not own, its exposure on such an option is theoretically unlimited. A Fund may enter into closing purchase transactions in order to realize a profit or limit a loss on a previously written call option or, in the case of a call option on a security it owns, to free itself to sell the underlying security or to write another call on the security, or protect a security from being called in an unexpected market rise. Any profits from a closing purchase transaction in the case of a call option on a security a Fund owns may be offset by a decline in the value of the underlying security. Conversely, because increases in the market price of a call option will generally
TABLE OF CONTENTS
| | Notes to Financial Statements (Continued) | |
reflect increases in the market price of the underlying security, any loss resulting from a closing purchase transaction relating to a call option on a security a Fund owns is likely to be offset in whole or in part by unrealized appreciation of the underlying security owned by the Fund. A Fund may not be able to close out a call option that it has previously written. A Fund may write put options in order to enhance its current return by taking a long directional position as to a security or index of securities. By writing a put option, the Fund assumes the risk that it may be required to purchase the underlying security for an exercise price higher than its then current market value, resulting in a potential capital loss unless the security later appreciates in value. A Fund may terminate a put option that it has written before it expires by entering into a closing purchase transaction. Any loss from this transaction may be partially or entirely offset by the premium received on the terminated option. A Fund may not be able to close out a put option that it has previously written.
When a Fund writes a call or put option, an amount equal to the premium received is recorded as a liability. Premiums received from writing options which expire are treated as realized gains. Premiums received from writing options which are exercised or closed are added to the proceeds or offset against the amount paid on the underlying investment to determine the realized gain or loss.
Purchasing put and call options. A Fund may purchase put options to protect portfolio holdings against a decline in market value of a security or securities held by it. A Fund may also purchase a put option hoping to profit from an anticipated decline in the value of the underlying security. If the Fund holds the security underlying the option, the option premium and any transaction costs will reduce any profit the Fund might have realized had it sold the underlying security instead of buying the put option. A Fund may purchase call options to hedge against an increase in the price of securities that the Fund wants ultimately to buy. A Fund may also purchase a call option as a long directional investment hoping to profit from an anticipated increase in the value of the underlying security. In order for a call option to be profitable, the market price of the underlying security must rise sufficiently above the exercise price to cover the premium and transaction costs. These costs will reduce any profit the Fund might have realized had it bought the underlying security at the time it purchased the call option.
When a Fund purchases an option, it runs the risk that it will lose its entire investment in the option in a relatively short period of time, unless the Fund exercises the option or enters into a closing sale transaction before the option’s expiration. If the price of the underlying security does not rise (in the case of a call) or fall (in the case of a put) to an extent sufficient to cover the option premium and transaction costs, the Fund will lose part or all of its investment in the option. This contrasts with an investment by a Fund in the underlying security, since the Fund will not realize a loss if the security’s price does not change. Premiums paid for purchasing options that expire are treated as realized losses.
OTC Options. OTC options purchased or sold by a Fund are not traded on securities or options exchanges or backed by clearinghouses. Rather, they are entered into directly between a Fund and the counterparty to the option. In the case of an OTC option purchased by the Fund, the value of the option to the Fund will depend on the willingness and ability of the option writer to perform its obligations to the Fund. In addition, OTC options may not be transferable and there may be little or no secondary market for them, so they may be considered illiquid. It may not be possible to enter into closing transactions with respect to OTC options or otherwise to terminate such options, and as a result a Fund may be required to remain obligated on an unfavorable OTC option until its expiration. OTC options are valued using prices supplied by a primary pricing source, selected pursuant to procedures approved by the Trustees.
Rights and Warrants. A Fund may purchase or hold warrants or rights in order to gain exposure to the underlying security without owning the security, including, for example, cases where the Fund hopes to lock in the price today of a security it may wish to purchase in the future. Warrants generally give the holder the right, but not the obligation, to buy a security at a stated price. In order for a warrant to be profitable, the market price of the underlying security must rise sufficiently above the exercise price to cover any premium and transaction costs. Rights may similarly confer on the holder the right to purchase or acquire securities, including through participation in a so-called rights offering. Bonds may be issued with warrants or other rights attached to purchase or acquire equity or other debt securities, typically of the bond issuer. The market prices of bonds with warrants or rights attached to purchase equity securities or bonds may, to some degree, reflect changes in the values of the underlying securities.
When a Fund purchases or otherwise acquires warrants or other rights, it runs the risk that it will lose its entire investment in the warrants or rights, unless the Fund exercises the warrant or right, acquires the underlying securities, or enters into a closing transaction before expiration. If the price of the underlying security does not rise to an extent sufficient to cover any premium and transaction costs, the Fund will lose part or all of its investment. Any premiums or purchase price paid for warrants or other rights that expire are treated as realized losses. Warrants and similar rights differ from options in that they are typically written by the issuer of the security underlying the warrant or right. Although some warrants and rights may be non-transferable, others may be traded over-the-counter or on an exchange.
TABLE OF CONTENTS
| | Notes to Financial Statements (Continued) | |
Hybrid Instruments
A hybrid instrument may be a debt security, preferred stock, warrant, convertible security, certificate of deposit, or other evidence of indebtedness on which a portion of or all interest payments, and/or the principal or stated amount payable at maturity, redemption, or retirement, is determined by reference to one or more underlying assets, indexes, economic factors, or other benchmarks. Because hybrid instruments may be designed to provide indirect exposures to virtually any type of derivative instrument, a Fund may invest in a hybrid instrument for any purpose it might engage in derivatives transactions. Hybrid instruments may take a number of forms, including, for example, debt instruments with interest or principal payments or redemption terms determined by reference to the value of an index, security, or other measure at a future time, preferred stock with dividend rates determined by reference to the value of a currency, or convertible securities where the conversion terms relate to a particular commodity. The risks of investing in a hybrid instrument may, depending on the nature of the instrument, reflect a combination of the risks of investing in securities, options, futures, currencies or other types of investments, and will depend upon the terms of the instrument. Such risks generally depend upon factors unrelated to the operations or credit quality of the issuer of the hybrid instrument, and may not be foreseen by the purchaser, such as financial or market developments, economic and political events, the supply and demand of the underlying assets, and interest rate movements. Hybrid instruments may be highly volatile and their use by a Fund may not be successful. The terms of a hybrid instrument may create investment leverage. Hybrid instruments are typically privately issued, presenting credit risk of the issuer, and may be highly illiquid and difficult to value.
Inflation-Linked Securities
Inflation-linked securities are typically fixed income securities whose principal values are periodically adjusted according to a measure of inflation. If the index measuring inflation falls, the principal value of an inflation-linked security will be adjusted downward, and consequently the interest payable on the security (calculated with respect to a smaller principal amount) will be reduced. Repayment of the original principal of the security upon maturity (as adjusted for inflation) is guaranteed in the case of U.S. Treasury inflation-linked securities. For securities that do not provide a similar guarantee, the adjusted principal value of the security repaid at maturity may be less than the original principal.
Alternatively, the interest rates payable on certain inflation-linked securities may be adjusted according to a measure of inflation. As a result, the principal values of such securities do not adjust according to the rate of inflation, although the interest payable on such securities may decline during times of falling inflation.
The values of inflation-linked securities are expected to change in response to changes in real interest rates. Real interest rates are tied to the relationship between nominal interest rates and the rate of inflation. If nominal interest rates increase at a faster rate than inflation, real interest rates may rise, leading to a decrease in value of inflation-linked securities. Inflation-linked securities may cause a potential cash flow mismatch to investors, because an increase in the principal amount of an inflation-linked security will be treated as interest income currently subject to tax at ordinary income rates even though investors will not receive repayment of principal until maturity. If a Fund invests in such securities, it will be required to distribute such interest income in order to qualify for treatment as a regulated investment company and eliminate the Fund-level tax, without a corresponding receipt of cash, and therefore may be required to dispose of portfolio securities at a time when it may not be advantageous to do so in order to make such distributions.
Bank Loans
A Fund may invest in bank loans including, for example, corporate loans, loan participations, direct debt, bank debt, and bridge debt. A Fund may invest in a loan by lending money to a borrower directly as part of a syndicate of lenders. In a syndicated loan, the agent that originated and structured the loan typically administers and enforces the loan on behalf of the syndicate. Failure by the agent to fulfill its obligations may delay or adversely affect receipt of payment by a Fund. A Fund may also invest in loans through novations, assignments, and participation interests. In a novation, a Fund typically assumes all of the rights of a lending institution in a loan, including the right to receive payments of principal and interest and other amounts directly from the borrower and to enforce its rights as a lender directly against the borrower. When a Fund takes an assignment of a loan, the Fund acquires some or all of the interest of another lender (or assignee) in the loan. In such cases, the Fund may be required generally to rely upon the assignor to demand payment and enforce rights under the loan. If a Fund acquires a participation in the loan, the Fund purchases an indirect interest in a loan held by a third party and the Fund typically will have a contractual relationship only with the third-party loan investor, not with the borrower. As a result, a Fund may have the right to receive payments of principal, interest,
TABLE OF CONTENTS
| | Notes to Financial Statements (Continued) | |
and any fees to which it is entitled only from the loan investor selling the participation and only upon receipt by such loan investor of such payments from the borrower. In such cases, a Fund assumes the credit risk of both the borrower and the loan investor selling the participation, and the Fund may be unable to realize some or all of the value of its interest in the loan in the event of the insolvency of the third party.
Changes in the financial condition of the borrower or economic conditions or other circumstances may reduce the capacity of the borrower to make principal and interest payments on such instruments and may lead to defaults. The value of any collateral securing a bank loan may decline after the Fund invests, and there is a risk that the value of the collateral may not be sufficient to cover the amount owed to the Fund.
Certain Funds may receive or pay fees associated with investments in bank loans. These fees are included as interest income on a Fund’s Statement of Operations. These fees include all income and expenses associated with the processing and maintenance of these types of loans, including but not limited to consent fee income, amendment fees, and closing fees.
At September 30, 2024, the Funds had no unfunded bank loan commitments.
Repurchase Agreements
Each Fund may enter into repurchase agreements with certain banks and broker-dealers whereby a Fund acquires a security for cash and obtains a simultaneous commitment from the seller to repurchase the security at an agreed upon price and date. A Fund, through its custodian, takes possession of the securities collateralizing the repurchase agreement in a segregated account. Repurchase agreements must be fully collateralized at all times, but involve some risk to a Fund if the other party should default on its obligation and the Fund is delayed or prevented from recovering the collateral, or if the Fund is required to return collateral to a borrower at a time when it may realize a loss on the investment of that collateral. Collateral for certain tri-party repurchase agreements is held at the Fund’s custodian or sub-custodian in a segregated account for the benefit of the Fund and the counterparty.
When-Issued, Delayed-Delivery, Forward Commitment, and To-Be-Announced Transactions
A Fund may enter into when-issued, delayed-delivery, forward commitment, or to-be-announced (“TBA”) transactions (collectively, the “Forward Transactions”) in order to lock in the purchase price of the underlying security, or in order to adjust the interest rate exposure of the Fund’s existing portfolio. In Forward Transactions, a Fund commits to purchase or sell particular securities, with payment and delivery to take place at a future date. In the case of TBA purchase commitments, the unit price and the estimated principal amount are established when the Fund enters into a commitment, with the actual principal amount being within a specified range of the estimate. Although a Fund does not typically pay for the securities in these types of transactions until they are delivered, it immediately assumes the risks of ownership, including the risk of price fluctuation. As a result, each of these types of transactions may create investment leverage in a Fund’s portfolio and increase the volatility of the Fund. If a Fund’s counterparty fails to deliver a security purchased in a Forward Transaction, there may be a loss, and the Fund may have missed an opportunity to make an alternative investment.
These securities are valued on the basis of valuations furnished by a pricing service, selected pursuant to procedures approved by the Trustees, which determines valuations taking into account appropriate factors such as institutional-size trading in similar groups of securities, yield, quality, coupon rate, maturity, type of issue, trading characteristics, and other market data. Securities for which no market quotation is available are valued at fair value by MML Advisers. A Fund records on a daily basis the unrealized appreciation (depreciation) based upon changes in the values of these securities. When a Forward Transaction is closed, a Fund records a realized gain or loss equal to the difference between the value of the transaction at the time it was opened and the value of the transaction at the time it was closed.
Dollar Roll Transactions
A Fund may enter into dollar roll transactions, in which the Fund sells mortgage-backed securities for delivery in the current month and simultaneously contracts to purchase substantially similar securities on a specified future date from the same party. A Fund may invest in dollar rolls in order to benefit from anticipated changes in pricing for the mortgage-backed securities during the term of the transaction, or for the purpose of creating investment leverage. In a dollar roll, the securities that are to be purchased will be of the same type as the securities sold, but will be supported by different pools of mortgages.
Dollar rolls involve the risk that the Fund’s counterparty will be unable to deliver the mortgage-backed securities underlying the dollar roll at the fixed time. If the counterparty files for bankruptcy or becomes insolvent, a Fund’s use of the transaction proceeds
TABLE OF CONTENTS
| | Notes to Financial Statements (Continued) | |
may be restricted pending a determination by the counterparty or its representative, whether to enforce the Fund’s obligation to repurchase the securities. A Fund can incur a loss on a dollar roll transaction (either because its counterparty fails to perform or because the value of the mortgages subject to the transaction declines) and on the investments made by the Fund with the proceeds of the dollar roll transaction.
A Fund accounts for a dollar roll transaction as a purchase and sale whereby the difference in the sales price and purchase price of the security sold is recorded as a realized gain (loss). If certain criteria are met, these dollar roll transactions may be considered financing transactions, whereby the difference in the sales price and the future purchase price is recorded as an adjustment to interest income. Dollar roll transactions generally have the effect of creating leverage in a Fund’s portfolio.
Mortgage- and Asset-Backed Securities
A Fund may invest in mortgage- and asset-backed securities. Mortgage-backed securities, including collateralized mortgage obligations and certain stripped mortgage- backed securities, represent a participation in, or are secured by, mortgage loans. Mortgage-backed securities may include securities that are issued or guaranteed by U.S. Government agencies or instrumentalities or other issuers, including private companies. Asset-backed securities are generally structured like mortgage-backed securities, but instead of mortgage loans or interests in mortgage loans, the underlying assets may include such items as consumer loans or receivables and they may be backed by collateralized debt obligations (“CDOs”), including collateralized bond obligations and collateralized loan obligations (“CLOs”).
Investments in mortgage- and asset-backed securities subject a Fund to credit risk, interest rate risk, extension risk, and prepayment risk, among other risks. Certain of these risks may be higher for investments in mortgage-backed securities composed of subprime mortgages and investments in CDOs and CLOs backed by pools of high-risk, below investment grade debt securities. Mortgage-backed and asset-backed securities not issued by a government agency generally involve greater credit risk than securities issued by government agencies. Payment of principal and interest generally depends on the cash flows generated by the underlying assets and the terms of the security. A Fund’s investments in mortgage-backed securities may make a Fund’s net asset value more susceptible to economic, market, political, and other developments affecting the residential and commercial real estate markets and the servicing of mortgage loans secured by real estate properties. Payments on mortgage-backed and many asset-backed investments typically include both interest and partial payment of principal. Principal may also be prepaid voluntarily, or as a result of refinancing or foreclosure. A Fund may have to invest the proceeds from prepaid investments in other investments with less attractive terms and yields. Investments that receive only the interest portion or the principal portion of payments on the underlying assets may be highly volatile. See a Fund’s Portfolio of Investments, if applicable, for mortgage-related and other asset-backed securities as of September 30, 2024.
Securities Lending
Each Fund, other than the U.S. Government Money Market Fund, may lend its securities; however, lending cannot exceed 33% of the total assets of the Fund taken at current value. The Funds’ securities lending activities are governed by a Securities Lending Agency Agreement (“Lending Agreement”) between each Fund and the lending agent (“Agent”). The Lending Agreement authorizes the Agent to lend portfolio securities held by a Fund to approved borrowers (each, a “Borrower”).
Each Fund expects that in connection with any securities on loan, the loan will be secured continuously by collateral consisting of cash (U.S. currency) and/or securities (U.S. Treasury and Agency obligations) adjusted daily to have value at least equal to the current market value of the securities loaned. The market value of the loaned securities is determined at the close of business of a Fund and any additional collateral is delivered to the Fund the next business day. The Funds bear the risk of loss with respect to the investment of cash collateral. As with other extensions of credit, the Funds may bear the risk of delay in recovery of the loaned securities or even loss of rights in the collateral should the Borrower of the securities fail financially. Pursuant to the Lending Agreement, the Agent has provided indemnification to the Funds in the event of default by a Borrower with respect to a loan. The Funds receive compensation for lending their securities in the form of a securities loan fee paid by the Borrower, as well as a share of the income earned on investment of the cash collateral received for the loaned securities. At September 30, 2024, the Funds’ collateral was equal to or greater than 100% of the market value of securities on loan and all of the Funds’ cash collateral was invested in the State Street Navigator Securities Lending Government Money Market Portfolio.
Subject to the terms of the Lending Agreement and the agreement between the Agent and the applicable Borrower (“Borrowing Agreement”), security loans can be terminated by the Agent, the Fund, or the Borrower and the related securities must be returned within the earlier of the customary settlement period for such securities or the period of time specified in the Borrowing Agreement.
TABLE OF CONTENTS
| | Notes to Financial Statements (Continued) | |
The Funds employ the Agent to implement their securities lending program and the Agent receives a fee from the Funds for its services. In addition, the Funds may be required to pay a rebate to the Borrower. Accordingly, a Fund’s compensation for lending its securities is reduced by any such fees or rebate paid to the Agent or Borrower, respectively. Income received by the Funds in securities lending transactions during the year ended September 30, 2024, is reflected as securities lending income on the Statement of Operations.
Accounting for Investment Transactions
Investment transactions are accounted for on the trade date. Realized gains and losses on sales of investments and unrealized appreciation and depreciation of investments are computed by the specific identification cost method. Proceeds received from litigation, if any, are included in realized gains on investment transactions for any investments that are no longer held in the portfolio and as a reduction in cost for investments that continue to be held in the portfolio. Interest income, adjusted for amortization of discounts and premiums on debt securities, is earned from the settlement date and is recorded on the accrual basis. Dividend income and realized capital gain distributions are recorded on the ex-dividend date. Non-cash dividends received in the form of stock are recorded as dividend income at market value. Withholding taxes on foreign interest, dividends, and capital gains have been provided for in accordance with the applicable country’s tax rules and rates. Foreign dividend income is recorded on the ex-dividend date or as soon as practicable after the Fund determines the existence of a dividend declaration after exercising reasonable due diligence. Distributions received on securities that represent a return of capital or capital gains are recorded as a reduction of cost of investments and/or as a realized gain.
Foreign Currency Translation
The books and records of the Funds are maintained in U.S. dollars. The market values of foreign currencies, foreign securities, and other assets and liabilities denominated in foreign currencies are translated into U.S. dollars at the mean of the buying and selling rates of such currencies against the U.S. dollar at the end of each business day. Purchases and sales of foreign securities and income and expense items are translated at the rates of exchange prevailing on the respective dates of such transactions. The Funds do not isolate that portion of the results of operations arising from changes in the exchange rates from that portion arising from changes in the market prices of securities. Net realized foreign currency gains and losses resulting from changes in exchange rates include foreign currency gains and losses between trade date and settlement date on investment securities transactions, foreign currency transactions, and the difference between the amounts of dividends or interest recorded on the books of the Funds and the amount actually received.
Market Risk
The value of a Fund’s portfolio securities may decline, at times sharply and unpredictably, as a result of unfavorable market-induced changes affecting particular industries, sectors, or issuers. Stock and bond markets can decline significantly in response to issuer, market, economic, industry, political, regulatory, geopolitical, public health, and other conditions, as well as investor perceptions of these conditions. A Fund is subject to risks affecting issuers, such as management performance, financial leverage, industry problems, and reduced demand for goods or services.
Allocation of Operating Activity
In maintaining the records for the Funds, the income and expense accounts are allocated daily to each class of shares. Investment income and loss, and unrealized and realized gains or losses are prorated among the classes of shares based on the relative net assets of each. Expenses are allocated to each class of shares depending on the nature of the expenditures. Administration and service fees, if any, which are directly attributable to a class of shares, are charged to that class’s operations. Expenses of a Fund not directly attributable to the operations of any specific class of shares of the Fund are prorated among the classes to which the expense relates based on relative net assets.
Foreign Securities
The Global Fund invests a significant amount of its assets in foreign securities and each of the International Equity Fund and Strategic Emerging Markets Fund invests substantially all of its assets in foreign securities. The other Funds may also invest in foreign securities. Foreign securities, including American Depositary Receipts, are subject to additional risks compared to securities of U.S. issuers, including international trade, currency, political, regulatory, public health, and diplomatic risks. In addition, fluctuations in currency exchange rates may favorably or unfavorably affect the values of foreign securities and the price
TABLE OF CONTENTS
| | Notes to Financial Statements (Continued) | |
of a Fund’s shares. Emerging markets securities are subject to greater risks than securities issued in developed foreign markets, including less liquidity, less stringent investor protection and disclosure standards, less reliable settlement practices, greater price volatility, higher relative rates of inflation, greater political, economic, and social instability, greater custody and operational risks, greater risk of new or inconsistent government treatment of or restrictions on issuers and instruments, and greater volatility in currency exchange rates, and are more susceptible to environmental problems.
Federal Income Tax
It is each Fund’s intent to continue to comply with the provisions of Subchapter M of the Internal Revenue Code of 1986, as amended (the “Code”), applicable to a regulated investment company. Under such provisions, the Funds would not be subject to U.S. federal income taxes on their ordinary income and net realized capital gains to the extent they are distributed or deemed to have been distributed to their shareholders. Therefore, the Funds have not made any provision for U.S. federal income tax.
Dividends and Distributions to Shareholders
Dividends from net investment income are either declared daily and paid monthly or declared and paid annually depending on the requirements of each Fund. Dividends from net investment income may also be distributed at other times throughout the year as required to satisfy tax or regulatory requirements. Distributions of any net realized capital gains of each Fund are declared and paid annually and at other times as may be required to satisfy tax or regulatory requirements.
Distributions to shareholders are recorded on the ex-dividend date. Income and capital gain distributions are determined in accordance with income tax regulations, which may differ from generally accepted accounting principles. As a result, net investment income and net realized capital gains on investment transactions for a reporting period may differ significantly from distributions during such period.
3.
| Investment Advisory Fees and Other Transactions |
Investment Advisory Fees and Investment Subadvisers
MML Advisers, a wholly-owned subsidiary of Massachusetts Mutual Life Insurance Company (“MassMutual”), serves as investment adviser to each Fund. Under the investment advisory agreements between MML Advisers and the Trust on behalf of each Fund, MML Advisers is responsible for providing investment management services for each Fund. In return for these services, MML Advisers receives investment advisory fees, based upon each Fund’s average daily net assets, computed and accrued daily and payable monthly, at the following annual rates:
| | | | | |
U.S. Government Money Market Fund | | | 0.35% on the first $1 billion; and
0.33% on any excess over $1 billion | |
Short-Duration Bond Fund | | | 0.35% on the first $500 million; and
0.30% on any excess over $500 million | |
Inflation-Protected and Income Fund | | | 0.38% on the first $350 million; and
0.33% on any excess over $350 million | |
Core Bond Fund | | | 0.38% on the first $1.5 billion;
0.33% on the next $500 million; and
0.28% on any excess over $2 billion | |
Diversified Bond Fund | | | 0.40% on the first $150 million; and
0.30% on any excess over $150 million | |
High Yield Fund | | | 0.48% on the first $250 million; and
0.455% on any excess over $250 million | |
Balanced Fund | | | 0.48% on the first $300 million; and
0.43% on any excess over $300 million | |
Disciplined Value Fund | | | 0.45% on the first $400 million; and
0.40% on any excess over $400 million | |
Disciplined Growth Fund | | | 0.45% on the first $400 million; and
0.40% on any excess over $400 million | |
Small Cap Opportunities Fund | | | 0.58% on the first $300 million; and
0.53% on any excess over $300 million | |
| | | | | |
TABLE OF CONTENTS
| | Notes to Financial Statements (Continued) | |
| | | | | |
Global Fund | | | 0.75% on the first $400 million; and
0.70% on any excess over $400 million | |
International Equity Fund | | | 0.83% on the first $500 million;
0.78% on the next $500 million; and
0.73% on any excess over $1 billion | |
Strategic Emerging Markets Fund | | | 1.00% on the first $350 million; and
0.95% on any excess over $350 million | |
| | | | | |
MML Advisers has entered into investment subadvisory agreements with Barings LLC (“Barings”), a wholly-owned subsidiary of MM Asset Management Holding LLC, itself a wholly-owned subsidiary of MassMutual Holding LLC, a controlled subsidiary of MassMutual, on behalf of certain Funds. These agreements provide that Barings manage the investment and reinvestment of assets of these Funds. Barings receives a subadvisory fee from MML Advisers, based upon each Fund’s average daily net assets, at the following annual rates:
| | | | | | | |
U.S. Government Money Market Fund | | | 0.05% | | | |
Short-Duration Bond Fund* | | | 0.08% | | | |
Inflation-Protected and Income Fund* | | | 0.08% | | | |
Core Bond Fund* | | | 0.10% | | | |
Diversified Bond Fund* | | | 0.10% | | | |
High Yield Fund* | | | 0.20% | | | |
| | | | | | | |
*
| Baring International Investment Limited (“BIIL”), a wholly-owned subsidiary of Barings, serves as a sub-subadviser of the Fund. BIIL does not receive a fee from Barings under the sub-subadvisory agreement with Barings. |
MML Advisers has also entered into investment subadvisory agreements for certain Funds with the unaffiliated investment subadviser(s) shown in the following table. MML Advisers pays a subadvisory fee to each of these subadvisers based upon the aggregate net assets under management which include (1) the average daily net assets of the specified Fund which it manages, and, if applicable, (2) the average daily net assets of other Funds or accounts of MML Advisers or its affiliates for which the subadviser provides subadvisory services.
| | | | | | | | |
Balanced Fund* | | | Invesco Advisers, Inc. | | | | |
Disciplined Value Fund | | | Wellington Management Company LLP | | | | |
Disciplined Growth Fund | | | Wellington Management Company LLP | | | | |
Small Cap Opportunities Fund | | | Invesco Advisers, Inc. | | | | |
Global Fund | | | Invesco Advisers, Inc. | | | | |
International Equity Fund | | | Thompson, Siegel & Walmsley LLC; and | | | | |
| | | Wellington Management Company LLP | | | | |
Strategic Emerging Markets Fund | | | Invesco Advisers, Inc. | | | | |
| | | | | | | | |
*
| Invesco Capital Management LLC serves as a sub-subadviser of the Fund. |
The Funds’ subadvisory fees are paid monthly by MML Advisers out of the investment advisory fees previously disclosed above.
TABLE OF CONTENTS
| | Notes to Financial Statements (Continued) | |
Administration Fees
Under an Administrative and Shareholder Services Agreement between the Trust and MML Advisers, on behalf of each Fund, MML Advisers is obligated to provide certain administrative and shareholder services. In return for these services, MML Advisers receives an administrative services fee, based upon the average daily net assets of the applicable class of shares of the Funds, at the following annual rates:
| | | | | | | | | | | | | | | | | | | | | | | | | | | | | | | |
U.S. Government Money Market Fund | | | N/A | | | 0.10% | | | N/A | | | N/A | | | N/A | | | N/A | | | N/A | | | N/A | | | N/A | | | N/A |
Short-Duration Bond Fund | | | None | | | 0.10% | | | 0.20% | | | 0.30% | | | 0.20% | | | 0.25%** | | | 0.20% | | | 0.10% | | | 0.05% | | | 0.05% |
Inflation-Protected and Income Fund | | | None | | | 0.10% | | | 0.20% | | | 0.30% | | | 0.20% | | | 0.25%** | | | 0.20% | | | 0.10% | | | N/A | | | N/A |
Core Bond Fund | | | None | | | 0.10% | | | 0.20% | | | 0.30% | | | 0.20% | | | 0.25%** | | | 0.20% | | | 0.10% | | | N/A | | | N/A |
Diversified Bond Fund | | | None | | | 0.10% | | | 0.20% | | | 0.30% | | | 0.20% | | | 0.25%** | | | 0.20% | | | 0.10% | | | N/A | | | N/A |
High Yield Fund | | | None | | | 0.10% | | | 0.20% | | | 0.30% | | | 0.20% | | | 0.25%** | | | 0.20% | | | 0.05% | | | N/A | | | None |
Balanced Fund | | | None | | | 0.10% | | | 0.20% | | | 0.30% | | | 0.20% | | | 0.25%** | | | 0.20% | | | 0.10% | | | N/A | | | N/A |
Disciplined Value Fund | | | None | | | 0.10% | | | 0.20% | | | 0.30% | | | 0.20% | | | 0.25%** | | | 0.20% | | | 0.10% | | | N/A | | | N/A |
Disciplined Growth Fund | | | None | | | 0.10% | | | 0.20% | | | 0.30% | | | 0.20% | | | 0.25%** | | | 0.20% | | | 0.10% | | | N/A | | | N/A |
Small Cap Opportunities Fund | | | None | | | 0.10% | | | 0.20% | | | 0.30% | | | 0.20% | | | 0.25%** | | | 0.20% | | | 0.10% | | | N/A | | | N/A |
Global Fund* | | | None | | | 0.10% | | | 0.20% | | | 0.30% | | | 0.20% | | | 0.25%** | | | 0.20% | | | 0.10% | | | N/A | | | N/A |
International Equity Fund | | | None | | | 0.10% | | | 0.20% | | | 0.30% | | | 0.20% | | | 0.25%** | | | 0.20% | | | 0.10% | | | N/A | | | N/A |
Strategic Emerging Markets Fund* | | | None | | | 0.10% | | | 0.20% | | | 0.30% | | | 0.20% | | | 0.25%** | | | 0.20% | | | 0.10% | | | N/A | | | N/A |
| | | | | | | | | | | | | | | | | | | | | | | | | | | | | | | |
*
| Class Y is not currently available for purchase. |
**
| Prior to February 1, 2024, the annual rate was 0.30%. |
Distribution and Service Fees
MML Distributors, LLC (the “Distributor”) acts as distributor to each Fund. Pursuant to a 12b-1 Plan adopted by the Trust, Class R4 shares and Class A shares of each applicable Fund and Class L shares of the Short-Duration Bond Fund pay an annual fee of 0.25% of the average daily net assets of the class; Class R3 shares of each applicable Fund and Class C shares of the Short-Duration Bond Fund pay an annual fee of 0.50% of the average daily net assets of the class; and Class C shares of the High Yield Fund pay an annual fee of 1.00% of the average daily net assets of the class, to the Distributor. Such payments compensate the Distributor for services provided and expenses incurred by it for purposes of promoting the sale of the relevant class of shares, reducing redemptions of shares, or maintaining or improving services provided to each Fund’s shareholders. The Distributor is a wholly-owned subsidiary of MassMutual.
Expense Caps and Waivers
Effective July 1, 2024, MML Advisers has agreed to cap the fees and expenses of the Funds noted below (other than extraordinary legal and other expenses, Acquired Fund Fees and Expenses#, interest expense, expenses related to borrowings, securities lending, leverage, taxes, and brokerage, short sale dividend and loan expense, or other non-recurring or unusual expenses such as organizational expenses and shareholder meeting expenses, as applicable) through January 31, 2026, based upon the average daily net assets of the applicable class of shares of the Fund, as follows:
| | | | | | | | | | | | | | | | | | | | | | | | | |
Inflation-Protected and Income Fund | | | 0.49% | | | 0.59% | | | 0.69% | | | 0.79% | | | 0.94% | | | 0.99% | | | 1.19% | | | 0.59% |
Diversified Bond Fund | | | 0.59% | | | 0.69% | | | 0.79% | | | 0.89% | | | 1.04% | | | 1.09% | | | 1.29% | | | 0.69% |
| | | | | | | | | | | | | | | | | | | | | | | | | |
#
| Acquired Fund Fees and Expenses are borne indirectly by a Fund through investments in other pooled investment vehicles. |
TABLE OF CONTENTS
| | Notes to Financial Statements (Continued) | |
Effective February 1, 2024, MML Advisers has agreed to cap the fees and expenses of the Funds noted below (other than extraordinary legal and other expenses, Acquired Fund Fees and Expenses#, interest expense, expenses related to borrowings, securities lending, leverage, taxes, and brokerage, short sale dividend and loan expense, or other non-recurring or unusual expenses such as organizational expenses and shareholder meeting expenses, as applicable) through January 31, 2025, based upon the average daily net assets of the applicable class of shares of the Fund, as follows:
| | | | | | | | | | | | | | | | | | | | | | | | | | | | | | | |
U.S. Government Money Market Fund | | | N/A | | | 0.54% | | | N/A | | | N/A | | | N/A | | | N/A | | | N/A | | | N/A | | | N/A | | | N/A |
Short-Duration Bond Fund | | | 0.46% | | | 0.56% | | | 0.66% | | | 0.76% | | | 0.91% | | | 0.96% | | | 1.16% | | | 0.51% | | | 0.76% | | | 1.01% |
Core Bond Fund | | | 0.42% | | | 0.52% | | | 0.62% | | | 0.72% | | | 0.87% | | | 0.92% | | | 1.12% | | | 0.52% | | | N/A | | | N/A |
High Yield Fund | | | 0.54% | | | 0.64% | | | 0.74% | | | 0.84% | | | 0.99% | | | 1.04% | | | 1.24% | | | 0.59% | | | N/A | | | 1.54% |
Small Cap Opportunities Fund | | | 0.65% | | | 0.75% | | | 0.85% | | | 0.95% | | | 1.10% | | | 1.15% | | | 1.35% | | | 0.75% | | | N/A | | | N/A |
Strategic Emerging Markets Fund* | | | 1.15% | | | 1.25% | | | 1.35% | | | 1.45% | | | 1.60% | | | 1.65% | | | 1.85% | | | 1.25% | | | N/A | | | N/A |
| | | | | | | | | | | | | | | | | | | | | | | | | | | | | | | |
#
| Acquired Fund Fees and Expenses are borne indirectly by a Fund through investments in other pooled investment vehicles. |
*
| Class Y is not currently available for purchase. |
Prior to February 1, 2024, MML Advisers agreed to cap the fees and expenses of the Funds noted below (other than extraordinary legal and other expenses, Acquired Fund Fees and Expenses#, interest expense, expenses related to borrowings, securities lending, leverage, taxes, and brokerage, short sale dividend and loan expense, or other non-recurring or unusual expenses such as organizational expenses and shareholder meeting expenses, as applicable) based upon the average daily net assets of the applicable class of shares of the Fund, as follows:
| | | | | | | | | | | | | | | | | | | | | | | | | | | | | | | |
Short-Duration Bond Fund | | | 0.40% | | | None | | | None | | | None | | | None | | | None | | | None | | | 0.40% | | | 0.65% | | | 0.90% |
Strategic Emerging Markets Fund* | | | 1.15% | | | 1.25% | | | 1.35% | | | 1.45% | | | 1.60% | | | 1.70% | | | 1.85% | | | 1.25% | | | N/A | | | N/A |
| | | | | | | | | | | | | | | | | | | | | | | | | | | | | | | |
#
| Acquired Fund Fees and Expenses are borne indirectly by a Fund through investments in other pooled investment vehicles. |
*
| Class Y is not currently available for purchase. |
MML Advisers has agreed to waive 0.05% of the investment advisory fee of the International Equity Fund through January 31, 2025.
For the U.S. Government Money Market Fund, MML Advisers has agreed to voluntarily waive some or all of its fees in an attempt to allow the Fund to avoid a negative yield. There is no guarantee that the Fund will be able to avoid a negative yield. Payments made to intermediaries will be unaffected. MML Advisers may amend or discontinue this waiver at any time without advance notice.
Expense caps and waiver amounts are reflected as a reduction of expenses on the Statements of Operations.
Rebated Brokerage Commissions
The Funds listed below have entered into agreements with certain brokers whereby the brokers will rebate to the Funds, in cash, a portion of brokerage commissions. Rebated brokerage commissions are amounts earned by the Funds and are included with realized gain or loss on investment transactions presented in the Statements of Operations. For the year ended September 30, 2024, brokerage commissions rebated under these agreements were as follows:
| | | | |
Small Cap Opportunities Fund | | | $ 10,260 |
Global Fund | | | 1,024 |
International Equity Fund | | | 388 |
Strategic Emerging Markets Fund | | | 1,445 |
| | | | |
TABLE OF CONTENTS
| | Notes to Financial Statements (Continued) | |
Deferred Compensation
Trustees of the Funds who are not officers or employees of MassMutual may elect to defer receipt of their annual fees in accordance with terms of a Non-Qualified Deferred Compensation Plan. Amounts deferred shall accrue interest or earnings and shall be recorded on the Funds’ books as other liabilities. Deferred compensation is included within Payables for Trustees’ fees and expenses in the Statements of Assets and Liabilities.
Other
Certain officers and trustees of the Funds may also be employees of MassMutual. The compensation of a trustee who is not an employee of MassMutual is borne by the Funds.
The following table shows beneficial ownership of Funds’ shares by related parties at September 30, 2024:
| | | | |
U.S. Government Money Market Fund | | | 85.7% |
Short-Duration Bond Fund | | | 81.7% |
Inflation-Protected and Income Fund | | | 75.2% |
Core Bond Fund | | | 92.0% |
Diversified Bond Fund | | | 92.6% |
High Yield Fund | | | 83.5% |
Balanced Fund | | | 94.7% |
Disciplined Value Fund | | | 99.1% |
Disciplined Growth Fund | | | 97.7% |
Small Cap Opportunities Fund | | | 59.3% |
Global Fund | | | 91.0% |
International Equity Fund | | | 90.5% |
Strategic Emerging Markets Fund | | | 98.2% |
| | | | |
4.
| Purchases and Sales of Investments |
Cost of purchases and proceeds from sales of investment securities (excluding short-term investments) for the year ended September 30, 2024, were as follows:
| | | | | | | |
Short-Duration Bond Fund | | | $— | | | $52,879,055 | | | $39,466 | | | $115,349,976 |
Inflation-Protected and Income Fund | | | 50,020,872 | | | 111,838,302 | | | 80,341,290 | | | 107,611,135 |
Core Bond Fund | | | 1,471,871,213 | | | 358,050,980 | | | 1,429,439,871 | | | 256,279,704 |
Diversified Bond Fund | | | 156,765,610 | | | 34,775,106 | | | 161,945,512 | | | 62,496,332 |
High Yield Fund | | | — | | | 256,047,010 | | | — | | | 304,985,681 |
Balanced Fund | | | 110,633,959 | | | 25,405,564 | | | 111,553,372 | | | 44,193,138 |
Disciplined Value Fund | | | — | | | 27,973,579 | | | — | | | 60,342,952 |
Disciplined Growth Fund | | | — | | | 124,137,066 | | | — | | | 153,871,850 |
Small Cap Opportunities Fund | | | — | | | 170,871,416 | | | — | | | 148,274,372 |
Global Fund | | | — | | | 11,945,128 | | | — | | | 62,089,259 |
International Equity Fund | | | — | | | 28,772,627 | | | — | | | 47,200,700 |
Strategic Emerging Markets Fund | | | — | | | 61,714,822 | | | — | | | 69,817,583 |
| | | | | | | | | | | | | |
The Funds may purchase from, or sell securities to, other affiliated Funds under procedures adopted by the Trustees. These procedures have been designed to ensure that cross trades conducted by the Funds comply with Rule 17a-7 under the 1940 Act. The Funds did not have any cross trade activity during the year.
TABLE OF CONTENTS
| | Notes to Financial Statements (Continued) | |
5.
| Capital Share Transactions |
Changes in shares outstanding for each Fund were as follows:
| | | | | | | |
U.S. Government Money Market Fund Class R5 | | | | | | | | | | | | |
Sold | | | 411,992,289 | | | $ 411,992,289 | | | 231,528,021 | | | $ 231,528,021 |
Issued as reinvestment of dividends | | | 8,736,771 | | | 8,736,771 | | | 7,693,032 | | | 7,693,032 |
Redeemed | | | (419,274,157) | | | (419,274,157) | | | (272,440,848) | | | (272,440,848) |
Net increase (decrease) | | | 1,454,903 | | | $1,454,903 | | | (33,219,795) | | | $(33,219,795) |
Short-Duration Bond Fund Class I | | | | | | | | | | | | |
Sold | | | 3,016,755 | | | $26,683,491 | | | 8,666,801 | | | $75,259,346 |
Issued as reinvestment of dividends | | | 242,562 | | | 2,172,180 | | | 382,931 | | | 3,314,863 |
Redeemed | | | (6,401,185) | | | (56,352,907) | | | (15,271,592) | | | (131,959,707) |
Net increase (decrease) | | | (3,141,868) | | | $(27,497,236) | | | (6,221,860) | | | $(53,385,498) |
Short-Duration Bond Fund Class R5 | | | | | | | | | | | | |
Sold | | | 905,867 | | | $8,071,960 | | | 1,767,569 | | | $15,294,522 |
Issued as reinvestment of dividends | | | 48,933 | | | 440,957 | | | 100,861 | | | 876,210 |
Redeemed | | | (1,014,464) | | | (9,065,373) | | | (4,075,011) | | | (35,447,895) |
Net increase (decrease) | | | (59,664) | | | $(552,456) | | | (2,206,581) | | | $(19,277,163) |
Short-Duration Bond Fund Service Class | | | | | | | | | | | | |
Sold | | | 312,804 | | | $2,795,758 | | | 450,710 | | | $3,885,915 |
Issued as reinvestment of dividends | | | 8,399 | | | 75,025 | | | 12,043 | | | 103,928 |
Redeemed | | | (488,848) | | | (4,317,878) | | | (410,242) | | | (3,536,476) |
Net increase (decrease) | | | (167,645) | | | $(1,447,095) | | | 52,511 | | | $453,367 |
Short-Duration Bond Fund Administrative Class | | | | | | | | | | | | |
Sold | | | 487,964 | | | $4,338,017 | | | 677,760 | | | $5,848,714 |
Issued as reinvestment of dividends | | | 45,866 | | | 409,315 | | | 38,073 | | | 327,792 |
Redeemed | | | (573,907) | | | (5,080,126) | | | (585,659) | | | (5,037,272) |
Net increase (decrease) | | | (40,077) | | | $(332,794) | | | 130,174 | | | $1,139,234 |
Short-Duration Bond Fund Class R4 | | | | | | | | | | | | |
Sold | | | 645,681 | | | $5,766,090 | | | 131,209 | | | $1,145,653 |
Issued as reinvestment of dividends | | | 25,591 | | | 231,051 | | | 21,549 | | | 186,887 |
Redeemed | | | (136,436) | | | (1,225,950) | | | (781,818) | | | (6,759,222) |
Net increase (decrease) | | | 534,836 | | | $4,771,191 | | | (629,060) | | | $(5,426,682) |
Short-Duration Bond Fund Class A | | | | | | | | | | | | |
Sold | | | 58,384 | | | $515,638 | | | 75,259 | | | $642,954 |
Issued as reinvestment of dividends | | | 23,027 | | | 204,528 | | | 23,781 | | | 203,775 |
Redeemed | | | (134,983) | | | (1,203,415) | | | (278,488) | | | (2,388,470) |
Net increase (decrease) | | | (53,572) | | | $(483,249) | | | (179,448) | | | $(1,541,741) |
Short-Duration Bond Fund Class R3 | | | | | | | | | | | | |
Sold | | | 83,992 | | | $741,189 | | | 268,834 | | | $2,316,577 |
Issued as reinvestment of dividends | | | 21,012 | | | 187,093 | | | 23,196 | | | 199,553 |
Redeemed | | | (298,426) | | | (2,636,751) | | | (400,080) | | | (3,435,021) |
Net increase (decrease) | | | (193,422) | | | $(1,708,469) | | | (108,050) | | | $(918,891) |
| | | | | | | | | | | | | |
TABLE OF CONTENTS
| | Notes to Financial Statements (Continued) | |
| | | | | | | |
Short-Duration Bond Fund Class Y | | | | | | | | | | | | |
Sold | | | 625,753 | | | $ 5,735,540 | | | 338,923 | | | $ 2,928,834 |
Issued as reinvestment of dividends | | | 138,072 | | | 1,236,726 | | | 379,571 | | | 3,283,279 |
Redeemed | | | (2,223,897) | | | (19,684,317) | | | (21,043,926) | | | (181,691,535) |
Net increase (decrease) | | | (1,460,072) | | | $(12,712,051) | | | (20,325,432) | | | $(175,479,422) |
Short-Duration Bond Fund Class L | | | | | | | | | | | | |
Sold | | | 16,150 | | | $143,922 | | | 56,691 | | | $489,439 |
Issued as reinvestment of dividends | | | 160,915 | | | 1,435,031 | | | 222,983 | | | 1,923,839 |
Redeemed | | | (3,138,756) | | | (28,340,803) | | | (3,834,161) | | | (33,002,074) |
Net increase (decrease) | | | (2,961,691) | | | $(26,761,850) | | | (3,554,487) | | | $(30,588,796) |
Short-Duration Bond Fund Class C | | | | | | | | | | | | |
Sold | | | 3 | | | $23 | | | 10,859 | | | $94,243 |
Issued as reinvestment of dividends | | | 2,901 | | | 26,137 | | | 3,784 | | | 32,936 |
Redeemed | | | (20,248) | | | (178,633) | | | (40,680) | | | (353,857) |
Net increase (decrease) | | | (17,344) | | | $(152,473) | | | (26,037) | | | $(226,678) |
Inflation-Protected and Income Fund Class I | | | | | | | | | | | | |
Sold | | | 6,061,074 | | | $56,231,895 | | | 6,364,701 | | | $59,346,528 |
Issued as reinvestment of dividends | | | 1,137,864 | | | 10,448,491 | | | 701,788 | | | 6,484,519 |
Redeemed | | | (8,627,219) | | | (79,691,033) | | | (6,718,141) | | | (62,722,555) |
Net increase (decrease) | | | (1,428,281) | | | $(13,010,647) | | | 348,348 | | | $3,108,492 |
Inflation-Protected and Income Fund Class R5 | | | | | | | | | | | | |
Sold | | | 3,958,324 | | | $37,132,094 | | | 1,348,371 | | | $12,576,982 |
Issued as reinvestment of dividends | | | 331,376 | | | 3,043,431 | | | 270,545 | | | 2,502,538 |
Redeemed | | | (4,690,429) | | | (43,921,362) | | | (3,268,629) | | | (30,563,669) |
Net increase (decrease) | | | (400,729) | | | $(3,745,837) | | | (1,649,713) | | | $(15,484,149) |
Inflation-Protected and Income Fund Service Class | | | | | | | | | | | | |
Sold | | | 497,148 | | | $4,596,015 | | | 606,257 | | | $5,636,269 |
Issued as reinvestment of dividends | | | 114,085 | | | 1,045,119 | | | 120,185 | | | 1,108,108 |
Redeemed | | | (1,284,438) | | | (11,912,505) | | | (1,712,041) | | | (15,898,371) |
Net increase (decrease) | | | (673,205) | | | $(6,271,371) | | | (985,599) | | | $(9,153,994) |
Inflation-Protected and Income Fund Administrative Class | | | | | | | | | | | | |
Sold | | | 196,185 | | | $1,849,397 | | | 395,290 | | | $3,714,053 |
Issued as reinvestment of dividends | | | 40,376 | | | 374,784 | | | 29,913 | | | 279,683 |
Redeemed | | | (468,531) | | | (4,395,411) | | | (502,677) | | | (4,738,049) |
Net increase (decrease) | | | (231,970) | | | $(2,171,230) | | | (77,474) | | | $(744,313) |
Inflation-Protected and Income Fund Class R4 | | | | | | | | | | | | |
Sold | | | 61,715 | | | $557,025 | | | 107,339 | | | $975,326 |
Issued as reinvestment of dividends | | | 16,083 | | | 144,067 | | | 16,806 | | | 151,257 |
Redeemed | | | (250,178) | | | (2,253,045) | | | (198,829) | | | (1,808,204) |
Net increase (decrease) | | | (172,380) | | | $(1,551,953) | | | (74,684) | | | $(681,621) |
Inflation-Protected and Income Fund Class A | | | | | | | | | | | | |
Sold | | | 157,571 | | | $ 1,432,055 | | | 180,696 | | | $ 1,651,858 |
Issued as reinvestment of dividends | | | 47,671 | | | 431,613 | | | 30,374 | | | 276,707 |
Redeemed | | | (196,586) | | | (1,789,720) | | | (296,994) | | | (2,730,780) |
Net increase (decrease) | | | 8,656 | | | $73,948 | | | (85,924) | | | $(802,215) |
| | | | | | | | | | | | | |
TABLE OF CONTENTS
| | Notes to Financial Statements (Continued) | |
| | | | | | | |
Inflation-Protected and Income Fund Class R3 | | | | | | | | | | | | |
Sold | | | 62,047 | | | $565,618 | | | 75,680 | | | $688,255 |
Issued as reinvestment of dividends | | | 12,469 | | | 112,043 | | | 7,661 | | | 69,335 |
Redeemed | | | (69,979) | | | (631,545) | | | (112,803) | | | (1,028,514) |
Net increase (decrease) | | | 4,537 | | | $46,116 | | | (29,462) | | | $(270,924) |
Inflation-Protected and Income Fund Class Y(a) | | | | | | | | | | | | |
Sold | | | 22 | | | $225 | | | 10,718 | | | $100,000 |
Issued as reinvestment of dividends | | | 1 | | | 6 | | | — | | | — |
Redeemed | | | — | | | (1) | | | — | | | — |
Net increase (decrease) | | | 23 | | | $230 | | | 10,718 | | | $100,000 |
Core Bond Fund Class I | | | | | | | | | | | | |
Sold | | | 11,197,330 | | | $100,695,015 | | | 14,343,365 | | | $129,812,183 |
Issued - merger | | | 29,082,100 | | | 271,626,832 | | | — | | | $— |
Issued as reinvestment of dividends | | | 4,515,844 | | | 40,123,179 | | | 2,085,319 | | | 18,934,696 |
Redeemed | | | (18,986,341) | | | (169,906,840) | | | (14,066,559) | | | (127,548,460) |
Net increase (decrease) | | | 25,808,933 | | | $242,538,186 | | | 2,362,125 | | | $21,198,419 |
Core Bond Fund Class R5 | | | | | | | | | | | | |
Sold | | | 2,509,493 | | | $22,652,414 | | | 1,851,620 | | | $16,878,204 |
Issued - merger | | | 5,279,738 | | | 49,523,959 | | | — | | | — |
Issued as reinvestment of dividends | | | 852,099 | | | 7,605,420 | | | 553,696 | | | 5,049,706 |
Redeemed | | | (3,525,083) | | | (31,781,724) | | | (6,792,597) | | | (61,570,153) |
Net increase (decrease) | | | 5,116,247 | | | $48,000,069 | | | (4,387,281) | | | $(39,642,243) |
Core Bond Fund Service Class | | | | | | | | | | | | |
Sold | | | 521,904 | | | $4,660,344 | | | 617,126 | | | $5,595,105 |
Issued - merger | | | 1,093,012 | | | 10,197,808 | | | — | | | $— |
Issued as reinvestment of dividends | | | 213,016 | | | 1,891,061 | | | 145,757 | | | 1,323,476 |
Redeemed | | | (1,306,359) | | | (11,779,099) | | | (1,462,508) | | | (13,251,738) |
Net increase (decrease) | | | 521,573 | | | $4,970,114 | | | (699,625) | | | $(6,333,157) |
Core Bond Fund Administrative Class | | | | | | | | | | | | |
Sold | | | 551,739 | | | $4,896,725 | | | 441,686 | | | $3,972,540 |
Issued - merger | | | 1,253,763 | | | 11,572,229 | | | — | | | $— |
Issued as reinvestment of dividends | | | 282,169 | | | 2,478,143 | | | 140,073 | | | 1,260,653 |
Redeemed | | | (1,550,654) | | | (14,022,054) | | | (979,141) | | | (8,726,243) |
Net increase (decrease) | | | 537,017 | | | $4,925,043 | | | (397,382) | | | $(3,493,050) |
Core Bond Fund Class R4 | | | | | | | | | | | | |
Sold | | | 204,895 | | | $1,858,947 | | | 215,650 | | | $1,909,328 |
Issued - merger | | | 1,868,036 | | | 17,073,857 | | | — | | | — |
Issued as reinvestment of dividends | | | 13,763 | | | 120,279 | | | 6,569 | | | 58,399 |
Redeemed | | | (69,284) | | | (621,526) | | | (317,047) | | | (2,802,117) |
Net increase (decrease) | | | 2,017,410 | | | $18,431,557 | | | (94,828) | | | $(834,390) |
| | | | | | | | | | | | | |
TABLE OF CONTENTS
| | Notes to Financial Statements (Continued) | |
| | | | | | | |
Core Bond Fund Class A | | | | | | | | | | | | |
Sold | | | 427,311 | | | $3,749,664 | | | 776,832 | | | $6,896,355 |
Issued - merger | | | 973,102 | | | 8,942,805 | | | — | | | $— |
Issued as reinvestment of dividends | | | 172,314 | | | 1,506,832 | | | 86,229 | | | 770,885 |
Redeemed | | | (792,140) | | | (7,018,341) | | | (1,017,959) | | | (9,067,462) |
Net increase (decrease) | | | 780,587 | | | $7,180,960 | | | (154,898) | | | $(1,400,222) |
Core Bond Fund Class R3 | | | | | | | | | | | | |
Sold | | | 4,915 | | | $46,530 | | | 4,943 | | | $45,378 |
Issued - merger | | | 417,196 | | | 3,988,392 | | | — | | | $— |
Issued as reinvestment of dividends | | | 1,628 | | | 14,892 | | | 573 | | | 5,295 |
Redeemed | | | (9,411) | | | (86,937) | | | (5,850) | | | (54,331) |
Net increase (decrease) | | | 414,328 | | | $3,962,877 | | | (334) | | | $(3,658) |
Core Bond Fund Class Y(a) | | | | | | | | | | | | |
Sold | | | 417,680 | | | $3,852,769 | | | 10,718 | | | $100,000 |
Issued - merger | | | 10,457 | | | 98,085 | | | — | | | $— |
Issued as reinvestment of dividends | | | 2,347 | | | 21,783 | | | — | | | — |
Redeemed | | | (414) | | | (3,865) | | | — | | | — |
Net increase (decrease) | | | 430,070 | | | $3,968,772 | | | 10,718 | | | $100,000 |
Diversified Bond Fund Class I | | | | | | | | | | | | |
Sold | | | 901,578 | | | $7,934,698 | | | 838,994 | | | $7,479,365 |
Issued as reinvestment of dividends | | | 472,450 | | | 4,094,531 | | | 342,966 | | | 3,066,113 |
Redeemed | | | (4,401,263) | | | (37,851,962) | | | (835,239) | | | (7,432,279) |
Net increase (decrease) | | | (3,027,235) | | | $(25,822,733) | | | 346,721 | | | $3,113,199 |
Diversified Bond Fund Class R5 | | | | | | | | | | | | |
Sold | | | 1,930,223 | | | $15,294,336 | | | 1,977,259 | | | $15,915,093 |
Issued as reinvestment of dividends | | | 732,482 | | | 5,721,867 | | | 299,799 | | | 2,434,368 |
Redeemed | | | (2,317,156) | | | (18,074,656) | | | (1,502,889) | | | (12,079,973) |
Net increase (decrease) | | | 345,549 | | | $2,941,547 | | | 774,169 | | | $6,269,488 |
Diversified Bond Fund Service Class | | | | | | | | | | | | |
Sold | | | 254,037 | | | $2,032,923 | | | 117,004 | | | $962,705 |
Issued as reinvestment of dividends | | | 42,877 | | | 341,259 | | | 23,098 | | | 190,793 |
Redeemed | | | (342,722) | | | (2,753,642) | | | (261,320) | | | (2,145,669) |
Net increase (decrease) | | | (45,808) | | | $(379,460) | | | (121,218) | | | $(992,171) |
Diversified Bond Fund Administrative Class | | | | | | | | | | | | |
Sold | | | 141,702 | | | $ 1,146,244 | | | 141,035 | | | $ 1,164,456 |
Issued as reinvestment of dividends | | | 38,881 | | | 309,178 | | | 40,978 | | | 338,479 |
Redeemed | | | (314,437) | | | (2,518,618) | | | (569,203) | | | (4,683,999) |
Net increase (decrease) | | | (133,854) | | | $(1,063,196) | | | (387,190) | | | $(3,181,064) |
Diversified Bond Fund Class R4 | | | | | | | | | | | | |
Sold | | | 39,890 | | | $316,019 | | | 112,190 | | | $905,376 |
Issued as reinvestment of dividends | | | 37,403 | | | 291,894 | | | 18,453 | | | 150,025 |
Redeemed | | | (362,849) | | | (2,867,627) | | | (33,578) | | | (271,656) |
Net increase (decrease) | | | (285,556) | | | $(2,259,714) | | | 97,065 | | | $783,745 |
| | | | | | | | | | | | | |
TABLE OF CONTENTS
| | Notes to Financial Statements (Continued) | |
| | | | | | | |
Diversified Bond Fund Class A | | | | | | | | | | | | |
Sold | | | 73,978 | | | $599,038 | | | 99,451 | | | $813,954 |
Issued as reinvestment of dividends | | | 42,864 | | | 342,205 | | | 22,797 | | | 188,989 |
Redeemed | | | (237,832) | | | (1,923,903) | | | (182,442) | | | (1,501,317) |
Net increase (decrease) | | | (120,990) | | | $(982,660) | | | (60,194) | | | $(498,374) |
Diversified Bond Fund Class R3 | | | | | | | | | | | | |
Sold | | | 41,577 | | | $333,478 | | | 37,159 | | | $302,631 |
Issued as reinvestment of dividends | | | 10,712 | | | 84,938 | | | 6,176 | | | 50,765 |
Redeemed | | | (62,025) | | | (495,223) | | | (68,163) | | | (552,011) |
Net increase (decrease) | | | (9,736) | | | $(76,807) | | | (24,828) | | | $(198,615) |
Diversified Bond Fund Class Y(a) | | | | | | | | | | | | |
Sold | | | — | | | $— | | | 12,048 | | | $100,000 |
Issued as reinvestment of dividends | | | — | | | — | | | — | | | — |
Redeemed | | | — | | | — | | | — | | | — |
Net increase (decrease) | | | — | | | $— | | | 12,048 | | | $100,000 |
High Yield Fund Class I | | | | | | | | | | | | |
Sold | | | 9,973,913 | | | $ 78,139,793 | | | 9,517,250 | | | $72,296,066 |
Issued as reinvestment of dividends | | | 2,276,415 | | | 17,886,776 | | | 2,114,155 | | | 16,019,963 |
Redeemed | | | (15,723,662) | | | (122,819,264) | | | (8,613,549) | | | (65,181,684) |
Net increase (decrease) | | | (3,473,334) | | | $(26,792,695) | | | 3,017,856 | | | $23,134,345 |
High Yield Fund Class R5 | | | | | | | | | | | | |
Sold | | | 1,333,604 | | | $10,518,463 | | | 670,049 | | | $5,115,989 |
Issued as reinvestment of dividends | | | 321,905 | | | 2,549,781 | | | 281,451 | | | 2,147,064 |
Redeemed | | | (1,251,030) | | | (9,874,778) | | | (1,288,207) | | | (9,806,141) |
Net increase (decrease) | | | 404,479 | | | $3,193,466 | | | (336,707) | | | $(2,543,088) |
High Yield Fund Service Class | | | | | | | | | | | | |
Sold | | | 508,155 | | | $3,998,865 | | | 538,228 | | | $4,102,334 |
Issued as reinvestment of dividends | | | 178,730 | | | 1,414,174 | | | 182,294 | | | 1,391,633 |
Redeemed | | | (1,149,314) | | | (9,058,170) | | | (981,296) | | | (7,499,534) |
Net increase (decrease) | | | (462,429) | | | $(3,645,131) | | | (260,774) | | | $(2,005,567) |
High Yield Fund Administrative Class | | | | | | | | | | | | |
Sold | | | 574,816 | | | $4,416,385 | | | 330,962 | | | $2,484,159 |
Issued as reinvestment of dividends | | | 116,929 | | | 909,388 | | | 107,348 | | | 804,819 |
Redeemed | | | (866,026) | | | (6,780,469) | | | (538,203) | | | (4,022,817) |
Net increase (decrease) | | | (174,281) | | | $(1,454,696) | | | (99,893) | | | $(733,839) |
High Yield Fund Class R4 | | | | | | | | | | | | |
Sold | | | 575,964 | | | $4,395,830 | | | 635,653 | | | $4,681,214 |
Issued as reinvestment of dividends | | | 144,406 | | | 1,102,843 | | | 192,337 | | | 1,415,316 |
Redeemed | | | (964,097) | | | (7,327,241) | | | (2,835,194) | | | (20,862,756) |
Net increase (decrease) | | | (243,727) | | | $(1,828,568) | | | (2,007,204) | | | $(14,766,226) |
High Yield Fund Class A | | | | | | | | | | | | |
Sold | | | 117,247 | | | $904,635 | | | 173,441 | | | $1,300,822 |
Issued as reinvestment of dividends | | | 58,406 | | | 453,807 | | | 65,518 | | | 490,973 |
Redeemed | | | (296,232) | | | (2,296,493) | | | (441,045) | | | (3,311,235) |
Net increase (decrease) | | | (120,579) | | | $(938,051) | | | (202,086) | | | $(1,519,440) |
| | | | | | | | | | | | | |
TABLE OF CONTENTS
| | Notes to Financial Statements (Continued) | |
| | | | | | | |
High Yield Fund Class R3 | | | | | | | | | | | | |
Sold | | | 1,009,872 | | | $7,932,833 | | | 541,261 | | | $4,114,615 |
Issued as reinvestment of dividends | | | 203,436 | | | 1,603,529 | | | 183,609 | | | 1,393,522 |
Redeemed | | | (908,993) | | | (7,110,596) | | | (1,046,525) | | | (7,950,222) |
Net increase (decrease) | | | 304,315 | | | $2,425,766 | | | (321,655) | | | $(2,442,085) |
High Yield Fund Class Y | | | | | | | | | | | | |
Sold | | | 693,625 | | | $5,502,406 | | | 1,295,544 | | | $9,852,336 |
Issued as reinvestment of dividends | | | 236,742 | | | 1,863,290 | | | 224,851 | | | 1,709,275 |
Redeemed | | | (1,699,346) | | | (13,246,411) | | | (856,847) | | | (6,479,358) |
Net increase (decrease) | | | (768,979) | | | $(5,880,715) | | | 663,548 | | | $5,082,253 |
Issued as reinvestment of dividends | | | — | | | — | | | — | | | — |
High Yield Fund Class C | | | | | | | | | | | | |
Sold | | | 8,348 | | | $67,594 | | | 1,654 | | | $12,500 |
Issued as reinvestment of dividends | | | 155 | | | 1,238 | | | 49 | | | 373 |
Redeemed | | | — | | | — | | | — | | | — |
Net increase (decrease) | | | 8,503 | | | $68,832 | | | 1,703 | | | $12,873 |
Balanced Fund Class I | | | | | | | | | | | | |
Sold | | | 671,188 | | | $ 7,783,823 | | | 402,605 | | | $ 4,207,009 |
Issued as reinvestment of dividends | | | 65,903 | | | 723,616 | | | 80,117 | | | 834,824 |
Redeemed | | | (1,203,803) | | | (14,018,547) | | | (1,438,957) | | | (15,094,805) |
Net increase (decrease) | | | (466,712) | | | $(5,511,108) | | | (956,235) | | | $(10,052,972) |
Balanced Fund Class R5 | | | | | | | | | | | | |
Sold | | | 191,480 | | | $2,236,042 | | | 326,720 | | | $3,419,792 |
Issued as reinvestment of dividends | | | 36,048 | | | 396,171 | | | 48,539 | | | 506,260 |
Redeemed | | | (792,915) | | | (8,908,778) | | | (906,601) | | | (9,565,534) |
Net increase (decrease) | | | (565,387) | | | $(6,276,565) | | | (531,342) | | | $(5,639,482) |
Balanced Fund Service Class | | | | | | | | | | | | |
Sold | | | 49,878 | | | $619,716 | | | 42,348 | | | $466,643 |
Issued as reinvestment of dividends | | | 10,948 | | | 130,066 | | | 10,187 | | | 114,812 |
Redeemed | | | (86,691) | | | (1,079,737) | | | (76,394) | | | (841,265) |
Net increase (decrease) | | | (25,865) | | | $(329,955) | | | (23,859) | | | $(259,810) |
Balanced Fund Administrative Class | | | | | | | | | | | | |
Sold | | | 13,779 | | | $162,336 | | | 71,091 | | | $749,507 |
Issued as reinvestment of dividends | | | 4,877 | | | 53,892 | | | 8,677 | | | 91,105 |
Redeemed | | | (253,133) | | | (2,914,646) | | | (427,218) | | | (4,351,312) |
Net increase (decrease) | | | (234,477) | | | $(2,698,418) | | | (347,450) | | | $(3,510,700) |
Balanced Fund Class R4 | | | | | | | | | | | | |
Sold | | | 60,579 | | | $669,481 | | | 48,939 | | | $486,930 |
Issued as reinvestment of dividends | | | 7,288 | | | 76,162 | | | 6,588 | | | 65,417 |
Redeemed | | | (134,493) | | | (1,516,563) | | | (58,010) | | | (577,657) |
Net increase (decrease) | | | (66,626) | | | $(770,920) | | | (2,483) | | | $(25,310) |
| | | | | | | | | | | | | |
TABLE OF CONTENTS
| | Notes to Financial Statements (Continued) | |
| | | | | | | |
Balanced Fund Class A | | | | | | | | | | | | |
Sold | | | 69,455 | | | $777,010 | | | 66,980 | | | $678,343 |
Issued as reinvestment of dividends | | | 14,784 | | | 157,001 | | | 16,572 | | | 167,048 |
Redeemed | | | (244,351) | | | (2,777,183) | | | (308,524) | | | (3,105,917) |
Net increase (decrease) | | | (160,112) | | | $(1,843,172) | | | (224,972) | | | $(2,260,526) |
Balanced Fund Class R3 | | | | | | | | | | | | |
Sold | | | 177,539 | | | $2,010,099 | | | 92,234 | | | $908,007 |
Issued as reinvestment of dividends | | | 10,868 | | | 112,924 | | | 11,037 | | | 108,827 |
Redeemed | | | (144,791) | | | (1,575,209) | | | (232,080) | | | (2,277,745) |
Net increase (decrease) | | | 43,616 | | | $547,814 | | | (128,809) | | | $(1,260,911) |
Balanced Fund Class Y(a) | | | | | | | | | | | | |
Sold | | | — | | | $— | | | 9,488 | | | $100,000 |
Issued as reinvestment of dividends | | | — | | | — | | | — | | | — |
Redeemed | | | — | | | — | | | — | | | — |
Net increase (decrease) | | | — | | | $— | | | 9,488 | | | $100,000 |
Disciplined Value Fund Class I | | | | | | | | | | | | |
Sold | | | 30,961 | | | $ 413,699 | | | 160,298 | | | $ 2,114,750 |
Issued as reinvestment of dividends | | | 50,973 | | | 632,068 | | | 213,307 | | | 2,730,325 |
Redeemed | | | (1,474,328) | | | (18,441,031) | | | (345,549) | | | (4,587,160) |
Net increase (decrease) | | | (1,392,394) | | | $(17,395,264) | | | 28,056 | | | $257,915 |
Disciplined Value Fund Class R5 | | | | | | | | | | | | |
Sold | | | 71,527 | | | $966,096 | | | 100,002 | | | $1,295,405 |
Issued as reinvestment of dividends | | | 89,117 | | | 1,110,403 | | | 158,675 | | | 2,040,561 |
Redeemed | | | (686,828) | | | (9,151,620) | | | (450,410) | | | (5,930,322) |
Net increase (decrease) | | | (526,184) | | | $(7,075,121) | | | (191,733) | | | $(2,594,356) |
Disciplined Value Fund Service Class | | | | | | | | | | | | |
Sold | | | 14,268 | | | $188,560 | | | 95,787 | | | $1,235,838 |
Issued as reinvestment of dividends | | | 59,591 | | | 732,368 | | | 102,366 | | | 1,301,070 |
Redeemed | | | (323,469) | | | (4,333,250) | | | (351,576) | | | (4,498,251) |
Net increase (decrease) | | | (249,610) | | | $(3,412,322) | | | (153,423) | | | $(1,961,343) |
Disciplined Value Fund Administrative Class | | | | | | | | | | | | |
Sold | | | 8,600 | | | $118,333 | | | 12,020 | | | $159,160 |
Issued as reinvestment of dividends | | | 4,754 | | | 60,562 | | | 9,109 | | | 119,698 |
Redeemed | | | (49,395) | | | (656,503) | | | (12,920) | | | (172,950) |
Net increase (decrease) | | | (36,041) | | | $(477,608) | | | 8,209 | | | $105,908 |
Disciplined Value Fund Class R4 | | | | | | | | | | | | |
Sold | | | 15,534 | | | $202,860 | | | 12,931 | | | $157,000 |
Issued as reinvestment of dividends | | | 1,028 | | | 12,495 | | | 11,124 | | | 137,935 |
Redeemed | | | (13,097) | | | (163,574) | | | (102,130) | | | (1,293,231) |
Net increase (decrease) | | | 3,465 | | | $51,781 | | | (78,075) | | | $(998,296) |
Disciplined Value Fund Class A | | | | | | | | | | | | |
Sold | | | 15,899 | | | $208,916 | | | 29,966 | | | $376,226 |
Issued as reinvestment of dividends | | | 23,642 | | | 286,779 | | | 34,858 | | | 437,463 |
Redeemed | | | (128,910) | | | (1,694,410) | | | (85,135) | | | (1,063,109) |
Net increase (decrease) | | | (89,369) | | | $(1,198,715) | | | (20,311) | | | $(249,420) |
| | | | | | | | | | | | | |
TABLE OF CONTENTS
| | Notes to Financial Statements (Continued) | |
| | | | | | | |
Disciplined Value Fund Class R3 | | | | | | | | | | | | |
Sold | | | 12,769 | | | $172,906 | | | 54,618 | | | $693,029 |
Issued as reinvestment of dividends | | | 9,417 | | | 116,304 | | | 30,556 | | | 388,059 |
Redeemed | | | (55,922) | | | (777,933) | | | (247,634) | | | (3,249,112) |
Net increase (decrease) | | | (33,736) | | | $(488,723) | | | (162,460) | | | $(2,168,024) |
Disciplined Value Fund Class Y(a) | | | | | | | | | | | | |
Sold | | | — | | | $— | | | 7,547 | | | $100,000 |
Issued as reinvestment of dividends | | | — | | | — | | | — | | | — |
Redeemed | | | — | | | — | | | — | | | — |
Net increase (decrease) | | | — | | | $— | | | 7,547 | | | $100,000 |
Disciplined Growth Fund Class I | | | | | | | | | | | | |
Sold | | | 580,233 | | | $ 6,308,491 | | | 1,991,204 | | | $ 17,545,608 |
Issued as reinvestment of dividends | | | 172,213 | | | 1,615,353 | | | 119,500 | | | 916,567 |
Redeemed | | | (1,232,454) | | | (13,470,238) | | | (687,698) | | | (5,780,020) |
Net increase (decrease) | | | (480,008) | | | $(5,546,394) | | | 1,423,006 | | | $12,682,155 |
Disciplined Growth Fund Class R5 | | | | | | | | | | | | |
Sold | | | 1,594,697 | | | $17,053,699 | | | 1,587,489 | | | $13,334,596 |
Issued as reinvestment of dividends | | | 375,007 | | | 3,517,567 | | | 487,693 | | | 3,740,607 |
Redeemed | | | (1,790,030) | | | (19,203,826) | | | (3,543,488) | | | (30,213,080) |
Net increase (decrease) | | | 179,674 | | | $1,367,440 | | | (1,468,306) | | | $(13,137,877) |
Disciplined Growth Fund Service Class | | | | | | | | | | | | |
Sold | | | 46,351 | | | $511,975 | | | 330,059 | | | $2,888,674 |
Issued as reinvestment of dividends | | | 37,760 | | | 356,459 | | | 92,189 | | | 712,618 |
Redeemed | | | (796,882) | | | (7,925,257) | | | (909,846) | | | (7,842,681) |
Net increase (decrease) | | | (712,771) | | | $(7,056,823) | | | (487,598) | | | $(4,241,389) |
Disciplined Growth Fund Administrative Class | | | | | | | | | | | | |
Sold | | | 225,287 | | | $2,501,040 | | | 254,222 | | | $2,075,512 |
Issued as reinvestment of dividends | | | 90,709 | | | 877,160 | | | 143,201 | | | 1,134,152 |
Redeemed | | | (768,113) | | | (8,638,535) | | | (1,316,882) | | | (10,575,413) |
Net increase (decrease) | | | (452,117) | | | $(5,260,335) | | | (919,459) | | | $(7,365,749) |
Disciplined Growth Fund Class R4 | | | | | | | | | | | | |
Sold | | | 90,460 | | | $877,707 | | | 82,823 | | | $641,231 |
Issued as reinvestment of dividends | | | 34,187 | | | 300,501 | | | 42,197 | | | 305,507 |
Redeemed | | | (237,807) | | | (2,116,714) | | | (253,639) | | | (1,933,624) |
Net increase (decrease) | | | (113,160) | | | $(938,506) | | | (128,619) | | | $(986,886) |
Disciplined Growth Fund Class A | | | | | | | | | | | | |
Sold | | | 38,911 | | | $385,988 | | | 182,991 | | | $1,455,844 |
Issued as reinvestment of dividends | | | 44,996 | | | 402,264 | | | 101,112 | | | 744,187 |
Redeemed | | | (334,282) | | | (3,531,316) | | | (1,320,431) | | | (10,770,423) |
Net increase (decrease) | | | (250,375) | | | $(2,743,064) | | | (1,036,328) | | | $(8,570,392) |
Disciplined Growth Fund Class R3 | | | | | | | | | | | | |
Sold | | | 152,799 | | | $1,421,413 | | | 94,731 | | | $730,073 |
Issued as reinvestment of dividends | | | 25,313 | | | 219,465 | | | 28,906 | | | 206,964 |
Redeemed | | | (224,509) | | | (2,143,000) | | | (145,268) | | | (1,115,633) |
Net increase (decrease) | | | (46,397) | | | $(502,122) | | | (21,631) | | | $(178,596) |
| | | | | | | | | | | | | |
TABLE OF CONTENTS
| | Notes to Financial Statements (Continued) | |
| | | | | | | |
Disciplined Growth Fund Class Y(a) | | | | | | | | | | | | |
Sold | | | — | | | $— | | | 12,674 | | | $100,000 |
Issued as reinvestment of dividends | | | — | | | — | | | — | | | — |
Redeemed | | | — | | | — | | | — | | | — |
Net increase (decrease) | | | — | | | $— | | | 12,674 | | | $100,000 |
Small Cap Opportunities Fund Class I | | | | | | | | | | | | |
Sold | | | 4,887,364 | | | $ 84,693,519 | | | 2,125,146 | | | $ 34,048,068 |
Issued as reinvestment of dividends | | | 410,985 | | | 6,551,095 | | | 90,919 | | | 1,438,337 |
Redeemed | | | (1,868,901) | | | (32,055,080) | | | (990,262) | | | (15,760,296) |
Net increase (decrease) | | | 3,429,448 | | | $59,189,534 | | | 1,225,803 | | | $19,726,109 |
Small Cap Opportunities Fund Class R5 | | | | | | | | | | | | |
Sold | | | 1,012,140 | | | $17,156,946 | | | 1,224,245 | | | $19,537,458 |
Issued as reinvestment of dividends | | | 326,606 | | | 5,186,500 | | | 89,462 | | | 1,410,819 |
Redeemed | | | (2,277,989) | | | (38,832,987) | | | (1,779,536) | | | (28,551,956) |
Net increase (decrease) | | | (939,243) | | | $(16,489,541) | | | (465,829) | | | $(7,603,679) |
Small Cap Opportunities Fund Service Class | | | | | | | | | | | | |
Sold | | | 267,411 | | | $4,634,922 | | | 183,329 | | | $2,894,968 |
Issued as reinvestment of dividends | | | 48,443 | | | 766,370 | | | 13,174 | | | 207,096 |
Redeemed | | | (440,624) | | | (7,540,525) | | | (323,049) | | | (5,271,747) |
Net increase (decrease) | | | (124,770) | | | $(2,139,233) | | | (126,546) | | | $(2,169,683) |
Small Cap Opportunities Fund Administrative Class | | | | | | | | | | | | |
Sold | | | 137,876 | | | $2,328,248 | | | 190,252 | | | $2,982,584 |
Issued as reinvestment of dividends | | | 66,093 | | | 1,035,678 | | | 15,549 | | | 242,408 |
Redeemed | | | (391,590) | | | (6,638,096) | | | (280,329) | | | (4,409,438) |
Net increase (decrease) | | | (187,621) | | | $(3,274,170) | | | (74,528) | | | $(1,184,446) |
Small Cap Opportunities Fund Class R4 | | | | | | | | | | | | |
Sold | | | 203,916 | | | $3,280,928 | | | 213,779 | | | $3,287,991 |
Issued as reinvestment of dividends | | | 48,085 | | | 720,788 | | | 8,582 | | | 128,301 |
Redeemed | | | (471,631) | | | (7,809,628) | | | (176,570) | | | (2,687,284) |
Net increase (decrease) | | | (219,630) | | | $(3,807,912) | | | 45,791 | | | $729,008 |
Small Cap Opportunities Fund Class A | | | | | | | | | | | | |
Sold | | | 737,481 | | | $12,401,711 | | | 248,064 | | | $3,752,629 |
Issued as reinvestment of dividends | | | 120,050 | | | 1,811,552 | | | 23,762 | | | 357,851 |
Redeemed | | | (915,027) | | | (15,055,058) | | | (718,089) | | | (10,871,931) |
Net increase (decrease) | | | (57,496) | | | $(841,795) | | | (446,263) | | | $(6,761,451) |
Small Cap Opportunities Fund Class R3 | | | | | | | | | | | | |
Sold | | | 167,303 | | | $2,691,628 | | | 150,038 | | | $2,207,862 |
Issued as reinvestment of dividends | | | 27,588 | | | 406,374 | | | 4,197 | | | 61,858 |
Redeemed | | | (163,135) | | | (2,619,517) | | | (175,026) | | | (2,604,169) |
Net increase (decrease) | | | 31,756 | | | $478,485 | | | (20,791) | | | $(334,449) |
Small Cap Opportunities Fund Class Y(a) | | | | | | | | | | | | |
Sold | | | 54,818 | | | $973,126 | | | 5,999 | | | $100,000 |
Issued as reinvestment of dividends | | | — | | | — | | | — | | | — |
Redeemed | | | (318) | | | (5,842) | | | — | | | — |
Net increase (decrease) | | | 54,500 | | | $967,284 | | | 5,999 | | | $100,000 |
| | | | | | | | | | | | | |
TABLE OF CONTENTS
| | Notes to Financial Statements (Continued) | |
| | | | | | | |
Global Fund Class I | | | | | | | | | | | | |
Sold | | | 1,352,524 | | | $ 15,021,235 | | | 1,102,378 | | | $ 12,353,755 |
Issued as reinvestment of dividends | | | 1,223,585 | | | 11,440,516 | | | 1,260,937 | | | 12,546,325 |
Redeemed | | | (2,139,962) | | | (22,984,798) | | | (3,290,838) | | | (36,692,765) |
Net increase (decrease) | | | 436,147 | | | $3,476,953 | | | (927,523) | | | $(11,792,685) |
Global Fund Class R5 | | | | | | | | | | | | |
Sold | | | 593,914 | | | $6,419,645 | | | 645,488 | | | $7,045,309 |
Issued as reinvestment of dividends | | | 1,239,479 | | | 11,551,942 | | | 1,398,752 | | | 13,889,612 |
Redeemed | | | (1,401,315) | | | (15,052,191) | | | (3,503,891) | | | (38,563,090) |
Net increase (decrease) | | | 432,078 | | | $2,919,396 | | | (1,459,651) | | | $(17,628,169) |
Global Fund Service Class | | | | | | | | | | | | |
Sold | | | 35,727 | | | $376,909 | | | 62,527 | | | $666,084 |
Issued as reinvestment of dividends | | | 104,492 | | | 950,873 | | | 139,264 | | | 1,359,215 |
Redeemed | | | (119,464) | | | (1,236,223) | | | (391,518) | | | (4,140,473) |
Net increase (decrease) | | | 20,755 | | | $91,559 | | | (189,727) | | | $(2,115,174) |
Global Fund Administrative Class | | | | | | | | | | | | |
Sold | | | 606,577 | | | $6,389,348 | | | 418,778 | | | $4,545,409 |
Issued as reinvestment of dividends | | | 1,261,602 | | | 11,606,738 | | | 1,109,178 | | | 10,936,495 |
Redeemed | | | (2,300,552) | | | (24,601,703) | | | (1,190,790) | | | (12,776,262) |
Net increase (decrease) | | | (432,373) | | | $(6,605,617) | | | 337,166 | | | $2,705,642 |
Global Fund Class R4 | | | | | | | | | | | | |
Sold | | | 154,938 | | | $1,546,621 | | | 167,991 | | | $1,684,423 |
Issued as reinvestment of dividends | | | 271,463 | | | 2,340,010 | | | 223,404 | | | 2,097,768 |
Redeemed | | | (359,457) | | | (3,543,128) | | | (377,560) | | | (3,879,123) |
Net increase (decrease) | | | 66,944 | | | $343,503 | | | 13,835 | | | $(96,932) |
Global Fund Class A | | | | | | | | | | | | |
Sold | | | 107,448 | | | $1,082,392 | | | 78,631 | | | $835,675 |
Issued as reinvestment of dividends | | | 313,958 | | | 2,775,390 | | | 227,397 | | | 2,178,460 |
Redeemed | | | (270,771) | | | (2,753,782) | | | (172,701) | | | (1,770,793) |
Net increase (decrease) | | | 150,635 | | | $1,104,000 | | | 133,327 | | | $1,243,342 |
Global Fund Class R3 | | | | | | | | | | | | |
Sold | | | 199,818 | | | $1,984,919 | | | 110,963 | | | $1,133,941 |
Issued as reinvestment of dividends | | | 218,703 | | | 1,893,964 | | | 198,231 | | | 1,873,279 |
Redeemed | | | (241,345) | | | (2,422,176) | | | (369,375) | | | (3,825,407) |
Net increase (decrease) | | | 177,176 | | | $1,456,707 | | | (60,181) | | | $(818,187) |
International Equity Fund Class I | | | | | | | | | | | | |
Sold | | | 1,094,378 | | | $ 9,163,451 | | | 2,992,094 | | | $ 24,516,587 |
Issued as reinvestment of dividends | | | 303,716 | | | 2,460,099 | | | 526,310 | | | 4,199,952 |
Redeemed | | | (2,458,718) | | | (20,772,858) | | | (3,940,341) | | | (32,337,195) |
Net increase (decrease) | | | (1,060,624) | | | $(9,149,308) | | | (421,937) | | | $(3,620,656) |
International Equity Fund Class R5 | | | | | | | | | | | | |
Sold | | | 353,938 | | | $2,987,722 | | | 480,617 | | | $3,937,017 |
Issued as reinvestment of dividends | | | 119,965 | | | 972,915 | | | 244,088 | | | 1,950,265 |
Redeemed | | | (1,132,861) | | | (9,392,898) | | | (1,228,457) | | | (10,137,157) |
Net increase (decrease) | | | (658,958) | | | $(5,432,261) | | | (503,752) | | | $(4,249,875) |
| | | | | | | | | | | | | |
TABLE OF CONTENTS
| | Notes to Financial Statements (Continued) | |
| | | | | | | |
International Equity Fund Service Class | | | | | | | | | | | | |
Sold | | | 29,878 | | | $249,652 | | | 99,541 | | | $800,758 |
Issued as reinvestment of dividends | | | 11,822 | | | 95,641 | | | 19,400 | | | 154,615 |
Redeemed | | | (164,818) | | | (1,336,165) | | | (47,077) | | | (360,975) |
Net increase (decrease) | | | (123,118) | | | $(990,872) | | | 71,864 | | | $594,398 |
International Equity Fund Administrative Class | | | | | | | | | | | | |
Sold | | | 29,945 | | | $248,137 | | | 41,651 | | | $335,810 |
Issued as reinvestment of dividends | | | 7,806 | | | 62,526 | | | 17,899 | | | 141,221 |
Redeemed | | | (92,703) | | | (785,789) | | | (140,480) | | | (1,121,857) |
Net increase (decrease) | | | (54,952) | | | $(475,126) | | | (80,930) | | | $(644,826) |
International Equity Fund Class R4 | | | | | | | | | | | | |
Sold | | | 7,861 | | | $60,391 | | | 9,670 | | | $72,500 |
Issued as reinvestment of dividends | | | 2,443 | | | 18,101 | | | 4,591 | | | 33,604 |
Redeemed | | | (10,435) | | | (79,927) | | | (48,725) | | | (371,212) |
Net increase (decrease) | | | (131) | | | $(1,435) | | | (34,464) | | | $(265,108) |
International Equity Fund Class A | | | | | | | | | | | | |
Sold | | | 80,783 | | | $640,012 | | | 174,452 | | | $1,323,495 |
Issued as reinvestment of dividends | | | 41,377 | | | 311,566 | | | 73,155 | | | 543,543 |
Redeemed | | | (303,945) | | | (2,384,198) | | | (265,383) | | | (2,018,177) |
Net increase (decrease) | | | (181,785) | | | $(1,432,620) | | | (17,776) | | | $(151,139) |
International Equity Fund Class R3 | | | | | | | | | | | | |
Sold | | | 60,328 | | | $462,649 | | | 67,506 | | | $494,314 |
Issued as reinvestment of dividends | | | 9,765 | | | 71,282 | | | 18,110 | | | 130,573 |
Redeemed | | | (74,540) | | | (570,105) | | | (91,696) | | | (685,614) |
Net increase (decrease) | | | (4,447) | | | $(36,174) | | | (6,080) | | | $(60,727) |
International Equity Fund Class Y(a) | | | | | | | | | | | | |
Sold | | | — | | | $— | | | 12,092 | | | $100,000 |
Issued as reinvestment of dividends | | | — | | | — | | | — | | | — |
Redeemed | | | — | | | — | | | — | | | — |
Net increase (decrease) | | | — | | | $— | | | 12,092 | | | $100,000 |
Strategic Emerging Markets Fund Class I | | | | | | | | | | | | |
Sold | | | 1,849,568 | | | $ 18,261,125 | | | 1,934,883 | | | $ 18,898,295 |
Issued as reinvestment of dividends | | | 12,170 | | | 116,712 | | | 49,063 | | | 454,812 |
Redeemed | | | (2,783,190) | | | (27,400,933) | | | (4,248,900) | | | (41,795,229) |
Net increase (decrease) | | | (921,452) | | | $(9,023,096) | | | (2,264,954) | | | $(22,442,122) |
Strategic Emerging Markets Fund Class R5 | | | | | | | | | | | | |
Sold | | | 909 | | | $9,215 | | | 3,585 | | | $36,150 |
Issued as reinvestment of dividends | | | 4 | | | 41 | | | — | | | — |
Redeemed | | | (16,211) | | | (162,672) | | | (2,585) | | | (25,217) |
Net increase (decrease) | | | (15,298) | | | $(153,416) | | | 1,000 | | | $10,933 |
Strategic Emerging Markets Fund Service Class | | | | | | | | | | | | |
Sold | | | 38,312 | | | $381,046 | | | 26,748 | | | $262,353 |
Issued as reinvestment of dividends | | | — | | | — | | | 249 | | | 2,309 |
Redeemed | | | (24,504) | | | (248,147) | | | (45,143) | | | (445,046) |
Net increase (decrease) | | | 13,808 | | | $132,899 | | | (18,146) | | | $(180,384) |
| | | | | | | | | | | | | |
TABLE OF CONTENTS
| | Notes to Financial Statements (Continued) | |
| | | | | | | |
Strategic Emerging Markets Fund Administrative Class | | | | | | | | | | | | |
Sold | | | 8,283 | | | $ 81,798 | | | 11,636 | | | $ 111,573 |
Issued as reinvestment of dividends | | | — | | | — | | | 7 | | | 69 |
Redeemed | | | (16,767) | | | (169,137) | | | (9,363) | | | (89,444) |
Net increase (decrease) | | | (8,484) | | | $(87,339) | | | 2,280 | | | $22,198 |
Strategic Emerging Markets Fund Class R4 | | | | | | | | | | | | |
Sold | | | 4,464 | | | $44,053 | | | 5,442 | | | $52,285 |
Issued as reinvestment of dividends | | | — | | | — | | | — | | | — |
Redeemed | | | (2,862) | | | (27,304) | | | (2,181) | | | (21,471) |
Net increase (decrease) | | | 1,602 | | | $16,749 | | | 3,261 | | | $30,814 |
Strategic Emerging Markets Fund Class A | | | | | | | | | | | | |
Sold | | | 503 | | | $5,024 | | | 701 | | | $6,528 |
Issued as reinvestment of dividends | | | — | | | — | | | — | | | — |
Redeemed | | | (10,517) | | | (99,736) | | | (1,403) | | | (13,082) |
Net increase (decrease) | | | (10,014) | | | $(94,712) | | | (702) | | | $(6,554) |
Strategic Emerging Markets Fund Class R3 | | | | | | | | | | | | |
Sold | | | 6,552 | | | $63,540 | | | 7,557 | | | $70,774 |
Issued as reinvestment of dividends | | | — | | | — | | | — | | | — |
Redeemed | | | (13,074) | | | (127,224) | | | (21,492) | | | (206,001) |
Net increase (decrease) | | | (6,522) | | | $(63,684) | | | (13,935) | | | $(135,227) |
| | | | | | | | | | | | | |
(a)
| Commenced operations on February 1, 2023. |
Unless waived, purchases of Class A and Class L shares are subject to a front-end sales charge of up to 5.50% and 2.50%, respectively, of the amount purchased. A portion of the front-end sales charge may be retained by the Distributor. The Distributor retained the following amounts during the year ended September 30, 2024.
| | | | |
Short-Duration Bond Fund | | | $ 5 |
High Yield Fund | | | 676 |
Disciplined Value Fund | | | 6 |
Disciplined Growth Fund | | | 113 |
Global Fund | | | 450 |
| | | | |
Unless waived, redemptions of Class A and Class L shares made within 18 months of purchase from initial investments of $1 million or more are subject to a contingent deferred sales charge of 1.00% (or 0.50% for holders of Class L shares of the Short-Duration Bond Fund prior to February 1, 2024) of the amount redeemed, and redemptions of Class C shares made within 12 months of purchase are subject to a contingent deferred sales charge of 1.00% (or 0.50% for holders of Class C shares of the Short-Duration Bond Fund prior to February 1. 2024) of the amount redeemed. The Distributor receives all contingent deferred sales charges. For the period ended September 30, 2024, no amounts have been retained by the Distributor.
With respect to Class A, Class L, and Class C shares, the Distributor may pay an up-front concession or commission to financial intermediaries through which sales are made as described in the Funds’ Prospectus.
TABLE OF CONTENTS
| | Notes to Financial Statements (Continued) | |
6. Federal Income Tax Information
At September 30, 2024, the aggregate cost of investments and the unrealized appreciation (depreciation) in the value of all investments owned by the Fund(s), as computed on a U.S. federal income tax basis, were as follows:
| | | | | | | | | | | | | |
U.S. Government Money Market Fund | | | $175,014,800 | | | $— | | | $— | | | $— |
Short-Duration Bond Fund | | | 162,276,266 | | | 1,797,091 | | | (7,400,802) | | | (5,603,711) |
Inflation-Protected and Income Fund | | | 246,866,933 | | | 8,561,306 | | | (4,412,478) | | | 4,148,828 |
Core Bond Fund | | | 1,255,988,085 | | | 10,572,794 | | | (45,002,194) | | | (34,429,400) |
Diversified Bond Fund | | | 158,436,682 | | | 1,871,604 | | | (9,750,584) | | | (7,878,980) |
High Yield Fund | | | 435,205,777 | | | 10,302,163 | | | (6,467,379) | | | 3,834,784 |
Balanced Fund | | | 97,317,776 | | | 16,154,473 | | | (3,133,166) | | | 13,021,307 |
Disciplined Value Fund | | | 32,691,107 | | | 7,250,185 | | | (717,126) | | | 6,533,059 |
Disciplined Growth Fund | | | 147,948,233 | | | 51,739,146 | | | (1,862,227) | | | 49,876,919 |
Small Cap Opportunities Fund | | | 355,451,299 | | | 92,397,034 | | | (11,437,764) | | | 80,959,270 |
Global Fund | | | 100,100,132 | | | 93,550,614 | | | (1,000,614) | | | 92,550,000 |
International Equity Fund | | | 109,542,174 | | | 16,951,515 | | | (4,789,343) | | | 12,162,172 |
Strategic Emerging Markets Fund | | | 95,254,691 | | | 14,503,402 | | | (3,326,222) | | | 11,177,180 |
| | | | | | | | | | | | | |
Note: The aggregate cost for investments for the U.S. Government Money Market Fund at September 30, 2024, is the same for financial reporting and U.S. federal income tax purposes.
Net capital loss carryforwards may be applied against any net realized taxable gains in succeeding years. Capital losses may be carried forward indefinitely, and retain the character of the original loss.
At September 30, 2024, the following Fund(s) had accumulated capital loss carryforwards:
| | | | | | | |
Short-Duration Bond Fund* | | | $(55,697,023) | | | $(102,403,309) |
Inflation-Protected and Income Fund | | | (28,817,986) | | | (7,733,519) |
Core Bond Fund* | | | (36,854,242) | | | (135,302,352) |
Diversified Bond Fund | | | (7,361,227) | | | (17,549,778) |
High Yield Fund* | | | (6,808,196) | | | (63,916,532) |
Strategic Emerging Markets Fund | | | (10,799,613) | | | (13,201,831) |
| | | | | | | |
*
| A portion of these amounts are subject to IRC 382-383 which is carried forward to future years to offset future realized gains subject to certain limitations. |
The following Fund(s) elected to defer to the fiscal year beginning October 1, 2024, late year ordinary losses:
| | | | |
Short-Duration Bond Fund | | | $259,947 |
Core Bond Fund | | | 1,018,362 |
Diversified Bond Fund | | | 313,215 |
Global Fund | | | 572,667 |
| | | | |
Generally accepted accounting principles in the United States of America require that only distributions in excess of tax basis earnings and profits be reported in the financial statements as a return of capital.
TABLE OF CONTENTS
| | Notes to Financial Statements (Continued) | |
The tax character of distributions (including capital gain dividends, if any, designated pursuant to Section 852 of the Code) paid during the year ended September 30, 2024, was as follows:
| | | | | | | | | | |
U.S. Government Money Market Fund | | | $8,744,012 | | | $— | | | $— |
Short-Duration Bond Fund | | | 6,593,150 | | | — | | | — |
Inflation-Protected and Income Fund | | | 15,608,488 | | | — | | | — |
Core Bond Fund | | | 53,785,698 | | | — | | | — |
Diversified Bond Fund | | | 11,194,865 | | | — | | | — |
High Yield Fund | | | 27,803,807 | | | — | | | — |
Balanced Fund | | | 1,651,677 | | | — | | | — |
Disciplined Value Fund | | | 2,481,158 | | | 476,997 | | | — |
Disciplined Growth Fund | | | 29,373 | | | 7,264,745 | | | — |
Small Cap Opportunities Fund | | | 4,065,364 | | | 12,543,509 | | | — |
Global Fund | | | — | | | 43,645,322 | | | — |
International Equity Fund | | | 2,357,219 | | | 1,639,016 | | | — |
Strategic Emerging Markets Fund | | | 116,768 | | | — | | | — |
| | | | | | | | | | |
The tax character of distributions (including capital gain dividends, if any, designated pursuant to Section 852 of the Code) paid during the year ended September 30, 2023, was as follows:
| | | | | | | | | | |
U.S. Government Money Market Fund | | | $ 7,696,593 | | | $— | | | $ — |
Short-Duration Bond Fund | | | 10,912,538 | | | — | | | 129,022 |
Inflation-Protected and Income Fund | | | 10,873,910 | | | — | | | — |
Core Bond Fund | | | 27,416,673 | | | — | | | — |
Diversified Bond Fund | | | 6,419,858 | | | — | | | — |
High Yield Fund | | | 25,396,630 | | | — | | | — |
Balanced Fund | | | 1,888,356 | | | — | | | — |
Disciplined Value Fund | | | 4,145,423 | | | 3,009,709 | | | — |
Disciplined Growth Fund | | | 125,279 | | | 7,635,323 | | | — |
Small Cap Opportunities Fund | | | 2,402,349 | | | 1,474,654 | | | — |
Global Fund | | | — | | | 44,885,053 | | | — |
International Equity Fund | | | 1,563,956 | | | 5,591,169 | | | — |
Strategic Emerging Markets Fund | | | 457,190 | | | — | | | — |
| | | | | | | | | | |
The following Fund(s) have elected to pass through the foreign tax credit for the year ended September 30, 2024:
| | | | |
International Equity Fund | | | $205,805 |
Strategic Emerging Markets Fund | | | 621,034 |
| | | | |
TABLE OF CONTENTS
| | Notes to Financial Statements (Continued) | |
Capital accounts within the financial statements are periodically adjusted for permanent differences between book and tax accounting. These adjustments have no impact on net assets or the results of operations. Temporary book and tax accounting differences will reverse in subsequent periods. At September 30, 2024, temporary book and tax accounting differences were primarily attributable to the deferral of wash sale losses, deferred trustee compensation, and other temporary basis adjustments.
At September 30, 2024, the components of distributable earnings on a tax basis were as follows:
| | | | | | | | | | | | | | | | |
U.S. Government Money Market Fund | | | $— | | | $— | | | $(24,717) | | | $— | | | $(24,717) |
Short-Duration Bond Fund | | | — | | | (158,360,279) | | | (39,586) | | | (5,603,707) | | | (164,003,572) |
Inflation-Protected and Income Fund | | | 93,008 | | | (36,551,505) | | | (15,178) | | | 4,148,828 | | | (32,324,847) |
Core Bond Fund | | | — | | | (173,174,956) | | | (106,112) | | | (34,428,725) | | | (207,709,793) |
Diversified Bond Fund | | | — | | | (25,249,820) | | | (9,807) | | | (7,878,389) | | | (33,138,016) |
High Yield Fund | | | 239,486 | | | (70,724,728) | | | (16,810) | | | 3,808,808 | | | (66,693,244) |
Balanced Fund | | | 1,304,978 | | | 4,113,486 | | | (8,094) | | | 13,021,307 | | | 18,431,677 |
Disciplined Value Fund | | | 1,022,712 | | | 2,510,868 | | | (12,108) | | | 6,533,059 | | | 10,054,531 |
Disciplined Growth Fund | | | 6,854,144 | | | 21,950,178 | | | (15,483) | | | 49,876,919 | | | 78,665,758 |
Small Cap Opportunities Fund | | | 1,843,812 | | | 34,133,492 | | | (12,675) | | | 80,959,255 | | | 116,923,884 |
Global Fund | | | — | | | 21,126,903 | | | (17,744) | | | 91,406,072 | | | 112,515,231 |
International Equity Fund | | | 1,961,391 | | | 3,237,441 | | | (28,533) | | | 12,180,811 | | | 17,351,110 |
Strategic Emerging Markets Fund | | | 44,519 | | | (24,001,444) | | | (7,823) | | | 10,613,765 | | | (13,350,983) |
| | | | | | | | | | | | | | | | |
The Funds did not have any unrecognized tax benefits at September 30, 2024, nor were there any increases or decreases in unrecognized tax benefits for the year then ended. The Funds recognize interest and penalties, if any, related to unrecognized tax benefits as an income tax expense in the Statements of Operations. During the year ended September 30, 2024, the Funds did not incur any such interest or penalties. The Funds are subject to examination by U.S. federal and state tax authorities for returns filed for the prior three fiscal years. Foreign taxes are provided for based on the Funds’ understanding of the tax rules and rates that exist in the foreign markets in which they invest.
7. Acquisition of MassMutual Strategic Bond Fund
Effective September 23, 2024, the MassMutual Strategic Bond Fund (“Strategic Bond Fund”) reorganized into the Core Bond Fund, pursuant to the terms of an Agreement and Plan of Reorganization.
TABLE OF CONTENTS
| | Notes to Financial Statements (Continued) | |
The Strategic Bond Fund’s assets and liabilities were transferred to the Core Bond Fund in return for shares of the Core Bond Fund. The Reorganization of the Strategic Bond Fund into the Core Bond Fund was intended to enable shareholders of the Strategic Bond Fund to invest in a larger, potentially more efficient portfolio while continuing to pursue a comparable investment objective. The acquisition was accomplished by a tax-free exchange of shares of the Core Bond Fund in the following amounts:
| | | | | | | | | | | | | | | | |
Class I | | | 30,876,487 | | | 0.941885 | | | $271,626,832 | | | Class I | | | 29,082,100 |
Class R5 | | | 5,621,408 | | | 0.939220 | | | 49,523,959 | | | Class R5 | | | 5,279,738 |
Service Class | | | 1,155,570 | | | 0.945864 | | | 10,197,808 | | | Service Class | | | 1,093,012 |
Administrative Class | | | 1,314,393 | | | 0.953872 | | | 11,572,229 | | | Administrative Class | | | 1,253,763 |
Class R4 | | | 1,951,447 | | | 0.957257 | | | 17,073,857 | | | Class R4 | | | 1,868,036 |
Class A | | | 1,015,199 | | | 0.958533 | | | 8,942,805 | | | Class A | | | 973,102 |
Class R3 | | | 458,991 | | | 0.908941 | | | 3,988,392 | | | Class R3 | | | 417,196 |
Class Y | | | 11,136 | | | 0.939022 | | | 98,085 | | | Class Y | | | 10,457 |
| | | 42,404,631 | | | | | | $373,023,967 | | | | | | 39,977,404 |
| | | | | | | | | | | | | | | | |
The investment portfolio of the Strategic Bond Fund, with a value of $ 372,304,718 in investments and a cost basis of $368,548,436 at September 20, 2024, was the principal asset acquired by the Core Bond Fund.
For financial reporting purposes, assets received and shares issued by the Core Bond Fund were recorded at fair value; however, the cost basis of the investments received from the Strategic Bond Fund was carried forward to align ongoing reporting of the Core Bond Fund’s realized and unrealized gains and losses with amounts distributable to shareholders for U.S. federal income tax purposes. Immediately prior to the acquisition, the Core Bond Fund’s net assets were $ 668,696,828.
Assuming the acquisition had been completed on October 1, 2023, the beginning of the annual reporting period of the Core Bond Fund, the Core Bond Fund’s pro forma results of operations for the twelve month period ended September 30, 2024, would have been as follows:
| | | | |
Net investment income (loss) | | | $ 48,551,172 |
Net realized and unrealized gain (loss) on investments | | | 85,835,269 |
Net increase (decrease) in net assets resulting from operations | | | 134,386,441 |
| | | | |
Because both the Strategic Bond Fund and the Core Bond Fund continuously sold and redeemed shares throughout the period, it is not practicable to provide pro-forma information on a per-share basis.
Because the combined investment portfolios have been managed as a single integrated portfolio since the acquisition was completed, it is also not practicable to separate the amounts of revenue and earnings of the Strategic Bond Fund that have been included in the Core Bond Fund’s Statements of Operations since September 23, 2024.
See Note 5, Capital Share Transactions, for the changes in shares outstanding for the Core Bond Fund during the period.
TABLE OF CONTENTS
| | Notes to Financial Statements (Continued) | |
8. Indemnifications
Under the Funds’ organizational documents, current and former Trustees and Officers are provided with specified rights to indemnification against liabilities arising in connection with the performance of their duties to the Funds, and shareholders are indemnified against personal liability for obligations of the Funds. In the normal course of business, the Funds may also enter into contracts that provide general indemnifications. The Funds’ maximum exposure under these arrangements is unknown as this would be dependent on future claims that may be made against the Funds. The risk of material loss from such claims is considered remote.
9. New Accounting Pronouncements
In December 2022, FASB issued Accounting Standards Update 2022-06, “Reference Rate Reform (Topic 848): Deferral of the Sunset Date of Topic 848” (“ASU 2022-06”). ASU 2022-06 is an update of ASU 2020-04, which responded to concerns about structural risks of interbank offered rates, and particularly the risk of cessation of LIBOR. ASU 2020-04 provides optional guidance for a limited period of time to ease the potential burden in accounting for (or recognizing the effects of) reference rate reform on financial reporting. ASU 2020-04 is elective and applies to all entities, subject to meeting certain criteria, that have contracts, hedging relationships, and other transactions that reference LIBOR or another reference rate expected to be discontinued because of reference rate reform. ASU 2022-06 defers the sunset date provision included in Topic 848. The amendments in this update are effective immediately through December 31, 2024, for all entities. Management has evaluated ASU 2022-06 and there is no material impact on the financial statements.
10. Upcoming Fund Liquidations
The Trustees have approved Plans of Liquidation and Termination pursuant to which it is expected that the Disciplined Value Fund and Strategic Emerging Markets Fund (each, a “Fund”) will be dissolved. Effective on or about January 24, 2025 (the “Termination Date”), shareholders of the various classes of shares of each Fund will receive proceeds in proportion to the number of shares of such class held by each of them on the Termination Date.
TABLE OF CONTENTS
| | | |
| | Report of Independent Registered Public Accounting Firm | |
| | | |
To the Board of Trustees of MassMutual Premier Funds and Shareholders of MassMutual U.S. Government Money Market Fund, MassMutual Short-Duration Bond Fund, MassMutual Inflation-Protected and Income Fund, MassMutual Core Bond Fund, MassMutual Diversified Bond Fund, MassMutual High Yield Fund, MassMutual Balanced Fund, MassMutual Disciplined Value Fund, MassMutual Disciplined Growth Fund, MassMutual Small Cap Opportunities Fund, MassMutual Global Fund, MassMutual International Equity Fund, and MassMutual Strategic Emerging Markets Fund:
Opinion on the Financial Statements and Financial Highlights
We have audited the accompanying statements of assets and liabilities of MassMutual U.S. Government Money Market Fund, MassMutual Short-Duration Bond Fund, MassMutual Inflation-Protected and Income Fund, MassMutual Core Bond Fund, MassMutual Diversified Bond Fund, MassMutual High Yield Fund, MassMutual Balanced Fund, MassMutual Disciplined Value Fund, MassMutual Disciplined Growth Fund, MassMutual Small Cap Opportunities Fund, MassMutual Global Fund, MassMutual International Equity Fund, and MassMutual Strategic Emerging Markets Fund (the “Funds”), each a fund of MassMutual Premier Funds, including the portfolios of investments, as of September 30, 2024, the related statements of operations for the year then ended, the statements of changes in net assets for each of the two years in the period then ended, the financial highlights for each of the five years in the period then ended, and the related notes. In our opinion, the financial statements and financial highlights present fairly, in all material respects, the financial position of each of the Funds, as of September 30, 2024, and the results of their operations for the year then ended, the changes in their net assets for each of the two years in the period then ended, and the financial highlights for each of the five years in the period then ended, in conformity with accounting principles generally accepted in the United States of America.
Basis for Opinion
These financial statements and financial highlights are the responsibility of the Funds’ management. Our responsibility is to express an opinion on the Funds’ financial statements and financial highlights based on our audits. We are a public accounting firm registered with the Public Company Accounting Oversight Board (United States) (PCAOB) and are required to be independent with respect to the Funds in accordance with the U.S. federal securities laws and the applicable rules and regulations of the Securities and Exchange Commission and the PCAOB.
We conducted our audits in accordance with the standards of the PCAOB. Those standards require that we plan and perform the audit to obtain reasonable assurance about whether the financial statements and financial highlights are free of material misstatement, whether due to error or fraud. The Funds are not required to have, nor were we engaged to perform, an audit of their internal control over financial reporting. As part of our audits we are required to obtain an understanding of internal control over financial reporting but not for the purpose of expressing an opinion on the effectiveness of the Funds’ internal control over financial reporting. Accordingly, we express no such opinion.
Our audits included performing procedures to assess the risks of material misstatement of the financial statements and financial highlights, whether due to error or fraud, and performing procedures that respond to those risks. Such procedures included examining, on a test basis, evidence regarding the amounts and disclosures in the financial statements and financial highlights. Our audits also included evaluating the accounting principles used and significant estimates made by management, as well as evaluating the overall presentation of the financial statements and financial highlights. Our procedures included confirmation of securities owned as of September 30, 2024, by correspondence with the custodian, brokers and agent banks; when replies were not received from brokers or agent banks, we performed other auditing procedures. We believe that our audits provide a reasonable basis for our opinion.
/s/ Deloitte & Touche LLP
Boston, Massachusetts
November 26, 2024
We have served as the auditor of one or more MassMutual investment companies since 1995.
TABLE OF CONTENTS
| | | |
| | Federal Tax Information (Unaudited) | |
| | | |
For the year ended September 30, 2024, the following Fund(s) earned the following foreign sources of income:
| | | | |
International Equity Fund | | | $1,893,448 |
Strategic Emerging Markets Fund | | | 1,006,267 |
| | | | |
Dividends Received Deduction
Each Fund reports the maximum amount allowable of its net taxable income as eligible for the corporate dividends received deduction.
Qualified Dividend Income
Under Section 854(b)(2) of the Code, the Fund(s) hereby designate the maximum amounts as qualified dividends for purposes of the maximum rate under Section 1(h)(11) of the Code for the year ended September 30, 2024.
The Fund(s) intend to pass through the maximum amount allowable as Section 163(j) Interest Dividends as defined in the Treasury Regulations §1.163(j)-1(b).
TABLE OF CONTENTS
Item 8. Changes in and Disagreements with Accountants for Open-End Management Investment Companies.
Not applicable.
TABLE OF CONTENTS
Item 9. Proxy Disclosures for Open-End Management Investment Companies.
Not applicable.
TABLE OF CONTENTS
Item 10. Remuneration Paid to Directors, Officers, and Others of Open-End Management Investment Companies.
This information is disclosed as part of the financial statements for each Fund as part of Item 7: Financial Statements and Financial Highlights for Open-End Management Investment Companies.
TABLE OF CONTENTS
Item 11. Statement Regarding Basis for Approval of Investment Advisory Contract.
Trustees’ Approval of Investment Advisory Contracts
At their meetings in May and June 2024, the Contract Committee (the “Committee”) and the Trustees, including the Trustees who are not “interested persons” (as such term is defined in the 1940 Act) of the Trust, MML Advisers, or the subadvisers (the “Independent Trustees”), considered and re-approved the existing advisory and subadvisory agreements (collectively, the “Contracts”) for each of the U.S. Government Money Market Fund, Short-Duration Bond Fund, Inflation-Protected and Income Fund, Core Bond Fund, Diversified Bond Fund, High Yield Fund, Balanced Fund, Disciplined Value Fund, Disciplined Growth Fund, Small Cap Opportunities Fund, Global Fund, International Equity Fund, and Strategic Emerging Markets Fund, as applicable. In preparation for the meetings, the Trustees requested, and MML Advisers and the subadvisers provided in advance, certain materials relevant to the consideration of the Contracts (the “Meeting Materials”). In all of their deliberations, the Trustees were advised by independent counsel.
The Committee received in advance of the meetings (i) a memorandum from MML Advisers discussing the nature and quality of the services it provides as investment adviser to the Funds; (ii) a profitability analysis prepared by MML Advisers; and (iii) a fee and performance study report (the “Third-Party Report”) with respect to each Fund prepared by an independent third-party vendor (the “Third-Party”). The Third-Party Report provided detailed comparative advisory fee, total expense, and performance information for each Fund to assist the Committee in its evaluation of the Contracts. The Committee also considered information presented to it throughout the year regarding MML Advisers and each of the subadvisers.
The Committee considered the nature, scope, and quality of services MML Advisers provides to the Funds, including: (i) the financial condition, stability, and business strategy of MML Advisers; (ii) the capabilities of MML Advisers with respect to regulatory compliance and its ability to monitor compliance with the investment policies of the Funds; (iii) MML Advisers’ ability to provide investment oversight and provide for administrative and shareholder services to the Funds; and (iv) the experience and qualifications of the personnel of MML Advisers that perform, or oversee the performance of, the services provided to the Funds, and the needs of the Funds for administrative and shareholder services. The Committee noted that it had received in the Meeting Materials or during the course of the past year: (i) detailed information regarding MML Advisers’ ability to provide investment oversight and provide for administrative and shareholder services to the Funds; and (ii) a wide range of information about the subadvisers and their personnel with responsibility for providing services to the Funds, as applicable, and the fees payable to each subadviser by MML Advisers. MML Advisers reviewed with the Committee in detail the work MML Advisers does in its oversight roles, the expertise it brings to these roles, the size of its teams, and the financial commitment it has made to provide those services.
The Committee then reviewed and considered, for each Fund separately, the detailed information presented in the Third-Party Report regarding: (i) Fund expenses, including, among other things, both the Fund’s net advisory fee and total net expense ratio against peer funds; and (ii) the Fund’s relative performance (over various time periods against funds in its “category” and a benchmark index). In connection with the Committee’s review, MML Advisers provided commentary and analysis regarding each Fund’s expenses and performance and a recommendation as to the action to be taken by the Committee. Throughout the discussion, MML Advisers responded to Committee members’ questions and provided additional information concerning each Fund.
The Committee reviewed the expense and performance information for each Fund. (References to any performance periods are to periods ended December 31, 2023, except as otherwise noted. In all cases, the comparative expense information is that of a Fund’s “peer group” and the comparative performance information is that of a Fund’s “performance category.”)
The Committee considered that the total net expense ratios for five of the Funds were in the top forty percent of their peer groups. Three additional Funds had total net expense ratios below the 66th percentile of their peer groups. All of the Funds with total net expense ratios below the 66th percentile of their peer groups had net advisory fees at or below the medians of their peer groups, or below the 66th percentile of their peer groups, except the Global Fund. As to the Global Fund, the Committee considered MML Advisers’ statements that although the Fund’s net advisory fee was at the 77th percentile, the Fund’s total net expense ratio was at the 54th percentile, and the Fund had achieved investment performance in the 54th percentile compared to its performance category for the three-year period.
The Funds with total net expense ratios higher than the 66th percentile of their peer groups were the U.S. Government Money Market Fund, Diversified Bond Fund, Inflation-Protected and Income Fund, Disciplined Value Fund, and International Equity Fund.
As to the U.S. Government Money Market Fund, the Committee considered MML Advisers’ statement that the Fund’s total net expense ratio, at the 80th percentile of its peer group, was 19 basis points above the peer group median, and that the Fund’s net
TABLE OF CONTENTS
advisory fee, at the 89th percentile of its peer group, was 13 basis points above the peer group median, and that the Fund had waived seven basis points for the year. The Committee also considered MML Advisers’ statement that the varied scale of money market funds makes peer grouping difficult, and that the Fund’s fourth quartile total net expense ratio was primarily driven by the Fund’s small asset base relative to its peers.
As to the Diversified Bond Fund, the Committee considered MML Advisers’ proposal to implement expense caps on the Fund. The Committee considered MML Advisers’ statement that, if the proposed expense cap had been implemented in the prior year, the cap would have resulted in an effective waiver of two basis points. The Committee further considered MML Advisers’ statement that the Fund’s proposed net expense ratio is expected to fall from 11 to nine basis points above the peer group median, and the net advisory fee is expected to fall from 15 to 13 basis points above the peer group median. The Committee also considered MML Advisers’ statement that with the proposed expense cap, the Fund is expected to move ahead of two peers in the net expense peer group and rank in the 79th percentile of its peer group.
As to the Inflation-Protected and Income Fund, the Committee considered MML Advisers’ proposal to implement expense caps on the Fund. The Committee considered MML Advisers’ statement that, if the proposed expense cap had been implemented in the prior year, the cap would have resulted in an effective waiver of two basis points. The Committee further considered MML Advisers’ statement that the Fund’s proposed net expense ratio is expected to fall from 11 to nine basis points above the peer group median, and the net advisory fee is expected to fall from 20 to 18 basis points above the peer group median. The Committee also considered MML Advisers’ statement that, with the proposed expense cap, MML Advisers believes that the fees are reasonable, as shareholders have benefitted from the Fund’s consistent long-term performance, as the Fund ranked in the top half of its performance category and outperformed its benchmark for eight and seven of the last ten calendar years, respectively.
As to the Disciplined Value Fund, the Committee considered MML Advisers’ statement that the Fund’s total net expense ratio was at the 77th percentile of its peer group, which was within six basis points of the median. The Committee also considered MML Advisers’ statement that the Fund was significantly smaller than most of the funds in its peer group and its total net expense ratio was in line with those funds in its peer group that have assets of comparable size. The Committee also considered that the Fund’s net advisory fee, at the 70th percentile of its peer group, was three basis points above the median.
As to the International Equity Fund, the Committee considered MML Advisers’ statement that the Fund’s total net expense ratio, at the 91st percentile of its peer group, was 12 basis points above the peer group median, and that the Fund’s net advisory fee, at the 91st percentile of its peer group, was 14 basis points above the peer group median. The Committee also considered MML Advisers’ statements that a third of the Fund’s peer group had double the average net assets of the Fund, and as such, the Fund was benefitting less from economies of scale than its peers, and that the Fund has achieved relatively favorable relative longer-term performance.
The Committee determined on the basis of these factors that the levels of the Funds’ net advisory fees, in light of the total net expenses of the Funds generally, were consistent with the continuation of the Contracts.
The Committee considered that the majority of the Funds achieved three-year investment performance above the medians of their performance categories, or within the top two thirds of their performance categories, except those Funds referred to below.
As to the Short-Duration Bond Fund and Strategic Emerging Markets Fund, the Committee considered that, although each of the Funds had performed less favorably than the top two-thirds of its performance category for the three-year period, each Fund’s relative performance had improved for the one-year period so as to be within the top two-thirds. In this regard, the Committee considered, among other things, MML Advisers’ statements that, with respect to the Short-Duration Bond Fund, duration positioning, among other factors, contributed to the Fund’s 2022 underperformance, and that with respect to the Strategic Emerging Markets Fund, underperformance in 2021 and 2022 contributed to the unfavorable three-year performance, driven by certain factors such as market environment and geopolitical developments.
As to the U.S. Government Money Market Fund, the Committee considered that the Fund performed at the 88th percentile of its performance category for the three-year period. The Committee considered MML Advisers’ statement that the Fund’s three-year total return percentage of 1.90% was reasonable compared to the 2.03% performance category median. The Committee also considered MML Advisers’ statement that the Fund is intended to serve as a conservative vehicle where investors may invest cash with minimal risk.
The Committee determined on the basis of these factors and on other factors and information considered by the Committee that the Funds’ performance, for the various periods presented, were generally consistent with the continuation of the Contracts.
The Committee also reviewed and considered information included in the Meeting Materials, or discussed at the meeting and during the course of the year, concerning economies of scale and the profitability of MML Advisers’ advisory relationship with the various Funds, including: (i) a description of MML Advisers’ revenues from the Funds (including advisory fees and administrative and shareholder services fees, as applicable) and the expense allocation methodology employed by MML Advisers; and (ii) profitability information with respect to each individual Fund. The discussions included consideration of the intangible benefits
TABLE OF CONTENTS
derived by MML Advisers and its affiliates resulting from their relationships with the Funds and any so-called “fallout benefits” to MML Advisers (which were not considered to be substantial in any event), such as any reputational value derived from serving as investment adviser to the Funds, and benefits accruing to subadvisers (including sub-subadvisers, as applicable) due to so-called “soft-dollar arrangements.”
Prior to the votes being taken to approve the Contracts, the Committee met separately in executive session to discuss the appropriateness of such contracts. The Committee weighed the foregoing matters in light of the advice given to them by their independent legal counsel as to the law applicable to the review of investment advisory contracts. In arriving at a decision, the Committee did not identify any single matter as all-important or controlling. The foregoing summary does not detail all of the matters considered.
As to each of the Funds, the Committee concluded that: (i) it was satisfied with the nature, extent, and quality of services provided, and expected to be provided in the future, under the Contracts, including the level of MML Advisers’ oversight of each Fund and the subadvisory process; (ii) MML Advisers’ levels of profitability from its relationship with the various Funds are not excessive and the advisory fees payable under the advisory agreements and each Fund’s total net expenses are fair and reasonable; (iii) the investment processes, research capabilities, and philosophies of the subadvisers appear well suited to the Funds, as applicable, given their investment objectives and policies; (iv) either the relative or absolute performance of a Fund (in each case, taking into account the applicable investment strategy and risk profile of the Fund), or the steps MML Advisers has proposed in respect of the underperformance of a Fund, are sufficient to warrant continuation of the Contracts for each of the Funds; and (v) the terms of the Contracts are fair and reasonable with respect to each Fund and are in the best interests of each Fund’s shareholders.
Item 12. Disclosure of Proxy Voting Policies and Procedures for Closed-End Management Investment Companies.
Not applicable.
Item 13. Portfolio Managers of Closed-End Management Investment Companies.
Not applicable.
Item 14. Purchases of Equity Securities by Closed-End Management Investment Company and Affiliated Purchasers.
Not applicable.
Item 15. Submission of Matters to a Vote of Security Holders.
Not applicable.
Item 16. Controls and Procedures.
(a) The Registrant’s Principal Executive Officer and Principal Financial Officer have concluded that the Registrant’s disclosure controls and procedures (as defined in Rule 30a-3(c) under the Investment Company Act of 1940, as amended (the “1940 Act”) (17 CFR 270.30a-3(c))) are effective, as of a date within 90 days of the filing date of this Form N-CSR, to provide reasonable assurance that the information required to be disclosed by the Registrant on Form N-CSR is recorded, processed, summarized, and reported within the time periods specified in the SEC’s rules and forms, based on their evaluation of these disclosure controls and procedures required by Rule 30a-3(b) under the 1940 Act (17 CFR 270.30a-3(b)) and Rules 13a-15(b) or 15d-15(b) under the Securities Exchange Act of 1934 (17 CFR 240.13a-15(b) or 240.15d-15(b)).
(b) There were no changes in the Registrant’s internal control over financial reporting (as defined in Rule 30a-3(d) under the 1940 Act (17 CFR 270.30a-3(d))) that occurred during the period covered by this report that has materially affected, or is reasonably likely to materially affect, the Registrant’s internal control over financial reporting.
Item 17. Disclosure of Securities Lending Activities for Closed-End Management Investment Companies.
Not applicable.
Item 18. Recovery of Erroneously Awarded Compensation.
Not applicable.
Item 19. Exhibits.
(a)(1) Code of Ethics (Item 2) - Attached.
(a)(2) Any policy required by the listing standards adopted pursuant to Rule 10D-1 under the Exchange Act of 1934 (17 CFR 240.10D-1) - Not applicable.
(a)(3) Certifications of the Principal Executive Officer and Principal Financial Officer of the Registrant as required by Rule 30a-2(a) under the 1940 Act (17 CFR 270.30a-2(a)) are attached hereto as Exhibit 99CERT.
(a)(4) Any written solicitation to purchase securities under Rule 23c-1 under the 1940 Act (17 CFR 270.23c-1) –Not applicable.
(a)(5) Change in Registrant’s independent public accountant –Not applicable.
(b) Certifications pursuant to Section 906 of the Sarbanes-Oxley Act of 2002 as required by Rule 30a-2(b), under the 1940 Act (17 CFR 270.30a-2(b)), Rule 15d-14(b) under the Securities Exchange Act of 1934 (17 CFR 240.15d-14(b)) and Section 1350 of Chapter 63 of Title 18 of the United States Code (18 U.S.C. 1350) are attached hereto as Exhibit 99.906CERT.
SIGNATURES
Pursuant to the requirements of the Securities Exchange Act of 1934 and the Investment Company Act of 1940, the registrant has duly caused this report to be signed on its behalf by the undersigned, thereunto duly authorized.
| (Registrant) | MassMutual Premier Funds | |
| | | |
| By (Signature and Title) | /s/ Douglas Steele | |
| | Douglas Steele, President and Principal Executive Officer | |
Pursuant to the requirements of the Securities Exchange Act of 1934 and the Investment Company Act of 1940, this report has been signed below by the following persons on behalf of the registrant and in the capacities and on the dates indicated.
| By (Signature and Title) | /s/ Douglas Steele | |
| | Douglas Steele, President and Principal Executive Officer | |
| By (Signature and Title) | /s/ Renée Hitchcock | |
| | Renée Hitchcock, Treasurer and Principal Financial Officer | |